Embed Size (px)
Citation preview
Report on Members’Compensation and Benefits
2016
2016 REPORT ON MEMBERS’ COMPENSATION AND BENEFITSPAGE 2
August 2016
© 2016 APEGBC. All rights reserved.
INTRODUCTIONWe are pleased to present the findings of a comprehensive compensation and benefits survey of APEGBC members undertaken by the Association in May 2016. The last member compensation survey was undertaken in May 2014.
The primary intent of this report is to provide information on base annual compensation, total annual compensation, and other non-monetary benefits earned by APEGBC members employed in full-time positions in British Columbia.
The best indicator of professional compensation is obtained through an Employment Responsibility Evaluation. Members can refer to the Benchmark Employment Descriptions to confirm the accuracy of their responsibility point level assessment. Both can be found at apeg.bc.ca/compensationsurvey.
Section A provides base salary and total annual compensation values by responsibility point level for the overall dataset and by industry sector. Section A also includes information on total other compensation, working hours, benefits, and perquisites.
Section B provides secondary demographic and other informational tables that may be of interest to some readers, including compensation reports presented by degree received, year of graduation, member status, size of organization, and gender.
The compensation survey data and exhibits included within this report are intended to provide the reader with general benchmarks and can be used as a guideline for comparing his or her compensation with overall industry values. Compensation values should be determined and calculated by the level of responsibility for the position. Therefore, the prediction of compensation based on any one factor is difficult due to market forces and general economic conditions, and caution should be exercised.
NOTE:
PAGE 32016 REPORT ON MEMBERS’ COMPENSATION AND BENEFITS
Survey Methodology 4
Section A — Results
Reported Base Salary and Total Annual Compensation by Responsibility Level 5
Reported Base Salary by Industry 6
Working Hours and Other Compensation 8
Employee Benefits and Perquisites 9
Vacation Entitlements 10
Section B — Survey Demographics and Other Compensation Tables
Employment Status 10
Reported Base Salary and Total Annual Compensation by Responsibility Level and Gender 11
Reported Base Salary by Bachelor’s Degree 11
Reported Base Salary by Graduate Degree Received 13
Reported Base Salary and Responsibility Level by Year of Graduation 13
Compensation by Size of Organization 14
Reported Base Salary by Member Status and Gender 15
Compensation by Region and Gender Including Non-BC Respondents 15
TABLE OF CONTENTS
2016 REPORT ON MEMBERS’ COMPENSATION AND BENEFITSPAGE 4
SURVEY METHODOLOGY
Practising APEGBC members were invited to participate in an online survey of members’ compensation by email in May 2016. A total of 2,106 responses were received.
The primary intent of this compensation survey is to provide data for BC-based APEGBC members. As such, the majority of tables in this report present information for this subset of the entire sample. Section B also contains selected reports for the entire valid data set including respondents from the rest of Canada and around the world.
As in previous years, the analyses dealing with compensation use a subset of the total respondents; members who indicated that they were full-time students, retired, employed part-time, or unemployed were removed from the data set. All respondents who did not indicate both compensation data and responsibility point-level were also removed. Also, respondents with reported base salary and total compensation of less than $25,000 were removed. Where reported total compensation was lower than reported base salary, the total compensation is calculated by adding stated values in different categories of compensation to the base salary. The remaining British Columbia-only compensation subset is comprised of 1,736 valid responses.
The survey asked respondents to provide information on their base annual compensation, defined strictly as base salary. A number of tables in this report also provide total annual compensation values defined as base annual compensation plus taxable benefits such as medical, insurance, and pension contributions paid by the employer, as well as cash compensation such as bonuses, commission, profit sharing, and paid overtime.
Compensation definitions are as follows:
• Mean – numerical average of compensation values;• Median – 50% of values are below and 50% of values are above this compensation;• Low Decile – 10% of values are below and 90% of values are above this compensation;• Low Quartile – 25% of values are below and 75% of values are above this compensation;• High Quartile – 75% of values are below and 25% of values are above this compensation; • High Decile – 90% of values are below and 10% of values are above this compensation.
In many tables, both median and mean compensation information is provided. Median figures are often a better indicator of compensation changes and ranges since median values are less affected by very high and very low responses. However, mean values provide a true arithmetic average, which may be of interest to some readers. Low and high decile information is not provided when a response sample is less than 10. Additionally, low and high quartile information is not provided when a sample is less than 25 respondents. Similarly, mean and median values have not been reported for samples sizes that are less than five.
The size of the 2016 return sample (2,106) declined compared to that obtained in 2014 (3,050 respondents). While a sufficient sample was obtained to validate many of the analyses, caution should be exercised when examining smaller data subsets of the entire sample.
PAGE 52016 REPORT ON MEMBERS’ COMPENSATION AND BENEFITS
SECTION ARESULTS Reported Base Salary and Total Annual Compensation by Responsibility Level
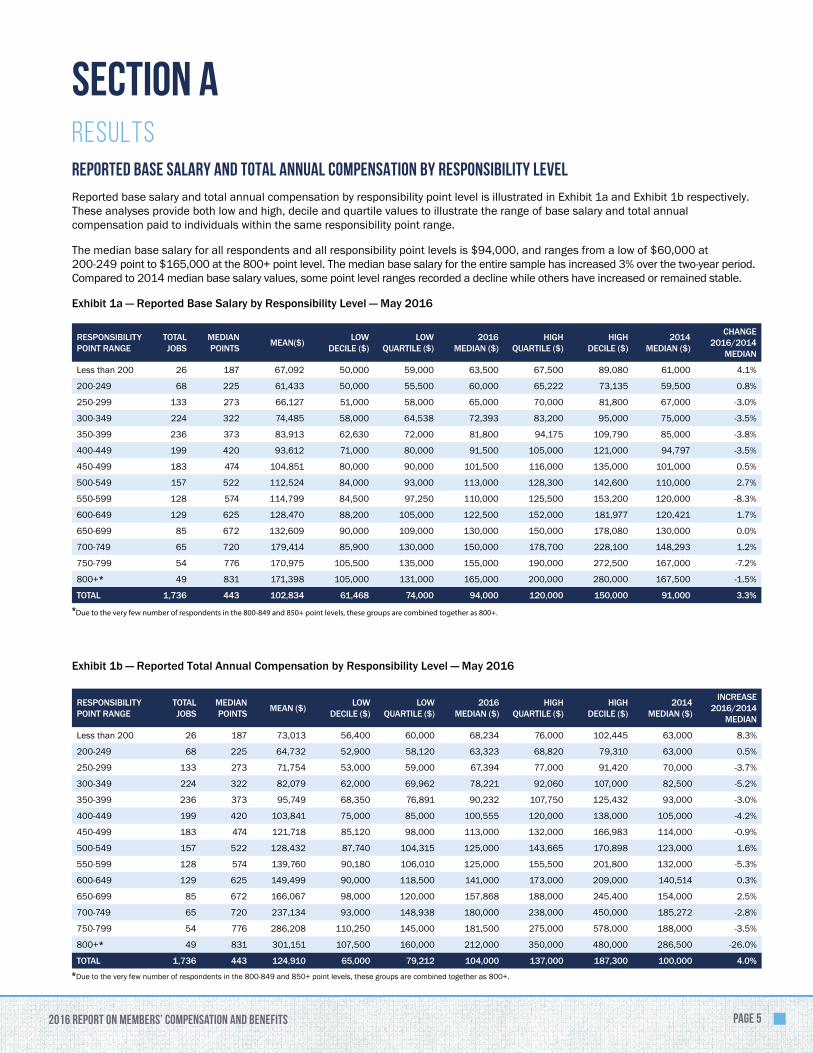
Reported base salary and total annual compensation by responsibility point level is illustrated in Exhibit 1a and Exhibit 1b respectively. These analyses provide both low and high, decile and quartile values to illustrate the range of base salary and total annual compensation paid to individuals within the same responsibility point range.
The median base salary for all respondents and all responsibility point levels is $94,000, and ranges from a low of $60,000 at 200-249 point to $165,000 at the 800+ point level. The median base salary for the entire sample has increased 3% over the two-year period. Compared to 2014 median base salary values, some point level ranges recorded a decline while others have increased or remained stable.
Exhibit 1a — Reported Base Salary by Responsibility Level — May 2016
RESPONSIBILITY POINT RANGE
TOTAL JOBS
MEDIAN POINTS MEAN($) LOW
DECILE ($)LOW
QUARTILE ($)2016
MEDIAN ($)HIGH
QUARTILE ($)HIGH
DECILE ($)2014
MEDIAN ($)
CHANGE 2016/2014
MEDIAN
Less than 200 26 187 67,092 50,000 59,000 63,500 67,500 89,080 61,000 4.1%
200-249 68 225 61,433 50,000 55,500 60,000 65,222 73,135 59,500 0.8%
250-299 133 273 66,127 51,000 58,000 65,000 70,000 81,800 67,000 -3.0%
300-349 224 322 74,485 58,000 64,538 72,393 83,200 95,000 75,000 -3.5%
350-399 236 373 83,913 62,630 72,000 81,800 94,175 109,790 85,000 -3.8%
400-449 199 420 93,612 71,000 80,000 91,500 105,000 121,000 94,797 -3.5%
450-499 183 474 104,851 80,000 90,000 101,500 116,000 135,000 101,000 0.5%
500-549 157 522 112,524 84,000 93,000 113,000 128,300 142,600 110,000 2.7%
550-599 128 574 114,799 84,500 97,250 110,000 125,500 153,200 120,000 -8.3%
600-649 129 625 128,470 88,200 105,000 122,500 152,000 181,977 120,421 1.7%
650-699 85 672 132,609 90,000 109,000 130,000 150,000 178,080 130,000 0.0%
700-749 65 720 179,414 85,900 130,000 150,000 178,700 228,100 148,293 1.2%
750-799 54 776 170,975 105,500 135,000 155,000 190,000 272,500 167,000 -7.2%
800+* 49 831 171,398 105,000 131,000 165,000 200,000 280,000 167,500 -1.5%
TOTAL 1,736 443 102,834 61,468 74,000 94,000 120,000 150,000 91,000 3.3%
Due to the very few number of respondents in the 800-849 and 850+ point levels, these groups are combined together as 800+.
Exhibit 1b — Reported Total Annual Compensation by Responsibility Level — May 2016
RESPONSIBILITY POINT RANGE
TOTAL JOBS
MEDIAN POINTS MEAN ($) LOW
DECILE ($)LOW
QUARTILE ($)2016
MEDIAN ($)HIGH
QUARTILE ($)HIGH
DECILE ($)2014
MEDIAN ($)
INCREASE 2016/2014
MEDIAN
Less than 200 26 187 73,013 56,400 60,000 68,234 76,000 102,445 63,000 8.3%
200-249 68 225 64,732 52,900 58,120 63,323 68,820 79,310 63,000 0.5%
250-299 133 273 71,754 53,000 59,000 67,394 77,000 91,420 70,000 -3.7%
300-349 224 322 82,079 62,000 69,962 78,221 92,060 107,000 82,500 -5.2%
350-399 236 373 95,749 68,350 76,891 90,232 107,750 125,432 93,000 -3.0%
400-449 199 420 103,841 75,000 85,000 100,555 120,000 138,000 105,000 -4.2%
450-499 183 474 121,718 85,120 98,000 113,000 132,000 166,983 114,000 -0.9%
500-549 157 522 128,432 87,740 104,315 125,000 143,665 170,898 123,000 1.6%
550-599 128 574 139,760 90,180 106,010 125,000 155,500 201,800 132,000 -5.3%
600-649 129 625 149,499 90,000 118,500 141,000 173,000 209,000 140,514 0.3%
650-699 85 672 166,067 98,000 120,000 157,868 188,000 245,400 154,000 2.5%
700-749 65 720 237,134 93,000 148,938 180,000 238,000 450,000 185,272 -2.8%
750-799 54 776 286,208 110,250 145,000 181,500 275,000 578,000 188,000 -3.5%
800+* 49 831 301,151 107,500 160,000 212,000 350,000 480,000 286,500 -26.0%
TOTAL 1,736 443 124,910 65,000 79,212 104,000 137,000 187,300 100,000 4.0% Due to the very few number of respondents in the 800-849 and 850+ point levels, these groups are combined together as 800+.
2016 REPORT ON MEMBERS’ COMPENSATION AND BENEFITSPAGE 6
Reported Base Salary by Industry
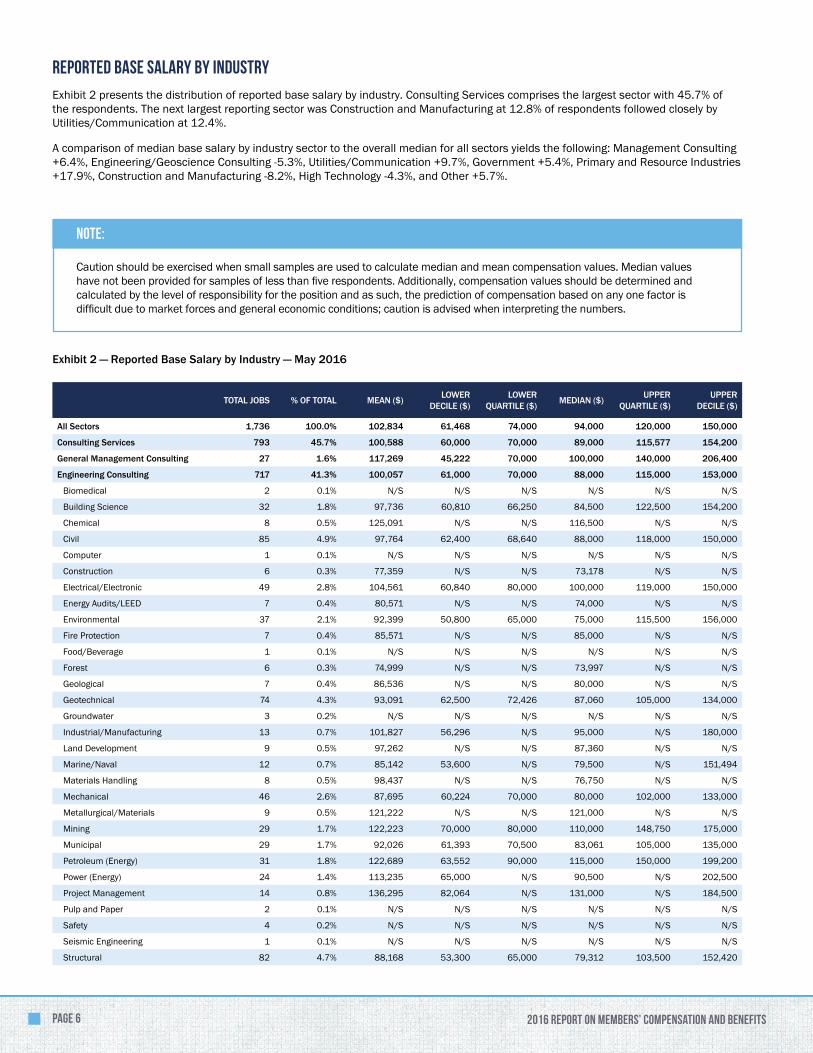
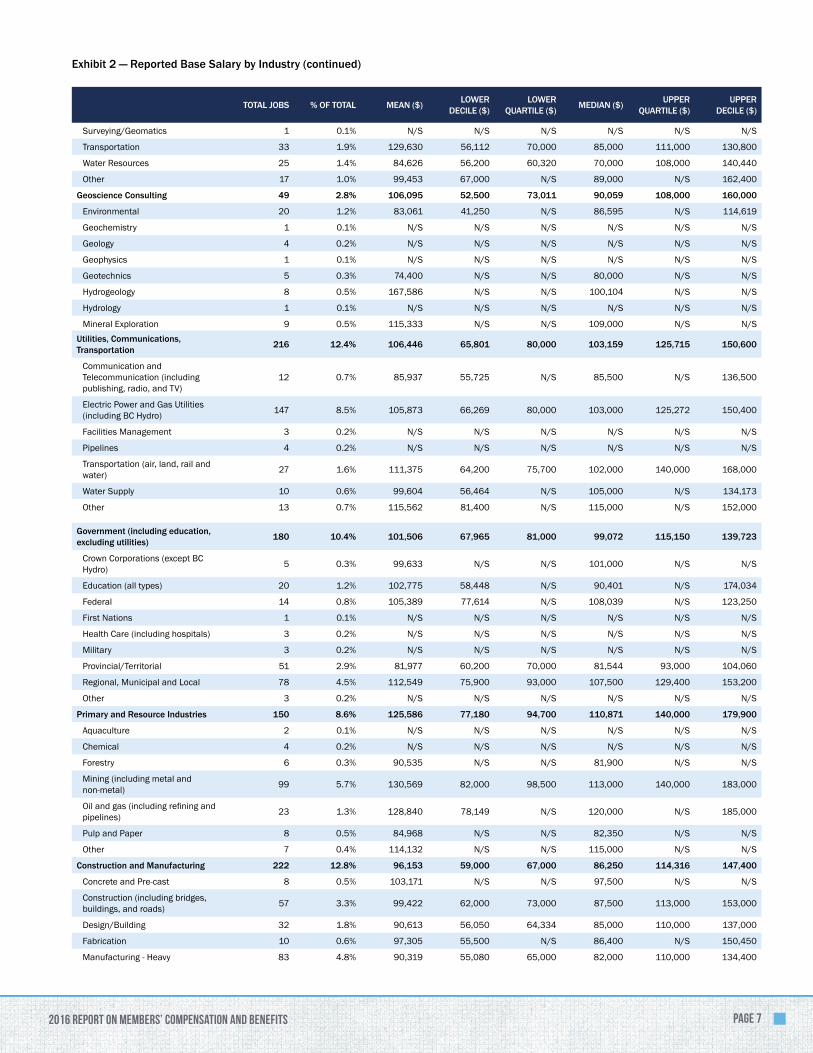
Exhibit 2 presents the distribution of reported base salary by industry. Consulting Services comprises the largest sector with 45.7% of the respondents. The next largest reporting sector was Construction and Manufacturing at 12.8% of respondents followed closely by Utilities/Communication at 12.4%.
A comparison of median base salary by industry sector to the overall median for all sectors yields the following: Management Consulting +6.4%, Engineering/Geoscience Consulting -5.3%, Utilities/Communication +9.7%, Government +5.4%, Primary and Resource Industries +17.9%, Construction and Manufacturing -8.2%, High Technology -4.3%, and Other +5.7%.
Note:
Caution should be exercised when small samples are used to calculate median and mean compensation values. Median values have not been provided for samples of less than five respondents. Additionally, compensation values should be determined and calculated by the level of responsibility for the position and as such, the prediction of compensation based on any one factor is difficult due to market forces and general economic conditions; caution is advised when interpreting the numbers.
Exhibit 2 — Reported Base Salary by Industry — May 2016
TOTAL JOBS % OF TOTAL MEAN ($) LOWER DECILE ($)
LOWER QUARTILE ($) MEDIAN ($) UPPER
QUARTILE ($)UPPER
DECILE ($)
All Sectors 1,736 100.0% 102,834 61,468 74,000 94,000 120,000 150,000
Consulting Services 793 45.7% 100,588 60,000 70,000 89,000 115,577 154,200
General Management Consulting 27 1.6% 117,269 45,222 70,000 100,000 140,000 206,400
Engineering Consulting 717 41.3% 100,057 61,000 70,000 88,000 115,000 153,000
Biomedical 2 0.1% N/S N/S N/S N/S N/S N/S
Building Science 32 1.8% 97,736 60,810 66,250 84,500 122,500 154,200
Chemical 8 0.5% 125,091 N/S N/S 116,500 N/S N/S
Civil 85 4.9% 97,764 62,400 68,640 88,000 118,000 150,000
Computer 1 0.1% N/S N/S N/S N/S N/S N/S
Construction 6 0.3% 77,359 N/S N/S 73,178 N/S N/S
Electrical/Electronic 49 2.8% 104,561 60,840 80,000 100,000 119,000 150,000
Energy Audits/LEED 7 0.4% 80,571 N/S N/S 74,000 N/S N/S
Environmental 37 2.1% 92,399 50,800 65,000 75,000 115,500 156,000
Fire Protection 7 0.4% 85,571 N/S N/S 85,000 N/S N/S
Food/Beverage 1 0.1% N/S N/S N/S N/S N/S N/S
Forest 6 0.3% 74,999 N/S N/S 73,997 N/S N/S
Geological 7 0.4% 86,536 N/S N/S 80,000 N/S N/S
Geotechnical 74 4.3% 93,091 62,500 72,426 87,060 105,000 134,000
Groundwater 3 0.2% N/S N/S N/S N/S N/S N/S
Industrial/Manufacturing 13 0.7% 101,827 56,296 N/S 95,000 N/S 180,000
Land Development 9 0.5% 97,262 N/S N/S 87,360 N/S N/S
Marine/Naval 12 0.7% 85,142 53,600 N/S 79,500 N/S 151,494
Materials Handling 8 0.5% 98,437 N/S N/S 76,750 N/S N/S
Mechanical 46 2.6% 87,695 60,224 70,000 80,000 102,000 133,000
Metallurgical/Materials 9 0.5% 121,222 N/S N/S 121,000 N/S N/S
Mining 29 1.7% 122,223 70,000 80,000 110,000 148,750 175,000
Municipal 29 1.7% 92,026 61,393 70,500 83,061 105,000 135,000
Petroleum (Energy) 31 1.8% 122,689 63,552 90,000 115,000 150,000 199,200
Power (Energy) 24 1.4% 113,235 65,000 N/S 90,500 N/S 202,500
Project Management 14 0.8% 136,295 82,064 N/S 131,000 N/S 184,500
Pulp and Paper 2 0.1% N/S N/S N/S N/S N/S N/S
Safety 4 0.2% N/S N/S N/S N/S N/S N/S
Seismic Engineering 1 0.1% N/S N/S N/S N/S N/S N/S
Structural 82 4.7% 88,168 53,300 65,000 79,312 103,500 152,420
PAGE 72016 REPORT ON MEMBERS’ COMPENSATION AND BENEFITS
Surveying/Geomatics 1 0.1% N/S N/S N/S N/S N/S N/S
Transportation 33 1.9% 129,630 56,112 70,000 85,000 111,000 130,800
Water Resources 25 1.4% 84,626 56,200 60,320 70,000 108,000 140,440
Other 17 1.0% 99,453 67,000 N/S 89,000 N/S 162,400
Geoscience Consulting 49 2.8% 106,095 52,500 73,011 90,059 108,000 160,000
Environmental 20 1.2% 83,061 41,250 N/S 86,595 N/S 114,619
Geochemistry 1 0.1% N/S N/S N/S N/S N/S N/S
Geology 4 0.2% N/S N/S N/S N/S N/S N/S
Geophysics 1 0.1% N/S N/S N/S N/S N/S N/S
Geotechnics 5 0.3% 74,400 N/S N/S 80,000 N/S N/S
Hydrogeology 8 0.5% 167,586 N/S N/S 100,104 N/S N/S
Hydrology 1 0.1% N/S N/S N/S N/S N/S N/S
Mineral Exploration 9 0.5% 115,333 N/S N/S 109,000 N/S N/S
Exhibit 2 — Reported Base Salary by Industry (continued)
TOTAL JOBS % OF TOTAL MEAN ($) LOWER DECILE ($)
LOWER QUARTILE ($) MEDIAN ($) UPPER
QUARTILE ($)UPPER
DECILE ($)
Utilities, Communications, Transportation 216 12.4% 106,446 65,801 80,000 103,159 125,715 150,600
Communication and Telecommunication (including publishing, radio, and TV)
12 0.7% 85,937 55,725 N/S 85,500 N/S 136,500
Electric Power and Gas Utilities (including BC Hydro) 147 8.5% 105,873 66,269 80,000 103,000 125,272 150,400
Facilities Management 3 0.2% N/S N/S N/S N/S N/S N/S
Pipelines 4 0.2% N/S N/S N/S N/S N/S N/S
Transportation (air, land, rail and water) 27 1.6% 111,375 64,200 75,700 102,000 140,000 168,000
Water Supply 10 0.6% 99,604 56,464 N/S 105,000 N/S 134,173
Other 13 0.7% 115,562 81,400 N/S 115,000 N/S 152,000
Government (including education, excluding utilities) 180 10.4% 101,506 67,965 81,000 99,072 115,150 139,723
Crown Corporations (except BC Hydro) 5 0.3% 99,633 N/S N/S 101,000 N/S N/S
Education (all types) 20 1.2% 102,775 58,448 N/S 90,401 N/S 174,034
Federal 14 0.8% 105,389 77,614 N/S 108,039 N/S 123,250
First Nations 1 0.1% N/S N/S N/S N/S N/S N/S
Health Care (including hospitals) 3 0.2% N/S N/S N/S N/S N/S N/S
Military 3 0.2% N/S N/S N/S N/S N/S N/S
Provincial/Territorial 51 2.9% 81,977 60,200 70,000 81,544 93,000 104,060
Regional, Municipal and Local 78 4.5% 112,549 75,900 93,000 107,500 129,400 153,200
Other 3 0.2% N/S N/S N/S N/S N/S N/S
Primary and Resource Industries 150 8.6% 125,586 77,180 94,700 110,871 140,000 179,900
Aquaculture 2 0.1% N/S N/S N/S N/S N/S N/S
Chemical 4 0.2% N/S N/S N/S N/S N/S N/S
Forestry 6 0.3% 90,535 N/S N/S 81,900 N/S N/S
Mining (including metal and non-metal) 99 5.7% 130,569 82,000 98,500 113,000 140,000 183,000
Oil and gas (including refining and pipelines) 23 1.3% 128,840 78,149 N/S 120,000 N/S 185,000
Pulp and Paper 8 0.5% 84,968 N/S N/S 82,350 N/S N/S
Other 7 0.4% 114,132 N/S N/S 115,000 N/S N/S
Construction and Manufacturing 222 12.8% 96,153 59,000 67,000 86,250 114,316 147,400
Concrete and Pre-cast 8 0.5% 103,171 N/S N/S 97,500 N/S N/S
Construction (including bridges, buildings, and roads) 57 3.3% 99,422 62,000 73,000 87,500 113,000 153,000
Design/Building 32 1.8% 90,613 56,050 64,334 85,000 110,000 137,000
Fabrication 10 0.6% 97,305 55,500 N/S 86,400 N/S 150,450
Manufacturing - Heavy 83 4.8% 90,319 55,080 65,000 82,000 110,000 134,400
2016 REPORT ON MEMBERS’ COMPENSATION AND BENEFITSPAGE 8
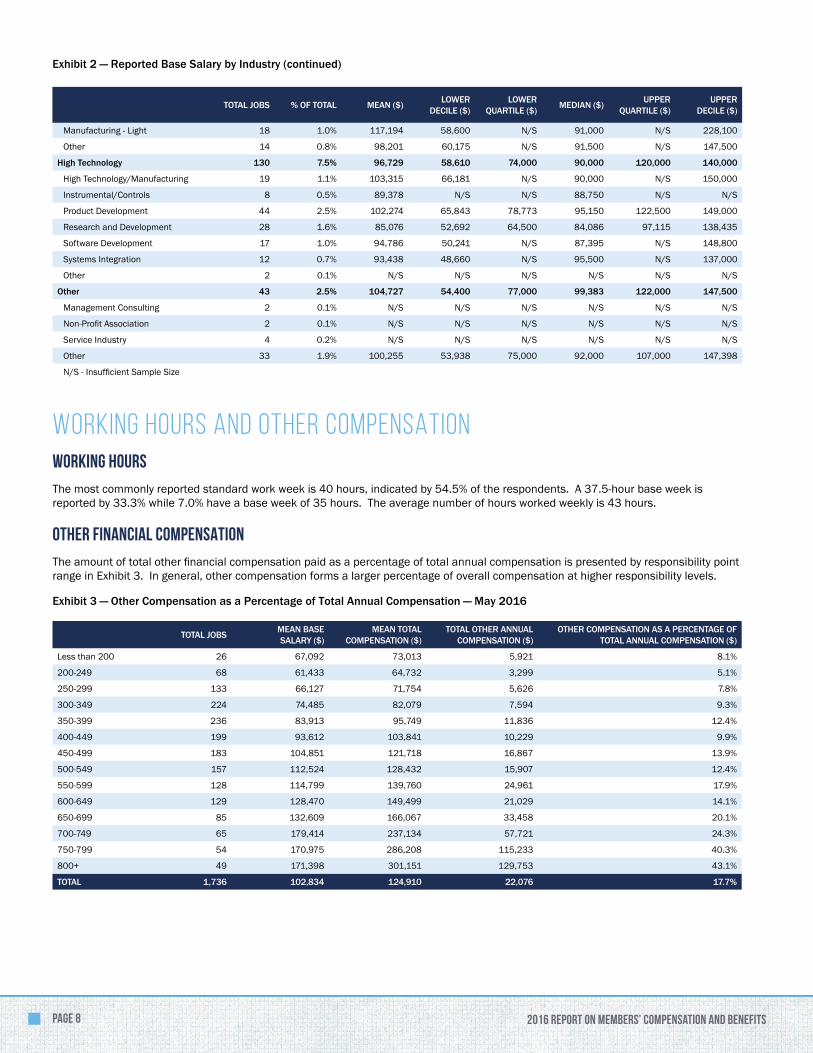
Manufacturing - Light 18 1.0% 117,194 58,600 N/S 91,000 N/S 228,100
Other 14 0.8% 98,201 60,175 N/S 91,500 N/S 147,500
High Technology 130 7.5% 96,729 58,610 74,000 90,000 120,000 140,000
High Technology/Manufacturing 19 1.1% 103,315 66,181 N/S 90,000 N/S 150,000
Instrumental/Controls 8 0.5% 89,378 N/S N/S 88,750 N/S N/S
Product Development 44 2.5% 102,274 65,843 78,773 95,150 122,500 149,000
Research and Development 28 1.6% 85,076 52,692 64,500 84,086 97,115 138,435
Software Development 17 1.0% 94,786 50,241 N/S 87,395 N/S 148,800
Systems Integration 12 0.7% 93,438 48,660 N/S 95,500 N/S 137,000
Other 2 0.1% N/S N/S N/S N/S N/S N/S
Other 43 2.5% 104,727 54,400 77,000 99,383 122,000 147,500
Management Consulting 2 0.1% N/S N/S N/S N/S N/S N/S
Non-Profit Association 2 0.1% N/S N/S N/S N/S N/S N/S
Service Industry 4 0.2% N/S N/S N/S N/S N/S N/S
Other 33 1.9% 100,255 53,938 75,000 92,000 107,000 147,398
N/S - Insufficient Sample Size
WORKING HOURS AND OTHER COMPENSATIONWorking Hours
The most commonly reported standard work week is 40 hours, indicated by 54.5% of the respondents. A 37.5-hour base week is reported by 33.3% while 7.0% have a base week of 35 hours. The average number of hours worked weekly is 43 hours.
Other Financial Compensation
The amount of total other financial compensation paid as a percentage of total annual compensation is presented by responsibility point range in Exhibit 3. In general, other compensation forms a larger percentage of overall compensation at higher responsibility levels.
Exhibit 3 — Other Compensation as a Percentage of Total Annual Compensation — May 2016
TOTAL JOBS MEAN BASE SALARY ($)
MEAN TOTAL COMPENSATION ($)
TOTAL OTHER ANNUAL COMPENSATION ($)
OTHER COMPENSATION AS A PERCENTAGE OF TOTAL ANNUAL COMPENSATION ($)
Less than 200 26 67,092 73,013 5,921 8.1%
200-249 68 61,433 64,732 3,299 5.1%
250-299 133 66,127 71,754 5,626 7.8%
300-349 224 74,485 82,079 7,594 9.3%
350-399 236 83,913 95,749 11,836 12.4%
400-449 199 93,612 103,841 10,229 9.9%
450-499 183 104,851 121,718 16,867 13.9%
500-549 157 112,524 128,432 15,907 12.4%
550-599 128 114,799 139,760 24,961 17.9%
600-649 129 128,470 149,499 21,029 14.1%
650-699 85 132,609 166,067 33,458 20.1%
700-749 65 179,414 237,134 57,721 24.3%
750-799 54 170,975 286,208 115,233 40.3%
800+ 49 171,398 301,151 129,753 43.1%
TOTAL 1,736 102,834 124,910 22,076 17.7%
Exhibit 2 — Reported Base Salary by Industry (continued)
TOTAL JOBS % OF TOTAL MEAN ($) LOWER DECILE ($)
LOWER QUARTILE ($) MEDIAN ($) UPPER
QUARTILE ($)UPPER
DECILE ($)

PAGE 92016 REPORT ON MEMBERS’ COMPENSATION AND BENEFITS
Exhibit 4 provides the percentages of respondents by industry that receive additional compensation over base annual compensation. Additional compensation is usually in the form of a performance/merit bonus, indicated by 30.3% of respondents, followed by overtime paid to 18.5% of respondents, and profit sharing paid to 12.0% of respondents.
Exhibit 4 — Percentage of Respondents Receiving Other Compensation
TOTAL JOBS PROJECT/ COMPLETION BONUS COMMISSION OVERTIME PERFORMANCE/
MERIT BONUSPROFIT
SHARINGSTOCK
OPTIONS OTHER
All Sectors 1,736 7.6% 0.6% 18.5% 30.3% 12.0% 7.0% 12.3%
Consulting Services 793 9.1% 0.6% 23.6% 27.1% 18.4% 4.7% 10.1%
General Management Consulting 27 11.1% 0.0% 3.7% 3.7% 7.4% 0.0% 18.5%
Engineering Consulting 716 8.9% 0.7% 24.9% 28.8% 19.0% 4.9% 9.9%
Geoscience Consulting 49 10.2% 0.0% 16.3% 16.3% 14.3% 4.1% 8.2%
Utilities, Communications, Transportation 216 2.3% 0.0% 17.1% 28.2% 3.7% 5.1% 16.7%
Government (including education, excluding utilities) 180 2.2% 0.0% 15.0% 5.0% 0.0% 0.0% 12.2%
Primary and Resource Industries 150 12.0% 0.0% 14.7% 58.7% 5.3% 24.0% 15.3%
Construction and Manufacturing 222 10.4% 2.7% 14.0% 38.3% 14.4% 4.5% 14.0%
High Technology 130 6.9% 0.0% 10.0% 34.6% 10.0% 17.7% 13.1%
Other 43 2.3% 0.0% 11.6% 53.5% 2.3% 9.3% 9.3%
Employee Benefits and Perquisites
The majority of respondents indicated that their employer pays for, or partially subsidizes, BC basic medical coverage (74.5%), extended health benefits (91.3%), long-term disability (81.1%), dental plans (92.6%), vision plans (85.3%), and life insurance (79.7%). Some respondents also indicated their employer provides them with some benefits: 72.3% of respondents indicated that education costs are partially reimbursed, 48% participate in an employer-sponsored RRSP plan, 44.7% participate in an employer-sponsored pension plan, and 84.2% have their APEGBC association fees paid for or partly sponsored by their employer.
Exhibit 5 provides a summary of the percentages of respondents receiving various benefits and perquisites.
Exhibit 5 — Employee Benefits and Perquisites
100% EMPLOYER PAID
PARTIALLY EMPLOYER PAID
TOTAL PROVIDED NOT PROVIDED NO RESPONSE /
DON'T KNOW
Life Insurance 37.1% 42.6% 79.7% 13.8% 6.6%
Provincial Medical Plan 51.2% 23.3% 74.5% 23.0% 2.4%
Extended Health Plan 40.3% 51.0% 91.3% 6.4% 2.3%
Dental Plan 36.0% 56.6% 92.6% 6.5% 0.9%
Vision Plan 32.1% 53.2% 85.3% 11.9% 2.9%
Prescription Drug Plan 36.1% 54.4% 90.5% 7.0% 2.5%
Long-term Disability 33.7% 47.4% 81.1% 12.6% 6.4%
Life/Accident Insurance 33.8% 45.6% 79.4% 12.4% 8.2%
Pension Plan 12.4% 32.3% 44.7% 47.2% 8.1%
RRSP Plan 7.0% 41.0% 48.0% 44.5% 7.6%
Education (related) 41.7% 30.6% 72.3% 19.7% 7.9%
Education (unrelated) 2.1% 7.8% 9.9% 74.8% 15.3%
APEGBC Membership Fees 79.3% 4.9% 84.2% 13.9% 2.0%
Other Professional Membership Fees 47.9% 8.0% 55.9% 28.9% 15.2%
Company Paid Parking 39.7% 39.7% 58.0% 2.2%
Company Supplied Car 10.7% 10.7% 86.8% 2.5%
BENEFIT PROVIDED
2016 REPORT ON MEMBERS’ COMPENSATION AND BENEFITSPAGE 10
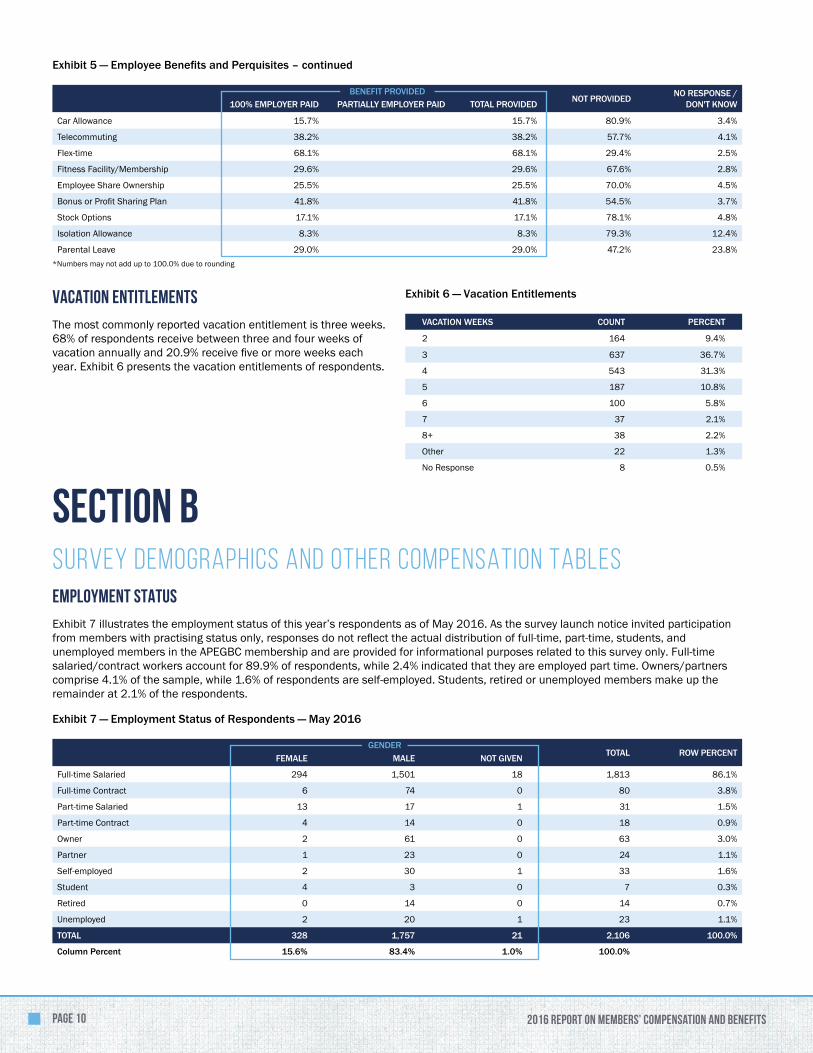
Vacation Entitlements
The most commonly reported vacation entitlement is three weeks. 68% of respondents receive between three and four weeks of vacation annually and 20.9% receive five or more weeks each year. Exhibit 6 presents the vacation entitlements of respondents.
Exhibit 6 — Vacation Entitlements
VACATION WEEKS COUNT PERCENT
2 164 9.4%
3 637 36.7%
4 543 31.3%
5 187 10.8%
6 100 5.8%
7 37 2.1%
8+ 38 2.2%
Other 22 1.3%
No Response 8 0.5%
Car Allowance 15.7% 15.7% 80.9% 3.4%
Telecommuting 38.2% 38.2% 57.7% 4.1%
Flex-time 68.1% 68.1% 29.4% 2.5%
Fitness Facility/Membership 29.6% 29.6% 67.6% 2.8%
Employee Share Ownership 25.5% 25.5% 70.0% 4.5%
Bonus or Profit Sharing Plan 41.8% 41.8% 54.5% 3.7%
Stock Options 17.1% 17.1% 78.1% 4.8%
Isolation Allowance 8.3% 8.3% 79.3% 12.4%
Parental Leave 29.0% 29.0% 47.2% 23.8%
Exhibit 5 — Employee Benefits and Perquisites – continued
100% EMPLOYER PAID
PARTIALLY EMPLOYER PAID
TOTAL PROVIDED NOT PROVIDED NO RESPONSE /
DON'T KNOWBENEFIT PROVIDED
*Numbers may not add up to 100.0% due to rounding
SECTION BSURVEY DEMOGRAPHICS AND OTHER COMPENSATION TABLES Employment Status
Exhibit 7 illustrates the employment status of this year’s respondents as of May 2016. As the survey launch notice invited participation from members with practising status only, responses do not reflect the actual distribution of full-time, part-time, students, and unemployed members in the APEGBC membership and are provided for informational purposes related to this survey only. Full-time salaried/contract workers account for 89.9% of respondents, while 2.4% indicated that they are employed part time. Owners/partners comprise 4.1% of the sample, while 1.6% of respondents are self-employed. Students, retired or unemployed members make up the remainder at 2.1% of the respondents.
Exhibit 7 — Employment Status of Respondents — May 2016
FEMALE
MALE
NOT GIVEN TOTAL ROW PERCENT
Full-time Salaried 294 1,501 18 1,813 86.1%
Full-time Contract 6 74 0 80 3.8%
Part-time Salaried 13 17 1 31 1.5%
Part-time Contract 4 14 0 18 0.9%
Owner 2 61 0 63 3.0%
Partner 1 23 0 24 1.1%
Self-employed 2 30 1 33 1.6%
Student 4 3 0 7 0.3%
Retired 0 14 0 14 0.7%
Unemployed 2 20 1 23 1.1%
TOTAL 328 1,757 21 2,106 100.0%
Column Percent 15.6% 83.4% 1.0% 100.0%
GENDER
2016 REPORT ON MEMBERS’ COMPENSATION AND BENEFITSPAGE 11
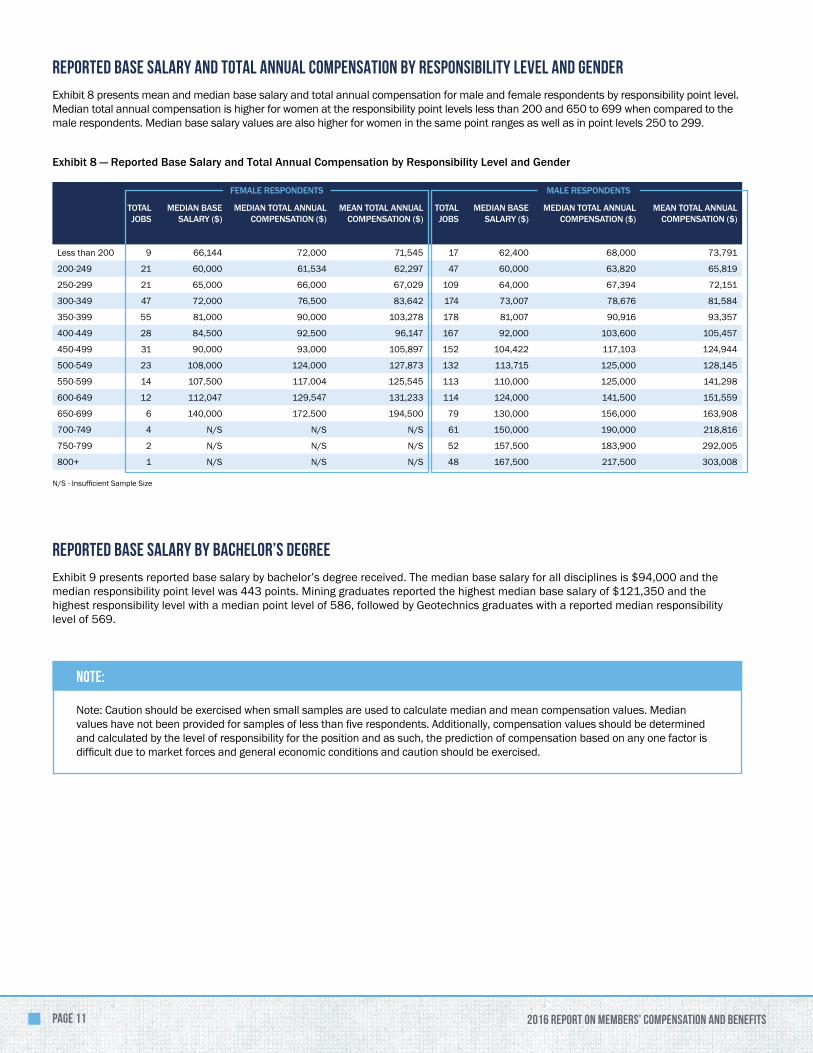
Reported Base Salary and Total Annual Compensation By Responsibility Level and Gender
Exhibit 8 presents mean and median base salary and total annual compensation for male and female respondents by responsibility point level. Median total annual compensation is higher for women at the responsibility point levels less than 200 and 650 to 699 when compared to the male respondents. Median base salary values are also higher for women in the same point ranges as well as in point levels 250 to 299.
Exhibit 8 — Reported Base Salary and Total Annual Compensation by Responsibility Level and Gender
TOTAL JOBS
MEDIAN BASE SALARY ($)
MEDIAN TOTAL ANNUAL COMPENSATION ($)
MEAN TOTAL ANNUAL COMPENSATION ($)
TOTAL JOBS
MEDIAN BASE SALARY ($)
MEDIAN TOTAL ANNUAL COMPENSATION ($)
MEAN TOTAL ANNUAL COMPENSATION ($)
Less than 200 9 66,144 72,000 71,545 17 62,400 68,000 73,791
200-249 21 60,000 61,534 62,297 47 60,000 63,820 65,819
250-299 21 65,000 66,000 67,029 109 64,000 67,394 72,151
300-349 47 72,000 76,500 83,642 174 73,007 78,676 81,584
350-399 55 81,000 90,000 103,278 178 81,007 90,916 93,357
400-449 28 84,500 92,500 96,147 167 92,000 103,600 105,457
450-499 31 90,000 93,000 105,897 152 104,422 117,103 124,944
500-549 23 108,000 124,000 127,873 132 113,715 125,000 128,145
550-599 14 107,500 117,004 125,545 113 110,000 125,000 141,298
600-649 12 112,047 129,547 131,233 114 124,000 141,500 151,559
650-699 6 140,000 172,500 194,500 79 130,000 156,000 163,908
700-749 4 N/S N/S N/S 61 150,000 190,000 218,816
750-799 2 N/S N/S N/S 52 157,500 183,900 292,005
800+ 1 N/S N/S N/S 48 167,500 217,500 303,008
N/S - Insufficient Sample Size
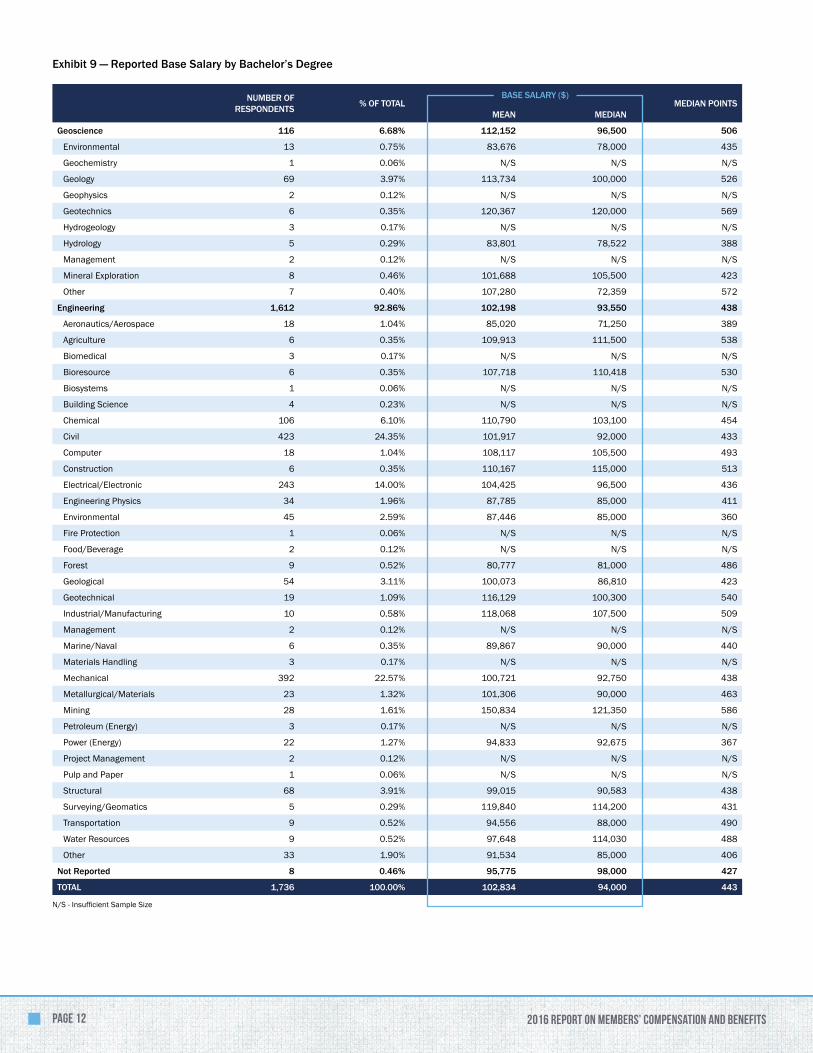
Reported Base Salary by Bachelor’s Degree
Exhibit 9 presents reported base salary by bachelor’s degree received. The median base salary for all disciplines is $94,000 and the median responsibility point level was 443 points. Mining graduates reported the highest median base salary of $121,350 and the highest responsibility level with a median point level of 586, followed by Geotechnics graduates with a reported median responsibility level of 569.
Note:
Note: Caution should be exercised when small samples are used to calculate median and mean compensation values. Median values have not been provided for samples of less than five respondents. Additionally, compensation values should be determined and calculated by the level of responsibility for the position and as such, the prediction of compensation based on any one factor is difficult due to market forces and general economic conditions and caution should be exercised.
FEMALE RESPONDENTS MALE RESPONDENTS
2016 REPORT ON MEMBERS’ COMPENSATION AND BENEFITSPAGE 12
Exhibit 9 — Reported Base Salary by Bachelor’s Degree
NUMBER OF RESPONDENTS % OF TOTAL
MEAN
MEDIANMEDIAN POINTS
Geoscience 116 6.68% 112,152 96,500 506
Environmental 13 0.75% 83,676 78,000 435
Geochemistry 1 0.06% N/S N/S N/S
Geology 69 3.97% 113,734 100,000 526
Geophysics 2 0.12% N/S N/S N/S
Geotechnics 6 0.35% 120,367 120,000 569
Hydrogeology 3 0.17% N/S N/S N/S
Hydrology 5 0.29% 83,801 78,522 388
Management 2 0.12% N/S N/S N/S
Mineral Exploration 8 0.46% 101,688 105,500 423
Other 7 0.40% 107,280 72,359 572
Engineering 1,612 92.86% 102,198 93,550 438
Aeronautics/Aerospace 18 1.04% 85,020 71,250 389
Agriculture 6 0.35% 109,913 111,500 538
Biomedical 3 0.17% N/S N/S N/S
Bioresource 6 0.35% 107,718 110,418 530
Biosystems 1 0.06% N/S N/S N/S
Building Science 4 0.23% N/S N/S N/S
Chemical 106 6.10% 110,790 103,100 454
Civil 423 24.35% 101,917 92,000 433
Computer 18 1.04% 108,117 105,500 493
Construction 6 0.35% 110,167 115,000 513
Electrical/Electronic 243 14.00% 104,425 96,500 436
Engineering Physics 34 1.96% 87,785 85,000 411
Environmental 45 2.59% 87,446 85,000 360
Fire Protection 1 0.06% N/S N/S N/S
Food/Beverage 2 0.12% N/S N/S N/S
Forest 9 0.52% 80,777 81,000 486
Geological 54 3.11% 100,073 86,810 423
Geotechnical 19 1.09% 116,129 100,300 540
Industrial/Manufacturing 10 0.58% 118,068 107,500 509
Management 2 0.12% N/S N/S N/S
Marine/Naval 6 0.35% 89,867 90,000 440
Materials Handling 3 0.17% N/S N/S N/S
Mechanical 392 22.57% 100,721 92,750 438
Metallurgical/Materials 23 1.32% 101,306 90,000 463
Mining 28 1.61% 150,834 121,350 586
Petroleum (Energy) 3 0.17% N/S N/S N/S
Power (Energy) 22 1.27% 94,833 92,675 367
Project Management 2 0.12% N/S N/S N/S
Pulp and Paper 1 0.06% N/S N/S N/S
Structural 68 3.91% 99,015 90,583 438
Surveying/Geomatics 5 0.29% 119,840 114,200 431
Transportation 9 0.52% 94,556 88,000 490
Water Resources 9 0.52% 97,648 114,030 488
Other 33 1.90% 91,534 85,000 406
Not Reported 8 0.46% 95,775 98,000 427
TOTAL 1,736 100.00% 102,834 94,000 443
N/S - Insufficient Sample Size
BASE SALARY ($)
PAGE 132016 REPORT ON MEMBERS’ COMPENSATION AND BENEFITS
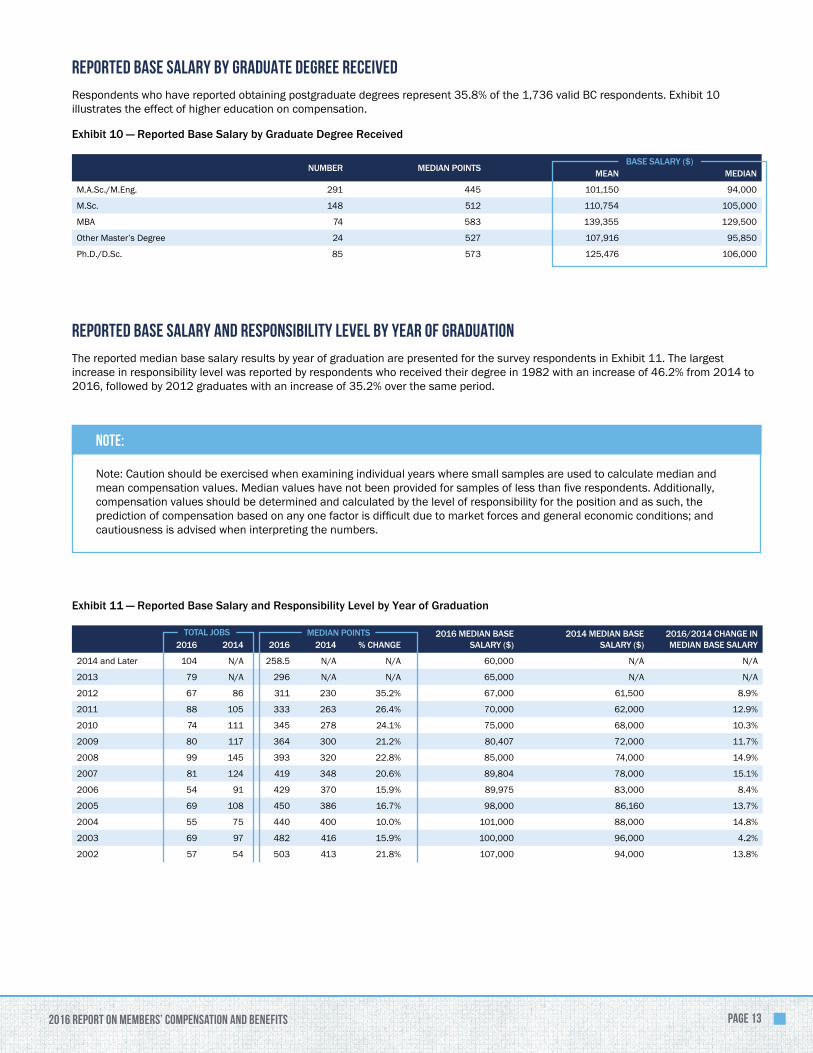
Reported Base Salary by Graduate Degree Received
Respondents who have reported obtaining postgraduate degrees represent 35.8% of the 1,736 valid BC respondents. Exhibit 10 illustrates the effect of higher education on compensation.
Exhibit 10 — Reported Base Salary by Graduate Degree Received
NUMBER MEDIAN POINTS MEAN
MEDIAN
M.A.Sc./M.Eng. 291 445 101,150 94,000
M.Sc. 148 512 110,754 105,000
MBA 74 583 139,355 129,500
Other Master’s Degree 24 527 107,916 95,850
Ph.D./D.Sc. 85 573 125,476 106,000
Reported Base Salary and Responsibility Level by Year of Graduation
The reported median base salary results by year of graduation are presented for the survey respondents in Exhibit 11. The largest increase in responsibility level was reported by respondents who received their degree in 1982 with an increase of 46.2% from 2014 to 2016, followed by 2012 graduates with an increase of 35.2% over the same period.
Note:
Note: Caution should be exercised when examining individual years where small samples are used to calculate median and mean compensation values. Median values have not been provided for samples of less than five respondents. Additionally, compensation values should be determined and calculated by the level of responsibility for the position and as such, the prediction of compensation based on any one factor is difficult due to market forces and general economic conditions; and cautiousness is advised when interpreting the numbers.
Exhibit 11 — Reported Base Salary and Responsibility Level by Year of Graduation
2016
2014
2016
2014
% CHANGE
2016 MEDIAN BASE SALARY ($)
2014 MEDIAN BASE SALARY ($)
2016/2014 CHANGE IN MEDIAN BASE SALARY
2014 and Later 104 N/A 258.5 N/A N/A 60,000 N/A N/A
2013 79 N/A 296 N/A N/A 65,000 N/A N/A
2012 67 86 311 230 35.2% 67,000 61,500 8.9%
2011 88 105 333 263 26.4% 70,000 62,000 12.9%
2010 74 111 345 278 24.1% 75,000 68,000 10.3%
2009 80 117 364 300 21.2% 80,407 72,000 11.7%
2008 99 145 393 320 22.8% 85,000 74,000 14.9%
2007 81 124 419 348 20.6% 89,804 78,000 15.1%
2006 54 91 429 370 15.9% 89,975 83,000 8.4%
2005 69 108 450 386 16.7% 98,000 86,160 13.7%
2004 55 75 440 400 10.0% 101,000 88,000 14.8%
2003 69 97 482 416 15.9% 100,000 96,000 4.2%
2002 57 54 503 413 21.8% 107,000 94,000 13.8%
TOTAL JOBS MEDIAN POINTS
BASE SALARY ($)
2016 REPORT ON MEMBERS’ COMPENSATION AND BENEFITSPAGE 14
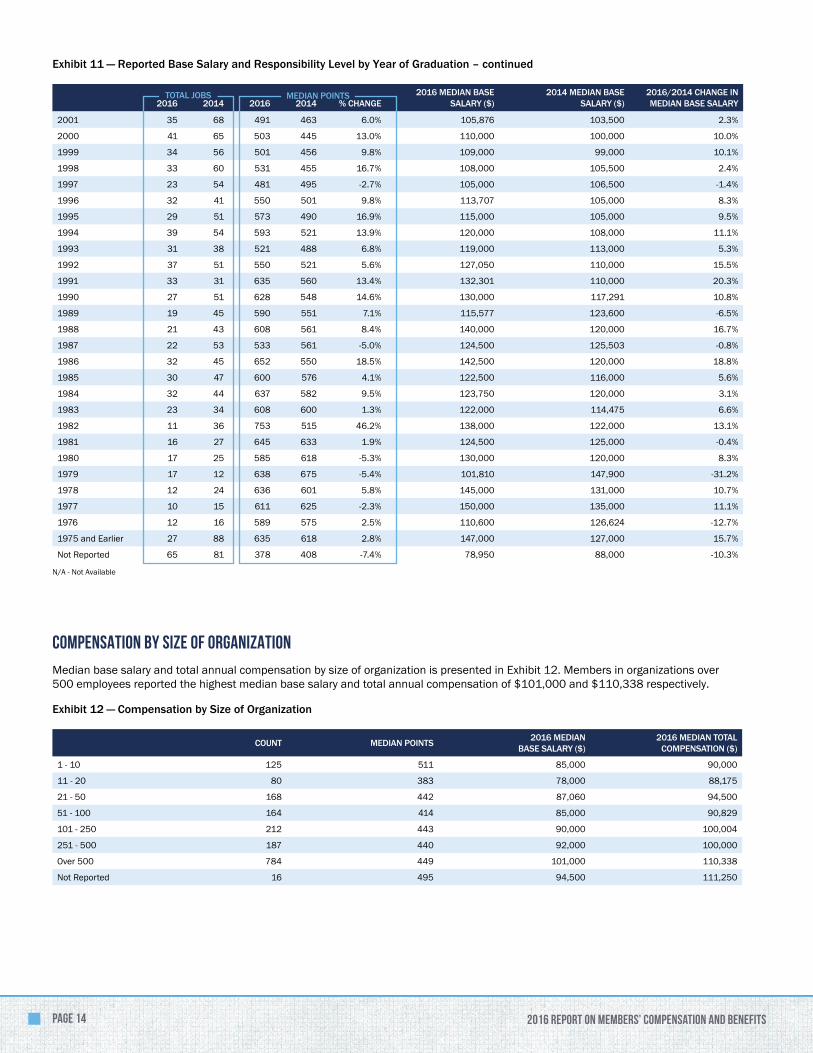
2001 35 68 491 463 6.0% 105,876 103,500 2.3%
2000 41 65 503 445 13.0% 110,000 100,000 10.0%
1999 34 56 501 456 9.8% 109,000 99,000 10.1%
1998 33 60 531 455 16.7% 108,000 105,500 2.4%
1997 23 54 481 495 -2.7% 105,000 106,500 -1.4%
1996 32 41 550 501 9.8% 113,707 105,000 8.3%
1995 29 51 573 490 16.9% 115,000 105,000 9.5%
1994 39 54 593 521 13.9% 120,000 108,000 11.1%
1993 31 38 521 488 6.8% 119,000 113,000 5.3%
1992 37 51 550 521 5.6% 127,050 110,000 15.5%
1991 33 31 635 560 13.4% 132,301 110,000 20.3%
1990 27 51 628 548 14.6% 130,000 117,291 10.8%
1989 19 45 590 551 7.1% 115,577 123,600 -6.5%
1988 21 43 608 561 8.4% 140,000 120,000 16.7%
1987 22 53 533 561 -5.0% 124,500 125,503 -0.8%
1986 32 45 652 550 18.5% 142,500 120,000 18.8%
1985 30 47 600 576 4.1% 122,500 116,000 5.6%
1984 32 44 637 582 9.5% 123,750 120,000 3.1%
1983 23 34 608 600 1.3% 122,000 114,475 6.6%
1982 11 36 753 515 46.2% 138,000 122,000 13.1%
1981 16 27 645 633 1.9% 124,500 125,000 -0.4%
1980 17 25 585 618 -5.3% 130,000 120,000 8.3%
1979 17 12 638 675 -5.4% 101,810 147,900 -31.2%
1978 12 24 636 601 5.8% 145,000 131,000 10.7%
1977 10 15 611 625 -2.3% 150,000 135,000 11.1%
1976 12 16 589 575 2.5% 110,600 126,624 -12.7%
1975 and Earlier 27 88 635 618 2.8% 147,000 127,000 15.7%
Not Reported 65 81 378 408 -7.4% 78,950 88,000 -10.3%
N/A - Not Available
Compensation by Size of Organization
Median base salary and total annual compensation by size of organization is presented in Exhibit 12. Members in organizations over 500 employees reported the highest median base salary and total annual compensation of $101,000 and $110,338 respectively.
Exhibit 12 — Compensation by Size of Organization
COUNT MEDIAN POINTS 2016 MEDIAN BASE SALARY ($)
2016 MEDIAN TOTAL COMPENSATION ($)
1 - 10 125 511 85,000 90,000
11 - 20 80 383 78,000 88,175
21 - 50 168 442 87,060 94,500
51 - 100 164 414 85,000 90,829
101 - 250 212 443 90,000 100,004
251 - 500 187 440 92,000 100,000
Over 500 784 449 101,000 110,338
Not Reported 16 495 94,500 111,250
Exhibit 11 — Reported Base Salary and Responsibility Level by Year of Graduation – continued
2016
2014
2016
2014
% CHANGE
2016 MEDIAN BASE SALARY ($)
2014 MEDIAN BASE SALARY ($)
2016/2014 CHANGE IN MEDIAN BASE SALARY
TOTAL JOBS MEDIAN POINTS
PAGE 152016 REPORT ON MEMBERS’ COMPENSATION AND BENEFITS
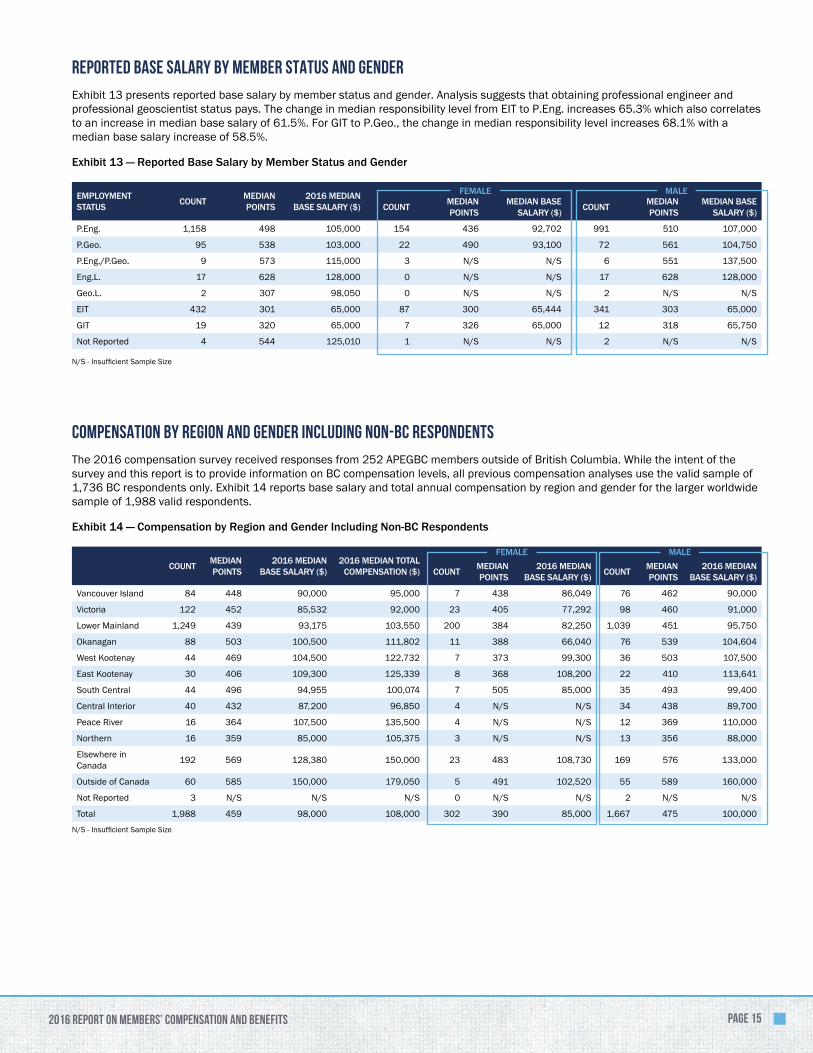
Reported Base Salary by Member Status and Gender
Exhibit 13 presents reported base salary by member status and gender. Analysis suggests that obtaining professional engineer and professional geoscientist status pays. The change in median responsibility level from EIT to P.Eng. increases 65.3% which also correlates to an increase in median base salary of 61.5%. For GIT to P.Geo., the change in median responsibility level increases 68.1% with a median base salary increase of 58.5%.
Exhibit 13 — Reported Base Salary by Member Status and Gender
EMPLOYMENT STATUS COUNT MEDIAN
POINTS2016 MEDIAN
BASE SALARY ($) COUNT
POINTSMEDIAN BASE
SALARY ($) COUNT
MEDIAN POINTS
MEDIAN BASE SALARY ($)
P.Eng. 1,158 498 105,000 154 436 92,702 991 510 107,000
P.Geo. 95 538 103,000 22 490 93,100 72 561 104,750
P.Eng./P.Geo. 9 573 115,000 3 N/S N/S 6 551 137,500
Eng.L. 17 628 128,000 0 N/S N/S 17 628 128,000
Geo.L. 2 307 98,050 0 N/S N/S 2 N/S N/S
EIT 432 301 65,000 87 300 65,444 341 303 65,000
GIT 19 320 65,000 7 326 65,000 12 318 65,750
Not Reported 4 544 125,010 1 N/S N/S 2 N/S N/S
N/S - Insufficient Sample Size
Compensation by Region and Gender Including Non-BC Respondents
The 2016 compensation survey received responses from 252 APEGBC members outside of British Columbia. While the intent of the survey and this report is to provide information on BC compensation levels, all previous compensation analyses use the valid sample of 1,736 BC respondents only. Exhibit 14 reports base salary and total annual compensation by region and gender for the larger worldwide sample of 1,988 valid respondents.
Exhibit 14 — Compensation by Region and Gender Including Non-BC Respondents
COUNT MEDIAN POINTS
2016 MEDIAN BASE SALARY ($)
2016 MEDIAN TOTAL COMPENSATION ($) COUNT
MEDIAN POINTS
2016 MEDIAN BASE SALARY ($) COUNT
MEDIAN POINTS
2016 MEDIAN BASE SALARY ($)
Vancouver Island 84 448 90,000 95,000 7 438 86,049 76 462 90,000
Victoria 122 452 85,532 92,000 23 405 77,292 98 460 91,000
Lower Mainland 1,249 439 93,175 103,550 200 384 82,250 1,039 451 95,750
Okanagan 88 503 100,500 111,802 11 388 66,040 76 539 104,604
West Kootenay 44 469 104,500 122,732 7 373 99,300 36 503 107,500
East Kootenay 30 406 109,300 125,339 8 368 108,200 22 410 113,641
South Central 44 496 94,955 100,074 7 505 85,000 35 493 99,400
Central Interior 40 432 87,200 96,850 4 N/S N/S 34 438 89,700
Peace River 16 364 107,500 135,500 4 N/S N/S 12 369 110,000
Northern 16 359 85,000 105,375 3 N/S N/S 13 356 88,000
Elsewhere in Canada 192 569 128,380 150,000 23 483 108,730 169 576 133,000
Outside of Canada 60 585 150,000 179,050 5 491 102,520 55 589 160,000
Not Reported 3 N/S N/S N/S 0 N/S N/S 2 N/S N/S
Total 1,988 459 98,000 108,000 302 390 85,000 1,667 475 100,000
N/S - Insufficient Sample Size
FEMALE MALE
FEMALE MALE
MEDIAN

Association of Professional Engineers and Geoscientists of British Columbia
200 – 4010 Regent Street, Burnaby, BC V5C 6N2
Tel 604.430.8035 | Fax 604.430.8085 | Toll Free: 1.888.430.8035 | apeg.bc.ca


![[XLS] · Web view11/1/2016 1/25/2016 1/22/2016 1/22/2016 1/21/2016 1/21/2016 1/21/2016 1/21/2016 1/21/2016 1/21/2016 1/21/2016 1/21/2016 1/20/2016 1/20/2016 1/19/2016 1/18/2016 1/18/2016](https://img.pdfslide.us/doc/110x75/5c8e2bb809d3f216698ba81b/xls-web-view1112016-1252016-1222016-1222016-1212016-1212016-1212016.jpg)


![[XLS]engineeringstudentsdata.comengineeringstudentsdata.com/downloads/2016/Telangana... · Web view2016 2016 2016 2016 2016 2016 2016 2016 2016 2016 2016 2016 2016 2016 2016 2016](https://img.pdfslide.us/doc/110x75/5b19478b7f8b9a23258c8745/xlseng-web-view2016-2016-2016-2016-2016-2016-2016-2016-2016-2016-2016-2016.jpg)