Embed Size (px)
Citation preview
THE EU
HIGHLIGHTS
THE EU IN THE WORLD
EU MARKET SUPPLY
CONSUMPTION
TRADE
EU LANDINGS
AQUACULTURE PRODUCTION
PROCESSING
WWW.EUMOFA.EU Maritime affairs
and Fisheries
FISH MARKET 2016 EDITION
I
Scope
“The EU fish market” aims at providing an economic description of the whole European fisheries and aquaculture
industry. It replies to questions such as what is produced/exported/imported, when and where, what is
consumed, by whom and what are the main trends.
Structural analysis allows a comprehensive view of the fisheries and aquaculture industries in Europe in
comparison with other food industries.
This publication is one of the services delivered by the European Market Observatory for Fisheries and
Aquaculture Products (EUMOFA).
This edition is based on data available as of July 2016.
More detailed and complementary data are available in the EUMOFA database: by species, place of sale,
Member State, partner country. Data are updated daily.
EUMOFA, developed by the European Commission, represents one of the tools of the new Market Policy in the
framework of the reform of the Common Fisheries Policy. [Regulation (EU) No 1379/2013 on the common
organisation of the markets in fishery and aquaculture products, Article 42].
As a market intelligence tool, EUMOFA provides regular weekly indicators, monthly market trends and annual
structural data along the supply chain.
The database is based on data provided and validated by Member States and European institutions. It is
available in all 24 EU languages.
EUMOFA website, publicly available as from April 2013, can be accessed at:
www.eumofa.eu

II
Methodological background
The report is mainly based on consolidated and exhaustive volume and value data collected and disseminated by EUMOFA at all stages of the supply chain.
MAIN SOURCES OF DATA. EUMOFA, EUROSTAT, national administrations of the EU, Joint Research Centre – European Commission, FAO, OECD, Federation of European Aquaculture Producers (FEAP).
SUPPLY BALANCE SHEET. The supply balance sheet provides an estimate of the supply of fishery and aquaculture products available for human consumption at EU level. Catches targeted for fishmeal (industrial catches) are excluded. The calculation of the supply balance sheet is based on the equation:
Apparent consumption = [(total catches – industrial catches) + aquaculture + imports] – exports
The resulting figures should be considered as proxies of market consumption (i.e. apparent consumption).
SELF-SUFFICIENCY RATE. EU production / Apparent consumption of the EU market
EXPENDITURE FOR FISHERY
AND AQUACULTURE
PRODUCTS
Expenditure data of this “EU fish market” are provided by EUROSTAT (for EU countries, see Charts 12, 13 and 15). These data are compiled basing on a common methodology elaborated within the “EUROSTAT – OECD PPP Programme” (http://www.oecd.org/std/prices-ppp/eurostat-oecdmethodologicalmanualonpurchasingpowerparitiesppps.htm). In “The EU fish market” report, the “Nominal expenditure at national prices in euro (millions)” and the “Nominal expenditure per head at national prices in euros” have been used. The “expenditure” is taken as a component of the GDP and concerns the final consumption expenditures on goods and services consumed by individual households. Expenditure is provided in Purchasing Power Parities (PPPs) which are spatial deflators and currency converters that eliminate the effects of the differences in price levels between Member States/countries, thus allowing volume comparisons of GDP components and comparisons of price levels. For the countries outside the Euro-zone, Price Level Indices (PLIs) are used for harmonising different currencies in a single currency (euro in this case). PLIs are obtained as ratios between PPPs and current nominal exchange rates, therefore, PPPs and PLIs values coincide in the Euro-zone countries. “Fishery and aquaculture products” is an aggregate of products, corresponding to COICOP 01.1.3, including fresh, chilled, frozen, preserved and processed seafood (http://ec.europa.eu/eurostat/ramon/nomenclatures/index.cfm?TargetUrl=LST_NOM_DTL&StrNom=HICP_2000&StrLanguageCode=EN&IntPcKey=&StrLayoutCode=EN).
LIVE WEIGHT EQUIVALENT. Since EUROSTAT provides production data in live weight, import/export net volumes are converted by using Conversion Factors (CF) for the purpose of building a harmonized Supply balance sheet. Taking the example of CF for cod, or more specifically for the item whose CN8 code is 0304 44 10: this item corresponds to the following description: “Fresh or chilled fillets of cod ‘Gadus morhua, Gadus ogac, Gadus macrocephalus’ and of fish of the species "Boreogadus saida’”. The CF is set at 2,85, representing an average of those found for skinned and boned fillets for this species in Eurostat/FAO publications. For the complete list of CFs used for the EUMOFA purposes, please refer to the Metadata published within the EUMOFA website at the link: http://www.eumofa.eu/documents/20178/24415/Metadata+2+-+DM+-+Annex+8+CF+per+CN8_%252707-%252714.pdf/7e98ac0c-a8cc-4223-9114-af64ab670532.
III
HOUSEHOLD
CONSUMPTION OF FRESH
FISH PRODUCTS
Data for the household consumption of fresh fish products are provided by EUROPANEL for 12 EU Member States. These data originate from representative household panels that record the details of every item purchased. Fresh fish species’ data monitored for each country are listed below.
Denmark – cod, dab, mackerel, mussel mytilus ssp., other flounders, other halibuts, salmon, trout, unspecified products;
France – cod, gilt-head seabrem, hake, mackerel, monk, saithe (=coalfish), salmon, trout, whiting, unspecified products;
Germany – carp, cod, herring, miscellaneous, shrimps, mussel mytilus spp., other freshwater fish, plaice, pollack, salmon, trout, unspecified products;
Hungary – total fresh products;
Ireland – cod, hake, mackerel, salmon, unspecified products;
Italy – anchovy, clam, cod, cuttlefish, European seabass, gilt-head seabream, mussel mytilus spp., octopus, salmon, squid, unspecified products;
Netherlands – cod, herring, mackerel, mussel mytilus spp., other cold-water shrimp, pangasius, plaice, salmon, shrimp Crangon spp., trout, unspecified products;
Poland – carp, mackerel, salmon, trout, unspecified products;
Portugal – clam, European seabass, gilt-head seabream, hake, mackerel, miscellaneous shrimps, octopus, salmon, sardine, scabbardfish, unspecified products;
Spain – cod, European seabass, gilt-head seabream, hake, mackerel, miscellaneous tunas, monk, other flounders, salmon, sardine, unspecified products;
Sweden – cod, European flounder, haddock, herring, other halibuts, other salmonids, pike-perch, salmon, unspecified products;
United Kingdom – cod, European seabass, haddock, mackerel, miscellaneous tunas, plaice, pollack, salmon, sole, trout, unspecified products.
ESTIMATES OF
AQUACULTURE PRODUCTS
IN IMPORTS AND EXPORTS.
For the procedure of assessment of origin of imports and exports, please refer to the EUMOFA Metadata at the link: http://www.eumofa.eu/documents/20178/24415/Metadata+3+-+DATA+ANALYSIS.pdf/b43e187e-9d9b-4d03-adbc-fede824c9b37.
AQUACULTURE DATA. ESTIMATES AND
EXTRAPOLATION FROM
EUROSTAT, FAO AND
MEMBER STATES
PUBLICATIONS.
For the purpose of properly conducting an analysis on aquaculture production in the EU, EUROSTAT data have been integrated with data deriving from national sources, FAO and sector associations. This was necessary to deal with the fact that EUROSTAT lacks data for several Member States in several years.
In order to solve this issue, the following integrations have been carried out. Austria:
2012 and 2014 data were integrated with figures provided by FAO.
Belgium: 2010-2014 data were integrated with figures provided by FAO.
Cyprus: 2011 regarding gilthead seabream and the group “Other seabreams” were integrated with figures provided by FAO. Values were estimated by multiplying the volumes of each main commercial species to its average price (average calculated using the price corresponding to year-1 and year+1).
Denmark: 2010 and 2013 values were estimated by multiplying the volumes of each main commercial species to its average price (average calculated using the price corresponding to year-1 and year+1) as provided by Danish AgriFish Agency. 2014 data were provided by FAO.
Estonia: 2010, 2012 and 2014 data were integrated with figures provided by FAO.
Finland and Hungary: 2014 data were provided by FAO.
IV
France: 2010-2012 data for salmon and turbot were integrated with figures provided by FAO. 2013 volumes for salmon, sole and turbot were integrated using FEAP; respective values were estimated by multiplying the volumes of each main commercial species to its 2014 price. 2014 data were provided by FAO.
Germany: 2011 data were integrated with figures provided by the national source (DESTATIS). They refer to trout, carp, pike, pike-perch, eel, other freshwater fish and molluscs. Specifically as concerns mollusc figures, since no details at species level is provided by DESTATIS, the aggregate amount was entirely assigned to the species “mussel”. In fact, mussel is the main mollusc farmed in Germany (oyster production is limited). Since DESTATIS does not report values for 2011, they have been estimated by multiplying the volumes to its price as for year-1 (namely, 2010). 2012 and 2013 data were integrated using FAO. 2014 data were provided by FAO.
Greece: 2010 figures referring to values were integrated with the ones provided by the national source (EL.STAT.). 2013 data were integrated using FAO.
Ireland and the United Kingdom: 2008 values were estimated by multiplying the volumes of each main commercial species to its average price (average calculated using the price corresponding to year-1 and year+1). 2014 data were integrated using FAO.
Latvia and Slovenia: 2014 data were integrated using FAO.
Malta: 2010 data regarding bluefin tuna were integrated using FAO.
Poland: 2010 data regarding carp and trout were integrated using Federation of European Aquaculture Producers (FEAP) figures. In the instances in which values were missing, 2012 prices (the only available in FEAP) were applied to 2010 and 2011 volumes in order to estimate homogeneous values. 2011 data regarding the group “Other freshwater species” were integrated using FAO.
SPECIFICATIONS ON EU
LANDINGS DATA
The following issues should be mentioned regarding data used for the “EU landings” chapter:
Portugal: 2014 figures are EUROSTAT provisional data 2014 data regarding ray were provided by the national source (DGRM).
Belgium, Denmark, Germany and Cyprus: 2014 data are EUROSTAT estimates
Netherlands: 2014 figures are EUROSTAT provisional data. It has also to be mentioned that almost all data reported for 2010, 2011 and 2012 are EUROSTAT estimates.
Ireland: 2013 and 2014 data regarding hake, and 2014 data regarding mackerel, were provided by the national source (SFPA).
PROCESSING DATA Processing data are collected from the EUROSTAT PRODCOM database, where data are organised in a specific nomenclature (PRODCOM classification of manufactured goods). In order to make these data more user-friendly, the analysis elaborated in this report “The EU fish market” has aggregated PRODCOM fish-related products into Commodity Groups. Below an example of PRODCOM codes aggregated into the Commodity “Small pelagics”:
CGs
PRODCOM CODES
Small Pelagics
10202450 Smoked herrings (including fillets)
10202455 Smoked herrings (including fillets, excluding heads, tails and
maws)
V
10202520 Prepared or preserved herrings, whole or in pieces (excluding
minced products and prepared meals and dishes)
10202530 Prepared or preserved sardines, sardinella, brisling and sprats,
whole or in pieces (excluding minced products and prepared
meals and dishes)
10202550 Prepared or preserved mackerel, whole or in pieces (excluding
minced products and prepared meals and dishes)
10202560 Prepared or preserved anchovies, whole or in pieces (excluding minced products and prepared meals and dishes)
EXTRA-EU TRADE. It encompasses all transactions between European Union (EU) Member States and countries outside the EU (non-member countries).
INTRA-EU TRADE. It encompasses all transactions declared by Member States of the European Union (EU) with one another. For the analysis of intra-EU trade, only exports have been taken into account. Actually, intra-EU trade as reported by EUROSTAT covers both arrivals (i.e. imports) and dispatches (i.e. exports). Because of different valuation principle (CIF > FOB), arrivals should be slightly higher than dispatches. This is one of the main reasons explaining asymmetries between import and export figures. In general, bilateral comparisons between MS of intra-EU flows have revealed major and persistent discrepancies. Therefore, comparisons dealing with intra-EU trade statistics and related results have to be taken into account cautiously and should consider the existence of these discrepancies. For more information, please visit EUROSTAT’s “Quality Report on International Trade Statistics”, at http://ec.europa.eu/eurostat/documents/3888793/6182577/KS-TC-14-009-EN-N.pdf.
Table of contents
0. Highlights p. 1
1. The EU in the world p. 4
1.1 Production p. 4
p. 3
1.2 Trade p. 7
1.3 Consumption p. 7
2. EU market supply p. 10
2.1 EU self-sufficiency p. 11
2.2 Supply balance and apparent consumption p. 15
3. Consumption p. 16
3.1 Expenditures and volume of fish consumption p. 16
3.2 Consumer prices – fish vs meat and food p. 18
3.3 Apparent consumption p. 19
3.4 Household consumption of fresh fish products p. 22
3.5 Out-of-home consumption p. 28
3.6 Consumption and production of organic fish and seafood p. 30
3.7 Geographical indications and traditional specialities guaranteed p. 30
4. Trade p. 32
4.1 Value of extra-EU balance trade by preservation state p. 35
4.2 Comparison between imports of fish and meat p. 36
4.3 Extra-EU imports p. 36
4.4 Extra-EU exports p. 47
4.5 Intra-EU trade p. 54
5. EU landings p. 60
6. Aquaculture production p. 69
6.1 Most relevant market trends p. 77
7. Processing p. 80
E U R O P E A N M A R K E T O B S E R V A T O R Y F O R F I S H E R I E S A N D A Q U A C U L T U R E P R O D U C T S - T H E E U F I S H M A R K E T - E D I T I O N 2 0 1 6
HIGHLIGHTS
1
Highlights
EU consumers spent 54 billion euro for buying fisheries and
aquaculture products in 2015, reaching the highest amount ever
recorded. With respect to 2014, the expenditure increased 3,2%, due
to a general positive trend recorded in all Member States (excepted
Greece).
The seafood supply in the EU grew by almost 650.000 tonnes
between 2013 and 2014 (+4,5%). The main driver was internal
production, which rose by 570.000 tonnes, mostly originating from
fishing activities. The EU’s self-sufficiency improved, moving from
44,5% to 47,5%.
Per capita fish consumption per year increased to 25,5 kg, as EU
consumers ate one kg of fish more than in 2013. The rise was more
significant for farmed products (+6%) than for fisheries products
(+2,7%). However, consumption in the EU market is dominated by
products originating from fishing activities (75% of total
consumption).
One of the most remarkable phenomena observed is the growing
relevance of cod, whose per capita consumption increased 22% from
2012 to 2014. In 2015, the total household purchases of fresh cod
amounted to EUR 1,4 billion, with the UK ranking first spending EUR
over 600 million for it.
The EU is the largest trader of fishery and aquaculture products in
the world in terms of value. In 2015, the trade flow amounted to EUR
49,3 billion and 13,8 million tonnes.
Fish alone represents almost 20% of the overall EUR 120 billion
worth of food products imported by the EU. The trade balance deficit
(exports minus imports) of 2015 was the largest ever, confirming the
EU as a net importer of fisheries and aquaculture products. The value
of imported fish grew 6% from 2014 and reached EUR 22,3 billion.
This was mainly determined by imports of cod, shrimps and salmon.
For cod and shrimps, this rise took place in the context of significant
price increases of 22% and 12%, respectively. In addition, a large 17%
import price increase was recorded for other relevant groundfish
species, namely Alaska pollock and hake. On the other hand, salmon
price remained quite stable in 2015.
Imports from Iceland registered a 19% growth, making this country
the 3rd largest EU supplier after Norway and China. Sales of cod and
of fishmeal played a significant role in this rise.
In 2015, the EU exported less fisheries and aquaculture products in
volume (-11%) compared with 2014, but their value rose to EUR 4,5
billion (+3%), the highest amount ever registered. This value increase
was driven by exports of bluefin tuna from Spain and fishmeal from
Denmark.
A major market for seafood
Growth of EU self-sufficiency
and consumption
Record level of fish imports
Increasing value of exports to
extra-EU countries
0
E U R O P E A N M A R K E T O B S E R V A T O R Y F O R F I S H E R I E S A N D A Q U A C U L T U R E P R O D U C T S - T H E E U F I S H M A R K E T - E D I T I O N 2 0 1 6
HIGHLIGHTS
2
Almost half of the fish products trade within and outside the EU
consists of exchanges between EU Member States. In 2015, intra-EU
exports were 4 times higher than exports to extra-EU countries, and
totalled the all-time peak of 6 million tonnes worth EUR 22,5 billion.
In 2014, the value of products landed in the EU was EUR 7,3 billion,
8% higher than its 10-year average. While in 2013 shrimps were the
most valued species, hake surpassed them in 2014, thanks to a
substantial increase registered by Spain and France.
In volume terms, EU landings totalled 4,5 million tonnes which was a
7-year peak. Over 40% of the total was represented by small pelagics
group. However, its 10-year trend is downward, due to the growth of
groundfish and tuna landed and to a decrease of small pelagics
landings by more than a quarter.
The EU is the largest importer in the world. In 2015 its trade deficit
reached EUR 17,8 billion, i.e. EUR 6 billion more than the United
States deficit and EUR 7 billion more than the Japanese one. The EU
deficit has been growing since 2009 and registered a significant 7%
increase with respect to 2014, due to the growing imports of both
frozen and fresh products.
Nevertheless, during 2009-2014 the EU self-sufficiency for seafood
has been rising thanks to the increase of the internal production,
which grew by 430.000 tonnes in the same period. Groundfish, small
pelagics and other marine fish were the groups of products for which
the EU has reported an improved self-sufficiency in this 6-year
period.
Retail prices for fish and seafood products have been rising from
2010 to 2015, with the highest annual growth registered in 2011.
Since then, the rate of increase has been shrinking every year.
Tuna was the most-consumed product in the EU, with a per capita
consumption of 2,6 kg in 2014, followed by cod, whose consumption
significantly increased.
The most consumed farmed species is salmon. It is also the species
with the highest production value in the EU. Salmon ranked 3rd
among the most consumed fish species in the EU and, for the first
time, its consumption surpassed 2 kg per capita in 2014.
Mussel is the 2nd most consumed aquaculture species, followed by
tropical shrimps, the latter being solely based on imports. In the
Member States surrounding the Mediterranean, farmed seabass and
seabream are higher on the list of most consumed species.
Despite a significant fall in its consumption from 2013 to 2014,
herring was the most consumed small pelagic species in the EU (1,2
kg per capita).
EU landings
Main market trends and
dynamics
Pivotal role of intra-EU trade
E U R O P E A N M A R K E T O B S E R V A T O R Y F O R F I S H E R I E S A N D A Q U A C U L T U R E P R O D U C T S - T H E E U F I S H M A R K E T - E D I T I O N 2 0 1 6
HIGHLIGHTS
3
Other trends and dynamics that notably impacted the EU market for
fisheries and aquaculture products in 2015, were the continued
import-ban imposed by Russia that contributed to the need of re-
directing trade-flows previously going to Russia to either other export
markets or internally within the EU.
Currency issues have impacted the market place to a large extent. As
important driver behind both pricing trends and volume shift, there
was the appreciation of the EUR against the Norwegian Krone
(NOK), the United States dollar (USD) and the Chinese Yuan (CNY)
rates which in 2015 reached the lowest level in more than a decade.
Parallel to a growing importance in imports from Iceland, the EUR
depreciated against the Icelandic króna (ISK).
During the first 7 months of 2016 the exchange rate trends seen in
2015 for NOK and ISK continued, with appreciation of EUR against
the NOK (+9%) and depreciation compared with ISK (-5%). On the
other hand, the EUR/USD exchange rate has remained unchanged in
average.
From the beginning of 2016 to end July, the Pound Sterling (GBP)
weakened compared with the EUR (-11%), affected by the EU
referendum in June 2016. In the first 7 months of 2016, the GBP
depreciated 6% against EUR, compared with the corresponding
period of 2015.

E U R O P E A N M A R K E T O B S E R V A T O R Y F O R F I S H E R I E S A N D A Q U A C U L T U R E P R O D U C T S - T H E E U F I S H M A R K E T - E D I T I O N 2 0 1 6
T h e E U i n t h e w o r l d
4
The EU in the world
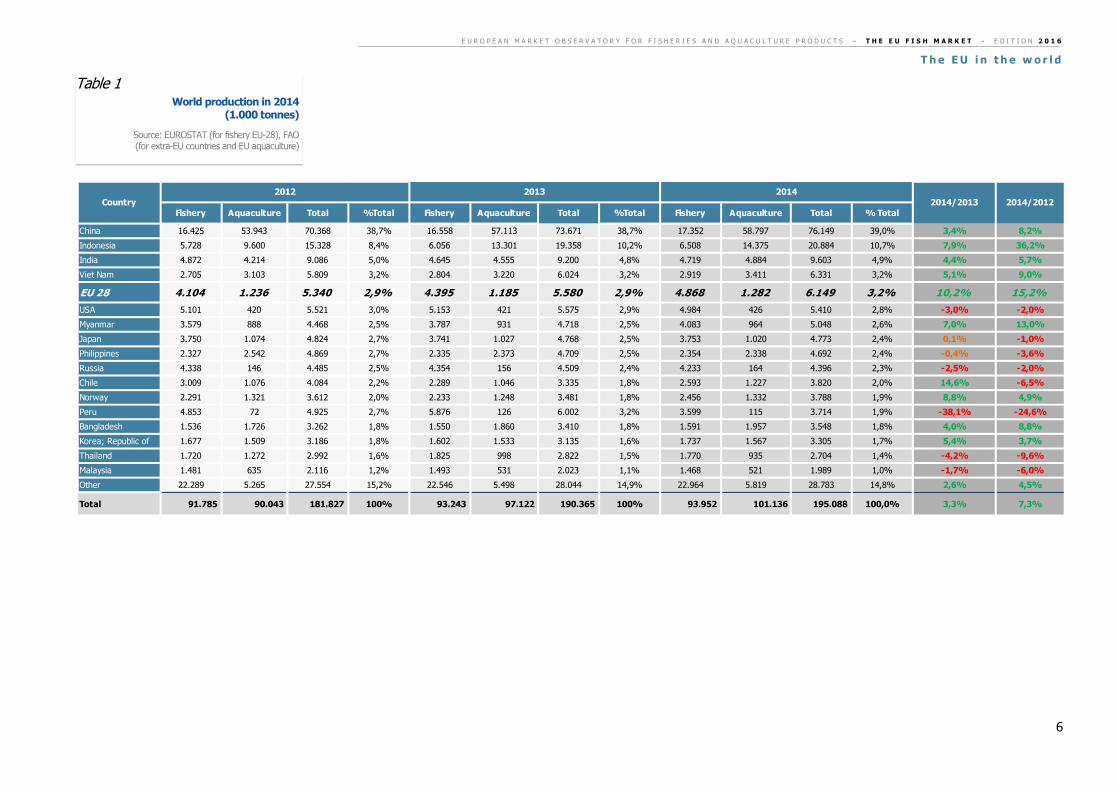
EU production volume has been constantly increasing since 2012.
Between 2012 and 2014, volume increased due to a 19% increase in
catches and a 4% increase in aquaculture. This amounted to a total of
6,15 million tonnes in 2014, which was an increase of 15% compared
with 2012, when it amounted to 5,34 million tonnes1.
During the same period, total world production increased 7%,
moving from around 182 million tonnes to 195 million tonnes. A
significant 50% increase in aquaculture production was registered in
Indonesia, while in Thailand, it dropped 27%, due to an outbreak of
early mortality syndrome (EMS) which hit shrimp farm production2.
In Peru, a total production drop of 25%, mainly due to the effects of
El Niño, caused the country’s ranking for catches3 to slip. In 2013,
Peru ranked fifth while the EU was sixth.
It is worth noting that 92% of world aquaculture production and 72%
of world catches originate from Asia, mainly China, Indonesia and
India.
In China the most important species produced are freshwater fish
with 27 million tonnes, molluscs with 15 million tonnes and aquatic
plants with 18 million tonnes. Since 2012, China has increased its
freshwater fish production by 11%. Carp, the most important species
it produces, accounts for 71% of the total freshwater fish.
In Indonesia, the most important species, aquatic plants, account for
49% of total production, followed by marine fish with 28% and
freshwater fish with 16%. In India the most important species
produced are freshwater fish with 5,6 million tonnes and marine
1 In 2012 the EU Member States totalled 27. Croatia entered in 2013. 2 FAO The State of the world fishery and aquaculture – 2016”, pp. 6-7. 3 According to FAO The State of the World Fishery and Aquaculture, (p. 4) “Catches of anchoveta in Peru fell to 2,3 million tonnes in 2014 – half that of the previous year and the lowest level since the strong El Niño in 1998.”
Asia74%
America11%
Europe9%
Africa5%
Oceania1%
Chart 1 World production (fishery and aquaculture)
by continents, in volume (2014)
Source: EUROSTAT (for fishery EU-28), FAO (for extra-EU countries and EU aquaculture)
1.1 Production
1
E U R O P E A N M A R K E T O B S E R V A T O R Y F O R F I S H E R I E S A N D A Q U A C U L T U R E P R O D U C T S - T H E E U F I S H M A R K E T - E D I T I O N 2 0 1 6
T h e E U i n t h e w o r l d
5
fish with 2,3 million tonnes. In 2014, 79% of freshwater fish products
imported in the EU originated from Asia.
In America, the most important species produced are anchovy,
Alaska pollock and herring, mainly in Peru, USA and Chile.
In Africa, total 2014 fish production amounted to around 11 million,
of which 5,4 million was small pelagics. Sardine, anchovy and
herring together accounted for 2,5 million tonnes while freshwater
fish amounted to 4,5 million tonnes. Nile perch of Tanzania is the
most imported freshwater fish species in the EU originated from
Africa.
E U R O P E A N M A R K E T O B S E R V A T O R Y F O R F I S H E R I E S A N D A Q U A C U L T U R E P R O D U C T S - T H E E U F I S H M A R K E T - E D I T I O N 2 0 1 6
T h e E U i n t h e w o r l d
6
Fishery Aquaculture Total %Total Fishery Aquaculture Total %Total Fishery Aquaculture Total % Total
China 16.425 53.943 70.368 38,7% 16.558 57.113 73.671 38,7% 17.352 58.797 76.149 39,0% 3,4% 8,2%
Indonesia 5.728 9.600 15.328 8,4% 6.056 13.301 19.358 10,2% 6.508 14.375 20.884 10,7% 7,9% 36,2%
India 4.872 4.214 9.086 5,0% 4.645 4.555 9.200 4,8% 4.719 4.884 9.603 4,9% 4,4% 5,7%
Viet Nam 2.705 3.103 5.809 3,2% 2.804 3.220 6.024 3,2% 2.919 3.411 6.331 3,2% 5,1% 9,0%
EU 28 4.104 1.236 5.340 2,9% 4.395 1.185 5.580 2,9% 4.868 1.282 6.149 3,2% 10,2% 15,2%
USA 5.101 420 5.521 3,0% 5.153 421 5.575 2,9% 4.984 426 5.410 2,8% -3,0% -2,0%
Myanmar 3.579 888 4.468 2,5% 3.787 931 4.718 2,5% 4.083 964 5.048 2,6% 7,0% 13,0%
Japan 3.750 1.074 4.824 2,7% 3.741 1.027 4.768 2,5% 3.753 1.020 4.773 2,4% 0,1% -1,0%
Philippines 2.327 2.542 4.869 2,7% 2.335 2.373 4.709 2,5% 2.354 2.338 4.692 2,4% -0,4% -3,6%
Russia 4.338 146 4.485 2,5% 4.354 156 4.509 2,4% 4.233 164 4.396 2,3% -2,5% -2,0%
Chile 3.009 1.076 4.084 2,2% 2.289 1.046 3.335 1,8% 2.593 1.227 3.820 2,0% 14,6% -6,5%
Norway 2.291 1.321 3.612 2,0% 2.233 1.248 3.481 1,8% 2.456 1.332 3.788 1,9% 8,8% 4,9%
Peru 4.853 72 4.925 2,7% 5.876 126 6.002 3,2% 3.599 115 3.714 1,9% -38,1% -24,6%
Bangladesh 1.536 1.726 3.262 1,8% 1.550 1.860 3.410 1,8% 1.591 1.957 3.548 1,8% 4,0% 8,8%
Korea; Republic of 1.677 1.509 3.186 1,8% 1.602 1.533 3.135 1,6% 1.737 1.567 3.305 1,7% 5,4% 3,7%
Thailand 1.720 1.272 2.992 1,6% 1.825 998 2.822 1,5% 1.770 935 2.704 1,4% -4,2% -9,6%
Malaysia 1.481 635 2.116 1,2% 1.493 531 2.023 1,1% 1.468 521 1.989 1,0% -1,7% -6,0%
Other 22.289 5.265 27.554 15,2% 22.546 5.498 28.044 14,9% 22.964 5.819 28.783 14,8% 2,6% 4,5%
Total 91.785 90.043 181.827 100% 93.243 97.122 190.365 100% 93.952 101.136 195.088 100,0% 3,3% 7,3%
2014/2013 2014/2012
20142012 2013
Country
Table 1 World production in 2014
(1.000 tonnes)
Source: EUROSTAT (for fishery EU-28), FAO (for extra-EU countries and EU aquaculture)
E U R O P E A N M A R K E T O B S E R V A T O R Y F O R F I S H E R I E S A N D A Q U A C U L T U R E P R O D U C T S - T H E E U F I S H M A R K E T - E D I T I O N 2 0 1 6
T h e E U i n t h e w o r l d
7
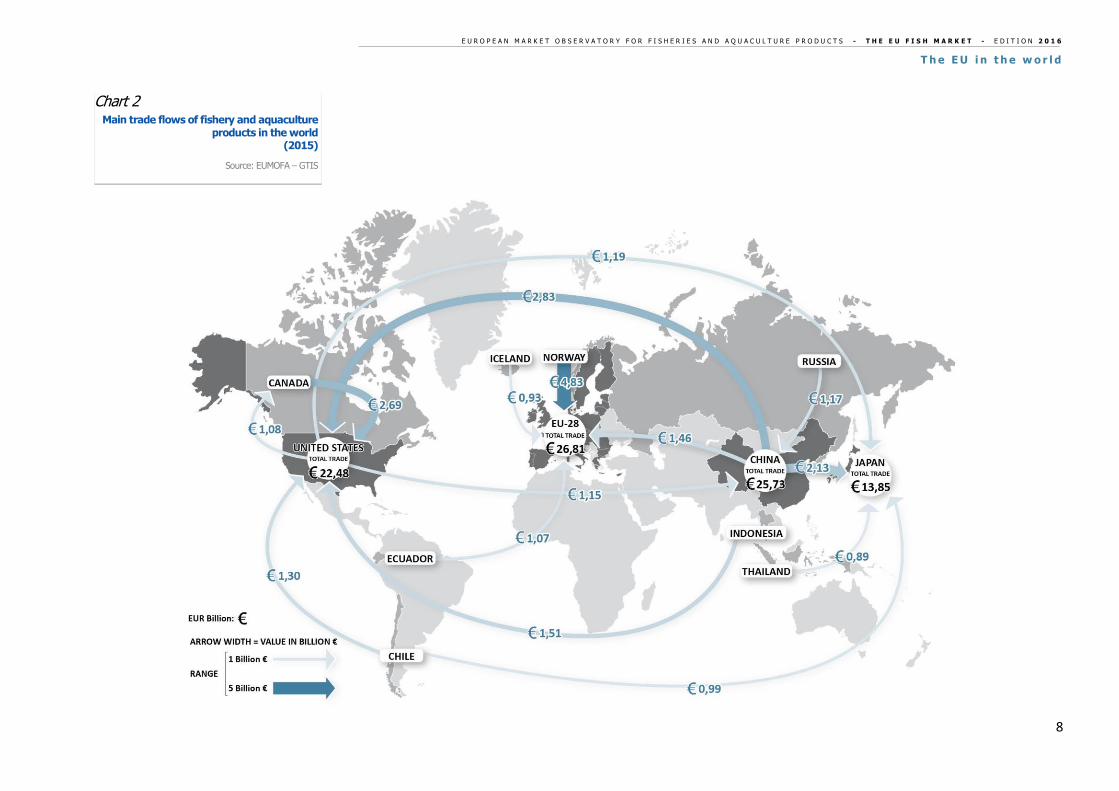
The EU is the top trader of fishery and aquaculture products in the
world in value. In 2015, total extra-EU trade (imports plus exports)
amounted to EUR 26,81 billion in 2015, an increase of 6% from 2014.
China’s trade value ranked second to the EU, with EUR 25,73 billion,
a 13% increase from 2014. EU domestic consumption is mostly
supplied by imports, especially from Norway with EUR 4,83 billion.
In general, the main products imported in the EU are frozen or
prepared meals. Shrimps, tuna, whitefish and fish-meal are the most
imported products.
World consumption moved from 16,1 kg/per capita in 2001 to 19,7 in
2013, marking a 22% increase. In this period, Asia registered the
highest percentage variation, with a 32% increase. In 2013, Europe4
and Asia increased per capita consumption by 2% and 8%,
respectively, compared with 2011, while the rest of the world
registered a decrease in 2013. In 2013, Oceania recorded the highest
per capita consumption, despite a 6% decrease from 2011.
4 “Europe” includes the EU-28 countries and Albania, Belarus, Bosnia and Herzegovina, Iceland, Montenegro, Norway, Republic of Moldova, Russian Federation, Serbia, Switzerland and Ukraine.
1.3 Consumption
1.2 Trade
E U R O P E A N M A R K E T O B S E R V A T O R Y F O R F I S H E R I E S A N D A Q U A C U L T U R E P R O D U C T S - T H E E U F I S H M A R K E T - E D I T I O N 2 0 1 6
T h e E U i n t h e w o r l d
8
Chart 2 Main trade flows of fishery and aquaculture
products in the world (2015)
Source: EUMOFA – GTIS

E U R O P E A N M A R K E T O B S E R V A T O R Y F O R F I S H E R I E S A N D A Q U A C U L T U R E P R O D U C T S - T H E E U F I S H M A R K E T - E D I T I O N 2 0 1 6
T h e E U i n t h e w o r l d
9
21,8
24,0 23,3 22,621,6 21,7 21,4
2001 2003 2005 2007 2009 2011 2013
Northern America
19,9 19,720,6
22,2 22,0 21,8 22,2
2001 2003 2005 2007 2009 2011 2013
Europe
9,1 8,99,3
10,1 10,09,5 9,4
2001 2003 2005 2007 2009 2011 2013
Latin America and Caribbean
8,3 8,3 9,110,4 9,9 10,9
9,8
2001 2003 2005 2007 2009 2011 2013
Africa
17,5 17,9 18,6 19,6 20,7 21,3 23,0
2001 2003 2005 2007 2009 2011 2013
Asia
23,4
25,9 26,327,0
25,826,5
24,8
2001 2003 2005 2007 2009 2011 2013
Oceania
Chart 3 Consumption per capita in the world (kg, 2001 - 2013)
Source: FAO
E U R O P E A N M A R K E T O B S E R V A T O R Y F O R F I S H E R I E S A N D A Q U A C U L T U R E P R O D U C T S - T H E E U F I S H M A R K E T - E D I T I O N 2 0 1 6
E U m a r k e t s u p p l y
10
EU market supply
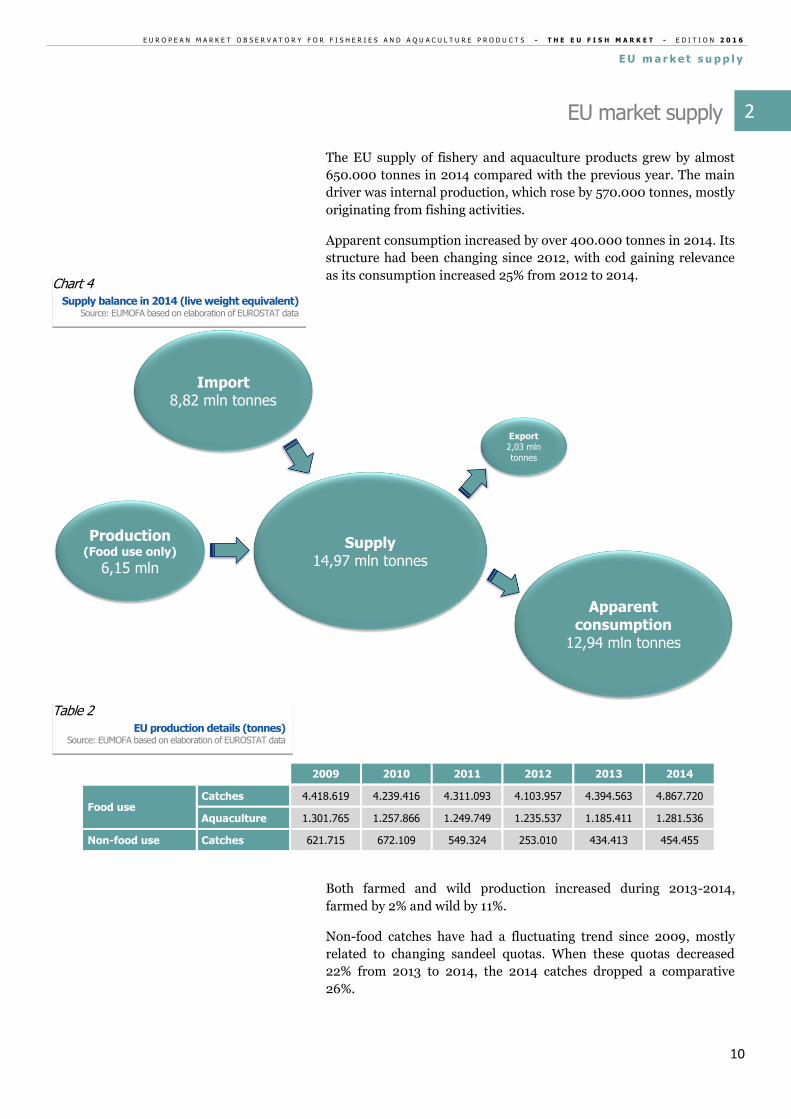
The EU supply of fishery and aquaculture products grew by almost
650.000 tonnes in 2014 compared with the previous year. The main
driver was internal production, which rose by 570.000 tonnes, mostly
originating from fishing activities.
Apparent consumption increased by over 400.000 tonnes in 2014. Its
structure had been changing since 2012, with cod gaining relevance
as its consumption increased 25% from 2012 to 2014.
2009 2010 2011 2012 2013 2014
Food use Catches 4.418.619 4.239.416 4.311.093 4.103.957 4.394.563 4.867.720
Aquaculture 1.301.765 1.257.866 1.249.749 1.235.537 1.185.411 1.281.536
Non-food use Catches 621.715 672.109 549.324 253.010 434.413 454.455
Both farmed and wild production increased during 2013-2014,
farmed by 2% and wild by 11%.
Non-food catches have had a fluctuating trend since 2009, mostly
related to changing sandeel quotas. When these quotas decreased
22% from 2013 to 2014, the 2014 catches dropped a comparative
26%.
Supply14,97 mln tonnes
Production(Food use only)
6,15 mln
Import8,82 mln tonnes
Export2,03 mln tonnes
Apparent consumption
12,94 mln tonnes
Chart 4 Supply balance in 2014 (live weight equivalent)
Source: EUMOFA based on elaboration of EUROSTAT data
Table 2 EU production details (tonnes)
Source: EUMOFA based on elaboration of EUROSTAT data
2

E U R O P E A N M A R K E T O B S E R V A T O R Y F O R F I S H E R I E S A N D A Q U A C U L T U R E P R O D U C T S - T H E E U F I S H M A R K E T - E D I T I O N 2 0 1 6
E U m a r k e t s u p p l y
11
The supply of the EU market is ensured by EU production and
imports.
The self-sufficiency rate – which is the ratio of EU production
(catches and aquaculture) to total apparent consumption of the EU
market – increased from 44,5% to 47,5% during 2013-2014, in spite
of a consumption increase. It has to be noted that a significant part of
this positive evolution was linked to the catch increase of species
which are not totally landed in the EU (tuna, small pelagics). This
means that the EU production was able to keep up with the rise of the
internal demand in 2014. However, the top four species consumed in
the EU – cod, tuna, salmon and Alaska pollock – represented 32% of
the market, and were mostly or totally imported from third countries.
Products Self sufficiency
Mackerel 124%
Herring 120%
Mussel 100%
Plaice 97%
Sole 92%
Sardine 91%
Trout 90%
Gilt-head seabream 90%
European seabass 86%
Monk 56%
Clam 49%
Hake 37%
Tuna 34%
Scallop 27%
Squid 20%
Salmon 18%
Cod 12%
Tropical shrimp 4%
Freshwater catfish 3%
Alaska pollock 0%
0,0%
10,0%
20,0%
30,0%
40,0%
50,0%
60,0%
0,00
2,00
4,00
6,00
8,00
10,00
12,00
14,00
2005 2006 2007 2008 2009 2010 2011 2012 2013 2014
Se
lf-s
uff
icie
ncy r
ate
Ap
pa
ren
t co
nsu
mp
tio
n
Apparent consumption (million tonnes) Self-sufficiency rate
The EU’s self-sufficiency increased during 2013-
2014
Chart 5 EU market trend and self-sufficiency rates
Source: EUMOFA based on elaboration of EUROSTAT data
Table 3 Self-sufficiency rate
of most consumed products (2014) Source: EUMOFA based on elaboration of EUROSTAT data
2.1 EU self sufficiency

E U R O P E A N M A R K E T O B S E R V A T O R Y F O R F I S H E R I E S A N D A Q U A C U L T U R E P R O D U C T S - T H E E U F I S H M A R K E T - E D I T I O N 2 0 1 6
E U m a r k e t s u p p l y
12
Commodity group 2005 2006 2007 2008 2009 2010 2011 2012 2013 2014
Bivalves and other molluscs and aquatic invertebrates
70% 65% 68% 62% 63% 60% 60% 64% 62% 61%
Cephalopods 16% 16% 18% 17% 17% 17% 18% 21% 21% 21%
Crustaceans 23% 23% 24% 23% 23% 21% 21% 21% 21% 21%
Flat fish 89% 83% 87% 93% 93% 95% 98% 77% 79% 75%
Freshwater fish 27% 20% 18% 26% 25% 22% 17% 17% 18% 20%
Groundfish 30% 29% 27% 24% 22% 22% 18% 21% 22% 25%
Other marine fish 52% 49% 51% 51% 57% 61% 60% 70% 69% 66%
Salmonids 37% 36% 34% 34% 35% 35% 33% 31% 31% 30%
Small pelagics 122% 110% 103% 103% 100% 106% 104% 109% 106% 124%
Tuna and tuna-like species 32% 26% 24% 35% 24% 21% 26% 26% 29% 34%
Total 50,2% 46,2% 46,8% 45,0% 44,6% 43,5% 43,1% 44,6% 44,5% 47,5%
This category contributes the most to the overall EU self-sufficiency.
In 2014, its production reached its 7-year peak at 2,3 million tonnes,
increasing by 15% over 2013 and leading to a self-sufficiency peak.
However, demand for these products registered a decline, with their
apparent consumption falling by more than 30.000 tonnes.
In 2011, the self-sufficiency of groundfish plummeted due to
increasing imports. It remained low in 2012 and 2013, but recovered
in 2014, reaching 25%. This was due to a 130.000-tonne rise in
catches, mostly of blue whiting and hake.
Cod, on the other hand, has its internal demand predominantly met
through imports: in 2014, only 10% of the total supply was produced
in the EU. Cod, together with Alaska pollock, which is not produced
in the EU at all, significantly reduces the overall self-sufficiency of
this commodity group.
0%
20%
40%
60%
80%
100%
120%
140%
0,00
0,50
1,00
1,50
2,00
2,50
2005 2006 2007 2008 2009 2010 2011 2012 2013 2014
Se
lf-s
uff
icie
ncy r
ate
Ap
pa
ren
t co
nsu
mp
tio
n
Apparent consumption (million tonnes) Self-sufficiency rate
Table 4 Self-sufficiency rate by commodity group
Source: EUMOFA based on elaboration of EUROSTAT data
Small pelagics
Chart 6 EU market trend and self-sufficiency rates for
small pelagics Source: EUMOFA based on elaboration of EUROSTAT data
Groundfish

E U R O P E A N M A R K E T O B S E R V A T O R Y F O R F I S H E R I E S A N D A Q U A C U L T U R E P R O D U C T S - T H E E U F I S H M A R K E T - E D I T I O N 2 0 1 6
E U m a r k e t s u p p l y
13
EU self-sufficiency for salmonids started to decrease in 2011, when
imports grew by 34.500 tonnes and production fell by 25.400 tonnes,
mainly related to a decrease of farmed trout. Imports grew 26%
between 2011 and 2014, which reduced EU self-sufficiency to 30% in
2014, the lowest level of the last 11 years.
Salmon alone has a remarkable impact on the low self-sufficiency of
the whole group of products. Trout, however, has an opposite impact,
with a high self-sufficiency of 90% in both 2013 and 2014.
EU self-sufficiency for flat fish plummeted over 20% in 2012 due to a
substantial growth in imports of frozen fillets of flatfish from China
(CN-8 code 03033970). Although growth of catches generated a
slight increase of self-sufficiency in 2013, it fell again during 2013-
2014 reaching 75%, due to both a 14.000-tonne increase in imports
and a 15.300-tonne decrease in catches.
However, the demand for plaice and sole, the most consumed species
of this commodity group, is mostly satisfied through internal
production. The self-sufficiency for plaice increased from 96% to 97%
in 2014, due to both increasing catches and lowered demand. As for
sole, growing imports meant the EU self-sufficiency fell from 95% to
92%.
0%
5%
10%
15%
20%
25%
30%
35%
0,00
0,50
1,00
1,50
2,00
2,50
3,00
3,50
2005 2006 2007 2008 2009 2010 2011 2012 2013 2014
Se
lf-s
uff
icie
ncy r
ate
Ap
pa
ren
t co
nsu
mp
tio
n
Apparent consumption (million tonnes) Self-sufficiency rate
0%
5%
10%
15%
20%
25%
30%
35%
40%
0,00
0,25
0,50
0,75
1,00
1,25
1,50
2005 2006 2007 2008 2009 2010 2011 2012 2013 2014S
elf
-su
ffic
ien
cy r
ate
Ap
pa
ren
t co
nsu
mp
tio
n
Apparent consumption (million tonnes) Self-sufficiency rate
Chart 7 EU market trend and self-sufficiency rates for
groundfish Source: EUMOFA based on elaboration of EUROSTAT data
18% of the salmon consumed in the EU is
produced internally
Salmonids
Chart 8 EU market trend and self-sufficiency rates for
salmonids Source: EUMOFA based on elaboration of EUROSTAT data
Flat fish
E U R O P E A N M A R K E T O B S E R V A T O R Y F O R F I S H E R I E S A N D A Q U A C U L T U R E P R O D U C T S - T H E E U F I S H M A R K E T - E D I T I O N 2 0 1 6
E U m a r k e t s u p p l y
14
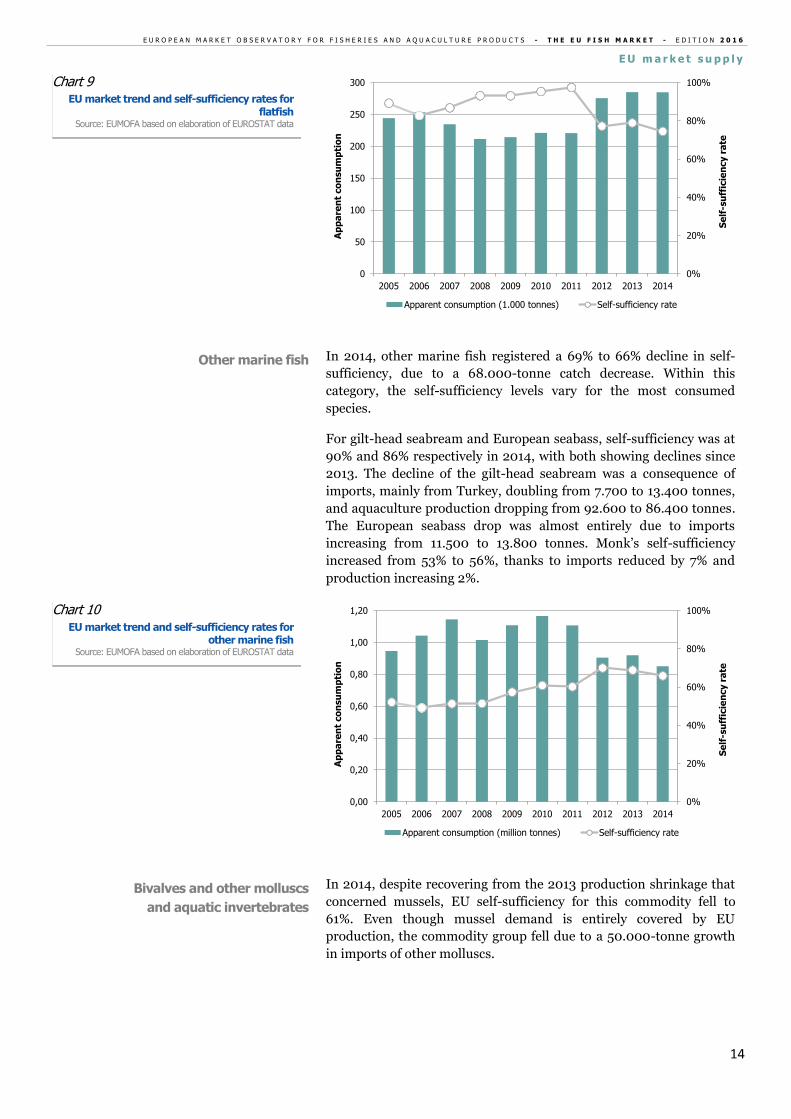
In 2014, other marine fish registered a 69% to 66% decline in self-
sufficiency, due to a 68.000-tonne catch decrease. Within this
category, the self-sufficiency levels vary for the most consumed
species.
For gilt-head seabream and European seabass, self-sufficiency was at
90% and 86% respectively in 2014, with both showing declines since
2013. The decline of the gilt-head seabream was a consequence of
imports, mainly from Turkey, doubling from 7.700 to 13.400 tonnes,
and aquaculture production dropping from 92.600 to 86.400 tonnes.
The European seabass drop was almost entirely due to imports
increasing from 11.500 to 13.800 tonnes. Monk’s self-sufficiency
increased from 53% to 56%, thanks to imports reduced by 7% and
production increasing 2%.
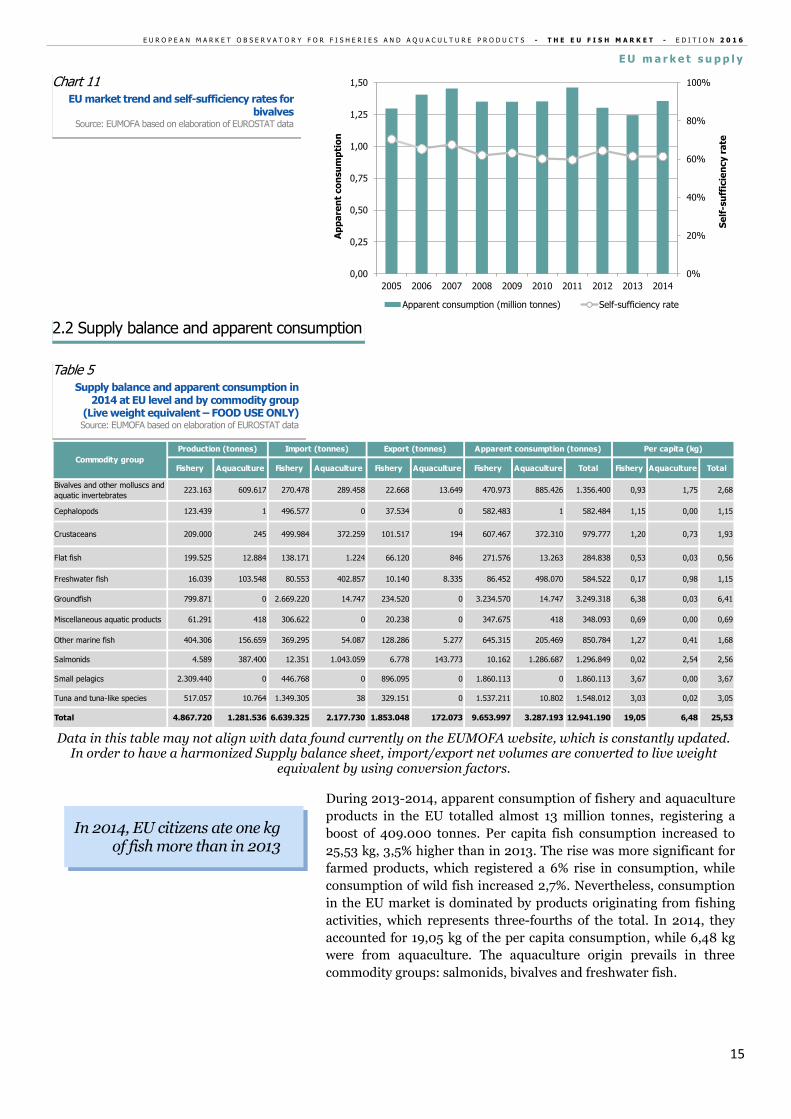
In 2014, despite recovering from the 2013 production shrinkage that
concerned mussels, EU self-sufficiency for this commodity fell to
61%. Even though mussel demand is entirely covered by EU
production, the commodity group fell due to a 50.000-tonne growth
in imports of other molluscs.
0%
20%
40%
60%
80%
100%
0
50
100
150
200
250
300
2005 2006 2007 2008 2009 2010 2011 2012 2013 2014
Se
lf-s
uff
icie
ncy r
ate
Ap
pa
ren
t co
nsu
mp
tio
n
Apparent consumption (1.000 tonnes) Self-sufficiency rate
0%
20%
40%
60%
80%
100%
0,00
0,20
0,40
0,60
0,80
1,00
1,20
2005 2006 2007 2008 2009 2010 2011 2012 2013 2014
Se
lf-s
uff
icie
ncy r
ate
Ap
pa
ren
t co
nsu
mp
tio
n
Apparent consumption (million tonnes) Self-sufficiency rate
Chart 9 EU market trend and self-sufficiency rates for
flatfish Source: EUMOFA based on elaboration of EUROSTAT data
Other marine fish
Chart 10 EU market trend and self-sufficiency rates for
other marine fish Source: EUMOFA based on elaboration of EUROSTAT data
Bivalves and other molluscs
and aquatic invertebrates
E U R O P E A N M A R K E T O B S E R V A T O R Y F O R F I S H E R I E S A N D A Q U A C U L T U R E P R O D U C T S - T H E E U F I S H M A R K E T - E D I T I O N 2 0 1 6
E U m a r k e t s u p p l y
15
Data in this table may not align with data found currently on the EUMOFA website, which is constantly updated.
In order to have a harmonized Supply balance sheet, import/export net volumes are converted to live weight equivalent by using conversion factors.
During 2013-2014, apparent consumption of fishery and aquaculture
products in the EU totalled almost 13 million tonnes, registering a
boost of 409.000 tonnes. Per capita fish consumption increased to
25,53 kg, 3,5% higher than in 2013. The rise was more significant for
farmed products, which registered a 6% rise in consumption, while
consumption of wild fish increased 2,7%. Nevertheless, consumption
in the EU market is dominated by products originating from fishing
activities, which represents three-fourths of the total. In 2014, they
accounted for 19,05 kg of the per capita consumption, while 6,48 kg
were from aquaculture. The aquaculture origin prevails in three
commodity groups: salmonids, bivalves and freshwater fish.
0%
20%
40%
60%
80%
100%
0,00
0,25
0,50
0,75
1,00
1,25
1,50
2005 2006 2007 2008 2009 2010 2011 2012 2013 2014
Se
lf-s
uff
icie
ncy r
ate
Ap
pa
ren
t co
nsu
mp
tio
n
Apparent consumption (million tonnes) Self-sufficiency rate
Fishery Aquaculture Fishery Aquaculture Fishery Aquaculture Fishery Aquaculture Total Fishery Aquaculture Total
Bivalves and other molluscs and
aquatic invertebrates223.163 609.617 270.478 289.458 22.668 13.649 470.973 885.426 1.356.400 0,93 1,75 2,68
Cephalopods 123.439 1 496.577 0 37.534 0 582.483 1 582.484 1,15 0,00 1,15
Crustaceans 209.000 245 499.984 372.259 101.517 194 607.467 372.310 979.777 1,20 0,73 1,93
Flat fish 199.525 12.884 138.171 1.224 66.120 846 271.576 13.263 284.838 0,53 0,03 0,56
Freshwater fish 16.039 103.548 80.553 402.857 10.140 8.335 86.452 498.070 584.522 0,17 0,98 1,15
Groundfish 799.871 0 2.669.220 14.747 234.520 0 3.234.570 14.747 3.249.318 6,38 0,03 6,41
Miscellaneous aquatic products 61.291 418 306.622 0 20.238 0 347.675 418 348.093 0,69 0,00 0,69
Other marine fish 404.306 156.659 369.295 54.087 128.286 5.277 645.315 205.469 850.784 1,27 0,41 1,68
Salmonids 4.589 387.400 12.351 1.043.059 6.778 143.773 10.162 1.286.687 1.296.849 0,02 2,54 2,56
Small pelagics 2.309.440 0 446.768 0 896.095 0 1.860.113 0 1.860.113 3,67 0,00 3,67
Tuna and tuna-like species 517.057 10.764 1.349.305 38 329.151 0 1.537.211 10.802 1.548.012 3,03 0,02 3,05
Total 4.867.720 1.281.536 6.639.325 2.177.730 1.853.048 172.073 9.653.997 3.287.193 12.941.190 19,05 6,48 25,53
Per capita (kg)
Commodity group
Production (tonnes) Import (tonnes) Export (tonnes) Apparent consumption (tonnes)
Chart 11 EU market trend and self-sufficiency rates for
bivalves Source: EUMOFA based on elaboration of EUROSTAT data
Table 5 Supply balance and apparent consumption in
2014 at EU level and by commodity group (Live weight equivalent – FOOD USE ONLY) Source: EUMOFA based on elaboration of EUROSTAT data
2.2 Supply balance and apparent consumption
In 2014, EU citizens ate one kg of fish more than in 2013

E U R O P E A N M A R K E T O B S E R V A T O R Y F O R F I S H E R I E S A N D A Q U A C U L T U R E P R O D U C T S - T H E E U F I S H M A R K E T - E D I T I O N 2 0 1 6
C o n s u m p t i o n
16
Consumption
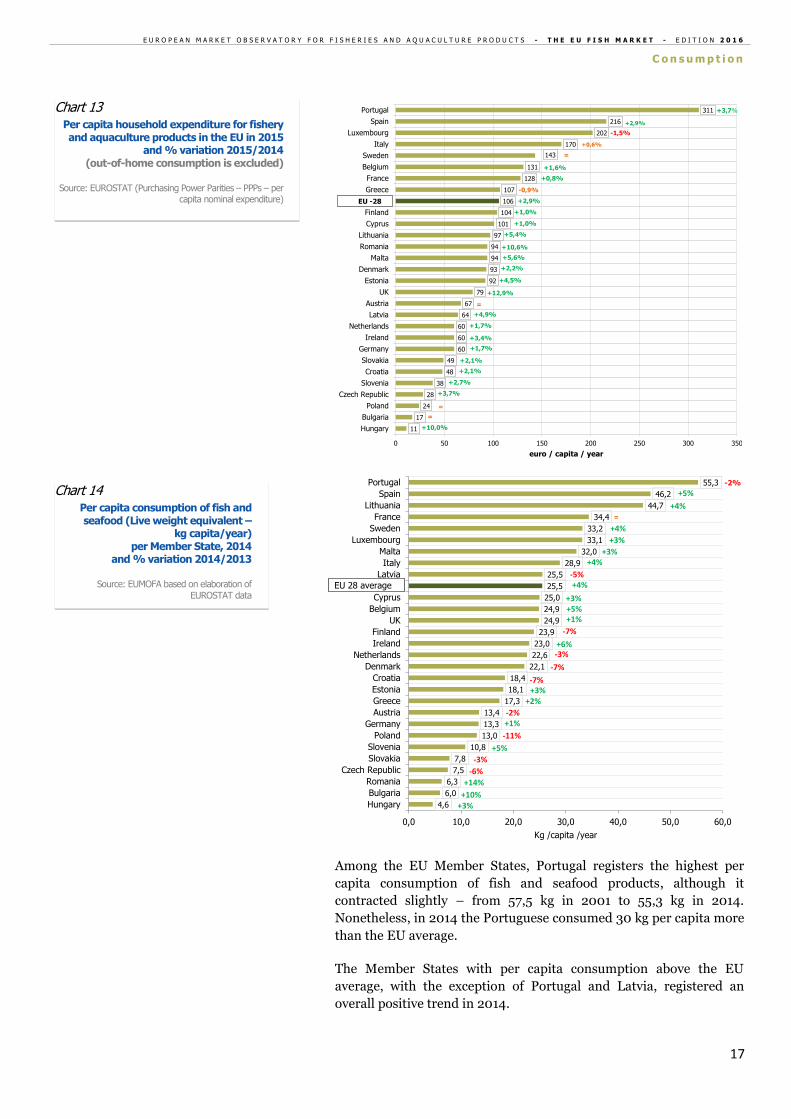
In 2015, the EU household expenditure for fishery and aquaculture
products totalled around EUR 54 billion. This represented a 3,2%
increase from 2014, due to a generally positive trend recorded in all
Member States with the exception of Greece. The UK recorded the
highest increase from 2014 to 2015, with Italy, Spain and France also
registering the highest expenditures for fishery and aquaculture
products.
Portugal maintained the highest per capita household expenditure,
recording EUR 311 in 2015, which was three times the EU average,
and represented an increase of 49% since 2000. Central and Eastern
European Member States registered minor expenditures.
41
78
85
104
115
121
123
126
201
268
280
282
293
527
573
579
940
1.022
1.163
1.398
1.469
1.860
3.221
4.904
5.161
8.525
10.030
10.351
0 2.000 4.000 6.000 8.000 10.000 12.000
Malta
Slovenia
Cyprus
Hungary
Luxembourg
Estonia
Bulgaria
Latvia
Croatia
Slovakia
Ireland
Lithuania
Czech Rep.
Denmark
Finland
Austria
Poland
Netherlands
Greece
Sweden
Belgium
Romania
Portugal
Germany
UK
France
Spain
Italy
million euro
+1,0%
+2,0%
+1,2%
+1,7%
+1,9%
-1,0%
+0,9%
+2,2%
+9,5%
+3,3%
+2,7%
+14,2%
+1,3%
+2,6%
+3,0%
+0,9%
+5,2%
=
+4,1%
+1,0%
+2,3%
+4,1%
+4,1%
+3,9%
+2,7%
+7,9%
+1,3%
=
Since 2003, the peak in the total EU
expenditure for FAP was registered in 2015,
reaching around EUR 54 million
Chart 12
Household expenditure for fishery and aquaculture products in 2015 and %
variation 2015/2014 (out-of-home consumption is excluded)
Source: EUROSTAT (Purchasing Power Parities – PPPs –
nominal expenditure)
3.1 Expenditures and volume of
fish consumption
3
E U R O P E A N M A R K E T O B S E R V A T O R Y F O R F I S H E R I E S A N D A Q U A C U L T U R E P R O D U C T S - T H E E U F I S H M A R K E T - E D I T I O N 2 0 1 6
C o n s u m p t i o n
17
Among the EU Member States, Portugal registers the highest per
capita consumption of fish and seafood products, although it
contracted slightly – from 57,5 kg in 2001 to 55,3 kg in 2014.
Nonetheless, in 2014 the Portuguese consumed 30 kg per capita more
than the EU average.
The Member States with per capita consumption above the EU
average, with the exception of Portugal and Latvia, registered an
overall positive trend in 2014.
11
17
24
28
38
48
49
60
60
60
64
67
79
92
93
94
94
97
101
104
106
107
128
131
143
170
202
216
311
0 50 100 150 200 250 300 350
Hungary
Bulgaria
Poland
Czech Republic
Slovenia
Croatia
Slovakia
Germany
Ireland
Netherlands
Latvia
Austria
UK
Estonia
Denmark
Malta
Romania
Lithuania
Cyprus
Finland
EU
Greece
France
Belgium
Sweden
Italy
Luxembourg
Spain
Portugal
euro / capita / year
+3,7%
=
-1,5%
+2,9%
+10,6%
+5,4%
+1,0%
+1,0%
+2,9%
-0,9%
+0,8%
+1,6%
+0,6%
+5,6%
+3,4%
+1,7%
+4,9%
=
+12,9%
+4,5%
+2,2%
=
+3,7%
+2,7%
+2,1%
+2,1%
+1,7%
+10,0%
=
EU -28
4,6
6,0
6,3
7,5
7,8
10,8
13,0
13,3
13,4
17,3
18,1
18,4
22,1
22,6
23,0
23,9
24,9
24,9
25,0
25,5
25,5
28,9
32,0
33,1
33,2
34,4
44,7
46,2
55,3
0,0 10,0 20,0 30,0 40,0 50,0 60,0
Hungary
Bulgaria
Romania
Czech Republic
Slovakia
Slovenia
Poland
Germany
Austria
Greece
Estonia
Croatia
Denmark
Netherlands
Ireland
Finland
UK
Belgium
Cyprus
EU 28 average
Latvia
Italy
Malta
Luxembourg
Sweden
France
Lithuania
Spain
Portugal
Kg /capita /year
-2%
+5%
+4%=
+4%
+3%
+3%+4%
-5%
+3%+5%+1%
-7%
+6%-3%
-7%
-7%+3%
+2%
+1%
-11%
+5%
-3%
-6%
+14%
+10%+3%
-2%
+4%EU 28 average
Chart 14
Per capita consumption of fish and seafood (Live weight equivalent –
kg capita/year) per Member State, 2014
and % variation 2014/2013
Source: EUMOFA based on elaboration of
EUROSTAT data
Chart 13 Per capita household expenditure for fishery and aquaculture products in the EU in 2015
and % variation 2015/2014 (out-of-home consumption is excluded)
Source: EUROSTAT (Purchasing Power Parities – PPPs – per
capita nominal expenditure)
E U R O P E A N M A R K E T O B S E R V A T O R Y F O R F I S H E R I E S A N D A Q U A C U L T U R E P R O D U C T S - T H E E U F I S H M A R K E T - E D I T I O N 2 0 1 6
C o n s u m p t i o n
18
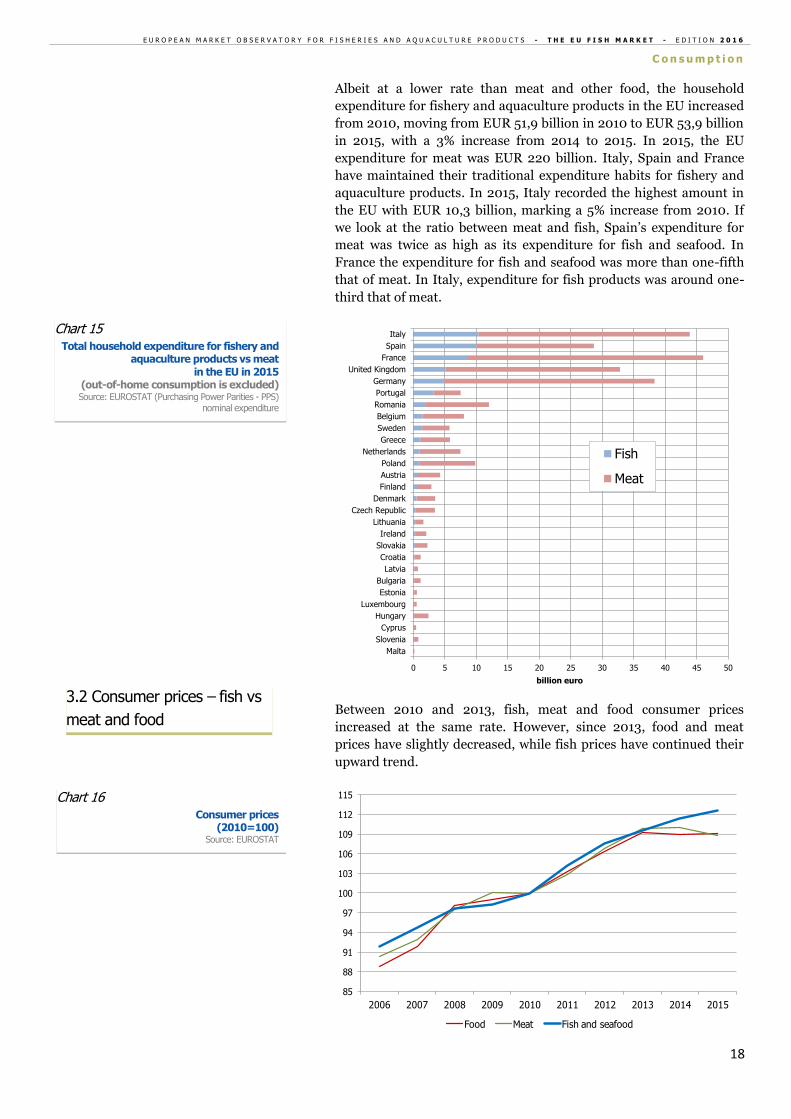
Albeit at a lower rate than meat and other food, the household
expenditure for fishery and aquaculture products in the EU increased
from 2010, moving from EUR 51,9 billion in 2010 to EUR 53,9 billion
in 2015, with a 3% increase from 2014 to 2015. In 2015, the EU
expenditure for meat was EUR 220 billion. Italy, Spain and France
have maintained their traditional expenditure habits for fishery and
aquaculture products. In 2015, Italy recorded the highest amount in
the EU with EUR 10,3 billion, marking a 5% increase from 2010. If
we look at the ratio between meat and fish, Spain’s expenditure for
meat was twice as high as its expenditure for fish and seafood. In
France the expenditure for fish and seafood was more than one-fifth
that of meat. In Italy, expenditure for fish products was around one-
third that of meat.
Between 2010 and 2013, fish, meat and food consumer prices
increased at the same rate. However, since 2013, food and meat
prices have slightly decreased, while fish prices have continued their
upward trend.
0 5 10 15 20 25 30 35 40 45 50
Malta
Slovenia
Cyprus
Hungary
Luxembourg
Estonia
Bulgaria
Latvia
Croatia
Slovakia
Ireland
Lithuania
Czech Republic
Denmark
Finland
Austria
Poland
Netherlands
Greece
Sweden
Belgium
Romania
Portugal
Germany
United Kingdom
France
Spain
Italy
billion euro
Fish
Meat
85
88
91
94
97
100
103
106
109
112
115
2006 2007 2008 2009 2010 2011 2012 2013 2014 2015
Food Meat Fish and seafood
Chart 16 Consumer prices
(2010=100) Source: EUROSTAT
3.2 Consumer prices – fish vs
meat and food
Chart 15
Total household expenditure for fishery and aquaculture products vs meat
in the EU in 2015 (out-of-home consumption is excluded) Source: EUROSTAT (Purchasing Power Parities - PPS)
nominal expenditure
E U R O P E A N M A R K E T O B S E R V A T O R Y F O R F I S H E R I E S A N D A Q U A C U L T U R E P R O D U C T S - T H E E U F I S H M A R K E T - E D I T I O N 2 0 1 6
C o n s u m p t i o n
19
Sector 2010 2011 2012 2013 2014 2015 2010-2015
Food +1,0% +3,2% +2,9% +2,8% -0,2% 0,0% +9%
Meat -0,1% +2,8% +3,9% +2,8% +0,2% -1,0% +9%
Fish and seafood +1,8% +4,3% +3,2% +1,9% +1,6% +1,1% +13%
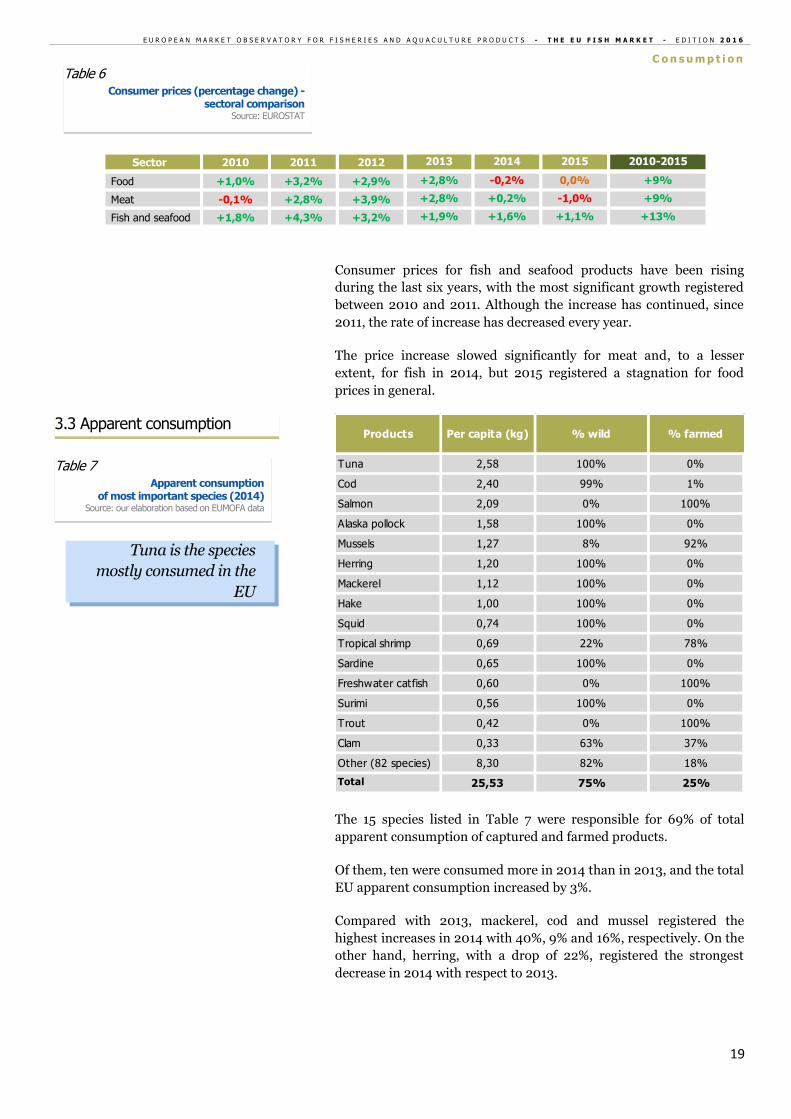
Consumer prices for fish and seafood products have been rising
during the last six years, with the most significant growth registered
between 2010 and 2011. Although the increase has continued, since
2011, the rate of increase has decreased every year.
The price increase slowed significantly for meat and, to a lesser
extent, for fish in 2014, but 2015 registered a stagnation for food
prices in general.
The 15 species listed in Table 7 were responsible for 69% of total
apparent consumption of captured and farmed products.
Of them, ten were consumed more in 2014 than in 2013, and the total
EU apparent consumption increased by 3%.
Compared with 2013, mackerel, cod and mussel registered the
highest increases in 2014 with 40%, 9% and 16%, respectively. On the
other hand, herring, with a drop of 22%, registered the strongest
decrease in 2014 with respect to 2013.
Products Per capita (kg) % wild % farmed
Tuna 2,58 100% 0%
Cod 2,40 99% 1%
Salmon 2,09 0% 100%
Alaska pollock 1,58 100% 0%
Mussels 1,27 8% 92%
Herring 1,20 100% 0%
Mackerel 1,12 100% 0%
Hake 1,00 100% 0%
Squid 0,74 100% 0%
Tropical shrimp 0,69 22% 78%
Sardine 0,65 100% 0%
Freshwater catfish 0,60 0% 100%
Surimi 0,56 100% 0%
Trout 0,42 0% 100%
Clam 0,33 63% 37%
Other (82 species) 8,30 82% 18%
Total 25,53 75% 25%
Tuna is the species
mostly consumed in the
EU
Table 7 Apparent consumption
of most important species (2014) Source: our elaboration based on EUMOFA data
3.3 Apparent consumption
Table 6 Consumer prices (percentage change) -
sectoral comparison Source: EUROSTAT
E U R O P E A N M A R K E T O B S E R V A T O R Y F O R F I S H E R I E S A N D A Q U A C U L T U R E P R O D U C T S - T H E E U F I S H M A R K E T - E D I T I O N 2 0 1 6
C o n s u m p t i o n
20
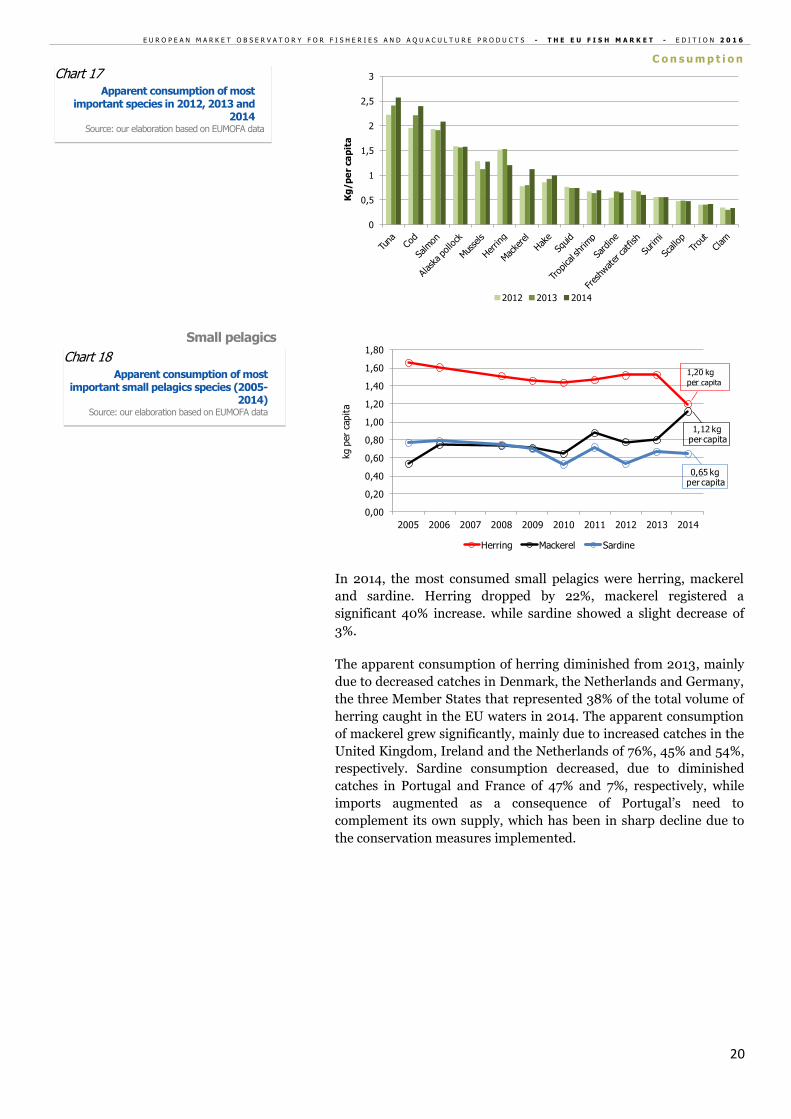
In 2014, the most consumed small pelagics were herring, mackerel
and sardine. Herring dropped by 22%, mackerel registered a
significant 40% increase. while sardine showed a slight decrease of
3%.
The apparent consumption of herring diminished from 2013, mainly
due to decreased catches in Denmark, the Netherlands and Germany,
the three Member States that represented 38% of the total volume of
herring caught in the EU waters in 2014. The apparent consumption
of mackerel grew significantly, mainly due to increased catches in the
United Kingdom, Ireland and the Netherlands of 76%, 45% and 54%,
respectively. Sardine consumption decreased, due to diminished
catches in Portugal and France of 47% and 7%, respectively, while
imports augmented as a consequence of Portugal’s need to
complement its own supply, which has been in sharp decline due to
the conservation measures implemented.
0
0,5
1
1,5
2
2,5
3
Kg
/p
er
ca
pit
a
2012 2013 2014
0,65 kgper capita
1,12 kgper capita
0,00
0,20
0,40
0,60
0,80
1,00
1,20
1,40
1,60
1,80
2005 2006 2007 2008 2009 2010 2011 2012 2013 2014
kg p
er
capita
Herring Mackerel Sardine
1,20 kg per capita
Chart 18 Apparent consumption of most
important small pelagics species (2005-2014)
Source: our elaboration based on EUMOFA data
Small pelagics
Chart 17 Apparent consumption of most
important species in 2012, 2013 and 2014
Source: our elaboration based on EUMOFA data
E U R O P E A N M A R K E T O B S E R V A T O R Y F O R F I S H E R I E S A N D A Q U A C U L T U R E P R O D U C T S - T H E E U F I S H M A R K E T - E D I T I O N 2 0 1 6
C o n s u m p t i o n
21
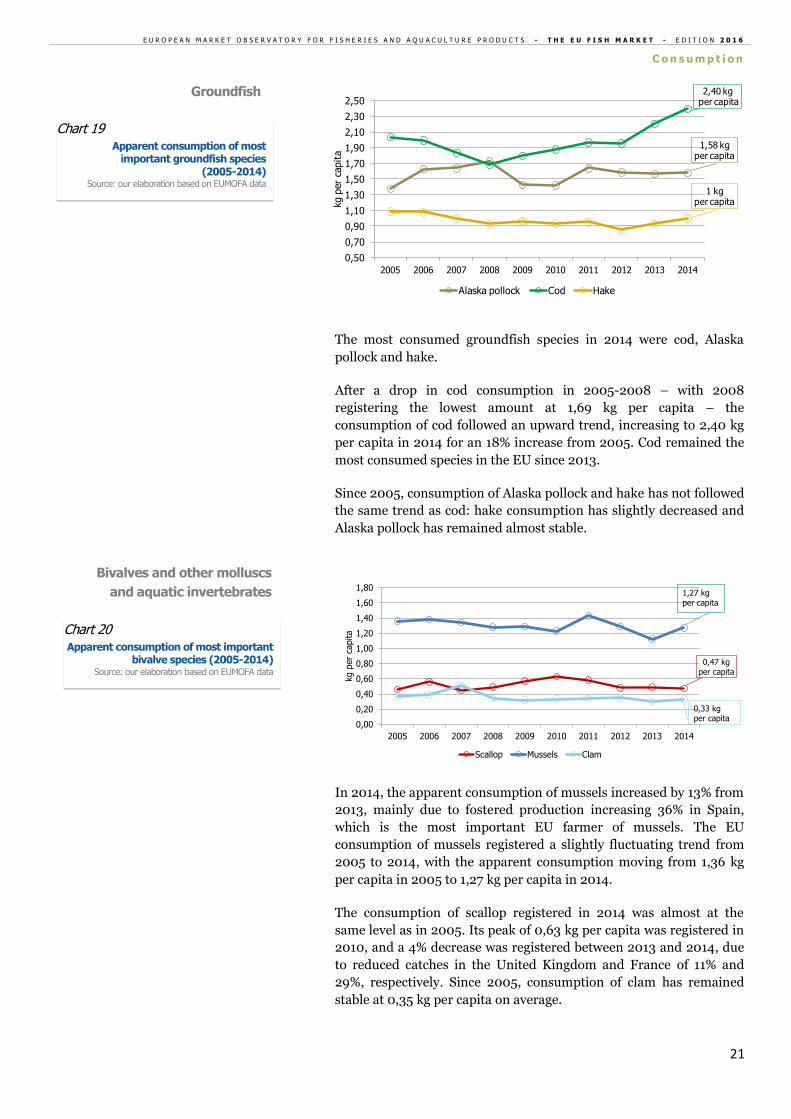
The most consumed groundfish species in 2014 were cod, Alaska
pollock and hake.
After a drop in cod consumption in 2005-2008 – with 2008
registering the lowest amount at 1,69 kg per capita – the
consumption of cod followed an upward trend, increasing to 2,40 kg
per capita in 2014 for an 18% increase from 2005. Cod remained the
most consumed species in the EU since 2013.
Since 2005, consumption of Alaska pollock and hake has not followed
the same trend as cod: hake consumption has slightly decreased and
Alaska pollock has remained almost stable.
In 2014, the apparent consumption of mussels increased by 13% from
2013, mainly due to fostered production increasing 36% in Spain,
which is the most important EU farmer of mussels. The EU
consumption of mussels registered a slightly fluctuating trend from
2005 to 2014, with the apparent consumption moving from 1,36 kg
per capita in 2005 to 1,27 kg per capita in 2014.
The consumption of scallop registered in 2014 was almost at the
same level as in 2005. Its peak of 0,63 kg per capita was registered in
2010, and a 4% decrease was registered between 2013 and 2014, due
to reduced catches in the United Kingdom and France of 11% and
29%, respectively. Since 2005, consumption of clam has remained
stable at 0,35 kg per capita on average.
1,58 kg per capita
2,40 kgper capita
1 kg per capita
0,50
0,70
0,90
1,10
1,30
1,50
1,70
1,90
2,10
2,30
2,50
2005 2006 2007 2008 2009 2010 2011 2012 2013 2014
kg p
er
capita
Alaska pollock Cod Hake
0,47 kg per capita
0,00
0,20
0,40
0,60
0,80
1,00
1,20
1,40
1,60
1,80
2005 2006 2007 2008 2009 2010 2011 2012 2013 2014
kg p
er
capita
Scallop Mussels Clam
1,27 kgper capita
0,33 kgper capita
Chart 20 Apparent consumption of most important
bivalve species (2005-2014) Source: our elaboration based on EUMOFA data
Bivalves and other molluscs
and aquatic invertebrates
Chart 19 Apparent consumption of most
important groundfish species (2005-2014)
Source: our elaboration based on EUMOFA data
Groundfish
E U R O P E A N M A R K E T O B S E R V A T O R Y F O R F I S H E R I E S A N D A Q U A C U L T U R E P R O D U C T S - T H E E U F I S H M A R K E T - E D I T I O N 2 0 1 6
C o n s u m p t i o n
22
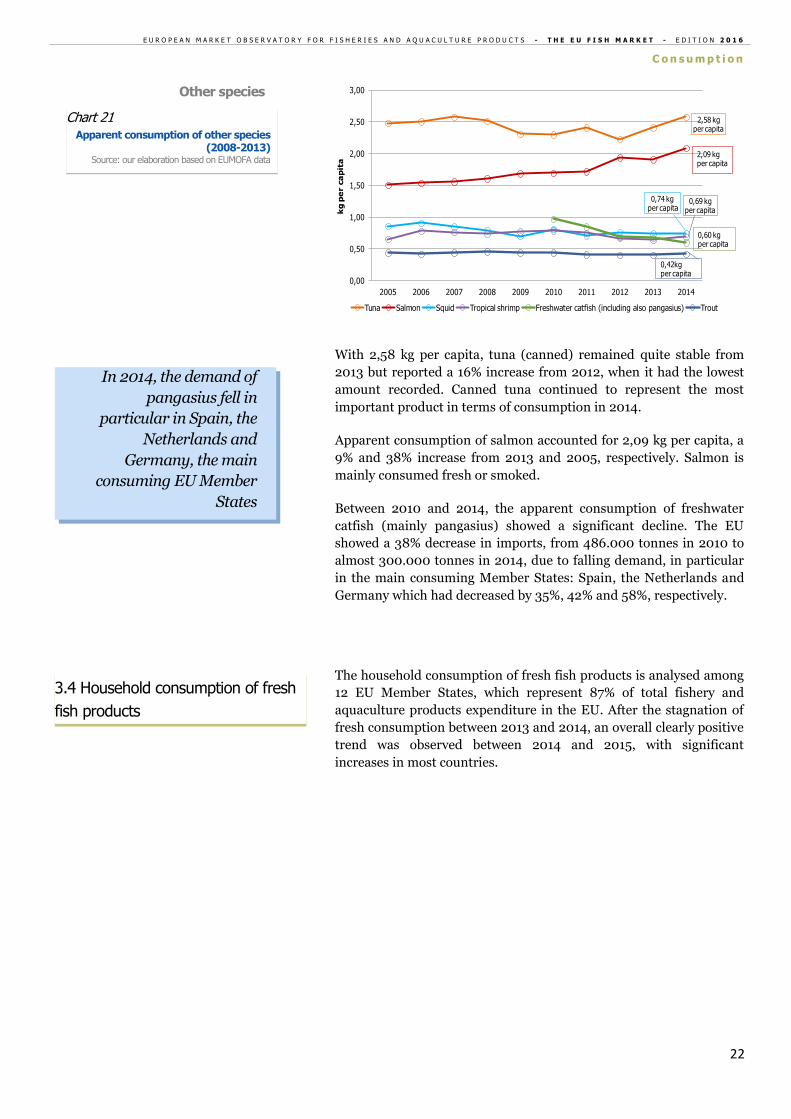
With 2,58 kg per capita, tuna (canned) remained quite stable from
2013 but reported a 16% increase from 2012, when it had the lowest
amount recorded. Canned tuna continued to represent the most
important product in terms of consumption in 2014.
Apparent consumption of salmon accounted for 2,09 kg per capita, a
9% and 38% increase from 2013 and 2005, respectively. Salmon is
mainly consumed fresh or smoked.
Between 2010 and 2014, the apparent consumption of freshwater
catfish (mainly pangasius) showed a significant decline. The EU
showed a 38% decrease in imports, from 486.000 tonnes in 2010 to
almost 300.000 tonnes in 2014, due to falling demand, in particular
in the main consuming Member States: Spain, the Netherlands and
Germany which had decreased by 35%, 42% and 58%, respectively.
The household consumption of fresh fish products is analysed among
12 EU Member States, which represent 87% of total fishery and
aquaculture products expenditure in the EU. After the stagnation of
fresh consumption between 2013 and 2014, an overall clearly positive
trend was observed between 2014 and 2015, with significant
increases in most countries.
2,58 kg per capita
0,74 kgper capita
0,69 kg per capita
0,00
0,50
1,00
1,50
2,00
2,50
3,00
2005 2006 2007 2008 2009 2010 2011 2012 2013 2014
kg
pe
r c
ap
ita
Tuna Salmon Squid Tropical shrimp Freshwater catfish (including also pangasius) Trout
2,09 kg per capita
0,60 kg per capita
0,42kg per capita
3.4 Household consumption of fresh
fish products
In 2014, the demand of
pangasius fell in
particular in Spain, the
Netherlands and
Germany, the main
consuming EU Member
States
Chart 21 Apparent consumption of other species
(2008-2013) Source: our elaboration based on EUMOFA data
Other species
E U R O P E A N M A R K E T O B S E R V A T O R Y F O R F I S H E R I E S A N D A Q U A C U L T U R E P R O D U C T S - T H E E U F I S H M A R K E T - E D I T I O N 2 0 1 6
C o n s u m p t i o n
23
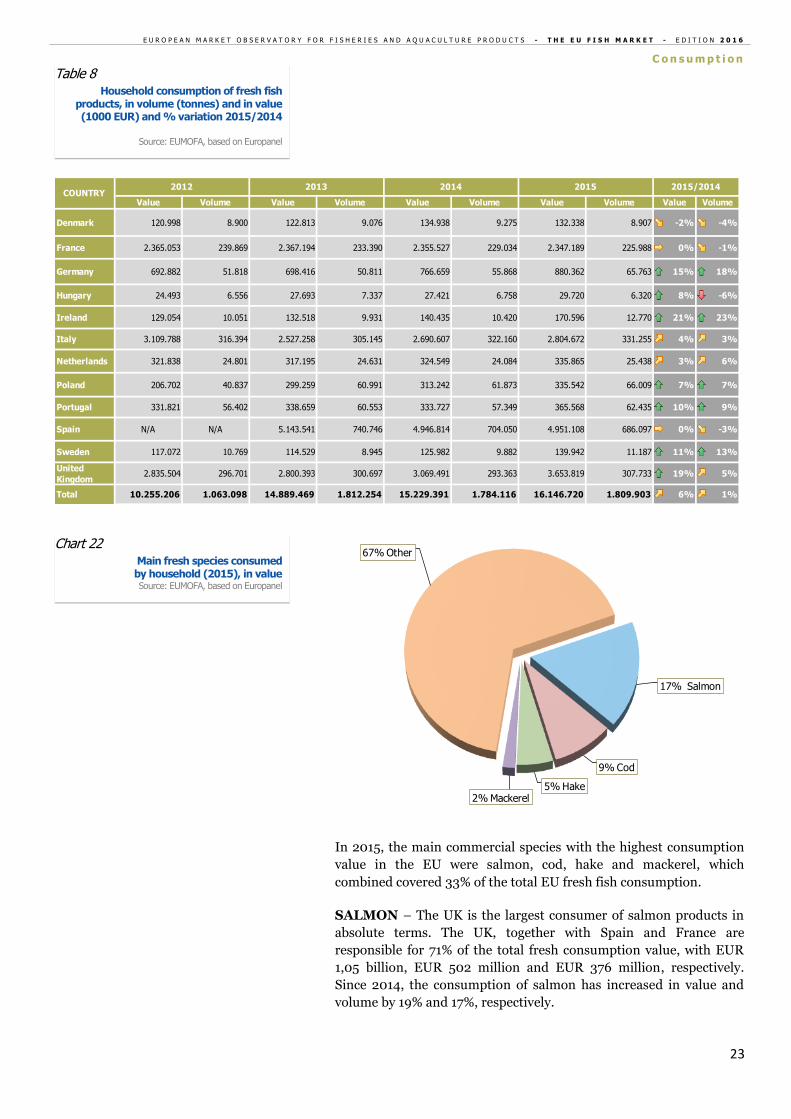
In 2015, the main commercial species with the highest consumption
value in the EU were salmon, cod, hake and mackerel, which
combined covered 33% of the total EU fresh fish consumption.
SALMON – The UK is the largest consumer of salmon products in
absolute terms. The UK, together with Spain and France are
responsible for 71% of the total fresh consumption value, with EUR
1,05 billion, EUR 502 million and EUR 376 million, respectively.
Since 2014, the consumption of salmon has increased in value and
volume by 19% and 17%, respectively.
Value Volume Value Volume Value Volume Value Volume Value Volume
Denmark 120.998 8.900 122.813 9.076 134.938 9.275 132.338 8.907 -2% -4%
France 2.365.053 239.869 2.367.194 233.390 2.355.527 229.034 2.347.189 225.988 0% -1%
Germany 692.882 51.818 698.416 50.811 766.659 55.868 880.362 65.763 15% 18%
Hungary 24.493 6.556 27.693 7.337 27.421 6.758 29.720 6.320 8% -6%
Ireland 129.054 10.051 132.518 9.931 140.435 10.420 170.596 12.770 21% 23%
Italy 3.109.788 316.394 2.527.258 305.145 2.690.607 322.160 2.804.672 331.255 4% 3%
Netherlands 321.838 24.801 317.195 24.631 324.549 24.084 335.865 25.438 3% 6%
Poland 206.702 40.837 299.259 60.991 313.242 61.873 335.542 66.009 7% 7%
Portugal 331.821 56.402 338.659 60.553 333.727 57.349 365.568 62.435 10% 9%
Spain N/A N/A 5.143.541 740.746 4.946.814 704.050 4.951.108 686.097 0% -3%
Sweden 117.072 10.769 114.529 8.945 125.982 9.882 139.942 11.187 11% 13%
United
Kingdom2.835.504 296.701 2.800.393 300.697 3.069.491 293.363 3.653.819 307.733 19% 5%
Total 10.255.206 1.063.098 14.889.469 1.812.254 15.229.391 1.784.116 16.146.720 1.809.903 6% 1%
2015/2014COUNTRY
2012 2013 2014 2015
17% Salmon
9% Cod
5% Hake2% Mackerel
67% OtherChart 22
Main fresh species consumed by household (2015), in value Source: EUMOFA, based on Europanel
Table 8 Household consumption of fresh fish
products, in volume (tonnes) and in value (1000 EUR) and % variation 2015/2014
Source: EUMOFA, based on Europanel

E U R O P E A N M A R K E T O B S E R V A T O R Y F O R F I S H E R I E S A N D A Q U A C U L T U R E P R O D U C T S - T H E E U F I S H M A R K E T - E D I T I O N 2 0 1 6
C o n s u m p t i o n
24
COD – Total household purchases of cod amounted to EUR 1,4
billion. The UK ranked first, with EUR 608 million, followed by
France with EUR 322 million, Spain with EUR 218 million and Italy
with EUR 137 million. From 2014, Spain and France decreased the
consumption of cod in value, by -5% and -3% respectively, and
volume, by -8% and -8% respectively, while the UK significantly
increased by 12% and 22%, respectively.
HAKE – Hake is the most important species consumed in Spain with
EUR 779 million. France and Portugal follow at distance, with EUR
43 million and EUR 30 million, respectively. From 2014, the total
consumption of hake products registered slight decreases of 2% value
and 4% volume.
MACKEREL – The UK, Spain and Poland, with mackerel
consumption of EUR 91 million, EUR 75 million and EUR 51 million,
respectively - accounted for around 75% of the EU’s total
consumption of EUR 290 million. From 2014, mackerel consumption
registered slight decreases in both value and volume.
37,9%Spain
18,4% Italy
17,0%United
Kingdom
12,5%France
3,6%Poland
3,6% Germany
7,0%Others
Chart 23 Household consumption of fresh fish
products in 2015 for the main EU Member States, in volume
Source: EUMOFA, based on Europanel
E U R O P E A N M A R K E T O B S E R V A T O R Y F O R F I S H E R I E S A N D A Q U A C U L T U R E P R O D U C T S - T H E E U F I S H M A R K E T - E D I T I O N 2 0 1 6
C o n s u m p t i o n
25
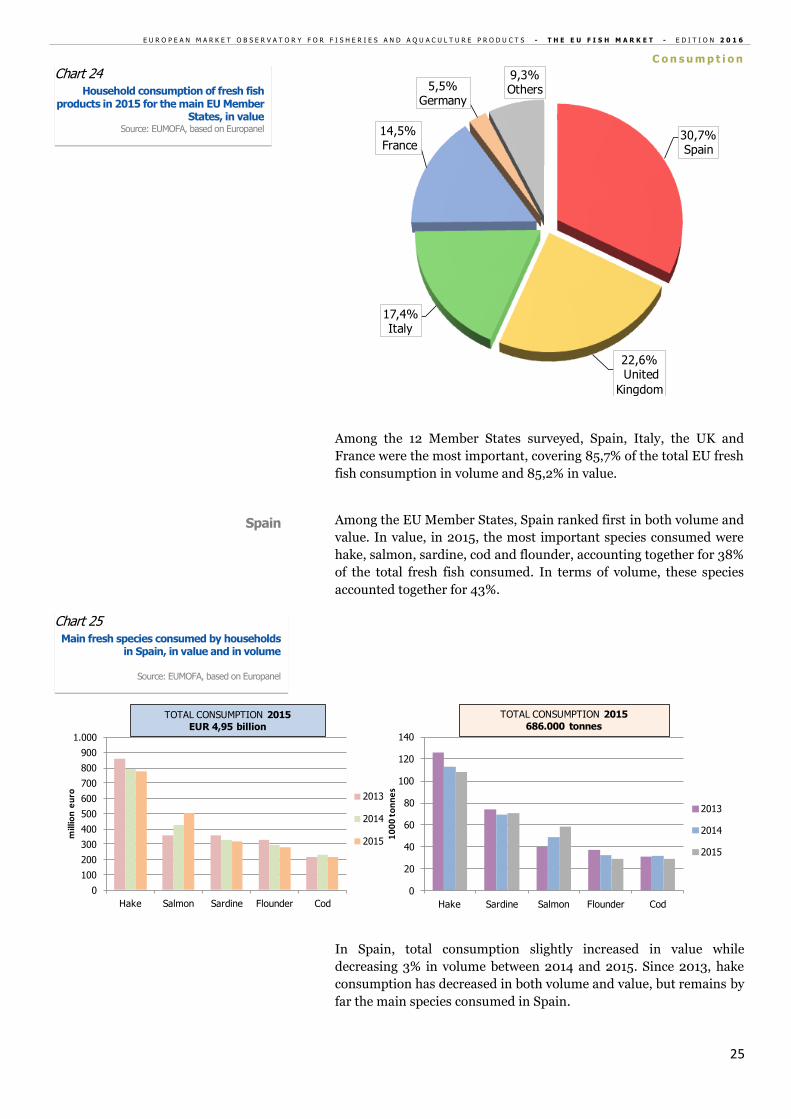
Among the 12 Member States surveyed, Spain, Italy, the UK and
France were the most important, covering 85,7% of the total EU fresh
fish consumption in volume and 85,2% in value.
Among the EU Member States, Spain ranked first in both volume and
value. In value, in 2015, the most important species consumed were
hake, salmon, sardine, cod and flounder, accounting together for 38%
of the total fresh fish consumed. In terms of volume, these species
accounted together for 43%.
In Spain, total consumption slightly increased in value while
decreasing 3% in volume between 2014 and 2015. Since 2013, hake
consumption has decreased in both volume and value, but remains by
far the main species consumed in Spain.
30,7% Spain
22,6%United
Kingdom
17,4% Italy
14,5%France
5,5% Germany
9,3% Others
0
100
200
300
400
500
600
700
800
900
1.000
Hake Salmon Sardine Flounder Cod
mill
ion
eu
ro 2013
2014
2015
TOTAL CONSUMPTION 2015
EUR 4,95 billion
0
20
40
60
80
100
120
140
Hake Sardine Salmon Flounder Cod
10
00
to
nn
es
2013
2014
2015
TOTAL CONSUMPTION 2015
686.000 tonnes
Chart 25 Main fresh species consumed by households
in Spain, in value and in volume
Source: EUMOFA, based on Europanel
Spain
Chart 24 Household consumption of fresh fish
products in 2015 for the main EU Member States, in value
Source: EUMOFA, based on Europanel

E U R O P E A N M A R K E T O B S E R V A T O R Y F O R F I S H E R I E S A N D A Q U A C U L T U R E P R O D U C T S - T H E E U F I S H M A R K E T - E D I T I O N 2 0 1 6
C o n s u m p t i o n
26
During the same period, the consumption of salmon registered the
most significant increments, increasing 39% in value and 24% in
volume. In 2015, salmon consumption registered EUR 502 million
for 58.000 tonnes, increases of 17% and 20%, respectively, from
2014.
Sardine, flounder and cod have registered negative trends from 2014.
In 2015, Italy ranked second in volume of fresh fish with 331.000
tonnes, but third in value with EUR 2,8 billion, after the United
Kingdom. The most important species consumed in value were gilt-
head seabream, octopus, squid, European seabass and cod, which
covered a combined 30% of total fish consumed. In volume terms,
mussel is the main species consumed.
Between 2014 and 2015, the Italian consumption of the main species
registered a positive trend of 4% in value and 3% in volume.
However, since 2012, Italian fish consumption has decreased by 10%
in value but increased by 5% in volume.
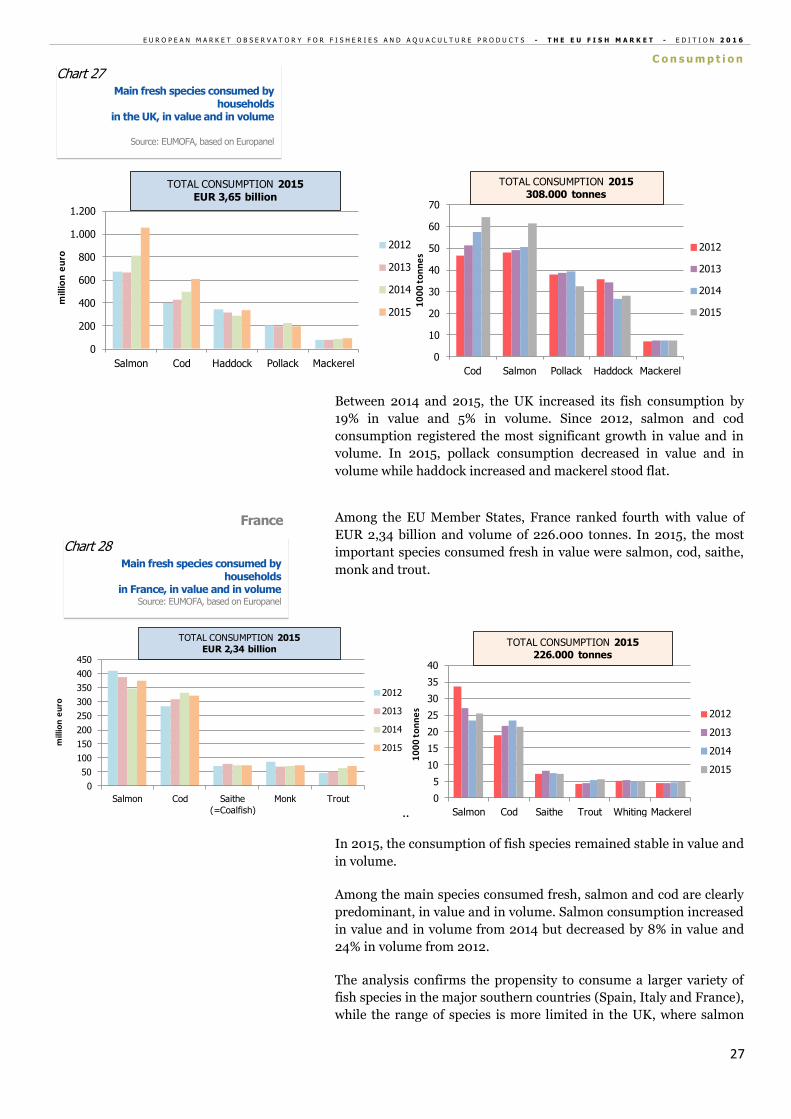
In 2015, the most important species consumed in the United
Kingdom were salmon, cod, haddock, pollack and mackerel, covering
together around 62% of value and 63% of volume of the total fresh
species consumed by household in the UK.
0
50
100
150
200
250
300
Gilt-head
seabream
Octopus Squid European
seabass
Cod
mill
ion
eu
ro
2012
2013
2014
2015
TOTAL CONSUMPTION 2015
EUR 2,80 billion
0
5
10
15
20
25
30
35
40
45
Mussel
Mytilus spp
Gilt-head
seabream
Anchovy Octopus Squid
10
00
to
nn
es
2012
2013
2014
2015
TOTAL CONSUMPTION 2015
331.000 tonnes
United Kingdom
Chart 26 Main fresh species consumed by
households in Italy, in value and in volume
Source: EUMOFA, based on Europanel
Italy
E U R O P E A N M A R K E T O B S E R V A T O R Y F O R F I S H E R I E S A N D A Q U A C U L T U R E P R O D U C T S - T H E E U F I S H M A R K E T - E D I T I O N 2 0 1 6
C o n s u m p t i o n
27
Between 2014 and 2015, the UK increased its fish consumption by
19% in value and 5% in volume. Since 2012, salmon and cod
consumption registered the most significant growth in value and in
volume. In 2015, pollack consumption decreased in value and in
volume while haddock increased and mackerel stood flat.
Among the EU Member States, France ranked fourth with value of
EUR 2,34 billion and volume of 226.000 tonnes. In 2015, the most
important species consumed fresh in value were salmon, cod, saithe,
monk and trout.
..
In 2015, the consumption of fish species remained stable in value and
in volume.
Among the main species consumed fresh, salmon and cod are clearly
predominant, in value and in volume. Salmon consumption increased
in value and in volume from 2014 but decreased by 8% in value and
24% in volume from 2012.
The analysis confirms the propensity to consume a larger variety of
fish species in the major southern countries (Spain, Italy and France),
while the range of species is more limited in the UK, where salmon
0
200
400
600
800
1.000
1.200
Salmon Cod Haddock Pollack Mackerel
mill
ion
eu
ro
2012
2013
2014
2015
TOTAL CONSUMPTION 2015
EUR 3,65 billion
0
10
20
30
40
50
60
70
Cod Salmon Pollack Haddock Mackerel
10
00
to
nn
es
2012
2013
2014
2015
TOTAL CONSUMPTION 2015
308.000 tonnes
0
50
100
150
200
250
300
350
400
450
Salmon Cod Saithe
(=Coalfish)
Monk Trout
mill
ion
eu
ro
2012
2013
2014
2015
TOTAL CONSUMPTION 2015
EUR 2,34 billion
0
5
10
15
20
25
30
35
40
Salmon Cod Saithe Trout Whiting Mackerel
10
00
to
nn
es
2012
2013
2014
2015
TOTAL CONSUMPTION 2015
226.000 tonnes
Chart 28 Main fresh species consumed by
households in France, in value and in volume
Source: EUMOFA, based on Europanel
France
Chart 27 Main fresh species consumed by
households in the UK, in value and in volume
Source: EUMOFA, based on Europanel
E U R O P E A N M A R K E T O B S E R V A T O R Y F O R F I S H E R I E S A N D A Q U A C U L T U R E P R O D U C T S - T H E E U F I S H M A R K E T - E D I T I O N 2 0 1 6
C o n s u m p t i o n
28
accounted for 92% of the total fish consumed.
Denmark – In 2015, a slight decrease in total consumption was due,
in part, to a slight decrease in salmon, the main species.
Germany – the consumption of fresh products is usually not high in
Germany where consumers prefer processed fish (frozen, smoked,
marinated, canned). However, in 2015, total fish consumed
amounted to EUR 880 million in value. The main fresh products
consumed are salmon and cod. From 2014, Germany significantly
augmented its fish consumption, with a 15% increase in value and
18% increase in volume.
Hungary – the household consumption of fresh fish products has
decreased in volume but increased in value since 2013.
Ireland – from 2014, the consumption of fresh products has
increased by 21% in terms of value. The most consumed species,
salmon and cod, together account for 60% of the total consumption
of fresh fish products.
Poland – the consumption of fresh fish increased 7% from 2014 and
remains on an upward trend. Salmon is the most consumed fresh
species, but freshwater species, trout and carp, have also registered
significant increases since 2012.
Portugal – the household consumption of fresh products registered
a 10% increase in value from 2014, mainly due to salmon,
miscellaneous shrimps and European seabass, which represented
together 27% of the total fresh fish consumed.
Sweden – the total consumption of fresh products, mainly salmon
and cod, increased 11% over 2014.
The fisheries and aquaculture industry supplies fish and seafood
through different distribution channels: retail, which includes
fishmongers and large-scale retail (LSR); foodservice, which includes
catering and commercial restaurants; and institutional, which
includes schools, canteens, hospitals and prisons.
France, Germany, Italy, Spain and the UK account for 72% of the
total out-of-home EU expenditure for fish and seafood products in
the EU.
3.5 Out-of-home consumption
Other countries

E U R O P E A N M A R K E T O B S E R V A T O R Y F O R F I S H E R I E S A N D A Q U A C U L T U R E P R O D U C T S - T H E E U F I S H M A R K E T - E D I T I O N 2 0 1 6
C o n s u m p t i o n
29
In 2015, retail represented the main distribution channel for fish and
seafood products in France, Germany, Italy, Spain and the UK.
In absolute terms and through the retail segment, Spain registered
the highest consumption with 929.000 tonnes. Looking at the
categories of products (finfish, crustaceans, molluscs and
cephalopods), finfish products are obviously the mostly consumed
among the 5 Member States and, in fact, account for 88% of fishery
products sold through retail in Germany and the UK. Spain has
highest consumption of crustaceans with 126.000 tonnes, followed by
the UK with 43.000 tonnes, while France consumed 95.000 tonnes of
molluscs and cephalopods, registering the highest consumption of
this category.
Since 2010, the supply of fish products through retail decreased in all
the top 5 EU Member States, except in the UK, which increased its
supply of fish products through retail by 16% in the period 2010-
2015.
Among the 5 EU Member States, the UK registered the highest
amount of fish consumption through its foodservice segment, due to
the specific importance of its “fish & chips” shops.
The institutional segment remained the lowest outlet for supplying
fish and seafood products.
82%73%
80% 78%
60%
14%
20%
18% 20%
35%
4% 7% 2% 3% 5%
0%
10%
20%
30%
40%
50%
60%
70%
80%
90%
100%
France Germany Italy Spain United Kingdom
Retail Foodservice Institutional
In all countries, finfish sales
through retail is by far the
most important segment
Chart 29 Fish and seafood consumption by
distribution channel (2015), in volume
Source: EUMOFA, based on Euromonitor
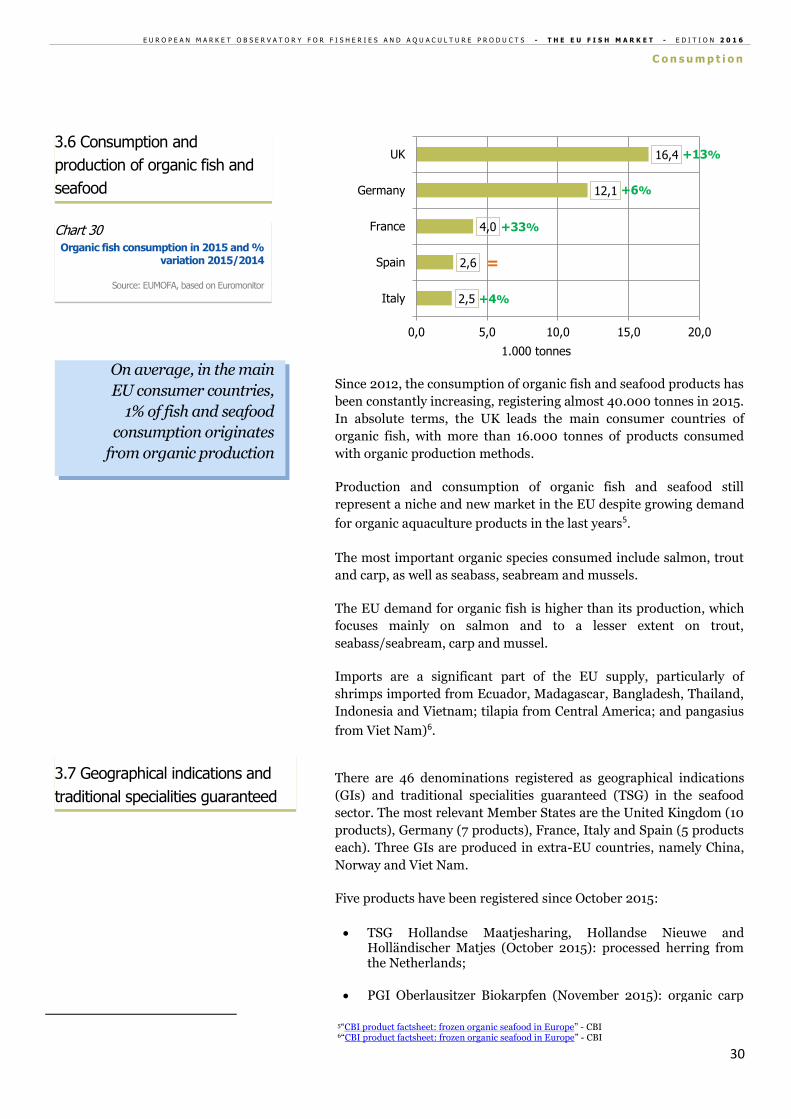
E U R O P E A N M A R K E T O B S E R V A T O R Y F O R F I S H E R I E S A N D A Q U A C U L T U R E P R O D U C T S - T H E E U F I S H M A R K E T - E D I T I O N 2 0 1 6
C o n s u m p t i o n
30
5“CBI product factsheet: frozen organic seafood in Europe” - CBI 6“CBI product factsheet: frozen organic seafood in Europe” - CBI
Since 2012, the consumption of organic fish and seafood products has
been constantly increasing, registering almost 40.000 tonnes in 2015.
In absolute terms, the UK leads the main consumer countries of
organic fish, with more than 16.000 tonnes of products consumed
with organic production methods.
Production and consumption of organic fish and seafood still
represent a niche and new market in the EU despite growing demand
for organic aquaculture products in the last years5.
The most important organic species consumed include salmon, trout
and carp, as well as seabass, seabream and mussels.
The EU demand for organic fish is higher than its production, which
focuses mainly on salmon and to a lesser extent on trout,
seabass/seabream, carp and mussel.
Imports are a significant part of the EU supply, particularly of
shrimps imported from Ecuador, Madagascar, Bangladesh, Thailand,
Indonesia and Vietnam; tilapia from Central America; and pangasius
from Viet Nam)6.
There are 46 denominations registered as geographical indications
(GIs) and traditional specialities guaranteed (TSG) in the seafood
sector. The most relevant Member States are the United Kingdom (10
products), Germany (7 products), France, Italy and Spain (5 products
each). Three GIs are produced in extra-EU countries, namely China,
Norway and Viet Nam.
Five products have been registered since October 2015:
TSG Hollandse Maatjesharing, Hollandse Nieuwe and Holländischer Matjes (October 2015): processed herring from the Netherlands;
PGI Oberlausitzer Biokarpfen (November 2015): organic carp
2,5
2,6
4,0
12,1
16,4
0,0 5,0 10,0 15,0 20,0
Italy
Spain
France
Germany
UK +13%
+6%
+33%
=
+4%
1.000 tonnes
3.7 Geographical indications and
traditional specialities guaranteed
On average, in the main
EU consumer countries,
1% of fish and seafood
consumption originates
from organic production
Chart 30 Organic fish consumption in 2015 and %
variation 2015/2014
Source: EUMOFA, based on Euromonitor
3.6 Consumption and
production of organic fish and
seafood
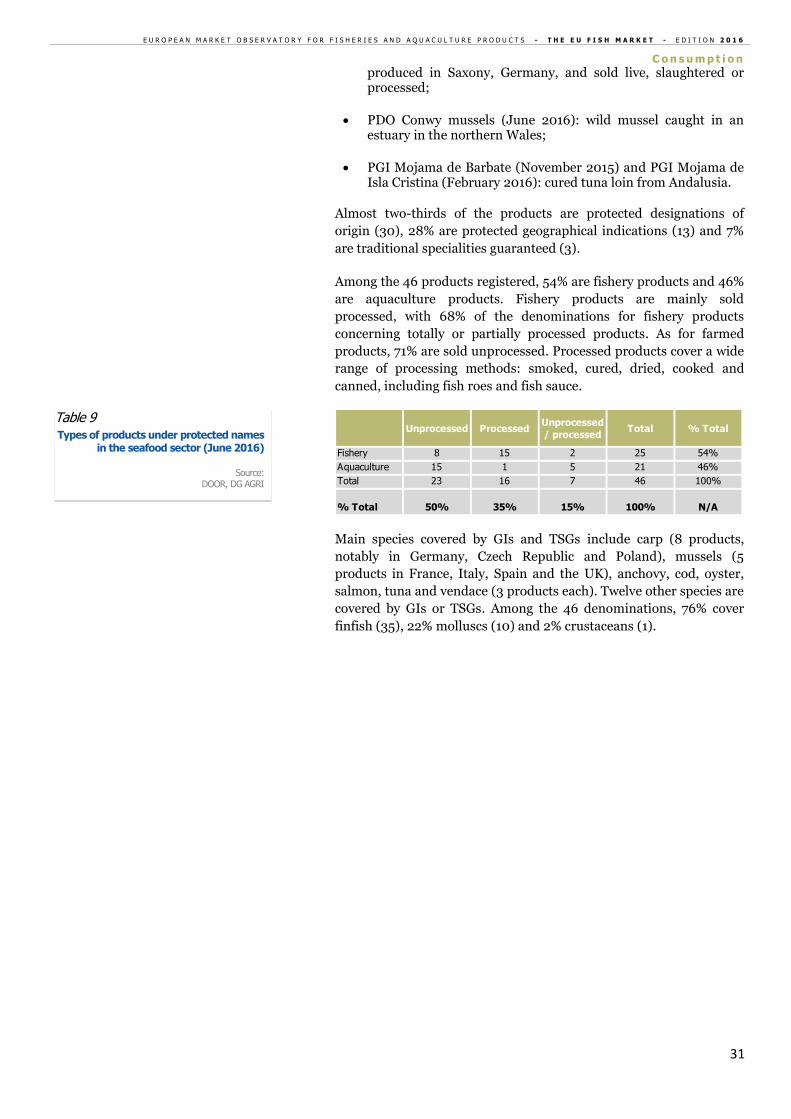
E U R O P E A N M A R K E T O B S E R V A T O R Y F O R F I S H E R I E S A N D A Q U A C U L T U R E P R O D U C T S - T H E E U F I S H M A R K E T - E D I T I O N 2 0 1 6
C o n s u m p t i o n
31
produced in Saxony, Germany, and sold live, slaughtered or processed;
PDO Conwy mussels (June 2016): wild mussel caught in an estuary in the northern Wales;
PGI Mojama de Barbate (November 2015) and PGI Mojama de Isla Cristina (February 2016): cured tuna loin from Andalusia.
Almost two-thirds of the products are protected designations of
origin (30), 28% are protected geographical indications (13) and 7%
are traditional specialities guaranteed (3).
Among the 46 products registered, 54% are fishery products and 46%
are aquaculture products. Fishery products are mainly sold
processed, with 68% of the denominations for fishery products
concerning totally or partially processed products. As for farmed
products, 71% are sold unprocessed. Processed products cover a wide
range of processing methods: smoked, cured, dried, cooked and
canned, including fish roes and fish sauce.
Main species covered by GIs and TSGs include carp (8 products,
notably in Germany, Czech Republic and Poland), mussels (5
products in France, Italy, Spain and the UK), anchovy, cod, oyster,
salmon, tuna and vendace (3 products each). Twelve other species are
covered by GIs or TSGs. Among the 46 denominations, 76% cover
finfish (35), 22% molluscs (10) and 2% crustaceans (1).
Unprocessed ProcessedUnprocessed
/ processedTotal % Total
Fishery 8 15 2 25 54%
Aquaculture 15 1 5 21 46%
Total 23 16 7 46 100%
% Total 50% 35% 15% 100% N/A
Table 9 Types of products under protected names
in the seafood sector (June 2016)
Source: DOOR, DG AGRI
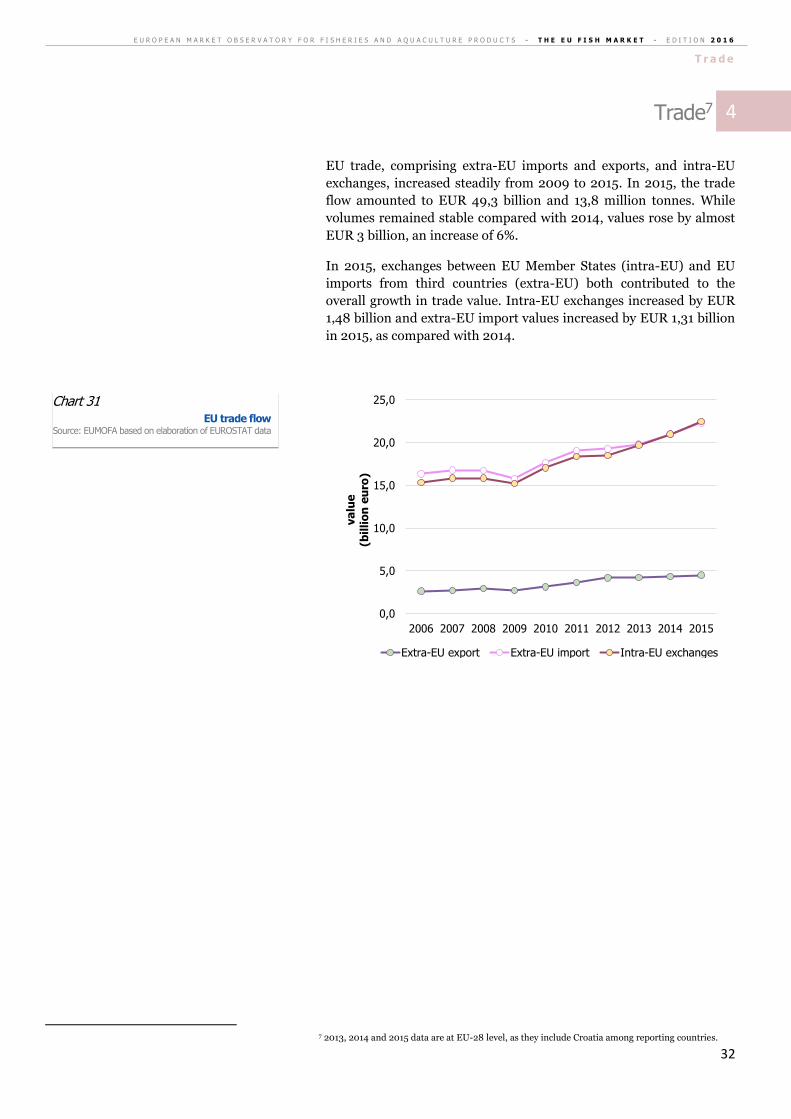
E U R O P E A N M A R K E T O B S E R V A T O R Y F O R F I S H E R I E S A N D A Q U A C U L T U R E P R O D U C T S - T H E E U F I S H M A R K E T - E D I T I O N 2 0 1 6
T r a d e
32
Trade7
EU trade, comprising extra-EU imports and exports, and intra-EU
exchanges, increased steadily from 2009 to 2015. In 2015, the trade
flow amounted to EUR 49,3 billion and 13,8 million tonnes. While
volumes remained stable compared with 2014, values rose by almost
EUR 3 billion, an increase of 6%.
In 2015, exchanges between EU Member States (intra-EU) and EU
imports from third countries (extra-EU) both contributed to the
overall growth in trade value. Intra-EU exchanges increased by EUR
1,48 billion and extra-EU import values increased by EUR 1,31 billion
in 2015, as compared with 2014.
7 2013, 2014 and 2015 data are at EU-28 level, as they include Croatia among reporting countries.
0,0
5,0
10,0
15,0
20,0
25,0
2006 2007 2008 2009 2010 2011 2012 2013 2014 2015
va
lue
(bil
lio
n e
uro
)
Extra-EU export Extra-EU import Intra-EU exchanges
Chart 31 EU trade flow
Source: EUMOFA based on elaboration of EUROSTAT data
4
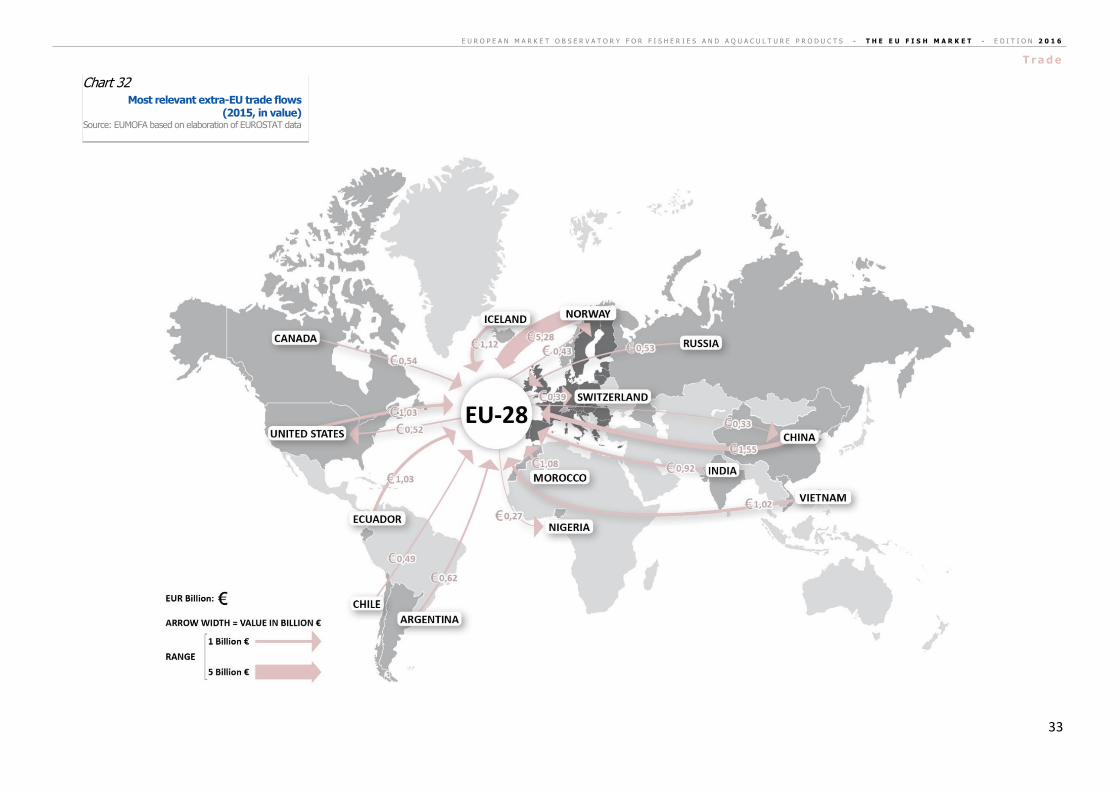
E U R O P E A N M A R K E T O B S E R V A T O R Y F O R F I S H E R I E S A N D A Q U A C U L T U R E P R O D U C T S - T H E E U F I S H M A R K E T - E D I T I O N 2 0 1 6
T r a d e
33
Chart 32 Most relevant extra-EU trade flows
(2015, in value) Source: EUMOFA based on elaboration of EUROSTAT data
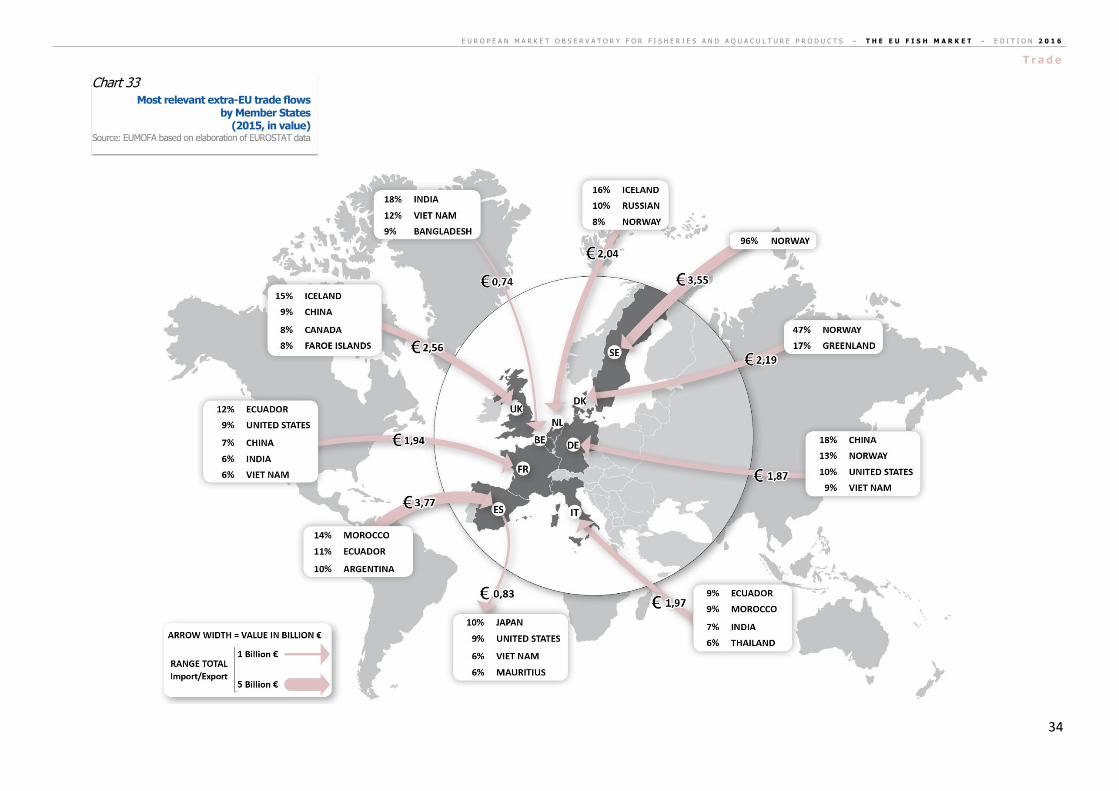
E U R O P E A N M A R K E T O B S E R V A T O R Y F O R F I S H E R I E S A N D A Q U A C U L T U R E P R O D U C T S - T H E E U F I S H M A R K E T - E D I T I O N 2 0 1 6
T r a d e
34
Chart 33 Most relevant extra-EU trade flows
by Member States (2015, in value)
Source: EUMOFA based on elaboration of EUROSTAT data
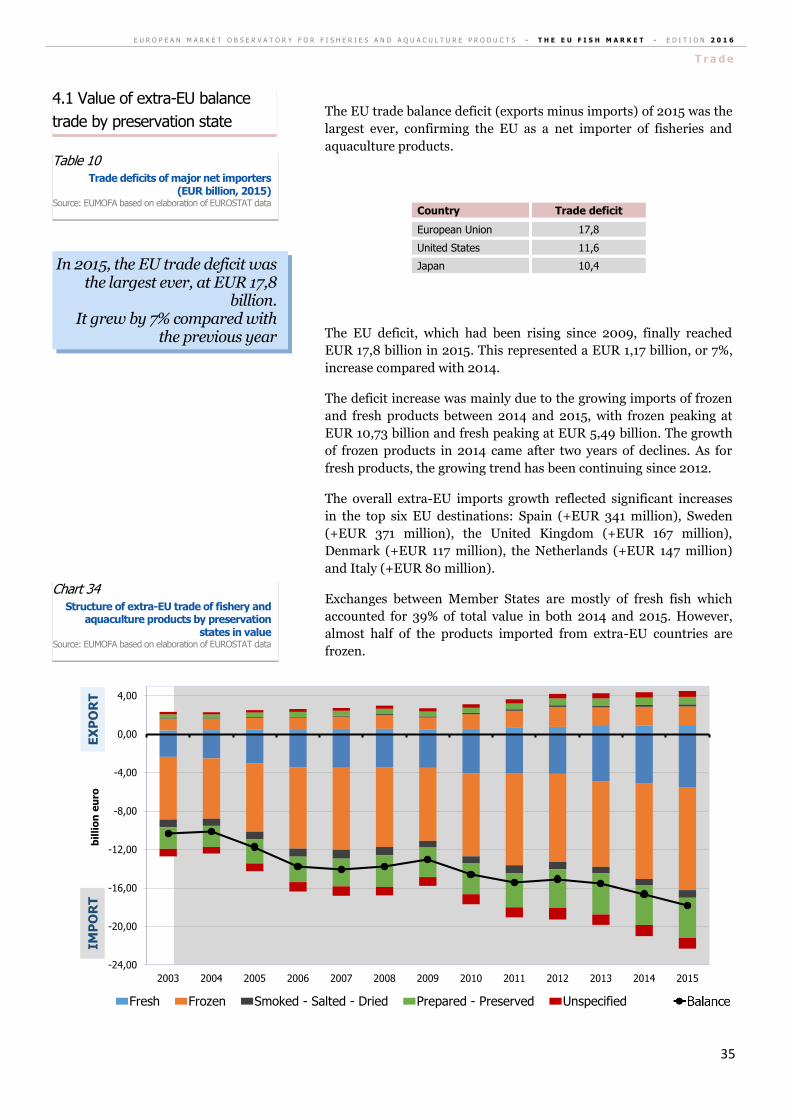
E U R O P E A N M A R K E T O B S E R V A T O R Y F O R F I S H E R I E S A N D A Q U A C U L T U R E P R O D U C T S - T H E E U F I S H M A R K E T - E D I T I O N 2 0 1 6
T r a d e
35
The EU trade balance deficit (exports minus imports) of 2015 was the
largest ever, confirming the EU as a net importer of fisheries and
aquaculture products.
Country Trade deficit
European Union 17,8
United States 11,6
Japan 10,4
The EU deficit, which had been rising since 2009, finally reached
EUR 17,8 billion in 2015. This represented a EUR 1,17 billion, or 7%,
increase compared with 2014.
The deficit increase was mainly due to the growing imports of frozen
and fresh products between 2014 and 2015, with frozen peaking at
EUR 10,73 billion and fresh peaking at EUR 5,49 billion. The growth
of frozen products in 2014 came after two years of declines. As for
fresh products, the growing trend has been continuing since 2012.
The overall extra-EU imports growth reflected significant increases
in the top six EU destinations: Spain (+EUR 341 million), Sweden
(+EUR 371 million), the United Kingdom (+EUR 167 million),
Denmark (+EUR 117 million), the Netherlands (+EUR 147 million)
and Italy (+EUR 80 million).
Exchanges between Member States are mostly of fresh fish which
accounted for 39% of total value in both 2014 and 2015. However,
almost half of the products imported from extra-EU countries are
frozen.
-24,00
-20,00
-16,00
-12,00
-8,00
-4,00
0,00
4,00
2003 2004 2005 2006 2007 2008 2009 2010 2011 2012 2013 2014 2015
Fresh Frozen Smoked - Salted - Dried Prepared - Preserved Unspecified Balance
IMP
OR
Tb
illi
on
eu
roE
XP
OR
T
Chart 34 Structure of extra-EU trade of fishery and
aquaculture products by preservation states in value
Source: EUMOFA based on elaboration of EUROSTAT data
In 2015, the EU trade deficit was the largest ever, at EUR 17,8
billion. It grew by 7% compared with
the previous year
Table 10 Trade deficits of major net importers
(EUR billion, 2015) Source: EUMOFA based on elaboration of EUROSTAT data
4.1 Value of extra-EU balance
trade by preservation state
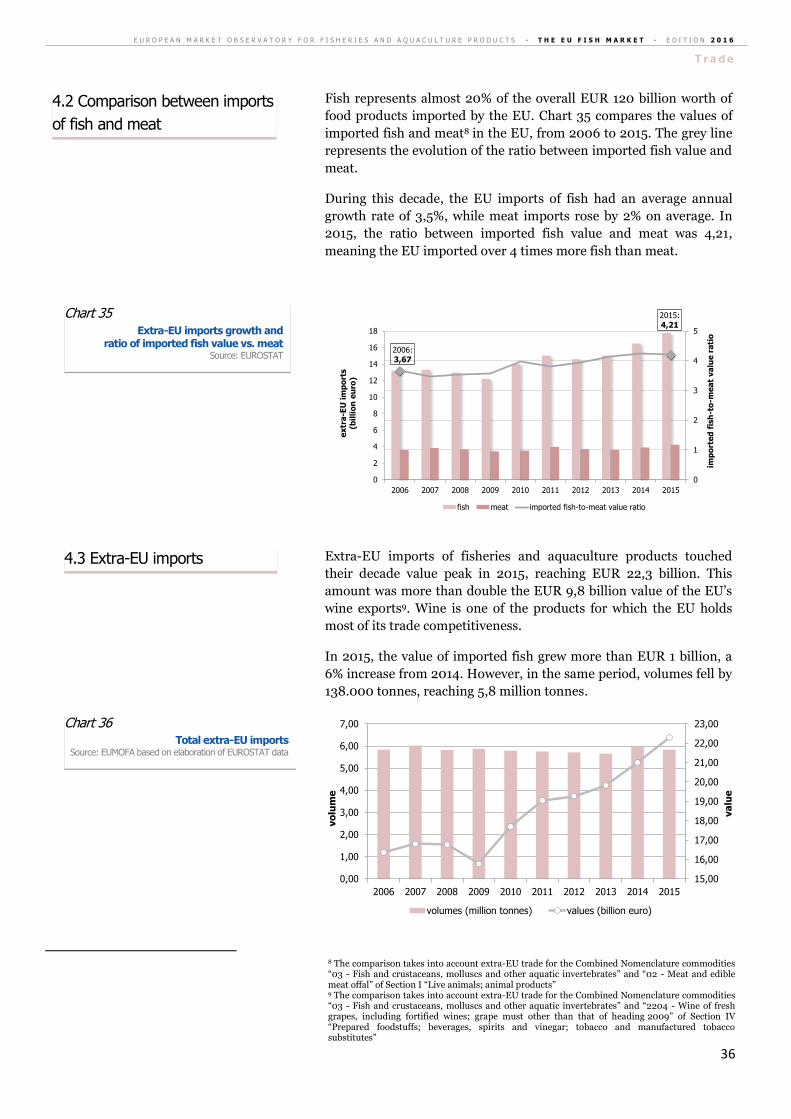
E U R O P E A N M A R K E T O B S E R V A T O R Y F O R F I S H E R I E S A N D A Q U A C U L T U R E P R O D U C T S - T H E E U F I S H M A R K E T - E D I T I O N 2 0 1 6
T r a d e
36
Fish represents almost 20% of the overall EUR 120 billion worth of
food products imported by the EU. Chart 35 compares the values of
imported fish and meat8 in the EU, from 2006 to 2015. The grey line
represents the evolution of the ratio between imported fish value and
meat.
During this decade, the EU imports of fish had an average annual
growth rate of 3,5%, while meat imports rose by 2% on average. In
2015, the ratio between imported fish value and meat was 4,21,
meaning the EU imported over 4 times more fish than meat.
Extra-EU imports of fisheries and aquaculture products touched
their decade value peak in 2015, reaching EUR 22,3 billion. This
amount was more than double the EUR 9,8 billion value of the EU’s
wine exports9. Wine is one of the products for which the EU holds
most of its trade competitiveness.
In 2015, the value of imported fish grew more than EUR 1 billion, a
6% increase from 2014. However, in the same period, volumes fell by
138.000 tonnes, reaching 5,8 million tonnes.
8 The comparison takes into account extra-EU trade for the Combined Nomenclature commodities “03 - Fish and crustaceans, molluscs and other aquatic invertebrates” and “02 - Meat and edible meat offal” of Section I “Live animals; animal products” 9 The comparison takes into account extra-EU trade for the Combined Nomenclature commodities “03 - Fish and crustaceans, molluscs and other aquatic invertebrates” and “2204 - Wine of fresh grapes, including fortified wines; grape must other than that of heading 2009” of Section IV “Prepared foodstuffs; beverages, spirits and vinegar; tobacco and manufactured tobacco substitutes”
2006:3,67
2015:4,21
0
1
2
3
4
5
0
2
4
6
8
10
12
14
16
18
2006 2007 2008 2009 2010 2011 2012 2013 2014 2015
imp
ort
ed
fis
h-t
o-m
ea
t va
lue
ra
tio
ex
tra
-EU
im
po
rts
(bil
lio
n e
uro
)
fish meat imported fish-to-meat value ratio
15,00
16,00
17,00
18,00
19,00
20,00
21,00
22,00
23,00
0,00
1,00
2,00
3,00
4,00
5,00
6,00
7,00
2006 2007 2008 2009 2010 2011 2012 2013 2014 2015
va
lue
vo
lum
e
volumes (million tonnes) values (billion euro)
Chart 36 Total extra-EU imports
Source: EUMOFA based on elaboration of EUROSTAT data
4.3 Extra-EU imports
Chart 35 Extra-EU imports growth and
ratio of imported fish value vs. meat Source: EUROSTAT
4.2 Comparison between imports
of fish and meat
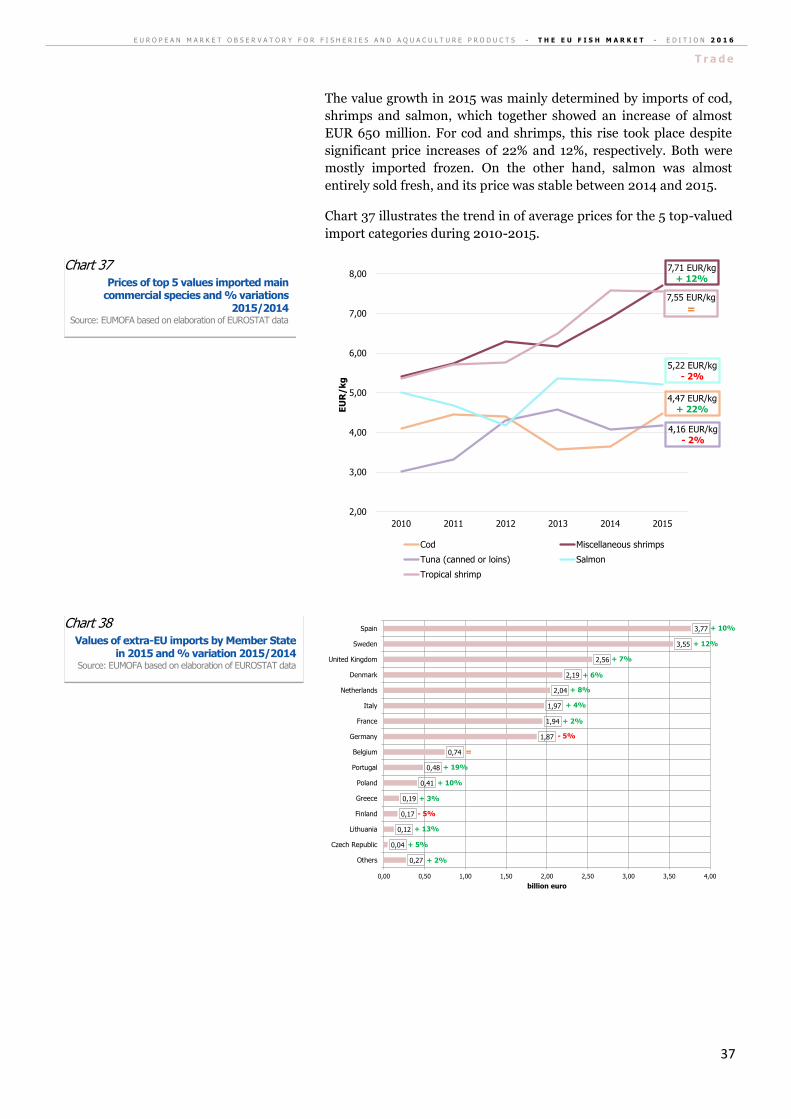
E U R O P E A N M A R K E T O B S E R V A T O R Y F O R F I S H E R I E S A N D A Q U A C U L T U R E P R O D U C T S - T H E E U F I S H M A R K E T - E D I T I O N 2 0 1 6
T r a d e
37
The value growth in 2015 was mainly determined by imports of cod,
shrimps and salmon, which together showed an increase of almost
EUR 650 million. For cod and shrimps, this rise took place despite
significant price increases of 22% and 12%, respectively. Both were
mostly imported frozen. On the other hand, salmon was almost
entirely sold fresh, and its price was stable between 2014 and 2015.
Chart 37 illustrates the trend in of average prices for the 5 top-valued
import categories during 2010-2015.
4,47 EUR/kg+ 22%
7,71 EUR/kg+ 12%
4,16 EUR/kg- 2%
5,22 EUR/kg- 2%
7,55 EUR/kg
=
2,00
3,00
4,00
5,00
6,00
7,00
8,00
2010 2011 2012 2013 2014 2015
EU
R/k
g
Cod Miscellaneous shrimps
Tuna (canned or loins) Salmon
Tropical shrimp
0,27
0,04
0,12
0,17
0,19
0,41
0,48
0,74
1,87
1,94
1,97
2,04
2,19
2,56
3,55
3,77
0,00 0,50 1,00 1,50 2,00 2,50 3,00 3,50 4,00
Others
Czech Republic
Lithuania
Finland
Greece
Poland
Portugal
Belgium
Germany
France
Italy
Netherlands
Denmark
United Kingdom
Sweden
Spain
billion euro
+ 10%
+ 12%
+ 7%
+ 6%
+ 8%
+ 4%
+ 2%
- 5%
=
+ 19%
+ 10%
+ 3%
- 5%
+ 13%
+ 5%
+ 2%
Chart 38 Values of extra-EU imports by Member State
in 2015 and % variation 2015/2014 Source: EUMOFA based on elaboration of EUROSTAT data
Chart 37 Prices of top 5 values imported main
commercial species and % variations 2015/2014
Source: EUMOFA based on elaboration of EUROSTAT data
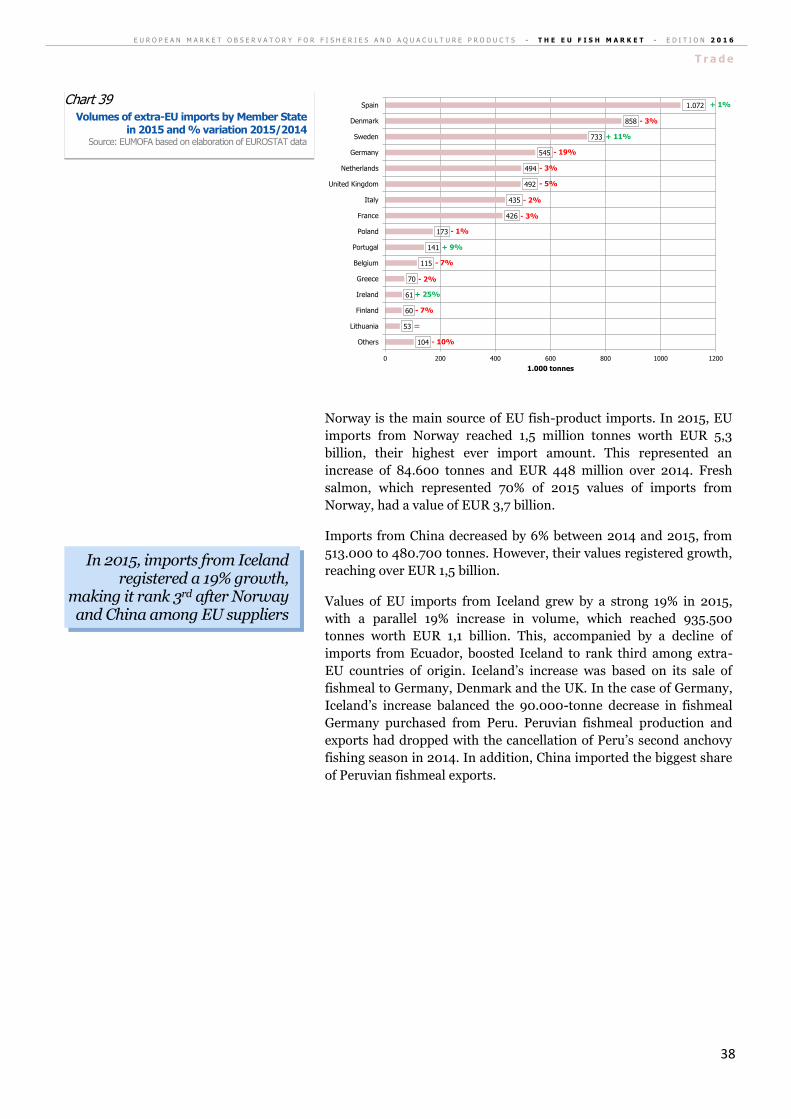
E U R O P E A N M A R K E T O B S E R V A T O R Y F O R F I S H E R I E S A N D A Q U A C U L T U R E P R O D U C T S - T H E E U F I S H M A R K E T - E D I T I O N 2 0 1 6
T r a d e
38
Norway is the main source of EU fish-product imports. In 2015, EU
imports from Norway reached 1,5 million tonnes worth EUR 5,3
billion, their highest ever import amount. This represented an
increase of 84.600 tonnes and EUR 448 million over 2014. Fresh
salmon, which represented 70% of 2015 values of imports from
Norway, had a value of EUR 3,7 billion.
Imports from China decreased by 6% between 2014 and 2015, from
513.000 to 480.700 tonnes. However, their values registered growth,
reaching over EUR 1,5 billion.
Values of EU imports from Iceland grew by a strong 19% in 2015,
with a parallel 19% increase in volume, which reached 935.500
tonnes worth EUR 1,1 billion. This, accompanied by a decline of
imports from Ecuador, boosted Iceland to rank third among extra-
EU countries of origin. Iceland’s increase was based on its sale of
fishmeal to Germany, Denmark and the UK. In the case of Germany,
Iceland’s increase balanced the 90.000-tonne decrease in fishmeal
Germany purchased from Peru. Peruvian fishmeal production and
exports had dropped with the cancellation of Peru’s second anchovy
fishing season in 2014. In addition, China imported the biggest share
of Peruvian fishmeal exports.
104
53
60
61
70
115
141
173
426
435
492
494
545
733
858
1.072
0 200 400 600 800 1000 1200
Others
Lithuania
Finland
Ireland
Greece
Belgium
Portugal
Poland
France
Italy
United Kingdom
Netherlands
Germany
Sweden
Denmark
Spain
1.000 tonnes
+ 1%
- 3%
+ 11%
- 19%
- 3%
- 5%
- 2%
- 3%
- 1%
+ 9%
- 7%
- 2%
+ 25%
- 7%
=
- 10%
In 2015, imports from Iceland registered a 19% growth,
making it rank 3rd after Norway and China among EU suppliers
Chart 39 Volumes of extra-EU imports by Member State
in 2015 and % variation 2015/2014 Source: EUMOFA based on elaboration of EUROSTAT data
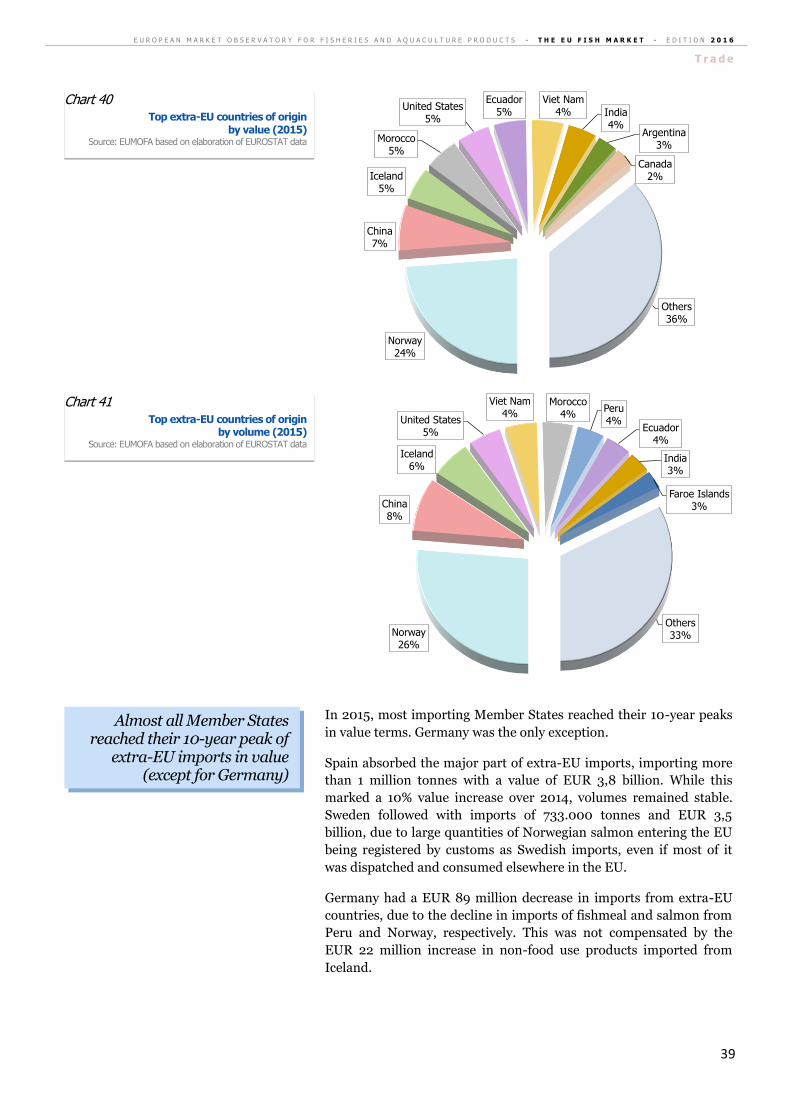
E U R O P E A N M A R K E T O B S E R V A T O R Y F O R F I S H E R I E S A N D A Q U A C U L T U R E P R O D U C T S - T H E E U F I S H M A R K E T - E D I T I O N 2 0 1 6
T r a d e
39
In 2015, most importing Member States reached their 10-year peaks
in value terms. Germany was the only exception.
Spain absorbed the major part of extra-EU imports, importing more
than 1 million tonnes with a value of EUR 3,8 billion. While this
marked a 10% value increase over 2014, volumes remained stable.
Sweden followed with imports of 733.000 tonnes and EUR 3,5
billion, due to large quantities of Norwegian salmon entering the EU
being registered by customs as Swedish imports, even if most of it
was dispatched and consumed elsewhere in the EU.
Germany had a EUR 89 million decrease in imports from extra-EU
countries, due to the decline in imports of fishmeal and salmon from
Peru and Norway, respectively. This was not compensated by the
EUR 22 million increase in non-food use products imported from
Iceland.
Norway24%
China7%
Iceland5%
Morocco5%
United States5%
Ecuador5%
Viet Nam4% India
4%Argentina
3%
Canada2%
Others36%
Norway26%
China8%
Iceland6%
United States5%
Viet Nam4%
Morocco4%
Peru4%
Ecuador4%
India3%
Faroe Islands3%
Others33%
Almost all Member States reached their 10-year peak of
extra-EU imports in value (except for Germany)
Chart 41 Top extra-EU countries of origin
by volume (2015) Source: EUMOFA based on elaboration of EUROSTAT data
Chart 40 Top extra-EU countries of origin
by value (2015) Source: EUMOFA based on elaboration of EUROSTAT data
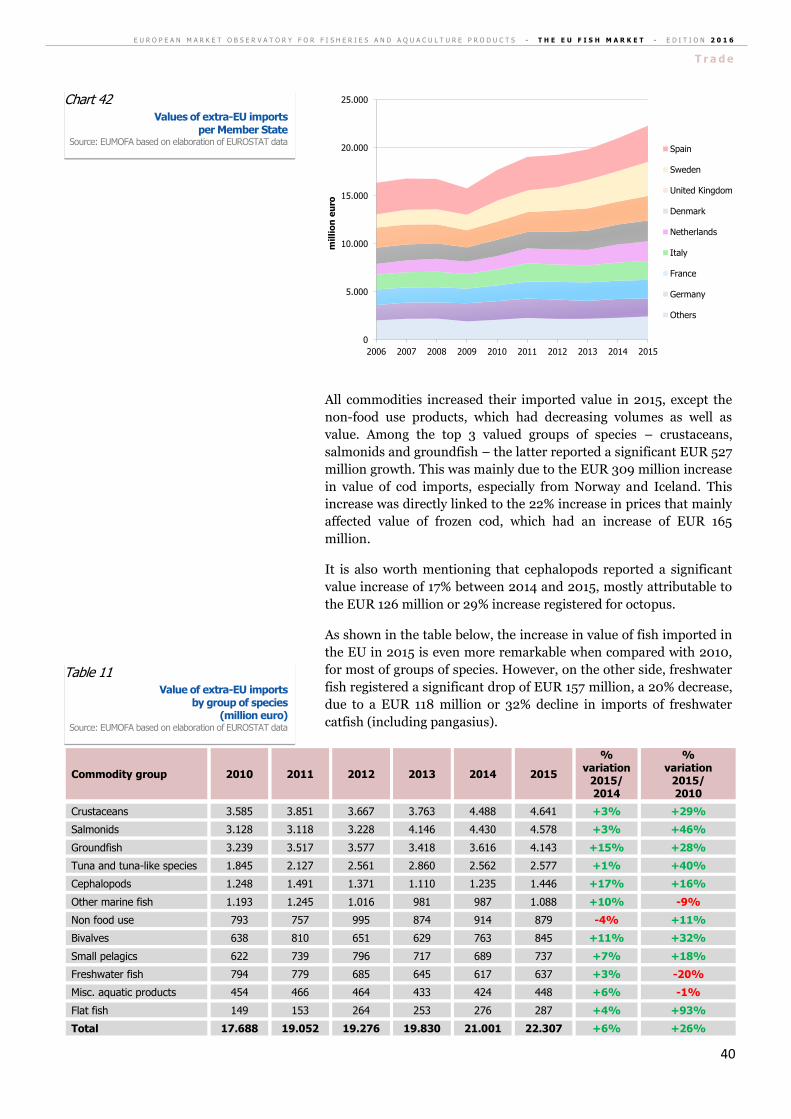
E U R O P E A N M A R K E T O B S E R V A T O R Y F O R F I S H E R I E S A N D A Q U A C U L T U R E P R O D U C T S - T H E E U F I S H M A R K E T - E D I T I O N 2 0 1 6
T r a d e
40
All commodities increased their imported value in 2015, except the
non-food use products, which had decreasing volumes as well as
value. Among the top 3 valued groups of species – crustaceans,
salmonids and groundfish – the latter reported a significant EUR 527
million growth. This was mainly due to the EUR 309 million increase
in value of cod imports, especially from Norway and Iceland. This
increase was directly linked to the 22% increase in prices that mainly
affected value of frozen cod, which had an increase of EUR 165
million.
It is also worth mentioning that cephalopods reported a significant
value increase of 17% between 2014 and 2015, mostly attributable to
the EUR 126 million or 29% increase registered for octopus.
As shown in the table below, the increase in value of fish imported in
the EU in 2015 is even more remarkable when compared with 2010,
for most of groups of species. However, on the other side, freshwater
fish registered a significant drop of EUR 157 million, a 20% decrease,
due to a EUR 118 million or 32% decline in imports of freshwater
catfish (including pangasius).
Commodity group 2010 2011 2012 2013 2014 2015
% variation
2015/ 2014
% variation
2015/ 2010
Crustaceans 3.585 3.851 3.667 3.763 4.488 4.641 +3% +29%
Salmonids 3.128 3.118 3.228 4.146 4.430 4.578 +3% +46%
Groundfish 3.239 3.517 3.577 3.418 3.616 4.143 +15% +28%
Tuna and tuna-like species 1.845 2.127 2.561 2.860 2.562 2.577 +1% +40%
Cephalopods 1.248 1.491 1.371 1.110 1.235 1.446 +17% +16%
Other marine fish 1.193 1.245 1.016 981 987 1.088 +10% -9%
Non food use 793 757 995 874 914 879 -4% +11%
Bivalves 638 810 651 629 763 845 +11% +32%
Small pelagics 622 739 796 717 689 737 +7% +18%
Freshwater fish 794 779 685 645 617 637 +3% -20%
Misc. aquatic products 454 466 464 433 424 448 +6% -1%
Flat fish 149 153 264 253 276 287 +4% +93%
Total 17.688 19.052 19.276 19.830 21.001 22.307 +6% +26%
0
5.000
10.000
15.000
20.000
25.000
2006 2007 2008 2009 2010 2011 2012 2013 2014 2015
mil
lio
n e
uro
Spain
Sweden
United Kingdom
Denmark
Netherlands
Italy
France
Germany
Others
Table 11 Value of extra-EU imports
by group of species (million euro)
Source: EUMOFA based on elaboration of EUROSTAT data
Chart 42 Values of extra-EU imports
per Member State Source: EUMOFA based on elaboration of EUROSTAT data

E U R O P E A N M A R K E T O B S E R V A T O R Y F O R F I S H E R I E S A N D A Q U A C U L T U R E P R O D U C T S - T H E E U F I S H M A R K E T - E D I T I O N 2 0 1 6
T r a d e
41
Looking at volume variations, most commodities experienced losses
between 2014 and 2015. Groundfish volume, for example, decreased
26.000 tonnes, and the group “miscellaneous aquatic products”,
which is mainly seaweed, decreased 7.400 tonnes.
However, most imported groups reported increasing trends for 2010-
2015, especially salmonids.
Commodity group 2010 2011 2012 2013 2014 2015
% variation
2015/ 2014
% variation
2015/ 2010
Groundfish 1.091 1.095 1.103 1.153 1.188 1.162 -2% +7%
Salmonids 631 663 763 776 837 877 +5% +39%
Non-food use 815 736 884 766 937 841 -10% +3%
Tuna and tuna-like species 673 698 666 701 718 722 +1% +7%
Crustaceans 662 660 604 596 622 602 -3% -9%
Cephalopods 431 392 379 370 363 375 +3% -13%
Small pelagics 427 404 379 354 358 357 = -16%
Bivalves 195 235 189 206 252 252 = +29%
Other marine fish 318 316 236 235 235 229 -3% -28%
Freshwater fish 331 305 256 256 230 209 -9% -37%
Misc. aquatic products 167 207 183 169 150 129 -14% -23%
Flat fish 48 44 70 72 79 75 -5% +56%
Total 5.788 5.754 5.713 5.654 5.968 5.830 -2% +1%
Crustaceans21%
Salmonids21%
Groundfish19%
Tuna and tuna-like species
12%
Cephalopods6%
Other marine fish5%
Non food use4%
Bivalves4%
Small pelagics3%
Freshwater fish3%
Misc. aquatic products
2%
Flat fish1%
Chart 43 EU imports by group of species
by value (2015) Source: EUMOFA based on elaboration of EUROSTAT data
Table 12 Volume of extra-EU imports by group of
species (1.000 tonnes)
Source: EUMOFA based on elaboration of EUROSTAT data

E U R O P E A N M A R K E T O B S E R V A T O R Y F O R F I S H E R I E S A N D A Q U A C U L T U R E P R O D U C T S - T H E E U F I S H M A R K E T - E D I T I O N 2 0 1 6
T r a d e
42
Since 2013, crustaceans have been the most valued group of species
imported in the EU, representing 21% of the total. Its 2015 imports
reached a value peak of EUR 4,6 billion for 602.000 tonnes. This was
due to an increase in import prices that affected almost all imported
species of this group. The only exception was tropical shrimp, which
was imported at a slightly declined price of 7,55 EUR/kg, which was
only 0,4% less than 2014.
Several of the important species within the crustaceans category had
both decline in import volume and higher prices in 2015. For
example, crab’s volume declined 5,5% and its price increased by 15%,
and lobster volume decreased 3% in volume, while its price rose 23%.
For miscellaneous shrimp, which is primarily coldwater shrimp from
the North Atlantic, and red shrimp from Argentina, import volumes
were relatively stable, while import price still increased by 12%.
Spain absorbed 22% of EU crustaceans imports. Total import value
of EUR 1 billion marked an 11% increase from 2014.
The main countries from which the EU imports crustaceans are India
and Ecuador. Despite decreasing values reported in 2015, their
combined coverage was 25% of the total at EUR 582 million and EUR
579 million, respectively. Imports from Viet Nam were also
noteworthy, growing by a significant 18% from 2014 to 2015 to EUR
456 million, mostly destined for the UK and the Netherlands.
Frozen shrimps rank second to salmon among products imported
into the EU in value. In 2015, they amounted to EUR 3 billion which
was EUR 58 million more than in 2014.
Groundfish20%
Salmonids15%
Non food use14%
Tuna and tuna-like species
12%
Crustaceans10%
Cephalopods6%
Small pelagics6%
Bivalves4%
Other marine fish4%
Freshwater fish4%
Misc. aquatic products
2%
Flat fish1%
Crustaceans
Chart 44 EU imports by group of species
by volume (2015) Source: EUMOFA based on elaboration of EUROSTAT data
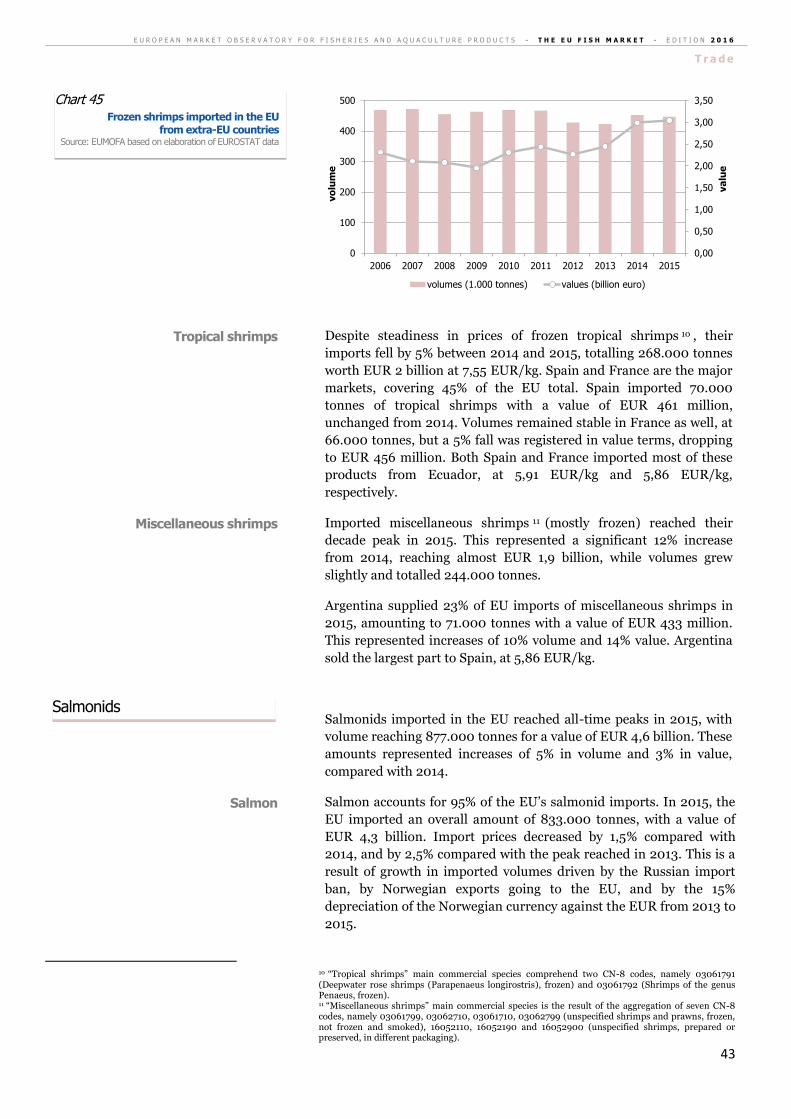
E U R O P E A N M A R K E T O B S E R V A T O R Y F O R F I S H E R I E S A N D A Q U A C U L T U R E P R O D U C T S - T H E E U F I S H M A R K E T - E D I T I O N 2 0 1 6
T r a d e
43
Despite steadiness in prices of frozen tropical shrimps 10 , their
imports fell by 5% between 2014 and 2015, totalling 268.000 tonnes
worth EUR 2 billion at 7,55 EUR/kg. Spain and France are the major
markets, covering 45% of the EU total. Spain imported 70.000
tonnes of tropical shrimps with a value of EUR 461 million,
unchanged from 2014. Volumes remained stable in France as well, at
66.000 tonnes, but a 5% fall was registered in value terms, dropping
to EUR 456 million. Both Spain and France imported most of these
products from Ecuador, at 5,91 EUR/kg and 5,86 EUR/kg,
respectively.
Imported miscellaneous shrimps 11 (mostly frozen) reached their
decade peak in 2015. This represented a significant 12% increase
from 2014, reaching almost EUR 1,9 billion, while volumes grew
slightly and totalled 244.000 tonnes.
Argentina supplied 23% of EU imports of miscellaneous shrimps in
2015, amounting to 71.000 tonnes with a value of EUR 433 million.
This represented increases of 10% volume and 14% value. Argentina
sold the largest part to Spain, at 5,86 EUR/kg.
Salmonids imported in the EU reached all-time peaks in 2015, with
volume reaching 877.000 tonnes for a value of EUR 4,6 billion. These
amounts represented increases of 5% in volume and 3% in value,
compared with 2014.
Salmon accounts for 95% of the EU’s salmonid imports. In 2015, the
EU imported an overall amount of 833.000 tonnes, with a value of
EUR 4,3 billion. Import prices decreased by 1,5% compared with
2014, and by 2,5% compared with the peak reached in 2013. This is a
result of growth in imported volumes driven by the Russian import
ban, by Norwegian exports going to the EU, and by the 15%
depreciation of the Norwegian currency against the EUR from 2013 to
2015.
10 “Tropical shrimps” main commercial species comprehend two CN-8 codes, namely 03061791 (Deepwater rose shrimps (Parapenaeus longirostris), frozen) and 03061792 (Shrimps of the genus Penaeus, frozen). 11 “Miscellaneous shrimps” main commercial species is the result of the aggregation of seven CN-8 codes, namely 03061799, 03062710, 03061710, 03062799 (unspecified shrimps and prawns, frozen, not frozen and smoked), 16052110, 16052190 and 16052900 (unspecified shrimps, prepared or preserved, in different packaging).
0,00
0,50
1,00
1,50
2,00
2,50
3,00
3,50
0
100
200
300
400
500
2006 2007 2008 2009 2010 2011 2012 2013 2014 2015
va
lue
vo
lum
e
volumes (1.000 tonnes) values (billion euro)
Salmon
Salmonids
Miscellaneous shrimps
Tropical shrimps
Chart 45 Frozen shrimps imported in the EU
from extra-EU countries Source: EUMOFA based on elaboration of EUROSTAT data

E U R O P E A N M A R K E T O B S E R V A T O R Y F O R F I S H E R I E S A N D A Q U A C U L T U R E P R O D U C T S - T H E E U F I S H M A R K E T - E D I T I O N 2 0 1 6
T r a d e
44
Of all salmon imported, 85% was fresh and originated from Norway,
corresponding to 700.00 tonnes and EUR 3,5 billion. According to
Eurostat, it was mostly sold to neighbouring Sweden and Denmark,
but they re-exported it to other EU countries. In other words, the real
salmon importing countries were the main consumer markets in the
EU, with France in the lead.
Chart 46 shows that Norway more than doubled its exports of fresh
salmon to the EU during the last decade. Between 2014 and 2015,
growth rates of 10% volume and 7% value were observed, while the
average price slightly declined from 5,12 EUR/kg to 4,99 EUR/kg.
In 2015, groundfish accounted for 19% of EU imports from third
countries in terms of value and 20% in terms of volume.
This amounted to 1,2 million tonnes, a 2% decrease from 2014, at a
value of EUR 4,1 billion, which was a remarkable 15%, or EUR 528
million, increase from 2014 and a 10-year peak in value. This peak
was primarily linked to a large, 17% import price increase, which was
positively affected by cod, Alaska pollock and hake. For the Alaska
pollock, the USD’s strengthening against the EUR was a pivotal
reason for an increased import price from the US, China and Russia.
More than half of groundfish imported is cod. In 2015, it totalled
486.000 tonnes and EUR 2,2 billion. Cod was also responsible for the
value growth of the whole commodity group, as its imported value
rose by 17% or EUR 309 million, due to a 22% price rise in the face of
a 5% contraction in volumes. The price increase was generated
because the TAC12, and thereby catches of cod in the North Atlantic,
decreased by nearly 10% in 2014-2015.
Norway and Iceland were the main countries of origin. Norway
totalled 174.000 tonnes and EUR 789 million, with a 30% price
increase (from 3,50 to 4,54 EUR/kg), while Iceland reached 90.000
tonnes and EUR 558 million, with a 15% price increase. Both reported
values increases, of 16% and 13%, respectively.
The Netherlands was the major importer of cod deriving from extra-
EU countries, mostly from Iceland at 5,20 EUR/kg, and from Russia
at 3,75 EUR/kg. However, these products were then re-exported to
other Member States.
12 Total Allowable Catches
0,00
0,50
1,00
1,50
2,00
2,50
3,00
3,50
4,00
0
100
200
300
400
500
600
700
800
2006 2007 2008 2009 2010 2011 2012 2013 2014 2015
va
lue
vo
lum
e
volumes (1.000 tonnes) values (billion euro)
Cod
Groundfish
Chart 46 Fresh salmon imported in the EU
from Norway Source: EUMOFA based on elaboration of EUROSTAT data

E U R O P E A N M A R K E T O B S E R V A T O R Y F O R F I S H E R I E S A N D A Q U A C U L T U R E P R O D U C T S - T H E E U F I S H M A R K E T - E D I T I O N 2 0 1 6
T r a d e
45
Imports of hake covered 15% of total groundfish originating from
extra-EU countries. An 8% price growth, observed between 2014 and
2015, caused values to increase 7%, from EUR 532 million to EUR 572
million. Volumes, however, stood flat at almost 178.700 tonnes.
Hake is mostly sold by Namibia, which had exports to the EU
amounting to 57.000 tonnes worth EUR 206 million in 2015. Spain
absorbed 70% of it, mostly as frozen fillets, at 3,59 EUR/kg.
Extra-EU imports of tuna and tuna-like species13 totalled 978.000
tonnes in 2015, worth over EUR 3 billion. Among these, swordfish
imports reached 21.600 tonnes, with a value of EUR 125 million.
The major part of this commodity consists of “processed tuna”. In
2015, its value of more than EUR 2 billion represented almost 70% of
total imported tuna. Volumes were at 536.000 tonnes. This category
comprises canned tuna (80%) and tuna loins for the canning industry
(20%). In looking at the composition by specific species, skipjack tuna
covered more than half of the total, with 304.000 tonnes valued at
over EUR 1 billion imported in 2015. Yellowfin tuna followed, with
131.000 tonnes accounting to EUR 637 million.
The most relevant suppliers sold these products at a lower price in
2015, compared with 2014. As regards Ecuador, the price went from
3,87 EUR/kg to 3,72 EUR/kg. Mauritius and Thailand registered very
slight 1% price decreases, with Mauritius selling it at 3,90 EUR/kg
and Thailand at 3,49 EUR/kg.
Extra-EU imports of processed tuna are mostly absorbed by Spain,
Italy and the UK. In 2015, Italy imported the lowest amount of these
products of the last decade, mainly due to declining imports from
Ecuador that destined most processed tuna to Spain, offset by an
increase of intra-EU imports.
13 The commodity group “Tuna and tuna-like species” includes the following main commercial species: albacore tuna, bigeye tuna, bluefin tuna, skipjack tuna, swordfish, yellowfin tuna, and the aggregation “miscellaneous tunas”.
Skipjack tuna55%
Yellowfin tuna32%
Miscellaneous tunas13%
Chart 47 Processed tuna imported
from extra-EU countries (by value, 2015) Source: EUMOFA based on elaboration of EUROSTAT data
Processed tuna
Tuna and tuna-like species
Hake
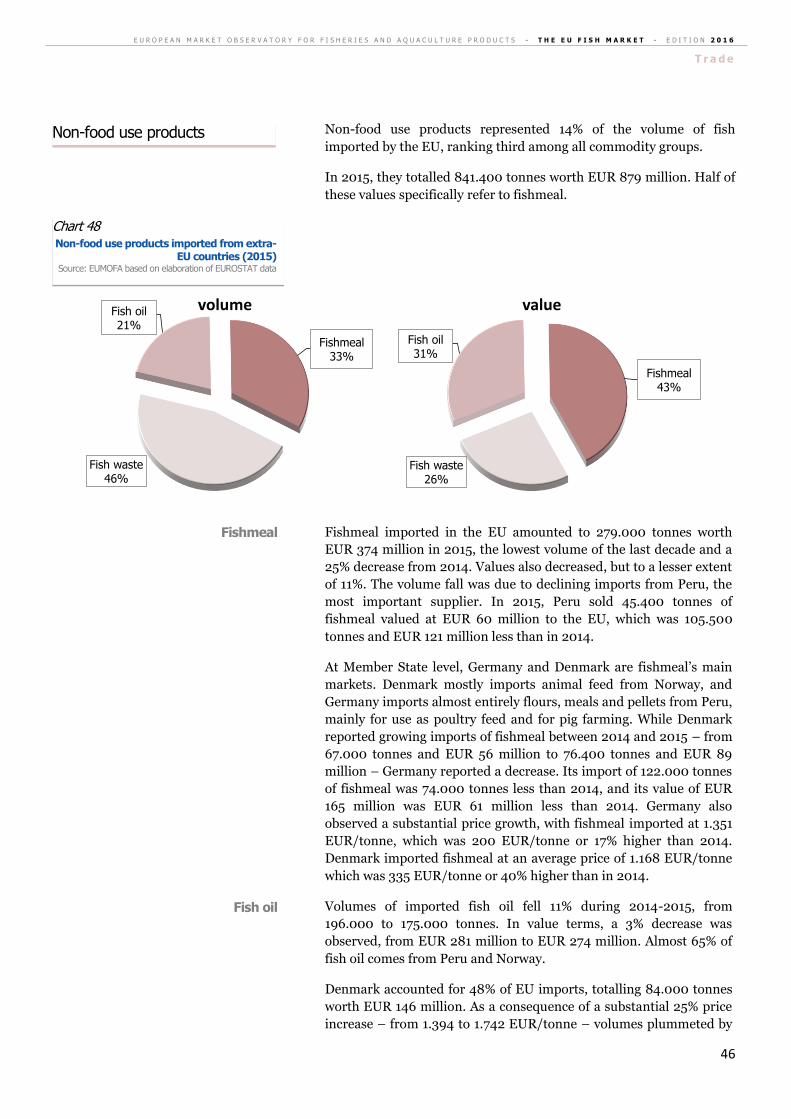
E U R O P E A N M A R K E T O B S E R V A T O R Y F O R F I S H E R I E S A N D A Q U A C U L T U R E P R O D U C T S - T H E E U F I S H M A R K E T - E D I T I O N 2 0 1 6
T r a d e
46
Non-food use products represented 14% of the volume of fish
imported by the EU, ranking third among all commodity groups.
In 2015, they totalled 841.400 tonnes worth EUR 879 million. Half of
these values specifically refer to fishmeal.
Fishmeal imported in the EU amounted to 279.000 tonnes worth
EUR 374 million in 2015, the lowest volume of the last decade and a
25% decrease from 2014. Values also decreased, but to a lesser extent
of 11%. The volume fall was due to declining imports from Peru, the
most important supplier. In 2015, Peru sold 45.400 tonnes of
fishmeal valued at EUR 60 million to the EU, which was 105.500
tonnes and EUR 121 million less than in 2014.
At Member State level, Germany and Denmark are fishmeal’s main
markets. Denmark mostly imports animal feed from Norway, and
Germany imports almost entirely flours, meals and pellets from Peru,
mainly for use as poultry feed and for pig farming. While Denmark
reported growing imports of fishmeal between 2014 and 2015 – from
67.000 tonnes and EUR 56 million to 76.400 tonnes and EUR 89
million – Germany reported a decrease. Its import of 122.000 tonnes
of fishmeal was 74.000 tonnes less than 2014, and its value of EUR
165 million was EUR 61 million less than 2014. Germany also
observed a substantial price growth, with fishmeal imported at 1.351
EUR/tonne, which was 200 EUR/tonne or 17% higher than 2014.
Denmark imported fishmeal at an average price of 1.168 EUR/tonne
which was 335 EUR/tonne or 40% higher than in 2014.
Volumes of imported fish oil fell 11% during 2014-2015, from
196.000 to 175.000 tonnes. In value terms, a 3% decrease was
observed, from EUR 281 million to EUR 274 million. Almost 65% of
fish oil comes from Peru and Norway.
Denmark accounted for 48% of EU imports, totalling 84.000 tonnes
worth EUR 146 million. As a consequence of a substantial 25% price
increase – from 1.394 to 1.742 EUR/tonne – volumes plummeted by
Fishmeal33%
Fish waste46%
Fish oil21%
volume
Fishmeal43%
Fish waste26%
Fish oil31%
value
Fish oil
Fishmeal
Chart 48 Non-food use products imported from extra-
EU countries (2015) Source: EUMOFA based on elaboration of EUROSTAT data
Non-food use products
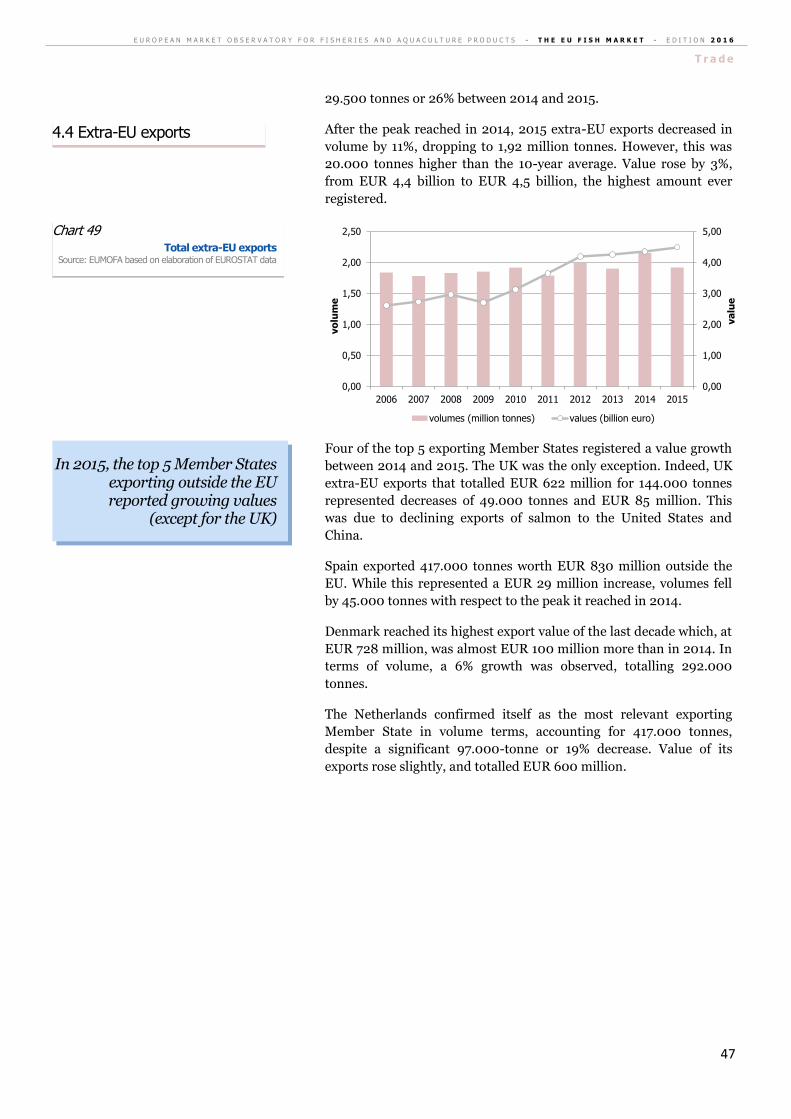
E U R O P E A N M A R K E T O B S E R V A T O R Y F O R F I S H E R I E S A N D A Q U A C U L T U R E P R O D U C T S - T H E E U F I S H M A R K E T - E D I T I O N 2 0 1 6
T r a d e
47
29.500 tonnes or 26% between 2014 and 2015.
After the peak reached in 2014, 2015 extra-EU exports decreased in
volume by 11%, dropping to 1,92 million tonnes. However, this was
20.000 tonnes higher than the 10-year average. Value rose by 3%,
from EUR 4,4 billion to EUR 4,5 billion, the highest amount ever
registered.
Four of the top 5 exporting Member States registered a value growth
between 2014 and 2015. The UK was the only exception. Indeed, UK
extra-EU exports that totalled EUR 622 million for 144.000 tonnes
represented decreases of 49.000 tonnes and EUR 85 million. This
was due to declining exports of salmon to the United States and
China.
Spain exported 417.000 tonnes worth EUR 830 million outside the
EU. While this represented a EUR 29 million increase, volumes fell
by 45.000 tonnes with respect to the peak it reached in 2014.
Denmark reached its highest export value of the last decade which, at
EUR 728 million, was almost EUR 100 million more than in 2014. In
terms of volume, a 6% growth was observed, totalling 292.000
tonnes.
The Netherlands confirmed itself as the most relevant exporting
Member State in volume terms, accounting for 417.000 tonnes,
despite a significant 97.000-tonne or 19% decrease. Value of its
exports rose slightly, and totalled EUR 600 million.
0,00
1,00
2,00
3,00
4,00
5,00
0,00
0,50
1,00
1,50
2,00
2,50
2006 2007 2008 2009 2010 2011 2012 2013 2014 2015
va
lue
vo
lum
e
volumes (million tonnes) values (billion euro)
In 2015, the top 5 Member States exporting outside the EU reported growing values
(except for the UK)
Chart 49 Total extra-EU exports
Source: EUMOFA based on elaboration of EUROSTAT data
4.4 Extra-EU exports
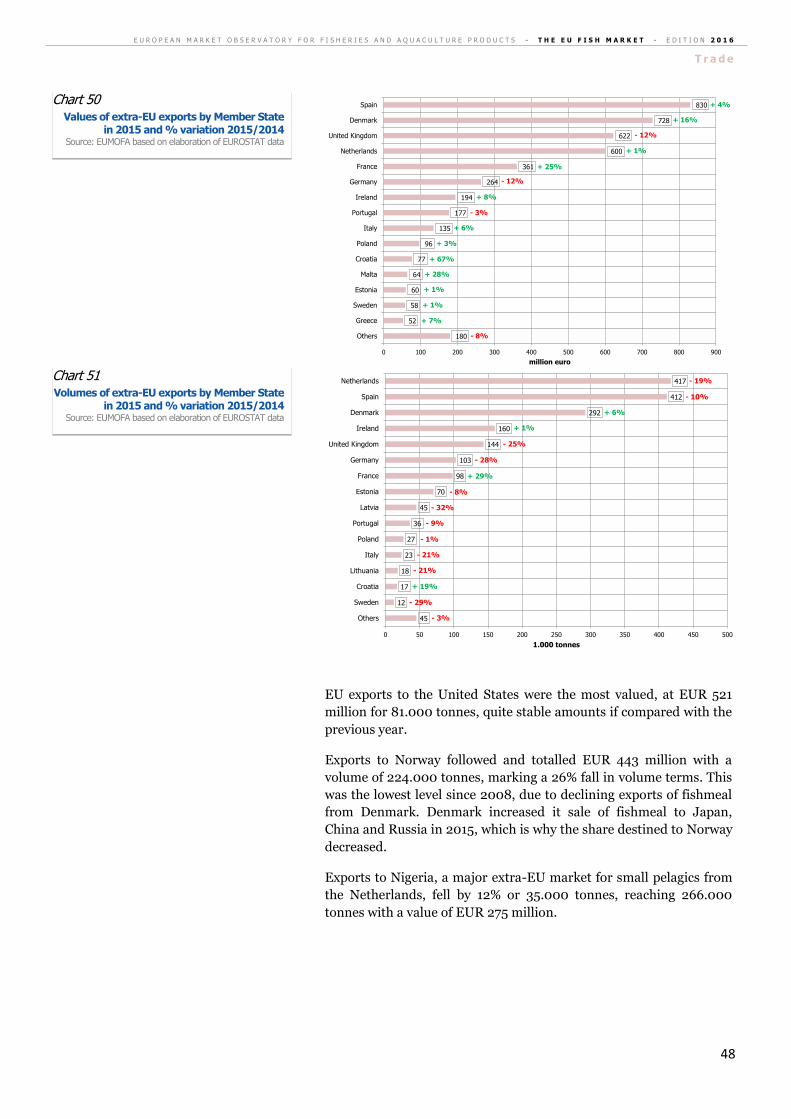
E U R O P E A N M A R K E T O B S E R V A T O R Y F O R F I S H E R I E S A N D A Q U A C U L T U R E P R O D U C T S - T H E E U F I S H M A R K E T - E D I T I O N 2 0 1 6
T r a d e
48
EU exports to the United States were the most valued, at EUR 521
million for 81.000 tonnes, quite stable amounts if compared with the
previous year.
Exports to Norway followed and totalled EUR 443 million with a
volume of 224.000 tonnes, marking a 26% fall in volume terms. This
was the lowest level since 2008, due to declining exports of fishmeal
from Denmark. Denmark increased it sale of fishmeal to Japan,
China and Russia in 2015, which is why the share destined to Norway
decreased.
Exports to Nigeria, a major extra-EU market for small pelagics from
the Netherlands, fell by 12% or 35.000 tonnes, reaching 266.000
tonnes with a value of EUR 275 million.
180
52
58
60
64
77
96
135
177
194
264
361
600
622
728
830
0 100 200 300 400 500 600 700 800 900
Others
Greece
Sweden
Estonia
Malta
Croatia
Poland
Italy
Portugal
Ireland
Germany
France
Netherlands
United Kingdom
Denmark
Spain
million euro
+ 4%
+ 16%
- 12%
+ 1%
+ 25%
- 12%
+ 8%
- 3%
+ 6%
+ 3%
+ 67%
+ 28%
+ 1%
+ 1%
+ 7%
- 8%
45
12
17
18
23
27
36
45
70
98
103
144
160
292
412
417
0 50 100 150 200 250 300 350 400 450 500
Others
Sweden
Croatia
Lithuania
Italy
Poland
Portugal
Latvia
Estonia
France
Germany
United Kingdom
Ireland
Denmark
Spain
Netherlands
1.000 tonnes
- 19%
- 10%
+ 6%
+ 1%
- 25%
- 28%
+ 29%
- 8%
- 32%
- 9%
- 1%
- 21%
- 21%
+ 19%
- 29%
- 3%
Chart 51 Volumes of extra-EU exports by Member State
in 2015 and % variation 2015/2014 Source: EUMOFA based on elaboration of EUROSTAT data
Chart 50 Values of extra-EU exports by Member State
in 2015 and % variation 2015/2014 Source: EUMOFA based on elaboration of EUROSTAT data
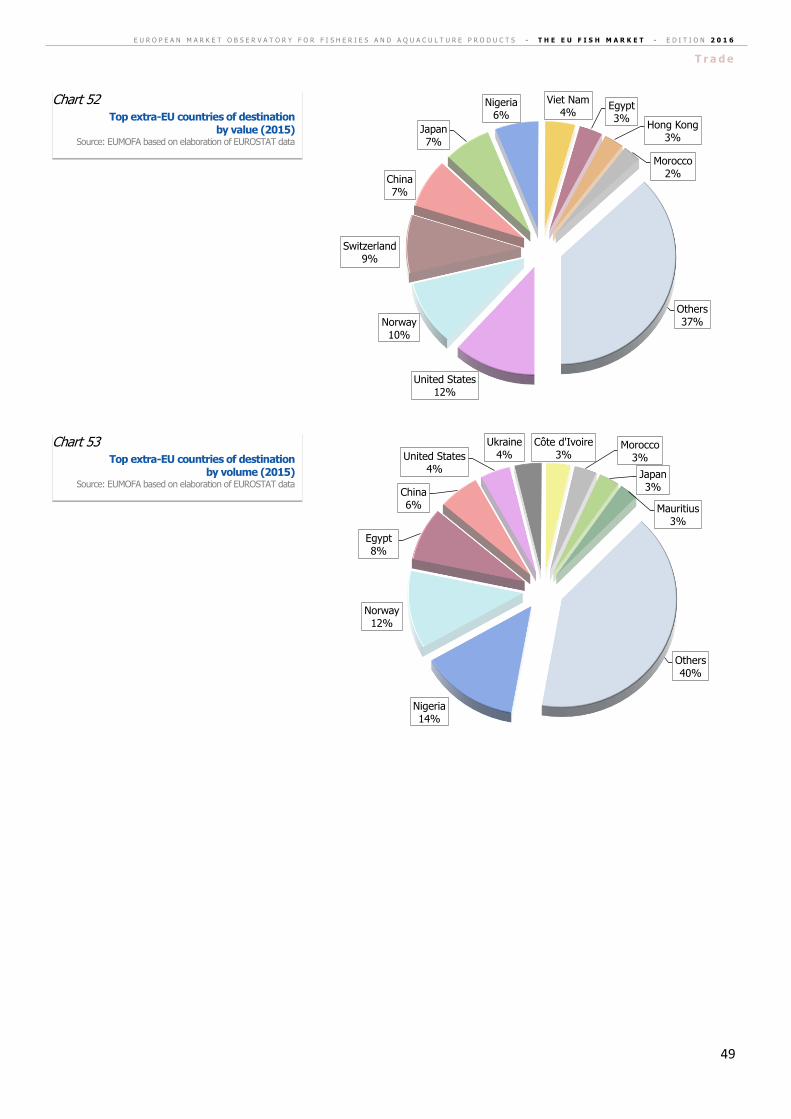
E U R O P E A N M A R K E T O B S E R V A T O R Y F O R F I S H E R I E S A N D A Q U A C U L T U R E P R O D U C T S - T H E E U F I S H M A R K E T - E D I T I O N 2 0 1 6
T r a d e
49
United States12%
Norway10%
Switzerland9%
China7%
Japan7%
Nigeria6%
Viet Nam4%
Egypt3%
Hong Kong3%
Morocco2%
Others37%
Nigeria14%
Norway12%
Egypt8%
China6%
United States4%
Ukraine4%
Côte d'Ivoire3%
Morocco3%
Japan3%
Mauritius3%
Others40%
Chart 53 Top extra-EU countries of destination
by volume (2015) Source: EUMOFA based on elaboration of EUROSTAT data
Chart 52 Top extra-EU countries of destination
by value (2015) Source: EUMOFA based on elaboration of EUROSTAT data
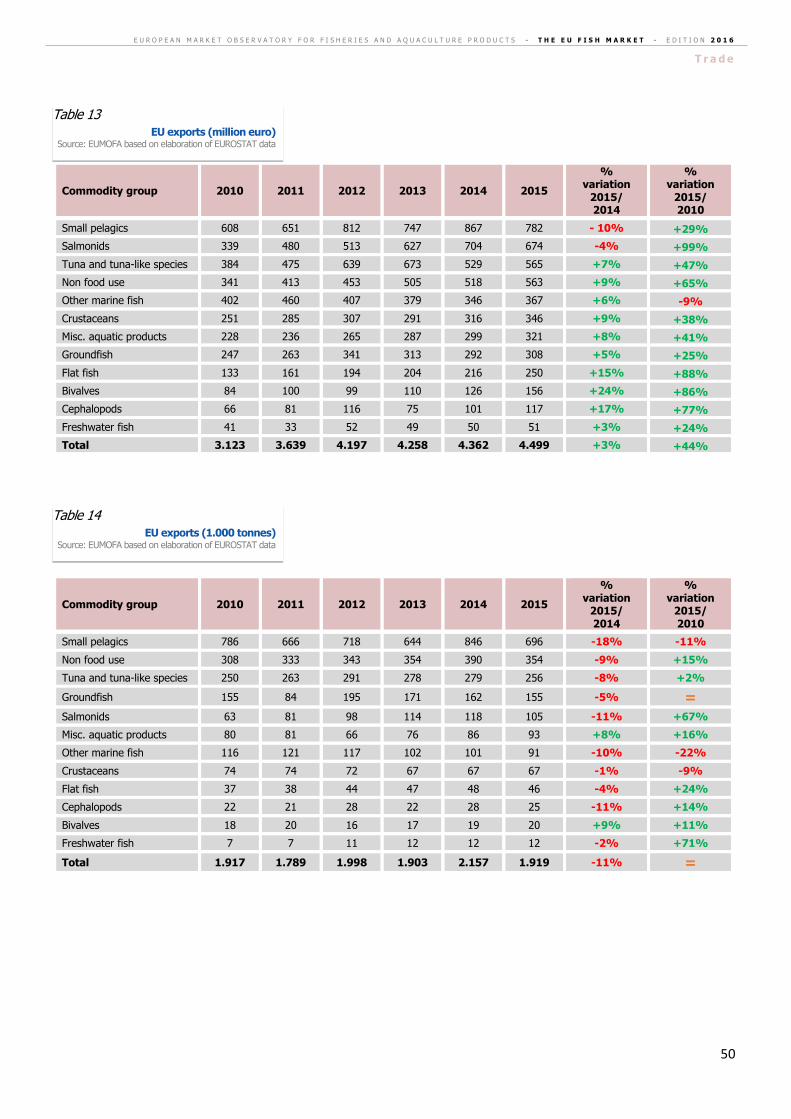
E U R O P E A N M A R K E T O B S E R V A T O R Y F O R F I S H E R I E S A N D A Q U A C U L T U R E P R O D U C T S - T H E E U F I S H M A R K E T - E D I T I O N 2 0 1 6
T r a d e
50
Commodity group 2010 2011 2012 2013 2014 2015
% variation
2015/ 2014
% variation
2015/ 2010
Small pelagics 608 651 812 747 867 782 - 10% +29%
Salmonids 339 480 513 627 704 674 -4% +99%
Tuna and tuna-like species 384 475 639 673 529 565 +7% +47%
Non food use 341 413 453 505 518 563 +9% +65%
Other marine fish 402 460 407 379 346 367 +6% -9%
Crustaceans 251 285 307 291 316 346 +9% +38%
Misc. aquatic products 228 236 265 287 299 321 +8% +41%
Groundfish 247 263 341 313 292 308 +5% +25%
Flat fish 133 161 194 204 216 250 +15% +88%
Bivalves 84 100 99 110 126 156 +24% +86%
Cephalopods 66 81 116 75 101 117 +17% +77%
Freshwater fish 41 33 52 49 50 51 +3% +24%
Total 3.123 3.639 4.197 4.258 4.362 4.499 +3% +44%
Commodity group 2010 2011 2012 2013 2014 2015
% variation
2015/ 2014
% variation
2015/ 2010
Small pelagics 786 666 718 644 846 696 -18% -11%
Non food use 308 333 343 354 390 354 -9% +15%
Tuna and tuna-like species 250 263 291 278 279 256 -8% +2%
Groundfish 155 84 195 171 162 155 -5% =
Salmonids 63 81 98 114 118 105 -11% +67%
Misc. aquatic products 80 81 66 76 86 93 +8% +16%
Other marine fish 116 121 117 102 101 91 -10% -22%
Crustaceans 74 74 72 67 67 67 -1% -9%
Flat fish 37 38 44 47 48 46 -4% +24%
Cephalopods 22 21 28 22 28 25 -11% +14%
Bivalves 18 20 16 17 19 20 +9% +11%
Freshwater fish 7 7 11 12 12 12 -2% +71%
Total 1.917 1.789 1.998 1.903 2.157 1.919 -11% =
Table 14 EU exports (1.000 tonnes)
Source: EUMOFA based on elaboration of EUROSTAT data
Table 13 EU exports (million euro)
Source: EUMOFA based on elaboration of EUROSTAT data
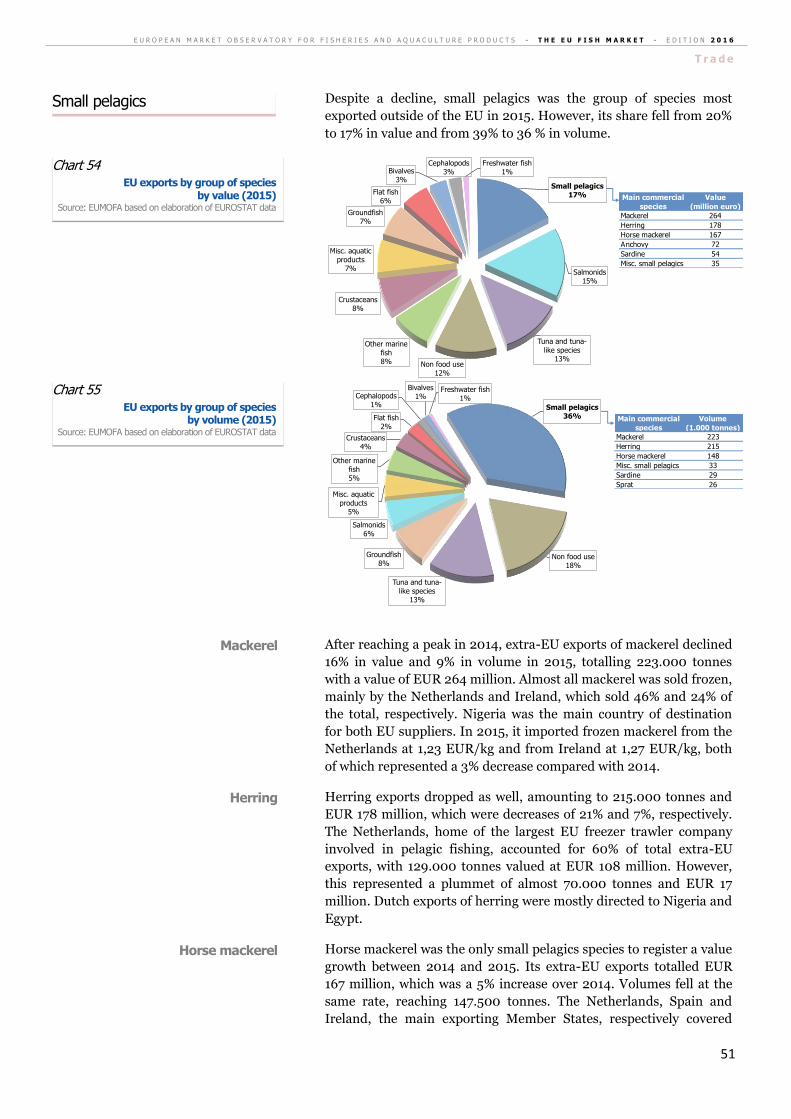
E U R O P E A N M A R K E T O B S E R V A T O R Y F O R F I S H E R I E S A N D A Q U A C U L T U R E P R O D U C T S - T H E E U F I S H M A R K E T - E D I T I O N 2 0 1 6
T r a d e
51
Despite a decline, small pelagics was the group of species most
exported outside of the EU in 2015. However, its share fell from 20%
to 17% in value and from 39% to 36 % in volume.
After reaching a peak in 2014, extra-EU exports of mackerel declined
16% in value and 9% in volume in 2015, totalling 223.000 tonnes
with a value of EUR 264 million. Almost all mackerel was sold frozen,
mainly by the Netherlands and Ireland, which sold 46% and 24% of
the total, respectively. Nigeria was the main country of destination
for both EU suppliers. In 2015, it imported frozen mackerel from the
Netherlands at 1,23 EUR/kg and from Ireland at 1,27 EUR/kg, both
of which represented a 3% decrease compared with 2014.
Herring exports dropped as well, amounting to 215.000 tonnes and
EUR 178 million, which were decreases of 21% and 7%, respectively.
The Netherlands, home of the largest EU freezer trawler company
involved in pelagic fishing, accounted for 60% of total extra-EU
exports, with 129.000 tonnes valued at EUR 108 million. However,
this represented a plummet of almost 70.000 tonnes and EUR 17
million. Dutch exports of herring were mostly directed to Nigeria and
Egypt.
Horse mackerel was the only small pelagics species to register a value
growth between 2014 and 2015. Its extra-EU exports totalled EUR
167 million, which was a 5% increase over 2014. Volumes fell at the
same rate, reaching 147.500 tonnes. The Netherlands, Spain and
Ireland, the main exporting Member States, respectively covered
Small pelagics17%
Salmonids15%
Tuna and tuna-like species
13%Non food use
12%
Other marine fish8%
Crustaceans8%
Misc. aquatic products
7%
Groundfish7%
Flat fish6%
Bivalves3%
Cephalopods3%
Freshwater fish1%
Main commercial
species
Value
(million euro)
Mackerel 264
Herring 178
Horse mackerel 167
Anchovy 72
Sardine 54
Misc. small pelagics 35
Small pelagics36%
Non food use18%
Tuna and tuna-like species
13%
Groundfish8%
Salmonids6%
Misc. aquatic products
5%
Other marine fish5%
Crustaceans4%
Flat fish2%
Cephalopods1%
Bivalves1%
Freshwater fish1%
Main commercial
species
Volume
(1.000 tonnes)
Mackerel 223
Herring 215
Horse mackerel 148
Misc. small pelagics 33
Sardine 29
Sprat 26
Horse mackerel
Herring
Mackerel
Chart 55 EU exports by group of species
by volume (2015) Source: EUMOFA based on elaboration of EUROSTAT data
Chart 54 EU exports by group of species
by value (2015) Source: EUMOFA based on elaboration of EUROSTAT data
Small pelagics
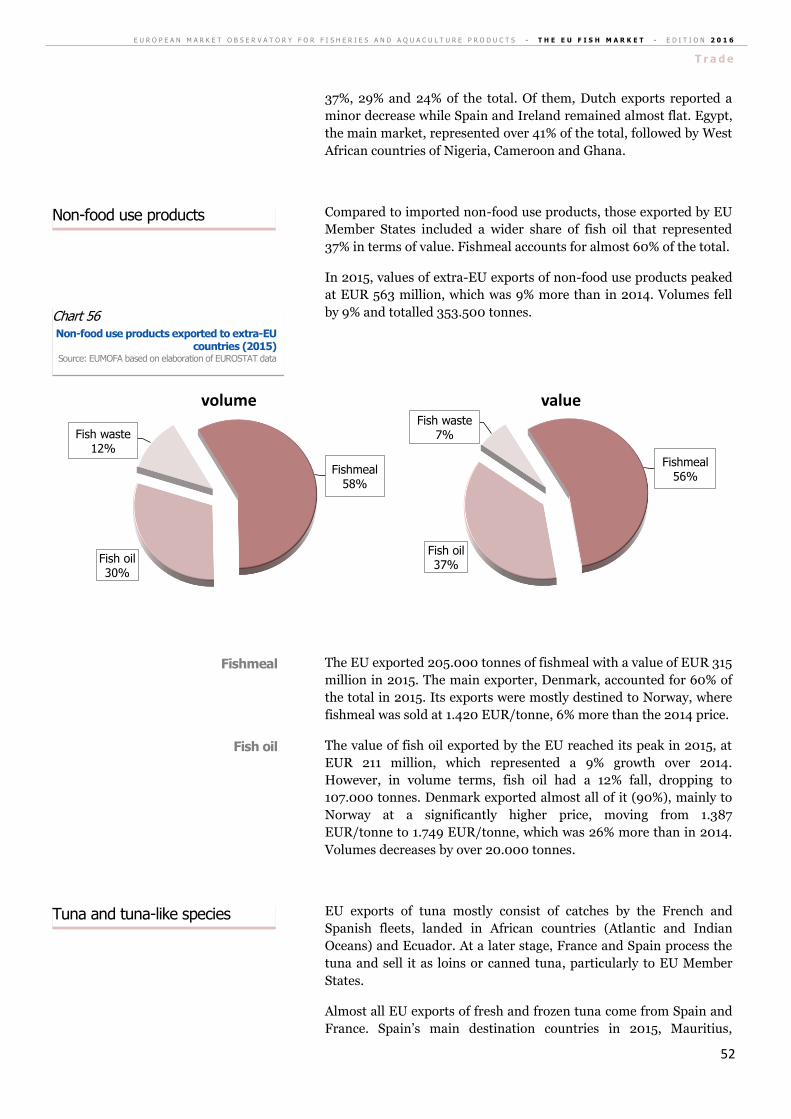
E U R O P E A N M A R K E T O B S E R V A T O R Y F O R F I S H E R I E S A N D A Q U A C U L T U R E P R O D U C T S - T H E E U F I S H M A R K E T - E D I T I O N 2 0 1 6
T r a d e
52
37%, 29% and 24% of the total. Of them, Dutch exports reported a
minor decrease while Spain and Ireland remained almost flat. Egypt,
the main market, represented over 41% of the total, followed by West
African countries of Nigeria, Cameroon and Ghana.
Compared to imported non-food use products, those exported by EU
Member States included a wider share of fish oil that represented
37% in terms of value. Fishmeal accounts for almost 60% of the total.
In 2015, values of extra-EU exports of non-food use products peaked
at EUR 563 million, which was 9% more than in 2014. Volumes fell
by 9% and totalled 353.500 tonnes.
The EU exported 205.000 tonnes of fishmeal with a value of EUR 315
million in 2015. The main exporter, Denmark, accounted for 60% of
the total in 2015. Its exports were mostly destined to Norway, where
fishmeal was sold at 1.420 EUR/tonne, 6% more than the 2014 price.
The value of fish oil exported by the EU reached its peak in 2015, at
EUR 211 million, which represented a 9% growth over 2014.
However, in volume terms, fish oil had a 12% fall, dropping to
107.000 tonnes. Denmark exported almost all of it (90%), mainly to
Norway at a significantly higher price, moving from 1.387
EUR/tonne to 1.749 EUR/tonne, which was 26% more than in 2014.
Volumes decreases by over 20.000 tonnes.
EU exports of tuna mostly consist of catches by the French and
Spanish fleets, landed in African countries (Atlantic and Indian
Oceans) and Ecuador. At a later stage, France and Spain process the
tuna and sell it as loins or canned tuna, particularly to EU Member
States.
Almost all EU exports of fresh and frozen tuna come from Spain and
France. Spain’s main destination countries in 2015, Mauritius,
Fishmeal58%
Fish oil30%
Fish waste12%
volume
Fishmeal56%
Fish oil37%
Fish waste7%
value
Tuna and tuna-like species
Fish oil
Fishmeal
Chart 56 Non-food use products exported to extra-EU
countries (2015) Source: EUMOFA based on elaboration of EUROSTAT data
Non-food use products

E U R O P E A N M A R K E T O B S E R V A T O R Y F O R F I S H E R I E S A N D A Q U A C U L T U R E P R O D U C T S - T H E E U F I S H M A R K E T - E D I T I O N 2 0 1 6
T r a d e
53
Ecuador and Seychelles, maintained the same relevance as in 2014.
On the other hand, French exports to Ghana skyrocketed, increasing
almost 5-fold during 2014-2015, while its exports to Thailand
decreased.
In 2015, exports of skipjack tuna totalled 134.000 tonnes worth EUR
178 million, reporting a remarkable 30% rise in value terms and
slight 3% decline in volume. It was sold almost entirely frozen. Spain
exported almost 100.000 tonnes of skipjack tuna at an average price
of 1,09 EUR/kg, which was 11% higher than the 2014 price. France
sold 28.000 tonnes at 1,04 EUR/kg, which was the same price as the
previous year.
Extra-EU exports of frozen yellowfin tuna stood flat with respect to
2014, at 84.000 tonnes worth EUR 133 million. Spain and France
accounted for 55.000 and 26.000 tonnes, respectively, with values of
EUR 79 million and EUR 44 million.
After a decade of growth, extra-EU exports of salmonids started to
decline in 2015, due to falling exports of salmon by the UK. The
export volume of 105.000 tonnes with a value of EUR 674 million
represented a drop of 13.000 tonnes and EUR 30 million from 2014
totals.
EU exports of salmon amounted to 86.000 tonnes with a value of
EUR 567 million, marking a significant EUR 33 million fall from
2014. The UK share, which was early three-fourths of the total in
2014, dropped to 63% in 2015. Its exports mostly consisted of fresh
salmon. The major extra-EU market, the United States, imported
32.000 tonnes at 7,42 EUR/kg in 2015, a price drop of 14% from
2014.
Smoked salmon accounts for 8% of the salmon exported by the EU,
but represents only 19% of the total value. The major exporters,
In 2015, salmonids’ exports to extra-EU countries started to decline, due to falling exports
from the UK
Salmon
Salmonids
Yellowfin tuna
Skipjack tuna
Chart 57 Export flows of frozen and fresh tuna
(volume, 2015) Source: EUMOFA based on elaboration of EUROSTAT
data
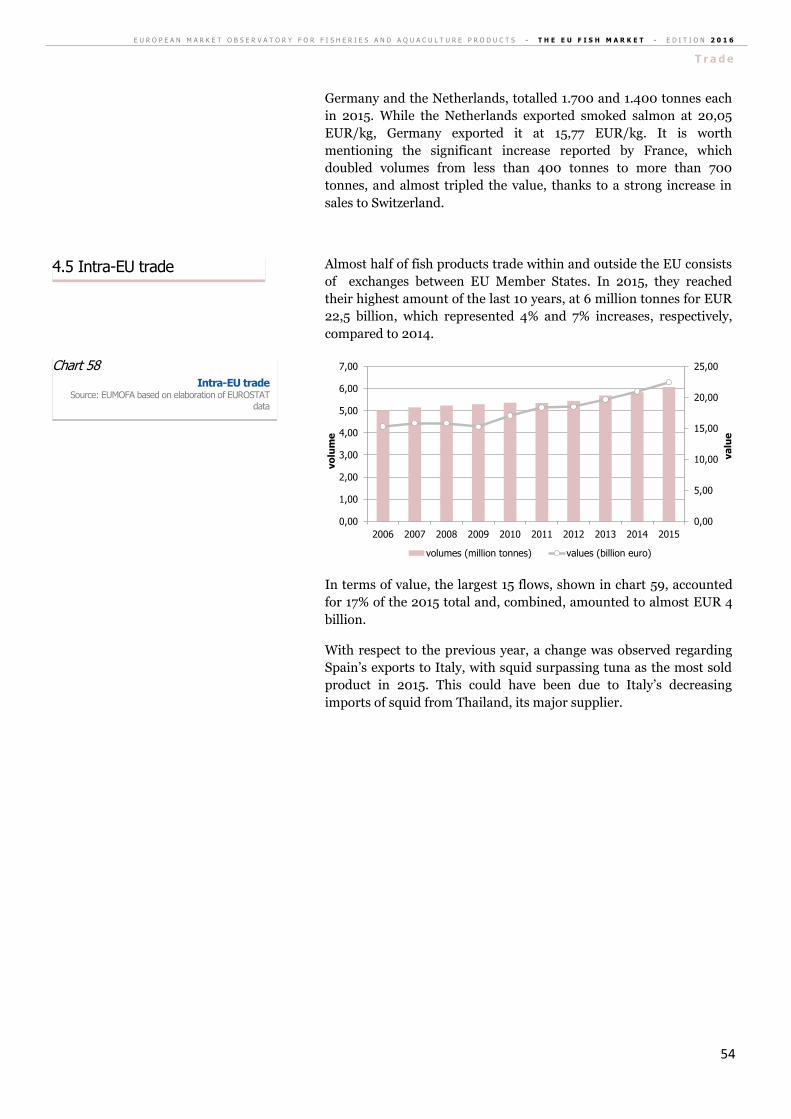
E U R O P E A N M A R K E T O B S E R V A T O R Y F O R F I S H E R I E S A N D A Q U A C U L T U R E P R O D U C T S - T H E E U F I S H M A R K E T - E D I T I O N 2 0 1 6
T r a d e
54
Germany and the Netherlands, totalled 1.700 and 1.400 tonnes each
in 2015. While the Netherlands exported smoked salmon at 20,05
EUR/kg, Germany exported it at 15,77 EUR/kg. It is worth
mentioning the significant increase reported by France, which
doubled volumes from less than 400 tonnes to more than 700
tonnes, and almost tripled the value, thanks to a strong increase in
sales to Switzerland.
Almost half of fish products trade within and outside the EU consists
of exchanges between EU Member States. In 2015, they reached
their highest amount of the last 10 years, at 6 million tonnes for EUR
22,5 billion, which represented 4% and 7% increases, respectively,
compared to 2014.
In terms of value, the largest 15 flows, shown in chart 59, accounted
for 17% of the 2015 total and, combined, amounted to almost EUR 4
billion.
With respect to the previous year, a change was observed regarding
Spain’s exports to Italy, with squid surpassing tuna as the most sold
product in 2015. This could have been due to Italy’s decreasing
imports of squid from Thailand, its major supplier.
0,00
5,00
10,00
15,00
20,00
25,00
0,00
1,00
2,00
3,00
4,00
5,00
6,00
7,00
2006 2007 2008 2009 2010 2011 2012 2013 2014 2015
va
lue
vo
lum
e
volumes (million tonnes) values (billion euro)
Chart 58 Intra-EU trade
Source: EUMOFA based on elaboration of EUROSTAT
data
4.5 Intra-EU trade

E U R O P E A N M A R K E T O B S E R V A T O R Y F O R F I S H E R I E S A N D A Q U A C U L T U R E P R O D U C T S - T H E E U F I S H M A R K E T - E D I T I O N 2 0 1 6
T r a d e
55
All species are exchanged within the EU.
At EUR 6,4 billion and over 1 million tonnes, salmonids reached their
10-year peak in 2015. Other relevant groups of species also reported
their highest amounts of intra-EU exchanges. For example,
groundfish accounted for almost 800.000 tonnes with a value of
EUR 3 billion, and small pelagics reached EUR 1,5 billion and 1
million tonnes.
Salmonids28%
Groundfish13%
Crustaceans13%
Other marine fish10%
Small pelagics7%
Tuna and tuna-like species
6%
Misc. aquatic products
6%
Bivalves4%
Cephalopods4%
Non food use4%
Flat fish3%
Freshwater fish2%
Chart 60 Intra-EU trade by commodity group
by value (2015) Source: EUMOFA based on elaboration of EUROSTAT
data
Chart 59 15 top flows within the EU in value (2015)
Source: EUMOFA based on elaboration of EUROSTAT data

E U R O P E A N M A R K E T O B S E R V A T O R Y F O R F I S H E R I E S A N D A Q U A C U L T U R E P R O D U C T S - T H E E U F I S H M A R K E T - E D I T I O N 2 0 1 6
T r a d e
56
Intra-EU exchanges of salmonids increased significantly between
2005 and 2015, with an average annual growth rate of 12%. They
almost entirely originate from Norway.
Salmon alone represents 25% of total intra-EU trade in value terms
and 15% in volume. In 2015, it accounted for 927.000 tonnes worth
EUR 5,7 billion, an increase of 72.000 tonnes and EUR 280 million.
Although volume was significantly higher than 2014, the resulting
price of 6,16 EUR/kg represented only a 3% decrease.
Of salmon traded within the EU, 80%, or 750.000 tonnes, was fresh.
In value terms, it totalled EUR 4 billion, but the share dropped to
70%, because of the market for smoked products, which totalled EUR
1,2 billion for 100.000 tonnes. Frozen salmon represented 8% of
total in both volume and value, at 76.000 tonnes and EUR 483
million.
Sweden, the main player, exported the majority of its salmon,
118.000 tonnes, to Poland at 4,89 EUR/kg. France, Sweden’s second
most important country of destination, received 92.00 tonnes of
salmon at 5,43 EUR/kg. France sends around one-third and Poland
sends almost half of their imported salmon to smoking industries.
Groundfish traded in the EU in 2015 reached peaks of 800.000
tonnes and EUR 3 billion. While this was a 5% increase in volume,
the value rose 15% over 2014, due to remarkable growth reported by
the Netherlands’ exports of cod.
The value of cod traded within the EU increased notably, registering
EUR 276 million more in 2015 than in 2014, with a decade peak of
EUR 1,8 billion. Of total value, 36% was traded frozen, 32%
dried/salted, 29% fresh and 3% prepared/preserved. All of the most
relevant players reported significant increases. For the Netherlands
Small pelagics19%
Salmonids17%
Groundfish13%
Non food use11%
Other marine fish9%
Misc. aquatic products8%
Tuna and tuna-like species
5%
Crustaceans5%
Bivalves5%
Cephalopods4%
Flat fish2%
Freshwater fish2%
Cod
Groundfish
Salmon
Salmonids
Chart 61 Intra-EU trade by commodity group
by volume (2015) Source: EUMOFA based on elaboration of EUROSTAT
data
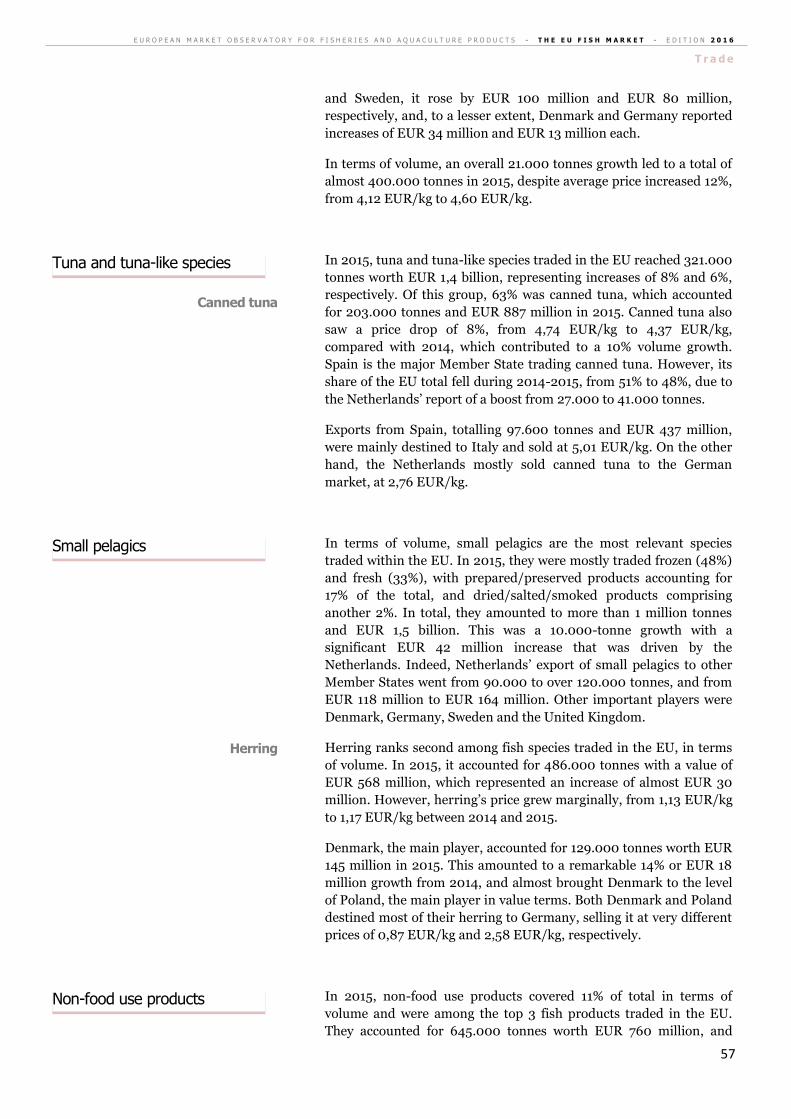
E U R O P E A N M A R K E T O B S E R V A T O R Y F O R F I S H E R I E S A N D A Q U A C U L T U R E P R O D U C T S - T H E E U F I S H M A R K E T - E D I T I O N 2 0 1 6
T r a d e
57
and Sweden, it rose by EUR 100 million and EUR 80 million,
respectively, and, to a lesser extent, Denmark and Germany reported
increases of EUR 34 million and EUR 13 million each.
In terms of volume, an overall 21.000 tonnes growth led to a total of
almost 400.000 tonnes in 2015, despite average price increased 12%,
from 4,12 EUR/kg to 4,60 EUR/kg.
In 2015, tuna and tuna-like species traded in the EU reached 321.000
tonnes worth EUR 1,4 billion, representing increases of 8% and 6%,
respectively. Of this group, 63% was canned tuna, which accounted
for 203.000 tonnes and EUR 887 million in 2015. Canned tuna also
saw a price drop of 8%, from 4,74 EUR/kg to 4,37 EUR/kg,
compared with 2014, which contributed to a 10% volume growth.
Spain is the major Member State trading canned tuna. However, its
share of the EU total fell during 2014-2015, from 51% to 48%, due to
the Netherlands’ report of a boost from 27.000 to 41.000 tonnes.
Exports from Spain, totalling 97.600 tonnes and EUR 437 million,
were mainly destined to Italy and sold at 5,01 EUR/kg. On the other
hand, the Netherlands mostly sold canned tuna to the German
market, at 2,76 EUR/kg.
In terms of volume, small pelagics are the most relevant species
traded within the EU. In 2015, they were mostly traded frozen (48%)
and fresh (33%), with prepared/preserved products accounting for
17% of the total, and dried/salted/smoked products comprising
another 2%. In total, they amounted to more than 1 million tonnes
and EUR 1,5 billion. This was a 10.000-tonne growth with a
significant EUR 42 million increase that was driven by the
Netherlands. Indeed, Netherlands’ export of small pelagics to other
Member States went from 90.000 to over 120.000 tonnes, and from
EUR 118 million to EUR 164 million. Other important players were
Denmark, Germany, Sweden and the United Kingdom.
Herring ranks second among fish species traded in the EU, in terms
of volume. In 2015, it accounted for 486.000 tonnes with a value of
EUR 568 million, which represented an increase of almost EUR 30
million. However, herring’s price grew marginally, from 1,13 EUR/kg
to 1,17 EUR/kg between 2014 and 2015.
Denmark, the main player, accounted for 129.000 tonnes worth EUR
145 million in 2015. This amounted to a remarkable 14% or EUR 18
million growth from 2014, and almost brought Denmark to the level
of Poland, the main player in value terms. Both Denmark and Poland
destined most of their herring to Germany, selling it at very different
prices of 0,87 EUR/kg and 2,58 EUR/kg, respectively.
In 2015, non-food use products covered 11% of total in terms of
volume and were among the top 3 fish products traded in the EU.
They accounted for 645.000 tonnes worth EUR 760 million, and
Non-food use products
Herring
Small pelagics
Canned tuna
Tuna and tuna-like species
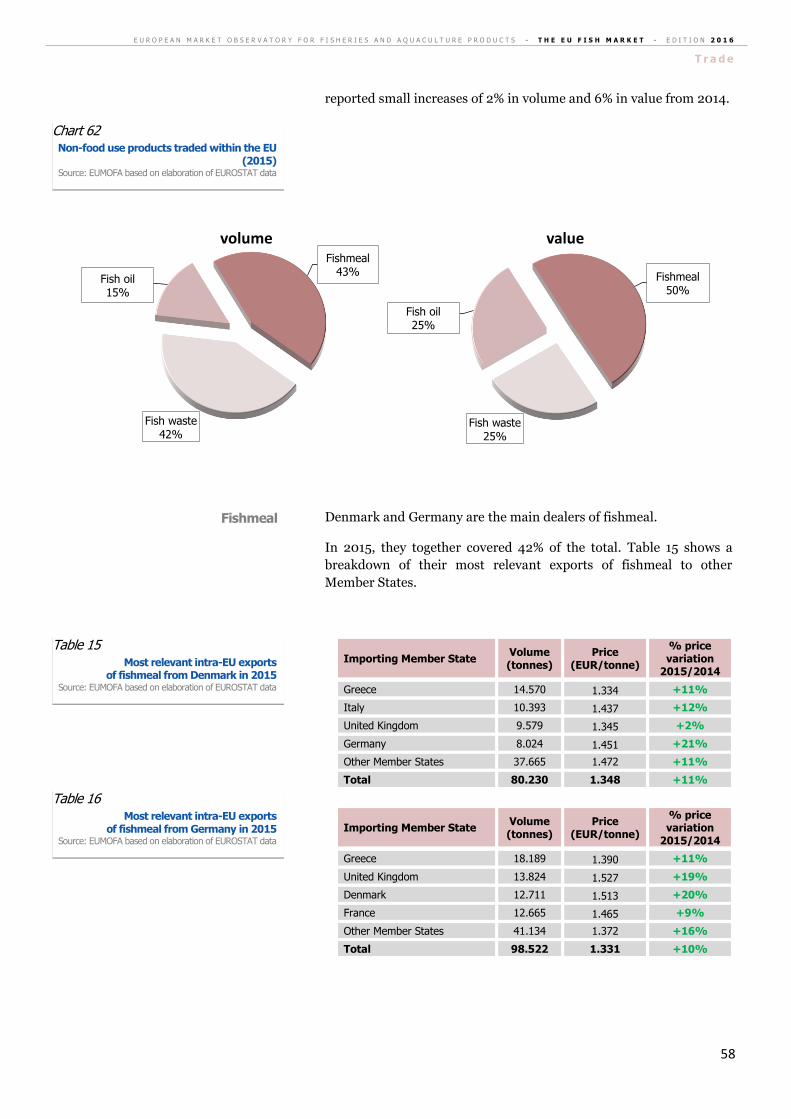
E U R O P E A N M A R K E T O B S E R V A T O R Y F O R F I S H E R I E S A N D A Q U A C U L T U R E P R O D U C T S - T H E E U F I S H M A R K E T - E D I T I O N 2 0 1 6
T r a d e
58
reported small increases of 2% in volume and 6% in value from 2014.
Denmark and Germany are the main dealers of fishmeal.
In 2015, they together covered 42% of the total. Table 15 shows a
breakdown of their most relevant exports of fishmeal to other
Member States.
Importing Member State Volume (tonnes)
Price (EUR/tonne)
% price variation
2015/2014
Greece 14.570 1.334 +11%
Italy 10.393 1.437 +12%
United Kingdom 9.579 1.345 +2%
Germany 8.024 1.451 +21%
Other Member States 37.665 1.472 +11%
Total 80.230 1.348 +11%
Importing Member State Volume (tonnes)
Price (EUR/tonne)
% price variation
2015/2014
Greece 18.189 1.390 +11%
United Kingdom 13.824 1.527 +19%
Denmark 12.711 1.513 +20%
France 12.665 1.465 +9%
Other Member States 41.134 1.372 +16%
Total 98.522 1.331 +10%
Fishmeal43%
Fish waste42%
Fish oil15%
volume
Fishmeal50%
Fish waste25%
Fish oil25%
value
Table 16 Most relevant intra-EU exports
of fishmeal from Germany in 2015 Source: EUMOFA based on elaboration of EUROSTAT data
Table 15 Most relevant intra-EU exports
of fishmeal from Denmark in 2015 Source: EUMOFA based on elaboration of EUROSTAT data
Fishmeal
Chart 62 Non-food use products traded within the EU
(2015) Source: EUMOFA based on elaboration of EUROSTAT data
E U R O P E A N M A R K E T O B S E R V A T O R Y F O R F I S H E R I E S A N D A Q U A C U L T U R E P R O D U C T S - T H E E U F I S H M A R K E T - E D I T I O N 2 0 1 6
T r a d e
59
Exchanges of crustaceans between EU Member States reached their
10-year value peak in 2015, totalling EUR 2,8 billion. This was a 6%
increase compared with 2014. Volume, which reached 319.000
tonnes, represented a 3% decrease.
Crustaceans traded within the EU are mostly represented by
miscellaneous shrimps, mostly comprising prepared/preserved and
frozen products. Total exchanges amounted to 113.000 tonnes in
2015, unchanged from 2014, but a 14% value increase brought the
total to EUR 1 billion. Denmark, the main player, traded 23.000
tonnes with a value of EUR 251 million, selling mainly to the United
Kingdom, Sweden, Germany and Italy.
Intra-EU trade of tropical shrimps remained almost flat during 2014-
2015, at 78.600 tonnes worth EUR 690 million. They were mostly
sold by the Netherlands (20.300 tonnes and EUR 181 million),
Belgium (17.600 tonnes and EUR 153 million) and Spain (16.700
tonnes and EUR 129 million). France, Germany and Portugal were
their main markets of destination, respectively.
Tropical shrimps
Miscellaneous shrimps
Crustaceans
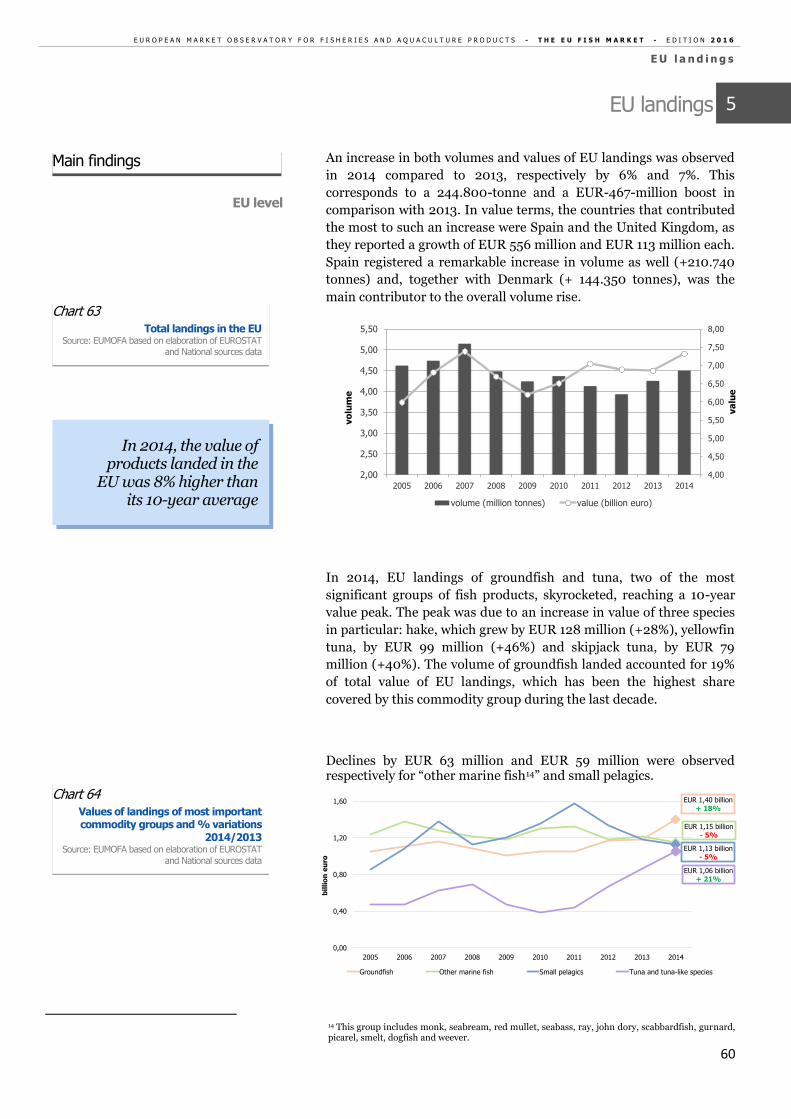
E U R O P E A N M A R K E T O B S E R V A T O R Y F O R F I S H E R I E S A N D A Q U A C U L T U R E P R O D U C T S - T H E E U F I S H M A R K E T - E D I T I O N 2 0 1 6
E U l a n d i n g s
60
EU landings
An increase in both volumes and values of EU landings was observed
in 2014 compared to 2013, respectively by 6% and 7%. This
corresponds to a 244.800-tonne and a EUR-467-million boost in
comparison with 2013. In value terms, the countries that contributed
the most to such an increase were Spain and the United Kingdom, as
they reported a growth of EUR 556 million and EUR 113 million each.
Spain registered a remarkable increase in volume as well (+210.740
tonnes) and, together with Denmark (+ 144.350 tonnes), was the
main contributor to the overall volume rise.
In 2014, EU landings of groundfish and tuna, two of the most
significant groups of fish products, skyrocketed, reaching a 10-year
value peak. The peak was due to an increase in value of three species
in particular: hake, which grew by EUR 128 million (+28%), yellowfin
tuna, by EUR 99 million (+46%) and skipjack tuna, by EUR 79
million (+40%). The volume of groundfish landed accounted for 19%
of total value of EU landings, which has been the highest share
covered by this commodity group during the last decade.
Declines by EUR 63 million and EUR 59 million were observed respectively for “other marine fish14” and small pelagics.
14 This group includes monk, seabream, red mullet, seabass, ray, john dory, scabbardfish, gurnard, picarel, smelt, dogfish and weever.
4,00
4,50
5,00
5,50
6,00
6,50
7,00
7,50
8,00
2,00
2,50
3,00
3,50
4,00
4,50
5,00
5,50
2005 2006 2007 2008 2009 2010 2011 2012 2013 2014
va
lue
vo
lum
e
volume (million tonnes) value (billion euro)
EUR 1,40 billion+ 18%
EUR 1,15 billion- 5%
EUR 1,13 billion- 5%
EUR 1,06 billion+ 21%
0,00
0,40
0,80
1,20
1,60
2005 2006 2007 2008 2009 2010 2011 2012 2013 2014
bil
lio
n e
uro
Groundfish Other marine fish Small pelagics Tuna and tuna-like species
Chart 64 Values of landings of most important commodity groups and % variations
2014/2013 Source: EUMOFA based on elaboration of EUROSTAT
and National sources data
In 2014, the value of products landed in the
EU was 8% higher than its 10-year average
Chart 63 Total landings in the EU
Source: EUMOFA based on elaboration of EUROSTAT and National sources data
EU level
Main findings
5
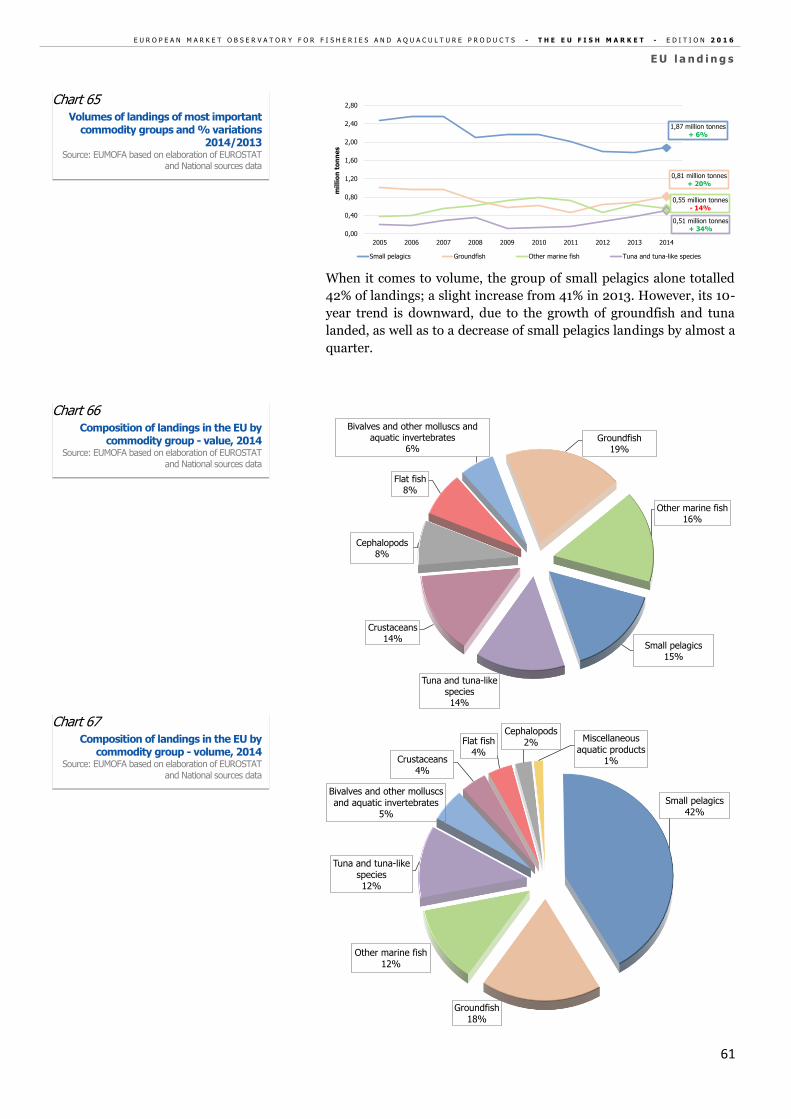
E U R O P E A N M A R K E T O B S E R V A T O R Y F O R F I S H E R I E S A N D A Q U A C U L T U R E P R O D U C T S - T H E E U F I S H M A R K E T - E D I T I O N 2 0 1 6
E U l a n d i n g s
61
When it comes to volume, the group of small pelagics alone totalled
42% of landings; a slight increase from 41% in 2013. However, its 10-
year trend is downward, due to the growth of groundfish and tuna
landed, as well as to a decrease of small pelagics landings by almost a
quarter.
1,87 million tonnes+ 6%
0,81 million tonnes+ 20%
0,55 million tonnes- 14%
0,51 million tonnes+ 34%
0,00
0,40
0,80
1,20
1,60
2,00
2,40
2,80
2005 2006 2007 2008 2009 2010 2011 2012 2013 2014
mil
lio
n t
on
ne
s
Small pelagics Groundfish Other marine fish Tuna and tuna-like species
Groundfish19%
Other marine fish16%
Small pelagics15%
Tuna and tuna-like species14%
Crustaceans14%
Cephalopods8%
Flat fish8%
Bivalves and other molluscs and aquatic invertebrates
6%
Small pelagics42%
Groundfish18%
Other marine fish12%
Tuna and tuna-like species12%
Bivalves and other molluscs and aquatic invertebrates
5%
Crustaceans4%
Flat fish4%
Cephalopods2% Miscellaneous
aquatic products1%
Chart 67 Composition of landings in the EU by
commodity group - volume, 2014 Source: EUMOFA based on elaboration of EUROSTAT
and National sources data
Chart 66 Composition of landings in the EU by
commodity group - value, 2014 Source: EUMOFA based on elaboration of EUROSTAT
and National sources data
Chart 65 Volumes of landings of most important
commodity groups and % variations 2014/2013
Source: EUMOFA based on elaboration of EUROSTAT and National sources data
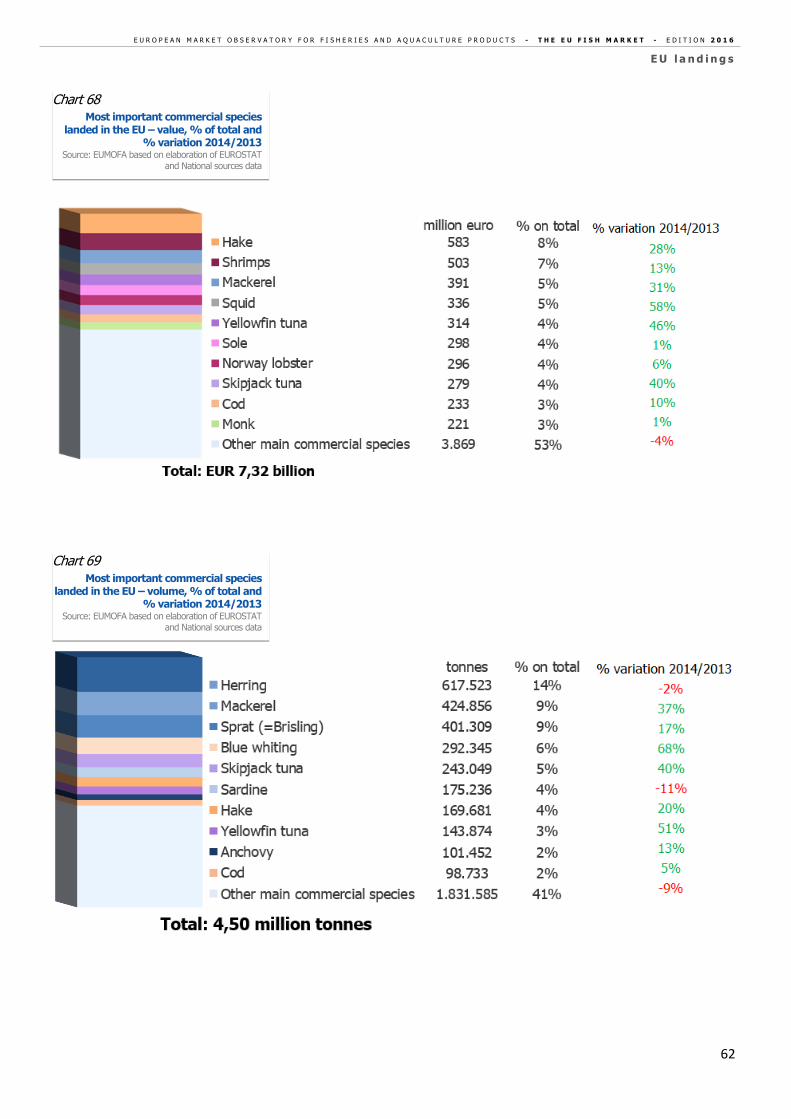
E U R O P E A N M A R K E T O B S E R V A T O R Y F O R F I S H E R I E S A N D A Q U A C U L T U R E P R O D U C T S - T H E E U F I S H M A R K E T - E D I T I O N 2 0 1 6
E U l a n d i n g s
62
Chart 69 Most important commercial species
landed in the EU – volume, % of total and % variation 2014/2013
Source: EUMOFA based on elaboration of EUROSTAT and National sources data
Chart 68 Most important commercial species
landed in the EU – value, % of total and % variation 2014/2013
Source: EUMOFA based on elaboration of EUROSTAT and National sources data
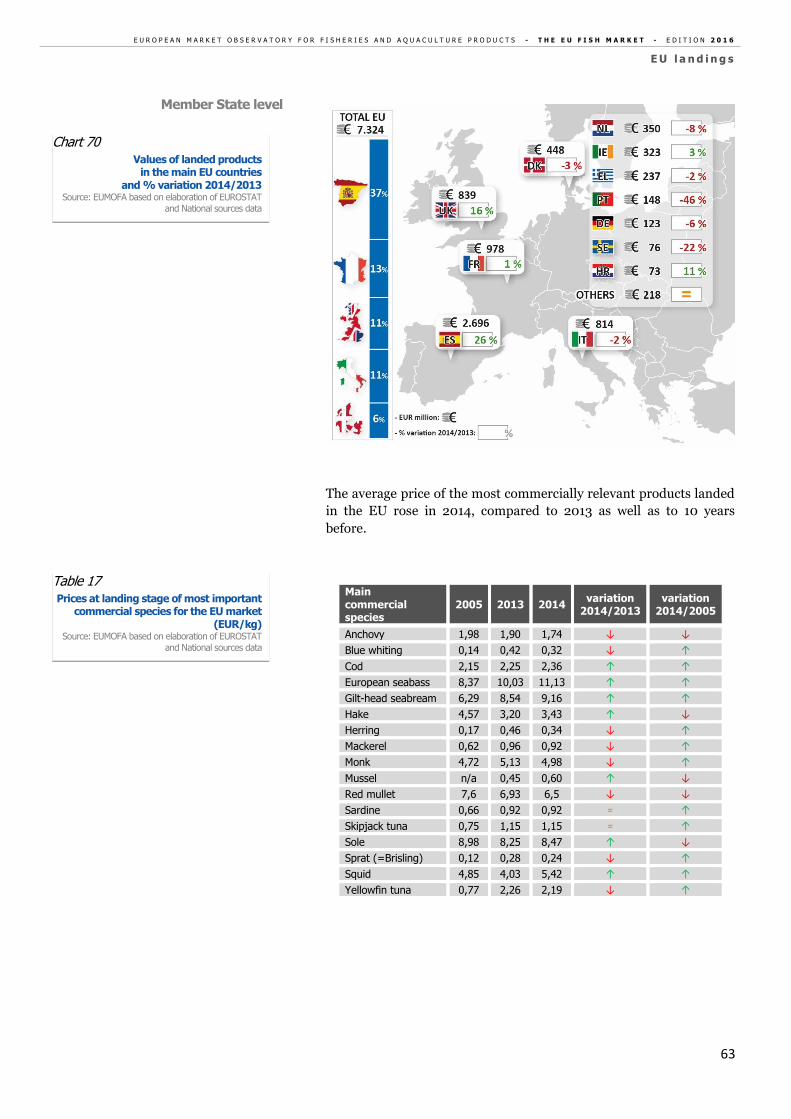
E U R O P E A N M A R K E T O B S E R V A T O R Y F O R F I S H E R I E S A N D A Q U A C U L T U R E P R O D U C T S - T H E E U F I S H M A R K E T - E D I T I O N 2 0 1 6
E U l a n d i n g s
63
The average price of the most commercially relevant products landed
in the EU rose in 2014, compared to 2013 as well as to 10 years
before.
Main commercial species
2005 2013 2014 variation
2014/2013 variation
2014/2005
Anchovy 1,98 1,90 1,74 ↓ ↓
Blue whiting 0,14 0,42 0,32 ↓ ↑
Cod 2,15 2,25 2,36 ↑ ↑
European seabass 8,37 10,03 11,13 ↑ ↑
Gilt-head seabream 6,29 8,54 9,16 ↑ ↑
Hake 4,57 3,20 3,43 ↑ ↓
Herring 0,17 0,46 0,34 ↓ ↑
Mackerel 0,62 0,96 0,92 ↓ ↑
Monk 4,72 5,13 4,98 ↓ ↑
Mussel n/a 0,45 0,60 ↑ ↓
Red mullet 7,6 6,93 6,5 ↓ ↓
Sardine 0,66 0,92 0,92 = ↑
Skipjack tuna 0,75 1,15 1,15 = ↑
Sole 8,98 8,25 8,47 ↑ ↓
Sprat (=Brisling) 0,12 0,28 0,24 ↓ ↑
Squid 4,85 4,03 5,42 ↑ ↑
Yellowfin tuna 0,77 2,26 2,19 ↓ ↑
Table 17 Prices at landing stage of most important
commercial species for the EU market (EUR/kg)
Source: EUMOFA based on elaboration of EUROSTAT
and National sources data
Chart 70 Values of landed products
in the main EU countries and % variation 2014/2013
Source: EUMOFA based on elaboration of EUROSTAT
and National sources data
Member State level
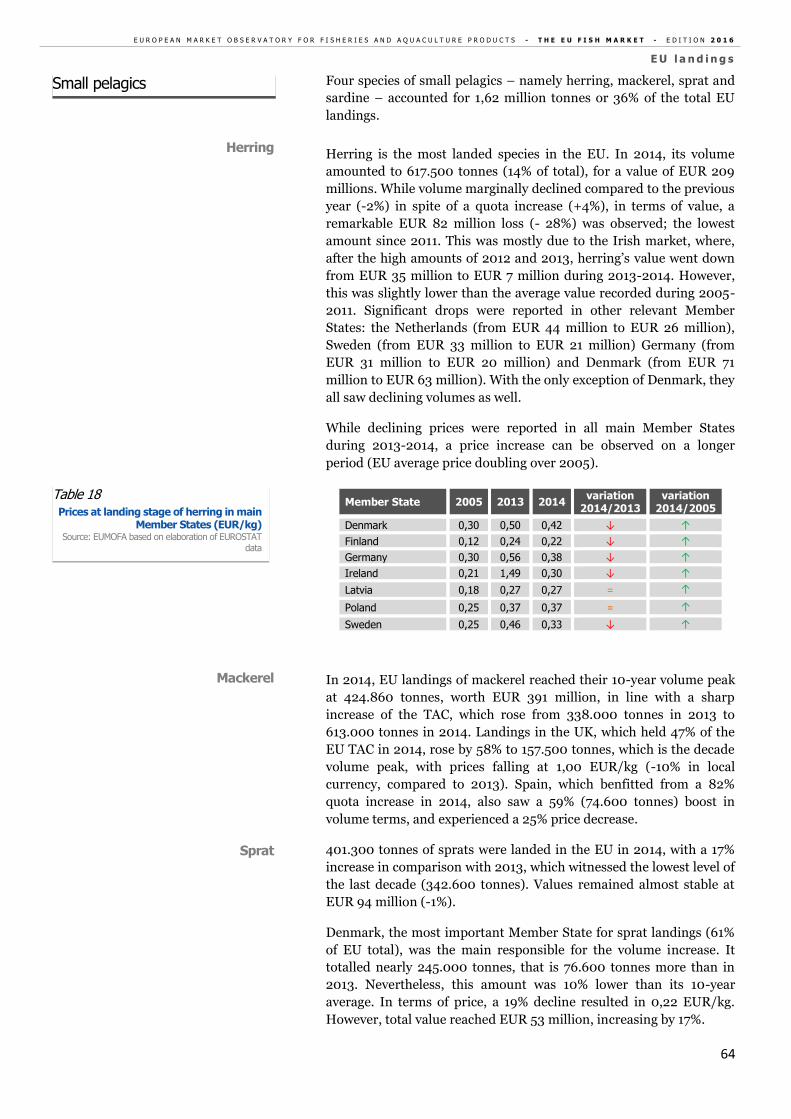
E U R O P E A N M A R K E T O B S E R V A T O R Y F O R F I S H E R I E S A N D A Q U A C U L T U R E P R O D U C T S - T H E E U F I S H M A R K E T - E D I T I O N 2 0 1 6
E U l a n d i n g s
64
Four species of small pelagics – namely herring, mackerel, sprat and
sardine – accounted for 1,62 million tonnes or 36% of the total EU
landings.
Herring is the most landed species in the EU. In 2014, its volume
amounted to 617.500 tonnes (14% of total), for a value of EUR 209
millions. While volume marginally declined compared to the previous
year (-2%) in spite of a quota increase (+4%), in terms of value, a
remarkable EUR 82 million loss (- 28%) was observed; the lowest
amount since 2011. This was mostly due to the Irish market, where,
after the high amounts of 2012 and 2013, herring’s value went down
from EUR 35 million to EUR 7 million during 2013-2014. However,
this was slightly lower than the average value recorded during 2005-
2011. Significant drops were reported in other relevant Member
States: the Netherlands (from EUR 44 million to EUR 26 million),
Sweden (from EUR 33 million to EUR 21 million) Germany (from
EUR 31 million to EUR 20 million) and Denmark (from EUR 71
million to EUR 63 million). With the only exception of Denmark, they
all saw declining volumes as well.
While declining prices were reported in all main Member States
during 2013-2014, a price increase can be observed on a longer
period (EU average price doubling over 2005).
Member State 2005 2013 2014 variation
2014/2013 variation
2014/2005
Denmark 0,30 0,50 0,42 ↓ ↑
Finland 0,12 0,24 0,22 ↓ ↑
Germany 0,30 0,56 0,38 ↓ ↑
Ireland 0,21 1,49 0,30 ↓ ↑
Latvia 0,18 0,27 0,27 = ↑
Poland 0,25 0,37 0,37 = ↑
Sweden 0,25 0,46 0,33 ↓ ↑
In 2014, EU landings of mackerel reached their 10-year volume peak
at 424.860 tonnes, worth EUR 391 million, in line with a sharp
increase of the TAC, which rose from 338.000 tonnes in 2013 to
613.000 tonnes in 2014. Landings in the UK, which held 47% of the
EU TAC in 2014, rose by 58% to 157.500 tonnes, which is the decade
volume peak, with prices falling at 1,00 EUR/kg (-10% in local
currency, compared to 2013). Spain, which benfitted from a 82%
quota increase in 2014, also saw a 59% (74.600 tonnes) boost in
volume terms, and experienced a 25% price decrease.
401.300 tonnes of sprats were landed in the EU in 2014, with a 17%
increase in comparison with 2013, which witnessed the lowest level of
the last decade (342.600 tonnes). Values remained almost stable at
EUR 94 million (-1%).
Denmark, the most important Member State for sprat landings (61%
of EU total), was the main responsible for the volume increase. It
totalled nearly 245.000 tonnes, that is 76.600 tonnes more than in
2013. Nevertheless, this amount was 10% lower than its 10-year
average. In terms of price, a 19% decline resulted in 0,22 EUR/kg.
However, total value reached EUR 53 million, increasing by 17%.
Sprat
Mackerel
Table 18 Prices at landing stage of herring in main
Member States (EUR/kg) Source: EUMOFA based on elaboration of EUROSTAT
data
Herring
Small pelagics
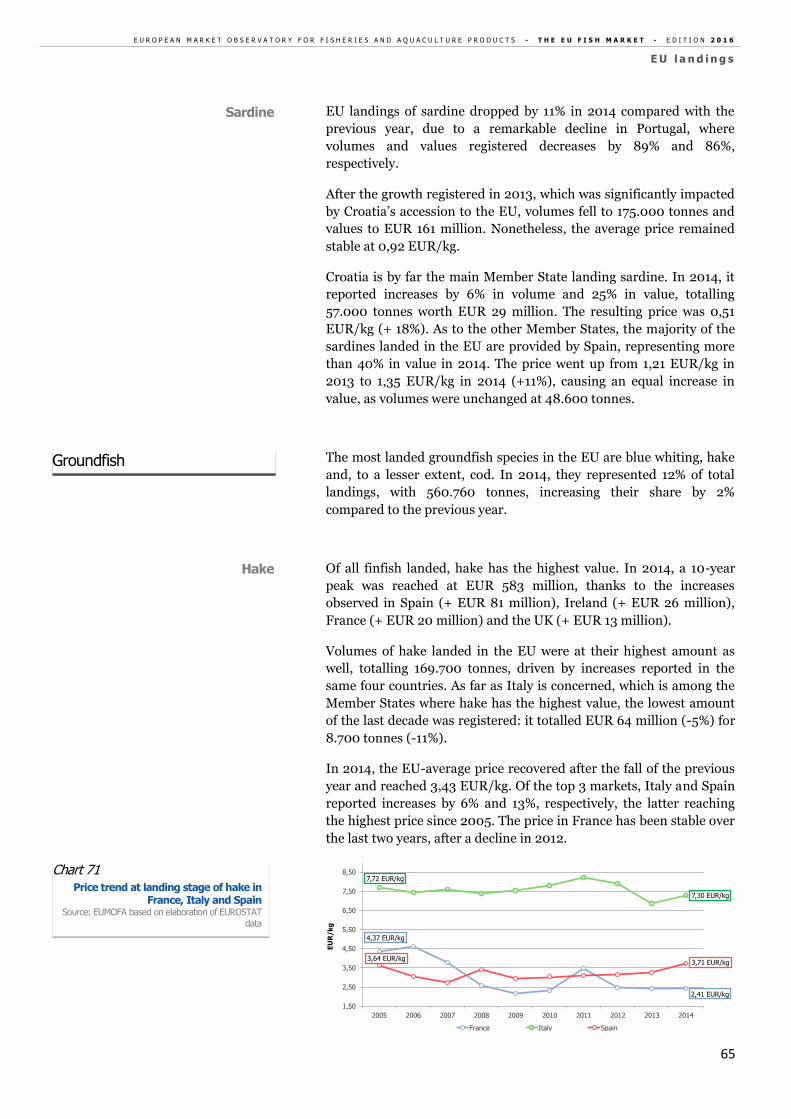
E U R O P E A N M A R K E T O B S E R V A T O R Y F O R F I S H E R I E S A N D A Q U A C U L T U R E P R O D U C T S - T H E E U F I S H M A R K E T - E D I T I O N 2 0 1 6
E U l a n d i n g s
65
EU landings of sardine dropped by 11% in 2014 compared with the
previous year, due to a remarkable decline in Portugal, where
volumes and values registered decreases by 89% and 86%,
respectively.
After the growth registered in 2013, which was significantly impacted
by Croatia’s accession to the EU, volumes fell to 175.000 tonnes and
values to EUR 161 million. Nonetheless, the average price remained
stable at 0,92 EUR/kg.
Croatia is by far the main Member State landing sardine. In 2014, it
reported increases by 6% in volume and 25% in value, totalling
57.000 tonnes worth EUR 29 million. The resulting price was 0,51
EUR/kg (+ 18%). As to the other Member States, the majority of the
sardines landed in the EU are provided by Spain, representing more
than 40% in value in 2014. The price went up from 1,21 EUR/kg in
2013 to 1,35 EUR/kg in 2014 (+11%), causing an equal increase in
value, as volumes were unchanged at 48.600 tonnes.
The most landed groundfish species in the EU are blue whiting, hake
and, to a lesser extent, cod. In 2014, they represented 12% of total
landings, with 560.760 tonnes, increasing their share by 2%
compared to the previous year.
Of all finfish landed, hake has the highest value. In 2014, a 10-year
peak was reached at EUR 583 million, thanks to the increases
observed in Spain (+ EUR 81 million), Ireland (+ EUR 26 million),
France (+ EUR 20 million) and the UK (+ EUR 13 million).
Volumes of hake landed in the EU were at their highest amount as
well, totalling 169.700 tonnes, driven by increases reported in the
same four countries. As far as Italy is concerned, which is among the
Member States where hake has the highest value, the lowest amount
of the last decade was registered: it totalled EUR 64 million (-5%) for
8.700 tonnes (-11%).
In 2014, the EU-average price recovered after the fall of the previous
year and reached 3,43 EUR/kg. Of the top 3 markets, Italy and Spain
reported increases by 6% and 13%, respectively, the latter reaching
the highest price since 2005. The price in France has been stable over
the last two years, after a decline in 2012.
4,37 EUR/kg
2,41 EUR/kg
7,72 EUR/kg
7,30 EUR/kg
3,64 EUR/kg3,71 EUR/kg
1,50
2,50
3,50
4,50
5,50
6,50
7,50
8,50
2005 2006 2007 2008 2009 2010 2011 2012 2013 2014
EU
R/k
g
France Italy Spain
Hake
Chart 71 Price trend at landing stage of hake in
France, Italy and Spain Source: EUMOFA based on elaboration of EUROSTAT
data
Groundfish
Sardine
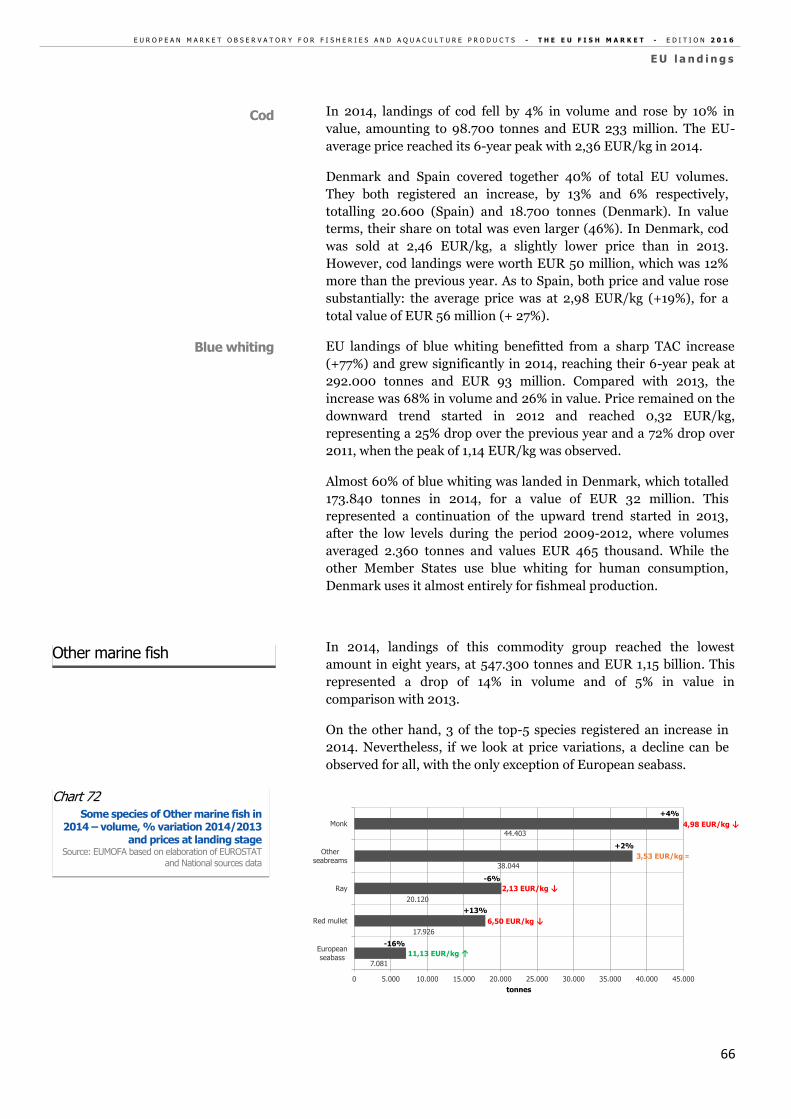
E U R O P E A N M A R K E T O B S E R V A T O R Y F O R F I S H E R I E S A N D A Q U A C U L T U R E P R O D U C T S - T H E E U F I S H M A R K E T - E D I T I O N 2 0 1 6
E U l a n d i n g s
66
In 2014, landings of cod fell by 4% in volume and rose by 10% in
value, amounting to 98.700 tonnes and EUR 233 million. The EU-
average price reached its 6-year peak with 2,36 EUR/kg in 2014.
Denmark and Spain covered together 40% of total EU volumes.
They both registered an increase, by 13% and 6% respectively,
totalling 20.600 (Spain) and 18.700 tonnes (Denmark). In value
terms, their share on total was even larger (46%). In Denmark, cod
was sold at 2,46 EUR/kg, a slightly lower price than in 2013.
However, cod landings were worth EUR 50 million, which was 12%
more than the previous year. As to Spain, both price and value rose
substantially: the average price was at 2,98 EUR/kg (+19%), for a
total value of EUR 56 million (+ 27%).
EU landings of blue whiting benefitted from a sharp TAC increase
(+77%) and grew significantly in 2014, reaching their 6-year peak at
292.000 tonnes and EUR 93 million. Compared with 2013, the
increase was 68% in volume and 26% in value. Price remained on the
downward trend started in 2012 and reached 0,32 EUR/kg,
representing a 25% drop over the previous year and a 72% drop over
2011, when the peak of 1,14 EUR/kg was observed.
Almost 60% of blue whiting was landed in Denmark, which totalled
173.840 tonnes in 2014, for a value of EUR 32 million. This
represented a continuation of the upward trend started in 2013,
after the low levels during the period 2009-2012, where volumes
averaged 2.360 tonnes and values EUR 465 thousand. While the
other Member States use blue whiting for human consumption,
Denmark uses it almost entirely for fishmeal production.
In 2014, landings of this commodity group reached the lowest
amount in eight years, at 547.300 tonnes and EUR 1,15 billion. This
represented a drop of 14% in volume and of 5% in value in
comparison with 2013.
On the other hand, 3 of the top-5 species registered an increase in
2014. Nevertheless, if we look at price variations, a decline can be
observed for all, with the only exception of European seabass.
7.081
17.926
20.120
38.044
44.403
0 5.000 10.000 15.000 20.000 25.000 30.000 35.000 40.000 45.000
Europeanseabass
Red mullet
Ray
Otherseabreams
Monk
tonnes
4,98 EUR/kg ↓
3,53 EUR/kg =
2,13 EUR/kg ↓
6,50 EUR/kg ↓
11,13 EUR/kg ↑
+4%
+2%
-6%
+13%
-16%
Cod
Blue whiting
Other marine fish
Chart 72 Some species of Other marine fish in
2014 – volume, % variation 2014/2013 and prices at landing stage
Source: EUMOFA based on elaboration of EUROSTAT
and National sources data
E U R O P E A N M A R K E T O B S E R V A T O R Y F O R F I S H E R I E S A N D A Q U A C U L T U R E P R O D U C T S - T H E E U F I S H M A R K E T - E D I T I O N 2 0 1 6
E U l a n d i n g s
67
Landings of monk increased by 4% in volume and by 1% in value,
totalling 44.403 tonnes and EUR 221 million.
France is the Member State where most of monk is landed,
representing 44% of the EU total. In 2014, French landings amounted
to 19.600 tonnes worth EUR 95 million, with volume and value
slightly declining in comparison with the previous year.
The growth at EU level was caused by the rise registered in Ireland,
where, after the 2013-drop, landings of monk totalled 5.500 tonnes,
for a value of EUR 22 million, both increasing by 66%. The increase
was due to a higher number of landings from French and Spanish
vessels.
In 2014, landings of ray were at their lowest level of the last decade.
They totalled almost 20.000 tonnes worth EUR 42 million, which
resulted drops by 7% and 10%, respectively in volume and value. The
responsible for this drop was the 57% decline that occurred in
Portugal between 2013 and 2014, with volumes plunging from 2.372
to 1.000 tonnes and values decreasing from EUR 4 million to EUR
2,5 million.
The most significant Member States were France and Spain, landing
6.570 and 6.400 tonnes of rays respectively, in 2015. While in France
ray was sold at 2,19 EUR/kg, the price in Spain was 1,93 EUR/kg,
both declining compared to 2013. The EU-average price was at 2,10
EUR/kg, 4% lower than in 2013. However, still slightly above its 10-
year average.
The main Member State landing European seabass is France,
covering 64% of total volumes and 67% of total values in 2014. The
drop observed in this country in 2014 triggered the one registered at
EU level. European seabass landed in the EU amounted to around
7.000 tonnes (-16%) and EUR 79 million (-6%).
Nevertheless, a 11% increase was registered in the EU-average price,
from 10,03 to 11,13 EUR/kg. This reflected the trend in France, where
the price rose from 10,35 to 11,64 EUR/kg (+12%).
In 2014, the tuna landed in the EU reached its 10-year peak at
513.000 tonnes, and over EUR 1 billion, continuing the upward trend
started in 2011.
Skipjack and yellowfin tuna are the most landed species of this group,
representing 75% of the 2014 total. However, in value terms, their
share on total was lower (56%). By including swordfish, the
percentage grows to 76%, as this tuna-like species is one of the
highest valued.
EU landings of skipjack tuna totalled 243.000 tonnes and were worth
EUR 279 million in 2014. This was a 40% boost in both volume and
value, consisting of 69.350 tonnes and EUR 79 million more than in
2013. These represented also the peaks of the 2005-2014 decade.
Monk
Ray
European seabass
Tuna and tuna-like species
Skipjack tuna
E U R O P E A N M A R K E T O B S E R V A T O R Y F O R F I S H E R I E S A N D A Q U A C U L T U R E P R O D U C T S - T H E E U F I S H M A R K E T - E D I T I O N 2 0 1 6
E U l a n d i n g s
68
Almost all (99%) skipjack tuna landed in EU ports was landed in
Spain, at 1,15 EUR/kg. Lower amounts were landed in Portugal, i.e.
2.000 tonnes sold at 1,24 EUR/kg, and France, where 25 tonnes were
sold at 0,41 EUR/kg.
Spain also happened to be the EU Member State where almost all
yellowfin tuna is landed (99,7% of 2014 total). With 143.470 tonnes
worth EUR 313 million, the 10-year peaks were reached in 2014,
marking a remarkable growth by 49.000 tonnes and EUR 99 million
in comparison with 2013. The average price fell, albeit slightly (-3%),
going down from 2,26 to 2,18 EUR/kg. In this case too, France and
Portugal followed suit, the first reporting 341 tonnes sold at 3,93
EUR/kg, the latter 60 tonnes sold at 3,74 EUR/kg.
EU landings of swordfish amounted to 34.000 tonnes and EUR 211
million. These represented 10-year peaks in both volume and value.
Compared with 2013, while volumes increased marginally (+1%), the
growth in value was 7%. Spain is the Member State where swordfish
is landed the most. It accounted to 27.000 tonnes and EUR 151
million, the highest amounts of the last decade. It was sold at 5,57
EUR/kg, 6% increasing in comparison with 2013.
Yellowfin tuna
Swordfish
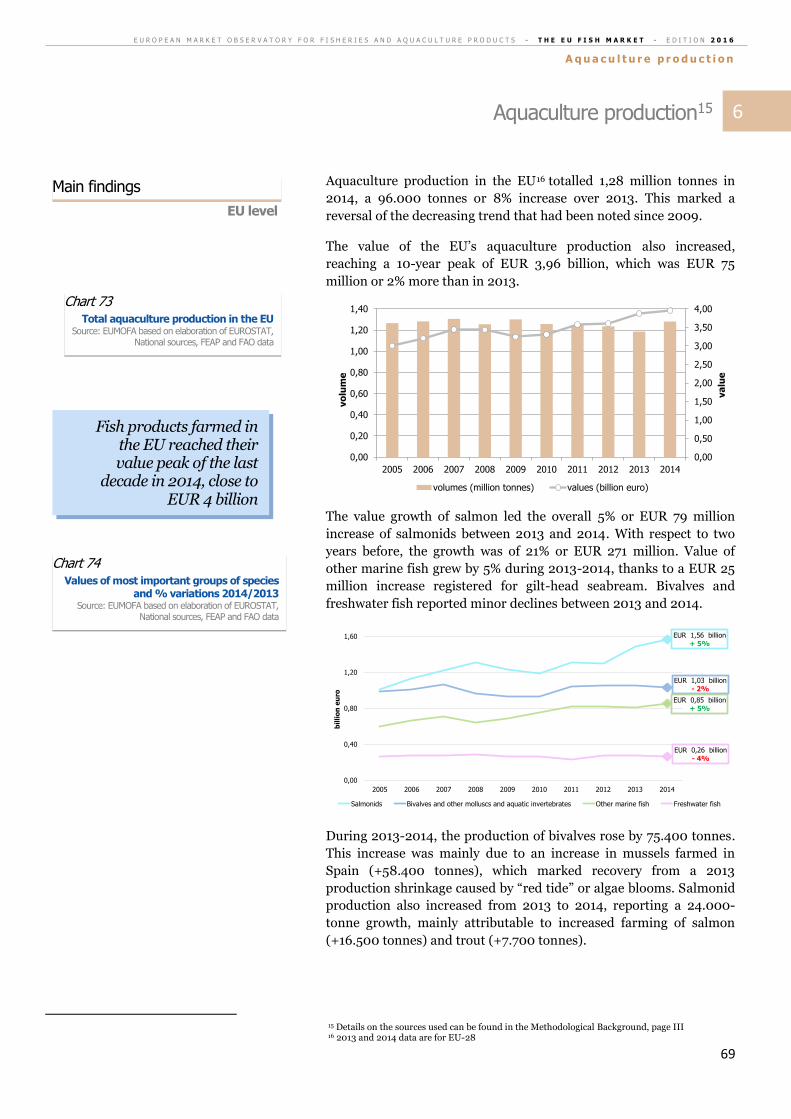
E U R O P E A N M A R K E T O B S E R V A T O R Y F O R F I S H E R I E S A N D A Q U A C U L T U R E P R O D U C T S - T H E E U F I S H M A R K E T - E D I T I O N 2 0 1 6
A q u a c u l t u r e p r o d u c t i o n
69
Aquaculture production15
Aquaculture production in the EU16 totalled 1,28 million tonnes in
2014, a 96.000 tonnes or 8% increase over 2013. This marked a
reversal of the decreasing trend that had been noted since 2009.
The value of the EU’s aquaculture production also increased,
reaching a 10-year peak of EUR 3,96 billion, which was EUR 75
million or 2% more than in 2013.
The value growth of salmon led the overall 5% or EUR 79 million
increase of salmonids between 2013 and 2014. With respect to two
years before, the growth was of 21% or EUR 271 million. Value of
other marine fish grew by 5% during 2013-2014, thanks to a EUR 25
million increase registered for gilt-head seabream. Bivalves and
freshwater fish reported minor declines between 2013 and 2014.
During 2013-2014, the production of bivalves rose by 75.400 tonnes.
This increase was mainly due to an increase in mussels farmed in
Spain (+58.400 tonnes), which marked recovery from a 2013
production shrinkage caused by “red tide” or algae blooms. Salmonid
production also increased from 2013 to 2014, reporting a 24.000-
tonne growth, mainly attributable to increased farming of salmon
(+16.500 tonnes) and trout (+7.700 tonnes).
15 Details on the sources used can be found in the Methodological Background, page III 16 2013 and 2014 data are for EU-28
0,00
0,50
1,00
1,50
2,00
2,50
3,00
3,50
4,00
0,00
0,20
0,40
0,60
0,80
1,00
1,20
1,40
2005 2006 2007 2008 2009 2010 2011 2012 2013 2014
va
lue
vo
lum
e
volumes (million tonnes) values (billion euro)
EUR 1,56 billion+ 5%
EUR 1,03 billion- 2%
EUR 0,85 billion+ 5%
EUR 0,26 billion- 4%
0,00
0,40
0,80
1,20
1,60
2005 2006 2007 2008 2009 2010 2011 2012 2013 2014
bil
lio
n e
uro
Salmonids Bivalves and other molluscs and aquatic invertebrates Other marine fish Freshwater fish
Chart 74 Values of most important groups of species
and % variations 2014/2013 Source: EUMOFA based on elaboration of EUROSTAT,
National sources, FEAP and FAO data
Fish products farmed in the EU reached their value peak of the last
decade in 2014, close to EUR 4 billion
Chart 73 Total aquaculture production in the EU
Source: EUMOFA based on elaboration of EUROSTAT, National sources, FEAP and FAO data
EU level
Main findings
6
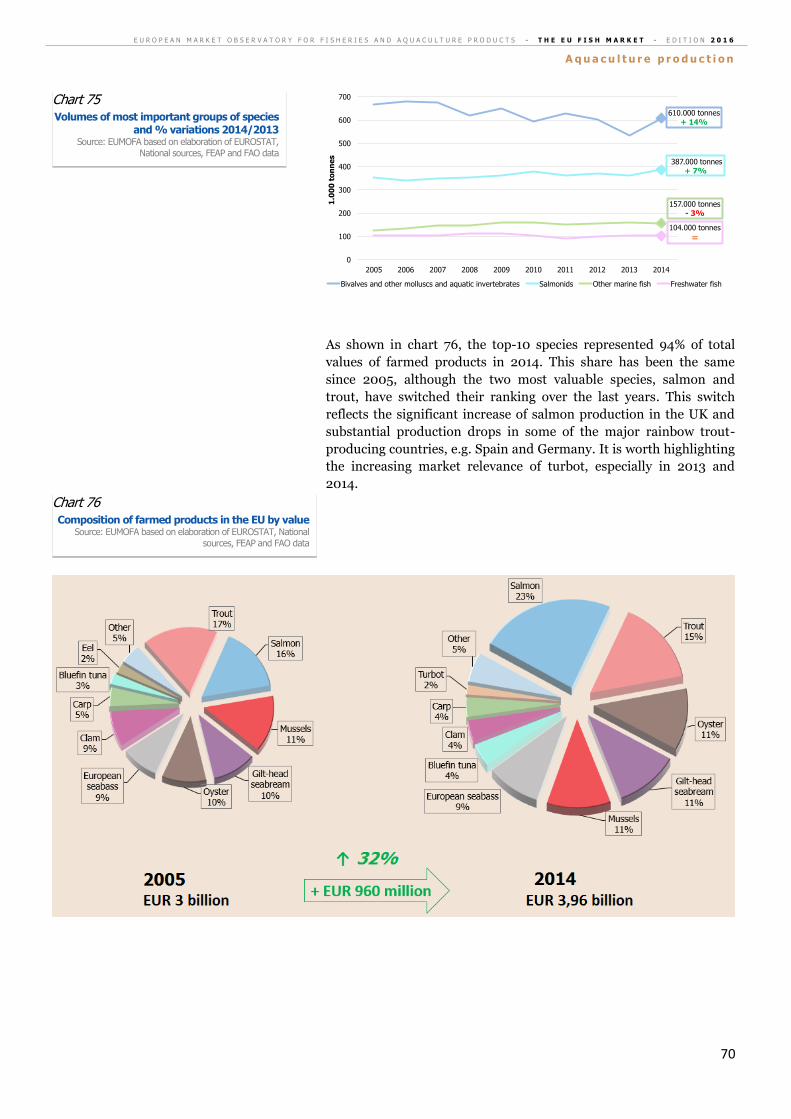
E U R O P E A N M A R K E T O B S E R V A T O R Y F O R F I S H E R I E S A N D A Q U A C U L T U R E P R O D U C T S - T H E E U F I S H M A R K E T - E D I T I O N 2 0 1 6
A q u a c u l t u r e p r o d u c t i o n
70
As shown in chart 76, the top-10 species represented 94% of total
values of farmed products in 2014. This share has been the same
since 2005, although the two most valuable species, salmon and
trout, have switched their ranking over the last years. This switch
reflects the significant increase of salmon production in the UK and
substantial production drops in some of the major rainbow trout-
producing countries, e.g. Spain and Germany. It is worth highlighting
the increasing market relevance of turbot, especially in 2013 and
2014.
610.000 tonnes + 14%
387.000 tonnes+ 7%
157.000 tonnes- 3%
104.000 tonnes
=
0
100
200
300
400
500
600
700
2005 2006 2007 2008 2009 2010 2011 2012 2013 2014
1.0
00
to
nn
es
Bivalves and other molluscs and aquatic invertebrates Salmonids Other marine fish Freshwater fish
Chart 76 Composition of farmed products in the EU by value
Source: EUMOFA based on elaboration of EUROSTAT, National
sources, FEAP and FAO data
Chart 75 Volumes of most important groups of species
and % variations 2014/2013 Source: EUMOFA based on elaboration of EUROSTAT,
National sources, FEAP and FAO data
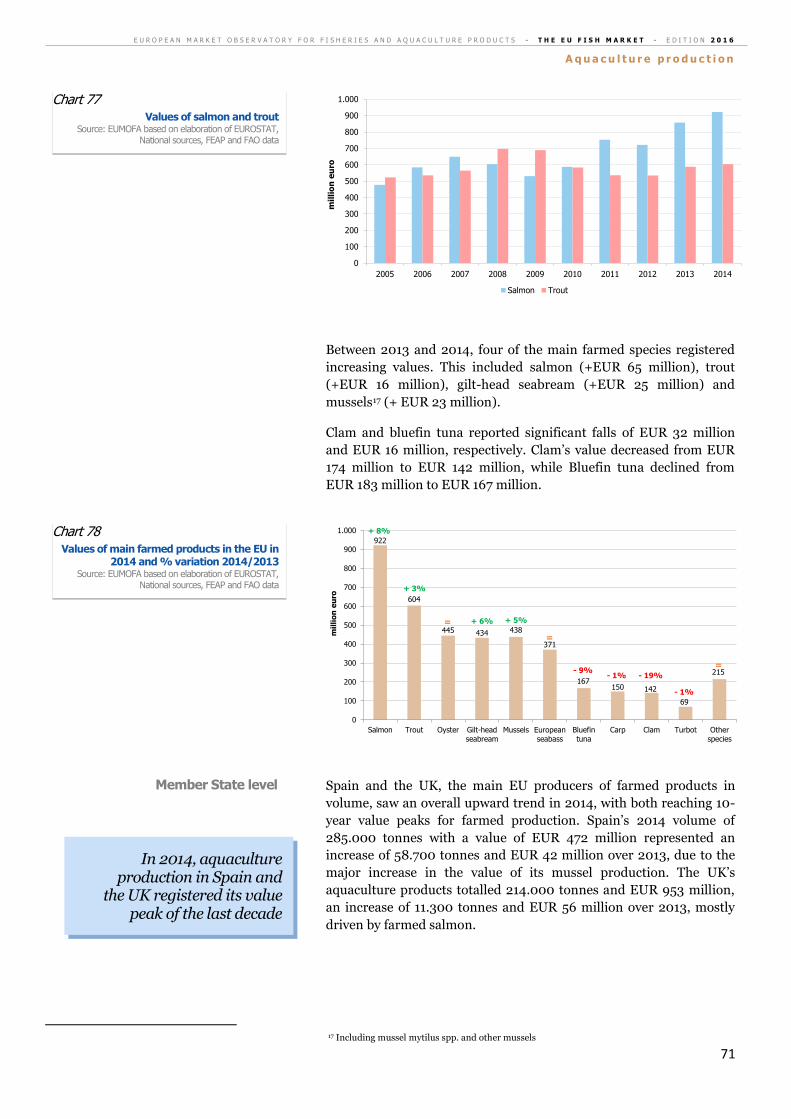
E U R O P E A N M A R K E T O B S E R V A T O R Y F O R F I S H E R I E S A N D A Q U A C U L T U R E P R O D U C T S - T H E E U F I S H M A R K E T - E D I T I O N 2 0 1 6
A q u a c u l t u r e p r o d u c t i o n
71
Between 2013 and 2014, four of the main farmed species registered
increasing values. This included salmon (+EUR 65 million), trout
(+EUR 16 million), gilt-head seabream (+EUR 25 million) and
mussels17 (+ EUR 23 million).
Clam and bluefin tuna reported significant falls of EUR 32 million
and EUR 16 million, respectively. Clam’s value decreased from EUR
174 million to EUR 142 million, while Bluefin tuna declined from
EUR 183 million to EUR 167 million.
Spain and the UK, the main EU producers of farmed products in
volume, saw an overall upward trend in 2014, with both reaching 10-
year value peaks for farmed production. Spain’s 2014 volume of
285.000 tonnes with a value of EUR 472 million represented an
increase of 58.700 tonnes and EUR 42 million over 2013, due to the
major increase in the value of its mussel production. The UK’s
aquaculture products totalled 214.000 tonnes and EUR 953 million,
an increase of 11.300 tonnes and EUR 56 million over 2013, mostly
driven by farmed salmon.
17 Including mussel mytilus spp. and other mussels
0
100
200
300
400
500
600
700
800
900
1.000
2005 2006 2007 2008 2009 2010 2011 2012 2013 2014
mil
lio
n e
uro
Salmon Trout
922
604
445 434 438
371
167150 142
69
215
0
100
200
300
400
500
600
700
800
900
1.000
Salmon Trout Oyster Gilt-headseabream
Mussels Europeanseabass
Bluefintuna
Carp Clam Turbot Otherspecies
mil
lio
n e
uro
+ 8%
+ 3%
+ 6% + 5%
- 9%- 1% - 19%
- 1%
=
=
=
In 2014, aquaculture production in Spain and
the UK registered its value peak of the last decade
Chart 78 Values of main farmed products in the EU in
2014 and % variation 2014/2013 Source: EUMOFA based on elaboration of EUROSTAT,
National sources, FEAP and FAO data
Chart 77 Values of salmon and trout
Source: EUMOFA based on elaboration of EUROSTAT, National sources, FEAP and FAO data
Member State level
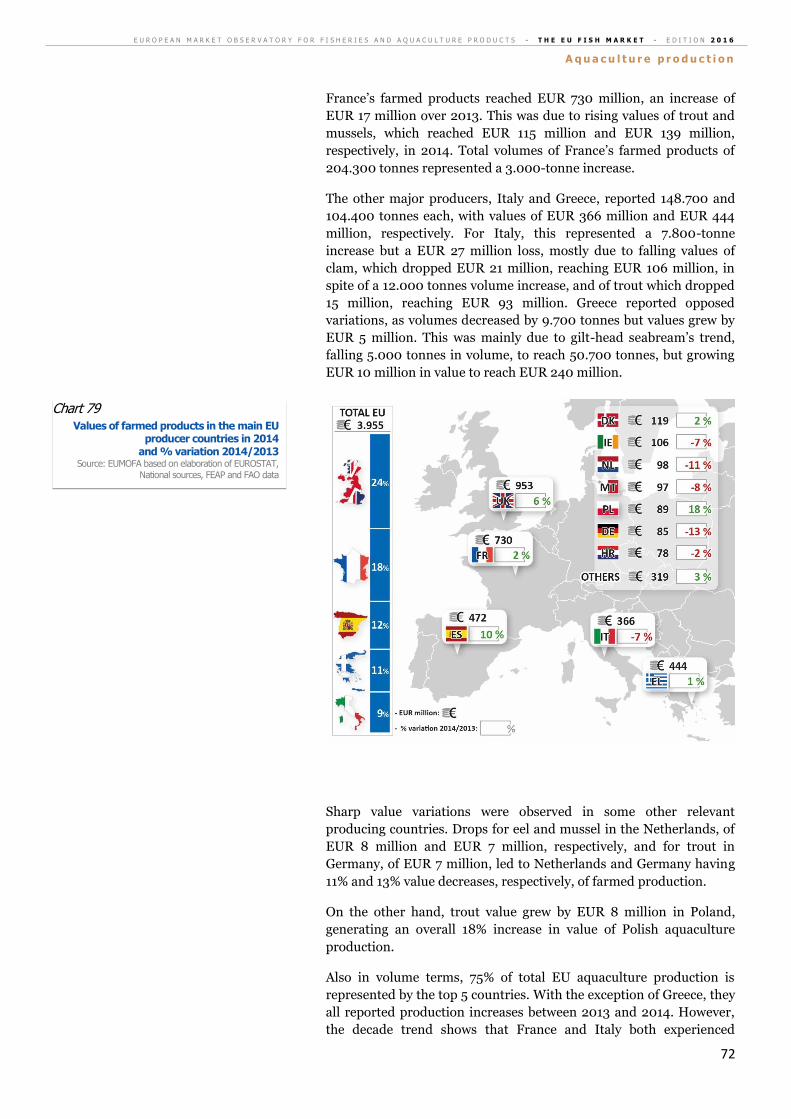
E U R O P E A N M A R K E T O B S E R V A T O R Y F O R F I S H E R I E S A N D A Q U A C U L T U R E P R O D U C T S - T H E E U F I S H M A R K E T - E D I T I O N 2 0 1 6
A q u a c u l t u r e p r o d u c t i o n
72
France’s farmed products reached EUR 730 million, an increase of
EUR 17 million over 2013. This was due to rising values of trout and
mussels, which reached EUR 115 million and EUR 139 million,
respectively, in 2014. Total volumes of France’s farmed products of
204.300 tonnes represented a 3.000-tonne increase.
The other major producers, Italy and Greece, reported 148.700 and
104.400 tonnes each, with values of EUR 366 million and EUR 444
million, respectively. For Italy, this represented a 7.800-tonne
increase but a EUR 27 million loss, mostly due to falling values of
clam, which dropped EUR 21 million, reaching EUR 106 million, in
spite of a 12.000 tonnes volume increase, and of trout which dropped
15 million, reaching EUR 93 million. Greece reported opposed
variations, as volumes decreased by 9.700 tonnes but values grew by
EUR 5 million. This was mainly due to gilt-head seabream’s trend,
falling 5.000 tonnes in volume, to reach 50.700 tonnes, but growing
EUR 10 million in value to reach EUR 240 million.
Sharp value variations were observed in some other relevant
producing countries. Drops for eel and mussel in the Netherlands, of
EUR 8 million and EUR 7 million, respectively, and for trout in
Germany, of EUR 7 million, led to Netherlands and Germany having
11% and 13% value decreases, respectively, of farmed production.
On the other hand, trout value grew by EUR 8 million in Poland,
generating an overall 18% increase in value of Polish aquaculture
production.
Also in volume terms, 75% of total EU aquaculture production is
represented by the top 5 countries. With the exception of Greece, they
all reported production increases between 2013 and 2014. However,
the decade trend shows that France and Italy both experienced
Chart 79 Values of farmed products in the main EU
producer countries in 2014 and % variation 2014/2013
Source: EUMOFA based on elaboration of EUROSTAT,
National sources, FEAP and FAO data
E U R O P E A N M A R K E T O B S E R V A T O R Y F O R F I S H E R I E S A N D A Q U A C U L T U R E P R O D U C T S - T H E E U F I S H M A R K E T - E D I T I O N 2 0 1 6
A q u a c u l t u r e p r o d u c t i o n
73
remarkable drops of 41.000 tonnes and 32.000 tonnes, respectively,
mainly due to production shrinkage of oyster and clam.
Member State 2005 2013 2014 %
variation 2014/2013
% variation
2014/2005
Spain 221 226 285 +26% +29%
United Kingdom 173 203 215 +6% +24%
France 245 201 204 +1% -17%
Italy 181 141 149 +6% -18%
Greece 106 114 104 -8% -2%
In 2014, EU production of bivalves increased 14%, reaching 609.600
tonnes. However, its value of EUR 1 billion was slightly lower than in
2013.
The value of farmed mussels reached a 10-year peak of EUR 438
million, an increase of EUR 23 million compared with 2013. Mussel
volume reached 475.000 tonnes, totalling 68.000 tonnes more than
2013.
EU growth was driven by Spain, the major producer, which had its
highest ever production in 2014, reaching 220.450 tonnes with a
value of EUR 110 million. This was a significant 38% rise over 2013,
when “red tide” or algae blooms caused production to drop.
However, price remained basically the same, moving from 0,49 in
2013 to 0,50 EUR/kg in 2014. Dutch mussel price fell a dramatic
38%, from 1,96 to 1,22 EUR/kg. The price drop was in response to its
great increase in volume – from 37.100 to 54.100 tonnes – which
brought it back to 2010 price levels, when production also far
exceeded the 50.000-tonne mark. Prices grew in other relevant
countries, namely France and Italy, with France seeing a slight 4%
increase, from 1,78 to 1,85 EUR/kg, and Italy observing a 13%
growth, from 0,69 to 0,78 EUR/kg, while production volumes
remained almost stable in both countries.
Oyster value reached EUR 445 million for 91.500 tonnes in 2014,
representing over 40% of total bivalve value. In volume terms, it was
the lowest amount registered in the last decade. The price of 4,86
EUR/kg was 33% above the 10-year average but stable compared
with the previous year (+0,8%).
The production shrinkage at EU level was due to the decrease
observed in France, the main producer, which had a fall of almost
3.000 tonnes in 2013. In fact, after a decrease of more than 40.000
tonnes due to a virus which caused mass mortality in juveniles at the
end of the years 2000, the French production was then hit by a
bacteria which caused mortality in several basins during the summer
of 2013. The 2013-2014 volumes presented a slight decrease, but this
did not have much impact on the price, which moved from 5,02 to
Oyster
Mussel
Bivalves and other molluscs and
aquatic invertebrates
Table 19 Volumes of farmed products in EU top 5
producer countries (1.000 tonnes) in 2005, 2013 and 2014
and % variation 2014/2013 and 2014/2005 Source: EUMOFA based on elaboration of EUROSTAT,
National sources and FEAP data
E U R O P E A N M A R K E T O B S E R V A T O R Y F O R F I S H E R I E S A N D A Q U A C U L T U R E P R O D U C T S - T H E E U F I S H M A R K E T - E D I T I O N 2 0 1 6
A q u a c u l t u r e p r o d u c t i o n
74
5,07 EUR/kg. However, this price is triple the price paid 15 years ago
(1,65 EUR/kg in 2000), when the production volume was 136.000
tonnes (against less than 77.000 tonnes in 2014).
Oyster prices skyrocketed in the Netherlands, generating a EUR 4
million increase, mainly based on the value of Dutch cupped oysters.
Member State 2013 2014 % variation 2014/2013
France 5,02 5,07 +1%
Ireland 4,62 4,63 =
Netherlands 1,26 2,36 +88%
United Kingdom 3,85 3,21 -17%
Portugal 2,53 2,59 +3%
Spain 4,05 4,01 -1%
In 2014, clam volumes increased by 11.000 tonnes, to reach 41.000
tonnes and EUR 142 million.
Clam’s EU average price reached its lowest level of the last ten years
in 2014, at 3,46 EUR/kg. This was a 41% drop from the 2013 price of
5,82 EUR/kg.
Italy, the main producer representing 89% of total, drove this
phenomenon. In 2014, the price fell by 44% to 2,91 EUR/kg and
values declined by over EUR 21 million. In volume terms, Italy
experienced a 12.000-tonne recovery from the 2013 22% fall that had
been generated by changes in the environmental conditions,
especially when excessive entry of fresh water led to a decline in the
salinity of the clam development and growing area.
Salmonids were responsible for EU aquaculture production reaching
its value peak in 2014 when their volume reached 387.000 tonnes
with a value of EUR 1,56 billion. This represented 39% of the value of
all products farmed.
More specifically, the value of salmon farmed in the UK led the
overall increase observed for salmonids and, in turn, led the value of
EU aquaculture production. As shown in chart 80, its values have
been rising an average of 14% a year since 2009. In 2014, volumes
were at 179.400 tonnes for a value of EUR 861 million. The 5,6 kg
mean weight at harvest was the highest ever, and its price of 4,80
EUR/kg was only slightly less than the 4,89 EUR/kg reached in
2013, which was the highest price of the last decade. Production of
organic salmon fell by 31% to 3.600 tonnes. Ireland’s salmon
production marginally improved after a 20% fall in 2013, reaching
9.400 tonnes of mostly organic salmon with a value of EUR 58
million in 2014.
Salmon
Salmonids
Clam
Table 20 Prices of oyster in main producer countries
(EUR/kg) Source: EUMOFA based on elaboration of EUROSTAT,
National sources and FEAP data
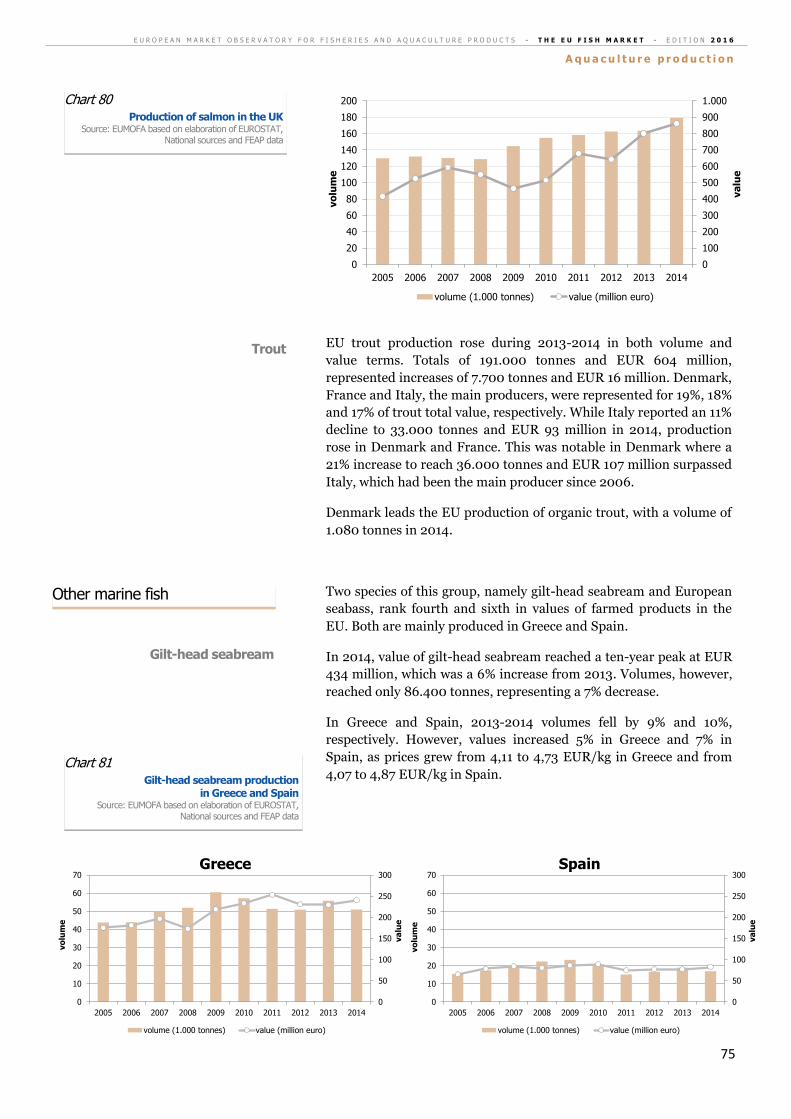
E U R O P E A N M A R K E T O B S E R V A T O R Y F O R F I S H E R I E S A N D A Q U A C U L T U R E P R O D U C T S - T H E E U F I S H M A R K E T - E D I T I O N 2 0 1 6
A q u a c u l t u r e p r o d u c t i o n
75
EU trout production rose during 2013-2014 in both volume and
value terms. Totals of 191.000 tonnes and EUR 604 million,
represented increases of 7.700 tonnes and EUR 16 million. Denmark,
France and Italy, the main producers, were represented for 19%, 18%
and 17% of trout total value, respectively. While Italy reported an 11%
decline to 33.000 tonnes and EUR 93 million in 2014, production
rose in Denmark and France. This was notable in Denmark where a
21% increase to reach 36.000 tonnes and EUR 107 million surpassed
Italy, which had been the main producer since 2006.
Denmark leads the EU production of organic trout, with a volume of
1.080 tonnes in 2014.
Two species of this group, namely gilt-head seabream and European
seabass, rank fourth and sixth in values of farmed products in the
EU. Both are mainly produced in Greece and Spain.
In 2014, value of gilt-head seabream reached a ten-year peak at EUR
434 million, which was a 6% increase from 2013. Volumes, however,
reached only 86.400 tonnes, representing a 7% decrease.
In Greece and Spain, 2013-2014 volumes fell by 9% and 10%,
respectively. However, values increased 5% in Greece and 7% in
Spain, as prices grew from 4,11 to 4,73 EUR/kg in Greece and from
4,07 to 4,87 EUR/kg in Spain.
0
100
200
300
400
500
600
700
800
900
1.000
0
20
40
60
80
100
120
140
160
180
200
2005 2006 2007 2008 2009 2010 2011 2012 2013 2014
va
lue
vo
lum
e
volume (1.000 tonnes) value (million euro)
0
50
100
150
200
250
300
0
10
20
30
40
50
60
70
2005 2006 2007 2008 2009 2010 2011 2012 2013 2014
va
lue
vo
lum
e
Greece
volume (1.000 tonnes) value (million euro)
0
50
100
150
200
250
300
0
10
20
30
40
50
60
70
2005 2006 2007 2008 2009 2010 2011 2012 2013 2014
va
lue
vo
lum
e
Spain
volume (1.000 tonnes) value (million euro)
Chart 81 Gilt-head seabream production
in Greece and Spain Source: EUMOFA based on elaboration of EUROSTAT,
National sources and FEAP data
Gilt-head seabream
Other marine fish
Trout
Chart 80 Production of salmon in the UK
Source: EUMOFA based on elaboration of EUROSTAT, National sources and FEAP data
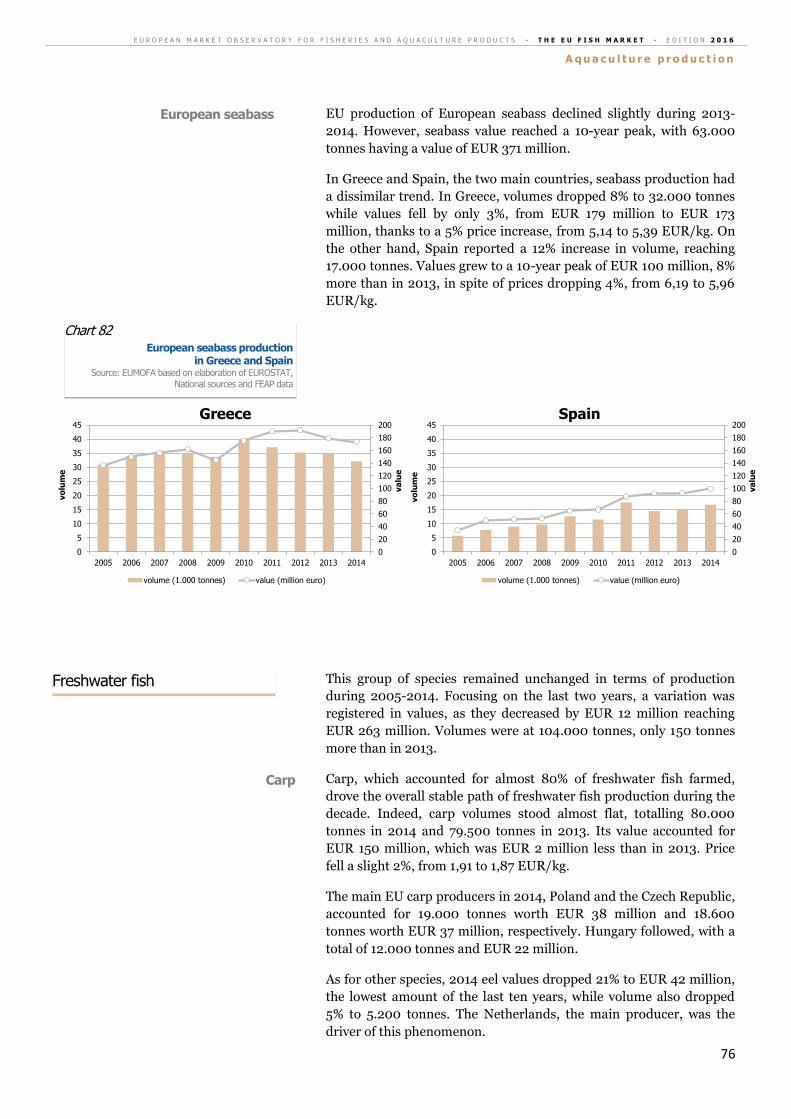
E U R O P E A N M A R K E T O B S E R V A T O R Y F O R F I S H E R I E S A N D A Q U A C U L T U R E P R O D U C T S - T H E E U F I S H M A R K E T - E D I T I O N 2 0 1 6
A q u a c u l t u r e p r o d u c t i o n
76
EU production of European seabass declined slightly during 2013-
2014. However, seabass value reached a 10-year peak, with 63.000
tonnes having a value of EUR 371 million.
In Greece and Spain, the two main countries, seabass production had
a dissimilar trend. In Greece, volumes dropped 8% to 32.000 tonnes
while values fell by only 3%, from EUR 179 million to EUR 173
million, thanks to a 5% price increase, from 5,14 to 5,39 EUR/kg. On
the other hand, Spain reported a 12% increase in volume, reaching
17.000 tonnes. Values grew to a 10-year peak of EUR 100 million, 8%
more than in 2013, in spite of prices dropping 4%, from 6,19 to 5,96
EUR/kg.
This group of species remained unchanged in terms of production
during 2005-2014. Focusing on the last two years, a variation was
registered in values, as they decreased by EUR 12 million reaching
EUR 263 million. Volumes were at 104.000 tonnes, only 150 tonnes
more than in 2013.
Carp, which accounted for almost 80% of freshwater fish farmed,
drove the overall stable path of freshwater fish production during the
decade. Indeed, carp volumes stood almost flat, totalling 80.000
tonnes in 2014 and 79.500 tonnes in 2013. Its value accounted for
EUR 150 million, which was EUR 2 million less than in 2013. Price
fell a slight 2%, from 1,91 to 1,87 EUR/kg.
The main EU carp producers in 2014, Poland and the Czech Republic,
accounted for 19.000 tonnes worth EUR 38 million and 18.600
tonnes worth EUR 37 million, respectively. Hungary followed, with a
total of 12.000 tonnes and EUR 22 million.
As for other species, 2014 eel values dropped 21% to EUR 42 million,
the lowest amount of the last ten years, while volume also dropped
5% to 5.200 tonnes. The Netherlands, the main producer, was the
driver of this phenomenon.
0
20
40
60
80
100
120
140
160
180
200
0
5
10
15
20
25
30
35
40
45
2005 2006 2007 2008 2009 2010 2011 2012 2013 2014
va
lue
vo
lum
e
Greece
volume (1.000 tonnes) value (million euro)
0
20
40
60
80
100
120
140
160
180
200
0
5
10
15
20
25
30
35
40
45
2005 2006 2007 2008 2009 2010 2011 2012 2013 2014
va
lue
vo
lum
eSpain
volume (1.000 tonnes) value (million euro)
Carp
Freshwater fish
Chart 82 European seabass production
in Greece and Spain Source: EUMOFA based on elaboration of EUROSTAT,
National sources and FEAP data
European seabass
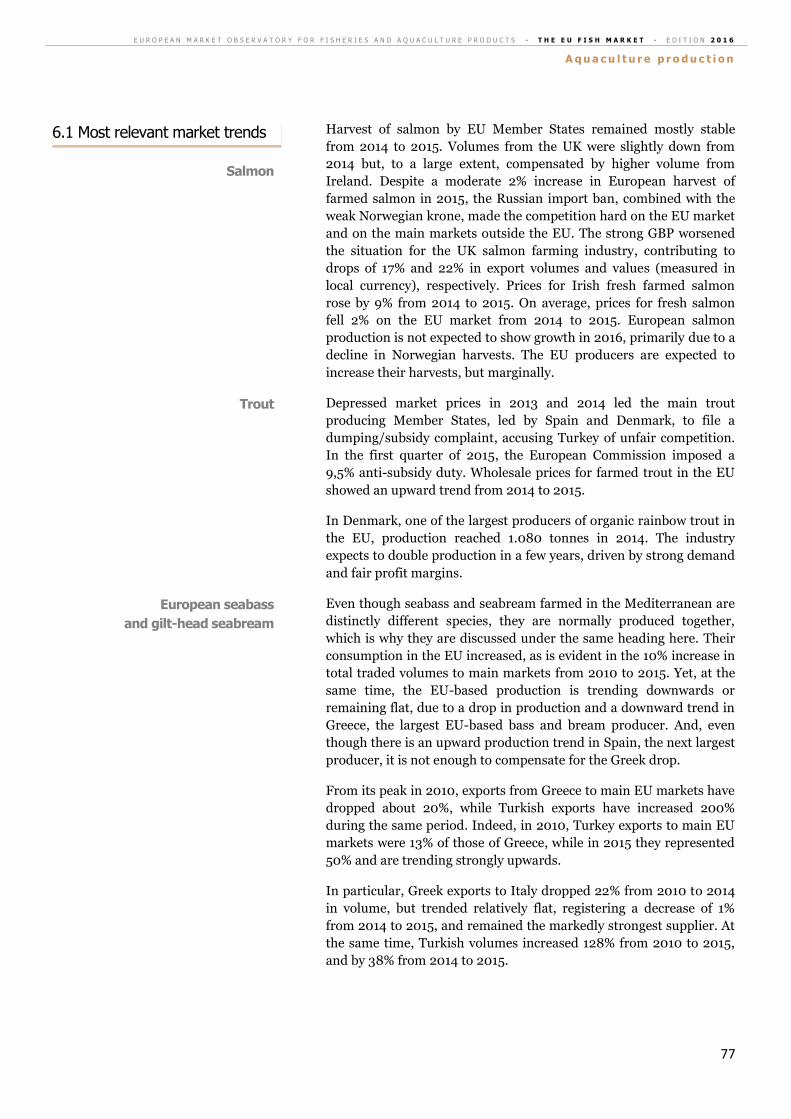
E U R O P E A N M A R K E T O B S E R V A T O R Y F O R F I S H E R I E S A N D A Q U A C U L T U R E P R O D U C T S - T H E E U F I S H M A R K E T - E D I T I O N 2 0 1 6
A q u a c u l t u r e p r o d u c t i o n
77
Harvest of salmon by EU Member States remained mostly stable
from 2014 to 2015. Volumes from the UK were slightly down from
2014 but, to a large extent, compensated by higher volume from
Ireland. Despite a moderate 2% increase in European harvest of
farmed salmon in 2015, the Russian import ban, combined with the
weak Norwegian krone, made the competition hard on the EU market
and on the main markets outside the EU. The strong GBP worsened
the situation for the UK salmon farming industry, contributing to
drops of 17% and 22% in export volumes and values (measured in
local currency), respectively. Prices for Irish fresh farmed salmon
rose by 9% from 2014 to 2015. On average, prices for fresh salmon
fell 2% on the EU market from 2014 to 2015. European salmon
production is not expected to show growth in 2016, primarily due to a
decline in Norwegian harvests. The EU producers are expected to
increase their harvests, but marginally.
Depressed market prices in 2013 and 2014 led the main trout
producing Member States, led by Spain and Denmark, to file a
dumping/subsidy complaint, accusing Turkey of unfair competition.
In the first quarter of 2015, the European Commission imposed a
9,5% anti-subsidy duty. Wholesale prices for farmed trout in the EU
showed an upward trend from 2014 to 2015.
In Denmark, one of the largest producers of organic rainbow trout in
the EU, production reached 1.080 tonnes in 2014. The industry
expects to double production in a few years, driven by strong demand
and fair profit margins.
Even though seabass and seabream farmed in the Mediterranean are
distinctly different species, they are normally produced together,
which is why they are discussed under the same heading here. Their
consumption in the EU increased, as is evident in the 10% increase in
total traded volumes to main markets from 2010 to 2015. Yet, at the
same time, the EU-based production is trending downwards or
remaining flat, due to a drop in production and a downward trend in
Greece, the largest EU-based bass and bream producer. And, even
though there is an upward production trend in Spain, the next largest
producer, it is not enough to compensate for the Greek drop.
From its peak in 2010, exports from Greece to main EU markets have
dropped about 20%, while Turkish exports have increased 200%
during the same period. Indeed, in 2010, Turkey exports to main EU
markets were 13% of those of Greece, while in 2015 they represented
50% and are trending strongly upwards.
In particular, Greek exports to Italy dropped 22% from 2010 to 2014
in volume, but trended relatively flat, registering a decrease of 1%
from 2014 to 2015, and remained the markedly strongest supplier. At
the same time, Turkish volumes increased 128% from 2010 to 2015,
and by 38% from 2014 to 2015.
European seabass
and gilt-head seabream
Trout
Salmon
6.1 Most relevant market trends
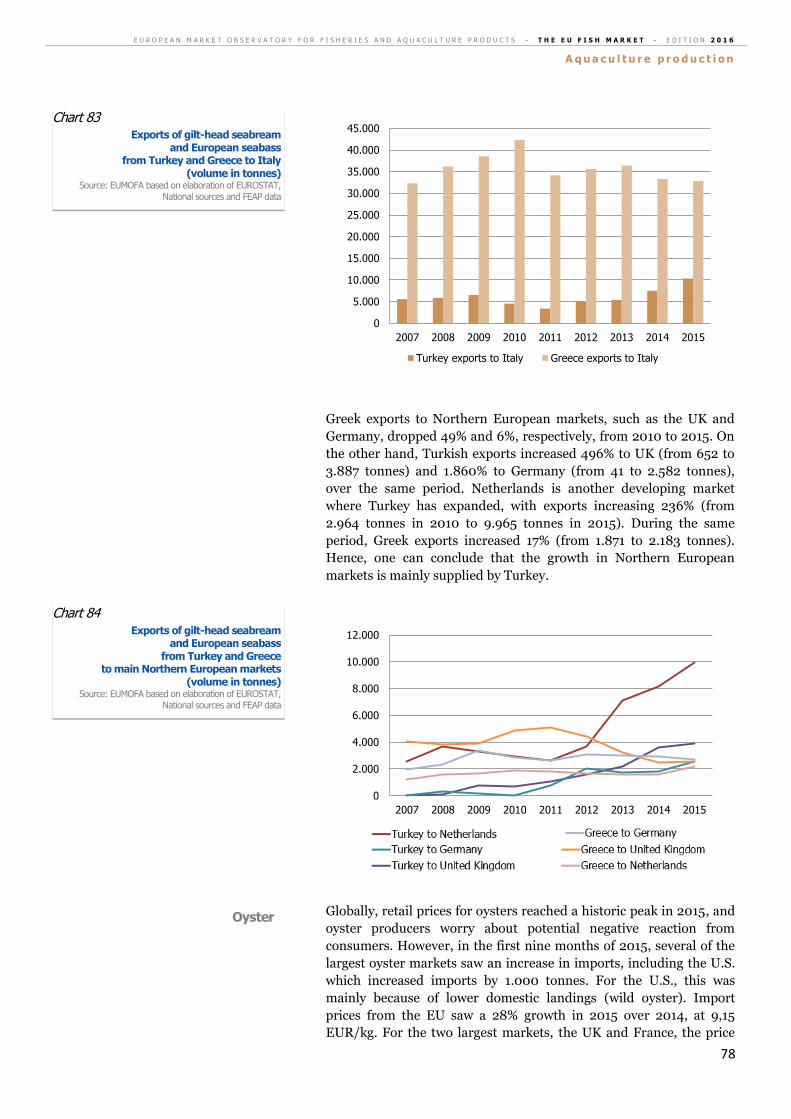
E U R O P E A N M A R K E T O B S E R V A T O R Y F O R F I S H E R I E S A N D A Q U A C U L T U R E P R O D U C T S - T H E E U F I S H M A R K E T - E D I T I O N 2 0 1 6
A q u a c u l t u r e p r o d u c t i o n
78
Greek exports to Northern European markets, such as the UK and
Germany, dropped 49% and 6%, respectively, from 2010 to 2015. On
the other hand, Turkish exports increased 496% to UK (from 652 to
3.887 tonnes) and 1.860% to Germany (from 41 to 2.582 tonnes),
over the same period. Netherlands is another developing market
where Turkey has expanded, with exports increasing 236% (from
2.964 tonnes in 2010 to 9.965 tonnes in 2015). During the same
period, Greek exports increased 17% (from 1.871 to 2.183 tonnes).
Hence, one can conclude that the growth in Northern European
markets is mainly supplied by Turkey.
Globally, retail prices for oysters reached a historic peak in 2015, and
oyster producers worry about potential negative reaction from
consumers. However, in the first nine months of 2015, several of the
largest oyster markets saw an increase in imports, including the U.S.
which increased imports by 1.000 tonnes. For the U.S., this was
mainly because of lower domestic landings (wild oyster). Import
prices from the EU saw a 28% growth in 2015 over 2014, at 9,15
EUR/kg. For the two largest markets, the UK and France, the price
0
5.000
10.000
15.000
20.000
25.000
30.000
35.000
40.000
45.000
2007 2008 2009 2010 2011 2012 2013 2014 2015
Turkey exports to Italy Greece exports to Italy
0
2.000
4.000
6.000
8.000
10.000
12.000
2007 2008 2009 2010 2011 2012 2013 2014 2015
Turkey to Netherlands Turkey to United Kingdom
Turkey to Germany Greece to United Kingdom
Greece to Germany Greece to Netherlands
Oyster
Chart 84 Exports of gilt-head seabream
and European seabass from Turkey and Greece
to main Northern European markets (volume in tonnes)
Source: EUMOFA based on elaboration of EUROSTAT,
National sources and FEAP data
Chart 83 Exports of gilt-head seabream
and European seabass from Turkey and Greece to Italy
(volume in tonnes) Source: EUMOFA based on elaboration of EUROSTAT,
National sources and FEAP data
E U R O P E A N M A R K E T O B S E R V A T O R Y F O R F I S H E R I E S A N D A Q U A C U L T U R E P R O D U C T S - T H E E U F I S H M A R K E T - E D I T I O N 2 0 1 6
A q u a c u l t u r e p r o d u c t i o n
79
increased by 14% to 7,26 EUR/kg, and by 34% to 8,64 EUR/kg,
respectively.
In 2015, oyster production in Ireland saw a 25% boost over the
previous year, reaching 40.140 tonnes. More than 90% of the Irish
production is exported, mainly to France (88%), but also to Hong
Kong and China. Irish oyster was highly welcomed in the two eastern
markets, where it received the highest price for oyster sold in this
region.
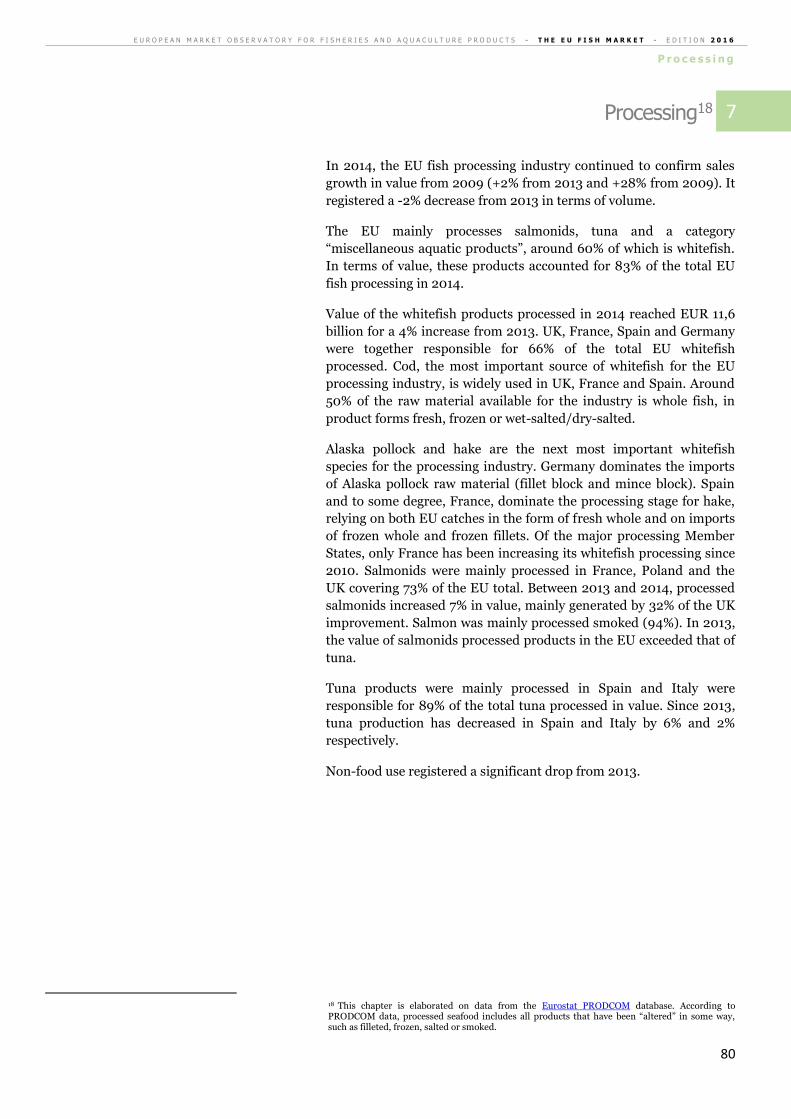
E U R O P E A N M A R K E T O B S E R V A T O R Y F O R F I S H E R I E S A N D A Q U A C U L T U R E P R O D U C T S - T H E E U F I S H M A R K E T - E D I T I O N 2 0 1 6
P r o c e s s i n g
80
Processing18
In 2014, the EU fish processing industry continued to confirm sales
growth in value from 2009 (+2% from 2013 and +28% from 2009). It
registered a -2% decrease from 2013 in terms of volume.
The EU mainly processes salmonids, tuna and a category
“miscellaneous aquatic products”, around 60% of which is whitefish.
In terms of value, these products accounted for 83% of the total EU
fish processing in 2014.
Value of the whitefish products processed in 2014 reached EUR 11,6
billion for a 4% increase from 2013. UK, France, Spain and Germany
were together responsible for 66% of the total EU whitefish
processed. Cod, the most important source of whitefish for the EU
processing industry, is widely used in UK, France and Spain. Around
50% of the raw material available for the industry is whole fish, in
product forms fresh, frozen or wet-salted/dry-salted.
Alaska pollock and hake are the next most important whitefish
species for the processing industry. Germany dominates the imports
of Alaska pollock raw material (fillet block and mince block). Spain
and to some degree, France, dominate the processing stage for hake,
relying on both EU catches in the form of fresh whole and on imports
of frozen whole and frozen fillets. Of the major processing Member
States, only France has been increasing its whitefish processing since
2010. Salmonids were mainly processed in France, Poland and the
UK covering 73% of the EU total. Between 2013 and 2014, processed
salmonids increased 7% in value, mainly generated by 32% of the UK
improvement. Salmon was mainly processed smoked (94%). In 2013,
the value of salmonids processed products in the EU exceeded that of
tuna.
Tuna products were mainly processed in Spain and Italy were
responsible for 89% of the total tuna processed in value. Since 2013,
tuna production has decreased in Spain and Italy by 6% and 2%
respectively.
Non-food use registered a significant drop from 2013.
18 This chapter is elaborated on data from the Eurostat PRODCOM database. According to PRODCOM data, processed seafood includes all products that have been “altered” in some way, such as filleted, frozen, salted or smoked.
7
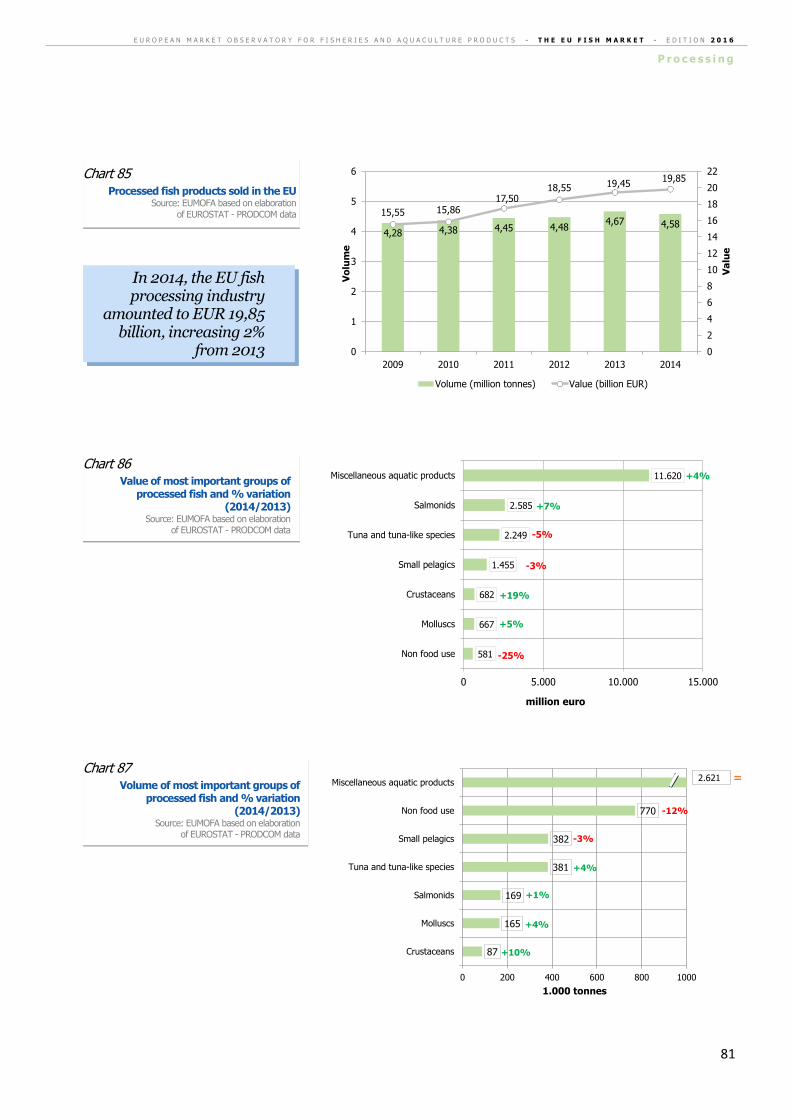
E U R O P E A N M A R K E T O B S E R V A T O R Y F O R F I S H E R I E S A N D A Q U A C U L T U R E P R O D U C T S - T H E E U F I S H M A R K E T - E D I T I O N 2 0 1 6
P r o c e s s i n g
81
4,28 4,38 4,45 4,484,67 4,58
15,55 15,8617,50
18,55 19,4519,85
0
2
4
6
8
10
12
14
16
18
20
22
0
1
2
3
4
5
6
2009 2010 2011 2012 2013 2014
Va
lue
Vo
lum
e
Volume (million tonnes) Value (billion EUR)
581
667
682
1.455
2.249
2.585
11.620
0 5.000 10.000 15.000
Non food use
Molluscs
Crustaceans
Small pelagics
Tuna and tuna-like species
Salmonids
Miscellaneous aquatic products
-25%
+5%
+19%
-3%
+7%
+4%
million eurortonneo
-5%
87
165
169
381
382
770
0 200 400 600 800 1000
Crustaceans
Molluscs
Salmonids
Tuna and tuna-like species
Small pelagics
Non food use
Miscellaneous aquatic products
1.000 tonnes
=
-12%
-3%
+4%
+1%
+10%
+4%
2.621
Chart 87 Volume of most important groups of
processed fish and % variation (2014/2013)
Source: EUMOFA based on elaboration of EUROSTAT - PRODCOM data
Chart 86 Value of most important groups of
processed fish and % variation (2014/2013)
Source: EUMOFA based on elaboration of EUROSTAT - PRODCOM data
In 2014, the EU fish processing industry
amounted to EUR 19,85 billion, increasing 2%
from 2013
Chart 85 Processed fish products sold in the EU
Source: EUMOFA based on elaboration
of EUROSTAT - PRODCOM data
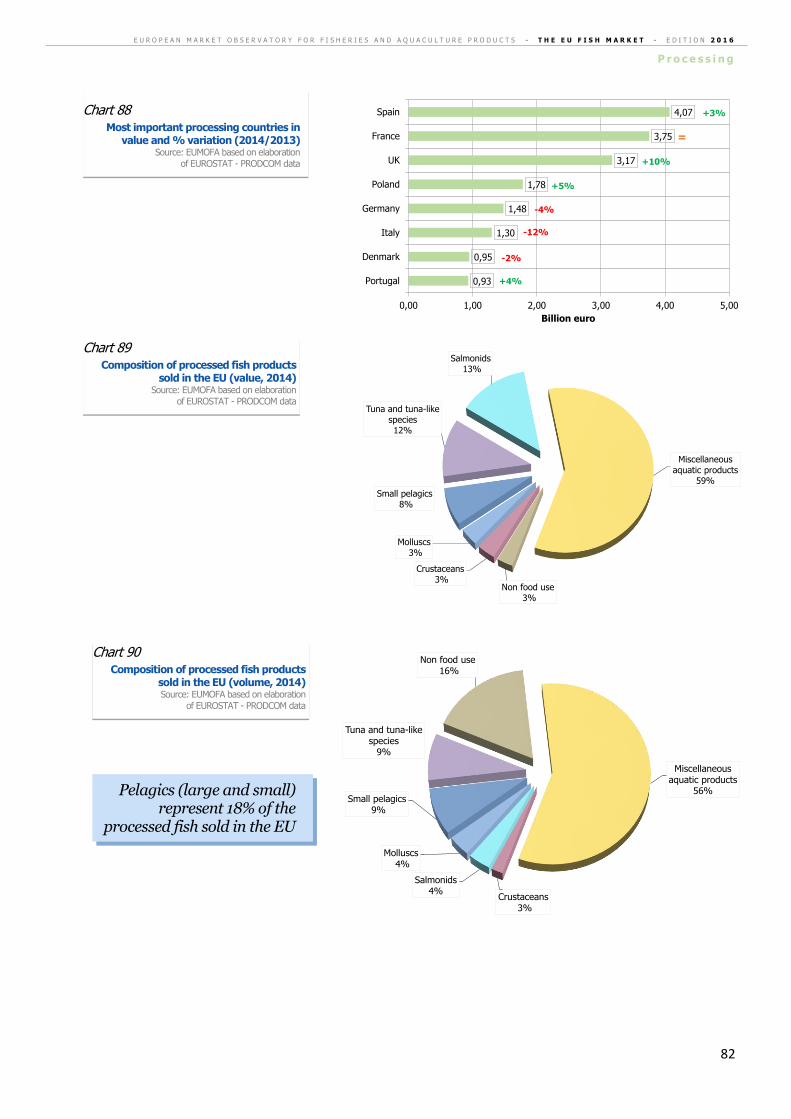
E U R O P E A N M A R K E T O B S E R V A T O R Y F O R F I S H E R I E S A N D A Q U A C U L T U R E P R O D U C T S - T H E E U F I S H M A R K E T - E D I T I O N 2 0 1 6
P r o c e s s i n g
82
0,93
0,95
1,30
1,48
1,78
3,17
3,75
4,07
0,00 1,00 2,00 3,00 4,00 5,00
Portugal
Denmark
Italy
Germany
Poland
UK
France
Spain
Billion euro
+4%
+3%
=
+10%
+5%
-4%
-12%
-2%
Non food use3%
Crustaceans3%
Molluscs3%
Small pelagics8%
Tuna and tuna-like species12%
Salmonids13%
Miscellaneous aquatic products
59%
Crustaceans3%
Salmonids4%
Molluscs4%
Small pelagics9%
Tuna and tuna-like species
9%
Non food use16%
Miscellaneous aquatic products
56%
Pelagics (large and small) represent 18% of the
processed fish sold in the EU
Chart 90 Composition of processed fish products
sold in the EU (volume, 2014) Source: EUMOFA based on elaboration
of EUROSTAT - PRODCOM data
Chart 89 Composition of processed fish products
sold in the EU (value, 2014) Source: EUMOFA based on elaboration
of EUROSTAT - PRODCOM data
Chart 88 Most important processing countries in
value and % variation (2014/2013) Source: EUMOFA based on elaboration
of EUROSTAT - PRODCOM data
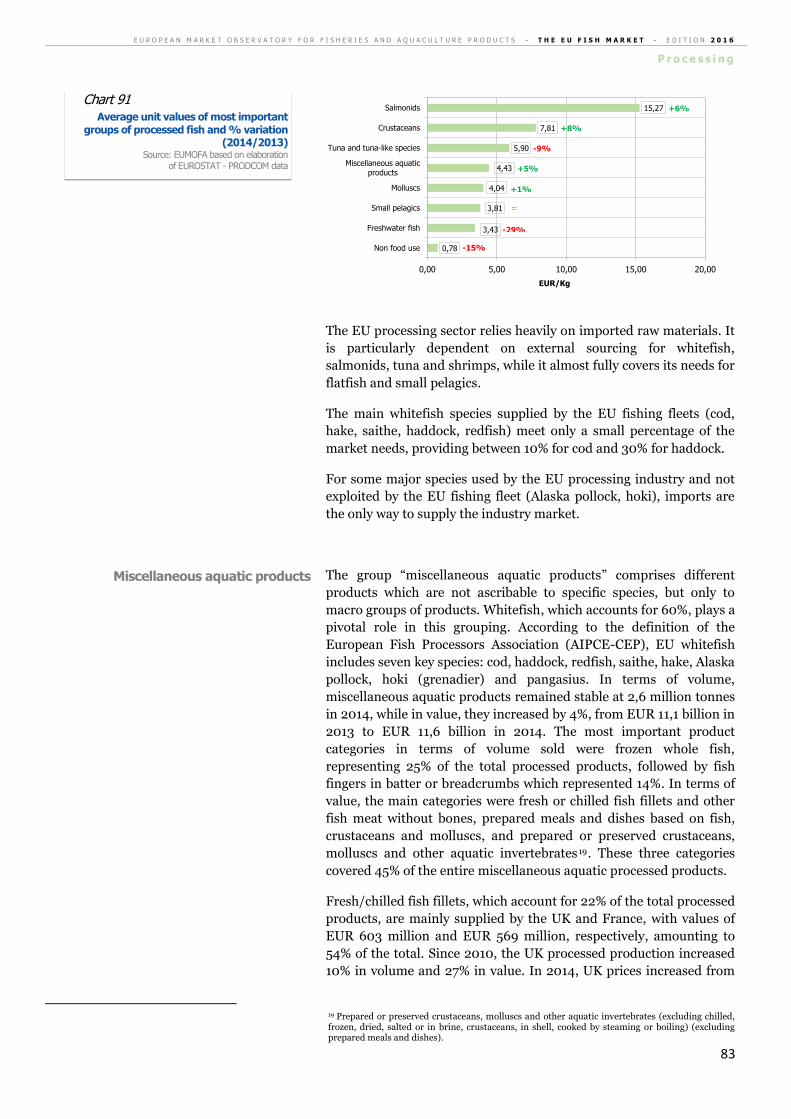
E U R O P E A N M A R K E T O B S E R V A T O R Y F O R F I S H E R I E S A N D A Q U A C U L T U R E P R O D U C T S - T H E E U F I S H M A R K E T - E D I T I O N 2 0 1 6
P r o c e s s i n g
83
0,78
3,43
3,81
4,04
4,43
5,90
7,81
15,27
0,00 5,00 10,00 15,00 20,00
Non food use
Freshwater fish
Small pelagics
Molluscs
Miscellaneous aquaticproducts
Tuna and tuna-like species
Crustaceans
Salmonids +6%
+8%
-9%
+5%
+1%
=
-29%
-15%
EUR/Kg
The EU processing sector relies heavily on imported raw materials. It
is particularly dependent on external sourcing for whitefish,
salmonids, tuna and shrimps, while it almost fully covers its needs for
flatfish and small pelagics.
The main whitefish species supplied by the EU fishing fleets (cod,
hake, saithe, haddock, redfish) meet only a small percentage of the
market needs, providing between 10% for cod and 30% for haddock.
For some major species used by the EU processing industry and not
exploited by the EU fishing fleet (Alaska pollock, hoki), imports are
the only way to supply the industry market.
The group “miscellaneous aquatic products” comprises different
products which are not ascribable to specific species, but only to
macro groups of products. Whitefish, which accounts for 60%, plays a
pivotal role in this grouping. According to the definition of the
European Fish Processors Association (AIPCE-CEP), EU whitefish
includes seven key species: cod, haddock, redfish, saithe, hake, Alaska
pollock, hoki (grenadier) and pangasius. In terms of volume,
miscellaneous aquatic products remained stable at 2,6 million tonnes
in 2014, while in value, they increased by 4%, from EUR 11,1 billion in
2013 to EUR 11,6 billion in 2014. The most important product
categories in terms of volume sold were frozen whole fish,
representing 25% of the total processed products, followed by fish
fingers in batter or breadcrumbs which represented 14%. In terms of
value, the main categories were fresh or chilled fish fillets and other
fish meat without bones, prepared meals and dishes based on fish,
crustaceans and molluscs, and prepared or preserved crustaceans,
molluscs and other aquatic invertebrates19. These three categories
covered 45% of the entire miscellaneous aquatic processed products.
Fresh/chilled fish fillets, which account for 22% of the total processed
products, are mainly supplied by the UK and France, with values of
EUR 603 million and EUR 569 million, respectively, amounting to
54% of the total. Since 2010, the UK processed production increased
10% in volume and 27% in value. In 2014, UK prices increased from
19 Prepared or preserved crustaceans, molluscs and other aquatic invertebrates (excluding chilled, frozen, dried, salted or in brine, crustaceans, in shell, cooked by steaming or boiling) (excluding prepared meals and dishes).
Miscellaneous aquatic products
Chart 91 Average unit values of most important
groups of processed fish and % variation (2014/2013)
Source: EUMOFA based on elaboration of EUROSTAT - PRODCOM data
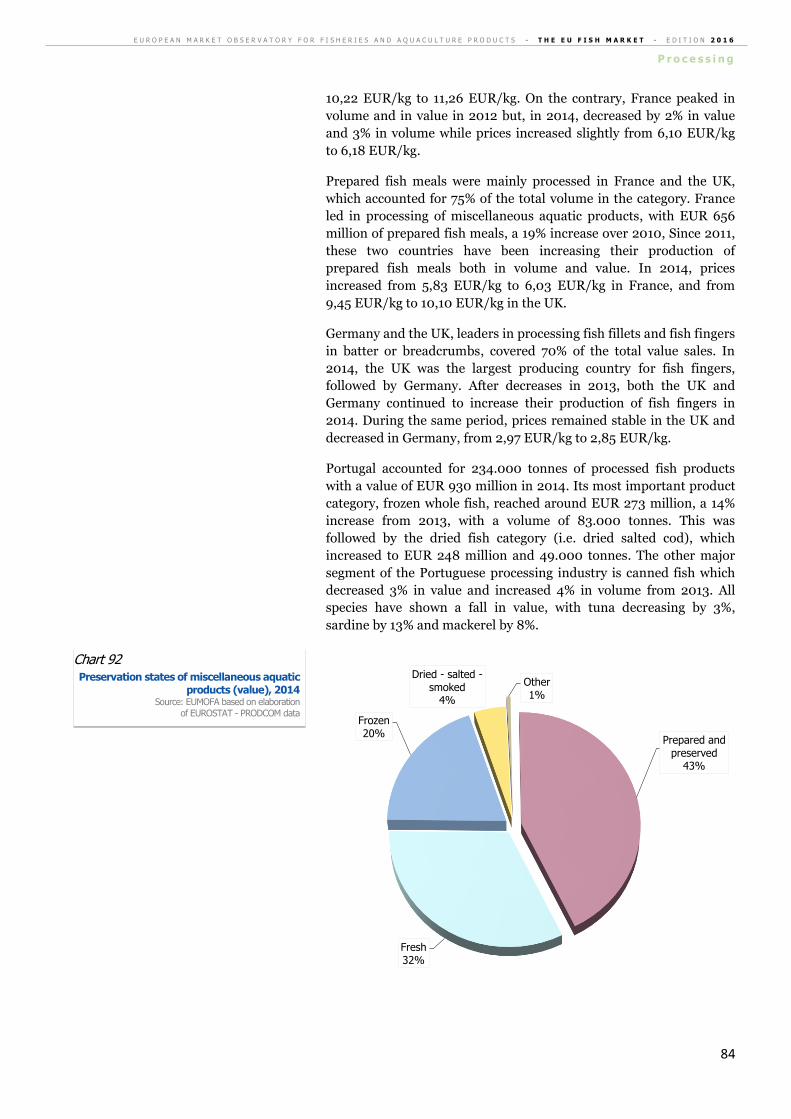
E U R O P E A N M A R K E T O B S E R V A T O R Y F O R F I S H E R I E S A N D A Q U A C U L T U R E P R O D U C T S - T H E E U F I S H M A R K E T - E D I T I O N 2 0 1 6
P r o c e s s i n g
84
10,22 EUR/kg to 11,26 EUR/kg. On the contrary, France peaked in
volume and in value in 2012 but, in 2014, decreased by 2% in value
and 3% in volume while prices increased slightly from 6,10 EUR/kg
to 6,18 EUR/kg.
Prepared fish meals were mainly processed in France and the UK,
which accounted for 75% of the total volume in the category. France
led in processing of miscellaneous aquatic products, with EUR 656
million of prepared fish meals, a 19% increase over 2010, Since 2011,
these two countries have been increasing their production of
prepared fish meals both in volume and value. In 2014, prices
increased from 5,83 EUR/kg to 6,03 EUR/kg in France, and from
9,45 EUR/kg to 10,10 EUR/kg in the UK.
Germany and the UK, leaders in processing fish fillets and fish fingers
in batter or breadcrumbs, covered 70% of the total value sales. In
2014, the UK was the largest producing country for fish fingers,
followed by Germany. After decreases in 2013, both the UK and
Germany continued to increase their production of fish fingers in
2014. During the same period, prices remained stable in the UK and
decreased in Germany, from 2,97 EUR/kg to 2,85 EUR/kg.
Portugal accounted for 234.000 tonnes of processed fish products
with a value of EUR 930 million in 2014. Its most important product
category, frozen whole fish, reached around EUR 273 million, a 14%
increase from 2013, with a volume of 83.000 tonnes. This was
followed by the dried fish category (i.e. dried salted cod), which
increased to EUR 248 million and 49.000 tonnes. The other major
segment of the Portuguese processing industry is canned fish which
decreased 3% in value and increased 4% in volume from 2013. All
species have shown a fall in value, with tuna decreasing by 3%,
sardine by 13% and mackerel by 8%.
Prepared and
preserved43%
Fresh32%
Frozen 20%
Dried - salted -smoked
4%
Other1%
Chart 92 Preservation states of miscellaneous aquatic
products (value), 2014 Source: EUMOFA based on elaboration
of EUROSTAT - PRODCOM data
E U R O P E A N M A R K E T O B S E R V A T O R Y F O R F I S H E R I E S A N D A Q U A C U L T U R E P R O D U C T S - T H E E U F I S H M A R K E T - E D I T I O N 2 0 1 6
P r o c e s s i n g
85
Non-food use production is essentially the manufacture of fishmeal,
which is used as an ingredient in feed for pigs, poultry and
aquaculture species, and of fish oil, which is used mainly in the
cosmetics sector. Denmark, the major producer of these products, is
responsible for 76% of total sales. At EU level, the production of non-
food use products registered a fluctuant trend from 2010, registering
its value peak in 2013 with around EUR 777.000.
During 2010–2014, tuna and tuna-like species (prepared and
preserved tuna, skipjack, and Atlantic bonito) had an upward trend in
both volume and value with increases of 10% and 15%, respectively.
Despite this increase, in 2014 tuna has become the 3rd species sold,
exceeded by salmon: while volume continued to increase, value
diminished moving from EUR 2,36 billion to EUR 2,24 billion. In
2013, tuna and tuna-like species was the second-largest commodity
group after salmonids in the ranking of processed products sold in
the EU.
Spain, the leader in terms of processed canned tuna, covered 67% of
the total. In 2014, Spain production decreased by 6% in value while
increasing by 5% in volume, due to a significant price fall, from 6,17
EUR/kg in 2013 to 5,51 EUR/kg in 2014.
Italy was the second largest canned tuna producer, although its EUR
506 million value was a slight 2% decrease from 2013.
Since 2010, processed small pelagics sold in the EU have increased by
24%. However, this group registered a 3% decrease in value and in
volume between 2013 and 2014. Herring, the most important species
sold, accounted for 41% of the total small pelagics processed, followed
by sardines and sprats, which together represented 28% of the total
small pelagics processed.
Germany and Poland account together for 89% of the total herring
products. Germany registered the highest value in 2014, with EUR
283 million for 69.000 tonnes. Poland continued to record the
highest volume since 2010, reached around 102.000 tonnes worth
EUR 253 million in 2014. Prices slightly increased in Germany, rising
from 3,97 EUR/kg in 2013 to 4,09 EUR/kg in 2014, but they
decreased in Poland, dropping from 2,62 EUR/kg in 2013 to 2,49
EUR/kg in 2014.
France led the EU in production of canned mackerel. Its output
valued at EUR 115 million accounted for 48% of EU’s total
production.
Spain, the main producer of preserved anchovies, was responsible for
72% of total prepared anchovy production in 2104. Its EUR 112
million value represented a 9% increase from 2013, while prices
decreased from 11,80 EUR/kg in 2013 to 11,19 EUR/kg in 2014.
As for canned preserved sardines and sprats, Spain, France, Latvia
and Portugal covered 77% of total values. Their 3% decrease in value
was mainly due to a 10% decrease in sales in Latvia (essentially
sprats), which was strongly impacted by the Russian ban on EU
exports.
Small pelagics
Tuna and tuna-like species
Non-food use
E U R O P E A N M A R K E T O B S E R V A T O R Y F O R F I S H E R I E S A N D A Q U A C U L T U R E P R O D U C T S - T H E E U F I S H M A R K E T - E D I T I O N 2 0 1 6
P r o c e s s i n g
86
In 2014, sales of processed salmonids in the EU exceeded those of
prepared tuna, becoming the second group after miscellaneous
aquatic products. An upward trend has been registered since 2010 for
salmonids products.
France and Poland have led the salmon smoking industry since 2011,
accounting for values of EUR 829 million and EUR 705 million
respectively in 2014. After peaking in 2013, France registered a 5%
decrease in value and 10% reduction in volume in 2014, with prices
rising from 20,64 EUR/kg to 21,78 EUR/kg. In the same period,
Poland registered a 6% reduction in volume but a 5% improvement in
value, with prices moving from 12,20 EUR/kg to 13,59 EUR/kg. The
price differential between Poland and France narrowed in 2014.
The UK and Spain both reported increases in their smoked salmon
production. UK production increased 32% in value and 20% in
volume, registering of EUR 347 million. In the same period, Spain
increased 11% in volume and decreased 15% in value.
The molluscs commodity group includes bivalves and cephalopods.
In 2014, it registered EUR 667 million, a 5% value increase from
2013, while volume sold increased 4%, generating a slight increase of
prices from 3,99 to 4,04 EUR/kg.
Spain contributes 60% of total EU production of processed molluscs
(frozen cephalopods and canned bivalves), which has significant
impact on the overall positive trend at EU level. In 2014, Greek
production exceeded that of Italy, making it the EU’s second most
important producing country, responsible for 9% of scallops, mussels,
cuttlefish, squid and octopus, (frozen, dried, smoked, salted or in
brine).
Italy registered a significant 38% drop in value and 57% drop in
volume, its lowest level since 2010. The drop was possibly due to the
decrease of raw material supplies from Vietnam and to the effects of
the 22% decrease of internal production in 2013 that was generated
by reduced salinity in clam-growing areas.
In terms of value, frozen crustaceans (mainly tropical shrimp and
Norway lobster) registered EUR 618 million in 2014, the peak of a
trend from 2010. Spain and the UK represented 68% of total
processed crustaceans, with values of EUR 287 million and EUR 177
million, respectively. In 2014, prices grew from 6,21 to 6,78 EUR/kg
Spain, but declined from 9,96 to 9,21 EUR/kg in the UK.
After France reported a decrease in 2013 in terms of value, its
production of frozen crustaceans increased by EUR 9 million to reach
EUR 75 million in 2014, while volume decreased by 4%. Prices
boosted from 9,59 EUR/kg to 11,33 EUR/kg, partly in relation to a
higher share of Norway lobsters in overall crustaceans production.
Crustaceans
Molluscs
Salmonids
“The EU fish market” is published by the Directorate-General for Maritime Affairs and Fisheries of the European
Commission.
Editor: European Commission, Directorate-General for Maritime Affairs and Fisheries, Director-General.
Disclaimer: Although the Maritime Affairs and Fisheries Directorate General is responsible for the overall
production of this publication, the views and conclusions presented in this report reflect the opinion of the
author(s) and do not necessarily reflect the opinion of the Commission or its officers.
© European Union, 2016
KL-AP-16-001-EN-N
ISBN: 978-92-79-69443-1ISSN: 2363-4154DOI: 10.2771/442971
Reproduction is authorized, provided the source is acknowledged.
FOR MORE INFORMATION AND COMMENTS:
Directorate-General for Maritime Affairs and Fisheries
B-1049 Brussels
Tel: +32 229-50101
E-mail: [email protected]


![EPK "King of Herrings" [2013] by David K. GREENWALD](https://img.pdfslide.us/doc/110x75/58f2871e1a28ab51148b45db/epk-king-of-herrings-2013-by-david-k-greenwald.jpg)