Embed Size (px)
Citation preview
2016 EdelmanTrust Barometer
Università LIUCCastellanza 3 Maggio 2016
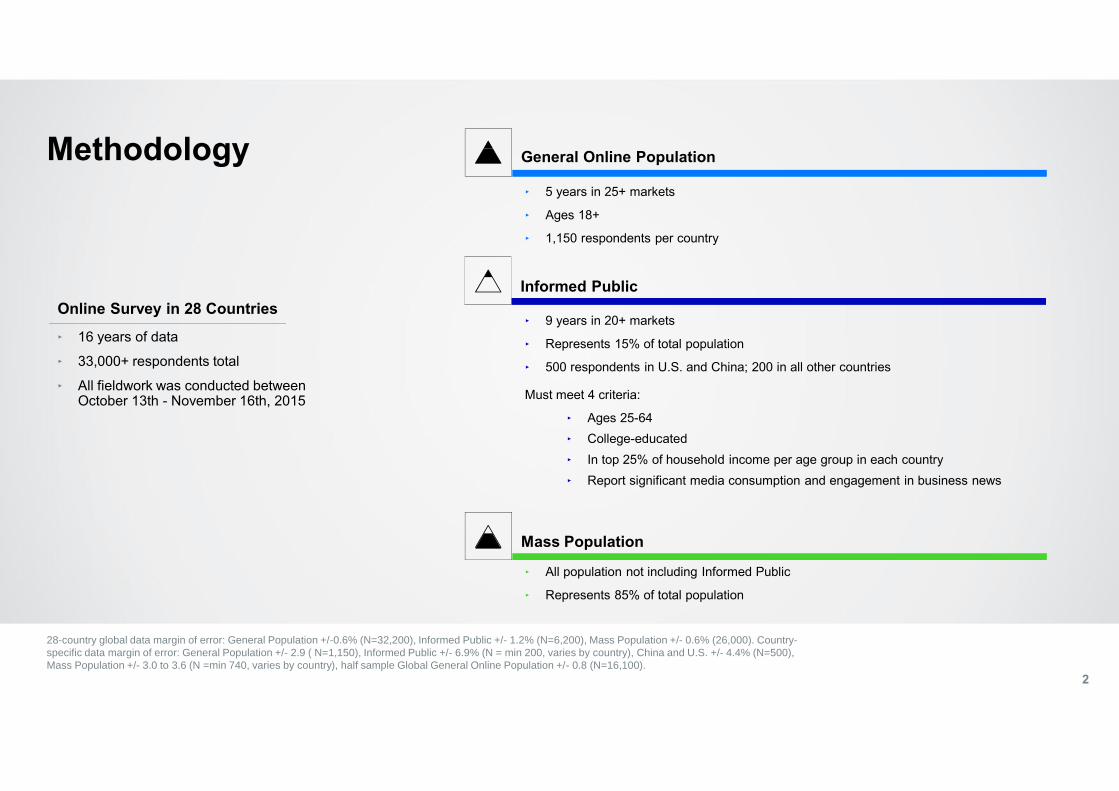
Informed Public
‣ 9 years in 20+ markets
‣ Represents 15% of total population
‣ 500 respondents in U.S. and China; 200 in all other countries
Must meet 4 criteria:
‣ Ages 25-64‣ College-educated‣ In top 25% of household income per age group in each country‣ Report significant media consumption and engagement in business news
General Online Population
‣ 5 years in 25+ markets
‣ Ages 18+
‣ 1,150 respondents per country
Methodology
28-country global data margin of error: General Population +/-0.6% (N=32,200), Informed Public +/- 1.2% (N=6,200), Mass Population +/- 0.6% (26,000). Country-specific data margin of error: General Population +/- 2.9 ( N=1,150), Informed Public +/- 6.9% (N = min 200, varies by country), China and U.S. +/- 4.4% (N=500),Mass Population +/- 3.0 to 3.6 (N =min 740, varies by country), half sample Global General Online Population +/- 0.8 (N=16,100).
‣ 16 years of data
‣ 33,000+ respondents total
‣ All fieldwork was conducted betweenOctober 13th - November 16th, 2015
Online Survey in 28 Countries
Mass Population
‣ All population not including Informed Public
‣ Represents 85% of total population
2
60
64 6563
66
5053 54
51
55
4648
4548
51
3841
3942 43
2012 2013 2014 2015 2016
54
58 5856
62
4750 49 49
53
2012 2013 2014 2015 2016
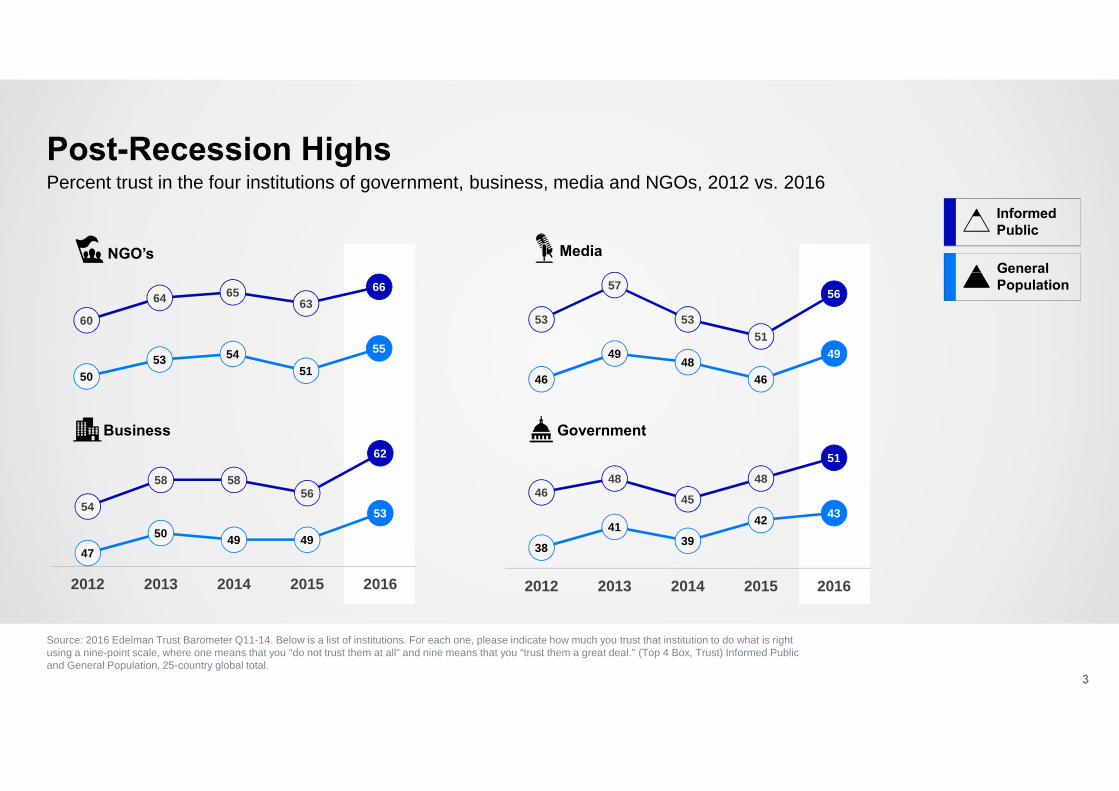
Source: 2016 Edelman Trust Barometer Q11-14. Below is a list of institutions. For each one, please indicate how much you trust that institution to do what is rightusing a nine-point scale, where one means that you “do not trust them at all” and nine means that you “trust them a great deal.” (Top 4 Box, Trust) Informed Publicand General Population, 25-country global total.
3
Percent trust in the four institutions of government, business, media and NGOs, 2012 vs. 2016
53
57
5351
56
46
4948
46
49
NGO’s
Government
Media
Business
Post-Recession HighsInformedPublic
GeneralPopulation
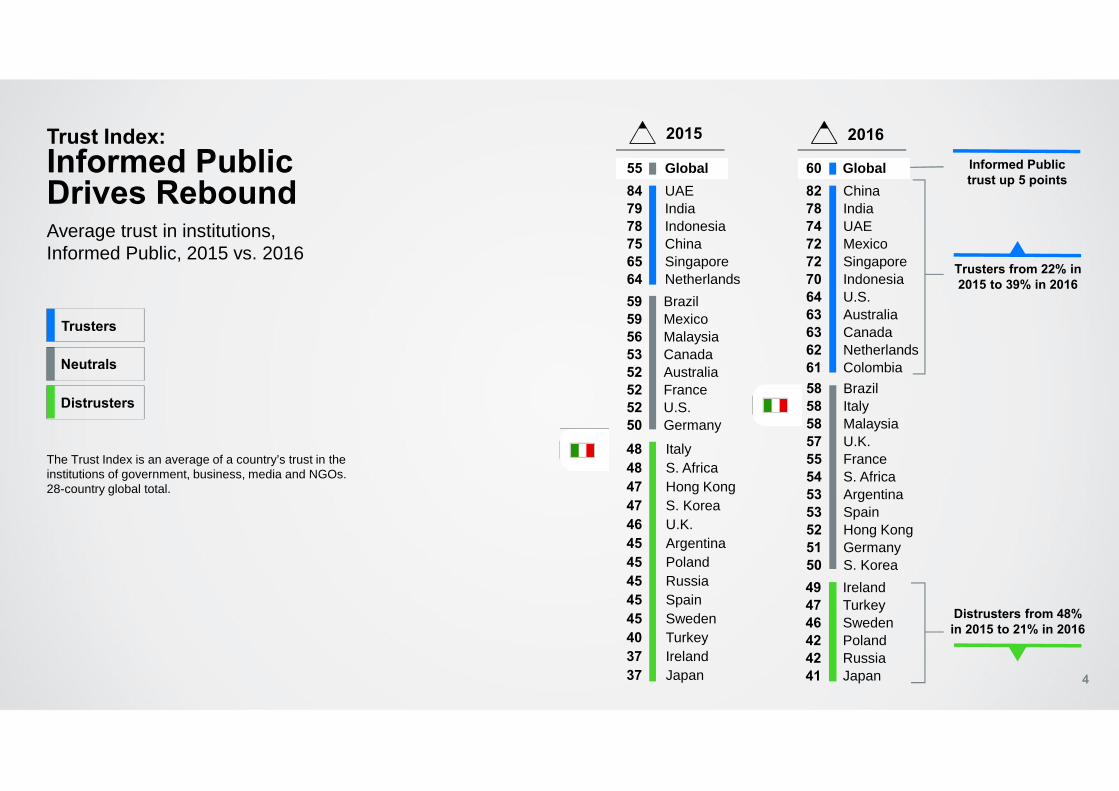
55 Global 60 Global82 China78 India74 UAE72 Mexico72 Singapore70 Indonesia64 U.S.63 Australia63 Canada62 Netherlands61 Colombia
84 UAE79 India78 Indonesia75 China65 Singapore64 Netherlands
49 Ireland47 Turkey46 Sweden42 Poland42 Russia41 Japan
48 Italy48 S. Africa47 Hong Kong47 S. Korea46 U.K.45 Argentina45 Poland45 Russia45 Spain45 Sweden40 Turkey37 Ireland37 Japan
58 Brazil58 Italy58 Malaysia57 U.K.55 France54 S. Africa53 Argentina53 Spain52 Hong Kong51 Germany50 S. Korea
59 Brazil59 Mexico56 Malaysia53 Canada52 Australia52 France52 U.S.50 Germany
Trust Index:Informed PublicDrives ReboundAverage trust in institutions,Informed Public, 2015 vs. 2016
2015 2016Informed Publictrust up 5 points
Trusters from 22% in2015 to 39% in 2016
Distrusters from 48%in 2015 to 21% in 2016
Trusters
Neutrals
Distrusters
4
The Trust Index is an average of a country’s trust in theinstitutions of government, business, media and NGOs.28-country global total.
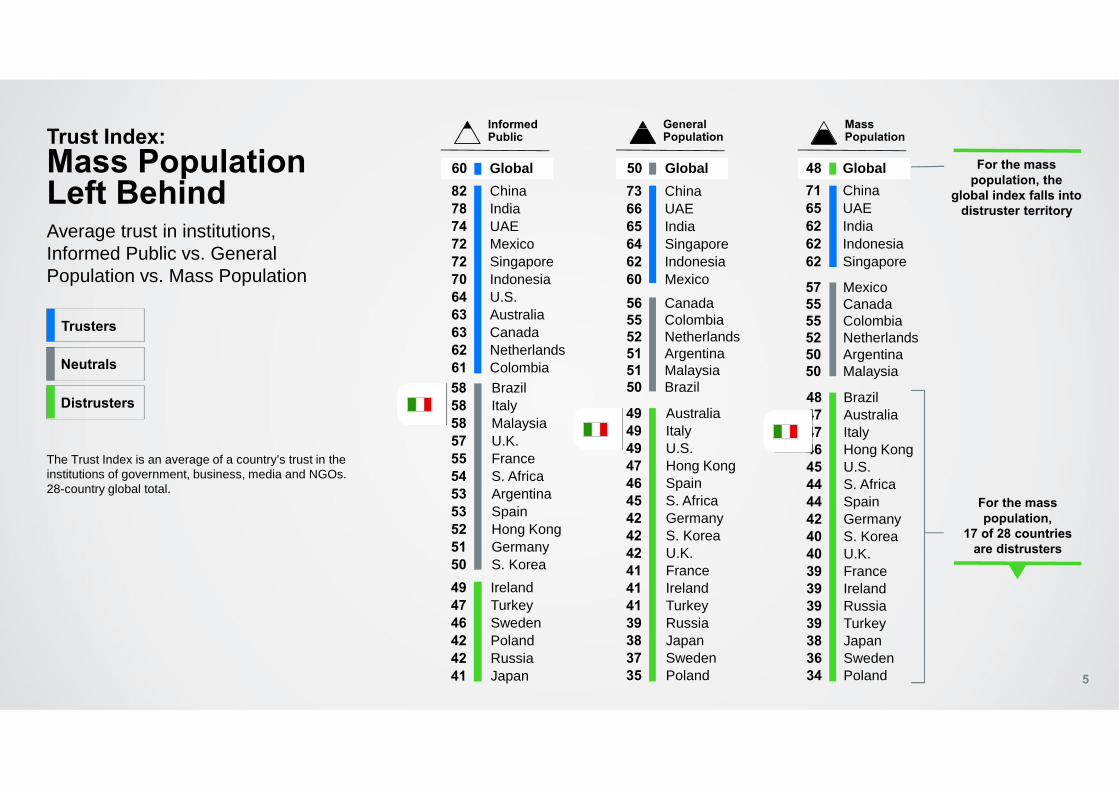
49 Australia49 Italy49 U.S.47 Hong Kong46 Spain45 S. Africa42 Germany42 S. Korea42 U.K.41 France41 Ireland41 Turkey39 Russia38 Japan37 Sweden35 Poland
73 China66 UAE65 India64 Singapore62 Indonesia60 Mexico 57 Mexico
55 Canada55 Colombia52 Netherlands50 Argentina50 Malaysia
48 Brazil47 Australia47 Italy46 Hong Kong45 U.S.44 S. Africa44 Spain42 Germany40 S. Korea40 U.K.39 France39 Ireland39 Russia39 Turkey38 Japan36 Sweden34 Poland
71 China65 UAE62 India62 Indonesia62 Singapore
56 Canada55 Colombia52 Netherlands51 Argentina51 Malaysia50 Brazil
Trust Index:Mass PopulationLeft BehindAverage trust in institutions,Informed Public vs. GeneralPopulation vs. Mass Population
For the masspopulation,
17 of 28 countriesare distrusters
The Trust Index is an average of a country’s trust in theinstitutions of government, business, media and NGOs.28-country global total.
GeneralPopulation
MassPopulation
50 Global 48 Global
49 Ireland47 Turkey46 Sweden42 Poland42 Russia41 Japan
82 China78 India74 UAE72 Mexico72 Singapore70 Indonesia64 U.S.63 Australia63 Canada62 Netherlands61 Colombia58 Brazil58 Italy58 Malaysia57 U.K.55 France54 S. Africa53 Argentina53 Spain52 Hong Kong51 Germany50 S. Korea
InformedPublic
60 Global For the masspopulation, the
global index falls intodistruster territory
5
Trusters
Neutrals
Distrusters
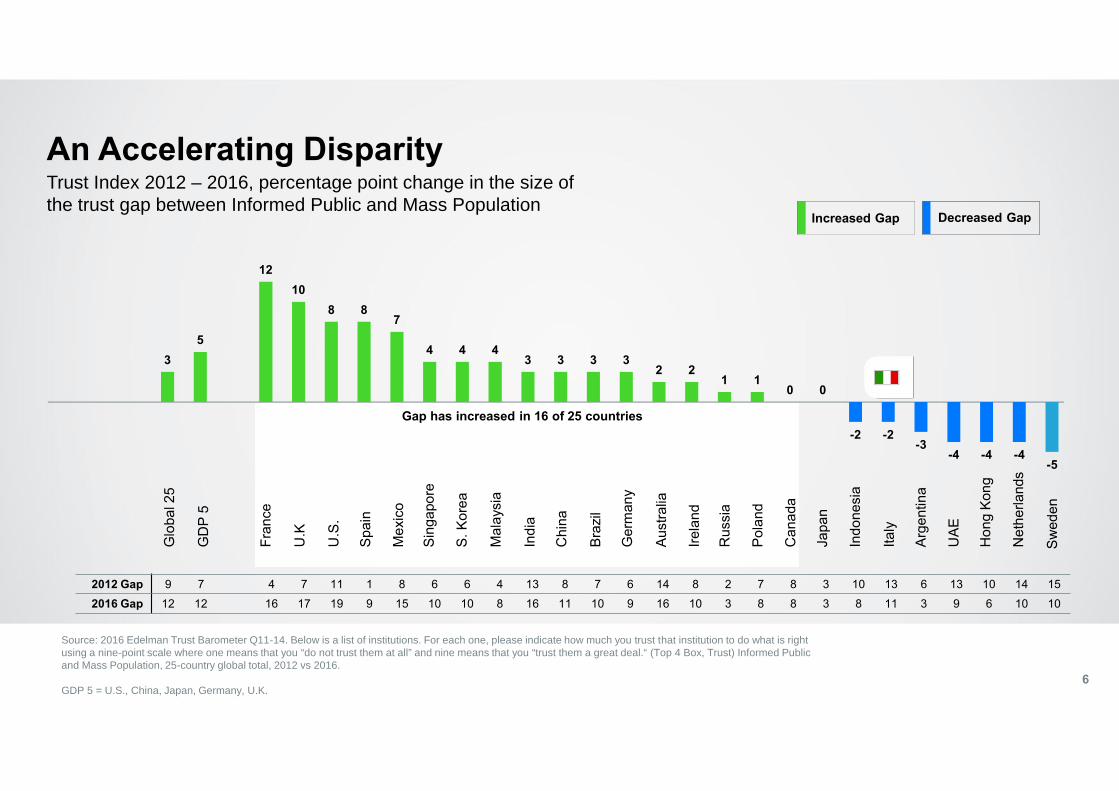
Trust Index 2012 – 2016, percentage point change in the size ofthe trust gap between Informed Public and Mass Population
An Accelerating Disparity
Source: 2016 Edelman Trust Barometer Q11-14. Below is a list of institutions. For each one, please indicate how much you trust that institution to do what is rightusing a nine-point scale where one means that you “do not trust them at all” and nine means that you “trust them a great deal.“ (Top 4 Box, Trust) Informed Publicand Mass Population, 25-country global total, 2012 vs 2016.
GDP 5 = U.S., China, Japan, Germany, U.K.6
Increased Gap Decreased Gap
Gap has increased in 16 of 25 countries
Glo
bal2
5
GD
P 5
Fran
ce
U.K
U.S
.
Spai
n
Mex
ico
Sing
apor
e
S. K
orea
Mal
aysi
a
Indi
a
Chi
na
Braz
il
Ger
man
y
Aust
ralia
Irela
nd
Rus
sia
Pola
nd
Can
ada
Japa
n
Indo
nesi
a
Italy
Arge
ntin
a
UAE
Hon
g Ko
ng
Net
herla
nds
2012 Gap 9 7 4 7 11 1 8 6 6 4 13 8 7 6 14 8 2 7 8 3 10 13 6 13 10 14 152016 Gap 12 12 16 17 19 9 15 10 10 8 16 11 10 9 16 10 3 8 8 3 8 11 3 9 6 10 10
Swed
en
35
1210
8 87
4 4 43 3 3 3
2 21 1
0 0
-2 -2-3
-4 -4 -4-5
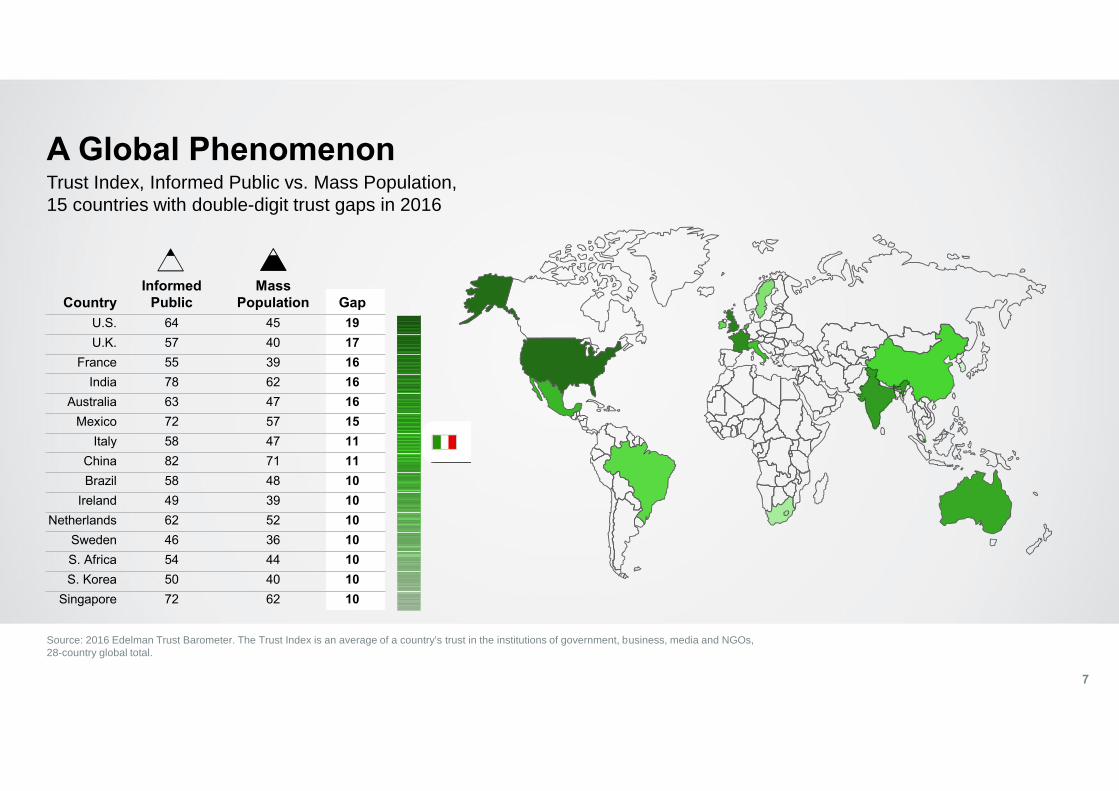
A Global Phenomenon
Source: 2016 Edelman Trust Barometer. The Trust Index is an average of a country’s trust in the institutions of government, business, media and NGOs,28-country global total.
7
Trust Index, Informed Public vs. Mass Population,15 countries with double-digit trust gaps in 2016
CountryInformed
PublicMass
Population GapU.S. 64 45 19U.K. 57 40 17
France 55 39 16India 78 62 16
Australia 63 47 16Mexico 72 57 15
Italy 58 47 11China 82 71 11Brazil 58 48 10
Ireland 49 39 10Netherlands 62 52 10
Sweden 46 36 10S. Africa 54 44 10S. Korea 50 40 10
Singapore 72 62 10
50%
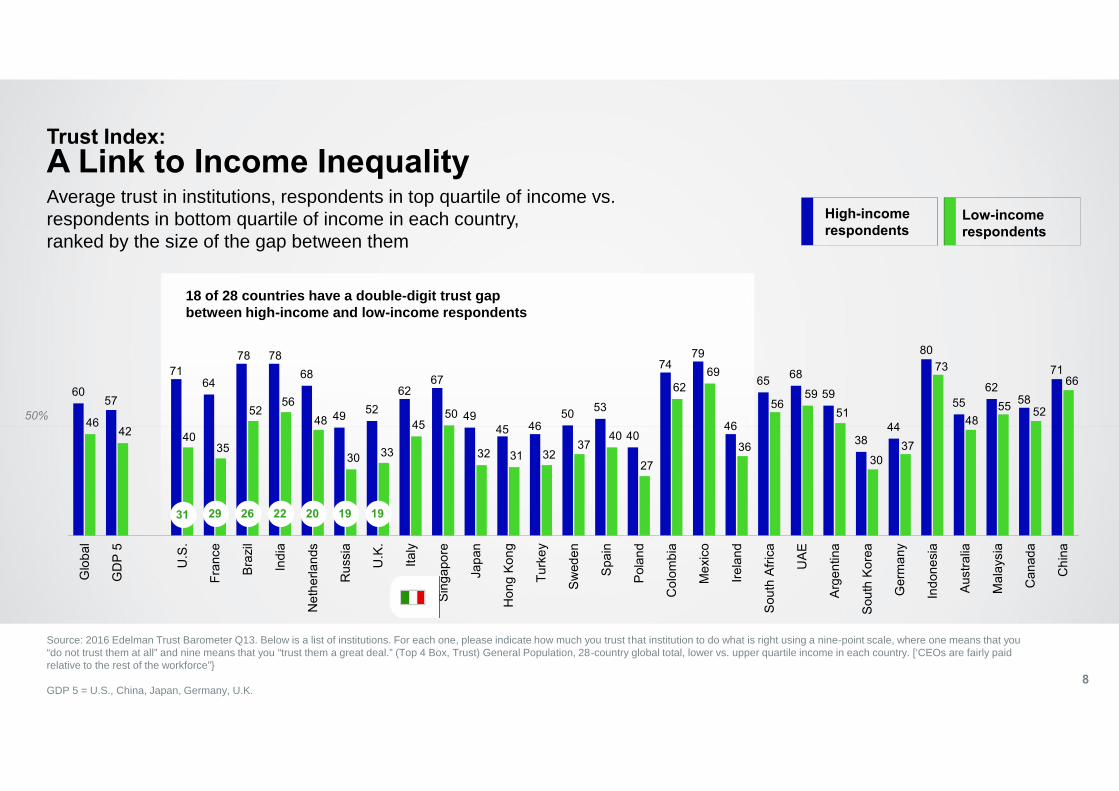
18 of 28 countries have a double-digit trust gapbetween high-income and low-income respondents
Trust Index:A Link to Income Inequality
Source: 2016 Edelman Trust Barometer Q13. Below is a list of institutions. For each one, please indicate how much you trust that institution to do what is right using a nine-point scale, where one means that you“do not trust them at all” and nine means that you “trust them a great deal.” (Top 4 Box, Trust) General Population, 28-country global total, lower vs. upper quartile income in each country. [‘CEOs are fairly paidrelative to the rest of the workforce”}
GDP 5 = U.S., China, Japan, Germany, U.K.8
Average trust in institutions, respondents in top quartile of income vs.respondents in bottom quartile of income in each country,ranked by the size of the gap between them
6057
7164
78 7868
49 5262
67
4945 46
50 53
40
7479
46
65 6859
3844
80
5562
58
71
4642 40
35
5256
48
30 33
4550
32 31 3237
40
27
6269
36
5659
51
3037
73
4855 52
66
Glo
bal
GD
P 5
U.S
.
Fran
ce
Braz
il
Indi
a
Net
herla
nds
Rus
sia
U.K
.
Italy
Sing
apor
e
Japa
n
Hon
g Ko
ng
Turk
ey
Swed
en
Spai
n
Pola
nd
Col
ombi
a
Mex
ico
Irela
nd
Sout
h Af
rica
UAE
Arge
ntin
a
Sout
h Ko
rea
Ger
man
y
Indo
nesi
a
Aust
ralia
Mal
aysi
a
Can
ada
Chi
na
19192022262931
Low-incomerespondents
High-incomerespondents
50%55
46
19 2128
4841
45 4247
44
57
4650
46
63
52 49
58 55 5551
6962 64
73 7379 81
87
47
37
1520
2431 31 33 33 34 34 36 36 37
3945 46 47 49 49 49
5764 64 65
69 7074
81 83
Glo
bal
GD
P 5
Japa
n
Fran
ce
Ger
man
y
U.K
.
Aust
ralia
Italy
S. K
orea
Net
herla
nds
Swed
en
Pola
nd
Hon
g Ko
ng
Can
ada
Rus
sia
U.S
.
Sing
apor
e
Turk
ey
Irela
nd
S. A
frica
Spai
n
Mal
aysi
a
Mex
ico
Arge
ntin
a
Braz
il
Chi
na
UAE
Indo
nesi
a
Col
ombi
a
Indi
a
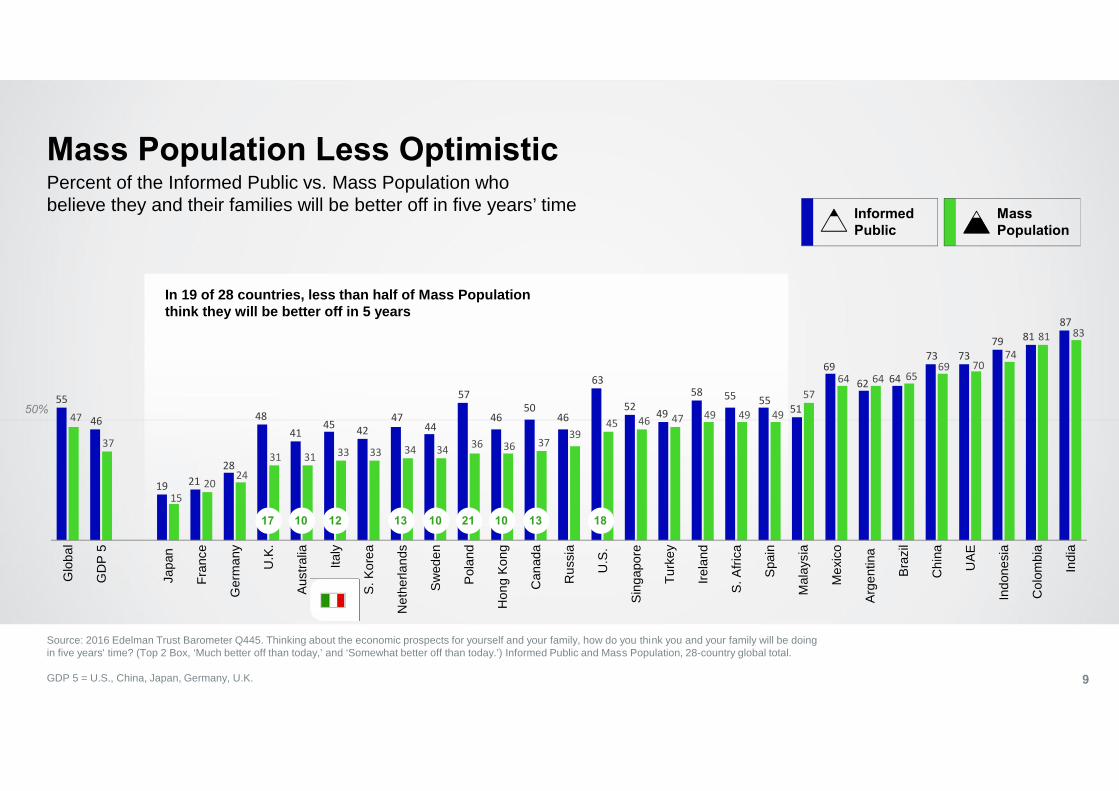
In 19 of 28 countries, less than half of Mass Populationthink they will be better off in 5 years
Mass Population Less Optimistic
Source: 2016 Edelman Trust Barometer Q445. Thinking about the economic prospects for yourself and your family, how do you think you and your family will be doingin five years' time? (Top 2 Box, ‘Much better off than today,’ and ‘Somewhat better off than today.’) Informed Public and Mass Population, 28-country global total.
GDP 5 = U.S., China, Japan, Germany, U.K. 9
Percent of the Informed Public vs. Mass Population whobelieve they and their families will be better off in five years’ time Informed
PublicMassPopulation
17 10 12 13 10 21 10 13 18
74
63 62 6472
6051 54 53
58
3135
2428
3526
21 1827 30
2012 2013 2014 2015 2016
6256
4553
68
5045
49 4857
2012 2013 2014 2015 2016
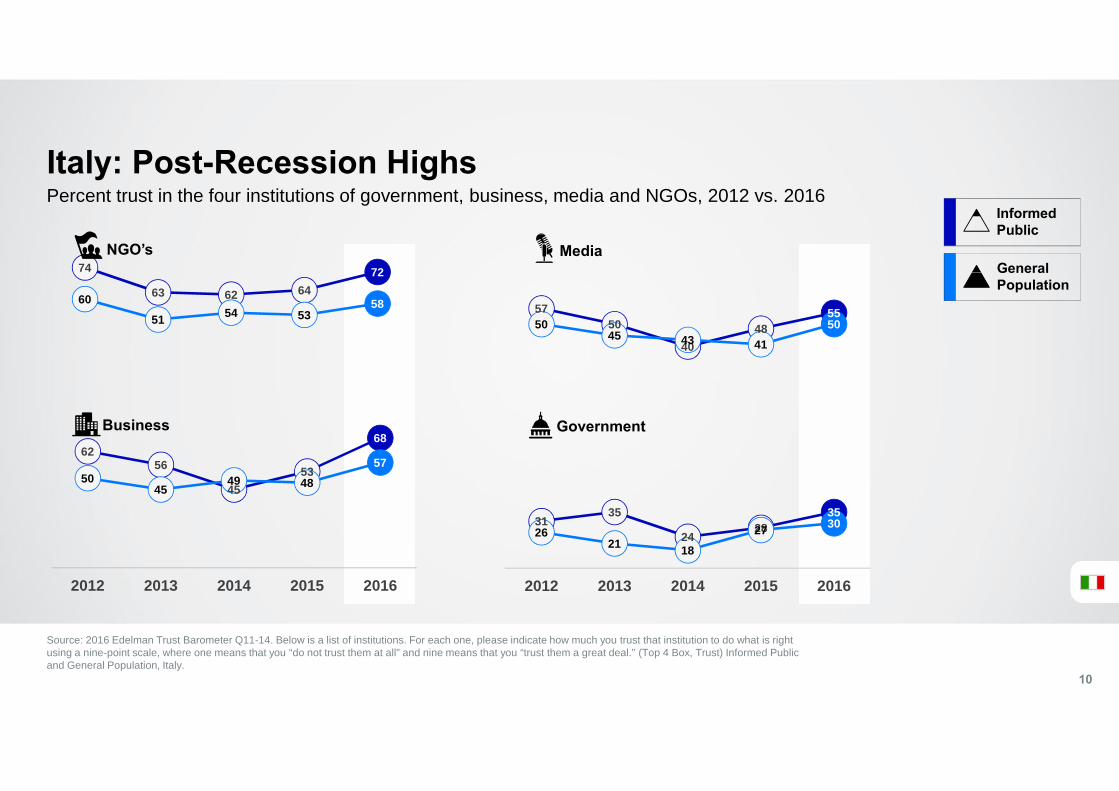
Source: 2016 Edelman Trust Barometer Q11-14. Below is a list of institutions. For each one, please indicate how much you trust that institution to do what is rightusing a nine-point scale, where one means that you “do not trust them at all” and nine means that you “trust them a great deal.” (Top 4 Box, Trust) Informed Publicand General Population, Italy.
10
Percent trust in the four institutions of government, business, media and NGOs, 2012 vs. 2016
5750
4048
5550
45 43 4150
NGO’s
Government
Media
Business
Italy: Post-Recession HighsInformedPublic
GeneralPopulation
56
51
43
48
58
43
38 39 40
47
2012 2013 2014 2015 2016
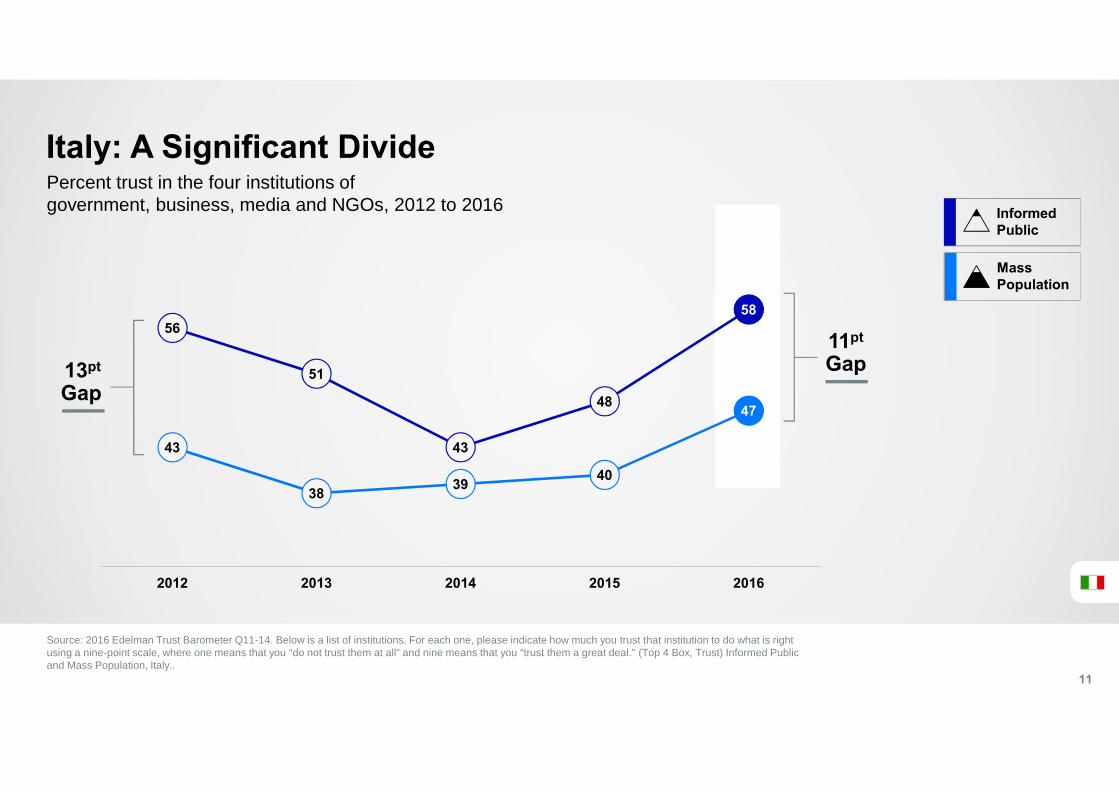
Italy: A Significant Divide
Source: 2016 Edelman Trust Barometer Q11-14. Below is a list of institutions. For each one, please indicate how much you trust that institution to do what is rightusing a nine-point scale, where one means that you “do not trust them at all” and nine means that you “trust them a great deal.” (Top 4 Box, Trust) Informed Publicand Mass Population, Italy..
11
Percent trust in the four institutions ofgovernment, business, media and NGOs, 2012 to 2016 Informed
Public
MassPopulation
11pt
Gap13pt
Gap
MassPopulation
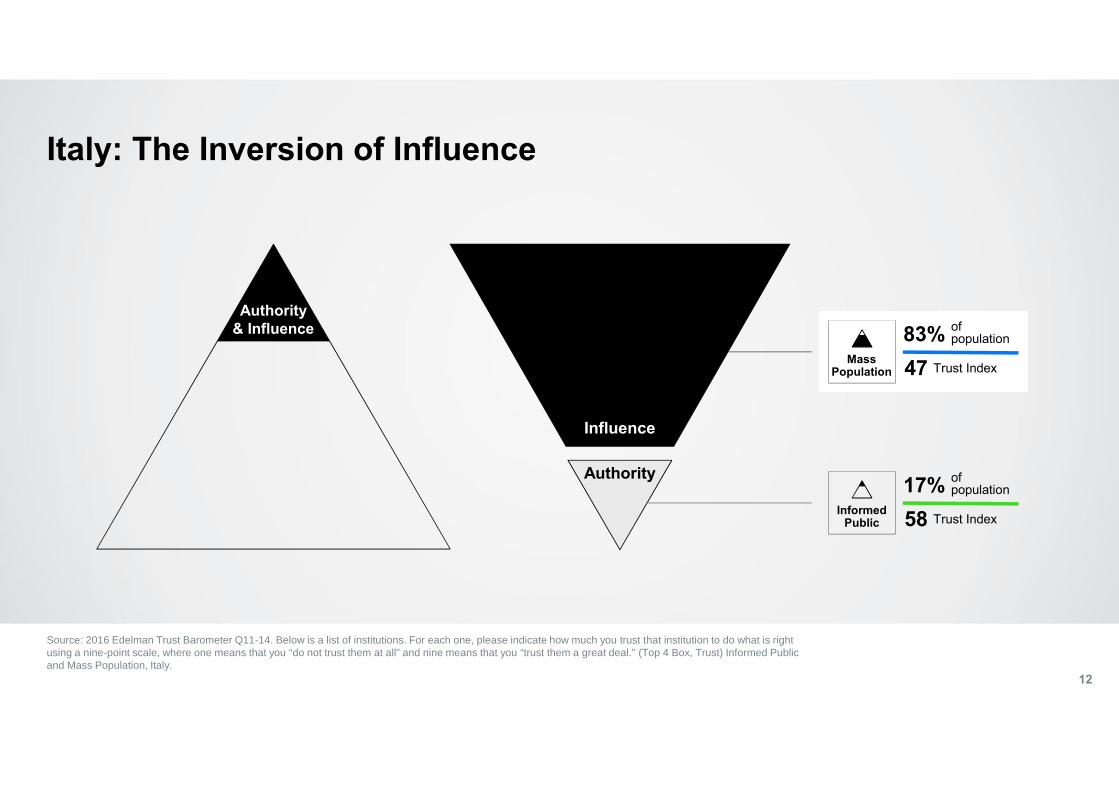
Italy: The Inversion of Influence
12
Authority& Influence
Influence
Authority
Source: 2016 Edelman Trust Barometer Q11-14. Below is a list of institutions. For each one, please indicate how much you trust that institution to do what is rightusing a nine-point scale, where one means that you “do not trust them at all” and nine means that you “trust them a great deal.” (Top 4 Box, Trust) Informed Publicand Mass Population, Italy.
83% ofpopulation
47 Trust Index
17% ofpopulation
58 Trust IndexInformed
Public
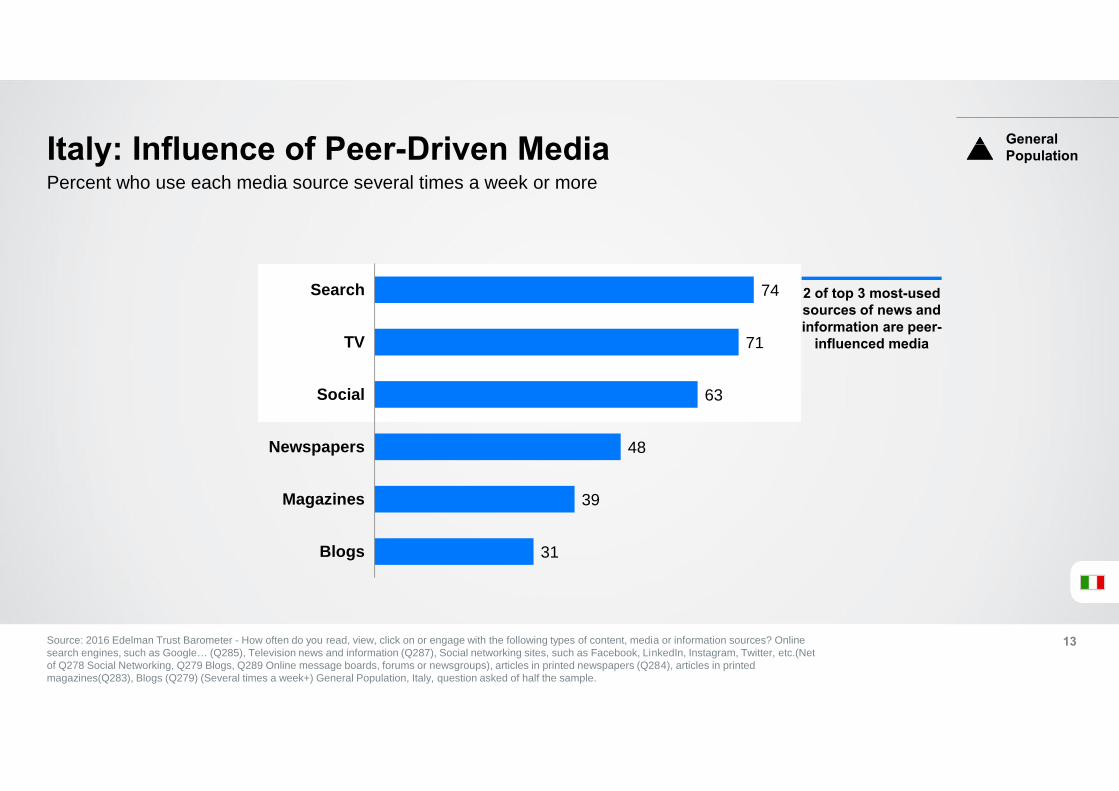
Italy: Influence of Peer-Driven Media
Source: 2016 Edelman Trust Barometer - How often do you read, view, click on or engage with the following types of content, media or information sources? Onlinesearch engines, such as Google… (Q285), Television news and information (Q287), Social networking sites, such as Facebook, LinkedIn, Instagram, Twitter, etc.(Netof Q278 Social Networking, Q279 Blogs, Q289 Online message boards, forums or newsgroups), articles in printed newspapers (Q284), articles in printedmagazines(Q283), Blogs (Q279) (Several times a week+) General Population, Italy, question asked of half the sample.
13
Percent who use each media source several times a week or more
GeneralPopulation
74
71
63
48
39
31
Search
TV
Social
Newspapers
Magazines
Blogs
2 of top 3 most-usedsources of news andinformation are peer-
influenced media
5855
59
51
39 38
29 29 29
61 6058
48 4845
3836 36
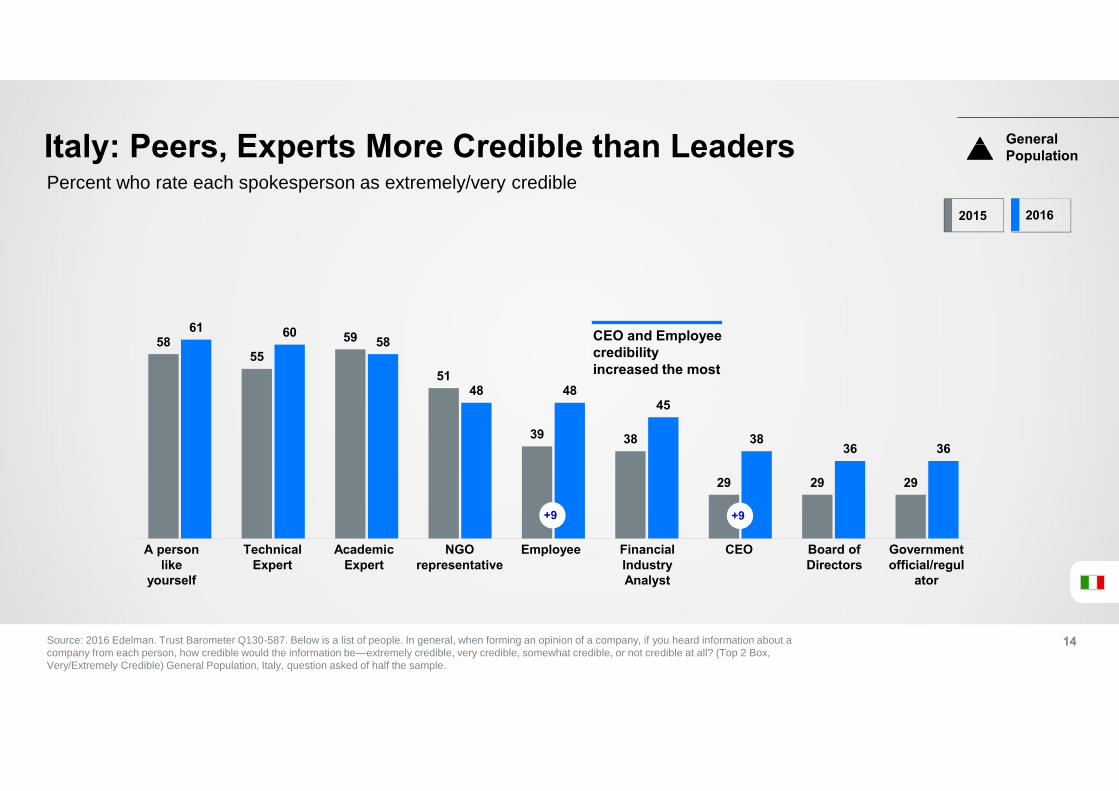
Italy: Peers, Experts More Credible than Leaders
Source: 2016 Edelman. Trust Barometer Q130-587. Below is a list of people. In general, when forming an opinion of a company, if you heard information about acompany from each person, how credible would the information be—extremely credible, very credible, somewhat credible, or not credible at all? (Top 2 Box,Very/Extremely Credible) General Population, Italy, question asked of half the sample.
14
Percent who rate each spokesperson as extremely/very credible2015 2016
+9+9
TechnicalExpert
AcademicExpert
A personlike
yourself
FinancialIndustryAnalyst
Employee CEONGOrepresentative
Board ofDirectors
Governmentofficial/regul
ator
CEO and Employeecredibilityincreased the most
GeneralPopulation
63 64
57
5048
41
50
39
33
6764 63
53 5249 48
44
35
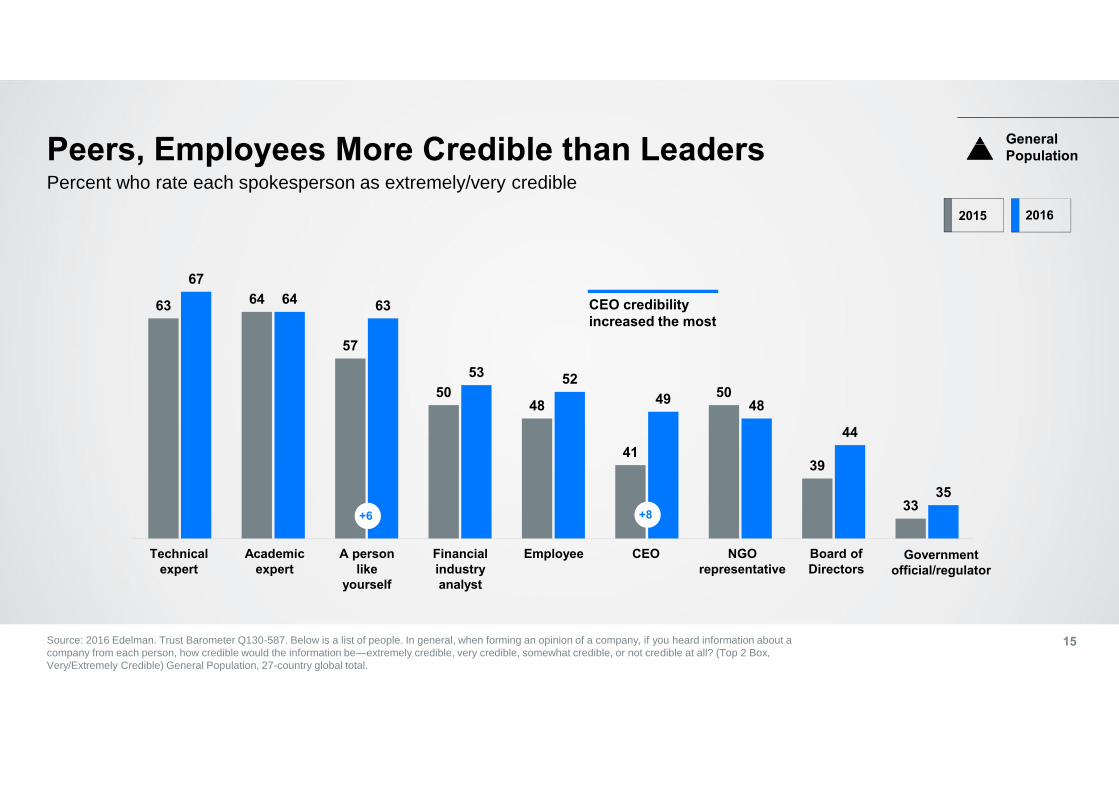
Peers, Employees More Credible than Leaders
Source: 2016 Edelman. Trust Barometer Q130-587. Below is a list of people. In general, when forming an opinion of a company, if you heard information about acompany from each person, how credible would the information be—extremely credible, very credible, somewhat credible, or not credible at all? (Top 2 Box,Very/Extremely Credible) General Population, 27-country global total.
15
Percent who rate each spokesperson as extremely/very credible2015 2016
+8
Technicalexpert
Academicexpert
A personlike
yourself
Financialindustryanalyst
Employee CEO NGOrepresentative
Board ofDirectors
Governmentofficial/regulator
CEO credibilityincreased the most
GeneralPopulation
+6
5348
4127
58 5750
30
6453 48
28
72 6855
35
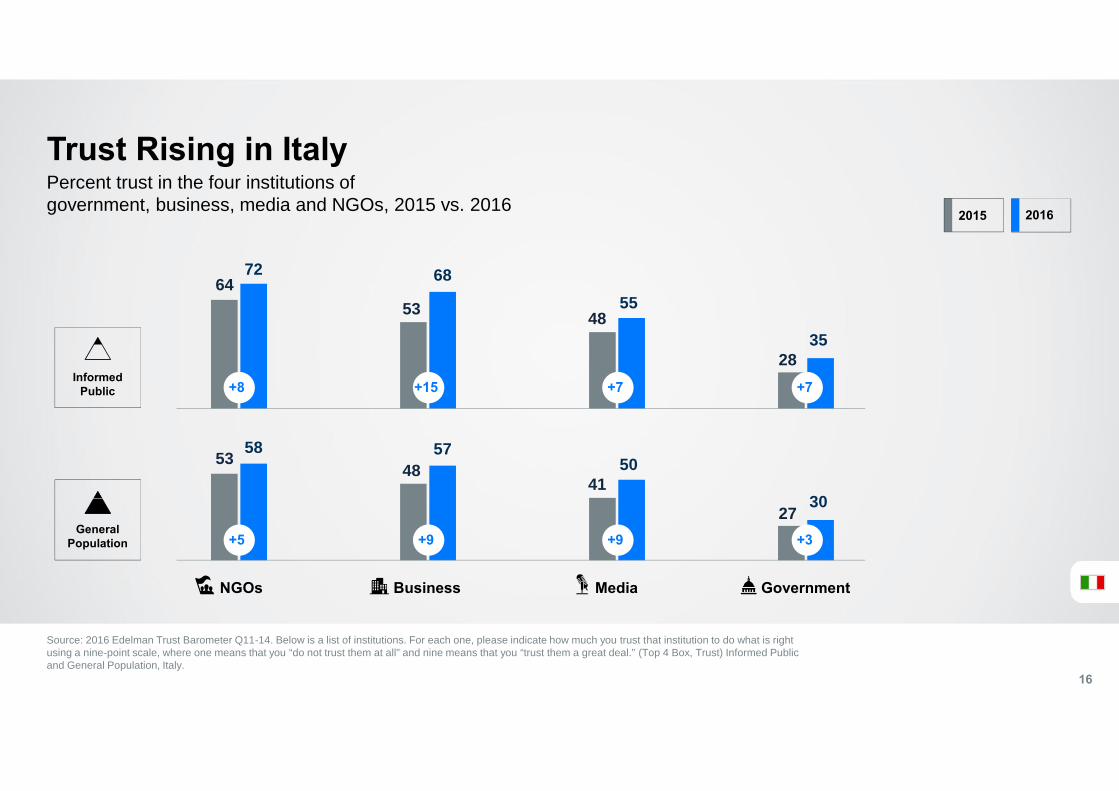
Trust Rising in Italy
Source: 2016 Edelman Trust Barometer Q11-14. Below is a list of institutions. For each one, please indicate how much you trust that institution to do what is rightusing a nine-point scale, where one means that you “do not trust them at all” and nine means that you “trust them a great deal.” (Top 4 Box, Trust) Informed Publicand General Population, Italy.
16
Percent trust in the four institutions ofgovernment, business, media and NGOs, 2015 vs. 2016
InformedPublic
GeneralPopulation
NGOs Business Media Government
+8 +15 +7 +7
2015 2016
+5 +9 +9 +3
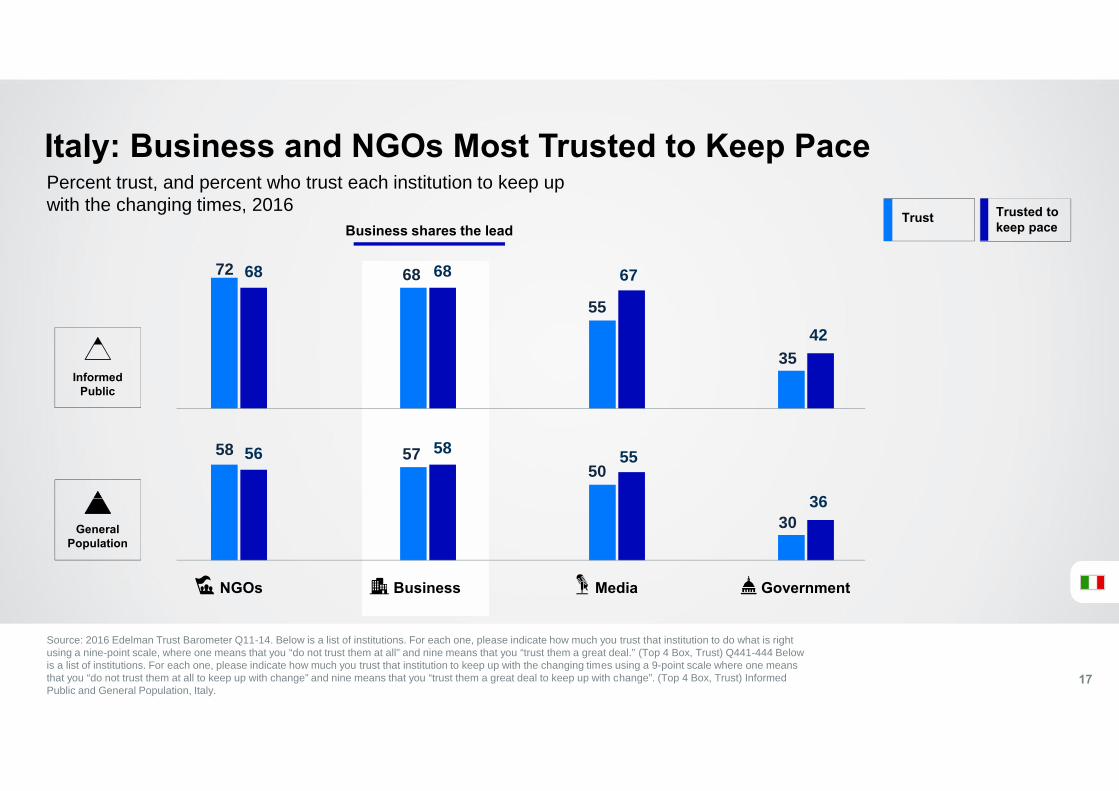
72 68
55
35
68 68 67
42
58 5750
30
56 58 55
36
NGOs Business Media Government
Italy: Business and NGOs Most Trusted to Keep Pace
Source: 2016 Edelman Trust Barometer Q11-14. Below is a list of institutions. For each one, please indicate how much you trust that institution to do what is rightusing a nine-point scale, where one means that you “do not trust them at all” and nine means that you “trust them a great deal.” (Top 4 Box, Trust) Q441-444 Belowis a list of institutions. For each one, please indicate how much you trust that institution to keep up with the changing times using a 9-point scale where one meansthat you “do not trust them at all to keep up with change” and nine means that you “trust them a great deal to keep up with change”. (Top 4 Box, Trust) InformedPublic and General Population, Italy.
17
Percent trust, and percent who trust each institution to keep upwith the changing times, 2016
InformedPublic
GeneralPopulation
Trust Trusted tokeep paceBusiness shares the lead
50%
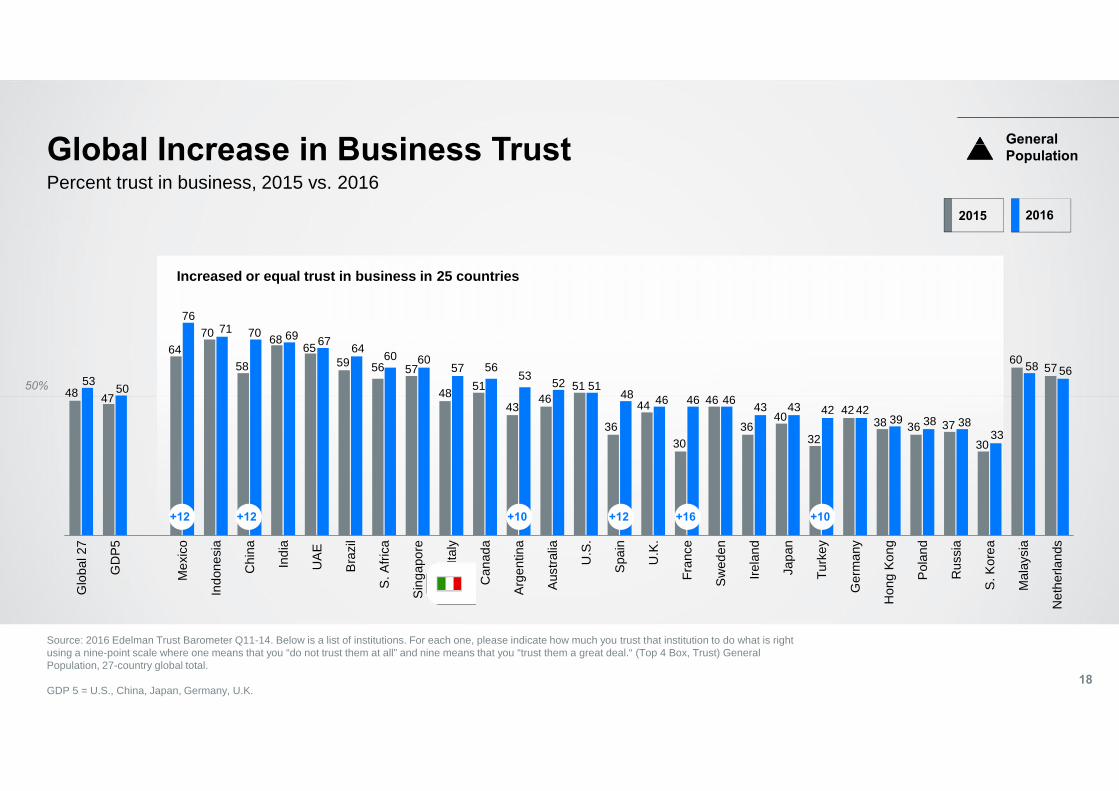
Source: 2016 Edelman Trust Barometer Q11-14. Below is a list of institutions. For each one, please indicate how much you trust that institution to do what is rightusing a nine-point scale where one means that you “do not trust them at all” and nine means that you “trust them a great deal.“ (Top 4 Box, Trust) GeneralPopulation, 27-country global total.
GDP 5 = U.S., China, Japan, Germany, U.K.
48 47
6470
58
6865
59 56 57
48 51
4346
51
36
44
30
46
3640
32
4238 36 37
30
6057
53 50
7671 70 69 67 64 60 60
57 5653 52 51
48 46 46 46 43 43 42 4239 38 38
33
58 56
Glo
bal 2
7
GD
P5
Mex
ico
Indo
nesi
a
Chi
na
Indi
a
UAE
Braz
il
S. A
frica
Sing
apor
e
Italy
Can
ada
Arge
ntin
a
Aust
ralia
U.S
.
Spai
n
U.K
.
Fran
ce
Swed
en
Irela
nd
Japa
n
Turk
ey
Ger
man
y
Hon
g Ko
ng
Pola
nd
Rus
sia
S. K
orea
Mal
aysi
a
Net
herla
nds
Global Increase in Business Trust
18
Percent trust in business, 2015 vs. 2016
Increased or equal trust in business in 25 countries
+12 +12 +10 +12 +16 +10
GeneralPopulation
2015 2016
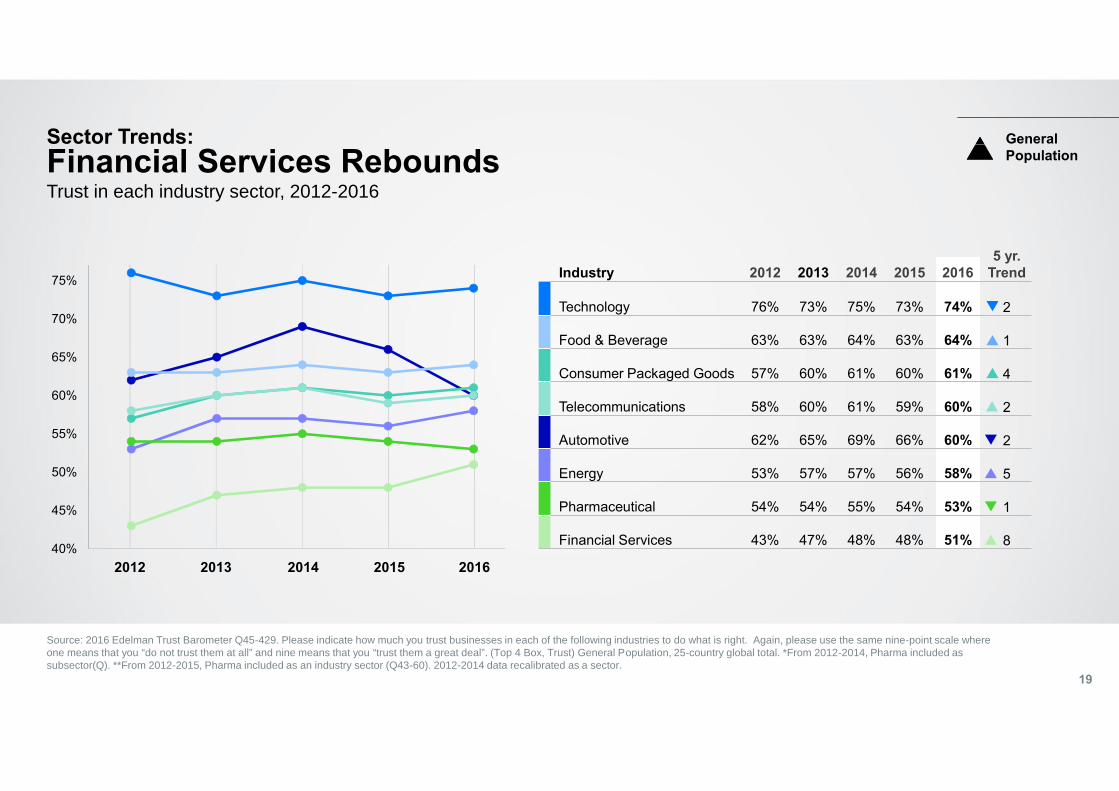
Industry 2012 2013 2014 2015 20165 yr.
Trend
Technology 76% 73% 75% 73% 74% 2
Food & Beverage 63% 63% 64% 63% 64% 1
Consumer Packaged Goods 57% 60% 61% 60% 61% 4
Telecommunications 58% 60% 61% 59% 60% 2
Automotive 62% 65% 69% 66% 60% 2
Energy 53% 57% 57% 56% 58% 5
Pharmaceutical 54% 54% 55% 54% 53% 1
Financial Services 43% 47% 48% 48% 51% 840%
45%
50%
55%
60%
65%
70%
75%
Sector Trends:Financial Services Rebounds
Source: 2016 Edelman Trust Barometer Q45-429. Please indicate how much you trust businesses in each of the following industries to do what is right. Again, please use the same nine-point scale whereone means that you “do not trust them at all” and nine means that you “trust them a great deal”. (Top 4 Box, Trust) General Population, 25-country global total. *From 2012-2014, Pharma included assubsector(Q). **From 2012-2015, Pharma included as an industry sector (Q43-60). 2012-2014 data recalibrated as a sector.
Trust in each industry sector, 2012-2016
2012 2013 2014 2015 2016
GeneralPopulation
19
20%
30%
40%
50%
60%
70%
80%
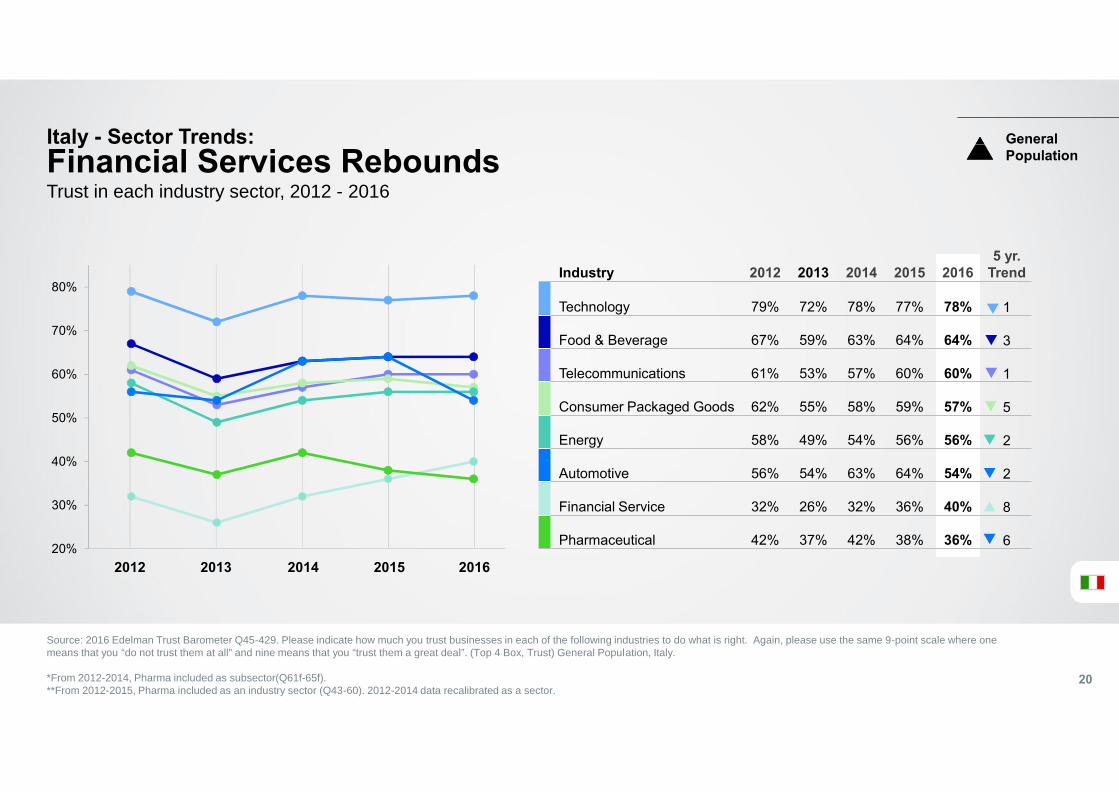
Italy - Sector Trends:Financial Services Rebounds
Source: 2016 Edelman Trust Barometer Q45-429. Please indicate how much you trust businesses in each of the following industries to do what is right. Again, please use the same 9-point scale where onemeans that you “do not trust them at all” and nine means that you “trust them a great deal”. (Top 4 Box, Trust) General Population, Italy.
*From 2012-2014, Pharma included as subsector(Q61f-65f).**From 2012-2015, Pharma included as an industry sector (Q43-60). 2012-2014 data recalibrated as a sector.
Trust in each industry sector, 2012 - 2016
2012 2013 2014 2015 2016
Industry 2012 2013 2014 2015 20165 yr.
Trend
Technology 79% 72% 78% 77% 78% 1
Food & Beverage 67% 59% 63% 64% 64% 3
Telecommunications 61% 53% 57% 60% 60% 1
Consumer Packaged Goods 62% 55% 58% 59% 57% 5
Energy 58% 49% 54% 56% 56% 2
Automotive 56% 54% 63% 64% 54% 2
Financial Service 32% 26% 32% 36% 40% 8
Pharmaceutical 42% 37% 42% 38% 36% 6
GeneralPopulation
20
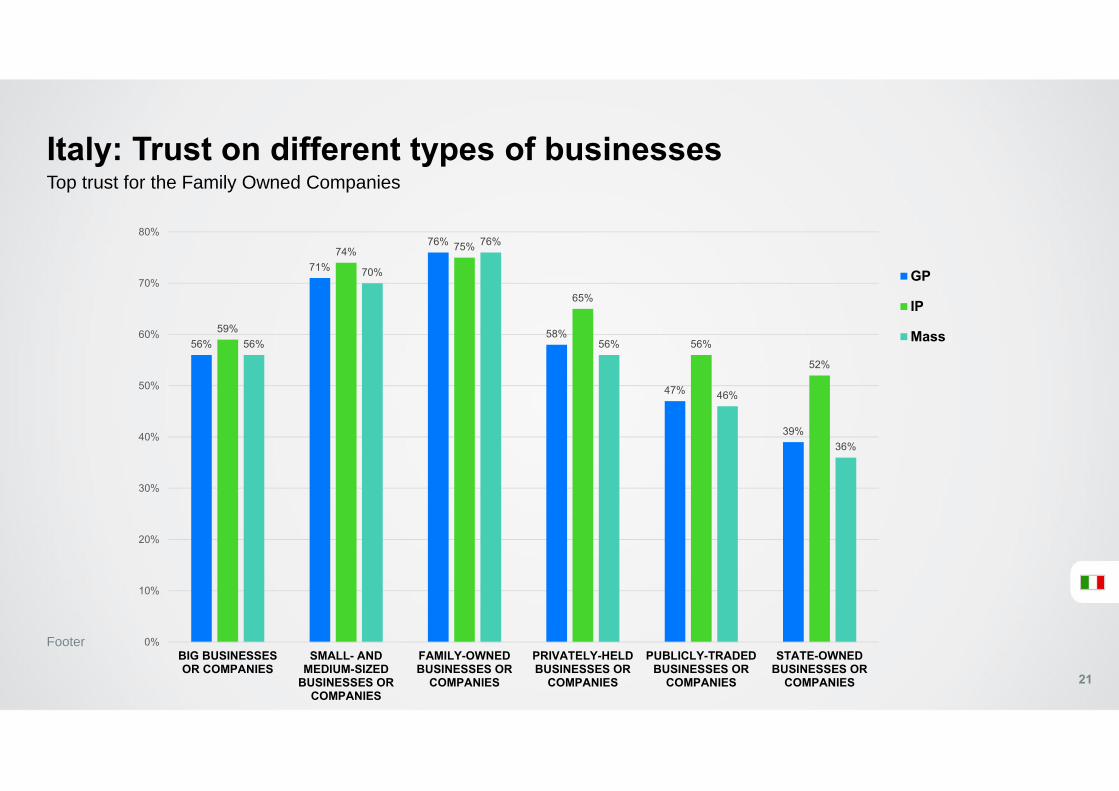
Italy: Trust on different types of businessesTop trust for the Family Owned Companies
Footer
21
56%
71%
76%
58%
47%
39%
59%
74% 75%
65%
56%
52%
56%
70%
76%
56%
46%
36%
0%
10%
20%
30%
40%
50%
60%
70%
80%
BIG BUSINESSESOR COMPANIES
SMALL- ANDMEDIUM-SIZED
BUSINESSES ORCOMPANIES
FAMILY-OWNEDBUSINESSES OR
COMPANIES
PRIVATELY-HELDBUSINESSES OR
COMPANIES
PUBLICLY-TRADEDBUSINESSES OR
COMPANIES
STATE-OWNEDBUSINESSES OR
COMPANIES
GP
IP
Mass
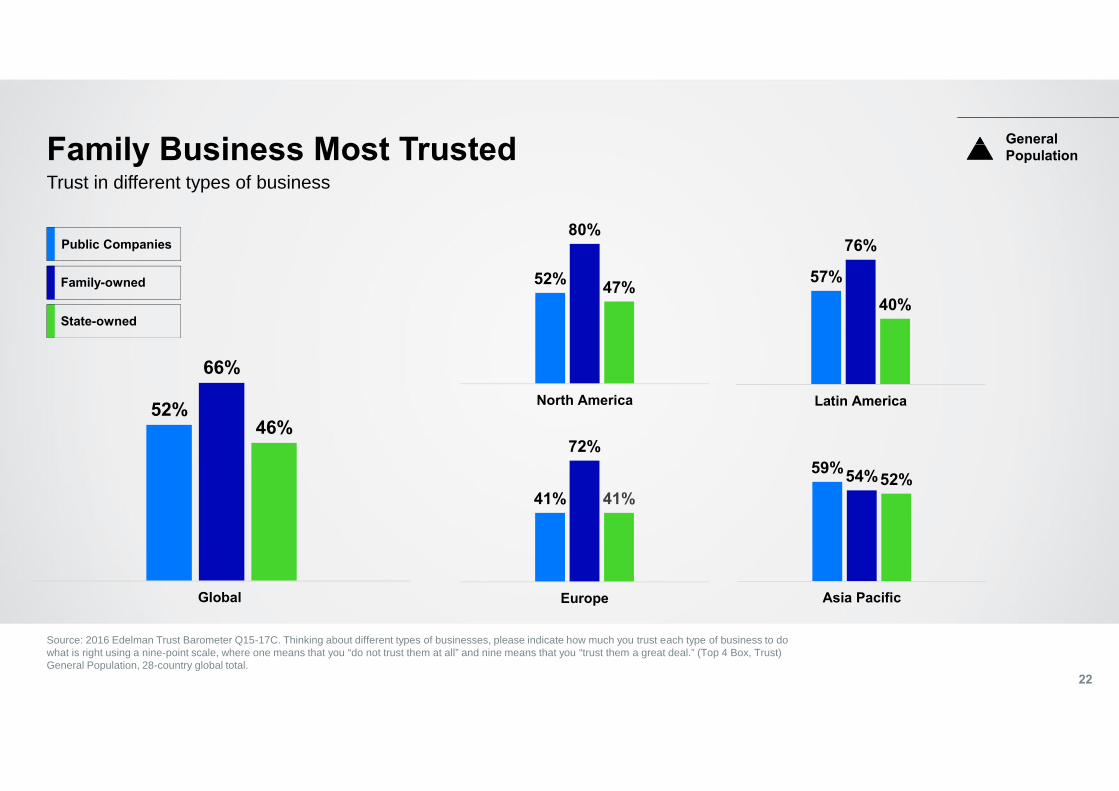
Family Business Most Trusted
Source: 2016 Edelman Trust Barometer Q15-17C. Thinking about different types of businesses, please indicate how much you trust each type of business to dowhat is right using a nine-point scale, where one means that you “do not trust them at all” and nine means that you “trust them a great deal.” (Top 4 Box, Trust)General Population, 28-country global total.
22
Trust in different types of business
52%
66%
46%
Global
59%54%52%
Asia Pacific
41%
72%
41%
Europe
52%
80%
47%
North America
57%
76%
40%
Latin America
Public Companies
Family-owned
State-owned
GeneralPopulation
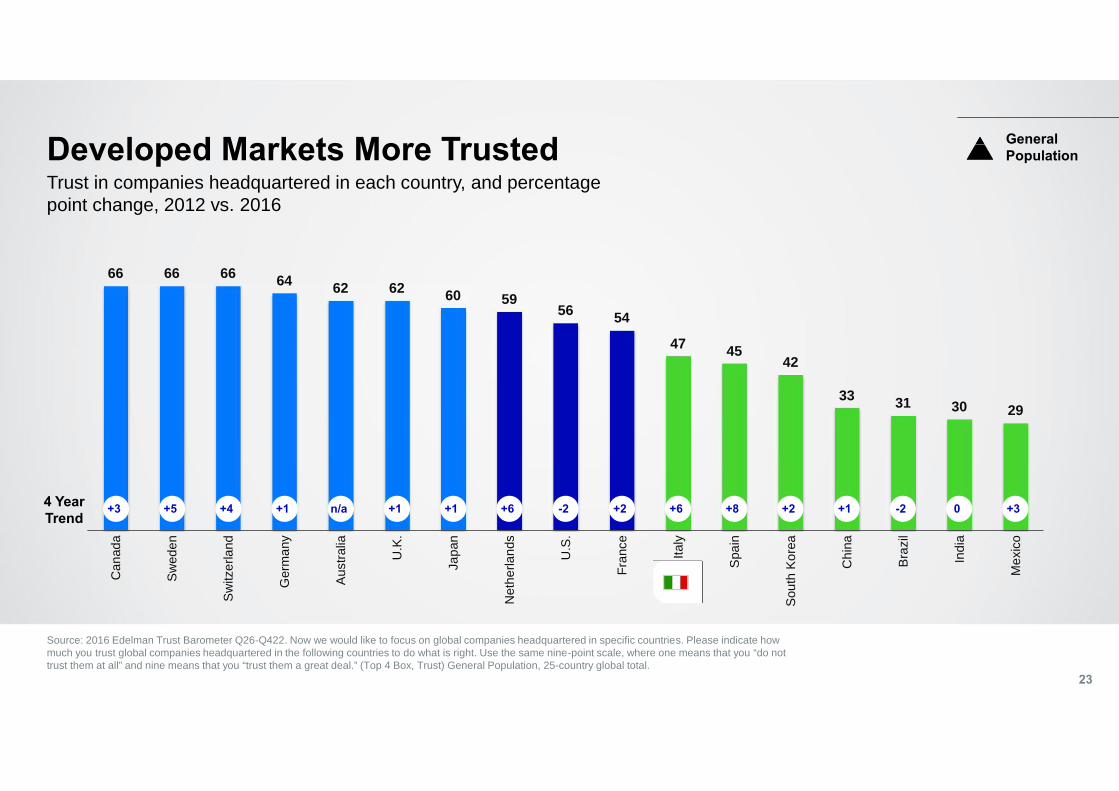
66 66 66 64 62 62 60 5956 54
47 4542
33 31 30 29
Can
ada
Swed
en
Switz
erla
nd
Ger
man
y
Aust
ralia
U.K
.
Japa
n
Net
herla
nds
U.S
.
Fran
ce
Italy
Spai
n
Sout
h Ko
rea
Chi
na
Braz
il
Indi
a
Mex
ico
Developed Markets More Trusted
Source: 2016 Edelman Trust Barometer Q26-Q422. Now we would like to focus on global companies headquartered in specific countries. Please indicate howmuch you trust global companies headquartered in the following countries to do what is right. Use the same nine-point scale, where one means that you “do nottrust them at all” and nine means that you “trust them a great deal.” (Top 4 Box, Trust) General Population, 25-country global total.
23
Trust in companies headquartered in each country, and percentagepoint change, 2012 vs. 2016
+6 -2 +6 +8 -2+1+1n/a+1+4+5+3 +2 +2 +1 0 +34 YearTrend
GeneralPopulation
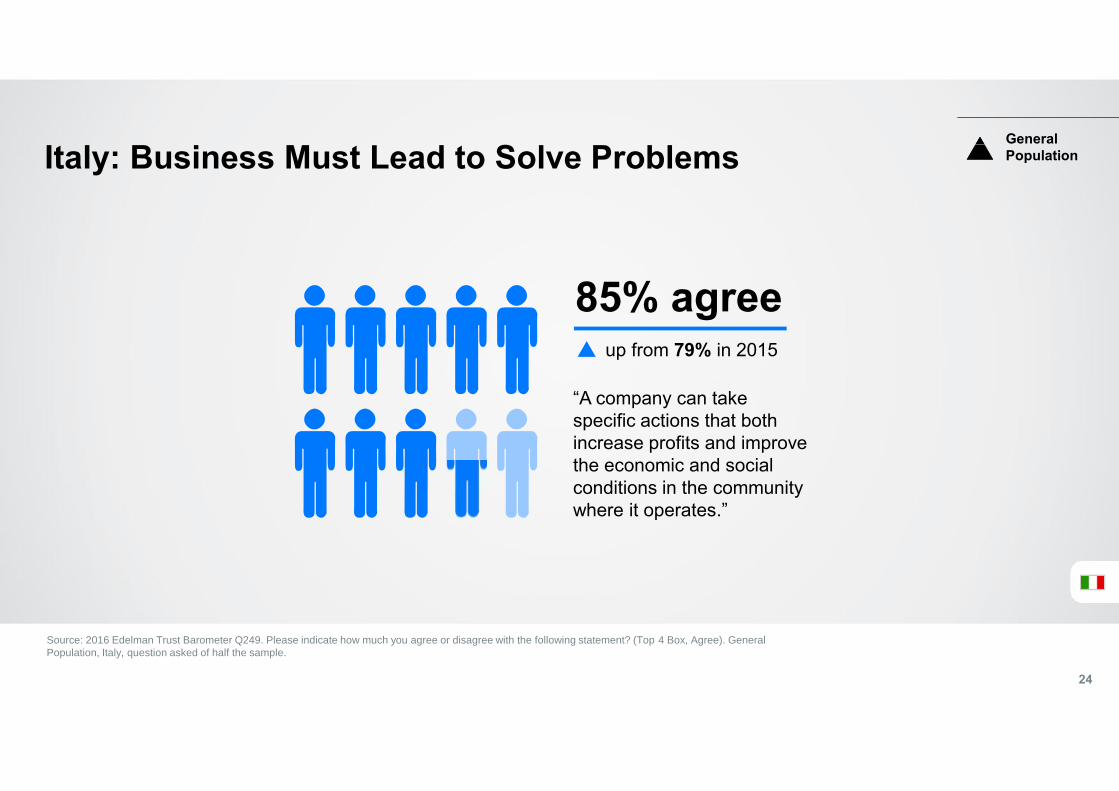
Italy: Business Must Lead to Solve Problems
Source: 2016 Edelman Trust Barometer Q249. Please indicate how much you agree or disagree with the following statement? (Top 4 Box, Agree). GeneralPopulation, Italy, question asked of half the sample.
85% agree
“A company can takespecific actions that bothincrease profits and improvethe economic and socialconditions in the communitywhere it operates.”
up from 79% in 2015
GeneralPopulation
24
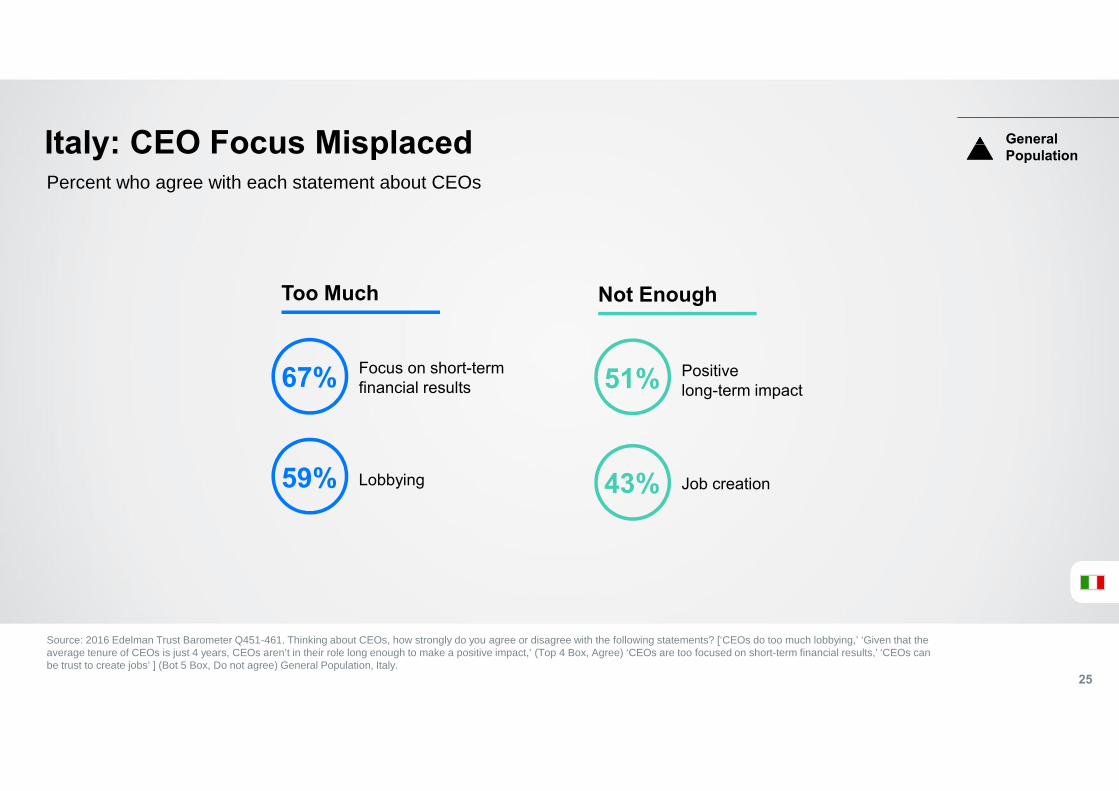
Italy: CEO Focus Misplaced
Source: 2016 Edelman Trust Barometer Q451-461. Thinking about CEOs, how strongly do you agree or disagree with the following statements? [‘CEOs do too much lobbying,’ ‘Given that theaverage tenure of CEOs is just 4 years, CEOs aren’t in their role long enough to make a positive impact,’ (Top 4 Box, Agree) ‘CEOs are too focused on short-term financial results,’ ‘CEOs canbe trust to create jobs’ ] (Bot 5 Box, Do not agree) General Population, Italy.
25
Percent who agree with each statement about CEOs
Focus on short-termfinancial results
Lobbying
Too Much
67%
59%
Not Enough
Job creation43%
Positivelong-term impact51%
GeneralPopulation
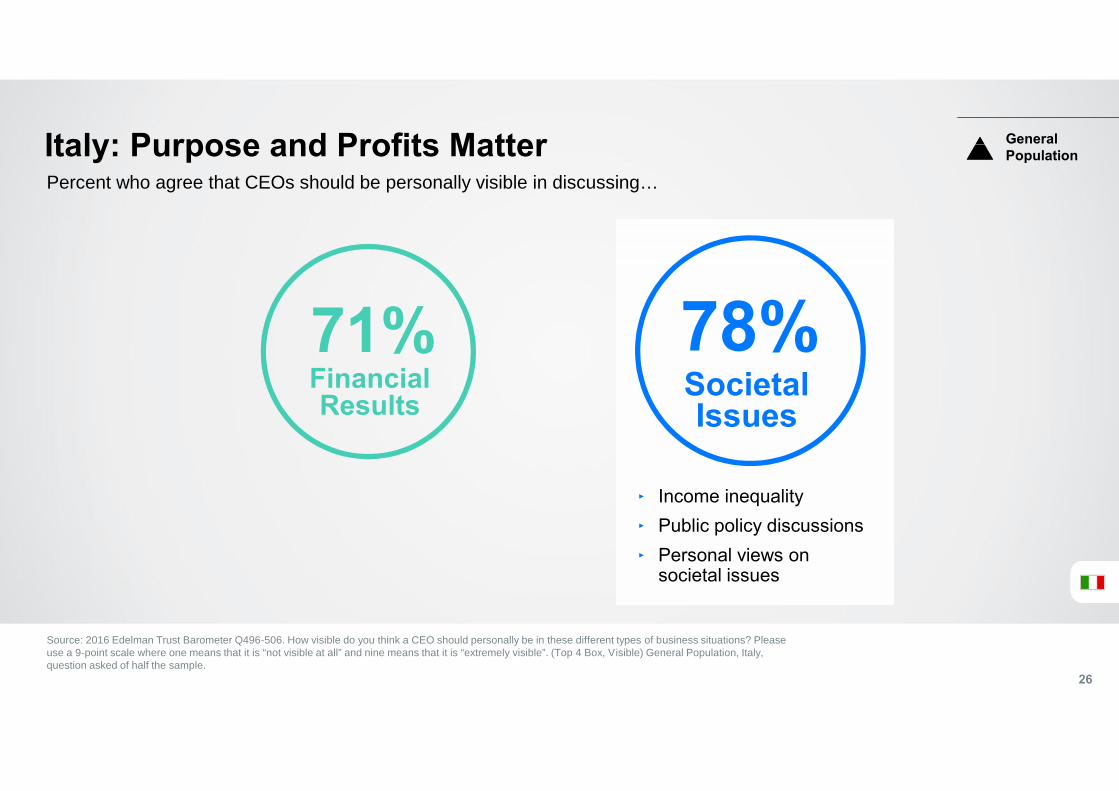
Italy: Purpose and Profits Matter
Source: 2016 Edelman Trust Barometer Q496-506. How visible do you think a CEO should personally be in these different types of business situations? Pleaseuse a 9-point scale where one means that it is “not visible at all” and nine means that it is “extremely visible”. (Top 4 Box, Visible) General Population, Italy,question asked of half the sample.
26
Percent who agree that CEOs should be personally visible in discussing…
78%SocietalIssues
‣ Income inequality‣ Public policy discussions‣ Personal views on
societal issues
71%FinancialResults
GeneralPopulation
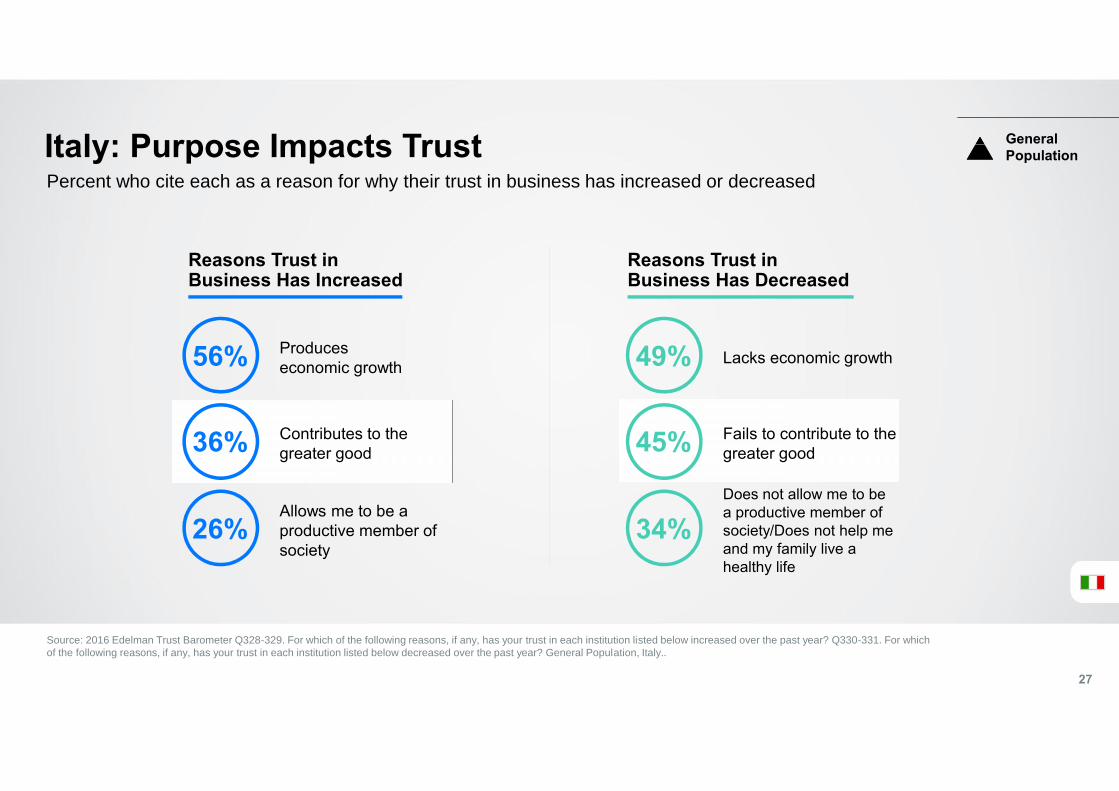
Italy: Purpose Impacts TrustPercent who cite each as a reason for why their trust in business has increased or decreased
Source: 2016 Edelman Trust Barometer Q328-329. For which of the following reasons, if any, has your trust in each institution listed below increased over the past year? Q330-331. For whichof the following reasons, if any, has your trust in each institution listed below decreased over the past year? General Population, Italy..
Reasons Trust inBusiness Has Increased
Reasons Trust inBusiness Has Decreased
Produceseconomic growth
Contributes to thegreater good
Allows me to be aproductive member ofsociety
Lacks economic growth
Fails to contribute to thegreater good
Does not allow me to bea productive member ofsociety/Does not help meand my family live ahealthy life
56%
36%
26%
49%
45%
34%
GeneralPopulation
27
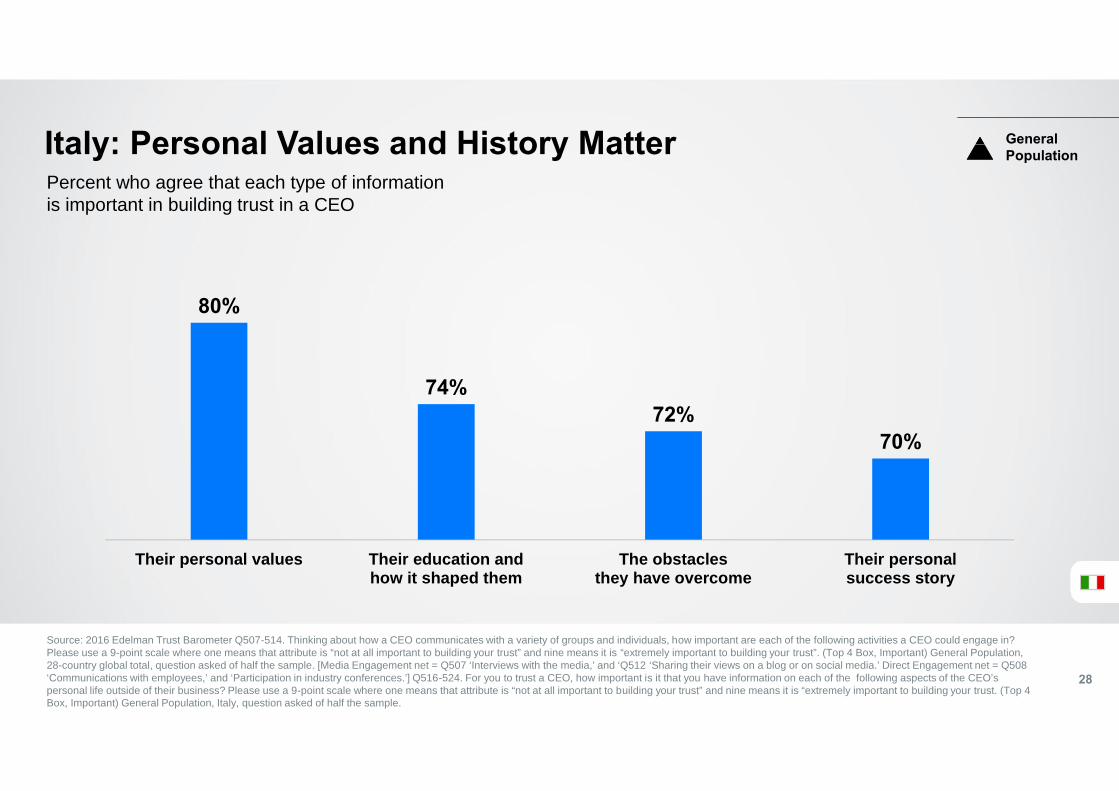
70%72%
74%
80%
Their personalsuccess story
The obstaclesthey have overcome
Their education andhow it shaped them
Their personal values
Italy: Personal Values and History Matter
Source: 2016 Edelman Trust Barometer Q507-514. Thinking about how a CEO communicates with a variety of groups and individuals, how important are each of the following activities a CEO could engage in?Please use a 9-point scale where one means that attribute is “not at all important to building your trust” and nine means it is “extremely important to building your trust”. (Top 4 Box, Important) General Population,28-country global total, question asked of half the sample. [Media Engagement net = Q507 ‘Interviews with the media,’ and ‘Q512 ‘Sharing their views on a blog or on social media.’ Direct Engagement net = Q508‘Communications with employees,’ and ‘Participation in industry conferences.’] Q516-524. For you to trust a CEO, how important is it that you have information on each of the following aspects of the CEO’spersonal life outside of their business? Please use a 9-point scale where one means that attribute is “not at all important to building your trust” and nine means it is “extremely important to building your trust. (Top 4Box, Important) General Population, Italy, question asked of half the sample.
Percent who agree that each type of informationis important in building trust in a CEO
GeneralPopulation
28
1619
16 18
2528
8 9 8
149 11
49
43
55
3237 37
31 3227
30 31
202016
1217
2024
69 7
1510 11
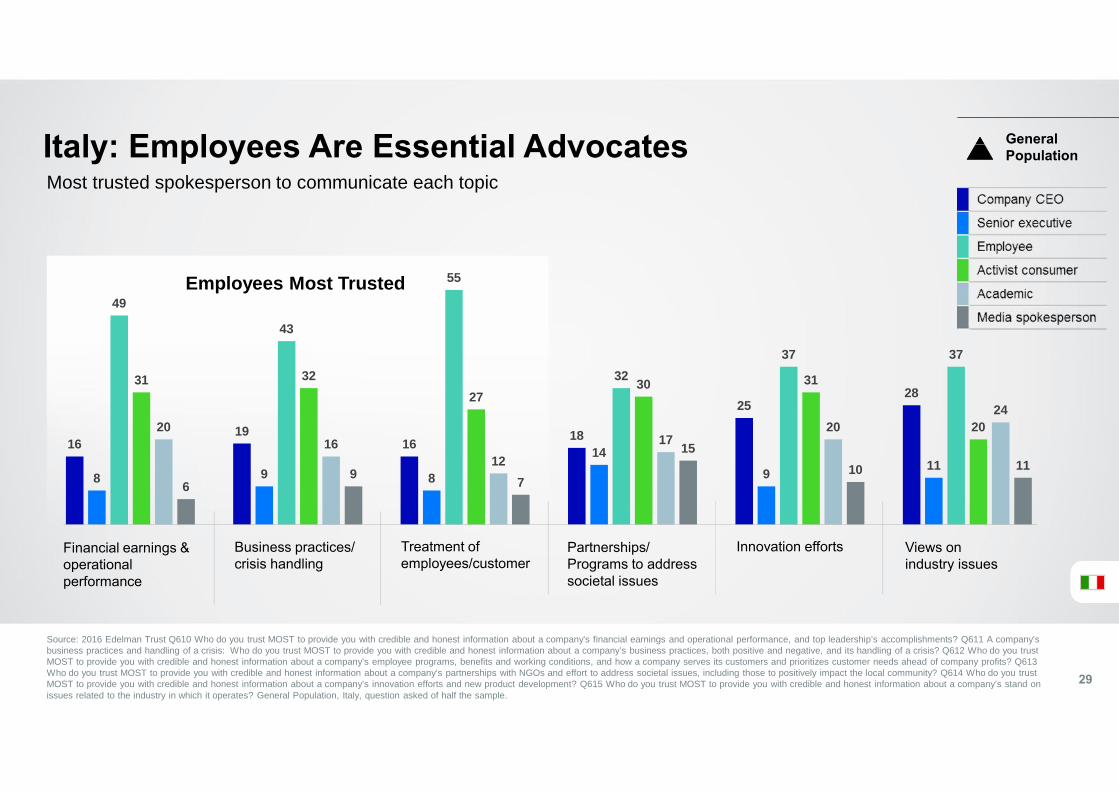
Italy: Employees Are Essential Advocates
Source: 2016 Edelman Trust Q610 Who do you trust MOST to provide you with credible and honest information about a company's financial earnings and operational performance, and top leadership’s accomplishments? Q611 A company’sbusiness practices and handling of a crisis: Who do you trust MOST to provide you with credible and honest information about a company’s business practices, both positive and negative, and its handling of a crisis? Q612 Who do you trustMOST to provide you with credible and honest information about a company’s employee programs, benefits and working conditions, and how a company serves its customers and prioritizes customer needs ahead of company profits? Q613Who do you trust MOST to provide you with credible and honest information about a company’s partnerships with NGOs and effort to address societal issues, including those to positively impact the local community? Q614 Who do you trustMOST to provide you with credible and honest information about a company’s innovation efforts and new product development? Q615 Who do you trust MOST to provide you with credible and honest information about a company’s stand onissues related to the industry in which it operates? General Population, Italy, question asked of half the sample.
29
Most trusted spokesperson to communicate each topic
Innovation effortsFinancial earnings &operationalperformance
Business practices/crisis handling
Treatment ofemployees/customer
Partnerships/Programs to addresssocietal issues
Views onindustry issues
Employees Most Trusted
GeneralPopulation
69
61
6668
70
59
4952
54
62
56
51
55 56
61
47
38
45 46
53
57
4547 48
44
30
35
40
45
50
55
60
65
70
75
2012 2013 2014 2015 2016
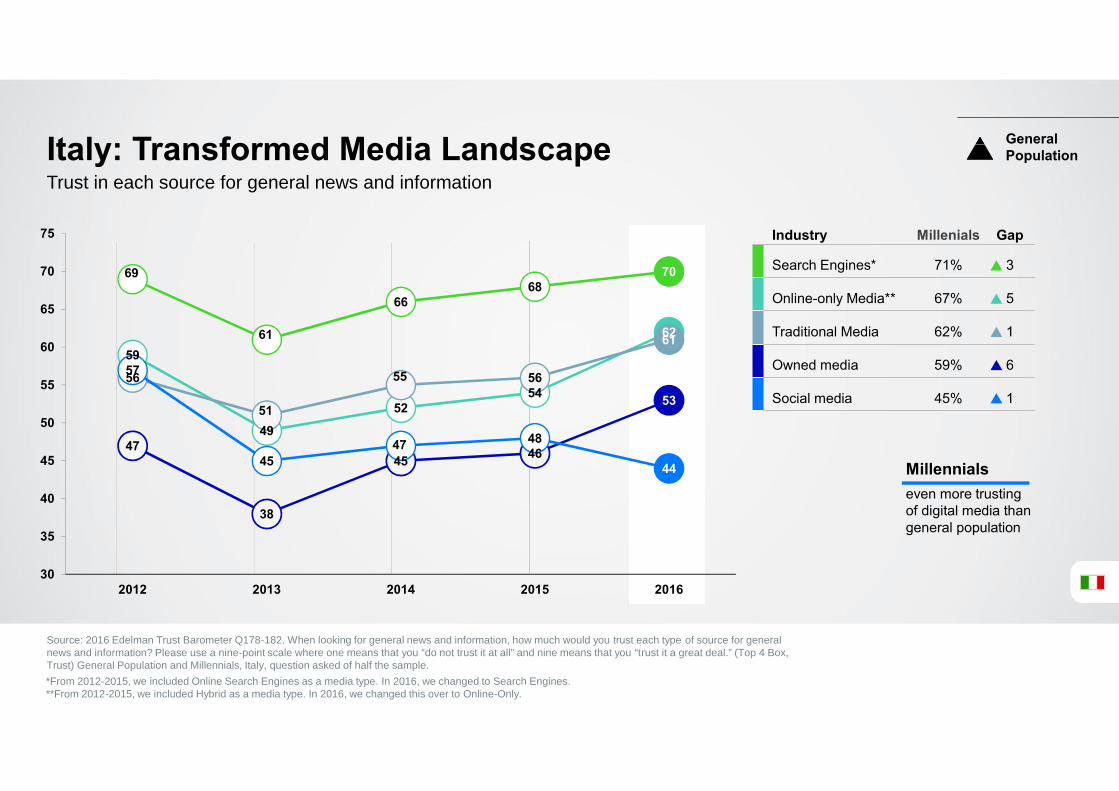
Italy: Transformed Media Landscape
Source: 2016 Edelman Trust Barometer Q178-182. When looking for general news and information, how much would you trust each type of source for generalnews and information? Please use a nine-point scale where one means that you “do not trust it at all” and nine means that you “trust it a great deal.” (Top 4 Box,Trust) General Population and Millennials, Italy, question asked of half the sample.
Trust in each source for general news and information
*From 2012-2015, we included Online Search Engines as a media type. In 2016, we changed to Search Engines.**From 2012-2015, we included Hybrid as a media type. In 2016, we changed this over to Online-Only.
Millennialseven more trustingof digital media thangeneral population
Industry Millenials Gap
Search Engines* 71% 3
Online-only Media** 67% 5
Traditional Media 62% 1
Owned media 59% 6
Social media 45% 1
GeneralPopulation
58
53
44
63
46
2012 2013 2014 2015 2016
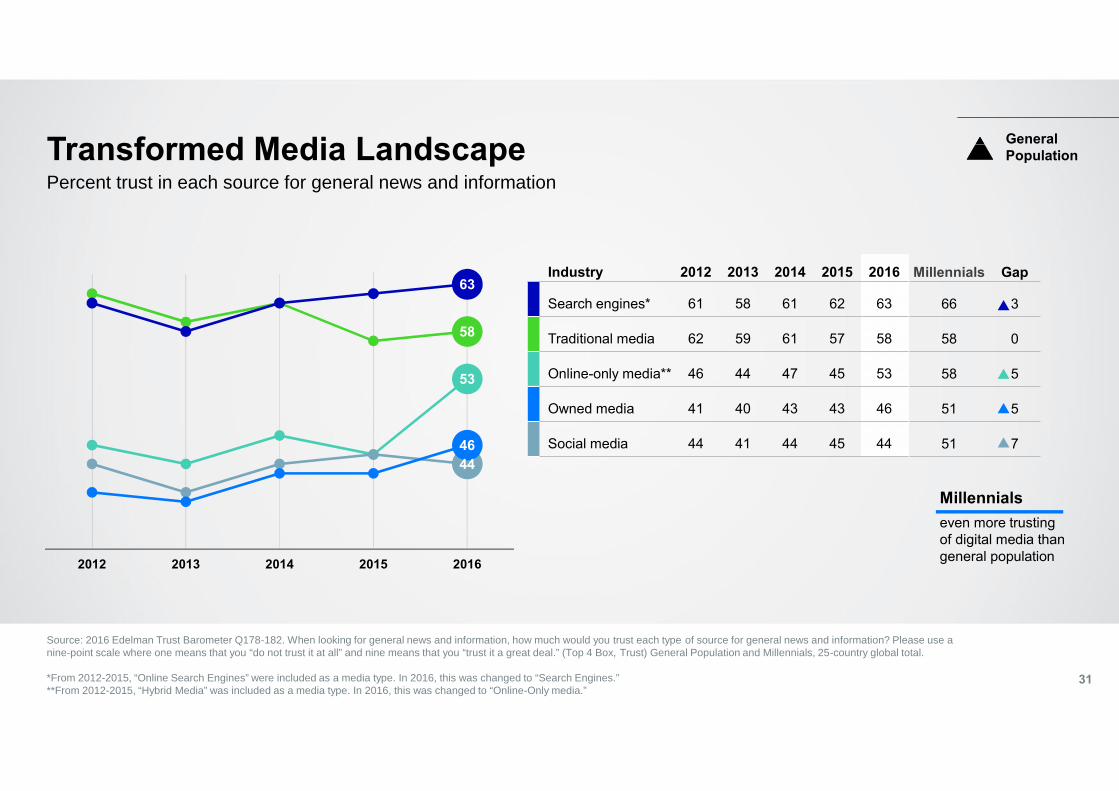
Transformed Media Landscape
Source: 2016 Edelman Trust Barometer Q178-182. When looking for general news and information, how much would you trust each type of source for general news and information? Please use anine-point scale where one means that you “do not trust it at all” and nine means that you “trust it a great deal.” (Top 4 Box, Trust) General Population and Millennials, 25-country global total.
*From 2012-2015, “Online Search Engines” were included as a media type. In 2016, this was changed to “Search Engines.”**From 2012-2015, “Hybrid Media” was included as a media type. In 2016, this was changed to “Online-Only media.”
Percent trust in each source for general news and information
Millennialseven more trustingof digital media thangeneral population
Industry 2012 2013 2014 2015 2016
Search engines* 61 58 61 62 63
Traditional media 62 59 61 57 58
Online-only media** 46 44 47 45 53
Owned media 41 40 43 43 46
Social media 44 41 44 45 44
GeneralPopulation
31
Millennials Gap
66 3
58 0
58 5
51 5
51 7
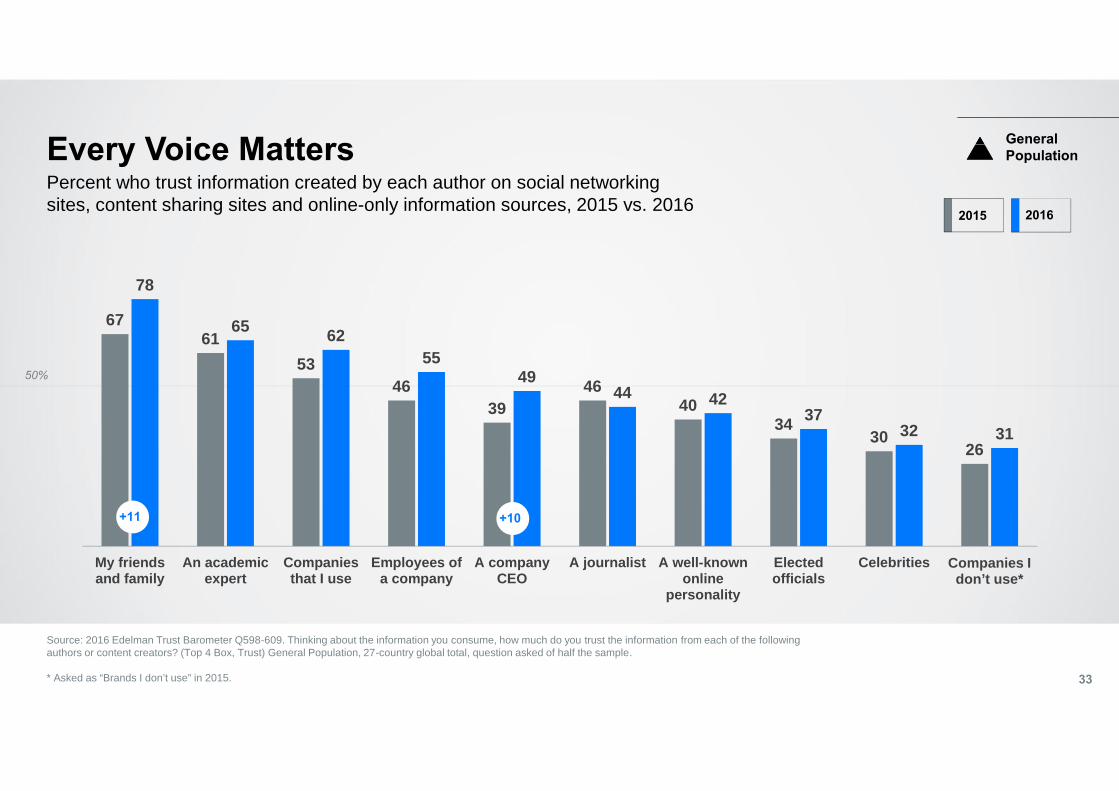
63
53 5044
3037 37
26 26 24
73
60 59 56
45 4238 37
33 31
My friendsand family
An academicexpert
Companies Iuse
Employees ofa company
A companyceo
A well-knownonline
personality
A journalist Companies[brands] Idon’t use
Electedofficials
Celebrities
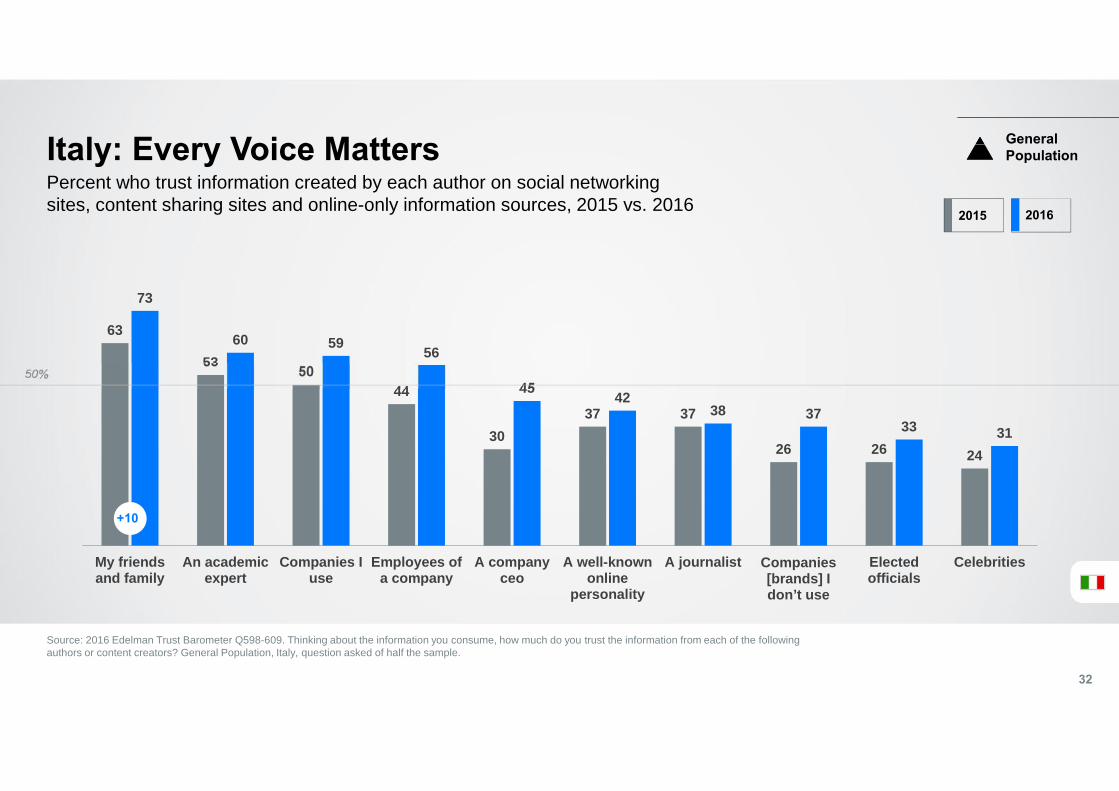
Italy: Every Voice Matters
Source: 2016 Edelman Trust Barometer Q598-609. Thinking about the information you consume, how much do you trust the information from each of the followingauthors or content creators? General Population, Italy, question asked of half the sample.
32
Percent who trust information created by each author on social networkingsites, content sharing sites and online-only information sources, 2015 vs. 2016 2015 2016
+10
GeneralPopulation
50%
6761
5346
3946
4034
3026
78
65 6255
4944 42
3732 31
My friendsand family
An academicexpert
Companiesthat I use
Employees ofa company
A companyCEO
A journalist A well-knownonline
personality
Electedofficials
Celebrities Companies Idon’t use*
Every Voice Matters
Source: 2016 Edelman Trust Barometer Q598-609. Thinking about the information you consume, how much do you trust the information from each of the followingauthors or content creators? (Top 4 Box, Trust) General Population, 27-country global total, question asked of half the sample.
* Asked as “Brands I don’t use” in 2015. 33
Percent who trust information created by each author on social networkingsites, content sharing sites and online-only information sources, 2015 vs. 2016
+11
GeneralPopulation
+10
2015 2016
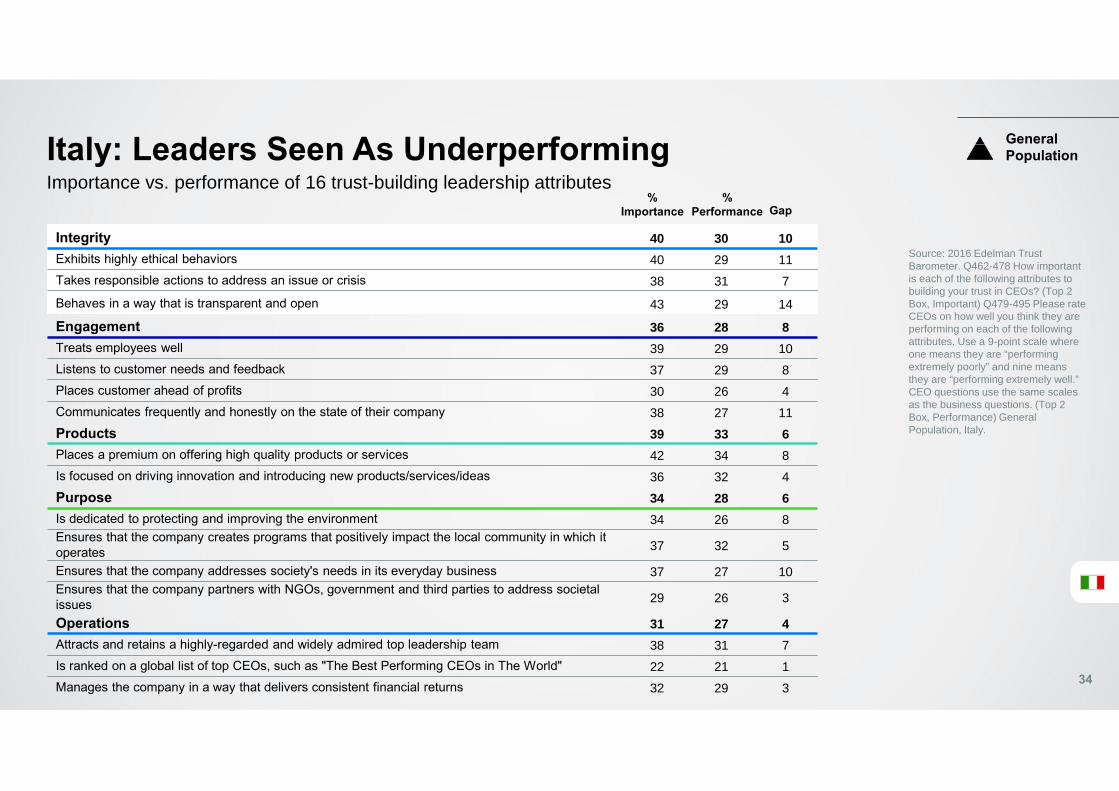
Integrity 40 30 10Exhibits highly ethical behaviors 40 29 11Takes responsible actions to address an issue or crisis 38 31 7
Behaves in a way that is transparent and open 43 29 14
Engagement 36 28 8Treats employees well 39 29 10Listens to customer needs and feedback 37 29 8Places customer ahead of profits 30 26 4Communicates frequently and honestly on the state of their company 38 27 11Products 39 33 6Places a premium on offering high quality products or services 42 34 8Is focused on driving innovation and introducing new products/services/ideas 36 32 4Purpose 34 28 6Is dedicated to protecting and improving the environment 34 26 8Ensures that the company creates programs that positively impact the local community in which itoperates 37 32 5
Ensures that the company addresses society's needs in its everyday business 37 27 10Ensures that the company partners with NGOs, government and third parties to address societalissues 29 26 3
Operations 31 27 4Attracts and retains a highly-regarded and widely admired top leadership team 38 31 7Is ranked on a global list of top CEOs, such as "The Best Performing CEOs in The World" 22 21 1Manages the company in a way that delivers consistent financial returns 32 29 3
Italy: Leaders Seen As Underperforming
Source: 2016 Edelman TrustBarometer. Q462-478 How importantis each of the following attributes tobuilding your trust in CEOs? (Top 2Box, Important) Q479-495 Please rateCEOs on how well you think they areperforming on each of the followingattributes. Use a 9-point scale whereone means they are “performingextremely poorly” and nine meansthey are “performing extremely well.”CEO questions use the same scalesas the business questions. (Top 2Box, Performance) GeneralPopulation, Italy.
Importance vs. performance of 16 trust-building leadership attributes%
Importance%
Performance Gap
GeneralPopulation
34
45
33
26
31
17
8
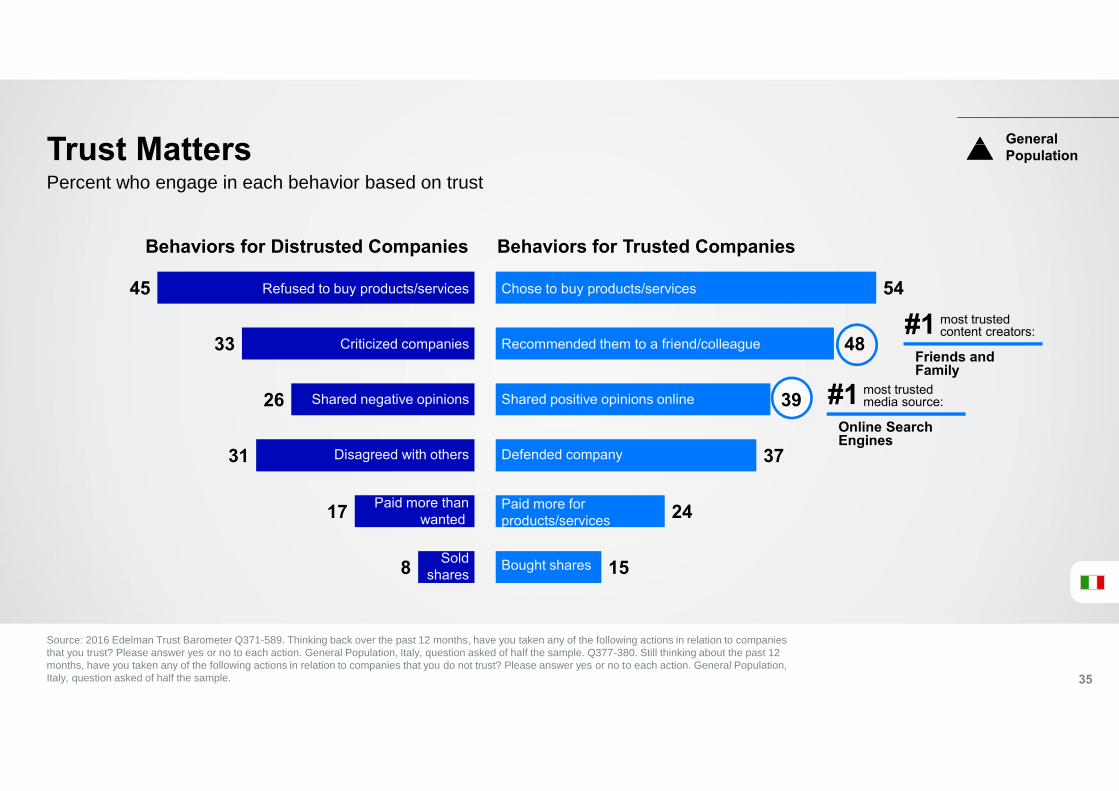
Trust Matters
Source: 2016 Edelman Trust Barometer Q371-589. Thinking back over the past 12 months, have you taken any of the following actions in relation to companiesthat you trust? Please answer yes or no to each action. General Population, Italy, question asked of half the sample. Q377-380. Still thinking about the past 12months, have you taken any of the following actions in relation to companies that you do not trust? Please answer yes or no to each action. General Population,Italy, question asked of half the sample. 35
Percent who engage in each behavior based on trust
54
48
39
37
24
15
Behaviors for Distrusted Companies Behaviors for Trusted Companies
Refused to buy products/services
Criticized companies
Shared negative opinions
Disagreed with others
Paid more thanwanted
Soldshares
Chose to buy products/services
Recommended them to a friend/colleague
Shared positive opinions online
Defended company
Paid more forproducts/services
Bought shares
most trustedcontent creators:#1
Friends andFamily
most trustedmedia source:#1
Online SearchEngines
GeneralPopulation
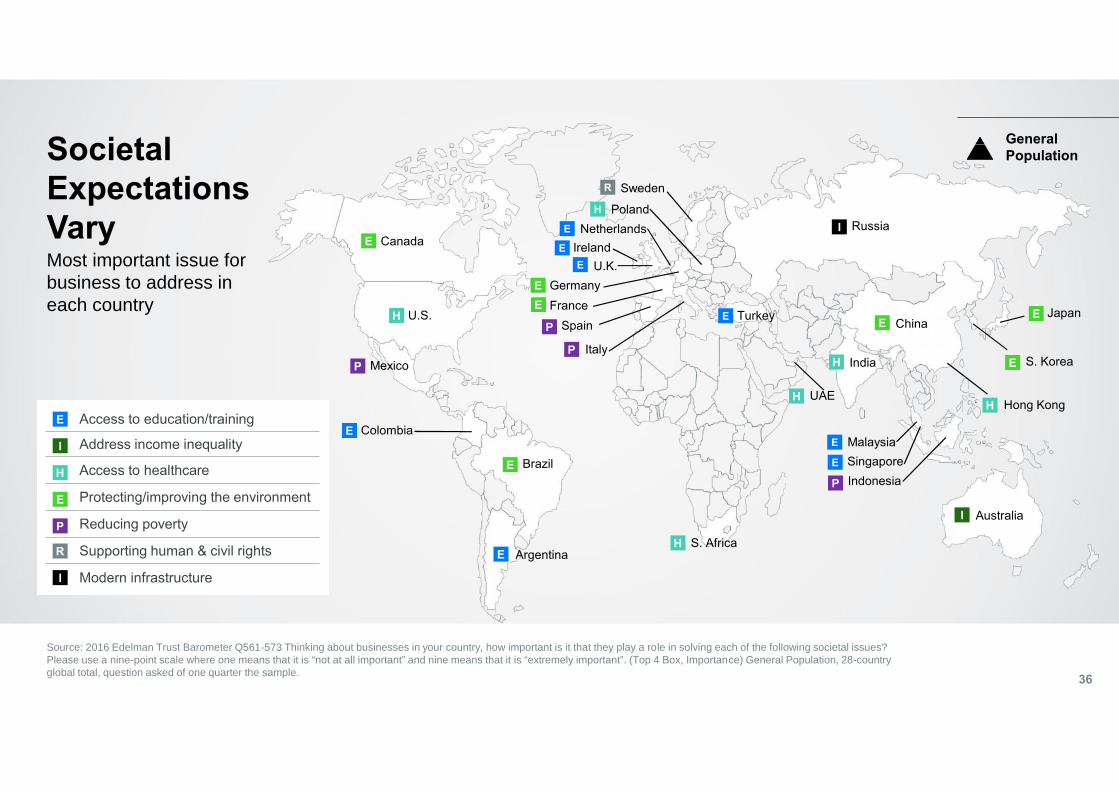
Access to education/training
Address income inequality
Access to healthcare
Protecting/improving the environment
Reducing poverty
Supporting human & civil rights
Modern infrastructure
E
E
P
H
Source: 2016 Edelman Trust Barometer Q561-573 Thinking about businesses in your country, how important is it that they play a role in solving each of the following societal issues?Please use a nine-point scale where one means that it is “not at all important” and nine means that it is “extremely important”. (Top 4 Box, Importance) General Population, 28-countryglobal total, question asked of one quarter the sample.
SocietalExpectationsVary
36
Most important issue forbusiness to address ineach country
Canada
Brazil
GermanyFrance
ChinaU.S.
Poland
Argentina
Sweden
Mexico
U.K.Ireland
Netherlands
Turkey
Singapore
Hong Kong
MalaysiaColombia
Japan
Australia
Russia
S. KoreaItaly
Spain
Indonesia
UAE
S. Africa
India
GeneralPopulation
R
I
IE
E
R
H
E
EE
EE
P
P
E
H
P
E
H
H
H
E
E
E
E
E
P
I
H
E
I
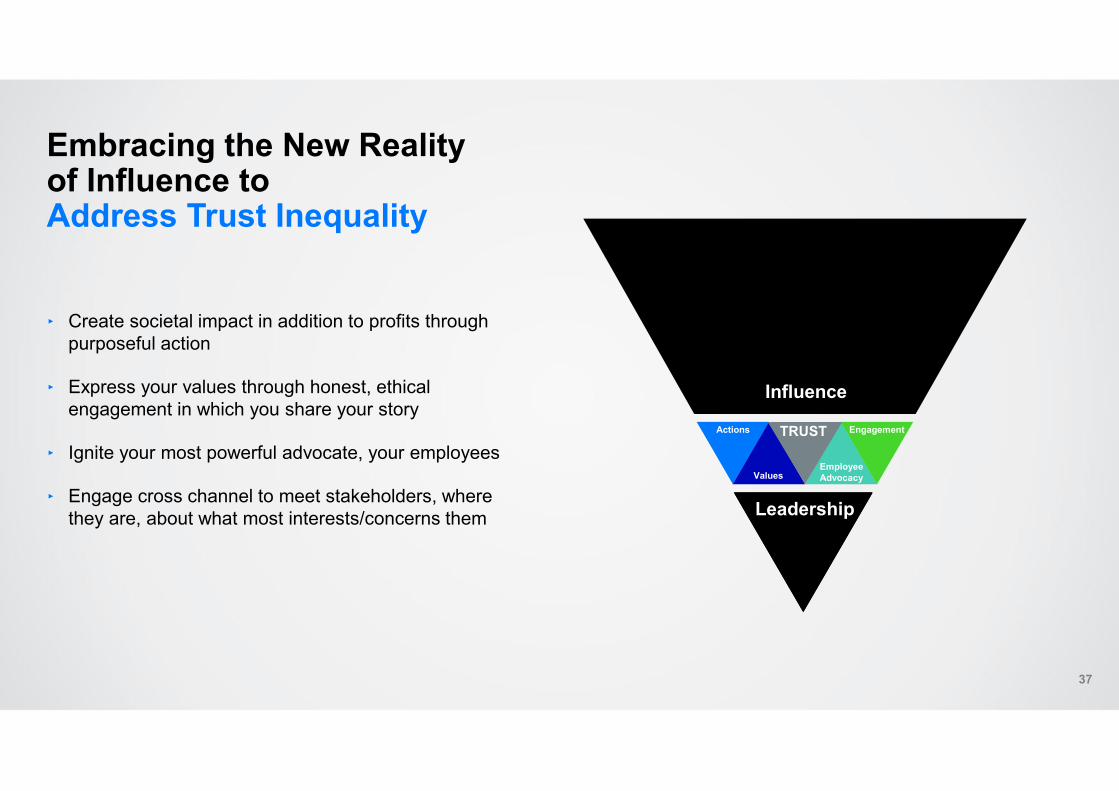
Embracing the New Realityof Influence toAddress Trust Inequality
37
‣ Create societal impact in addition to profits throughpurposeful action
‣ Express your values through honest, ethicalengagement in which you share your story
‣ Ignite your most powerful advocate, your employees
‣ Engage cross channel to meet stakeholders, wherethey are, about what most interests/concerns them
Actions
ValuesEmployeeAdvocacy
Engagement
Influence
AuthorityLeadership
TRUST