Embed Size (px)
Citation preview

UD ADVANCE 2016 Faculty Climate Survey Report 1
2016 ADVANCE Faculty Climate Survey Report
Prepared by the leaders of the UD ADVANCE Program
Dr. Pam Cook, PI, Unidel Professor of Mathematical Sciences & Associate Dean of Engineering Dr. Robin Andreasen, Co-PI, Associate Professor of Linguistics & Cognitive Science
Dr. Heather Doty, Co-PI, Assistant Professor of Mechanical Engineering Dr. John Sawyer, Co-PI, Professor of Business Administration & Associate Provost, IRE
Dr. Shawna Vican, Director, UD ADVANCE Institute The UD ADVANCE Institute, funded by the NSF Grant No. HRD-1409472, operates with the broad goal of promoting faculty diversity.1 We seek to increase the representation, retention, and advancement of women faculty, especially in areas in which they are under-represented. In order to continue and sustain institutional change, our work aims to improve the climate for all faculty. For additional information about the ADVANCE Institute and our work on campus, please see: http://sites.udel.edu/advance/. UD ADVANCE conducts a faculty climate survey every two years. The survey is designed to provide much needed data on the climate for faculty at UD, inform ADVANCE programmatic activities, and help us identify additional areas to focus on. The survey will also be used as part of our research agenda. The purpose of this report is to provide an overview of major themes and results from the 2016 Faculty Climate Survey. Please direct questions to Shawn Vican, Director, UD ADVANCE Institute: [email protected]. Report Structure Section 1: Background and Methodology (pages 2-4) Section 2: Work Satisfaction & Departmental Climate (pages 5-11) Section 3: Promotion & Tenure Process (pages 12-16) Section 4: Mentoring (pages 17-18) Section 5: Work-Life Balance (pages 19-24) Section 6: Climate for Diversity (pages 25-33) Section 7: Experiences of CT Faculty (pages 34-39)
1 For more about the objectives of the grant, please see: http://sites.udel.edu/advance/resources-new/program-documents/

UD ADVANCE 2016 Faculty Climate Survey Report 2
Section 1: Background & Methodology
Survey Development The 2016 survey instrument was based largely on the first ADVANCE Faculty Climate Survey, conducted in 2014. The ADVANCE research team created this survey to include scales and measures common across faculty surveys at other ADVANCE institutions. Additional questions were developed to address areas of programmatic and research interest to the UD ADVANCE Institute. For the 2016 survey, the research team used the 2014 survey as a base while revising some items and adding a more robust set of scales and questions around topics including mentoring, climate for diversity, and departmental climate. To allow for longitudinal analysis, subsequent waves of the faculty climate survey will employ 2016 survey items and scales. The 2016 faculty climate survey was administered from April 8-May 23. The initial email invitation to participate in the survey was sent from the university president, with subsequent reminders from the provost, the chair of the faculty senate, and the ADVANCE director. The survey population included all full-time tenured, tenure-track, and continuing track faculty who were not on leave in spring 2016 (N=1,049). Methodology The majority of survey questions were 5- or 7-point items measuring faculty attitudes or perceptions of UD policies and climate. For these continuous scale questions, we conducted two-way analysis of variance to compare faculty mean responses by gender and rank. We include gender and rank in all models unless otherwise specified. When gender and/or rank showed a statistically significant effect, we ran post-hoc analysis to determine where the significant differences occurred between categories of respondents. Thus a significant effect for gender can be interpreted as a difference in the mean response of men and women, after controlling for rank. For questions with categorical response variables, such as whether respondents had stopped the tenure clock, we use chi-square tests (or Fisher’s exact tests, when applicable) to determine whether there are significant differences in responses by gender and, separately, by race. For ease of interpretation, tables include both frequencies for a subset of response categories, as well as estimated marginal means (least squares means) for categories of respondents (i.e., categories of rank and gender), making note of significant differences between these groups. Matching symbols denote statistically significant differences. Several scales were constructed using multiple survey items. We report scale reliability (Cronbach’s alpha) and composite scores for these scales. We chose a minimum a coefficient of 0.8 for scales.

UD ADVANCE 2016 Faculty Climate Survey Report 3
Throughout the report, main analyses are conducted on tenured and tenure-track (T/TT) respondents. The report includes a separate section with results for continuing track (CT) faculty (see Section 7, “Experiences of CT Faculty”). We report results for CT faculty only for questions pertinent to their job and when their response rate was high enough to allow for meaningful analysis. Due to low numbers, this report does not disaggregate by race in main models or in qualitative results. For results related to race/ethnicity, see Section 6, “Climate for Diversity, Faculty of Color.” In this section we model the effects of race/ethnicity on a number of climate variables. Due to the low sample size for faculty of color, we do not control for gender or rank in these models. The survey included several open-ended questions allowing for written comments. These comments were coded using an open coding process. Responses were read to develop an initial set of codes, which was then revised throughout the coding process. We report themes that emerged from the data, but do not include quotes to maintain confidentiality. Sample Characteristics 525 full-time faculty members opened the survey, with 393 completing the survey, yielding a 37.5% response rate and 74.9% completion rate. Some faculty (N=40) chose to skip one or more of the demographic items on the survey, but among those that reported demographics we note several differences between survey respondents and the UD faculty population.
• Rank, Tenure Status: As compared to the UD faculty population, CT faculty are underrepresented. Among T/TT faculty, respondents are slightly overrepresented among more senior faculty ranks (see Table 1.1).
• Sex/Gender Identity: Across T/TT faculty, survey respondents skew more female than the overall UD faculty population (see Table 1.2).
• Race/Ethnicity: Black faculty are underrepresented among respondents as compared to the UD faculty population (2.5% vs. 4.2%); Latino(a) faculty are slightly overrepresented (3.4% vs. 2.8%); Asian faculty are underrepresented (7.3% vs. 11.1%), white faculty are slightly overrepresented (82.6% vs. 79.7%).
• LGBTQ: Among respondents who chose to identify, 92.5% are “straight or heterosexual,” 3.8% are “lesbian, gay, or homosexual,” 1.7% are “bisexual,” 1.4% indicated they “don’t know,” and 0.6% identified as “something else.” UD lacks institutional data on sexual orientation, so it is unclear whether this distribution is similar to that of the UD faculty population.
• Disability: 7.3% of respondents indicated they have (or have had) a disability and have requested accommodation, 6.5% had (or have had) a disability and have not requested

UD ADVANCE 2016 Faculty Climate Survey Report 4
accommodation, and 86.2% did not have (or have had) a disability that qualifies for accommodation. UD lacks institutional data on faculty disability, so it is unclear whether this distribution approximates rates of disability in the UD faculty population.
• Colleges and Portfolios: Among those respondents who identified their college or portfolio, respondents approximate the makeup of the UD colleges and portfolios with a few exceptions (see Table 1.3). Respondents in the College of Arts & Sciences (CAS) Natural Sciences portfolio are underrepresented, while faculty in the CAS Social Sciences portfolio are overrepresented.
Table 1.1: Respondents by Rank & Tenure Status
Table 1.2: Respondents by Rank, Tenure Status, Sex
Table 1.3: Respondents by College & Portfolio
Respondents Population 1 Respondents Population Respondents PopulationAssistant 21.5% 26.1% 13.3% 14.6% 8.2% 11.5%Associate 34.8% 31.7% 29.7% 27.0% 5.1% 4.7%Professor 39.4% 34.3% 38.8% 33.4% 0.6% 0.9%Instructor 4.2% 7.9% - - 4.2% 7.9%All Ranks 100.0% 100.0% 81.9% 75.0% 18.1% 25.0%
1 Source: UD Facts & Figures 2015-2016, "Number of Faculty by Rank and Tenure Status"
Continuing TrackAll Faculty Tenure-Track & Tenured
Population 1 Population PopulationCount % Female % Female Count % Female % Female Count % Female % Female
Assistant 76 63.2% 52.4% 47 59.6% 50.9% 29 69.0% 54.3%Associate 123 53.7% 43.4% 105 54.3% 44.0% 18 50.0% 43.4%Professor 139 32.4% 25.8% 137 32.8% 25.7% 2 0.0% 25.8%Instructor 15 53.3% 68.2% - - - 15 53.3% 68.2%All Ranks 353 47.3% 41.6% 289 45.0% 37.2% 64 57.8% 55.0%
1 Source: UD Facts & Figures 2015-2016, "Number of Faculty by Rank and Tenure Status"
Tenure-Track & Tenured Continuing TrackAll FacultyRespondents Respondents Respondents
Respondents PopulationAgriculture & Natural Resources 9.1% 6.8%CAS Art 2.1% 4.9%CAS Humanities 17.3% 14.0%CAS Natural Sciences 10.9% 16.5%CAS Social Sciences 14.2% 10.0%CAS Miscellaneous 2.1% 3.8%Earth, Ocean, & Environment 4.5% 4.8%Education & Human Development 8.8% 6.3%Engineering 10.9% 12.4%Health Sciences 10.0% 8.9%Lerner College of Business & Economics 10.0% 11.6%
UD ADVANCE 2016 Faculty Climate Survey Report 5
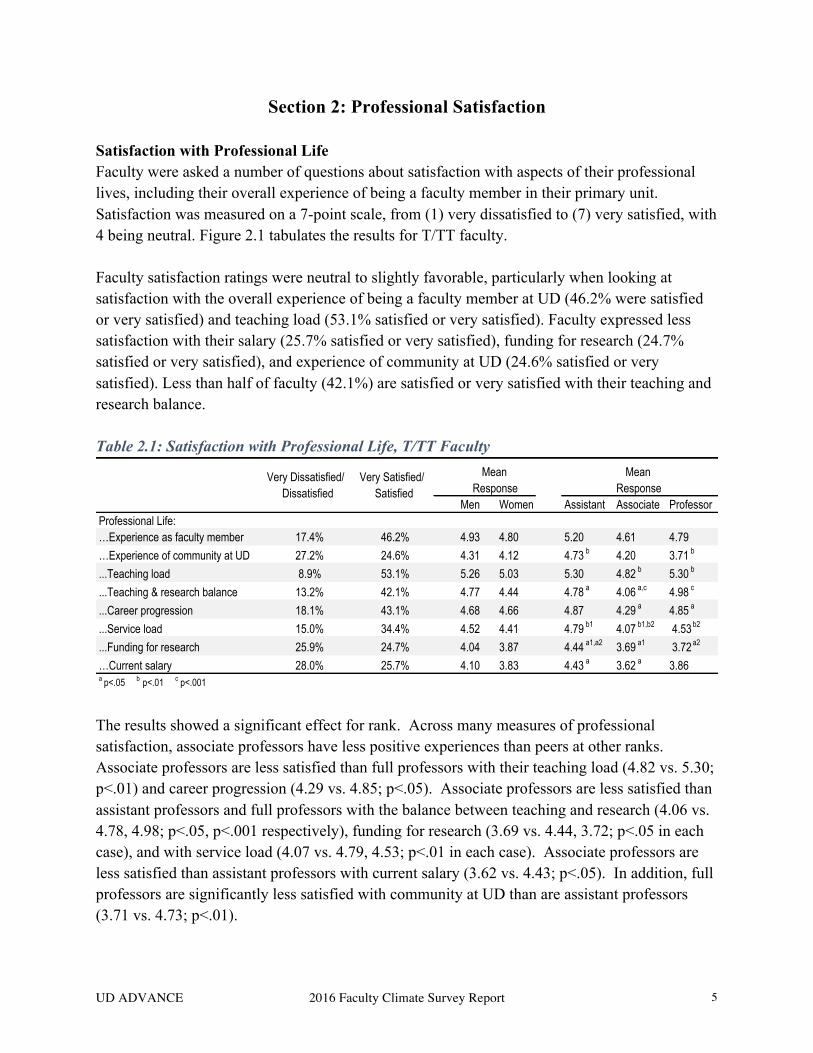
Section 2: Professional Satisfaction Satisfaction with Professional Life Faculty were asked a number of questions about satisfaction with aspects of their professional lives, including their overall experience of being a faculty member in their primary unit. Satisfaction was measured on a 7-point scale, from (1) very dissatisfied to (7) very satisfied, with 4 being neutral. Figure 2.1 tabulates the results for T/TT faculty. Faculty satisfaction ratings were neutral to slightly favorable, particularly when looking at satisfaction with the overall experience of being a faculty member at UD (46.2% were satisfied or very satisfied) and teaching load (53.1% satisfied or very satisfied). Faculty expressed less satisfaction with their salary (25.7% satisfied or very satisfied), funding for research (24.7% satisfied or very satisfied), and experience of community at UD (24.6% satisfied or very satisfied). Less than half of faculty (42.1%) are satisfied or very satisfied with their teaching and research balance. Table 2.1: Satisfaction with Professional Life, T/TT Faculty
The results showed a significant effect for rank. Across many measures of professional satisfaction, associate professors have less positive experiences than peers at other ranks. Associate professors are less satisfied than full professors with their teaching load (4.82 vs. 5.30; p<.01) and career progression (4.29 vs. 4.85; p<.05). Associate professors are less satisfied than assistant professors and full professors with the balance between teaching and research (4.06 vs. 4.78, 4.98; p<.05, p<.001 respectively), funding for research (3.69 vs. 4.44, 3.72; p<.05 in each case), and with service load (4.07 vs. 4.79, 4.53; p<.01 in each case). Associate professors are less satisfied than assistant professors with current salary (3.62 vs. 4.43; p<.05). In addition, full professors are significantly less satisfied with community at UD than are assistant professors (3.71 vs. 4.73; p<.01).
Men Women Assistant Associate ProfessorProfessional Life:…Experience as faculty member 17.4% 46.2% 4.93 4.80 5.20 4.61 4.79…Experience of community at UD 27.2% 24.6% 4.31 4.12 4.73 b 4.20 3.71 b
...Teaching load 8.9% 53.1% 5.26 5.03 5.30 4.82 b 5.30 b
...Teaching & research balance 13.2% 42.1% 4.77 4.44 4.78 a 4.06 a,c 4.98 c
...Career progression 18.1% 43.1% 4.68 4.66 4.87 4.29 a 4.85 a
...Service load 15.0% 34.4% 4.52 4.41 4.79 b1 4.07 b1,b2 4.53b2
...Funding for research 25.9% 24.7% 4.04 3.87 4.44 a1,a2 3.69 a1 3.72a2
…Current salary 28.0% 25.7% 4.10 3.83 4.43 a 3.62 a 3.86a p<.05 b p<.01 c p<.001
Mean Response
Mean Response
Very Dissatisfied/ Dissatisfied
Very Satisfied/ Satisfied
UD ADVANCE 2016 Faculty Climate Survey Report 6
Factors Influencing Satisfaction Faculty were asked to comment on the factors that contributed to or detracted from their satisfaction at UD. A total of 253 faculty responded to this write-in question. The most common theme across the responses was dissatisfaction with university administration, which occurred in nearly half of the comments (n=108, 43%). These comments touched on multiple aspects of dissatisfaction, including (1) a decline in shared governance, (2) the increased bureaucratization or corporatization of the university, (3) lack of transparency in decision making and strategies initiated by the administration, and (4) dissatisfaction with the current budget model. Another area of concern among faculty centers on the aspects of professional life that are valued and rewarded. There is a general feeling that faculty work is underappreciated, with a number of comments pointing to the lack of alignment between work responsibilities and reward structures. Faculty express frustration that their teaching and service appear to count for little as compared to research productivity. At the same time, they see university administrators as prioritizing tuition generation and revenue over quality of instruction. With regard to research and scholarship, faculty point to a lack of available resources to support research. Faculty perceive that research success is increasingly defined in a narrow sense and biased towards metrics such as grant funding and impact factor. Faculty also highlight concern about changes in tenure and promotion expectations, particularly at the level of deans and the provost. A final area of concern among faculty has to do with compensation and benefits. Faculty express general dissatisfaction with salaries, with a subset of these responses mentioning perceived gender inequity in salaries. Additionally, there are a number of concerns about retirement benefits and proposed changes to these benefits. Climate in Departments Faculty were asked about their departmental climate in three series of questions. The first (a=0.84) measured overall departmental inclusiveness. It included questions about sexism, racism, homogeneity, homophobia, and ableist tendencies within the department. This was measured on a 7-point continuum, from negative to positive attributes (i.e. sexist to non-sexist). A second series (a=0.94) measured collegiality, again on a 7-point continuum. It included questions about how contentious, isolating, hostile, competitive, individualistic, not supportive, unfair, and stressful the department is. The third series (a=0.81) measured the strength of faculty voice in departmental decision-making processes. It included questions about faculty’s perception of their own voice in departmental decisions, whether meetings allow all participants to share their views, and how often committee assignments rotate fairly. This was measured on a 5-point scale, from “never” to “always,” with a score of three as “sometimes.” Overall results (Figure 2.2) indicate that T/TT faculty perceive their departments as somewhat inclusive and collegial, with a higher score for inclusivity than collegiality (5.02 vs. 4.45).
UD ADVANCE 2016 Faculty Climate Survey Report 7
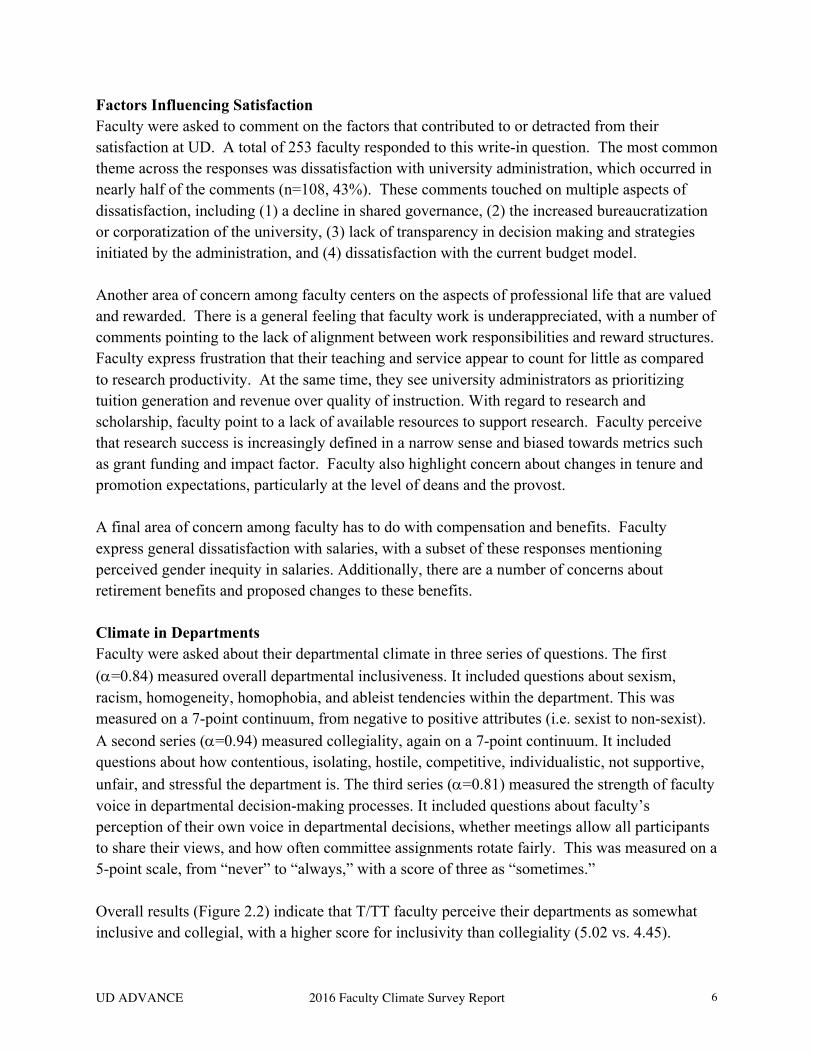
However, these scores are just above the midpoint of the scale, indicating faculty do not view their departments are strongly inclusive or collegial. T/TT faculty rate the strength of faculty voice in departmental decision making as slightly above midpoint (3.43), indicating they “sometimes” have a voice in decision making within their departments. Table 2.2: Departmental Climate
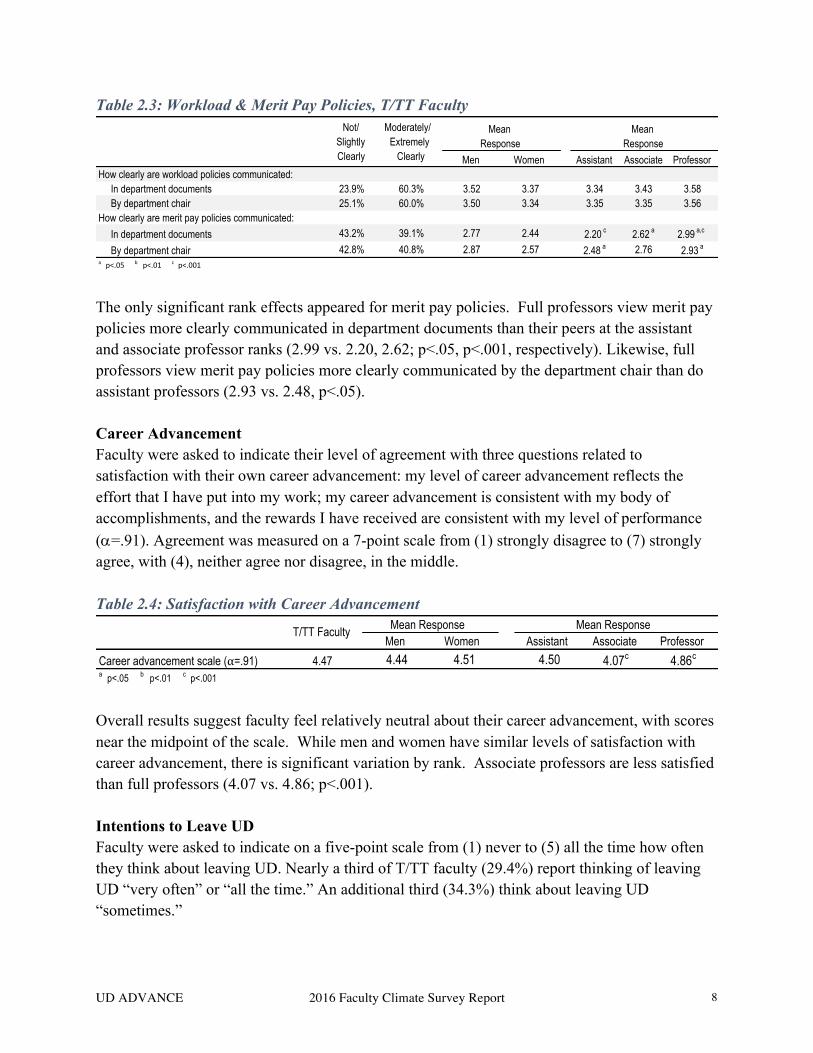
When disaggregated by rank and by gender, the results show significant effects. Associate professors perceive the departments as less inclusive than do full and assistant professors (4.72 vs. 5.36, 5.03; p<.05 for each). Associate professors perceive that they have less voice in their departmental decision making than full professors do (3.25 vs, 3.57; p<.01). With regard to gender effects, men perceive their departments as more inclusive than do women (5.29 vs. 4.79; p<.01). Clarity of Departmental Policies and Procedures Faculty were asked questions regarding communication of department workload and merit pay policies in departmental documents, by the department chair, and by other faculty in the department. In each case, how clearly policies are communicated was measured on a 5-point scale from (1) not clearly to (5) extremely clearly. The results for T/TT faculty (Table 2.3) indicate an overall higher level of clarity in communication of workload policies as compared to merit pay policies. Over half of T/TT respondents perceive that workload policies are communicated moderately or extremely clearly in department documents (60.3%) and by the department chair and (60%). However, around a quarter of T/TT respondents perceive that workload policies are communicated not clearly or only slightly clearly in department documents (23.9%) and by the department chair (25.1%). Faculty are less decided on how clearly merit pay policies are communicated. Close to the same percentage of T/TT respondents (roughly 40%) perceive that merit pay policies are not clearly or only slight clearly communicated both in department documents and by the department chair.
Men Women Assistant Associate Professor
Inclusive department scale (⍺=0.84) 5.02 5.29b 4.79b 5.36a 4.72a,a 5.03a
Collegial department scale (⍺=0.94) 4.45 4.58 4.44 4.71 4.29 4.54Voice in department scale (⍺=0.81) 3.43 3.50 3.36 3.47 3.25b 3.57b
a p<.05 b p<.01 c p<.001
Mean Response Mean ResponseT/TT Faculty
UD ADVANCE 2016 Faculty Climate Survey Report 8
Table 2.3: Workload & Merit Pay Policies, T/TT Faculty
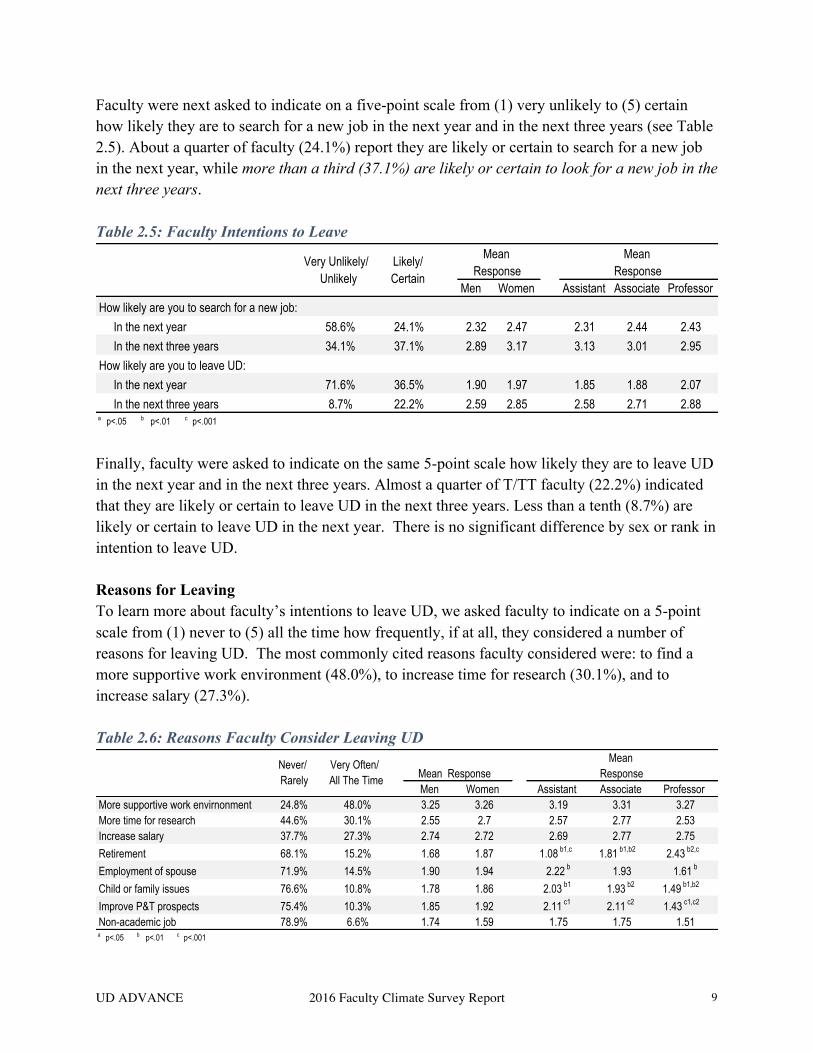
The only significant rank effects appeared for merit pay policies. Full professors view merit pay policies more clearly communicated in department documents than their peers at the assistant and associate professor ranks (2.99 vs. 2.20, 2.62; p<.05, p<.001, respectively). Likewise, full professors view merit pay policies more clearly communicated by the department chair than do assistant professors (2.93 vs. 2.48, p<.05). Career Advancement Faculty were asked to indicate their level of agreement with three questions related to satisfaction with their own career advancement: my level of career advancement reflects the effort that I have put into my work; my career advancement is consistent with my body of accomplishments, and the rewards I have received are consistent with my level of performance (a=.91). Agreement was measured on a 7-point scale from (1) strongly disagree to (7) strongly agree, with (4), neither agree nor disagree, in the middle. Table 2.4: Satisfaction with Career Advancement
Overall results suggest faculty feel relatively neutral about their career advancement, with scores near the midpoint of the scale. While men and women have similar levels of satisfaction with career advancement, there is significant variation by rank. Associate professors are less satisfied than full professors (4.07 vs. 4.86; p<.001). Intentions to Leave UD Faculty were asked to indicate on a five-point scale from (1) never to (5) all the time how often they think about leaving UD. Nearly a third of T/TT faculty (29.4%) report thinking of leaving UD “very often” or “all the time.” An additional third (34.3%) think about leaving UD “sometimes.”
Men Women Assistant Associate ProfessorHow clearly are workload policies communicated: In department documents 23.9% 60.3% 3.52 3.37 3.34 3.43 3.58 By department chair 25.1% 60.0% 3.50 3.34 3.35 3.35 3.56How clearly are merit pay policies communicated: In department documents 43.2% 39.1% 2.77 2.44 2.20 c 2.62 a 2.99 a,c
By department chair 42.8% 40.8% 2.87 2.57 2.48 a 2.76 2.93 a
a" p<.05"" b" p<.01"" c "p<.001
Not/Slightly Clearly
Moderately/ Extremely
Clearly
Mean Response
Mean Response
Men Women Assistant Associate Professor
Career advancement scale (⍺=.91) 4.47 4.44 4.51 4.50 4.07c 4.86c
a p<.05 b p<.01 c p<.001
T/TT Faculty Mean Response Mean Response
UD ADVANCE 2016 Faculty Climate Survey Report 9
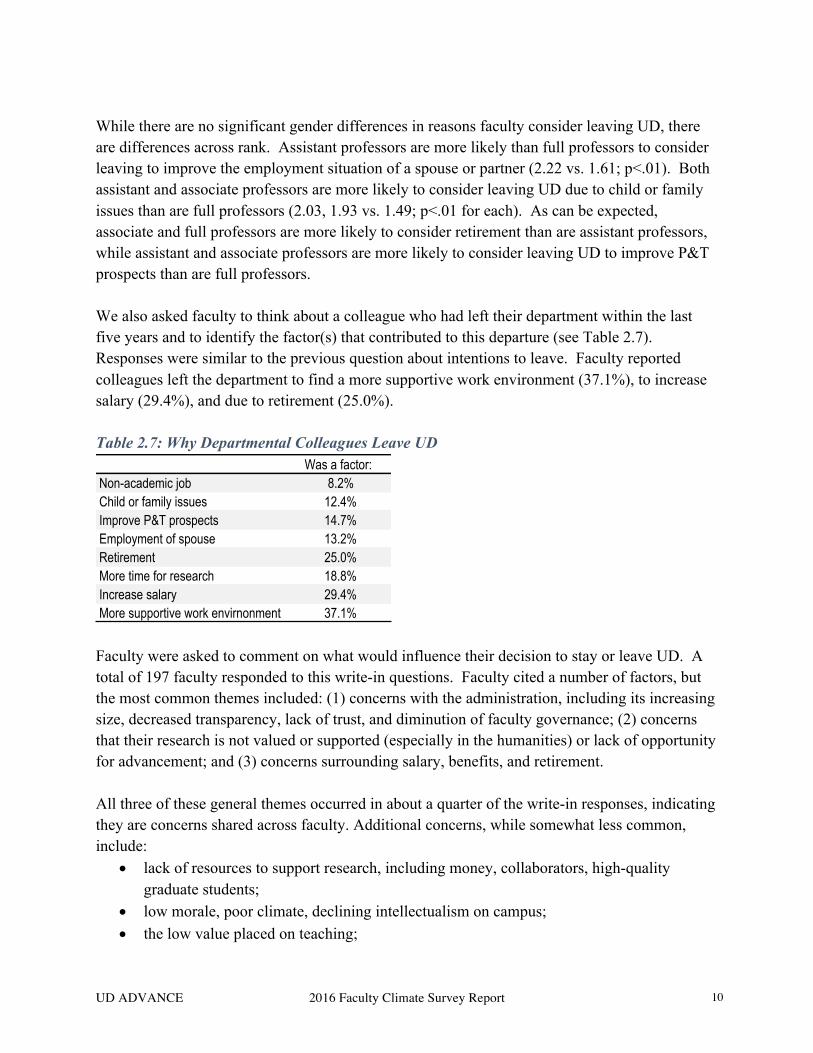
Faculty were next asked to indicate on a five-point scale from (1) very unlikely to (5) certain how likely they are to search for a new job in the next year and in the next three years (see Table 2.5). About a quarter of faculty (24.1%) report they are likely or certain to search for a new job in the next year, while more than a third (37.1%) are likely or certain to look for a new job in the next three years. Table 2.5: Faculty Intentions to Leave
Finally, faculty were asked to indicate on the same 5-point scale how likely they are to leave UD in the next year and in the next three years. Almost a quarter of T/TT faculty (22.2%) indicated that they are likely or certain to leave UD in the next three years. Less than a tenth (8.7%) are likely or certain to leave UD in the next year. There is no significant difference by sex or rank in intention to leave UD. Reasons for Leaving To learn more about faculty’s intentions to leave UD, we asked faculty to indicate on a 5-point scale from (1) never to (5) all the time how frequently, if at all, they considered a number of reasons for leaving UD. The most commonly cited reasons faculty considered were: to find a more supportive work environment (48.0%), to increase time for research (30.1%), and to increase salary (27.3%). Table 2.6: Reasons Faculty Consider Leaving UD
Men Women Assistant Associate ProfessorHow likely are you to search for a new job: In the next year 58.6% 24.1% 2.32 2.47 2.31 2.44 2.43 In the next three years 34.1% 37.1% 2.89 3.17 3.13 3.01 2.95How likely are you to leave UD: In the next year 71.6% 36.5% 1.90 1.97 1.85 1.88 2.07 In the next three years 8.7% 22.2% 2.59 2.85 2.58 2.71 2.88a p<.05 b p<.01 c p<.001
Mean Response
Mean Response
Very Unlikely/ Unlikely
Likely/ Certain
Men Women Assistant Associate ProfessorMore supportive work envirnonment 24.8% 48.0% 3.25 3.26 3.19 3.31 3.27More time for research 44.6% 30.1% 2.55 2.7 2.57 2.77 2.53Increase salary 37.7% 27.3% 2.74 2.72 2.69 2.77 2.75Retirement 68.1% 15.2% 1.68 1.87 1.08 b1,c 1.81 b1,b2 2.43 b2,c
Employment of spouse 71.9% 14.5% 1.90 1.94 2.22 b 1.93 1.61 b
Child or family issues 76.6% 10.8% 1.78 1.86 2.03 b1 1.93 b2 1.49 b1,b2
Improve P&T prospects 75.4% 10.3% 1.85 1.92 2.11 c1 2.11 c2 1.43 c1,c2
Non-academic job 78.9% 6.6% 1.74 1.59 1.75 1.75 1.51a p<.05 b p<.01 c p<.001
Mean ResponseMean
ResponseNever/ Rarely
Very Often/ All The Time
UD ADVANCE 2016 Faculty Climate Survey Report 10
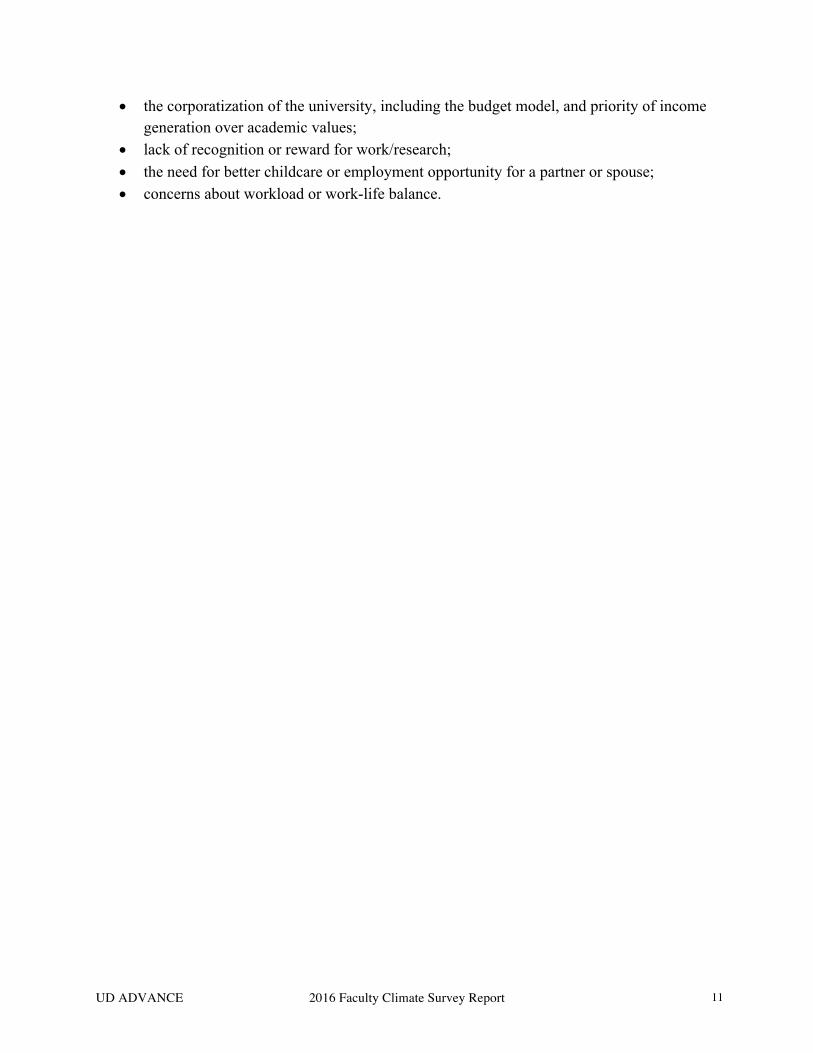
While there are no significant gender differences in reasons faculty consider leaving UD, there are differences across rank. Assistant professors are more likely than full professors to consider leaving to improve the employment situation of a spouse or partner (2.22 vs. 1.61; p<.01). Both assistant and associate professors are more likely to consider leaving UD due to child or family issues than are full professors (2.03, 1.93 vs. 1.49; p<.01 for each). As can be expected, associate and full professors are more likely to consider retirement than are assistant professors, while assistant and associate professors are more likely to consider leaving UD to improve P&T prospects than are full professors. We also asked faculty to think about a colleague who had left their department within the last five years and to identify the factor(s) that contributed to this departure (see Table 2.7). Responses were similar to the previous question about intentions to leave. Faculty reported colleagues left the department to find a more supportive work environment (37.1%), to increase salary (29.4%), and due to retirement (25.0%). Table 2.7: Why Departmental Colleagues Leave UD
Faculty were asked to comment on what would influence their decision to stay or leave UD. A total of 197 faculty responded to this write-in questions. Faculty cited a number of factors, but the most common themes included: (1) concerns with the administration, including its increasing size, decreased transparency, lack of trust, and diminution of faculty governance; (2) concerns that their research is not valued or supported (especially in the humanities) or lack of opportunity for advancement; and (3) concerns surrounding salary, benefits, and retirement. All three of these general themes occurred in about a quarter of the write-in responses, indicating they are concerns shared across faculty. Additional concerns, while somewhat less common, include:
• lack of resources to support research, including money, collaborators, high-quality graduate students;
• low morale, poor climate, declining intellectualism on campus; • the low value placed on teaching;
Was a factor:Non-academic job 8.2%Child or family issues 12.4%Improve P&T prospects 14.7%Employment of spouse 13.2%Retirement 25.0%More time for research 18.8%Increase salary 29.4%More supportive work envirnonment 37.1%
UD ADVANCE 2016 Faculty Climate Survey Report 11
• the corporatization of the university, including the budget model, and priority of income generation over academic values;
• lack of recognition or reward for work/research; • the need for better childcare or employment opportunity for a partner or spouse; • concerns about workload or work-life balance.
UD ADVANCE 2016 Faculty Climate Survey Report 12
Section 3: Promotion and Tenure Process T/TT faculty were asked a number of questions related to the promotion and tenure (P&T) process, including questions about P&T standards, fairness in the application of those standards, perceived support for advancement, and what could be done to improve the P&T process. Overall findings about P&T include: (1) assistant professors report feeling supported in their advancement to associate professor by their chairs and their colleagues within the department; (2) associate professors perceive some lack of support in advancement to full professor; (3) faculty feel that the standards for promotion have changed over the last five years; (4) faculty perceive some bias or lack of fairness in the P&T process. P&T Standards To measure perceptions of P&T standards, T/TT faculty were asked whether the standards are reasonable, flexible in terms of weight given to teaching research and service, whether they have changed over time, as well as whether they are applied consistently within a department and are free from bias (Table 3.1). Faculty were also asked about their perceptions of fairness in how various groups apply P&T standards (Figure 3.2). All of these items were measured on a 7-point scale, from (1) strongly disagree to (7) strongly agree, with a score of four as neutral. T/TT faculty generally agree the P&T standards are reasonable. Nearly 60% agree or strongly agree that the standards were reasonable and only 6.9% disagree or strongly disagree. Faculty are somewhat less certain about whether the standards are applied consistently within the department. Close to 44% of the respondents agree or strongly agree with the statement, but nearly 25% disagree or strongly disagree. When asked whether there the P&T system is flexible in terms of the weight given to teaching, research, and service, there was even less agreement. About a quarter of T/TT faculty agree or strongly agree, while nearly the same percentage disagree or strongly disagree that the system is flexible in this regard. A majority of the T/TT faculty (53.2%) perceive that the P&T standards have changed over the last five years and few (12.8%) disagree or strongly disagree. Faculty also appear to perceive that there is some bias in the P&T process. Close to half the T/TT faculty (46.1%) disagree or strongly disagree that P&T process is free from bias, with only 15.7% of the faculty agreeing with this statement. When disaggregated by rank and by gender, few gender effects were found. The one exception is that women are more likely than men to agree that P&T standards have changed over the last five years (5.49 vs. 4.95; p<.05).

UD ADVANCE 2016 Faculty Climate Survey Report 13
Table 3.1: Views on P&T Standards, T/TT Faculty
The results did show some significant rank effects. Full professors are more likely to agree that the standards are reasonable than associate or assistant professors, with assistant professors having the lowest overall mean response (p<.05). They are also more likely than associate professors to agree that the system is flexible in terms of the weight given to reaching, research and service (mean 4.38 vs. 3.57; p<.01). With respect to perceptions of bias, associate professors have more negative views than assistant professors (mean 2.54 vs 3.33; p<.05) or full professors (mean 2.54 vs 3.23; p<.001). Fairness in Application of P&T Standards When asked about perceptions of fairness in how various groups apply P&T standards, faculty are most likely to agree or strongly agree that the standards are applied fairly by the departmental P&T committee and by the chairs (see Table 3.2). Even so, roughly 35% of the T/TT faculty express concerns about fairness in this realm. The levels of perceived fairness are in the mid-range for the College and the University P&T committees. About half of faculty agree or strongly agree that their college P&T committee and the university P&T committee apply standards fairly. Levels of agreement are lowest when asked about application of P&T standards by the deans and provost. Roughly 40% of the faculty agree or strongly agree that the deans are fair in their application of standards (39.4%); only 29% agree or strongly agree that they are applied fairly by the provost. While there was not a significant difference in perceptions of fairness in the application of P&T standards between men and women, one significant rank effect was found. Associate professors are less likely to agree about the fairness of their department chair than are full professors (mean 5.27 vs 5.75; p<.05).
Men Women Assistant Associate FullP&T standards have been applied consistently across my department
24.9% 43.7% 4.33 4.37 4.44 4.15 4.48
P&T standards are reasonable 6.9% 58.9% 5.13 5.20 4.80 a1 5.08 a2 5.62 a1,a2
P&T system is flexible in terms of weight given to teaching, research,
25.9% 26.4% 3.88 3.96 3.82 3.57 b 4.38 b
P&T standards have changed over the last 5 years
12.8% 53.2% 4.95 a 5.49 a 5.14 5.38 5.14
The P&T process is free from bias 46.1% 15.7% 3.23 2.83 3.33 a 2.54 a,c 3.23 c
a p<.05 b p<.01 c p<.001
Mean Response
Disagree/ Strongly Disagree
Agree/Strongly
Agree
Mean(Response

UD ADVANCE 2016 Faculty Climate Survey Report 14
Table 3.2: Perceptions of Fairness in Application of P&T Standards
P&T Resources Faculty were asked which resources they used to understand the P&T process (see Table 3.3). For each resource they reported using, faculty were then asked to rate how helpful it was on a 5-point scale from (1) not at all helpful to (5) extremely helpful, with a midpoint score of (3) as somewhat helpful. The most common resources faculty reported using were departmental documents (92.6%) and departmental colleagues (90.1%). While also common resources, slightly fewer faculty reported using the faculty handbook (85.1%) and department chair (81.5%) to help understand the P&T process. More than a third of those faculty that used departmental colleagues, departmental documents, and their chair to understand the P&T process perceived these resources as extremely helpful. Only a fifth of those that used the faculty handbook to understand the P&T process found this resource extremely helpful. There were no significant gender differences in perceptions of how helpful these resources were in understanding the P&T process. Overall, men and women both perceive the various resources as somewhat to moderately useful. Assistant professors perceive resources as less helpful than associate or full professors. Assistant professors find the faculty handbook (3.32 vs. 3.82; p<.01) and department chair (3.40 vs. 3.94; p<.05) less helpful in understanding the P&T process than full professor colleagues. For departmental documents, perceptions of the helpfulness of this resource increase by rank (see Table 3.3). Table 3.3: Resources to Understand P&T Process
Men Women Assistant Associate FullP&T standards have been applied fairly by:…department P&T committee 10.3% 64.3% 5.33 5.50 5.35 5.36 5.52...department chair 9.2% 66.6% 5.31 5.66 5.43 5.27 a 5.75 a
…college P&T committee 7.9% 50.7% 4.98 5.05 4.93 4.97 5.15…dean 17.7% 39.4% 4.51 4.62 4.65 4.51 4.54…university P&T committee 6.3% 46.3% 5.01 5.07 4.81 5.12 5.18…provost 22.0% 29.0% 4.09 4.10 4.19 4.03 4.06a p<.05 b p<.01 c p<.001
Disagree/ Strongly Disagree
Agree/Strongly
Agree
Mean Response
Mean Response
Men Women Assistant Associate FullColleagues in your department 90.1% 4.1% 41.3% 3.81 3.90 3.65 3.85 4.08Departmental documents 92.6% 3.4% 37.6% 3.95 3.76 3.42 a,c 3.89 a,b 4.25 b,c
Faculty Handbook 85.1% 6.6% 22.8% 3.60 3.56 3.32 b 3.58 3.82 b
Department chair 81.5% 7.7% 37.3% 3.76 3.69 3.4 a 3.83 3.94 a
a p<.05 b p<.01 c p<.001
Mean Response
Used Resource to Understand P&T Process
NotHelpful
Extremely Helpful
Mean Response

UD ADVANCE 2016 Faculty Climate Survey Report 15
Faculty were also asked to rate the helpfulness of 2-year, 4-year, post-tenure peer reviews, and P&T workshops, where applicable, on a 5-point scale (see Table 3.4). Aggregated results indicate that faculty perceive the 2-year and 4-year evaluations, as well as P&T workshops, to be moderately helpful. Nonetheless, full professors are more likely than associate professors to rate the 2-year review as helpful (mean 2.97 vs. 3.52; p < .05). Ratings for post-tenure review process are below neutral, indicating that faculty find these evaluations to be only slightly helpful in preparing for promotion to full professor. Table 3.4: Peer Evaluations and P&T Workshops
Support for P&T In addition to being asked about P&T standards, faculty were asked to rate the degree to which they feel or felt supported in their advancement to tenure on a five-point scale ranging from (1) not at all to (5) extremely, with a midpoint of (3) somewhat (see Table 3.5). Associate and full professors were also asked whether they feel supported in promotion to full professor (see Table 3.6). With respect to advancement to tenure, the majority of respondents strongly agree that they feel or felt support(ed) by their department chair (56.3%) and by colleagues in the department (53.7%). When disaggregated by rank, full professors report feeling more support by colleagues in the department than associate professors (4.25 vs. 3.96; p < .05). There is less consistency in faculty perceptions of support by the dean, with 29.2% reporting feeling extremely supported but 20.8% reporting feeling not at all supported. Table 3.5: Perceived Support in Advancement to Tenure
When it comes to advancement to full professor, results show significant differences by rank (see Table 3.6). Full professors report moderate support from their department chair (4.14) and from
Men Women Assistant Associate Full2-Year Peer Evaluation 73.2% 11.0% 20.9% 3.30 3.29 2.97 a 3.40 3.52 a
4-Year Peer Evaluation 66.4% 11.4% 25.7% 3.27 3.70 3.35 3.52 3.57Post-Tenure Review 54.9% 32.7% 9.6% 2.50 2.02 NA 2.53 2.51P&T Workshop 39.6% 5.9% 8.6% 3.16 3.30 3.24 3.08 3.38a p<.05 b P<.01 c P<.001
NotHelpful
Extremely Helpful
Mean Response
Mean Response
Have Completed or
Attended
tenure
Men Women Assistant Associate FullDepartment Chair 7.6% 56.3% 4.03 4.14 3.93 3.98 4.33Colleagues in Department 5.8% 53.7% 3.96 4.1 3.89 3.96 a 4.25 a
Dean of College 20.8% 29.2% 3.08 3.45 3.15 3.22 3.43a' p<.05'' b 'P<.01'' c 'P<.001
Not At All Supported
Extremely Supported
Mean Response
Mean Response
UD ADVANCE 2016 Faculty Climate Survey Report 16
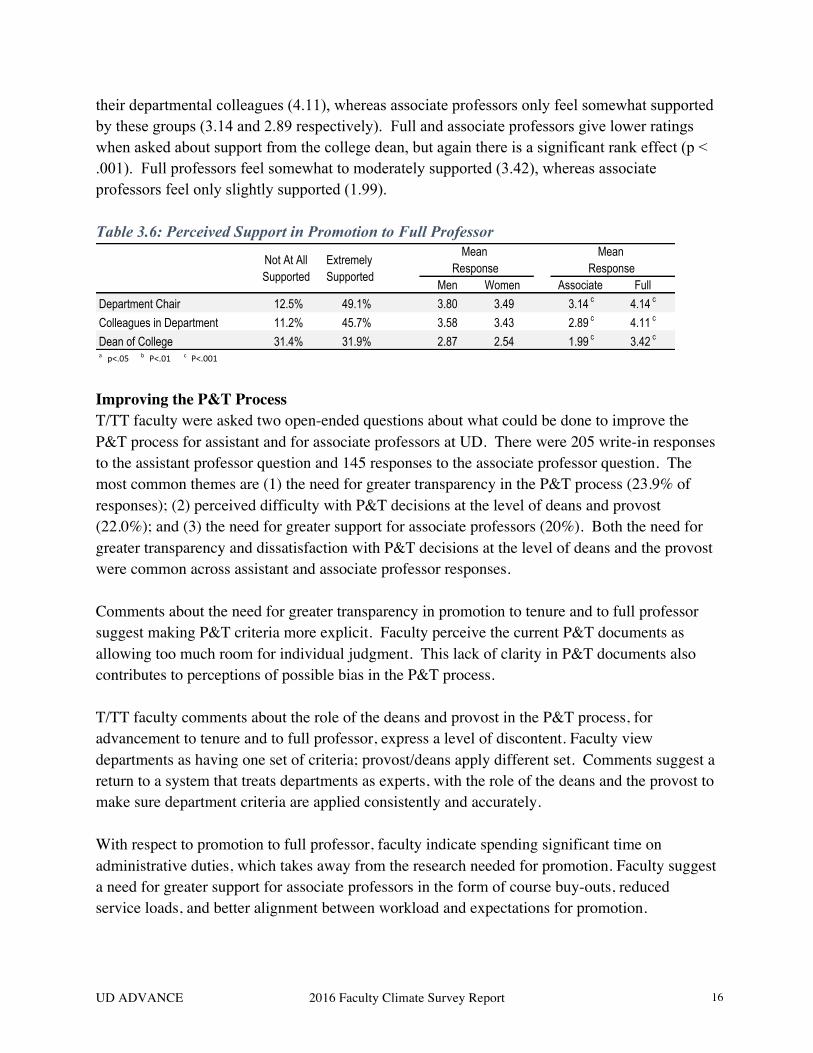
their departmental colleagues (4.11), whereas associate professors only feel somewhat supported by these groups (3.14 and 2.89 respectively). Full and associate professors give lower ratings when asked about support from the college dean, but again there is a significant rank effect (p < .001). Full professors feel somewhat to moderately supported (3.42), whereas associate professors feel only slightly supported (1.99). Table 3.6: Perceived Support in Promotion to Full Professor
Improving the P&T Process T/TT faculty were asked two open-ended questions about what could be done to improve the P&T process for assistant and for associate professors at UD. There were 205 write-in responses to the assistant professor question and 145 responses to the associate professor question. The most common themes are (1) the need for greater transparency in the P&T process (23.9% of responses); (2) perceived difficulty with P&T decisions at the level of deans and provost (22.0%); and (3) the need for greater support for associate professors (20%). Both the need for greater transparency and dissatisfaction with P&T decisions at the level of deans and the provost were common across assistant and associate professor responses. Comments about the need for greater transparency in promotion to tenure and to full professor suggest making P&T criteria more explicit. Faculty perceive the current P&T documents as allowing too much room for individual judgment. This lack of clarity in P&T documents also contributes to perceptions of possible bias in the P&T process.
T/TT faculty comments about the role of the deans and provost in the P&T process, for advancement to tenure and to full professor, express a level of discontent. Faculty view departments as having one set of criteria; provost/deans apply different set. Comments suggest a return to a system that treats departments as experts, with the role of the deans and the provost to make sure department criteria are applied consistently and accurately. With respect to promotion to full professor, faculty indicate spending significant time on administrative duties, which takes away from the research needed for promotion. Faculty suggest a need for greater support for associate professors in the form of course buy-outs, reduced service loads, and better alignment between workload and expectations for promotion.
Full
Men Women Associate FullDepartment Chair 12.5% 49.1% 3.80 3.49 3.14 c 4.14 c
Colleagues in Department 11.2% 45.7% 3.58 3.43 2.89 c 4.11 c
Dean of College 31.4% 31.9% 2.87 2.54 1.99 c 3.42 c
a% p<.05%% b %P<.01%% c %P<.001
Not At All Supported
Extremely Supported
Mean Response
Mean Response
UD ADVANCE 2016 Faculty Climate Survey Report 17
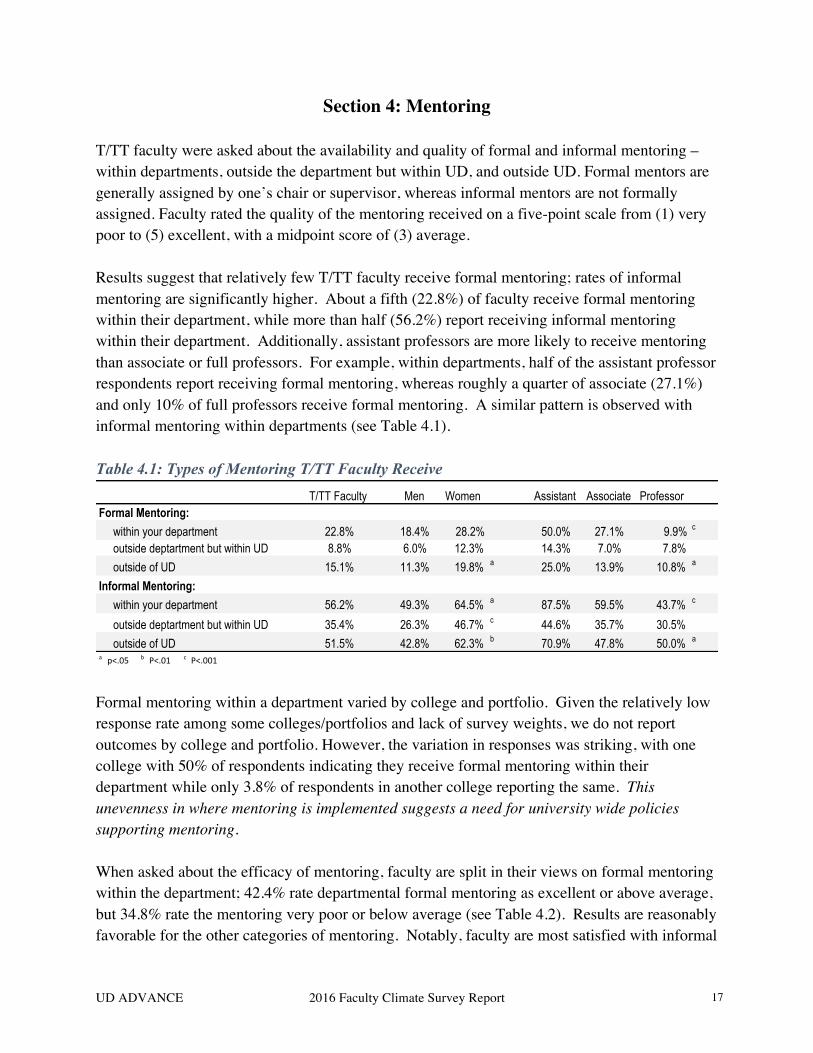
Section 4: Mentoring T/TT faculty were asked about the availability and quality of formal and informal mentoring – within departments, outside the department but within UD, and outside UD. Formal mentors are generally assigned by one’s chair or supervisor, whereas informal mentors are not formally assigned. Faculty rated the quality of the mentoring received on a five-point scale from (1) very poor to (5) excellent, with a midpoint score of (3) average. Results suggest that relatively few T/TT faculty receive formal mentoring; rates of informal mentoring are significantly higher. About a fifth (22.8%) of faculty receive formal mentoring within their department, while more than half (56.2%) report receiving informal mentoring within their department. Additionally, assistant professors are more likely to receive mentoring than associate or full professors. For example, within departments, half of the assistant professor respondents report receiving formal mentoring, whereas roughly a quarter of associate (27.1%) and only 10% of full professors receive formal mentoring. A similar pattern is observed with informal mentoring within departments (see Table 4.1). Table 4.1: Types of Mentoring T/TT Faculty Receive
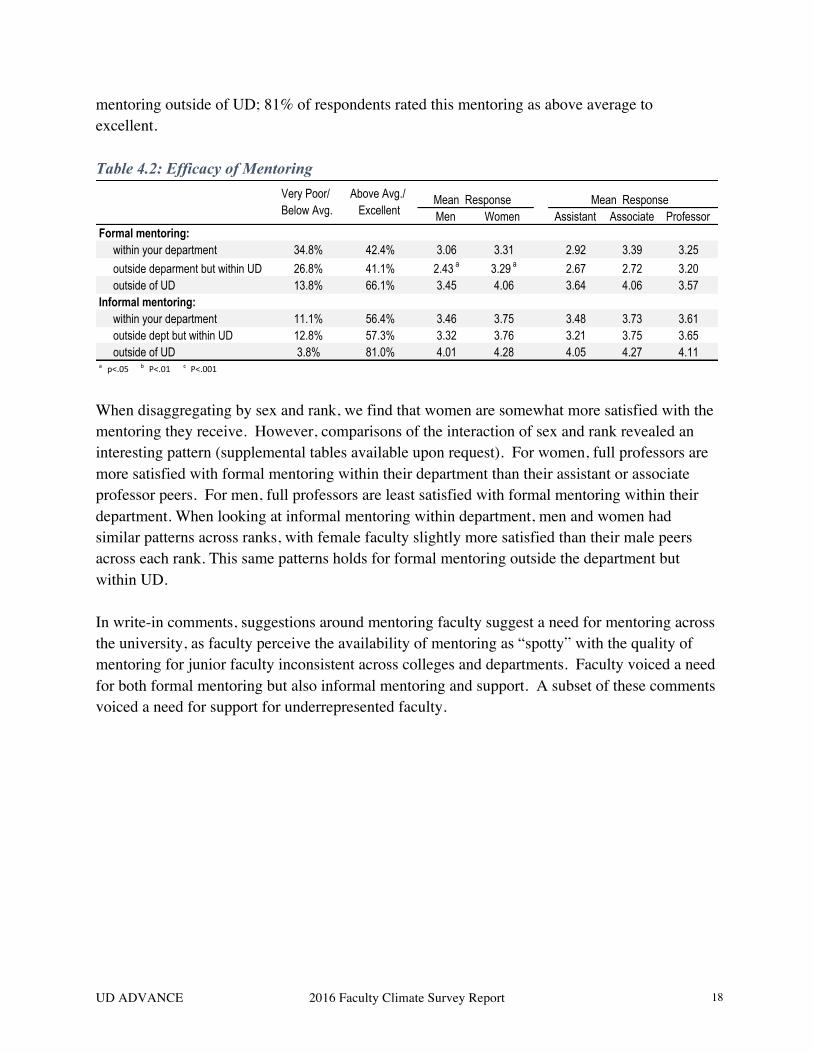
Formal mentoring within a department varied by college and portfolio. Given the relatively low response rate among some colleges/portfolios and lack of survey weights, we do not report outcomes by college and portfolio. However, the variation in responses was striking, with one college with 50% of respondents indicating they receive formal mentoring within their department while only 3.8% of respondents in another college reporting the same. This unevenness in where mentoring is implemented suggests a need for university wide policies supporting mentoring. When asked about the efficacy of mentoring, faculty are split in their views on formal mentoring within the department; 42.4% rate departmental formal mentoring as excellent or above average, but 34.8% rate the mentoring very poor or below average (see Table 4.2). Results are reasonably favorable for the other categories of mentoring. Notably, faculty are most satisfied with informal
T/TT Faculty Men Women Assistant Associate ProfessorFormal Mentoring: within your department 22.8% 18.4% 28.2% 50.0% 27.1% 9.9% c
outside deptartment but within UD 8.8% 6.0% 12.3% 14.3% 7.0% 7.8% outside of UD 15.1% 11.3% 19.8% a 25.0% 13.9% 10.8% a
Informal Mentoring: within your department 56.2% 49.3% 64.5% a 87.5% 59.5% 43.7% c
outside deptartment but within UD 35.4% 26.3% 46.7% c 44.6% 35.7% 30.5% outside of UD 51.5% 42.8% 62.3% b 70.9% 47.8% 50.0% a
a" p<.05"" b "P<.01"" c "P<.001
UD ADVANCE 2016 Faculty Climate Survey Report 18
mentoring outside of UD; 81% of respondents rated this mentoring as above average to excellent. Table 4.2: Efficacy of Mentoring
When disaggregating by sex and rank, we find that women are somewhat more satisfied with the mentoring they receive. However, comparisons of the interaction of sex and rank revealed an interesting pattern (supplemental tables available upon request). For women, full professors are more satisfied with formal mentoring within their department than their assistant or associate professor peers. For men, full professors are least satisfied with formal mentoring within their department. When looking at informal mentoring within department, men and women had similar patterns across ranks, with female faculty slightly more satisfied than their male peers across each rank. This same patterns holds for formal mentoring outside the department but within UD. In write-in comments, suggestions around mentoring faculty suggest a need for mentoring across the university, as faculty perceive the availability of mentoring as “spotty” with the quality of mentoring for junior faculty inconsistent across colleges and departments. Faculty voiced a need for both formal mentoring but also informal mentoring and support. A subset of these comments voiced a need for support for underrepresented faculty.
Men Women Assistant Associate ProfessorFormal mentoring: within your department 34.8% 42.4% 3.06 3.31 2.92 3.39 3.25 outside deparment but within UD 26.8% 41.1% 2.43 a 3.29 a 2.67 2.72 3.20 outside of UD 13.8% 66.1% 3.45 4.06 3.64 4.06 3.57Informal mentoring: within your department 11.1% 56.4% 3.46 3.75 3.48 3.73 3.61 outside dept but within UD 12.8% 57.3% 3.32 3.76 3.21 3.75 3.65 outside of UD 3.8% 81.0% 4.01 4.28 4.05 4.27 4.11a" p<.05"" b "P<.01"" c "P<.001
Mean Response Mean ResponseVery Poor/ Below Avg.
Above Avg./ Excellent

UD ADVANCE 2016 Faculty Climate Survey Report 19
Section 5: Work-Family Balance
This section included questions on various topics to help characterize the experiences of UD faculty with respect to balancing their career advancement with family considerations. Topics included dual career situations, family and parental leave, and stop-the-tenure-clock policies. Dual Career In this section, our aim was to understand the number of UD faculty for whom spouse or partner (hereafter partner) employment needs impact(ed) their career decisions. Among the T/TT survey respondents, 84.1% indicated that they have a partner. Faculty with partners were asked about their partners’ employment situations, including whether they are employed, whether they work in academia, whether they work at UD, and whether they are satisfied with career opportunities at UD and in the community. Next, those faculty with employed partners were asked whether someone at UD was formally involved in helping their partners find jobs. Finally, faculty were asked if their partner’s employment was important in their decision to accept the position at UD. Table 5.1 shows the results for T/TT faculty who have partners who work2. Table 5.1: Spouse/Partner Employment
Overall results indicate that a large percentage of the UD faculty have working partners: half of the men (51.7%) and nearly three quarters of the women (73.4%) have a partner who works full-time. Of these, over a third (39.8%) have a partner that works in academia, with similar rates for male and female faculty. Of those faculty whose partners work in academia, the majority have partners who work at UD (81.8% of men and 63.0% women). These numbers tell us that dual career is a significant issue at UD, and a higher percentage of women faculty than men have partners who work at UD. Notably, women are more likely to report that their spouse or partner’s employment was important in their decision to accept a job at UD (3.57 vs. 3.03; p<.05; see Table 5.2). This finding may have implications for recruiting and hiring women faculty. 2 The table likely reflects some degree of double counting that occurs when both members of UD faculty couples completed the survey. Because the survey was anonymous, we cannot quantify the extent of the double counting.
T/TT Faculty Men Women Assistant Associate ProfessorSouse/Partner is employed: Full-Time 61.5% 51.7% 73.4% a 68.2% 70.4% 51.7% b
Part-Time 16.0% 20.3% 10.6% 18.2% 14.3% 16.7%Spouse/Partner works in academia 39.8% 41.2% 41.8% 28.9% 48.8% 35.8% Spouse/Partner works at UD 72.5%% 63.0% 81.8% 81.8% 65.0% 79.3%Someone at UD was formally involved in helping spouse/partner find job
41.8% 46.5% 37.5% 70.0% 32.5% 44.8%
a" p<.05"" b "P<.01"" c "P<.001

UD ADVANCE 2016 Faculty Climate Survey Report 20
Table 5.2: Spouse/Partner Employment & UD
The survey shows that individuals at UD frequently assist faculty in finding partner employment opportunities (see Table 5.1). Of those respondents whose partner works in academia, almost half of men (46.5%) and 37.5% of women report someone from UD was involved in a formal capacity in helping their partner find employment. With respect to partner satisfaction with career opportunities at UD, only a small fraction of faculty report high levels of partner career satisfaction (10.4%; see Table 5.3). Women faculty report their partner is significantly less satisfied with career opportunities at UD than do men (3.20 vs. 3.79; p<.05). Partner satisfaction with career opportunities in the community is somewhat better, with about a fifth (20.3%) of faculty reporting their partner is extremely satisfied or satisfied. Assistant professors report their partners are less satisfied with career opportunities in the community than are partners of associate and full professors. This suggests that junior faculty may need additional assistance with dual career concerns. Table 5.3: Partner Satisfaction with Career Opportunities
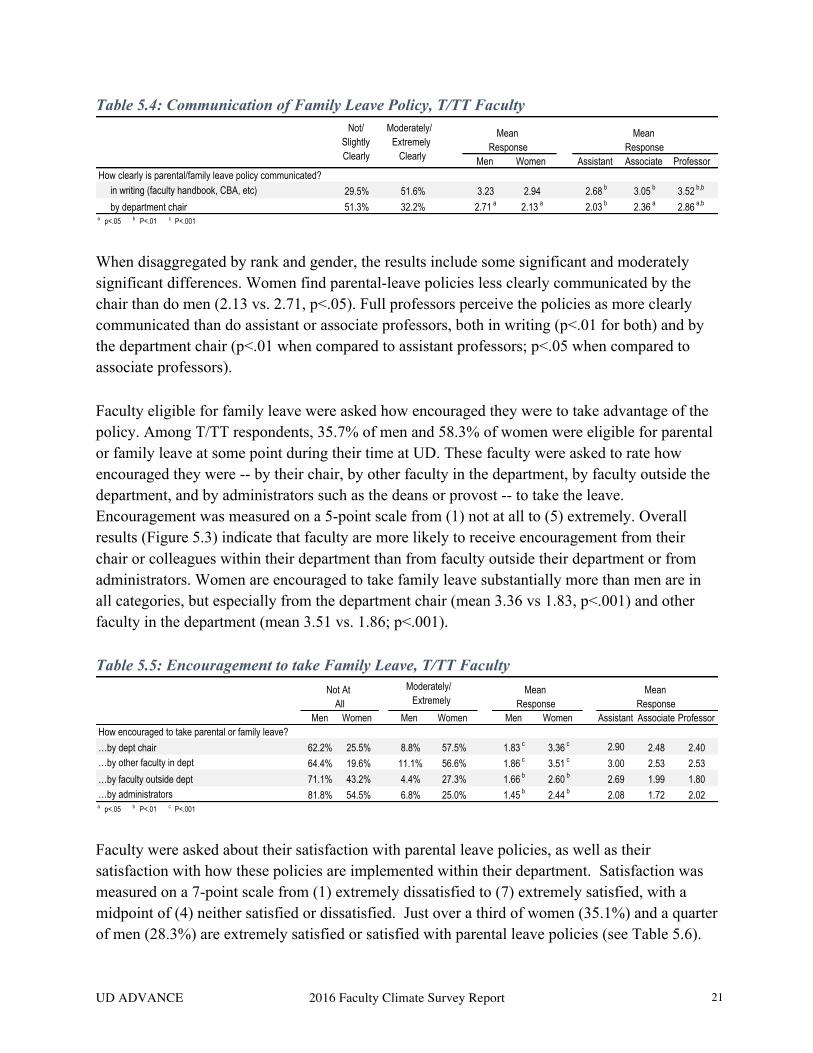
Family and Parental Leave Faculty were asked how well UD’s family-leave policies are communicated in written documents (e.g., in the faculty handbook or collective bargaining agreement) and by the department chair. Clarity was measured on a 5-point scale from (1) not clearly to (5) extremely clearly. Overall results indicate (Figure 5.2) that the policies are more clearly communicated in writing than by the department chair. Among the T/TT respondents, half (51.6%) find the written documents moderately or extremely clear, although close to a third (29.5%) find them not clear or slightly clear. In contrast, half of the respondents (51.3%) perceive the chair’s communication as not clear or slightly clear, while a third (32.2%) find the chair’s communication moderately or extremely clear.
Men Women Assistant Associate Professor
Was spouse/partner's employment important in your decision to accept a job at UD?
38.2% 49.1% 3.03 a 3.57 a 3.38 3.38 3.15
a p<.05 b P<.01 c P<.001
Not At All/Slightly
Moderately/Extremely
Mean Response Mean Response
Men Women Assistant Associate ProfessorIs spouse/partner satisifed with career opportunites at UD?
29.1% 10.4% 3.79 a 3.20 a 3.47 3.67 3.34
Is spouse/partner satisfied with career opportunites in community?
24.6% 20.3% 3.92 3.62 3.31 b,c 4.20 b 3.80 c
a p<.05 b P<.01 c P<.001
Mean ResponseMean ResponseExtremely
Dissatisfied/ Dissatisifed
Extremely Satisifed/ Satisfied
UD ADVANCE 2016 Faculty Climate Survey Report 21
Table 5.4: Communication of Family Leave Policy, T/TT Faculty
When disaggregated by rank and gender, the results include some significant and moderately significant differences. Women find parental-leave policies less clearly communicated by the chair than do men (2.13 vs. 2.71, p<.05). Full professors perceive the policies as more clearly communicated than do assistant or associate professors, both in writing (p<.01 for both) and by the department chair (p<.01 when compared to assistant professors; p<.05 when compared to associate professors). Faculty eligible for family leave were asked how encouraged they were to take advantage of the policy. Among T/TT respondents, 35.7% of men and 58.3% of women were eligible for parental or family leave at some point during their time at UD. These faculty were asked to rate how encouraged they were -- by their chair, by other faculty in the department, by faculty outside the department, and by administrators such as the deans or provost -- to take the leave. Encouragement was measured on a 5-point scale from (1) not at all to (5) extremely. Overall results (Figure 5.3) indicate that faculty are more likely to receive encouragement from their chair or colleagues within their department than from faculty outside their department or from administrators. Women are encouraged to take family leave substantially more than men are in all categories, but especially from the department chair (mean 3.36 vs 1.83, p<.001) and other faculty in the department (mean 3.51 vs. 1.86; p<.001). Table 5.5: Encouragement to take Family Leave, T/TT Faculty
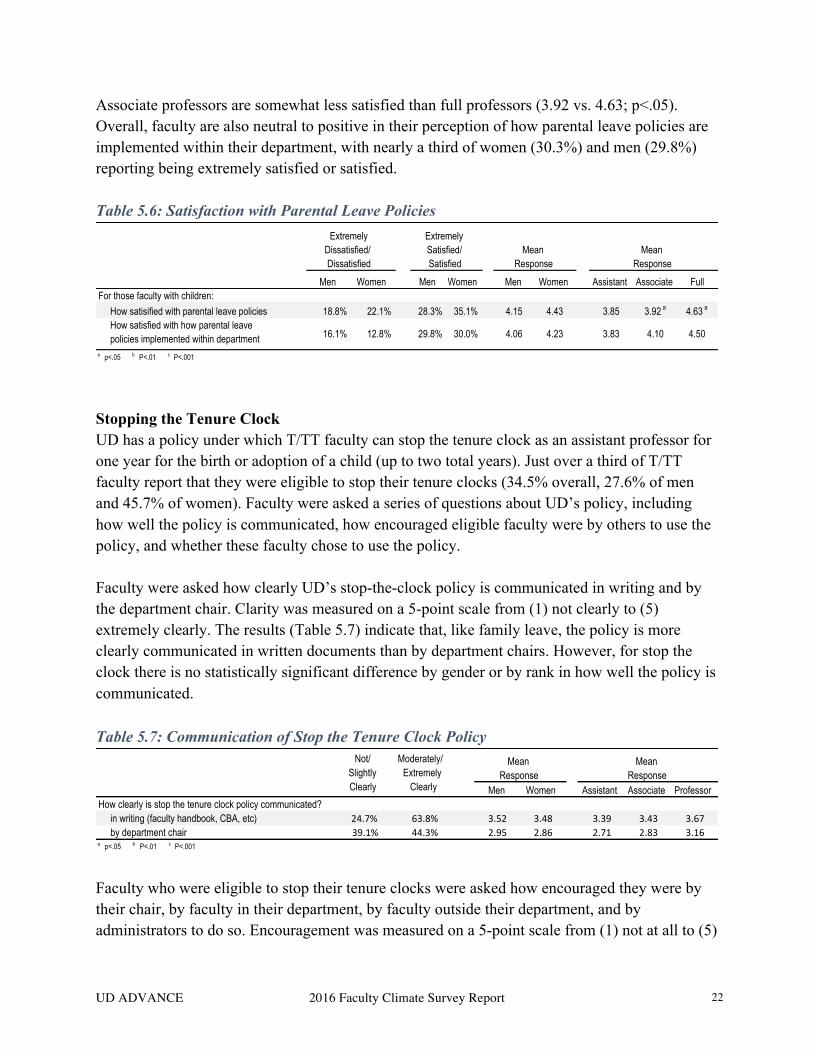
Faculty were asked about their satisfaction with parental leave policies, as well as their satisfaction with how these policies are implemented within their department. Satisfaction was measured on a 7-point scale from (1) extremely dissatisfied to (7) extremely satisfied, with a midpoint of (4) neither satisfied or dissatisfied. Just over a third of women (35.1%) and a quarter of men (28.3%) are extremely satisfied or satisfied with parental leave policies (see Table 5.6).
Men Women Assistant Associate ProfessorHow clearly is parental/family leave policy communicated? in writing (faculty handbook, CBA, etc) 29.5% 51.6% 3.23 2.94 2.68 b 3.05 b 3.52 b,b
by department chair 51.3% 32.2% 2.71 a 2.13 a 2.03 b 2.36 a 2.86 a,b
a p<.05 b P<.01 c P<.001
Mean Response
Moderately/Extremely
Clearly
Mean Response
Not/Slightly Clearly
Men Women Men Women Men Women Assistant Associate ProfessorHow encouraged to take parental or family leave?…by dept chair 62.2% 25.5% 8.8% 57.5% 1.83 c 3.36 c 2.90 2.48 2.40…by other faculty in dept 64.4% 19.6% 11.1% 56.6% 1.86 c 3.51 c 3.00 2.53 2.53…by faculty outside dept 71.1% 43.2% 4.4% 27.3% 1.66 b 2.60 b 2.69 1.99 1.80…by administrators 81.8% 54.5% 6.8% 25.0% 1.45 b 2.44 b 2.08 1.72 2.02a p<.05 b P<.01 c P<.001
Moderately/Extremely
Not At All
Mean Response
Mean Response
UD ADVANCE 2016 Faculty Climate Survey Report 22
Associate professors are somewhat less satisfied than full professors (3.92 vs. 4.63; p<.05). Overall, faculty are also neutral to positive in their perception of how parental leave policies are implemented within their department, with nearly a third of women (30.3%) and men (29.8%) reporting being extremely satisfied or satisfied. Table 5.6: Satisfaction with Parental Leave Policies
Stopping the Tenure Clock UD has a policy under which T/TT faculty can stop the tenure clock as an assistant professor for one year for the birth or adoption of a child (up to two total years). Just over a third of T/TT faculty report that they were eligible to stop their tenure clocks (34.5% overall, 27.6% of men and 45.7% of women). Faculty were asked a series of questions about UD’s policy, including how well the policy is communicated, how encouraged eligible faculty were by others to use the policy, and whether these faculty chose to use the policy. Faculty were asked how clearly UD’s stop-the-clock policy is communicated in writing and by the department chair. Clarity was measured on a 5-point scale from (1) not clearly to (5) extremely clearly. The results (Table 5.7) indicate that, like family leave, the policy is more clearly communicated in written documents than by department chairs. However, for stop the clock there is no statistically significant difference by gender or by rank in how well the policy is communicated. Table 5.7: Communication of Stop the Tenure Clock Policy
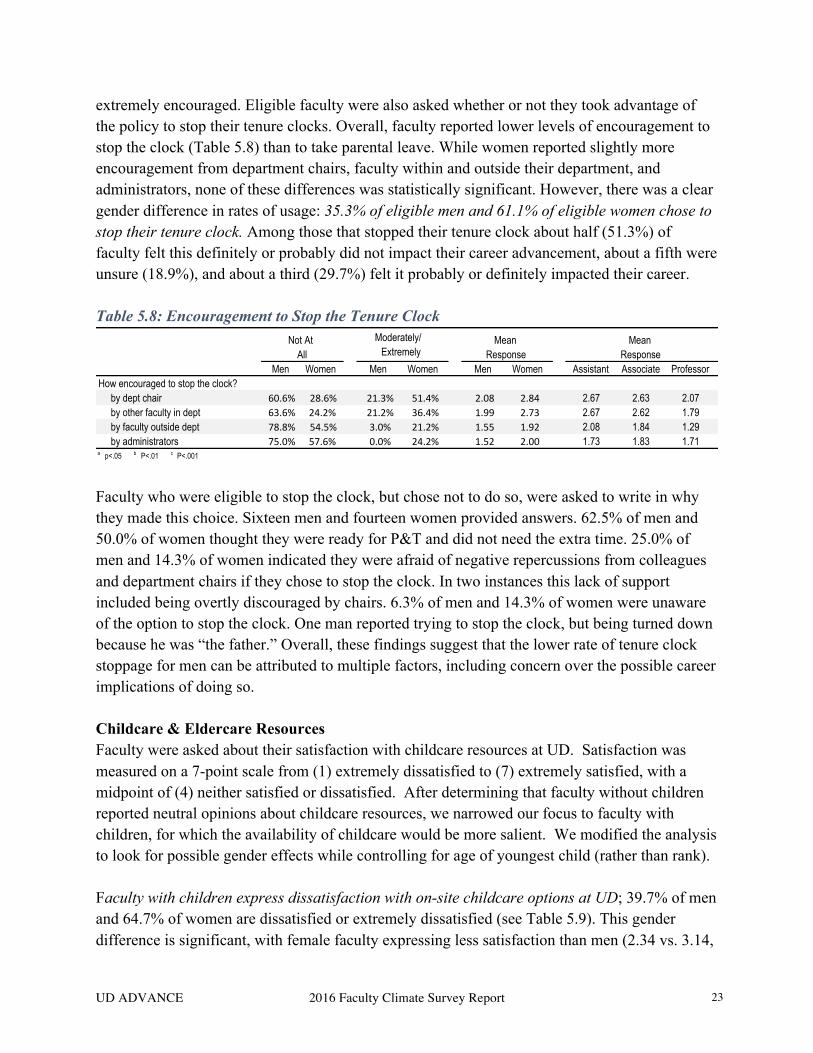
Faculty who were eligible to stop their tenure clocks were asked how encouraged they were by their chair, by faculty in their department, by faculty outside their department, and by administrators to do so. Encouragement was measured on a 5-point scale from (1) not at all to (5)
Men Women Men Women Men Women Assistant Associate FullFor those faculty with children: How satisified with parental leave policies 18.8% 22.1% 28.3% 35.1% 4.15 4.43 3.85 3.92 a 4.63 a
How satisfied with how parental leave policies implemented within department 16.1% 12.8% 29.8% 30.0% 4.06 4.23 3.83 4.10 4.50
a p<.05 b P<.01 c P<.001
Extremely Dissatisfied/Dissatisfied
Extremely Satisfied/Satisfied
Mean Response
Mean Response
Men Women Assistant Associate ProfessorHow clearly is stop the tenure clock policy communicated? in writing (faculty handbook, CBA, etc) 24.7% 63.8% 3.52 3.48 3.39 3.43 3.67 by department chair 39.1% 44.3% 2.95 2.86 2.71 2.83 3.16a p<.05 b P<.01 c P<.001
Not/Slightly Clearly
Moderately/Extremely
Clearly
MeanResponse
Mean Response
UD ADVANCE 2016 Faculty Climate Survey Report 23
extremely encouraged. Eligible faculty were also asked whether or not they took advantage of the policy to stop their tenure clocks. Overall, faculty reported lower levels of encouragement to stop the clock (Table 5.8) than to take parental leave. While women reported slightly more encouragement from department chairs, faculty within and outside their department, and administrators, none of these differences was statistically significant. However, there was a clear gender difference in rates of usage: 35.3% of eligible men and 61.1% of eligible women chose to stop their tenure clock. Among those that stopped their tenure clock about half (51.3%) of faculty felt this definitely or probably did not impact their career advancement, about a fifth were unsure (18.9%), and about a third (29.7%) felt it probably or definitely impacted their career. Table 5.8: Encouragement to Stop the Tenure Clock
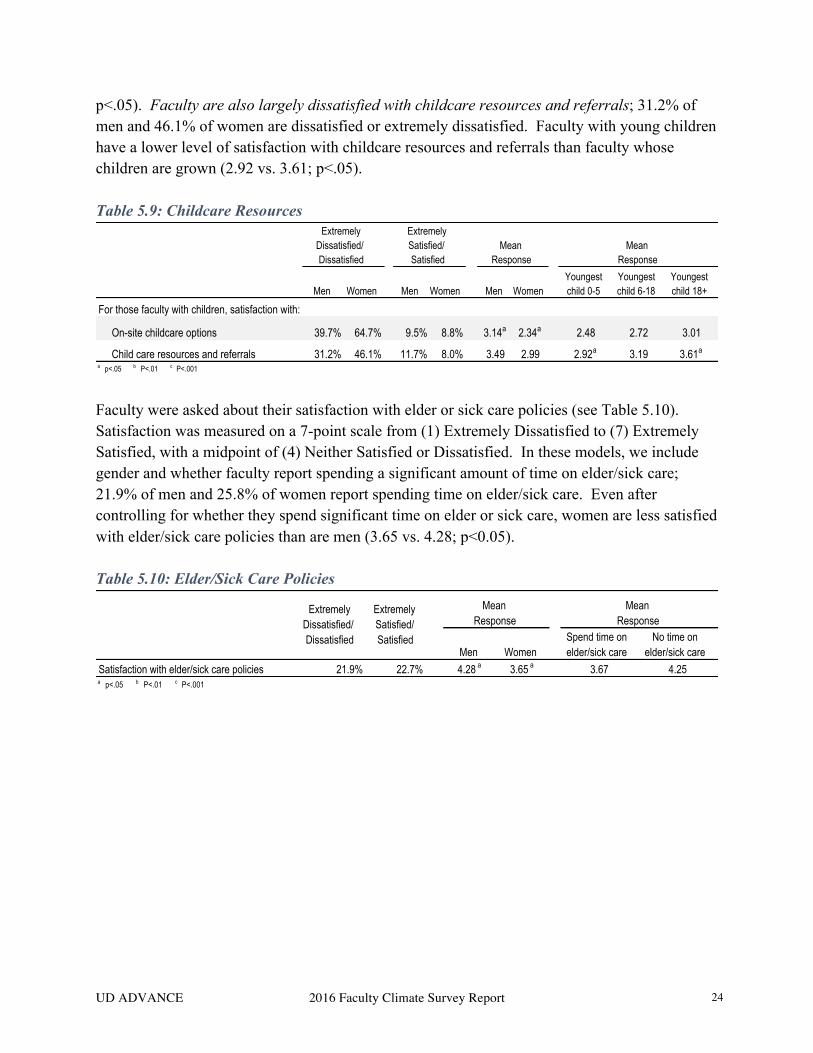
Faculty who were eligible to stop the clock, but chose not to do so, were asked to write in why they made this choice. Sixteen men and fourteen women provided answers. 62.5% of men and 50.0% of women thought they were ready for P&T and did not need the extra time. 25.0% of men and 14.3% of women indicated they were afraid of negative repercussions from colleagues and department chairs if they chose to stop the clock. In two instances this lack of support included being overtly discouraged by chairs. 6.3% of men and 14.3% of women were unaware of the option to stop the clock. One man reported trying to stop the clock, but being turned down because he was “the father.” Overall, these findings suggest that the lower rate of tenure clock stoppage for men can be attributed to multiple factors, including concern over the possible career implications of doing so. Childcare & Eldercare Resources Faculty were asked about their satisfaction with childcare resources at UD. Satisfaction was measured on a 7-point scale from (1) extremely dissatisfied to (7) extremely satisfied, with a midpoint of (4) neither satisfied or dissatisfied. After determining that faculty without children reported neutral opinions about childcare resources, we narrowed our focus to faculty with children, for which the availability of childcare would be more salient. We modified the analysis to look for possible gender effects while controlling for age of youngest child (rather than rank). Faculty with children express dissatisfaction with on-site childcare options at UD; 39.7% of men and 64.7% of women are dissatisfied or extremely dissatisfied (see Table 5.9). This gender difference is significant, with female faculty expressing less satisfaction than men (2.34 vs. 3.14,
Men Women Men Women Men Women Assistant Associate ProfessorHow encouraged to stop the clock? by dept chair 60.6% 28.6% 21.3% 51.4% 2.08 2.84 2.67 2.63 2.07 by other faculty in dept 63.6% 24.2% 21.2% 36.4% 1.99 2.73 2.67 2.62 1.79 by faculty outside dept 78.8% 54.5% 3.0% 21.2% 1.55 1.92 2.08 1.84 1.29 by administrators 75.0% 57.6% 0.0% 24.2% 1.52 2.00 1.73 1.83 1.71a p<.05 b P<.01 c P<.001
Not At All
Moderately/Extremely
Mean Response
Mean Response
UD ADVANCE 2016 Faculty Climate Survey Report 24
p<.05). Faculty are also largely dissatisfied with childcare resources and referrals; 31.2% of men and 46.1% of women are dissatisfied or extremely dissatisfied. Faculty with young children have a lower level of satisfaction with childcare resources and referrals than faculty whose children are grown (2.92 vs. 3.61; p<.05). Table 5.9: Childcare Resources
Faculty were asked about their satisfaction with elder or sick care policies (see Table 5.10). Satisfaction was measured on a 7-point scale from (1) Extremely Dissatisfied to (7) Extremely Satisfied, with a midpoint of (4) Neither Satisfied or Dissatisfied. In these models, we include gender and whether faculty report spending a significant amount of time on elder/sick care; 21.9% of men and 25.8% of women report spending time on elder/sick care. Even after controlling for whether they spend significant time on elder or sick care, women are less satisfied with elder/sick care policies than are men (3.65 vs. 4.28; p<0.05). Table 5.10: Elder/Sick Care Policies
Men Women Men Women Men WomenYoungest child 0-5
Youngest child 6-18
Youngest child 18+
For those faculty with children, satisfaction with:
On-site childcare options 39.7% 64.7% 9.5% 8.8% 3.14a 2.34a 2.48 2.72 3.01
Child care resources and referrals 31.2% 46.1% 11.7% 8.0% 3.49 2.99 2.92a 3.19 3.61a
a p<.05 b P<.01 c P<.001
Extremely Satisfied/Satisfied
Mean Response
Mean Response
Extremely Dissatisfied/Dissatisfied
Men WomenSpend time on elder/sick care
No time on elder/sick care
Satisfaction with elder/sick care policies 21.9% 22.7% 4.28 a 3.65 a 3.67 4.25a p<.05 b P<.01 c P<.001
Mean Response
Mean Response
Extremely Dissatisfied/ Dissatisfied
Extremely Satisfied/Satisfied

UD ADVANCE 2016 Faculty Climate Survey Report 25
Section 6: Climate for Diversity Faculty were asked to rate the climate for diversity within departments -- overall and for a number of groups including women, faculty of color, LGBQT, and those with disabilities. Ratings were on a 7-point scale, from (1) very poor to (7) excellent, with a midpoint of (4) average. Aggregated results suggest that faculty perceive the climate for diversity to be average to slightly above average (see Table 6.1). However, about a fifth of the T/TT faculty perceive the climate to be poor or very poor for overall diversity (18.2%) and for faculty of color (21.2%). Additionally, as described below, results differ significantly by gender, race/ethnicity, and disability. Table 6.1: Departmental Climate for Diversity, Overall
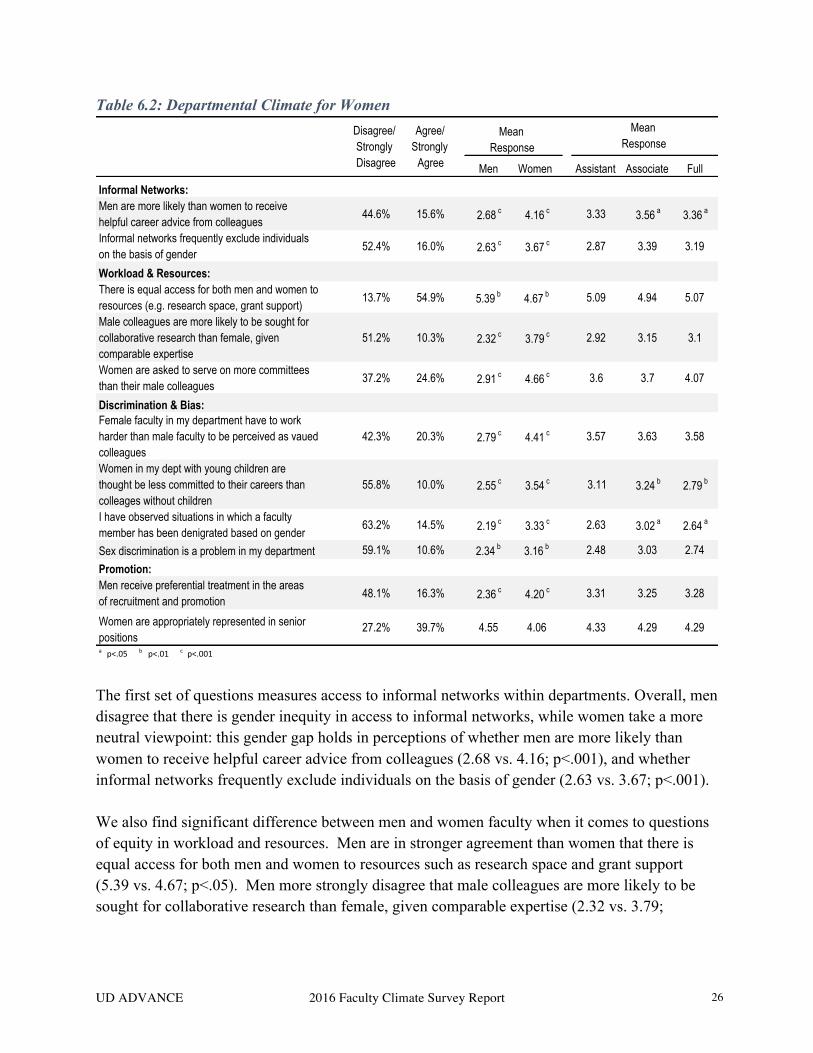
Climate for Women Women faculty perceive the climate for women within their department as less positive than do male peers (4.43 vs. 5.33; p<.001). Given this gender differences in perceptions of the departmental climate for women, we next consider the elements that may lead to this difference (see Table 6.2). These questions ask specifically about the climate for female faculty within departments and are measured on a 7-point scale, with (1) strongly disagree to (7) strongly agree, with a midpoint of (4) neither agree nor disagree.
Men Women Assistant Associate ProfessorThe climate within your dept: For women 14.1% 44.2% 5.33 c 4.43 c 4.92 4.79 4.92 For faculty of color 21.2% 35.7% 4.75 b 3.88 b 4.27 4.19 4.50 For LGBTQ faculty 9.6% 43.8% 5.24 a 4.69 a 5.09 4.81 5.00 For faculty with disabilites 7.3% 39.5% 5.15 b 4.47 b 4.74 4.64 a 5.06 a
For overall diversity 18.2% 35.6% 4.89 b 4.04 b 4.45 4.31 a 4.63 a
a p<.05 b p<.01 c p<.001
Mean Response Mean ResponseVery Poor/ Poor
Very Good/ Excellent
UD ADVANCE 2016 Faculty Climate Survey Report 26
Table 6.2: Departmental Climate for Women
The first set of questions measures access to informal networks within departments. Overall, men disagree that there is gender inequity in access to informal networks, while women take a more neutral viewpoint: this gender gap holds in perceptions of whether men are more likely than women to receive helpful career advice from colleagues (2.68 vs. 4.16; p<.001), and whether informal networks frequently exclude individuals on the basis of gender (2.63 vs. 3.67; p<.001). We also find significant difference between men and women faculty when it comes to questions of equity in workload and resources. Men are in stronger agreement than women that there is equal access for both men and women to resources such as research space and grant support (5.39 vs. 4.67; p<.05). Men more strongly disagree that male colleagues are more likely to be sought for collaborative research than female, given comparable expertise (2.32 vs. 3.79;
Men Women Assistant Associate Full
Informal Networks:Men are more likely than women to receive helpful career advice from colleagues
44.6% 15.6% 2.68 c 4.16 c 3.33 3.56 a 3.36 a
Informal networks frequently exclude individuals on the basis of gender
52.4% 16.0% 2.63 c 3.67 c 2.87 3.39 3.19
Workload & Resources:There is equal access for both men and women to resources (e.g. research space, grant support)
13.7% 54.9% 5.39 b 4.67 b 5.09 4.94 5.07
Male colleagues are more likely to be sought for collaborative research than female, given comparable expertise
51.2% 10.3% 2.32 c 3.79 c 2.92 3.15 3.1
Women are asked to serve on more committees than their male colleagues
37.2% 24.6% 2.91 c 4.66 c 3.6 3.7 4.07
Discrimination & Bias:Female faculty in my department have to work harder than male faculty to be perceived as vaued colleagues
42.3% 20.3% 2.79 c 4.41 c 3.57 3.63 3.58
Women in my dept with young children are thought be less committed to their careers than colleages without children
55.8% 10.0% 2.55 c 3.54 c 3.11 3.24 b 2.79 b
I have observed situations in which a faculty member has been denigrated based on gender
63.2% 14.5% 2.19 c 3.33 c 2.63 3.02 a 2.64 a
Sex discrimination is a problem in my department 59.1% 10.6% 2.34 b 3.16 b 2.48 3.03 2.74
Promotion:Men receive preferential treatment in the areas of recruitment and promotion
48.1% 16.3% 2.36 c 4.20 c 3.31 3.25 3.28
Women are appropriately represented in senior positions
27.2% 39.7% 4.55 4.06 4.33 4.29 4.29
a" p<.05"" b" p<.01"" c "p<.001
Mean Response
Mean Response
Disagree/ Strongly Disagree
Agree/Strongly
Agree
UD ADVANCE 2016 Faculty Climate Survey Report 27
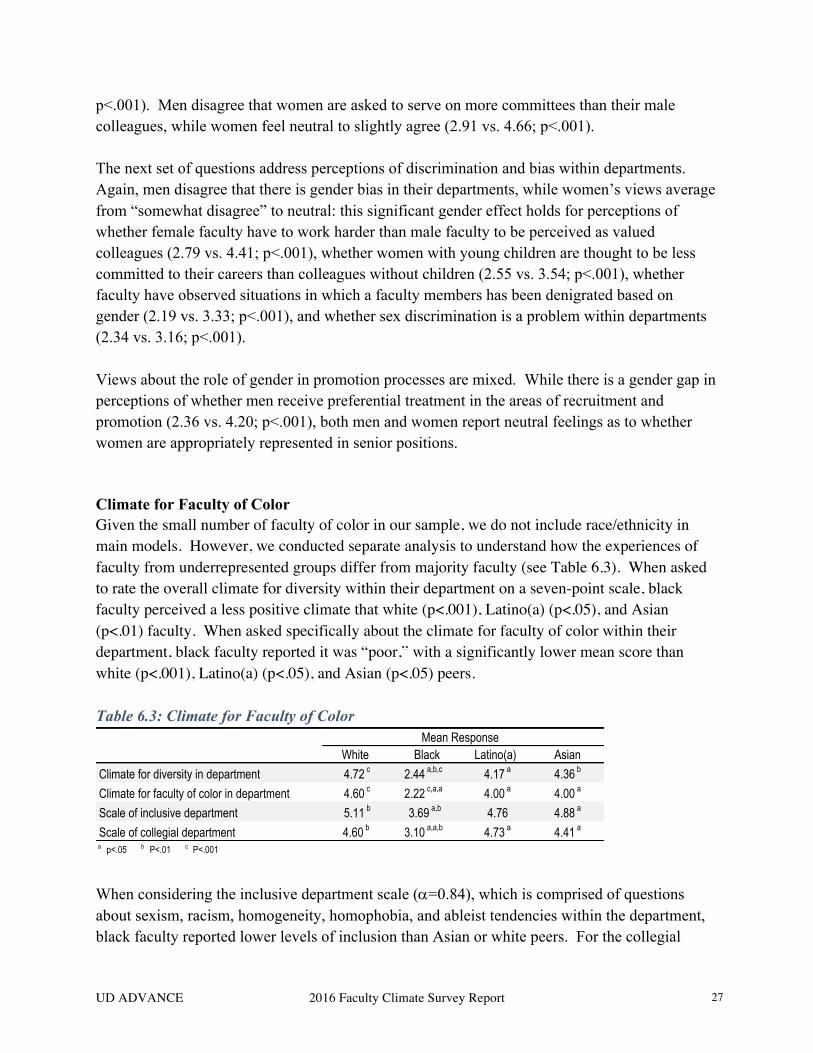
p<.001). Men disagree that women are asked to serve on more committees than their male colleagues, while women feel neutral to slightly agree (2.91 vs. 4.66; p<.001). The next set of questions address perceptions of discrimination and bias within departments. Again, men disagree that there is gender bias in their departments, while women’s views average from “somewhat disagree” to neutral: this significant gender effect holds for perceptions of whether female faculty have to work harder than male faculty to be perceived as valued colleagues (2.79 vs. 4.41; p<.001), whether women with young children are thought to be less committed to their careers than colleagues without children (2.55 vs. 3.54; p<.001), whether faculty have observed situations in which a faculty members has been denigrated based on gender (2.19 vs. 3.33; p<.001), and whether sex discrimination is a problem within departments (2.34 vs. 3.16; p<.001). Views about the role of gender in promotion processes are mixed. While there is a gender gap in perceptions of whether men receive preferential treatment in the areas of recruitment and promotion (2.36 vs. 4.20; p<.001), both men and women report neutral feelings as to whether women are appropriately represented in senior positions. Climate for Faculty of Color Given the small number of faculty of color in our sample, we do not include race/ethnicity in main models. However, we conducted separate analysis to understand how the experiences of faculty from underrepresented groups differ from majority faculty (see Table 6.3). When asked to rate the overall climate for diversity within their department on a seven-point scale, black faculty perceived a less positive climate that white (p<.001), Latino(a) (p<.05), and Asian (p<.01) faculty. When asked specifically about the climate for faculty of color within their department, black faculty reported it was “poor,” with a significantly lower mean score than white (p<.001), Latino(a) (p<.05), and Asian (p<.05) peers. Table 6.3: Climate for Faculty of Color
When considering the inclusive department scale (a=0.84), which is comprised of questions about sexism, racism, homogeneity, homophobia, and ableist tendencies within the department, black faculty reported lower levels of inclusion than Asian or white peers. For the collegial
White Black Latino(a) AsianClimate for diversity in department 4.72 c 2.44 a,b,c 4.17 a 4.36 b
Climate for faculty of color in department 4.60 c 2.22 c,a,a 4.00 a 4.00 a
Scale of inclusive department 5.11 b 3.69 a,b 4.76 4.88 a
Scale of collegial department 4.60 b 3.10 a,a,b 4.73 a 4.41 a
a p<.05 b P<.01 c P<.001
Mean Response

UD ADVANCE 2016 Faculty Climate Survey Report 28
department scale (a=0.94), which is comprised of questions about how contentious, isolating, hostile, competitive, individualistic, not supportive, unfair, and stressful the department is, black faculty reported less collegiality than Asian, Latino(a), and white peers. Given findings of a particularly negative climate for black faculty, we next consider specific types of experiences that may contribute to these perceptions (see Table 6.4) These questions ask specifically about the climate for URM faculty within departments and are measured on a 7-point scale, with (1) strongly disagree to (7) strongly agree, with a midpoint of (4) neither agree nor disagree. Table 6.4: Departmental Climate for URM Faculty
The first set of questions measures access to informal networks within departments. Black faculty have higher levels of agreement than white peers about lack of access to informal networks. Black faculty agree URM faculty are less likely to get helpful career advice from colleagues (5.22 vs. 2.81; p<.001) and that informal networks frequently exclude individuals on the basis of race or ethnicity (5.57 vs. 2.78; p<.001), while white faculty disagree with these statements. We also find significant difference between black and white faculty when it comes to questions of equity in workload and resources: black faculty are more likely to agree that white colleagues
White Black Latino(a) AsianInformal Networks:URM faculty are less likely than white faculty to get helpful career advice from colleagues 2.81 c 5.22 a,c 4.50 3.70 c
Informal networks frequently exclude individuals on the basis of race and ethnicity 2.78 c 5.57 a,c 4.11 2.84 a
Workload & Resources:There is equal access for both white and non-white faculty to research space and resources 5.30 a 3.89 a 4.60 4.90White colleagues are more likely to be sought out for collaborative research than non-white, given comperable expertise 2.61 b1,b2 4.33 b1 4.50 b2 3.37URM faculty are asked to serve on more committees than their white colleagues 3.75 a 5.33 a 4.50 3.42Discrimination & Bias:URM faculty have to work harder than white colleagues to be perceived as valued colleagues 2.94 c 5.33 b,c 4.10 3.20 b
I have observed situations in which faculty members have been denigrated based on race and ethnicity 2.46 a 4.13 a 2.50 2.84Racial and ethnic discrimination is a problem in my department 2.62 a 3.89 a 3.20 2.94Promotion:White faculty receive preferential treatment in the areas of recruitment and promotion 2.68 c 5.22 a,c 4.40 3.75 a
Faculty of color are appropriately represented in senior positions 3.72 3.11 3.30 3.64a p<.05 b P<.01 c P<.001
Mean Response

UD ADVANCE 2016 Faculty Climate Survey Report 29
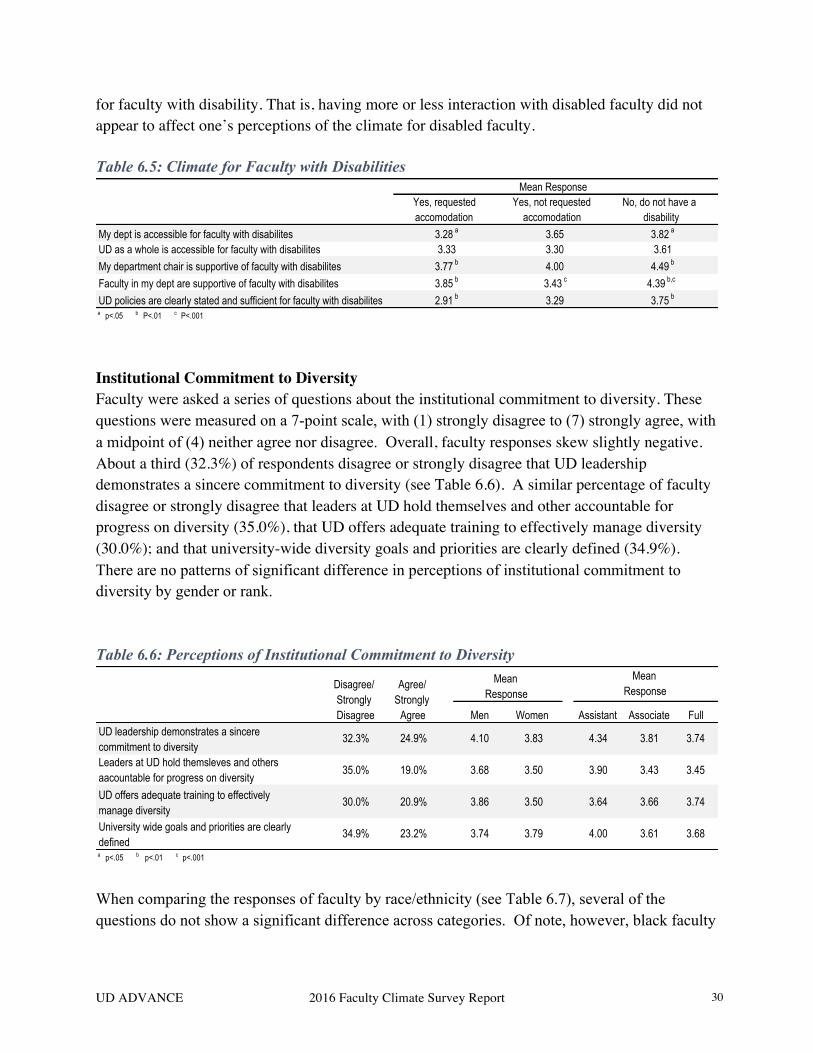
are more likely to be sought out for collaborative research than non-white colleagues (4.33 vs. 2.61; p<.01), and that URM faculty are asked to serve on more committees than white colleagues (5.33 vs. 3.75; p<.05). Black faculty are less likely than white faculty to agree that there is equal access for both white and non-white faculty to research space and resources (3.89 vs. 5.30; p<.05) The next set of questions address perceptions of discrimination and bias within departments. Black faculty are more likely than white faculty to agree that URM faculty have to work harder than white faculty to be perceived as valued colleagues (5.33 vs. 2.94; p<.001). Black faculty have generally neutral views about instances of discrimination within their department, while white faculty disagree that they have observed situations in which faculty members have been denigrated based on race or ethnicity (4.13 vs. 2.46; p<.05), and racial and ethnic discrimination is a problem in their department (3.89 vs. 2.61; p<.05). Views about the role of race/ethnicity in promotion processes are more mixed. Black faculty are more likely than white faculty to agree that white faculty receive preferential treatment in the areas of recruitment and promotion (5.22 vs. 2.68; p<.001). However, we find no significant difference by race/ethnicity in views about the lack of representation of faculty of color in senior positions within departments; all groups of faculty “somewhat disagree” that faculty of color are appropriately represented in senior positions. Climate for Disability Faculty were asked whether they have, or ever have had, a disability or condition that required accommodation. 7.3% of respondents indicate they have (or have had) a disability and had requested accommodation, 6.5% indicate they have (or have had) a disability and have not requested an accommodation, and 86.2% do not have (or have not had) a disability that qualifies for accommodation. Given the current lack of UD institutional data on faculty with disabilities, we cannot determine whether faculty with disabilities are over or under-represented among survey respondents. Responses to a series of questions about the climate for faculty with disabilities indicated that faculty with disabilities perceive a less positive climate than their non-disabled peers (see Table 6.5). Differences of note include perceptions about whether the department is accessible for faculty with disabilities, whether the department chair is supportive of faculty with disabilities, whether faculty within the department are supportive of faculty with disabilities, and whether UD policies are clearly stated and sufficient for faculty with disabilities. When respondents were asked how often they work with faculty with disabilities that require accommodation, 63.5% responded “never” or “rarely,” 24% responded “sometimes,” and 12.5% responded “very often” or “all the time.” Analysis of these categories of respondents did not identify any relationship between reported frequency of contact and attitudes towards the climate
UD ADVANCE 2016 Faculty Climate Survey Report 30
for faculty with disability. That is, having more or less interaction with disabled faculty did not appear to affect one’s perceptions of the climate for disabled faculty. Table 6.5: Climate for Faculty with Disabilities
Institutional Commitment to Diversity Faculty were asked a series of questions about the institutional commitment to diversity. These questions were measured on a 7-point scale, with (1) strongly disagree to (7) strongly agree, with a midpoint of (4) neither agree nor disagree. Overall, faculty responses skew slightly negative. About a third (32.3%) of respondents disagree or strongly disagree that UD leadership demonstrates a sincere commitment to diversity (see Table 6.6). A similar percentage of faculty disagree or strongly disagree that leaders at UD hold themselves and other accountable for progress on diversity (35.0%), that UD offers adequate training to effectively manage diversity (30.0%); and that university-wide diversity goals and priorities are clearly defined (34.9%). There are no patterns of significant difference in perceptions of institutional commitment to diversity by gender or rank. Table 6.6: Perceptions of Institutional Commitment to Diversity
When comparing the responses of faculty by race/ethnicity (see Table 6.7), several of the questions do not show a significant difference across categories. Of note, however, black faculty
Yes, requested accomodation
Yes, not requested accomodation
No, do not have a disability
My dept is accessible for faculty with disabilites 3.28 a 3.65 3.82 a
UD as a whole is accessible for faculty with disabilites 3.33 3.30 3.61My department chair is supportive of faculty with disabilites 3.77 b 4.00 4.49 b
Faculty in my dept are supportive of faculty with disabilites 3.85 b 3.43 c 4.39 b,c
UD policies are clearly stated and sufficient for faculty with disabilites 2.91 b 3.29 3.75 b
a p<.05 b P<.01 c P<.001
Mean Response
Men Women Assistant Associate FullUD leadership demonstrates a sincere commitment to diversity
32.3% 24.9% 4.10 3.83 4.34 3.81 3.74
Leaders at UD hold themsleves and others aacountable for progress on diversity
35.0% 19.0% 3.68 3.50 3.90 3.43 3.45
UD offers adequate training to effectively manage diversity
30.0% 20.9% 3.86 3.50 3.64 3.66 3.74
University wide goals and priorities are clearly defined
34.9% 23.2% 3.74 3.79 4.00 3.61 3.68
a p<.05 b p<.01 c p<.001
Disagree/ Strongly Disagree
Agree/Strongly
Agree
Mean Response
Mean Response

UD ADVANCE 2016 Faculty Climate Survey Report 31
more strongly disagree than white and Asian faculty that leaders at UD hold themselves and others accountable for progress on diversity (2.13 vs. 3.68, 3.86; p<.05). Table 6.7: Institutional Commitment to Diversity, Perceptions by Race/Ethnicity
Diversity and Faculty Search Committees Faculty were asked to assess whether faculty search committees within their departments address issues of diversity (see Table 6.8). Overall, faculty disagree or strongly disagree that search committees believe it is difficult to find qualified female applicants in their field (60.4%), that search committees talk about a candidate’s personal characteristics during discussions (56.8%), that search committees talk differently about male and female candidates (53.5%), and that search committees do not take adequate steps to recruit diverse candidates (48.3%). However, about a third of respondents agree or strongly agree that search committees believe that recruiting diverse candidates to UD is difficult (37.1%) and that search committees believe it is difficult to find qualified ethnic/racial minorities in their field (33.0%). There are no significant differences by gender, but full professors more strongly agree that search committees believe that recruiting diverse candidates to UD is difficult and agree search committees believe it is difficult to find qualified ethnic/racial minorities in their field.
White Black Hispanic AsianUD leadership deminstrates a sincere commitment to diversity 4.11 2.75 3.00 3.86
Leaders at UD hold themsleves and others aacountable for progress on diversity 3.68 a1 2.13 a1,a2 3.10 3.86 a2
UD offers adequate training to effectively manage diversity 3.88 2.63 3.20 3.57
University wide goals and priorities are clearly defined 3.87 3.50 3.60 3.62a" p<.05"" b" p<.01"" c "p<.001
Mean Response

UD ADVANCE 2016 Faculty Climate Survey Report 32
Table 6.8: Diversity and Faculty Search Committees
When comparing the responses of faculty by race/ethnicity (see Table 6.9), we find differences across several questions. Black faculty agree that search committees in their department do not take adequate steps to recruit diverse candidates, while white and Asian faculty disagree with this statement (6.00 vs. 3.16, 3.67; p<.01). Black faculty also agree that search committees in their department believe it is difficult to recruit diverse candidates to UD, while white and Asian faculty disagree with this statement (6.00 vs. 4.76, 3.71; p<.05). Finally, black faculty agree that search committees believe it is difficult to find qualified ethnic/racial minorities in their field, while white and Asian faculty disagree (5.88 vs. 4.26, 3.81; p,>05). Table 6.9: Diversity and Faculty Search Committees, Perceptions by Race/Ethnicity
Men Women Assistant Associate Full
Faculty search committees in my department:Are concerned that focusing on diversity is at the expense of excellence
32.8% 21.0% 3.49 3.92 3.3 3.8 4.01
Do not take adequate steps to recruit diverse 48.3% 20.0% 3.16 3.66 3.37 3.47 3.39Believe it is difficult to find qualified female applicants in our field
60.4% 10.4% 2.59 2.81 2.49 2.68 2.93
Believe it is difficult to find qualified ethnic/racial minorities in our field
28.9% 33.0% 3.85 4.31 3.52 a 4.2 4.52 a
Talk different about male and female candidates 53.5% 14.3% 2.68 3.53 2.84 3.35 3.13Talk about a candidate's personal characteristics (race, sex, martial status, children, religion) during
56.8% 12.6% 2.64 3.44 3.16 3.06 2.9
Believe that recruiting diverse candidates to UD is difficult
21.3% 37.1% 4.3 4.74 4.04 a 4.62 4.91 a
a" p<.05"" b" p<.01"" c "p<.001
Disagree/ Strongly Disagree
Agree/Strongly
Agree
Mean Response
Mean Response
White Black Hispanic Asian
Faculty search committees in my department:Are concerned that focusing on diversity is at the expense of excellence 3.84 5.13 3.50 3.62
Do not take adequate steps to recruit diverse candidates 3.16 c 6.00 b,c 4.30 3.67 b
Believe it is difficult to find qualified female applicants in our field 2.71 3.75 2.80 3.24
Believe it is difficult to find qualified ethnic/racial minorities in our field 4.26 a 5.88 a1,a2 4.10 3.81 a2
Talk different about male and female 3.07 4.50 3.70 3.00Talk about a candidate's personal characteristics (race, sex, martial status, children, religion) during discussions
2.95 2.88 2.50 2.95
Believe that recruiting diverse candidates to UD is difficult 4.76 a 6.00 b 4.40 3.71 a,b
a" p<.05"" b" p<.01"" c "p<.001

UD ADVANCE 2016 Faculty Climate Survey Report 33
Faculty Actions in Support of Diversity Faculty were asked if they had intentionally engaged in an action to increase the diversity of faculty, staff, and/or students at UD over the last year. More than half (52.5%) of respondents reported they had done so. Faculty who answered “yes” were then asked to explain what they had done to advance diversity at UD as a write-in response. The most common type of activities faculty reported were related to (1) recruiting or retaining diverse students, (2) recruiting and retaining diverse faculty, and (3) promoting diversity via service work. Approximately a quarter of faculty who had taken action to promote diversity reported they had undertaken activities across two or more of these categories within the last year (i.e. both mentoring students of color and advocating for diverse hires while serving on a faculty search committee). Among those who completed the write-in question (N=193), about half had undertaken efforts at recruiting or retaining diverse students. Efforts related to recruitment of diverse students included targeted recruitment efforts both at the undergraduate and graduate level, as well as outreach at local schools to build the pipeline of diverse students. Actions to promote student retention and student success include mentoring women and students of color, nominating female students and students of color for scholarships and awards, and holding a workshop for first generation students. More than a third of faculty indicated they had participated in efforts to recruit and retain diverse faculty. Actions to recruit diverse faculty include active recruitment at professional meetings and through disciplinary associations, advocating for the consideration of diversity when serving on a search committee, and inviting diverse speakers to department colloquium. Faculty retention efforts include mentoring junior faculty from underrepresented groups and advocating for faculty of color and women to advance into positions of leadership. A smaller number of respondents indicated they served on a departmental or campus committee related to diversity, promoted diverse perspectives in the classroom or curriculum, or attended a workshop focused on diversity and inclusion.

UD ADVANCE 2016 Faculty Climate Survey Report 34
Section 7: Experiences of CT Faculty In this final section we report on the experiences of CT faculty (N=64). It should be noted that during the 2015-2016 academic year there were a number of discussions on campus and in the university senate regarding promotion policies for CT faculty. As a result, all departments have had to revise their P&T documents to explicitly address promotion for CT faculty. Given the timing of the 2016 survey, we capture CT faculty attitudes during this time of increased discussion, but before P&T documents were revised. Work Satisfaction & Departmental Climate Professional Satisfaction CT faculty were asked a number of questions about satisfaction with aspects of their professional lives. Satisfaction was measured on a 7-point scale, from (1) very dissatisfied to (7) very satisfied, with (4) being neutral. Overall, CT faculty report being somewhat satisfied with numerous elements of their professional life (see Table 7.1)3. CT faculty are most satisfied with their overall experience as a faculty member (60.3% satisfied or very satisfied). Faculty expressed less satisfaction with teaching load (42.8% satisfied or very satisfied), experience of community at UD (41.2%), current salary (32.8%), career progression (31.7%), and service load (31.8%). Table 7.1: Satisfaction with Professional Life, CT Faculty
Workload & Merit Pay Policies Faculty were asked questions regarding communication of department workload and merit pay policies in departmental documents, by the department chair, and by other faculty in the department. In each case, clarity of communication was measured on a 5-point scale from (1) not
3 A total of 64 CT faculty completed all sections of the survey; we do not disaggregate CT responses by rank.
Men Women
Professional Life:…Experience as faculty member 12.7% 60.3% 5.52 5.19…Experience of community at UD 12.7% 41.2% 4.56 4.86...Teaching load 7.9% 42.8% 4.85 5.00...Career progression 20.6% 31.7% 4.52 4.22...Service load 11.1% 31.8% 4.63 4.47…Current salary 18.0% 32.8% 4.88 4.28a" p<.05"" b" p<.01"" c "p<.001
Very Dissatisfied/ Dissatisfied
Very Satisfied/ Satisfied
Mean Response
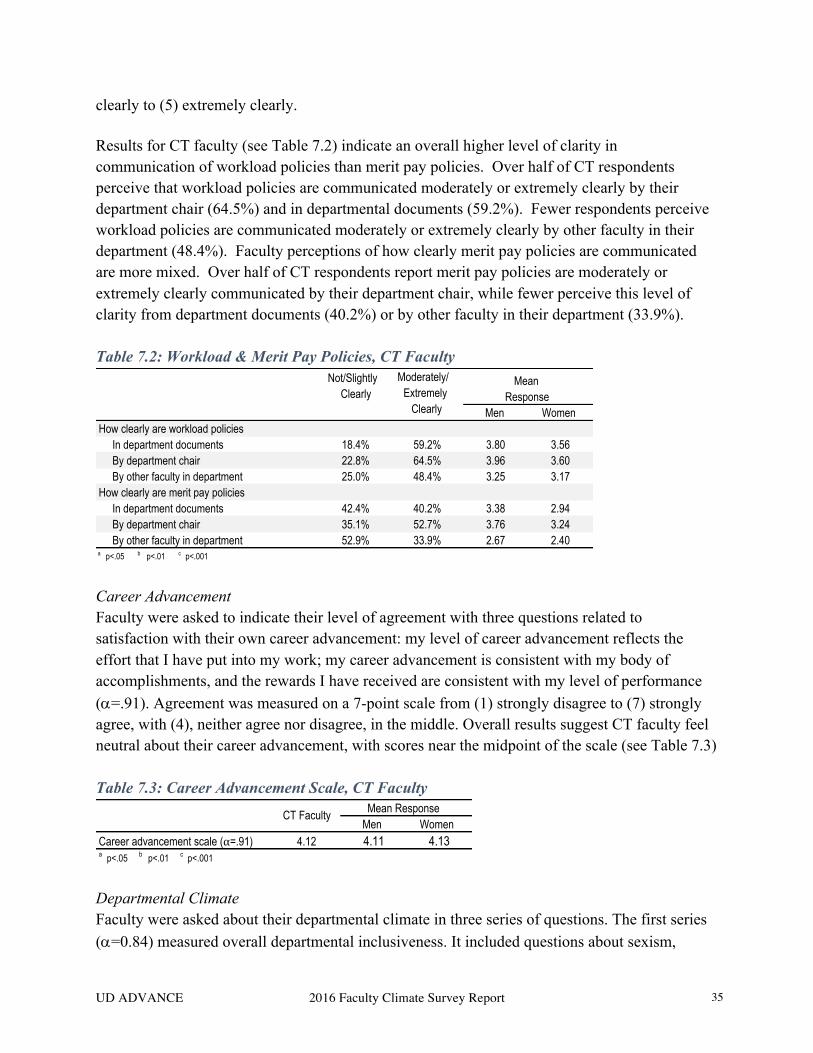
UD ADVANCE 2016 Faculty Climate Survey Report 35
clearly to (5) extremely clearly. Results for CT faculty (see Table 7.2) indicate an overall higher level of clarity in communication of workload policies than merit pay policies. Over half of CT respondents perceive that workload policies are communicated moderately or extremely clearly by their department chair (64.5%) and in departmental documents (59.2%). Fewer respondents perceive workload policies are communicated moderately or extremely clearly by other faculty in their department (48.4%). Faculty perceptions of how clearly merit pay policies are communicated are more mixed. Over half of CT respondents report merit pay policies are moderately or extremely clearly communicated by their department chair, while fewer perceive this level of clarity from department documents (40.2%) or by other faculty in their department (33.9%). Table 7.2: Workload & Merit Pay Policies, CT Faculty
Career Advancement Faculty were asked to indicate their level of agreement with three questions related to satisfaction with their own career advancement: my level of career advancement reflects the effort that I have put into my work; my career advancement is consistent with my body of accomplishments, and the rewards I have received are consistent with my level of performance (a=.91). Agreement was measured on a 7-point scale from (1) strongly disagree to (7) strongly agree, with (4), neither agree nor disagree, in the middle. Overall results suggest CT faculty feel neutral about their career advancement, with scores near the midpoint of the scale (see Table 7.3) Table 7.3: Career Advancement Scale, CT Faculty
Departmental Climate Faculty were asked about their departmental climate in three series of questions. The first series (a=0.84) measured overall departmental inclusiveness. It included questions about sexism,
Men WomenHow clearly are workload policies In department documents 18.4% 59.2% 3.80 3.56 By department chair 22.8% 64.5% 3.96 3.60 By other faculty in department 25.0% 48.4% 3.25 3.17How clearly are merit pay policies In department documents 42.4% 40.2% 3.38 2.94 By department chair 35.1% 52.7% 3.76 3.24 By other faculty in department 52.9% 33.9% 2.67 2.40a p<.05 b p<.01 c p<.001
Mean Response
Not/Slightly Clearly
Moderately/Extremely
Clearly
Men WomenCareer advancement scale (⍺=.91) 4.12 4.11 4.13a p<.05 b p<.01 c p<.001
CT Faculty Mean Response

UD ADVANCE 2016 Faculty Climate Survey Report 36
racism, homogeneity, homophobia, and ableist tendencies within the department. This was measured on a 7-point continuum, from negative to positive attributes (i.e. sexist to non-sexist). A second series (a=0.94) measured collegiality, again on a 7-point continuum. It included questions about how contentious, isolating, hostile, competitive, individualistic, not supportive, unfair, and stressful the department is. The third series (a=0.81) measured the strength of faculty voice in departmental decision-making processes. It included questions about faculty’s perception of their own voice in departmental decisions, whether meetings allow all participants to share their views, and how often committee assignments rotate fairly. This was measured on a 5-point scale, from “never” to “always,” with a score of 3 as “sometimes.” Overall results (Figure 7.4) indicate that CT faculty perceive their departments as somewhat inclusive and collegial, with a higher score for inclusion than collegiality (5.22 vs. 4.53). However, these scores are just above the midpoint of the scale, indicating CT faculty do not feel their departments are strongly inclusive or collegial. CT respondents report the strength of faculty voice in department decision making as slightly above the midpoint (3.47), indicating they “sometimes: have a voice in decision making within their department. Table 7.4: Departmental Climate, CT Faculty
Promotion Process P&T Standards To measure perceptions of P&T standards, T/TT faculty were asked whether the standards are reasonable, flexible in terms of weight given to teaching research and service, whether they have changed over time, as well as whether they are applied consistently within a department and are free from bias (Table 7.5). Faculty were also asked about their perceptions of fairness in how various groups apply P&T standards (Figure 7.6). All of these items were measured on a 7-point scale, from (1) Strongly Disagree to (7) Strongly Agree, with a score of 4 as neutral. The majority of CT respondents (61.6%) agree that promotion standards have changed over the last five years. CT faculty have mixed views on whether promotion standards are reasonable, with about a quarter of respondents both disagreeing (21.7%) and agreeing with this statement (25.0%). The mean response for this question is about 4, neither agree nor disagree. A similar patterns holds for whether promotion standards have been applied consistently within the department, with nearly equal proportions disagreeing (28.8%) and agreeing (27.1%) to this statement. For both questions, mean results are near the neutral point of the scale.
Men WomenInclusive department scale (⍺=0.84) 5.22 5.31 5.11Collegial department scale (⍺=0.94) 4.53 4.82 4.38Voice in department scale (⍺=0.81) 3.47 3.70 3.33a p<.05 b p<.01 c p<.001
CT Faculty Mean Response
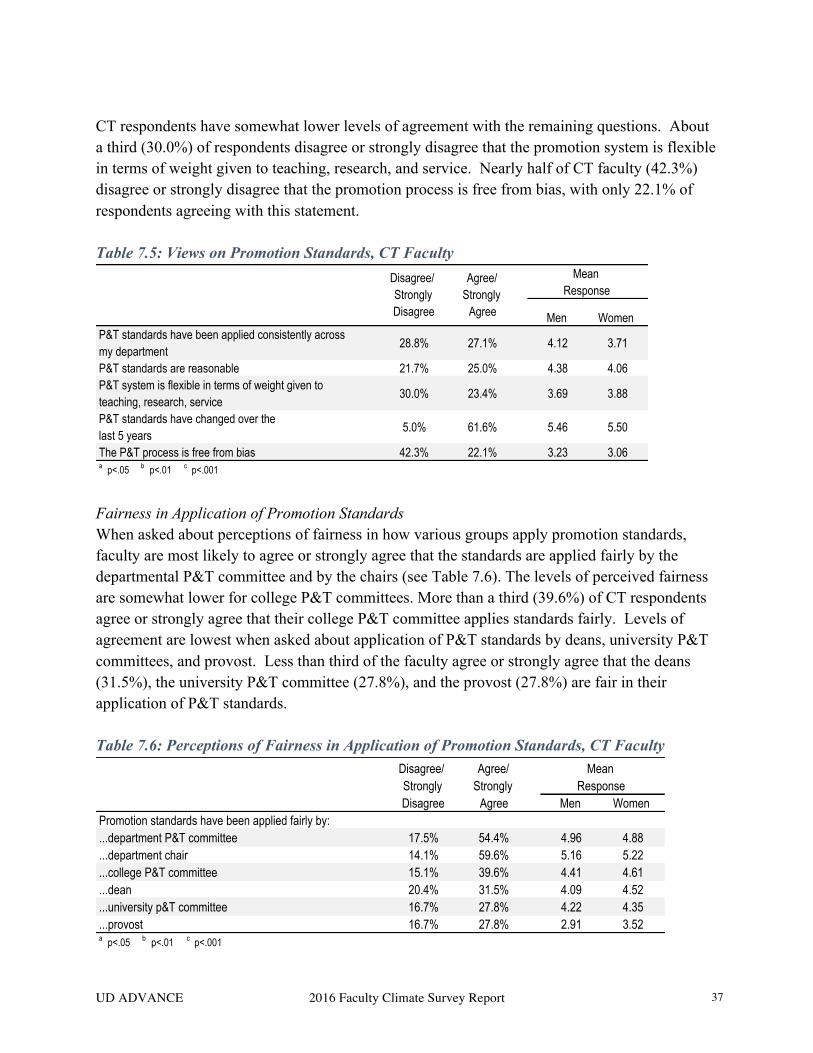
UD ADVANCE 2016 Faculty Climate Survey Report 37
CT respondents have somewhat lower levels of agreement with the remaining questions. About a third (30.0%) of respondents disagree or strongly disagree that the promotion system is flexible in terms of weight given to teaching, research, and service. Nearly half of CT faculty (42.3%) disagree or strongly disagree that the promotion process is free from bias, with only 22.1% of respondents agreeing with this statement. Table 7.5: Views on Promotion Standards, CT Faculty
Fairness in Application of Promotion Standards When asked about perceptions of fairness in how various groups apply promotion standards, faculty are most likely to agree or strongly agree that the standards are applied fairly by the departmental P&T committee and by the chairs (see Table 7.6). The levels of perceived fairness are somewhat lower for college P&T committees. More than a third (39.6%) of CT respondents agree or strongly agree that their college P&T committee applies standards fairly. Levels of agreement are lowest when asked about application of P&T standards by deans, university P&T committees, and provost. Less than third of the faculty agree or strongly agree that the deans (31.5%), the university P&T committee (27.8%), and the provost (27.8%) are fair in their application of P&T standards. Table 7.6: Perceptions of Fairness in Application of Promotion Standards, CT Faculty
Men WomenP&T standards have been applied consistently across my department
28.8% 27.1% 4.12 3.71
P&T standards are reasonable 21.7% 25.0% 4.38 4.06P&T system is flexible in terms of weight given to teaching, research, service
30.0% 23.4% 3.69 3.88
P&T standards have changed over the last 5 years
5.0% 61.6% 5.46 5.50
The P&T process is free from bias 42.3% 22.1% 3.23 3.06a p<.05 b p<.01 c p<.001
Disagree/ Strongly Disagree
Agree/Strongly
Agree
Mean Response
Men WomenPromotion standards have been applied fairly by:...department P&T committee 17.5% 54.4% 4.96 4.88...department chair 14.1% 59.6% 5.16 5.22...college P&T committee 15.1% 39.6% 4.41 4.61...dean 20.4% 31.5% 4.09 4.52...university p&T committee 16.7% 27.8% 4.22 4.35...provost 16.7% 27.8% 2.91 3.52a p<.05 b p<.01 c p<.001
Disagree/ Strongly Disagree
Agree/Strongly
Agree
Mean Response

UD ADVANCE 2016 Faculty Climate Survey Report 38
Promotion Resources Faculty were asked which resources they used to understand the P&T process (see Table 7.7). For each resource they reported using, faculty were then asked to rate how helpful it was on a 5-point scale from (1) not at all helpful to (5) extremely helpful, with a midpoint score of (3) as somewhat helpful. The most common resources CT faculty reported using were departmental documents (79.0%), the faculty handbook (79.0%), and departmental colleagues (78.7%). While also common resources, slightly fewer faculty reported using their department chair (73.8%) to help understand the promotion process. A fifth of faculty who used departmental colleagues and their department chair perceived these resources as extremely helpful. Fewer faculty who used departmental documents (14.0%) and the faculty handbook (13.7%) perceived these resources as extremely helpful. Table 7.7: Resources to Understand the Promotion Process, CT Faculty
Consistency of Job Responsibilities and Promotion Criteria CT faculty were asked how consistent the criteria for promotion are/were with the stated responsibilities of their position (see Table 7.8). This was measured on a five-point scale ranging from (1) not consistent to (5) extremely consistent, with a mid-point of (3) somewhat consistent. More than a quarter of CT faculty (27.1%) perceive the promotion criteria as not consistent with the stated responsibilities of their position. Table 7.8: Consistency of Responsibilities & Promotion Criteria, CT Faculty
Improving the Promotion Process CT Faculty were asked an open-ended write-in question about what could be done to improve the promotion process for assistant professors. A total of 47 CT faculty responded to this question. The most common themes were (1) the need for better alignment in workload and
Men WomenColleagues in your department 78.7% 12.0% 20.0% 3.57 3.30Departmental documents 79.0% 16.0% 14.0% 3.09 3.04Faculty Handbook 79.0% 13.7% 13.7% 2.91 3.18Department chair 73.8% 14.0% 20.0% 3.48 3.38a p<.05 b p<.01 c p<.001
Mean Used This Resource
NotHelpful
Extremely Helpful
Men Women
How consistent are/were the criteria for promotion with the stated responsibilites of your position 27.1% 8.5% 2.92 2.58a" p<.05"" b" p<.01"" c "p<.001
Not Consistent
Extremely Consistent
Mean Response

UD ADVANCE 2016 Faculty Climate Survey Report 39
promotion standards (36.2%), (2) the need for greater transparency in the promotion process (27.7%), (3) and a lack of clarity in the criteria for teaching excellence (25.5%). With regard to perceived lack of alignment between workload and promotion standards, CT faculty point to the importance of factors like research productivity and reputation in their field, even though their workloads are primarily teaching based. Additionally, the standards for teaching excellence are perceived as unclear, with faculty uncertain about both how to document their teaching efficacy and what the evaluation process entails. Mentoring CT faculty were asked about the availability and quality of formal and informal mentoring – within departments, outside the department but within UD, and outside UD. Formal mentors are generally assigned by one’s chair or supervisor, whereas informal mentors are not formally assigned. Faculty rated the quality of the mentoring received on a five-point scale from (1) very poor to (5) excellent, with a midpoint score of (3) average. CT faculty report receiving limited formal mentoring (see Table 7.9). Due to the small proportion of CT faculty receiving mentoring, we do not disaggregate the mentoring results by gender. About a fifth of CT faculty report receiving formal mentoring within their department, while even fewer (10.4%) report receiving formal mentoring outside their department but within UD. Informal mentoring is much more common for CT faculty, with more than half (67.6%) reporting they receive informal mentoring within their department. Across both formal and informal mentoring, the majority of CT faculty that are mentored report the quality of mentoring is above average to excellent. Table 7.9: Mentoring, CT Faculty
Very Poor/ Below Avg.
Above Avg./ Excellent
Formal Mentoring: within your department 19.4% 16.7% 55.6% outside dept but within UD 10.4% 15.4% 46.2% outside UD 10.4% 9.1% 54.6%Informal Mentoring: within your department 67.6% 9.1% 68.2% outside dept but within UD 31.8% 4.2% 66.6% outside UD 28.4% 9.5% 57.1%
Receive this type of mentoring
Quality of Mentoring