Embed Size (px)
Citation preview
California Recreational Boating Accident Statistics
www.dbw.parks.ca.gov 1-888-326-2822
State of California Natural Resources Agency
California State Parks
Division of Boating and Waterways
2016
California
2016 California Recreational Boating Accident Statistics2 I
Boating Accident Statistics
3
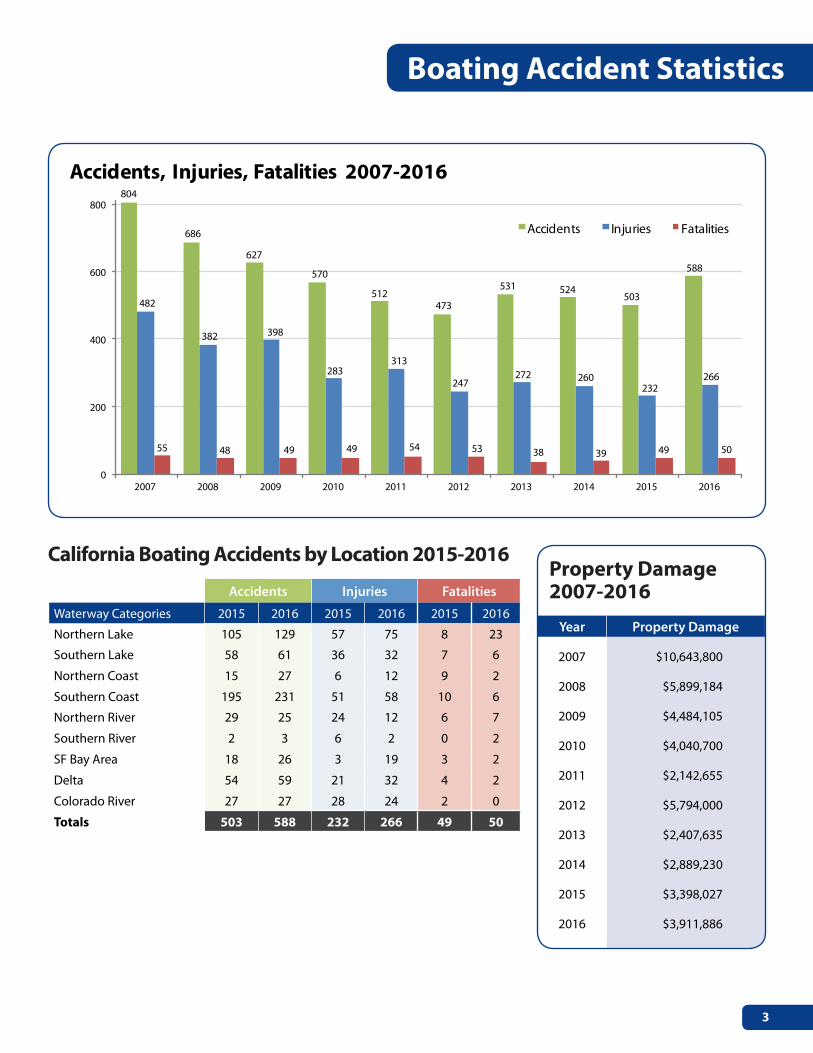
California Boating Accidents by Location 2015-2016
Accidents Injuries Fatalities
Waterway Categories 2015 2016 2015 2016 2015 2016
Northern Lake 105 129 57 75 8 23
Southern Lake 58 61 36 32 7 6
Northern Coast 15 27 6 12 9 2
Southern Coast 195 231 51 58 10 6
Northern River 29 25 24 12 6 7
Southern River 2 3 6 2 0 2
SF Bay Area 18 26 3 19 3 2
Delta 54 59 21 32 4 2
Colorado River 27 27 28 24 2 0
Totals 503 588 232 266 49 50
Property Damage 2007-2016
Year Property Damage
2007 $10,643,800
2008 $5,899,184
2009 $4,484,105
2010 $4,040,700
2011 $2,142,655
2012 $5,794,000
2013 $2,407,635
2014 $2,889,230
2015 $3,398,027
2016 $3,911,886
804
686
627
570
512473
531 524503
588
482
382 398
283313
247272 260
232266
55 48 49 49 54 53 38 39 49 50
0
200
400
600
800
2007 2008 2009 2010 2011 2012 2013 2014 2015 2016
Accidents, Injuries, Fatalities 2007-2016
Accidents Injuries Fatalities
California
2016 California Recreational Boating Accident Statistics4 I
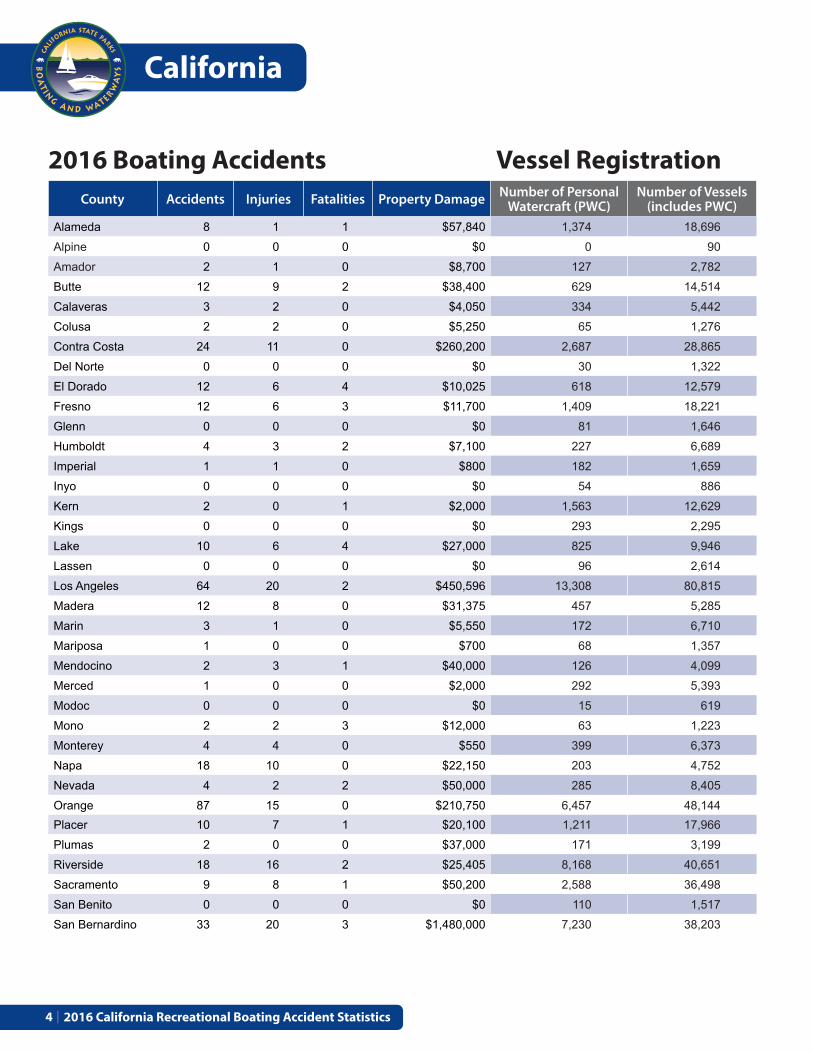
2016 Boating Accidents Vessel RegistrationCounty Accidents Injuries Fatalities Property Damage Number of Personal
Watercraft (PWC)Number of Vessels
(includes PWC)
Alameda 8 1 1 $57,840 1,374 18,696
Alpine 0 0 0 $0 0 90
Amador 2 1 0 $8,700 127 2,782
Butte 12 9 2 $38,400 629 14,514
Calaveras 3 2 0 $4,050 334 5,442
Colusa 2 2 0 $5,250 65 1,276
Contra Costa 24 11 0 $260,200 2,687 28,865
Del Norte 0 0 0 $0 30 1,322
El Dorado 12 6 4 $10,025 618 12,579
Fresno 12 6 3 $11,700 1,409 18,221
Glenn 0 0 0 $0 81 1,646
Humboldt 4 3 2 $7,100 227 6,689
Imperial 1 1 0 $800 182 1,659
Inyo 0 0 0 $0 54 886
Kern 2 0 1 $2,000 1,563 12,629
Kings 0 0 0 $0 293 2,295
Lake 10 6 4 $27,000 825 9,946
Lassen 0 0 0 $0 96 2,614
Los Angeles 64 20 2 $450,596 13,308 80,815
Madera 12 8 0 $31,375 457 5,285
Marin 3 1 0 $5,550 172 6,710
Mariposa 1 0 0 $700 68 1,357
Mendocino 2 3 1 $40,000 126 4,099
Merced 1 0 0 $2,000 292 5,393
Modoc 0 0 0 $0 15 619
Mono 2 2 3 $12,000 63 1,223
Monterey 4 4 0 $550 399 6,373
Napa 18 10 0 $22,150 203 4,752
Nevada 4 2 2 $50,000 285 8,405
Orange 87 15 0 $210,750 6,457 48,144Placer 10 7 1 $20,100 1,211 17,966
Plumas 2 0 0 $37,000 171 3,199
Riverside 18 16 2 $25,405 8,168 40,651
Sacramento 9 8 1 $50,200 2,588 36,498
San Benito 0 0 0 $0 110 1,517
San Bernardino 33 20 3 $1,480,000 7,230 38,203
Boating Accident Statistics
5
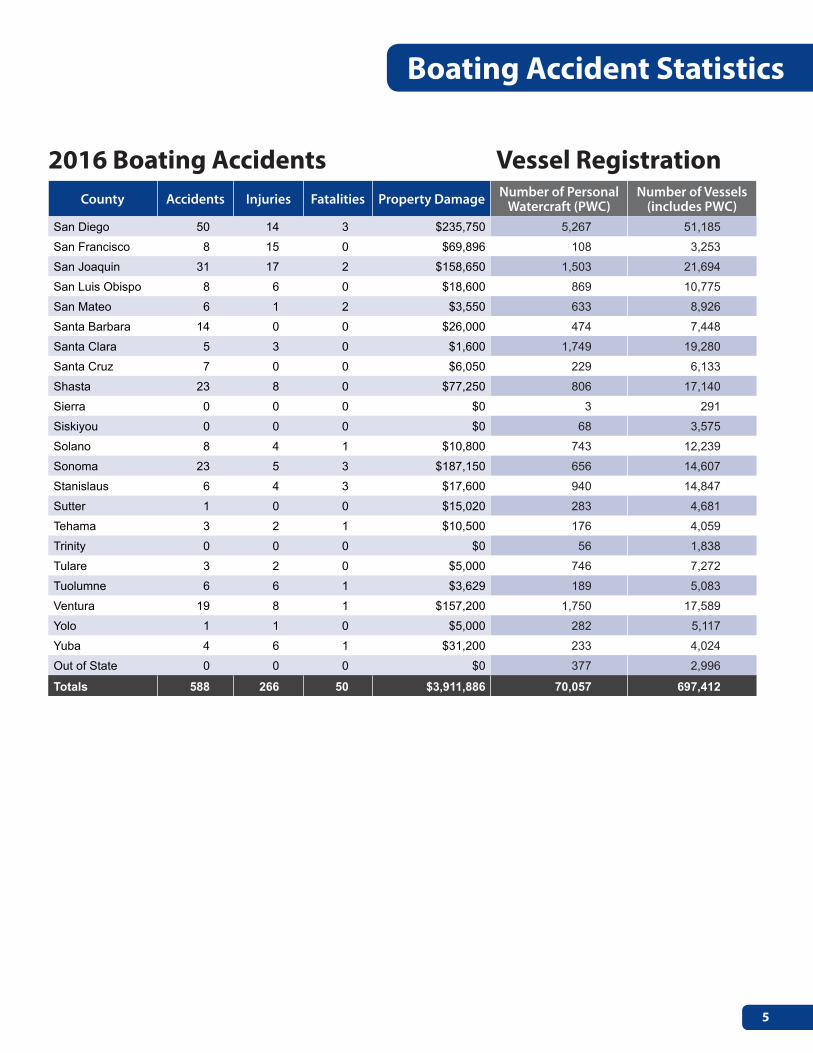
2016 Boating Accidents Vessel RegistrationCounty Accidents Injuries Fatalities Property Damage Number of Personal
Watercraft (PWC)Number of Vessels
(includes PWC)
San Diego 50 14 3 $235,750 5,267 51,185
San Francisco 8 15 0 $69,896 108 3,253
San Joaquin 31 17 2 $158,650 1,503 21,694
San Luis Obispo 8 6 0 $18,600 869 10,775
San Mateo 6 1 2 $3,550 633 8,926
Santa Barbara 14 0 0 $26,000 474 7,448
Santa Clara 5 3 0 $1,600 1,749 19,280
Santa Cruz 7 0 0 $6,050 229 6,133
Shasta 23 8 0 $77,250 806 17,140
Sierra 0 0 0 $0 3 291
Siskiyou 0 0 0 $0 68 3,575
Solano 8 4 1 $10,800 743 12,239
Sonoma 23 5 3 $187,150 656 14,607
Stanislaus 6 4 3 $17,600 940 14,847
Sutter 1 0 0 $15,020 283 4,681
Tehama 3 2 1 $10,500 176 4,059
Trinity 0 0 0 $0 56 1,838
Tulare 3 2 0 $5,000 746 7,272
Tuolumne 6 6 1 $3,629 189 5,083
Ventura 19 8 1 $157,200 1,750 17,589
Yolo 1 1 0 $5,000 282 5,117
Yuba 4 6 1 $31,200 233 4,024
Out of State 0 0 0 $0 377 2,996
Totals 588 266 50 $3,911,886 70,057 697,412
California
2016 California Recreational Boating Accident Statistics6 I
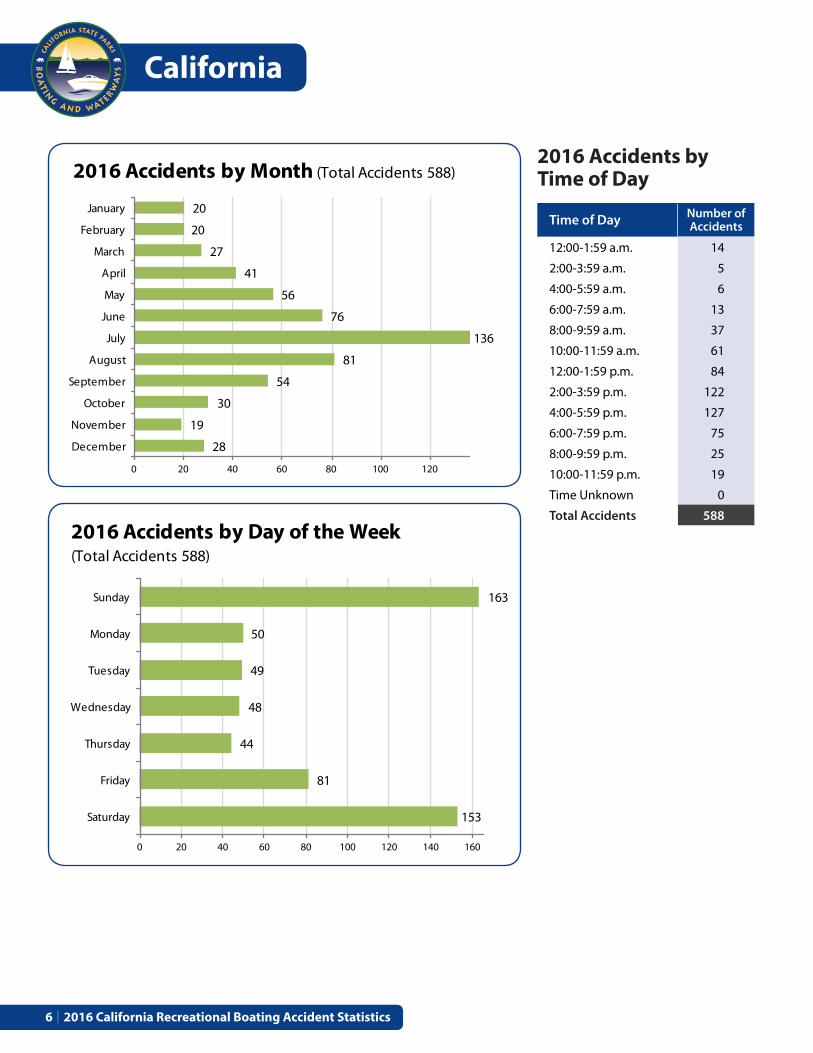
Time of Day Number of Accidents
12:00-1:59 a.m. 14
2:00-3:59 a.m. 5
4:00-5:59 a.m. 6
6:00-7:59 a.m. 13
8:00-9:59 a.m. 37
10:00-11:59 a.m. 61
12:00-1:59 p.m. 84
2:00-3:59 p.m. 122
4:00-5:59 p.m. 127
6:00-7:59 p.m. 75
8:00-9:59 p.m. 25
10:00-11:59 p.m. 19
Time Unknown 0
Total Accidents 588
2016 Accidents by Time of Day
20
20
27
41
56
76
136
81
54
30
19
28
0 20 40 60 80 100 120
January
February
March
April
May
June
July
August
September
October
November
December
2016 Accidents by Month (Total Accidents 588)
163
50
49
48
44
81
153
0 20 40 60 80 100 120 140 160
Sunday
Monday
Tuesday
Wednesday
Thursday
Friday
Saturday
2016 Accidents by Day of the Week (Total Accidents 588)
Boating Accident Statistics
7
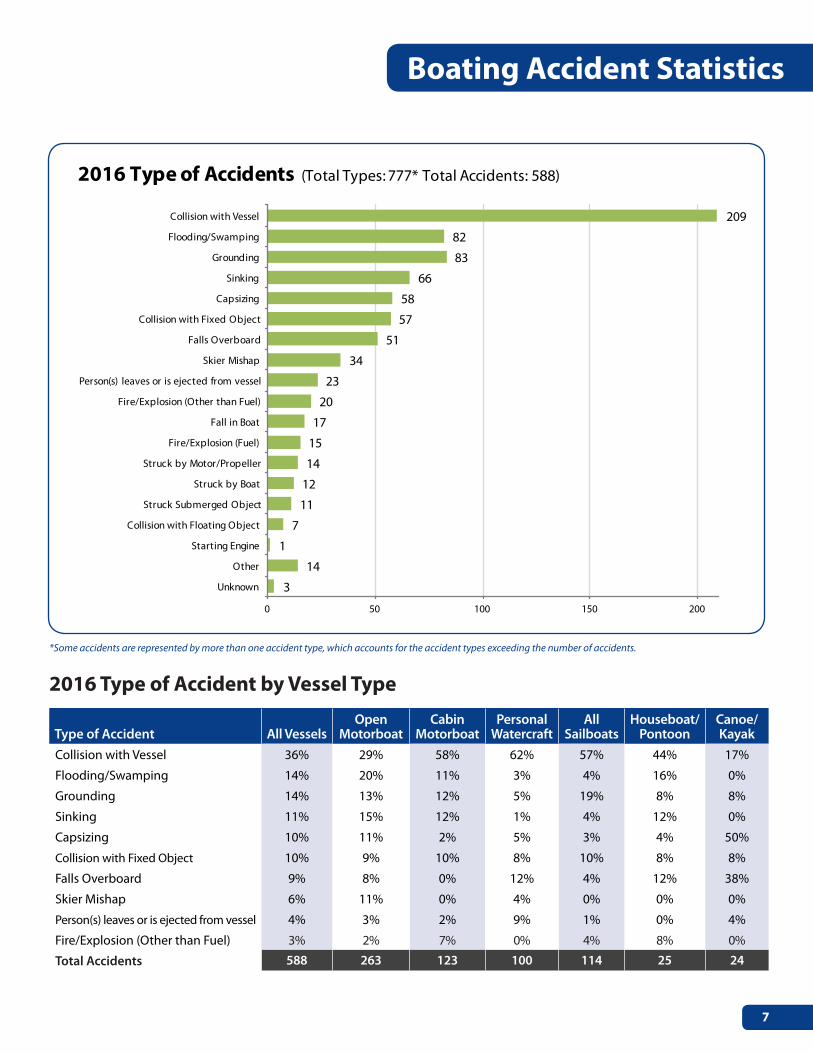
2016 Type of Accident by Vessel Type
Type of Accident All VesselsOpen
MotorboatCabin
Motorboat Personal
WatercraftAll
SailboatsHouseboat/
PontoonCanoe/Kayak
Collision with Vessel 36% 29% 58% 62% 57% 44% 17%
Flooding/Swamping 14% 20% 11% 3% 4% 16% 0%
Grounding 14% 13% 12% 5% 19% 8% 8%
Sinking 11% 15% 12% 1% 4% 12% 0%
Capsizing 10% 11% 2% 5% 3% 4% 50%
Collision with Fixed Object 10% 9% 10% 8% 10% 8% 8%
Falls Overboard 9% 8% 0% 12% 4% 12% 38%
Skier Mishap 6% 11% 0% 4% 0% 0% 0%
Person(s) leaves or is ejected from vessel 4% 3% 2% 9% 1% 0% 4%
Fire/Explosion (Other than Fuel) 3% 2% 7% 0% 4% 8% 0%
Total Accidents 588 263 123 100 114 25 24
*Some accidents are represented by more than one accident type, which accounts for the accident types exceeding the number of accidents.
209
82
83
66
58
57
51
34
23
20
17
15
14
12
11
7
1
14
3
0 50 100 150 200
Collision with Vessel
Flooding/Swamping
Grounding
Sinking
Capsizing
Collision with Fixed Object
Falls Overboard
Skier Mishap
Person(s) leaves or is ejected from vessel
Fire/Explosion (Other than Fuel)
Fall in Boat
Fire/Explosion (Fuel)
Struck by Motor/Propeller
Struck by Boat
Struck Submerged Object
Collision with Floating Object
Starting Engine
Other
Unknown
2016 Type of Accidents (Total Types: 777* Total Accidents: 588)
California
2016 California Recreational Boating Accident Statistics8 I
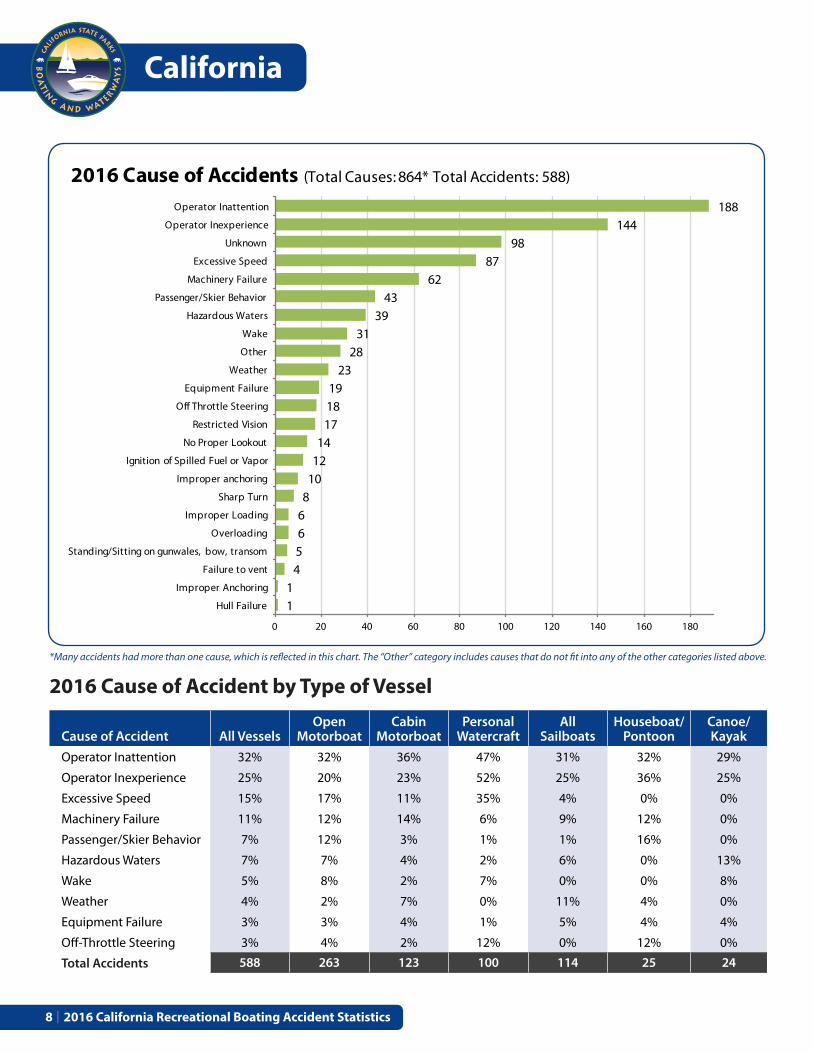
2016 Cause of Accident by Type of Vessel
Cause of Accident All VesselsOpen
MotorboatCabin
Motorboat Personal
WatercraftAll
SailboatsHouseboat/
PontoonCanoe/Kayak
Operator Inattention 32% 32% 36% 47% 31% 32% 29%
Operator Inexperience 25% 20% 23% 52% 25% 36% 25%
Excessive Speed 15% 17% 11% 35% 4% 0% 0%
Machinery Failure 11% 12% 14% 6% 9% 12% 0%
Passenger/Skier Behavior 7% 12% 3% 1% 1% 16% 0%
Hazardous Waters 7% 7% 4% 2% 6% 0% 13%
Wake 5% 8% 2% 7% 0% 0% 8%
Weather 4% 2% 7% 0% 11% 4% 0%
Equipment Failure 3% 3% 4% 1% 5% 4% 4%
Off-Throttle Steering 3% 4% 2% 12% 0% 12% 0%
Total Accidents 588 263 123 100 114 25 24
*Many accidents had more than one cause, which is reflected in this chart. The “Other” category includes causes that do not fit into any of the other categories listed above.
188144
9887
6243
3931
2823
191817
1412
108
6654
11
0 20 40 60 80 100 120 140 160 180
Operator Inattention
Operator Inexperience
Unknown
Excessive Speed
Machinery Failure
Passenger/Skier Behavior
Hazardous Waters
Wake
Other
Weather
Equipment Failure
Off Throttle Steering
Restricted Vision
No Proper Lookout
Ignition of Spilled Fuel or Vapor
Improper anchoring
Sharp Turn
Improper Loading
Overloading
Standing/Sitting on gunwales, bow, transom
Failure to vent
Improper Anchoring
Hull Failure
2016 Cause of Accidents (Total Causes: 864* Total Accidents: 588)
Boating Accident Statistics
9
All Vessels Open Motorboats Personal Watercraft
Operated ByNumber of
VesselsPercent of
VesselsNumber of
VesselsPercent of
VesselsNumber of
VesselsPercent of
Vessels
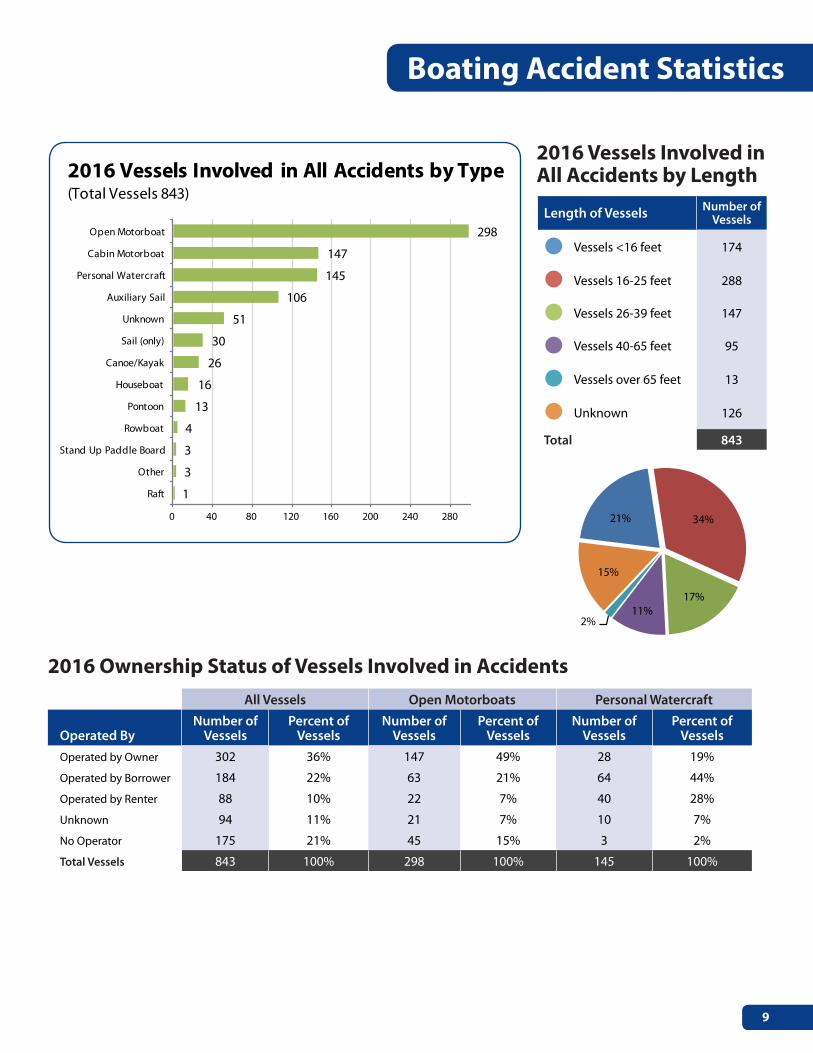
Operated by Owner 302 36% 147 49% 28 19%
Operated by Borrower 184 22% 63 21% 64 44%
Operated by Renter 88 10% 22 7% 40 28%
Unknown 94 11% 21 7% 10 7%
No Operator 175 21% 45 15% 3 2%
Total Vessels 843 100% 298 100% 145 100%
2016 Ownership Status of Vessels Involved in Accidents
2016 Vessels Involved in All Accidents by Length
Length of Vessels Number of Vessels
Vessels <16 feet 174
Vessels 16-25 feet 288
Vessels 26-39 feet 147
Vessels 40-65 feet 95
Vessels over 65 feet 13
Unknown 126
Total 843
21% 34%
17%11%
2%
15%
298
147
145
106
51
30
26
16
13
4
3
3
1
0 40 80 120 160 200 240 280
Open Motorboat
Cabin Motorboat
Personal Watercraft
Auxiliary Sail
Unknown
Sail (only)
Canoe/Kayak
Houseboat
Pontoon
Rowboat
Stand Up Paddle Board
Other
Raft
2016 Vessels Involved in All Accidents by Type (Total Vessels 843)
California
2016 California Recreational Boating Accident Statistics10 I
2016 Operator Education
2016 Gender of Operators Involved in Accidents
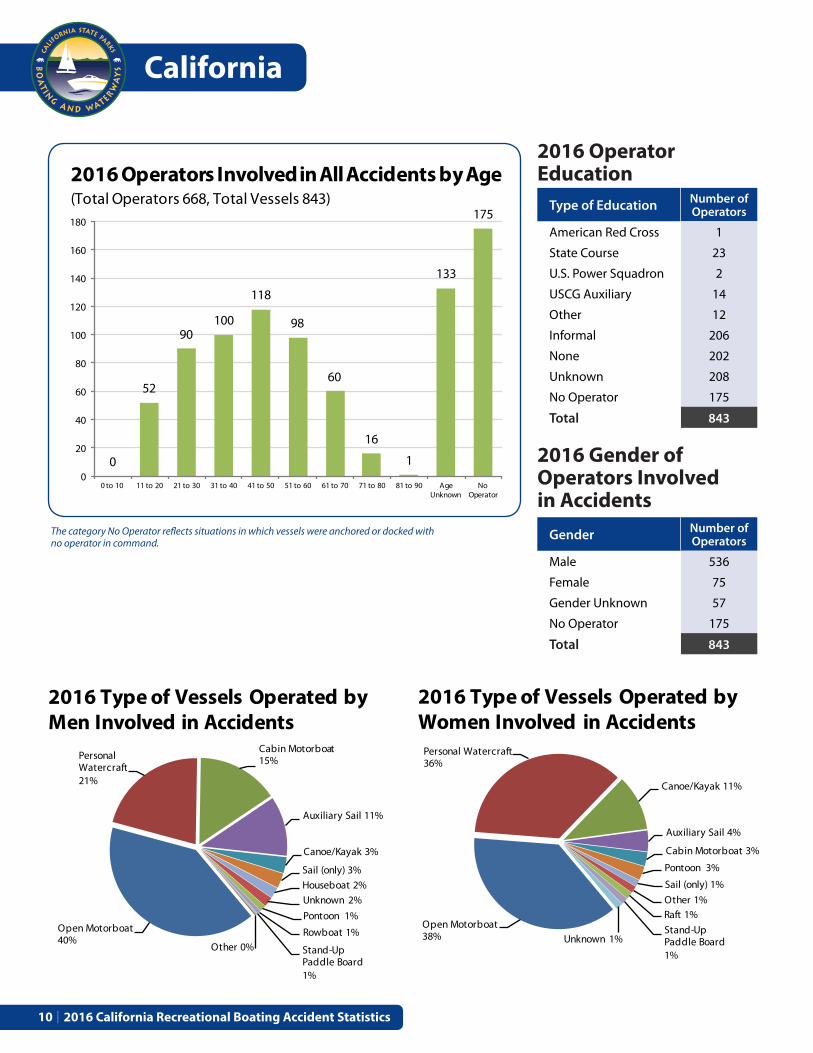
Type of Education Number of Operators
American Red Cross 1
State Course 23
U.S. Power Squadron 2
USCG Auxiliary 14
Other 12
Informal 206
None 202
Unknown 208
No Operator 175
Total 843
Gender Number of Operators
Male 536
Female 75
Gender Unknown 57
No Operator 175
Total 843
The category No Operator reflects situations in which vessels were anchored or docked with no operator in command.
0
52
90100
118
98
60
16
1
133
175
0
20
40
60
80
100
120
140
160
180
0 to 10 11 to 20 21 to 30 31 to 40 41 to 50 51 to 60 61 to 70 71 to 80 81 to 90 Age Unknown
No Operator
2016 Operators Involved in All Accidents by Age(Total Operators 668, Total Vessels 843)
Open Motorboat38%
Personal Watercraft36%
Canoe/Kayak 11%
Auxiliary Sail 4%
Cabin Motorboat 3%
Pontoon 3%
Sail (only) 1%
Other 1%Raft 1%
Stand-Up Paddle Board1%
Unknown 1%
2016 Type of Vessels Operated by Women Involved in Accidents
Open Motorboat40%
Personal Watercraft21%
Cabin Motorboat15%
Auxiliary Sail 11%
Canoe/Kayak 3%
Sail (only) 3%
Houseboat 2%Unknown 2%
Pontoon 1%
Rowboat 1%
Stand-Up Paddle Board1%
Other 0%
2016 Type of Vessels Operated by Men Involved in Accidents
Boating Accident Statistics
11
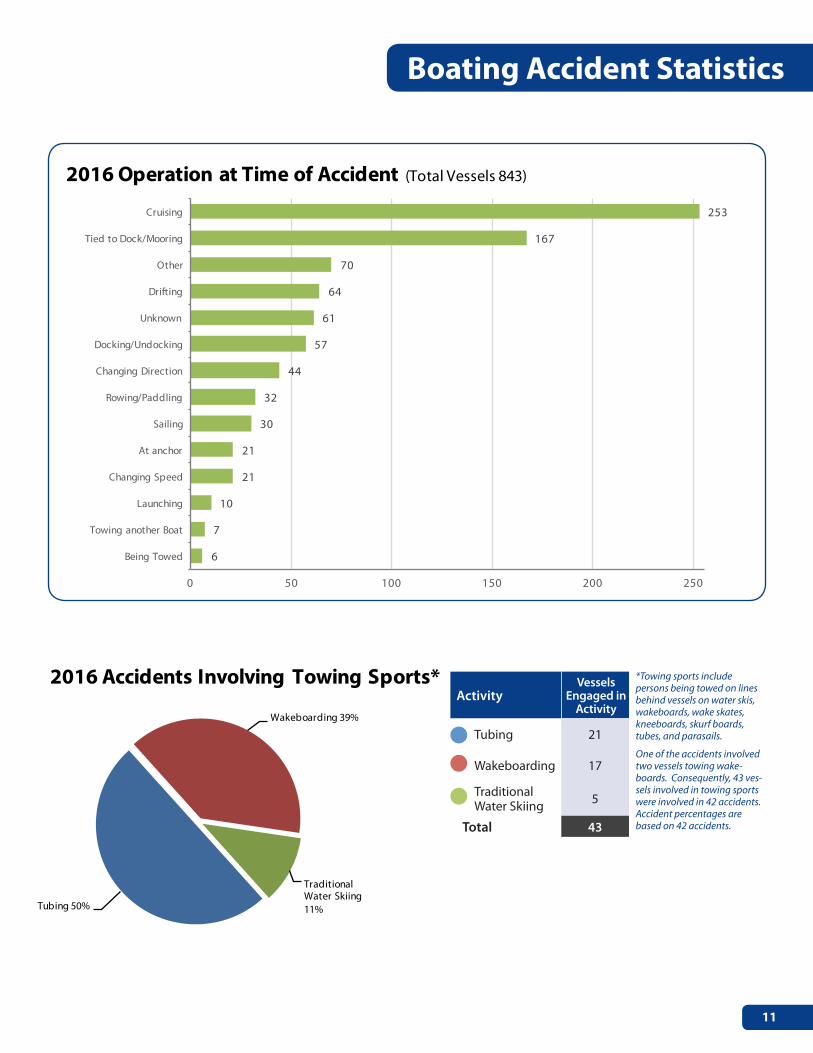
*Towing sports include persons being towed on lines behind vessels on water skis, wakeboards, wake skates, kneeboards, skurf boards, tubes, and parasails.
One of the accidents involved two vessels towing wake-boards. Consequently, 43 ves-sels involved in towing sports were involved in 42 accidents. Accident percentages are based on 42 accidents.
ActivityVessels
Engaged in Activity
Tubing 21
Wakeboarding 17
Traditional Water Skiing 5
Total 43
253
167
70
64
61
57
44
32
30
21
21
10
7
6
0 50 100 150 200 250
Cruising
Tied to Dock/Mooring
Other
Drifting
Unknown
Docking/Undocking
Changing Direction
Rowing/Paddling
Sailing
At anchor
Changing Speed
Launching
Towing another Boat
Being Towed
2016 Operation at Time of Accident (Total Vessels 843)
Tubing 50%
Wakeboarding 39%
Traditional Water Skiing11%
2016 Accidents Involving Towing Sports*
California
2016 California Recreational Boating Accident Statistics12 I
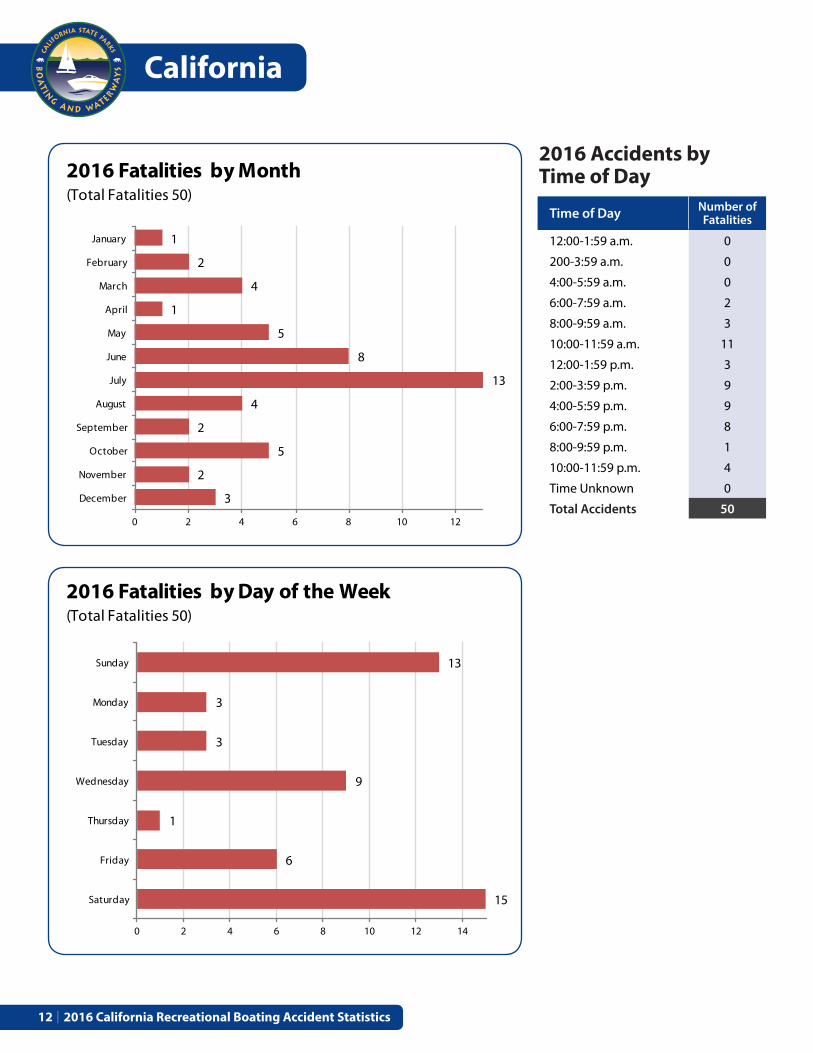
2016 Accidents by Time of Day
Time of Day Number of Fatalities
12:00-1:59 a.m. 0
200-3:59 a.m. 0
4:00-5:59 a.m. 0
6:00-7:59 a.m. 2
8:00-9:59 a.m. 3
10:00-11:59 a.m. 11
12:00-1:59 p.m. 3
2:00-3:59 p.m. 9
4:00-5:59 p.m. 9
6:00-7:59 p.m. 8
8:00-9:59 p.m. 1
10:00-11:59 p.m. 4
Time Unknown 0
Total Accidents 50
13
3
3
9
1
6
15
0 2 4 6 8 10 12 14
Sunday
Monday
Tuesday
Wednesday
Thursday
Friday
Saturday
2016 Fatalities by Day of the Week (Total Fatalities 50)
1
2
4
1
5
8
13
4
2
5
2
3
0 2 4 6 8 10 12
January
February
March
April
May
June
July
August
September
October
November
December
2016 Fatalities by Month (Total Fatalities 50)
Boating Accident Statistics
13
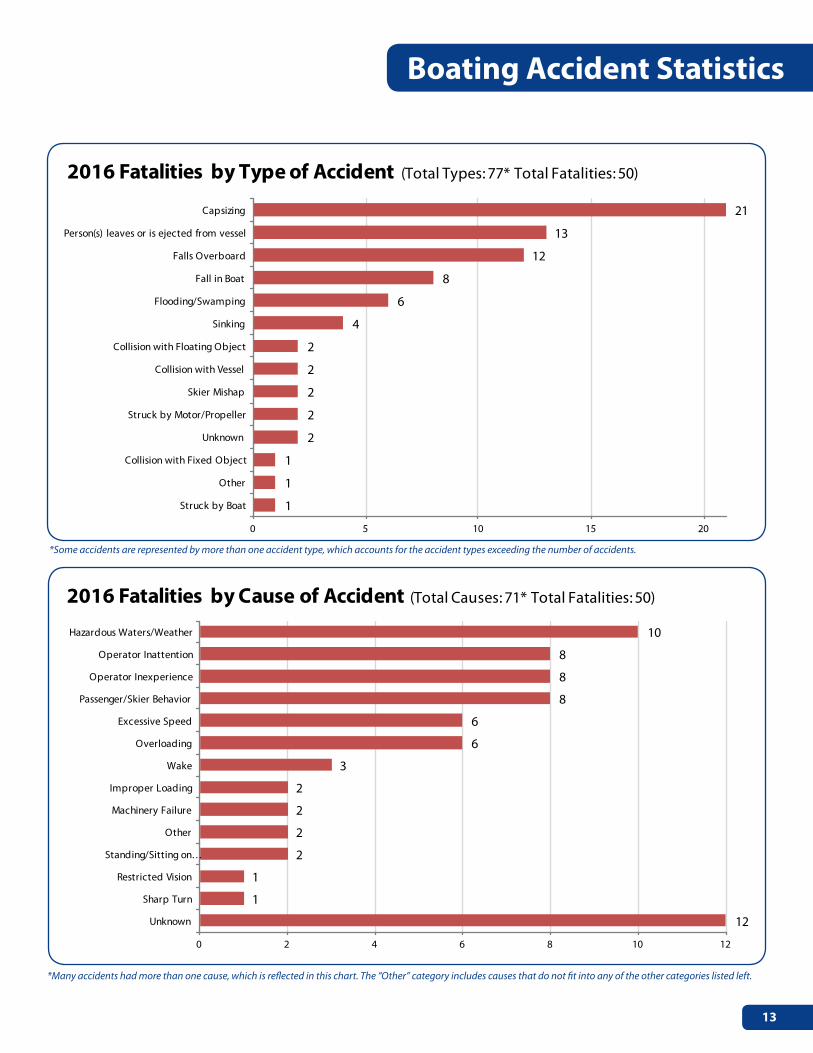
*Some accidents are represented by more than one accident type, which accounts for the accident types exceeding the number of accidents.
*Many accidents had more than one cause, which is reflected in this chart. The “Other” category includes causes that do not fit into any of the other categories listed left.
10
8
8
8
6
6
3
2
2
2
2
1
1
12
0 2 4 6 8 10 12
Hazardous Waters/Weather
Operator Inattention
Operator Inexperience
Passenger/Skier Behavior
Excessive Speed
Overloading
Wake
Improper Loading
Machinery Failure
Other
Standing/Sitting on …
Restricted Vision
Sharp Turn
Unknown
2016 Fatalities by Cause of Accident (Total Causes: 71* Total Fatalities: 50)
21
13
12
8
6
4
2
2
2
2
2
1
1
1
0 5 10 15 20
Capsizing
Person(s) leaves or is ejected from vessel
Falls Overboard
Fall in Boat
Flooding/Swamping
Sinking
Collision with Floating Object
Collision with Vessel
Skier Mishap
Struck by Motor/Propeller
Unknown
Collision with Fixed Object
Other
Struck by Boat
2016 Fatalities by Type of Accident (Total Types: 77* Total Fatalities: 50)
California
2016 California Recreational Boating Accident Statistics14 I
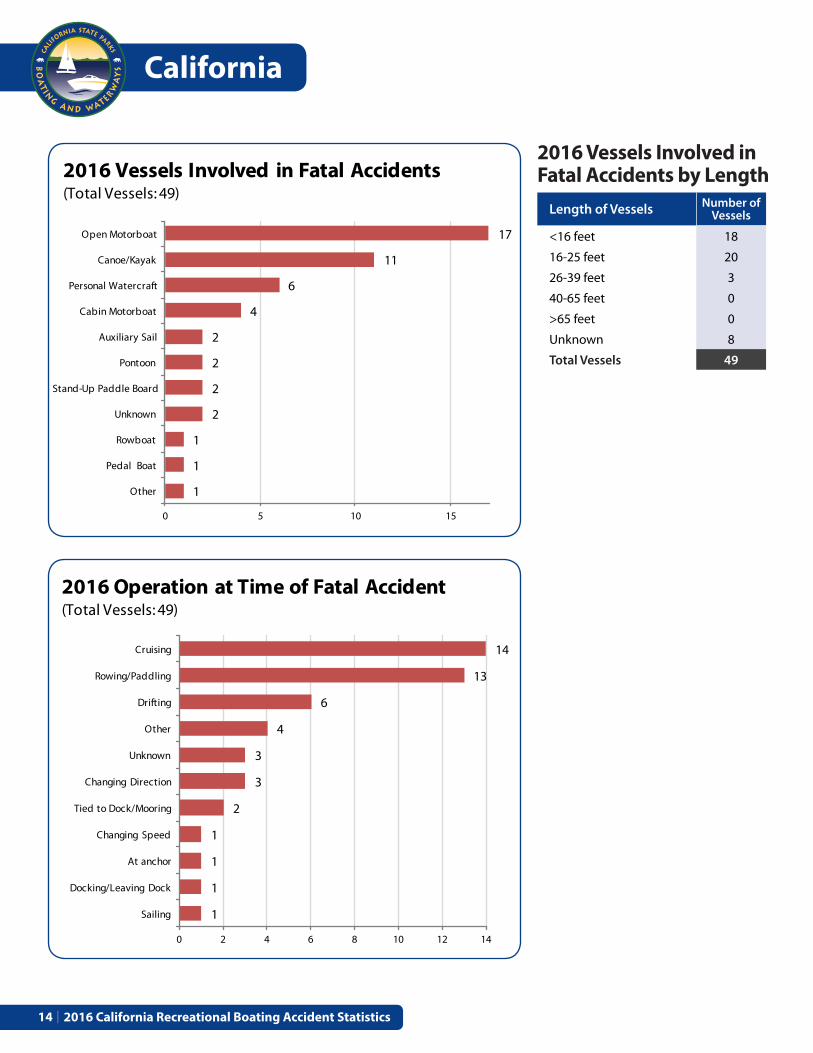
2016 Vessels Involved in Fatal Accidents by Length
Length of Vessels Number of Vessels
<16 feet 18
16-25 feet 20
26-39 feet 3
40-65 feet 0
>65 feet 0
Unknown 8
Total Vessels 49
17
11
6
4
2
2
2
2
1
1
1
0 5 10 15
Open Motorboat
Canoe/Kayak
Personal Watercraft
Cabin Motorboat
Auxiliary Sail
Pontoon
Stand-Up Paddle Board
Unknown
Rowboat
Pedal Boat
Other
2016 Vessels Involved in Fatal Accidents (Total Vessels: 49)
14
13
6
4
3
3
2
1
1
1
1
0 2 4 6 8 10 12 14
Cruising
Rowing/Paddling
Drifting
Other
Unknown
Changing Direction
Tied to Dock/Mooring
Changing Speed
At anchor
Docking/Leaving Dock
Sailing
2016 Operation at Time of Fatal Accident (Total Vessels: 49)
Boating Accident Statistics
15
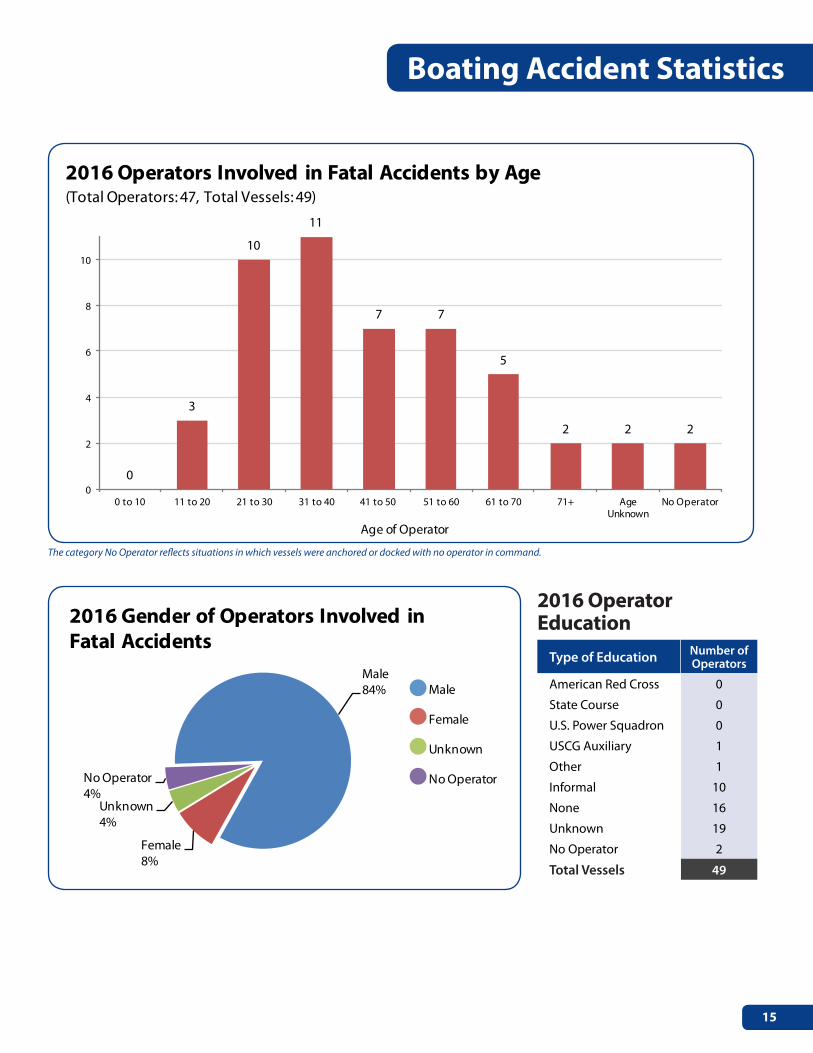
2016 Operator Education
Type of Education Number of Operators
American Red Cross 0
State Course 0
U.S. Power Squadron 0
USCG Auxiliary 1
Other 1
Informal 10
None 16
Unknown 19
No Operator 2
Total Vessels 49
The category No Operator reflects situations in which vessels were anchored or docked with no operator in command.
Male84%
Female8%
Unknown4%
No Operator4%
2016 Gender of Operators Involved in Fatal Accidents
Male
Female
Unknown
No Operator
0
3
10
11
7 7
5
2 2 2
0
2
4
6
8
10
0 to 10 11 to 20 21 to 30 31 to 40 41 to 50 51 to 60 61 to 70 71+ Age Unknown
No Operator
Age of Operator
2016 Operators Involved in Fatal Accidents by Age (Total Operators: 47, Total Vessels: 49)
California
2016 California Recreational Boating Accident Statistics16 I
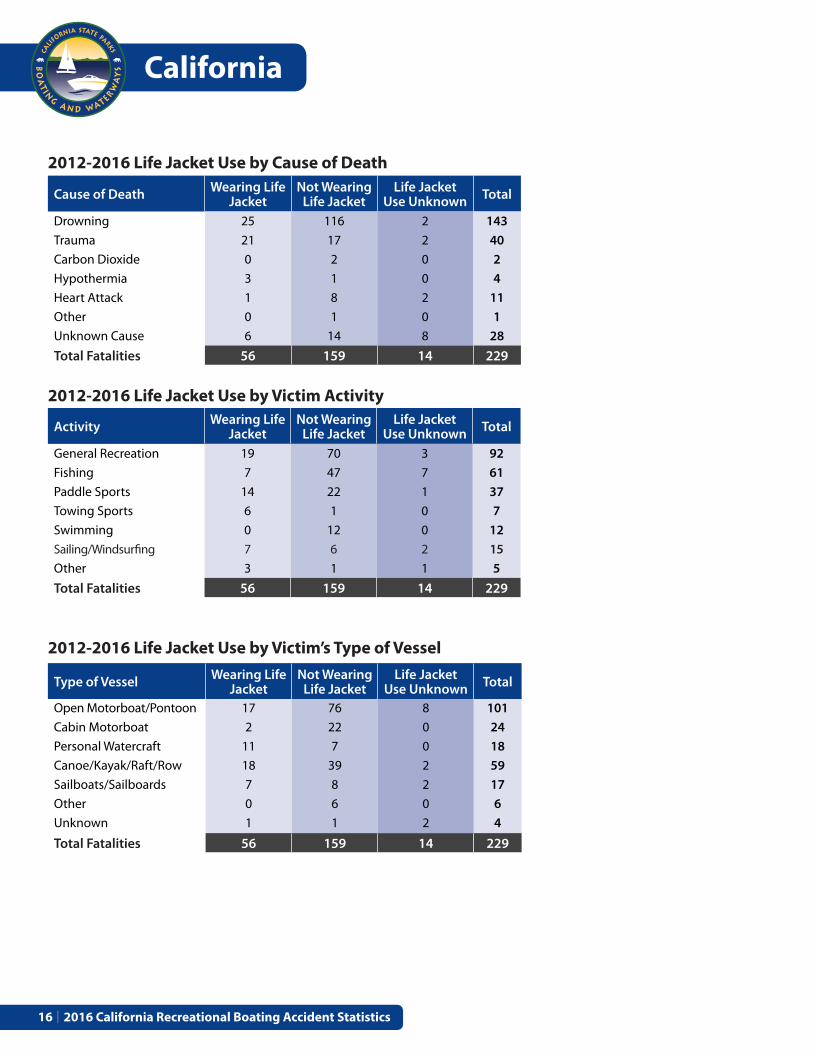
Cause of Death Wearing Life Jacket
Not Wearing Life Jacket
Life Jacket Use Unknown Total
Drowning 25 116 2 143
Trauma 21 17 2 40
Carbon Dioxide 0 2 0 2
Hypothermia 3 1 0 4
Heart Attack 1 8 2 11
Other 0 1 0 1
Unknown Cause 6 14 8 28
Total Fatalities 56 159 14 229
Activity Wearing Life Jacket
Not Wearing Life Jacket
Life Jacket Use Unknown Total
General Recreation 19 70 3 92
Fishing 7 47 7 61
Paddle Sports 14 22 1 37
Towing Sports 6 1 0 7
Swimming 0 12 0 12
Sailing/Windsurfing 7 6 2 15
Other 3 1 1 5
Total Fatalities 56 159 14 229
Type of Vessel Wearing Life Jacket
Not Wearing Life Jacket
Life Jacket Use Unknown Total
Open Motorboat/Pontoon 17 76 8 101
Cabin Motorboat 2 22 0 24
Personal Watercraft 11 7 0 18
Canoe/Kayak/Raft/Row 18 39 2 59
Sailboats/Sailboards 7 8 2 17
Other 0 6 0 6
Unknown 1 1 2 4
Total Fatalities 56 159 14 229
2012-2016 Life Jacket Use by Cause of Death
2012-2016 Life Jacket Use by Victim Activity
2012-2016 Life Jacket Use by Victim’s Type of Vessel
Boating Accident Statistics
17
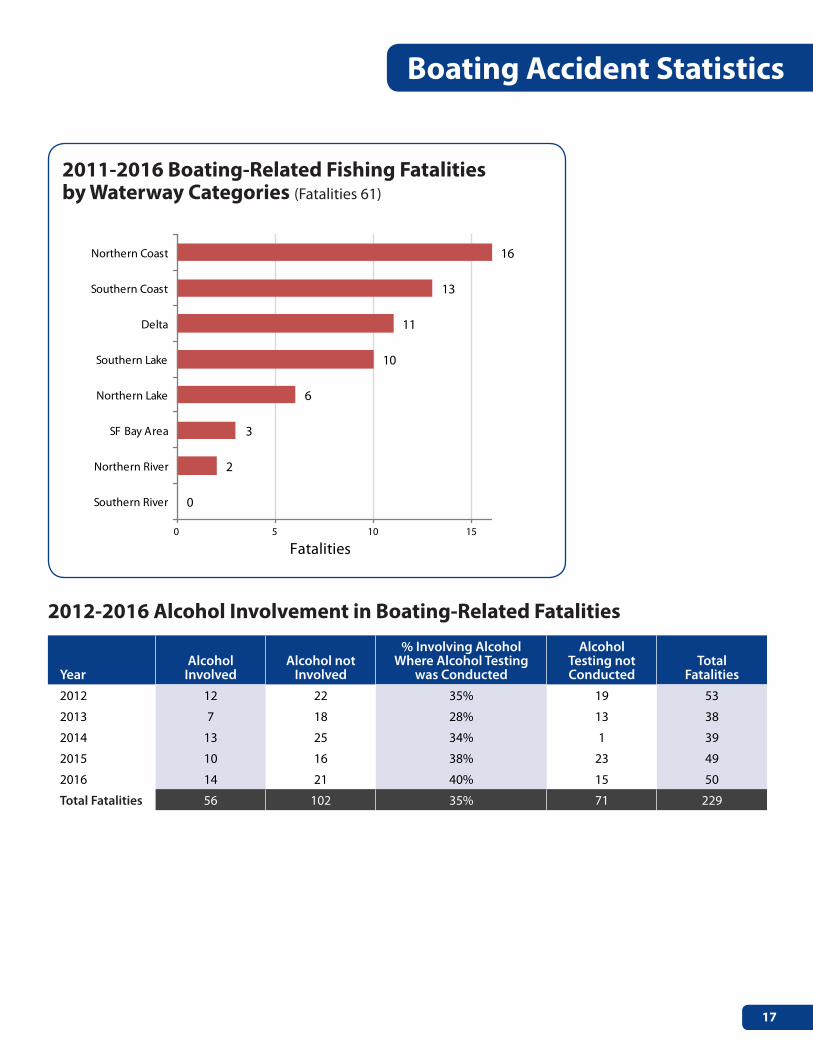
2012-2016 Alcohol Involvement in Boating-Related Fatalities
YearAlcohol
InvolvedAlcohol not
Involved
% Involving Alcohol Where Alcohol Testing
was Conducted
Alcohol Testing not Conducted
Total Fatalities
2012 12 22 35% 19 53
2013 7 18 28% 13 38
2014 13 25 34% 1 39
2015 10 16 38% 23 49
2016 14 21 40% 15 50
Total Fatalities 56 102 35% 71 229
16
13
11
10
6
3
2
0
0 5 10 15
Northern Coast
Southern Coast
Delta
Southern Lake
Northern Lake
SF Bay Area
Northern River
Southern River
Fatalities
2011-2016 Boating-Related Fishing Fatalities by Waterway Categories (Fatalities 61)
2011-2016 Boating-Related Fishing Fatalities by Waterway Categories (Fatalities 61)
California
2016 California Recreational Boating Accident Statistics18 I
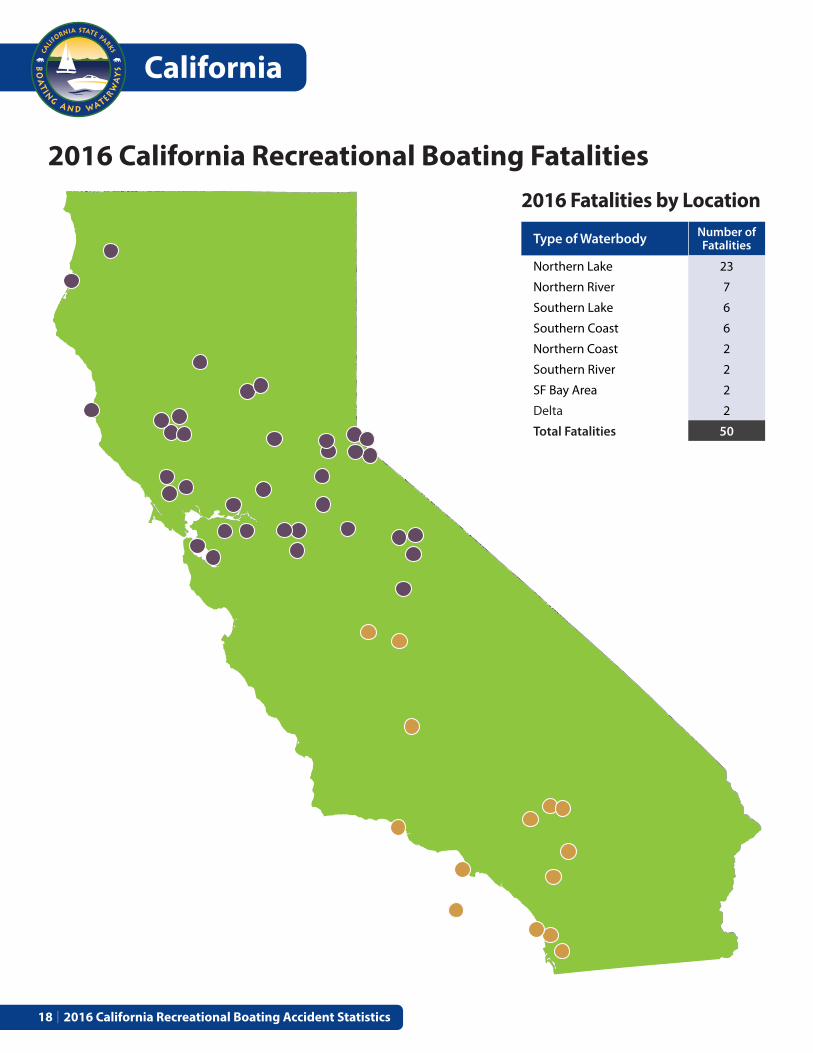
2016 Fatalities by Location
Type of Waterbody Number of Fatalities
Northern Lake 23
Northern River 7
Southern Lake 6
Southern Coast 6
Northern Coast 2
Southern River 2
SF Bay Area 2
Delta 2
Total Fatalities 50
2016 California Recreational Boating Fatalities