Embed Size (px)
Citation preview

2016 Budget
Lakewood, Washington
3701 96th
Street S.W.
P.O. Box 99070
Lakewood, WA 98496-0070
253-581-8000
Fax 253-581-8075
Mission Statement
“Pierce Transit improves people’s quality of
life by providing safe, reliable, innovative
and useful transportation services that are
locally based and regionally connected.”
Strategic Priorities
Service Excellence
Financial Stability
Community Engagement
Innovative Solutions
Economic Development
Sustainability
Engaged Workforce
2016 BUDGET
Fiscal Year January 1, 2016 through December 31, 2016
SUE DREIER
Chief Executive Officer
Prepared By
The Finance Division
WAYNE FANSHIER KELLI DION
Vice President, Finance Budget Assistant Manager
KATHY SULLIVANT CARON SANDERSON
Finance Manager Budget Coordinator
BARB HUNTER
Grants Administrator
For budget and other information about Pierce Transit visit www.piercetransit.org
i

ii

PIERCE TRANSIT2016 BUDGET
TABLE OF CONTENTS
Introduction Page Pierce Transit Board of Commissioners ................................................................................................ 2
Organizational Chart .............................................................................................................................. 3
Budget Message ..................................................................................................................................... 4
Fact Sheet ............................................................................................................................................. 21Resolution ............................................................................................................................................. 23
Budget Summary Overall Summary ................................................................................................................................ 27Operating Summary - Revenues ........................................................................................................ 28Operating Summary - Expenditures ................................................................................................... 29Capital Summary ................................................................................................................................. 30Insurance Summary ............................................................................................................................. 31Ending Balances .................................................................................................................................. 32Agency Expenditure Comparison ...................................................................................................... 33
Budget StatisticsOperating Statistics – All Modes ..................................................................................................... 37Personnel Summary ............................................................................................................................ 38Capital Program ................................................................................................................................... 40Capital Budget ..................................................................................................................................... 42Insurance Expenditure Comparison ................................................................................................... 44
Six-Year Financial PlanOperating Revenues & Expenditures ................................................................................................ 46Ending Balances .................................................................................................................................. 48Capital Plan ......................................................................................................................................... 50
Appendix Acronym List ...................................................................................................................................... 52Budget Glossary ................................................................................................................................. 54
Information is available on Pierce
Transit’s website:
www.piercetransit.org
Or contact the Pierce Transit Budget
Office:
Kelli Dion – (253) 983-3344 or
Caron Sanderson – (253) 581-8048 or
Barb Hunter – (253) 984-8200 or
iii

iv

2016 Budget
Introduction
This section includes Pierce Transit
Board of Commissioners, Pierce
Transit Organizational Chart, and the
Budget Message.
1

BOARD OF COMMISSIONERS
Pierce Transit is a separate municipal corporation, not part of the City of Tacoma or Pierce County.
Pierce Transit is governed by a nine-member Board. The Board is currently made up of elected officials representing Pierce County, Tacoma, Lakewood, Puyallup, University Place and the smaller cities and towns in Pierce County. The governance structure allows for a tenth, non-voting union representative; however, this right is currently not being exercised and the position is vacant.
2

CITIZENS OF PIERCE COUNTY
BOARD OF COMMISSIONERS
2016 ORGANIZATIONAL CHART CHIEF EXECUTIVE OFFICER CLERK OF THE BOARD/
Sue Dreier PUBLIC RECORDS OFFICER
Deanne Jacobson
Office of the CEO ADMINISTRATION FINANCE OPERATIONSDIVISION DIVISION DIVISION
Sue Dreier Vivienne Kamphaus Wayne Fanshier Doug MiddletonChief Executive Officer Acting, Chief Administration Officer Chief Finance Officer Chief Operating Officer
Division Admin Division Admin Division Admin Division Admin
Business Development Human Resources Radio Program Admin
Project Management Labor Relations Finance Department Maintenance Bus Radio Systems
Legal Training Department Admin Facilities Management
Public Relations Accounting
Safety Information Technology Department Budgeting Fleet Maintenance Department
Department Admin Revenue Accounting Department Admin
Information Technology Automotive
Procurement Department Bus Repair
Marketing Department Department Admin Maintenance Training
Marketing Purchasing
Administrative Services Warehousing Public Safety Department
Customer Services Department Admin
Field Customer Services Transit Development Department Physical Security
Department Admin Public Safety Records
Risk Management Department Capital Planning Transit Police
Risk Management Bus Stop Program Uniform Security
ADA Employer Services Admin
Employer Services Transportation Department
Vanpool Department Admin
Service Planning Transportation Operators
Service Planning Admin Operators Admin
Bus Stop Program Operators Dispatch
Planning Operators
Scheduling Paratransit
Paratransit Admin
Paratransit Customer Service
Paratransit Operations
Transportation Service Support Department
Service Support Admin
Service Support Operations
Bus Safety & Training
3

2016 BUDGET MESSAGE
December 14, 2015 TO: Pierce Transit Board of Commissioners, Citizens and Employees FROM: Sue Dreier, Chief Executive Officer
I am pleased to present the 2016 Budget for your review and consideration. Pierce Transit
is a strong and resilient Agency and has moved out of the Great Recession with
determination and optimism. We enter 2016 with the understanding of the important and
critical role that public transit plays in the health and vitality of our communities. We do
this by serving the community with respect, collaborating internally and externally and
caring for our customers, employees and business partners. We deliver reliable public
transportation services that reduce the dependency on the automobile supporting our core
mission and values.
Pierce Transit’s mission, vision, and goals align with Pierce Transit’s Board of
Commissioner’s strategic direction. The Strategic Plan ensures we have a common
framework to guide us. The strategic priorities are:
1. Service Excellence: Achieve service excellence in the way the Agency performs
its work and delivers transit service.
2. Financial Stability: Maintain long-term financial stability in order to maximize
and sustain a consistent level of service to the public.3. Community Engagement: Achieve a high level of confidence from our riders and
the communities Pierce Transit serves.4. Innovative Solutions: Develop innovative transportation services with community
involvement, tailored to meet the diverse needs of residents.
5. Economic Development: Support local and regional development by increasing
useful transit options in areas of economic activity.
6. Sustainability: Integrate operations, planning and construction business practices
and strategies to support environmentally friendly sustainable practices.
7. Engaged Workforce: Involve employees in achieving the first six strategic goals.
4

2016 BUDGET MESSAGE
The Back to Basics Initiative aligns the budget process with the strategic plan. It prioritizes
service first and is focused around three objectives:
Service Excellence: Everyone we interact with – whether it’s a customer, a
member of the community, a contractor or a regional partner – will be offered the
very best service.
Safety: Pierce Transit will be an Agency where employee and customer safety is
understood and accepted to be a top priority.
Community Engagement: Pierce Transit staff will increase awareness of the
value we add to the community by providing a high-quality transportation system
and supporting economic growth in the region.
The goal in the 2016 Budget process was to limit expenses in order to provide funds for
service restoration. We accomplished this mission and at a minimum 20,000 fixed route
service hours will be restored in September 2016. This builds upon our service restoration
of over 14,000 hours in 2015. Pierce Transit will have the capacity to restore modest
service levels over the next six years if revenue and expense forecast perform as expected.
Additionally, in support of the Strategic Plan, Pierce Transit’s budget will align with the
goals of the Agency that include:
Maximizing service efficiency and productivity
Increase ridership as measured by boardings
Improve our public image via high performance care of facilities
Prepare for regional employment and population growth by collaborating with
Sound Transit for seamless connections of ST2 and ST3 initiatives
Continue to assure high-quality fixed route, paratransit and vanpool transportation
services appropriate to the resources available
Continue the planning process for High Capacity Corridor service on Pacific/SR7
5

2016 BUDGET MESSAGE
Using Lean processes seek and implement new business models that improve
efficiency and productivity in all areas of Pierce Transit
Implement a Wellness Program
Plan for the future of the Agency with a well-defined succession plan
Continue to serve small communities with innovative thinking
Seek opportunities to increase grant funded capital projects
Overview
Pierce Transit’s annual planning process has examined the economic forecasts, its
programs, service, financial operations and financial outlook. Local economic conditions
and consumer spending play major roles in the generation of sales tax revenue which is
Pierce Transit’s primary operating revenue source. The outlook for the economic future is
improving at a moderate pace and as these conditions improve, so will our levels of
service.
There are still uncertainties that could have impact for Pierce Transit’s financial condition.
Two of the uncertainties are the continued local economic growth and the settlement of the
Amalgamated Transit Union (ATU) labor contract. Additionally, a long term
transportation package has not been agreed upon at the Federal level.
The Bus and Bus Facility formula program was reduced under the Moving Ahead for
Progress in the 21st Century (MAP21) Federal program and we continue our collective
efforts to seek increased funding in this area. Sixty-seven of Pierce Transit’s buses will be
well past useful life over the next 5 years.
6
2016 BUDGET MESSAGE
Economic Condition and Outlook
The U.S. economy is expected to grow by approximately 3.2 percent in 2015. Leading the
national economic recovery is declining unemployment, declining oil prices, support from
Federal Reserve policy, and pent-up demand as consumers regain confidence after nearly
seven years of economic doldrums. Unemployment is expected to fall below 5%
nationally, as a result of 3 million more Americans who found work in 2014, the largest
number of jobs since 2008.
Local economic conditions and retail spending play major roles in the generation of sales
tax revenue which is Pierce Transit’s primary operating revenue source. Pierce Transit
relies heavily on sales tax collected within its Public Transportation Benefit Area (PTBA)
for its operating revenue. Sales tax contributes 73% of total budget operating revenues in
2016 (excluding Sound Transit regional transit service revenue) and is expected to generate
$74.1 million in sales tax revenue in 2016.
Pierce Transit’s sales tax collections showed slight improvements during 2014, with year-
end collections up 5.1% over 2013. Sales tax growth has continued through the most
recent July 2015 sales tax collections. Changes in Gross Domestic Product (GDP),
consumer disposable income and increased employment are some of the main drivers of
the growth in sales tax. GDP is expected to grow by about 3.0% in 2015 and Washington
State employment is expected to increase by approximately 1.1%. These factors are
expected to contribute to a modest growth in Pierce Transit’s sales tax revenue.
Though the economic recovery has been slow, there are signs that the Puget Sound
economy will continue its steady improvement. The Port of Tacoma is expected to be a
major driver of the Pierce County economy with continued growth in container volumes.
The proximity to King County, with its solid growth led in part by Amazon.com and
Boeing, will remain an important source of employment for Pierce County residents.
7
2016 BUDGET MESSAGE
With slow but steady economic growth over the last several years, consumption is finally
returning to pre-recession levels. In 2016, the Puget Sound’s retail sales are expected to
grow by 3.9 percent. The Washington state unemployment rate, which ended 2014 at 6.3
percent, declined to 5.9 percent in March of 2015. Home sales are rebounding. Personal
income growth is also expected to grow modestly in 2016. Falling gas prices are also
expected to add to a more robust economy.
Budget Summary
The 2016 Budget is approximately $153 million. This is balanced by expected revenues
and reserves. The gradual recovery of sales tax collections, continuing efforts to improve
productivity as well as grants for service have resulted in service restoration plans to add
over 20,000 fixed route service hours in 2016. A comprehensive system-wide service
analysis will be completed and is expected to be implemented with the September 2016
service change. This service analysis will provide information in order to more effectively
and efficiently utilize service hours.
This budget and service plan support our community by providing transportation access to
jobs, school, medical appointments, shopping, and events. It also supports economic
development, reduction in carbon emissions and congestion, and provides a lifeline access
for those without cars in a growing population.
The Six-Year Financial Plan is sustainable. Reserves will be utilized over the next six
years to restore additional service hours in 2017 and 2018, to provide capital acquisitions
to support the service plans, and to meet the required reserve at the end of the six-year
period. Reserves are in compliance with required levels established by the Board of
Commissioners. This provides the ability to deal with adverse economic conditions,
emergencies, and exposure to casualty and legal risks. The Agency has no long-term debt.
8

2016 BUDGET MESSAGE
Efforts are continuing to focus resources on restoring service, controlling costs,
redesigning service delivery processes, and prioritizing the delivery of service to better
align services based on customer needs. The Agency is committed to providing as much
service as possible to the public. Service excellence, safety, and community engagement
remain top priorities.
We are currently in a very exciting period for Pierce Transit and the communities we serve.
We have come through the worst economic downturn since the Great Depression. The
Agency is poised to move forward, collaborating with our cities and partner agencies in
developing a vision that will result in a transportation network to meet the needs of our
region into the future.
I would like to take this opportunity to thank the Pierce Transit Finance and Budget
professionals for their thoughtful preparation of the 2016 Budget. It is a testament to the
cooperation and moving forward spirit of the Agency.
I also thank the Pierce Transit Board of Commissioners for their commitment to public
transit in our communities.
The 2016 Budget is balanced, sustainable, and focused on restoring a high-quality
transportation system.
___________________________________________
Sue Dreier, Chief Executive Officer
9
2016 BUDGET MESSAGE
In brief:
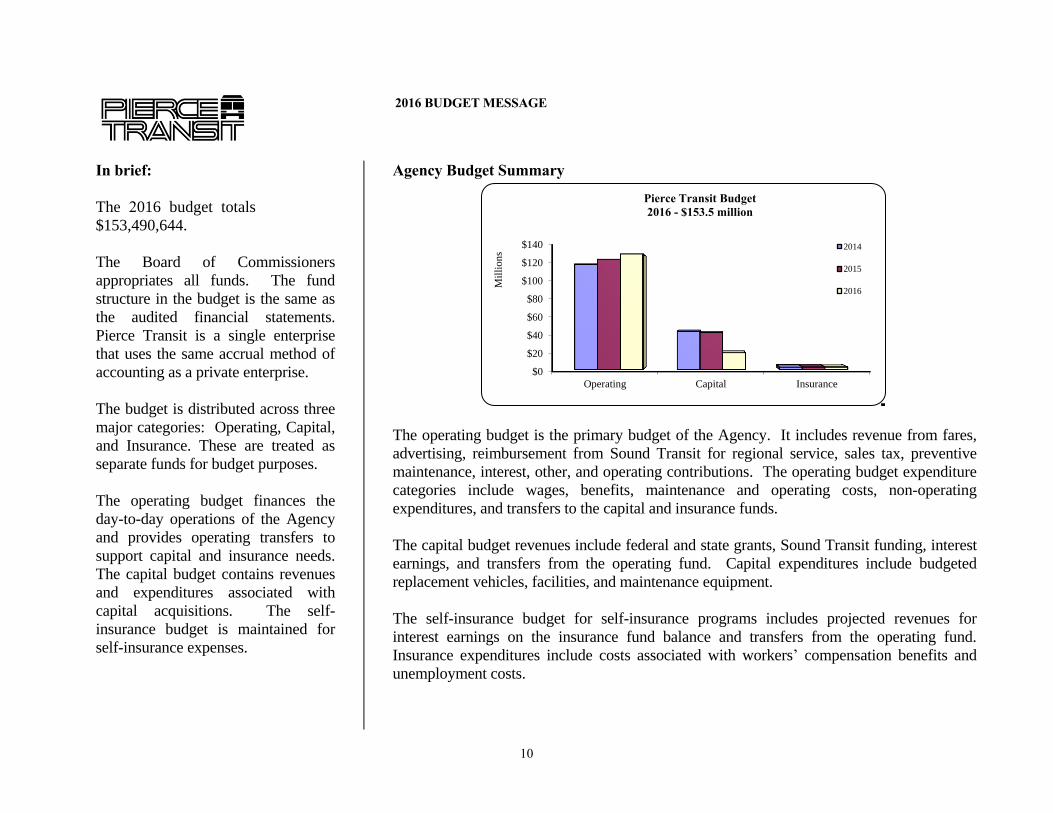
The 2016 budget totals $153,490,644.
The Board of Commissioners
appropriates all funds. The fund
structure in the budget is the same as
the audited financial statements.
Pierce Transit is a single enterprise
that uses the same accrual method of
accounting as a private enterprise.
The budget is distributed across three
major categories: Operating, Capital,
and Insurance. These are treated as
separate funds for budget purposes.
The operating budget finances the
day-to-day operations of the Agency
and provides operating transfers to
support capital and insurance needs.
The capital budget contains revenues
and expenditures associated with
capital acquisitions. The self-
insurance budget is maintained for
self-insurance expenses.
Agency Budget Summary
The operating budget is the primary budget of the Agency. It includes revenue from fares,
advertising, reimbursement from Sound Transit for regional service, sales tax, preventive
maintenance, interest, other, and operating contributions. The operating budget expenditure
categories include wages, benefits, maintenance and operating costs, non-operating
expenditures, and transfers to the capital and insurance funds.
The capital budget revenues include federal and state grants, Sound Transit funding, interest
earnings, and transfers from the operating fund. Capital expenditures include budgeted
replacement vehicles, facilities, and maintenance equipment.
The self-insurance budget for self-insurance programs includes projected revenues for
interest earnings on the insurance fund balance and transfers from the operating fund.
Insurance expenditures include costs associated with workers’ compensation benefits and
unemployment costs.
$0
$20
$40
$60
$80
$100
$120
$140
Operating Capital Insurance
Mil
lion
s
Pierce Transit Budget 2016 - $153.5 million
2014
2015
2016
10

2016 BUDGET MESSAGE
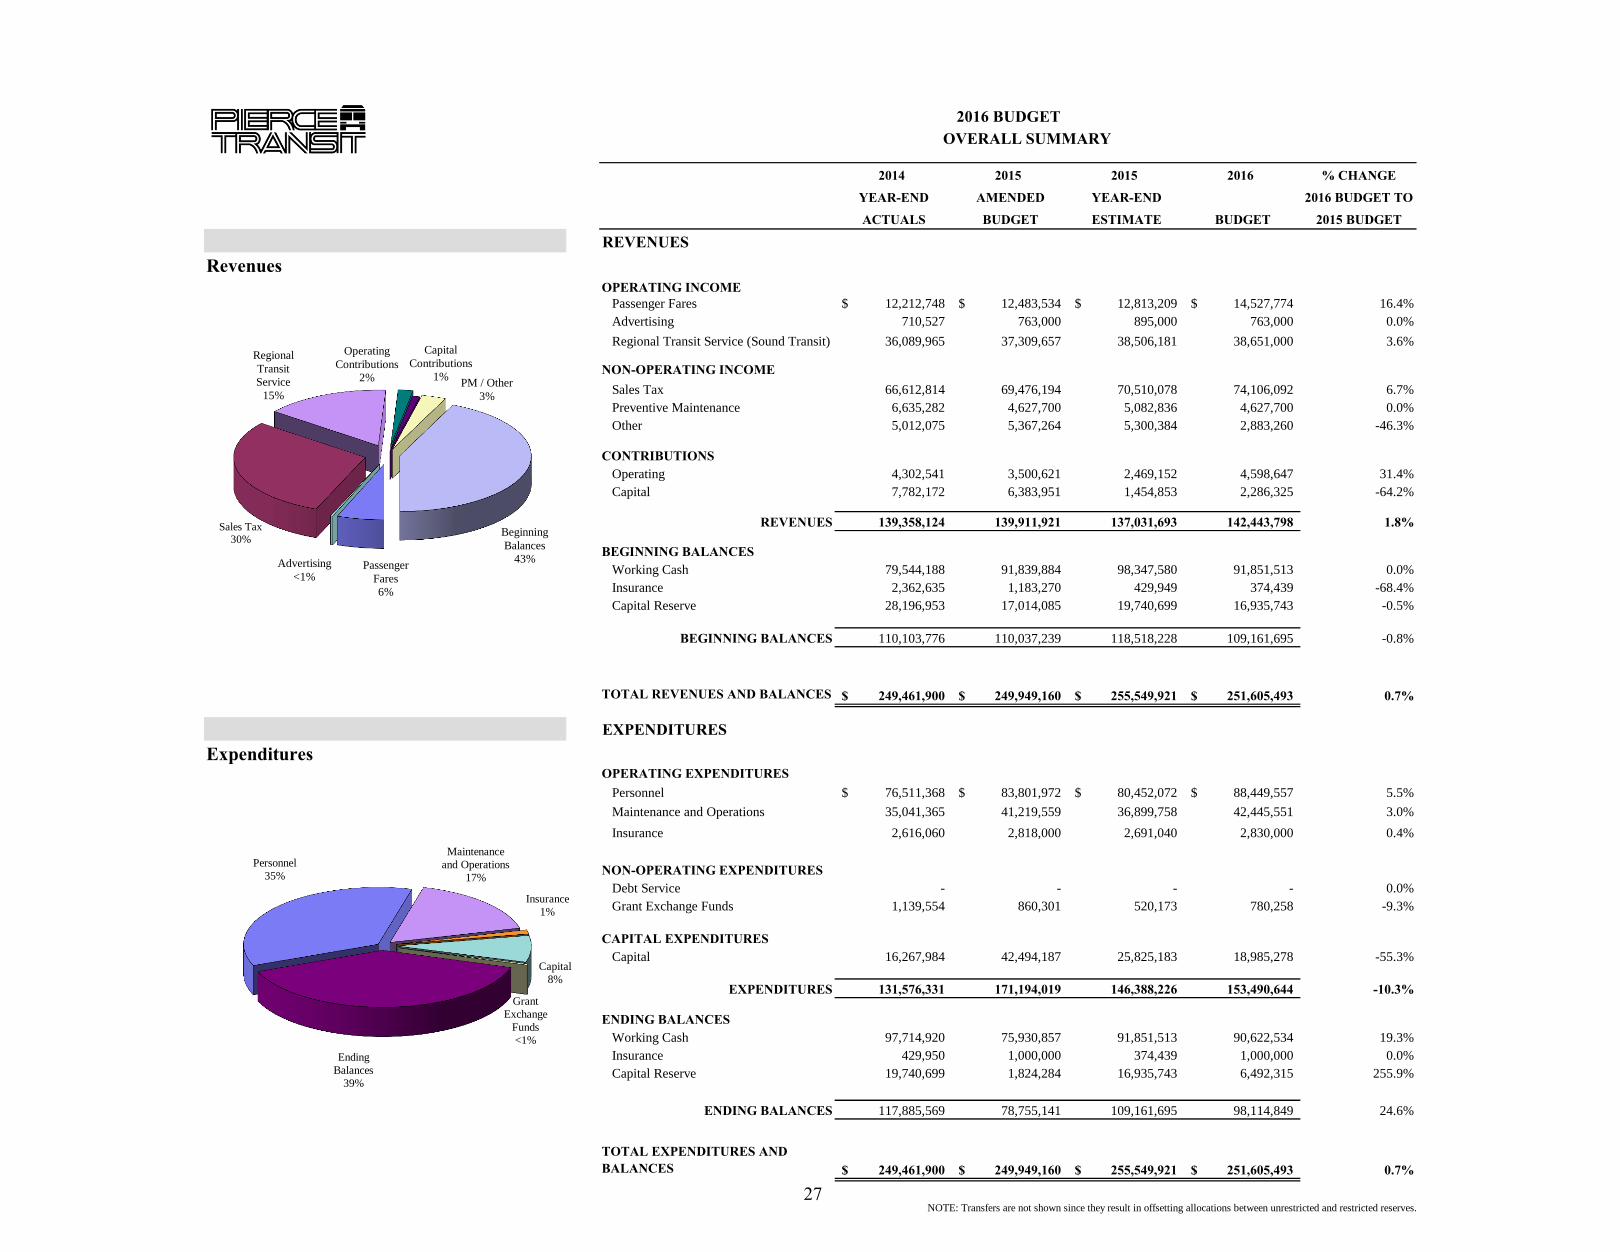
A comparison of revenues and
expenditures including beginning
balances and ending balances for the
total Agency 2015 Amended Budget,
the 2015 Year-End Estimates, and the
2016 Budget is shown.
Sales tax revenue is gradually
improving and offsetting other
decreases in revenue.
Expenditure changes are driven by
fixed route service changes and the
carryover of capital projects.
11

2016 BUDGET MESSAGE
In brief:
The budget includes operating
revenues, operating expenditures,
non-operating expenditures, and
operating transfers.
Operating Revenues – Funds such as
sales tax and fares received to pay for
ongoing operations.
Operating Expenditures – Funds paid
for providing transportation services.
Non-Operating Expenditures –
Expenditures for the Pierce County
Agreement for grant exchange funds.
Operating Transfers – Amounts
transferred from the Operating
Budget to the Capital and Insurance
Budgets to fund expenditures and
reserves.
Operating Budget
The 2016 operating revenues of $139,712,508 support the operating expenditures of
$130,895,108, non-operating expenditures of $780,258, and operating transfers of
$9,266,121. Operating transfers support the self-insurance and capital programs and
fluctuate from year to year depending on capital and self-insurance needs. The use of
reserves is $(1,228,979). Additional reserves will be utilized over the next six years to
restore additional service hours in 2017 and 2018, to provide capital acquisitions to support
service plans, and to meet the required reserves by the end of the six-year period.
The operating budget revenue for 2016 is increasing by 4.7% and operating expenditures are
increasing 4.7% from the 2015 Amended Budget.
2015 Non-Operating Expenditures are for the payment of $780,258 for the Pierce County
Agreement grant exchange funds.
2015 Amended 2016 Budget to Budget Change
Budget Budget Amount %
Operating Revenues $ 133,491,270 $ 139,712,508 $ 6,221,238 4.7%
Operating Expenditures (125,021,531) (130,895,108) 5,873,577 4.7%
8,469,739 8,817,400
Non-Operating Expenditures (860,301) (780,258)
Operating Transfers (23,518,465) (9,266,121)
Net Change - Reserves $ (15,909,027) $ (1,228,979)
12

2016 BUDGET MESSAGE
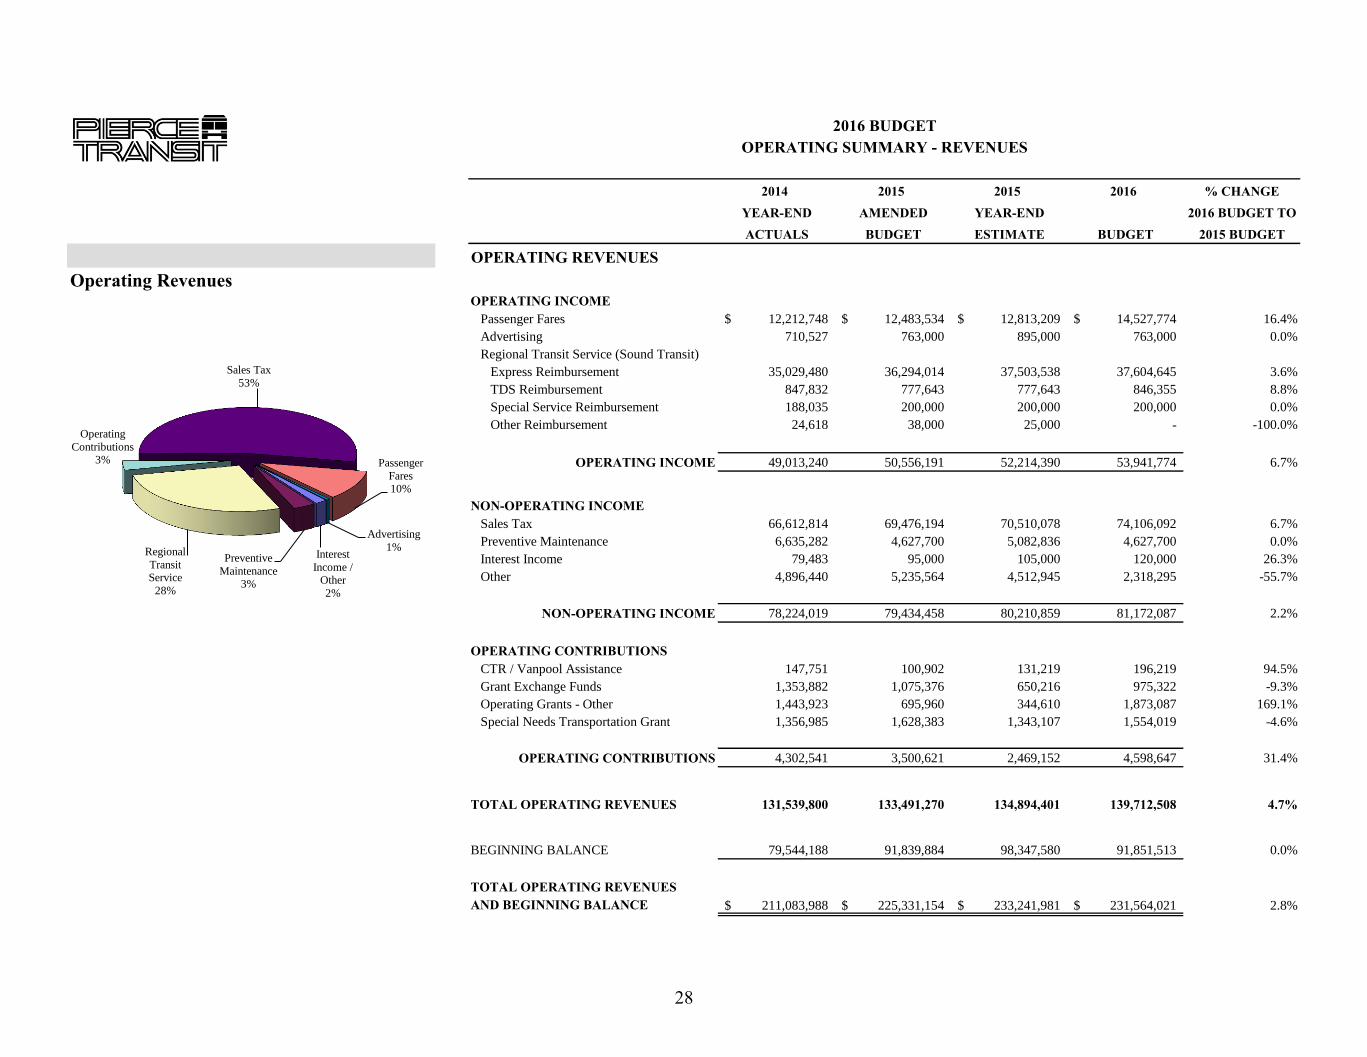
In brief:
The type of revenue and percent
change from 2015 Amended Budget
are provided in the table and briefly
explained as follows:
Fares – service changes
ridership projections
average fare per boarding
Advertising – advertising demand
Sound Transit – reimbursement rate
services provided
Sales Tax – estimated revenue
Interest – investment balance
interest rates
Other – projected property sales
Operating Contributions – grants
Operating Revenues
Fares - Revenues are estimated based on ridership and average fare per boarding
projections. The average fare per boarding is expected to increase in 2016 to $.95 from
$.85 per boarding. Average fare per boarding varies due to factors such as the percentage
of boardings by fare type and category. Pierce Transit implemented revisions to its fares in
2014 to coincide with the replacement of its fareboxes. The revisions included elimination
of paper transfers and the introduction of a new All Day Pass valid on Pierce Transit local
service.
There is no projected adult fare increase included in the 2016 Budget revenue. The last adult
fare increase was November, 2010. The increase was $.25 for the local adult fare from $1.75
to $2.00. There is a proposed fare increase scheduled in March 2016 for senior/disabled,
youth and paratransit (SHUTTLE) riders. Senior/ disabled, youth and SHUTTLE fares were
last increased in March 2006.
2015 Amended 2016 Budget to Budget Change
Budget Budget Amount %
Operating Income
Fares $ 12,483,534 $ 14,527,774 $ 2,044,240 16.4%
Advertising 763,000 763,000 - 0.0%
Sound Transit 37,309,657 38,651,000 1,341,343 3.6%
Non-Operating Income
Sales Tax 69,476,194 74,106,092 4,629,898 9.7%
Preventive Maintenance 4,627,700 4,627,700 - 0.0%
Interest 95,000 120,000 25,000 26.3%
Other 5,235,564 2,318,295 (2,917,269) -55.7%
Operating Contributions 3,500,621 4,598,647 1,098,026 31.4%
$ 133,491,270 $ 139,712,508 $ 6,221,238 4.7%
13

2016 BUDGET MESSAGE
Advertising – The advertising budget reflects demand and the number of buses in service
available for ads.
Sound Transit – Regional Transit Service budgeted revenue totals $38,651,000 in 2016 and
is expected to increase 3.6% from 2015 Budget. Pierce Transit is under contract with Sound
Transit to provide regional express transit services. Sound Transit reimburses Pierce Transit
for the cost of operating its service. For 2016, Sound Transit is increasing service hours
0.3% from 306,577 to 307,491. Sound Transit also reimburses for their share of costs
associated with the Tacoma Dome Station, security, liability insurance, and special services.
Sales Tax - The sales tax projections are based on economic conditions and analysis of
activity in the jurisdictions in the Public Transportation Benefit Area. Consumer spending
plays a major role in the generation of sales tax revenue which is Pierce Transit’s primary
operating revenue source. Sales tax represents 73% of the operating budget revenue
excluding Sound Transit. In 2016, sales tax is expected to total $74,106,092. The 2016
Budgeted sales tax revenue is a 6.7% increase over the 2015 Budget. This consists of a 5.1%
increase over 2015 year-end estimate and the 2015 year-end estimate is 1.6% over 2015
Budget. The outlook for the economic future is improving at a moderate pace and as these
conditions improve, so will our levels of service.
Preventive Maintenance - This source is a Federal Transit Administration (FTA) 5307 grant.
The 5307 grant is allocated based on certain performance measures including the number of
passenger boardings and service hours provided, based on a two year lag. Preventive
Maintenance for 2016 is $4,627,700 and is authorized under the Moving Ahead for Progress
in the 21st Century Act (MAP-21, Public Law 112-141). MAP 21 full reauthorization is
pending congressional action. No additional increase is anticipated in 2016.
Interest - Interest revenue estimates are based on investment balances and projected interest
rates. Interest rates and available funds to invest have increased slightly during 2015
resulting in increased interest revenue in 2016.
14

2016 BUDGET MESSAGE
Other - This revenue category includes $1.0 million for a one-time sale of property, revenue
from parking fees at the Tacoma Dome Station, revenue from the sale of vehicles at the end
of their useful life, and miscellaneous sources. The 55.7% reduction in 2016 is primarily due
to the one time sale of property in 2015.
Operating Contributions - Included in Operating Contributions are grants with Pierce
County and the City of Tacoma for $196,219 for Commute Trip Reduction (CTR)
administration and Pierce County Employer Services Programs. Washington State
Department of Transportation Regional Mobility Grants for peak hour service expansions
is included for $1,792,127. Also included is a Federal grant for $80,960 for a community
accessibility inventory program to help individuals with disabilities utilize bus service.
The remainder of the funds provide services required by the Americans with Disabilities
Act (ADA) through an agreement with Pierce County for the use of $975,322 in federal
formula funds and $1,554,019 for a Washington Department of Transportation grant for
special needs transportation.
15

2016 BUDGET MESSAGE
In brief:
The 2016 Budget reflects the best use
of the projected funds for the
effective, efficient, and convenient
provision of service to the
community.
The type of expenditures and 2016
dollar and percent change from 2015
Amended Budget is provided in the
table and is briefly explained as
follows:
Wages –
Projected wage adjustments
Benefits –
Medical and Dental insurance
premium increases
Employer contribution rate
change for Washington State
Public Employees Retirement
System (PERS)
Maintenance & Operating (M&O) –
Services increase
Operating Expenditures
The focus for the 2016 Budget process was to limit expenses in order to provide funds for
service restoration based on our Back to Basics Initiative that prioritizes service first and is
built around the strategic priorities. That goal was accomplished and 20,000 fixed route
service hours will be restored in September 2016. Operating expenses are projected to total
$130,895,108 for a 4.7% increase from the 2015 Amended Budget. The changes from the
2015 Amended Budget to the 2016 Budget are as follows:
Wages - The 2016 Budget includes 916 positions and 897.5 full-time equivalents (FTEs).
The 2.9% increase in wages includes an addition of twenty-two new positions directly
related to restoring service hours and one reclassification of a contract services position for
ORCA support personnel. The increase in wages also includes projected increases in wages
and salaries.
Represented employees are 84% of the total Agency workforce. The Master Agreement
with the transit union for the three-year period, July 1, 2011 through June 30, 2014, has
ended and a new contract is being negotiated. The Master Agreement with the transit
security officer union is for a four-year period, May 1, 2014 through April 30, 2018.
2015 Amended 2016 Budget to Budget Change
Budget Budget Amount %
Wages $ 59,318,841 $ 61,064,863 $ 1,746,022 2.9%
Benefits 24,483,131 27,384,694 2,901,563 11.9%
M & O 41,219,559 42,445,551 1,225,992 3.0%
Total Operations 125,021,531 130,895,108 5,873,577 4.7%
Non-Operating Expenditures 860,301 780,258 (80,043) -9.3%
Total $ 125,881,832 $ 131,675,366 $ 5,793,534 4.6%
16

2016 BUDGET MESSAGE
The fuel prices for the 2016 Budget
are shown below.
Unleaded and diesel prices are per
gallon and CNG prices are per gas
gallon equivalent.
Benefits - The increase in benefits of 11.9% or $2,901,563 is a result of staff increases,
medical and dental premium increases, and an increase in the Washington State Public
Employees Retirement System (PERS) employer contribution rates. PERS is projected to
increase from 2015 Budget of 10.11% of eligible wages to 11.18% of eligible wages
effective July 1, 2015.
Maintenance and Operations - The 2016 Maintenance and Operations (M&O) Budget is
$42,445,551. This is an increase of $1,225,992 or 3.0% higher than the 2015 Amended
Budget. The increase is to support the restoration of service and radio maintenance system
and facility needs.
Fuel - Fuel costs of $6,424,344 represent approximately 15.1% of the maintenance
and operating budget. Compressed Natural Gas (CNG) comprises 18.1% of the fuel
costs and is driven by CNG contracted prices. The Pierce Transit fleet is nearly
100% CNG powered and Sound Transit fleet is primarily diesel powered. The diesel
and unleaded costs are estimated based on the best information available. A majority
of diesel costs are reimbursed by Sound Transit.
Non-Operating Expenditures - 2016 Non-Operating Expenditures are for the payment of
$780,258 for the Pierce County Agreement grant exchange funds.
2016
Budget
Unleaded $ 2.500
Diesel $ 2.500
CNG $ 0.714
17

2016 BUDGET MESSAGE
In brief:
Itemization of Budgetary Changes
The 2016 total operating budget is
4.7% above the 2015 Amended
Budget. An itemization of this
increase is shown in the following
chart.
Budget category comparison
As shown in the graph below, the operating budget categories for 2015 Budget and 2016
Budget represent similar percentages of the total operating budget. Personnel costs are
approximately 68%, supplies 10%, services 8%, and other 14%.
Category % Change
Wages 1.4%
Benefits 2.3%
Services 1.9%
Supplies -0.2%
Fuel -1.1%
Repairs & Maintenance 0.0%
Rentals 0.0%
Utilities 0.3%
Purchased Transportation 0.0%
Insurance -0.2%
Other 0.3%
Total 4.7%
Itemization of Budgetary Changes
18

2016 BUDGET MESSAGE
In brief:
The 2016 Capital Budget is
comprised of the following
categories.
Revenue Vehicles – 46%
Provide customers a comfortable
and reliable mode of transportation
Passenger Facilities &
Amenities – 17%
Serve as the front door to the transit
system
Base Facilities – 20%
Support the efficiency of the Agency
Technology – 13%
Improve information and services
to the public
Other – 4%
Maintain equipment
A detailed project list reflecting the
responsible division, carryover, and
grant support is located in the Budget
Statistics section of this document.
Capital
The Capital Budget presents the revenues and expenditures associated with capital
development and acquisition. It includes funds for budgeted replacement vehicles, capital
planning for the efficient use of base facilities, maintenance equipment, and off-site
improvements. These items are distinguished from operating items due to their value
(greater than $5,000) and projected useful life (longer than one year). Capital expenses
and grant reimbursements are budgeted by project. Projects are budgeted in their entirety
when approved regardless of anticipated expenditure dates.
Capital projects for 2016 are budgeted at $18,985,278. Approved but unspent projects are
carried over to the following budget year. The 2016 Budget contains $12,693,470 of prior
year budgeted funds (carryover) and $6,291,808 in new projects in 2016. Expenditures are
supported by $2,701,290 in grant revenue primarily from the Federal Transit Administration,
Sound Transit, and a FEMA Transit Security Grant Program. Operating costs or anticipated
savings associated with significant non-routine capital expenditures such as personnel,
maintenance, and utility costs have been included in the operating budgets of the responsible
department.Carryover New Total
6,805,165$ 1,946,406$ 8,751,571$
(Bus - 9 @ 25' replacement, Bus - 6@40' expansion;
Vanpool - 60 replacement)
3,318,090 - 3,318,090
(Tacoma Dome Station, Air Spares, 512 P&R, 72nd St P&R )
914,539 2,843,000 3,757,539
(Buildings 1 and 4, West Base, Base Rewire & Electrical Needs)
1,344,458 1,028,107 2,372,565
(ORCA II, Financial Management System, Portfolio Management System,
RSM Ride Check System, CCTV, Server and Infrastructure Replacement)
311,218 474,295 785,513
(Support Vehicles, Maintenance, Admin. and Shop Equipment)
12,693,470$ 6,291,808$ 18,985,278$
Revenue Vehicles
Passenger Facilities and Amenities
Base Facilities
Technology
Other
19

2016 BUDGET MESSAGE
Self- Insurance
The 2016 Budget of $2,830,000 reflects an increase of $12,000 from the 2015 Amended
Budget of $2,818,000. This is a result of projected Workers’ Compensation claims and
associated costs. Unemployment costs have no projected changes from the prior year.
Ending Balances
Ending balances include the required reserves for the operating, capital, and insurance
funds. The Board of Commissioners designated balances policy follows:
Operating reserve - a minimum of two months of agency operating expenditures.
Capital reserve - a minimum amount equal to ten percent of the six-year average
annual capital expenditures and fifty percent of the average annual grant funding
programmed in the Six-Year Financial Plan.
Self-Insurance reserve - a level adequate to protect the agency from self-insurance
claims (currently $1 million).
Conclusion
The 2016 Budget is balanced, sustainable, and focused on restoring a high-quality
transportation system.
20

Fact Sheet:
A Fact Sheet is prepared to accompany resolutions presented to the Board of Commissioners. It provides information about the item in the resolution including preceding actions affecting the current request. It also includes budget information, background, alternatives, and the recommendation.
2016 BUDGET FACT SHEET
21

2016 BUDGET FACT SHEET
22

Resolution:
The resolution is the legal documentation of the formal action taken by the Board of Commissioners. It provides authority for the Agency to implement the action.
2016 BUDGET RESOLUTION
23

2016 BUDGET RESOLUTION
24

2016 Budget
Summary
A summary of Pierce Transit’s budget
is displayed in the following section.
This summary is designed to present
a brief overview of the Agency’s
financial outlook for the coming year.
This information includes an overall
summary, operating revenue
summary, operating expenditure
summary, capital summary, insurance
summary, ending balances summary
and an agency expenditure
comparison.
25

26
2016 BUDGETOVERALL SUMMARY
2014 2015 2015 2016 % CHANGE
YEAR-END AMENDED YEAR-END 2016 BUDGET TO
ACTUALS BUDGET ESTIMATE BUDGET 2015 BUDGET
REVENUESRevenues
OPERATING INCOMEPassenger Fares 12,212,748$ 12,483,534$ 12,813,209$ 14,527,774$ 16.4%
Advertising 710,527 763,000 895,000 763,000 0.0%
Regional Transit Service (Sound Transit) 36,089,965 37,309,657 38,506,181 38,651,000 3.6%
NON-OPERATING INCOMESales Tax 66,612,814 69,476,194 70,510,078 74,106,092 6.7%
Preventive Maintenance 6,635,282 4,627,700 5,082,836 4,627,700 0.0%
Other 5,012,075 5,367,264 5,300,384 2,883,260 -46.3%
CONTRIBUTIONSOperating 4,302,541 3,500,621 2,469,152 4,598,647 31.4%
Capital 7,782,172 6,383,951 1,454,853 2,286,325 -64.2%
REVENUES 139,358,124 139,911,921 137,031,693 142,443,798 1.8%
BEGINNING BALANCESWorking Cash 79,544,188 91,839,884 98,347,580 91,851,513 0.0%
Insurance 2,362,635 1,183,270 429,949 374,439 -68.4%
Capital Reserve 28,196,953 17,014,085 19,740,699 16,935,743 -0.5%
BEGINNING BALANCES 110,103,776 110,037,239 118,518,228 109,161,695 -0.8%
TOTAL REVENUES AND BALANCES 249,461,900$ 249,949,160$ 255,549,921$ 251,605,493$ 0.7%
EXPENDITURESExpenditures
OPERATING EXPENDITURESPersonnel 76,511,368$ 83,801,972$ 80,452,072$ 88,449,557$ 5.5%
Maintenance and Operations 35,041,365 41,219,559 36,899,758 42,445,551 3.0%
Insurance 2,616,060 2,818,000 2,691,040 2,830,000 0.4%
NON-OPERATING EXPENDITURESDebt Service - - - - 0.0%
Grant Exchange Funds 1,139,554 860,301 520,173 780,258 -9.3%
CAPITAL EXPENDITURESCapital 16,267,984 42,494,187 25,825,183 18,985,278 -55.3%
EXPENDITURES 131,576,331 171,194,019 146,388,226 153,490,644 -10.3%
ENDING BALANCESWorking Cash 97,714,920 75,930,857 91,851,513 90,622,534 19.3%
Insurance 429,950 1,000,000 374,439 1,000,000 0.0%
Capital Reserve 19,740,699 1,824,284 16,935,743 6,492,315 255.9%
ENDING BALANCES 117,885,569 78,755,141 109,161,695 98,114,849 24.6%
TOTAL EXPENDITURES AND BALANCES 249,461,900$ 249,949,160$ 255,549,921$ 251,605,493$ 0.7%
NOTE: Transfers are not shown since they result in offsetting allocations between unrestricted and restricted reserves.
Personnel
35%
Maintenance
and Operations
17%
Insurance
1%
Capital
8%
Grant
Exchange
Funds
<1%
Ending
Balances
39%
Passenger
Fares
6%
Advertising
<1%
Sales Tax 30%
Regional
Transit
Service
15%
Operating
Contributions
2%
Capital
Contributions
1% PM / Other
3%
Beginning
Balances
43%
27
2016 BUDGETOPERATING SUMMARY - REVENUES
2014 2015 2015 2016 % CHANGEYEAR-END AMENDED YEAR-END 2016 BUDGET TOACTUALS BUDGET ESTIMATE BUDGET 2015 BUDGET
OPERATING REVENUESOperating Revenues
OPERATING INCOMEPassenger Fares 12,212,748$ 12,483,534$ 12,813,209$ 14,527,774$ 16.4%
Advertising 710,527 763,000 895,000 763,000 0.0%
Regional Transit Service (Sound Transit)
Express Reimbursement 35,029,480 36,294,014 37,503,538 37,604,645 3.6%
TDS Reimbursement 847,832 777,643 777,643 846,355 8.8%
Special Service Reimbursement 188,035 200,000 200,000 200,000 0.0%
Other Reimbursement 24,618 38,000 25,000 - -100.0%
OPERATING INCOME 49,013,240 50,556,191 52,214,390 53,941,774 6.7%
NON-OPERATING INCOMESales Tax 66,612,814 69,476,194 70,510,078 74,106,092 6.7%
Preventive Maintenance 6,635,282 4,627,700 5,082,836 4,627,700 0.0%
Interest Income 79,483 95,000 105,000 120,000 26.3%
Other 4,896,440 5,235,564 4,512,945 2,318,295 -55.7%
NON-OPERATING INCOME 78,224,019 79,434,458 80,210,859 81,172,087 2.2%
OPERATING CONTRIBUTIONSCTR / Vanpool Assistance 147,751 100,902 131,219 196,219 94.5%
Grant Exchange Funds 1,353,882 1,075,376 650,216 975,322 -9.3%
Operating Grants - Other 1,443,923 695,960 344,610 1,873,087 169.1%
Special Needs Transportation Grant 1,356,985 1,628,383 1,343,107 1,554,019 -4.6%
OPERATING CONTRIBUTIONS 4,302,541 3,500,621 2,469,152 4,598,647 31.4%
TOTAL OPERATING REVENUES 131,539,800 133,491,270 134,894,401 139,712,508 4.7%
BEGINNING BALANCE 79,544,188 91,839,884 98,347,580 91,851,513 0.0%
TOTAL OPERATING REVENUESAND BEGINNING BALANCE 211,083,988$ 225,331,154$ 233,241,981$ 231,564,021$ 2.8%
Interest
Income / Other
2%
Preventive
Maintenance 3%
Regional
Transit Service
28%
Operating
Contributions 3%
Sales Tax
53%
Passenger
Fares 10%
Advertising
1%
28

2016 BUDGETOPERATING SUMMARY - EXPENDITURES
2014 2015 2015 2016 % CHANGEYEAR-END AMENDED YEAR-END 2016 BUDGET TOACTUALS BUDGET ESTIMATE BUDGET 2015 BUDGET
OPERATING EXPENDITURESOperating Expenditures & Transfers
OPERATING
PERSONNELWages 54,326,151$ 59,318,841$ 57,296,985$ 61,064,863$ 2.9%Benefits 22,185,217 24,483,131 23,155,087 27,384,694 11.9%
PERSONNEL 76,511,368 83,801,972 80,452,072 88,449,557 5.5%
MAINTENANCE & OPERATIONSSupplies 13,235,781 14,814,473 13,213,092 13,178,261 -11.0%Services 4,820,233 8,060,663 6,554,355 10,405,482 29.1%Insurance (Purchased) 2,384,464 2,391,618 2,258,972 2,116,997 -11.5%Utilities 1,330,277 1,528,500 1,707,200 1,878,500 22.9%Repairs 430,965 622,952 656,204 677,808 8.8%Rentals 310,079 472,570 473,203 457,509 -3.2%Purchased Transportation 7,848,907 8,180,053 7,493,395 8,202,451 0.3%Other 4,680,659 5,148,730 4,543,337 5,528,543 7.4%
MAINTENANCE & OPERATIONS 35,041,365 41,219,559 36,899,758 42,445,551 3.0%
OPERATING EXPENDITURES 111,552,733 125,021,531 117,351,830 130,895,108 4.7%
NON-OPERATING EXPENDITURESGrant Exchange Funds 1,139,554 860,301 520,173 780,258 -9.3%
NON-OPERATING EXPENDITURES 1,139,554 860,301 520,173 780,258 -9.3%
TOTAL EXPENDITURES 112,692,287 125,881,832 117,872,003 131,675,366 4.6%
TRANSFERSLiability and Other Insurance Transfer (1,144,072) 455,477 83,940 103,697 -77.2%Workers' Comp. Transfer 1,820,853 2,174,553 2,546,090 3,346,864 53.9%Capital Reserve - 20,888,435 20,888,435 5,815,560 -72.2%
TRANSFERS 676,781 23,518,465 23,518,465 9,266,121 -60.6%
ENDING BALANCE 97,714,920 75,930,857 91,851,513 90,622,534 19.3%
TOTAL OPERATING EXPENDITURESAND ENDING BALANCE 211,083,988$ 225,331,154$ 233,241,981$ 231,564,021$ 2.8%
140,941,487 -5.7%TOTAL EXPENDITURES AND TRANSFERS 113,369,068 149,400,297 141,390,468
Wages43% Benefits
19%
Maintenance & Operations
30%Non-Operating
1%
Transfers7%
29

2016 BUDGETCAPITAL SUMMARY
2014 2015 2015 2016 % CHANGE
YEAR-END AMENDED YEAR-END 2016 BUDGET TO
ACTUALS BUDGET ESTIMATE BUDGET 2015 BUDGET
CAPITAL REVENUES
Capital Revenues & Transfers REVENUESGrants 7,782,172$ 6,383,951$ 1,454,853$ 2,286,325$ -64.2%
Other Capital Revenue / Interest 29,558 32,000 676,939 439,965 1274.9%
REVENUE 7,811,730 6,415,951 2,131,792 2,726,290 -57.5%
TRANSFERSCapital Reserve - 20,888,435 20,888,435 5,815,560 -72.2%
TRANSFERS - 20,888,435 20,888,435 5,815,560
CAPITAL REVENUES 7,811,730 27,304,386 23,020,227 8,541,850 -68.7%
BEGINNING BALANCECapital Reserve 28,196,953 17,014,085 19,740,699 16,935,743 -0.5%
TOTAL CAPITAL REVENUESAND BEGINNING BALANCE
CAPITAL EXPENDITURES
Capital Expenditures CAPITAL ACQUISITIONRevenue Vehicles 7,675,219$ 18,856,392$ 9,801,351$ 8,751,571$ -53.6%
Passenger Facilities & Amenities 1,061,742 1,849,971 1,537,173 3,318,090 79.4%
Base Facilities 1,757,098 5,445,150 493,775 3,757,539 -31.0%
Technology 4,497,316 14,659,040 12,620,470 2,372,565 -83.8%
Other 1,276,609 1,683,634 1,372,414 785,513 -53.3%
CAPITAL EXPENDITURES 16,267,984 42,494,187 25,825,183 18,985,278 -55.3%
ENDING BALANCECapital Reserve 19,740,699 1,824,284 16,935,743 6,492,315 255.9%
TOTAL CAPITAL EXPENDITURESAND ENDING BALANCE
-42.5%
36,008,683$ 44,318,471$ 42,760,926$ 25,477,593$ -42.5%
36,008,683$ 44,318,471$ 42,760,926$ 25,477,593$
Grants
27%
Other /
Interest
5%
Transfers
68%
Revenue
Vehicles
46%
Passenger
Facilities &
Amenities
17%
Base Facilities
20%
Technology
13%
Other
4%
30

PIERCE TRANSIT2016 BUDGET
INSURANCE SUMMARY
2014 2015 2015 2016 % CHANGEYEAR-END AMENDED YEAR-END 2016 BUDGET TOACTUALS BUDGET ESTIMATE BUDGET 2015 BUDGET
INSURANCE REVENUESInsurance Revenues & Transfers REVENUES
Liability Insurance Interest -$ 1,787$ -$ -$ -100.0%
Workers' Comp. Interest 6,457 2,476 5,387 4,941 99.6%
Unemployment Insurance Interest 137 437 113 59 -86.5%
REVENUES 6,594 4,700 5,500 5,000 6.4%
TRANSFERSLiability Insurance Transfer - 371,537 - - -100.0%
Workers' Comp. Transfer 1,820,853 2,174,553 2,546,090 3,346,864 53.9%
Unemployment Insurance Transfer (1,144,072) 83,940 83,940 103,697 23.5%
TRANSFERS 676,781 2,630,030 2,630,030 3,450,561 31.2%
REVENUES AND TRANSFERS 683,375 2,634,730 2,635,530 3,455,561 31.2%
BEGINNING BALANCESLiability Insurance 463,753 654,676 - - -100.0%
Workers' Comp. Insurance 489,620 362,971 242,758 228,195 -37.1%
Unemployment Insurance 1,409,262 165,623 187,191 146,244 -11.7%
BEGINNING BALANCES 2,362,635 1,183,270 429,949 374,439 -68.4%
TOTAL INSURANCE REVENUESAND BEGINNING BALANCES 3,046,010$ 3,818,000$ 3,065,479$ 3,830,000$ 0.3%
INSURANCE EXPENDITURESInsurance Expenditures Liability Insurance -$ 528,000$ -$ -$ -100.0%
Workers' Comp. Insurance 2,537,925 2,165,000 2,566,040 2,705,000 24.9%
Unemployment Insurance 78,135 125,000 125,000 125,000 0.0%
INSURANCE EXPENDITURES 2,616,060 2,818,000 2,691,040 2,830,000 0.4%
ENDING BALANCESLiability Insurance 463,753 500,000 - - -100.0%
Workers' Comp. Insurance (220,995) 375,000 228,195 875,000 133.3%
Unemployment Insurance 187,192 125,000 146,244 125,000 0.0%
ENDING BALANCES 429,950 1,000,000 374,439 1,000,000 0.0%
TOTAL INSURANCE EXPENDITURESAND ENDING BALANCES 3,046,010$ 3,818,000$ 3,065,479$ 3,830,000$ 0.3%
2016 BUDGETINSURANCE SUMMARY
Interest
<1%
Transfers
100%
Workers'
Comp. 96%
Unemployment
4%
31

2014 2015 2015 2016 % CHANGEYEAR-END AMENDED YEAR-END 2016 BUDGET TO
ACTUALS BUDGET ESTIMATE BUDGET 2015 BUDGET
Ending Balances OPERATINGRevenues 131,539,800$ 133,491,270$ 134,894,401$ 139,712,508$ 4.7%
Less: Expenditures (112,692,287) (125,881,832) (117,872,003) (131,675,366) 4.6%
Subtotal 18,847,513 7,609,438 17,022,398 8,037,142 5.6%
Plus: Beginning Balance 79,544,188 91,839,884 98,347,580 91,851,513 0.0%
Less: Transfers
Capital Reserve - (20,888,435) (20,888,435) (5,815,560) -72.2%
Insurance (676,781) (2,630,030) (2,630,030) (3,450,561) 31.2%
ENDING OPERATING BALANCE 97,714,920$ 75,930,857$ 91,851,513$ 90,622,534$ 19.3%
CAPITALRevenues 7,811,730$ 6,415,951$ 2,131,792$ 2,726,290$ -57.5%
Plus: Transfers
Capital Reserve - 20,888,435 20,888,435 5,815,560 -72.2%
Subtotal Revenue 7,811,730 27,304,386 23,020,227 8,541,850 -68.7%
Less: Expenditures (16,267,984) (42,494,187) (25,825,183) (18,985,278) -55.3%
Subtotal (8,456,254) (15,189,801) (2,804,956) (10,443,428) -31.2%
Plus: Beginning Balance 28,196,953 17,014,085 19,740,699 16,935,743 -0.5%
ENDING CAPITAL BALANCE 19,740,699$ 1,824,284$ 16,935,743$ 6,492,315$ 255.9%
INSURANCERevenues 6,594$ 4,700$ 5,500$ 5,000$ 6.4%
Plus: Transfers 676,781 2,630,030 2,630,030 3,450,561 31.2%
Subtotal Revenue 683,375 2,634,730 2,635,530 3,455,561 31.2%
Less: Expenditures (2,616,060) (2,818,000) (2,691,040) (2,830,000) 0.4%
Subtotal (1,932,685) (183,270) (55,510) 625,561 -441.3%
Plus: Beginning Balance 2,362,635 1,183,270 429,949 374,439 -68.4%
ENDING INSURANCE BALANCE 429,950$ 1,000,000$ 374,439$ 1,000,000$ 0.0%
GRAND TOTAL - ALL BALANCES 117,885,569$ 78,755,141$ 109,161,695$ 98,114,849$ 24.6%
ENDING BALANCES2016 BUDGET
Operating 92%
Capital 7%Insurance
1%
32

2016 OPERATING BUDGETAGENCY EXPENDITURE COMPARISON
2014 2015 2015 2016 % ChangeAmended Year-End 2016 Budget to
Description Actual Budget Estimate Budget 2015 BudgetPersonnel
Wages 54,326,151$ 59,318,841$ 57,296,985$ 61,064,863$ 2.9%Benefits 22,185,217 24,483,131 23,155,087 27,384,694 11.9%
Personnel 76,511,367 83,801,972 80,452,072 88,449,557 5.5%
Maintenance and OperationsSupplies 13,235,781 14,814,473 13,213,092 13,178,261 -11.0%Services 4,820,233 8,060,663 6,554,355 10,405,482 29.1%Insurance 2,384,464 2,391,618 2,258,972 2,116,997 -11.5%Utilities 1,330,277 1,528,500 1,707,200 1,878,500 22.9%Repairs & Maintenance 430,965 622,952 656,204 677,808 8.8%Rentals 310,079 472,570 473,203 457,509 -3.2%Other 12,066,506 12,693,130 11,416,829 12,879,241 1.5%Repairs & Maint Contract Services 441,223 498,353 483,103 509,603 2.3%Other Improvements 21,837 137,300 136,800 342,150 149.2%
Maintenance and Operations 35,041,365 41,219,559 36,899,758 42,445,551 3.0%
Total * 111,552,732$ 125,021,531$ 117,351,830$ 130,895,108$ 4.7%
Total FTE's 875.5 875.5 897.5Total Positions 893.0 893.0 916.0
* Does not include Non-Departmental, Debt Service, Transfers or Self-Insurance Expenditures
$0.0
$20.0
$40.0
$60.0
$80.0
$100.0
2014Actual
2015AmendedBudget
2015Year-EndEstimate
2016Budget
Mill
ions
Expenditure Summary
Total Personnel
Total M&O
Office of the CEO3%
Administration Division
11%
Finance Division8%
Operations Division78%
Agency Operating Budget
33

34

2016 Budget
Statistics
This section includes Operating Statistics for all modes of service,
Personnel Summary, Capital Program, Capital Budget by Project,
and an Insurance Expenditure Comparison.
35

36

2016 BudgetOperating Statistics
All Modes
2015 2016 % ChangeBudget Budget 2015 - 2016
Pierce TransitFixed Route Local & Express
Ridership 10,792,701 11,475,046 6.3%
Service Hours 442,542 464,000 4.8%
Service Miles 4,961,958 5,198,370 4.8%
Sound TransitFixed Route Express
Ridership 7,480,480 7,502,782 0.3%
Service Hours 306,577 307,491 0.3%Service Miles 7,639,900 7,662,677 0.3%
Total Fixed Route (Pierce Transit & Sound Transit)Ridership 18,273,181 18,977,828 3.9%
Service Hours 749,119 771,491 3.0%
Service Miles 12,601,858 12,861,047 2.1%
SHUTTLERidership 378,603 371,378 -1.9%
Service Hours 189,220 187,860 -0.7%
Service Miles 2,738,744 2,730,176 -0.3%
VanpoolRidership 950,000 950,000 0.0%
Service Hours 147,000 147,000 0.0%
Service Miles 5,000,000 5,000,000 0.0%
AGENCY TOTAL (Pierce Transit and Sound Transit Fixed Route,SHUTTLE & Vanpool)
Ridership 19,601,784 20,299,206 3.6%
Service Hours 1,085,339 1,106,351 1.9%
Service Miles 20,340,602 20,591,223 1.2%
37
2016 BUDGET PERSONNEL SUMMARY
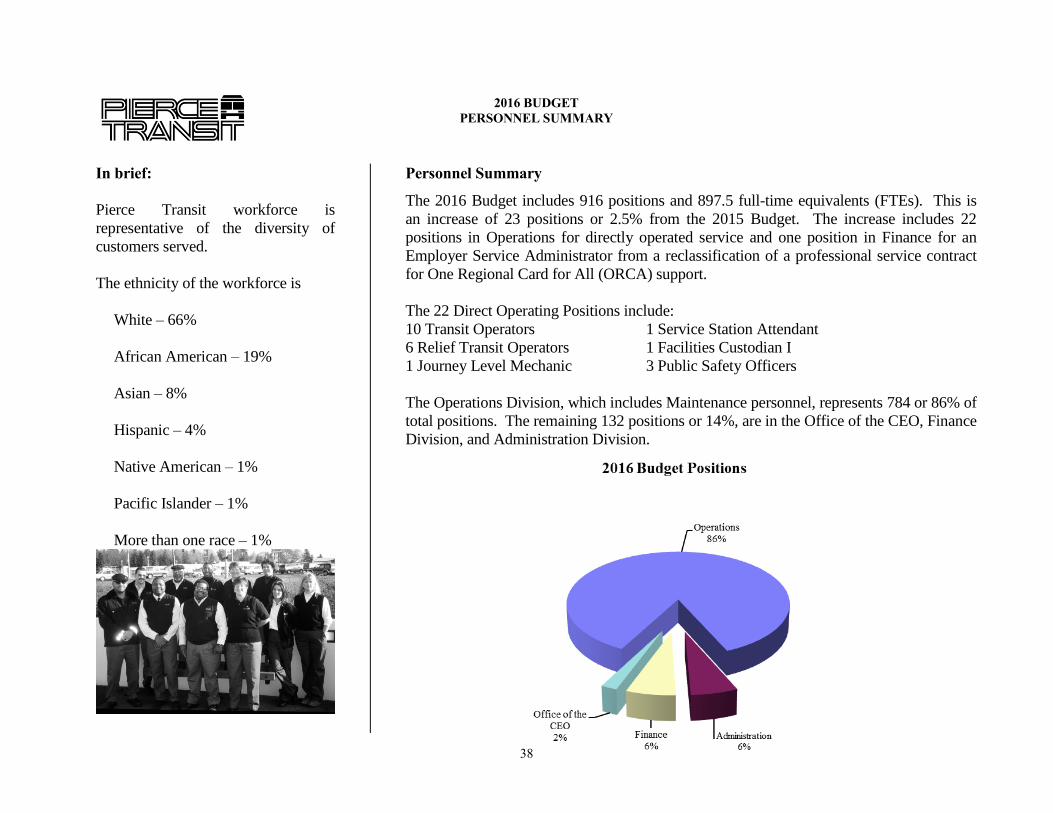
In brief:
Pierce Transit workforce is
representative of the diversity of
customers served.
The ethnicity of the workforce is
White – 66%
African American – 19%
Asian – 8%
Hispanic – 4%
Native American – 1%
Pacific Islander – 1%
More than one race – 1%
Personnel Summary
The 2016 Budget includes 916 positions and 897.5 full-time equivalents (FTEs). This is
an increase of 23 positions or 2.5% from the 2015 Budget. The increase includes 22
positions in Operations for directly operated service and one position in Finance for an
Employer Service Administrator from a reclassification of a professional service contract
for One Regional Card for All (ORCA) support.
The 22 Direct Operating Positions include:
10 Transit Operators 1 Service Station Attendant
6 Relief Transit Operators 1 Facilities Custodian I
1 Journey Level Mechanic 3 Public Safety Officers
The Operations Division, which includes Maintenance personnel, represents 784 or 86% of
total positions. The remaining 132 positions or 14%, are in the Office of the CEO, Finance
Division, and Administration Division.
38

2014 2015 2016 2015-2016 2014 2015 2016 2015-2016Budget Budget Budget Change Budget Budget Budget Change
844.0 875.5 897.5 22.0 866.0 893.0 916.0 23.0
2016 BUDGETPERSONNEL SUMMARY
Budget FTEs
0
200
400
600
800
1,000
2014 2015 2016
Budget FTEs & Positions
FTEs Positions
39

2016 BUDGET CAPITAL PROGRAM
In brief:
Major projects spanning more
than one year account for a
significant portion of the budget.
Investment supports public
transportation needs in Pierce
County.
Provides critical infrastructure for
the transit system.
The 2016 Capital Budget consists of a variety of projects primarily for the replacement
and refurbishment of existing equipment and facilities including some multi-year
projects that are carried over.
Revenue Vehicles – Pierce Transit currently operates an active fleet of 149 buses, 366
vanpool vans, and 100 SHUTTLE vehicles. Revenue vehicles are replaced on a regular
cycle. The replacement schedule meets or exceeds Federal Transit Administration
requirements that a vehicle not be removed from service prior to the completion of its
useful life. With recent reductions, Pierce Transit has a fixed route fleet with an average
age of 8.8 years. The actual replacement of vehicles will be on an as-needed basis and
the Agency continues to extend the useful life of vehicles wherever possible.
Passenger Facilities & Amenities – Funds are budgeted for necessary repairs and
refurbishments at several locations including Tacoma Dome Station, and 512 Park &
Ride, 72nd
Street Transit Center, as well as Transit Oriented Development at the Air
Spares property near the Tacoma Dome Station.
Base Facilities – Funds are budgeted for necessary repairs and refurbishments to base
facilities and systems, and the acquisition of additional property for the base.
Technology – Funds are budgeted for for maintenance and upgrade of several critical
software and systems, as well as replacement of infrastructure that has reached the end of
its useful life. Some of these projects include the financial management system
replacement, server and infrastructure replacement, portfolio management software, and
Closed Circuit Television (CCTV).
Other – Other capital projects include replacement of non-revenue support vehicles
(trucks, forklifts, cars, etc.), and maintenance and administrative equipment.
40

2016 BUDGET CAPITAL PROGRAM
Local funds
Grant funds
Carryover funds – As a matter of policy, Pierce Transit budgets funds in the year in
which the Agency anticipates entering into a contract for service or acquisition. This
generally results in funds that carry over from the previous budget year for projects in
process. At the time the budget is prepared, the amount to be carried over is estimated.
The estimated amounts are revised as necessary when the final year end expenditures are
available, generally during the first quarter of the year.
Grant funds – Federal grant revenues for 2016 in the capital program are expected to be
nearly $3 million and include the following projects:
Tacoma Dome Station Mid-Life Maintenance $2 million
Fixed Video at Radio Sites
State Grants and Other Capital Assistance are expected to be nearly $2 million for the
Base Master Plan project.
The detailed 2016 Capital Budget list follows.
41

2016 CAPITAL BUDGET BY PROJECT NUMBER
Responsibility
Line
# Project DivisionCost
CenterProject Number
Total Project Budget
Prior Year Expenditures
(through 12/31/14)
Estimated 2015 Expenditures
Project Closeout -
Amount Returned to Reserves At
Close
Estimated Project
Carryover from 2015 into 2016
New 2016 Project
Allocation Amount
Total 2016 Annual Capital
BudgetLocal (Pierce
Transit) FundedEstimated
Grant Funding
1 TDS Mid-Life Maintenance Finance 411000 0315 2,871,045 182,449 84,356 - 2,604,240 - 2,604,240 418,915 2,185,325
2 112th Street &Pacific/SR-7 Transit Access Mods Finance 411000 0343 2,375,658 1,058,421 756,579 560,658 - - - - -
3 Master Key System Replacement Operations 645000 0344 110,889 48,345 62,544 - - - - - -
4 Bldg. 4 Modifications Finance 411000 0345 2,443,317 1,592,509 409,151 441,657 - - - - -
5 Adept Version Upgrade Administration 262000 0358 157,119 136,978 20,141 - - - - - -
6 Maintenance Management System Administration 262000 0359 539,312 180,022 323,763 35,527 - - - - -
7 Limited Access Control Software Administration 262000 0361 204,951 180,015 24,936 - - - - - -
8 ORCA (Regional Fare Integration) Finance 243000 0364 5,296,645 4,690,210 - - 254,623 351,812 606,435 606,435 -
9 LAN Replacement 2013--CLOSED 2015 Administration 262000 0386 358,939 338,865 - 20,074 - - - - -
10 CAD AVL System Upgrade 2013 Administration 262000 0387 404,269 - 104,000 300,269 - - - - -
11 Fare Box Replacement 2013 Administration 262000 0388 3,700,000 2,160,474 1,539,526 - - - - - -
12 TDS G Street Expansion Zone Finance 411000 0390 744,024 80,327 524,673 139,024 - - - - -
13 TRAX Data Coverage Upgrade Operations 662000 0397 192,257 - 192,257 - - - - - -
14 Radio Subscriber Replacement Operations 662000 0398 2,154,188 1,663,802 490,386 - - - - - -
15 Bus Replacement 2013 Operations 652000 0406 4,215,900 4,190,997 24,903 - - - - - -
16 Ticket Vending Machine Purchase Finance 243000 0407 109,771 - 109,771 - - - - - -
17 AV System Replacement - Bldg. 5 Administration 262000 0410 546,452 - 410,000 136,452 - - - - -
18 Supervisor Vehicle Computer Replacement Administration 262000 0413 169,788 2,085 167,703 - - - - - -
19 CAD AVL System Upgrade 2014 and 2019 Administration 262000 0415 454,780 - 454,780 - - - - - -
20 Cameras on Buses Administration 262000 0416 2,050,391 13,176 2,036,824 391 - - - - -
21 End Point Security--CLOSED 2015 Administration 262000 0417 90,255 - 24,123 66,132 - - - - -
22 Facilities Critical Repairs Finance 411000 0418 714,850 - 100,000 - 614,850 - 614,850 614,850 -
23 Support Vehicle Replacement 2014 Operations 651000 0420 696,229 619,753 76,476 - - - - - -
24 Shuttle Replacement 2014 Operations 651000 0422 417,727 - 50,000 367,727 - - - - -
25 Vanpool Replacement 2014 Operations 651000 0423 1,539,424 - 1,539,424 - - - - - -
26 Vanpool Expansion 2014 Operations 651000 0424 325,000 - 325,000 - - - - - -
27 Brake Lathe Replacement 2014--CLOSED Operations 652000 0426 18,830 - 12,396 6,434 - - - - -
28 Trolley Vehicle Expansion--CLOSED 2014 Operations 652000 0427 234,650 56,097 3,977 174,576 - - - - -
29 Building 4 Roof Deck Replacement Operations 653000 0428 334,752 277,884 24,824 32,044 - - - - -
30 Radio Subscriber Replacement/Bus, Shuttle and Support Operations 662000 0429 2,244,848 717,066 1,527,782 - - - - - -
31 CAD AVL GPS Repeater 450 MHz Data Radio Project Operations 662000 0430 3,402,197 60,735 3,341,462 - - - - - -
32 Bus Replacement 2014 Operations 652000 0442 5,411,413 2,050 5,409,363 - - - - - -
33 DFAR Operations 645000 0443 45,000 11,316 33,684 - - - - - -
34 Financial Mgmt Sys Repl 2015 Finance 241000 0445 1,010,000 - - - 1,010,000 - 1,010,000 1,010,000 -
35 Copier Repl 2015 Administration 262000 0446 437,600 - 437,600 - - - - - -
36 Network Infrastructure Repl 2015 Administration 262000 0447 680,518 - 680,518 - - - - - -
37 SAN 2015 Administration 262000 0448 191,450 - 131,542 59,908 - - - - -
38 Portfolio Mgmt Software 2015 Executive 263000 0449 130,000 - 65,000 - 65,000 - 65,000 65,000 -
39 Air Spare/TDS Transit Oriented Development Finance 411000 0450 99,000 - - - 99,000 - 99,000 99,000 -
40 RSM Ridecheck Software 2015 Operations 451000 0451 184,835 - 170,000 - 14,835 - 14,835 14,835 -
41 Emergency Warning System Repl 2015 Operations 645000 0452 466,874 - - - 466,874 - 466,874 466,874 -
42 Shuttle Fleet Replacement 2015 Operations 651000 0453 2,368,440 - 2,368,440 - - - - - -
43 Vanpool Fleet Replacement 2015 Operations 651000 0454 1,780,120 - - 1,780,120 - - - - -
44 Support Vehicle Replacement 2015 Operations 651000 0455 411,711 - 411,711 - - - - - -
45 Vanpool Fleet Expansion 2015 Operations 651000 0456 550,000 - 80,244 469,756 - - - - -
46 Auto Shop Equip Repl 2015 Operations 651000 0457 28,679 - 28,679 - - - - - -
47 Paint Booth Heater Refurbishment 2015 Operations 651000 0458 60,170 - 60,170 - - - - - -
48 Auto Shop Hoist Repl 2015 Operations 651000 0459 311,218 - - - 311,218 - 311,218 311,218 -
Project Biographical Data Account Tracking Multi-Year Budget Data 2016 Annual Project Budget Data Funding of 2016 Project Amount
42

2016 CAPITAL BUDGET BY PROJECT NUMBER
Responsibility
Line
# Project DivisionCost
CenterProject Number
Total Project Budget
Prior Year Expenditures
(through 12/31/14)
Estimated 2015 Expenditures
Project Closeout -
Amount Returned to Reserves At
Close
Estimated Project
Carryover from 2015 into 2016
New 2016 Project
Allocation Amount
Total 2016 Annual Capital
BudgetLocal (Pierce
Transit) FundedEstimated
Grant Funding
Project Biographical Data Account Tracking Multi-Year Budget Data 2016 Annual Project Budget Data Funding of 2016 Project Amount
49 Bus Fleet Replacement 2015 Operations 652000 0460 1,069,875 - - - 1,069,875 - 1,069,875 1,069,875 -
50 Bldg 1 and 4 Rewire 2015 Administration 262000 0461 447,665 - - - 447,665 - 447,665 447,665 -
51 Critical Electrical Needs in Base Power 2015 Operations 653000 0462 59,800 - 59,800 - - - - - -
52 TDS Bus Shop Lighting 2015 Operations 653000 0463 71,565 - 71,565 - - - - - -
53 Radio Subscriber Repl for Bus, Shuttle & Support Veh 2015 Operations 662000 0464 819,499 - 819,499 - - - - - -
54 Radio Shop Equip 2015 Operations 662000 0465 235,611 - 235,611 - - - - - -
55 Bus Fleet Expansion 2015 Operations 652000 0469 5,735,290 - - - 5,735,290 - 5,735,290 5,735,290 -
56 CCTV Video Retention Expansion Operations 645000 TBA 48,000 - - - - 48,000 48,000 48,000 -
57 Money Counting Room Sorter Replacement Finance 242000 TBA 12,581 - - - - 12,581 12,581 12,581 -
58 Support Fleet Replacement Operations 651000 TBA 391,714 - - - - 391,714 391,714 391,714 -
59 Network Infrastructure Replacement Administration 262000 TBA 213,330 - - - - 213,330 213,330 213,330 -
60 Vanpool Fleet Replacement Operations 651000 TBA 1,946,406 - - - - 1,946,406 1,946,406 1,946,406 -
61 Training Fare Boxes Operations 643000 TBA 70,000 - - - - 70,000 70,000 70,000 -
62 Base Master Plan Update and Facility Needs Assessment Finance 411000 TBA 253,000 - - - - 253,000 253,000 152,000 101,000
63 West Base Property Acquisition Finance 411000 TBA 2,590,000 - - - - 2,590,000 2,590,000 2,590,000 -
64 Radio Site Fixed Video Operations 662000 TBA 414,965 - - - - 414,965 414,965 - 414,965
Grand Total 67,664,786$ 18,263,576$ 25,825,183$ 4,590,749$ 12,693,470$ 6,291,808$ 18,985,278$ 16,283,988$ 2,701,290$
43

2015 % Change2014 AMENDED 2016 2016 Budget
Insurance Expenditure Comparison Description ACTUAL BUDGET BUDGET to 2015 Budget
Liability & Other Insurance 458,372 528,000 - -100.0%
Workers' Comp. Insurance 2,079,553 2,165,000 2,705,000 24.9%
Unemployment Insurance 78,135 125,000 125,000 0.0%
TOTAL INSURANCE 2,616,060$ 2,818,000$ 2,830,000$ 0.4%
2016 BUDGETINSURANCE EXPENDITURE COMPARISON
$0.0
$1.0
$2.0
$3.0
$4.0
$5.0
2014 Actual 2015
Amended
Budget
2016 Budget
Mil
lions
Expenditure Summary
Workers' Comp
96%
Unemployment
4%
44

2016 Budget
Six-Year Financial Plan
This section includes the Six-Year
Financial Plan Operating Revenues &
Expenditures, Ending Balances, and
the 2016-2021 Six-Year Capital Plan.
A Six-Year Financial Plan is prepared
to ensure fiscal sustainability over
time.
45

PIERCE TRANSIT2016-2021 Six-Year Financial PlanOperating Revenues & Expenditures
(Millions) 2015 2016 2017 2018 2019 2020 2021YE Est Budget
REVENUES -BEGINNING WORKING CASH $98.347580 $91.851513 $90.622534 $74.054075 $72.255654 $57.277953 $43.016243
OPERATING INCOMEFARES AND PASSES
Local Fares 9.219039 10.814265 11.039334 12.765882 12.893540 14.293758 14.405385
Express Fares (Excludes ST) 0.049916 0.060700 0.059430 0.066343 0.067007 0.074122 0.074863
Shuttle 0.361854 0.352809 0.363393 0.413695 0.426106 0.480688 0.495108
Vanpool 3.182400 3.300000 3.610000 4.085000 4.085000 4.560000 4.560000
Subtotal- Fares and Passes 12.813209 14.527774 15.072158 17.330919 17.471652 19.408568 19.535357
SALES TAX 70.510078 74.106092 77.996662 82.286478 87.017951 92.239028 97.773369
OPER. ASSIST. CTR/VANPOOL 0.131219 0.196219 0.100990 0.100990 0.100990 0.100990 0.100990
SPECIAL NEEDS PROGRAM FUNDS 1.343107 1.554019 1.227010 0.932412 0.932412 0.932412 0.932412
INTEREST 0.105000 0.120000 0.000000 0.000000 0.000000 0.000000 0.000000
ADVERTISINGContract Advertising - Pierce Transit Revenue 0.895000 0.763000 0.750000 0.750000 0.750000 0.750000 0.750000
SOUND TRANSITST Express Reimb. 37.503538 37.604645 41.135820 43.366754 47.186990 49.717435 52.415594
ST TDS Reimb. 0.777643 0.846355 0.846355 0.871746 0.897898 0.924835 0.952580
Special Service 0.200000 0.200000 0.200000 0.206000 0.212180 0.218545 0.225102
Other ST Reimb. 0.025000 0.000000 0.000000 0.000000 0.000000 0.000000 0.000000
MISCELLANEOUSOperating Grant - Other (Homeland Sec/Reg Mob) 0.344610 1.873087 1.476239 1.160352 0.580176 0.000000 0.000000
Operating Grant (5307)/Pierce County 0.650216 0.975322 0.975322 0.975322 0.975322 0.975322 0.975322
Preventive Maint. (5307) / ADA 5.082836 4.627700 4.627700 4.627700 4.627700 4.627700 4.627700
Other Miscellaneous 4.512945 2.318295 0.200000 0.200000 0.200000 0.200000 0.200000
TOTAL OPERATING INCOME 134.894401 139.712508 144.608256 152.808672 160.953270 170.094834 178.488426
TOTAL REVENUES & WORKING CASH $233.241981 $231.564021 $235.230790 $226.862747 $233.208924 $227.372786 $221.504668
46

PIERCE TRANSIT2016-2021 Six-Year Financial PlanOperating Revenues & Expenditures
(Millions) 2015 2016 2017 2018 2019 2020 2021YE Est Budget
EXPENDITURES -Ongoing Operations
Wages $57.296985 $61.064863 $64.155465 $69.014907 $71.946867 $75.154079 $78.195731
Benefits 23.155087 27.384694 30.688055 34.224308 37.012358 40.133404 43.373619
M & O 18.322932 23.356591 22.486292 23.198672 23.894632 24.614048 25.349815
Fuel 6.199817 6.624344 6.684162 6.907946 7.057333 7.216733 7.369685
Parts 4.725554 4.080298 4.083203 4.270222 4.398329 4.534680 4.666187
Purchased Trans. 7.493395 8.202451 8.026029 8.202902 8.385195 8.573077 8.766718
Bridge Tolls 0.158060 0.181867 0.183992 0.189076 0.194302 0.199673 0.205194
TOTAL EXPENDITURES: w/out Debt Payment
and Depreciation 117.351830 130.895108 136.307198 146.008033 152.889016 160.425693 167.926950
Non-Operating CostsPayments to Pierce Co for 5307 Agreement 0.520173 0.780258 0.780258 0.780258 0.780258 0.780258 0.780258
Subtotal 0.520173 0.780258 0.780258 0.780258 0.780258 0.780258 0.780258
EXPENDITURES (w/ Debt & Reimbursements) 117.872003 131.675366 137.087456 146.788291 153.669274 161.205951 168.707208CURRENT REVENUES LESS CURRENT
EXPENDITURES 17.022398 8.037142 7.520800 6.020381 7.283997 8.888882 9.781217
TRANSFERS -Capital Reserve 20.888435 5.815560 21.174359 4.816455 19.169281 19.965402 17.318741
Insurance 2.630030 3.450561 2.914900 3.002347 3.092417 3.185190 3.280746
Subtotal Transfers 23.518465 9.266121 24.089259 7.818802 22.261698 23.150592 20.599487
TOTAL EXPENDITURES AND TRANSFERS141.390468 140.941487 161.176715 154.607093 175.930972 184.356543 189.306695
ENDING WORKING CASH 91.851513 90.622534 74.054075 72.255654 57.277953 43.016243 32.197974
REQUIRED CASH 19.558638 21.815851 22.717866 24.334672 25.481503 26.737616 27.987825
TOTAL EXPENDITURES
& WORKING CASH $233.241981 $231.564021 $235.230790 $226.862747 $233.208924 $227.372786 $221.504668
MARGIN / (DEFICIT) $72.292875 $68.806683 $51.336208 $47.920982 $31.796450 $16.278627 $4.210149
47

PIERCE TRANSIT2016-2021 Six-Year Financial PlanEnding Balances
(Millions) 2015 2016 2017 2018 2019 2020 2021YE Est Budget
OPERATING FUNDOperating Fund Beginning Balance 98.347580 91.851513 90.622534 74.054075 72.255654 57.277953 43.016243
RevenueOperating Income 134.894401 139.712508 144.608256 152.808672 160.953270 170.094834 178.488426
Subtotal - Operating Revenue 134.894401 139.712508 144.608256 152.808672 160.953270 170.094834 178.488426
ExpendituresOperating Expenditures 117.872003 131.675366 137.087456 146.788291 153.669274 161.205951 168.707208
Transfers 23.518465 9.266121 24.089259 7.818802 22.261698 23.150592 20.599487
Subtotal - Operating Expenditures 141.390468 140.941487 161.176715 154.607093 175.930972 184.356543 189.306695
Operating Fund Ending Balance $91.851513 $90.622534 $74.054075 $72.255654 $57.277953 $43.016243 $32.197974Required Margin 19.558638 21.815851 22.717866 24.334672 25.481503 26.737616 27.987825
Margin / (Deficit) 72.292875 68.806683 51.336208 47.920982 31.796450 16.278627 4.210149
CAPITAL FUND Beginning Reserves $0.000000 $0.000000 $0.000000 $0.000000 $0.000000 $0.000000 $0.000000
Revenue5307 Funding
5307 Earned Share 5.082836 4.627700 4.627700 4.627700 4.627700 4.627700 4.627700
5307 Competitive Funds 0.000000 0.000000 0.000000 0.000000 0.000000 0.000000 0.000000
Less Preventive Maintenance -5.082836 -4.627700 -4.627700 -4.627700 -4.627700 -4.627700 -4.627700
5307 Funds Available for Capital Projects 0.000000 0.000000 0.000000 0.000000 0.000000 0.000000 0.000000
Pierce County 53075307 Revenues from Pierce Co Agreement 0.650216 0.975322 0.975322 0.975322 0.975322 0.975322 0.975322
Pierce Co. 5307 -0.650216 -0.975322 -0.975322 -0.975322 -0.975322 -0.975322 -0.975322
Pierce County 5307 Available for Capital 0.000000 0.000000 0.000000 0.000000 0.000000 0.000000 0.000000
Flexible Funds & EarmarksFederal Flex Funds - Regional 0.000000 0.000000 0.000000 0.000000 2.720000 2.720000 2.640000
Federal Flex Funds - Countywide 0.258775 0.000000 4.500000 4.500000 0.000000 0.000000 0.000000
Earmarks - 5309 0.405601 1.775530 0.000000 0.000000 0.000000 0.000000 0.000000
Sound Transit Sound Transit Base Expansion 0.000000 0.000000 0.000000 2.053800 0.000000 0.000000 0.000000
Sound Transit - Other Capital 0.000000 0.510795 0.000000 0.000000 0.000000 0.000000 0.000000
Other FundingState Funding 0.790477 0.000000 0.000000 0.855000 0.000000 0.000000 0.000000
Interest 0.025000 0.025000 0.000000 0.000000 0.000000 0.000000 0.000000
Other Capital Revenues 0.651939 0.414965 0.000000 0.000000 0.000000 0.000000 0.000000
Contributions from Other FundsTransfer from Operating Fund 20.888435 5.815560 21.174359 4.816455 19.169281 19.965402 17.318741
Total Capital Revenues & Reserves 23.020227 8.541850 25.674359 12.225255 21.889281 22.685402 19.958741
48

PIERCE TRANSIT2016-2021 Six-Year Financial PlanEnding Balances
(Millions) 2015 2016 2017 2018 2019 2020 2021YE Est Budget
ExpendituresRevenue Vehicles 9.801351 8.751571 19.281980 6.195788 16.745424 15.405699 15.197540
Passenger Facilities & Amenities 1.537173 3.318090 1.015839 0.000000 0.000000 0.700000 3.300000
Base Facilities 0.493775 3.757539 0.460000 3.984500 0.000000 0.000000 0.327800
Technology 12.620470 2.372565 3.639245 0.635450 1.021000 2.746474 0.771936
Other 1.372414 0.785513 1.277295 1.409517 4.122857 3.833229 0.361465
Total Capital Expenditures (Inflated) 25.825183 18.985278 25.674359 12.225255 21.889281 22.685402 19.958741
USE OF CAPITAL RESERVE -2.804956 -10.443428 0.000000 0.000000 0.000000 0.000000 0.000000
CAPITAL RESERVERevenueBeginning Reserves $19.740699 $16.935743 $6.492315 $6.492315 $6.492315 $6.492315 $6.492315
Total Capital Revenues 23.020227 8.541850 25.674359 12.225255 21.889281 22.685402 19.958741
TOTAL CAPITAL RESERVE REVENUES & BEGINNING RESERVE 42.760926 25.477593 32.166674 18.717570 28.381596 29.177717 26.451056
ExpendituresCapital Expenditures 25.825183 18.985278 25.674359 12.225255 21.889281 22.685402 19.958741
CAPITAL RESERVE -Req'd $6.492315 $16.935743 $6.492315 $6.492315 $6.492315 $6.492315 $6.492315 $6.492315
INSURANCE FUNDRevenueBeginning Balance $0.429949 $0.374439 $1.000000 $1.000000 $1.000000 $1.000000 $1.000000
Interest on Insurance Fund 0.005500 0.005000 0.000000 0.000000 0.000000 0.000000 0.000000
Transfer 2.630030 3.450561 2.914900 3.002347 3.092417 3.185190 3.280746
ExpendituresPayments from Insurance Fund 2.691040 2.830000 2.914900 3.002347 3.092417 3.185190 3.280746
Insurance Fund Ending Balance $0.374439 $1.000000 $1.000000 $1.000000 $1.000000 $1.000000 $1.000000
TOTAL ENDING BALANCES $109.161695 $98.114849 $81.546390 $79.747969 $64.770268 $50.508558 $39.690289
49

2016 - 2021 PROPOSED SIX YEAR CAPITAL PLAN BY COST CENTERResponsibility Account Tracking
Line # Project Title Division
Cost Center
Project Number
2015 Est. Carryover
Amount 2016 2017 2018 2019 2020 2021 Total 1 Document Management System Executive 111000 TBA -$ -$ 232,400$ -$ -$ -$ -$ 232,400$
2 Money Counting Room Sorter Replacement Finance 242000 TBA - 12,581 - - - - - 12,581
3 ORCA 2 Finance 243000 0364 254,623 351,812 689,686 - - 81,365 166,936 1,544,422
4 Financial Mgmt. Sys Repl. 2015 Finance 241000 0445 1,010,000 - - - - - - 1,010,000
5 Agency Plotter Replacement Administration 262000 TBA - - - - 18,000 - - 18,000
6 Bldg. 1 and 4 Rewire 2015 Administration 262000 0461 447,665 - - - - - - 447,665
7 Business Intelligence System Administration 262000 TBA - - - - - - - -
8 CAD AVL System Upgrade Administration 262000 TBA - - - - - 800,000 - 800,000
9 Copier Repl. 2015 Administration 262000 TBA - - - - - - - -
10 Customer Resource Management System Replacement Administration 262000 TBA - - - 120,450 - - - 120,450
11 Hastus Upgrade 2017 and 2020 Administration 262000 TBA - - 501,609 - - 501,609 - 1,003,218
12 Marketing Printer and Plotter Replacement Administration 262000 TBA - - 66,950 - - - - 66,950
13 Network Infrastructure Repl. Administration 262000 TBA - 213,330 785,000 340,000 797,000 883,500 430,000 3,448,830
14 Service Supervisor Vehicle Computer Replacement Administration 262000 TBA - - - - - 200,000 - 200,000
15 Shuttle Scheduling Software Replacement Administration 262000 TBA - - 963,600 - - - - 963,600
16 Storage Area Network Administration 262000 TBA - - 400,000 175,000 200,000 280,000 175,000 1,230,000
17 Vinyl Cutter Repl. 2016 Administration 262000 TBA - - - - 6,000 - - 6,000
18 Portfolio Mgmt. Software 2015 Executive 263000 0449 65,000 - - - - - - 65,000
19 Air Spare/TDS Transit Oriented Development Finance 411000 0450 99,000 - - - - - - 99,000
20 Articulated Bus Infrastructure (route 1) Finance 411000 TBA - - 53,856 106,920 - - - 160,776
21 Base Master Plan Update and Facility Needs Assessment Finance 411000 TBA - 253,000 - - - - - 253,000
22 Building 1 Expansion Finance 411000 TBA - - 460,000 3,984,500 - - - 4,444,500
23 Facilities Critical Repairs Finance 411000 0418 614,850 - - - - - - 614,850
24 Pac Ave SR-7 P&R Bus Turnaround Finance 411000 TBA - - - 700,000 3,400,000 3,400,000 - 7,500,000
25 South Hill P&R Finance 411000 TBA - - - - - 700,000 3,300,000 4,000,000
26 TDS Mid-Life Maintenance Finance 411000 0315 2,604,240 - - - - - - 2,604,240
27 Transit Center Shelter Refurbishment Finance 411000 TBA - - 1,015,839 - - - - 1,015,839
28 Vanpool Carport Finance 411000 TBA - - - - - - - -
29 West Base Property Acquisition Finance 411000 TBA - 2,590,000 - - - - 327,800 2,917,800
30 RSM Ridecheck Software 2015 Operations 451000 0451 14,835 - - - - - - 14,835
31 Training Fare Boxes Operations 643000 TBA - 70,000 - - - - - 70,000
32 CCTV Video Retention Expansion Operations 645000 TBA - 48,000 - - - - - 48,000
33 Emergency Warning System Repl. 2015 Operations 645000 0452 466,874 - - - - - - 466,874
34 Physical Protection System Integration Phase 1 Operations 645000 TBA - - - - - - - -
35 Auto Shop Hoist Repl. 2015 Operations 651000 0459 311,218 - - - - - - 311,218
36 Shuttle Fleet Replacement Operations 651000 TBA - - - - 3,492,004 2,062,126 4,016,896 9,571,026
37 Support Fleet Replacement Operations 651000 TBA - 391,714 311,087 516,211 546,152 400,471 317,309 2,482,944
38 Vanpool Fleet Replacement Operations 651000 454/TBA - 1,946,406 2,138,184 856,061 706,740 587,683 1,197,559 7,432,633
39 Wheel Alignment System Replacement (Auto Shop Equip) Operations 651000 TBA - - 24,024 32,000 7,463 9,152 10,000 82,639
40 Bus Fleet Expansion 2015 Operations 652000 0469 5,735,290 - 6,500,000 - - - - 12,235,290
41 Bus Fleet Replacement Operations 652000 460/TBA 1,069,875 - 10,643,796 5,339,727 12,546,680 12,755,890 9,983,085 52,339,053
42 Crash Avoidance System Operations 652000 TBA - - 842,380 - - - - 842,380
43 Parts Cleaner Cabinet Replacement (Bus Shop Equip) Operations 652000 TBA - - 45,948 54,386 169,242 23,606 34,156 327,338
44 Radio Site Fixed Video Operations 662000 TBA - 414,965 - - - - - 414,965
Total 12,693,470$ 6,291,808$ 25,674,359$ 12,225,255$ 21,889,281$ 22,685,402$ 19,958,741$ 121,418,316$
Anticipated Grant Revenues 2,175,498 515,965 4,500,000 7,408,800 2,720,000 2,720,000 2,640,000 22,680,263
Project Biographical Data 2016 Annual Budget Data 2017-2021 Project Forecast
50

2016 Budget
Appendix
This section includes the
Acronym List
and
Budget Glossary.
51
2016 BUDGET ACRONYM LIST
Acronyms are words formed from the initial letters of other words most commonly used in the context of the budget.
ADA – American Disabilities Act APTA – American Public Transportation Association BVP – Bulletproof Vest Partnership CAFR – Comprehensive Annual Financial Report CCTV – Closed Circuit Television CMAQ – Congestion Mitigation & Air Quality Program CNG – Compressed Natural Gas CTR – Commute Trip Reduction DOT – Department of Transportation FEMA – Federal Emergency Management Agency FTA – Federal Transit Administration FY – Fiscal Year GFOA – Government Finance Officers Association GROW AMERICA ACT – Generating Renewal, Opportunity, and Work with Accelerated Mobility, Efficiency, and Rebuilding of Infrastructure and Communities throughout America ISTEA – Intermodal Surface Transportation Efficiency Act JARC – Job Access and Reverse Commute MAP 21– Moving Ahead for Progress in the 21st Century Act (P.L. 112-141) ORCA – One Regional Card for All OJP – Office of Justice Programs PCEI – Pierce County Economic Index PL – Public Law PT – Pierce Transit POV – Privately Owned Vehicle PTBA – Public Transportation Benefit Area RCW – Revised Code of Washington
52

2016 BUDGET ACRONYM LIST
SAFETEA-LU – Safe, Accountable, Flexible, Efficient Transportation Equity Act: A Legacy for Users SHUTTLE – Specialized Transportation ST – Sound Transit SUV – Special Use Van TANF – Temporary Aid to Needy Families TBSH – The Bus Stops Here TDP – Transit Development Plan TDS – Tacoma Dome Station USDOT – United States Department of Transportation UZA – Urbanized Area VP – Vanpool WATPA – Washington Auto Theft Prevention Authority WSDOT – Washington State Department of Transportation YE – Year End
53
2016 BUDGET GLOSSARY
Accounting System – Pierce Transit is a single enterprise that uses the accrual method of accounting. Under this method of accounting, revenues are recorded when earned and expenses are recorded as soon as they result in liabilities for benefits received.
Accrual Accounting – A basis of accounting in which revenues and expenses are allocated to the year in which they are incurred, as opposed to when cash is actually received or spent.
Accrual Basis – The basis of accounting under which transactions are recognized when they occur, regardless of the timing of related cash receipts and disbursements.
ADA Americans With Disabilities Act – Federal legislation mandating specific requirements for vehicles and facilities to accommodate the disabled.
Agency – As a government agency, Pierce Transit is often referred to as “the Agency” in this document and in other Pierce Transit publications.
Annual Ridership – The total number of passenger boardings on fixed route, SHUTTLE, or vanpool in a year.
Annual Service Hours – The number of hours of service provided during one year.
Appropriation – A legal authorization granted by a legislative body to make expenditures and to incur obligations for specific purposes. An appropriation usually is limited in amount and time it may be expended.
APTA – American Public Transportation Association. National, nonprofit trade association representing the public transit industry.
Basis of Accounting – The term that describes the criteria governing the timing of the recognition of transactions and events.
Beginning Reserve Balance – The fund balance as of January 1 that includes designated and undesignated amounts.
54

2016 BUDGET GLOSSARY
Boardings – Passengers are counted each time they board revenue vehicles no matter how many vehicles they use to travel from their origin to their destination. The official name of this statistic in National Transit Database (NTD) terms is “unlinked passenger trip.”
Bond – Long-term debt issued by an agency to help finance new acquisitions of property, facilities and equipment.
Budget – A financial plan to allocate financial resources to personnel, equipment, and facilities to deliver transit services to the public. It serves four main purposes: a policy statement, an operation guide, a financial plan, and a communication device.
Budget Amendment – A budget amendment is a formal action of the Board of Commissioners. An amendment is required in accordance with the Agency budget procedures.
Budget Revision – A budget revision is a record of change to the budget. A completed budget revision form is required for a revision.
Capital Budget – The Capital Budget is a portion of the annual budget that appropriates funds for the purchase of capital items. It includes funds for capital purchases such as vehicles, construction of new facilities, maintenance machinery, and off-site improvements. In addition, payroll costs and supplies may be capitalized if they are a portion of a project greater than $5,000. These items are distinguished from operating items due to their value (greater than $5,000) and projected useful life (greater than one year). Effective 2002.
Capital Fund Account – An account used to segregate a portion of the Agency's equity to be used for future capital program expenditures. The amount of the capital account is roughly equal to the Agency's annual equipment depreciation and an amount identified as being needed for future capital acquisition.
Capital Reserve – Reserves established to meet expenditure requirements for capital programmed in the Six-Year Financial Plan – a minimum amount equal to ten percent of the six-year average annual capital expenditures and fifty percent of the average annual grant funding programmed in the Six-Year Financial Plan.
55

2016 BUDGET GLOSSARY
Congestion Mitigation & Air Quality Program (CMAQ) – A federal program that funds transportation projects that will contribute to meeting the attainment of national ambient air quality standards.
Cost per Passenger – The cost of carrying each passenger. This is determined by dividing the total cost of carrying all passengers by the total number of passenger trips.
Cost per Vehicle Mile – The cost of traveling one mile. This is determined by dividing the total cost of providing service by the total number of miles traveled.
Deadhead Time – The number of hours a bus is traveling while not in revenue service. Includes travel between the garage and the beginning/end of a route or travel between two routes when the vehicle is not actually in service.
Debt – The amount of money required to pay interest and principal on the Agency's borrowed funds.
Debt Service – The annual debt service requirements and future debt service schedule associated with the bonds currently outstanding as determined by the debt policy. Debt service includes the principal and interest payment obligations for the defined periods.
Department – An sub-organizational unit of a Division responsible for achievement of specific Agency objectives such as service support, facilities management, and procurement.
Division – An organizational unit of the Agency responsible for carrying out Agency functions such as Operations and Finance.
DOT – See USDOT and WSDOT
Dwell Time – The scheduled time a vehicle is allowed to discharge and take on passengers at a stop, including opening and closing doors.
Encumbrances – A classification of expenditures committed for goods or services for which payments have not been made.
56

2016 BUDGET GLOSSARY
Ending Reserve Balance – The fund balance as of December 31 that includes designated and undesignated amounts.
Enterprise Fund – An enterprise fund is a type of proprietary fund used to account for a government’s business-type activities. An enterprise fund may be used to report any activity for which a fee is charged to external users for goods or services. Enterprise funds are commonly used by transit districts to focus attention on the cost of providing services, and they serve to highlight the portion of that cost being borne by taxpayers.
Expenditures – Decrease in net current assets. Expenditures include debt service, capital outlays, and those current operating costs that require the use of current assets.
Expenses – Decreases in net total assets. Expenses represent the total cost of operations during a period regardless of the timing of related expenditures.
Express – A segment of fixed route service that operates between major commuting centers without intermediate stops. This service is designed to be faster and more direct than local fixed route service. Express service is made up of Sound Transit service and other express services.
Farebox Recovery Ratio – The amount of total fares collected divided by total costs. This ratio indicates how much the passenger provides toward the total cost of service.
Fiscal Year – The fiscal year for Pierce Transit is the calendar year January 1 through December 31.
Fixed Guideway (fg) – A Public transportation facility using and occupying: a separate right-of-way (ROW) or rail for the exclusive use of Public Transportation; or a fixed catenary system usable by other forms of transportation.
Fixed Route – Bus operations that adhere to a published schedule on specific routes.
Full-time Equivalents (FTEs) – A unit used for measuring personnel according to the percentage of hours worked annually, based on a 40-hour workweek / 52 weeks / 2080 hours.
57

2016 BUDGET GLOSSARY
Fund – A fiscal or accounting entity with a self-balancing set of accounts. A fund is established for the purpose of carrying on specific activities in accordance with specific limitations.
Fund Balance – Fund balance is the difference between assets and liabilities. The fund balance consists of required reserves set by the Board of Commissioners policy and unreserved amounts.
Grants – A contribution by a government or other organization to support a particular function. Grants may be classified as either operational or capital depending on the purpose of the grant.
Grow America Act – Generating Renewal, Opportunity, and Work with Accelerated Mobility, Efficiency, and Rebuilding of Infrastructure and Communities throughout America is the proposed multi-year surface transportation reauthorization proposal in 2014.
Insurance Fund Account – This account reflects the Agency's self-insured risk management programs: workers’ compensation, and unemployment benefits. Operating funds pay an appropriate premium into this fund, which then pays valid claims. Dedicated cash funds to cover potential claims have been accumulated and are maintained in this account. These funds are restricted in their use.
Insurance Reserve – Reserves set at a level to adequately protect the Agency from self-insurance risks. The risks and reserve levels will be evaluated annually.
JARC – Job Access and Reverse Commute program. A grant funding support van services for Temporary Aid to Needy Families (TANF) and Welfare to Work recipients to transport eligible individuals with low income to and from jobs and activities related to their employment.
Layover Time – The time a bus is not in service between two scheduled trips.
Local Service – Fixed route bus service which travels within the local service area and makes regular and frequent stops. Pierce Transit’s local service extends north to the Federal Way Transit Center in south King County, south to Spanaway, west to University Place and Steilacoom, and east to Puyallup.
58

2016 BUDGET GLOSSARY
Maintenance and Operation Expenditures (M&O) – This term refers to expenditures paid to obtain goods or services; including such items as services, supplies, fuel, utilities, insurance, etc. This category does not include personnel or capital expenditures.
MAP-21 Moving Ahead for Progress in the 21st Century Act (P.L. 112-141) – Federal legislation funding surface transportation programs through the Federal Transit Administration for fiscal years 2013 and 2014. It replaces SAFETEA-LU.
Mission Statement – This statement defines the purpose of Pierce Transit, thus providing long-term guidance to the Agency. This Mission Statement is the basis of the Agency's strategy priorities, annual goals, and objectives.
Modified Accrual Basis of Accounting – This method recognizes increases and decreases in financial resources only to the extent that they reflect near-term inflows or outflows of cash. Non-revenues and expenditures, including capital grant receipts, and capital acquisitions are budgeted on an accrual basis. Debt service principal is budgeted on a cash basis.
Net Cost per Passenger – A measure of the cost-effectiveness of a transit system. This is determined by subtracting total fare revenue from the total cost of providing service, divided by the number of passenger trips.
One Regional Card for All (ORCA) – The seamless fare system for the region’s customers. It enables agencies to offer transit fare options, reduce media confusion, and improve interagency fare revenue reconciliation through an apportionment process. Regional fares are shared by the participating agencies which include Community Transit, Everett Transit, Kitsap Transit, King County Metro, Pierce Transit, Sound Transit, and Washington State Ferries.
Operating Budget – A plan of expenditures and proposed sources of financing current service. The operating budget does not include capital funds. The principle sources of revenue are operating income, sales tax, investment income and grants. All divisions are financed through this budget.
Operating Expenditures –The outflow of funds paid, or to be paid, for current goods and services.
59

2016 BUDGET GLOSSARY
Operating Reserve – Reserves maintained to provide a sufficient working capital and balance to finance cash flow requirements, unanticipated downturns in revenues, and provide funds for emergency expenditures - a minimum of two months of operating expenditures.
Operating Revenue – Funds that the Agency receives as income to pay for ongoing operations. It includes such items as: taxes, fees from specific services, interest earnings, and grant revenues. Operating revenues are used to pay for day-to-day services.
Passengers per Vehicle Hour – The number of passenger trips taken during one hour of service. This is calculated by dividing the total number of service hours by the number of passenger trips.
Performance Indicators – Measures by which Pierce Transit evaluates the effectiveness and efficiency of its operations.
Personnel – This item includes the cost of all salaries, wages, overtime, and benefits associated with the Agency's staff.
Platform Hours – At Pierce Transit, the terms platform hours and service hours are interchangeable (see Service Hours).
Regional Fare Coordination Project (ORCA / Smart Card) - The Regional Fare Coordination (RFC) Contract, Joint Consultant contracts, and the combined Agency activities related to the RFC System. The System, which comprises Community Transit, Everett Transit, Kitsap Transit, King County Metro, Pierce Transit, Sound Transit, and Washington State Ferries, will provide a common, non-cash fare system throughout the Agencies’ service areas.
Replacement – Capital items having reached the end of a minimum normal service life.
Required Reserve – The amount approved by the Board of Commissioner for the account groups operating, capital, and insurance account groups needed to mitigate current and future risks.
60

2016 BUDGET GLOSSARY
Service Miles – A calculation of service based on the number of miles a vehicle is on the road (includes revenue, recovery, and deadhead miles but not training or maintenance road test miles).
SHUTTLE – see Specialized Transportation also known as SHUTTLE.
Single-Enterprise Fund – Pierce Transit is a single-enterprise fund. Within the single fund, there are account groups (operating, capital, and insurance).
Smart Card – see Regional Fare Coordination Project.
Sound Transit – Regional Transit Authority. A cooperative known as “Sound Transit” which includes Pierce, King, and Snohomish counties, established to implement a regional, integrated, transit system throughout the Puget Sound area.
Specialized Transportation – An Agency program whereby transportation services are provided to the area disabled.
Transfers – Amounts transferred from the operating budget to the insurance and capital budgets. These amounts represent the annual contribution to these budgets.
Unreserved Amount – The designated or undesignated fund balance resources available for spending.
USDOT – United States Department of Transportation. The federal agency responsible for overseeing, regulating and providing financial assistance to ensure safe, effective national transportation systems including the Federal Transit Administration.
Vanpool – A group of 5 to 15 people sharing the ride in an 8, 12, or 15-passenger van.
Vehicle Hours – Aggregation of time during which a transit vehicle leaves the operating base, is available for service, and returns to the operating base. Includes layover and deadhead hours.
Working Cash – Excess of readily available assets over current liabilities or cash on hand equivalents that may be used to satisfy cash flow needs.
61

2016 BUDGET GLOSSARY
WSDOT – Washington State Department of Transportation. The state agency responsible for carrying out state transportation programs including public transportation.
62