Embed Size (px)
Citation preview
Performance of the Defense Acquisition System, 2016
PERFORMANCE OF THE
DEFENSE ACQUISITION SYSTEM
2016 ANNUAL REPORT
OCTOBER 24, 2016
Approved for public release; distribution unlimited.

ii
Performance of the Defense Acquisition System, 2016
Under Secretary of Defense, Acquisition, Technology, and Logistics. (2016). Performance of the
Defense Acquisition System: 2016 Annual Report. Washington, DC: Department of Defense.
3000 Defense Pentagon
Washington, DC 20301-3000
www.acq.osd.mil
iii
Performance of the Defense Acquisition System, 2016
FOREWORD
Eliminate all other factors, and the one which remains must be the truth. —Sir Arthur Conan Doyle in “The Sign of the Four”
As this report is being published, I am concluding 5 years of serving as the Under Secretary of Defense for Acquisition, Logistics, and Technology. This fourth report in the series continues my long-term effort to bring data-driven decision making to acquisition policy. This report demonstrates that the Department of Defense (DoD) is making continuing progress in improving acquisition. The overall series presents strong evidence that the DoD has moved—and is moving—in the right direction with regard to the cost, schedule, and quality of the products we deliver. There is, of course, much more that can be done to improve defense acquisition, but with the 5-year moving average of cost growth on our largest and highest-risk programs at a 30-year low, it is hard to argue that we are not moving in the right direction.
Each year we add cumulative data and new analysis to the report. This year is no exception. While that data can show us ways and places to improve, I believe there is no secret to what it takes to achieve good results in defense acquisition. The short form of this is to: (1) set reasonable requirements, (2) put professionals in charge, (3) give them the resources that they need, and (4) provide strong incentives for success. Unfortunately, there is a world of complexity and difficulty in each of these four items.
Creating new—and sometimes well beyond the current state of the art—weapons systems that will give our warfighters a decisive operational advantage far into the future will never be a low-risk endeavor. That risk can be managed, however, and while we should not expect perfection, we should be able to keep the inevitable problems that will arise within reasonable bounds. We should also be able to continuously improve our performance as we learn from our experience and work to improve our ability to make sound acquisition decisions. This volume and its predecessors are dedicated to these propositions.
We open this volume with some accrued insights and an attempt to refute some popular myths about defense acquisition. Too much of our decision making on acquisition policy has been based on cyclical and intuitive conventional wisdom and on anecdote—or just the desire, spurred by frustration, to affect change. As I’ve worked in this field for more than four decades, it has become clear to me that there is no “acquisition magic”—no easy solution or set of solutions that will miraculously change

iv
Performance of the Defense Acquisition System, 2016
our results. Most attempts to direct or legislate acquisition “magic” in some form have been counterproductive and often only increased the system's bureaucracy and rigidity or led to excessive risk taking—neither of which is helpful. What we need, and always will need, is professionalism, hard work, attention to detail, and flexible policies and incentives that the data show align with the results we desire. Improving each of these is a continuous endeavor of which this volume is a part.
v
Performance of the Defense Acquisition System, 2016
PRINCIPLES FOR IMPROVING DEFENSE ACQUISITION
People matter most; we can never be too professional or too competent.
Continuous improvement will be more effective than radical change.
Data should drive policy.
Critical thinking is necessary for success; fixed rules are too constraining.
Controlling life-cycle cost is one of our jobs; staying on budget isn’t enough.
Incentives work—we get what we reward.
Competition and the threat of competition are the most effective incentives.
Defense acquisition is a team sport.
Our technological superiority is at risk and we must respond.
We should have the courage to challenge bad policy.

vi
Performance of the Defense Acquisition System, 2016
(This page was left blank intentionally)
vii
Performance of the Defense Acquisition System, 2016
ORGANIZATION OF THE REPORT
Highlights. The following section briefly discusses recent actions and key findings from the report, providing page references to detailed discussions in the main body. It also provides some insights to illustrate how this kind of analysis is informing actions within the DoD. Though not comprehensive, it provides perspectives and insights gleaned from the entire report.
Chapter 1 provides background material on acquisition, spending levels and trends, and general perspectives on measuring institutional performance to set the stage for the analysis presented in subsequent chapters.
Chapter 2 analyzes the performance outcomes of our acquisition institutions from a variety of perspectives: DoD-wide, by commodity type, contract- and program-level, military department, and contractors. This chapter builds on the results from prior annual reports, updating some analysis and providing new results using different datasets. To a large extent, this chapter presents an ongoing view of performance and trends.
Chapter 3 discusses new analysis on broader factors that influence acquisition outcomes. We start with how broad acquisition reforms and the funding climate affect program cost growth. We follow with analysis that identifies the major correlates of cost growth in Operating and Support (O&S) cost estimates while programs are in acquisition. We then provide a short progress report on the implementation of our affordability process, followed by preliminary analysis of the stability of program requirements. Following this, we provide analyses on how many units we procure relative to original plans, an update of program cancellation and sunk costs, and the frequency of new major program starts. Finally, the chapter closes with summary analysis and highlights of issues, successes, and suggestions from our program managers and program executive officers.
Chapter 4 provides selected measures of the inputs to the defense system and its internal processes, including acquisition workforce improvements and incentives, contractor bid-protest rates and outputs, our performance relative to competition and small-business goals, and trends in improving the efficiency and backlog of contractor audits.
Appendix A provides a concise overview of DoD’s Better Buying Power strategic effort to improve defense acquisition efficiency and effectiveness.
Appendices B–E provide details on the statistical analyses and methods employed in selected studies.
Appendix F–G defines program and general acronyms used in the report.
Appendices H–I lists the figures, tables, and references in the report.

viii
Performance of the Defense Acquisition System, 2016
(This page was left blank intentionally)
ix
Performance of the Defense Acquisition System, 2016
Contents
Foreword ................................................................................................................................ iii
Principles for Improving Defense Acquisition .......................................................................... v
Organization of the Report ..................................................................................................... vii
Performance Highlights ......................................................................................................... xiii
Prior Annual Reports in the Series .................................................................................................. xiii
Actionable Insights ......................................................................................................................... xv Myth Busters ...................................................................................................................................................... xv Insights for Current and Future Leadership ..................................................................................................... xvii Program-Level Insights .................................................................................................................................... xviii
Actions Since the Last Report .......................................................................................................... xx Major Program Actions by the DAE ................................................................................................................... xx Institutional and Policy Changes ....................................................................................................................... xxi
Funding Growth and DAEs ........................................................................................................... xxiii
Cost-Related Improvements ........................................................................................................ xxvi
Schedule-Related Performance ................................................................................................... xxxv
Improvements in Institutional Inputs ......................................................................................... xxxix
Where Improvement Is Needed ...................................................................................................... xl
Other Observations ...................................................................................................................... xliii
Acknowledgments ................................................................................................................ xlix
1. The Acquisition Landscape and Performance Measures ................................................... 1
The Defense Acquisition System ...................................................................................................... 1 How Internal Functions and Processes Affect Performance ................................................................................ 1
Phases of Acquisition ....................................................................................................................... 2
Follow the Money: Analysis of Spending .......................................................................................... 3 Spending by Comptroller Budget Accounts ......................................................................................................... 3 Contractual Spending by Product Service Code Portfolios .................................................................................. 6
On Measuring Performance ............................................................................................................. 8 Scope of Outcomes: Programs or Their Constituent Contracts ........................................................................... 8 Avoiding Maturity Bias in Testing for Recent Improvements .............................................................................. 9 Measuring Performance on Contracts ................................................................................................................. 9
2. Acquisition System Outcomes and Trends ..................................................................... 11
Cost-Related Funding Growth and Defense Acquisition Executives ................................................ 12
Operational Performance of Acquired Systems .............................................................................. 15 Operational Testing Results ............................................................................................................................... 15 Trends in Operational Testing of Effectiveness and Suitability .......................................................................... 16 Operational Testing of Effectiveness and Suitability by Commodity ................................................................. 18 Correlations Between Summary Test Ratings .................................................................................................... 20 Correlations Between Summary Test Ratings and Subordinate Abilities .......................................................... 21
x
Performance of the Defense Acquisition System, 2016
Cost Performance: Overall ............................................................................................................. 22 Nunn-McCurdy Program Breaches..................................................................................................................... 22 MAIS and Business Systems ............................................................................................................................... 30
Cost Performance: Development ................................................................................................... 35 Planned Program Funding Growth: Development ............................................................................................. 35
Cycle Times and Schedule Growth: Development ........................................................................... 45 MDAP Cycle Time: MS B or C to IOC .................................................................................................................. 45 MDAP Schedule Growth: MS B or C to IOC ........................................................................................................ 46 MAIS Cycle Times ............................................................................................................................................... 49
Cost Performance: Production ....................................................................................................... 50 Program Production Funding Growth (Quantity Adjusted) ............................................................................... 50
Contract-Level Cycle Times and Schedule Growth: Development and Early Production .................. 60 Cycle Time Trends: Development Contracts ...................................................................................................... 60 Schedule Growth Trends .................................................................................................................................... 61
Institutional Analyses: Military Departments ................................................................................. 61 Operational Testing of Effectiveness and Suitability by DoD Component ......................................................... 62 Nunn-McCurdy Cost Breaches ........................................................................................................................... 63 Program Cost Growth and New Statutory Penalties .......................................................................................... 66 Program Cost Growth and Service Acquisition Executives ................................................................................ 69
Institutional Analyses: Prime Contractors ...................................................................................... 75 Superior Supplier Incentive Program ................................................................................................................. 75 DoD Prime Contractor Profitability .................................................................................................................... 80
3. Expanded Analyses ........................................................................................................ 83
Annual Growth of Contract Costs for Major Programs in Development and Early Production ......... 83 Annual Growth of Development and Early Production Contracted Costs ......................................................... 84 Factors Contributing to Annual Growth in Contracted Costs............................................................................. 85 Testing for Underlying Causes ............................................................................................................................ 87
Budget Climate Effects on Total Growth of Contract Costs ............................................................. 92 Total Growth of MDAP Contracted Costs in Development and Early Production Aligned to MS B Date .......... 92 Factors Contributing to Total Growth in Contracted Costs at Program MS B Start ........................................... 93
Sustainment Costs ......................................................................................................................... 95 Correlates of Growth in O&S Cost Estimates During Acquisition ...................................................................... 95
Affordability .................................................................................................................................. 99
Dynamics of Program Performance Requirements: Preliminary Analysis ...................................... 100
Quantity Procured ....................................................................................................................... 104
Program Cancellations and Sunk Costs ......................................................................................... 106
Frequency of New MDAP Starts ................................................................................................... 109
Program Manager Annual Assessments ....................................................................................... 110
Program Executive Officer Assessments ....................................................................................... 114 Balance in Acquisition ...................................................................................................................................... 114 Acquisition and the Larger Defense Mission .................................................................................................... 114 Managing Risks During Execution .................................................................................................................... 115 Challenge and Inform Requirement Decisions ................................................................................................. 115 Workforce Levels.............................................................................................................................................. 116
xi
Performance of the Defense Acquisition System, 2016
Workforce Learning and Culture ...................................................................................................................... 117 Acquisition Strategy ......................................................................................................................................... 117 Processes and Impediments ............................................................................................................................ 118
4. Input and Process Measures ........................................................................................ 119
Defense Acquisition Workforce .................................................................................................... 119 Improving the Workforce ................................................................................................................................. 119 Performance Incentives ................................................................................................................................... 124
Bid Protests on DoD Source Selections ......................................................................................... 125 Bid Protest Rates and Outcomes by Company ................................................................................................. 128
Rates of Competitive Contracting Across the DoD for Goods and Services .................................... 135
Small-Business Participation ........................................................................................................ 135
Auditing Responsiveness and Backlog Reduction ......................................................................... 137
A. Overview of Better Buying Power ................................................................................... 139
Guiding Principles of Better Buying Power ................................................................................... 139
B. Analytic Details: Annual Growth of Contract Costs and Schedule for Major Programs in Development and Early Production ..................................................................................... 143
Model of Annual Growth of Contract Costs ..................................................................................................... 144 Model of Annual Contract Schedule Growth ................................................................................................... 148
C. Analytic Details: Total Growth of MDAP Contract Costs Aligned to Milestone B .............. 151 Model of Total Growth of Contract Costs Aligned to MDAP MS B Date .......................................................... 152
D. Analytic Details: Correlates of O&S Cost Estimates .......................................................... 155 Defense-Wide .................................................................................................................................................. 155
E. Further Statistical Analysis Details ................................................................................... 157 Supporting Sample Analysis for Regressions ................................................................................................... 157 Single Variable Analysis Tests .......................................................................................................................... 157 Interpreting Box-and-Whisker Diagrams and Percentile Plots ........................................................................ 157
F. Program Name Acronyms ................................................................................................ 159
G. Abbreviations .................................................................................................................. 163
H. Indices ............................................................................................................................. 165
Index of Figures ........................................................................................................................... 165
Index of Tables ............................................................................................................................ 168
I. References ........................................................................................................................ 169

xii
Performance of the Defense Acquisition System, 2016
(This page was left blank intentionally)
xiii
Performance of the Defense Acquisition System, 2016
PERFORMANCE HIGHLIGHTS
A key part of improving a system is objectively measuring its performance and the effects of policies, processes, and inputs on the outcomes of the system. Without this, we cannot tell where we have problems, what is working (or not), and whether management changes are making things better (or worse). In the case of defense acquisition, the primary outcome is the value of operational capabilities delivered in time for our warfighters to address threats. Unfortunately, it is very difficult to measure the final operational performance and value of our systems across systems and commodities. Our reports can objectively measure and thus focus on the cost, schedule, and technical performance of our acquisitions—aggregated to look for statistically significant trends together with correlates, institutional differences, and theory to inform ways to improve future outcomes. Each performance measure has its strengths and weaknesses, so we use multiple measures (e.g., at both the program and contract level) and subsequent analysis to see if the answers point in the same direction. We add experience and theoretical insights to guide our conclusions.
This is the fourth annual report on the Performance of the Defense Acquisition System, using quantitative analysis of broad data to measure institutional performance. This annual report series is a central part of Better Buying Power (BBP). It continues to reflect results in defense acquisition performance from ongoing DoD compliance with the Improve Acquisition Act of 2010 and the earlier Weapon Systems Acquisition Reform Act of 2009. Although similarly motivated, our efforts go beyond the specifics of those laws to seek additional insights for improving the defense acquisition system’s performance. This study also fulfills ongoing Office of Management and Budget (OMB) requests for evidence-based analytic studies on acquisition performance. It is encouraging to see evidence of performance improvement over the last few years. However, these results are not a reason to pause in our efforts. They should motivate us to press ahead even more vigorously.
PRIOR ANNUAL REPORTS IN THE SERIES
The first report by the Under Secretary of Defense (USD) for Acquisition, Technology, and Logistics (USD(AT&L), 2013b)1 analyzed recent and historical data to establish performance references and to begin looking for evidence of what factors affect cost, schedule, and technical performance. For example, we found that undefinitized contract actions (UCAs) usually can be employed in early procurement without incurring cost growth, but UCAs correlate historically with cost and schedule growth on development contracts. That first report also established measures of cost growth at both the program and contract levels that avoid confounding issues
1 Throughout this report we follow APA and Chicago style guidelines wherein multiple documents in the same year by the same author are differentiated by adding sequential letters (a, b, c, etc.) after the year in order of publication.
xiv
Performance of the Defense Acquisition System, 2016
such as quantity effects, reporting these measures across our major programs and their contracts. We realized that years will be needed to see the full results of our improvement initiatives (our major programs last many years and new policies tend to affect programs incrementally). The journey toward data-driven policies started with our original report and continues here.
The second report (USD(AT&L), 2014a) built on the first, adding another year of data to the series of cost, schedule, and technical performance measures while reporting insights from new policy analysis. Some signs of improvements were seen—but not everywhere. Outliers required further analysis given their distorting effects on the portfolio in certain metrics and on the overall perceptions about the defense acquisition system when viewed as exemplars. Expanded analysis of the correlation of contract type on cost and schedule outcomes found that the prevalent debate on whether “cost-reimbursement” or “fixed-price” contracts are best at controlling prices is a red herring. The real issue is how effective the incentives are for each contract type based on the situation at hand. Also, firm-fixed-price contracting alone may not result in fixed prices in the end because some fixed-price contract deliverables are structured as narrow requirements or increments so that the Government still has all the true risks and must pay for changes. We found that incentive contracts (cost-plus-incentive-fee and fixed-price-incentive) control cost, price, and schedule as well as, or better than, other types—and with generally lower, yet fair, margins. Each situation depends on risk, cost knowledge, uncertainty, and a number of other factors—so we should avoid dictating a single approach.
Last year’s annual report built on and extended the series of data from the first two reports. We saw more statistically significant trends and differences, so we have greater confidence in the positive changes we are seeing. Cost growth on our major programs generally is at, or better than, historical levels, but outliers remain a problem. Median biennial change in total needed program funding has been near zero since 2009 (although past growth over baselines remains). Contractors on Major Defense Acquisition Program (MDAP) contracts are doing a better job of meeting cost targets. The number of MDAP contracts started since 2009 with price reductions has increased significantly compared to earlier contracts. Also, preliminary analysis showed that the percentages of government execution costs (direct and overhead) are at or below defense industry overhead levels, and they are not unreasonable in absolute percentages. Additionally, work from the Institute for Defense Analyses (and confirmed by the related analysis below) provided an important cautionary tale that high acquisition cost growth for programs and tight budgetary environments (like the one at present) during program baselining are very strongly correlated.
Below are highlights of this fourth report along with page references to more detailed discussion later in the report. As with the prior annual reports, many analyses are beginnings and indicate areas that need further work, but in others we now see similar indicators in multiple measures, increasing our confidence in the results.
While we use somewhat different metrics, our program-level results reflect what the Government Accountability Office (GAO) has been reporting recently (see GAO, 2014, 2015a)—that we are seeing significant, measurable improvements in cost control for recent years.
xv
Performance of the Defense Acquisition System, 2016
ACTIONABLE INSIGHTS
The highlights below and detailed data in this report provide useful insights for stakeholders and practitioners.
Myth Busters
Myth: All defense acquisition programs have large cost growth. Reality: Cost control has improved significantly. Not only is cost growth significantly lower than historical levels, but recent efforts have dramatically lowered cost growth further. Multiple measures summarized below show statistically lower cost growth on major programs: number of Nunn-McCurdy breaches; Section 828 “overruns” on programs since 2009; proportion of programs needing less funding than originally planned; biennial cost growth in development and production; total production cost growth; and annual growth of contracted costs. Historical analyses also show that cost controls are better than in the decades before Goldwater-Nichols (USD(AT&L), 2014a, pp. 47–49). We do still have legacy problems on older programs. Total research, development, test and evaluation (RDT&E) cost growth is still rising due to older programs. We need to do better through continued evolutionary improvements, but recent improvements focused on acquisition fundamentals and an empowered government workforce have been more successful than laissez-faire acquisition reforms of the mid-1990s or prior to the passage of Goldwater-Nichols and the Packard Commission reforms of the late 1980s.
Myth: Defense programs usually cut quantity (e.g., to pay for cost growth). Reality: Most major programs deliver the original baseline quantity or more. We don’t as a rule cut program quantity. As discussed below and on p. 104, most MDAPs actually produce the quantities we originally planned at Milestone (MS) B. This runs counter to the impression given from just focusing on certain high-visibility programs such as the F-22 program or the DDG 1000 Zumwalt-class destroyer that incurred major cuts in quantity.
Myth: Swings in O&S cost estimates indicate poor program management. Reality: The dynamics of cost estimates indicate that O&S costs appear to be heavily driven by external inflation factors. Analysis shows that the recent dynamics of program O&S costs estimated during acquisition correlate with the dynamics of labor, health-care, fuel, and maintenance costs. While this aligns with intuition, it also indicates that O&S cost increases involve both factors that the acquisition system cannot control (e.g., wages, health-care costs, and fuel costs) as well as some that can, in part be controlled (e.g., system reliability, fuel efficiency, and ease of maintenance). Operational tempo also affects O&S costs through many of these factors (e.g., the amount of fuel consumed and maintenance costs), and changes in forecasted tempo will affect O&S costs independent of both inflation and weapon system performance. Thus, while the acquisition system needs continued attention to the levers it can control (with full knowledge that their effects often will not be seen for decades), stakeholders need to recognize the strong influence of other factors on O&S costs. (See discussion starting on p. 95.)
xvi
Performance of the Defense Acquisition System, 2016
Myth: Program requirements are unstable. Reality: High-level requirements seldom change on major programs, and very few programs have many changes. About 85 percent of MDAPs showed no changes that we could trace from the original MS B baseline to the latest Selected Acquisition Report (SAR) report for the program. Moreover, of the few programs with any traced changes, most had only one. This is commensurate with experts’ experience and GAO’s findings (2015b), which also indicate that changes are largely made at the engineering level as development seeks ways to meet high-level requirements. Changes, however, are not always bad. Some changes reflect prudent requirement reductions to unforeseen high costs of options uncovered in development or new affordability pressures. Other changes address new threats that otherwise would render an unmodified system obsolete upon delivery. Thus, flexibility, prudence, and continued tradeoffs, together with ruthless management attention to cost implications, are more important in the end than simple edicts at the extremes of change control. (See discussion starting on p. 100.)
Myth: The DoD cannot acquire systems quickly. Reality: DoD acquisition can be timely and responsive. Despite criticism that defense acquisition is too slow, the highlights below show that schedule growth is lower than cost growth in development, and cycle times for major programs have increased only from about 5 years to 7 years since the 1980s with dramatic increases in weapon system complexity.2 This is not to say that internal processes cannot be improved, so efforts continue to institutionalize streamlining and tailoring.
Myth: Increased bid protests reflect a deteriorating ability to conduct source selections. Reality: Contracting processes are generally fair, rigorous, and objective—and protests are rarely sustained. Despite concerns arising from increased numbers of protested solicitations and contract awards, GAO data indicate that protests and sustainments remain very low both in number and as a percentage of solicitations and awards. Protests to GAO have averaged about 2.5 percent of solicitations and about 0.25 percent of contracts. The sustainment rate remains very low—about 30 per year, or 2 percent of the approximately 1,300 annual protests. (See discussion starting on p. 125.)
Myth: The DoD is pursuing cost savings at the expense of contractor profits. Reality: Major defense companies remain profitable despite the DoD’s increased success at tying profits to performance. Further data build on prior reports to show that the DoD’s efforts to improve cost performance are not a war on profits but a reasonable alignment of industry and government goals. (See Figure H-21 on p. xlviii below.)
Myth: Defense acquisition is broken. Reality: The acquisition system for decades has given the United States the most capable military in the world and has been improving both in the past and more recently. While there is no absolute definition for sufficiency, the data in these annual performance reports indicate
2 Also, unpublished analysis indicates that the DoD has successful approaches for rapidly acquiring urgently needed capabilities that leverage mature technology. These approaches generally are limited by available technology restrictions on reprogramming appropriated funds.
xvii
Performance of the Defense Acquisition System, 2016
that the system functions reasonably well compared to the past and continues improving. We cannot look at a single metric to measure the performance of the defense acquisition system, and many metrics work at odds with each other. For example, the so-called “iron triangle” of cost, schedule, and technical performance has long shown that emphasizing one or two dimensions often is done at the expense of the others. While cost (followed by schedule) metrics are the easiest to quantify, data for all three dimensions indicate stability and, in many cases, significant improvement.
Insights for Current and Future Leadership
First, let us discuss insights that primarily affect both DoD-wide and DoD Component3 leadership.
The lack of programs in our “new product pipeline” may be putting technological superiority at risk. Both RDT&E budget levels—particularly Engineering and Manufacturing Development budgets—and program new-start data indicate a slowdown since the mid-2000s. Total budget reductions limit what we can do, but it is important to step back and watch these macro trends in the context of increasing threats (technologically, pace, and diversity). The DoD’s recent response has been to add a number of early stage experimental prototyping efforts. This is an important and necessary step but does not deliver capability or designs that are ready for production and fielding in any substantial quantity.
Be particularly careful to ensure realistic program baselines—especially when budgets are tight. Further analysis published in this report reinforces prior concerns that excessive optimism or risk tolerance may be particularly acute when programs are initiated during tight budget periods (such as at present), leading to the higher cost growth seen on these programs. We should explicitly recognize this and avoid setting up our successors for large overruns.4 For example, acquisition and DoD Component leadership should ensure adequate risk reduction before MS B and apply healthy skepticism about novel approaches that are marketed as offering substantial cost reductions (i.e., if it sounds too good to be true, it probably is. In a tight-budget climate, industry is motivated to be optimistic and take greater risk in order to win new business. DoD programmers also are motivated to put pressure on acquisition professionals to lower cost estimates and funding requirements. Because of these tendencies, the Defense Acquisition Executive (DAE) is focusing particularly on cost and schedule realism for Acquisition Category (ACAT) I and Major Automated Information Systems (MAIS) programs at milestone decision reviews. (See detailed analysis and discussion starting on p. 92.)
3 For purposes of this report, DoD Components include the Office of the Secretary of Defense (OSD), military departments, and all defense agencies, DoD field activities, and other entities within the DoD that are authorized to award or administer contracts, grants, cooperative agreements, and other transactions.
4 See, for example, the bidding and acceptance on the Space-Based Infrared Systems-High (SBIRS-High) program (Thompson, 2012), and the problem of overly optimistic cost estimates at MS B for the F-35 (DPARCA, 2010f).
xviii
Performance of the Defense Acquisition System, 2016
Be prepared to incur statutory overrun penalties. As shown in Table H-2 (p. xxxiv below), the Army and Navy are a few billion dollars away from incurring a Section 828 penalty for Program Acquisition Unit Cost (PAUC) cost growth on MDAPs that started since 2009. Growth on individual programs may be warranted in order to address threat or critical engineering issues, and the prospect of penalties should not deter sound decisions on program content or requirements. The penalties were created to encourage better program planning, but the impact, which will come years after program initiation, is more likely to affect decisions made after cost growth is realized. Penalty avoidance, like Nunn McCurdy avoidance, should not be the primary decision criterion once cost growth has been realized; the priority should be getting critically needed capability to the warfighter at the best cost possible.
We need a metric for the portion of O&S costs related solely to weapon system design and performance. Analysis shows that many of the factors that correlate with growth of O&S cost estimates reported during acquisition are outside the control of the acquisition system (i.e., wages, health-care costs, and fuel prices). Current O&S metrics do not separate acquisition program effects from these external effects. However, a new metric could be developed to measure these internal program effects by holding the external variables constant from MS B forward (solely for purposes of comparison) so that the effects solely from the acquisition system are revealed.
Listen to feedback from the DoD’s professional acquisition leadership. The annual program manager (PM) assessments sent to the DAE provide useful perspective on the realities of conditions where acquisition actually takes place—in program offices. Our PMs tended to be positive about strategy, system performance, program cost, and contracting (although the latter was raised often as both a success and issue). Conversely, funding difficulties, risks, and cyber issues top the list of concerns. Some topics have high levels of both success and problems—especially schedule performance, contractor performance, and the implications of changing technology. (See p. 110.)
Just as important, our program executive officers (PEOs) raised a number of system issues across their portfolios while making insightful suggestions on how we can improve the defense acquisition system (see p. 114). For example, the PEOs note that system improvements (e.g., savings) come at a cost—namely, we need sufficient workforce to think through and execute more efficient acquisition approaches. Blind “headquarter” or other cuts in government and contractor workforce can be extremely counterproductive.
Program-Level Insights
Focusing on acquisition fundamentals and cost control makes a difference. Proactive management and creative thinking contribute significantly and measurably to cost control. Multiple measures and analyses in this and prior annual reports (e.g., see Figure H-4 on p. xxviii) show that fundamentals work in controlling costs. We need to keep up the good work. These savings are dependent on workforce expertise, sufficiency, empowerment, and the degree to which we can illustrate and prove these linkages will go a long way toward ensuring continued success. The institution of “should cost” management and its consistent emphasis over the last
xix
Performance of the Defense Acquisition System, 2016
6 years by the acquisition chain-of-command been a success and should be a permanent feature of the DoD’s acquisition culture. Staying within budget is not the definition of success.
Don’t neglect suitability (reliability, maintainability, etc.) in pursuing system performance. Operational tests show that major programs are often effective when they tested as operationally suitable, but the converse is not true (see p. 20). This correlation by itself does not prove causality, but it reinforces the logic that the so-called “-illities” (e.g., interoperability, availability, maintainability, reliability) are important to achieving the mission. For example, well-engineered systems that address suitability factors are probably also better positioned to be effective. Also, no matter its features, a weapon system may not serve its function if it is unreliable and unavailable to the warfighter.
Don’t neglect O&S cost implications in early system requirements and design. Analysis shows that many of the factors that correlate with growth of SAR O&S cost estimates (i.e., wages, health-care costs, and fuel prices) are outside of program management control. While PMs cannot control these external factors, they can affect fuel efficiency and maintenance costs (e.g., system reliability, ease of maintenance, and repair automation). Usually, these aspects must be addressed very early in the system’s design, so don’t neglect them in early program planning and management. That is why the new affordability process sets goals and caps on life-cycle costs early in the program’s life (e.g., at the point of the Materiel Development Decision (MDD) and MS A, when bigger design changes can be made). Don’t neglect them just because you cannot control the external factors and uncertainties remain.
Don’t let up on ensuring rigorous source selections that align government value structures, source-selection rules, and industry’s goal of winning. While GAO data on source selections provide encouraging news that our practices generally are fair and rigorous, we should not let up on efforts to improve source selections. The basic integrity and fairness of our processes are fundamental to maintaining public confidence in how taxpayer resources are spent.
Use fixed-price contracting judiciously in development. In our updated guidance on contract incentives (Director of Defense Procurement and Acquisition Policy [DDPAP], 2016b), data from prior annual reports (USD(AT&L), 2014a), and experience (Kendall, 2013) indicate using fixed-price contracts in development can be very risky and counterproductive, while incentive contracts can yield good cost control at lower risk and lower prices. All of the following five criteria should generally be met before using fixed-price contracts in development:
1) Requirements are stable 2) Technologies are mature 3) The contractor is experienced 4) The contractor can absorb overruns 5) The contractor has a business case for absorbing any overruns that occur
xx
Performance of the Defense Acquisition System, 2016
ACTIONS SINCE THE LAST REPORT
This annual report measures institutional performance trends using a variety of metrics. This year we also provide a summary of major actions and events that have occurred since the last report.
Major Program Actions by the DAE
Delegation. Milestone Decision Authority was delegated from the DAE to the respective DoD Component (usually a military department) on 28 ACAT I programs since July 2015.5
CH-53K. Advanced procurement to support the first CH-53K heavy-lift helicopter’s low-rate initial production (LRIP) lot was approved in April 2016 to position the program for MS C without further impacting projected Initial Operational Capability (IOC) date. Should MS C ultimately not be approved, these parts and material would be used for other rotary wing aircraft within the current Navy inventory.
DEAMS. Limited Deployment was granted to enable the Air Force to improve over initial operational test results prior to returning for a Full-Deployment Decision of this accounting and management system. The Air Force will also conduct a critical change review to ensure that: the new cost and schedule estimates for the program include plans to reduce defects consistent with a program of this maturity; the Oracle R12 upgrade is completed effectively; and future deployments are tied to performance gains verified through demonstrated software stability and logically sequenced test events.
EPAWSS. The high reliance on off-the-shelf components allowed the F-15 Eagle Passive/Active Warning and Survivability System (EPAWSS) acquisition to be highly tailored, have a very short Technology Maturation and Risk Reduction (TMRR) phase, and have Milestone Decision Authority (MDA) delegation to the Air Force.
F-35. We continue to negotiate better prices aligned with actual costs and employ strong contract performance incentives on LRIP lots to drive costs down, improve performance, and minimize concurrency problems. The Air Force declared IOC in August 2016 for the conventional F-35A variant fighter jet.
FAB-T. The Family of Advanced Beyond Line of Sight Terminals (FAB-T) Command Post Terminal (CPT) subprogram passed MS C in October 2015 to support Presidential and National Voice Conferencing operational transition from existing aging assets and maintain the earliest possible FAB-T CPT IOC schedule.
5 Delegations from July 2015 through September 2016:
Army: DCGS-A Inc 1, GCSS-A, H-47 Block II, IFPC Inc 2-I, JLTV, LMP Inc 2, PAC-3 MSE, PIM, IPPS-A, and WIN-T Inc 2
Navy: AAG, CANES, LHA-6, JPALS, P-8A, MQ-8, MUOS, SSN 774, and T-AO 205 Air Force: WAS, AEHF, F-15 EPAWSS, ICBM Fuze Modernization, MOP GBU-57A/B, MPS Inc 5,
Space Fence Inc 1, and CRH Defense Health Agency: TMIP-J
(program abbreviations are defined in Appendix F starting on p. 169).
xxi
Performance of the Defense Acquisition System, 2016
GBSD. The Ground Based Strategic Deterrent (GBSD) program was approved in August 2016 to enter TMRR, but significant cost and industrial-base uncertainties remain given limited historical data and the long period since the last Intercontinental Ballistic Missile (ICBM) development program. TMRR will produce more current and directly applicable information to support higher confidence cost estimates and inform baselines.
GPS OCX. The DAE, Secretary of the Air Force, acquisition chain of command, and prime contractor’s chief executive officer together are conducting quarterly “deep dive” reviews as a result of continued cost increases and schedule slips. The Global Positioning System (GPS) next-generation Operational Control System (OCX) program also breached its critical Nunn-McCurdy threshold in June 2016 (see p. 26).
JAGM. Given the strong potential for future international sales, the Joint Air-to-Ground Missile (JAGM) program is implementing Defense Exportability Features in Engineering, Manufacturing and Development (EMD), and the Army plans to obtain the appropriate Technology Security/Foreign Disclosure approval authorities prior to MS C.
KC-46A. MS C and approval for LRIP were authorized in August 2016 at a higher quantity to permit an orderly increase in the production rate of this military aerial refueling and transport aircraft upon completion of operational testing, which was delayed to correct design and manufacturing issues and to complete performance verification and hardware certification. The contractor, Boeing, has now recorded reach-forward losses totaling about $1.7 billion on the EMD phase contract (Boeing, 2016).
RMS. The Remote Minehunting System (RMS) was canceled in March 2016 due to unsatisfactory progress on system reliability and availability (see p. 26).
Institutional and Policy Changes
Acquisition Workforce Development. The DoD continues to increase the capabilities of our workforce, leveraging legislated authorities and funding such as the Defense Acquisition Workforce Development Fund (DAWDF) as well as the Force of the Future initiatives (see p. 119).
M&As. The Department of Justice clarified DoD authorities on mergers and acquisitions (M&As), resolving concerns that we had insufficient authorities to address our wider concerns regarding about the ongoing consolidation trend in the defense industry.
Innovation and Technical Excellence. The DoD essentially has completed the initial implementation of the BBP 3.0 set of acquisition policy initiatives and continues monthly follow-up through the Business Senior Integration Group.
Commercial Outreach. The DoD renewed outreach to the commercial sector through the Defense Innovation Unit, Experimental (DIUx).
Independent Research and Development (IR&D). In February 2016, the DoD proposed a Defense Federal Acquisition Regulation Supplement requirement that an appropriate DoD official be notified of new IR&D efforts in order to ensure that these investments are of potential interest to the DoD. Then results would have to be reported to facilitate utilization. We also issued in February an advanced notice of proposed rulemaking that would preclude misusing future IR&D expenditures to reduce evaluated bid prices in competitive source selections.
xxii
Performance of the Defense Acquisition System, 2016
Intelligence Support to Acquisition. To better address emerging threats, we are improving the latency, dissemination, and relevance of intelligence to inform acquisition planning and system updates.
Contracted Services. A new DoD Instruction (DoDI) 5000.74 was issued in January 2016 to establish a management structure for the acquisition of contracted services while authorizing DoD Component decision authorities to tailor the procedures to best achieve cost, schedule, and performance objectives (USD(AT&L), 2016).
Affordability. We continue to apply and enforce affordability constraints on MDAPs and smaller programs, driving requirements tradeoff and management decisions during execution (see p. 99).
Independent Technical Risk Assessments. We released a new Risk, Issue, and Opportunity Management Guide in June 2015 to help programs better identify risks, quantify their potential effects, and develop strategies to address and mitigate those risks.
Cybersecurity. We are ensuring that new cybersecurity regulations are applied to DoD contracts to better secure unclassified controlled technical information resident in the defense industry.
Source-Selection Procedures. A common set of principles and procedures for effectively conducting competitively negotiated source selections was updated in March 2016, including new guidance on Value-Adjusted Total Evaluated Price (VATEP) tradeoffs and appropriate uses of Lowest-Price Technically Acceptable (LPTA).
Incentive and Other Contract Types. A major guidebook update (DDPAP, 2016b) provides advice on the selection and negotiation of the most appropriate and effective contract type and incentives for a given acquisition situation, emphasizing how to apply judgment and tailor our contracting to improve outcomes and contractor performance.
O&S Cost Management. Published in February 2016, a new guidebook for PMs and product-support managers provides tools and best practices for O&S cost analyses to inform early life-cycle decisions, effect reliability trades, and identify Should-Cost initiatives having the greatest effect on future O&S costs.
Performance-Based Logistics. A March 2016 update of our Performance-Based Logistics (PBL) Guidebook reviews common myths about PBLs, adds new guidance regarding intellectual property issues, and continues to provide best practices, selection criteria for when PBLs are appropriate, and practical examples to maximize successful outcomes (Assistant Secretary of Defense for Logistics and Materiel Readiness, 2016).
PM/PEO Assessments. To better understand performance issues and successes in the acquisition system, we expanded the annual PM assessments to include PEO assessments sent directly to the DAE and Service Acquisition Executives (SAEs) (see pp. 110 and 114).
xxiii
Performance of the Defense Acquisition System, 2016
FUNDING GROWTH AND DAES
Policy, sound planning, and execution decisions by DoD executives should bear on the effectiveness of the overall acquisition system. This is particularly true for the program structure and associated baselines set at MS B against which future cost performance is measured. Therefore, in our annual reports we track the performance of programs started under different acquisition executives to help reinforce accountability and provide an initial look for possible trends for further analysis.
Figure H-1 and Figure H-2 show growth in MDAP6 Planned Total Funding in development and procurement (respectively) for active7 and completed MDAPs against original baselines as reported to Congress in the SARs. Note that SAR funding data reflect current PM estimates of total needs by the end of the program for the current program configuration, including past actual funding, the current budget request, planned funding in the Future Years Defense Program (FYDP), and planned funding beyond the FYDP to the end of the program. Growth is measured against the baseline set at the original MS B and can be positive or negative.
These figures also show who served as the DAE at the time of the MDAP’s MS B approval. Later in the report we show similar charts for the programs started under different SAEs in the three military departments. (See sections starting on pp. 12 and 69).
These charts neither reflect the effectiveness of subsequent oversight or major program changes by later DAEs during execution oversight, nor do they reflect statistical analysis to control for other internal and external variables that could have led to a program’s success or problems. Defense acquisition is complex, and each measure has its strengths and weaknesses, so attributing performance to a single measure is subject to the limitations of that measure. For example, some programs may appear to be performing well in terms of total planned RDT&E funding but may be having problems that are reflected in other measures (e.g., total needed procurement funding; estimated operational costs; or cost growth on one of the program’s major contracts). Thus, a combined examination of available data is important before reaching conclusions. Nevertheless, they are a crude indicator of the effectiveness of the decisions made by these officials. (See detailed discussion starting on p. 12.)
6 MDAPs are DoD acquisition programs that are not highly sensitive (classified) and are either: (a) designated as such by the Secretary of Defense, or (b) estimated to require an eventual total expenditure for RDT&E of more than $480 million (in Fiscal Year [FY] 2014 constant dollars) or an eventual total expenditure for procurement (including all planned increments or spirals) of more than $2.79 billion (in FY 2014 constant dollars)—see 10 U.S.C., Section 2430(a), and USD(AT&L) (2015a, p. 44).
7 In this report, active MDAPs are those that provide SARs and have passed MS B. MDAPs cease providing SARs and are deemed completed after they deliver 90 percent of total U.S. quantity or spend 90 percent of planned expenditures. See 10 U.S.C., Section 2432(g).

xxiv
Performance of the Defense Acquisition System, 2016
Figure H-1. Program Cost-Related Development Performance Baselined in DAE Periods
Cumulative Growth Over Original MS B Baseline of MDAP Planned Total (From Start to Completion)
RDT&E Funding by DAE Tenure Period (CY 1997–2015)
MS B date
NOTE: This shows total RDT&E funding growth independent of procurement funding and quantity changes; it reflects any work-content changes. These are percentage changes after adjusting for inflation from original MS B baseline of actual past and estimated future funding as reported in each program’s latest SAR. Total RDT&E is an insightful measure because it is necessary, regardless of quantity. White bars between DAE shaded regions represent periods with no confirmed executive. Not shown are relatively new programs that have not spent at least 30 percent of their original EMD schedule. Program abbreviations are defined in Appendix F starting on p. 159.
xxv
Performance of the Defense Acquisition System, 2016
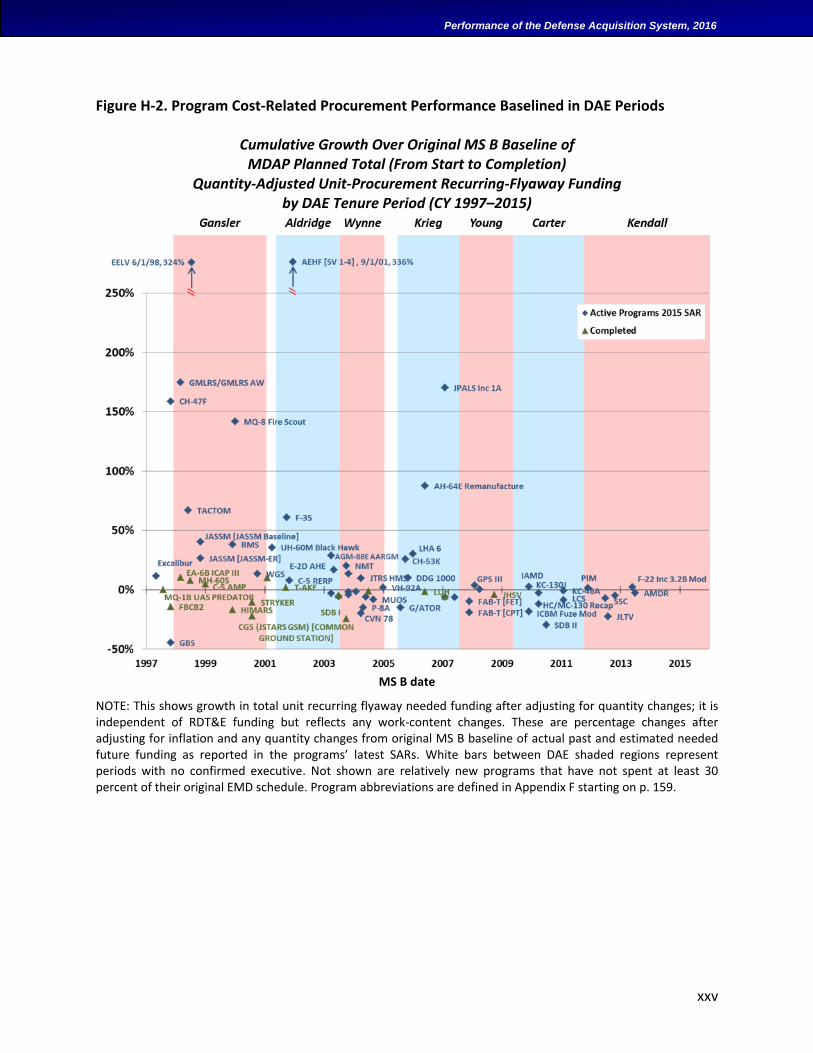
Figure H-2. Program Cost-Related Procurement Performance Baselined in DAE Periods
Cumulative Growth Over Original MS B Baseline of MDAP Planned Total (From Start to Completion)
Quantity-Adjusted Unit-Procurement Recurring-Flyaway Funding by DAE Tenure Period (CY 1997–2015)
MS B date
NOTE: This shows growth in total unit recurring flyaway needed funding after adjusting for quantity changes; it is independent of RDT&E funding but reflects any work-content changes. These are percentage changes after adjusting for inflation and any quantity changes from original MS B baseline of actual past and estimated needed future funding as reported in the programs’ latest SARs. White bars between DAE shaded regions represent periods with no confirmed executive. Not shown are relatively new programs that have not spent at least 30 percent of their original EMD schedule. Program abbreviations are defined in Appendix F starting on p. 159.
xxvi
Performance of the Defense Acquisition System, 2016
COST-RELATED IMPROVEMENTS
Recent data on MDAPs at the program- and contract-level have shown some statistically significant improvement trends in funding, price, and cost control, although complicating factors raise caveats and potential concerns.
More MDAPs are showing program funding reductions in both development and production. Relative to their original MS B baselines, more active MDAPs by proportion are estimated to have total RDT&E and unit-procurement funding reductions (sometimes referred to as “underruns”) as of 2015 than as of 2009—even after we remove relatively new programs that would be unlikely to currently show growth (see Figure H-3). (See detailed discussion starting on pp. 43 and 58). The 2015 numbers are slightly lower than we saw last year in the 2014 data, but they remain significant. These data reflect similar results discussed below where biennial cost growth at the program level and the annual growth of contracted costs for MDAPs both have dropped significantly in recent years.
xxvii
Performance of the Defense Acquisition System, 2016
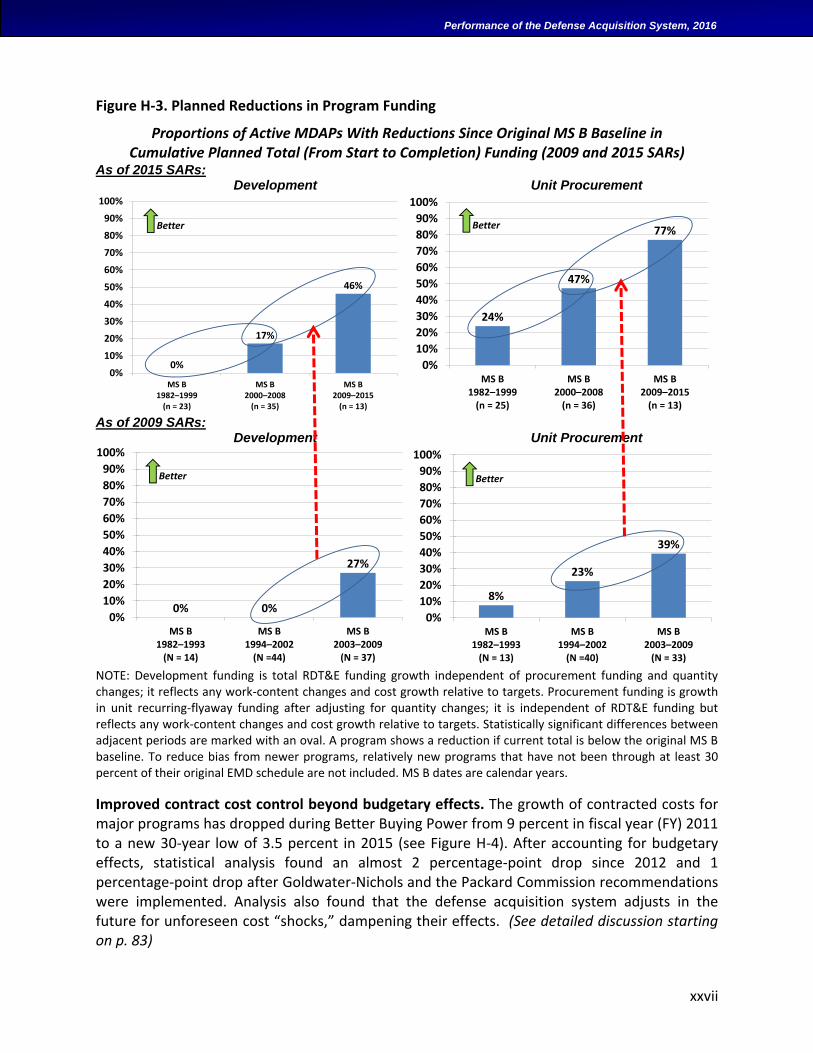
Figure H-3. Planned Reductions in Program Funding
Proportions of Active MDAPs With Reductions Since Original MS B Baseline in Cumulative Planned Total (From Start to Completion) Funding (2009 and 2015 SARs)
As of 2015 SARs: Development Unit Procurement
As of 2009 SARs: Development Unit Procurement
NOTE: Development funding is total RDT&E funding growth independent of procurement funding and quantity changes; it reflects any work-content changes and cost growth relative to targets. Procurement funding is growth in unit recurring-flyaway funding after adjusting for quantity changes; it is independent of RDT&E funding but reflects any work-content changes and cost growth relative to targets. Statistically significant differences between adjacent periods are marked with an oval. A program shows a reduction if current total is below the original MS B baseline. To reduce bias from newer programs, relatively new programs that have not been through at least 30 percent of their original EMD schedule are not included. MS B dates are calendar years.
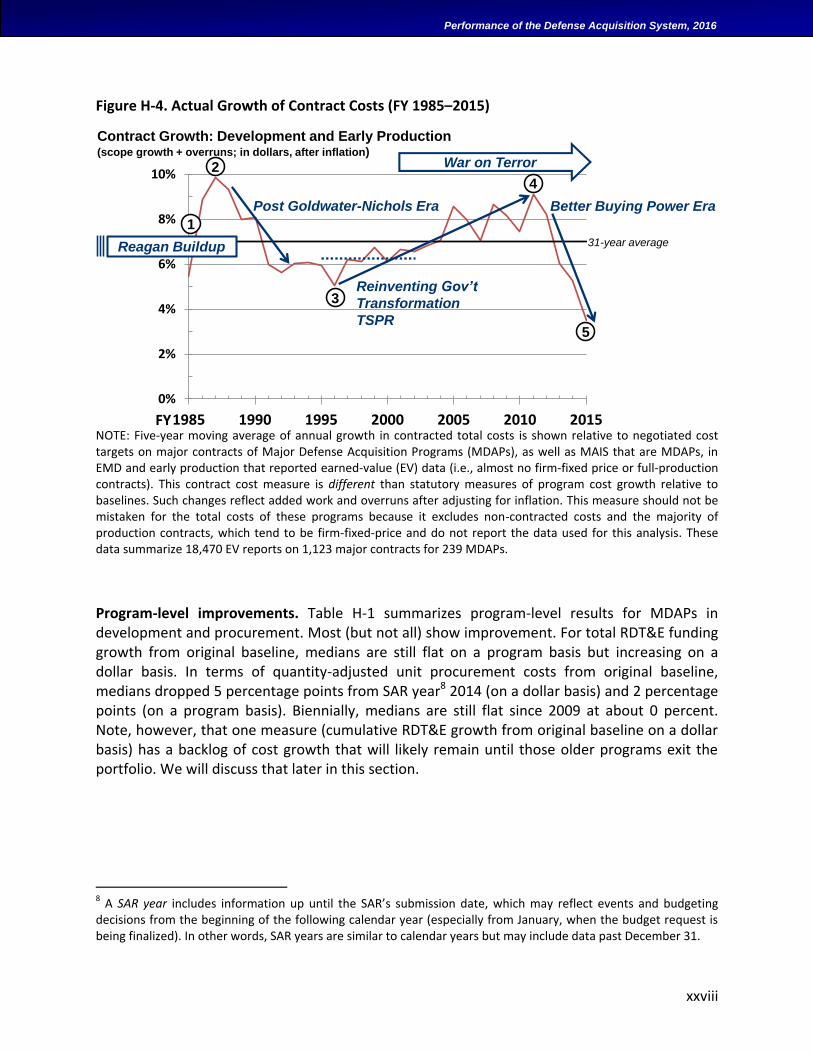
Improved contract cost control beyond budgetary effects. The growth of contracted costs for major programs has dropped during Better Buying Power from 9 percent in fiscal year (FY) 2011 to a new 30-year low of 3.5 percent in 2015 (see Figure H-4). After accounting for budgetary effects, statistical analysis found an almost 2 percentage-point drop since 2012 and 1 percentage-point drop after Goldwater-Nichols and the Packard Commission recommendations were implemented. Analysis also found that the defense acquisition system adjusts in the future for unforeseen cost “shocks,” dampening their effects. (See detailed discussion starting on p. 83)
0%
17%
46%
0%
10%
20%
30%
40%
50%
60%
70%
80%
90%
100%
MS B1982–1999
(n = 23)
MS B2000–2008
(n = 35)
MS B2009–2015
(n = 13)
Better
24%
47%
77%
0%
10%
20%
30%
40%
50%
60%
70%
80%
90%
100%
MS B1982–1999
(n = 25)
MS B2000–2008
(n = 36)
MS B2009–2015
(n = 13)
Better
0% 0%
27%
0%
10%
20%
30%
40%
50%
60%
70%
80%
90%
100%
MS B1982–1993
(N = 14)
MS B1994–2002
(N =44)
MS B2003–2009
(N = 37)
Better
8%
23%
39%
0%
10%
20%
30%
40%
50%
60%
70%
80%
90%
100%
MS B1982–1993
(N = 13)
MS B1994–2002
(N =40)
MS B2003–2009
(N = 33)
Better
xxviii
Performance of the Defense Acquisition System, 2016
Figure H-4. Actual Growth of Contract Costs (FY 1985–2015)
NOTE: Five-year moving average of annual growth in contracted total costs is shown relative to negotiated cost targets on major contracts of Major Defense Acquisition Programs (MDAPs), as well as MAIS that are MDAPs, in EMD and early production that reported earned-value (EV) data (i.e., almost no firm-fixed price or full-production contracts). This contract cost measure is different than statutory measures of program cost growth relative to baselines. Such changes reflect added work and overruns after adjusting for inflation. This measure should not be mistaken for the total costs of these programs because it excludes non-contracted costs and the majority of production contracts, which tend to be firm-fixed-price and do not report the data used for this analysis. These data summarize 18,470 EV reports on 1,123 major contracts for 239 MDAPs.
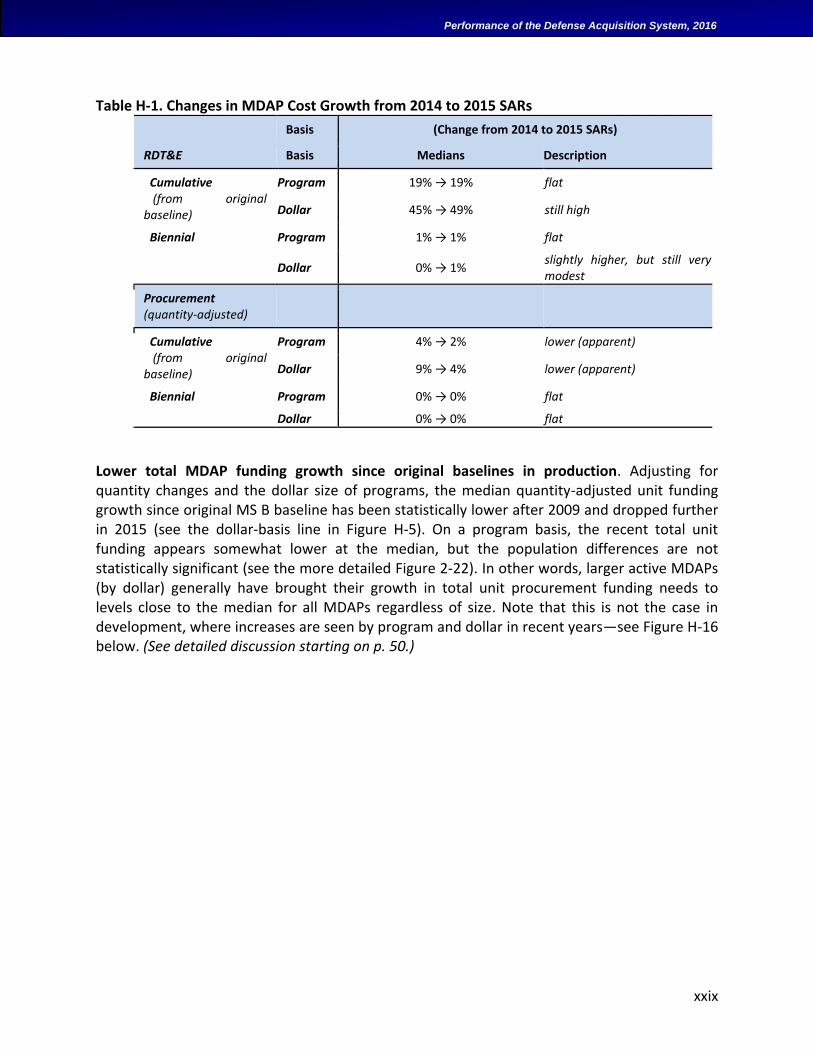
Program-level improvements. Table H-1 summarizes program-level results for MDAPs in development and procurement. Most (but not all) show improvement. For total RDT&E funding growth from original baseline, medians are still flat on a program basis but increasing on a dollar basis. In terms of quantity-adjusted unit procurement costs from original baseline, medians dropped 5 percentage points from SAR year8 2014 (on a dollar basis) and 2 percentage points (on a program basis). Biennially, medians are still flat since 2009 at about 0 percent. Note, however, that one measure (cumulative RDT&E growth from original baseline on a dollar basis) has a backlog of cost growth that will likely remain until those older programs exit the portfolio. We will discuss that later in this section.
8 A SAR year includes information up until the SAR’s submission date, which may reflect events and budgeting decisions from the beginning of the following calendar year (especially from January, when the budget request is being finalized). In other words, SAR years are similar to calendar years but may include data past December 31.
0%
2%
4%
6%
8%
10%
1985 1990 1995 2000 2005 2010 2015FY
5-year Moving Average: MDAP Contract Portfolio Annual Total Cost Growth
5-year Moving Average 31-year average
3
4
5
Post Goldwater-Nichols Era
Reinventing Gov’t
Transformation
TSPR
Better Buying Power Era
2
Reagan Buildup 31-year average
War on Terror
Contract Growth: Development and Early Production(scope growth + overruns; in dollars, after inflation)
1
xxix
Performance of the Defense Acquisition System, 2016
Table H-1. Changes in MDAP Cost Growth from 2014 to 2015 SARs
Basis (Change from 2014 to 2015 SARs)
RDT&E Basis Medians Description
Cumulative (from original baseline)
Program 19% → 19% flat
Dollar 45% → 49% still high
Biennial Program 1% → 1% flat
Dollar 0% → 1% slightly higher, but still very modest
Procurement (quantity-adjusted)
Cumulative (from original baseline)
Program 4% → 2% lower (apparent)
Dollar 9% → 4% lower (apparent)
Biennial Program 0% → 0% flat
Dollar 0% → 0% flat
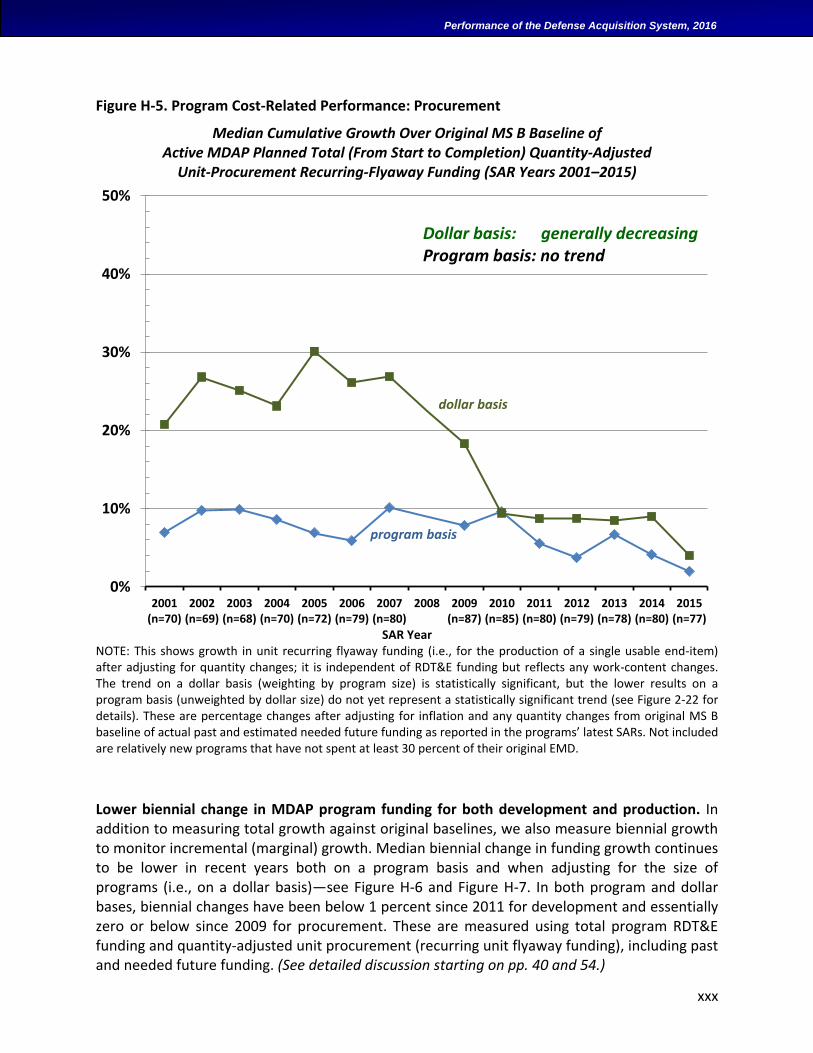
Lower total MDAP funding growth since original baselines in production. Adjusting for quantity changes and the dollar size of programs, the median quantity-adjusted unit funding growth since original MS B baseline has been statistically lower after 2009 and dropped further in 2015 (see the dollar-basis line in Figure H-5). On a program basis, the recent total unit funding appears somewhat lower at the median, but the population differences are not statistically significant (see the more detailed Figure 2-22). In other words, larger active MDAPs (by dollar) generally have brought their growth in total unit procurement funding needs to levels close to the median for all MDAPs regardless of size. Note that this is not the case in development, where increases are seen by program and dollar in recent years—see Figure H-16 below. (See detailed discussion starting on p. 50.)
xxx
Performance of the Defense Acquisition System, 2016
Figure H-5. Program Cost-Related Performance: Procurement
Median Cumulative Growth Over Original MS B Baseline of Active MDAP Planned Total (From Start to Completion) Quantity-Adjusted
Unit-Procurement Recurring-Flyaway Funding (SAR Years 2001–2015)
SAR Year
NOTE: This shows growth in unit recurring flyaway funding (i.e., for the production of a single usable end-item) after adjusting for quantity changes; it is independent of RDT&E funding but reflects any work-content changes. The trend on a dollar basis (weighting by program size) is statistically significant, but the lower results on a program basis (unweighted by dollar size) do not yet represent a statistically significant trend (see Figure 2-22 for details). These are percentage changes after adjusting for inflation and any quantity changes from original MS B baseline of actual past and estimated needed future funding as reported in the programs’ latest SARs. Not included are relatively new programs that have not spent at least 30 percent of their original EMD.
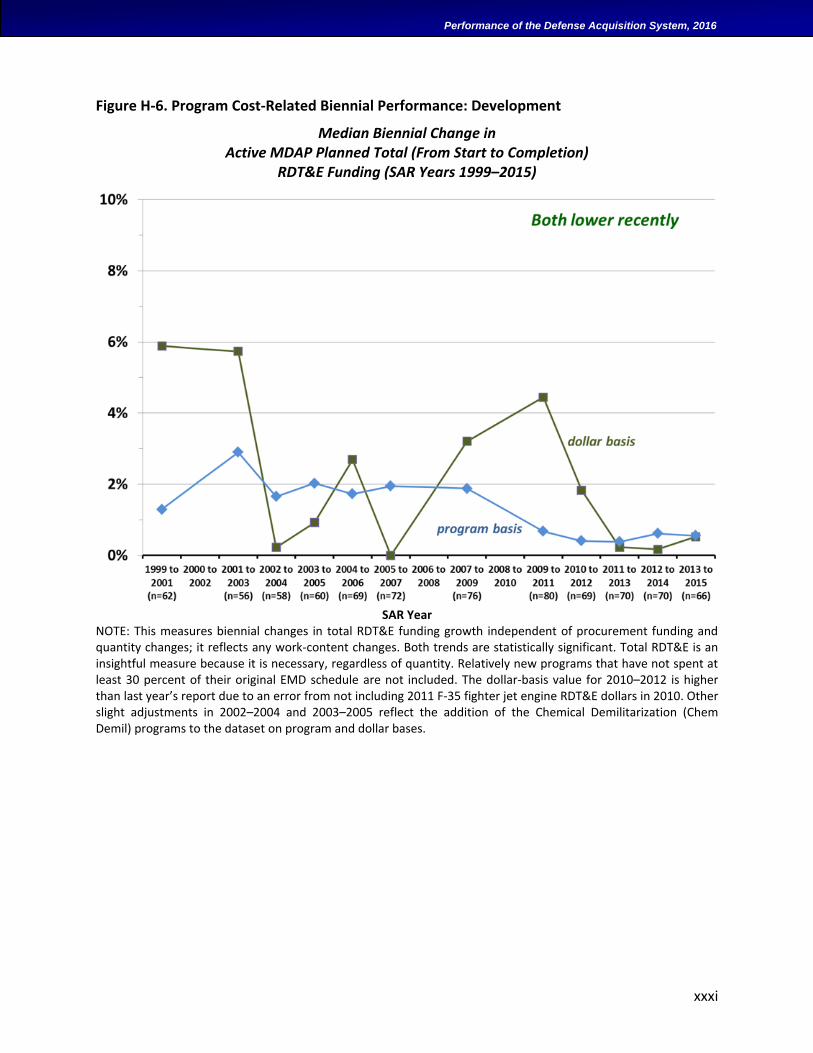
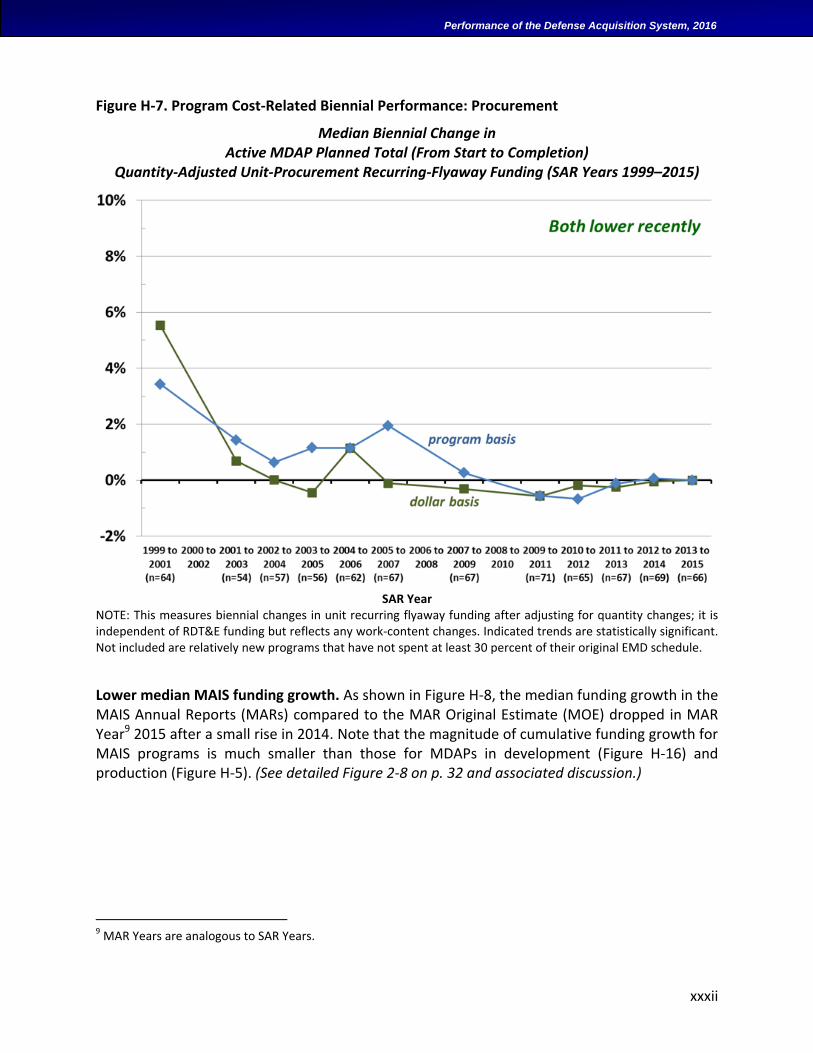
Lower biennial change in MDAP program funding for both development and production. In addition to measuring total growth against original baselines, we also measure biennial growth to monitor incremental (marginal) growth. Median biennial change in funding growth continues to be lower in recent years both on a program basis and when adjusting for the size of programs (i.e., on a dollar basis)—see Figure H-6 and Figure H-7. In both program and dollar bases, biennial changes have been below 1 percent since 2011 for development and essentially zero or below since 2009 for procurement. These are measured using total program RDT&E funding and quantity-adjusted unit procurement (recurring unit flyaway funding), including past and needed future funding. (See detailed discussion starting on pp. 40 and 54.)
0%
10%
20%
30%
40%
50%
2001(n=70)
2002(n=69)
2003(n=68)
2004(n=70)
2005(n=72)
2006(n=79)
2007(n=80)
2008 2009(n=87)
2010(n=85)
2011(n=80)
2012(n=79)
2013(n=78)
2014(n=80)
2015(n=77)
dollar basis
program basis
Dollar basis: generally decreasingProgram basis: no trend
xxxi
Performance of the Defense Acquisition System, 2016
Figure H-6. Program Cost-Related Biennial Performance: Development
Median Biennial Change in Active MDAP Planned Total (From Start to Completion)
RDT&E Funding (SAR Years 1999–2015)
SAR Year
NOTE: This measures biennial changes in total RDT&E funding growth independent of procurement funding and quantity changes; it reflects any work-content changes. Both trends are statistically significant. Total RDT&E is an insightful measure because it is necessary, regardless of quantity. Relatively new programs that have not spent at least 30 percent of their original EMD schedule are not included. The dollar-basis value for 2010–2012 is higher than last year’s report due to an error from not including 2011 F-35 fighter jet engine RDT&E dollars in 2010. Other slight adjustments in 2002–2004 and 2003–2005 reflect the addition of the Chemical Demilitarization (Chem Demil) programs to the dataset on program and dollar bases.
xxxii
Performance of the Defense Acquisition System, 2016
Figure H-7. Program Cost-Related Biennial Performance: Procurement
Median Biennial Change in Active MDAP Planned Total (From Start to Completion)
Quantity-Adjusted Unit-Procurement Recurring-Flyaway Funding (SAR Years 1999–2015)
SAR Year
NOTE: This measures biennial changes in unit recurring flyaway funding after adjusting for quantity changes; it is independent of RDT&E funding but reflects any work-content changes. Indicated trends are statistically significant. Not included are relatively new programs that have not spent at least 30 percent of their original EMD schedule.
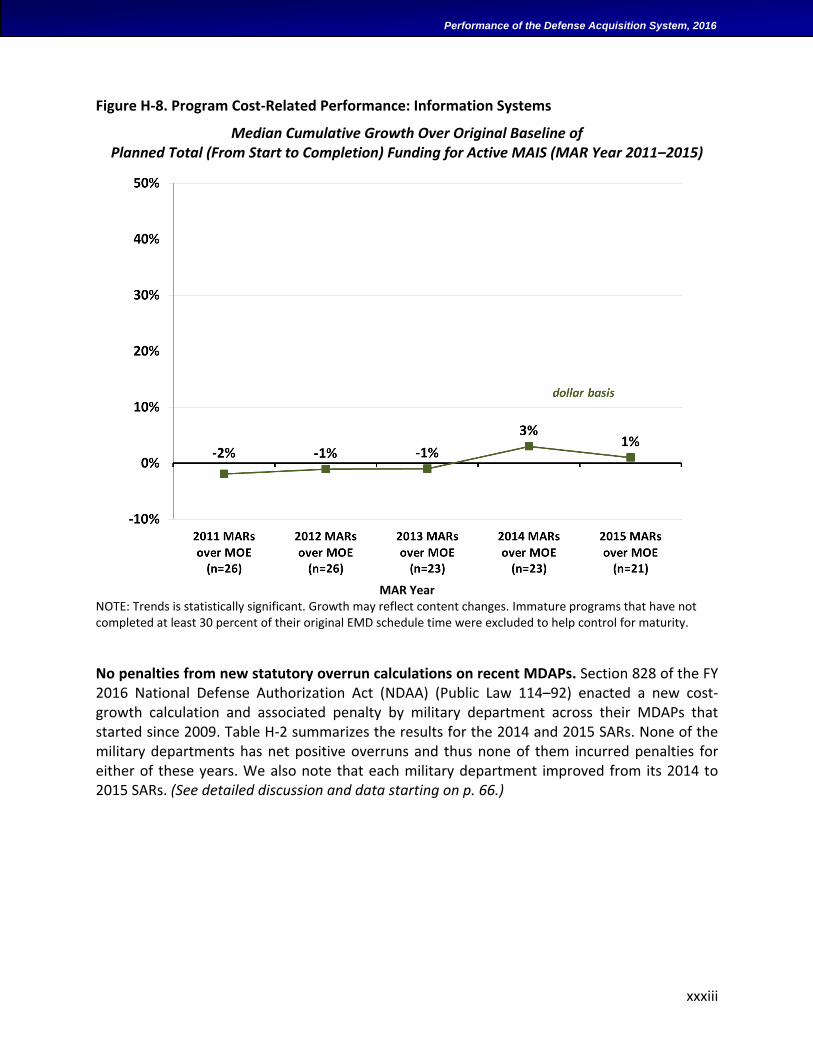
Lower median MAIS funding growth. As shown in Figure H-8, the median funding growth in the MAIS Annual Reports (MARs) compared to the MAR Original Estimate (MOE) dropped in MAR Year9 2015 after a small rise in 2014. Note that the magnitude of cumulative funding growth for MAIS programs is much smaller than those for MDAPs in development (Figure H-16) and production (Figure H-5). (See detailed Figure 2-8 on p. 32 and associated discussion.)
9 MAR Years are analogous to SAR Years.
xxxiii
Performance of the Defense Acquisition System, 2016
Figure H-8. Program Cost-Related Performance: Information Systems
Median Cumulative Growth Over Original Baseline of Planned Total (From Start to Completion) Funding for Active MAIS (MAR Year 2011–2015)
MAR Year
NOTE: Trends is statistically significant. Growth may reflect content changes. Immature programs that have not completed at least 30 percent of their original EMD schedule time were excluded to help control for maturity.
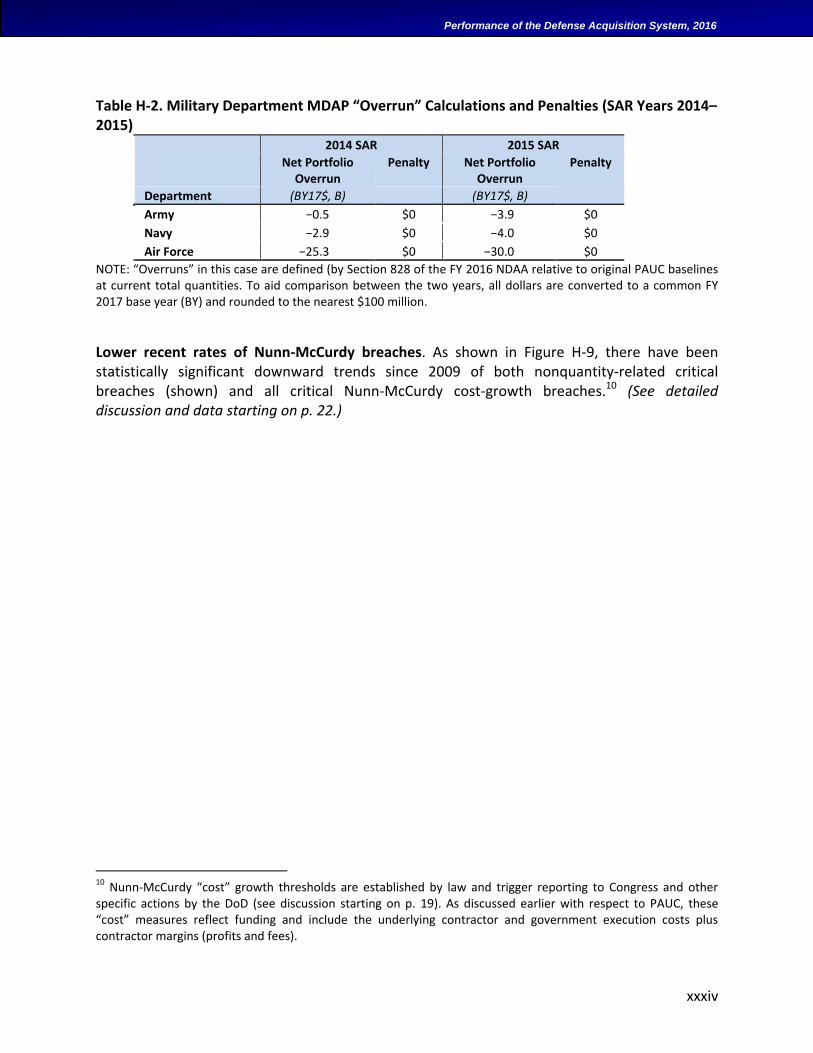
No penalties from new statutory overrun calculations on recent MDAPs. Section 828 of the FY 2016 National Defense Authorization Act (NDAA) (Public Law 114–92) enacted a new cost-growth calculation and associated penalty by military department across their MDAPs that started since 2009. Table H-2 summarizes the results for the 2014 and 2015 SARs. None of the military departments has net positive overruns and thus none of them incurred penalties for either of these years. We also note that each military department improved from its 2014 to 2015 SARs. (See detailed discussion and data starting on p. 66.)
xxxiv
Performance of the Defense Acquisition System, 2016
Table H-2. Military Department MDAP “Overrun” Calculations and Penalties (SAR Years 2014–2015)
2014 SAR 2015 SAR
Net Portfolio Overrun
Penalty Net Portfolio Overrun
Penalty
Department (BY17$, B) (BY17$, B)
Army −0.5 $0 −3.9 $0
Navy −2.9 $0 −4.0 $0
Air Force −25.3 $0 −30.0 $0
NOTE: “Overruns” in this case are defined (by Section 828 of the FY 2016 NDAA relative to original PAUC baselines at current total quantities. To aid comparison between the two years, all dollars are converted to a common FY 2017 base year (BY) and rounded to the nearest $100 million.
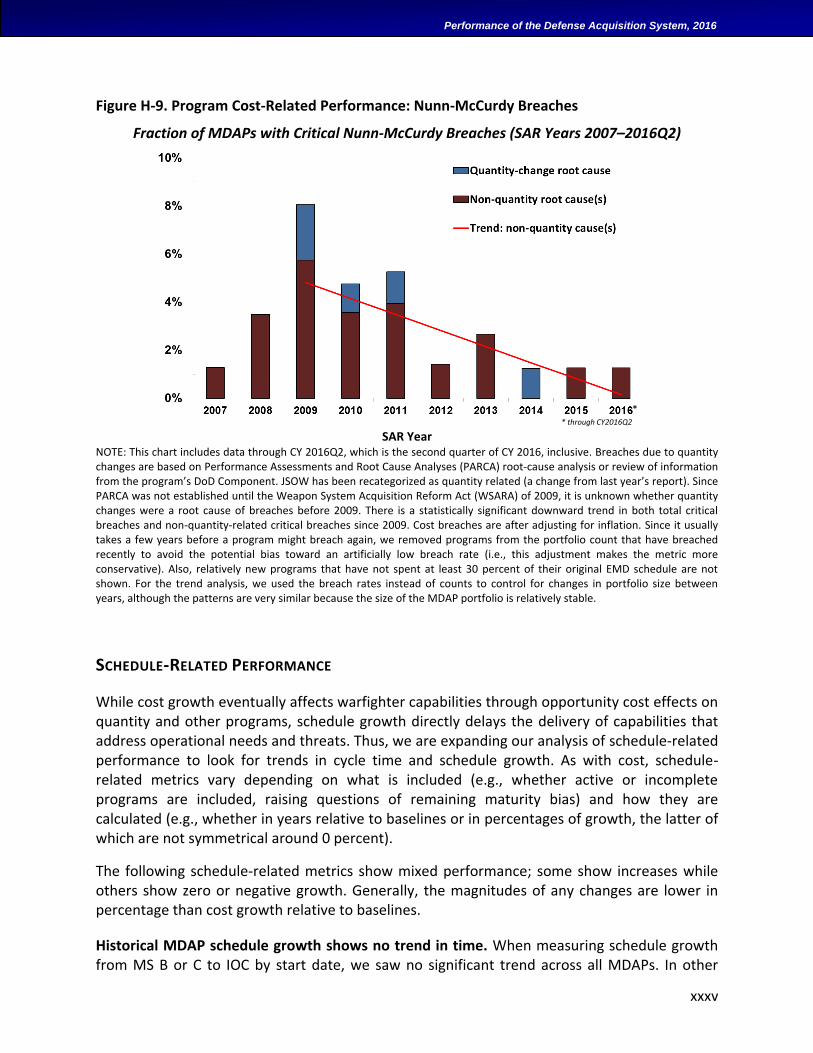
Lower recent rates of Nunn-McCurdy breaches. As shown in Figure H-9, there have been statistically significant downward trends since 2009 of both nonquantity-related critical breaches (shown) and all critical Nunn-McCurdy cost-growth breaches.10 (See detailed discussion and data starting on p. 22.)
10 Nunn-McCurdy “cost” growth thresholds are established by law and trigger reporting to Congress and other specific actions by the DoD (see discussion starting on p. 19). As discussed earlier with respect to PAUC, these “cost” measures reflect funding and include the underlying contractor and government execution costs plus contractor margins (profits and fees).
xxxv
Performance of the Defense Acquisition System, 2016
Figure H-9. Program Cost-Related Performance: Nunn-McCurdy Breaches
Fraction of MDAPs with Critical Nunn-McCurdy Breaches (SAR Years 2007–2016Q2)
SAR Year
NOTE: This chart includes data through CY 2016Q2, which is the second quarter of CY 2016, inclusive. Breaches due to quantity changes are based on Performance Assessments and Root Cause Analyses (PARCA) root-cause analysis or review of information from the program’s DoD Component. JSOW has been recategorized as quantity related (a change from last year’s report). Since PARCA was not established until the Weapon System Acquisition Reform Act (WSARA) of 2009, it is unknown whether quantity changes were a root cause of breaches before 2009. There is a statistically significant downward trend in both total critical breaches and non-quantity-related critical breaches since 2009. Cost breaches are after adjusting for inflation. Since it usually takes a few years before a program might breach again, we removed programs from the portfolio count that have breached recently to avoid the potential bias toward an artificially low breach rate (i.e., this adjustment makes the metric more conservative). Also, relatively new programs that have not spent at least 30 percent of their original EMD schedule are not shown. For the trend analysis, we used the breach rates instead of counts to control for changes in portfolio size between years, although the patterns are very similar because the size of the MDAP portfolio is relatively stable.
SCHEDULE-RELATED PERFORMANCE
While cost growth eventually affects warfighter capabilities through opportunity cost effects on quantity and other programs, schedule growth directly delays the delivery of capabilities that address operational needs and threats. Thus, we are expanding our analysis of schedule-related performance to look for trends in cycle time and schedule growth. As with cost, schedule-related metrics vary depending on what is included (e.g., whether active or incomplete programs are included, raising questions of remaining maturity bias) and how they are calculated (e.g., whether in years relative to baselines or in percentages of growth, the latter of which are not symmetrical around 0 percent).
The following schedule-related metrics show mixed performance; some show increases while others show zero or negative growth. Generally, the magnitudes of any changes are lower in percentage than cost growth relative to baselines.
Historical MDAP schedule growth shows no trend in time. When measuring schedule growth from MS B or C to IOC by start date, we saw no significant trend across all MDAPs. In other
** through CY2016Q2
xxxvi
Performance of the Defense Acquisition System, 2016
words, essentially no part of the variation is explained generally by a trend in time. The median overall growth since 1981 is 1 percent (up from 0 percent last year). We do see a downward trend in the subset of programs that have not yet achieved IOC, but it is too early to tell whether the trend is real or are merely due to the fact that the programs are not yet complete. (See discussions starting on p. 46.)
MDAPs have averaged about 7 years to reach IOC, showing about 3 percent growth overall. The average MDAP that reported between calendar year (CY) 1997̅–2015 took about 7 years to reach IOC from initiation at MS B or C. This is about 3 percent above the average planned length. The actual portfolio variation (standard deviation) grows by about 5 months. In other words, the portfolio of programs that have achieved IOC showed modest schedule growth, measured in months, not years. (See discussion starting on p. 45.)
Recent median schedule growth on active, shorter MDAPs is increasing. In a different measure examining all then-active MS-B-start programs (regardless of whether they have reached IOC or not), we have seen a marked increase in schedule growth from program start (MS B) to IOC from about 4 percent to about 15 percent at the median on programs since 2009 on a program basis (see Figure H-10). Schedule growth across the distribution in CY 2015 was statistically higher than it was in 1997–1999 and 2004–2005. However, when weighting by program span (so that longer programs weigh more than shorter programs), the trend remains relatively flat at about 2 percent. Thus, recent schedule growth (in percent) on active programs generally appears to be concentrated on shorter programs. We also found (in separate analysis) that shorter programs tended to have higher schedule-growth percentage variation than longer programs. (See discussion starting on p. 46.)
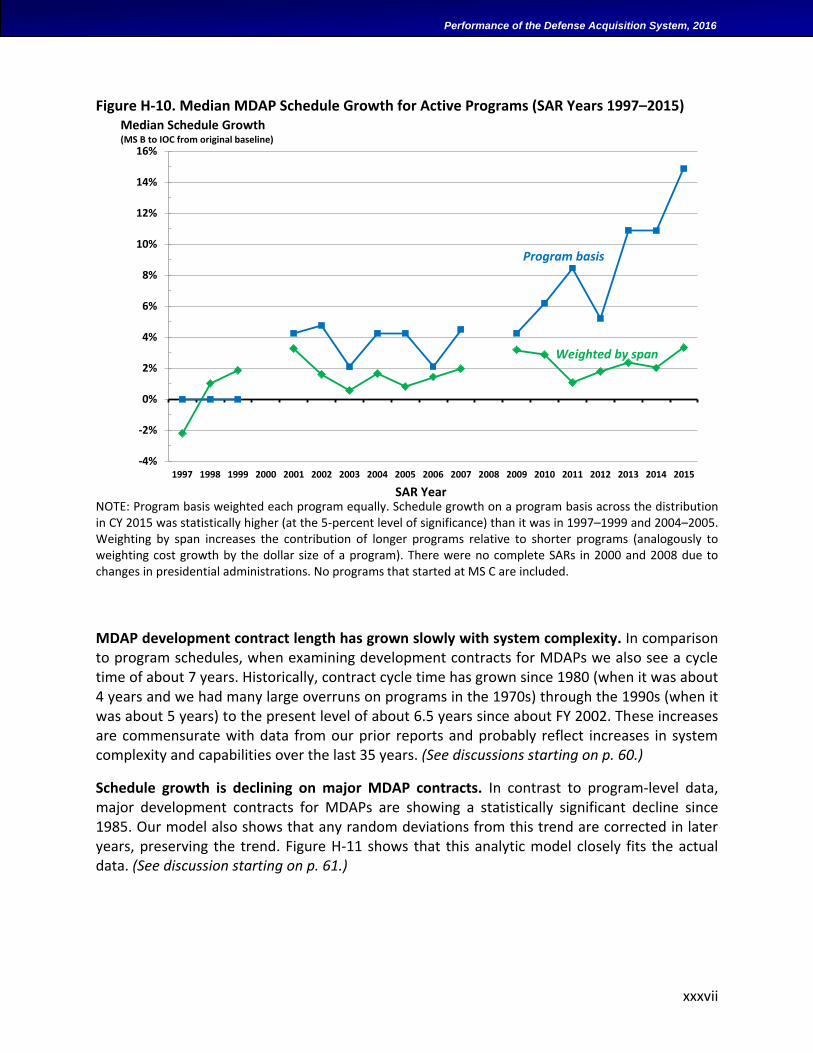
xxxvii
Performance of the Defense Acquisition System, 2016
Figure H-10. Median MDAP Schedule Growth for Active Programs (SAR Years 1997–2015)
NOTE: Program basis weighted each program equally. Schedule growth on a program basis across the distribution in CY 2015 was statistically higher (at the 5-percent level of significance) than it was in 1997–1999 and 2004–2005. Weighting by span increases the contribution of longer programs relative to shorter programs (analogously to weighting cost growth by the dollar size of a program). There were no complete SARs in 2000 and 2008 due to changes in presidential administrations. No programs that started at MS C are included.
MDAP development contract length has grown slowly with system complexity. In comparison to program schedules, when examining development contracts for MDAPs we also see a cycle time of about 7 years. Historically, contract cycle time has grown since 1980 (when it was about 4 years and we had many large overruns on programs in the 1970s) through the 1990s (when it was about 5 years) to the present level of about 6.5 years since about FY 2002. These increases are commensurate with data from our prior reports and probably reflect increases in system complexity and capabilities over the last 35 years. (See discussions starting on p. 60.)
Schedule growth is declining on major MDAP contracts. In contrast to program-level data, major development contracts for MDAPs are showing a statistically significant decline since 1985. Our model also shows that any random deviations from this trend are corrected in later years, preserving the trend. Figure H-11 shows that this analytic model closely fits the actual data. (See discussion starting on p. 61.)
-4%
-2%
0%
2%
4%
6%
8%
10%
12%
14%
16%
1997 1998 1999 2000 2001 2002 2003 2004 2005 2006 2007 2008 2009 2010 2011 2012 2013 2014 2015
Median Schedule Growth(MS B to IOC from original baseline)
SAR Year
Program basis
Weighted by span
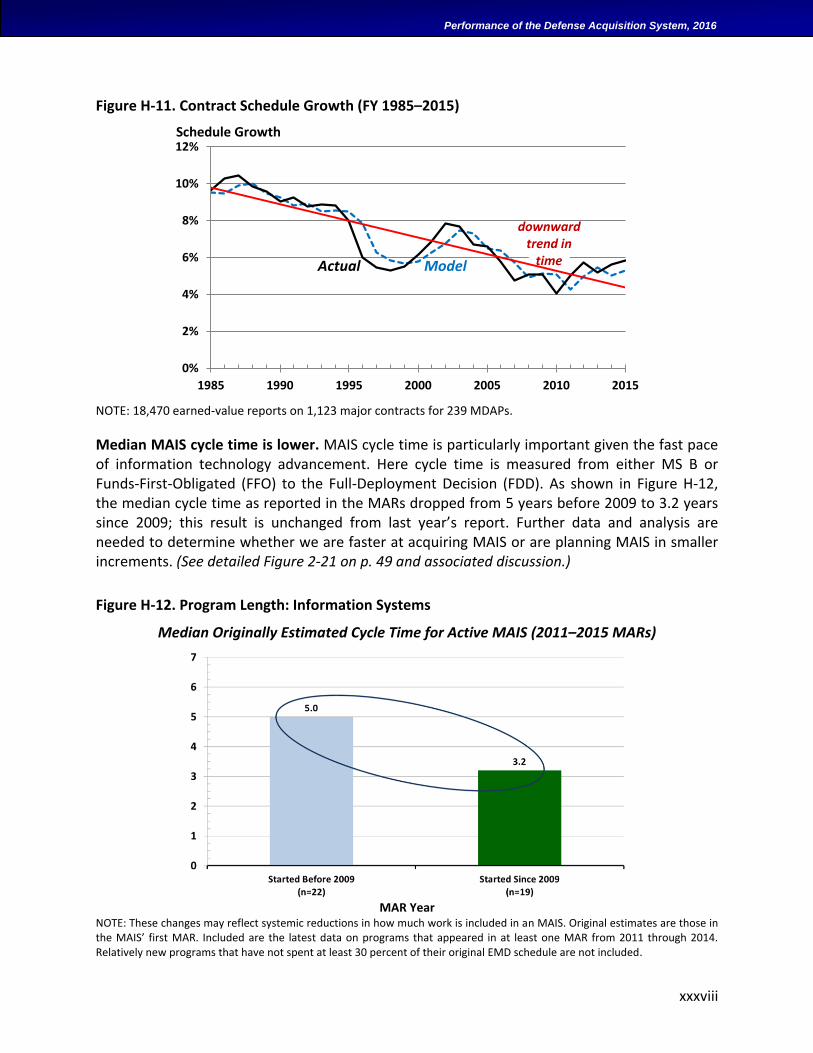
xxxviii
Performance of the Defense Acquisition System, 2016
Figure H-11. Contract Schedule Growth (FY 1985–2015)
NOTE: 18,470 earned-value reports on 1,123 major contracts for 239 MDAPs.
Median MAIS cycle time is lower. MAIS cycle time is particularly important given the fast pace of information technology advancement. Here cycle time is measured from either MS B or Funds-First-Obligated (FFO) to the Full-Deployment Decision (FDD). As shown in Figure H-12, the median cycle time as reported in the MARs dropped from 5 years before 2009 to 3.2 years since 2009; this result is unchanged from last year’s report. Further data and analysis are needed to determine whether we are faster at acquiring MAIS or are planning MAIS in smaller increments. (See detailed Figure 2-21 on p. 49 and associated discussion.)
Figure H-12. Program Length: Information Systems
Median Originally Estimated Cycle Time for Active MAIS (2011–2015 MARs)
MAR Year
NOTE: These changes may reflect systemic reductions in how much work is included in an MAIS. Original estimates are those in the MAIS’ first MAR. Included are the latest data on programs that appeared in at least one MAR from 2011 through 2014. Relatively new programs that have not spent at least 30 percent of their original EMD schedule are not included.
0%
2%
4%
6%
8%
10%
12%
1985 1990 1995 2000 2005 2010 2015
Actual Model
Schedule Growth
downwardtrend in
time
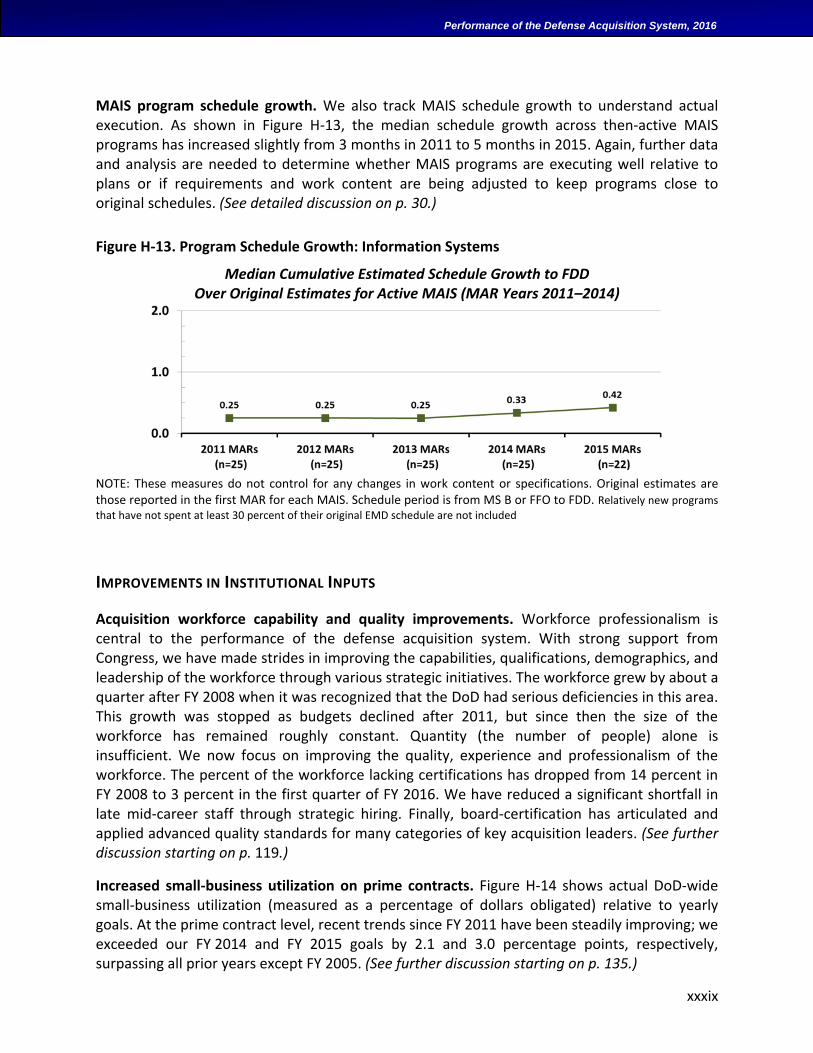
xxxix
Performance of the Defense Acquisition System, 2016
MAIS program schedule growth. We also track MAIS schedule growth to understand actual execution. As shown in Figure H-13, the median schedule growth across then-active MAIS programs has increased slightly from 3 months in 2011 to 5 months in 2015. Again, further data and analysis are needed to determine whether MAIS programs are executing well relative to plans or if requirements and work content are being adjusted to keep programs close to original schedules. (See detailed discussion on p. 30.)
Figure H-13. Program Schedule Growth: Information Systems
Median Cumulative Estimated Schedule Growth to FDD Over Original Estimates for Active MAIS (MAR Years 2011–2014)
NOTE: These measures do not control for any changes in work content or specifications. Original estimates are those reported in the first MAR for each MAIS. Schedule period is from MS B or FFO to FDD. Relatively new programs
that have not spent at least 30 percent of their original EMD schedule are not included
IMPROVEMENTS IN INSTITUTIONAL INPUTS
Acquisition workforce capability and quality improvements. Workforce professionalism is central to the performance of the defense acquisition system. With strong support from Congress, we have made strides in improving the capabilities, qualifications, demographics, and leadership of the workforce through various strategic initiatives. The workforce grew by about a quarter after FY 2008 when it was recognized that the DoD had serious deficiencies in this area. This growth was stopped as budgets declined after 2011, but since then the size of the workforce has remained roughly constant. Quantity (the number of people) alone is insufficient. We now focus on improving the quality, experience and professionalism of the workforce. The percent of the workforce lacking certifications has dropped from 14 percent in FY 2008 to 3 percent in the first quarter of FY 2016. We have reduced a significant shortfall in late mid-career staff through strategic hiring. Finally, board-certification has articulated and applied advanced quality standards for many categories of key acquisition leaders. (See further discussion starting on p. 119.)
Increased small-business utilization on prime contracts. Figure H-14 shows actual DoD-wide small-business utilization (measured as a percentage of dollars obligated) relative to yearly goals. At the prime contract level, recent trends since FY 2011 have been steadily improving; we exceeded our FY 2014 and FY 2015 goals by 2.1 and 3.0 percentage points, respectively, surpassing all prior years except FY 2005. (See further discussion starting on p. 135.)
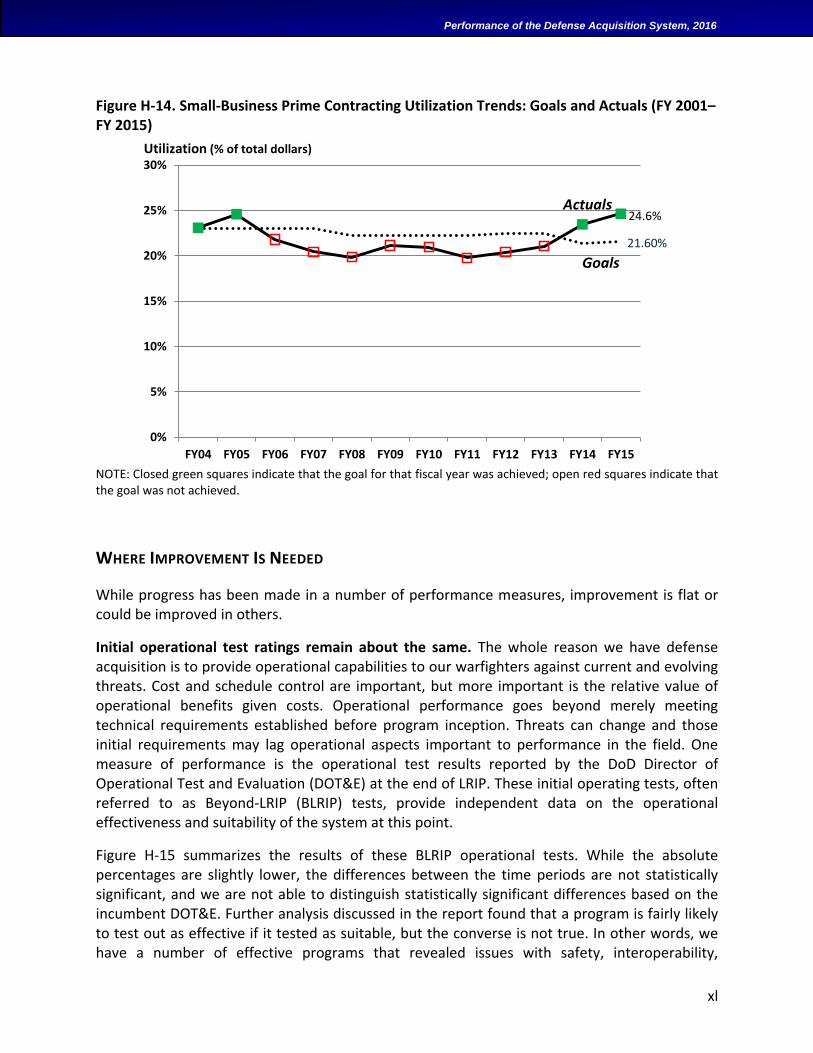
xl
Performance of the Defense Acquisition System, 2016
Figure H-14. Small-Business Prime Contracting Utilization Trends: Goals and Actuals (FY 2001–FY 2015)
NOTE: Closed green squares indicate that the goal for that fiscal year was achieved; open red squares indicate that the goal was not achieved.
WHERE IMPROVEMENT IS NEEDED
While progress has been made in a number of performance measures, improvement is flat or could be improved in others.
Initial operational test ratings remain about the same. The whole reason we have defense acquisition is to provide operational capabilities to our warfighters against current and evolving threats. Cost and schedule control are important, but more important is the relative value of operational benefits given costs. Operational performance goes beyond merely meeting technical requirements established before program inception. Threats can change and those initial requirements may lag operational aspects important to performance in the field. One measure of performance is the operational test results reported by the DoD Director of Operational Test and Evaluation (DOT&E) at the end of LRIP. These initial operating tests, often referred to as Beyond-LRIP (BLRIP) tests, provide independent data on the operational effectiveness and suitability of the system at this point.
Figure H-15 summarizes the results of these BLRIP operational tests. While the absolute percentages are slightly lower, the differences between the time periods are not statistically significant, and we are not able to distinguish statistically significant differences based on the incumbent DOT&E. Further analysis discussed in the report found that a program is fairly likely to test out as effective if it tested as suitable, but the converse is not true. In other words, we have a number of effective programs that revealed issues with safety, interoperability,
21.60%
24.6%
0%
5%
10%
15%
20%
25%
30%
FY04 FY05 FY06 FY07 FY08 FY09 FY10 FY11 FY12 FY13 FY14 FY15
Utilization (% of total dollars)
Goals
Actuals
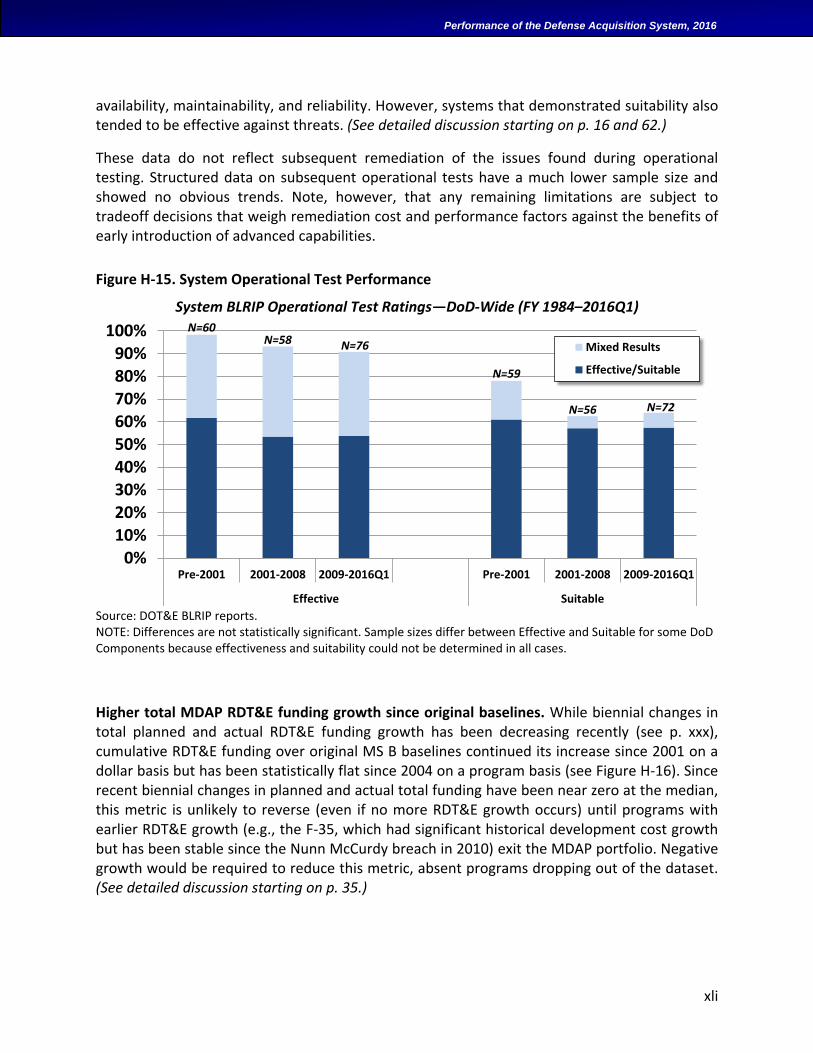
xli
Performance of the Defense Acquisition System, 2016
availability, maintainability, and reliability. However, systems that demonstrated suitability also tended to be effective against threats. (See detailed discussion starting on p. 16 and 62.)
These data do not reflect subsequent remediation of the issues found during operational testing. Structured data on subsequent operational tests have a much lower sample size and showed no obvious trends. Note, however, that any remaining limitations are subject to tradeoff decisions that weigh remediation cost and performance factors against the benefits of early introduction of advanced capabilities.
Figure H-15. System Operational Test Performance
System BLRIP Operational Test Ratings—DoD-Wide (FY 1984–2016Q1)
Source: DOT&E BLRIP reports. NOTE: Differences are not statistically significant. Sample sizes differ between Effective and Suitable for some DoD Components because effectiveness and suitability could not be determined in all cases.
Higher total MDAP RDT&E funding growth since original baselines. While biennial changes in total planned and actual RDT&E funding growth has been decreasing recently (see p. xxx), cumulative RDT&E funding over original MS B baselines continued its increase since 2001 on a dollar basis but has been statistically flat since 2004 on a program basis (see Figure H-16). Since recent biennial changes in planned and actual total funding have been near zero at the median, this metric is unlikely to reverse (even if no more RDT&E growth occurs) until programs with earlier RDT&E growth (e.g., the F-35, which had significant historical development cost growth but has been stable since the Nunn McCurdy breach in 2010) exit the MDAP portfolio. Negative growth would be required to reduce this metric, absent programs dropping out of the dataset. (See detailed discussion starting on p. 35.)
N=60N=58 N=76
N=59
N=56 N=72
0%10%20%30%40%50%60%70%80%90%
100%
Pre-2001 2001-2008 2009-2016Q1 Pre-2001 2001-2008 2009-2016Q1
Effective Suitable
Mixed Results
Effective/Suitable
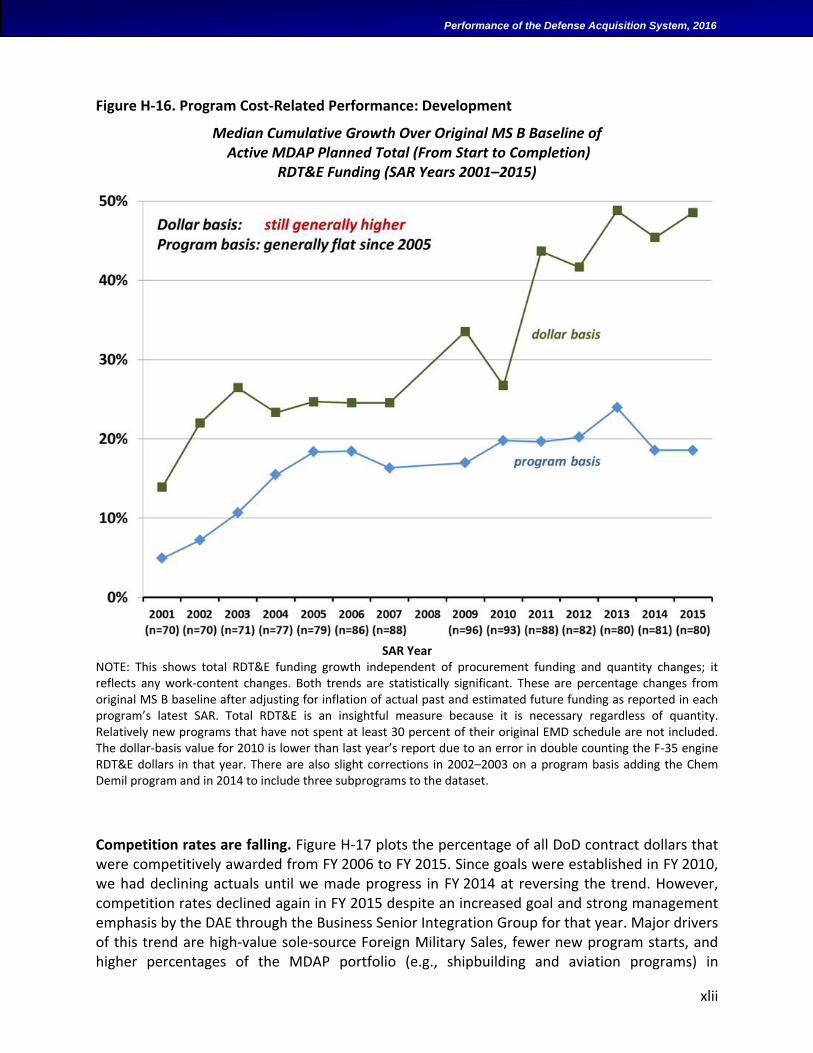
xlii
Performance of the Defense Acquisition System, 2016
Figure H-16. Program Cost-Related Performance: Development
Median Cumulative Growth Over Original MS B Baseline of Active MDAP Planned Total (From Start to Completion)
RDT&E Funding (SAR Years 2001–2015)
SAR Year
NOTE: This shows total RDT&E funding growth independent of procurement funding and quantity changes; it reflects any work-content changes. Both trends are statistically significant. These are percentage changes from original MS B baseline after adjusting for inflation of actual past and estimated future funding as reported in each program’s latest SAR. Total RDT&E is an insightful measure because it is necessary regardless of quantity. Relatively new programs that have not spent at least 30 percent of their original EMD schedule are not included. The dollar-basis value for 2010 is lower than last year’s report due to an error in double counting the F-35 engine RDT&E dollars in that year. There are also slight corrections in 2002–2003 on a program basis adding the Chem Demil program and in 2014 to include three subprograms to the dataset.
Competition rates are falling. Figure H-17 plots the percentage of all DoD contract dollars that were competitively awarded from FY 2006 to FY 2015. Since goals were established in FY 2010, we had declining actuals until we made progress in FY 2014 at reversing the trend. However, competition rates declined again in FY 2015 despite an increased goal and strong management emphasis by the DAE through the Business Senior Integration Group for that year. Major drivers of this trend are high-value sole-source Foreign Military Sales, fewer new program starts, and higher percentages of the MDAP portfolio (e.g., shipbuilding and aviation programs) in
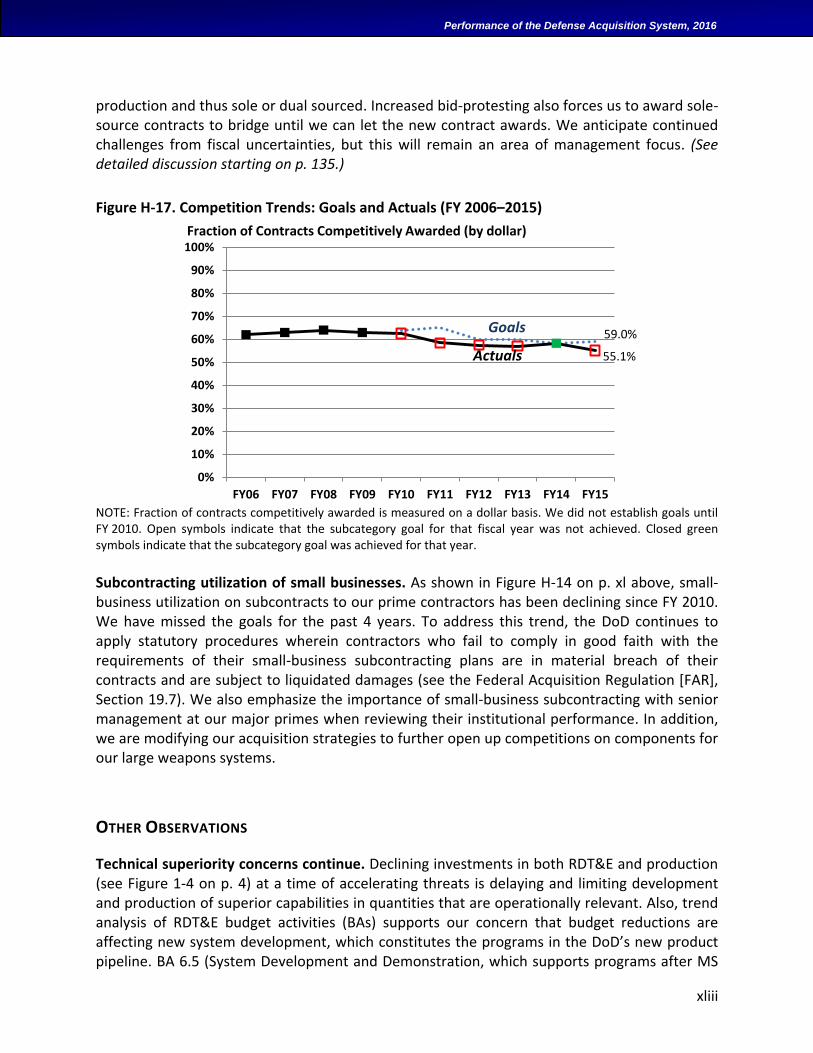
xliii
Performance of the Defense Acquisition System, 2016
production and thus sole or dual sourced. Increased bid-protesting also forces us to award sole-source contracts to bridge until we can let the new contract awards. We anticipate continued challenges from fiscal uncertainties, but this will remain an area of management focus. (See detailed discussion starting on p. 135.)
Figure H-17. Competition Trends: Goals and Actuals (FY 2006–2015)
NOTE: Fraction of contracts competitively awarded is measured on a dollar basis. We did not establish goals until FY 2010. Open symbols indicate that the subcategory goal for that fiscal year was not achieved. Closed green symbols indicate that the subcategory goal was achieved for that year.
Subcontracting utilization of small businesses. As shown in Figure H-14 on p. xl above, small-business utilization on subcontracts to our prime contractors has been declining since FY 2010. We have missed the goals for the past 4 years. To address this trend, the DoD continues to apply statutory procedures wherein contractors who fail to comply in good faith with the requirements of their small-business subcontracting plans are in material breach of their contracts and are subject to liquidated damages (see the Federal Acquisition Regulation [FAR], Section 19.7). We also emphasize the importance of small-business subcontracting with senior management at our major primes when reviewing their institutional performance. In addition, we are modifying our acquisition strategies to further open up competitions on components for our large weapons systems.
OTHER OBSERVATIONS
Technical superiority concerns continue. Declining investments in both RDT&E and production (see Figure 1-4 on p. 4) at a time of accelerating threats is delaying and limiting development and production of superior capabilities in quantities that are operationally relevant. Also, trend analysis of RDT&E budget activities (BAs) supports our concern that budget reductions are affecting new system development, which constitutes the programs in the DoD’s new product pipeline. BA 6.5 (System Development and Demonstration, which supports programs after MS
59.0%
55.1%
0%
10%
20%
30%
40%
50%
60%
70%
80%
90%
100%
FY06 FY07 FY08 FY09 FY10 FY11 FY12 FY13 FY14 FY15
Goals
Actuals
Fraction of Contracts Competitively Awarded (by dollar)
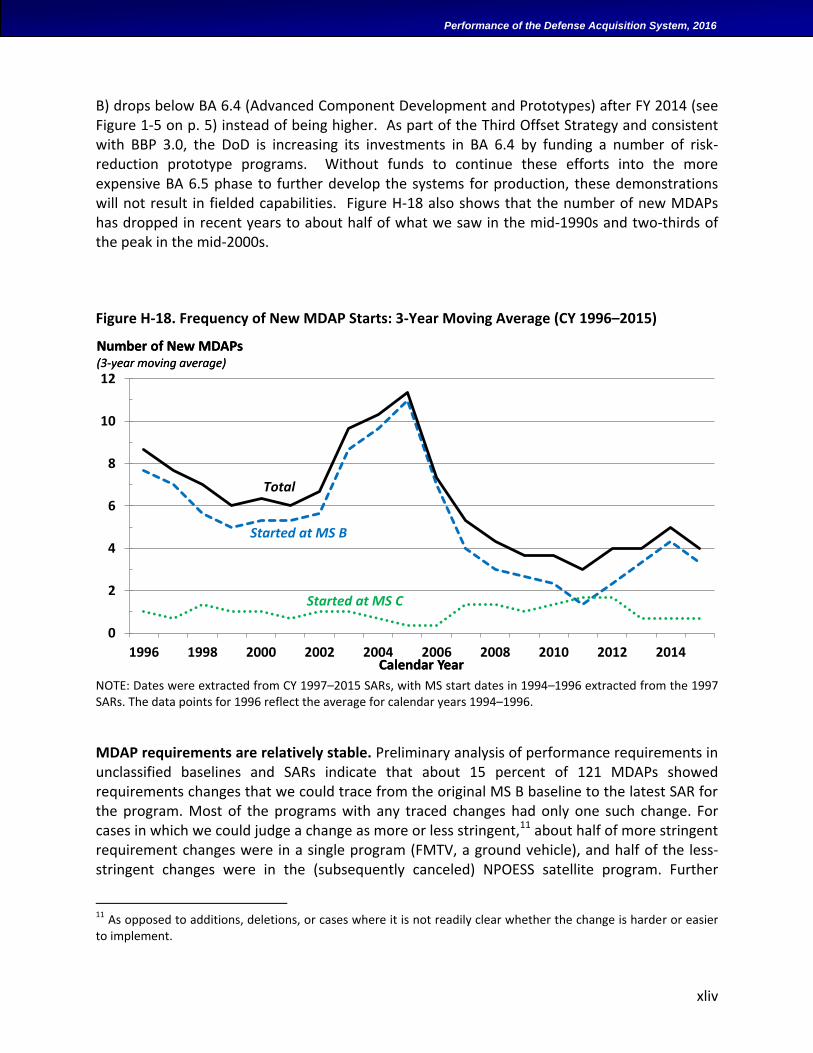
xliv
Performance of the Defense Acquisition System, 2016
B) drops below BA 6.4 (Advanced Component Development and Prototypes) after FY 2014 (see Figure 1-5 on p. 5) instead of being higher. As part of the Third Offset Strategy and consistent with BBP 3.0, the DoD is increasing its investments in BA 6.4 by funding a number of risk-reduction prototype programs. Without funds to continue these efforts into the more expensive BA 6.5 phase to further develop the systems for production, these demonstrations will not result in fielded capabilities. Figure H-18 also shows that the number of new MDAPs has dropped in recent years to about half of what we saw in the mid-1990s and two-thirds of the peak in the mid-2000s.
Figure H-18. Frequency of New MDAP Starts: 3-Year Moving Average (CY 1996–2015)
NOTE: Dates were extracted from CY 1997–2015 SARs, with MS start dates in 1994–1996 extracted from the 1997 SARs. The data points for 1996 reflect the average for calendar years 1994–1996.
MDAP requirements are relatively stable. Preliminary analysis of performance requirements in unclassified baselines and SARs indicate that about 15 percent of 121 MDAPs showed requirements changes that we could trace from the original MS B baseline to the latest SAR for the program. Most of the programs with any traced changes had only one such change. For cases in which we could judge a change as more or less stringent,11 about half of more stringent requirement changes were in a single program (FMTV, a ground vehicle), and half of the less-stringent changes were in the (subsequently canceled) NPOESS satellite program. Further
11 As opposed to additions, deletions, or cases where it is not readily clear whether the change is harder or easier to implement.
0
2
4
6
8
10
12
1996 1998 2000 2002 2004 2006 2008 2010 2012 2014
Number of New MDAPs(3-year moving average)
Calendar Year
Number of New MDAPs(3-year moving average)
Calendar Year
Total
Started at MS B
Started at MS C
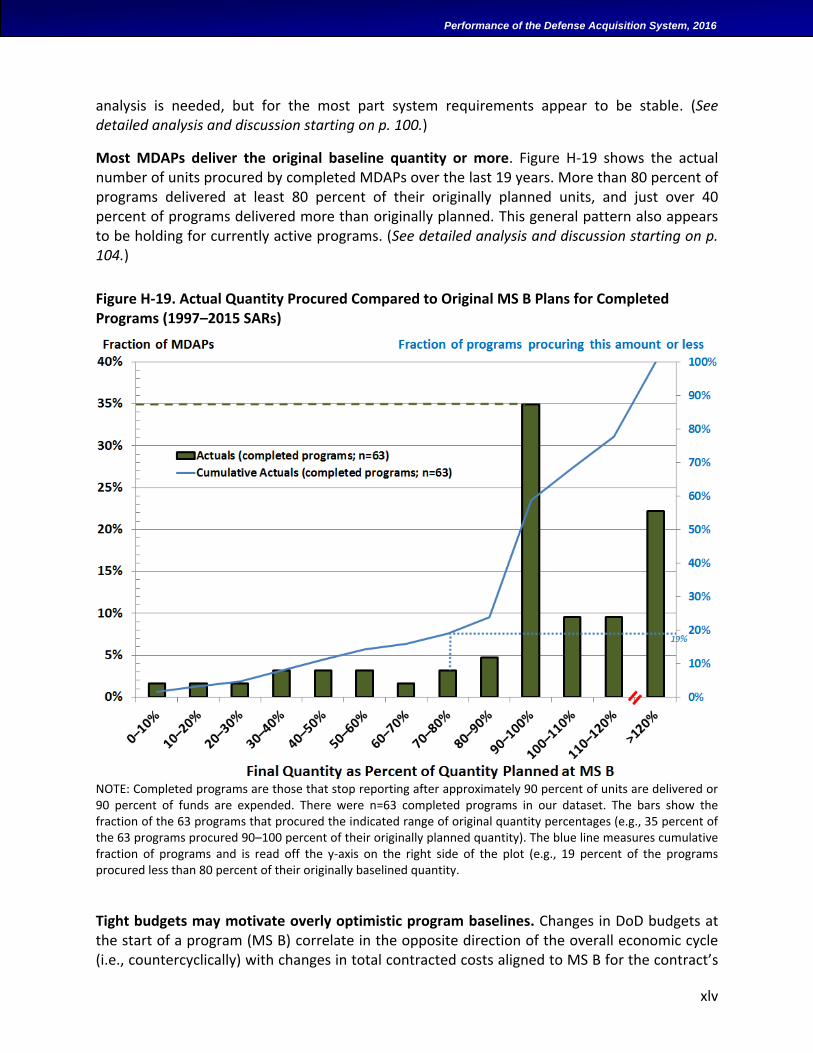
xlv
Performance of the Defense Acquisition System, 2016
analysis is needed, but for the most part system requirements appear to be stable. (See detailed analysis and discussion starting on p. 100.)
Most MDAPs deliver the original baseline quantity or more. Figure H-19 shows the actual number of units procured by completed MDAPs over the last 19 years. More than 80 percent of programs delivered at least 80 percent of their originally planned units, and just over 40 percent of programs delivered more than originally planned. This general pattern also appears to be holding for currently active programs. (See detailed analysis and discussion starting on p. 104.)
Figure H-19. Actual Quantity Procured Compared to Original MS B Plans for Completed Programs (1997–2015 SARs)
NOTE: Completed programs are those that stop reporting after approximately 90 percent of units are delivered or 90 percent of funds are expended. There were n=63 completed programs in our dataset. The bars show the fraction of the 63 programs that procured the indicated range of original quantity percentages (e.g., 35 percent of the 63 programs procured 90–100 percent of their originally planned quantity). The blue line measures cumulative fraction of programs and is read off the y-axis on the right side of the plot (e.g., 19 percent of the programs procured less than 80 percent of their originally baselined quantity.
Tight budgets may motivate overly optimistic program baselines. Changes in DoD budgets at the start of a program (MS B) correlate in the opposite direction of the overall economic cycle (i.e., countercyclically) with changes in total contracted costs aligned to MS B for the contract’s
xlvi
Performance of the Defense Acquisition System, 2016
parent MDAP. Thus, as budgets go down, total contracted costs (including both work-content growth and cost-over-target overruns) generally increase, and the opposite occurs when budgets go up. Analysis also found three stabilizing correction factors that adjust growth in total contracted costs when actuals vary from what was expected from the model. (See detailed analysis and discussion starting on p. 92.) The countercyclical nature of total growth of MDAP contracted costs by MS B start date seems to imply that in tight budgetary environments resource planners were willing to take risks to maintain program start rates and used unrealistic and optimistic initial cost estimates to fit more content into military department budgets. With optimistic initial estimates on what typically are higher-risk development efforts, we would expect the higher cost growth that the data reflect.
Conversely, in accommodating budgetary environments, there may have been less pressure to assume risk to maintain number of program starts, so DoD Components may have had more realistic program start rates and cost estimates. With realistic initial estimates and low risks, we would expect lower cost growth.
These data (along with prior results from McNicol and Wu, 2014) further support caution about starting programs with overly optimistic program cost baselines and contract cost targets during periods when budgets are contracting or low, as in the current environment.
Schedule growth is lower than cost growth in development. Overall median schedule growth (B/C to IOC) since 1981 for active and completed programs is running at 1 percent while schedule growth on only active programs has ranged from 0 percent in 1997 to about 15 percent in 2015. In contrast, MDAP program- and contract-level cost growth in development tends to run in the 20–45 percent range, depending on what measures, data, and adjustments are included. Thus, there are indications that the DoD generally may prioritize schedule over cost, which makes sense given that our primary mission is equipping the warfighter against existing threats, but the data and results on schedule growth are mixed.
Operationally suitable programs are fairly likely to be operationally effective, too. An examination of the coincidence between DOT&E test results shows that major programs often tested as operationally effective when they tested as operationally suitable, but the converse was not true. In other words, we have a number of effective systems that have suitability issues (e.g., safety, interoperability, availability, maintainability, and reliability), but systems that address these suitability issues tended to also be effective against threats. (See detailed analysis and discussion starting on p. 20.)
Labor, health-care, fuel, and maintenance costs appear to drive O&S cost estimates. DoD-wide, these factors correlate closely with O&S cost estimate changes reported in 2001–2014 SARs after adjusting for inflation. With some differences, these are also the dominant correlate types of factors for growth in O&S estimates by DoD Component and commodity. In nearly all cases, growth in system service life or quantity did not correlate with growth in O&S cost estimates. Thus, dynamics in these factors appear to be important for controlling O&S costs, and we found these dynamics can cause estimates to vary significantly from year to year (i.e.,
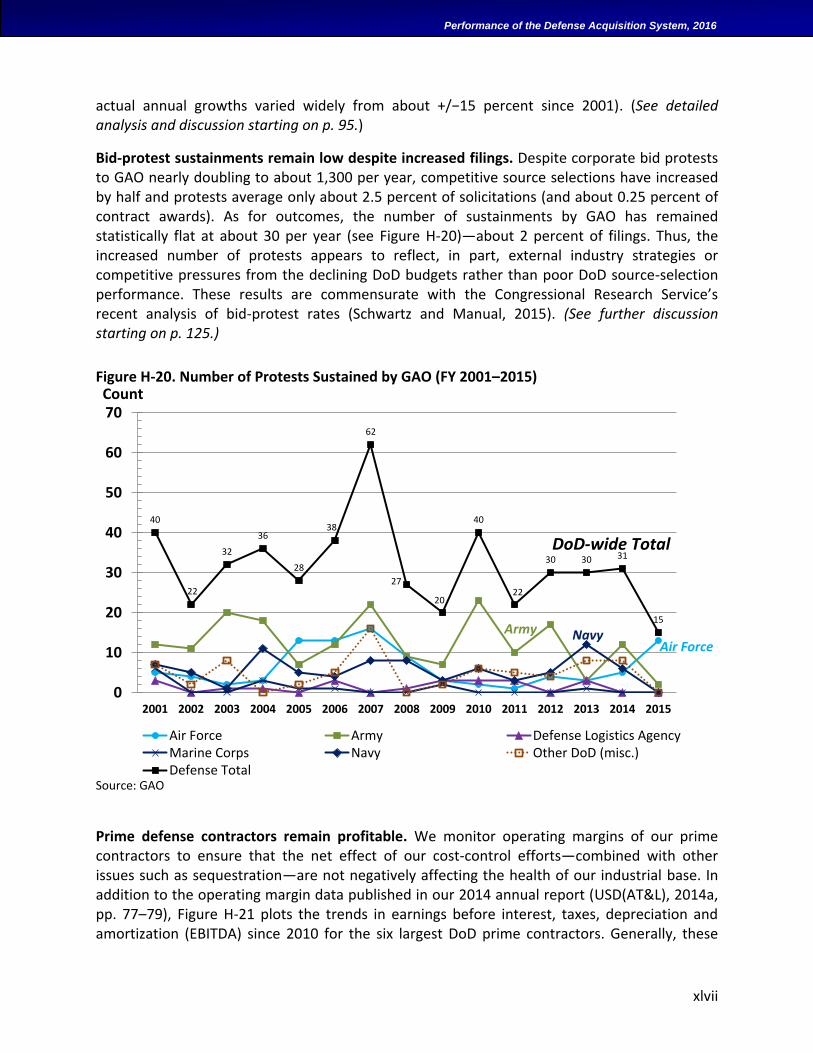
xlvii
Performance of the Defense Acquisition System, 2016
actual annual growths varied widely from about +/−15 percent since 2001). (See detailed analysis and discussion starting on p. 95.)
Bid-protest sustainments remain low despite increased filings. Despite corporate bid protests to GAO nearly doubling to about 1,300 per year, competitive source selections have increased by half and protests average only about 2.5 percent of solicitations (and about 0.25 percent of contract awards). As for outcomes, the number of sustainments by GAO has remained statistically flat at about 30 per year (see Figure H-20)—about 2 percent of filings. Thus, the increased number of protests appears to reflect, in part, external industry strategies or competitive pressures from the declining DoD budgets rather than poor DoD source-selection performance. These results are commensurate with the Congressional Research Service’s recent analysis of bid-protest rates (Schwartz and Manual, 2015). (See further discussion starting on p. 125.)
Figure H-20. Number of Protests Sustained by GAO (FY 2001–2015)
Source: GAO
Prime defense contractors remain profitable. We monitor operating margins of our prime contractors to ensure that the net effect of our cost-control efforts—combined with other issues such as sequestration—are not negatively affecting the health of our industrial base. In addition to the operating margin data published in our 2014 annual report (USD(AT&L), 2014a, pp. 77–79), Figure H-21 plots the trends in earnings before interest, taxes, depreciation and amortization (EBITDA) since 2010 for the six largest DoD prime contractors. Generally, these
40
22
32
36
28
38
62
27
20
40
22
30 30 31
15
0
10
20
30
40
50
60
70
2001 2002 2003 2004 2005 2006 2007 2008 2009 2010 2011 2012 2013 2014 2015
Count
# DoD Protests Sustained by GAO
Air Force Army Defense Logistics AgencyMarine Corps Navy Other DoD (misc.)Defense Total
DoD-wide Total
ArmyAir Force
Navy
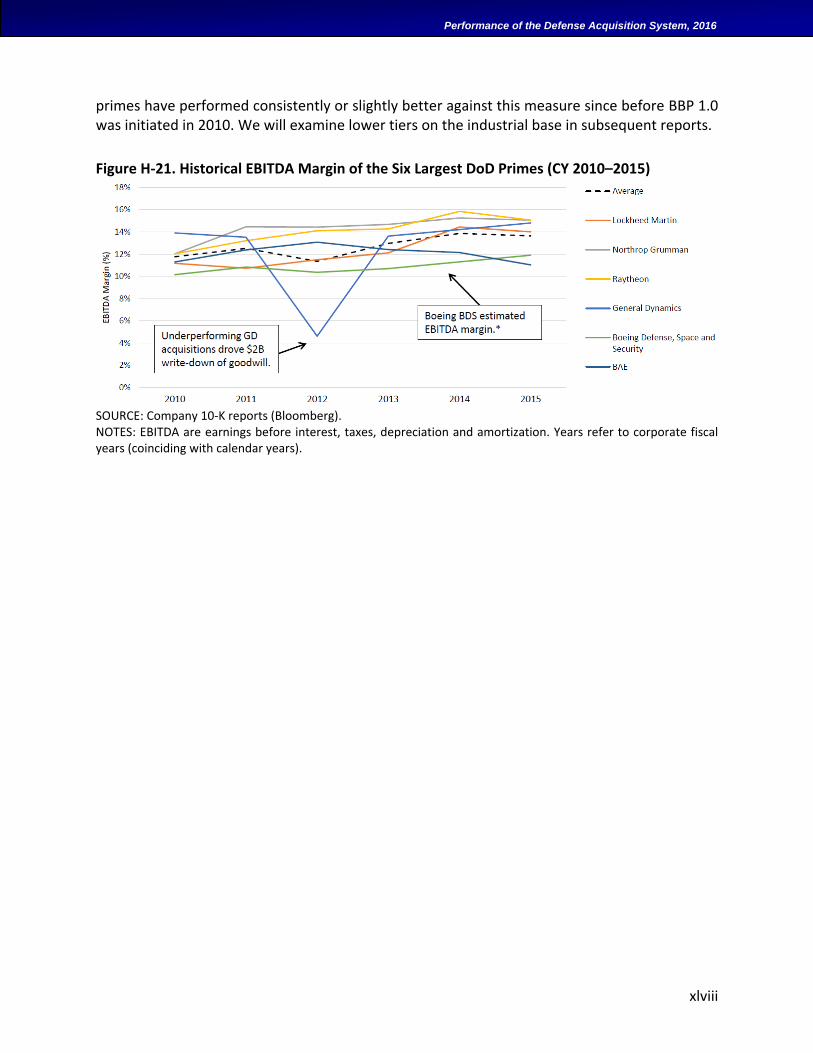
xlviii
Performance of the Defense Acquisition System, 2016
primes have performed consistently or slightly better against this measure since before BBP 1.0 was initiated in 2010. We will examine lower tiers on the industrial base in subsequent reports.
Figure H-21. Historical EBITDA Margin of the Six Largest DoD Primes (CY 2010–2015)
SOURCE: Company 10-K reports (Bloomberg). NOTES: EBITDA are earnings before interest, taxes, depreciation and amortization. Years refer to corporate fiscal years (coinciding with calendar years).
xlix
Performance of the Defense Acquisition System, 2016
ACKNOWLEDGMENTS
The analysis in this report could not have been performed without authoritative structured data archives in the DoD and GAO. The analysis was primarily conducted by Dan Davis, Ken Munson, Douglas J. Buettner, and Philip S. Anton, with much-appreciated assistance and contributions from Joseph Beauregard, Gary R. Bliss, Caroline Chien, Ellen Chou, Karen Cook, Margaret Cregan, Brian Davidson, Terence Emmert, Adrienne Evertson, Randall Fisher, Alan Fu, Susan Gates (RAND), Lynne Giordano, Larry Klapper, Matthias Maier, Andrew Monje, Philip D. Rodgers, Lisa Romney, Garry Shafovaloff, Thomas Sheehan, Nancy Spruill, René Thomas-Rizzo; E. Andrew Long and Catherine Warner (DOT&E); and Edward Goldstein, Jeanette S. McKinney, and Ralph O. White (GAO). Philip S. Anton, Dan Davis, Ken Munson, and Douglas J. Buettner were the primary writers, with very helpful reviews and comments provided by Philip D. Rodgers, Gary R. Bliss, Michael Glennon, Claire Grady, Susan Raps, and Kenyata Wesley. Benjamin Tyree and Michael Shoemaker cheerfully provided excellent editing on a very compressed schedule.

l
Performance of the Defense Acquisition System, 2016
(This page was left blank intentionally)
1
Performance of the Defense Acquisition System, 2016
1. THE ACQUISITION LANDSCAPE AND PERFORMANCE MEASURES
Our acquisition system—its institutions, offices, laboratories, workforce, managers, executives, and industrial partners—conducts research, provides a wide range of services, develops and produces new goods and weapon systems, and sustains these capabilities for warfighters and other operators. The performance of that system is measured relative to its outputs and outcomes of interest. Identifying internal policies, processes, workforce, and management capabilities that bear positively or negatively on those measures requires data and analysis to avoid speculative or cyclical policy choices based on current conventional wisdom and untested hypotheses.
THE DEFENSE ACQUISITION SYSTEM
Institutional performance is all about acquiring value as efficiently (cheaply) as possible. Value to the DoD stems from the immediate benefits (i.e., technical performance) of the goods and services acquired in a responsive time (schedule) compared to the costs to the taxpayer. Hence, measures of cost, schedule, and performance serve as the basis for measuring the effectiveness and efficiency of the acquisition system in converting inputs to outputs (see Figure 1-1). The subsequent operational benefits of the acquired capabilities to address threats and fill capability gaps is more difficult to measure objectively with available data, and we will continue to explore ways to efficiently obtain such data on outcomes.
How Internal Functions and Processes Affect Performance
The acquisition system can be measured at two fundamental levels: (1) the major outputs and outcomes of the system, and (2) the key functions, responsible entities, and institutions responsible within the system to achieve those outputs and outcomes. The most readily available and measurable outcomes assessed throughout the report are cost and schedule performance, but some readily available information on technical performance is analyzed also.
Decomposing the acquisition system into major functional responsibilities enables analysis of how elements of the system affect ultimate outcomes. Intermediate outputs and outcomes of key institutional functions may correlate with cost, schedule, and performance outcomes, but others may be too small or difficult to discern from available data. Nevertheless, a functional decomposition facilitates an understanding of how well the defense acquisition system performs, based on management principles and intermediary outputs and outcomes. As this work moves forward, our greatest challenge remains identifying the relationships between and among factors the DoD can affect (policies, contract terms, incentives, workforce capacity and skills, etc.) and the outcomes sought. This report is a continuing step in that process.
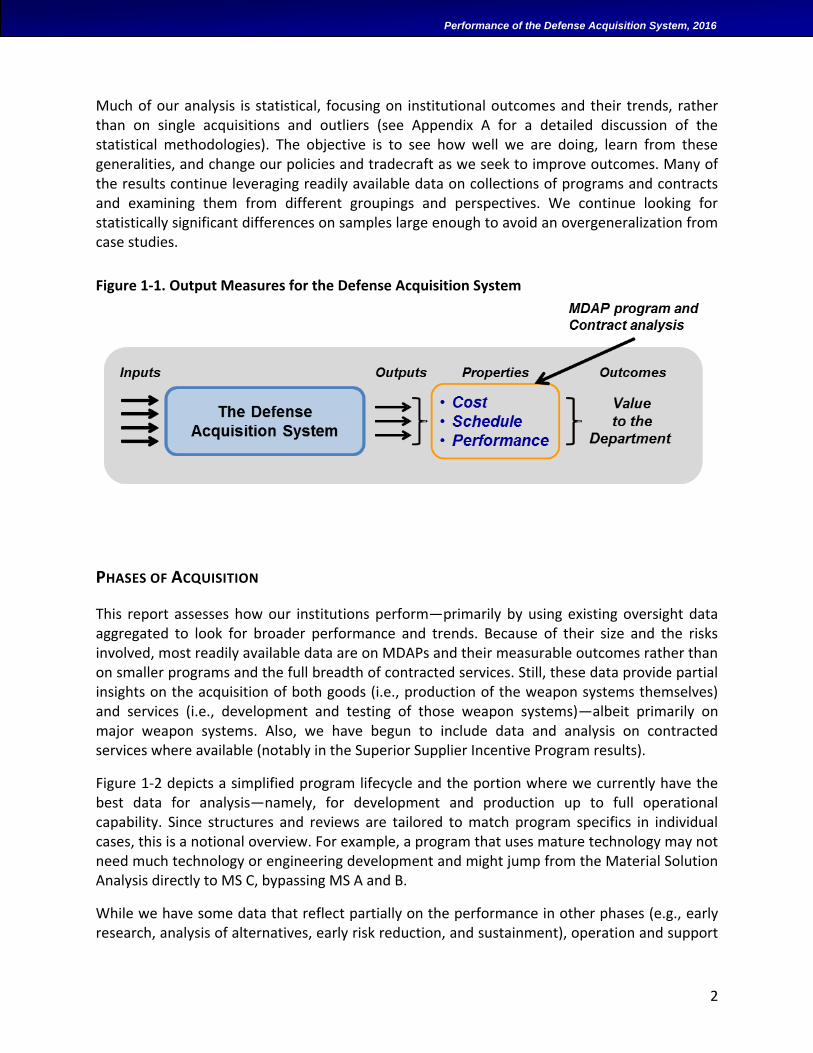
2
Performance of the Defense Acquisition System, 2016
Much of our analysis is statistical, focusing on institutional outcomes and their trends, rather than on single acquisitions and outliers (see Appendix A for a detailed discussion of the statistical methodologies). The objective is to see how well we are doing, learn from these generalities, and change our policies and tradecraft as we seek to improve outcomes. Many of the results continue leveraging readily available data on collections of programs and contracts and examining them from different groupings and perspectives. We continue looking for statistically significant differences on samples large enough to avoid an overgeneralization from case studies.
Figure 1-1. Output Measures for the Defense Acquisition System
PHASES OF ACQUISITION
This report assesses how our institutions perform—primarily by using existing oversight data aggregated to look for broader performance and trends. Because of their size and the risks involved, most readily available data are on MDAPs and their measurable outcomes rather than on smaller programs and the full breadth of contracted services. Still, these data provide partial insights on the acquisition of both goods (i.e., production of the weapon systems themselves) and services (i.e., development and testing of those weapon systems)—albeit primarily on major weapon systems. Also, we have begun to include data and analysis on contracted services where available (notably in the Superior Supplier Incentive Program results).
Figure 1-2 depicts a simplified program lifecycle and the portion where we currently have the best data for analysis—namely, for development and production up to full operational capability. Since structures and reviews are tailored to match program specifics in individual cases, this is a notional overview. For example, a program that uses mature technology may not need much technology or engineering development and might jump from the Material Solution Analysis directly to MS C, bypassing MS A and B.
While we have some data that reflect partially on the performance in other phases (e.g., early research, analysis of alternatives, early risk reduction, and sustainment), operation and support
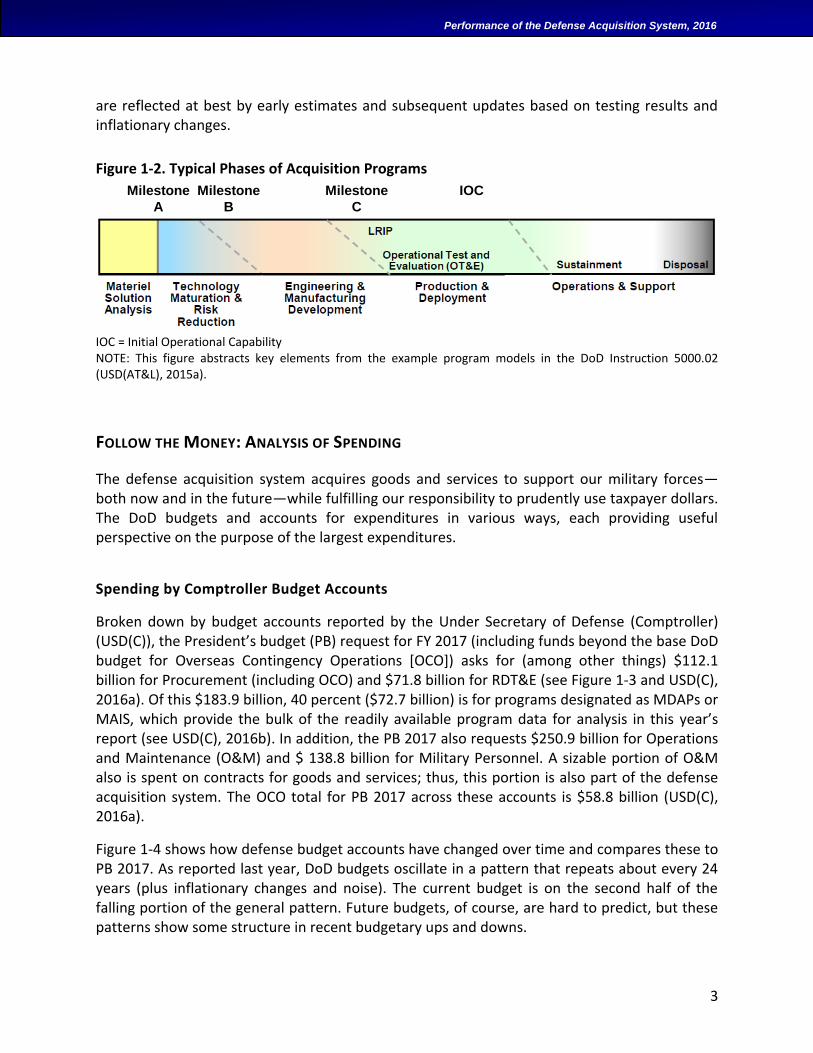
3
Performance of the Defense Acquisition System, 2016
are reflected at best by early estimates and subsequent updates based on testing results and inflationary changes.
Figure 1-2. Typical Phases of Acquisition Programs
IOC = Initial Operational Capability NOTE: This figure abstracts key elements from the example program models in the DoD Instruction 5000.02 (USD(AT&L), 2015a).
FOLLOW THE MONEY: ANALYSIS OF SPENDING
The defense acquisition system acquires goods and services to support our military forces—both now and in the future—while fulfilling our responsibility to prudently use taxpayer dollars. The DoD budgets and accounts for expenditures in various ways, each providing useful perspective on the purpose of the largest expenditures.
Spending by Comptroller Budget Accounts
Broken down by budget accounts reported by the Under Secretary of Defense (Comptroller) (USD(C)), the President’s budget (PB) request for FY 2017 (including funds beyond the base DoD budget for Overseas Contingency Operations [OCO]) asks for (among other things) $112.1 billion for Procurement (including OCO) and $71.8 billion for RDT&E (see Figure 1-3 and USD(C), 2016a). Of this $183.9 billion, 40 percent ($72.7 billion) is for programs designated as MDAPs or MAIS, which provide the bulk of the readily available program data for analysis in this year’s report (see USD(C), 2016b). In addition, the PB 2017 also requests $250.9 billion for Operations and Maintenance (O&M) and $ 138.8 billion for Military Personnel. A sizable portion of O&M also is spent on contracts for goods and services; thus, this portion is also part of the defense acquisition system. The OCO total for PB 2017 across these accounts is $58.8 billion (USD(C), 2016a).
Figure 1-4 shows how defense budget accounts have changed over time and compares these to PB 2017. As reported last year, DoD budgets oscillate in a pattern that repeats about every 24 years (plus inflationary changes and noise). The current budget is on the second half of the falling portion of the general pattern. Future budgets, of course, are hard to predict, but these patterns show some structure in recent budgetary ups and downs.
Milestone
A
Milestone
B
Milestone
C
IOC
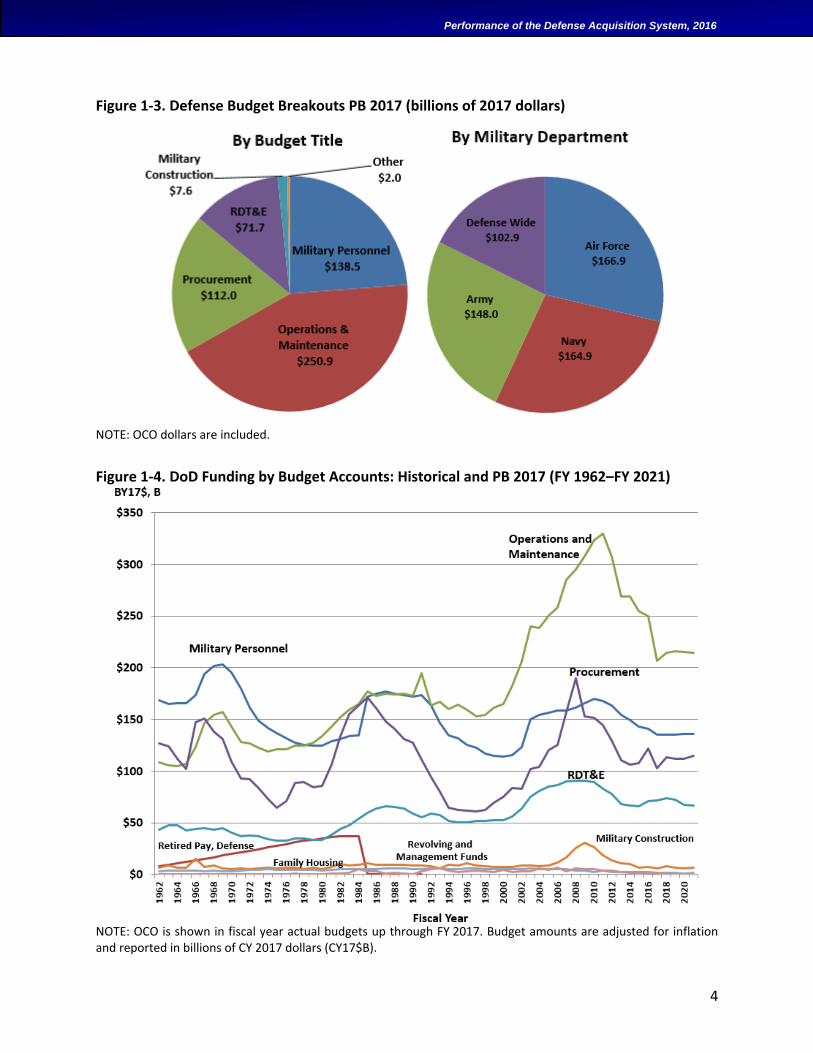
4
Performance of the Defense Acquisition System, 2016
Figure 1-3. Defense Budget Breakouts PB 2017 (billions of 2017 dollars)
NOTE: OCO dollars are included.
Figure 1-4. DoD Funding by Budget Accounts: Historical and PB 2017 (FY 1962–FY 2021)
NOTE: OCO is shown in fiscal year actual budgets up through FY 2017. Budget amounts are adjusted for inflation and reported in billions of CY 2017 dollars (CY17$B).
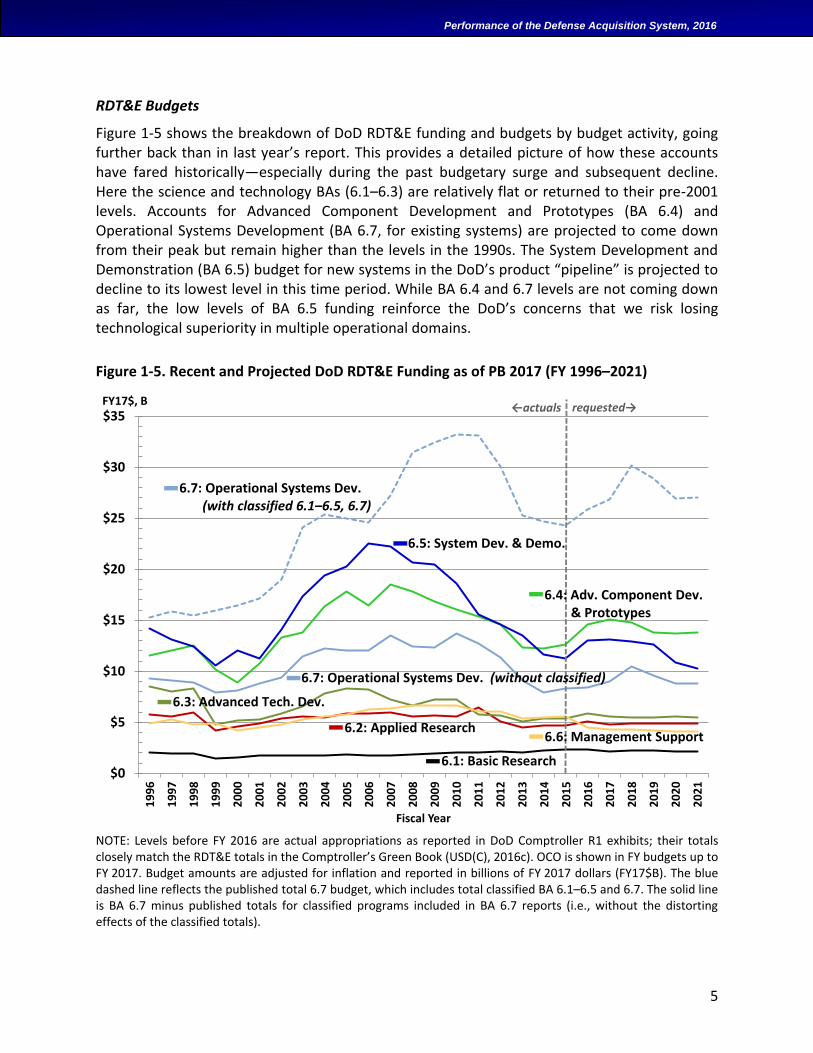
5
Performance of the Defense Acquisition System, 2016
RDT&E Budgets
Figure 1-5 shows the breakdown of DoD RDT&E funding and budgets by budget activity, going further back than in last year’s report. This provides a detailed picture of how these accounts have fared historically—especially during the past budgetary surge and subsequent decline. Here the science and technology BAs (6.1–6.3) are relatively flat or returned to their pre-2001 levels. Accounts for Advanced Component Development and Prototypes (BA 6.4) and Operational Systems Development (BA 6.7, for existing systems) are projected to come down from their peak but remain higher than the levels in the 1990s. The System Development and Demonstration (BA 6.5) budget for new systems in the DoD’s product “pipeline” is projected to decline to its lowest level in this time period. While BA 6.4 and 6.7 levels are not coming down as far, the low levels of BA 6.5 funding reinforce the DoD’s concerns that we risk losing technological superiority in multiple operational domains.
Figure 1-5. Recent and Projected DoD RDT&E Funding as of PB 2017 (FY 1996–2021)
NOTE: Levels before FY 2016 are actual appropriations as reported in DoD Comptroller R1 exhibits; their totals closely match the RDT&E totals in the Comptroller’s Green Book (USD(C), 2016c). OCO is shown in FY budgets up to FY 2017. Budget amounts are adjusted for inflation and reported in billions of FY 2017 dollars (FY17$B). The blue dashed line reflects the published total 6.7 budget, which includes total classified BA 6.1–6.5 and 6.7. The solid line is BA 6.7 minus published totals for classified programs included in BA 6.7 reports (i.e., without the distorting effects of the classified totals).
$0
$5
$10
$15
$20
$25
$30
$35
19
96
19
97
19
98
19
99
20
00
20
01
20
02
20
03
20
04
20
05
20
06
20
07
20
08
20
09
20
10
20
11
20
12
20
13
20
14
20
15
20
16
20
17
20
18
20
19
20
20
20
21
Fiscal Year
FY17$, B
6.5: System Dev. & Demo.
6.1: Basic Research
←actuals requested→
6.4: Adv. Component Dev.& Prototypes
6.6: Management Support
6.7: Operational Systems Dev. (with classified 6.1–6.5, 6.7)
6.3: Advanced Tech. Dev.
6.2: Applied Research
6.7: Operational Systems Dev. (without classified)
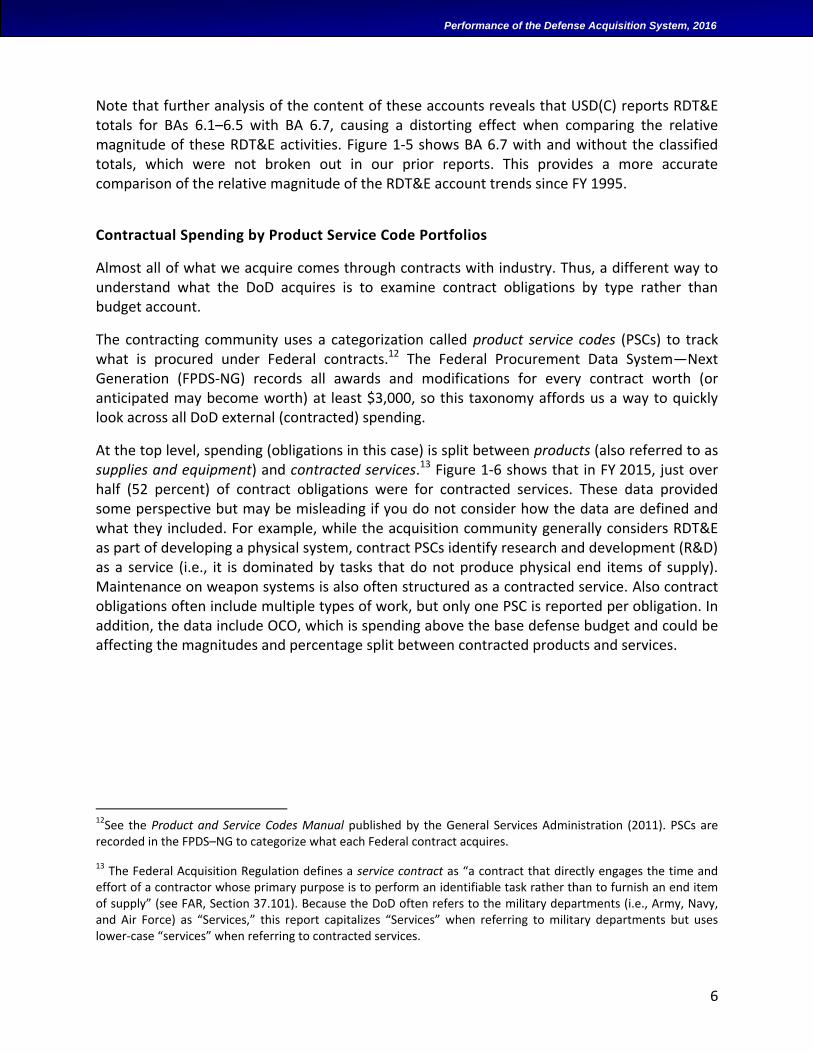
6
Performance of the Defense Acquisition System, 2016
Note that further analysis of the content of these accounts reveals that USD(C) reports RDT&E totals for BAs 6.1–6.5 with BA 6.7, causing a distorting effect when comparing the relative magnitude of these RDT&E activities. Figure 1-5 shows BA 6.7 with and without the classified totals, which were not broken out in our prior reports. This provides a more accurate comparison of the relative magnitude of the RDT&E account trends since FY 1995.
Contractual Spending by Product Service Code Portfolios
Almost all of what we acquire comes through contracts with industry. Thus, a different way to understand what the DoD acquires is to examine contract obligations by type rather than budget account.
The contracting community uses a categorization called product service codes (PSCs) to track what is procured under Federal contracts.12 The Federal Procurement Data System—Next Generation (FPDS-NG) records all awards and modifications for every contract worth (or anticipated may become worth) at least $3,000, so this taxonomy affords us a way to quickly look across all DoD external (contracted) spending.
At the top level, spending (obligations in this case) is split between products (also referred to as supplies and equipment) and contracted services.13 Figure 1-6 shows that in FY 2015, just over half (52 percent) of contract obligations were for contracted services. These data provided some perspective but may be misleading if you do not consider how the data are defined and what they included. For example, while the acquisition community generally considers RDT&E as part of developing a physical system, contract PSCs identify research and development (R&D) as a service (i.e., it is dominated by tasks that do not produce physical end items of supply). Maintenance on weapon systems is also often structured as a contracted service. Also contract obligations often include multiple types of work, but only one PSC is reported per obligation. In addition, the data include OCO, which is spending above the base defense budget and could be affecting the magnitudes and percentage split between contracted products and services.
12See the Product and Service Codes Manual published by the General Services Administration (2011). PSCs are recorded in the FPDS–NG to categorize what each Federal contract acquires.
13 The Federal Acquisition Regulation defines a service contract as “a contract that directly engages the time and effort of a contractor whose primary purpose is to perform an identifiable task rather than to furnish an end item of supply” (see FAR, Section 37.101). Because the DoD often refers to the military departments (i.e., Army, Navy, and Air Force) as “Services,” this report capitalizes “Services” when referring to military departments but uses lower-case “services” when referring to contracted services.
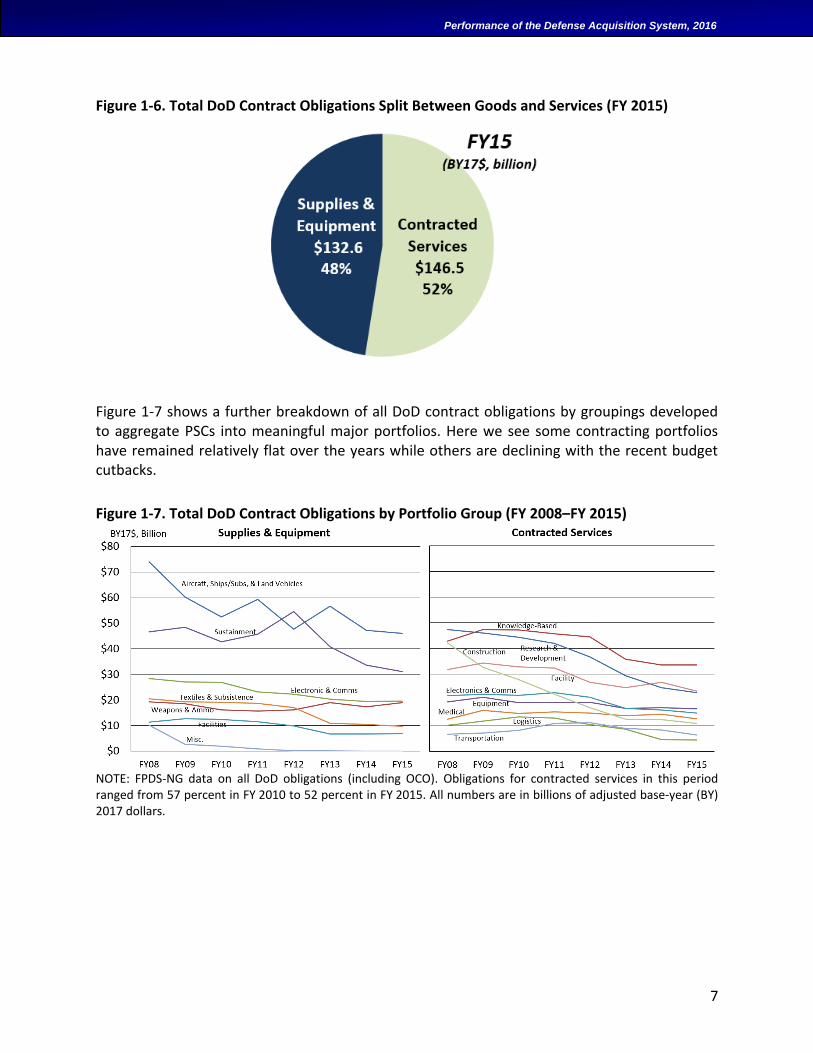
7
Performance of the Defense Acquisition System, 2016
Figure 1-6. Total DoD Contract Obligations Split Between Goods and Services (FY 2015)
Figure 1-7 shows a further breakdown of all DoD contract obligations by groupings developed to aggregate PSCs into meaningful major portfolios. Here we see some contracting portfolios have remained relatively flat over the years while others are declining with the recent budget cutbacks.
Figure 1-7. Total DoD Contract Obligations by Portfolio Group (FY 2008–FY 2015)
NOTE: FPDS-NG data on all DoD obligations (including OCO). Obligations for contracted services in this period ranged from 57 percent in FY 2010 to 52 percent in FY 2015. All numbers are in billions of adjusted base-year (BY) 2017 dollars.
8
Performance of the Defense Acquisition System, 2016
ON MEASURING PERFORMANCE
Scope of Outcomes: Programs or Their Constituent Contracts
Our analyses often examine two main types of performance data:
Program-level data—describing measurements across the entire program (e.g., growth in planned total funding from MS B baseline as reported in the SARs and MARs, including past actual funding, current funding requests, planned funding in the FYDP,
and estimated needed funding beyond the FYDP to the end of the program). Data sources include the SARs, MARs, DOT&E’s BLRIP reports, oversight data, the Contractor Performance Assessment Reporting System (CPARS), and review documentation.
Contract-level data—describing measurements on one of the many contracts that constitute a program (e.g., the total cost growth from original negotiated contract target cost for an early lot of units procured). Data sources include Earned Value (EV) Central Repository, FPDS-NG, GAO bid-protest data, and cost data reports.
Program-level measures show how well the acquisition system developed the ability to produce the overall program against original baselines despite quantity changes, while providing insight into whether cost growth may have been a factor in quantity changes. Contract-level measures provide early indicators of potential program-level issues by examining performance when the DoD contracts for specific work from industry. Nearly all the actual research, development, and production on weapon systems are performed by industry partners through contracts with the DoD. Thus, examining performance at the contract level provides detailed and potentially useful indicators of performance that eventually will be seen at the more aggregate program level. This report often switches between these types of data as we examine different types of institutions (e.g., DoD-wide or military departments) and different phases of acquisition (e.g., development or early production).
While contracts are the key execution elements of a program (i.e., most goods and even services are provided by contractors), they have different baselines (e.g., contract cost targets) set at different times than the program’s MS B baseline. Performance on individual contracts can be measured earlier than their effects might show up in program-level measures. However, because there often are numerous contracts within a program, and program baselines are not equivalent to contract cost targets, an individual contract performance may not necessarily reflect the performance revealed in program-level measurements. Thus, it is important to recognize what type of data is discussed at each point in the report.
Also, care must be taken to note whether cost data have been adjusted for inflation. Often the available program-level budget data we used have been adjusted for inflation (i.e., reported in “base-year” [BY] dollars), but some contract-level cost-growth data have not been adjusted (i.e., are reported only in “then-year” [TY] dollars, and insufficient temporal information was
9
Performance of the Defense Acquisition System, 2016
available for us to adjust the reported figures for inflation). Thus, partly because of inflation, the program-level cost-growth figures in this report may be lower than those for some contract-level analyses.
Avoiding Maturity Bias in Testing for Recent Improvements
A primary reason for systematically measuring our performance is to determine objectively whether we are improving (i.e., whether our efforts are helped by recent policy and processes changes such as WSARA of 2009, three iterations of BBP14, major efficiency drives, and continued investments in the acquisition workforce training and hiring). By their nature, recent programs and contracts have less cost and schedule growth because they are newer and have not had time to realize any growth. Unfortunately, waiting until they are complete will take many years—sometimes decades. This is but one challenge in comparing performance (other variables in the portfolio include shifting commodity mixes, budgetary changes, multiple parallel policy and process changes, etc.) and is a key analytic concern.
Rather than wait for the completion of programs and contracts before measuring their performance, we take the middle ground of controlling for immature programs in many of our analyses. The cost community generally has found that programs and contracts with large cost or schedule growth will begin seeing and reflecting it in their estimates by the time they have executed about 30 percent of their originally planned schedule. Thus, analyses in this report that control for maturity exclude newer programs and contracts that have not yet reached this point. This, of course, is not the final word, but it does allow us to reflect much of the anticipated performance problems and get a reasonable sense of recent performance.
Additional methods include examining incremental (marginal) growth rather than just total growth since inception. Our program-level analyses, for example, examine biennial change as a way of seeing if growth is added (or removed) on top of original estimates. If recent programs or contracts are worsening, we should be able to see that in the marginal change data.
Measuring Performance on Contracts
Price, schedule, and technical performance are key contract outcomes of interest. Ultimately, the cost to the contractor of providing a good or service relates in various ways to the price paid by the government. Thus, we often examine cost, price, or both (when possible). In most cases and where noted, contract price and cost data are adjusted for inflation. This allows us to distinguish real price and cost growth performance independent of inflationary effects. As for technical performance data, they are reported to the program office and are not generally available in the Office of the Secretary of Defense (OSD) for analysis.
14 See USD(AT&L), 2010, 2013a, and 2015d.
10
Performance of the Defense Acquisition System, 2016
Analysis of Work Content Growth and Cost-Over-Target
In other datasets, we do not have profit or fee data but can break down total cost growth into two broad elements of work-content growth and cost-over-target. Work-content growth is simply the change in the contract budget base (CBB), which reflects the contract target cost since contract initiation. Cost-over-target is the latest PM estimate at completion (EAC) minus the latest CBB, all divided by the original CBB. Unless otherwise indicated, all these contract cost data are reported in TY dollars and are thus not adjusted for inflation.
Note that contract targets themselves are not pure, unbiased estimates of project cost. In addition to expected project scale (size) they also reflect other contract terms, such as the share lines, incentive terms, as well as market contestability and the general negotiating environment. Thus, in part they are the result of bidding strategies.
11
Performance of the Defense Acquisition System, 2016
2. ACQUISITION SYSTEM OUTCOMES AND TRENDS
A key to improving acquisition is learning from our successes and failures. Without looking at results of past actions, we have no feedback to inform whether our hypotheses and beliefs pan out in the complicated world of defense acquisition. Objectively examining the relative effectiveness of DoD acquisition Components and institutions while attempting to distinguish which factors and variables affect outcomes not only allows us to identify successes and failures, but also begins to lead us to specific lessons we can try to replicate—and control points we can exploit.
The following analyses examine key outcomes of cost, schedule, and technical performance of MDAPs across the DoD and by Components, commodities, and prime contractors—measured at program and contract levels. Combined, these analyses provide insight into potential cause-and-effect relationships, focusing attention on problems as early as possible, clarifying misunderstandings, and informing assessments and learning.
For our analyses of program data, note that the MDAPs examined are in varying states of maturity—from early programs that may or may not develop future problems, to mature programs adding new capabilities to existing systems, to completed programs.
We often use readily available EV data for our analyses of major MDAP contracts. This includes the six largest contracts per MDAP (prime, associated, or for government-furnished equipment) valued at over $40 million (TY dollars) but usually not firm-fixed-price contracts—see Title 10 of United States Code (U.S.C.) Section 2432. This also may include other EV-reporting contracts for MDAPs. These contracts may be for development or production. Unless noted, all datasets consist of all readily available cases rather than a statistical sampling from a larger set. In some analyses when we are trying to ascertain the general tendency of the population, we remove statistical outliers using standard tests; and these instances are noted. Otherwise, we include all data, including outliers. Also, we often report medians because this is a better measure of central tendency or “average” for skewed distributions than arithmetic means, which exaggerate the effect of outliers.15
15Part of the skewing in the distribution of cost change is the mathematical boundary of cost change because cost cannot decrease more than 100 percent, but it can increase more than 100 percent.
12
Performance of the Defense Acquisition System, 2016
COST-RELATED FUNDING GROWTH AND DEFENSE ACQUISITION EXECUTIVES
Policy and execution decisions by DoD executives should bear (in part) on the effectiveness of the overall acquisition system during their tenures. This is particularly true for the program structure and associated baselines set at MS B, against which future cost performance is measured. Such decisions include changes to the defense acquisition system policies and procedures (e.g., through changes in departmental regulations); approvals, certifications, and exemptions within that system; institutional organization, policies, and processes; incentives; personnel selection, training, and mentoring; guidance and execution on larger programs, including acquisition strategies and choices; and myriad other effects. More specifically, the acquisition executives chair the boards that review programs at major milestones, guiding both program directions and specific approaches to contracting. Therefore, in our annual reports we track the performance of programs started under different acquisition executives to help reinforce accountability and provide an initial look for possible trends for further analysis.
Figure 2-1 and Figure 2-2 show growth in planned total funding against original baselines for development and procurement as reported to Congress in the SARs on active and completed MDAPs. Note that SAR funding data reflect what the PM currently estimates will be needed in total by the end of the program for the current program configuration, including past actual funding, the current budget request, planned funding in the FYDP, and planned funding beyond the FYDP to the end of the program. Growth is measured against the baseline set at the original MS B and can be positive or negative.
These figures also show the DAE at the time of the MDAP’s MS B approval; this infers influence through the DAE’s policies and could include direct influence if the DAE was the MDA for the program. Later in the report we show similar charts for the programs started under different SAEs in the three military departments. We use total needed program funding instead of contract cost growth for these charts since needed funding is measured directly against the MS B baseline set by the DAE (see the discussion starting on p. 66).
Caution is warranted, however. These charts neither reflect the effectiveness of subsequent oversight or major program changes by later DAEs during execution oversight, nor do they report statistical analysis that controls for other internal and external variables that could have led to program success or problems. Also, as we mention above, each measure has its strengths and weaknesses, so attributing performance to a single measure is subject to the limitations of that measure. For example, some programs may appear to be performing well in terms of total needed RDT&E funding but may be having problems reflected in other measures (e.g., total needed procurement funding, estimated operational costs, and cost growth on one of the program’s major contracts). Thus, a combined examination of available data is important before reaching conclusions.
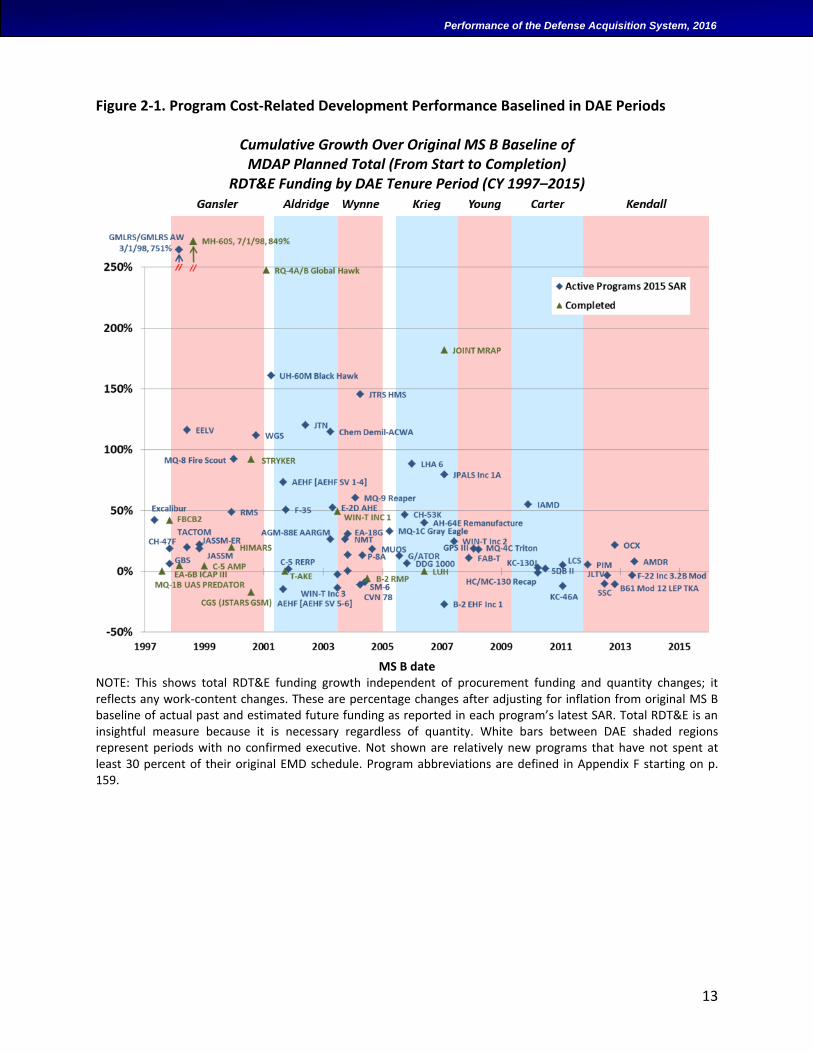
13
Performance of the Defense Acquisition System, 2016
Figure 2-1. Program Cost-Related Development Performance Baselined in DAE Periods
Cumulative Growth Over Original MS B Baseline of MDAP Planned Total (From Start to Completion)
RDT&E Funding by DAE Tenure Period (CY 1997–2015)
MS B date
NOTE: This shows total RDT&E funding growth independent of procurement funding and quantity changes; it reflects any work-content changes. These are percentage changes after adjusting for inflation from original MS B baseline of actual past and estimated future funding as reported in each program’s latest SAR. Total RDT&E is an insightful measure because it is necessary regardless of quantity. White bars between DAE shaded regions represent periods with no confirmed executive. Not shown are relatively new programs that have not spent at least 30 percent of their original EMD schedule. Program abbreviations are defined in Appendix F starting on p. 159.
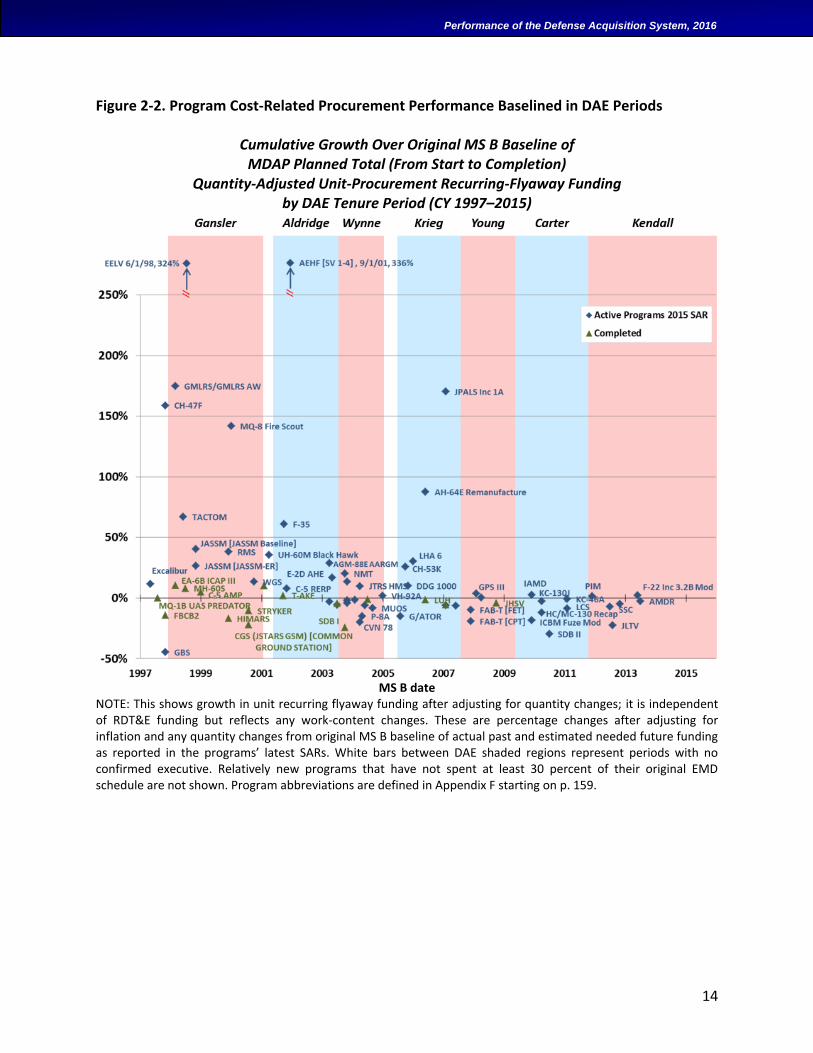
14
Performance of the Defense Acquisition System, 2016
Figure 2-2. Program Cost-Related Procurement Performance Baselined in DAE Periods
Cumulative Growth Over Original MS B Baseline of MDAP Planned Total (From Start to Completion)
Quantity-Adjusted Unit-Procurement Recurring-Flyaway Funding by DAE Tenure Period (CY 1997–2015)
MS B date
NOTE: This shows growth in unit recurring flyaway funding after adjusting for quantity changes; it is independent of RDT&E funding but reflects any work-content changes. These are percentage changes after adjusting for inflation and any quantity changes from original MS B baseline of actual past and estimated needed future funding as reported in the programs’ latest SARs. White bars between DAE shaded regions represent periods with no confirmed executive. Relatively new programs that have not spent at least 30 percent of their original EMD schedule are not shown. Program abbreviations are defined in Appendix F starting on p. 159.
15
Performance of the Defense Acquisition System, 2016
OPERATIONAL PERFORMANCE OF ACQUIRED SYSTEMS
While most of this report discusses outcome measures of cost and schedule, this section summarizes some readily available independent assessments of operational performance of weapon systems.
Operational Testing Results
Definitions
One measure of technical performance of acquired systems is how they rate, as a group, in operational effectiveness and suitability as assessed by DOT&E.16 Operational effectiveness is defined in the Joint Capabilities Integration and Development System (JCIDS) Manual (CJCS, 2015) as: "Measure of the overall ability of a system to accomplish a mission when used by representative personnel in the environment planned or expected for operational employment of the system considering organization, doctrine, tactics, supportability, survivability, vulnerability, and threat." Operational suitability is a composite evaluation that considers a system's safety, interoperability, availability, maintainability, and reliability. Operational effectiveness and suitability are not measured solely on the basis of system requirements (e.g., Key Performance Parameters [KPPs] and Key System Attributes [KSAs]). Rather, measurements are accomplished through an evaluation that includes the system under test and all interrelated systems (including weapons, sensors, command and control, and platforms) needed to accomplish a combat mission in expected environments.
Reliability is a measure of the probability that the system will perform without failure over a specific interval, under specified conditions. Materiel availability is the measure of the percentage of the total inventory of a system operationally capable, based on materiel condition, of performing an assigned mission. Operational availability is the measure of the percentage of time that a system or group of systems within a unit are operationally capable of performing an assigned mission and can be expressed as uptime/(uptime + downtime). Maintainability is the ability of the system to be brought back to a state of normal function or utility. Maintainability is normally expressed as Mean-Down-Time, Mean-Time-to-Repair or a calculation of ease of maintainability. Supportability is the ability of the system to identify and/or predict failures down to a certain subsystem level within a given percentage of accuracy. Survivability is intended to ensure the system maintains its critical capabilities under applicable threat environments and may include reducing a system’s likelihood of being engaged by hostile fire, through attributes such as speed, maneuverability, detectability, and
16 DOT&E is independent statutorily from the acquisition organizations and is responsible for, among other things, reporting the operational test results for all MDAPs to the Secretary of Defense, USD(AT&L), Service Secretaries, and Congress. Operational test and evaluation is “the field test, under realistic combat conditions, of any item of (or key component of) weapons, equipment, or munitions for the purpose of determining the effectiveness and suitability of the weapons, equipment, or munitions for use in combat by typical military users; and the evaluation of the results of such test” (10 U.S.C., Section 139(a)(2)(A)).
16
Performance of the Defense Acquisition System, 2016
countermeasures; reducing the system’s vulnerability if hit by hostile fire, through attributes such as armor and redundancy of critical components; enabling operation in degraded electromagnetic, space, or cyber environments; and allowing the system to survive and continue to operate in, or after exposure to, a Chemical, Biological, Radiological, or Nuclear (CBRN) environment, if required (CJCS, 2015).
We also discuss below the conditional probability of being effectiveness given test results for test adequacy, survivability, and lethality. The performance levels for these metrics are defined in each system’s requirements documents.17
Developmental testing occurs throughout the earlier phases of a program's acquisition. It is intended to provide feedback to designers to verify performance and to discover and correct issues so that, by the time of operational testing on production representative test articles, major performance issues should be rarely discovered.
Note that in some cases results were not determined by DOT&E and thus were excluded from our data plots. In addition to new program evaluations, the number of programs in each sample also varies from last year because we now restrict our plots to DOT&E BLRIP summary data to improve consistency.
Trends in Operational Testing of Effectiveness and Suitability
The following figure shows no statistically significant trends (up or down) in DOT&E's assessments of operational performance of weapon systems across the DoD. Given the relative infrequency in which programs come up for operational testing, we grouped ratings into three sets of periods: FY 1984–2001, FY 2001–2008, and FY 2009 through the first quarter of FY 2016. Generally, it appears that performance dropped somewhat since FY 2001 compared to prior years (e.g., in the number of systems rated fully effective and the number of partially suitable systems). This perceived drop may be due in part to an overall trend of more complex, multi-mission systems. These changes nevertheless are not statistically significant. In other words, statistically the DoD’s newly acquired systems perform in operational tests about as well as they always have through FY 1984 to present. In our ability to acquire quality systems, there is no degradation (or improvement) dramatic enough to be measurable statistically considering the relatively few programs in question.
17 These are defined as follows. The DoD Test and Evaluation Management Guide defines test adequacy as having the amount of data and realism of test conditions sufficient to support the evaluation of the critical operational issues (COIs). 10 U.S.C. Section 2366(e)(3) defines realistic survivability testing as “…testing for vulnerability of the system in combat by firing munitions likely to be encountered in combat (or munitions with a capability similar to such munitions) at the system configured for combat, with the primary emphasis on testing vulnerability with respect to potential user casualties and taking into equal consideration the susceptibility to attack and combat performance of the system.” 10 U.S.C. Section 2366(e)(4) defines realistic lethality testing in the case of a major munitions program or a missile program (or a covered product improvement program for such a program), as “…testing for lethality by firing the munition or missile concerned at appropriate targets configured for combat.”
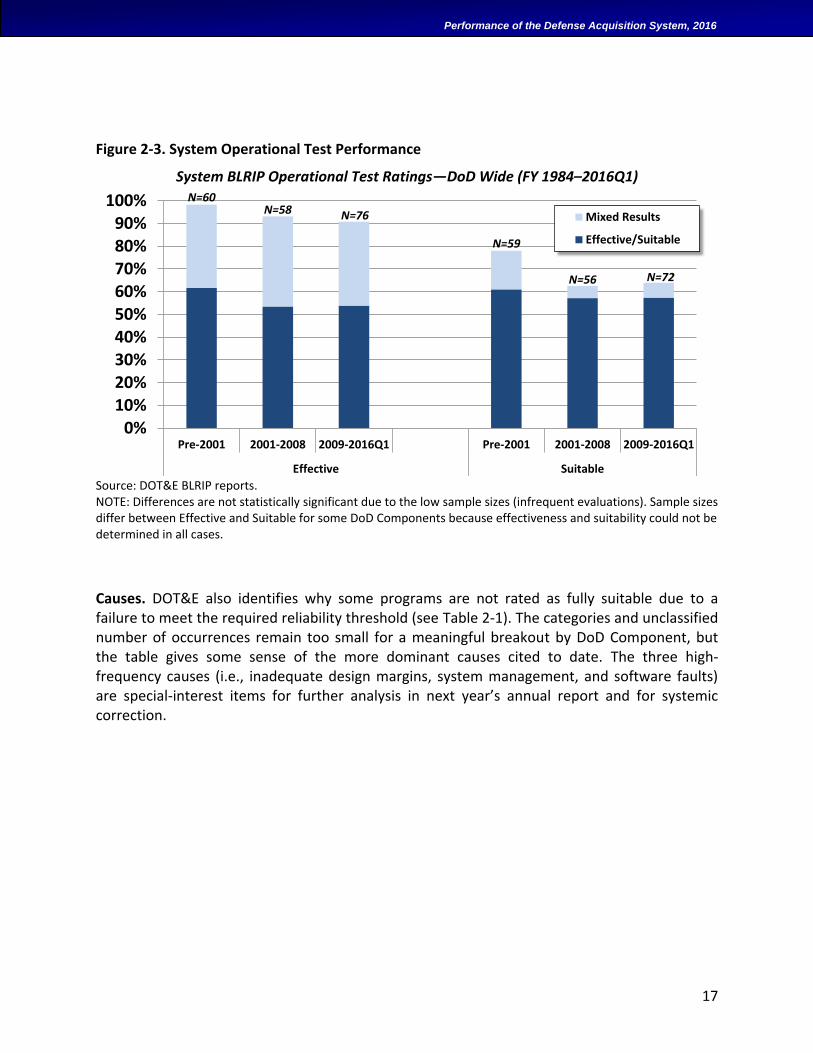
17
Performance of the Defense Acquisition System, 2016
Figure 2-3. System Operational Test Performance
System BLRIP Operational Test Ratings—DoD Wide (FY 1984–2016Q1)
Source: DOT&E BLRIP reports. NOTE: Differences are not statistically significant due to the low sample sizes (infrequent evaluations). Sample sizes differ between Effective and Suitable for some DoD Components because effectiveness and suitability could not be determined in all cases.
Causes. DOT&E also identifies why some programs are not rated as fully suitable due to a failure to meet the required reliability threshold (see Table 2-1). The categories and unclassified number of occurrences remain too small for a meaningful breakout by DoD Component, but the table gives some sense of the more dominant causes cited to date. The three high-frequency causes (i.e., inadequate design margins, system management, and software faults) are special-interest items for further analysis in next year’s annual report and for systemic correction.
N=60N=58 N=76
N=59
N=56 N=72
0%10%20%30%40%50%60%70%80%90%
100%
Pre-2001 2001-2008 2009-2016Q1 Pre-2001 2001-2008 2009-2016Q1
Effective Suitable
Mixed Results
Effective/Suitable
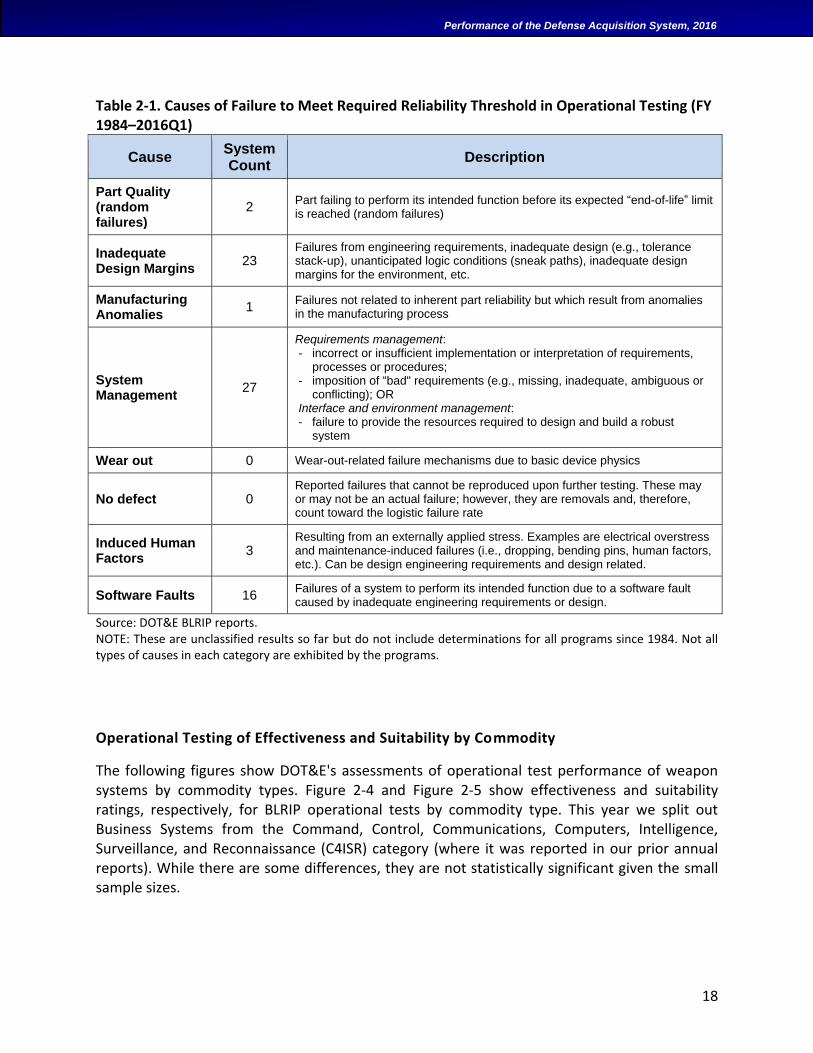
18
Performance of the Defense Acquisition System, 2016
Table 2-1. Causes of Failure to Meet Required Reliability Threshold in Operational Testing (FY 1984–2016Q1)
Cause System Count
Description
Part Quality (random failures)
2 Part failing to perform its intended function before its expected “end-of-life” limit is reached (random failures)
Inadequate Design Margins
23 Failures from engineering requirements, inadequate design (e.g., tolerance stack-up), unanticipated logic conditions (sneak paths), inadequate design margins for the environment, etc.
Manufacturing Anomalies
1 Failures not related to inherent part reliability but which result from anomalies in the manufacturing process
System Management
27
Requirements management: - incorrect or insufficient implementation or interpretation of requirements,
processes or procedures; - imposition of “bad" requirements (e.g., missing, inadequate, ambiguous or
conflicting); OR Interface and environment management: - failure to provide the resources required to design and build a robust
system
Wear out 0 Wear-out-related failure mechanisms due to basic device physics
No defect 0 Reported failures that cannot be reproduced upon further testing. These may or may not be an actual failure; however, they are removals and, therefore, count toward the logistic failure rate
Induced Human Factors
3 Resulting from an externally applied stress. Examples are electrical overstress and maintenance-induced failures (i.e., dropping, bending pins, human factors, etc.). Can be design engineering requirements and design related.
Software Faults 16 Failures of a system to perform its intended function due to a software fault caused by inadequate engineering requirements or design.
Source: DOT&E BLRIP reports. NOTE: These are unclassified results so far but do not include determinations for all programs since 1984. Not all types of causes in each category are exhibited by the programs.
Operational Testing of Effectiveness and Suitability by Commodity
The following figures show DOT&E's assessments of operational test performance of weapon systems by commodity types. Figure 2-4 and Figure 2-5 show effectiveness and suitability ratings, respectively, for BLRIP operational tests by commodity type. This year we split out Business Systems from the Command, Control, Communications, Computers, Intelligence, Surveillance, and Reconnaissance (C4ISR) category (where it was reported in our prior annual reports). While there are some differences, they are not statistically significant given the small sample sizes.
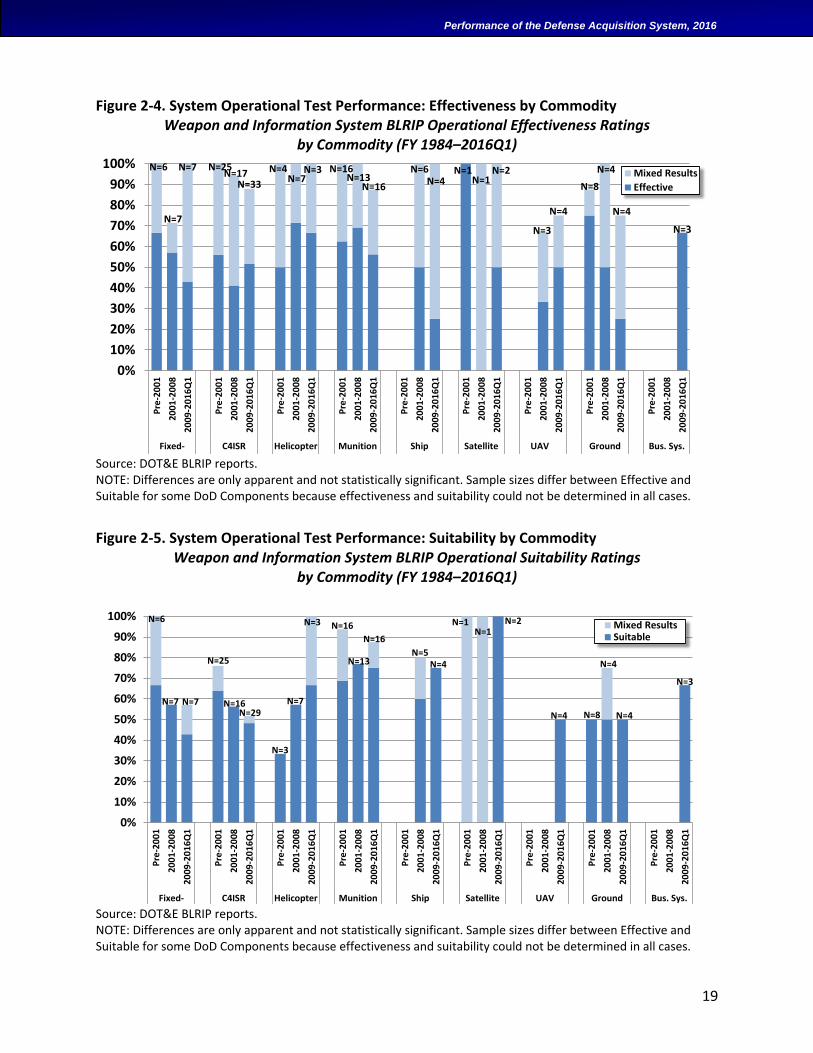
19
Performance of the Defense Acquisition System, 2016
Figure 2-4. System Operational Test Performance: Effectiveness by Commodity Weapon and Information System BLRIP Operational Effectiveness Ratings
by Commodity (FY 1984–2016Q1)
Source: DOT&E BLRIP reports. NOTE: Differences are only apparent and not statistically significant. Sample sizes differ between Effective and Suitable for some DoD Components because effectiveness and suitability could not be determined in all cases.
Figure 2-5. System Operational Test Performance: Suitability by Commodity Weapon and Information System BLRIP Operational Suitability Ratings
by Commodity (FY 1984–2016Q1)
Source: DOT&E BLRIP reports. NOTE: Differences are only apparent and not statistically significant. Sample sizes differ between Effective and Suitable for some DoD Components because effectiveness and suitability could not be determined in all cases.
N=6
N=7
N=7N=17
N=33
N=25N=7
N=16N=13
N=6N=4
N=4
N=16
N=4
N=3
N=8
N=4N=1N=1
N=2
N=3
N=4
N=3
0%
10%
20%
30%
40%
50%
60%
70%
80%
90%
100%P
re-2
001
2001
-20
08
200
9-2
01
6Q
1
Pre
-20
01
200
1-2
00
8
2009
-20
16Q
1
Pre
-20
01
2001
-20
08
2009
-20
16Q
1
Pre
-20
01
2001
-20
08
2009
-20
16Q
1
Pre
-20
01
2001
-20
08
2009
-20
16Q
1
Pre
-20
01
2001
-20
08
2009
-20
16Q
1
Pre
-20
01
2001
-20
08
2009
-20
16Q
1
Pre
-20
01
2001
-20
08
2009
-20
16Q
1
Pre
-20
01
2001
-20
08
2009
-20
16Q
1
Fixed-Wing
C4ISR Helicopter Munition Ship Satellite UAV GroundVehicle
Bus. Sys.
Mixed Results
Effective
N=6
N=7 N=7 N=16N=29
N=3
N=25
N=16
N=13N=5
N=4
N=7
N=1
N=4 N=8
N=4
N=16
N=3N=1
N=4
N=2
N=3
0%
10%
20%
30%
40%
50%
60%
70%
80%
90%
100%
Pre
-20
01
2001
-20
08
2009
-20
16Q
1
Pre
-20
01
2001
-20
08
2009
-20
16Q
1
Pre
-20
01
2001
-20
08
2009
-20
16Q
1
Pre
-20
01
2001
-20
08
2009
-20
16Q
1
Pre
-20
01
2001
-20
08
2009
-20
16Q
1
Pre
-20
01
2001
-20
08
2009
-20
16Q
1
Pre
-20
01
2001
-20
08
2009
-20
16Q
1
Pre
-20
01
2001
-20
08
2009
-20
16Q
1
Pre
-20
01
2001
-20
08
2009
-20
16Q
1
Fixed-Wing
C4ISR Helicopter Munition Ship Satellite UAV GroundVehicle
Bus. Sys.
Mixed ResultsSuitable
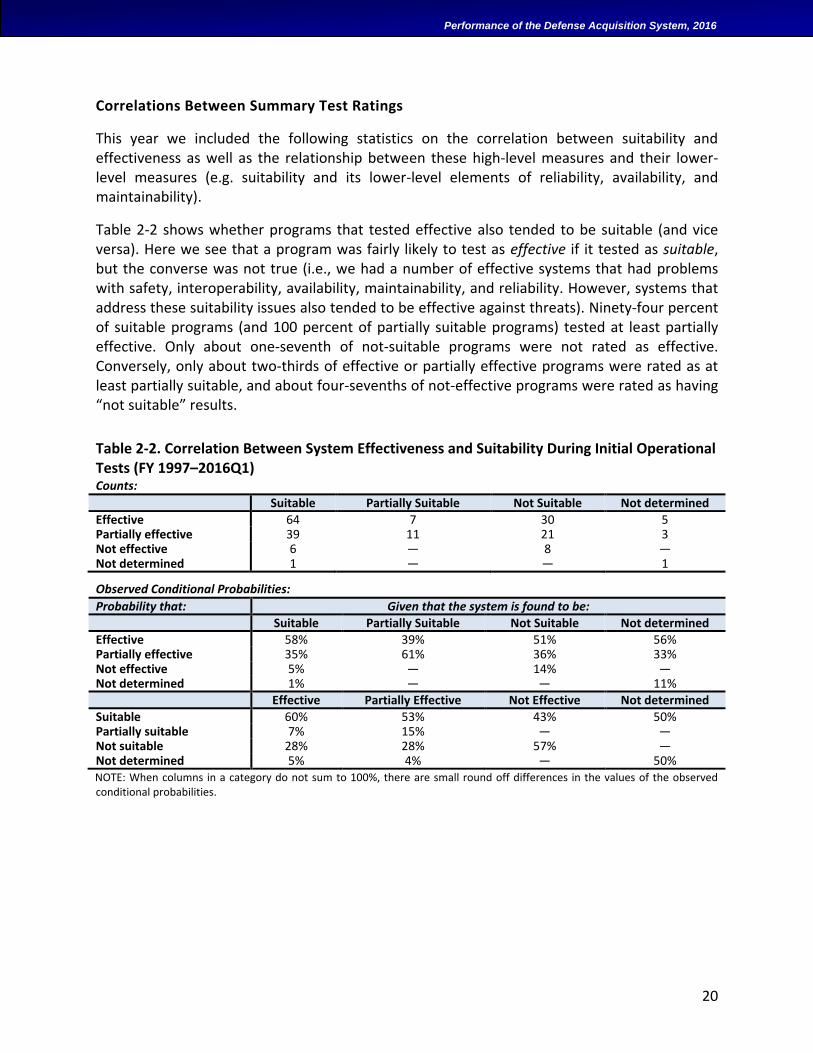
20
Performance of the Defense Acquisition System, 2016
Correlations Between Summary Test Ratings
This year we included the following statistics on the correlation between suitability and effectiveness as well as the relationship between these high-level measures and their lower-level measures (e.g. suitability and its lower-level elements of reliability, availability, and maintainability).
Table 2-2 shows whether programs that tested effective also tended to be suitable (and vice versa). Here we see that a program was fairly likely to test as effective if it tested as suitable, but the converse was not true (i.e., we had a number of effective systems that had problems with safety, interoperability, availability, maintainability, and reliability. However, systems that address these suitability issues also tended to be effective against threats). Ninety-four percent of suitable programs (and 100 percent of partially suitable programs) tested at least partially effective. Only about one-seventh of not-suitable programs were not rated as effective. Conversely, only about two-thirds of effective or partially effective programs were rated as at least partially suitable, and about four-sevenths of not-effective programs were rated as having “not suitable” results.
Table 2-2. Correlation Between System Effectiveness and Suitability During Initial Operational Tests (FY 1997–2016Q1) Counts:
Suitable Partially Suitable Not Suitable Not determined
Effective 64 7 30 5 Partially effective 39 11 21 3 Not effective 6 — 8 — Not determined 1 — — 1
Observed Conditional Probabilities:
Probability that: Given that the system is found to be:
Suitable Partially Suitable Not Suitable Not determined Effective 58% 39% 51% 56% Partially effective 35% 61% 36% 33% Not effective 5% — 14% — Not determined 1% — — 11% Effective Partially Effective Not Effective Not determined
Suitable 60% 53% 43% 50% Partially suitable 7% 15% — — Not suitable 28% 28% 57% — Not determined 5% 4% — 50% NOTE: When columns in a category do not sum to 100%, there are small round off differences in the values of the observed conditional probabilities.
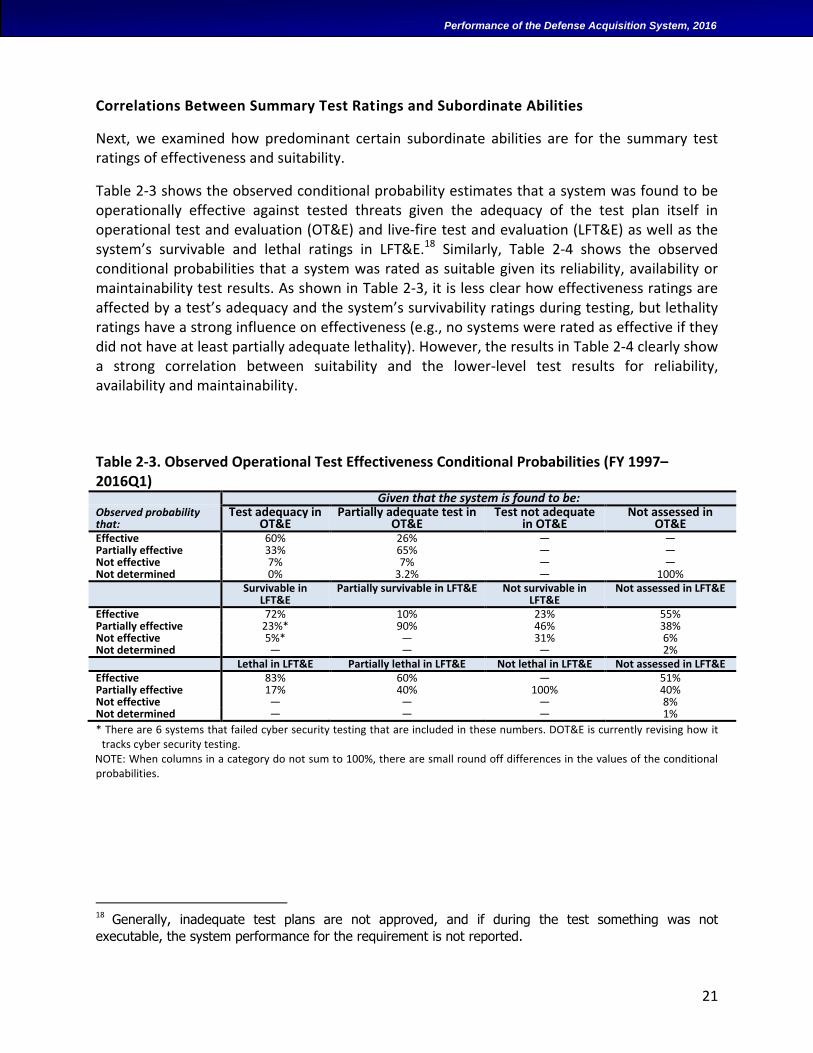
21
Performance of the Defense Acquisition System, 2016
Correlations Between Summary Test Ratings and Subordinate Abilities
Next, we examined how predominant certain subordinate abilities are for the summary test ratings of effectiveness and suitability.
Table 2-3 shows the observed conditional probability estimates that a system was found to be operationally effective against tested threats given the adequacy of the test plan itself in operational test and evaluation (OT&E) and live-fire test and evaluation (LFT&E) as well as the system’s survivable and lethal ratings in LFT&E.18 Similarly, Table 2-4 shows the observed conditional probabilities that a system was rated as suitable given its reliability, availability or maintainability test results. As shown in Table 2-3, it is less clear how effectiveness ratings are affected by a test’s adequacy and the system’s survivability ratings during testing, but lethality ratings have a strong influence on effectiveness (e.g., no systems were rated as effective if they did not have at least partially adequate lethality). However, the results in Table 2-4 clearly show a strong correlation between suitability and the lower-level test results for reliability, availability and maintainability.
Table 2-3. Observed Operational Test Effectiveness Conditional Probabilities (FY 1997–2016Q1) Given that the system is found to be: Observed probability that:
Test adequacy in OT&E
Partially adequate test in OT&E
Test not adequate in OT&E
Not assessed in OT&E
Effective 60% 26% — — Partially effective 33% 65% — — Not effective 7% 7% — — Not determined 0% 3.2% — 100% Survivable in
LFT&E Partially survivable in LFT&E Not survivable in
LFT&E Not assessed in LFT&E
Effective 72% 10% 23% 55% Partially effective 23%* 90% 46% 38% Not effective 5%* — 31% 6% Not determined — — — 2% Lethal in LFT&E Partially lethal in LFT&E Not lethal in LFT&E Not assessed in LFT&E Effective 83% 60% — 51% Partially effective 17% 40% 100% 40% Not effective — — — 8% Not determined — — — 1%
* There are 6 systems that failed cyber security testing that are included in these numbers. DOT&E is currently revising how it tracks cyber security testing.
NOTE: When columns in a category do not sum to 100%, there are small round off differences in the values of the conditional probabilities.
18 Generally, inadequate test plans are not approved, and if during the test something was not
executable, the system performance for the requirement is not reported.
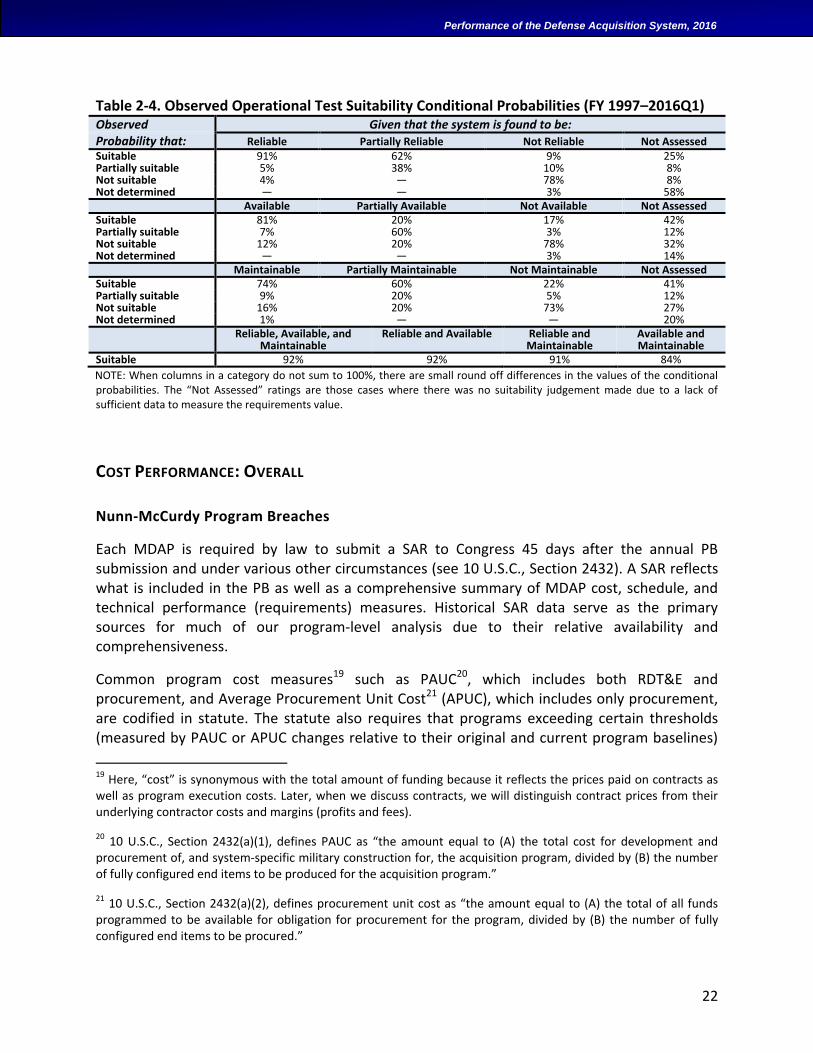
22
Performance of the Defense Acquisition System, 2016
Table 2-4. Observed Operational Test Suitability Conditional Probabilities (FY 1997–2016Q1) Observed Given that the system is found to be: Probability that: Reliable Partially Reliable Not Reliable Not Assessed Suitable 91% 62% 9% 25% Partially suitable 5% 38% 10% 8% Not suitable 4% — 78% 8% Not determined — — 3% 58% Available Partially Available Not Available Not Assessed Suitable 81% 20% 17% 42% Partially suitable 7% 60% 3% 12% Not suitable 12% 20% 78% 32% Not determined — — 3% 14% Maintainable Partially Maintainable Not Maintainable Not Assessed Suitable 74% 60% 22% 41% Partially suitable 9% 20% 5% 12% Not suitable 16% 20% 73% 27% Not determined 1% — — 20% Reliable, Available, and
Maintainable Reliable and Available Reliable and
Maintainable Available and Maintainable
Suitable 92% 92% 91% 84%
NOTE: When columns in a category do not sum to 100%, there are small round off differences in the values of the conditional probabilities. The “Not Assessed” ratings are those cases where there was no suitability judgement made due to a lack of sufficient data to measure the requirements value.
COST PERFORMANCE: OVERALL
Nunn-McCurdy Program Breaches
Each MDAP is required by law to submit a SAR to Congress 45 days after the annual PB submission and under various other circumstances (see 10 U.S.C., Section 2432). A SAR reflects what is included in the PB as well as a comprehensive summary of MDAP cost, schedule, and technical performance (requirements) measures. Historical SAR data serve as the primary sources for much of our program-level analysis due to their relative availability and comprehensiveness.
Common program cost measures19 such as PAUC20, which includes both RDT&E and procurement, and Average Procurement Unit Cost21 (APUC), which includes only procurement, are codified in statute. The statute also requires that programs exceeding certain thresholds (measured by PAUC or APUC changes relative to their original and current program baselines)
19 Here, “cost” is synonymous with the total amount of funding because it reflects the prices paid on contracts as well as program execution costs. Later, when we discuss contracts, we will distinguish contract prices from their underlying contractor costs and margins (profits and fees).
20 10 U.S.C., Section 2432(a)(1), defines PAUC as “the amount equal to (A) the total cost for development and procurement of, and system-specific military construction for, the acquisition program, divided by (B) the number of fully configured end items to be produced for the acquisition program.”
21 10 U.S.C., Section 2432(a)(2), defines procurement unit cost as “the amount equal to (A) the total of all funds programmed to be available for obligation for procurement for the program, divided by (B) the number of fully configured end items to be procured.”
23
Performance of the Defense Acquisition System, 2016
must go through a rigorous reexamination and certification to Congress along a variety of specified criteria. This process commonly is referred to as the “Nunn-McCurdy” process, named for the original sponsors of the legislation dating back to 1982 (see Schwartz, 2010, for an extensive overview of the process).
Two types of breaches are called out in the Nunn-McCurdy process: significant and critical. A significant breach is the lower threshold and is intended to warn Congress that a program is experiencing significant unit-cost growth relative to its baseline. A critical breach signifies the cost growth is even higher, triggering the formal reexamination and certification process mentioned above. The criteria for a significant breach are 15 percent from the current baseline, or 30 percent cost growth in APUC or PAUC from the original baseline. A critical breach occurs when the program experiences 25 percent cost growth from the current baseline, or 50 percent cost growth from the original baseline.
As with last year’s report, we continue to report Nunn-McCurdy statistics based on our official list of breaches from 1997 through June 2016 (see Table 2-5). Recall that the numbers of breaches per year are slightly different than in our 2013 and 2014 reports.22 It is important to note that the NDAA for FY 2006 made changes to the Nunn-McCurdy statute by adding the requirement to report unit-cost growth from the original baseline in addition to the current baseline. This additional requirement caused a large spike in 2005 when 11 programs had to report preexisting significant breaches. Thus, for historical comparisons, we need to compare current performance against those since 2006 because 2005 is a boundary condition and the years before 2005 were operating under different statutory rules.
Figure 2-6 shows the critical Nunn-McCurdy yearly breach rates and counts. The statistically significant downward trends since 2009 of non-quantity-related critical breaches (shown) and for all critical breaches continued through the second quarter of CY 2016, inclusive. For the trend analysis, we used the breach rates instead of counts to control for changes in portfolio size between years. We also controlled for program maturity and the recency of past breaches. Immature MDAPs that had not yet executed 30 percent of their originally scheduled time between MS B and MS C were removed from the dataset since they would likely bias the breach numbers so they would be artificially low. Also, any MDAPs that had a critical breach within the past 3 years were removed from the denominator of this measure since they are immature relative to their new baselines, and we have yet to see a program breach a second time before this period. Thus, these adjustments provide a more conservative (harder) test and higher percentages by removing the bias from programs that are naturally less likely to breach by nature of their newness.
22 Our prior reports used quarterly SARs, whose dates may not align with the exact breach reporting dates to Congress. We also used to report breaches by SAR years, which do not align completely with calendar years because SARs can include information from the beginning of the next calendar year. In addition, canceled programs may not have a final SAR, and programs stop reporting at 90 percent of cost expended or quantity delivered.
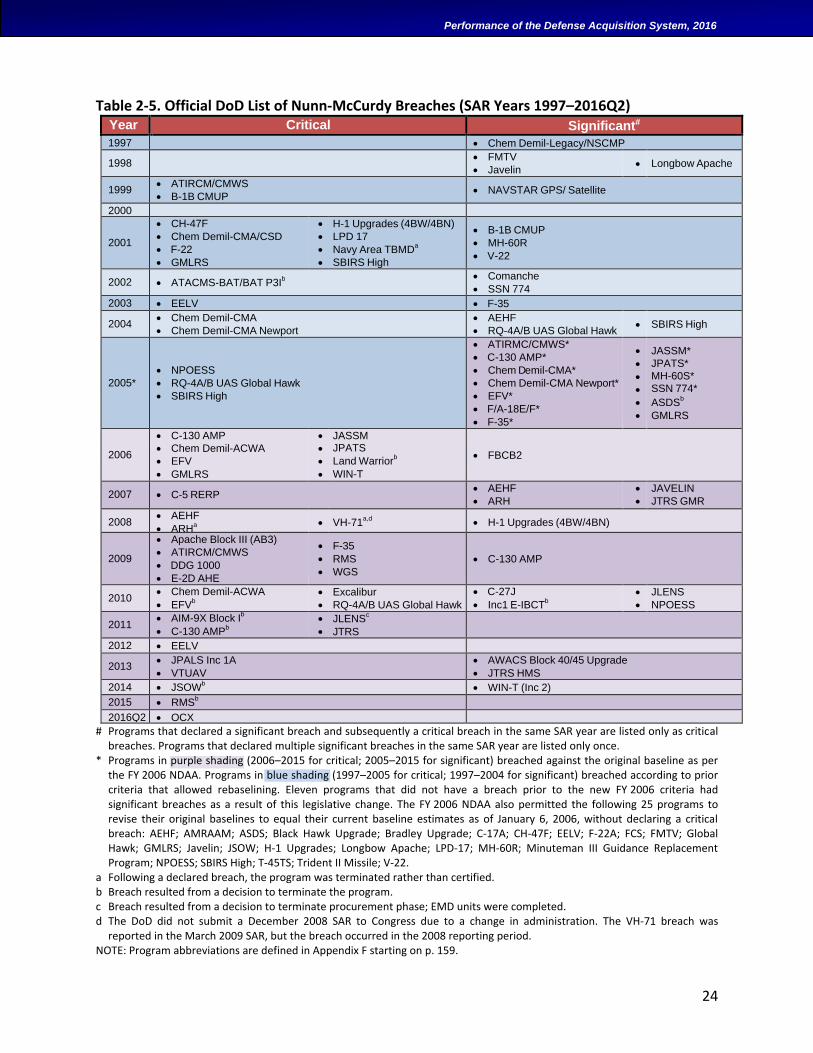
24
Performance of the Defense Acquisition System, 2016
Table 2-5. Official DoD List of Nunn-McCurdy Breaches (SAR Years 1997–2016Q2) Year Critical Significant#
1997 Chem Demil-Legacy/NSCMP
1998 FMTV
Javelin Longbow Apache
1999 ATIRCM/CMWS
B-1B CMUP NAVSTAR GPS/ Satellite
2000
2001
CH-47F
Chem Demil-CMA/CSD
F-22
GMLRS
H-1 Upgrades (4BW/4BN)
LPD 17
Navy Area TBMDa
SBIRS High
B-1B CMUP
MH-60R
V-22
2002 ATACMS-BAT/BAT P3Ib
Comanche
SSN 774
2003 EELV F-35
2004 Chem Demil-CMA
Chem Demil-CMA Newport
AEHF
RQ-4A/B UAS Global Hawk SBIRS High
2005*
NPOESS
RQ-4A/B UAS Global Hawk
SBIRS High
ATIRMC/CMWS*
C-130 AMP*
Chem Demil-CMA*
Chem Demil-CMA Newport*
EFV*
F/A-18E/F*
F-35*
JASSM*
JPATS*
MH-60S*
SSN 774*
ASDSb
GMLRS
2006
C-130 AMP JASSM FBCB2
Chem Demil-ACWA
EFV
JPATS
Land Warriorb
GMLRS WIN-T
2007 C-5 RERP AEHF
ARH
JAVELIN
JTRS GMR
2008 AEHF
ARHa
VH-71a,d
H-1 Upgrades (4BW/4BN)
2009
Apache Block III (AB3)
ATIRCM/CMWS
DDG 1000
E-2D AHE
F-35
RMS
WGS
C-130 AMP
2010 Chem Demil-ACWA
EFVb
Excalibur
RQ-4A/B UAS Global Hawk
C-27J
Inc1 E-IBCTb
JLENS
NPOESS
2011 AIM-9X Block I
b
C-130 AMPb
JLENSc
JTRS
GMRa
2012 EELV 2013
JPALS Inc 1A
VTUAV
AWACS Block 40/45 Upgrade
JTRS HMS
2014 JSOWb WIN-T (Inc 2)
2015 RMSb
2016Q2 OCX
# Programs that declared a significant breach and subsequently a critical breach in the same SAR year are listed only as critical breaches. Programs that declared multiple significant breaches in the same SAR year are listed only once.
* Programs in purple shading (2006–2015 for critical; 2005–2015 for significant) breached against the original baseline as per the FY 2006 NDAA. Programs in blue shading (1997–2005 for critical; 1997–2004 for significant) breached according to prior criteria that allowed rebaselining. Eleven programs that did not have a breach prior to the new FY 2006 criteria had significant breaches as a result of this legislative change. The FY 2006 NDAA also permitted the following 25 programs to revise their original baselines to equal their current baseline estimates as of January 6, 2006, without declaring a critical breach: AEHF; AMRAAM; ASDS; Black Hawk Upgrade; Bradley Upgrade; C‐17A; CH‐47F; EELV; F‐22A; FCS; FMTV; Global Hawk; GMLRS; Javelin; JSOW; H‐1 Upgrades; Longbow Apache; LPD‐17; MH‐60R; Minuteman III Guidance Replacement Program; NPOESS; SBIRS High; T‐45TS; Trident II Missile; V‐22.
a Following a declared breach, the program was terminated rather than certified. b Breach resulted from a decision to terminate the program. c Breach resulted from a decision to terminate procurement phase; EMD units were completed. d The DoD did not submit a December 2008 SAR to Congress due to a change in administration. The VH-71 breach was
reported in the March 2009 SAR, but the breach occurred in the 2008 reporting period. NOTE: Program abbreviations are defined in Appendix F starting on p. 159.
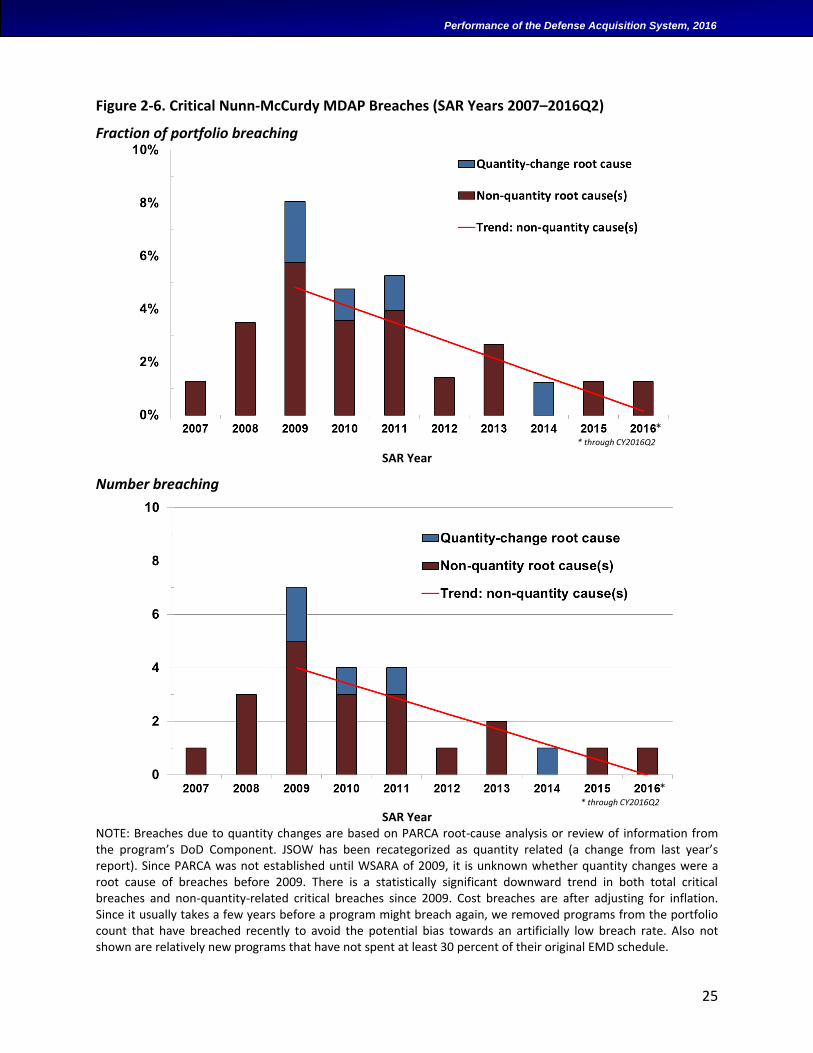
25
Performance of the Defense Acquisition System, 2016
Figure 2-6. Critical Nunn-McCurdy MDAP Breaches (SAR Years 2007–2016Q2)
Fraction of portfolio breaching
SAR Year
Number breaching
SAR Year
NOTE: Breaches due to quantity changes are based on PARCA root-cause analysis or review of information from the program’s DoD Component. JSOW has been recategorized as quantity related (a change from last year’s report). Since PARCA was not established until WSARA of 2009, it is unknown whether quantity changes were a root cause of breaches before 2009. There is a statistically significant downward trend in both total critical breaches and non-quantity-related critical breaches since 2009. Cost breaches are after adjusting for inflation. Since it usually takes a few years before a program might breach again, we removed programs from the portfolio count that have breached recently to avoid the potential bias towards an artificially low breach rate. Also not shown are relatively new programs that have not spent at least 30 percent of their original EMD schedule.
** through CY2016Q2
** through CY2016Q2
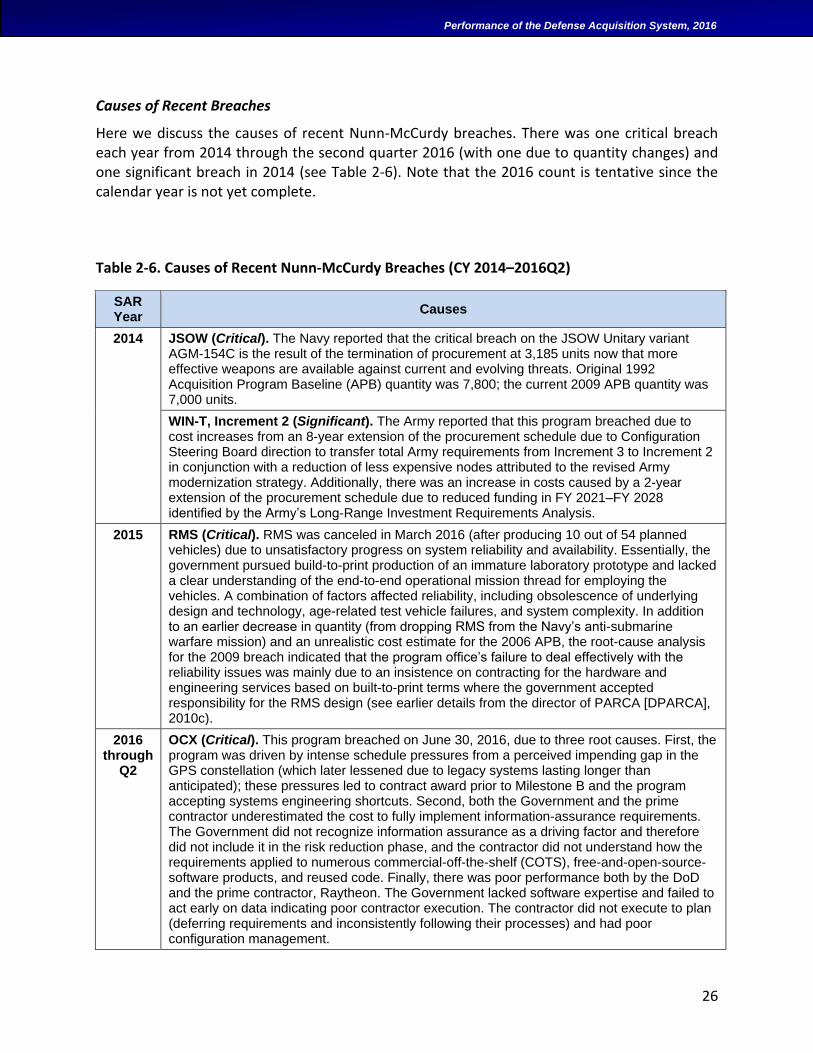
26
Performance of the Defense Acquisition System, 2016
Causes of Recent Breaches
Here we discuss the causes of recent Nunn-McCurdy breaches. There was one critical breach each year from 2014 through the second quarter 2016 (with one due to quantity changes) and one significant breach in 2014 (see Table 2-6). Note that the 2016 count is tentative since the calendar year is not yet complete.
Table 2-6. Causes of Recent Nunn-McCurdy Breaches (CY 2014–2016Q2)
SAR Year
Causes
2014 JSOW (Critical). The Navy reported that the critical breach on the JSOW Unitary variant AGM-154C is the result of the termination of procurement at 3,185 units now that more effective weapons are available against current and evolving threats. Original 1992 Acquisition Program Baseline (APB) quantity was 7,800; the current 2009 APB quantity was 7,000 units.
WIN-T, Increment 2 (Significant). The Army reported that this program breached due to cost increases from an 8-year extension of the procurement schedule due to Configuration Steering Board direction to transfer total Army requirements from Increment 3 to Increment 2 in conjunction with a reduction of less expensive nodes attributed to the revised Army modernization strategy. Additionally, there was an increase in costs caused by a 2-year extension of the procurement schedule due to reduced funding in FY 2021–FY 2028 identified by the Army’s Long-Range Investment Requirements Analysis.
2015 RMS (Critical). RMS was canceled in March 2016 (after producing 10 out of 54 planned vehicles) due to unsatisfactory progress on system reliability and availability. Essentially, the government pursued build-to-print production of an immature laboratory prototype and lacked a clear understanding of the end-to-end operational mission thread for employing the vehicles. A combination of factors affected reliability, including obsolescence of underlying design and technology, age-related test vehicle failures, and system complexity. In addition to an earlier decrease in quantity (from dropping RMS from the Navy’s anti-submarine warfare mission) and an unrealistic cost estimate for the 2006 APB, the root-cause analysis for the 2009 breach indicated that the program office’s failure to deal effectively with the reliability issues was mainly due to an insistence on contracting for the hardware and engineering services based on built-to-print terms where the government accepted responsibility for the RMS design (see earlier details from the director of PARCA [DPARCA], 2010c).
2016 through
Q2
OCX (Critical). This program breached on June 30, 2016, due to three root causes. First, the program was driven by intense schedule pressures from a perceived impending gap in the GPS constellation (which later lessened due to legacy systems lasting longer than anticipated); these pressures led to contract award prior to Milestone B and the program accepting systems engineering shortcuts. Second, both the Government and the prime contractor underestimated the cost to fully implement information-assurance requirements. The Government did not recognize information assurance as a driving factor and therefore did not include it in the risk reduction phase, and the contractor did not understand how the requirements applied to numerous commercial-off-the-shelf (COTS), free-and-open-source-software products, and reused code. Finally, there was poor performance both by the DoD and the prime contractor, Raytheon. The Government lacked software expertise and failed to act early on data indicating poor contractor execution. The contractor did not execute to plan (deferring requirements and inconsistently following their processes) and had poor configuration management.
27
Performance of the Defense Acquisition System, 2016
Root Causes of Critical Breaches Since 2010
Developing systems beyond the current state-of-the-art often results in problems specific to each effort, resulting in the saying that programs succeed by employing well-established tradecraft but fail for rather unique reasons. Despite this, it is useful to abstract the failures into categories to identify commonality that might be rectified systemically. It is especially useful to conduct such reviews independently and to differentiate root causes from proximal causes. Table 2-7 summarizes such reviews on all statutory and discretionary root-cause analyses to since the PARCA office was set up in January 2010 (DPARCA, 2010a–g, 2011a–e, 2012a–c, 2013, 2014a–b, and 2016), including detailed breakouts of the management performance issues. Generally, the common root cause areas remain the same as those discussed in last year’s annual report (USD(AT&L), 2015b).
Acquisition Improvements
Finally, despite the differing details of individual breaches, it is useful to discuss how recent program causes relate to ongoing efforts to incrementally improve acquisition by addressing specific issue areas (e.g., through BBP initiatives and principles).
The Joint Standoff Weapon (JSOW) critical breach in 2014 was from elimination of distant out-year production and resulting termination. The emergence of more cost-effective munitions obviated the need for the JSOW units predicted at the tail-end of the program buy. Thus, the cause is more one of an inability to predict the pace of future threat changes than a flaw in initiation or execution. The BBP effort to address technical superiority supports such decisions to evolve and react to threat changes.
The Warfighter Information Network-Tactical (WIN-T), Increment 2, significant breach in 2014 was due to production extensions from requirements changes and realization of long-term affordability limitations. While a breach factor, the imposition of the long-term affordability policy in BBP and associated corrections for WIN-T, Increment 2, is a positive sign that the DoD is working to take long-term affordability analysis seriously, which should result in early decisions and reduced sunk costs.
The RMS critical breach reported in the 2015 SAR was due to a termination for unsatisfactory progress on system reliability and availability. BBP is attempting to address the kind of prototype and mission thread issues experienced by RMS by improving how, when, and whether we use early prototyping and improving our understanding of threats and operational needs. Merely replicating immature prototypes can deliver new capabilities to the field quickly, but like rapidly acquired systems can often come with the results of limited engineering on the robustness of the system during operation (and possibly also limited utility for other missions).
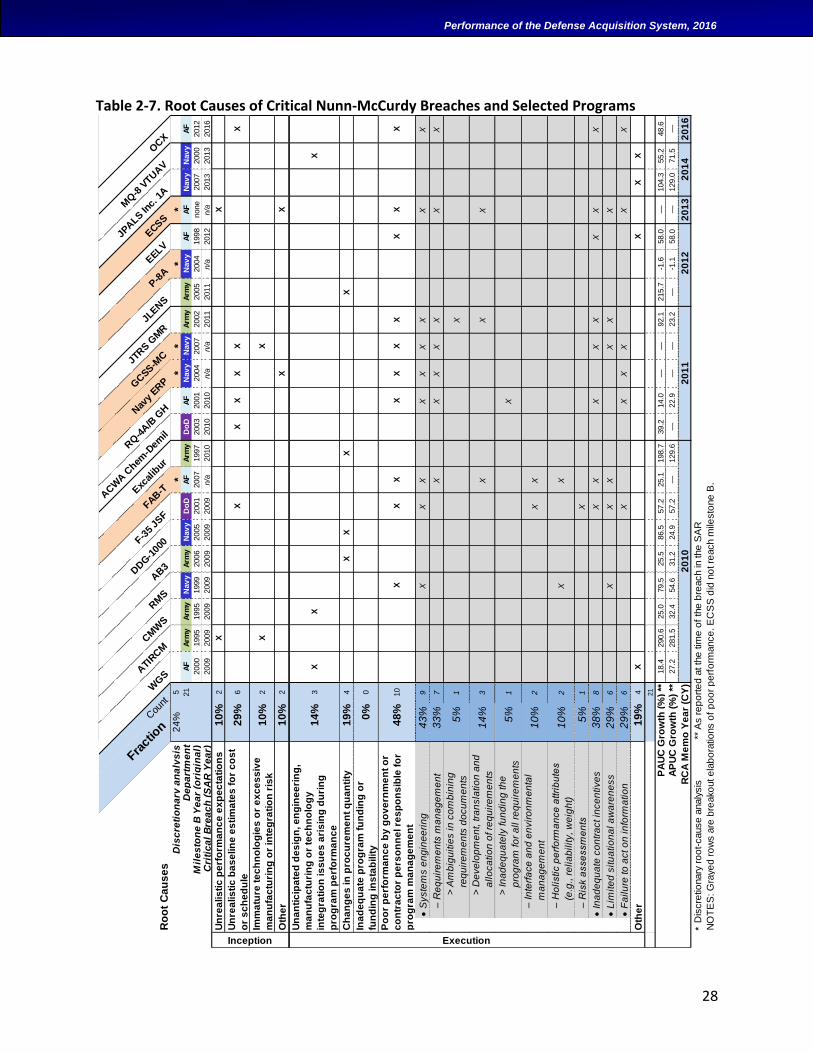
28
Performance of the Defense Acquisition System, 2016
Table 2-7. Root Causes of Critical Nunn-McCurdy Breaches and Selected Programs
Ro
ot
Ca
us
es
Fract
ion
Cou
ntW
GS
ATI
RCM
CM
WS
RM
S
AB3D
DG-1
000F-3
5 JS
FFA
B-TE
xcal
ibur
ACW
A C
hem-D
emil
RQ
-4A/B
GHN
avy
ERPG
CSS
-MCJT
RS G
MR
JLENS
P-8
A
EELV
ECSS
JPALS In
c. 1
A
MQ
-8 V
TUAV
OCX
Dis
cre
tio
na
ry a
na
lys
is2
4%
5*
**
**
De
pa
rtm
en
t21
AF
Arm
yA
rmy
Nav
yA
rmy
Nav
yD
oD
AF
Arm
yD
oD
AF
Nav
yN
av
yA
rmy
Arm
yN
av
yA
FA
FN
av
yN
av
yA
F
Mil
es
ton
e B
Ye
ar
(ori
gin
al)
2000
1995
1995
1999
2006
2005
2001
2007
1997
2003
2001
2004
2007
2002
2005
2004
1998
none
2007
2000
2012
Cri
tic
al
Bre
ac
h (
SA
R Y
ea
r)2009
2009
2009
2009
2009
2009
2009
n/a
2010
2010
2010
n/a
n/a
2011
2011
n/a
2012
n/a
2013
2013
2016
Un
rea
lis
tic
pe
rfo
rma
nc
e e
xp
ec
tati
on
s1
0%
2X
X
Un
rea
lis
tic
ba
se
lin
e e
sti
ma
tes
fo
r c
os
t
or
sc
he
du
le2
9%
6X
XX
XX
X
Imm
atu
re t
ec
hn
olo
gie
s o
r e
xc
es
siv
e
ma
nu
fac
turi
ng
or
inte
gra
tio
n r
isk
10
%2
XX
Oth
er
10
%2
XX
Un
an
tic
ipa
ted
de
sig
n, e
ng
ine
eri
ng
,
ma
nu
fac
turi
ng
or
tec
hn
olo
gy
inte
gra
tio
n is
su
es
ari
sin
g d
uri
ng
pro
gra
m p
erf
orm
an
ce
14
%3
XX
X
Ch
an
ge
s in
pro
cu
rem
en
t q
ua
nti
ty1
9%
4X
XX
X
Ina
de
qu
ate
pro
gra
m f
un
din
g o
r
fun
din
g in
sta
bilit
y0
%0
Po
or
pe
rfo
rma
nc
e b
y g
ov
ern
me
nt
or
co
ntr
ac
tor
pe
rso
nn
el re
sp
on
sib
le f
or
pro
gra
m m
an
ag
em
en
t
48
%10
XX
XX
XX
XX
XX
S
yste
ms e
ng
ine
eri
ng
43
%9
XX
XX
XX
XX
X
–
Re
qu
ire
me
nts
ma
na
ge
me
nt
33
%7
XX
XX
XX
X
>
Am
big
uitie
s in
co
mb
inin
g
r
eq
uir
em
en
ts d
ocu
me
nts
5%
1X
>
De
ve
lop
me
nt, tra
nsla
tio
n a
nd
a
llo
ca
tio
n o
f re
qu
ire
me
nts
14
%3
XX
X
>
In
ad
eq
ua
tely
fu
nd
ing
th
e
p
rog
ram
fo
r a
ll r
eq
uir
em
en
ts5
%1
X
–
In
terf
ace
an
d e
nvir
on
me
nta
l
m
an
ag
em
en
t1
0%
2X
X
–
Ho
listic p
erf
orm
an
ce
attri
bu
tes
(e
.g., r
elia
bility, w
eig
ht)
10
%2
XX
–
Ris
k a
sse
ssm
en
ts5
%1
X
In
ad
eq
ua
te c
on
tra
ct in
ce
ntive
s3
8%
8X
XX
XX
XX
X
L
imite
d s
itu
atio
na
l a
wa
ren
ess
29
%6
XX
XX
XX
F
ailu
re to
act o
n in
form
atio
n2
9%
6X
XX
XX
X
Oth
er
19
%4
XX
XX
21
18.4
290.6
25.0
79.5
25.5
86.5
57.2
25.1
198.7
39.2
14.0
——
92.1
215.7
-1.6
58.0
—104.3
55.2
48.6
27.2
281.5
32.4
54.6
31.2
24.9
57.2
—129.6
—22.9
——
23.2
—-1
.158.0
—129.0
71.5
—
20
12
20
13
20
16
* D
iscre
tio
nary
ro
ot-
cause
analy
sis
Inception Execution
PA
UC
Gro
wth
(%
) **
AP
UC
Gro
wth
(%
) **
RC
A M
em
o Y
ea
r (C
Y)
20
11
20
14
NO
TE
S: G
raye
d r
ow
s a
re b
reako
ut e
lab
ora
tio
ns o
f p
oo
r p
erf
orm
ance
. E
CS
S d
id n
ot re
ach m
ilesto
ne
B.
20
10
** A
s r
ep
ort
ed
at th
e tim
e o
f th
e b
reach in the
SA
R
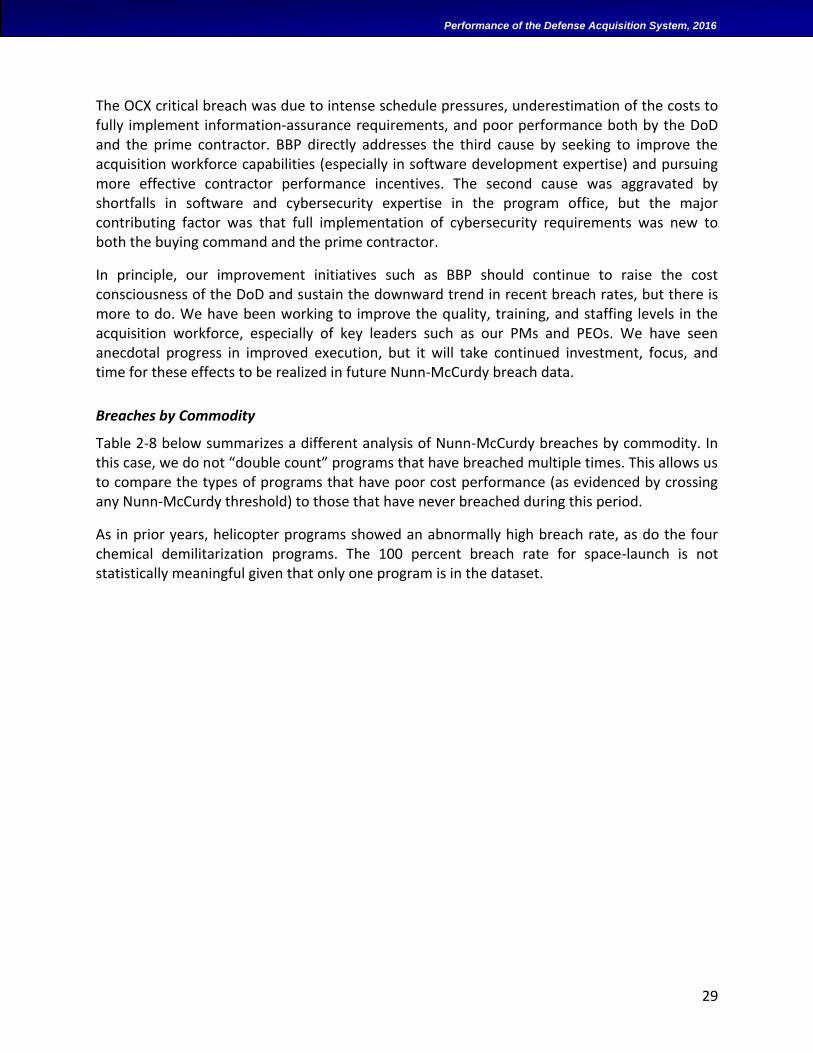
29
Performance of the Defense Acquisition System, 2016
The OCX critical breach was due to intense schedule pressures, underestimation of the costs to fully implement information-assurance requirements, and poor performance both by the DoD and the prime contractor. BBP directly addresses the third cause by seeking to improve the acquisition workforce capabilities (especially in software development expertise) and pursuing more effective contractor performance incentives. The second cause was aggravated by shortfalls in software and cybersecurity expertise in the program office, but the major contributing factor was that full implementation of cybersecurity requirements was new to both the buying command and the prime contractor.
In principle, our improvement initiatives such as BBP should continue to raise the cost consciousness of the DoD and sustain the downward trend in recent breach rates, but there is more to do. We have been working to improve the quality, training, and staffing levels in the acquisition workforce, especially of key leaders such as our PMs and PEOs. We have seen anecdotal progress in improved execution, but it will take continued investment, focus, and time for these effects to be realized in future Nunn-McCurdy breach data.
Breaches by Commodity
Table 2-8 below summarizes a different analysis of Nunn-McCurdy breaches by commodity. In this case, we do not “double count” programs that have breached multiple times. This allows us to compare the types of programs that have poor cost performance (as evidenced by crossing any Nunn-McCurdy threshold) to those that have never breached during this period.
As in prior years, helicopter programs showed an abnormally high breach rate, as do the four chemical demilitarization programs. The 100 percent breach rate for space-launch is not statistically meaningful given that only one program is in the dataset.
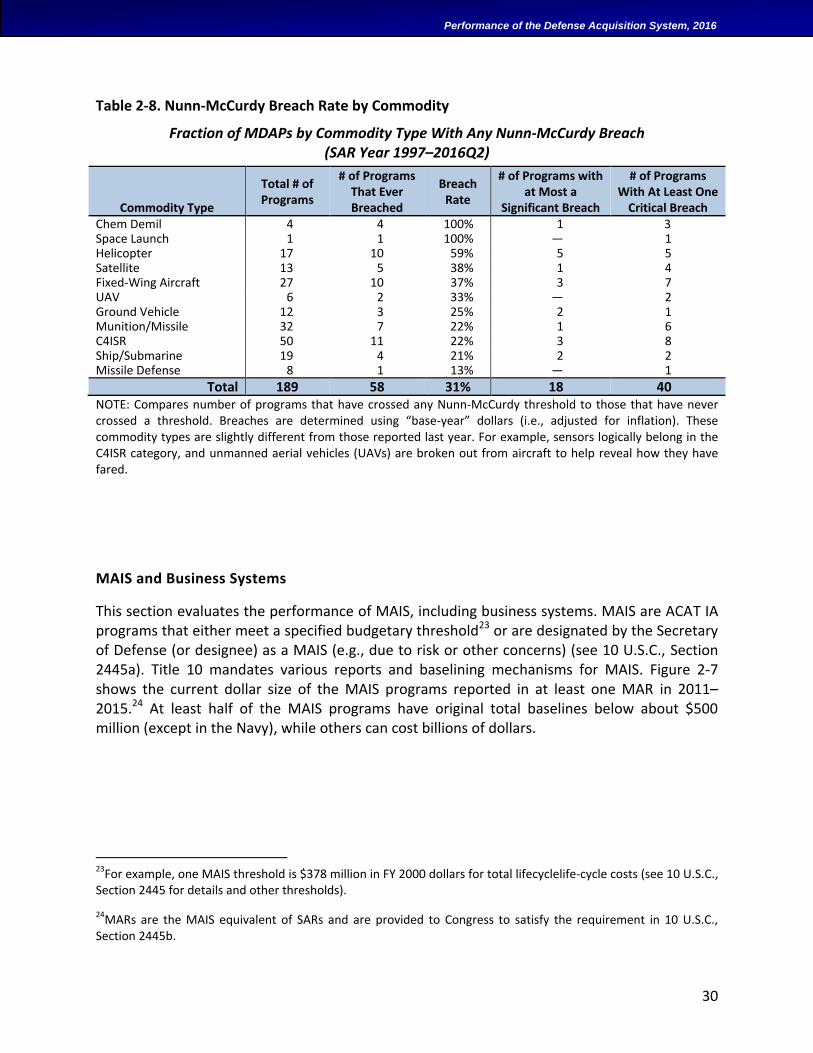
30
Performance of the Defense Acquisition System, 2016
Table 2-8. Nunn-McCurdy Breach Rate by Commodity
Fraction of MDAPs by Commodity Type With Any Nunn-McCurdy Breach (SAR Year 1997–2016Q2)
Commodity Type
Total # of Programs
# of Programs That Ever Breached
Breach Rate
# of Programs with at Most a
Significant Breach
# of Programs With At Least One
Critical Breach Chem Demil 4 4 100% 1 3 Space Launch 1 1 100% — 1 Helicopter 17 10 59% 5 5 Satellite 13 5 38% 1 4 Fixed-Wing Aircraft 27 10 37% 3 7 UAV 6 2 33% — 2 Ground Vehicle 12 3 25% 2 1 Munition/Missile 32 7 22% 1 6 C4ISR 50 11 22% 3 8 Ship/Submarine 19 4 21% 2 2 Missile Defense 8 1 13% — 1
Total 189 58 31% 18 40 NOTE: Compares number of programs that have crossed any Nunn-McCurdy threshold to those that have never crossed a threshold. Breaches are determined using “base-year” dollars (i.e., adjusted for inflation). These commodity types are slightly different from those reported last year. For example, sensors logically belong in the C4ISR category, and unmanned aerial vehicles (UAVs) are broken out from aircraft to help reveal how they have fared.
MAIS and Business Systems
This section evaluates the performance of MAIS, including business systems. MAIS are ACAT IA programs that either meet a specified budgetary threshold23 or are designated by the Secretary of Defense (or designee) as a MAIS (e.g., due to risk or other concerns) (see 10 U.S.C., Section 2445a). Title 10 mandates various reports and baselining mechanisms for MAIS. Figure 2-7 shows the current dollar size of the MAIS programs reported in at least one MAR in 2011–2015.24 At least half of the MAIS programs have original total baselines below about $500 million (except in the Navy), while others can cost billions of dollars.
23For example, one MAIS threshold is $378 million in FY 2000 dollars for total lifecyclelife-cycle costs (see 10 U.S.C., Section 2445 for details and other thresholds).
24MARs are the MAIS equivalent of SARs and are provided to Congress to satisfy the requirement in 10 U.S.C., Section 2445b.
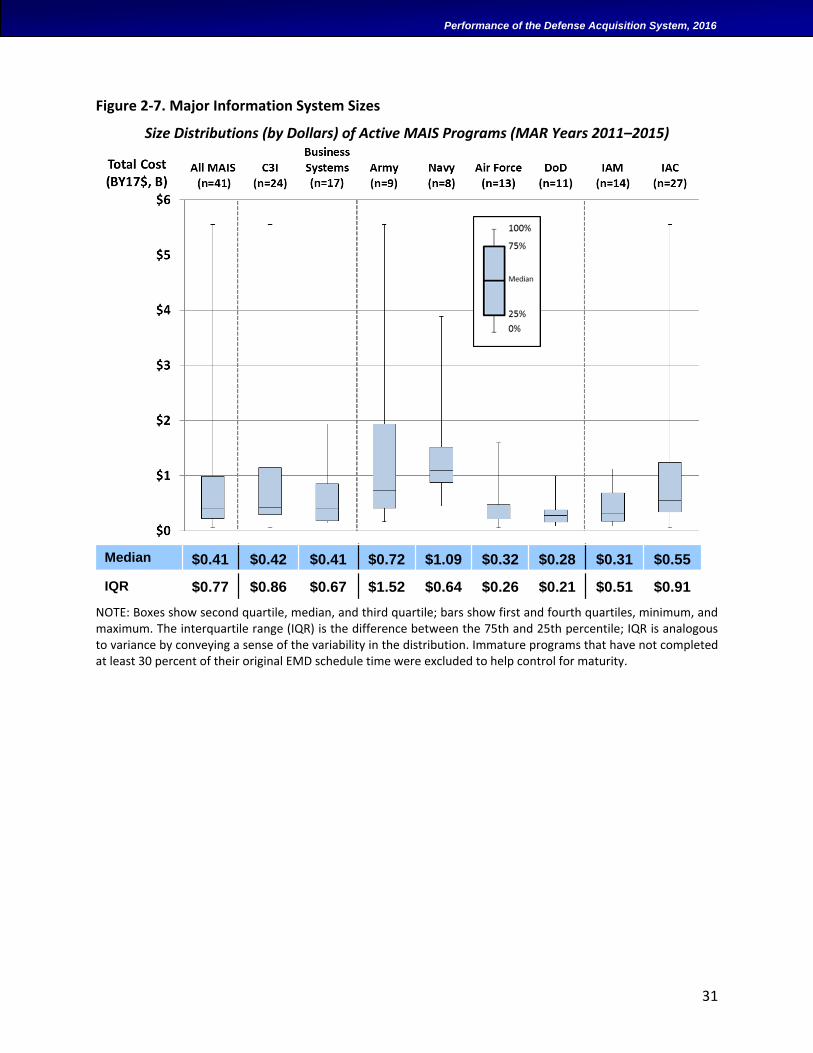
31
Performance of the Defense Acquisition System, 2016
Figure 2-7. Major Information System Sizes
Size Distributions (by Dollars) of Active MAIS Programs (MAR Years 2011–2015)
NOTE: Boxes show second quartile, median, and third quartile; bars show first and fourth quartiles, minimum, and maximum. The interquartile range (IQR) is the difference between the 75th and 25th percentile; IQR is analogous to variance by conveying a sense of the variability in the distribution. Immature programs that have not completed at least 30 percent of their original EMD schedule time were excluded to help control for maturity.
Median $0.41 $0.42 $0.41 $0.72 $1.09 $0.32 $0.28 $0.31 $0.55
IQR $0.77 $0.86 $0.67 $1.52 $0.64 $0.26 $0.21 $0.51 $0.91
32
Performance of the Defense Acquisition System, 2016
Figure 2-8 shows the funding growth from original baselines as reported in the 2011–015 MARs. We weighted results by program spend (dollars) and controlled for program maturity (a program is relatively mature when it passes 30 percent of the planned or actual time from FFO to FDD). Total funding growth from original baseline dropped to 1 percent at the median in 2015. Median year-on-year funding growth also dropped and ran negative between 2014 and 2015.
Figure 2-8. Program Cost-Related Performance: Information Systems
Cumulative Growth from Original Baseline and Annual Changes of Planned Total (From Start to Completion) Funding for Active MAIS
(Weighted by Program Spend; MAR Years 2011–2015)
NOTE: The IQR is the difference between the 75th and 25th percentiles. Immature programs that have not completed at least 30 percent of their original EMD schedule time were excluded to help control for maturity. Original baselines are from the MAR original estimate.
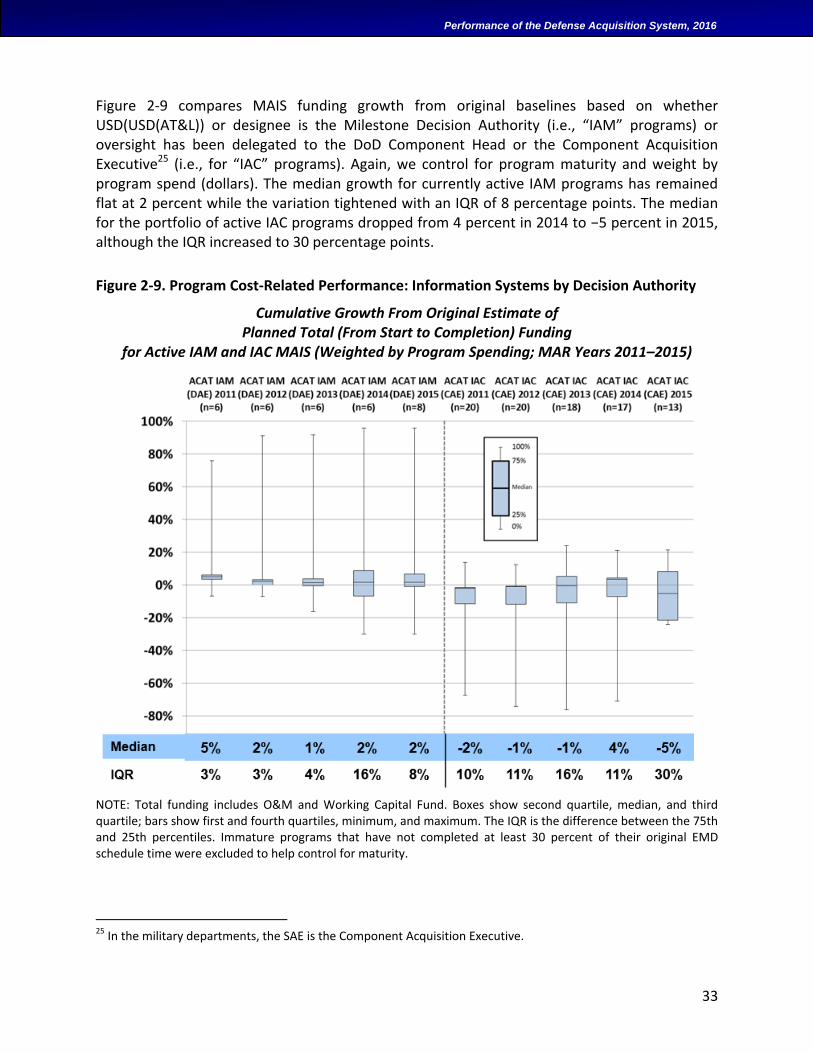
33
Performance of the Defense Acquisition System, 2016
Figure 2-9 compares MAIS funding growth from original baselines based on whether USD(USD(AT&L)) or designee is the Milestone Decision Authority (i.e., “IAM” programs) or oversight has been delegated to the DoD Component Head or the Component Acquisition Executive25 (i.e., for “IAC” programs). Again, we control for program maturity and weight by program spend (dollars). The median growth for currently active IAM programs has remained flat at 2 percent while the variation tightened with an IQR of 8 percentage points. The median for the portfolio of active IAC programs dropped from 4 percent in 2014 to −5 percent in 2015, although the IQR increased to 30 percentage points.
Figure 2-9. Program Cost-Related Performance: Information Systems by Decision Authority
Cumulative Growth From Original Estimate of Planned Total (From Start to Completion) Funding
for Active IAM and IAC MAIS (Weighted by Program Spending; MAR Years 2011–2015)
NOTE: Total funding includes O&M and Working Capital Fund. Boxes show second quartile, median, and third quartile; bars show first and fourth quartiles, minimum, and maximum. The IQR is the difference between the 75th and 25th percentiles. Immature programs that have not completed at least 30 percent of their original EMD schedule time were excluded to help control for maturity.
25 In the military departments, the SAE is the Component Acquisition Executive.
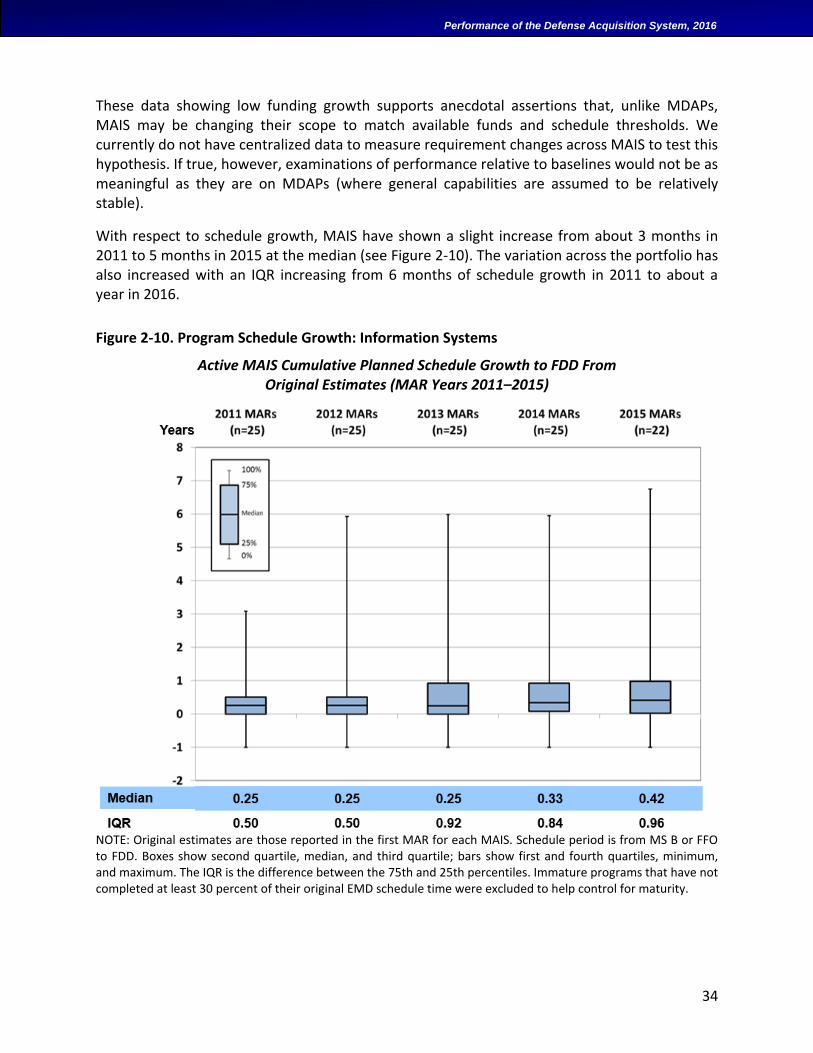
34
Performance of the Defense Acquisition System, 2016
These data showing low funding growth supports anecdotal assertions that, unlike MDAPs, MAIS may be changing their scope to match available funds and schedule thresholds. We currently do not have centralized data to measure requirement changes across MAIS to test this hypothesis. If true, however, examinations of performance relative to baselines would not be as meaningful as they are on MDAPs (where general capabilities are assumed to be relatively stable).
With respect to schedule growth, MAIS have shown a slight increase from about 3 months in 2011 to 5 months in 2015 at the median (see Figure 2-10). The variation across the portfolio has also increased with an IQR increasing from 6 months of schedule growth in 2011 to about a year in 2016.
Figure 2-10. Program Schedule Growth: Information Systems
Active MAIS Cumulative Planned Schedule Growth to FDD From Original Estimates (MAR Years 2011–2015)
NOTE: Original estimates are those reported in the first MAR for each MAIS. Schedule period is from MS B or FFO to FDD. Boxes show second quartile, median, and third quartile; bars show first and fourth quartiles, minimum, and maximum. The IQR is the difference between the 75th and 25th percentiles. Immature programs that have not completed at least 30 percent of their original EMD schedule time were excluded to help control for maturity.
35
Performance of the Defense Acquisition System, 2016
COST PERFORMANCE: DEVELOPMENT
Planned Program Funding Growth: Development
We now examine MDAP development cost-related performance at the program level, using total RDT&E funding growth as the metric. Program “cost” (e.g., as defined for PAUC and APUC) is synonymous with the total amount of funding because it reflects the prices paid on contracts as well as program execution costs. Generally, RDT&E must be funded regardless of how many units are produced. In that sense, they are a fixed cost for the DoD to arrive at the point where we can procure and field a capability. Thus, for RDT&E, we track total funding growth rather than by units produced (e.g., as for PAUC and APUC) to avoid confusing the effects of even small quantity changes with growth in RDT&E. Since we measure growth compared to initial baselines, this measure can show significant increases when a program originally was planned to involve little RDT&E but received even modest additions to address changing threats or operational needs. Still, this approach provides a means for measuring total RDT&E funding control relative to original plans.
While examining total RDT&E funding from each program’s original baseline estimate is important to capture the overall growth since inception, it may not be the best choice for gaining insight into recent cost-growth management. When we analyze a program from inception, we are forced to carry all growth until the program or phase of the program ceases to be active. Programs currently executing well but that had a one-time increase in the distant past can appear to be poor performers in the long term. Therefore, we also measure biennial changes in total planned and actual RDT&E funding.
Figure 2-11 shows total cumulative RDT&E funding growth over original MS B baseline for each year’s MDAP portfolio. This is the most conservative measure since it ignores any revised original baselines set after Nunn-McCurdy breaches. For each analysis, we first show the main portion of the distribution (between −10 percent and +100 percent growth) followed by a separate figure showing all outliers (especially those with growth greater than 100 percent). Medians are the lines within each box. Gray-shaded columns in the table beneath each chart were periods with very low sample counts because SARs for all active programs were not made in those years due to new Presidential administrations. The “x” markers above the box mark the five largest instances of program funding growth (although outliers above 100 percent only appear on the outlier charts). These outlier charts are controlled for program maturity only. Notably, the data show considerable (and sometimes seemingly conflicting) differences between the medians and the arithmetic means. This is because the data are highly skewed, and a single but very large outlier can have a large effect on the mean while not affecting the median.26 In these cases, the best measure of central tendency is the mean.
26 Part of the skewing in the distribution of cost change is the mathematical boundary of cost change because cost cannot decrease more than 100 percent but can increase more than 100 percent.
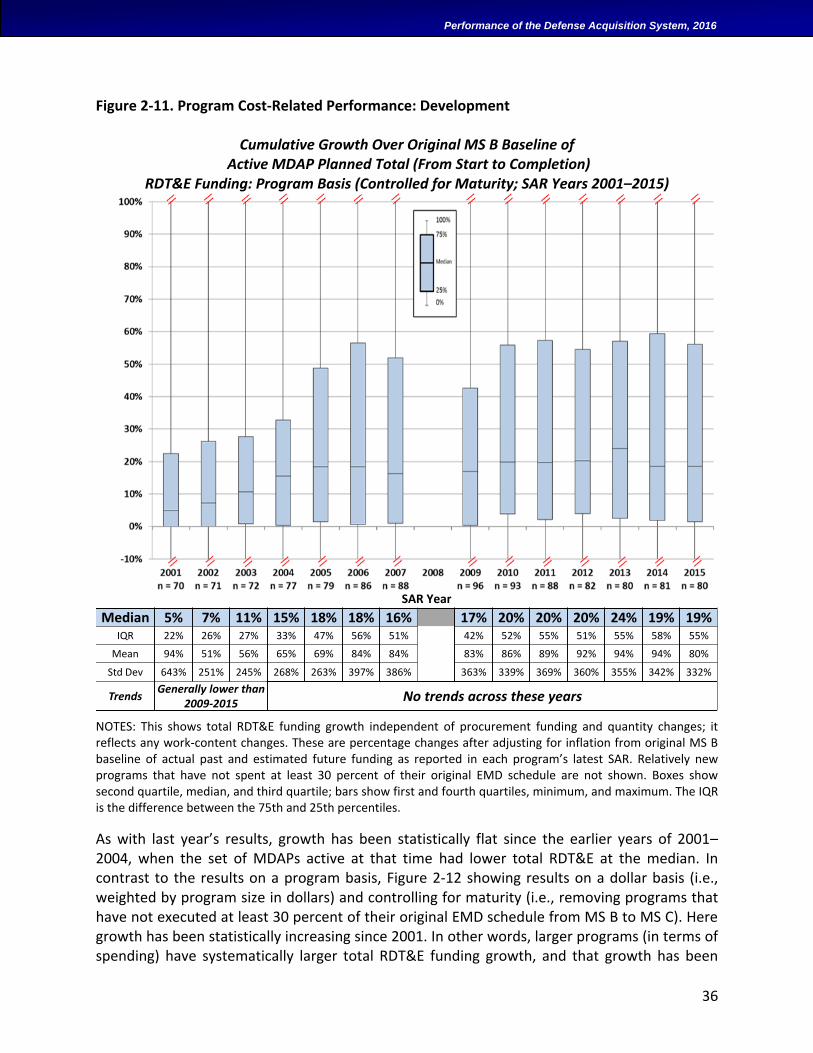
36
Performance of the Defense Acquisition System, 2016
Figure 2-11. Program Cost-Related Performance: Development
Cumulative Growth Over Original MS B Baseline of Active MDAP Planned Total (From Start to Completion)
RDT&E Funding: Program Basis (Controlled for Maturity; SAR Years 2001–2015)
SAR Year
NOTES: This shows total RDT&E funding growth independent of procurement funding and quantity changes; it reflects any work-content changes. These are percentage changes after adjusting for inflation from original MS B baseline of actual past and estimated future funding as reported in each program’s latest SAR. Relatively new programs that have not spent at least 30 percent of their original EMD schedule are not shown. Boxes show second quartile, median, and third quartile; bars show first and fourth quartiles, minimum, and maximum. The IQR is the difference between the 75th and 25th percentiles.
As with last year’s results, growth has been statistically flat since the earlier years of 2001–2004, when the set of MDAPs active at that time had lower total RDT&E at the median. In contrast to the results on a program basis, Figure 2-12 showing results on a dollar basis (i.e., weighted by program size in dollars) and controlling for maturity (i.e., removing programs that have not executed at least 30 percent of their original EMD schedule from MS B to MS C). Here growth has been statistically increasing since 2001. In other words, larger programs (in terms of spending) have systematically larger total RDT&E funding growth, and that growth has been
Median 5% 7% 11% 15% 18% 18% 16% 17% 20% 20% 20% 24% 19% 19%IQR 22% 26% 27% 33% 47% 56% 51% 42% 52% 55% 51% 55% 58% 55%
Mean 94% 51% 56% 65% 69% 84% 84% 83% 86% 89% 92% 94% 94% 80%
Std Dev 643% 251% 245% 268% 263% 397% 386% 363% 339% 369% 360% 355% 342% 332%
TrendsGenerally lower than
2009-2015No trends across these years
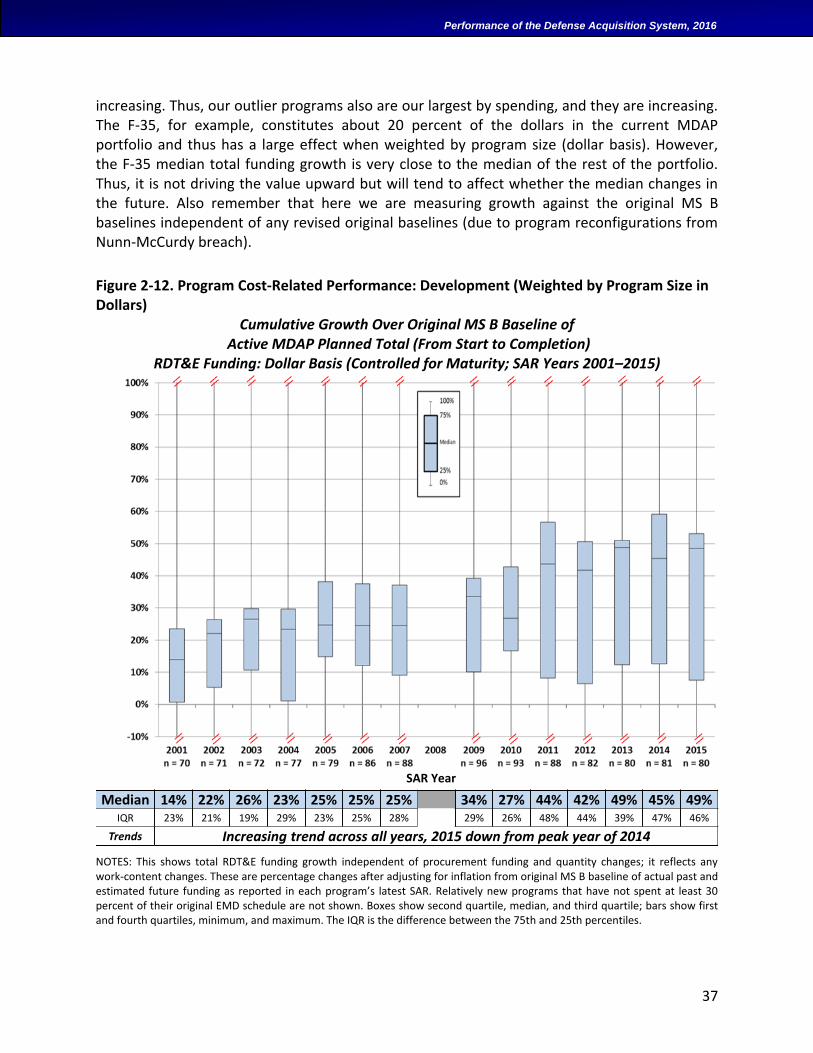
37
Performance of the Defense Acquisition System, 2016
increasing. Thus, our outlier programs also are our largest by spending, and they are increasing. The F-35, for example, constitutes about 20 percent of the dollars in the current MDAP portfolio and thus has a large effect when weighted by program size (dollar basis). However, the F-35 median total funding growth is very close to the median of the rest of the portfolio. Thus, it is not driving the value upward but will tend to affect whether the median changes in the future. Also remember that here we are measuring growth against the original MS B baselines independent of any revised original baselines (due to program reconfigurations from Nunn-McCurdy breach).
Figure 2-12. Program Cost-Related Performance: Development (Weighted by Program Size in Dollars)
Cumulative Growth Over Original MS B Baseline of Active MDAP Planned Total (From Start to Completion)
RDT&E Funding: Dollar Basis (Controlled for Maturity; SAR Years 2001–2015)
SAR Year
NOTES: This shows total RDT&E funding growth independent of procurement funding and quantity changes; it reflects any work-content changes. These are percentage changes after adjusting for inflation from original MS B baseline of actual past and estimated future funding as reported in each program’s latest SAR. Relatively new programs that have not spent at least 30 percent of their original EMD schedule are not shown. Boxes show second quartile, median, and third quartile; bars show first and fourth quartiles, minimum, and maximum. The IQR is the difference between the 75th and 25th percentiles.
Median 14% 22% 26% 23% 25% 25% 25% 34% 27% 44% 42% 49% 45% 49%IQR 23% 21% 19% 29% 23% 25% 28% 29% 26% 48% 44% 39% 47% 46%
Trends Increasing trend across all years, 2015 down from peak year of 2014
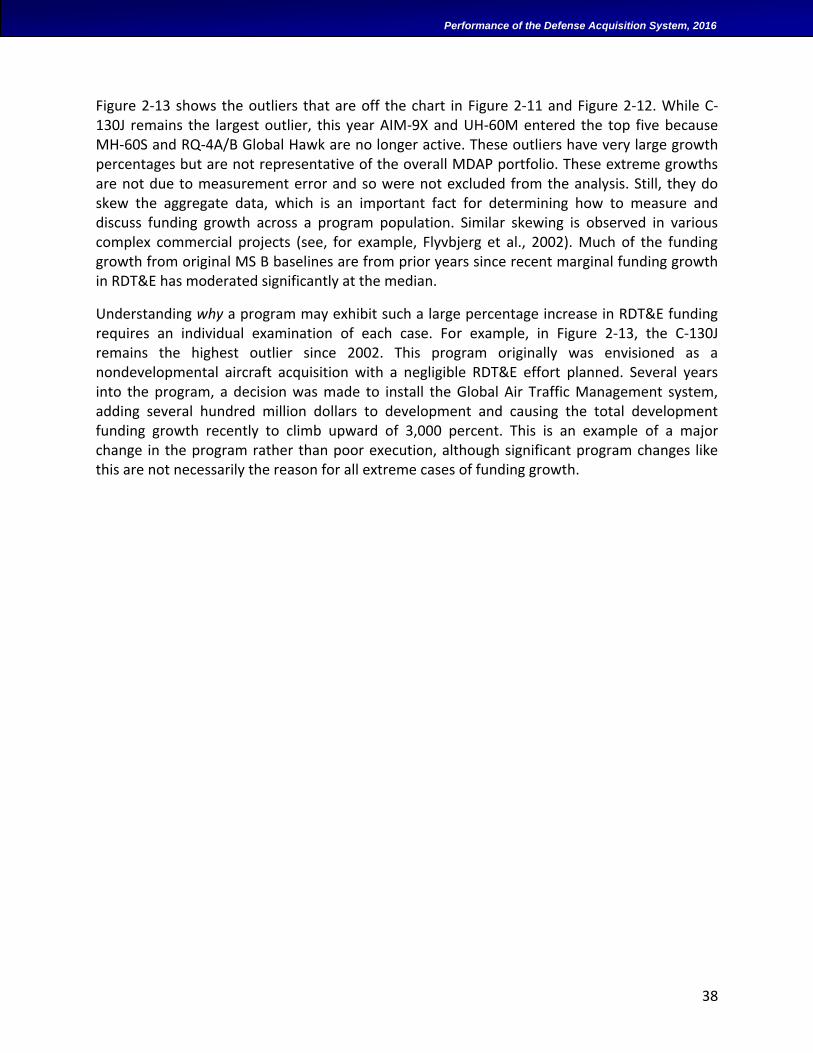
38
Performance of the Defense Acquisition System, 2016
Figure 2-13 shows the outliers that are off the chart in Figure 2-11 and Figure 2-12. While C-130J remains the largest outlier, this year AIM-9X and UH-60M entered the top five because MH-60S and RQ-4A/B Global Hawk are no longer active. These outliers have very large growth percentages but are not representative of the overall MDAP portfolio. These extreme growths are not due to measurement error and so were not excluded from the analysis. Still, they do skew the aggregate data, which is an important fact for determining how to measure and discuss funding growth across a program population. Similar skewing is observed in various complex commercial projects (see, for example, Flyvbjerg et al., 2002). Much of the funding growth from original MS B baselines are from prior years since recent marginal funding growth in RDT&E has moderated significantly at the median.
Understanding why a program may exhibit such a large percentage increase in RDT&E funding requires an individual examination of each case. For example, in Figure 2-13, the C-130J remains the highest outlier since 2002. This program originally was envisioned as a nondevelopmental aircraft acquisition with a negligible RDT&E effort planned. Several years into the program, a decision was made to install the Global Air Traffic Management system, adding several hundred million dollars to development and causing the total development funding growth recently to climb upward of 3,000 percent. This is an example of a major change in the program rather than poor execution, although significant program changes like this are not necessarily the reason for all extreme cases of funding growth.
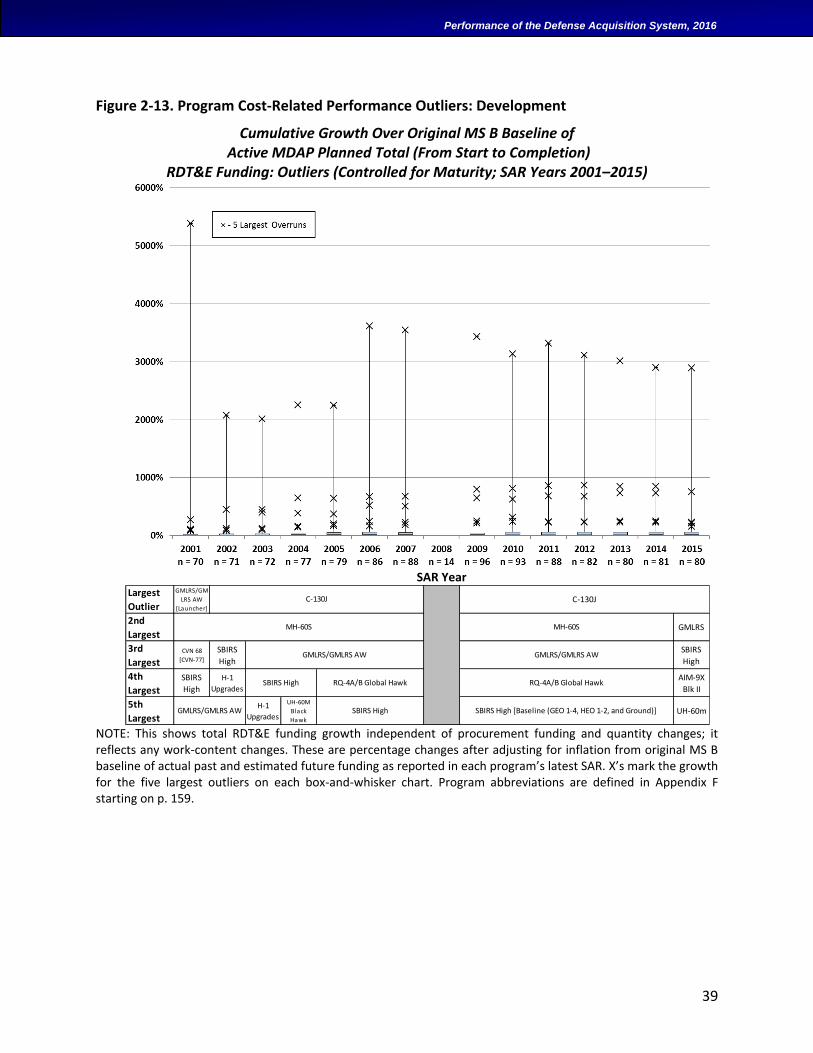
39
Performance of the Defense Acquisition System, 2016
Figure 2-13. Program Cost-Related Performance Outliers: Development
Cumulative Growth Over Original MS B Baseline of Active MDAP Planned Total (From Start to Completion)
RDT&E Funding: Outliers (Controlled for Maturity; SAR Years 2001–2015)
SAR Year
NOTE: This shows total RDT&E funding growth independent of procurement funding and quantity changes; it reflects any work-content changes. These are percentage changes after adjusting for inflation from original MS B baseline of actual past and estimated future funding as reported in each program’s latest SAR. X’s mark the growth for the five largest outliers on each box-and-whisker chart. Program abbreviations are defined in Appendix F starting on p. 159.
Largest
Outlier
GMLRS/GM
LRS AW
[Launcher]
2nd
LargestGMLRS
3rd
LargestCVN 68
[CVN-77]
SBIRS
High
SBIRS
High
4th
Largest
SBIRS
High
H-1
Upgrades
AIM-9X
Blk II
5th
Largest
H-1
Upgrades
UH-60M
Black
Hawk
UH-60m
C-130J
MH-60S MH-60S
GMLRS/GMLRS AW
SBIRS High RQ-4A/B Global Hawk RQ-4A/B Global Hawk
SBIRS HighGMLRS/GMLRS AW
C-130J
GMLRS/GMLRS AW
SBIRS High [Baseline (GEO 1-4, HEO 1-2, and Ground)]
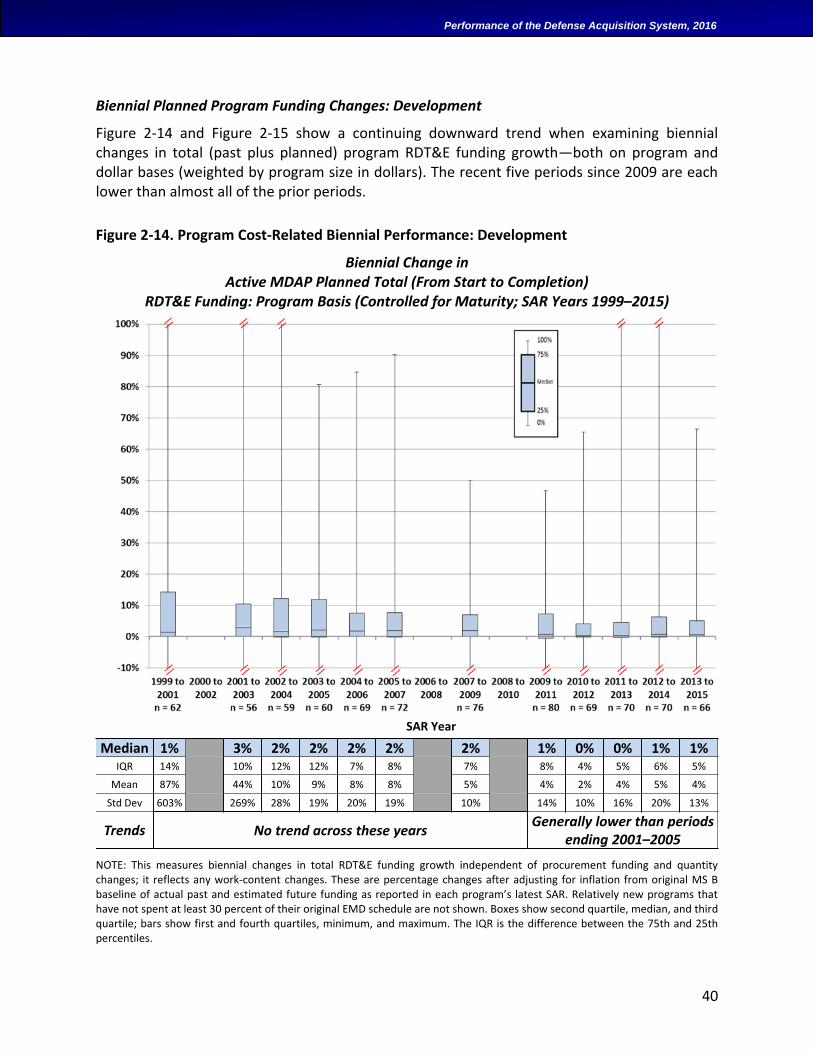
40
Performance of the Defense Acquisition System, 2016
Biennial Planned Program Funding Changes: Development
Figure 2-14 and Figure 2-15 show a continuing downward trend when examining biennial changes in total (past plus planned) program RDT&E funding growth—both on program and dollar bases (weighted by program size in dollars). The recent five periods since 2009 are each lower than almost all of the prior periods.
Figure 2-14. Program Cost-Related Biennial Performance: Development
Biennial Change in Active MDAP Planned Total (From Start to Completion)
RDT&E Funding: Program Basis (Controlled for Maturity; SAR Years 1999–2015)
SAR Year
NOTE: This measures biennial changes in total RDT&E funding growth independent of procurement funding and quantity changes; it reflects any work-content changes. These are percentage changes after adjusting for inflation from original MS B baseline of actual past and estimated future funding as reported in each program’s latest SAR. Relatively new programs that have not spent at least 30 percent of their original EMD schedule are not shown. Boxes show second quartile, median, and third quartile; bars show first and fourth quartiles, minimum, and maximum. The IQR is the difference between the 75th and 25th percentiles.
Median 1% 3% 2% 2% 2% 2% 2% 1% 0% 0% 1% 1%IQR 14% 10% 12% 12% 7% 8% 7% 8% 4% 5% 6% 5%
Mean 87% 44% 10% 9% 8% 8% 5% 4% 2% 4% 5% 4%
Std Dev 603% 269% 28% 19% 20% 19% 10% 14% 10% 16% 20% 13%
Trends No trend across these yearsGenerally lower than periods
ending 2001–2005
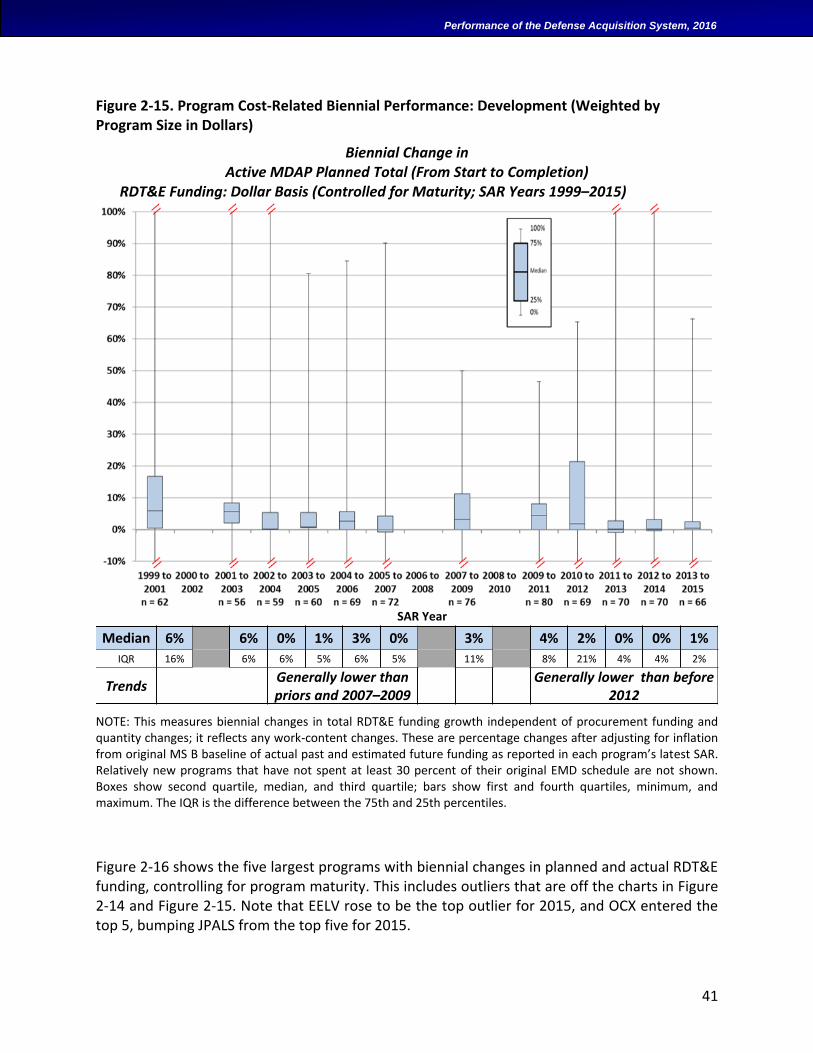
41
Performance of the Defense Acquisition System, 2016
Figure 2-15. Program Cost-Related Biennial Performance: Development (Weighted by Program Size in Dollars)
Biennial Change in Active MDAP Planned Total (From Start to Completion)
RDT&E Funding: Dollar Basis (Controlled for Maturity; SAR Years 1999–2015)
SAR Year
NOTE: This measures biennial changes in total RDT&E funding growth independent of procurement funding and quantity changes; it reflects any work-content changes. These are percentage changes after adjusting for inflation from original MS B baseline of actual past and estimated future funding as reported in each program’s latest SAR. Relatively new programs that have not spent at least 30 percent of their original EMD schedule are not shown. Boxes show second quartile, median, and third quartile; bars show first and fourth quartiles, minimum, and maximum. The IQR is the difference between the 75th and 25th percentiles.
Figure 2-16 shows the five largest programs with biennial changes in planned and actual RDT&E funding, controlling for program maturity. This includes outliers that are off the charts in Figure 2-14 and Figure 2-15. Note that EELV rose to be the top outlier for 2015, and OCX entered the top 5, bumping JPALS from the top five for 2015.
Median 6% 6% 0% 1% 3% 0% 3% 4% 2% 0% 0% 1%
IQR 16% 6% 6% 5% 6% 5% 11% 8% 21% 4% 4% 2%
TrendsGenerally lower than priors and 2007–2009
Generally lower than before 2012
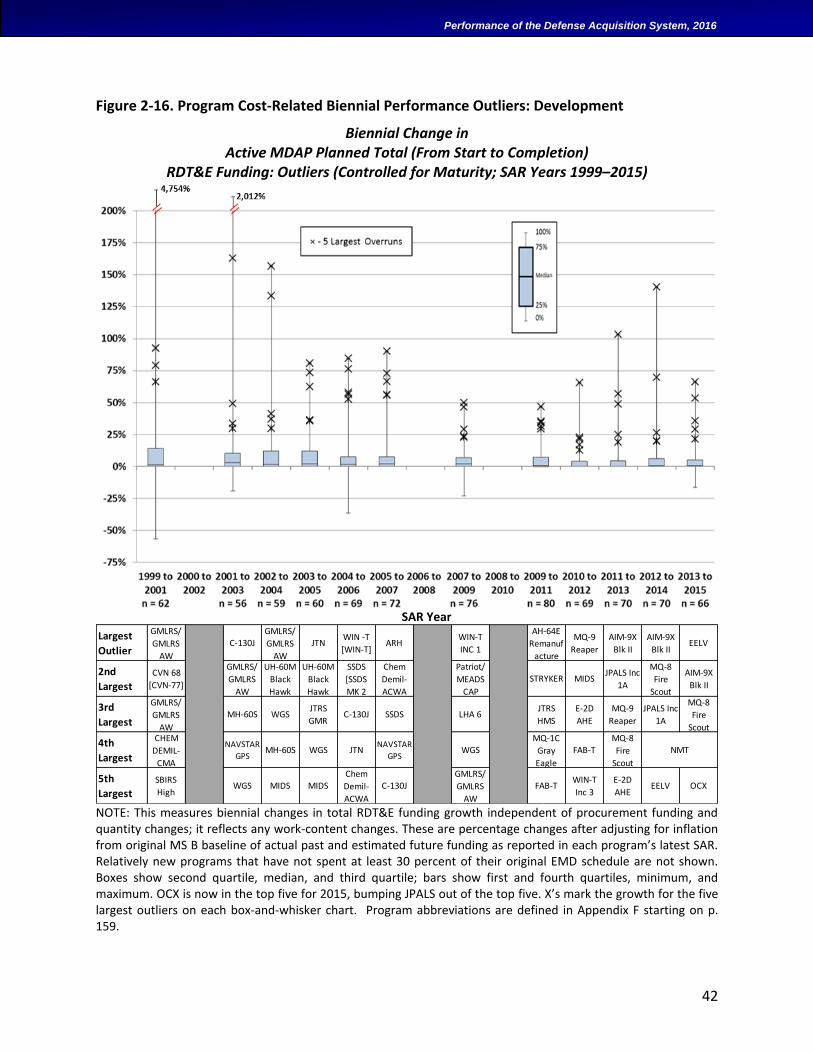
42
Performance of the Defense Acquisition System, 2016
Figure 2-16. Program Cost-Related Biennial Performance Outliers: Development
Biennial Change in Active MDAP Planned Total (From Start to Completion)
RDT&E Funding: Outliers (Controlled for Maturity; SAR Years 1999–2015)
SAR Year
NOTE: This measures biennial changes in total RDT&E funding growth independent of procurement funding and quantity changes; it reflects any work-content changes. These are percentage changes after adjusting for inflation from original MS B baseline of actual past and estimated future funding as reported in each program’s latest SAR. Relatively new programs that have not spent at least 30 percent of their original EMD schedule are not shown. Boxes show second quartile, median, and third quartile; bars show first and fourth quartiles, minimum, and maximum. OCX is now in the top five for 2015, bumping JPALS out of the top five. X’s mark the growth for the five largest outliers on each box-and-whisker chart. Program abbreviations are defined in Appendix F starting on p. 159.
Largest
Outlier
GMLRS/
GMLRS
AW
C-130JGMLRS/
GMLRS
AW
JTNWIN -T
[WIN-T]ARH
WIN-T
INC 1
AH-64E
Remanuf
acture
MQ-9
Reaper
AIM-9X
Blk II
AIM-9X
Blk IIEELV
2nd
Largest
CVN 68
[CVN-77]
GMLRS/
GMLRS
AW
UH-60M
Black
Hawk
UH-60M
Black
Hawk
SSDS
[SSDS
MK 2
Chem
Demil-
ACWA
Patriot/
MEADS
CAP
STRYKER MIDSJPALS Inc
1A
MQ-8
Fire
Scout
AIM-9X
Blk II
3rd
Largest
GMLRS/
GMLRS
AW
MH-60S WGSJTRS
GMRC-130J SSDS LHA 6
JTRS
HMS
E-2D
AHE
MQ-9
Reaper
JPALS Inc
1A
MQ-8
Fire
Scout
4th
Largest
CHEM
DEMIL-
CMA
NAVSTAR
GPSMH-60S WGS JTN
NAVSTAR
GPSWGS
MQ-1C
Gray
Eagle
FAB-TMQ-8
Fire
Scout
5th
Largest
SBIRS
HighWGS MIDS MIDS
Chem
Demil-
ACWA
C-130JGMLRS/
GMLRS
AW
FAB-TWIN-T
Inc 3
E-2D
AHEEELV OCX
NMT
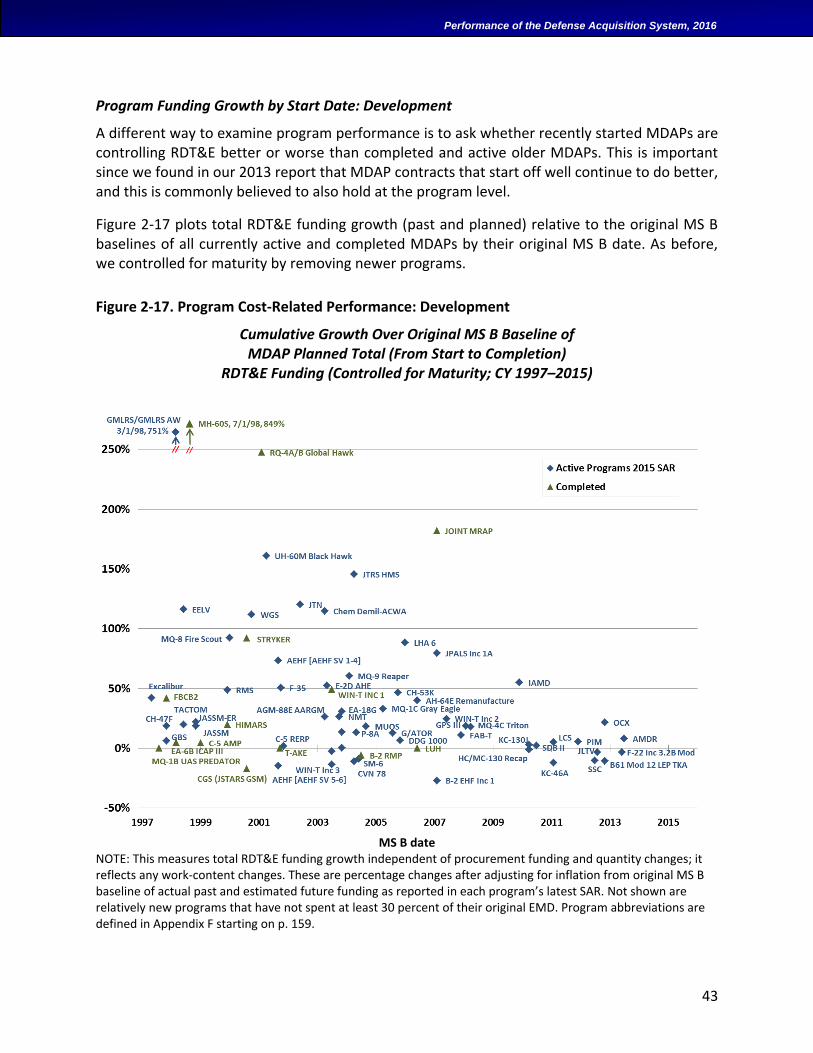
43
Performance of the Defense Acquisition System, 2016
Program Funding Growth by Start Date: Development
A different way to examine program performance is to ask whether recently started MDAPs are controlling RDT&E better or worse than completed and active older MDAPs. This is important since we found in our 2013 report that MDAP contracts that start off well continue to do better, and this is commonly believed to also hold at the program level.
Figure 2-17 plots total RDT&E funding growth (past and planned) relative to the original MS B baselines of all currently active and completed MDAPs by their original MS B date. As before, we controlled for maturity by removing newer programs.
Figure 2-17. Program Cost-Related Performance: Development
Cumulative Growth Over Original MS B Baseline of MDAP Planned Total (From Start to Completion)
RDT&E Funding (Controlled for Maturity; CY 1997–2015)
MS B date
NOTE: This measures total RDT&E funding growth independent of procurement funding and quantity changes; it reflects any work-content changes. These are percentage changes after adjusting for inflation from original MS B baseline of actual past and estimated future funding as reported in each program’s latest SAR. Not shown are relatively new programs that have not spent at least 30 percent of their original EMD. Program abbreviations are defined in Appendix F starting on p. 159.
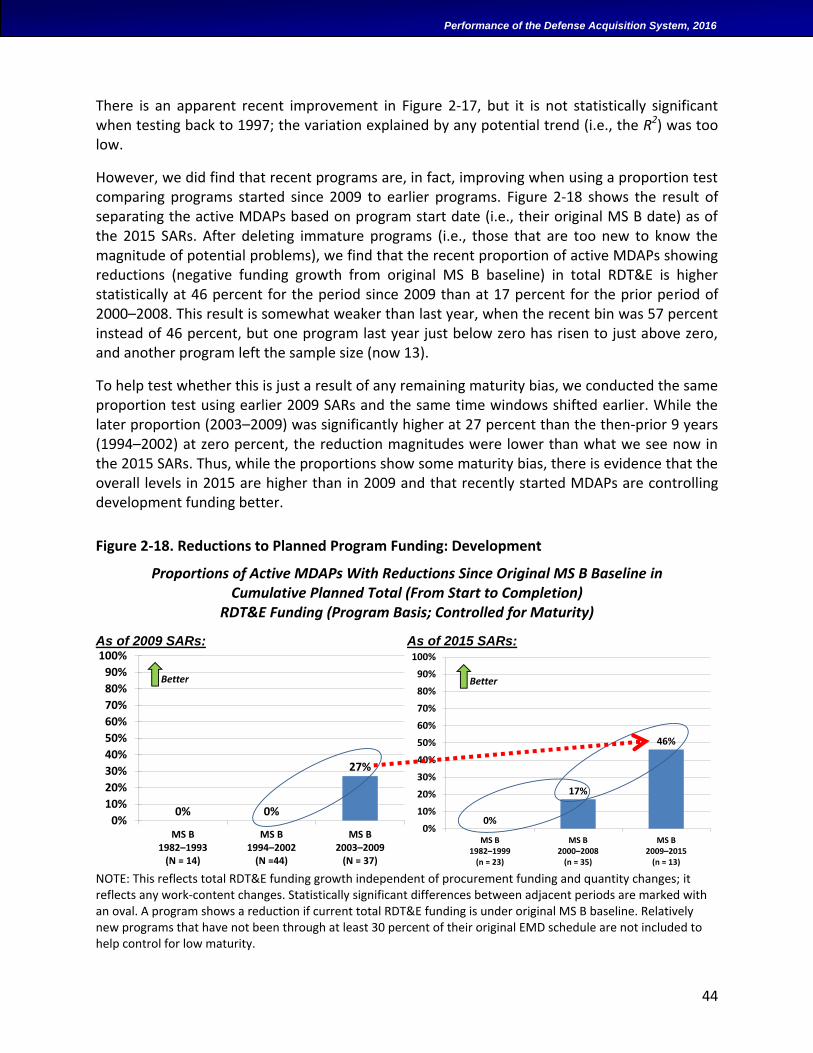
44
Performance of the Defense Acquisition System, 2016
There is an apparent recent improvement in Figure 2-17, but it is not statistically significant when testing back to 1997; the variation explained by any potential trend (i.e., the R2) was too low.
However, we did find that recent programs are, in fact, improving when using a proportion test comparing programs started since 2009 to earlier programs. Figure 2-18 shows the result of separating the active MDAPs based on program start date (i.e., their original MS B date) as of the 2015 SARs. After deleting immature programs (i.e., those that are too new to know the magnitude of potential problems), we find that the recent proportion of active MDAPs showing reductions (negative funding growth from original MS B baseline) in total RDT&E is higher statistically at 46 percent for the period since 2009 than at 17 percent for the prior period of 2000–2008. This result is somewhat weaker than last year, when the recent bin was 57 percent instead of 46 percent, but one program last year just below zero has risen to just above zero, and another program left the sample size (now 13).
To help test whether this is just a result of any remaining maturity bias, we conducted the same proportion test using earlier 2009 SARs and the same time windows shifted earlier. While the later proportion (2003–2009) was significantly higher at 27 percent than the then-prior 9 years (1994–2002) at zero percent, the reduction magnitudes were lower than what we see now in the 2015 SARs. Thus, while the proportions show some maturity bias, there is evidence that the overall levels in 2015 are higher than in 2009 and that recently started MDAPs are controlling development funding better.
Figure 2-18. Reductions to Planned Program Funding: Development
Proportions of Active MDAPs With Reductions Since Original MS B Baseline in Cumulative Planned Total (From Start to Completion)
RDT&E Funding (Program Basis; Controlled for Maturity)
As of 2009 SARs: As of 2015 SARs:
NOTE: This reflects total RDT&E funding growth independent of procurement funding and quantity changes; it reflects any work-content changes. Statistically significant differences between adjacent periods are marked with an oval. A program shows a reduction if current total RDT&E funding is under original MS B baseline. Relatively new programs that have not been through at least 30 percent of their original EMD schedule are not included to help control for low maturity.
0% 0%
27%
0%
10%
20%
30%
40%
50%
60%
70%
80%
90%
100%
MS B1982–1993
(N = 14)
MS B1994–2002
(N =44)
MS B2003–2009
(N = 37)
Better
0%
17%
46%
0%
10%
20%
30%
40%
50%
60%
70%
80%
90%
100%
MS B1982–1999
(n = 23)
MS B2000–2008
(n = 35)
MS B2009–2015
(n = 13)
Better
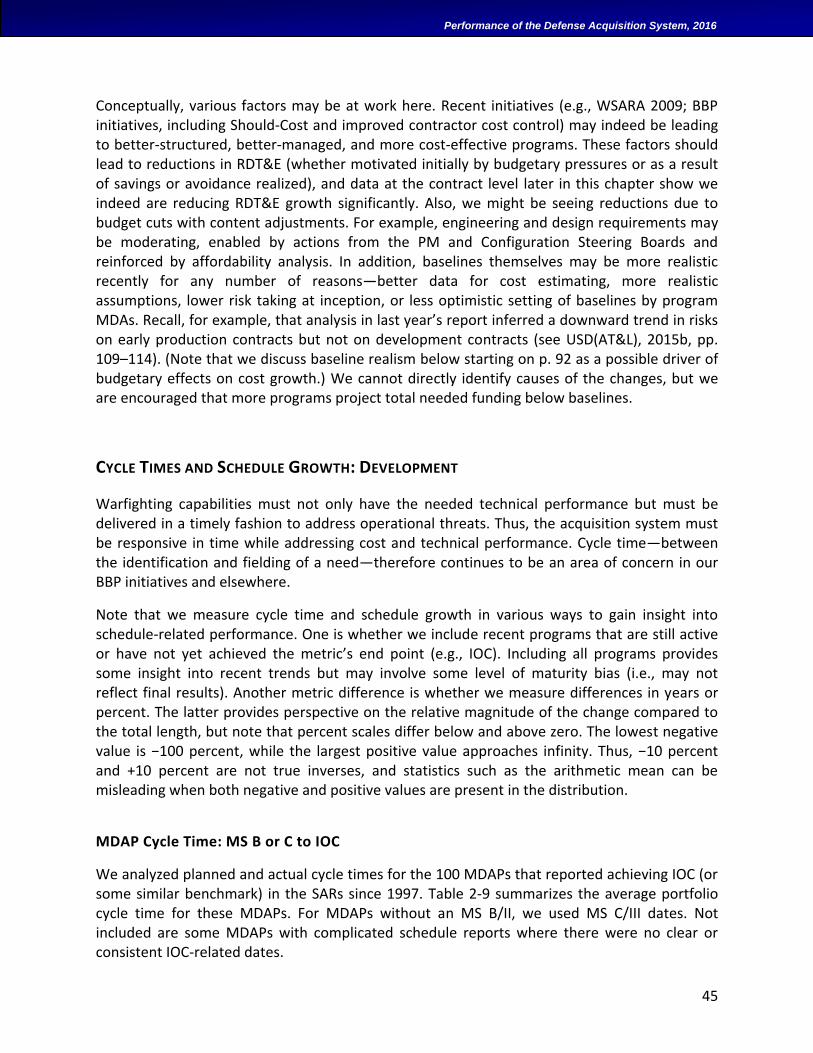
45
Performance of the Defense Acquisition System, 2016
Conceptually, various factors may be at work here. Recent initiatives (e.g., WSARA 2009; BBP initiatives, including Should-Cost and improved contractor cost control) may indeed be leading to better-structured, better-managed, and more cost-effective programs. These factors should lead to reductions in RDT&E (whether motivated initially by budgetary pressures or as a result of savings or avoidance realized), and data at the contract level later in this chapter show we indeed are reducing RDT&E growth significantly. Also, we might be seeing reductions due to budget cuts with content adjustments. For example, engineering and design requirements may be moderating, enabled by actions from the PM and Configuration Steering Boards and reinforced by affordability analysis. In addition, baselines themselves may be more realistic recently for any number of reasons—better data for cost estimating, more realistic assumptions, lower risk taking at inception, or less optimistic setting of baselines by program MDAs. Recall, for example, that analysis in last year’s report inferred a downward trend in risks on early production contracts but not on development contracts (see USD(AT&L), 2015b, pp. 109–114). (Note that we discuss baseline realism below starting on p. 92 as a possible driver of budgetary effects on cost growth.) We cannot directly identify causes of the changes, but we are encouraged that more programs project total needed funding below baselines.
CYCLE TIMES AND SCHEDULE GROWTH: DEVELOPMENT
Warfighting capabilities must not only have the needed technical performance but must be delivered in a timely fashion to address operational threats. Thus, the acquisition system must be responsive in time while addressing cost and technical performance. Cycle time—between the identification and fielding of a need—therefore continues to be an area of concern in our BBP initiatives and elsewhere.
Note that we measure cycle time and schedule growth in various ways to gain insight into schedule-related performance. One is whether we include recent programs that are still active or have not yet achieved the metric’s end point (e.g., IOC). Including all programs provides some insight into recent trends but may involve some level of maturity bias (i.e., may not reflect final results). Another metric difference is whether we measure differences in years or percent. The latter provides perspective on the relative magnitude of the change compared to the total length, but note that percent scales differ below and above zero. The lowest negative value is −100 percent, while the largest positive value approaches infinity. Thus, −10 percent and +10 percent are not true inverses, and statistics such as the arithmetic mean can be misleading when both negative and positive values are present in the distribution.
MDAP Cycle Time: MS B or C to IOC
We analyzed planned and actual cycle times for the 100 MDAPs that reported achieving IOC (or some similar benchmark) in the SARs since 1997. Table 2-9 summarizes the average portfolio cycle time for these MDAPs. For MDAPs without an MS B/II, we used MS C/III dates. Not included are some MDAPs with complicated schedule reports where there were no clear or consistent IOC-related dates.
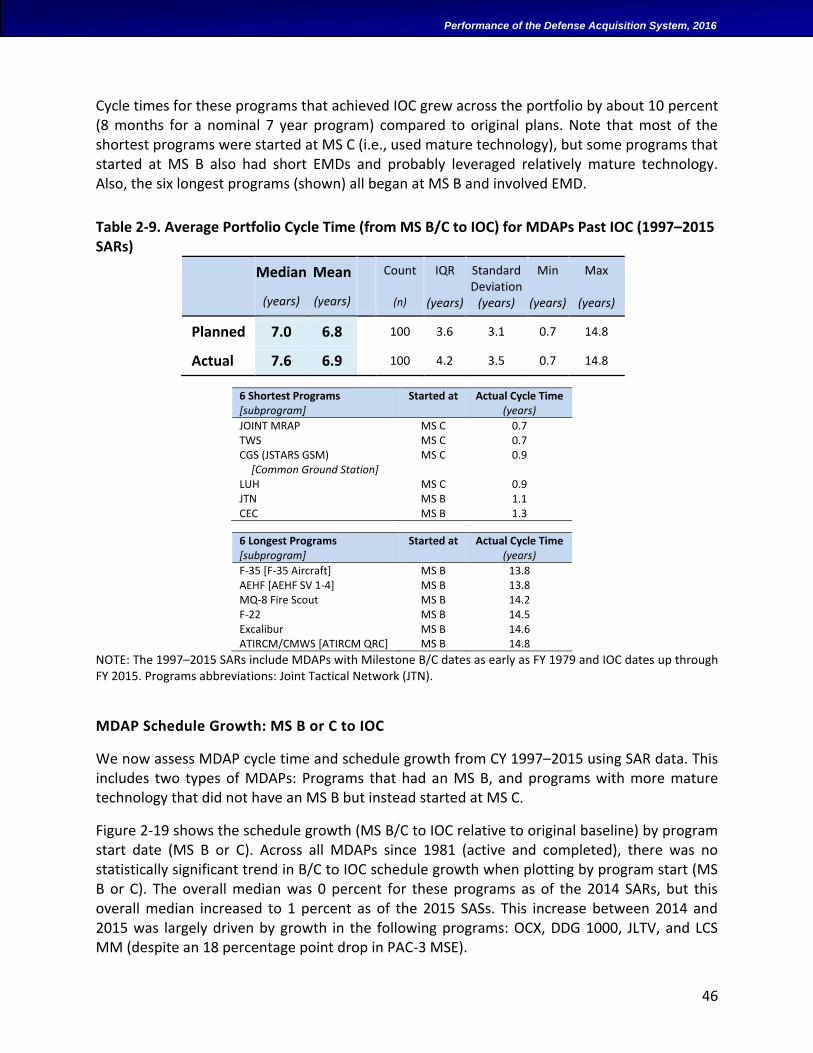
46
Performance of the Defense Acquisition System, 2016
Cycle times for these programs that achieved IOC grew across the portfolio by about 10 percent (8 months for a nominal 7 year program) compared to original plans. Note that most of the shortest programs were started at MS C (i.e., used mature technology), but some programs that started at MS B also had short EMDs and probably leveraged relatively mature technology. Also, the six longest programs (shown) all began at MS B and involved EMD.
Table 2-9. Average Portfolio Cycle Time (from MS B/C to IOC) for MDAPs Past IOC (1997–2015 SARs)
Median
(years)
Mean
(years)
Count
(n)
IQR
(years)
Standard Deviation
(years)
Min
(years)
Max
(years)
Planned 7.0 6.8 100 3.6 3.1 0.7 14.8
Actual 7.6 6.9 100 4.2 3.5 0.7 14.8
6 Shortest Programs [subprogram]
Started at Actual Cycle Time (years)
JOINT MRAP MS C 0.7 TWS MS C 0.7 CGS (JSTARS GSM)
[Common Ground Station] MS C 0.9
LUH MS C 0.9 JTN MS B 1.1 CEC MS B 1.3
6 Longest Programs [subprogram]
Started at Actual Cycle Time (years)
F-35 [F-35 Aircraft] MS B 13.8 AEHF [AEHF SV 1-4] MS B 13.8 MQ-8 Fire Scout MS B 14.2 F-22 MS B 14.5 Excalibur MS B 14.6 ATIRCM/CMWS [ATIRCM QRC] MS B 14.8
NOTE: The 1997–2015 SARs include MDAPs with Milestone B/C dates as early as FY 1979 and IOC dates up through FY 2015. Programs abbreviations: Joint Tactical Network (JTN).
MDAP Schedule Growth: MS B or C to IOC
We now assess MDAP cycle time and schedule growth from CY 1997–2015 using SAR data. This includes two types of MDAPs: Programs that had an MS B, and programs with more mature technology that did not have an MS B but instead started at MS C.
Figure 2-19 shows the schedule growth (MS B/C to IOC relative to original baseline) by program start date (MS B or C). Across all MDAPs since 1981 (active and completed), there was no statistically significant trend in B/C to IOC schedule growth when plotting by program start (MS B or C). The overall median was 0 percent for these programs as of the 2014 SARs, but this overall median increased to 1 percent as of the 2015 SASs. This increase between 2014 and 2015 was largely driven by growth in the following programs: OCX, DDG 1000, JLTV, and LCS MM (despite an 18 percentage point drop in PAC-3 MSE).
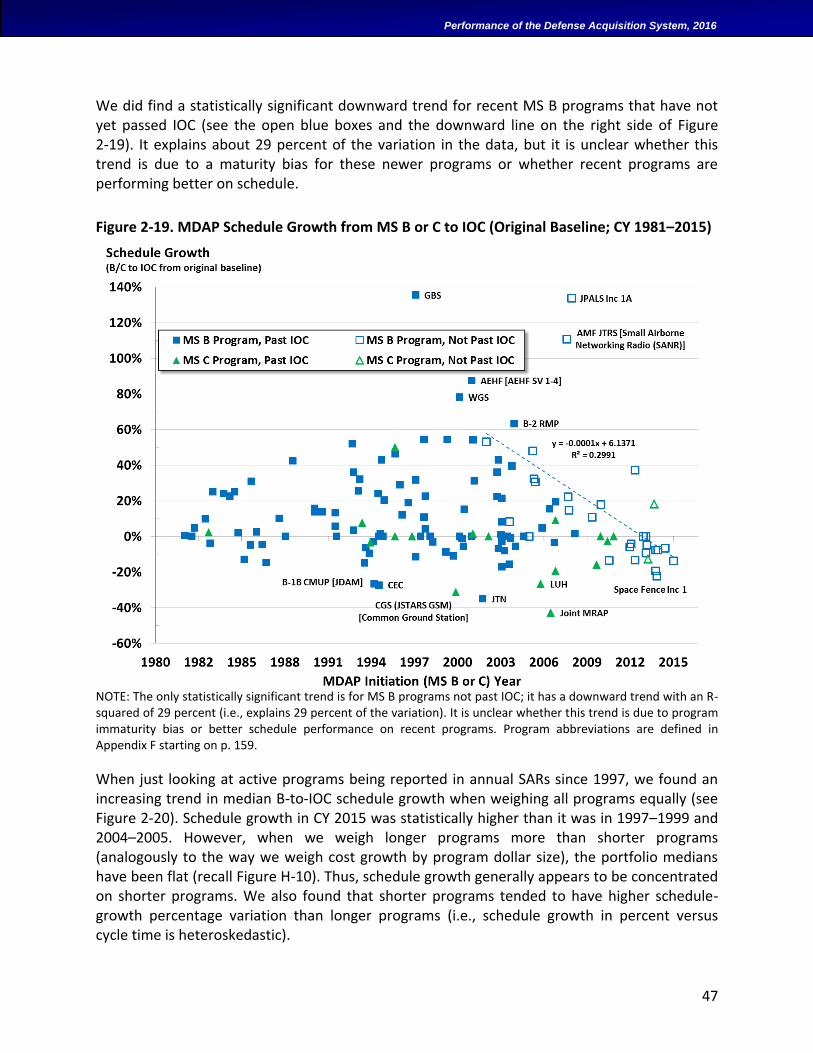
47
Performance of the Defense Acquisition System, 2016
We did find a statistically significant downward trend for recent MS B programs that have not yet passed IOC (see the open blue boxes and the downward line on the right side of Figure 2-19). It explains about 29 percent of the variation in the data, but it is unclear whether this trend is due to a maturity bias for these newer programs or whether recent programs are performing better on schedule.
Figure 2-19. MDAP Schedule Growth from MS B or C to IOC (Original Baseline; CY 1981–2015)
NOTE: The only statistically significant trend is for MS B programs not past IOC; it has a downward trend with an R-squared of 29 percent (i.e., explains 29 percent of the variation). It is unclear whether this trend is due to program immaturity bias or better schedule performance on recent programs. Program abbreviations are defined in Appendix F starting on p. 159.
When just looking at active programs being reported in annual SARs since 1997, we found an increasing trend in median B-to-IOC schedule growth when weighing all programs equally (see Figure 2-20). Schedule growth in CY 2015 was statistically higher than it was in 1997–1999 and 2004–2005. However, when we weigh longer programs more than shorter programs (analogously to the way we weigh cost growth by program dollar size), the portfolio medians have been flat (recall Figure H-10). Thus, schedule growth generally appears to be concentrated on shorter programs. We also found that shorter programs tended to have higher schedule-growth percentage variation than longer programs (i.e., schedule growth in percent versus cycle time is heteroskedastic).
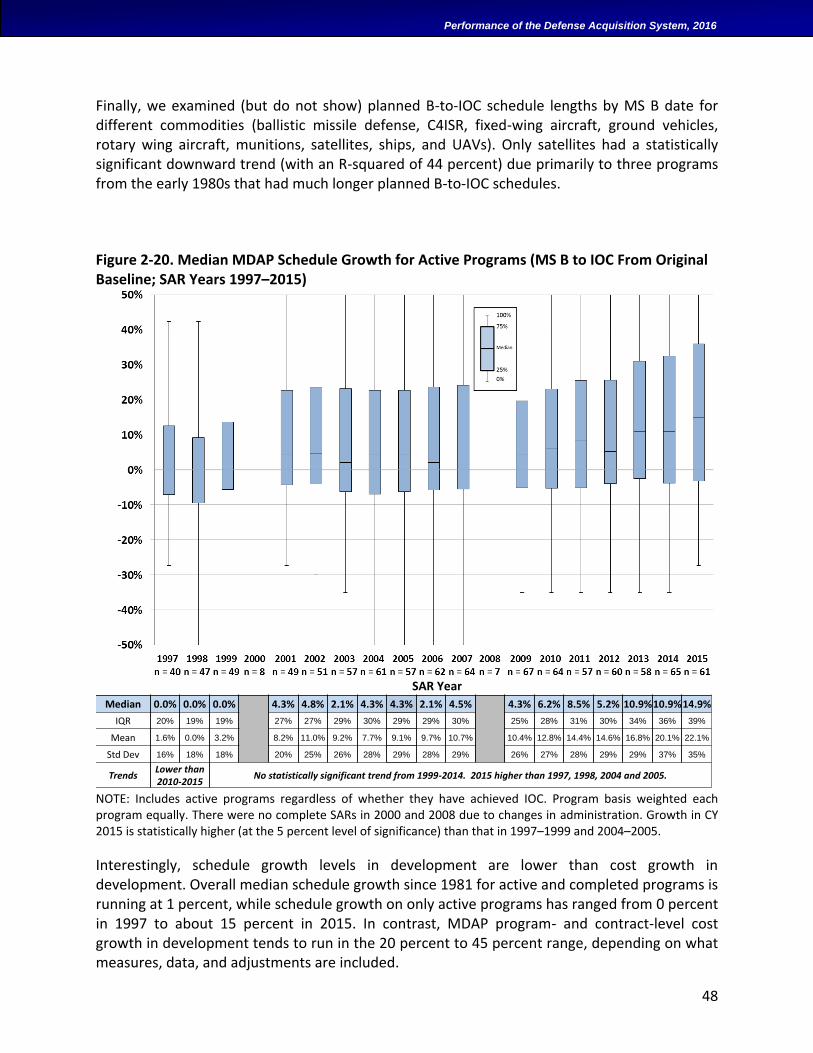
48
Performance of the Defense Acquisition System, 2016
Finally, we examined (but do not show) planned B-to-IOC schedule lengths by MS B date for different commodities (ballistic missile defense, C4ISR, fixed-wing aircraft, ground vehicles, rotary wing aircraft, munitions, satellites, ships, and UAVs). Only satellites had a statistically significant downward trend (with an R-squared of 44 percent) due primarily to three programs from the early 1980s that had much longer planned B-to-IOC schedules.
Figure 2-20. Median MDAP Schedule Growth for Active Programs (MS B to IOC From Original Baseline; SAR Years 1997–2015)
SAR Year
NOTE: Includes active programs regardless of whether they have achieved IOC. Program basis weighted each program equally. There were no complete SARs in 2000 and 2008 due to changes in administration. Growth in CY 2015 is statistically higher (at the 5 percent level of significance) than that in 1997–1999 and 2004–2005.
Interestingly, schedule growth levels in development are lower than cost growth in development. Overall median schedule growth since 1981 for active and completed programs is running at 1 percent, while schedule growth on only active programs has ranged from 0 percent in 1997 to about 15 percent in 2015. In contrast, MDAP program- and contract-level cost growth in development tends to run in the 20 percent to 45 percent range, depending on what measures, data, and adjustments are included.
Median 0.0% 0.0% 0.0% 4.3% 4.8% 2.1% 4.3% 4.3% 2.1% 4.5% 4.3% 6.2% 8.5% 5.2% 10.9%10.9%14.9%
IQR 20% 19% 19% 27% 27% 29% 30% 29% 29% 30% 25% 28% 31% 30% 34% 36% 39%
Mean 1.6% 0.0% 3.2% 8.2% 11.0% 9.2% 7.7% 9.1% 9.7% 10.7% 10.4% 12.8% 14.4% 14.6% 16.8% 20.1% 22.1%
Std Dev 16% 18% 18% 20% 25% 26% 28% 29% 28% 29% 26% 27% 28% 29% 29% 37% 35%
TrendsLower than2010-2015
No statistically significant trend from 1999-2014. 2015 higher than 1997, 1998, 2004 and 2005.
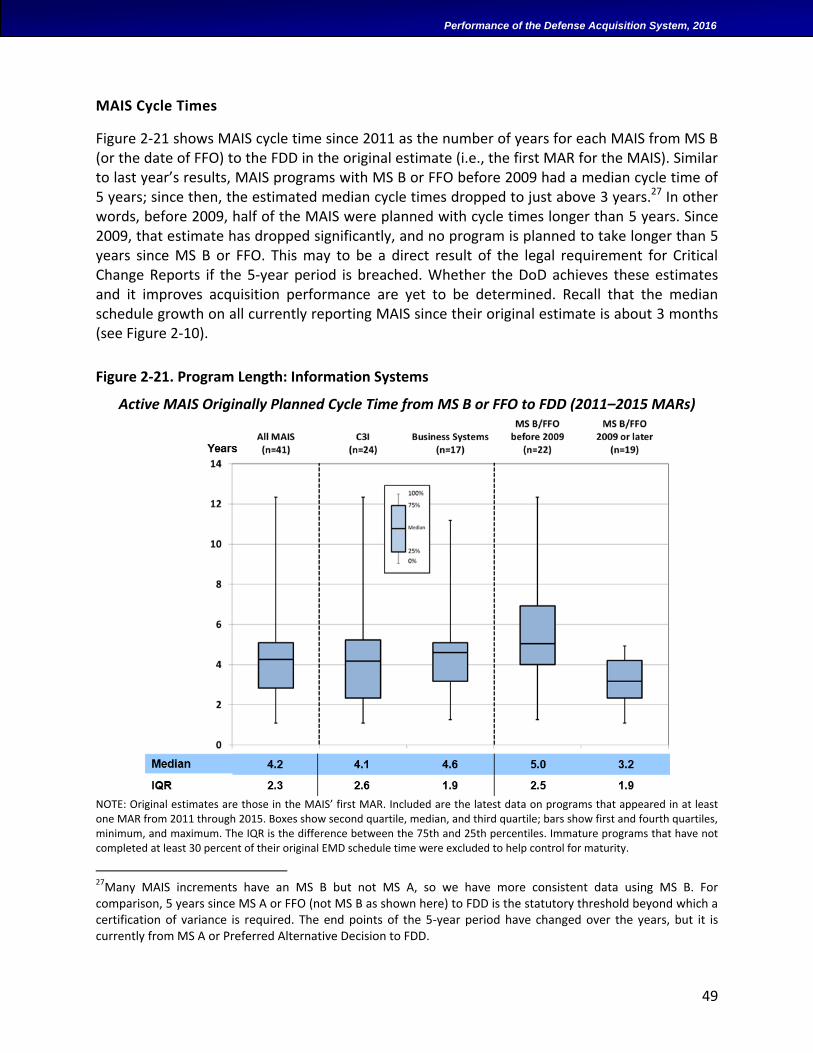
49
Performance of the Defense Acquisition System, 2016
MAIS Cycle Times
Figure 2-21 shows MAIS cycle time since 2011 as the number of years for each MAIS from MS B (or the date of FFO) to the FDD in the original estimate (i.e., the first MAR for the MAIS). Similar to last year’s results, MAIS programs with MS B or FFO before 2009 had a median cycle time of 5 years; since then, the estimated median cycle times dropped to just above 3 years.27 In other words, before 2009, half of the MAIS were planned with cycle times longer than 5 years. Since 2009, that estimate has dropped significantly, and no program is planned to take longer than 5 years since MS B or FFO. This may to be a direct result of the legal requirement for Critical Change Reports if the 5-year period is breached. Whether the DoD achieves these estimates and it improves acquisition performance are yet to be determined. Recall that the median schedule growth on all currently reporting MAIS since their original estimate is about 3 months (see Figure 2-10).
Figure 2-21. Program Length: Information Systems
Active MAIS Originally Planned Cycle Time from MS B or FFO to FDD (2011–2015 MARs)
NOTE: Original estimates are those in the MAIS’ first MAR. Included are the latest data on programs that appeared in at least one MAR from 2011 through 2015. Boxes show second quartile, median, and third quartile; bars show first and fourth quartiles, minimum, and maximum. The IQR is the difference between the 75th and 25th percentiles. Immature programs that have not completed at least 30 percent of their original EMD schedule time were excluded to help control for maturity.
27Many MAIS increments have an MS B but not MS A, so we have more consistent data using MS B. For comparison, 5 years since MS A or FFO (not MS B as shown here) to FDD is the statutory threshold beyond which a certification of variance is required. The end points of the 5-year period have changed over the years, but it is currently from MS A or Preferred Alternative Decision to FDD.
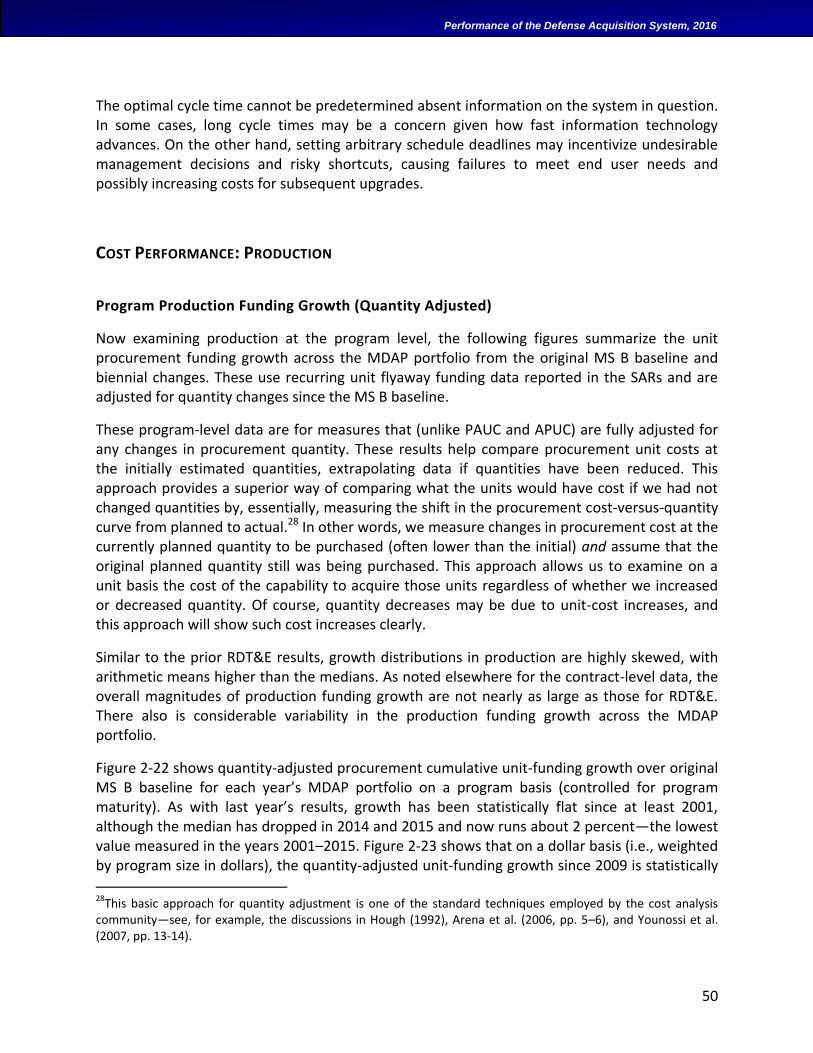
50
Performance of the Defense Acquisition System, 2016
The optimal cycle time cannot be predetermined absent information on the system in question. In some cases, long cycle times may be a concern given how fast information technology advances. On the other hand, setting arbitrary schedule deadlines may incentivize undesirable management decisions and risky shortcuts, causing failures to meet end user needs and possibly increasing costs for subsequent upgrades.
COST PERFORMANCE: PRODUCTION
Program Production Funding Growth (Quantity Adjusted)
Now examining production at the program level, the following figures summarize the unit procurement funding growth across the MDAP portfolio from the original MS B baseline and biennial changes. These use recurring unit flyaway funding data reported in the SARs and are adjusted for quantity changes since the MS B baseline.
These program-level data are for measures that (unlike PAUC and APUC) are fully adjusted for any changes in procurement quantity. These results help compare procurement unit costs at the initially estimated quantities, extrapolating data if quantities have been reduced. This approach provides a superior way of comparing what the units would have cost if we had not changed quantities by, essentially, measuring the shift in the procurement cost-versus-quantity curve from planned to actual.28 In other words, we measure changes in procurement cost at the currently planned quantity to be purchased (often lower than the initial) and assume that the original planned quantity still was being purchased. This approach allows us to examine on a unit basis the cost of the capability to acquire those units regardless of whether we increased or decreased quantity. Of course, quantity decreases may be due to unit-cost increases, and this approach will show such cost increases clearly.
Similar to the prior RDT&E results, growth distributions in production are highly skewed, with arithmetic means higher than the medians. As noted elsewhere for the contract-level data, the overall magnitudes of production funding growth are not nearly as large as those for RDT&E. There also is considerable variability in the production funding growth across the MDAP portfolio.
Figure 2-22 shows quantity-adjusted procurement cumulative unit-funding growth over original MS B baseline for each year’s MDAP portfolio on a program basis (controlled for program maturity). As with last year’s results, growth has been statistically flat since at least 2001, although the median has dropped in 2014 and 2015 and now runs about 2 percent—the lowest value measured in the years 2001–2015. Figure 2-23 shows that on a dollar basis (i.e., weighted by program size in dollars), the quantity-adjusted unit-funding growth since 2009 is statistically
28This basic approach for quantity adjustment is one of the standard techniques employed by the cost analysis community—see, for example, the discussions in Hough (1992), Arena et al. (2006, pp. 5–6), and Younossi et al. (2007, pp. 13-14).
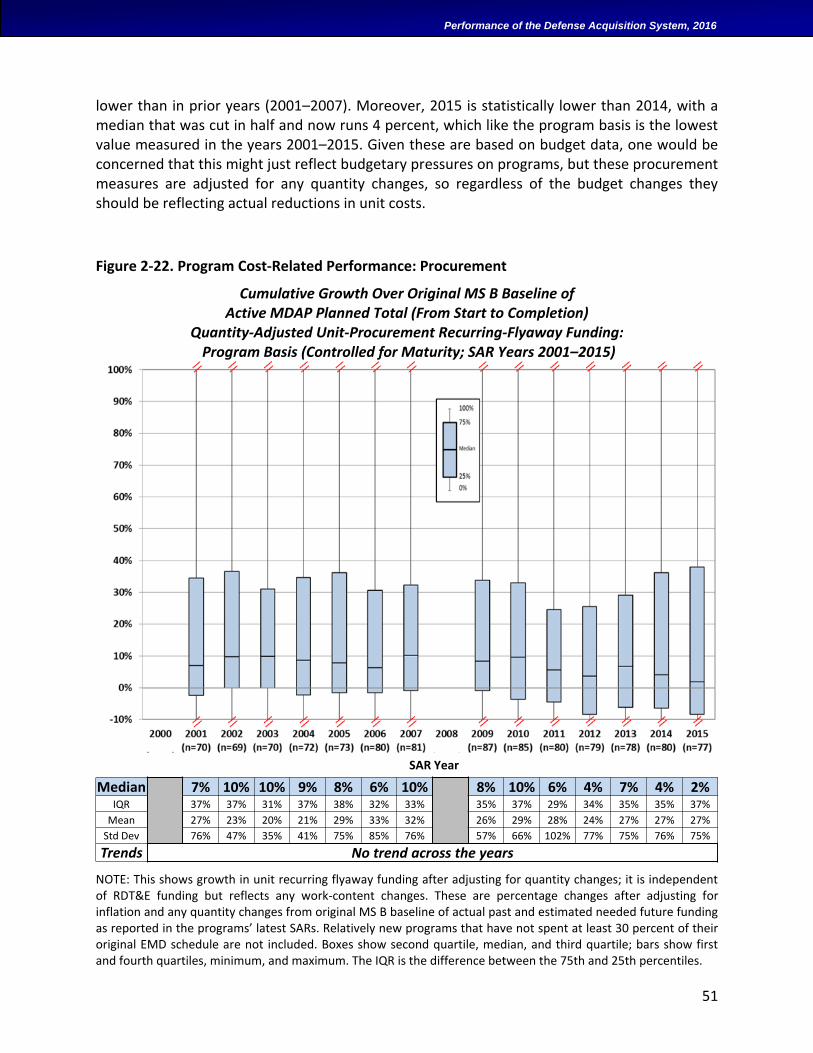
51
Performance of the Defense Acquisition System, 2016
lower than in prior years (2001–2007). Moreover, 2015 is statistically lower than 2014, with a median that was cut in half and now runs 4 percent, which like the program basis is the lowest value measured in the years 2001–2015. Given these are based on budget data, one would be concerned that this might just reflect budgetary pressures on programs, but these procurement measures are adjusted for any quantity changes, so regardless of the budget changes they should be reflecting actual reductions in unit costs.
Figure 2-22. Program Cost-Related Performance: Procurement
Cumulative Growth Over Original MS B Baseline of Active MDAP Planned Total (From Start to Completion)
Quantity-Adjusted Unit-Procurement Recurring-Flyaway Funding: Program Basis (Controlled for Maturity; SAR Years 2001–2015)
SAR Year
NOTE: This shows growth in unit recurring flyaway funding after adjusting for quantity changes; it is independent of RDT&E funding but reflects any work-content changes. These are percentage changes after adjusting for inflation and any quantity changes from original MS B baseline of actual past and estimated needed future funding as reported in the programs’ latest SARs. Relatively new programs that have not spent at least 30 percent of their original EMD schedule are not included. Boxes show second quartile, median, and third quartile; bars show first and fourth quartiles, minimum, and maximum. The IQR is the difference between the 75th and 25th percentiles.
Median 7% 10% 10% 9% 8% 6% 10% 8% 10% 6% 4% 7% 4% 2%IQR 37% 37% 31% 37% 38% 32% 33% 35% 37% 29% 34% 35% 35% 37%
Mean 27% 23% 20% 21% 29% 33% 32% 26% 29% 28% 24% 27% 27% 27%
Std Dev 76% 47% 35% 41% 75% 85% 76% 57% 66% 102% 77% 75% 76% 75%
Trends No trend across the years
52
Performance of the Defense Acquisition System, 2016
Figure 2-23. Program Cost-Related Performance: Procurement (Weighted by Program Size in Dollars)
Cumulative Growth Over Original MS B Baseline of Active MDAP Planned Total (From Start to Completion)
Quantity-Adjusted Unit-Procurement Recurring-Flyaway Funding: Dollar Basis (Controlled for Maturity; SAR Years 2001–2015)
SAR Year
NOTE: This shows growth in unit recurring flyaway funding after adjusting for quantity changes; it is independent of RDT&E funding but reflects any work-content changes. These are percentage changes after adjusting for inflation and any quantity changes from original MS B baseline of actual past and estimated needed future funding as reported in the programs’ latest SARs. Relatively new programs that have not spent at least 30 percent of their original EMD schedule are not included. Boxes show second quartile, median, and third quartile; bars show first and fourth quartiles, minimum, and maximum. The IQR is the difference between the 75th and 25th percentiles.
Median 21% 27% 25% 23% 30% 26% 27% 18% 9% 9% 9% 8% 9% 4%IQR 31% 38% 42% 45% 43% 36% 34% 28% 34% 24% 28% 25% 24% 28%
TrendAll generally lower than before 2009;
2015 is also lower than 2014
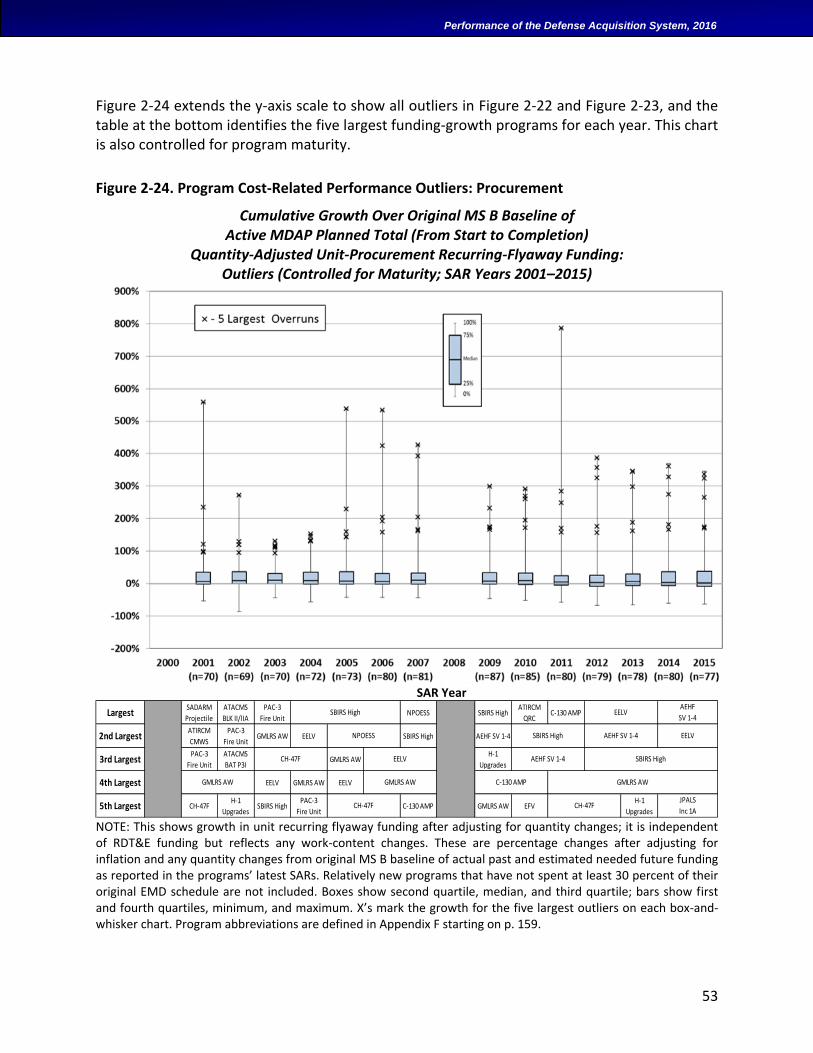
53
Performance of the Defense Acquisition System, 2016
Figure 2-24 extends the y-axis scale to show all outliers in Figure 2-22 and Figure 2-23, and the table at the bottom identifies the five largest funding-growth programs for each year. This chart is also controlled for program maturity.
Figure 2-24. Program Cost-Related Performance Outliers: Procurement
Cumulative Growth Over Original MS B Baseline of Active MDAP Planned Total (From Start to Completion)
Quantity-Adjusted Unit-Procurement Recurring-Flyaway Funding: Outliers (Controlled for Maturity; SAR Years 2001–2015)
SAR Year
NOTE: This shows growth in unit recurring flyaway funding after adjusting for quantity changes; it is independent of RDT&E funding but reflects any work-content changes. These are percentage changes after adjusting for inflation and any quantity changes from original MS B baseline of actual past and estimated needed future funding as reported in the programs’ latest SARs. Relatively new programs that have not spent at least 30 percent of their original EMD schedule are not included. Boxes show second quartile, median, and third quartile; bars show first and fourth quartiles, minimum, and maximum. X’s mark the growth for the five largest outliers on each box-and-whisker chart. Program abbreviations are defined in Appendix F starting on p. 159.
LargestSADARM
Projectile
ATACMS
BLK II/IIA
PAC-3
Fire UnitNPOESS SBIRS High
ATIRCM
QRCC-130 AMP
2nd LargestATIRCM
CMWS
PAC-3
Fire UnitGMLRS AW EELV SBIRS High AEHF SV 1-4
3rd LargestPAC-3
Fire Unit
ATACMS
BAT P3IGMLRS AW
H-1
Upgrades
4th Largest EELV GMLRS AW EELV
5th Largest CH-47FH-1
UpgradesSBIRS High
PAC-3
Fire UnitC-130 AMP GMLRS AW EFV
H-1
Upgrades
SBIRS High
GMLRS AW
JPALS
Inc 1A
AEHF SV 1-4
GMLRS AW GMLRS AW C-130 AMP
CH-47F CH-47F
SBIRS High EELV
NPOESS SBIRS High AEHF SV 1-4
CH-47F EELV
AEHF
SV 1-4
EELV
54
Performance of the Defense Acquisition System, 2016
Biennial Funding Changes: Production
Figure 2-25 shows biennial changes in total quantity-adjusted unit procurement funding (actual and planned), controlling for program maturity. The most recent biennial period of 2013–2015 and the two periods 2009–2011 and 2010–2012 are statistically lower than the years 2001–2009. Thus, the most recent period has shown an improvement. Figure 2-26 shows total quantity-adjusted unit procurement funding, but on a dollar basis. On a dollar basis, the years 2009–2015 are lower than prior years. In both bases, the median unit funding growth has been zero or less since 2009, but the variation (as measured by IQR) has improved (tightened) by half from 2014 to 2015.
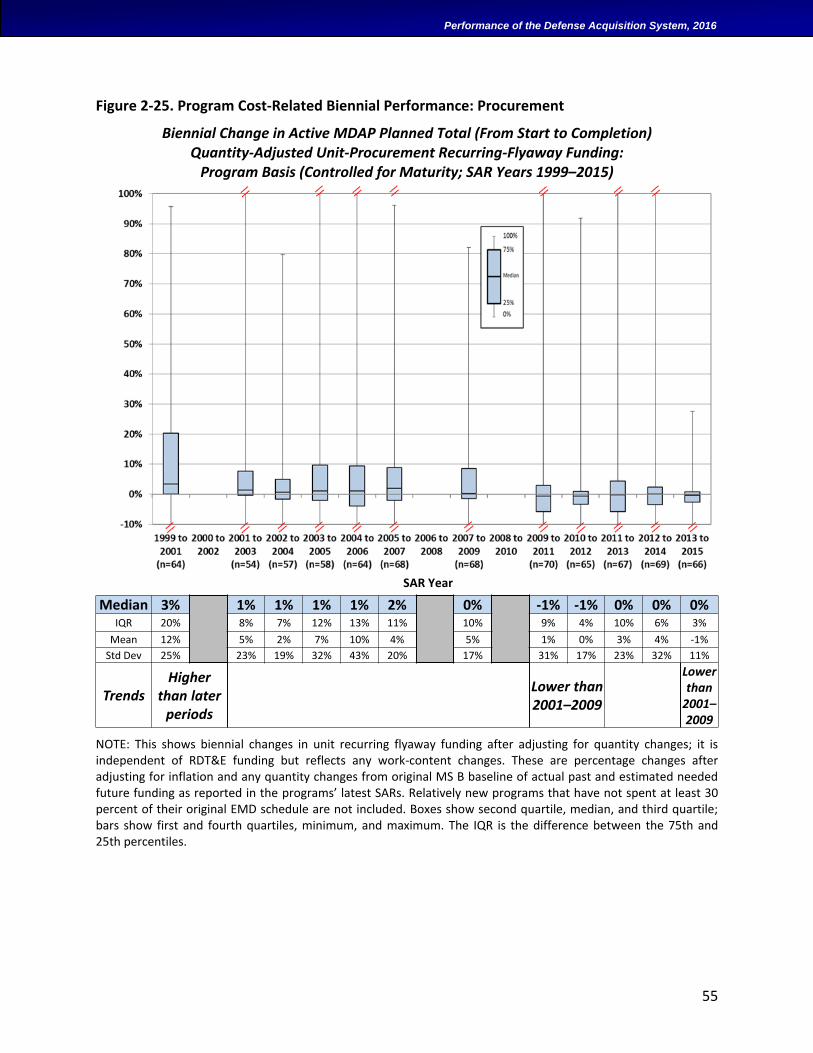
55
Performance of the Defense Acquisition System, 2016
Figure 2-25. Program Cost-Related Biennial Performance: Procurement
Biennial Change in Active MDAP Planned Total (From Start to Completion) Quantity-Adjusted Unit-Procurement Recurring-Flyaway Funding:
Program Basis (Controlled for Maturity; SAR Years 1999–2015)
SAR Year
NOTE: This shows biennial changes in unit recurring flyaway funding after adjusting for quantity changes; it is independent of RDT&E funding but reflects any work-content changes. These are percentage changes after adjusting for inflation and any quantity changes from original MS B baseline of actual past and estimated needed future funding as reported in the programs’ latest SARs. Relatively new programs that have not spent at least 30 percent of their original EMD schedule are not included. Boxes show second quartile, median, and third quartile; bars show first and fourth quartiles, minimum, and maximum. The IQR is the difference between the 75th and 25th percentiles.
Median 3% 1% 1% 1% 1% 2% 0% -1% -1% 0% 0% 0%IQR 20% 8% 7% 12% 13% 11% 10% 9% 4% 10% 6% 3%
Mean 12% 5% 2% 7% 10% 4% 5% 1% 0% 3% 4% -1%
Std Dev 25% 23% 19% 32% 43% 20% 17% 31% 17% 23% 32% 11%
TrendsHigher
than later periods
Lower than 2001–2009
Lower than
2001–2009
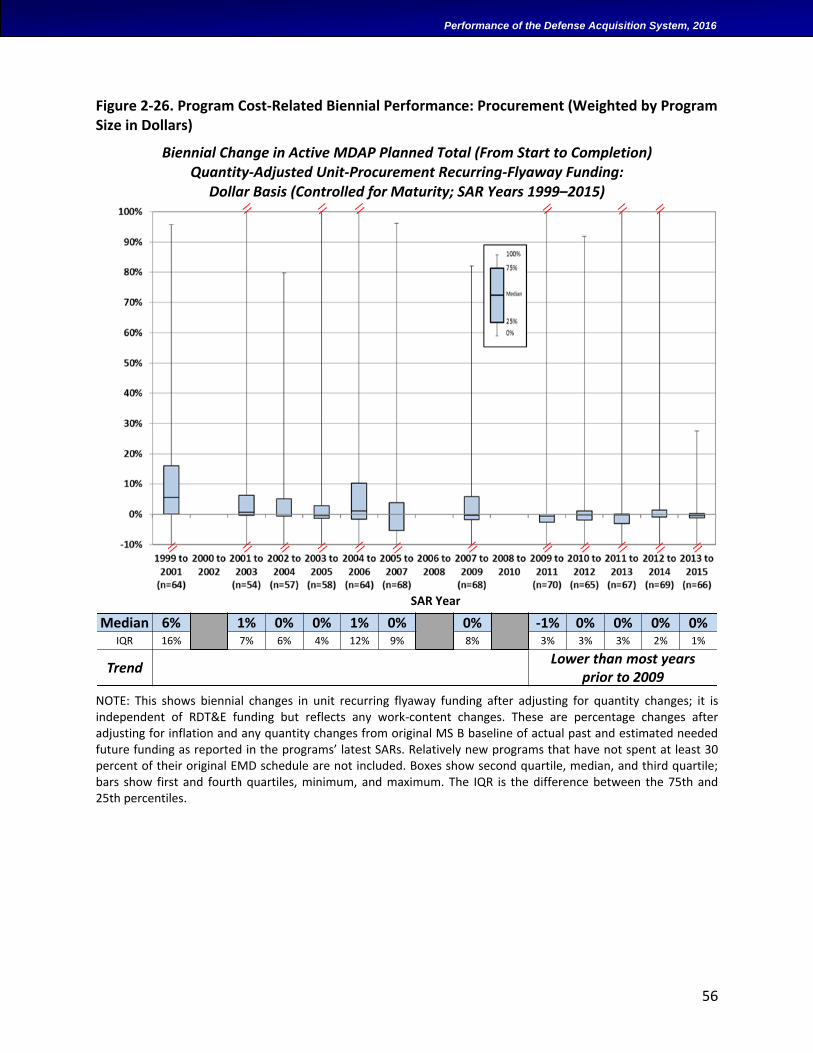
56
Performance of the Defense Acquisition System, 2016
Figure 2-26. Program Cost-Related Biennial Performance: Procurement (Weighted by Program Size in Dollars)
Biennial Change in Active MDAP Planned Total (From Start to Completion) Quantity-Adjusted Unit-Procurement Recurring-Flyaway Funding:
Dollar Basis (Controlled for Maturity; SAR Years 1999–2015)
SAR Year
NOTE: This shows biennial changes in unit recurring flyaway funding after adjusting for quantity changes; it is independent of RDT&E funding but reflects any work-content changes. These are percentage changes after adjusting for inflation and any quantity changes from original MS B baseline of actual past and estimated needed future funding as reported in the programs’ latest SARs. Relatively new programs that have not spent at least 30 percent of their original EMD schedule are not included. Boxes show second quartile, median, and third quartile; bars show first and fourth quartiles, minimum, and maximum. The IQR is the difference between the 75th and 25th percentiles.
Median 6% 1% 0% 0% 1% 0% 0% -1% 0% 0% 0% 0%IQR 16% 7% 6% 4% 12% 9% 8% 3% 3% 3% 2% 1%
TrendLower than most years
prior to 2009
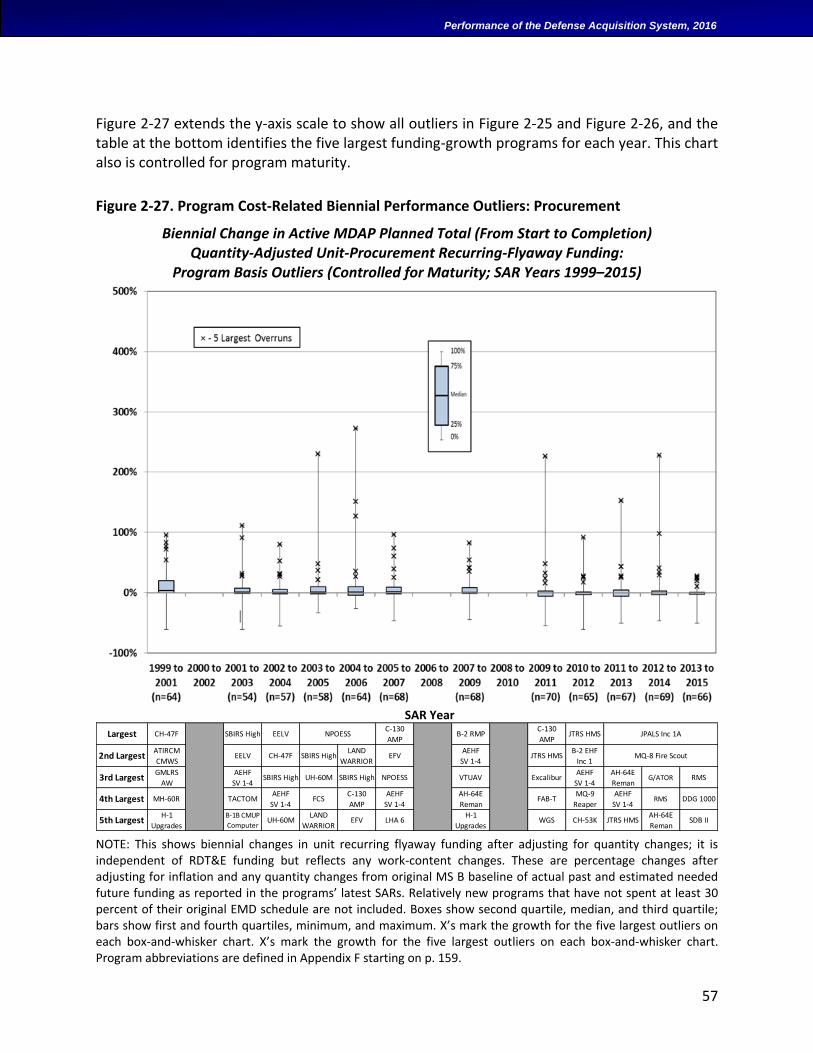
57
Performance of the Defense Acquisition System, 2016
Figure 2-27 extends the y-axis scale to show all outliers in Figure 2-25 and Figure 2-26, and the table at the bottom identifies the five largest funding-growth programs for each year. This chart also is controlled for program maturity.
Figure 2-27. Program Cost-Related Biennial Performance Outliers: Procurement
Biennial Change in Active MDAP Planned Total (From Start to Completion) Quantity-Adjusted Unit-Procurement Recurring-Flyaway Funding:
Program Basis Outliers (Controlled for Maturity; SAR Years 1999–2015)
SAR Year
NOTE: This shows biennial changes in unit recurring flyaway funding after adjusting for quantity changes; it is independent of RDT&E funding but reflects any work-content changes. These are percentage changes after adjusting for inflation and any quantity changes from original MS B baseline of actual past and estimated needed future funding as reported in the programs’ latest SARs. Relatively new programs that have not spent at least 30 percent of their original EMD schedule are not included. Boxes show second quartile, median, and third quartile; bars show first and fourth quartiles, minimum, and maximum. X’s mark the growth for the five largest outliers on each box-and-whisker chart. X’s mark the growth for the five largest outliers on each box-and-whisker chart. Program abbreviations are defined in Appendix F starting on p. 159.
Largest CH-47F SBIRS High EELVC-130
AMPB-2 RMP
C-130
AMPJTRS HMS
2nd LargestATIRCM
CMWSEELV CH-47F SBIRS High
LAND
WARRIOREFV
AEHF
SV 1-4JTRS HMS
B-2 EHF
Inc 1
3rd LargestGMLRS
AW
AEHF
SV 1-4SBIRS High UH-60M SBIRS High NPOESS VTUAV Excalibur
AEHF
SV 1-4
AH-64E
RemanG/ATOR RMS
4th Largest MH-60R TACTOMAEHF
SV 1-4FCS
C-130
AMP
AEHF
SV 1-4
AH-64E
RemanFAB-T
MQ-9
Reaper
AEHF
SV 1-4RMS DDG 1000
5th LargestH-1
Upgrades
B-1B CMUP
ComputerUH-60M
LAND
WARRIOREFV LHA 6
H-1
UpgradesWGS CH-53K JTRS HMS
AH-64E
RemanSDB II
NPOESS JPALS Inc 1A
MQ-8 Fire Scout
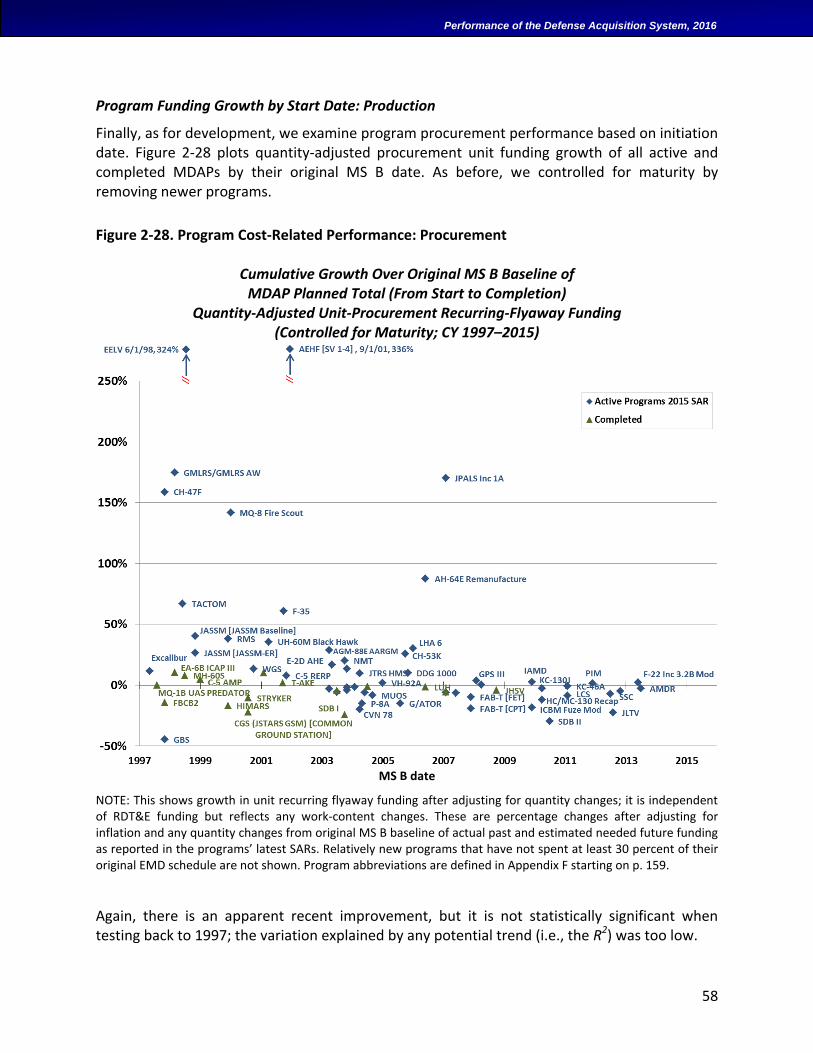
58
Performance of the Defense Acquisition System, 2016
Program Funding Growth by Start Date: Production
Finally, as for development, we examine program procurement performance based on initiation date. Figure 2-28 plots quantity-adjusted procurement unit funding growth of all active and completed MDAPs by their original MS B date. As before, we controlled for maturity by removing newer programs.
Figure 2-28. Program Cost-Related Performance: Procurement
Cumulative Growth Over Original MS B Baseline of MDAP Planned Total (From Start to Completion)
Quantity-Adjusted Unit-Procurement Recurring-Flyaway Funding (Controlled for Maturity; CY 1997–2015)
MS B date
NOTE: This shows growth in unit recurring flyaway funding after adjusting for quantity changes; it is independent of RDT&E funding but reflects any work-content changes. These are percentage changes after adjusting for inflation and any quantity changes from original MS B baseline of actual past and estimated needed future funding as reported in the programs’ latest SARs. Relatively new programs that have not spent at least 30 percent of their original EMD schedule are not shown. Program abbreviations are defined in Appendix F starting on p. 159.
Again, there is an apparent recent improvement, but it is not statistically significant when testing back to 1997; the variation explained by any potential trend (i.e., the R2) was too low.
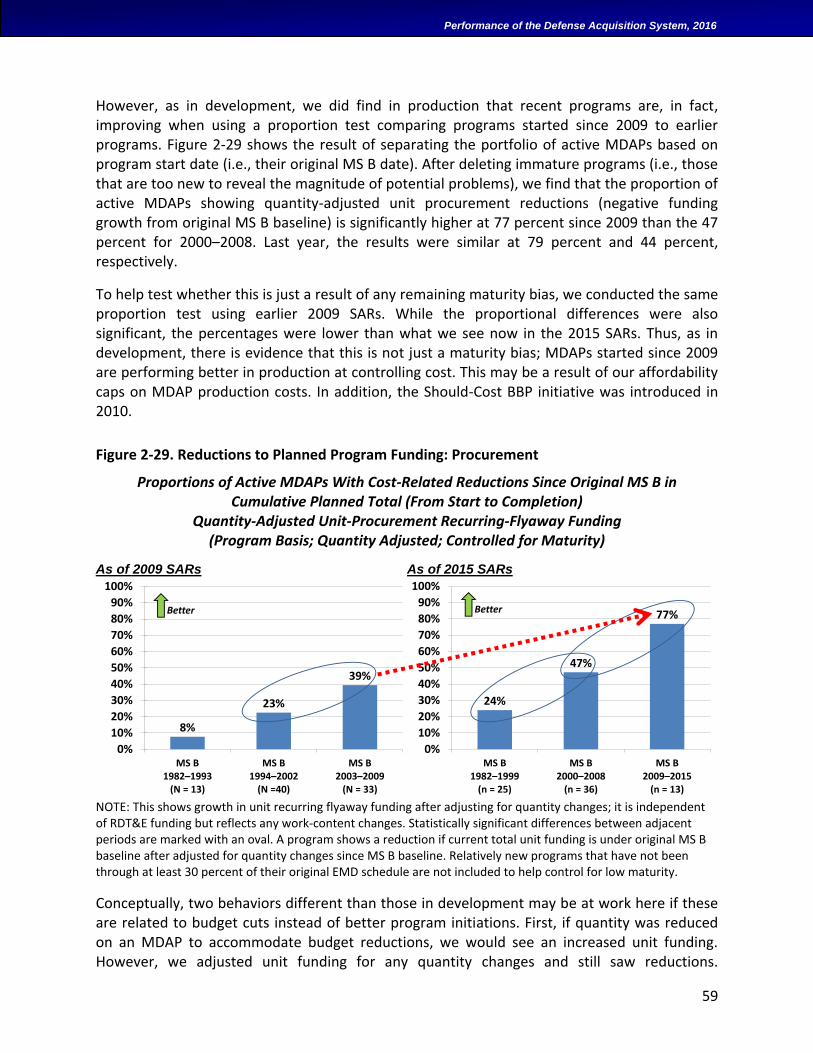
59
Performance of the Defense Acquisition System, 2016
However, as in development, we did find in production that recent programs are, in fact, improving when using a proportion test comparing programs started since 2009 to earlier programs. Figure 2-29 shows the result of separating the portfolio of active MDAPs based on program start date (i.e., their original MS B date). After deleting immature programs (i.e., those that are too new to reveal the magnitude of potential problems), we find that the proportion of active MDAPs showing quantity-adjusted unit procurement reductions (negative funding growth from original MS B baseline) is significantly higher at 77 percent since 2009 than the 47 percent for 2000–2008. Last year, the results were similar at 79 percent and 44 percent, respectively.
To help test whether this is just a result of any remaining maturity bias, we conducted the same proportion test using earlier 2009 SARs. While the proportional differences were also significant, the percentages were lower than what we see now in the 2015 SARs. Thus, as in development, there is evidence that this is not just a maturity bias; MDAPs started since 2009 are performing better in production at controlling cost. This may be a result of our affordability caps on MDAP production costs. In addition, the Should-Cost BBP initiative was introduced in 2010.
Figure 2-29. Reductions to Planned Program Funding: Procurement
Proportions of Active MDAPs With Cost-Related Reductions Since Original MS B in Cumulative Planned Total (From Start to Completion)
Quantity-Adjusted Unit-Procurement Recurring-Flyaway Funding (Program Basis; Quantity Adjusted; Controlled for Maturity)
As of 2009 SARs As of 2015 SARs
NOTE: This shows growth in unit recurring flyaway funding after adjusting for quantity changes; it is independent of RDT&E funding but reflects any work-content changes. Statistically significant differences between adjacent periods are marked with an oval. A program shows a reduction if current total unit funding is under original MS B baseline after adjusted for quantity changes since MS B baseline. Relatively new programs that have not been through at least 30 percent of their original EMD schedule are not included to help control for low maturity.
Conceptually, two behaviors different than those in development may be at work here if these are related to budget cuts instead of better program initiations. First, if quantity was reduced on an MDAP to accommodate budget reductions, we would see an increased unit funding. However, we adjusted unit funding for any quantity changes and still saw reductions.
8%
23%
39%
0%
10%
20%
30%
40%
50%
60%
70%
80%
90%
100%
MS B1982–1993
(N = 13)
MS B1994–2002
(N =40)
MS B2003–2009
(N = 33)
Better
24%
47%
77%
0%
10%
20%
30%
40%
50%
60%
70%
80%
90%
100%
MS B1982–1999
(n = 25)
MS B2000–2008
(n = 36)
MS B2009–2015
(n = 13)
Better
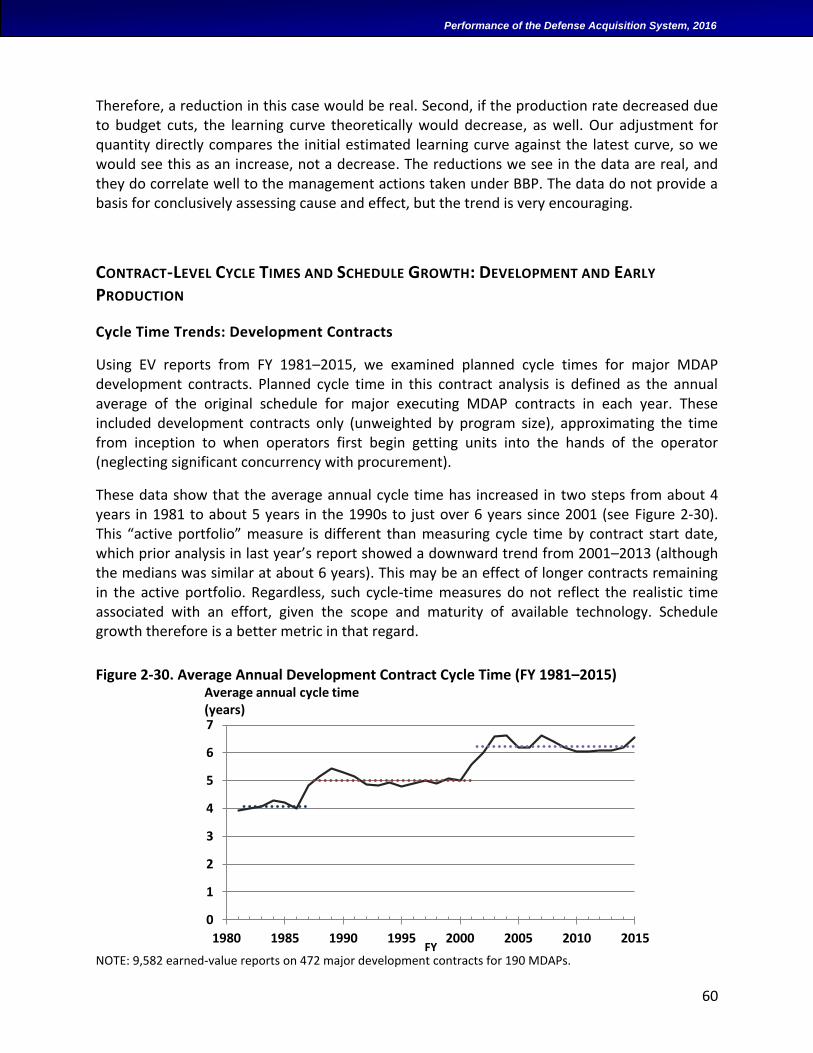
60
Performance of the Defense Acquisition System, 2016
Therefore, a reduction in this case would be real. Second, if the production rate decreased due to budget cuts, the learning curve theoretically would decrease, as well. Our adjustment for quantity directly compares the initial estimated learning curve against the latest curve, so we would see this as an increase, not a decrease. The reductions we see in the data are real, and they do correlate well to the management actions taken under BBP. The data do not provide a basis for conclusively assessing cause and effect, but the trend is very encouraging.
CONTRACT-LEVEL CYCLE TIMES AND SCHEDULE GROWTH: DEVELOPMENT AND EARLY
PRODUCTION
Cycle Time Trends: Development Contracts
Using EV reports from FY 1981–2015, we examined planned cycle times for major MDAP development contracts. Planned cycle time in this contract analysis is defined as the annual average of the original schedule for major executing MDAP contracts in each year. These included development contracts only (unweighted by program size), approximating the time from inception to when operators first begin getting units into the hands of the operator (neglecting significant concurrency with procurement).
These data show that the average annual cycle time has increased in two steps from about 4 years in 1981 to about 5 years in the 1990s to just over 6 years since 2001 (see Figure 2-30). This “active portfolio” measure is different than measuring cycle time by contract start date, which prior analysis in last year’s report showed a downward trend from 2001–2013 (although the medians was similar at about 6 years). This may be an effect of longer contracts remaining in the active portfolio. Regardless, such cycle-time measures do not reflect the realistic time associated with an effort, given the scope and maturity of available technology. Schedule growth therefore is a better metric in that regard.
Figure 2-30. Average Annual Development Contract Cycle Time (FY 1981–2015)
NOTE: 9,582 earned-value reports on 472 major development contracts for 190 MDAPs.
0
1
2
3
4
5
6
7
1980 1985 1990 1995 2000 2005 2010 2015FY
Average annual cycle time(years)
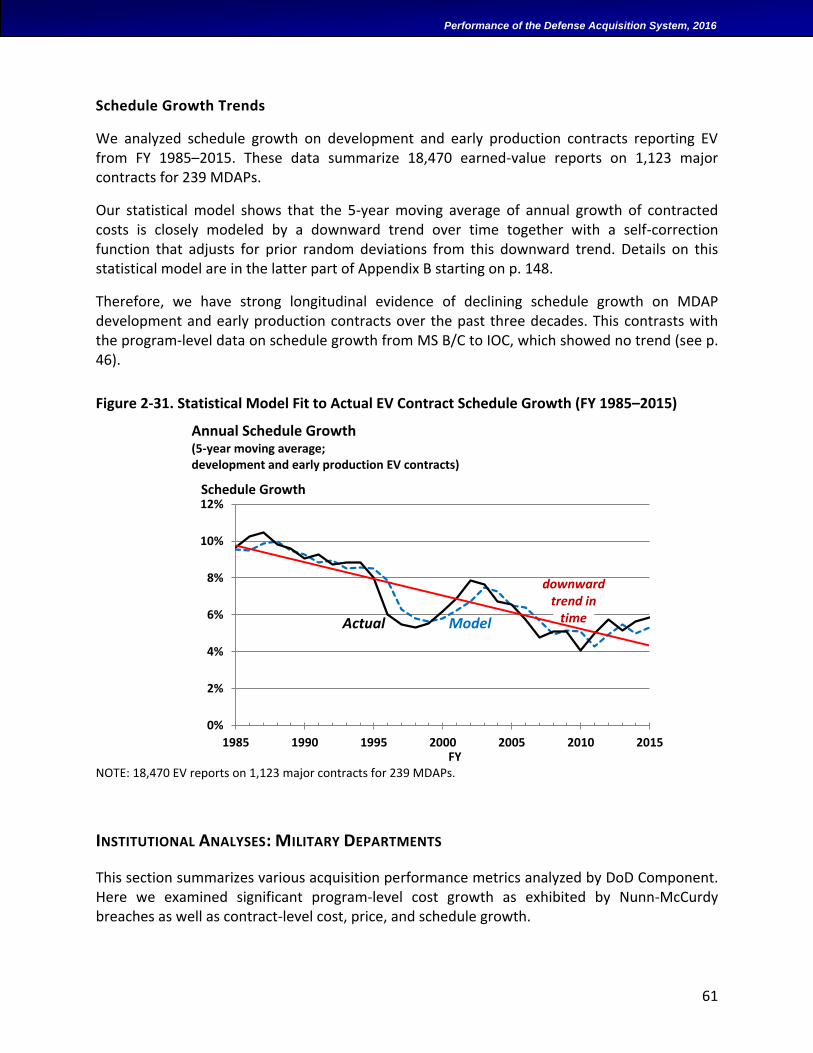
61
Performance of the Defense Acquisition System, 2016
Schedule Growth Trends
We analyzed schedule growth on development and early production contracts reporting EV from FY 1985–2015. These data summarize 18,470 earned-value reports on 1,123 major contracts for 239 MDAPs.
Our statistical model shows that the 5-year moving average of annual growth of contracted costs is closely modeled by a downward trend over time together with a self-correction function that adjusts for prior random deviations from this downward trend. Details on this statistical model are in the latter part of Appendix B starting on p. 148.
Therefore, we have strong longitudinal evidence of declining schedule growth on MDAP development and early production contracts over the past three decades. This contrasts with the program-level data on schedule growth from MS B/C to IOC, which showed no trend (see p. 46).
Figure 2-31. Statistical Model Fit to Actual EV Contract Schedule Growth (FY 1985–2015)
Annual Schedule Growth (5-year moving average; development and early production EV contracts)
FY
NOTE: 18,470 EV reports on 1,123 major contracts for 239 MDAPs.
INSTITUTIONAL ANALYSES: MILITARY DEPARTMENTS
This section summarizes various acquisition performance metrics analyzed by DoD Component. Here we examined significant program-level cost growth as exhibited by Nunn-McCurdy breaches as well as contract-level cost, price, and schedule growth.
0%
2%
4%
6%
8%
10%
12%
1985 1990 1995 2000 2005 2010 2015
Actual Model
Schedule Growth
downwardtrend in
time
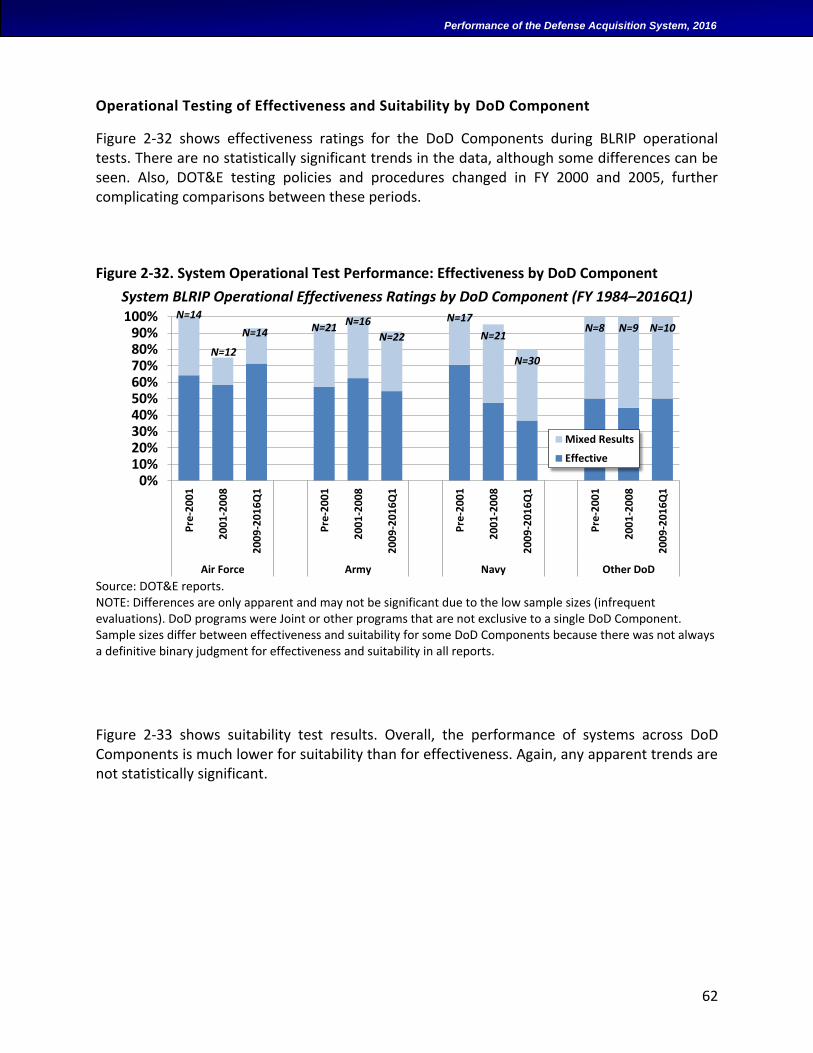
62
Performance of the Defense Acquisition System, 2016
Operational Testing of Effectiveness and Suitability by DoD Component
Figure 2-32 shows effectiveness ratings for the DoD Components during BLRIP operational tests. There are no statistically significant trends in the data, although some differences can be seen. Also, DOT&E testing policies and procedures changed in FY 2000 and 2005, further complicating comparisons between these periods.
Figure 2-32. System Operational Test Performance: Effectiveness by DoD Component
System BLRIP Operational Effectiveness Ratings by DoD Component (FY 1984–2016Q1)
Source: DOT&E reports. NOTE: Differences are only apparent and may not be significant due to the low sample sizes (infrequent evaluations). DoD programs were Joint or other programs that are not exclusive to a single DoD Component. Sample sizes differ between effectiveness and suitability for some DoD Components because there was not always a definitive binary judgment for effectiveness and suitability in all reports.
Figure 2-33 shows suitability test results. Overall, the performance of systems across DoD Components is much lower for suitability than for effectiveness. Again, any apparent trends are not statistically significant.
N=14
N=12
N=14 N=21N=16
N=22
N=17
N=21
N=30
N=8 N=9 N=10
0%10%20%30%40%50%60%70%80%90%
100%
Pre
-20
01
20
01
-20
08
20
09
-20
16
Q1
Pre
-20
01
20
01
-20
08
20
09
-20
16
Q1
Pre
-20
01
20
01
-20
08
20
09
-20
16
Q1
Pre
-20
01
20
01
-20
08
20
09
-20
16
Q1
Air Force Army Navy Other DoD
Mixed Results
Effective
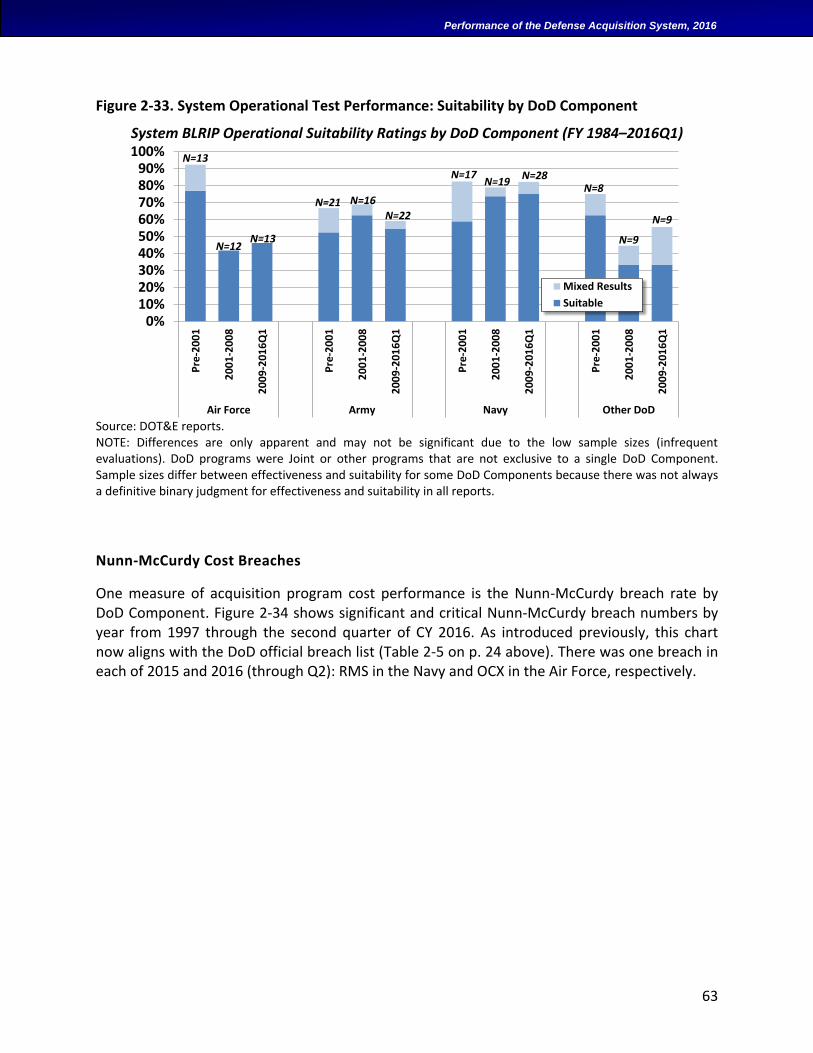
63
Performance of the Defense Acquisition System, 2016
Figure 2-33. System Operational Test Performance: Suitability by DoD Component
System BLRIP Operational Suitability Ratings by DoD Component (FY 1984–2016Q1)
Source: DOT&E reports. NOTE: Differences are only apparent and may not be significant due to the low sample sizes (infrequent evaluations). DoD programs were Joint or other programs that are not exclusive to a single DoD Component. Sample sizes differ between effectiveness and suitability for some DoD Components because there was not always a definitive binary judgment for effectiveness and suitability in all reports.
Nunn-McCurdy Cost Breaches
One measure of acquisition program cost performance is the Nunn-McCurdy breach rate by DoD Component. Figure 2-34 shows significant and critical Nunn-McCurdy breach numbers by year from 1997 through the second quarter of CY 2016. As introduced previously, this chart now aligns with the DoD official breach list (Table 2-5 on p. 24 above). There was one breach in each of 2015 and 2016 (through Q2): RMS in the Navy and OCX in the Air Force, respectively.
N=13
N=12N=13
N=21 N=16
N=22
N=17N=19
N=28N=8
N=9
N=9
0%10%20%30%40%50%60%70%80%90%
100%
Pre
-20
01
20
01
-20
08
20
09
-20
16
Q1
Pre
-20
01
20
01
-20
08
20
09
-20
16
Q1
Pre
-20
01
20
01
-20
08
20
09
-20
16
Q1
Pre
-20
01
20
01
-20
08
20
09
-20
16
Q1
Air Force Army Navy Other DoD
Mixed Results
Suitable
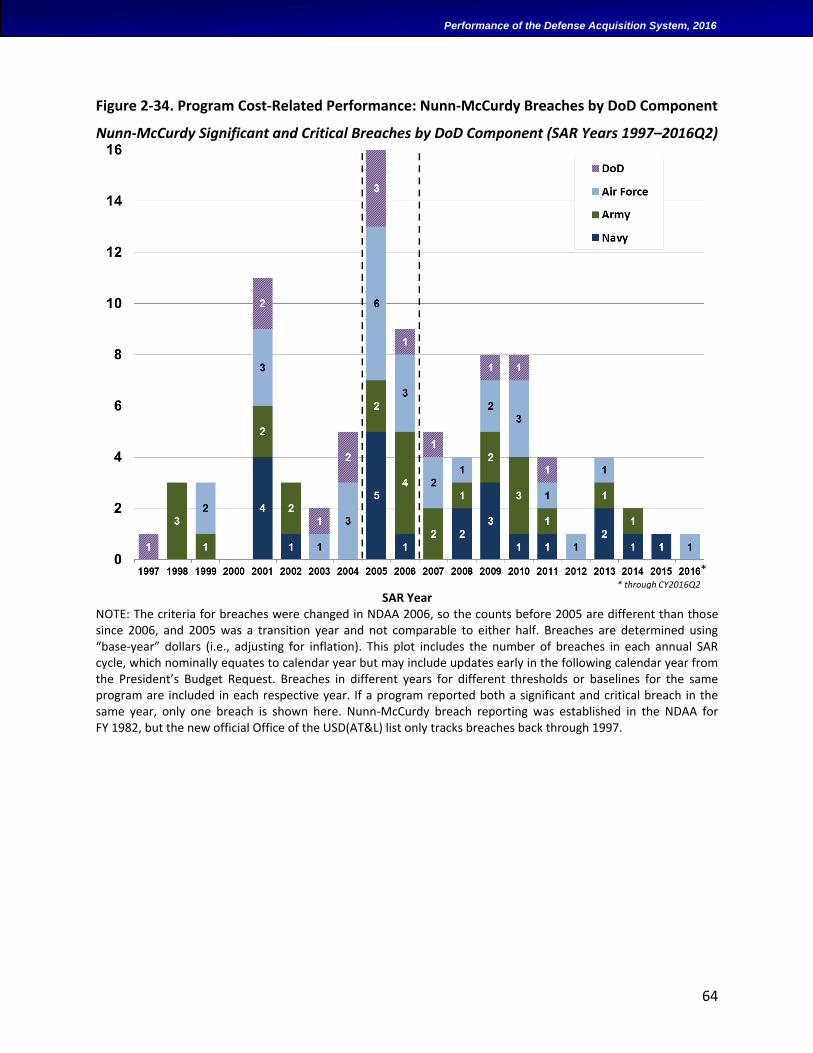
64
Performance of the Defense Acquisition System, 2016
Figure 2-34. Program Cost-Related Performance: Nunn-McCurdy Breaches by DoD Component
Nunn-McCurdy Significant and Critical Breaches by DoD Component (SAR Years 1997–2016Q2)
SAR Year
NOTE: The criteria for breaches were changed in NDAA 2006, so the counts before 2005 are different than those since 2006, and 2005 was a transition year and not comparable to either half. Breaches are determined using “base-year” dollars (i.e., adjusting for inflation). This plot includes the number of breaches in each annual SAR cycle, which nominally equates to calendar year but may include updates early in the following calendar year from the President’s Budget Request. Breaches in different years for different thresholds or baselines for the same program are included in each respective year. If a program reported both a significant and critical breach in the same year, only one breach is shown here. Nunn-McCurdy breach reporting was established in the NDAA for FY 1982, but the new official Office of the USD(AT&L) list only tracks breaches back through 1997.
** through CY2016Q2
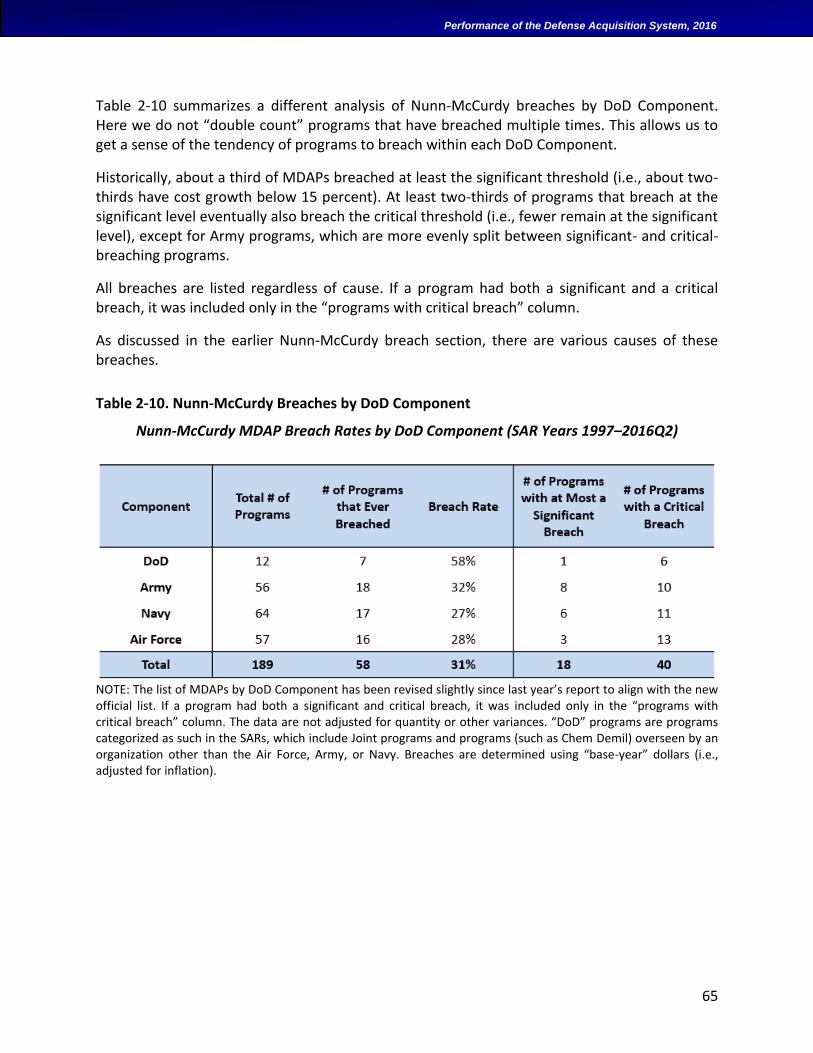
65
Performance of the Defense Acquisition System, 2016
Table 2-10 summarizes a different analysis of Nunn-McCurdy breaches by DoD Component. Here we do not “double count” programs that have breached multiple times. This allows us to get a sense of the tendency of programs to breach within each DoD Component.
Historically, about a third of MDAPs breached at least the significant threshold (i.e., about two-thirds have cost growth below 15 percent). At least two-thirds of programs that breach at the significant level eventually also breach the critical threshold (i.e., fewer remain at the significant level), except for Army programs, which are more evenly split between significant- and critical-breaching programs.
All breaches are listed regardless of cause. If a program had both a significant and a critical breach, it was included only in the “programs with critical breach” column.
As discussed in the earlier Nunn-McCurdy breach section, there are various causes of these breaches.
Table 2-10. Nunn-McCurdy Breaches by DoD Component
Nunn-McCurdy MDAP Breach Rates by DoD Component (SAR Years 1997–2016Q2)
NOTE: The list of MDAPs by DoD Component has been revised slightly since last year’s report to align with the new official list. If a program had both a significant and critical breach, it was included only in the “programs with critical breach” column. The data are not adjusted for quantity or other variances. “DoD” programs are programs categorized as such in the SARs, which include Joint programs and programs (such as Chem Demil) overseen by an organization other than the Air Force, Army, or Navy. Breaches are determined using “base-year” dollars (i.e., adjusted for inflation).
66
Performance of the Defense Acquisition System, 2016
Program Cost Growth and New Statutory Penalties
Section 828 of the FY 2016 NDAA (Pub. L. 114–92) enacted a new cost-growth calculation and associated penalty for each of the military departments. For each year beginning with FY 2015, the Secretary of each military department shall pay a penalty for cost overruns on the covered MDAPs of the military department. Programs and subprograms included are those with an original APB dated on or after May 22, 2009 (which is the enactment date of the WSARA of 2009). This includes, for example, the F-35 program because it received a revised original baseline due to its Nunn-McCurdy breach after the passage of WSARA.
The “overrun” is defined as the difference between the Current Estimate PAUC minus the Original Baseline Estimate PAUC, all multiplied by the current quantity to be purchased. Overruns are summed across all applicable programs and subprograms for each military department. If the cumulative overrun is positive, then the military department is penalized 3 percent of the total overrun calculated that FY. Thus, if overruns continue in future fiscal years, then there will be a 3-percent penalty each FY. Since these results are dollar weighted, large programs (by dollar) have a larger effect than smaller programs.
Table 2-11 shows the result of applying this algorithm to the December SARs from FY 2015. In FY 2015, the departments of the Air Force, Army, and Navy showed net negative overruns (i.e., underruns) of −$24.4 billion, −$0.5 billion, and −$2.8 billion. Large underruns for EELV, F-35 aircraft, and KC-46A dominated the Air Force result. The large overrun from the AH-64E Remanufacture was mostly negated by the large underruns by the Integrated Air and Missile Defense (IAMD) and MQ-1C Gray Eagle for the Army. The large underrun from the F-35 aircraft program was the dominant correction for the large overrun on E-2D AHE for the Navy.
Table 2-12 shows that, in FY 2016, all three departments improved, with lower negative overruns (i.e., underruns) of −$29.5 billion, −$3.8 billion, and −$3.9 billion. Again, large underruns for the EELV, F-35 aircraft, and KC-46A (with other underruns, including a now-underrunning F-35 engine subprogram) dominated the Air Force result. For the Army, JLTV joined IAMD and MQ-1C Gray Eagle in negating the overrun from the AH-64E Remanufacture. The change in JLTV from FY 2015 to 2016 is the result of further cost savings because of the competition for production. The large (and improving) underruns from F-35 aircraft and engine subprograms were the dominant corrections for the large overrun on E-2D AHE for the Navy.
There was no net overrun for any of the military departments in either year and therefore no military department incurred penalties. Thus, all three military departments showed net improvements across their portfolios of programs with original baselines since 2009. This result aligns with our other analysis, indicating that cost growth has improved recently, and it is the programs that started before 2009 that have higher cost growth.
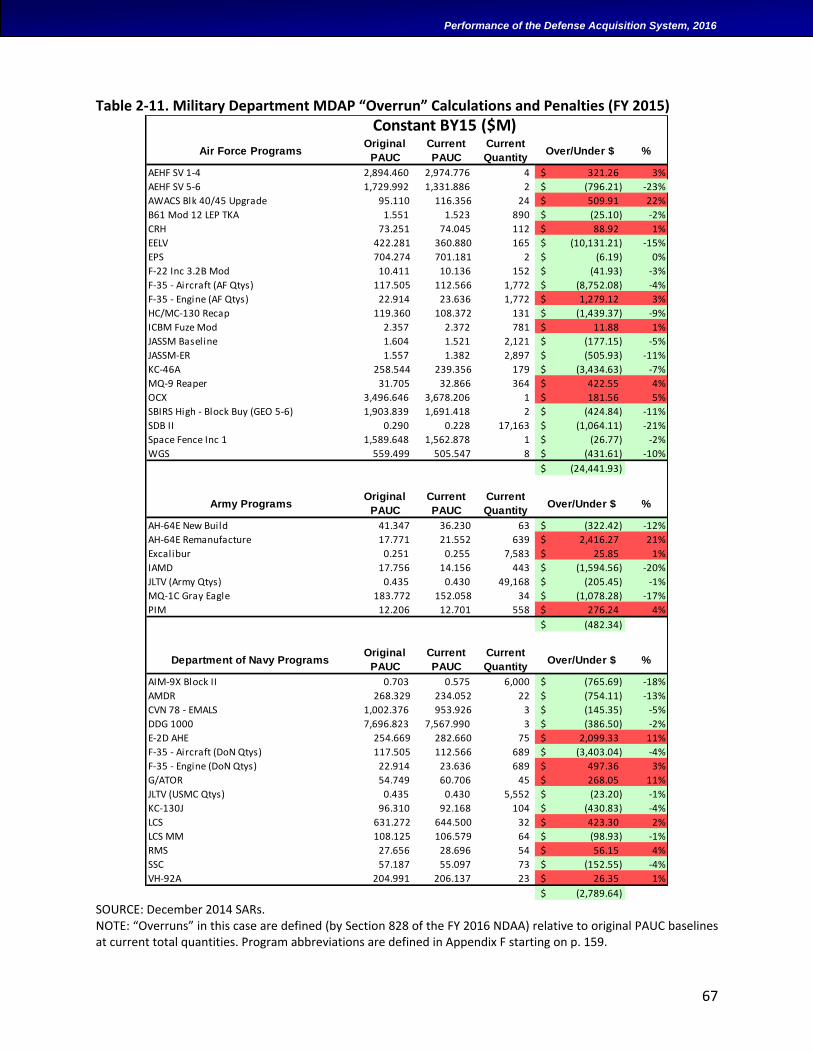
67
Performance of the Defense Acquisition System, 2016
Table 2-11. Military Department MDAP “Overrun” Calculations and Penalties (FY 2015)
SOURCE: December 2014 SARs. NOTE: “Overruns” in this case are defined (by Section 828 of the FY 2016 NDAA) relative to original PAUC baselines at current total quantities. Program abbreviations are defined in Appendix F starting on p. 159.
Air Force ProgramsOriginal
PAUC
Current
PAUC
Current
QuantityOver/Under $ %
AEHF SV 1-4 2,894.460 2,974.776 4 321.26$ 3%
AEHF SV 5-6 1,729.992 1,331.886 2 (796.21)$ -23%
AWACS Blk 40/45 Upgrade 95.110 116.356 24 509.91$ 22%
B61 Mod 12 LEP TKA 1.551 1.523 890 (25.10)$ -2%
CRH 73.251 74.045 112 88.92$ 1%
EELV 422.281 360.880 165 (10,131.21)$ -15%
EPS 704.274 701.181 2 (6.19)$ 0%
F-22 Inc 3.2B Mod 10.411 10.136 152 (41.93)$ -3%
F-35 - Aircraft (AF Qtys) 117.505 112.566 1,772 (8,752.08)$ -4%
F-35 - Engine (AF Qtys) 22.914 23.636 1,772 1,279.12$ 3%
HC/MC-130 Recap 119.360 108.372 131 (1,439.37)$ -9%
ICBM Fuze Mod 2.357 2.372 781 11.88$ 1%
JASSM Baseline 1.604 1.521 2,121 (177.15)$ -5%
JASSM-ER 1.557 1.382 2,897 (505.93)$ -11%
KC-46A 258.544 239.356 179 (3,434.63)$ -7%
MQ-9 Reaper 31.705 32.866 364 422.55$ 4%
OCX 3,496.646 3,678.206 1 181.56$ 5%
SBIRS High - Block Buy (GEO 5-6) 1,903.839 1,691.418 2 (424.84)$ -11%
SDB II 0.290 0.228 17,163 (1,064.11)$ -21%
Space Fence Inc 1 1,589.648 1,562.878 1 (26.77)$ -2%
WGS 559.499 505.547 8 (431.61)$ -10%
(24,441.93)$
Army ProgramsOriginal
PAUC
Current
PAUC
Current
Quantity Over/Under $ %
AH-64E New Build 41.347 36.230 63 (322.42)$ -12%
AH-64E Remanufacture 17.771 21.552 639 2,416.27$ 21%
Excalibur 0.251 0.255 7,583 25.85$ 1%
IAMD 17.756 14.156 443 (1,594.56)$ -20%
JLTV (Army Qtys) 0.435 0.430 49,168 (205.45)$ -1%
MQ-1C Gray Eagle 183.772 152.058 34 (1,078.28)$ -17%
PIM 12.206 12.701 558 276.24$ 4%
(482.34)$
Department of Navy ProgramsOriginal
PAUC
Current
PAUC
Current
Quantity Over/Under $ %
AIM-9X Block II 0.703 0.575 6,000 (765.69)$ -18%
AMDR 268.329 234.052 22 (754.11)$ -13%
CVN 78 - EMALS 1,002.376 953.926 3 (145.35)$ -5%
DDG 1000 7,696.823 7,567.990 3 (386.50)$ -2%
E-2D AHE 254.669 282.660 75 2,099.33$ 11%
F-35 - Aircraft (DoN Qtys) 117.505 112.566 689 (3,403.04)$ -4%
F-35 - Engine (DoN Qtys) 22.914 23.636 689 497.36$ 3%
G/ATOR 54.749 60.706 45 268.05$ 11%
JLTV (USMC Qtys) 0.435 0.430 5,552 (23.20)$ -1%
KC-130J 96.310 92.168 104 (430.83)$ -4%
LCS 631.272 644.500 32 423.30$ 2%
LCS MM 108.125 106.579 64 (98.93)$ -1%
RMS 27.656 28.696 54 56.15$ 4%
SSC 57.187 55.097 73 (152.55)$ -4%
VH-92A 204.991 206.137 23 26.35$ 1%
(2,789.64)$
Constant BY15 ($M)
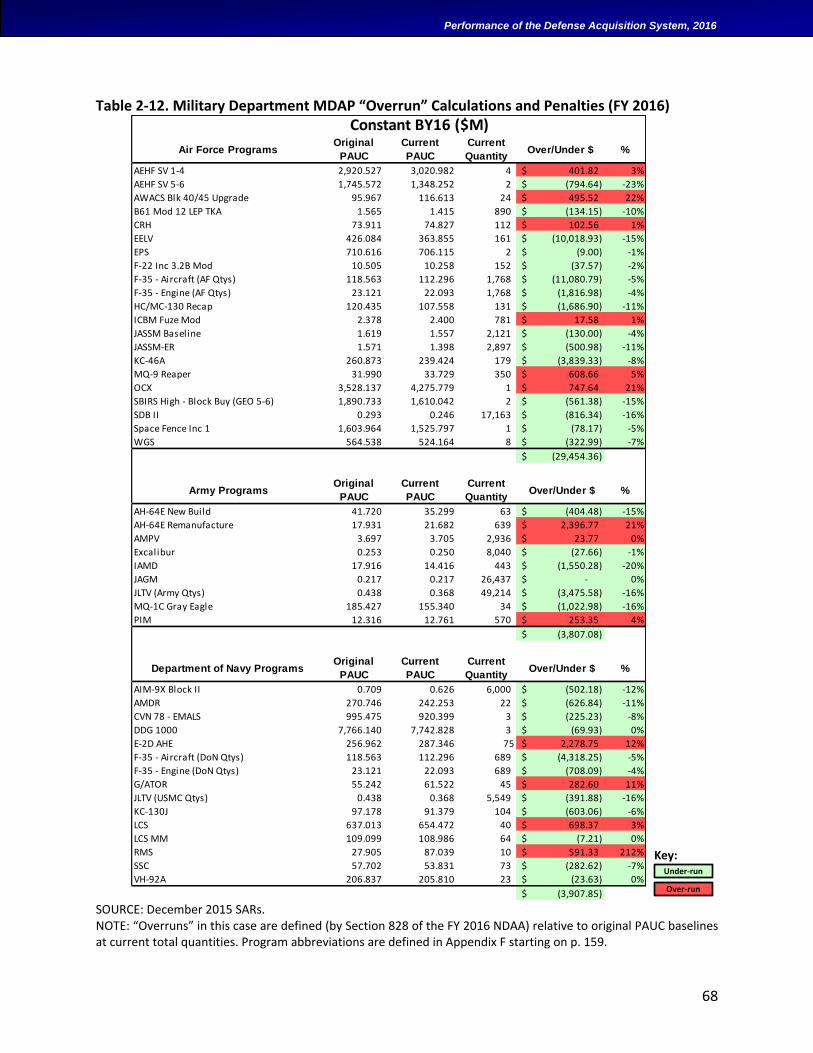
68
Performance of the Defense Acquisition System, 2016
Table 2-12. Military Department MDAP “Overrun” Calculations and Penalties (FY 2016)
SOURCE: December 2015 SARs. NOTE: “Overruns” in this case are defined (by Section 828 of the FY 2016 NDAA) relative to original PAUC baselines at current total quantities. Program abbreviations are defined in Appendix F starting on p. 159.
Air Force ProgramsOriginal
PAUC
Current
PAUC
Current
QuantityOver/Under $ %
AEHF SV 1-4 2,920.527 3,020.982 4 401.82$ 3%
AEHF SV 5-6 1,745.572 1,348.252 2 (794.64)$ -23%
AWACS Blk 40/45 Upgrade 95.967 116.613 24 495.52$ 22%
B61 Mod 12 LEP TKA 1.565 1.415 890 (134.15)$ -10%
CRH 73.911 74.827 112 102.56$ 1%
EELV 426.084 363.855 161 (10,018.93)$ -15%
EPS 710.616 706.115 2 (9.00)$ -1%
F-22 Inc 3.2B Mod 10.505 10.258 152 (37.57)$ -2%
F-35 - Aircraft (AF Qtys) 118.563 112.296 1,768 (11,080.79)$ -5%
F-35 - Engine (AF Qtys) 23.121 22.093 1,768 (1,816.98)$ -4%
HC/MC-130 Recap 120.435 107.558 131 (1,686.90)$ -11%
ICBM Fuze Mod 2.378 2.400 781 17.58$ 1%
JASSM Baseline 1.619 1.557 2,121 (130.00)$ -4%
JASSM-ER 1.571 1.398 2,897 (500.98)$ -11%
KC-46A 260.873 239.424 179 (3,839.33)$ -8%
MQ-9 Reaper 31.990 33.729 350 608.66$ 5%
OCX 3,528.137 4,275.779 1 747.64$ 21%
SBIRS High - Block Buy (GEO 5-6) 1,890.733 1,610.042 2 (561.38)$ -15%
SDB II 0.293 0.246 17,163 (816.34)$ -16%
Space Fence Inc 1 1,603.964 1,525.797 1 (78.17)$ -5%
WGS 564.538 524.164 8 (322.99)$ -7%
(29,454.36)$
Army ProgramsOriginal
PAUC
Current
PAUC
Current
Quantity Over/Under $ %
AH-64E New Build 41.720 35.299 63 (404.48)$ -15%
AH-64E Remanufacture 17.931 21.682 639 2,396.77$ 21%
AMPV 3.697 3.705 2,936 23.77$ 0%
Excalibur 0.253 0.250 8,040 (27.66)$ -1%
IAMD 17.916 14.416 443 (1,550.28)$ -20%
JAGM 0.217 0.217 26,437 -$ 0%
JLTV (Army Qtys) 0.438 0.368 49,214 (3,475.58)$ -16%
MQ-1C Gray Eagle 185.427 155.340 34 (1,022.98)$ -16%
PIM 12.316 12.761 570 253.35$ 4%
(3,807.08)$
Department of Navy ProgramsOriginal
PAUC
Current
PAUC
Current
Quantity Over/Under $ %
AIM-9X Block II 0.709 0.626 6,000 (502.18)$ -12%
AMDR 270.746 242.253 22 (626.84)$ -11%
CVN 78 - EMALS 995.475 920.399 3 (225.23)$ -8%
DDG 1000 7,766.140 7,742.828 3 (69.93)$ 0%
E-2D AHE 256.962 287.346 75 2,278.75$ 12%
F-35 - Aircraft (DoN Qtys) 118.563 112.296 689 (4,318.25)$ -5%
F-35 - Engine (DoN Qtys) 23.121 22.093 689 (708.09)$ -4%
G/ATOR 55.242 61.522 45 282.60$ 11%
JLTV (USMC Qtys) 0.438 0.368 5,549 (391.88)$ -16%
KC-130J 97.178 91.379 104 (603.06)$ -6%
LCS 637.013 654.472 40 698.37$ 3%
LCS MM 109.099 108.986 64 (7.21)$ 0%
RMS 27.905 87.039 10 591.33$ 212%
SSC 57.702 53.831 73 (282.62)$ -7%
VH-92A 206.837 205.810 23 (23.63)$ 0%
(3,907.85)$
Constant BY16 ($M)
Key:Under-run
Over-run
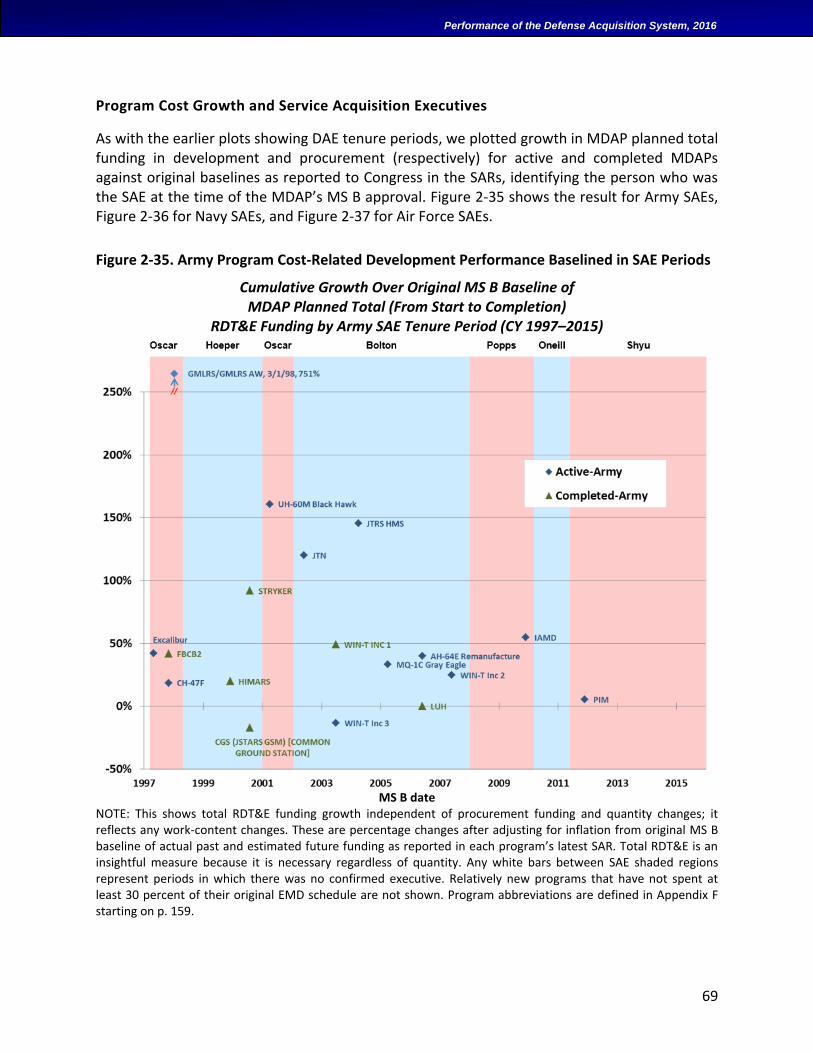
69
Performance of the Defense Acquisition System, 2016
Program Cost Growth and Service Acquisition Executives
As with the earlier plots showing DAE tenure periods, we plotted growth in MDAP planned total funding in development and procurement (respectively) for active and completed MDAPs against original baselines as reported to Congress in the SARs, identifying the person who was the SAE at the time of the MDAP’s MS B approval. Figure 2-35 shows the result for Army SAEs, Figure 2-36 for Navy SAEs, and Figure 2-37 for Air Force SAEs.
Figure 2-35. Army Program Cost-Related Development Performance Baselined in SAE Periods
Cumulative Growth Over Original MS B Baseline of MDAP Planned Total (From Start to Completion)
RDT&E Funding by Army SAE Tenure Period (CY 1997–2015)
MS B date
NOTE: This shows total RDT&E funding growth independent of procurement funding and quantity changes; it reflects any work-content changes. These are percentage changes after adjusting for inflation from original MS B baseline of actual past and estimated future funding as reported in each program’s latest SAR. Total RDT&E is an insightful measure because it is necessary regardless of quantity. Any white bars between SAE shaded regions represent periods in which there was no confirmed executive. Relatively new programs that have not spent at least 30 percent of their original EMD schedule are not shown. Program abbreviations are defined in Appendix F starting on p. 159.
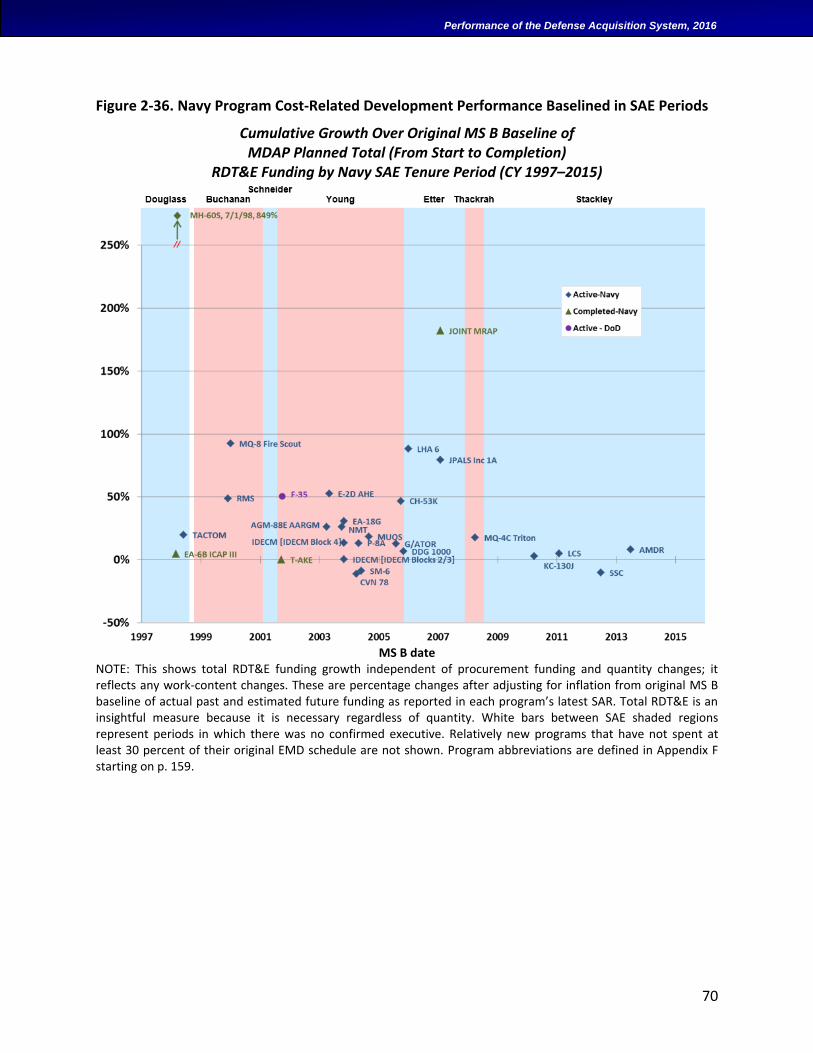
70
Performance of the Defense Acquisition System, 2016
Figure 2-36. Navy Program Cost-Related Development Performance Baselined in SAE Periods
Cumulative Growth Over Original MS B Baseline of MDAP Planned Total (From Start to Completion)
RDT&E Funding by Navy SAE Tenure Period (CY 1997–2015)
MS B date
NOTE: This shows total RDT&E funding growth independent of procurement funding and quantity changes; it reflects any work-content changes. These are percentage changes after adjusting for inflation from original MS B baseline of actual past and estimated future funding as reported in each program’s latest SAR. Total RDT&E is an insightful measure because it is necessary regardless of quantity. White bars between SAE shaded regions represent periods in which there was no confirmed executive. Relatively new programs that have not spent at least 30 percent of their original EMD schedule are not shown. Program abbreviations are defined in Appendix F starting on p. 159.
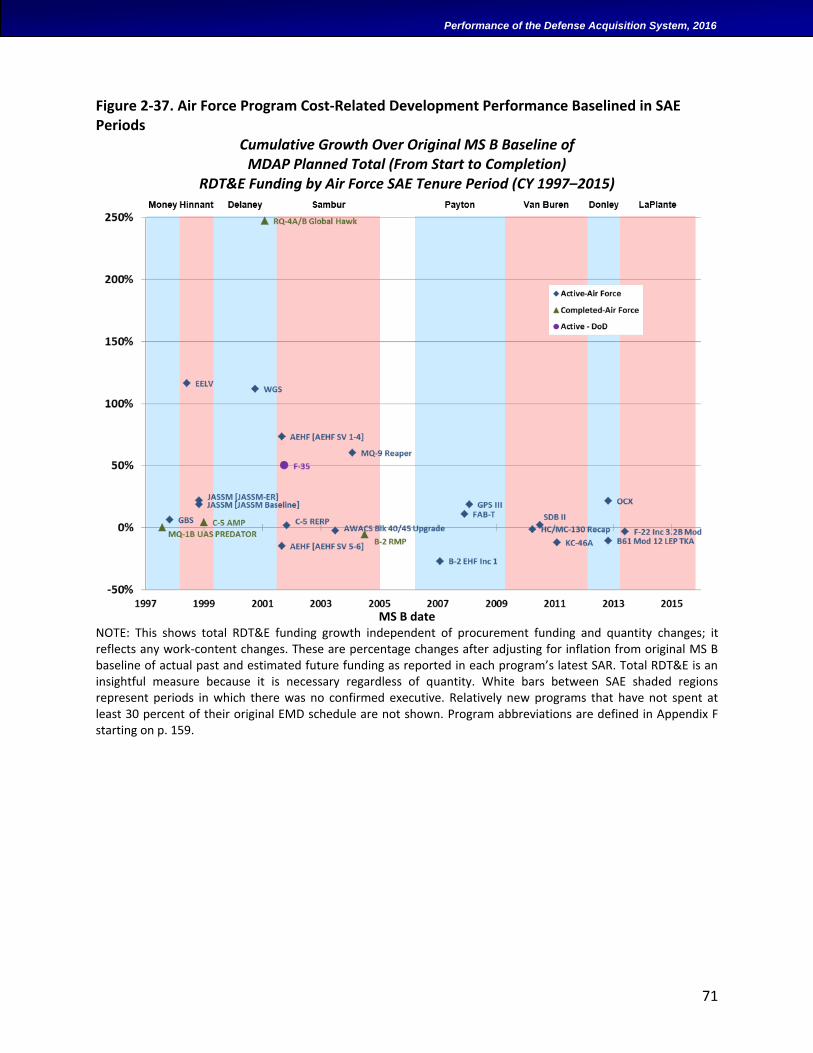
71
Performance of the Defense Acquisition System, 2016
Figure 2-37. Air Force Program Cost-Related Development Performance Baselined in SAE Periods
Cumulative Growth Over Original MS B Baseline of MDAP Planned Total (From Start to Completion)
RDT&E Funding by Air Force SAE Tenure Period (CY 1997–2015)
MS B date
NOTE: This shows total RDT&E funding growth independent of procurement funding and quantity changes; it reflects any work-content changes. These are percentage changes after adjusting for inflation from original MS B baseline of actual past and estimated future funding as reported in each program’s latest SAR. Total RDT&E is an insightful measure because it is necessary regardless of quantity. White bars between SAE shaded regions represent periods in which there was no confirmed executive. Relatively new programs that have not spent at least 30 percent of their original EMD schedule are not shown. Program abbreviations are defined in Appendix F starting on p. 159.
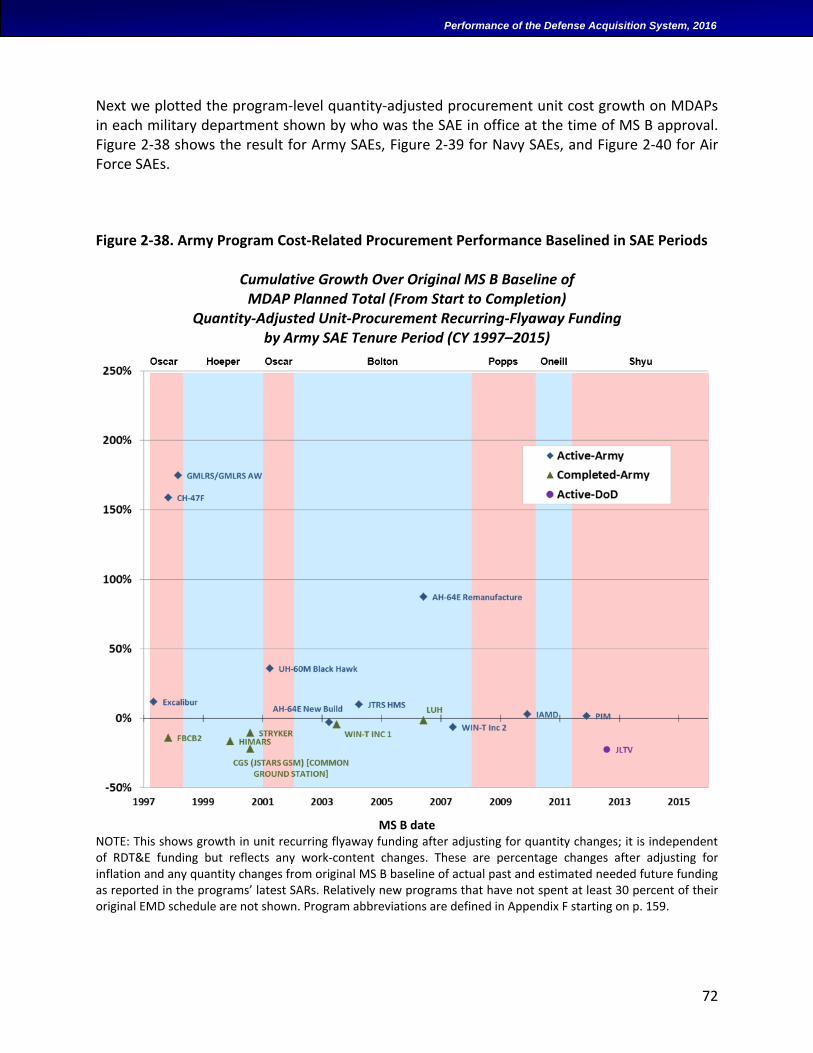
72
Performance of the Defense Acquisition System, 2016
Next we plotted the program-level quantity-adjusted procurement unit cost growth on MDAPs in each military department shown by who was the SAE in office at the time of MS B approval. Figure 2-38 shows the result for Army SAEs, Figure 2-39 for Navy SAEs, and Figure 2-40 for Air Force SAEs.
Figure 2-38. Army Program Cost-Related Procurement Performance Baselined in SAE Periods
Cumulative Growth Over Original MS B Baseline of MDAP Planned Total (From Start to Completion)
Quantity-Adjusted Unit-Procurement Recurring-Flyaway Funding by Army SAE Tenure Period (CY 1997–2015)
MS B date
NOTE: This shows growth in unit recurring flyaway funding after adjusting for quantity changes; it is independent of RDT&E funding but reflects any work-content changes. These are percentage changes after adjusting for inflation and any quantity changes from original MS B baseline of actual past and estimated needed future funding as reported in the programs’ latest SARs. Relatively new programs that have not spent at least 30 percent of their original EMD schedule are not shown. Program abbreviations are defined in Appendix F starting on p. 159.
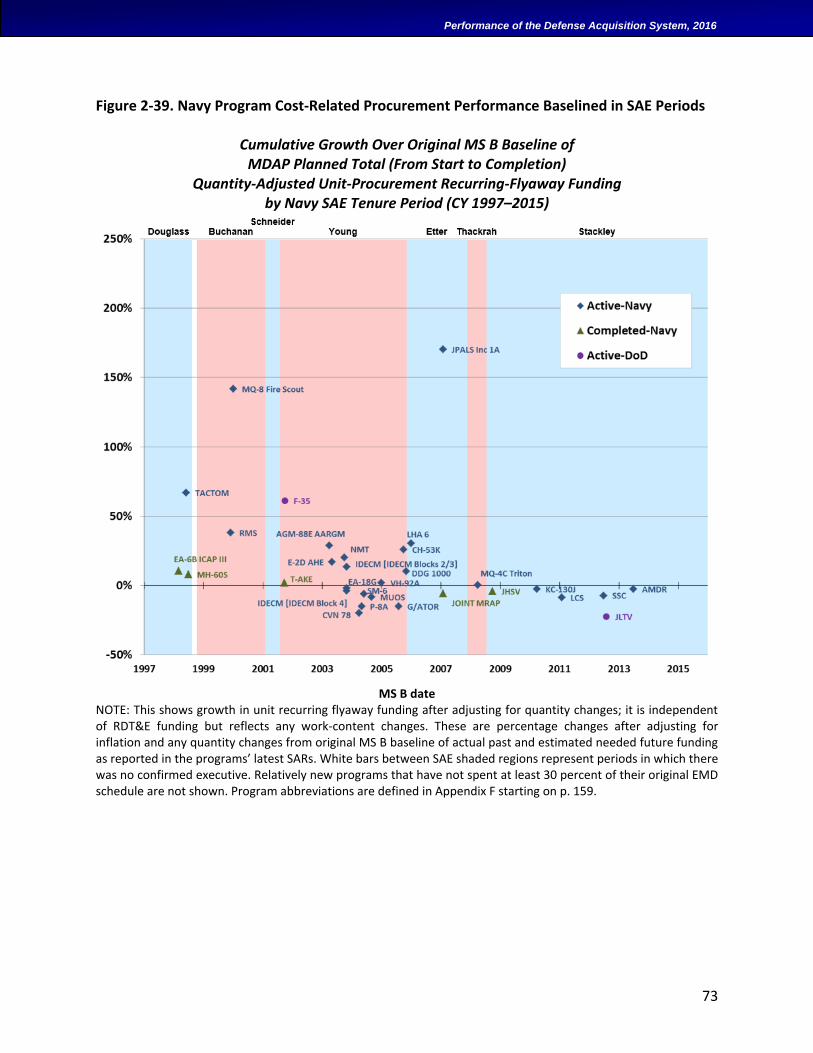
73
Performance of the Defense Acquisition System, 2016
Figure 2-39. Navy Program Cost-Related Procurement Performance Baselined in SAE Periods
Cumulative Growth Over Original MS B Baseline of MDAP Planned Total (From Start to Completion)
Quantity-Adjusted Unit-Procurement Recurring-Flyaway Funding by Navy SAE Tenure Period (CY 1997–2015)
MS B date
NOTE: This shows growth in unit recurring flyaway funding after adjusting for quantity changes; it is independent of RDT&E funding but reflects any work-content changes. These are percentage changes after adjusting for inflation and any quantity changes from original MS B baseline of actual past and estimated needed future funding as reported in the programs’ latest SARs. White bars between SAE shaded regions represent periods in which there was no confirmed executive. Relatively new programs that have not spent at least 30 percent of their original EMD schedule are not shown. Program abbreviations are defined in Appendix F starting on p. 159.
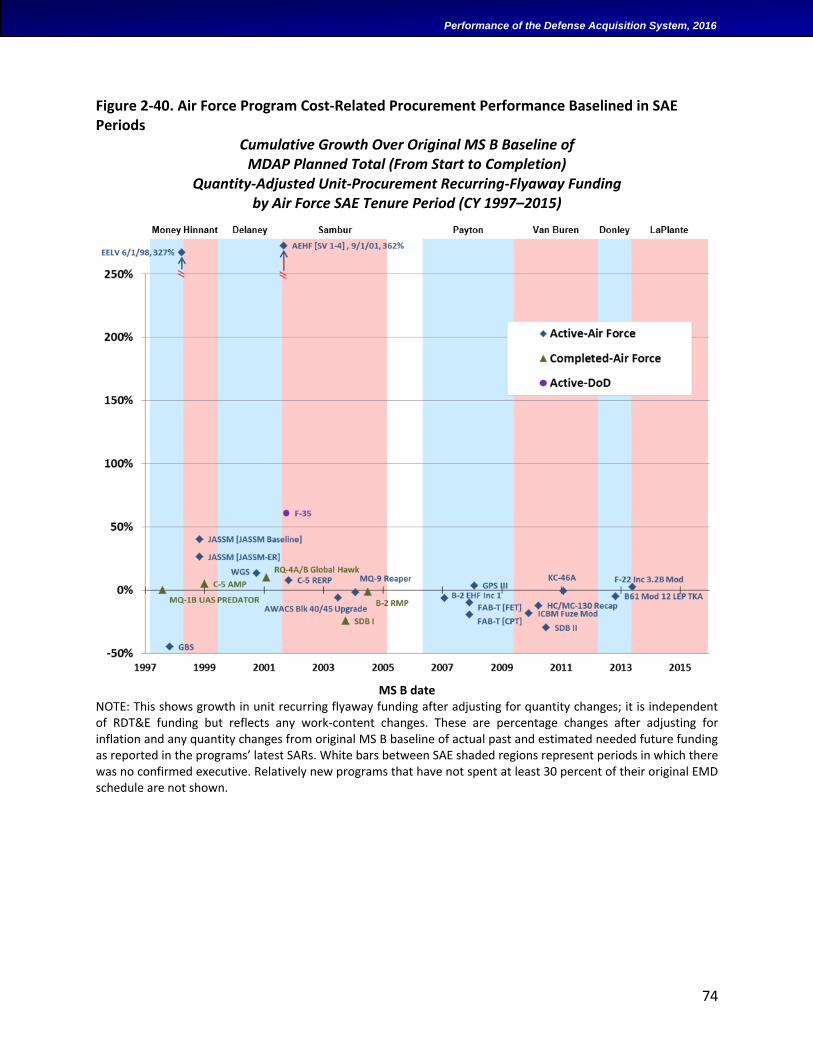
74
Performance of the Defense Acquisition System, 2016
Figure 2-40. Air Force Program Cost-Related Procurement Performance Baselined in SAE Periods
Cumulative Growth Over Original MS B Baseline of MDAP Planned Total (From Start to Completion)
Quantity-Adjusted Unit-Procurement Recurring-Flyaway Funding by Air Force SAE Tenure Period (CY 1997–2015)
MS B date
NOTE: This shows growth in unit recurring flyaway funding after adjusting for quantity changes; it is independent of RDT&E funding but reflects any work-content changes. These are percentage changes after adjusting for inflation and any quantity changes from original MS B baseline of actual past and estimated needed future funding as reported in the programs’ latest SARs. White bars between SAE shaded regions represent periods in which there was no confirmed executive. Relatively new programs that have not spent at least 30 percent of their original EMD schedule are not shown.
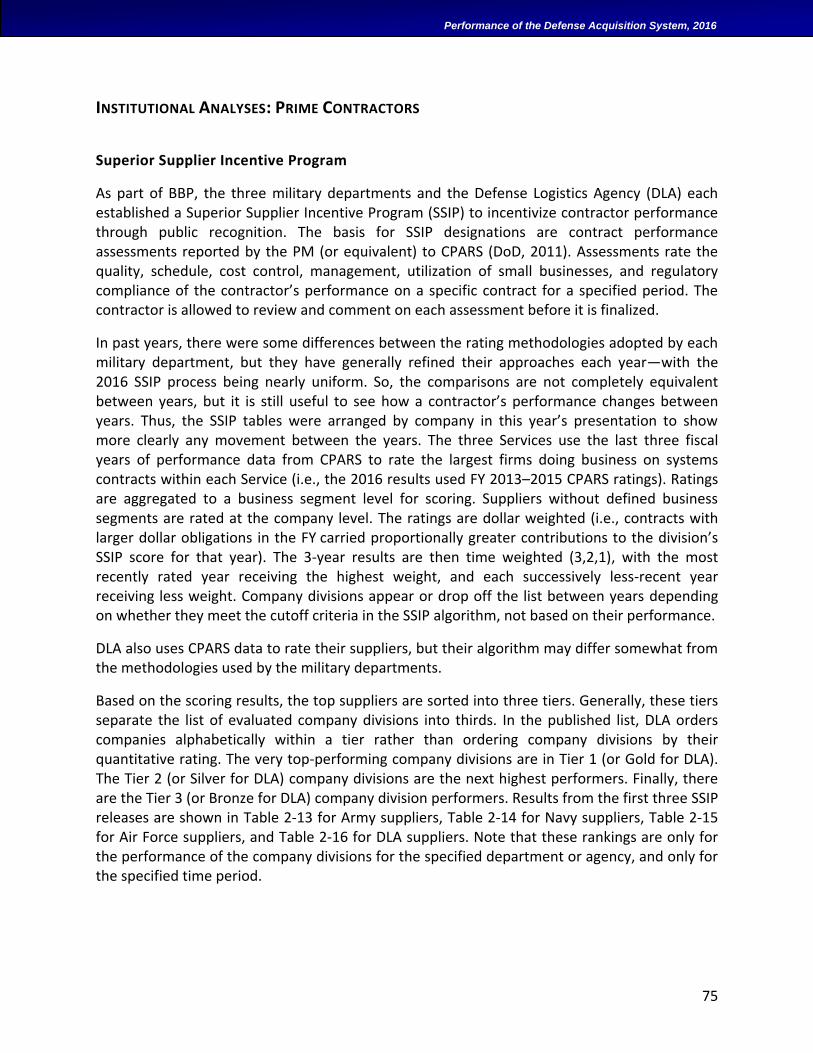
75
Performance of the Defense Acquisition System, 2016
INSTITUTIONAL ANALYSES: PRIME CONTRACTORS
Superior Supplier Incentive Program
As part of BBP, the three military departments and the Defense Logistics Agency (DLA) each established a Superior Supplier Incentive Program (SSIP) to incentivize contractor performance through public recognition. The basis for SSIP designations are contract performance assessments reported by the PM (or equivalent) to CPARS (DoD, 2011). Assessments rate the quality, schedule, cost control, management, utilization of small businesses, and regulatory compliance of the contractor’s performance on a specific contract for a specified period. The contractor is allowed to review and comment on each assessment before it is finalized.
In past years, there were some differences between the rating methodologies adopted by each military department, but they have generally refined their approaches each year—with the 2016 SSIP process being nearly uniform. So, the comparisons are not completely equivalent between years, but it is still useful to see how a contractor’s performance changes between years. Thus, the SSIP tables were arranged by company in this year’s presentation to show more clearly any movement between the years. The three Services use the last three fiscal years of performance data from CPARS to rate the largest firms doing business on systems contracts within each Service (i.e., the 2016 results used FY 2013–2015 CPARS ratings). Ratings are aggregated to a business segment level for scoring. Suppliers without defined business segments are rated at the company level. The ratings are dollar weighted (i.e., contracts with larger dollar obligations in the FY carried proportionally greater contributions to the division’s SSIP score for that year). The 3-year results are then time weighted (3,2,1), with the most recently rated year receiving the highest weight, and each successively less-recent year receiving less weight. Company divisions appear or drop off the list between years depending on whether they meet the cutoff criteria in the SSIP algorithm, not based on their performance.
DLA also uses CPARS data to rate their suppliers, but their algorithm may differ somewhat from the methodologies used by the military departments.
Based on the scoring results, the top suppliers are sorted into three tiers. Generally, these tiers separate the list of evaluated company divisions into thirds. In the published list, DLA orders companies alphabetically within a tier rather than ordering company divisions by their quantitative rating. The very top-performing company divisions are in Tier 1 (or Gold for DLA). The Tier 2 (or Silver for DLA) company divisions are the next highest performers. Finally, there are the Tier 3 (or Bronze for DLA) company division performers. Results from the first three SSIP releases are shown in Table 2-13 for Army suppliers, Table 2-14 for Navy suppliers, Table 2-15 for Air Force suppliers, and Table 2-16 for DLA suppliers. Note that these rankings are only for the performance of the company divisions for the specified department or agency, and only for the specified time period.
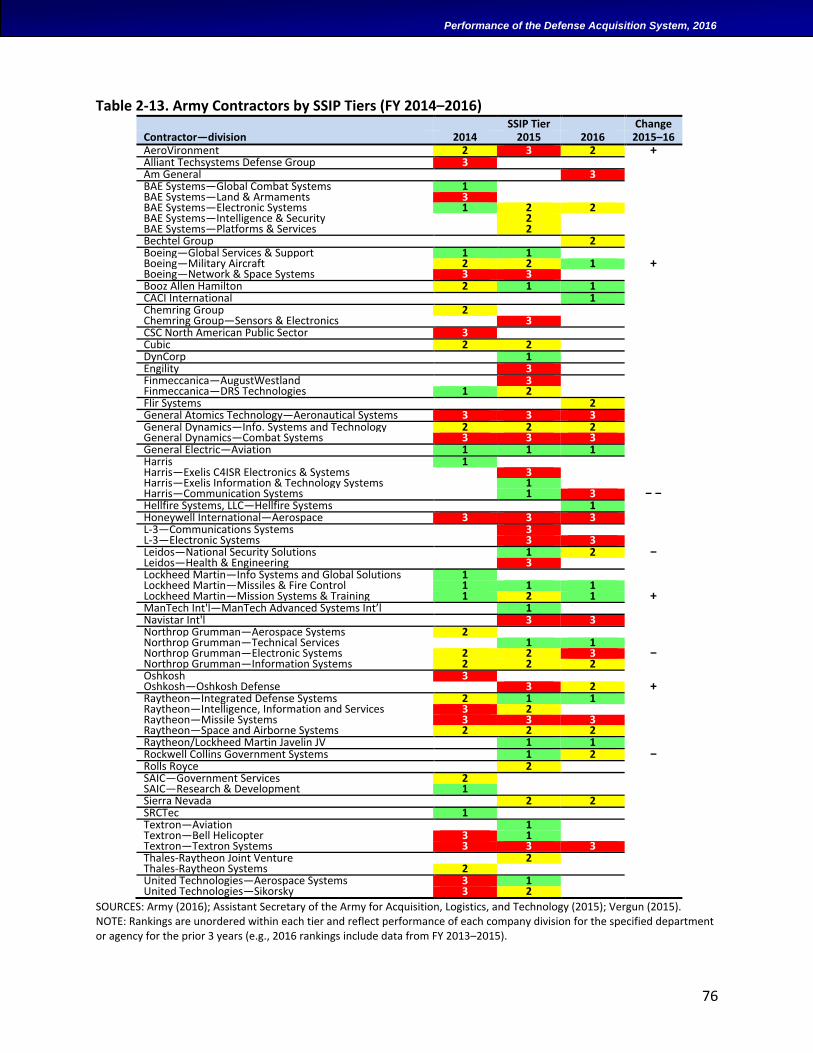
76
Performance of the Defense Acquisition System, 2016
Table 2-13. Army Contractors by SSIP Tiers (FY 2014–2016) SSIP Tier Change Contractor—division 2014 2015 2016 2015–16 AeroVironment 2 3 2 + Alliant Techsystems Defense Group 3 Am General 3 BAE Systems—Global Combat Systems 1 BAE Systems—Land & Armaments 3 BAE Systems—Electronic Systems 1 2 2 BAE Systems—Intelligence & Security 2 BAE Systems—Platforms & Services 2 Bechtel Group 2 Boeing—Global Services & Support 1 1 Boeing—Military Aircraft 2 2 1 + Boeing—Network & Space Systems 3 3 Booz Allen Hamilton 2 1 1 CACI International 1 Chemring Group 2 Chemring Group—Sensors & Electronics 3 CSC North American Public Sector 3 Cubic 2 2 DynCorp 1 Engility 3 Finmeccanica—AugustWestland 3 Finmeccanica—DRS Technologies 1 2 Flir Systems 2 General Atomics Technology—Aeronautical Systems 3 3 3 General Dynamics—Info. Systems and Technology 2 2 2 General Dynamics—Combat Systems 3 3 3 General Electric—Aviation 1 1 1 Harris 1 Harris—Exelis C4ISR Electronics & Systems 3 Harris—Exelis Information & Technology Systems 1 Harris—Communication Systems 1 3 − − Hellfire Systems, LLC—Hellfire Systems 1 Honeywell International—Aerospace 3 3 3 L-3—Communications Systems 3 L-3—Electronic Systems 3 3 Leidos—National Security Solutions 1 2 − Leidos—Health & Engineering 3 Lockheed Martin—Info Systems and Global Solutions 1 Lockheed Martin—Missiles & Fire Control 1 1 1 Lockheed Martin—Mission Systems & Training 1 2 1 + ManTech Int'l—ManTech Advanced Systems Int’l 1 Navistar Int'l 3 3 Northrop Grumman—Aerospace Systems 2 Northrop Grumman—Technical Services 1 1 Northrop Grumman—Electronic Systems 2 2 3 − Northrop Grumman—Information Systems 2 2 2 Oshkosh 3 Oshkosh—Oshkosh Defense 3 2 + Raytheon—Integrated Defense Systems 2 1 1 Raytheon—Intelligence, Information and Services 3 2 Raytheon—Missile Systems 3 3 3 Raytheon—Space and Airborne Systems 2 2 2 Raytheon/Lockheed Martin Javelin JV 1 1 Rockwell Collins Government Systems 1 2 − Rolls Royce 2 SAIC—Government Services 2 SAIC—Research & Development 1 Sierra Nevada 2 2 SRCTec 1 Textron—Aviation 1 Textron—Bell Helicopter 3 1 Textron—Textron Systems 3 3 3 Thales-Raytheon Joint Venture 2 Thales-Raytheon Systems 2 United Technologies—Aerospace Systems 3 1 United Technologies—Sikorsky 3 2
SOURCES: Army (2016); Assistant Secretary of the Army for Acquisition, Logistics, and Technology (2015); Vergun (2015). NOTE: Rankings are unordered within each tier and reflect performance of each company division for the specified department or agency for the prior 3 years (e.g., 2016 rankings include data from FY 2013–2015).
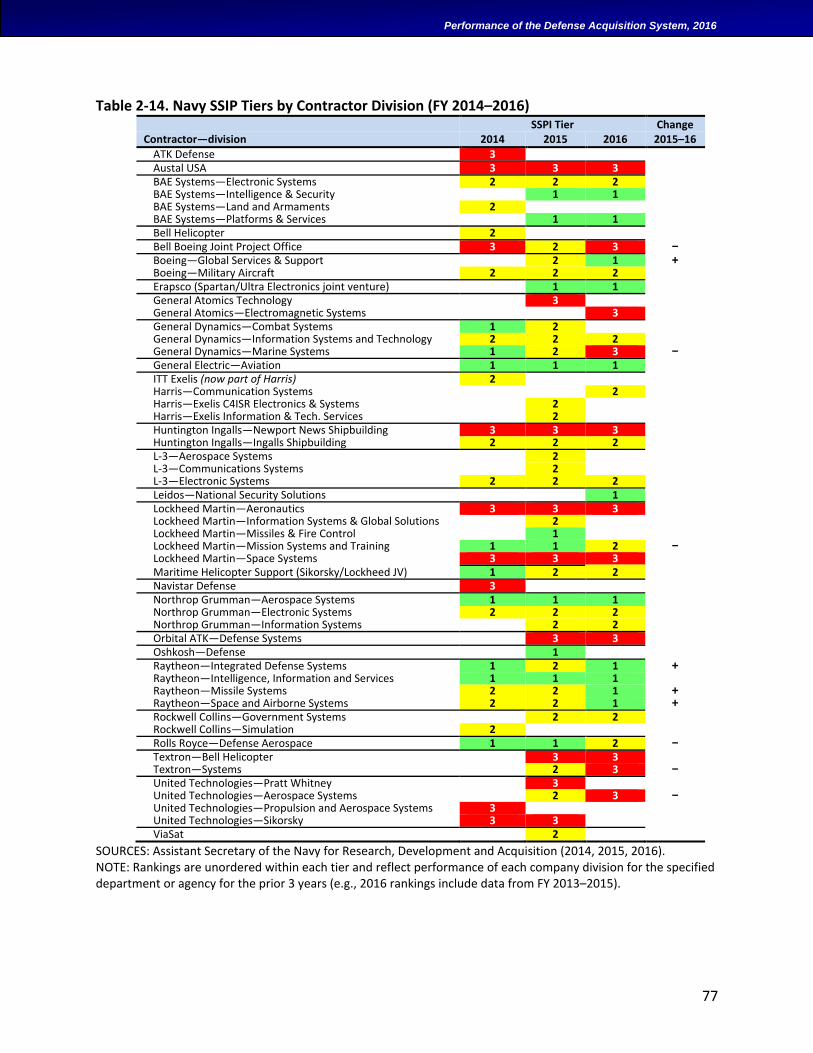
77
Performance of the Defense Acquisition System, 2016
Table 2-14. Navy SSIP Tiers by Contractor Division (FY 2014–2016) SSPI Tier Change
Contractor—division 2014 2015 2016 2015–16
ATK Defense 3
Austal USA 3 3 3 BAE Systems—Electronic Systems 2 2 2 BAE Systems—Intelligence & Security 1 1 BAE Systems—Land and Armaments 2
BAE Systems—Platforms & Services 1 1 Bell Helicopter 2
Bell Boeing Joint Project Office 3 2 3 − Boeing—Global Services & Support 2 1 + Boeing—Military Aircraft 2 2 2 Erapsco (Spartan/Ultra Electronics joint venture) 1 1 General Atomics Technology 3
General Atomics—Electromagnetic Systems 3 General Dynamics—Combat Systems 1 2
General Dynamics—Information Systems and Technology 2 2 2 General Dynamics—Marine Systems 1 2 3 − General Electric—Aviation 1 1 1 ITT Exelis (now part of Harris) 2
Harris—Communication Systems 2 Harris—Exelis C4ISR Electronics & Systems 2
Harris—Exelis Information & Tech. Services 2
Huntington Ingalls—Newport News Shipbuilding 3 3 3 Huntington Ingalls—Ingalls Shipbuilding 2 2 2 L-3—Aerospace Systems 2
L-3—Communications Systems 2
L-3—Electronic Systems 2 2 2 Leidos—National Security Solutions 1 Lockheed Martin—Aeronautics 3 3 3 Lockheed Martin—Information Systems & Global Solutions 2
Lockheed Martin—Missiles & Fire Control 1
Lockheed Martin—Mission Systems and Training 1 1 2 − Lockheed Martin—Space Systems 3 3 3 Maritime Helicopter Support (Sikorsky/Lockheed JV) 1 2 2 Navistar Defense 3
Northrop Grumman—Aerospace Systems 1 1 1 Northrop Grumman—Electronic Systems 2 2 2 Northrop Grumman—Information Systems 2 2 Orbital ATK—Defense Systems 3 3 Oshkosh—Defense 1
Raytheon—Integrated Defense Systems 1 2 1 + Raytheon—Intelligence, Information and Services 1 1 1 Raytheon—Missile Systems 2 2 1 + Raytheon—Space and Airborne Systems 2 2 1 + Rockwell Collins—Government Systems 2 2 Rockwell Collins—Simulation 2
Rolls Royce—Defense Aerospace 1 1 2 − Textron—Bell Helicopter 3 3 Textron—Systems 2 3 − United Technologies—Pratt Whitney 3
United Technologies—Aerospace Systems 2 3 − United Technologies—Propulsion and Aerospace Systems 3
United Technologies—Sikorsky 3 3
ViaSat 2
SOURCES: Assistant Secretary of the Navy for Research, Development and Acquisition (2014, 2015, 2016). NOTE: Rankings are unordered within each tier and reflect performance of each company division for the specified department or agency for the prior 3 years (e.g., 2016 rankings include data from FY 2013–2015).
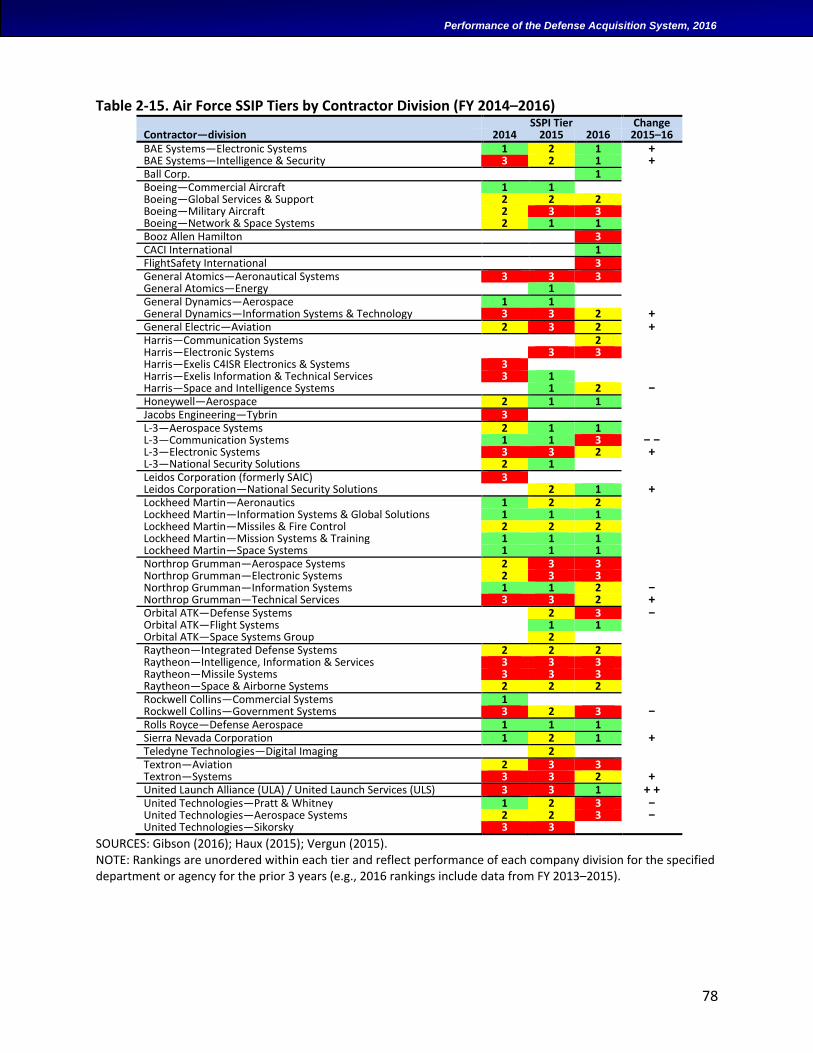
78
Performance of the Defense Acquisition System, 2016
Table 2-15. Air Force SSIP Tiers by Contractor Division (FY 2014–2016) SSPI Tier Change Contractor—division 2014 2015 2016 2015–16 BAE Systems—Electronic Systems 1 2 1 + BAE Systems—Intelligence & Security 3 2 1 + Ball Corp. 1 Boeing—Commercial Aircraft 1 1
Boeing—Global Services & Support 2 2 2 Boeing—Military Aircraft 2 3 3 Boeing—Network & Space Systems 2 1 1 Booz Allen Hamilton 3 CACI International 1 FlightSafety International 3 General Atomics—Aeronautical Systems 3 3 3 General Atomics—Energy 1 General Dynamics—Aerospace 1 1
General Dynamics—Information Systems & Technology 3 3 2 + General Electric—Aviation 2 3 2 + Harris—Communication Systems 2 Harris—Electronic Systems 3 3 Harris—Exelis C4ISR Electronics & Systems 3
Harris—Exelis Information & Technical Services 3 1 Harris—Space and Intelligence Systems 1 2 − Honeywell—Aerospace 2 1 1 Jacobs Engineering—Tybrin 3 L-3—Aerospace Systems 2 1 1 L-3—Communication Systems 1 1 3 − − L-3—Electronic Systems 3 3 2 + L-3—National Security Solutions 2 1 Leidos Corporation (formerly SAIC) 3
Leidos Corporation—National Security Solutions 2 1 + Lockheed Martin—Aeronautics 1 2 2 Lockheed Martin—Information Systems & Global Solutions 1 1 1 Lockheed Martin—Missiles & Fire Control 2 2 2 Lockheed Martin—Mission Systems & Training 1 1 1 Lockheed Martin—Space Systems 1 1 1 Northrop Grumman—Aerospace Systems 2 3 3 Northrop Grumman—Electronic Systems 2 3 3 Northrop Grumman—Information Systems 1 1 2 − Northrop Grumman—Technical Services 3 3 2 + Orbital ATK—Defense Systems
2 3 −
Orbital ATK—Flight Systems
1 1 Orbital ATK—Space Systems Group 2 Raytheon—Integrated Defense Systems 2 2 2 Raytheon—Intelligence, Information & Services 3 3 3 Raytheon—Missile Systems 3 3 3 Raytheon—Space & Airborne Systems 2 2 2 Rockwell Collins—Commercial Systems 1
Rockwell Collins—Government Systems 3 2 3 − Rolls Royce—Defense Aerospace 1 1 1 Sierra Nevada Corporation 1 2 1 + Teledyne Technologies—Digital Imaging 2 Textron—Aviation 2 3 3 Textron—Systems 3 3 2 + United Launch Alliance (ULA) / United Launch Services (ULS) 3 3 1 + + United Technologies—Pratt & Whitney 1 2 3 − United Technologies—Aerospace Systems 2 2 3 − United Technologies—Sikorsky 3 3
SOURCES: Gibson (2016); Haux (2015); Vergun (2015). NOTE: Rankings are unordered within each tier and reflect performance of each company division for the specified department or agency for the prior 3 years (e.g., 2016 rankings include data from FY 2013–2015).
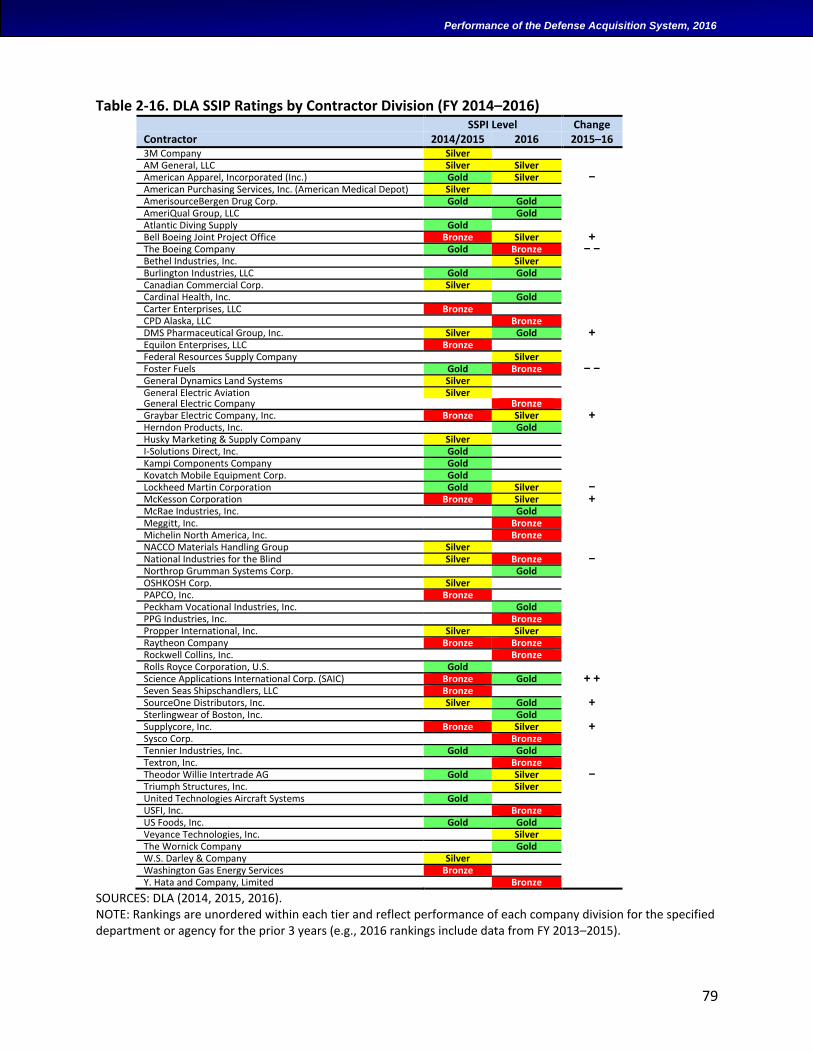
79
Performance of the Defense Acquisition System, 2016
Table 2-16. DLA SSIP Ratings by Contractor Division (FY 2014–2016) SSPI Level Change Contractor 2014/2015 2016 2015–16 3M Company Silver AM General, LLC Silver Silver American Apparel, Incorporated (Inc.) Gold Silver − American Purchasing Services, Inc. (American Medical Depot) Silver AmerisourceBergen Drug Corp. Gold Gold AmeriQual Group, LLC Gold Atlantic Diving Supply Gold Bell Boeing Joint Project Office Bronze Silver + The Boeing Company Gold Bronze − − Bethel Industries, Inc. Silver Burlington Industries, LLC Gold Gold Canadian Commercial Corp. Silver Cardinal Health, Inc. Gold Carter Enterprises, LLC Bronze CPD Alaska, LLC Bronze DMS Pharmaceutical Group, Inc. Silver Gold + Equilon Enterprises, LLC Bronze Federal Resources Supply Company Silver Foster Fuels Gold Bronze − − General Dynamics Land Systems Silver General Electric Aviation Silver General Electric Company Bronze Graybar Electric Company, Inc. Bronze Silver + Herndon Products, Inc. Gold Husky Marketing & Supply Company Silver I-Solutions Direct, Inc. Gold Kampi Components Company Gold Kovatch Mobile Equipment Corp. Gold Lockheed Martin Corporation Gold Silver − McKesson Corporation Bronze Silver + McRae Industries, Inc. Gold Meggitt, Inc. Bronze Michelin North America, Inc. Bronze NACCO Materials Handling Group Silver National Industries for the Blind Silver Bronze − Northrop Grumman Systems Corp. Gold OSHKOSH Corp. Silver PAPCO, Inc. Bronze Peckham Vocational Industries, Inc. Gold PPG Industries, Inc. Bronze Propper International, Inc. Silver Silver Raytheon Company Bronze Bronze Rockwell Collins, Inc. Bronze Rolls Royce Corporation, U.S. Gold Science Applications International Corp. (SAIC) Bronze Gold + + Seven Seas Shipschandlers, LLC Bronze SourceOne Distributors, Inc. Silver Gold + Sterlingwear of Boston, Inc. Gold Supplycore, Inc. Bronze Silver + Sysco Corp. Bronze Tennier Industries, Inc. Gold Gold Textron, Inc. Bronze Theodor Willie Intertrade AG Gold Silver − Triumph Structures, Inc. Silver United Technologies Aircraft Systems Gold USFI, Inc. Bronze US Foods, Inc. Gold Gold Veyance Technologies, Inc. Silver The Wornick Company Gold W.S. Darley & Company Silver Washington Gas Energy Services Bronze Y. Hata and Company, Limited Bronze
SOURCES: DLA (2014, 2015, 2016). NOTE: Rankings are unordered within each tier and reflect performance of each company division for the specified department or agency for the prior 3 years (e.g., 2016 rankings include data from FY 2013–2015).
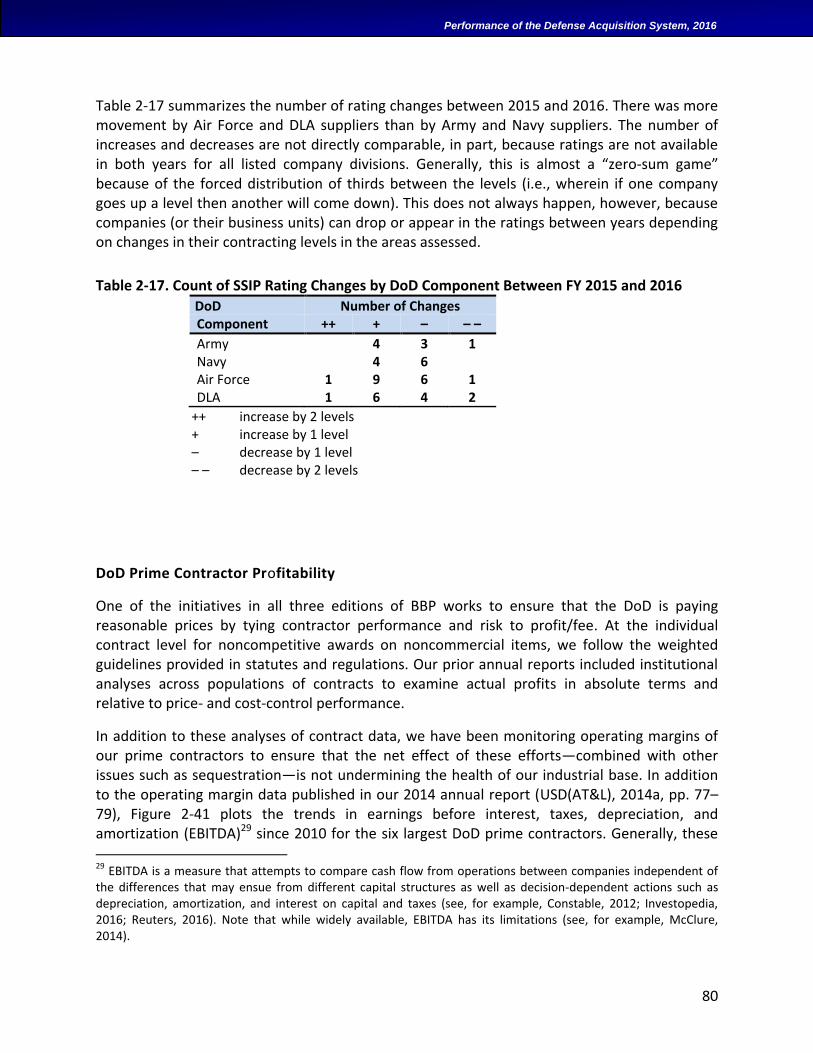
80
Performance of the Defense Acquisition System, 2016
Table 2-17 summarizes the number of rating changes between 2015 and 2016. There was more movement by Air Force and DLA suppliers than by Army and Navy suppliers. The number of increases and decreases are not directly comparable, in part, because ratings are not available in both years for all listed company divisions. Generally, this is almost a “zero-sum game” because of the forced distribution of thirds between the levels (i.e., wherein if one company goes up a level then another will come down). This does not always happen, however, because companies (or their business units) can drop or appear in the ratings between years depending on changes in their contracting levels in the areas assessed.
Table 2-17. Count of SSIP Rating Changes by DoD Component Between FY 2015 and 2016
DoD Number of Changes Component ++ + – – –
Army 4 3 1 Navy 4 6 Air Force 1 9 6 1 DLA 1 6 4 2
++ increase by 2 levels + increase by 1 level – decrease by 1 level – – decrease by 2 levels
DoD Prime Contractor Profitability
One of the initiatives in all three editions of BBP works to ensure that the DoD is paying reasonable prices by tying contractor performance and risk to profit/fee. At the individual contract level for noncompetitive awards on noncommercial items, we follow the weighted guidelines provided in statutes and regulations. Our prior annual reports included institutional analyses across populations of contracts to examine actual profits in absolute terms and relative to price- and cost-control performance.
In addition to these analyses of contract data, we have been monitoring operating margins of our prime contractors to ensure that the net effect of these efforts—combined with other issues such as sequestration—is not undermining the health of our industrial base. In addition to the operating margin data published in our 2014 annual report (USD(AT&L), 2014a, pp. 77–79), Figure 2-41 plots the trends in earnings before interest, taxes, depreciation, and amortization (EBITDA)29 since 2010 for the six largest DoD prime contractors. Generally, these 29 EBITDA is a measure that attempts to compare cash flow from operations between companies independent of the differences that may ensue from different capital structures as well as decision-dependent actions such as depreciation, amortization, and interest on capital and taxes (see, for example, Constable, 2012; Investopedia, 2016; Reuters, 2016). Note that while widely available, EBITDA has its limitations (see, for example, McClure, 2014).
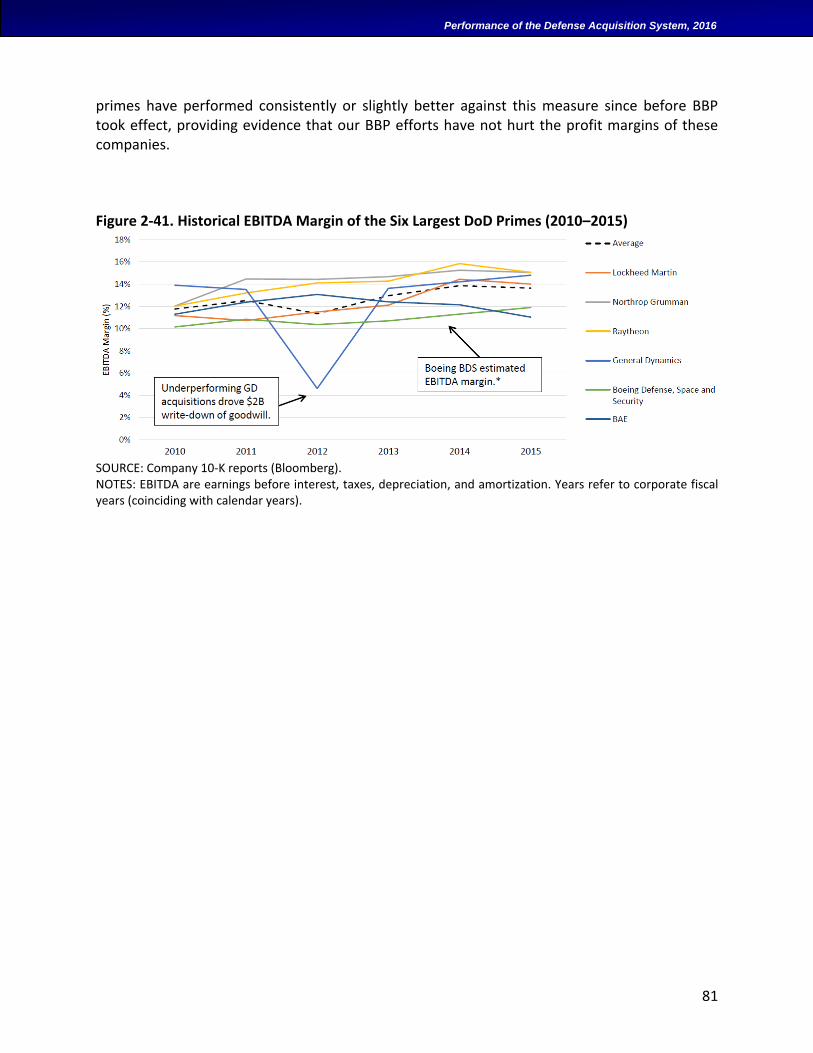
81
Performance of the Defense Acquisition System, 2016
primes have performed consistently or slightly better against this measure since before BBP took effect, providing evidence that our BBP efforts have not hurt the profit margins of these companies.
Figure 2-41. Historical EBITDA Margin of the Six Largest DoD Primes (2010–2015)
SOURCE: Company 10-K reports (Bloomberg). NOTES: EBITDA are earnings before interest, taxes, depreciation, and amortization. Years refer to corporate fiscal years (coinciding with calendar years).

82
Performance of the Defense Acquisition System, 2016
(This page was left blank intentionally)
83
Performance of the Defense Acquisition System, 2016
3. EXPANDED ANALYSES
ANNUAL GROWTH OF CONTRACT COSTS FOR MAJOR PROGRAMS IN DEVELOPMENT AND
EARLY PRODUCTION
Are there periods of improved cost control on defense contracts? Have recent efforts produced measurable results? What effects have external events and major policy changes had on controlling costs on major defense programs?
To help answer these questions, we examined the 5-year moving average of annual growth in total EV contract costs on major contracts30 for the development and early production of MDAPs. Growth is in real terms (i.e., after adjusting for inflation). This different measure of growth reflects changes relative to negotiated cost targets on contracts tracked in EV reports. It includes both scope growth (i.e., work added to a contract after award) and overruns (i.e., latest estimate of cost over the latest negotiated target). Negotiated targets do not necessarily equal Government or contractor negotiation cost estimates. These contract level targets are also different than broader program-level cost estimates, baselines, and statutory measures of cost growth relative to program-level baselines, because it excludes noncontracted costs and the majority of production contracts. Nonetheless, we expect that the cost-reimbursement and fixed-price incentive contracts that this study examines should show the same trends as other measures of total program cost growth—in part because production contracts have much lower cost growth than these development and early production contracts. EV reports are typically limited to development (engineering and manufacturing phase) and early production contracts. They include fixed-price incentive and cost-reimbursement contracts but generally not firm-fixed-price contracts (which often are not appropriate until full-rate production and usually do not report EV). Each year’s growth is the sum of all the changes in active contract values divided by the sum of all the original target costs. Thus, the portfolio percentage change will be closer in value to the percentage change of the larger contracts. Of final note, reports of scope changes and estimates of final cost in EV reports can be sporadic, leading to wide year-to-year changes; therefore, we used a 5-year moving average to smooth out these effects and reveal longer-term trends.
We used standard statistical modeling techniques to identify statistically significant factors that are likely causes of growth. For example, are reductions merely reflections of budgetary
30
Major contracts include the six largest contracts (prime, associated, or for government-furnished equipment) for
each MDAP valued at more than $40 million. Earned value data also are available for other MDAP contracts of at
least $60 million in RDT&E or $250 million in procurement or ship construction (in FY 1990 constant dollars).
Note that EV data are usually not provided for firm-fixed-price contracts, so this MDAP contract dataset has very
few such contracts.
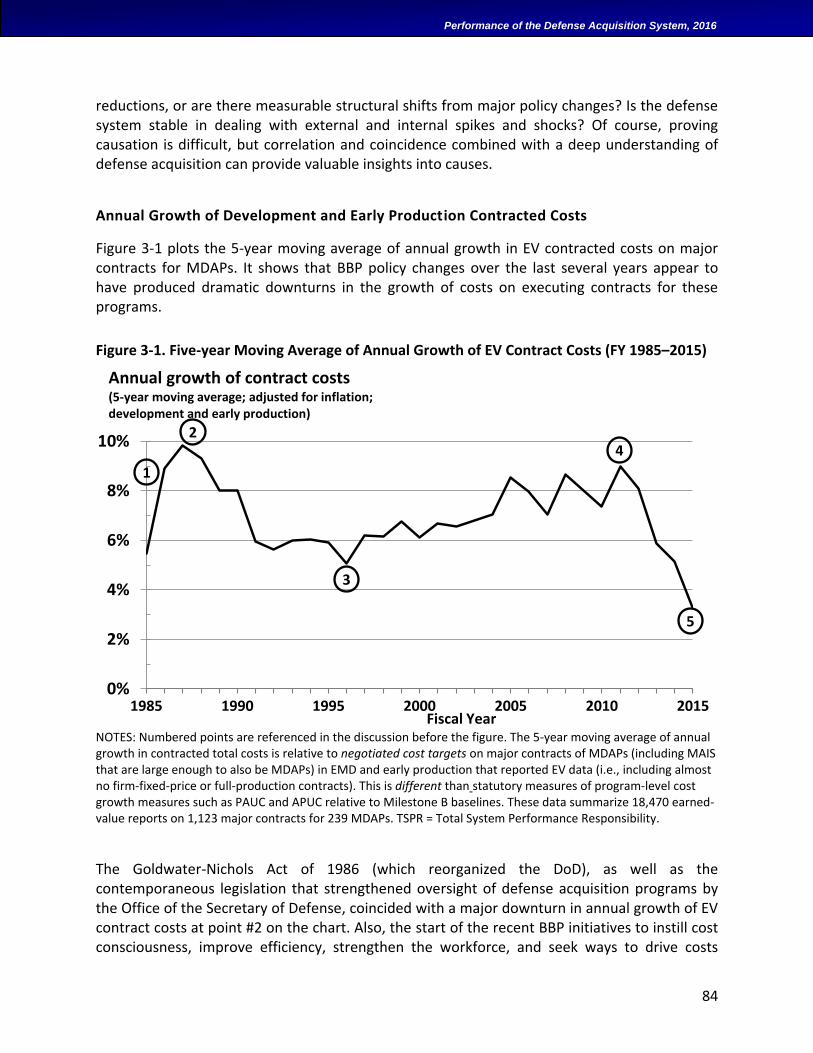
84
Performance of the Defense Acquisition System, 2016
reductions, or are there measurable structural shifts from major policy changes? Is the defense system stable in dealing with external and internal spikes and shocks? Of course, proving causation is difficult, but correlation and coincidence combined with a deep understanding of defense acquisition can provide valuable insights into causes.
Annual Growth of Development and Early Production Contracted Costs
Figure 3-1 plots the 5-year moving average of annual growth in EV contracted costs on major contracts for MDAPs. It shows that BBP policy changes over the last several years appear to have produced dramatic downturns in the growth of costs on executing contracts for these programs.
Figure 3-1. Five-year Moving Average of Annual Growth of EV Contract Costs (FY 1985–2015)
NOTES: Numbered points are referenced in the discussion before the figure. The 5-year moving average of annual growth in contracted total costs is relative to negotiated cost targets on major contracts of MDAPs (including MAIS that are large enough to also be MDAPs) in EMD and early production that reported EV data (i.e., including almost no firm-fixed-price or full-production contracts). This is different than statutory measures of program-level cost growth measures such as PAUC and APUC relative to Milestone B baselines. These data summarize 18,470 earned-value reports on 1,123 major contracts for 239 MDAPs. TSPR = Total System Performance Responsibility.
The Goldwater-Nichols Act of 1986 (which reorganized the DoD), as well as the contemporaneous legislation that strengthened oversight of defense acquisition programs by the Office of the Secretary of Defense, coincided with a major downturn in annual growth of EV contract costs at point #2 on the chart. Also, the start of the recent BBP initiatives to instill cost consciousness, improve efficiency, strengthen the workforce, and seek ways to drive costs
0%
2%
4%
6%
8%
10%
1985 1990 1995 2000 2005 2010 2015Fiscal Year
3
4
5
2
1
Annual growth of contract costs(5-year moving average; adjusted for inflation;development and early production)
85
Performance of the Defense Acquisition System, 2016
downward coincided with the recent downturn starting at point #4. At 3.5% in FY 2015 for the portfolio, the DoD is now at the lowest level of growth since before FY 1985.
Conversely, policy changes that reduced oversight on contractor performance, starting in the mid-1990s, appear to coincide with an upturn in annual added costs on contracts from point #3. We test below whether that period increase is statistically significant (e.g., whether the trend is really flat from 1995 if you dismiss 1996 as anomalous).
Increased demands for new capabilities can also add costs to contracts; that is visible in the chart during the defense buildup in the 1980s by President Reagan and during the post-9/11 wars to combat global terrorism.
Factors Contributing to Annual Growth in Contracted Costs
To understand whether the trends in Figure 3-1 are significant and what may be driving them, we employed the following statistical analyses. First, we wanted to determine whether the two steep drops are statistically significant or whether they are merely an artifact of budget cuts. We also wanted to test whether the growth in the mid-to-late 1990s was flat or significantly trending upward.
We found that the combined effects of three types of drivers—together with a constant base and random noise—very closely fit the dynamics of the growth curve.31 1) Budget effects. The growth in costs is, in part, positively correlated with budget levels and
dynamics. This includes two factors: a) the average of the DoD budget over the past 5 years, and b) the change in that average from the prior year to the current year.
2) Two structural changes. Two overlapping periods correlate with partial reductions: a) one since 1990, coincident with post-Goldwater-Nichols implementation, and b) one since 2012, coincident with BBP implementation.32
3) A self-correcting behavior. A factor that corrects for prior differences between the anticipated cost growth from the budgetary, structural, and constant factors and the actual growth. This autoregression factor adjusts for unforeseen external “shocks” to the systems (including unanticipated changes in budgets) and internal variations (such as larger-than-modeled annual contract obligations). It serves as a kind of negative feedback that keeps the system under control.
31
The following variables were either spurious or statistically insignificant: UCAs (although UCAs can be
significant in some commodity classes, especially ships in development); contract spending share of program
spending; cost-over-target; share of cost growth due to work-content growth; share of cost growth due to cost-over-
target; margin; change in margin over the contract’s period of performance; contract size (total dollars); schedule
growth; military department (i.e., Army, Navy, Air Force, or DoD); commodity type (except space systems in
development and aircraft in early production); and quantity changes (USD(AT&L), 2015, pp. 75–77).
32 Since the effects of new policies take time to show, we measured these periods to start 2 to 3 years after their
enactment. Goldwater-Nichols Act was signed into law at the start of FY 1987, and the first BBP memoranda were
issued in late FY 2010.
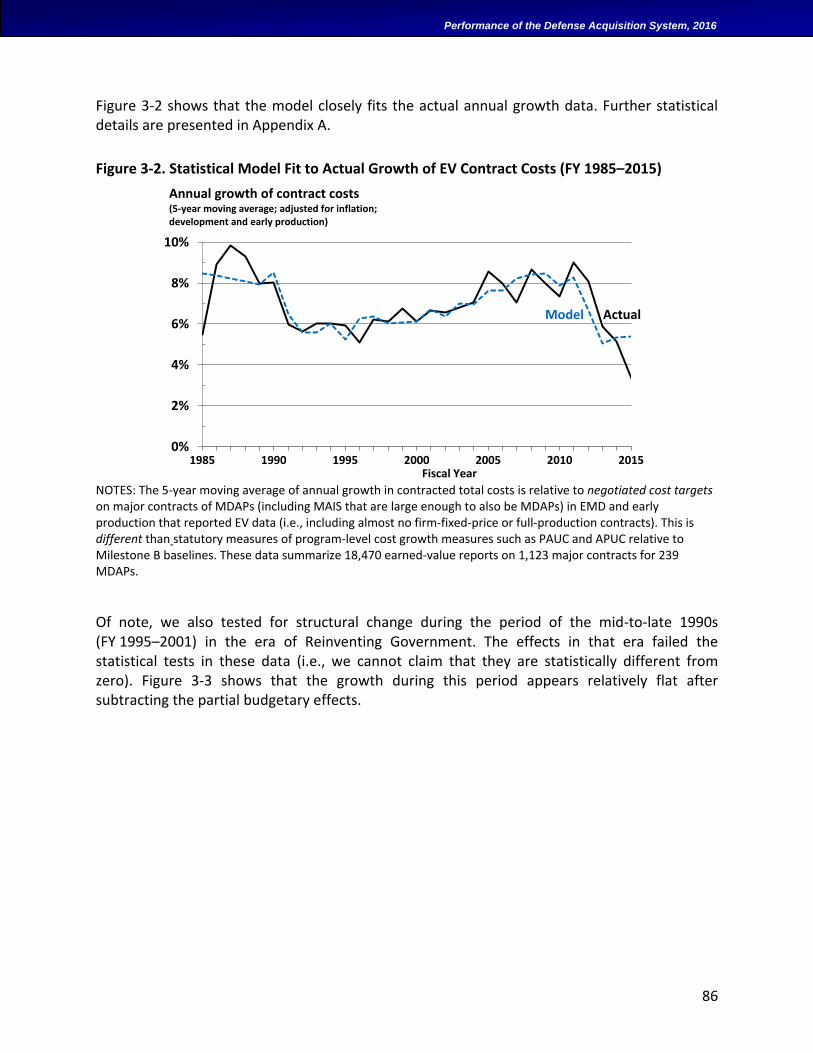
86
Performance of the Defense Acquisition System, 2016
Figure 3-2 shows that the model closely fits the actual annual growth data. Further statistical details are presented in Appendix A.
Figure 3-2. Statistical Model Fit to Actual Growth of EV Contract Costs (FY 1985–2015)
NOTES: The 5-year moving average of annual growth in contracted total costs is relative to negotiated cost targets on major contracts of MDAPs (including MAIS that are large enough to also be MDAPs) in EMD and early production that reported EV data (i.e., including almost no firm-fixed-price or full-production contracts). This is different than statutory measures of program-level cost growth measures such as PAUC and APUC relative to Milestone B baselines. These data summarize 18,470 earned-value reports on 1,123 major contracts for 239 MDAPs.
Of note, we also tested for structural change during the period of the mid-to-late 1990s (FY 1995–2001) in the era of Reinventing Government. The effects in that era failed the statistical tests in these data (i.e., we cannot claim that they are statistically different from zero). Figure 3-3 shows that the growth during this period appears relatively flat after subtracting the partial budgetary effects.
0%
2%
4%
6%
8%
10%
1985 1990 1995 2000 2005 2010 2015
Annual growth of contract costs(5-year moving average; adjusted for inflation;development and early production)
ActualModel
Fiscal Year
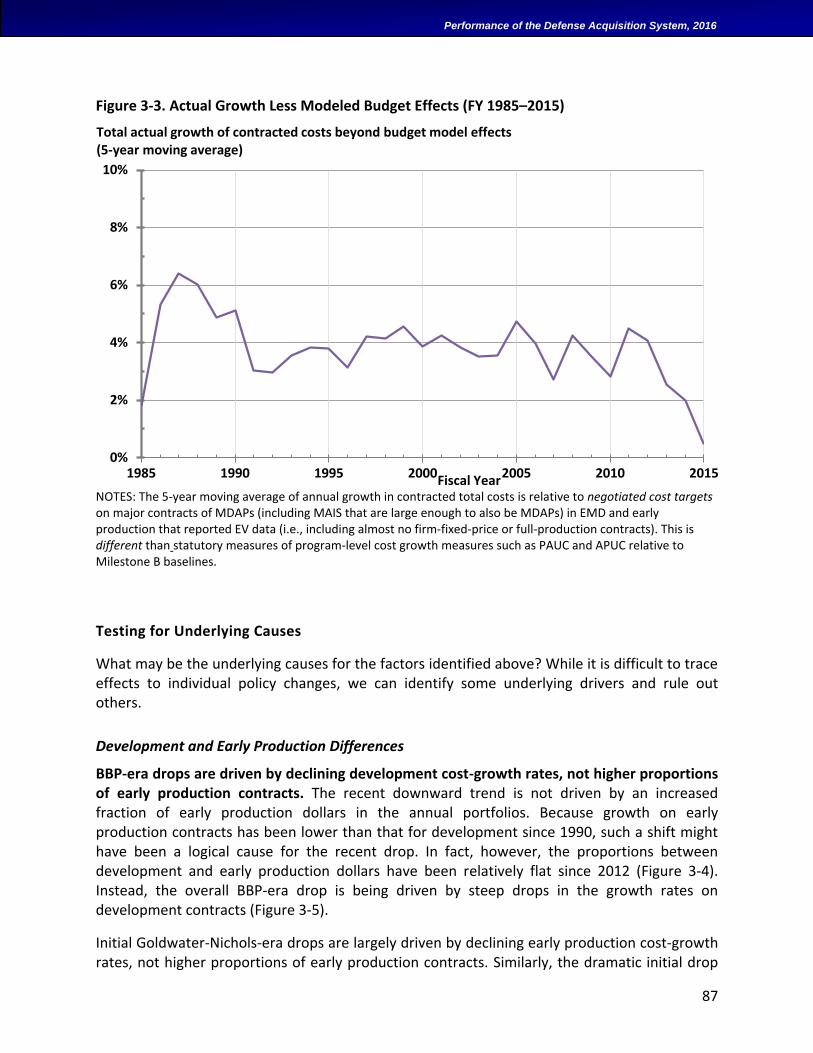
87
Performance of the Defense Acquisition System, 2016
Figure 3-3. Actual Growth Less Modeled Budget Effects (FY 1985–2015)
NOTES: The 5-year moving average of annual growth in contracted total costs is relative to negotiated cost targets on major contracts of MDAPs (including MAIS that are large enough to also be MDAPs) in EMD and early production that reported EV data (i.e., including almost no firm-fixed-price or full-production contracts). This is different than statutory measures of program-level cost growth measures such as PAUC and APUC relative to Milestone B baselines.
Testing for Underlying Causes
What may be the underlying causes for the factors identified above? While it is difficult to trace effects to individual policy changes, we can identify some underlying drivers and rule out others.
Development and Early Production Differences
BBP-era drops are driven by declining development cost-growth rates, not higher proportions of early production contracts. The recent downward trend is not driven by an increased fraction of early production dollars in the annual portfolios. Because growth on early production contracts has been lower than that for development since 1990, such a shift might have been a logical cause for the recent drop. In fact, however, the proportions between development and early production dollars have been relatively flat since 2012 (Figure 3-4). Instead, the overall BBP-era drop is being driven by steep drops in the growth rates on development contracts (Figure 3-5).
Initial Goldwater-Nichols-era drops are largely driven by declining early production cost-growth rates, not higher proportions of early production contracts. Similarly, the dramatic initial drop
0%
2%
4%
6%
8%
10%
1985 1990 1995 2000 2005 2010 2015Fiscal Year
Total actual growth of contracted costs beyond budget model effects(5-year moving average)
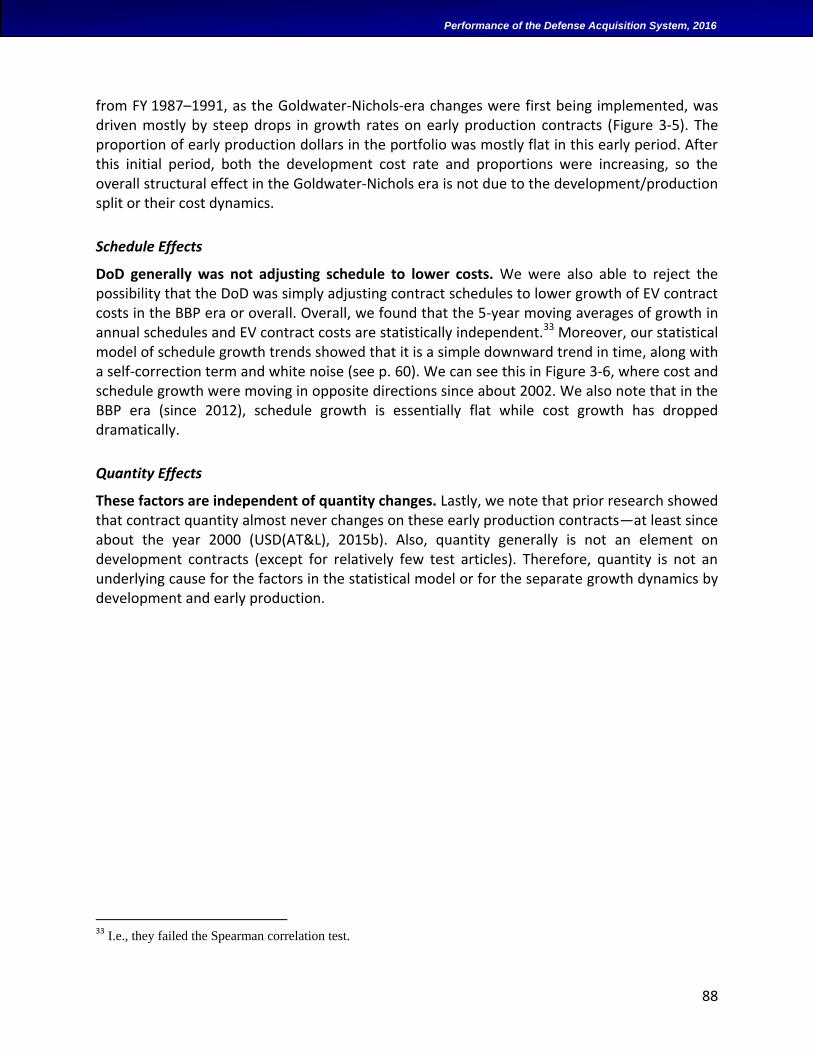
88
Performance of the Defense Acquisition System, 2016
from FY 1987–1991, as the Goldwater-Nichols-era changes were first being implemented, was driven mostly by steep drops in growth rates on early production contracts (Figure 3-5). The proportion of early production dollars in the portfolio was mostly flat in this early period. After this initial period, both the development cost rate and proportions were increasing, so the overall structural effect in the Goldwater-Nichols era is not due to the development/production split or their cost dynamics.
Schedule Effects
DoD generally was not adjusting schedule to lower costs. We were also able to reject the possibility that the DoD was simply adjusting contract schedules to lower growth of EV contract costs in the BBP era or overall. Overall, we found that the 5-year moving averages of growth in annual schedules and EV contract costs are statistically independent.33 Moreover, our statistical model of schedule growth trends showed that it is a simple downward trend in time, along with a self-correction term and white noise (see p. 60). We can see this in Figure 3-6, where cost and schedule growth were moving in opposite directions since about 2002. We also note that in the BBP era (since 2012), schedule growth is essentially flat while cost growth has dropped dramatically.
Quantity Effects
These factors are independent of quantity changes. Lastly, we note that prior research showed that contract quantity almost never changes on these early production contracts—at least since about the year 2000 (USD(AT&L), 2015b). Also, quantity generally is not an element on development contracts (except for relatively few test articles). Therefore, quantity is not an underlying cause for the factors in the statistical model or for the separate growth dynamics by development and early production.
33
I.e., they failed the Spearman correlation test.
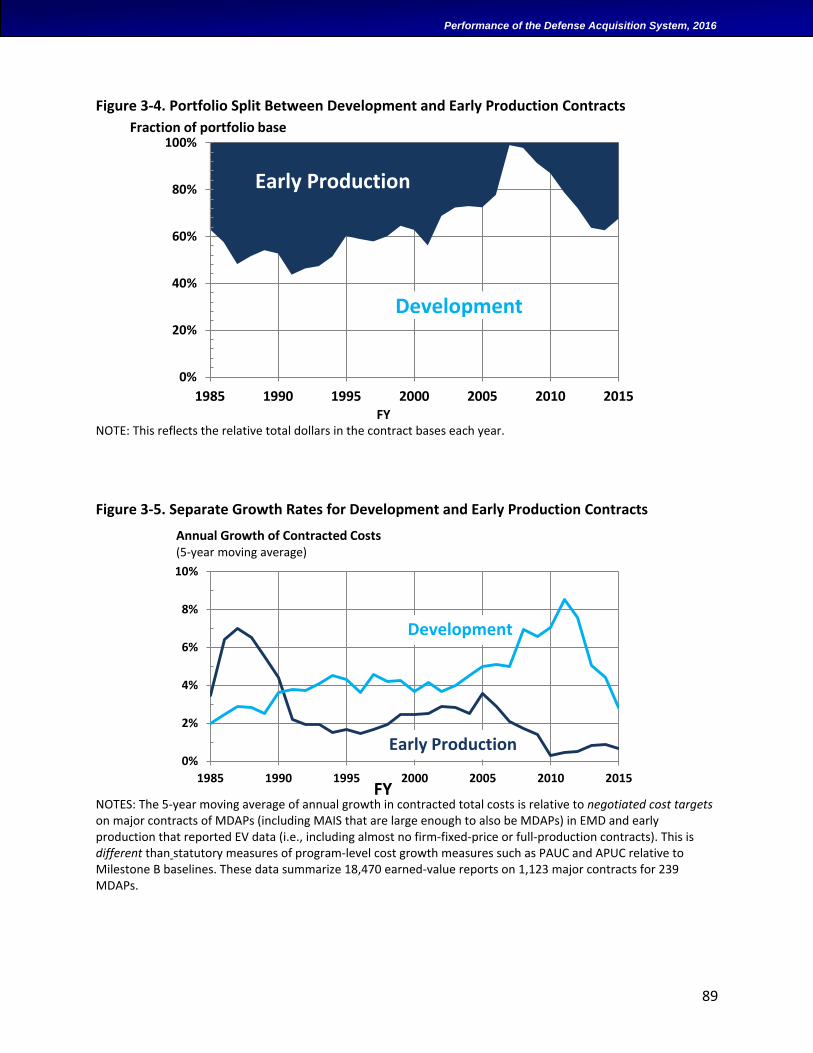
89
Performance of the Defense Acquisition System, 2016
Figure 3-4. Portfolio Split Between Development and Early Production Contracts
NOTE: This reflects the relative total dollars in the contract bases each year.
Figure 3-5. Separate Growth Rates for Development and Early Production Contracts
NOTES: The 5-year moving average of annual growth in contracted total costs is relative to negotiated cost targets on major contracts of MDAPs (including MAIS that are large enough to also be MDAPs) in EMD and early production that reported EV data (i.e., including almost no firm-fixed-price or full-production contracts). This is different than statutory measures of program-level cost growth measures such as PAUC and APUC relative to Milestone B baselines. These data summarize 18,470 earned-value reports on 1,123 major contracts for 239 MDAPs.
0%
20%
40%
60%
80%
100%
1985 1990 1995 2000 2005 2010 2015FY
Development
Early Production
Fraction of portfolio base
0%
2%
4%
6%
8%
10%
1985 1990 1995 2000 2005 2010 2015
Development
Early Production
Annual Growth of Contracted Costs(5-year moving average)
FY
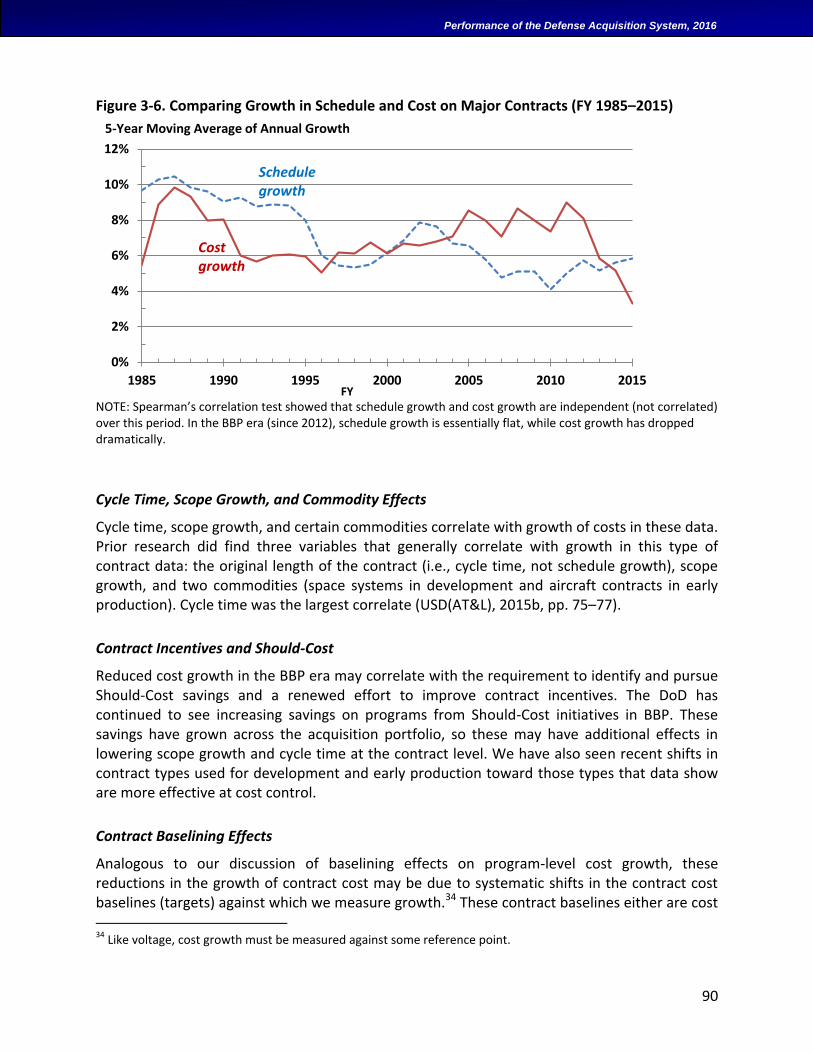
90
Performance of the Defense Acquisition System, 2016
Figure 3-6. Comparing Growth in Schedule and Cost on Major Contracts (FY 1985–2015)
NOTE: Spearman’s correlation test showed that schedule growth and cost growth are independent (not correlated) over this period. In the BBP era (since 2012), schedule growth is essentially flat, while cost growth has dropped dramatically.
Cycle Time, Scope Growth, and Commodity Effects
Cycle time, scope growth, and certain commodities correlate with growth of costs in these data. Prior research did find three variables that generally correlate with growth in this type of contract data: the original length of the contract (i.e., cycle time, not schedule growth), scope growth, and two commodities (space systems in development and aircraft contracts in early production). Cycle time was the largest correlate (USD(AT&L), 2015b, pp. 75–77).
Contract Incentives and Should-Cost
Reduced cost growth in the BBP era may correlate with the requirement to identify and pursue Should-Cost savings and a renewed effort to improve contract incentives. The DoD has continued to see increasing savings on programs from Should-Cost initiatives in BBP. These savings have grown across the acquisition portfolio, so these may have additional effects in lowering scope growth and cycle time at the contract level. We have also seen recent shifts in contract types used for development and early production toward those types that data show are more effective at cost control.
Contract Baselining Effects
Analogous to our discussion of baselining effects on program-level cost growth, these reductions in the growth of contract cost may be due to systematic shifts in the contract cost baselines (targets) against which we measure growth.34 These contract baselines either are cost 34 Like voltage, cost growth must be measured against some reference point.
0%
2%
4%
6%
8%
10%
12%
1985 1990 1995 2000 2005 2010 2015FY
Annual 5-year moving average of schedule growth in executing contracts of majorprograms
Annual 5-year moving average of cost growth in executing contracts of major programs
5-Year Moving Average of Annual Growth
Schedulegrowth
Costgrowth
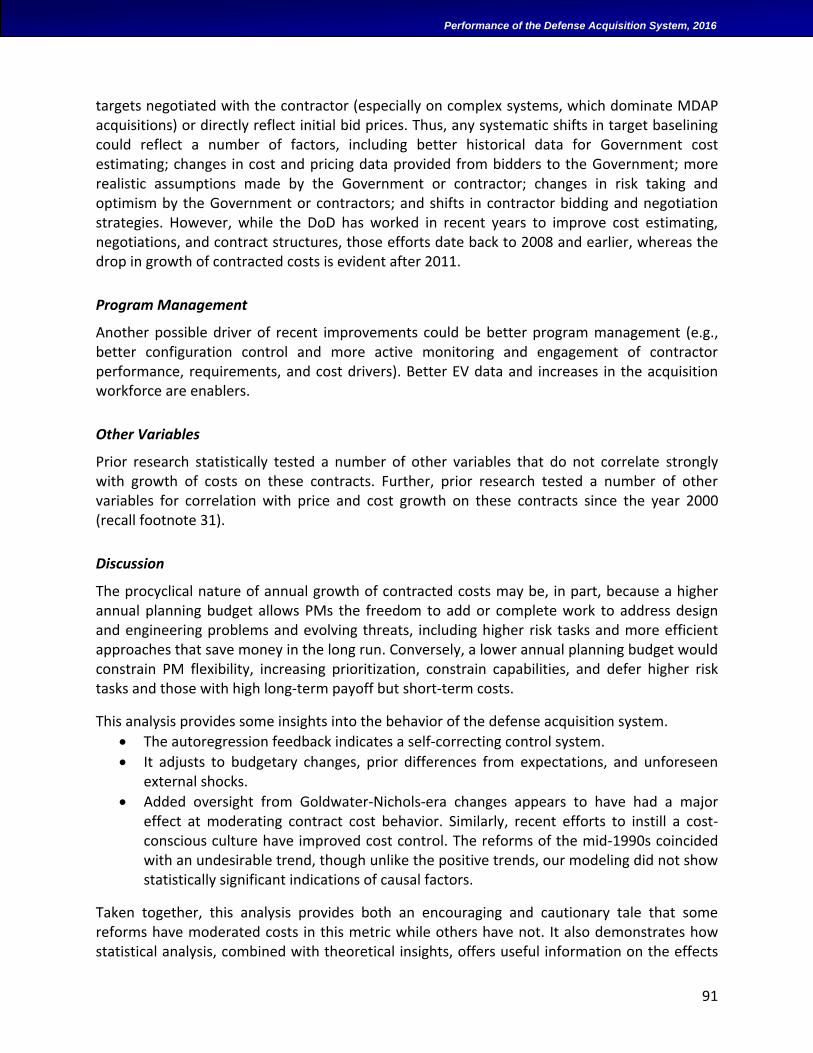
91
Performance of the Defense Acquisition System, 2016
targets negotiated with the contractor (especially on complex systems, which dominate MDAP acquisitions) or directly reflect initial bid prices. Thus, any systematic shifts in target baselining could reflect a number of factors, including better historical data for Government cost estimating; changes in cost and pricing data provided from bidders to the Government; more realistic assumptions made by the Government or contractor; changes in risk taking and optimism by the Government or contractors; and shifts in contractor bidding and negotiation strategies. However, while the DoD has worked in recent years to improve cost estimating, negotiations, and contract structures, those efforts date back to 2008 and earlier, whereas the drop in growth of contracted costs is evident after 2011.
Program Management
Another possible driver of recent improvements could be better program management (e.g., better configuration control and more active monitoring and engagement of contractor performance, requirements, and cost drivers). Better EV data and increases in the acquisition workforce are enablers.
Other Variables
Prior research statistically tested a number of other variables that do not correlate strongly with growth of costs on these contracts. Further, prior research tested a number of other variables for correlation with price and cost growth on these contracts since the year 2000 (recall footnote 31).
Discussion
The procyclical nature of annual growth of contracted costs may be, in part, because a higher annual planning budget allows PMs the freedom to add or complete work to address design and engineering problems and evolving threats, including higher risk tasks and more efficient approaches that save money in the long run. Conversely, a lower annual planning budget would constrain PM flexibility, increasing prioritization, constrain capabilities, and defer higher risk tasks and those with high long-term payoff but short-term costs.
This analysis provides some insights into the behavior of the defense acquisition system.
The autoregression feedback indicates a self-correcting control system.
It adjusts to budgetary changes, prior differences from expectations, and unforeseen external shocks.
Added oversight from Goldwater-Nichols-era changes appears to have had a major effect at moderating contract cost behavior. Similarly, recent efforts to instill a cost-conscious culture have improved cost control. The reforms of the mid-1990s coincided with an undesirable trend, though unlike the positive trends, our modeling did not show statistically significant indications of causal factors.
Taken together, this analysis provides both an encouraging and cautionary tale that some reforms have moderated costs in this metric while others have not. It also demonstrates how statistical analysis, combined with theoretical insights, offers useful information on the effects
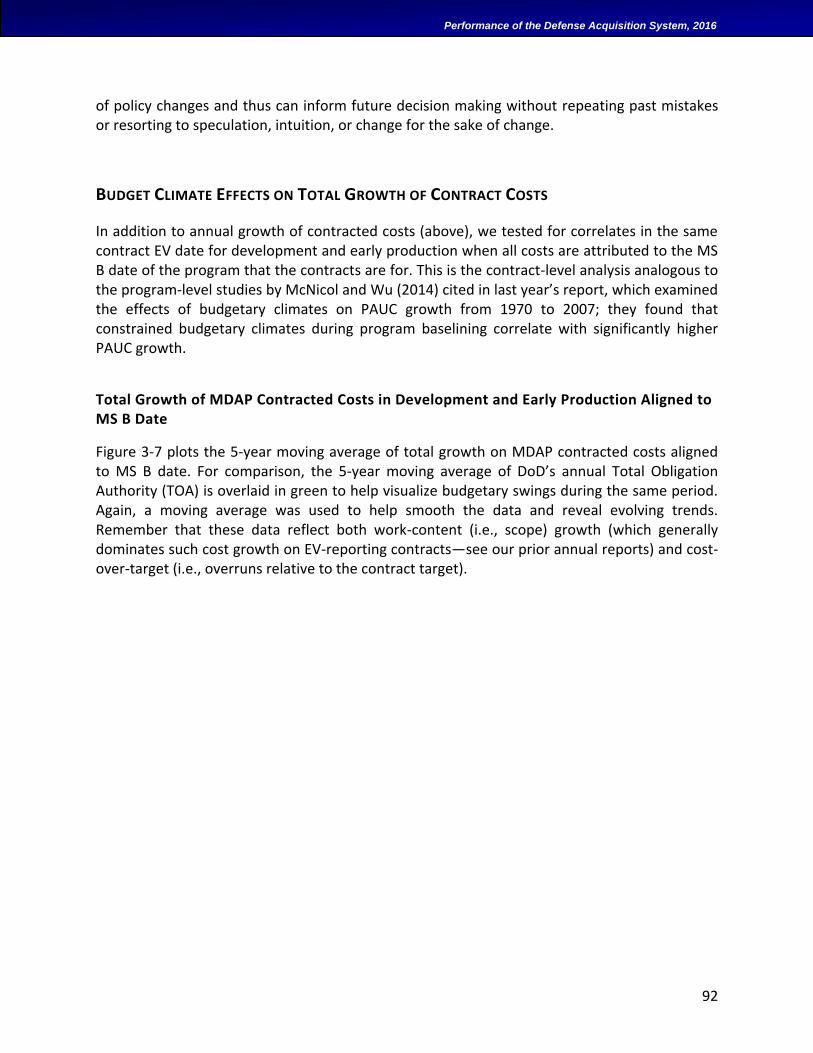
92
Performance of the Defense Acquisition System, 2016
of policy changes and thus can inform future decision making without repeating past mistakes or resorting to speculation, intuition, or change for the sake of change.
BUDGET CLIMATE EFFECTS ON TOTAL GROWTH OF CONTRACT COSTS
In addition to annual growth of contracted costs (above), we tested for correlates in the same contract EV date for development and early production when all costs are attributed to the MS B date of the program that the contracts are for. This is the contract-level analysis analogous to the program-level studies by McNicol and Wu (2014) cited in last year’s report, which examined the effects of budgetary climates on PAUC growth from 1970 to 2007; they found that constrained budgetary climates during program baselining correlate with significantly higher PAUC growth.
Total Growth of MDAP Contracted Costs in Development and Early Production Aligned to MS B Date
Figure 3-7 plots the 5-year moving average of total growth on MDAP contracted costs aligned to MS B date. For comparison, the 5-year moving average of DoD’s annual Total Obligation Authority (TOA) is overlaid in green to help visualize budgetary swings during the same period. Again, a moving average was used to help smooth the data and reveal evolving trends. Remember that these data reflect both work-content (i.e., scope) growth (which generally dominates such cost growth on EV-reporting contracts—see our prior annual reports) and cost-over-target (i.e., overruns relative to the contract target).
93
Performance of the Defense Acquisition System, 2016
Figure 3-7. Five-year Moving Average of Total Growth of Contracted Costs for MDAPs Aligned to Milestone B date (FY 1985–2012)
Cumulative Scope Growth Plus Overruns for MDAP Contracts Reporting EV in Development and Early Production
Aligned with MDAP MS B Date (dollar basis; adjusted for inflation; FY 1985–2012)
NOTES: Total growth of contracted costs is aligned to the original MS B date regardless of contract start dates. DoD TOA is shown in green, and its scale is on the right-hand y-axis in FY 2016 real dollars. The 5-year moving average of total growth in contracted costs is relative to negotiated cost targets on major contracts of MDAPs (including MAIS that are large enough to also be MDAPs) in EMD and early production that reported EV data (i.e., including almost no firm-fixed-price or full-production contracts). This is different than statutory measures of program-level cost growth measures such as PAUC and APUC relative to Milestone B baselines. These data summarize 18,470 earned-value reports on 1,123 major contracts for 239 MDAPs.
Factors Contributing to Total Growth in Contracted Costs at Program MS B Start
To understand what may be driving the trends in Figure 3-7, we tested for statistical correlation of different available variables against the total growth curve. We found that the combined effects of two types of drivers—together with a constant base and random noise—very closely fit the dynamics of the growth curve. 1) Countercyclical budget effect. The total growth in costs aligned to MDAP start is, in part,
countercyclical with the change in the 5-year moving average of the TOA from the prior year.
2) Three self-correcting factors. The data behave as if the system corrects for prior differences between the anticipated growth levels from the countercyclical budget factor and the actual growth (with three different lags of 1, 4, and 5 years) due to “shocks” to the system. In other words, it appears that the system not only responds countercyclically to budgetary changes but also sees and responds to cost growth on programs started in the recent past relative to that countercyclical behavior.
0
100
200
300
400
500
600
700
800
0%
10%
20%
30%
40%
50%
60%
70%
80%
90%
1985 1990 1995 2000 2005 2010 2015
Total growth of contracted costs(5-year moving average)
FY of MS B for Contract's Program
TOA(FY16$,B; 5-year moving average)
TOAcontracted costs
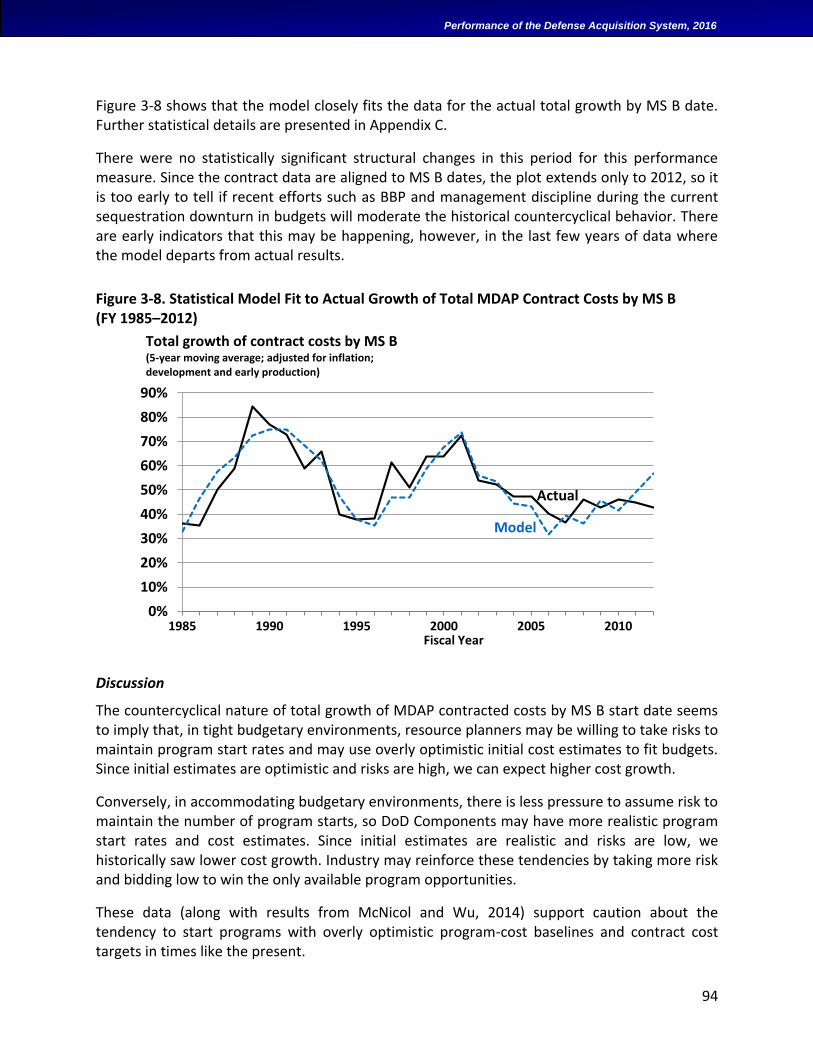
94
Performance of the Defense Acquisition System, 2016
Figure 3-8 shows that the model closely fits the data for the actual total growth by MS B date. Further statistical details are presented in Appendix C.
There were no statistically significant structural changes in this period for this performance measure. Since the contract data are aligned to MS B dates, the plot extends only to 2012, so it is too early to tell if recent efforts such as BBP and management discipline during the current sequestration downturn in budgets will moderate the historical countercyclical behavior. There are early indicators that this may be happening, however, in the last few years of data where the model departs from actual results.
Figure 3-8. Statistical Model Fit to Actual Growth of Total MDAP Contract Costs by MS B (FY 1985–2012)
Discussion
The countercyclical nature of total growth of MDAP contracted costs by MS B start date seems to imply that, in tight budgetary environments, resource planners may be willing to take risks to maintain program start rates and may use overly optimistic initial cost estimates to fit budgets. Since initial estimates are optimistic and risks are high, we can expect higher cost growth.
Conversely, in accommodating budgetary environments, there is less pressure to assume risk to maintain the number of program starts, so DoD Components may have more realistic program start rates and cost estimates. Since initial estimates are realistic and risks are low, we historically saw lower cost growth. Industry may reinforce these tendencies by taking more risk and bidding low to win the only available program opportunities.
These data (along with results from McNicol and Wu, 2014) support caution about the tendency to start programs with overly optimistic program-cost baselines and contract cost targets in times like the present.
0%
10%
20%
30%
40%
50%
60%
70%
80%
90%
1985 1990 1995 2000 2005 2010
Total growth of contract costs by MS B(5-year moving average; adjusted for inflation;development and early production)
Actual
Model
Fiscal Year
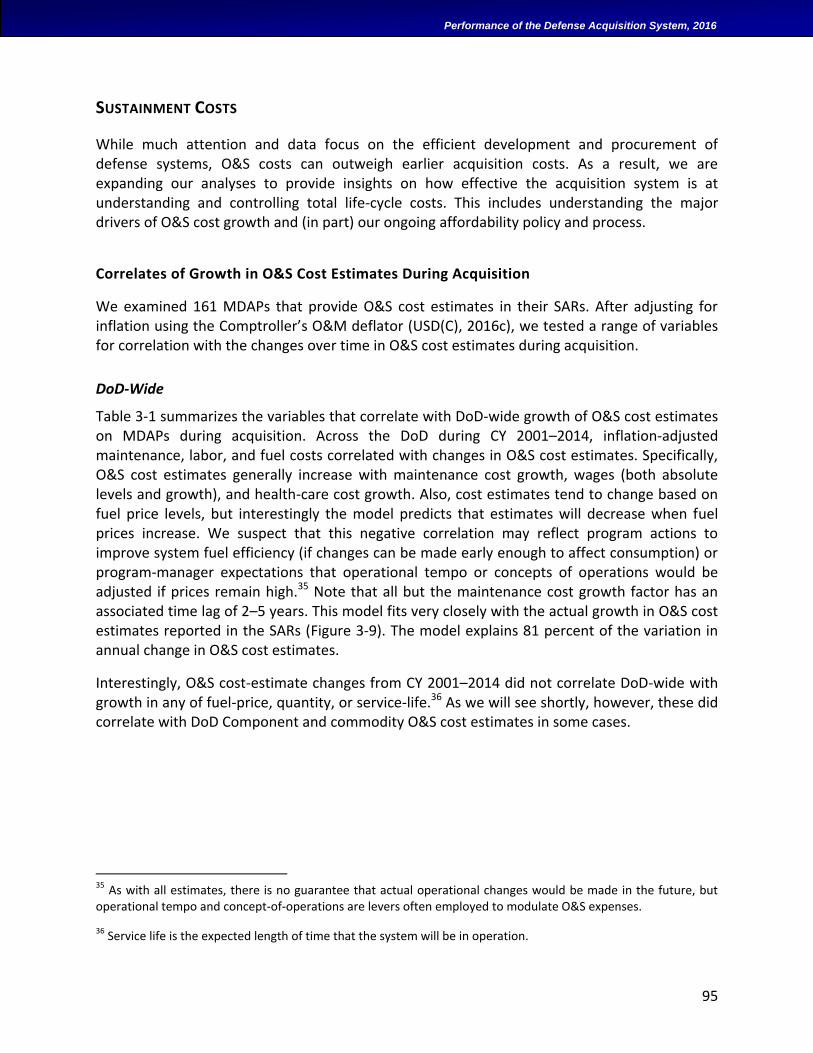
95
Performance of the Defense Acquisition System, 2016
SUSTAINMENT COSTS
While much attention and data focus on the efficient development and procurement of defense systems, O&S costs can outweigh earlier acquisition costs. As a result, we are expanding our analyses to provide insights on how effective the acquisition system is at understanding and controlling total life-cycle costs. This includes understanding the major drivers of O&S cost growth and (in part) our ongoing affordability policy and process.
Correlates of Growth in O&S Cost Estimates During Acquisition
We examined 161 MDAPs that provide O&S cost estimates in their SARs. After adjusting for inflation using the Comptroller’s O&M deflator (USD(C), 2016c), we tested a range of variables for correlation with the changes over time in O&S cost estimates during acquisition.
DoD-Wide
Table 3-1 summarizes the variables that correlate with DoD-wide growth of O&S cost estimates on MDAPs during acquisition. Across the DoD during CY 2001–2014, inflation-adjusted maintenance, labor, and fuel costs correlated with changes in O&S cost estimates. Specifically, O&S cost estimates generally increase with maintenance cost growth, wages (both absolute levels and growth), and health-care cost growth. Also, cost estimates tend to change based on fuel price levels, but interestingly the model predicts that estimates will decrease when fuel prices increase. We suspect that this negative correlation may reflect program actions to improve system fuel efficiency (if changes can be made early enough to affect consumption) or program-manager expectations that operational tempo or concepts of operations would be adjusted if prices remain high.35 Note that all but the maintenance cost growth factor has an associated time lag of 2–5 years. This model fits very closely with the actual growth in O&S cost estimates reported in the SARs (Figure 3-9). The model explains 81 percent of the variation in annual change in O&S cost estimates.
Interestingly, O&S cost-estimate changes from CY 2001–2014 did not correlate DoD-wide with growth in any of fuel-price, quantity, or service-life.36 As we will see shortly, however, these did correlate with DoD Component and commodity O&S cost estimates in some cases.
35 As with all estimates, there is no guarantee that actual operational changes would be made in the future, but operational tempo and concept-of-operations are levers often employed to modulate O&S expenses.
36 Service life is the expected length of time that the system will be in operation.
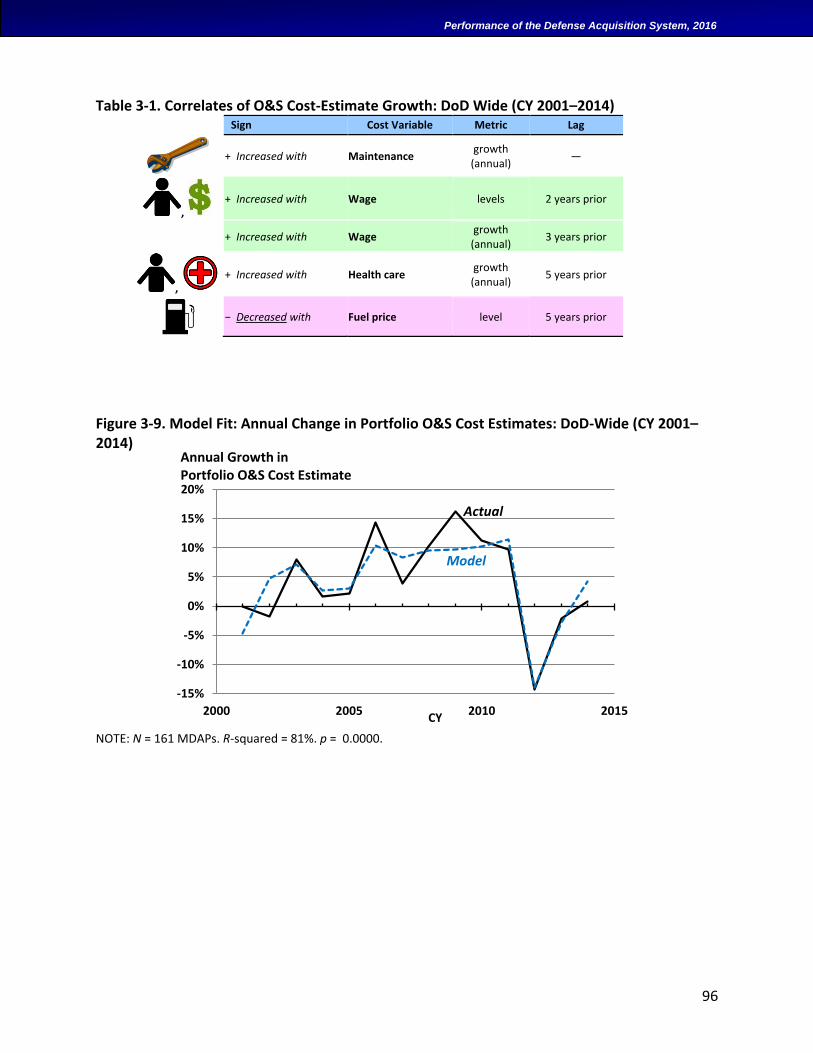
96
Performance of the Defense Acquisition System, 2016
Table 3-1. Correlates of O&S Cost-Estimate Growth: DoD Wide (CY 2001–2014) Sign Cost Variable Metric Lag
+ Increased with Maintenance
growth (annual)
—
, + Increased with Wage levels 2 years prior
+ Increased with Wage
growth (annual)
3 years prior
, + Increased with Health care
growth (annual)
5 years prior
− Decreased with Fuel price level 5 years prior
Figure 3-9. Model Fit: Annual Change in Portfolio O&S Cost Estimates: DoD-Wide (CY 2001–2014)
NOTE: N = 161 MDAPs. R-squared = 81%. p = 0.0000.
-15%
-10%
-5%
0%
5%
10%
15%
20%
2000 2005 2010 2015CY
Actual
Model
Annual Growth in Portfolio O&S Cost Estimate
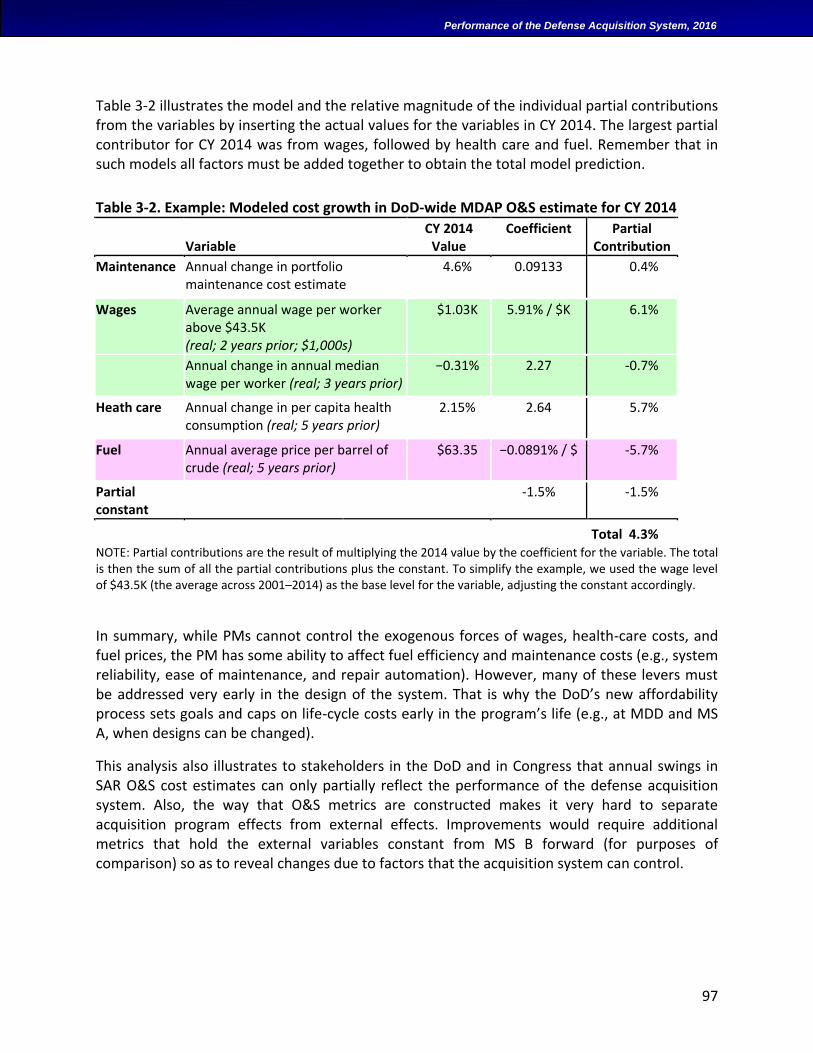
97
Performance of the Defense Acquisition System, 2016
Table 3-2 illustrates the model and the relative magnitude of the individual partial contributions from the variables by inserting the actual values for the variables in CY 2014. The largest partial contributor for CY 2014 was from wages, followed by health care and fuel. Remember that in such models all factors must be added together to obtain the total model prediction.
Table 3-2. Example: Modeled cost growth in DoD-wide MDAP O&S estimate for CY 2014
Variable
CY 2014 Value
Coefficient Partial Contribution
Maintenance Annual change in portfolio maintenance cost estimate
4.6% 0.09133 0.4%
Wages Average annual wage per worker above $43.5K (real; 2 years prior; $1,000s)
$1.03K 5.91% / $K 6.1%
Annual change in annual median wage per worker (real; 3 years prior)
−0.31% 2.27 -0.7%
Heath care Annual change in per capita health consumption (real; 5 years prior)
2.15% 2.64 5.7%
Fuel Annual average price per barrel of crude (real; 5 years prior)
$63.35 −0.0891% / $ -5.7%
Partial constant
-1.5% -1.5%
Total 4.3%
NOTE: Partial contributions are the result of multiplying the 2014 value by the coefficient for the variable. The total is then the sum of all the partial contributions plus the constant. To simplify the example, we used the wage level of $43.5K (the average across 2001–2014) as the base level for the variable, adjusting the constant accordingly.
In summary, while PMs cannot control the exogenous forces of wages, health-care costs, and fuel prices, the PM has some ability to affect fuel efficiency and maintenance costs (e.g., system reliability, ease of maintenance, and repair automation). However, many of these levers must be addressed very early in the design of the system. That is why the DoD’s new affordability process sets goals and caps on life-cycle costs early in the program’s life (e.g., at MDD and MS A, when designs can be changed).
This analysis also illustrates to stakeholders in the DoD and in Congress that annual swings in SAR O&S cost estimates can only partially reflect the performance of the defense acquisition system. Also, the way that O&S metrics are constructed makes it very hard to separate acquisition program effects from external effects. Improvements would require additional metrics that hold the external variables constant from MS B forward (for purposes of comparison) so as to reveal changes due to factors that the acquisition system can control.
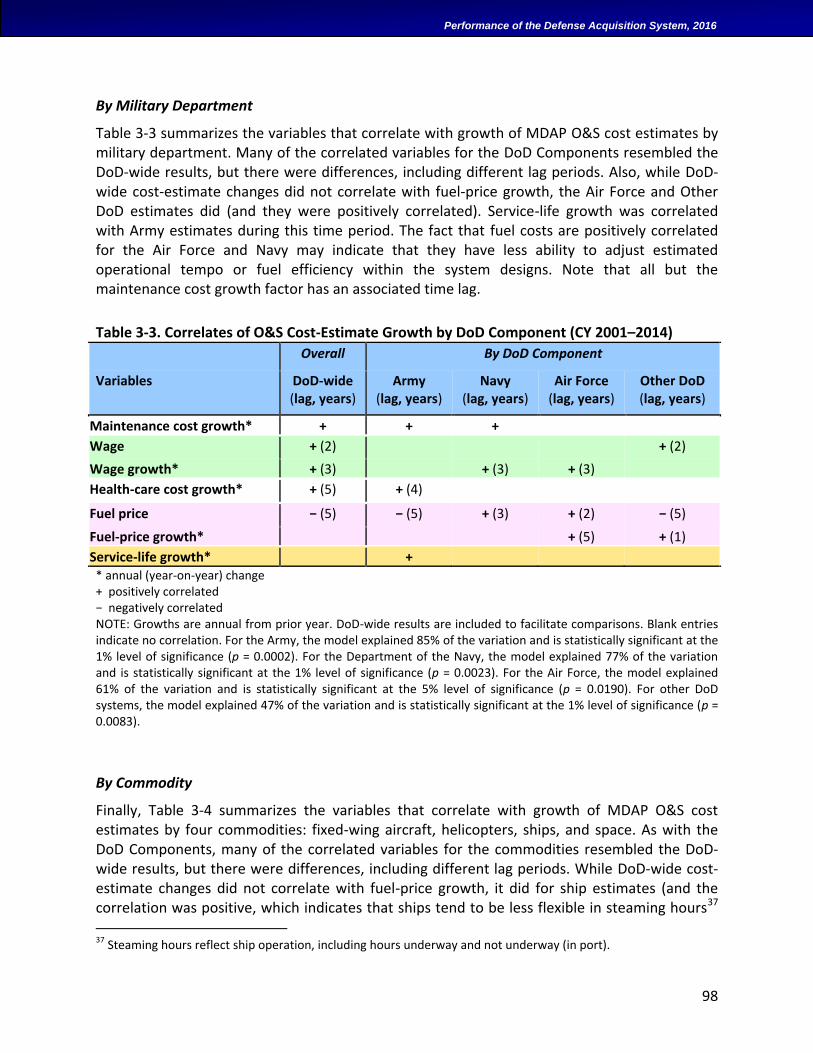
98
Performance of the Defense Acquisition System, 2016
By Military Department
Table 3-3 summarizes the variables that correlate with growth of MDAP O&S cost estimates by military department. Many of the correlated variables for the DoD Components resembled the DoD-wide results, but there were differences, including different lag periods. Also, while DoD-wide cost-estimate changes did not correlate with fuel-price growth, the Air Force and Other DoD estimates did (and they were positively correlated). Service-life growth was correlated with Army estimates during this time period. The fact that fuel costs are positively correlated for the Air Force and Navy may indicate that they have less ability to adjust estimated operational tempo or fuel efficiency within the system designs. Note that all but the maintenance cost growth factor has an associated time lag.
Table 3-3. Correlates of O&S Cost-Estimate Growth by DoD Component (CY 2001–2014)
Overall By DoD Component
Variables DoD-wide (lag, years)
Army (lag, years)
Navy (lag, years)
Air Force (lag, years)
Other DoD (lag, years)
Maintenance cost growth* + + +
Wage + (2) + (2)
Wage growth* + (3) + (3) + (3)
Health-care cost growth* + (5) + (4)
Fuel price − (5) − (5) + (3) + (2) − (5)
Fuel-price growth* + (5) + (1)
Service-life growth*
+
* annual (year-on-year) change + positively correlated − negatively correlated NOTE: Growths are annual from prior year. DoD-wide results are included to facilitate comparisons. Blank entries indicate no correlation. For the Army, the model explained 85% of the variation and is statistically significant at the 1% level of significance (p = 0.0002). For the Department of the Navy, the model explained 77% of the variation and is statistically significant at the 1% level of significance (p = 0.0023). For the Air Force, the model explained 61% of the variation and is statistically significant at the 5% level of significance (p = 0.0190). For other DoD systems, the model explained 47% of the variation and is statistically significant at the 1% level of significance (p = 0.0083).
By Commodity
Finally, Table 3-4 summarizes the variables that correlate with growth of MDAP O&S cost estimates by four commodities: fixed-wing aircraft, helicopters, ships, and space. As with the DoD Components, many of the correlated variables for the commodities resembled the DoD-wide results, but there were differences, including different lag periods. While DoD-wide cost-estimate changes did not correlate with fuel-price growth, it did for ship estimates (and the correlation was positive, which indicates that ships tend to be less flexible in steaming hours37 37 Steaming hours reflect ship operation, including hours underway and not underway (in port).
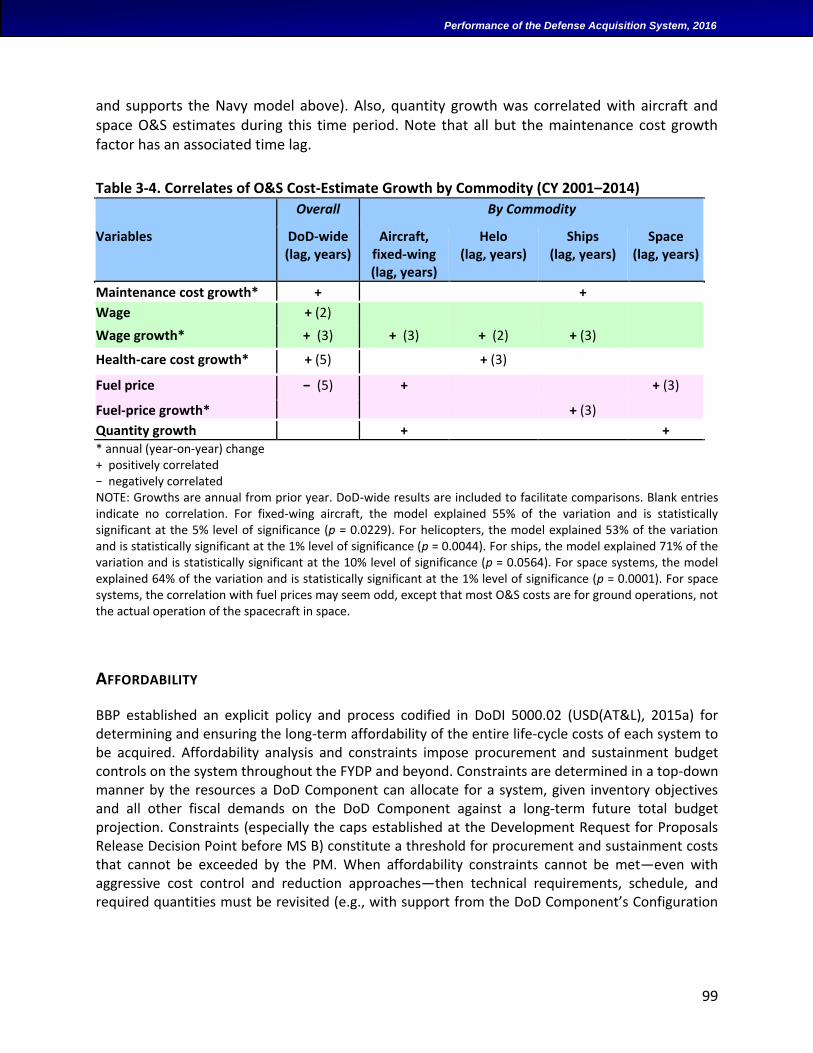
99
Performance of the Defense Acquisition System, 2016
and supports the Navy model above). Also, quantity growth was correlated with aircraft and space O&S estimates during this time period. Note that all but the maintenance cost growth factor has an associated time lag.
Table 3-4. Correlates of O&S Cost-Estimate Growth by Commodity (CY 2001–2014)
Overall By Commodity
Variables DoD-wide (lag, years)
Aircraft, fixed-wing (lag, years)
Helo (lag, years)
Ships (lag, years)
Space (lag, years)
Maintenance cost growth* +
+
Wage + (2)
Wage growth* + (3) + (3) + (2) + (3)
Health-care cost growth* + (5) + (3)
Fuel price − (5) + + (3)
Fuel-price growth* + (3)
Quantity growth + + * annual (year-on-year) change + positively correlated − negatively correlated NOTE: Growths are annual from prior year. DoD-wide results are included to facilitate comparisons. Blank entries indicate no correlation. For fixed-wing aircraft, the model explained 55% of the variation and is statistically significant at the 5% level of significance (p = 0.0229). For helicopters, the model explained 53% of the variation and is statistically significant at the 1% level of significance (p = 0.0044). For ships, the model explained 71% of the variation and is statistically significant at the 10% level of significance (p = 0.0564). For space systems, the model explained 64% of the variation and is statistically significant at the 1% level of significance (p = 0.0001). For space systems, the correlation with fuel prices may seem odd, except that most O&S costs are for ground operations, not the actual operation of the spacecraft in space.
AFFORDABILITY
BBP established an explicit policy and process codified in DoDI 5000.02 (USD(AT&L), 2015a) for determining and ensuring the long-term affordability of the entire life-cycle costs of each system to be acquired. Affordability analysis and constraints impose procurement and sustainment budget controls on the system throughout the FYDP and beyond. Constraints are determined in a top-down manner by the resources a DoD Component can allocate for a system, given inventory objectives and all other fiscal demands on the DoD Component against a long-term future total budget projection. Constraints (especially the caps established at the Development Request for Proposals Release Decision Point before MS B) constitute a threshold for procurement and sustainment costs that cannot be exceeded by the PM. When affordability constraints cannot be met—even with aggressive cost control and reduction approaches—then technical requirements, schedule, and required quantities must be revisited (e.g., with support from the DoD Component’s Configuration
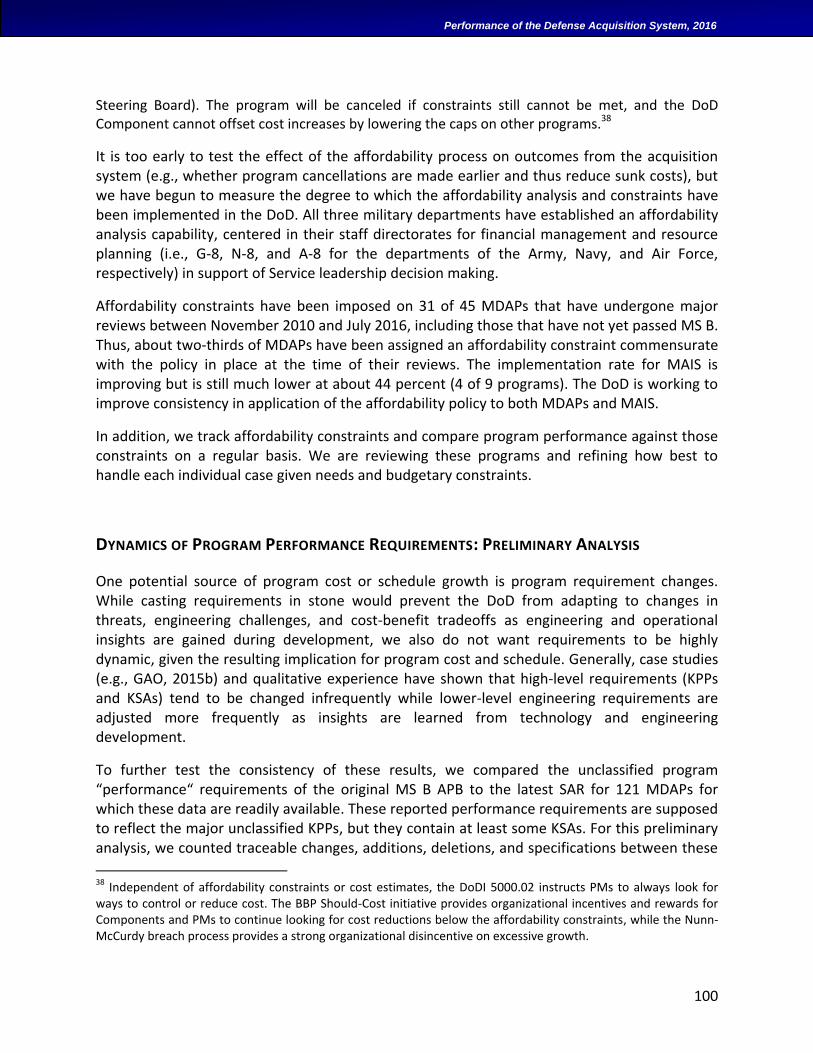
100
Performance of the Defense Acquisition System, 2016
Steering Board). The program will be canceled if constraints still cannot be met, and the DoD Component cannot offset cost increases by lowering the caps on other programs.38
It is too early to test the effect of the affordability process on outcomes from the acquisition system (e.g., whether program cancellations are made earlier and thus reduce sunk costs), but we have begun to measure the degree to which the affordability analysis and constraints have been implemented in the DoD. All three military departments have established an affordability analysis capability, centered in their staff directorates for financial management and resource planning (i.e., G-8, N-8, and A-8 for the departments of the Army, Navy, and Air Force, respectively) in support of Service leadership decision making.
Affordability constraints have been imposed on 31 of 45 MDAPs that have undergone major reviews between November 2010 and July 2016, including those that have not yet passed MS B. Thus, about two-thirds of MDAPs have been assigned an affordability constraint commensurate with the policy in place at the time of their reviews. The implementation rate for MAIS is improving but is still much lower at about 44 percent (4 of 9 programs). The DoD is working to improve consistency in application of the affordability policy to both MDAPs and MAIS.
In addition, we track affordability constraints and compare program performance against those constraints on a regular basis. We are reviewing these programs and refining how best to handle each individual case given needs and budgetary constraints.
DYNAMICS OF PROGRAM PERFORMANCE REQUIREMENTS: PRELIMINARY ANALYSIS
One potential source of program cost or schedule growth is program requirement changes. While casting requirements in stone would prevent the DoD from adapting to changes in threats, engineering challenges, and cost-benefit tradeoffs as engineering and operational insights are gained during development, we also do not want requirements to be highly dynamic, given the resulting implication for program cost and schedule. Generally, case studies (e.g., GAO, 2015b) and qualitative experience have shown that high-level requirements (KPPs and KSAs) tend to be changed infrequently while lower-level engineering requirements are adjusted more frequently as insights are learned from technology and engineering development.
To further test the consistency of these results, we compared the unclassified program “performance“ requirements of the original MS B APB to the latest SAR for 121 MDAPs for which these data are readily available. These reported performance requirements are supposed to reflect the major unclassified KPPs, but they contain at least some KSAs. For this preliminary analysis, we counted traceable changes, additions, deletions, and specifications between these
38 Independent of affordability constraints or cost estimates, the DoDI 5000.02 instructs PMs to always look for ways to control or reduce cost. The BBP Should-Cost initiative provides organizational incentives and rewards for Components and PMs to continue looking for cost reductions below the affordability constraints, while the Nunn-McCurdy breach process provides a strong organizational disincentive on excessive growth.
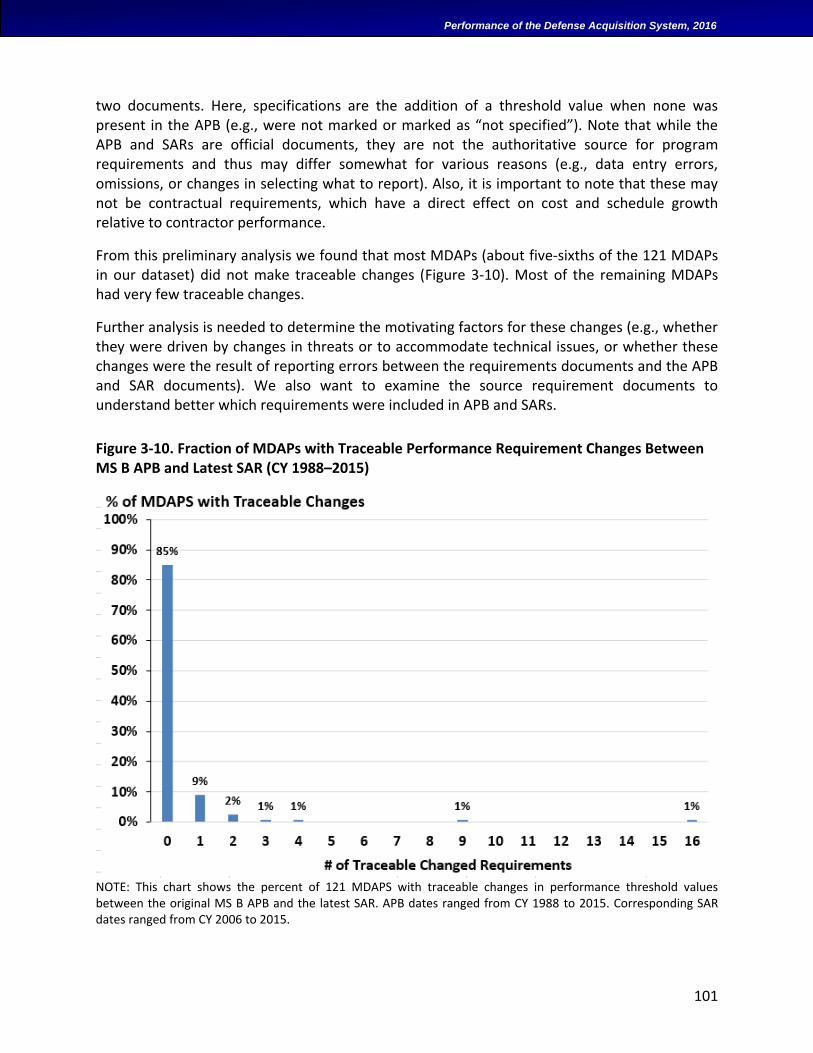
101
Performance of the Defense Acquisition System, 2016
two documents. Here, specifications are the addition of a threshold value when none was present in the APB (e.g., were not marked or marked as “not specified”). Note that while the APB and SARs are official documents, they are not the authoritative source for program requirements and thus may differ somewhat for various reasons (e.g., data entry errors, omissions, or changes in selecting what to report). Also, it is important to note that these may not be contractual requirements, which have a direct effect on cost and schedule growth relative to contractor performance.
From this preliminary analysis we found that most MDAPs (about five-sixths of the 121 MDAPs in our dataset) did not make traceable changes (Figure 3-10). Most of the remaining MDAPs had very few traceable changes.
Further analysis is needed to determine the motivating factors for these changes (e.g., whether they were driven by changes in threats or to accommodate technical issues, or whether these changes were the result of reporting errors between the requirements documents and the APB and SAR documents). We also want to examine the source requirement documents to understand better which requirements were included in APB and SARs.
Figure 3-10. Fraction of MDAPs with Traceable Performance Requirement Changes Between MS B APB and Latest SAR (CY 1988–2015)
NOTE: This chart shows the percent of 121 MDAPS with traceable changes in performance threshold values between the original MS B APB and the latest SAR. APB dates ranged from CY 1988 to 2015. Corresponding SAR dates ranged from CY 2006 to 2015.
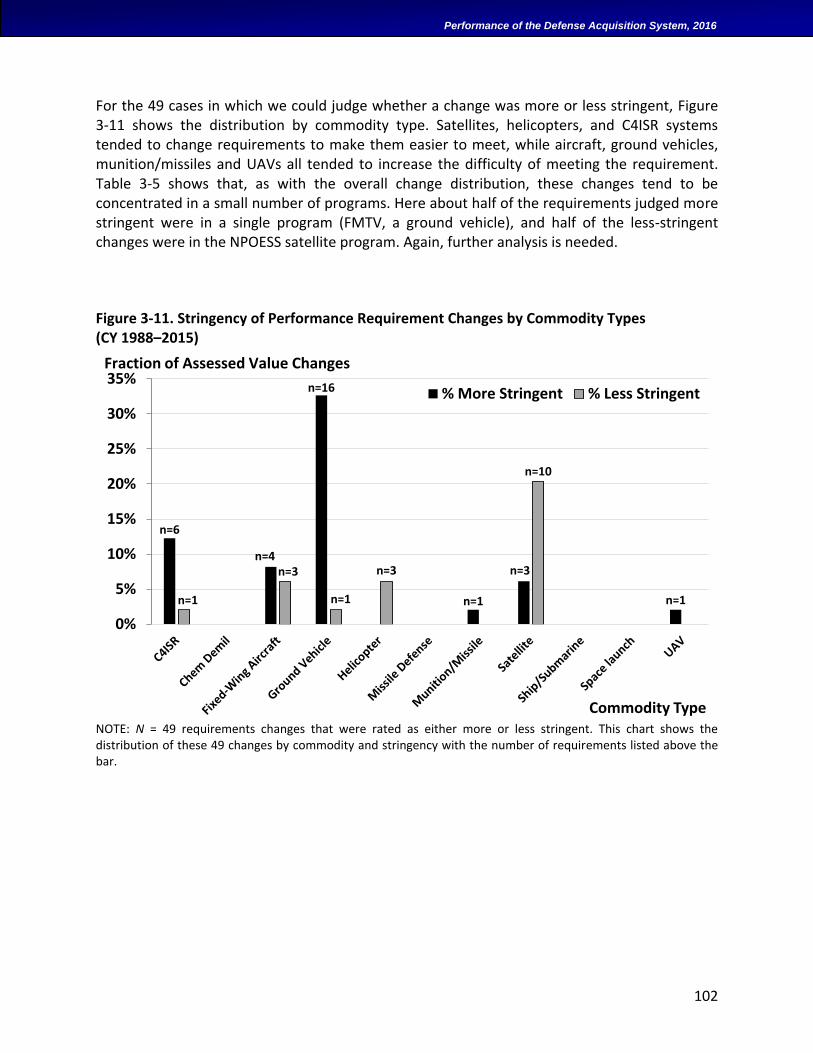
102
Performance of the Defense Acquisition System, 2016
For the 49 cases in which we could judge whether a change was more or less stringent, Figure 3-11 shows the distribution by commodity type. Satellites, helicopters, and C4ISR systems tended to change requirements to make them easier to meet, while aircraft, ground vehicles, munition/missiles and UAVs all tended to increase the difficulty of meeting the requirement. Table 3-5 shows that, as with the overall change distribution, these changes tend to be concentrated in a small number of programs. Here about half of the requirements judged more stringent were in a single program (FMTV, a ground vehicle), and half of the less-stringent changes were in the NPOESS satellite program. Again, further analysis is needed.
Figure 3-11. Stringency of Performance Requirement Changes by Commodity Types (CY 1988–2015)
NOTE: N = 49 requirements changes that were rated as either more or less stringent. This chart shows the distribution of these 49 changes by commodity and stringency with the number of requirements listed above the bar.
n=6
n=4
n=16
n=1
n=3
n=1n=1
n=3
n=1
n=3
n=10
0%
5%
10%
15%
20%
25%
30%
35%
Commodity Type
Assessed Requirement Value Changes by Commodity
% More Stringent % Less Stringent
Fraction of Assessed Value Changes
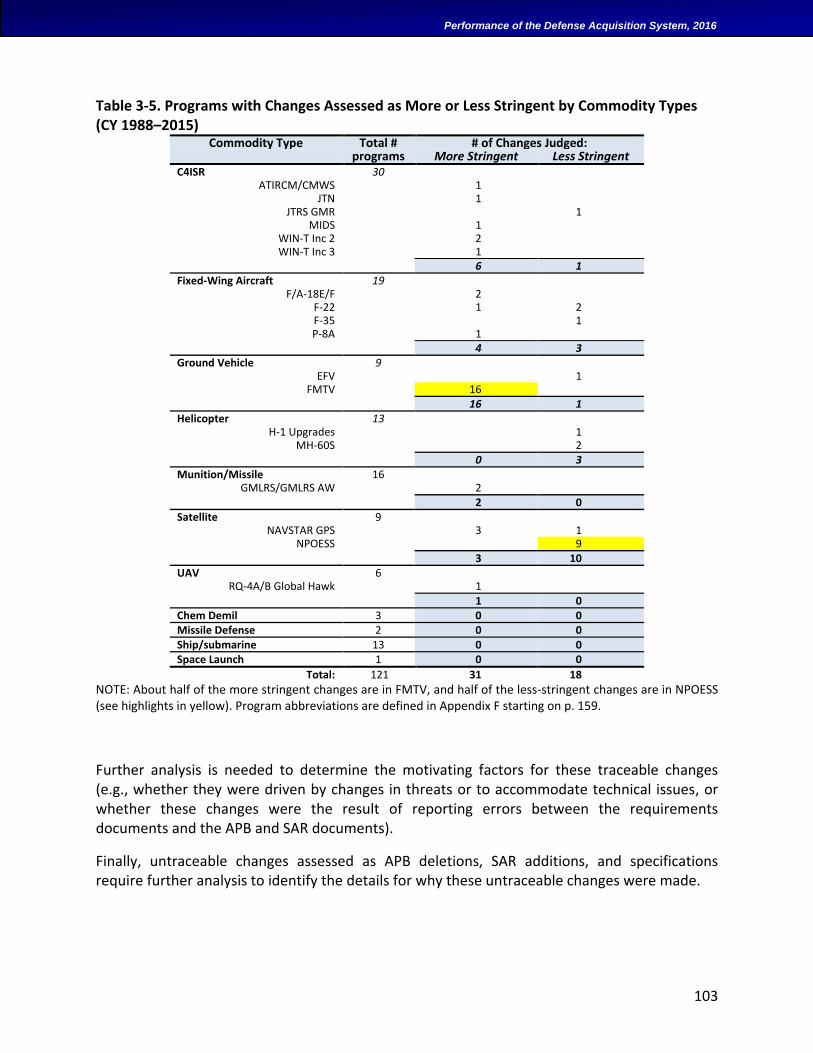
103
Performance of the Defense Acquisition System, 2016
Table 3-5. Programs with Changes Assessed as More or Less Stringent by Commodity Types (CY 1988–2015)
Commodity Type Total # # of Changes Judged:
programs More Stringent Less Stringent
C4ISR 30
ATIRCM/CMWS 1
JTN 1
JTRS GMR
1 MIDS 1
WIN-T Inc 2 2
WIN-T Inc 3 1
6 1
Fixed-Wing Aircraft 19
F/A-18E/F 2
F-22 1 2 F-35
1
P-8A 1
4 3 Ground Vehicle 9
EFV
1 FMTV 16
16 1
Helicopter 13 H-1 Upgrades
1
MH-60S
2 0 3
Munition/Missile 16 GMLRS/GMLRS AW 2
2 0
Satellite 9 NAVSTAR GPS 3 1
NPOESS
9 3 10
UAV 6 RQ-4A/B Global Hawk 1
1 0
Chem Demil 3 0 0 Missile Defense 2 0 0 Ship/submarine 13 0 0 Space Launch 1 0 0
Total: 121 31 18
NOTE: About half of the more stringent changes are in FMTV, and half of the less-stringent changes are in NPOESS (see highlights in yellow). Program abbreviations are defined in Appendix F starting on p. 159.
Further analysis is needed to determine the motivating factors for these traceable changes (e.g., whether they were driven by changes in threats or to accommodate technical issues, or whether these changes were the result of reporting errors between the requirements documents and the APB and SAR documents).
Finally, untraceable changes assessed as APB deletions, SAR additions, and specifications require further analysis to identify the details for why these untraceable changes were made.
104
Performance of the Defense Acquisition System, 2016
QUANTITY PROCURED
Another useful measure of acquisition performance is the quantity of major weapon systems procured compared to the number planned at the original MS B. An oft-quoted saying by military strategists is that quantity has a quality all its own,39 so it is useful to see how often the defense acquisition system ends up procuring the originally planned number of major weapon systems.
Despite reductions in quantity on some high-visibility programs (e.g., DDG-1000 and F-22), most programs deliver nearly the original quantity or more. Figure 3-12 shows the actual number of units procured by completed MDAPs that passed MS B over the past 19 years. Over 80 percent of programs delivered at least 80 percent of their originally planned units, and just over 40 percent of programs delivered more than originally planned.
This general pattern appears to be holding for currently active programs. Figure 3-13 shows the estimated final quantity distribution for active MDAPs along with the final quantity distribution for completed MDAPs. Again, most active programs estimate they will deliver at least 80% of their originally baselined quantities.
39 The original source of this quote is difficult to verify.
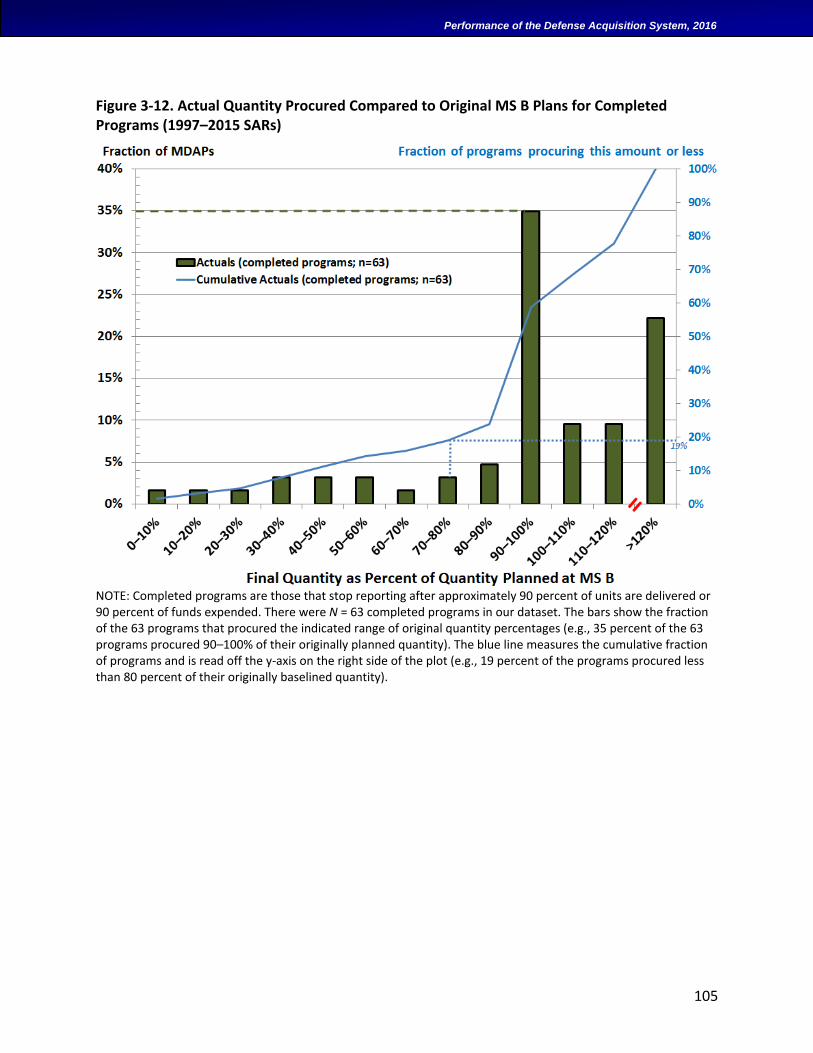
105
Performance of the Defense Acquisition System, 2016
Figure 3-12. Actual Quantity Procured Compared to Original MS B Plans for Completed Programs (1997–2015 SARs)
NOTE: Completed programs are those that stop reporting after approximately 90 percent of units are delivered or 90 percent of funds expended. There were N = 63 completed programs in our dataset. The bars show the fraction of the 63 programs that procured the indicated range of original quantity percentages (e.g., 35 percent of the 63 programs procured 90–100% of their originally planned quantity). The blue line measures the cumulative fraction of programs and is read off the y-axis on the right side of the plot (e.g., 19 percent of the programs procured less than 80 percent of their originally baselined quantity).
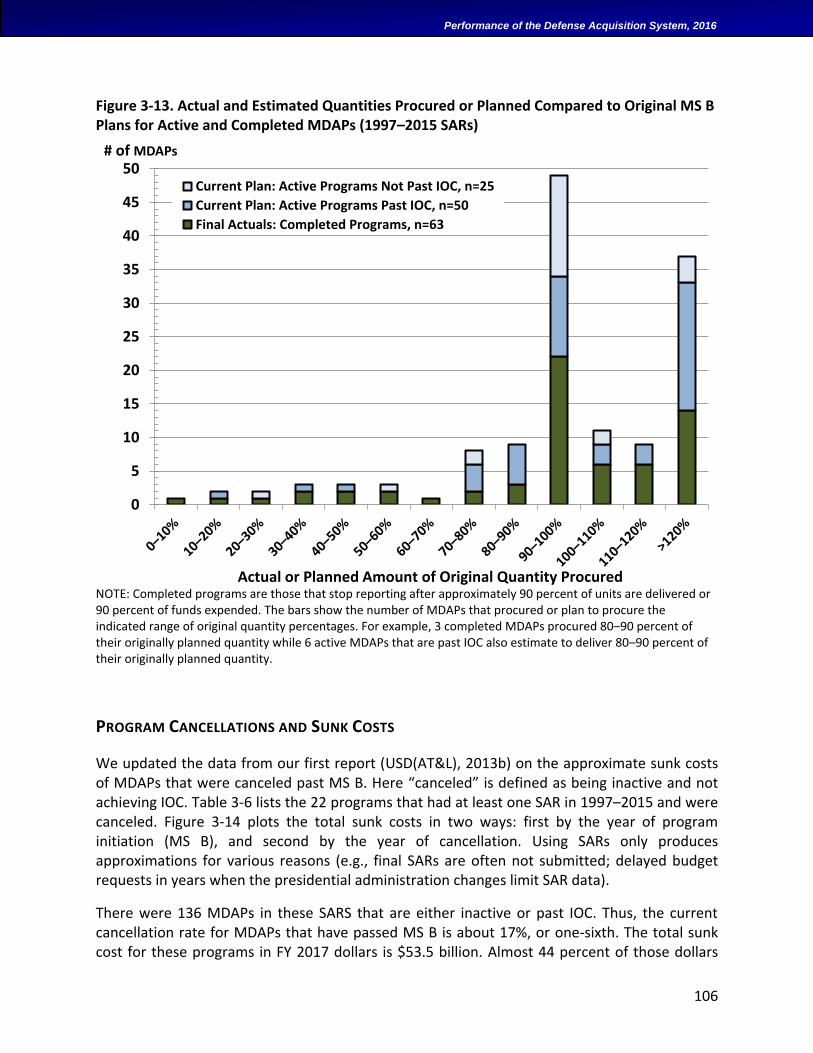
106
Performance of the Defense Acquisition System, 2016
Figure 3-13. Actual and Estimated Quantities Procured or Planned Compared to Original MS B Plans for Active and Completed MDAPs (1997–2015 SARs)
NOTE: Completed programs are those that stop reporting after approximately 90 percent of units are delivered or 90 percent of funds expended. The bars show the number of MDAPs that procured or plan to procure the indicated range of original quantity percentages. For example, 3 completed MDAPs procured 80–90 percent of their originally planned quantity while 6 active MDAPs that are past IOC also estimate to deliver 80–90 percent of their originally planned quantity.
PROGRAM CANCELLATIONS AND SUNK COSTS
We updated the data from our first report (USD(AT&L), 2013b) on the approximate sunk costs of MDAPs that were canceled past MS B. Here “canceled” is defined as being inactive and not achieving IOC. Table 3-6 lists the 22 programs that had at least one SAR in 1997–2015 and were canceled. Figure 3-14 plots the total sunk costs in two ways: first by the year of program initiation (MS B), and second by the year of cancellation. Using SARs only produces approximations for various reasons (e.g., final SARs are often not submitted; delayed budget requests in years when the presidential administration changes limit SAR data).
There were 136 MDAPs in these SARS that are either inactive or past IOC. Thus, the current cancellation rate for MDAPs that have passed MS B is about 17%, or one-sixth. The total sunk cost for these programs in FY 2017 dollars is $53.5 billion. Almost 44 percent of those dollars
0
5
10
15
20
25
30
35
40
45
50Current Plan: Active Programs Not Past IOC, n=25
Current Plan: Active Programs Past IOC, n=50
Final Actuals: Completed Programs, n=63
# of MDAPs
Actual or Planned Amount of Original Quantity Procured
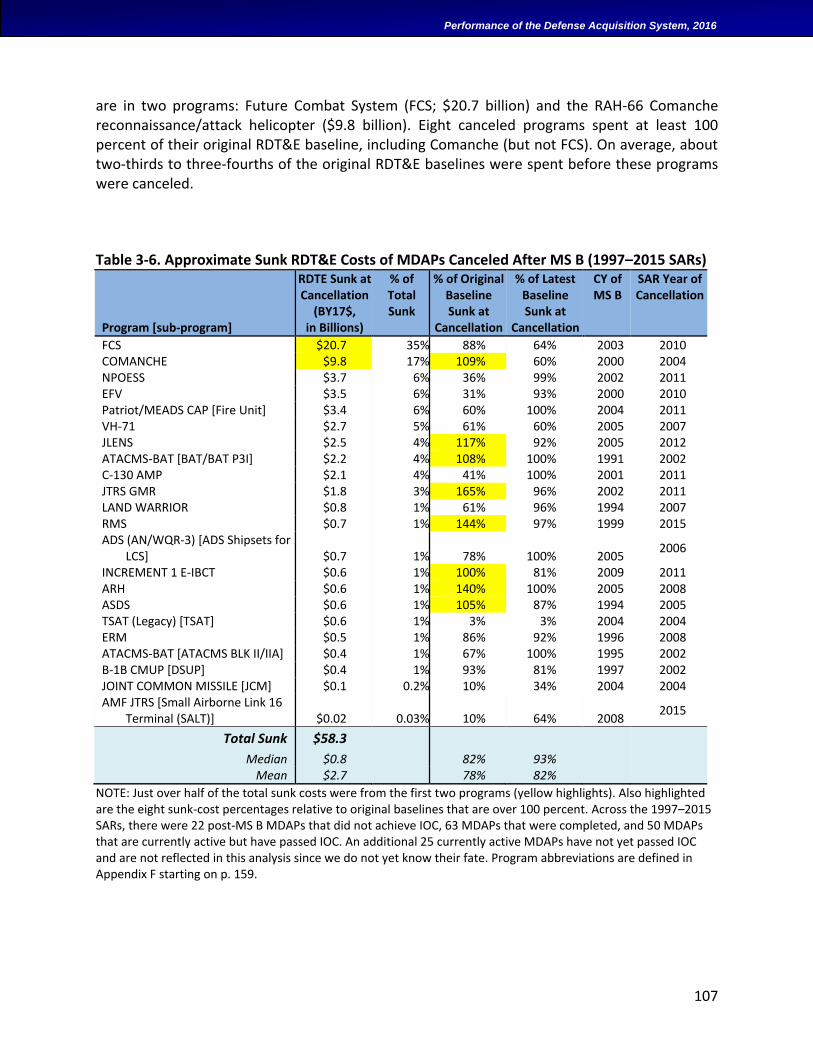
107
Performance of the Defense Acquisition System, 2016
are in two programs: Future Combat System (FCS; $20.7 billion) and the RAH-66 Comanche reconnaissance/attack helicopter ($9.8 billion). Eight canceled programs spent at least 100 percent of their original RDT&E baseline, including Comanche (but not FCS). On average, about two-thirds to three-fourths of the original RDT&E baselines were spent before these programs were canceled.
Table 3-6. Approximate Sunk RDT&E Costs of MDAPs Canceled After MS B (1997–2015 SARs)
Program [sub-program]
RDTE Sunk at Cancellation
(BY17$, in Billions)
% of Total Sunk
% of Original Baseline Sunk at
Cancellation
% of Latest Baseline Sunk at
Cancellation
CY of MS B
SAR Year of Cancellation
FCS $20.7 35% 88% 64% 2003 2010 COMANCHE $9.8 17% 109% 60% 2000 2004 NPOESS $3.7 6% 36% 99% 2002 2011 EFV $3.5 6% 31% 93% 2000 2010 Patriot/MEADS CAP [Fire Unit] $3.4 6% 60% 100% 2004 2011 VH-71 $2.7 5% 61% 60% 2005 2007 JLENS $2.5 4% 117% 92% 2005 2012 ATACMS-BAT [BAT/BAT P3I] $2.2 4% 108% 100% 1991 2002 C-130 AMP $2.1 4% 41% 100% 2001 2011 JTRS GMR $1.8 3% 165% 96% 2002 2011 LAND WARRIOR $0.8 1% 61% 96% 1994 2007 RMS $0.7 1% 144% 97% 1999 2015 ADS (AN/WQR-3) [ADS Shipsets for
LCS] $0.7 1% 78% 100% 2005 2006
INCREMENT 1 E-IBCT $0.6 1% 100% 81% 2009 2011 ARH $0.6 1% 140% 100% 2005 2008 ASDS $0.6 1% 105% 87% 1994 2005 TSAT (Legacy) [TSAT] $0.6 1% 3% 3% 2004 2004 ERM $0.5 1% 86% 92% 1996 2008 ATACMS-BAT [ATACMS BLK II/IIA] $0.4 1% 67% 100% 1995 2002 B-1B CMUP [DSUP] $0.4 1% 93% 81% 1997 2002 JOINT COMMON MISSILE [JCM] $0.1 0.2% 10% 34% 2004 2004 AMF JTRS [Small Airborne Link 16
Terminal (SALT)] $0.02 0.03% 10% 64% 2008 2015
Total Sunk $58.3
Median $0.8 82% 93% Mean $2.7 78% 82%
NOTE: Just over half of the total sunk costs were from the first two programs (yellow highlights). Also highlighted are the eight sunk-cost percentages relative to original baselines that are over 100 percent. Across the 1997–2015 SARs, there were 22 post-MS B MDAPs that did not achieve IOC, 63 MDAPs that were completed, and 50 MDAPs that are currently active but have passed IOC. An additional 25 currently active MDAPs have not yet passed IOC and are not reflected in this analysis since we do not yet know their fate. Program abbreviations are defined in Appendix F starting on p. 159.
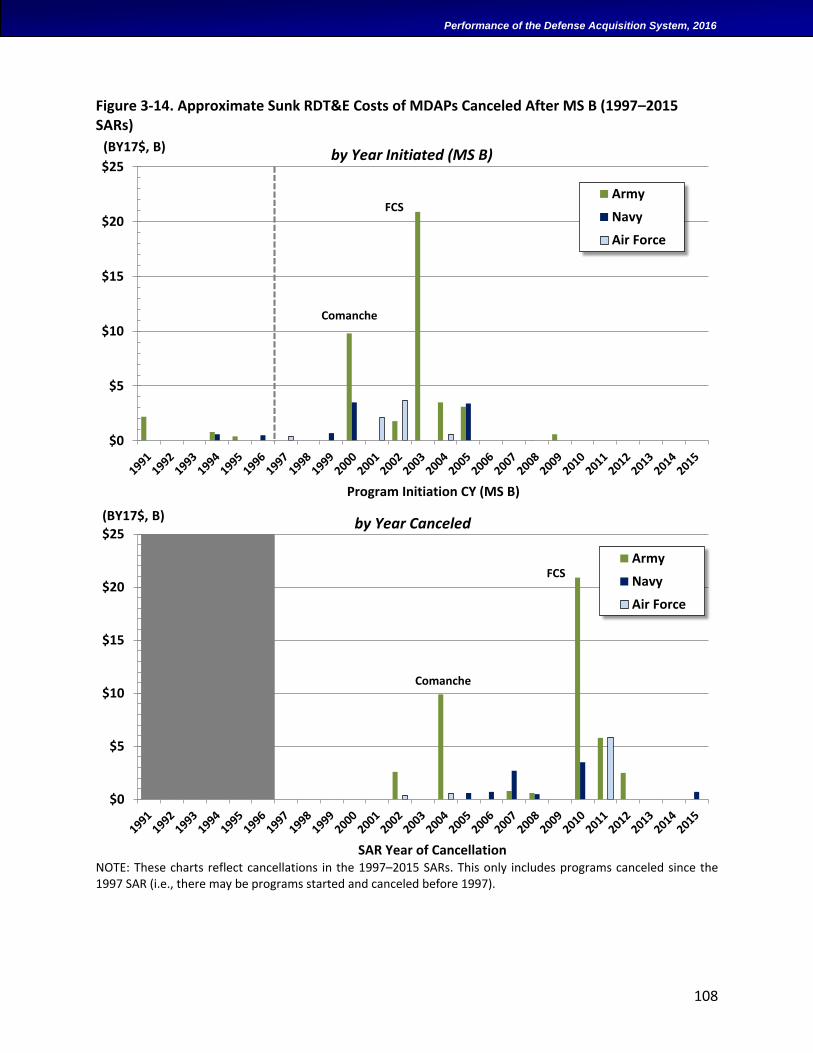
108
Performance of the Defense Acquisition System, 2016
Figure 3-14. Approximate Sunk RDT&E Costs of MDAPs Canceled After MS B (1997–2015 SARs)
NOTE: These charts reflect cancellations in the 1997–2015 SARs. This only includes programs canceled since the 1997 SAR (i.e., there may be programs started and canceled before 1997).
$0
$5
$10
$15
$20
$25
Army
Navy
Air Force
(BY17$, B)
FCS
Comanche
Program Initiation CY (MS B)
by Year Initiated (MS B)
$0
$5
$10
$15
$20
$25
Army
Navy
Air Force
(BY17$, B)
FCS
Comanche
SAR Year of Cancellation
by Year Canceled
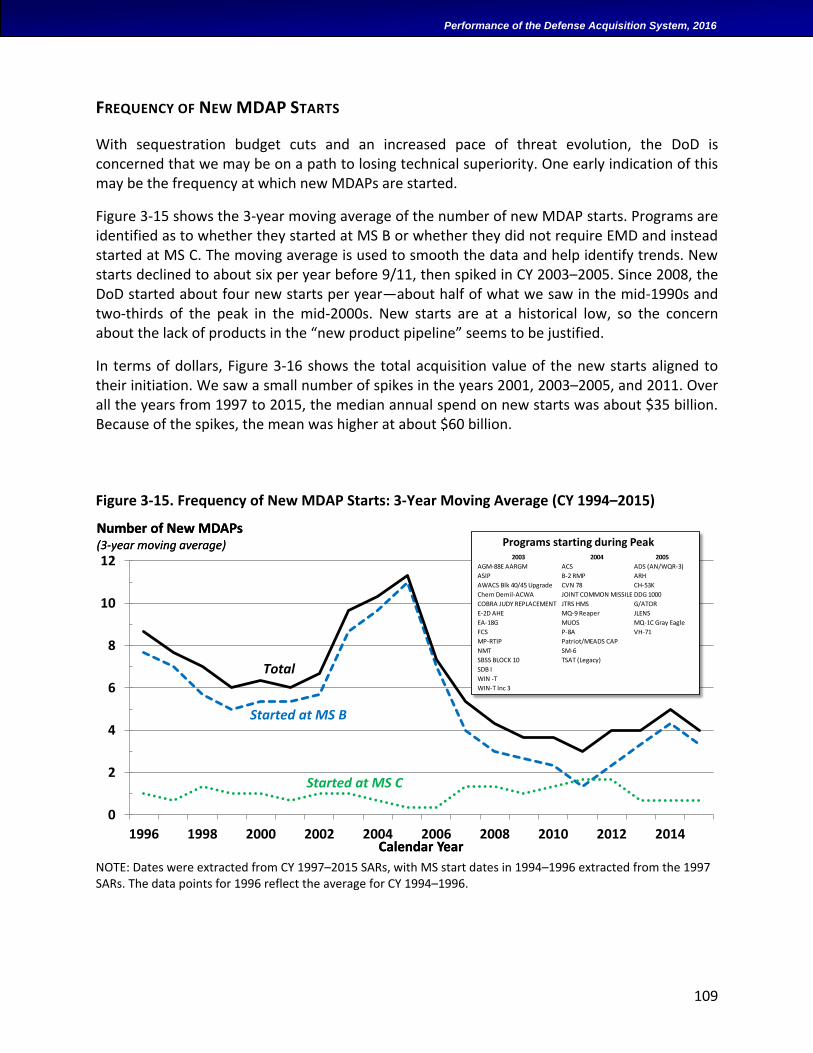
109
Performance of the Defense Acquisition System, 2016
FREQUENCY OF NEW MDAP STARTS
With sequestration budget cuts and an increased pace of threat evolution, the DoD is concerned that we may be on a path to losing technical superiority. One early indication of this may be the frequency at which new MDAPs are started.
Figure 3-15 shows the 3-year moving average of the number of new MDAP starts. Programs are identified as to whether they started at MS B or whether they did not require EMD and instead started at MS C. The moving average is used to smooth the data and help identify trends. New starts declined to about six per year before 9/11, then spiked in CY 2003–2005. Since 2008, the DoD started about four new starts per year—about half of what we saw in the mid-1990s and two-thirds of the peak in the mid-2000s. New starts are at a historical low, so the concern about the lack of products in the “new product pipeline” seems to be justified.
In terms of dollars, Figure 3-16 shows the total acquisition value of the new starts aligned to their initiation. We saw a small number of spikes in the years 2001, 2003–2005, and 2011. Over all the years from 1997 to 2015, the median annual spend on new starts was about $35 billion. Because of the spikes, the mean was higher at about $60 billion.
Figure 3-15. Frequency of New MDAP Starts: 3-Year Moving Average (CY 1994–2015)
NOTE: Dates were extracted from CY 1997–2015 SARs, with MS start dates in 1994–1996 extracted from the 1997 SARs. The data points for 1996 reflect the average for CY 1994–1996.
0
2
4
6
8
10
12
1996 1998 2000 2002 2004 2006 2008 2010 2012 2014
Number of New MDAPs(3-year moving average)
Calendar Year
Number of New MDAPs(3-year moving average)
Calendar Year
Total
Started at MS B
Started at MS C
2003 2004 2005
AGM-88E AARGM ACS ADS (AN/WQR-3)
ASIP B-2 RMP ARH
AWACS Blk 40/45 Upgrade CVN 78 CH-53K
Chem Demil-ACWA JOINT COMMON MISSILE DDG 1000
COBRA JUDY REPLACEMENT JTRS HMS G/ATOR
E-2D AHE MQ-9 Reaper JLENS
EA-18G MUOS MQ-1C Gray Eagle
FCS P-8A VH-71
MP-RTIP Patriot/MEADS CAP
NMT SM-6
SBSS BLOCK 10 TSAT (Legacy)
SDB I
WIN -T
WIN-T Inc 3
Programs starting during Peak
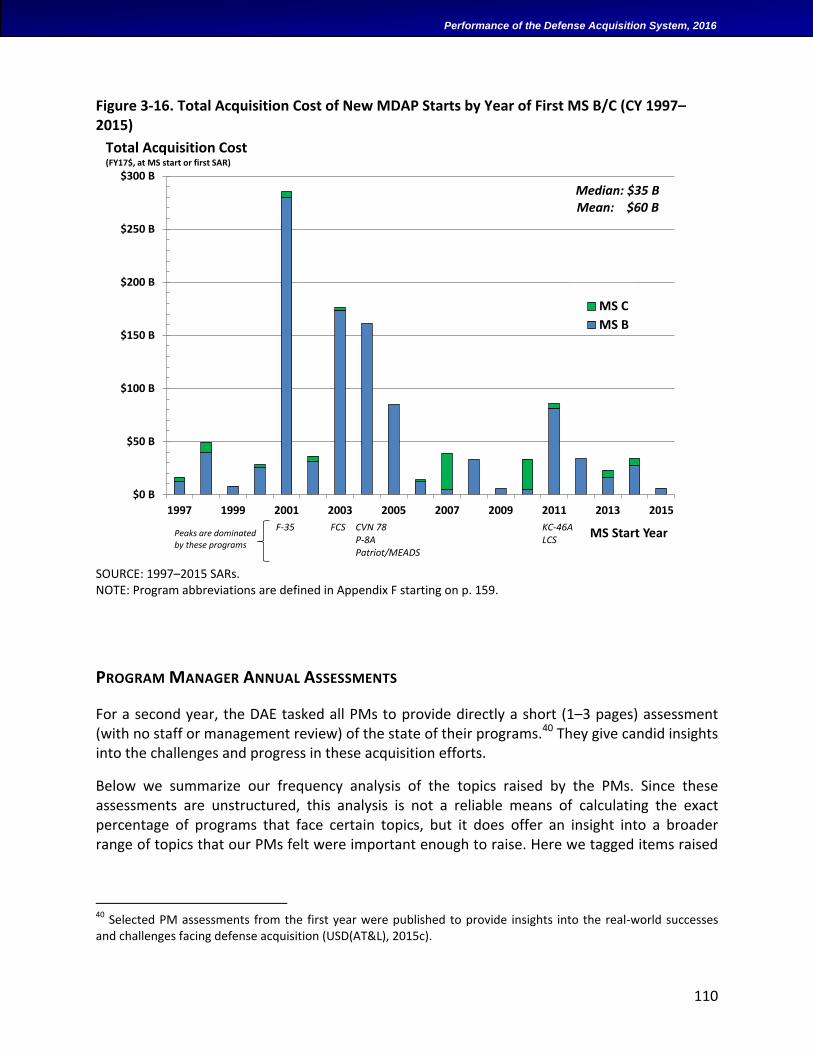
110
Performance of the Defense Acquisition System, 2016
Figure 3-16. Total Acquisition Cost of New MDAP Starts by Year of First MS B/C (CY 1997–2015)
SOURCE: 1997–2015 SARs. NOTE: Program abbreviations are defined in Appendix F starting on p. 159.
PROGRAM MANAGER ANNUAL ASSESSMENTS
For a second year, the DAE tasked all PMs to provide directly a short (1–3 pages) assessment (with no staff or management review) of the state of their programs.40 They give candid insights into the challenges and progress in these acquisition efforts.
Below we summarize our frequency analysis of the topics raised by the PMs. Since these assessments are unstructured, this analysis is not a reliable means of calculating the exact percentage of programs that face certain topics, but it does offer an insight into a broader range of topics that our PMs felt were important enough to raise. Here we tagged items raised
40 Selected PM assessments from the first year were published to provide insights into the real-world successes and challenges facing defense acquisition (USD(AT&L), 2015c).
$0 B
$50 B
$100 B
$150 B
$200 B
$250 B
$300 B
1997 1999 2001 2003 2005 2007 2009 2011 2013 2015
MS C
MS B
MS Type
MS Start
Sum of Total Cost FY17$
F-35 FCS CVN 78P-8APatriot/MEADS
KC-46ALCS
Median: $35 BMean: $60 B
Total Acquisition Cost(FY17$, at MS start or first SAR)
MS Start YearPeaks are dominated by these programs
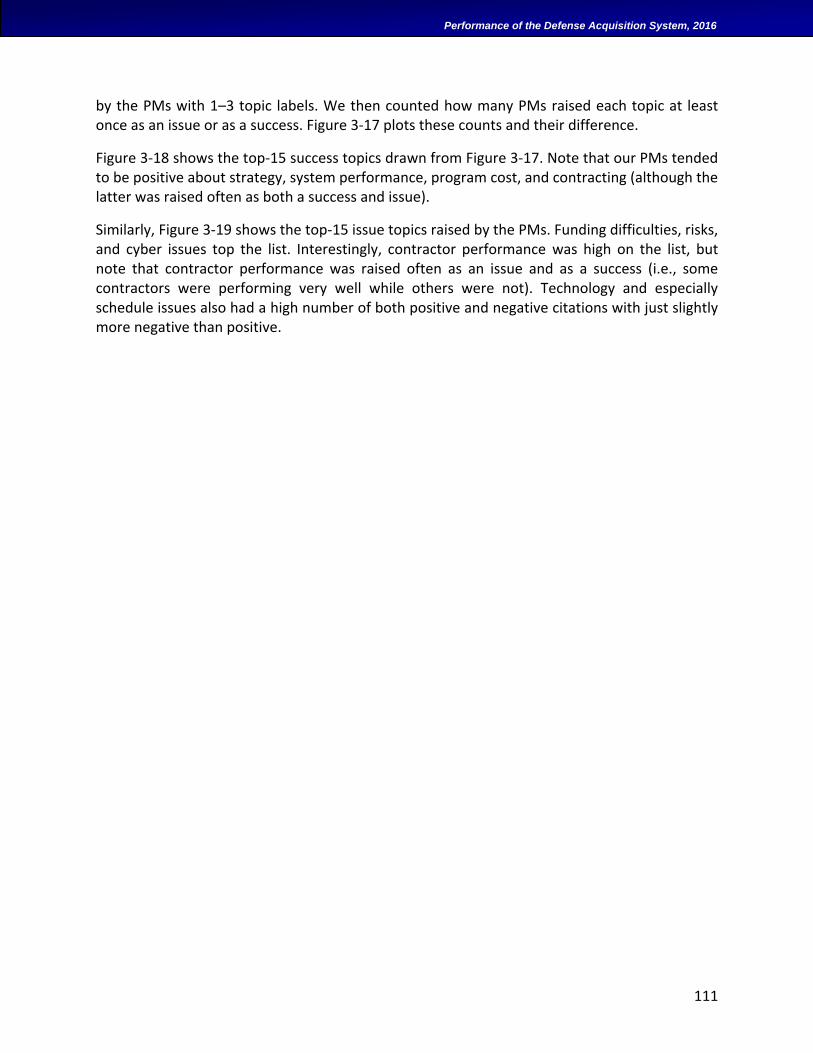
111
Performance of the Defense Acquisition System, 2016
by the PMs with 1–3 topic labels. We then counted how many PMs raised each topic at least once as an issue or as a success. Figure 3-17 plots these counts and their difference.
Figure 3-18 shows the top-15 success topics drawn from Figure 3-17. Note that our PMs tended to be positive about strategy, system performance, program cost, and contracting (although the latter was raised often as both a success and issue).
Similarly, Figure 3-19 shows the top-15 issue topics raised by the PMs. Funding difficulties, risks, and cyber issues top the list. Interestingly, contractor performance was high on the list, but note that contractor performance was raised often as an issue and as a success (i.e., some contractors were performing very well while others were not). Technology and especially schedule issues also had a high number of both positive and negative citations with just slightly more negative than positive.
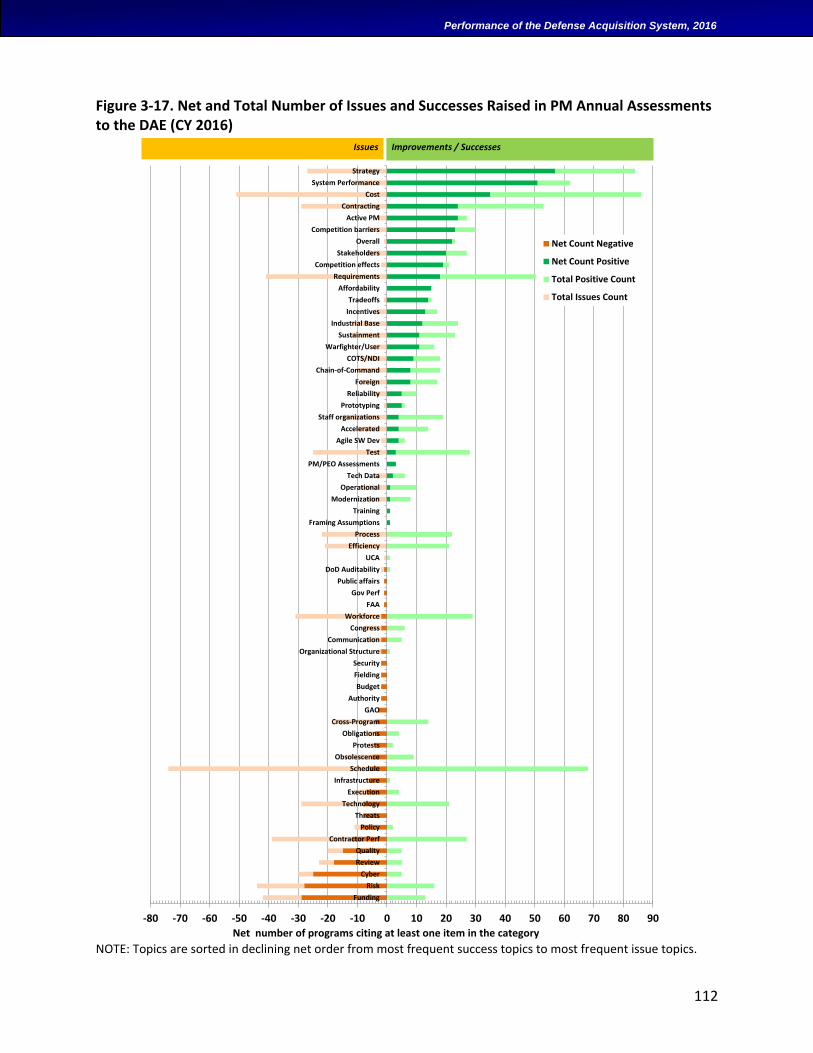
112
Performance of the Defense Acquisition System, 2016
Figure 3-17. Net and Total Number of Issues and Successes Raised in PM Annual Assessments to the DAE (CY 2016)
NOTE: Topics are sorted in declining net order from most frequent success topics to most frequent issue topics.
-80 -70 -60 -50 -40 -30 -20 -10 0 10 20 30 40 50 60 70 80 90
Funding
Risk
Cyber
Review
Quality
Contractor Perf
Policy
Threats
Technology
Execution
Infrastructure
Schedule
Obsolescence
Protests
Obligations
Cross-Program
GAO
Authority
Budget
Fielding
Security
Organizational Structure
Communication
Congress
Workforce
FAA
Gov Perf
Public affairs
DoD Auditability
UCA
Efficiency
Process
Framing Assumptions
Training
Modernization
Operational
Tech Data
PM/PEO Assessments
Test
Agile SW Dev
Accelerated
Staff organizations
Prototyping
Reliability
Foreign
Chain-of-Command
COTS/NDI
Warfighter/User
Sustainment
Industrial Base
Incentives
Tradeoffs
Affordability
Requirements
Competition effects
Stakeholders
Overall
Competition barriers
Active PM
Contracting
Cost
System Performance
Strategy
Net Count Negative
Net Count Positive
Total Positive Count
Total Issues Count
Net number of programs citing at least one item in the category
Issues Improvements / Successes
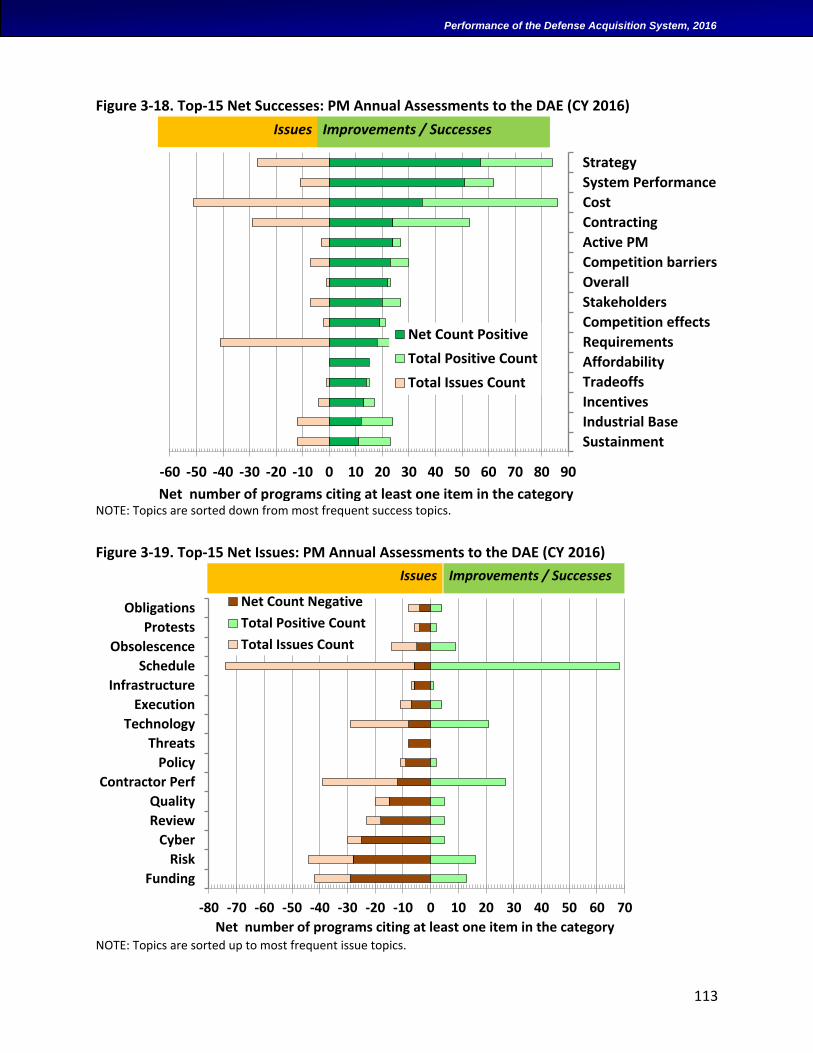
113
Performance of the Defense Acquisition System, 2016
Figure 3-18. Top-15 Net Successes: PM Annual Assessments to the DAE (CY 2016)
NOTE: Topics are sorted down from most frequent success topics.
Figure 3-19. Top-15 Net Issues: PM Annual Assessments to the DAE (CY 2016)
NOTE: Topics are sorted up to most frequent issue topics.
-60 -50 -40 -30 -20 -10 0 10 20 30 40 50 60 70 80 90
Sustainment
Industrial Base
Incentives
Tradeoffs
Affordability
Requirements
Competition effects
Stakeholders
Overall
Competition barriers
Active PM
Contracting
Cost
System Performance
Strategy
Net Count Positive
Total Positive Count
Total Issues Count
Net number of programs citing at least one item in the category
Issues Improvements / Successes
-80 -70 -60 -50 -40 -30 -20 -10 0 10 20 30 40 50 60 70
Funding
Risk
Cyber
Review
Quality
Contractor Perf
Policy
Threats
Technology
Execution
Infrastructure
Schedule
Obsolescence
Protests
Obligations Net Count Negative
Total Positive Count
Total Issues Count
Net number of programs citing at least one item in the category
Issues Improvements / Successes
114
Performance of the Defense Acquisition System, 2016
PROGRAM EXECUTIVE OFFICER ASSESSMENTS
This year, in addition to the PM assessments discussed above, each PEO was directed to submit a short assessment of their portfolios directly to the DAE along with any suggestions they might have for improving defense acquisition. The DAE received a wide range of valuable observations, best practices, and recommendations, including thoughts on improving acquisition efficiency, eliminating bureaucracy, getting more from industry, developing the acquisition workforce, and many other topics.
Below are highlights of the issues and suggestions made by the PEOs that are applicable to wide portions of defense acquisition. In addition, some extracts rendered anonymous were included in a recent Defense AT&L magazine article (Kendall, 2016b). This is a useful collection of perspectives, ideas, and recommendations that we are reviewing with the intent of adopting good ideas where we can and stimulating our thoughts on how we can all be more effective. The USD(AT&L) staff in particular is working with the military departments and other elements of the OSD staff on implementation of many of the ideas in the full set of the PEO Assessments.
Balance in Acquisition
Cultural shift from spending to efficiency. We need to continue working on the workforce culture shift from a focus on spending to meet budget execution benchmarks toward employing critical thinking, tailoring, and incentives to be more efficient in both time and money as we equip our warfighters and try to get as much value as possible with the taxpayers’ dollars.
Acquisition and the Larger Defense Mission
Pursue larger operational effects, not just program-level acquisition. At the end of the day, the defense acquisition system’s job is to provide warfighter capabilities and effects—not just delivering a narrowly defined program. PEOs and other stakeholders are increasingly examining the integrated effects of programs on kill chains and mission capabilities, looking for unforeseen system-of-system interactions, dependencies, and gaps. This is a cultural shift. The processes for program design, requirements, and management are fairly well developed but are often narrowly specified and constrained when trying to identify and change to achieve broader system-of-systems operational outcomes.
Tyranny of the baseline. Programs need levels against which to measure cost, schedule, and technical performance objectives. However, those baselines often constrain the program when dealing with unforeseen technical problems (on a developmental program) or changing threats. Measuring programs against Milestone B baselines is a statutory obligation within the DoD, but new threats and unforeseen engineering challenges commonly arise after that milestone. Management techniques such as block upgrades and subprograms can help isolate and illuminate associated changes for approval by DoD leadership and Congress, but their widespread use is discouraged by the bureaucratic burdens they incur.
115
Performance of the Defense Acquisition System, 2016
Sunk cost (and past problems). A corollary to the baseline problem is an inability to recognize recent performance progress on long programs. Many PEOs note that some programs are now performing well after major attention and restructuring, but it is hard to shed past sins. Of course, simply rebaselining on a regular basis creates its own problem by concealing problems, so a balance and multiple views are needed.
Managing Risks During Execution
Test and information technology (IT). Program designs, testing, and fiscal resources are closely considered and traded at program initiation to ensure a viable program. In some cases, program requirements may not fully reflect the intended combat environment, and those environments may change with evolving threats. In contrast, the test and IT communities are responsible for ensuring that tests and cybersecurity address current threats. Unfortunately, this can lead to impasses between the program and test/IT community because program funding is based on requirements while testing/cybersecurity evaluations are based on current threats. Additional funding could be required. Although the acquisition chain-of-command will adjudicate many of these conflicting pressures during major program reviews, the infrequency of these reviews makes it difficult to adjudicate these needs and make risk and funding tradeoffs. One PEO suggested that a new process may be needed (e.g., bringing test and cybersecurity mandates under Configuration Steering Boards (CSBs)) to balance these risks, tradeoffs, and funding demands during execution.
IT upgrades and testing. The pace of IT changes to systems (from threats, system-of-systems needs, and technical opportunities) is significantly shorter than the timelines required to perform tests—especially if numerous deficiencies are found that must be fixed and retested. Policies, processes, and approaches for efficiently testing incremental system changes are not always employed. Approaches currently being used with some success include ensuring that earlier defects are addressed, incremental testing that leverages earlier test results, using automated software regression test tools, and other best practices.
Risk management. New frameworks for assessing risks—combined with IT staff incentives to drive risks to near zero—can lead to excessive focus on risk mitigation rather than balanced management. Many PEOs complained that, rather than facilitating quick consideration of key risks, the recent Risk Management Framework (DoD CIO, 2016) is overly bureaucratic, complex, ill-tailored for weapon systems, and hard to satisfy. More implementation refinement may be needed to make the use of the framework more efficient, effective, and responsive.
Challenge and Inform Requirement Decisions
Use Configuration Steering Boards (CSBs) for lower ACAT programs. As with major programs, it would be useful to have CSBs refine requirements and conduct tradeoffs for lower ACAT programs during execution. As the Army has found, this may need to involve delegation to boards below the Service Chief level due to the much larger number of lower ACATs.
116
Performance of the Defense Acquisition System, 2016
Treat every decision as if it uses your own money. One way to personalize acquisition performance is to ask staff to treat every decision as if the implications consume their personal money. This motivates early analysis of the cost, schedule, and technical risks associated with requirements, informing tradeoffs and requirements tailoring by the requirements community.
Workforce Levels
Workforce levels not fully recovered from 1990s reforms. While we have seen total increases of 25% in the acquisition workforce since FY 2008, some PEOs mentioned that their staffing levels are below validated requirement levels—even for their highest priority efforts. For example, one PEO cited a 50% increase in program dollars being executed but a 47% decrease in the acquisition workforce in their area since FY 1995. Efficiencies are being pursued, but many hinge on processes outside the program and PEO’s control.
Workforce sufficiency review at milestones. Currently, a program is not allowed to proceed without both validated requirements and sufficient budgetary resources matched to cost estimates. Similarly, sufficient workforce levels should be ensured before a program is approved. Otherwise, the program should be re-scoped or not allowed to proceed. This would entail a major change in the way programs are reviewed but would formally recognize the importance of having a sufficient workforce for program success. Workforce sufficiency is difficult to ascertain in a purely quantitative fashion, so expert judgment and reviews would need to be used.
Workforce levels enable savings and are independent of force structure. The significant savings achieved in recent years depend on having a sufficient workforce that can pursue customized approaches rather than just spending money. Multiple PEOs asserted that recent savings outweigh the cost of the entire acquisition workforce. Unfortunately, headquarter budget cuts are reducing Government and contractor staff support to programs from PEOs, buying commands, and defense agencies. These cuts are endangering recent efficiency gains and degrading basic program management support. Such arbitrary cuts (without associated reductions in process streamlining) do not reflect the fact that the acquisition management workload is generally independent of quantity reductions associated with force-structure reductions. The management workload is also highly affected by the increasing pace of system upgrades to address increasing kinetic, electronic, and cyber threats.
Hiring. While having special hiring authorities helps, it still takes too long (e.g., over 100 days) to hire someone, which makes our offers too late for consideration (regardless of our salary levels) when trying to hire students directly out of college. Also, since we are generally precluded from hiring retiring O-5 and O-6 officers, we are seeing excellent candidates with 20+ years of experience walk out the door.
117
Performance of the Defense Acquisition System, 2016
Workforce Learning and Culture
Learning through “Whiteboard” sessions by leadership. Some leaders are conducting in-person reviews of acquisition strategies to facilitate staff learning while increasing innovation and developing more tailored and effective strategies.
Employee shadowing of senior leaders. One PEO established a practice of selecting employees to join him for two weeks at all meetings and events as a learning experience. This on-the-job training illustrates how to think critically and creatively about key acquisition elements such as acquisition strategies, contract type selection, design of contract incentives, and source-selection approaches while broadening their perspective.
Town hall meetings. Regular, informal town-hall meetings provide valuable venues for senior leaders to clarify the intent behind initiatives, offer examples of innovative acquisition, and illustrate how to think creatively to design better acquisition programs. Such meetings also facilitate feedback to senior leaders of challenges and issues “in the trenches.”
Stakeholder training. Stakeholders within the DoD Components and in Congress often lack basic understanding of defense acquisition processes and their respective roles in it. This results in time lost answering questions far outside acquisition responsibilities (as well as the generation of uninformed reform ideas).
Acquisition Strategy
Commercial items. COTS and NDI usually (or even “only) work for defense systems when the requirements, usage, and environments match exactly. This results in fairly low appropriateness at the system level (where functions, requirements, and “-illities” often differ) but increasing appropriateness at part levels.
Limitations of rapidly acquired systems. Because rapidly acquired systems are based on readily available and often commercial components, they share many of the COTS/NDI issues above. Also, they are often difficult and costly to sustain in the long term, difficult to convert to a regular program of record, and are often effective against only a narrow range of threats.
COTS obsolescence. Challenges in replacing obsolete COTS components are increasing, especially for IT elements. For some longer programs, upgrades may even be required before initial fielding. Replacements, lifetime buys, and upgrades must be built into strategies, budgets, and staffing plans throughout the life cycle, but some statutory fiscal rules can limit flexibility and options that save money in the end.
Software development and integration. The DoD continues to find that giving prime contractors responsibility for major software block upgrades is risky. Heavy Government involvement and rapid, incremental approaches (e.g., through Agile development) have been successful, but they also point to the need for reforms in how we conduct testing and risk management. Some PEOs also mentioned that Agile software development has been very beneficial in accelerating and improving software development, but success hinges on use of cost-reimbursable contracting and flexible operational testing approaches.
118
Performance of the Defense Acquisition System, 2016
Fixed-price contracting. One PEO noted that “a fixed-price contract type is every bit as challenging as a cost-plus vehicle, albeit in different ways.” We cannot use Government money to solve problems that endanger the program; we cannot change requirements (despite needs); we must keep the funding profile stable, and we can require only the performance and product we placed on the contract (nothing more).
Risks versus savings. Savings are not always risk or consequence free. While BBP’s goal is savings that do not decrease capabilities, some approaches can increase cost, schedule, or technical risks and must be weighted as such.
Processes and Impediments
Agility. PEOs raised the following as factors hampering agile acquisition:
Requirement decision cycles that are longer than technology and threat change cycles (especially for areas such as cyber).
Funding cycles that are longer than technology and threat change cycles.
Strong external and internal disincentives for staff to pursue options that come with any personal risks.
Testing cycles that are longer than agile software development cycles or require full system tests when only components are upgraded.
Tailoring. While PEOs, other leaders, and the DoDI 5000.02 emphasize tailoring the acquisition process, testing, and oversight to each specific program, the PEOs report that success is mixed in getting PMs and oversight staff to pursue tailoring. Institutionalizing this cultural shift will require continued training and leadership emphasis.
Rapid acquisition. We have good processes in place to acquire (nondevelopmental) systems rapidly, but finding the money is often the biggest impedance, because we do not have a ready reserve of funds. Furthermore, rapid acquisitions require significant staff work that must come out of existing staff, adding workloads and growth to normal program progress when large numbers of Urgent Operational Needs arise in a particular area or portfolio.
Obligation and expenditure monitoring. Measuring program financial performance solely on goals can be problematic. Performance also needs to take into consideration actual execution situations (e.g., delays due to negotiating better prices or constructing effective contract incentives).
Value of oversight. While some issues remain, the PEOs often identified places where OSD staff and individuals offer value in streamlining processes or providing assistance. Continued progress is needed (as can be seen from other comments) to improve and retain value.
119
Performance of the Defense Acquisition System, 2016
4. INPUT AND PROCESS MEASURES
Finally, we examine input and process measures of the defense acquisition system. While these do not directly reflect the outputs and outcomes, some are contentious topics for which it is useful to examine the available data, while others such as competition rates and small-business utilization have conceptually important ties to outcomes and thus have assigned goals.
DEFENSE ACQUISITION WORKFORCE
The DoD has made significant progress toward strengthening capability and advancing professionalism of the Acquisition Workforce (AWF). Since we started BBP in 2010, we have rebalanced and increased the size of the workforce to meet challenges and emergent threats. Significant investments also have been made to improve workforce quality. Our strategy is to responsibly sustain and build on these improvements as resources allow. We will continue to improve our analysis of required staffing levels and demographics. We also seek to increase professionalism by concentrating on certification, education, training, and experience, expanding our pool of qualified leaders at all levels, and addressing current and future workforce challenges as they arise.
Improving the Workforce
Recruiting and hiring. Throughout the DoD, Components have used the DAWDF to rebuild, reshape, and sustain the workforce in critical functional areas through targeted hiring strategies and retention efforts. Figure 4-1 and Table 4-1 show the results of these efforts. Of note are the significant personnel increases since the low point in FY 2008, especially in contracting, program management, engineering, life-cycle logistics, and information technology.
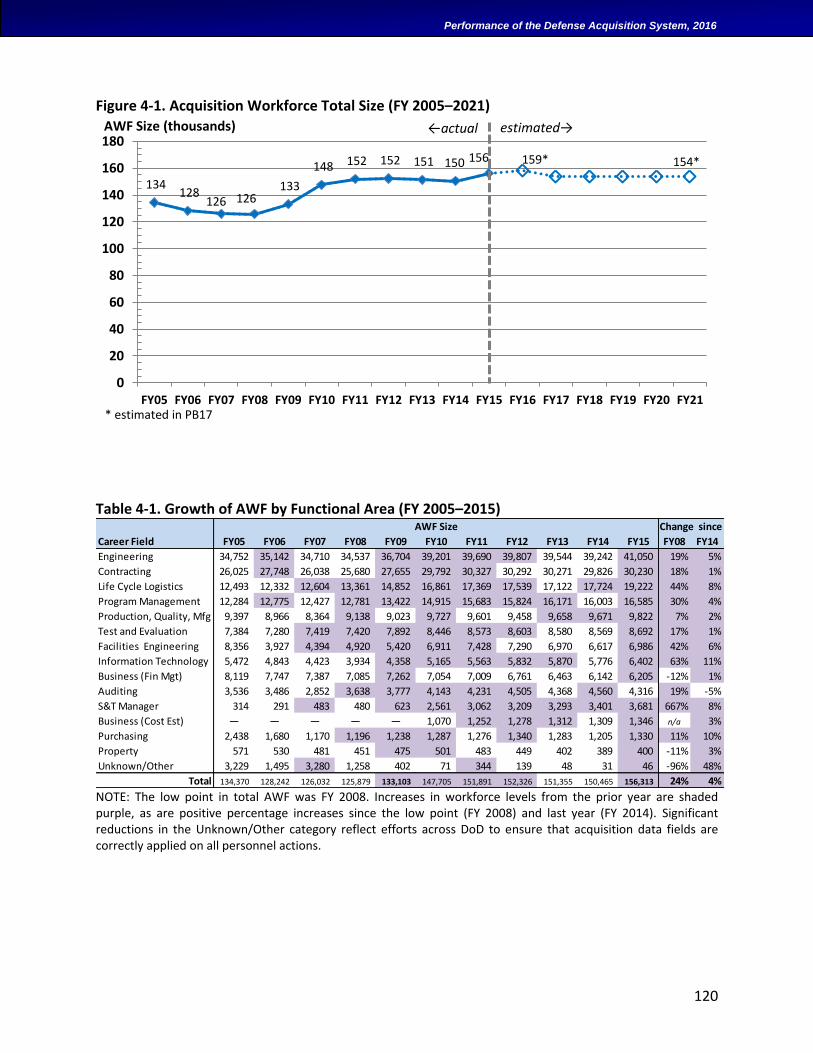
120
Performance of the Defense Acquisition System, 2016
Figure 4-1. Acquisition Workforce Total Size (FY 2005–2021)
* estimated in PB17
Table 4-1. Growth of AWF by Functional Area (FY 2005–2015)
NOTE: The low point in total AWF was FY 2008. Increases in workforce levels from the prior year are shaded purple, as are positive percentage increases since the low point (FY 2008) and last year (FY 2014). Significant reductions in the Unknown/Other category reflect efforts across DoD to ensure that acquisition data fields are correctly applied on all personnel actions.
134 128
126 126 133
148 152 152 151 150 156 159*
0
20
40
60
80
100
120
140
160
180
FY05 FY06 FY07 FY08 FY09 FY10 FY11 FY12 FY13 FY14 FY15 FY16 FY17 FY18 FY19 FY20 FY21
AWF Size (thousands)
154*
estimated→←actual
Career Field FY05 FY06 FY07 FY08 FY09 FY10 FY11 FY12 FY13 FY14 FY15 FY08 FY14
Engineering 34,752 35,142 34,710 34,537 36,704 39,201 39,690 39,807 39,544 39,242 41,050 19% 5%
Contracting 26,025 27,748 26,038 25,680 27,655 29,792 30,327 30,292 30,271 29,826 30,230 18% 1%
Life Cycle Logistics 12,493 12,332 12,604 13,361 14,852 16,861 17,369 17,539 17,122 17,724 19,222 44% 8%
Program Management 12,284 12,775 12,427 12,781 13,422 14,915 15,683 15,824 16,171 16,003 16,585 30% 4%
Production, Quality, Mfg 9,397 8,966 8,364 9,138 9,023 9,727 9,601 9,458 9,658 9,671 9,822 7% 2%
Test and Evaluation 7,384 7,280 7,419 7,420 7,892 8,446 8,573 8,603 8,580 8,569 8,692 17% 1%
Facilities Engineering 8,356 3,927 4,394 4,920 5,420 6,911 7,428 7,290 6,970 6,617 6,986 42% 6%
Information Technology 5,472 4,843 4,423 3,934 4,358 5,165 5,563 5,832 5,870 5,776 6,402 63% 11%
Business (Fin Mgt) 8,119 7,747 7,387 7,085 7,262 7,054 7,009 6,761 6,463 6,142 6,205 -12% 1%
Auditing 3,536 3,486 2,852 3,638 3,777 4,143 4,231 4,505 4,368 4,560 4,316 19% -5%
S&T Manager 314 291 483 480 623 2,561 3,062 3,209 3,293 3,401 3,681 667% 8%
Business (Cost Est) — — — — — 1,070 1,252 1,278 1,312 1,309 1,346 n/a 3%
Purchasing 2,438 1,680 1,170 1,196 1,238 1,287 1,276 1,340 1,283 1,205 1,330 11% 10%
Property 571 530 481 451 475 501 483 449 402 389 400 -11% 3%
Unknown/Other 3,229 1,495 3,280 1,258 402 71 344 139 48 31 46 -96% 48%
Total 134,370 128,242 126,032 125,879 133,103 147,705 151,891 152,326 151,355 150,465 156,313 24% 4%
Change sinceAWF Size
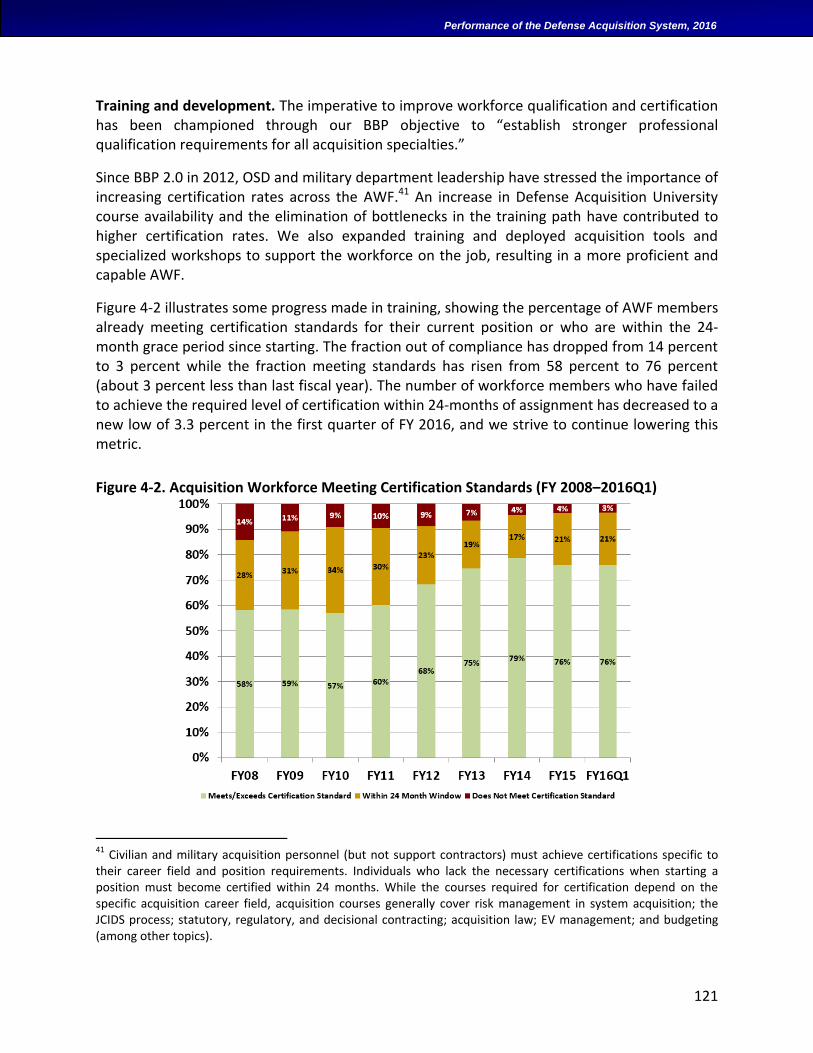
121
Performance of the Defense Acquisition System, 2016
Training and development. The imperative to improve workforce qualification and certification has been championed through our BBP objective to “establish stronger professional qualification requirements for all acquisition specialties.”
Since BBP 2.0 in 2012, OSD and military department leadership have stressed the importance of increasing certification rates across the AWF.41 An increase in Defense Acquisition University course availability and the elimination of bottlenecks in the training path have contributed to higher certification rates. We also expanded training and deployed acquisition tools and specialized workshops to support the workforce on the job, resulting in a more proficient and capable AWF.
Figure 4-2 illustrates some progress made in training, showing the percentage of AWF members already meeting certification standards for their current position or who are within the 24-month grace period since starting. The fraction out of compliance has dropped from 14 percent to 3 percent while the fraction meeting standards has risen from 58 percent to 76 percent (about 3 percent less than last fiscal year). The number of workforce members who have failed to achieve the required level of certification within 24-months of assignment has decreased to a new low of 3.3 percent in the first quarter of FY 2016, and we strive to continue lowering this metric.
Figure 4-2. Acquisition Workforce Meeting Certification Standards (FY 2008–2016Q1)
41 Civilian and military acquisition personnel (but not support contractors) must achieve certifications specific to their career field and position requirements. Individuals who lack the necessary certifications when starting a position must become certified within 24 months. While the courses required for certification depend on the specific acquisition career field, acquisition courses generally cover risk management in system acquisition; the JCIDS process; statutory, regulatory, and decisional contracting; acquisition law; EV management; and budgeting (among other topics).
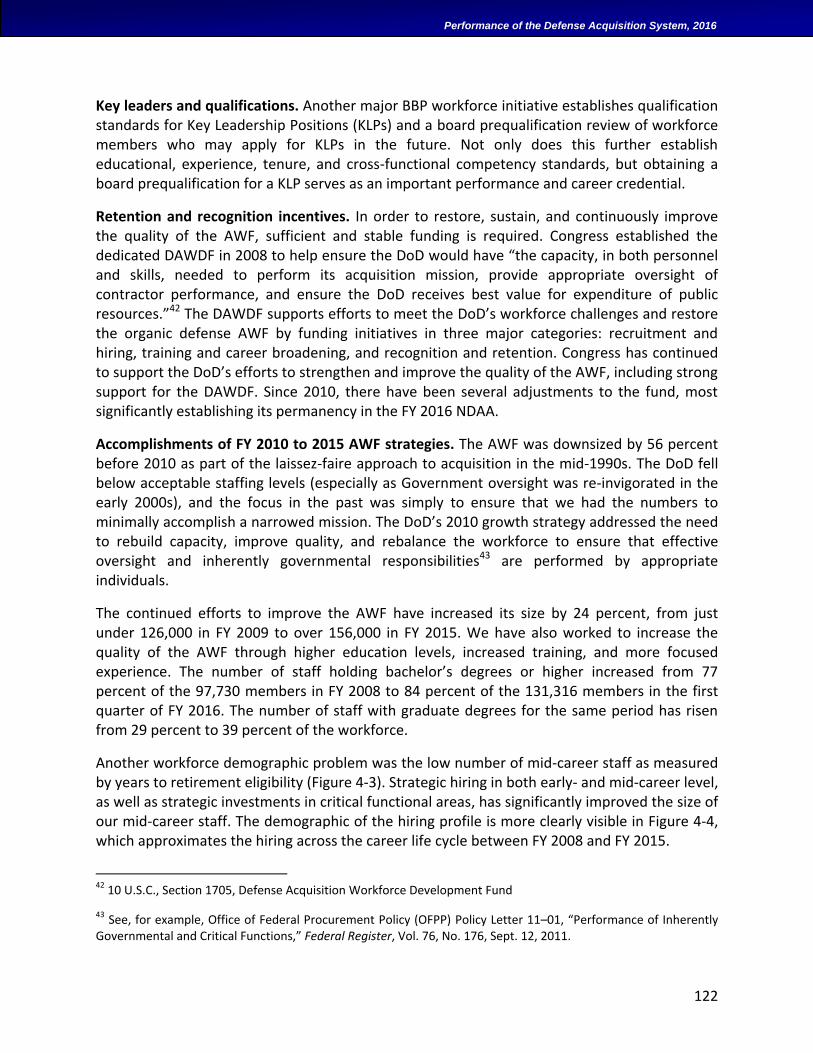
122
Performance of the Defense Acquisition System, 2016
Key leaders and qualifications. Another major BBP workforce initiative establishes qualification standards for Key Leadership Positions (KLPs) and a board prequalification review of workforce members who may apply for KLPs in the future. Not only does this further establish educational, experience, tenure, and cross-functional competency standards, but obtaining a board prequalification for a KLP serves as an important performance and career credential.
Retention and recognition incentives. In order to restore, sustain, and continuously improve the quality of the AWF, sufficient and stable funding is required. Congress established the dedicated DAWDF in 2008 to help ensure the DoD would have “the capacity, in both personnel and skills, needed to perform its acquisition mission, provide appropriate oversight of contractor performance, and ensure the DoD receives best value for expenditure of public resources.”42 The DAWDF supports efforts to meet the DoD’s workforce challenges and restore the organic defense AWF by funding initiatives in three major categories: recruitment and hiring, training and career broadening, and recognition and retention. Congress has continued to support the DoD’s efforts to strengthen and improve the quality of the AWF, including strong support for the DAWDF. Since 2010, there have been several adjustments to the fund, most significantly establishing its permanency in the FY 2016 NDAA.
Accomplishments of FY 2010 to 2015 AWF strategies. The AWF was downsized by 56 percent before 2010 as part of the laissez-faire approach to acquisition in the mid-1990s. The DoD fell below acceptable staffing levels (especially as Government oversight was re-invigorated in the early 2000s), and the focus in the past was simply to ensure that we had the numbers to minimally accomplish a narrowed mission. The DoD’s 2010 growth strategy addressed the need to rebuild capacity, improve quality, and rebalance the workforce to ensure that effective oversight and inherently governmental responsibilities43 are performed by appropriate individuals.
The continued efforts to improve the AWF have increased its size by 24 percent, from just under 126,000 in FY 2009 to over 156,000 in FY 2015. We have also worked to increase the quality of the AWF through higher education levels, increased training, and more focused experience. The number of staff holding bachelor’s degrees or higher increased from 77 percent of the 97,730 members in FY 2008 to 84 percent of the 131,316 members in the first quarter of FY 2016. The number of staff with graduate degrees for the same period has risen from 29 percent to 39 percent of the workforce.
Another workforce demographic problem was the low number of mid-career staff as measured by years to retirement eligibility (Figure 4-3). Strategic hiring in both early- and mid-career level, as well as strategic investments in critical functional areas, has significantly improved the size of our mid-career staff. The demographic of the hiring profile is more clearly visible in Figure 4-4, which approximates the hiring across the career life cycle between FY 2008 and FY 2015.
42 10 U.S.C., Section 1705, Defense Acquisition Workforce Development Fund
43 See, for example, Office of Federal Procurement Policy (OFPP) Policy Letter 11–01, “Performance of Inherently Governmental and Critical Functions,” Federal Register, Vol. 76, No. 176, Sept. 12, 2011.
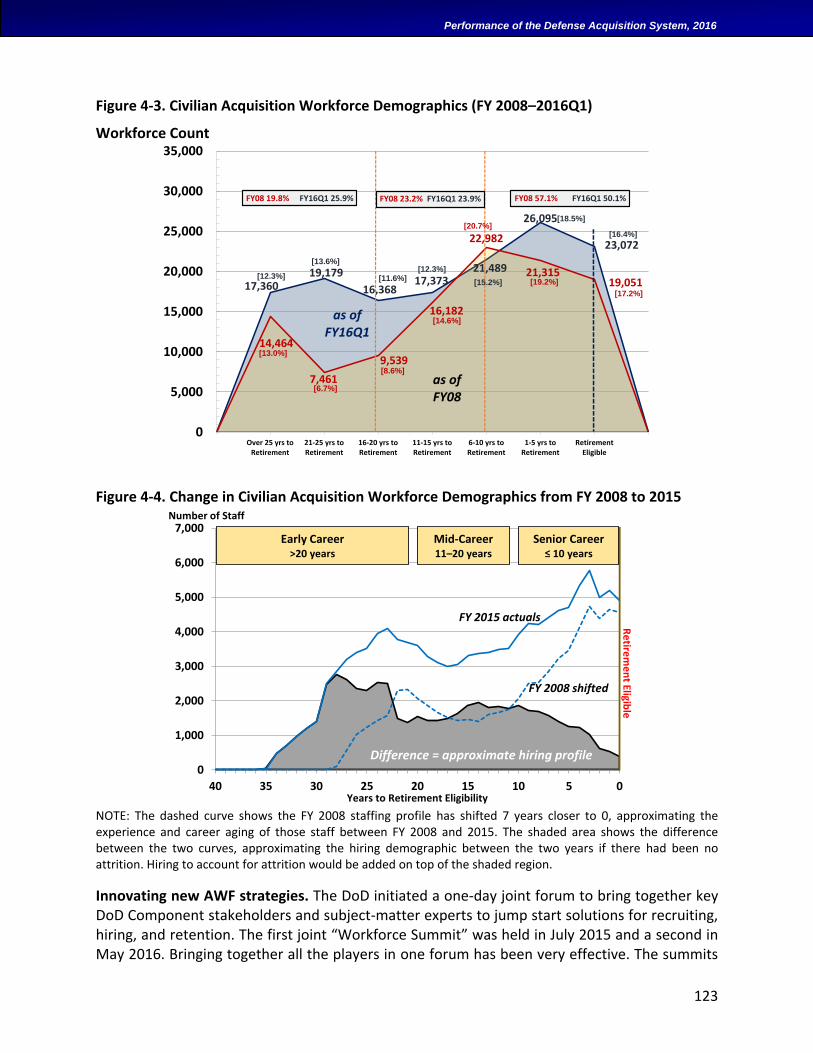
123
Performance of the Defense Acquisition System, 2016
Figure 4-3. Civilian Acquisition Workforce Demographics (FY 2008–2016Q1)
Workforce Count
Figure 4-4. Change in Civilian Acquisition Workforce Demographics from FY 2008 to 2015
NOTE: The dashed curve shows the FY 2008 staffing profile has shifted 7 years closer to 0, approximating the experience and career aging of those staff between FY 2008 and 2015. The shaded area shows the difference between the two curves, approximating the hiring demographic between the two years if there had been no attrition. Hiring to account for attrition would be added on top of the shaded region.
Innovating new AWF strategies. The DoD initiated a one-day joint forum to bring together key DoD Component stakeholders and subject-matter experts to jump start solutions for recruiting, hiring, and retention. The first joint “Workforce Summit” was held in July 2015 and a second in May 2016. Bringing together all the players in one forum has been very effective. The summits
17,36019,179
16,36817,373
21,489
26,095
23,072
14,464
7,461
9,539
16,182
22,982
21,31519,051
0
5,000
10,000
15,000
20,000
25,000
30,000
35,000
Over 25 yrs toRetirement
21-25 yrs toRetirement
16-20 yrs toRetirement
11-15 yrs toRetirement
6-10 yrs toRetirement
1-5 yrs toRetirement
RetirementEligible
Overall DAW - Civilian Retirement Eligibility Distribution - End-FY08 vs End-FY16Q1
[12.3%]
[13.6%]
[11.6%][12.3%]
[15.2%]
[18.5%]
[16.4%]
[13.0%]
[6.7%]
[8.6%]
[14.6%]
[20.7%]
[19.2%]
[17.2%]
FY08 19.8% FY16Q1 25.9% FY08 23.2% FY16Q1 23.9% FY08 57.1% FY16Q1 50.1%
as of FY16Q1
as of FY08
0
1,000
2,000
3,000
4,000
5,000
6,000
7,000
40 35 30 25 20 15 10 5 0
Number of Staff
Years to Retirement Eligibility
Re
tirem
en
t Eligible
FY 2015 actuals
FY 2008 shifted
Difference = approximate hiring profile
Early Career>20 years
Mid-Career11–20 years
Senior Career≤ 10 years
124
Performance of the Defense Acquisition System, 2016
fostered significantly improved understanding of problems and drivers, available authorities, legislative solutions (such as the college student direct-hire authority in the Senate's FY 2017 NDAA bill), and best practices. Best practices include how to effectively use the Expedited Hiring Authority, the Navy's very effective and efficient centralized journeymen and entry-level program, the Student Training and Academic Recruitment program, and initiatives to improve hiring processes and the use of special authorities (such as the Army's stand-up of a "hiring cell" to pilot process improvements). As a result of the July 2015 summit, the DoD updated our Expedited Hiring Authority policy and established a joint Incentives Integrated Product Team (IPT) to focus on how to improve use of incentives. The next joint summit is scheduled for November 2016.
Force of the Future. As part of the DoD’s Force of the Future initiatives, we are actively pursuing a direct-hire authority to accelerate offers for college students. We are also increasing the use of Science, Mathematics and Research Transformation scholarships and leveraging the Student Training and Academic Recruitment program.
Performance Incentives
Incentives IPT. This IPT was established to evaluate how we are using incentives, including recruitment and retention bonuses, student loan repayments, and other monetary and nonmonetary incentives to improve hiring and retention outcomes. The team is evaluating how to improve the use of incentives across the workforce, especially to lower barriers to usage and to share best practices to facilitate use. The team is developing a strategic plan to communicate existing policy and guidance as well as best practices for incentives implementation, resulting in an overall strategy for all DoD Components to use for their respective workforce.
Awards. The DoD has also expanded its awards programs and added a Should-Cost and Innovation Award as part of BBP to recognize exceptional performance and help instill a cost-conscious culture. The David Packard Excellence in Acquisition Award (first given in 1997) is the DoD’s highest acquisition team award and now emphasizes superior program management or successful execution of one or more BBP initiatives to reduce life-cycle costs. The Should-Cost and Innovation Award began in 2014 and recognizes outstanding commitment, innovation, and results in Should-Cost management.
In addition, two other major awards are the Defense Acquisition Workforce Individual Achievement Award and the Defense Acquisition Workforce Development Award. Individual Achievement Awards are given for excellence in 18 categories: acquisition in an expeditionary environment; auditing; financial management; cost estimating; contracting and procurement; engineering; facilities engineering; industrial and contract property management; information technology; life-cycle logistics; production, quality, and manufacturing; program management; science and technology management; test and evaluation; EV management; requirements management; services acquisition; and small business. The Workforce Development Award recognizes acquisition organizations that have made exemplary contributions to the career-long development of their workforce.
125
Performance of the Defense Acquisition System, 2016
BID PROTESTS ON DOD SOURCE SELECTIONS
A bid protest is a legal challenge to a solicitation or contract award for the procurement of goods or services.44 The GAO is a primary adjudicator of bid protests concerning Federal agencies and departments (including the DoD).45 Once a protest is filed, the GAO has 100 days to issue a decision. A bid protest can have four different outcomes: dismissed, denied, or sustained by the GAO, and at any time it can be withdrawn by the protester.46 In addition to the full decisions, the GAO tracks these four outcomes by protester. Denials and sustainments are definitive (although appeals are possible). However, we cannot tell from these summary data the frequency with which dismissals and withdrawals resulted in any accommodations or corrective actions by the Federal agency. Note also that some actions incurred more than one filing (i.e., a primary protest and subsequent filings). Finally, even though a company might “win” a protest (either through a sustainment or possibly in early agency actions causing a withdrawal or dismissal), revisions to a source selection may not necessarily result in a change of who is awarded the contract in the end.
Annual DoD solicitations in FedBizOps have been increasing since FY 2007, when they numbered about 35,000, and now number about 52,000 in FY 2016. In contrast, the total number of protests against these actions ranged from just over 600 in FY 2001 to a high of 1,365 in 2013 (Figure 4-5). Thus, the recent protest rate has averaged about 2.5 percent of solicitations. Note that annual contract awards are about an order of magnitude higher, so if we counted protests against contract awards (i.e., using the number of contract awards in the denominator), then the average would be one-tenth the size (i.e., about 0.25 percent).
While there has been a sharp increase in the absolute number of protests since 2009 (especially for the Army), the number of solicitations since FY 2007 has increased only by half, and the number of protests sustained per year by the GAO has remained steady at about 30 per year, dropping to 15 in 2015 (Figure 4-6). As a result, the sustainment rate has been running about 2 percent since 2009 and recently has been below the Federal total, which includes the DoD (Figure 4-7). In 2015, the sustainment rate was just over 1 percent. The individual sustainment rate for the Army (not shown) has been low and comparable to the other DoD Components
44 “An interested party may protest a solicitation or other request by a Federal agency for offers for a contract for the procurement of property or services; the cancellation of such a solicitation or other request; an award or proposed award of such a contract; and a termination of such a contract, if the protest alleges that the termination was based on improprieties in the award of the contract.” (4 CFR 2.1)
45 Bid protests can also be handled by the procuring agency or the U.S. Court of Federal Claims. Thus, these data provide a view into a significant number of (but not all) bid protests.
46 Note that bid protests are an integral part of a government acquisition system that has a core value of treating all bidders fairly. (There are no protests in commercial business transactions.) The protest system imparts an incentive to ensure that solicitations and awards are conducted properly. The number of protests sustained provides an independent indicator of the quality of the DoD’s source selections, independent of how many protests there are. See http://www.gao.gov/legal/bids/bidprotest.html as well as Schwartz and Manuel (2015) for more information on the GAO process and timeline.
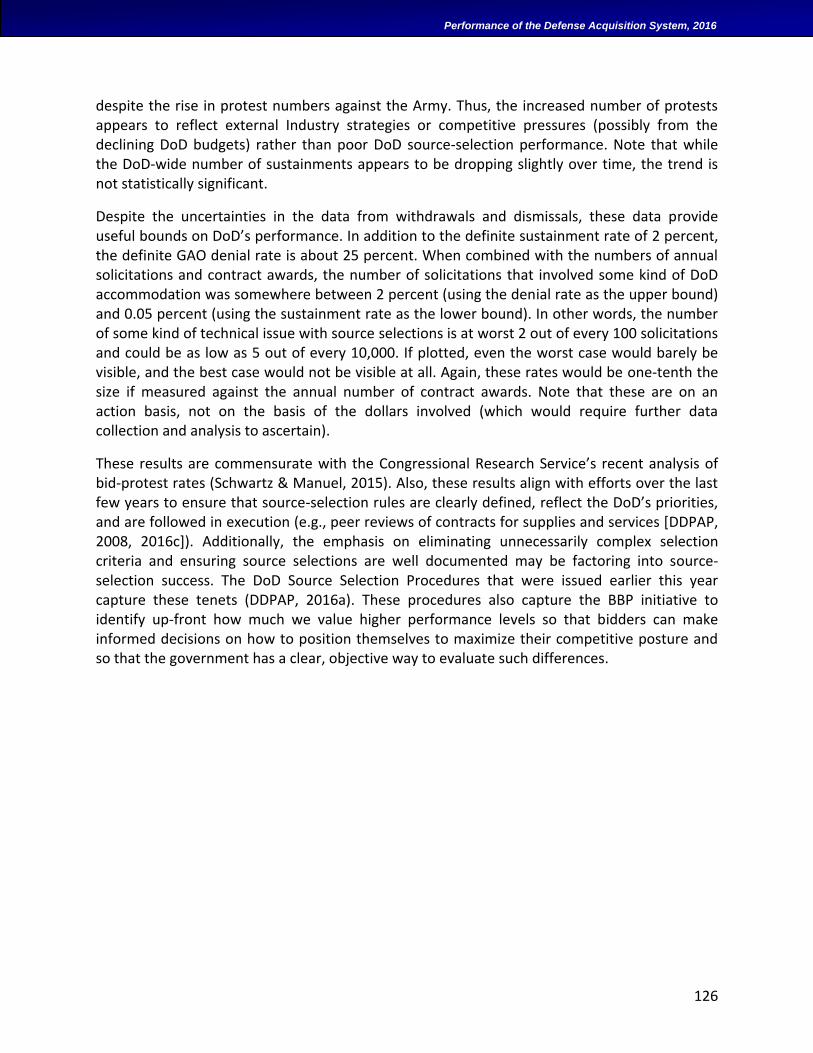
126
Performance of the Defense Acquisition System, 2016
despite the rise in protest numbers against the Army. Thus, the increased number of protests appears to reflect external Industry strategies or competitive pressures (possibly from the declining DoD budgets) rather than poor DoD source-selection performance. Note that while the DoD-wide number of sustainments appears to be dropping slightly over time, the trend is not statistically significant.
Despite the uncertainties in the data from withdrawals and dismissals, these data provide useful bounds on DoD’s performance. In addition to the definite sustainment rate of 2 percent, the definite GAO denial rate is about 25 percent. When combined with the numbers of annual solicitations and contract awards, the number of solicitations that involved some kind of DoD accommodation was somewhere between 2 percent (using the denial rate as the upper bound) and 0.05 percent (using the sustainment rate as the lower bound). In other words, the number of some kind of technical issue with source selections is at worst 2 out of every 100 solicitations and could be as low as 5 out of every 10,000. If plotted, even the worst case would barely be visible, and the best case would not be visible at all. Again, these rates would be one-tenth the size if measured against the annual number of contract awards. Note that these are on an action basis, not on the basis of the dollars involved (which would require further data collection and analysis to ascertain).
These results are commensurate with the Congressional Research Service’s recent analysis of bid-protest rates (Schwartz & Manuel, 2015). Also, these results align with efforts over the last few years to ensure that source-selection rules are clearly defined, reflect the DoD’s priorities, and are followed in execution (e.g., peer reviews of contracts for supplies and services [DDPAP, 2008, 2016c]). Additionally, the emphasis on eliminating unnecessarily complex selection criteria and ensuring source selections are well documented may be factoring into source-selection success. The DoD Source Selection Procedures that were issued earlier this year capture these tenets (DDPAP, 2016a). These procedures also capture the BBP initiative to identify up-front how much we value higher performance levels so that bidders can make informed decisions on how to position themselves to maximize their competitive posture and so that the government has a clear, objective way to evaluate such differences.
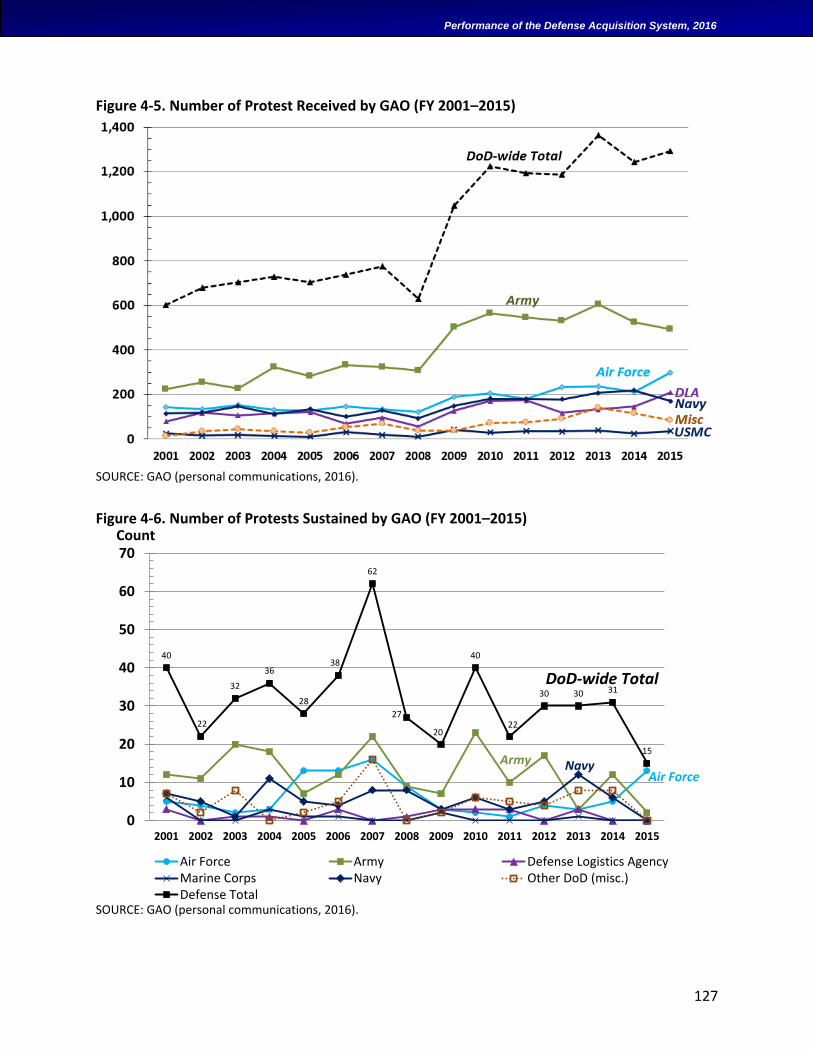
127
Performance of the Defense Acquisition System, 2016
Figure 4-5. Number of Protest Received by GAO (FY 2001–2015)
SOURCE: GAO (personal communications, 2016).
Figure 4-6. Number of Protests Sustained by GAO (FY 2001–2015)
SOURCE: GAO (personal communications, 2016).
40
22
32
36
28
38
62
27
20
40
22
30 30 31
15
0
10
20
30
40
50
60
70
2001 2002 2003 2004 2005 2006 2007 2008 2009 2010 2011 2012 2013 2014 2015
Count
# DoD Protests Sustained by GAO
Air Force Army Defense Logistics AgencyMarine Corps Navy Other DoD (misc.)Defense Total
DoD-wide Total
ArmyAir Force
Navy
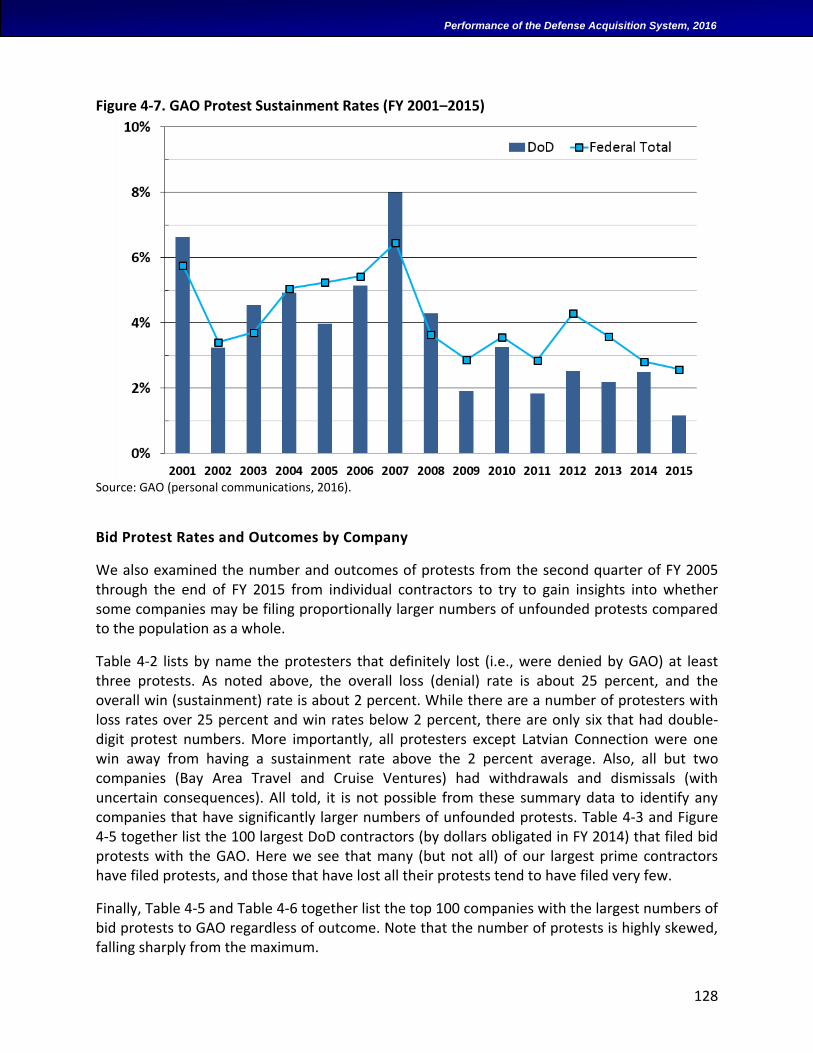
128
Performance of the Defense Acquisition System, 2016
Figure 4-7. GAO Protest Sustainment Rates (FY 2001–2015)
Source: GAO (personal communications, 2016).
Bid Protest Rates and Outcomes by Company
We also examined the number and outcomes of protests from the second quarter of FY 2005 through the end of FY 2015 from individual contractors to try to gain insights into whether some companies may be filing proportionally larger numbers of unfounded protests compared to the population as a whole.
Table 4-2 lists by name the protesters that definitely lost (i.e., were denied by GAO) at least three protests. As noted above, the overall loss (denial) rate is about 25 percent, and the overall win (sustainment) rate is about 2 percent. While there are a number of protesters with loss rates over 25 percent and win rates below 2 percent, there are only six that had double-digit protest numbers. More importantly, all protesters except Latvian Connection were one win away from having a sustainment rate above the 2 percent average. Also, all but two companies (Bay Area Travel and Cruise Ventures) had withdrawals and dismissals (with uncertain consequences). All told, it is not possible from these summary data to identify any companies that have significantly larger numbers of unfounded protests. Table 4-3 and Figure 4-5 together list the 100 largest DoD contractors (by dollars obligated in FY 2014) that filed bid protests with the GAO. Here we see that many (but not all) of our largest prime contractors have filed protests, and those that have lost all their protests tend to have filed very few.
Finally, Table 4-5 and Table 4-6 together list the top 100 companies with the largest numbers of bid protests to GAO regardless of outcome. Note that the number of protests is highly skewed, falling sharply from the maximum.
129
Performance of the Defense Acquisition System, 2016
The only definitive case of excessive unfounded protests is Latvian Connection, LLC. This company had a very high total number of DoD protests (251) since FY 2005, but these data showed nearly all with uncertain consequences (withdrawn or dismissed). However, GAO reported separately that Latvian Connection was suspended in August 2016 from filing protests with GAO for one year due to abuse of the GAO protest process.47 We are not aware of any other companies that have ever been suspended by the GAO from protesting, so this appears to be unique.
Interestingly, we note a few cases where Federal agencies or departments appear in the data as protesters. These are requests for reconsideration of GAO sustainment decisions. Table 4-2 shows that the Small Business Administration filed four protests and the Marine Corps filed three. All were denied (as were the two Air Force and one Army protest).
Further analysis is needed to determine whether the withdrawals and dismissals from such companies were associated with accommodations or corrective actions by the DoD. Analysis is also needed to determine the frequency at which actions by the DoD are taken to simply accelerate acquisitions and avoid problems despite no clear basis or problem with a solicitation or award. Finally, further analysis would be needed to determine whether any changes to the source selection led to different awardees in the end.
47The GAO decided that the “Protest challenging the issuance of a task order to a large business concern is dismissed for abuse of process, and the protester is suspended from protesting for a period of one year, where the protester has submitted 150 protests this fiscal year, challenging an array of acquisitions (some of which were fully performed years earlier) conducted by a host of contracting agencies worldwide; has repeatedly failed to demonstrate that it is capable of, or interested in, performing the solicited requirements; and has repeatedly failed to engage constructively on the substantive and threshold issues raised by its protests.” (GAO, 2016)
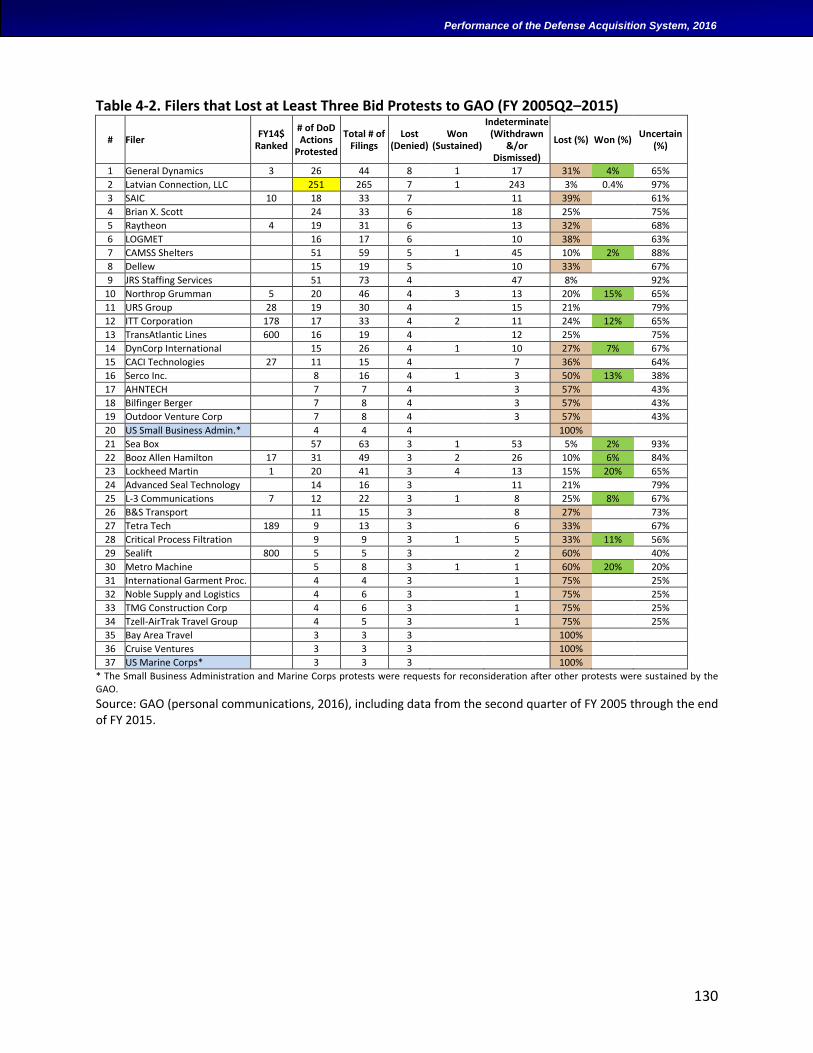
130
Performance of the Defense Acquisition System, 2016
Table 4-2. Filers that Lost at Least Three Bid Protests to GAO (FY 2005Q2–2015)
# Filer FY14$
Ranked
# of DoD Actions
Protested
Total # of Filings
Lost (Denied)
Won (Sustained)
Indeterminate (Withdrawn
&/or Dismissed)
Lost (%) Won (%) Uncertain
(%)
1 General Dynamics 3 26 44 8 1 17 31% 4% 65%
2 Latvian Connection, LLC 251 265 7 1 243 3% 0.4% 97%
3 SAIC 10 18 33 7 11 39% 61%
4 Brian X. Scott 24 33 6 18 25% 75%
5 Raytheon 4 19 31 6 13 32% 68%
6 LOGMET 16 17 6 10 38% 63%
7 CAMSS Shelters 51 59 5 1 45 10% 2% 88%
8 Dellew 15 19 5 10 33% 67%
9 JRS Staffing Services 51 73 4 47 8% 92%
10 Northrop Grumman 5 20 46 4 3 13 20% 15% 65%
11 URS Group 28 19 30 4 15 21% 79%
12 ITT Corporation 178 17 33 4 2 11 24% 12% 65%
13 TransAtlantic Lines 600 16 19 4 12 25% 75%
14 DynCorp International 15 26 4 1 10 27% 7% 67%
15 CACI Technologies 27 11 15 4 7 36% 64%
16 Serco Inc. 8 16 4 1 3 50% 13% 38%
17 AHNTECH 7 7 4 3 57% 43%
18 Bilfinger Berger 7 8 4 3 57% 43%
19 Outdoor Venture Corp 7 8 4 3 57% 43%
20 US Small Business Admin.* 4 4 4 100%
21 Sea Box 57 63 3 1 53 5% 2% 93%
22 Booz Allen Hamilton 17 31 49 3 2 26 10% 6% 84%
23 Lockheed Martin 1 20 41 3 4 13 15% 20% 65%
24 Advanced Seal Technology 14 16 3 11 21% 79%
25 L-3 Communications 7 12 22 3 1 8 25% 8% 67%
26 B&S Transport 11 15 3 8 27% 73%
27 Tetra Tech 189 9 13 3 6 33% 67%
28 Critical Process Filtration 9 9 3 1 5 33% 11% 56%
29 Sealift 800 5 5 3 2 60% 40%
30 Metro Machine 5 8 3 1 1 60% 20% 20%
31 International Garment Proc. 4 4 3 1 75% 25%
32 Noble Supply and Logistics 4 6 3 1 75% 25%
33 TMG Construction Corp 4 6 3 1 75% 25%
34 Tzell-AirTrak Travel Group 4 5 3 1 75% 25%
35 Bay Area Travel 3 3 3 100%
36 Cruise Ventures 3 3 3 100%
37 US Marine Corps* 3 3 3 100%
* The Small Business Administration and Marine Corps protests were requests for reconsideration after other protests were sustained by the GAO.
Source: GAO (personal communications, 2016), including data from the second quarter of FY 2005 through the end of FY 2015.
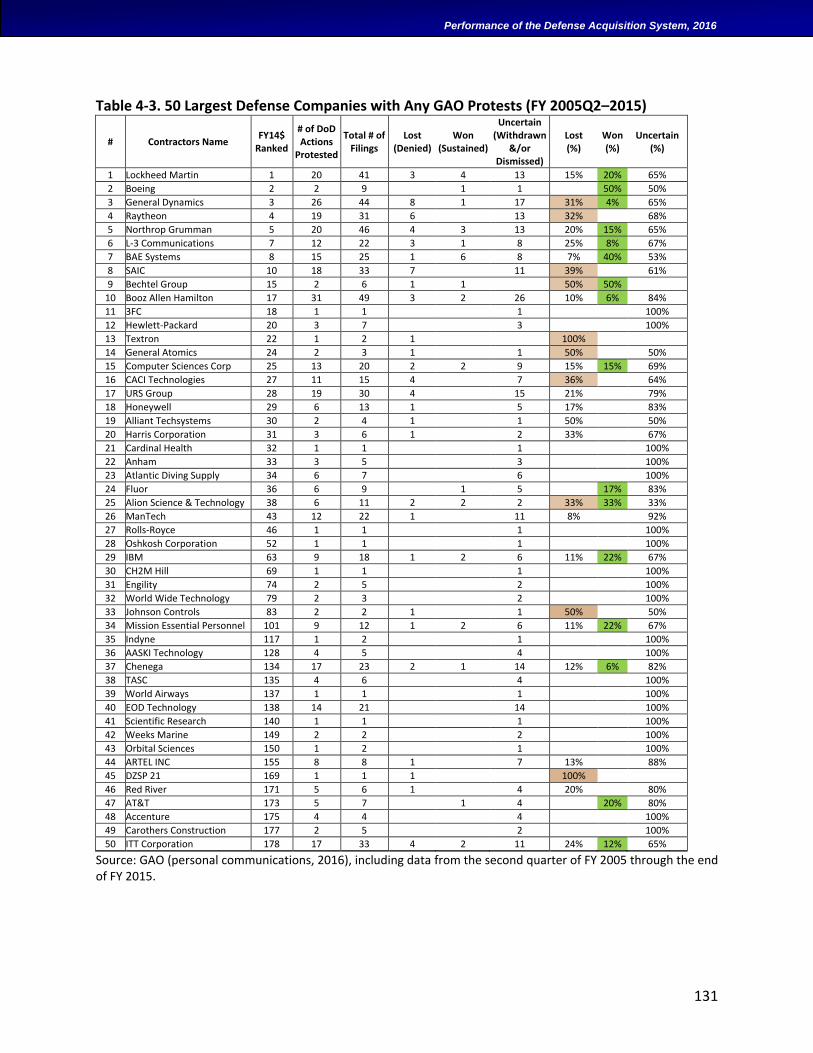
131
Performance of the Defense Acquisition System, 2016
Table 4-3. 50 Largest Defense Companies with Any GAO Protests (FY 2005Q2–2015)
# Contractors Name FY14$
Ranked
# of DoD Actions
Protested
Total # of Filings
Lost (Denied)
Won (Sustained)
Uncertain (Withdrawn
&/or Dismissed)
Lost (%)
Won (%)
Uncertain (%)
1 Lockheed Martin 1 20 41 3 4 13 15% 20% 65%
2 Boeing 2 2 9 1 1 50% 50%
3 General Dynamics 3 26 44 8 1 17 31% 4% 65%
4 Raytheon 4 19 31 6 13 32% 68%
5 Northrop Grumman 5 20 46 4 3 13 20% 15% 65%
6 L-3 Communications 7 12 22 3 1 8 25% 8% 67%
7 BAE Systems 8 15 25 1 6 8 7% 40% 53%
8 SAIC 10 18 33 7 11 39% 61%
9 Bechtel Group 15 2 6 1 1 50% 50%
10 Booz Allen Hamilton 17 31 49 3 2 26 10% 6% 84%
11 3FC 18 1 1 1 100%
12 Hewlett-Packard 20 3 7 3 100%
13 Textron 22 1 2 1 100%
14 General Atomics 24 2 3 1 1 50% 50%
15 Computer Sciences Corp 25 13 20 2 2 9 15% 15% 69%
16 CACI Technologies 27 11 15 4 7 36% 64%
17 URS Group 28 19 30 4 15 21% 79%
18 Honeywell 29 6 13 1 5 17% 83%
19 Alliant Techsystems 30 2 4 1 1 50% 50%
20 Harris Corporation 31 3 6 1 2 33% 67%
21 Cardinal Health 32 1 1 1 100%
22 Anham 33 3 5 3 100%
23 Atlantic Diving Supply 34 6 7 6 100%
24 Fluor 36 6 9 1 5 17% 83%
25 Alion Science & Technology 38 6 11 2 2 2 33% 33% 33%
26 ManTech 43 12 22 1 11 8% 92%
27 Rolls-Royce 46 1 1 1 100%
28 Oshkosh Corporation 52 1 1 1 100%
29 IBM 63 9 18 1 2 6 11% 22% 67%
30 CH2M Hill 69 1 1 1 100%
31 Engility 74 2 5 2 100%
32 World Wide Technology 79 2 3 2 100%
33 Johnson Controls 83 2 2 1 1 50% 50%
34 Mission Essential Personnel 101 9 12 1 2 6 11% 22% 67%
35 Indyne 117 1 2 1 100%
36 AASKI Technology 128 4 5 4 100%
37 Chenega 134 17 23 2 1 14 12% 6% 82%
38 TASC 135 4 6 4 100%
39 World Airways 137 1 1 1 100%
40 EOD Technology 138 14 21 14 100%
41 Scientific Research 140 1 1 1 100%
42 Weeks Marine 149 2 2 2 100%
43 Orbital Sciences 150 1 2 1 100%
44 ARTEL INC 155 8 8 1 7 13% 88%
45 DZSP 21 169 1 1 1 100%
46 Red River 171 5 6 1 4 20% 80%
47 AT&T 173 5 7 1 4 20% 80%
48 Accenture 175 4 4 4 100%
49 Carothers Construction 177 2 5 2 100%
50 ITT Corporation 178 17 33 4 2 11 24% 12% 65%
Source: GAO (personal communications, 2016), including data from the second quarter of FY 2005 through the end of FY 2015.
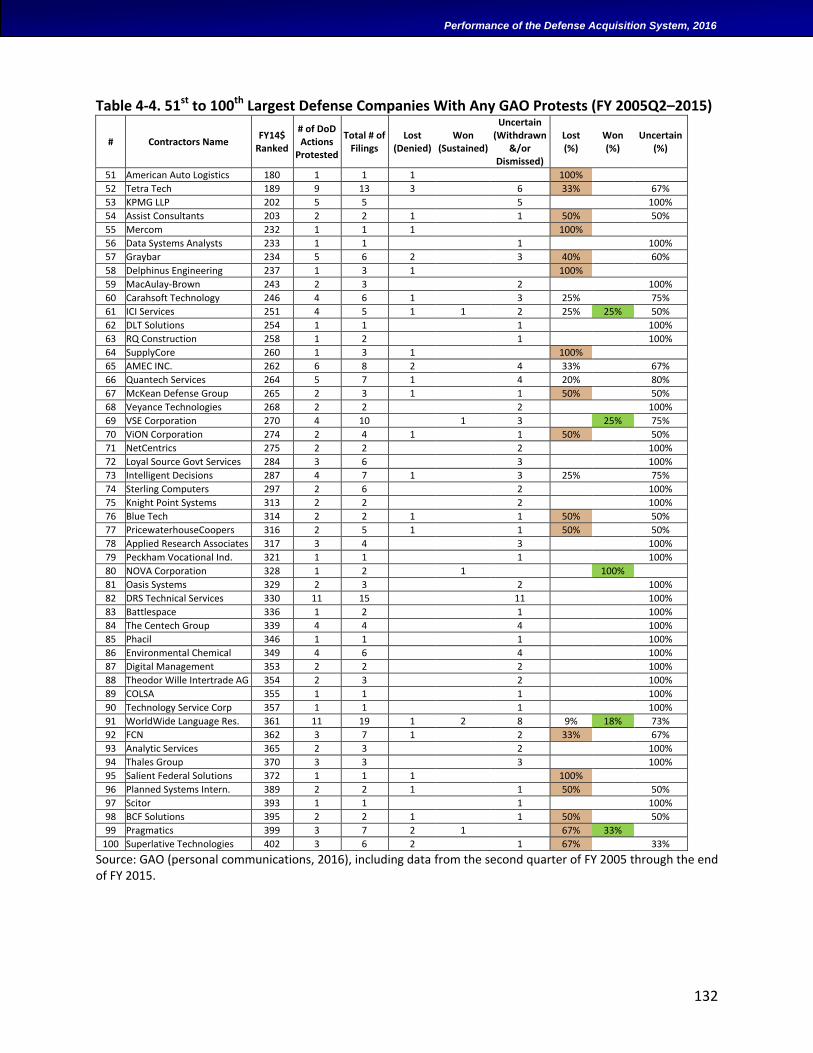
132
Performance of the Defense Acquisition System, 2016
Table 4-4. 51st to 100th Largest Defense Companies With Any GAO Protests (FY 2005Q2–2015)
# Contractors Name FY14$
Ranked
# of DoD Actions
Protested
Total # of Filings
Lost (Denied)
Won (Sustained)
Uncertain (Withdrawn
&/or Dismissed)
Lost (%)
Won (%)
Uncertain (%)
51 American Auto Logistics 180 1 1 1 100%
52 Tetra Tech 189 9 13 3 6 33% 67%
53 KPMG LLP 202 5 5 5 100%
54 Assist Consultants 203 2 2 1 1 50% 50%
55 Mercom 232 1 1 1 100%
56 Data Systems Analysts 233 1 1 1 100%
57 Graybar 234 5 6 2 3 40% 60%
58 Delphinus Engineering 237 1 3 1 100%
59 MacAulay-Brown 243 2 3 2 100%
60 Carahsoft Technology 246 4 6 1 3 25% 75%
61 ICI Services 251 4 5 1 1 2 25% 25% 50%
62 DLT Solutions 254 1 1 1 100%
63 RQ Construction 258 1 2 1 100%
64 SupplyCore 260 1 3 1 100%
65 AMEC INC. 262 6 8 2 4 33% 67%
66 Quantech Services 264 5 7 1 4 20% 80%
67 McKean Defense Group 265 2 3 1 1 50% 50%
68 Veyance Technologies 268 2 2 2 100%
69 VSE Corporation 270 4 10 1 3 25% 75%
70 ViON Corporation 274 2 4 1 1 50% 50%
71 NetCentrics 275 2 2 2 100%
72 Loyal Source Govt Services 284 3 6 3 100%
73 Intelligent Decisions 287 4 7 1 3 25% 75%
74 Sterling Computers 297 2 6 2 100%
75 Knight Point Systems 313 2 2 2 100%
76 Blue Tech 314 2 2 1 1 50% 50%
77 PricewaterhouseCoopers 316 2 5 1 1 50% 50%
78 Applied Research Associates 317 3 4 3 100%
79 Peckham Vocational Ind. 321 1 1 1 100%
80 NOVA Corporation 328 1 2 1 100%
81 Oasis Systems 329 2 3 2 100%
82 DRS Technical Services 330 11 15 11 100%
83 Battlespace 336 1 2 1 100%
84 The Centech Group 339 4 4 4 100%
85 Phacil 346 1 1 1 100%
86 Environmental Chemical 349 4 6 4 100%
87 Digital Management 353 2 2 2 100%
88 Theodor Wille Intertrade AG 354 2 3 2 100%
89 COLSA 355 1 1 1 100%
90 Technology Service Corp 357 1 1 1 100%
91 WorldWide Language Res. 361 11 19 1 2 8 9% 18% 73%
92 FCN 362 3 7 1 2 33% 67%
93 Analytic Services 365 2 3 2 100%
94 Thales Group 370 3 3 3 100%
95 Salient Federal Solutions 372 1 1 1 100%
96 Planned Systems Intern. 389 2 2 1 1 50% 50%
97 Scitor 393 1 1 1 100%
98 BCF Solutions 395 2 2 1 1 50% 50%
99 Pragmatics 399 3 7 2 1 67% 33%
100 Superlative Technologies 402 3 6 2 1 67% 33%
Source: GAO (personal communications, 2016), including data from the second quarter of FY 2005 through the end of FY 2015.
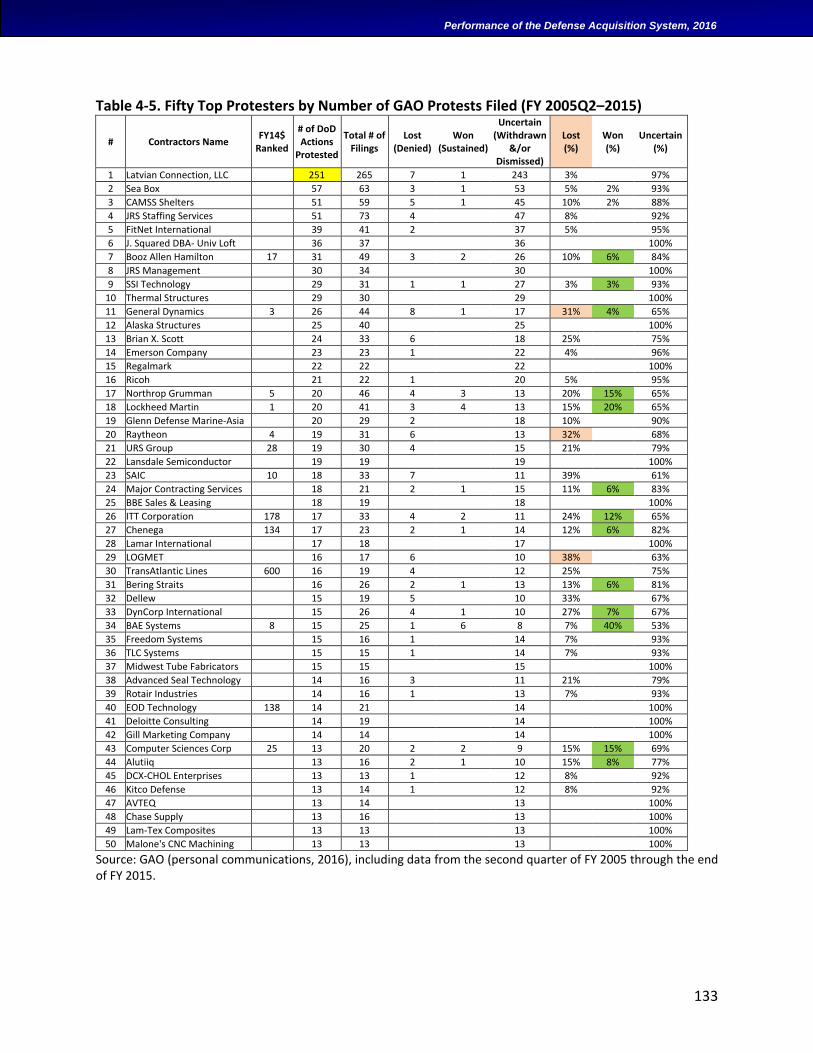
133
Performance of the Defense Acquisition System, 2016
Table 4-5. Fifty Top Protesters by Number of GAO Protests Filed (FY 2005Q2–2015)
# Contractors Name FY14$
Ranked
# of DoD Actions
Protested
Total # of Filings
Lost (Denied)
Won (Sustained)
Uncertain (Withdrawn
&/or Dismissed)
Lost (%)
Won (%)
Uncertain (%)
1 Latvian Connection, LLC 251 265 7 1 243 3% 97%
2 Sea Box 57 63 3 1 53 5% 2% 93%
3 CAMSS Shelters 51 59 5 1 45 10% 2% 88%
4 JRS Staffing Services 51 73 4 47 8% 92%
5 FitNet International 39 41 2 37 5% 95%
6 J. Squared DBA- Univ Loft 36 37 36 100%
7 Booz Allen Hamilton 17 31 49 3 2 26 10% 6% 84%
8 JRS Management 30 34 30 100%
9 SSI Technology 29 31 1 1 27 3% 3% 93%
10 Thermal Structures 29 30 29 100%
11 General Dynamics 3 26 44 8 1 17 31% 4% 65%
12 Alaska Structures 25 40 25 100%
13 Brian X. Scott 24 33 6 18 25% 75%
14 Emerson Company 23 23 1 22 4% 96%
15 Regalmark 22 22 22 100%
16 Ricoh 21 22 1 20 5% 95%
17 Northrop Grumman 5 20 46 4 3 13 20% 15% 65%
18 Lockheed Martin 1 20 41 3 4 13 15% 20% 65%
19 Glenn Defense Marine-Asia 20 29 2 18 10% 90%
20 Raytheon 4 19 31 6 13 32% 68%
21 URS Group 28 19 30 4 15 21% 79%
22 Lansdale Semiconductor 19 19 19 100%
23 SAIC 10 18 33 7 11 39% 61%
24 Major Contracting Services 18 21 2 1 15 11% 6% 83%
25 BBE Sales & Leasing 18 19 18 100%
26 ITT Corporation 178 17 33 4 2 11 24% 12% 65%
27 Chenega 134 17 23 2 1 14 12% 6% 82%
28 Lamar International 17 18 17 100%
29 LOGMET 16 17 6 10 38% 63%
30 TransAtlantic Lines 600 16 19 4 12 25% 75%
31 Bering Straits 16 26 2 1 13 13% 6% 81%
32 Dellew 15 19 5 10 33% 67%
33 DynCorp International 15 26 4 1 10 27% 7% 67%
34 BAE Systems 8 15 25 1 6 8 7% 40% 53%
35 Freedom Systems 15 16 1 14 7% 93%
36 TLC Systems 15 15 1 14 7% 93%
37 Midwest Tube Fabricators 15 15 15 100%
38 Advanced Seal Technology 14 16 3 11 21% 79%
39 Rotair Industries 14 16 1 13 7% 93%
40 EOD Technology 138 14 21 14 100%
41 Deloitte Consulting 14 19 14 100%
42 Gill Marketing Company 14 14 14 100%
43 Computer Sciences Corp 25 13 20 2 2 9 15% 15% 69%
44 Alutiiq 13 16 2 1 10 15% 8% 77%
45 DCX-CHOL Enterprises 13 13 1 12 8% 92%
46 Kitco Defense 13 14 1 12 8% 92%
47 AVTEQ 13 14 13 100%
48 Chase Supply 13 16 13 100%
49 Lam-Tex Composites 13 13 13 100%
50 Malone's CNC Machining 13 13 13 100%
Source: GAO (personal communications, 2016), including data from the second quarter of FY 2005 through the end of FY 2015.
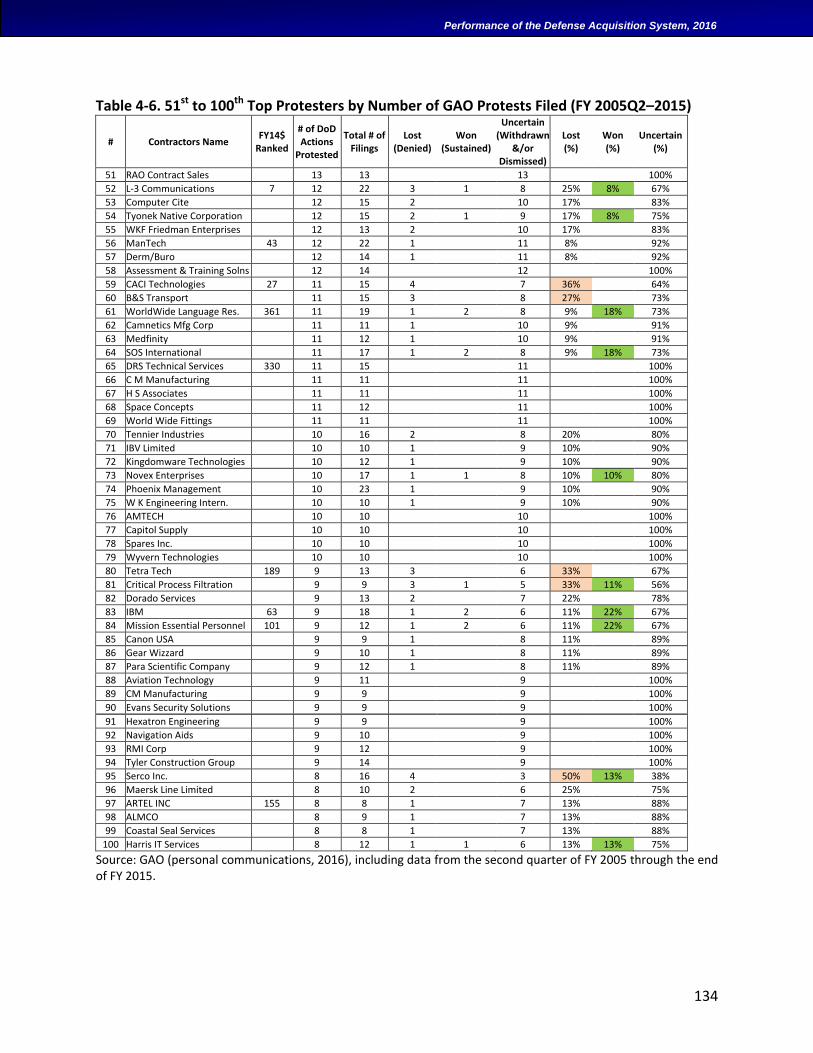
134
Performance of the Defense Acquisition System, 2016
Table 4-6. 51st to 100th Top Protesters by Number of GAO Protests Filed (FY 2005Q2–2015)
# Contractors Name FY14$
Ranked
# of DoD Actions
Protested
Total # of Filings
Lost (Denied)
Won (Sustained)
Uncertain (Withdrawn
&/or Dismissed)
Lost (%)
Won (%)
Uncertain (%)
51 RAO Contract Sales 13 13 13 100%
52 L-3 Communications 7 12 22 3 1 8 25% 8% 67%
53 Computer Cite 12 15 2 10 17% 83%
54 Tyonek Native Corporation 12 15 2 1 9 17% 8% 75%
55 WKF Friedman Enterprises 12 13 2 10 17% 83%
56 ManTech 43 12 22 1 11 8% 92%
57 Derm/Buro 12 14 1 11 8% 92%
58 Assessment & Training Solns 12 14 12 100%
59 CACI Technologies 27 11 15 4 7 36% 64%
60 B&S Transport 11 15 3 8 27% 73%
61 WorldWide Language Res. 361 11 19 1 2 8 9% 18% 73%
62 Camnetics Mfg Corp 11 11 1 10 9% 91%
63 Medfinity 11 12 1 10 9% 91%
64 SOS International 11 17 1 2 8 9% 18% 73%
65 DRS Technical Services 330 11 15 11 100%
66 C M Manufacturing 11 11 11 100%
67 H S Associates 11 11 11 100%
68 Space Concepts 11 12 11 100%
69 World Wide Fittings 11 11 11 100%
70 Tennier Industries 10 16 2 8 20% 80%
71 IBV Limited 10 10 1 9 10% 90%
72 Kingdomware Technologies 10 12 1 9 10% 90%
73 Novex Enterprises 10 17 1 1 8 10% 10% 80%
74 Phoenix Management 10 23 1 9 10% 90%
75 W K Engineering Intern. 10 10 1 9 10% 90%
76 AMTECH 10 10 10 100%
77 Capitol Supply 10 10 10 100%
78 Spares Inc. 10 10 10 100%
79 Wyvern Technologies 10 10 10 100%
80 Tetra Tech 189 9 13 3 6 33% 67%
81 Critical Process Filtration 9 9 3 1 5 33% 11% 56%
82 Dorado Services 9 13 2 7 22% 78%
83 IBM 63 9 18 1 2 6 11% 22% 67%
84 Mission Essential Personnel 101 9 12 1 2 6 11% 22% 67%
85 Canon USA 9 9 1 8 11% 89%
86 Gear Wizzard 9 10 1 8 11% 89%
87 Para Scientific Company 9 12 1 8 11% 89%
88 Aviation Technology 9 11 9 100%
89 CM Manufacturing 9 9 9 100%
90 Evans Security Solutions 9 9 9 100%
91 Hexatron Engineering 9 9 9 100%
92 Navigation Aids 9 10 9 100%
93 RMI Corp 9 12 9 100%
94 Tyler Construction Group 9 14 9 100%
95 Serco Inc. 8 16 4 3 50% 13% 38%
96 Maersk Line Limited 8 10 2 6 25% 75%
97 ARTEL INC 155 8 8 1 7 13% 88%
98 ALMCO 8 9 1 7 13% 88%
99 Coastal Seal Services 8 8 1 7 13% 88%
100 Harris IT Services 8 12 1 1 6 13% 13% 75%
Source: GAO (personal communications, 2016), including data from the second quarter of FY 2005 through the end of FY 2015.
135
Performance of the Defense Acquisition System, 2016
RATES OF COMPETITIVE CONTRACTING ACROSS THE DOD FOR GOODS AND SERVICES
Competition—both head-to-head on contract competitions and environments that introduce competitive pressures in other ways—is a central tenet of our BBP initiatives. When viable, competition is, perhaps, the single best way to motivate contractors to provide the best value (i.e., the best performance at the lowest price). We have set a strategic objective to increase the percentage of spending on competed contracts from current levels. The military departments each analyze projections of future acquisitions to identify opportunities and creative strategies for future competitive awards.
Figure H-17, shown earlier on page xliii, plots the percentage of all DoD contract dollars competitively awarded from FY 2006 through FY 2015. Since goals were established in FY 2010, we had declining actuals until we made progress toward reversing the trend in FY 2014. However, competition rates declined in FY 2015 despite an increased goal for that year.
Challenges to increasing competition rates include high-value sole-source Foreign Military Sales as well as large remaining production runs for ships and aircraft that have already passed their competitive development phase. Increased industry bid-protesting of source selections also force the DoD to award sole-source contracts to provide “bridge” goods and services in the interim until the protests are resolved and the new contracts can be awarded. Fiscal uncertainty, including continuing resolutions and continued downward pressure on base and Overseas Contingency Operations funding, will negatively affect FY 2016 and future competition rates.
Despite these challenges, the DoD is continuing to pursue various approaches for breaking out system components for competition, opening system architectures for competing components and upgrades, and identifying new competitive sources. Beyond this kind of head-to-head competition, we are also expanding the types and use of other competitive environments to drive performance and cost savings (USD(AT&L), 2014b). For example, the Navy’s evolving Profit-Related-to-Offer techniques adjust profits and production share between two captive shipyards based on bidding and cost control. Finally, analysis is continuing to set goals based on what is achievable rather than on simply setting goals based on prior actuals.
SMALL-BUSINESS PARTICIPATION
Pursuing small-business utilization goals has been both a statutory requirement and administration priority because of the potential benefits from small-business contributions in both innovation and efficiency. More small-business engagement can increase the competitive nature of our solicitations, resulting in better cost and schedule performance on contracts. Small businesses also can infuse new, innovative technical solutions as capabilities are pursued for U.S. warfighters.
Figure H-14, shown earlier on page xl, plots actual DoD-wide small-business utilization (measured by obligations) relative to yearly goals for prime contracts. Recent trends since FY 2011 have been steadily improving; we exceeded our FY 2014 and 2015 goals by 2.1 and 3.0
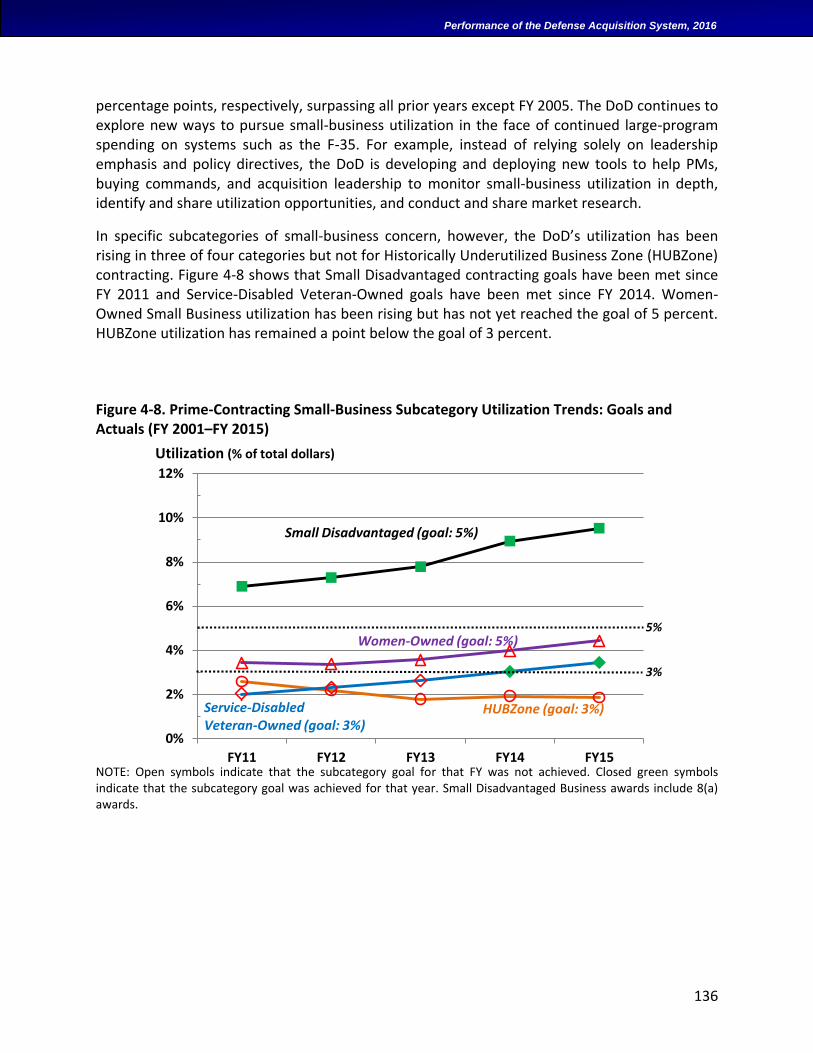
136
Performance of the Defense Acquisition System, 2016
percentage points, respectively, surpassing all prior years except FY 2005. The DoD continues to explore new ways to pursue small-business utilization in the face of continued large-program spending on systems such as the F-35. For example, instead of relying solely on leadership emphasis and policy directives, the DoD is developing and deploying new tools to help PMs, buying commands, and acquisition leadership to monitor small-business utilization in depth, identify and share utilization opportunities, and conduct and share market research.
In specific subcategories of small-business concern, however, the DoD’s utilization has been rising in three of four categories but not for Historically Underutilized Business Zone (HUBZone) contracting. Figure 4-8 shows that Small Disadvantaged contracting goals have been met since FY 2011 and Service-Disabled Veteran-Owned goals have been met since FY 2014. Women-Owned Small Business utilization has been rising but has not yet reached the goal of 5 percent. HUBZone utilization has remained a point below the goal of 3 percent.
Figure 4-8. Prime-Contracting Small-Business Subcategory Utilization Trends: Goals and Actuals (FY 2001–FY 2015)
NOTE: Open symbols indicate that the subcategory goal for that FY was not achieved. Closed green symbols indicate that the subcategory goal was achieved for that year. Small Disadvantaged Business awards include 8(a) awards.
0%
2%
4%
6%
8%
10%
12%
FY11 FY12 FY13 FY14 FY15
Utilization (% of total dollars)
HUBZone (goal: 3%)
Women-Owned (goal: 5%)
Service-DisabledVeteran-Owned (goal: 3%)
Small Disadvantaged (goal: 5%)
5%
3%
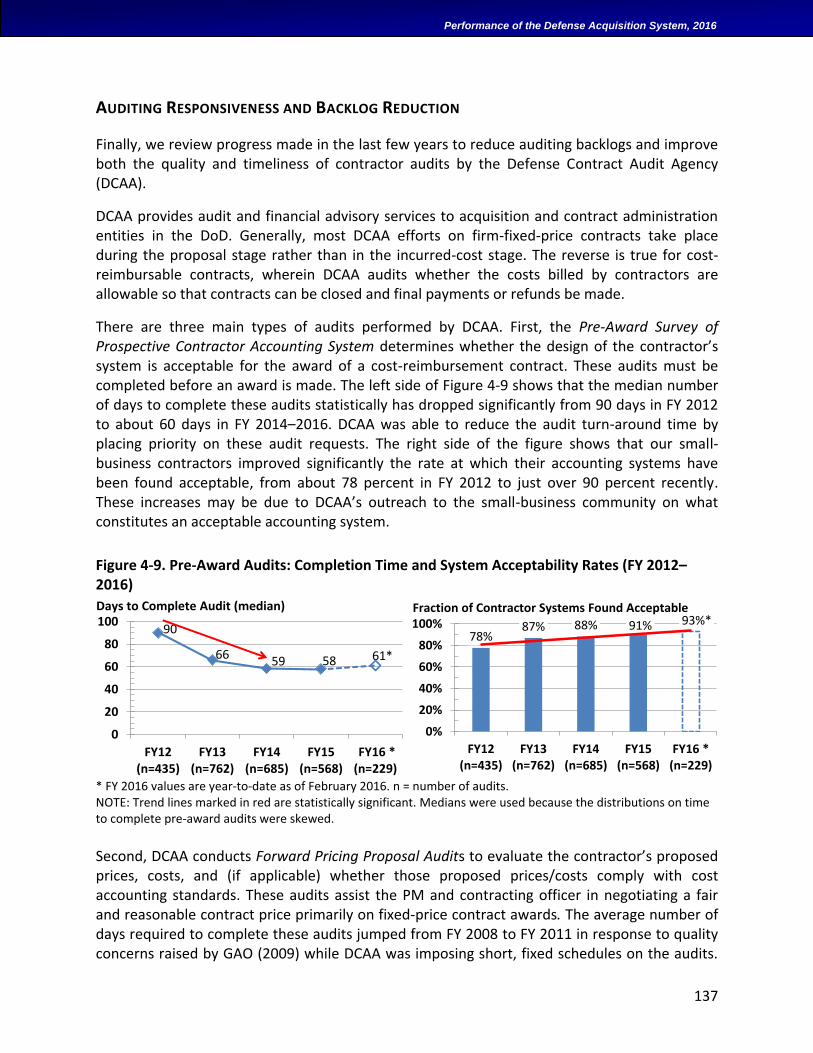
137
Performance of the Defense Acquisition System, 2016
AUDITING RESPONSIVENESS AND BACKLOG REDUCTION
Finally, we review progress made in the last few years to reduce auditing backlogs and improve both the quality and timeliness of contractor audits by the Defense Contract Audit Agency (DCAA).
DCAA provides audit and financial advisory services to acquisition and contract administration entities in the DoD. Generally, most DCAA efforts on firm-fixed-price contracts take place during the proposal stage rather than in the incurred-cost stage. The reverse is true for cost-reimbursable contracts, wherein DCAA audits whether the costs billed by contractors are allowable so that contracts can be closed and final payments or refunds be made.
There are three main types of audits performed by DCAA. First, the Pre-Award Survey of Prospective Contractor Accounting System determines whether the design of the contractor’s system is acceptable for the award of a cost-reimbursement contract. These audits must be completed before an award is made. The left side of Figure 4-9 shows that the median number of days to complete these audits statistically has dropped significantly from 90 days in FY 2012 to about 60 days in FY 2014–2016. DCAA was able to reduce the audit turn-around time by placing priority on these audit requests. The right side of the figure shows that our small-business contractors improved significantly the rate at which their accounting systems have been found acceptable, from about 78 percent in FY 2012 to just over 90 percent recently. These increases may be due to DCAA’s outreach to the small-business community on what constitutes an acceptable accounting system.
Figure 4-9. Pre-Award Audits: Completion Time and System Acceptability Rates (FY 2012–2016)
* FY 2016 values are year-to-date as of February 2016. n = number of audits. NOTE: Trend lines marked in red are statistically significant. Medians were used because the distributions on time to complete pre-award audits were skewed.
Second, DCAA conducts Forward Pricing Proposal Audits to evaluate the contractor’s proposed prices, costs, and (if applicable) whether those proposed prices/costs comply with cost accounting standards. These audits assist the PM and contracting officer in negotiating a fair and reasonable contract price primarily on fixed-price contract awards. The average number of days required to complete these audits jumped from FY 2008 to FY 2011 in response to quality concerns raised by GAO (2009) while DCAA was imposing short, fixed schedules on the audits.
90
66 59 58 61*
0
20
40
60
80
100
FY12(n=435)
FY13(n=762)
FY14(n=685)
FY15(n=568)
FY16 *(n=229)
Days to Complete Audit (median)
78%87% 88% 91% 93%*
0%
20%
40%
60%
80%
100%
FY12(n=435)
FY13(n=762)
FY14(n=685)
FY15(n=568)
FY16 *(n=229)
Fraction of Contractor Systems Found Acceptable
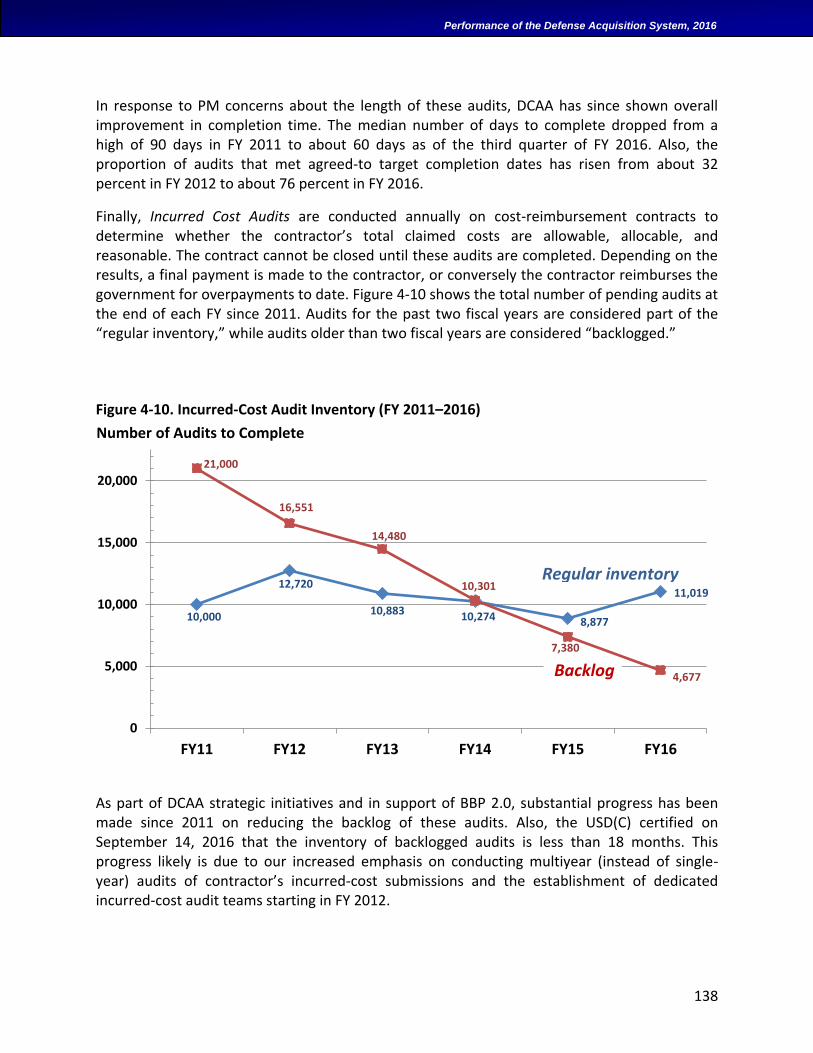
138
Performance of the Defense Acquisition System, 2016
In response to PM concerns about the length of these audits, DCAA has since shown overall improvement in completion time. The median number of days to complete dropped from a high of 90 days in FY 2011 to about 60 days as of the third quarter of FY 2016. Also, the proportion of audits that met agreed-to target completion dates has risen from about 32 percent in FY 2012 to about 76 percent in FY 2016.
Finally, Incurred Cost Audits are conducted annually on cost-reimbursement contracts to determine whether the contractor’s total claimed costs are allowable, allocable, and reasonable. The contract cannot be closed until these audits are completed. Depending on the results, a final payment is made to the contractor, or conversely the contractor reimburses the government for overpayments to date. Figure 4-10 shows the total number of pending audits at the end of each FY since 2011. Audits for the past two fiscal years are considered part of the “regular inventory,” while audits older than two fiscal years are considered “backlogged.”
Figure 4-10. Incurred-Cost Audit Inventory (FY 2011–2016)
As part of DCAA strategic initiatives and in support of BBP 2.0, substantial progress has been made since 2011 on reducing the backlog of these audits. Also, the USD(C) certified on September 14, 2016 that the inventory of backlogged audits is less than 18 months. This progress likely is due to our increased emphasis on conducting multiyear (instead of single-year) audits of contractor’s incurred-cost submissions and the establishment of dedicated incurred-cost audit teams starting in FY 2012.
10,000
12,720
10,883 10,274 8,877
11,019
21,000
16,551
14,480
10,301
7,380
4,677
0
5,000
10,000
15,000
20,000
FY11 FY12 FY13 FY14 FY15 FY16
Regular inventory
Number of Audits to Complete
Backlog
139
Performance of the Defense Acquisition System, 2016
A. OVERVIEW OF BETTER BUYING POWER
BBP seeks to obtain greater efficiency and productivity in defense spending through leadership emphasis on cost control, streamlined processes, reduced bureaucracy, productivity, innovation, competition, the acquisition of contracted services, and workforce capabilities.
There are three full iterations of BBP to date. Table A-1 lists the initiatives for the first iteration (USD(AT&L), 2010) grouped into five focus areas. The goal is to improve acquisition by improving efficiency and productivity—doing more without more. Specific initiatives emphasized acquisition fundamentals while implementing proven lessons and best practices.
The second iteration of BBP (USD(AT&L), 2013a) added an emphasis on improving the acquisition workforce. Table A-2 lists the seven areas and underlying initiatives for BBP 2.0. Finally, the third iteration of BBP (USD(AT&L), 2015d) continues prior focus areas while strengthening our emphasis on innovation, technical excellence, and the quality of our products. Table A-3 lists the areas and initiatives for BBP 3.0.
GUIDING PRINCIPLES OF BETTER BUYING POWER
Throughout its initiatives, BBP reinforces the principles of defense acquisition (Kendall, 2016a):
People matter most; we can never be too professional or too competent.
Continuous improvement will be more effective than radical change.
Data should drive policy.
Critical thinking is necessary for success; fixed rules are too constraining.
Controlling life-cycle cost is one of our jobs; staying on budget isn’t enough.
Incentives work—we get what we reward.
Competition and the threat of competition are the most effective incentives.
Defense acquisition is a team sport.
Our technological superiority is at risk and we must respond.
We should have the courage to challenge bad policy.
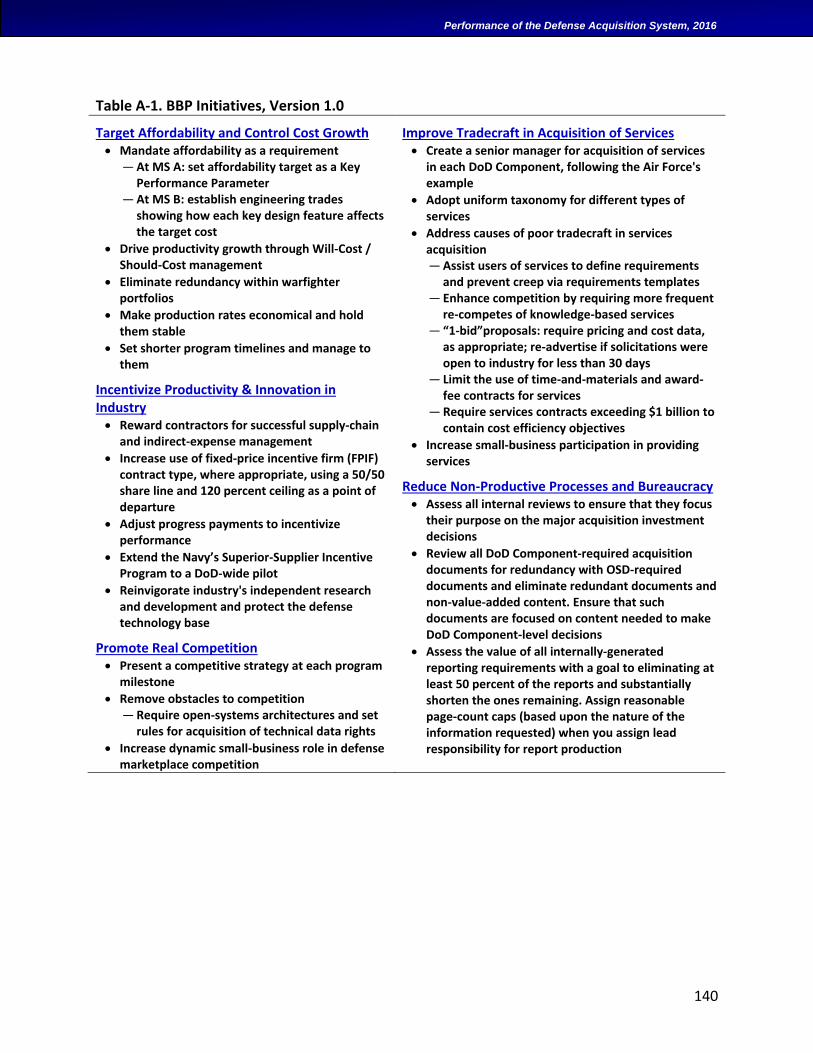
140
Performance of the Defense Acquisition System, 2016
Table A-1. BBP Initiatives, Version 1.0
Target Affordability and Control Cost Growth Mandate affordability as a requirement
— At MS A: set affordability target as a Key Performance Parameter
— At MS B: establish engineering trades showing how each key design feature affects the target cost
Drive productivity growth through Will-Cost / Should-Cost management
Eliminate redundancy within warfighter portfolios
Make production rates economical and hold them stable
Set shorter program timelines and manage to them
Incentivize Productivity & Innovation in Industry Reward contractors for successful supply-chain
and indirect-expense management
Increase use of fixed-price incentive firm (FPIF) contract type, where appropriate, using a 50/50 share line and 120 percent ceiling as a point of departure
Adjust progress payments to incentivize performance
Extend the Navy’s Superior-Supplier Incentive Program to a DoD-wide pilot
Reinvigorate industry's independent research and development and protect the defense technology base
Promote Real Competition Present a competitive strategy at each program
milestone
Remove obstacles to competition — Require open-systems architectures and set
rules for acquisition of technical data rights
Increase dynamic small-business role in defense marketplace competition
Improve Tradecraft in Acquisition of Services Create a senior manager for acquisition of services
in each DoD Component, following the Air Force's example
Adopt uniform taxonomy for different types of services
Address causes of poor tradecraft in services acquisition — Assist users of services to define requirements
and prevent creep via requirements templates — Enhance competition by requiring more frequent
re-competes of knowledge-based services — “1-bid”proposals: require pricing and cost data,
as appropriate; re-advertise if solicitations were open to industry for less than 30 days
— Limit the use of time-and-materials and award-fee contracts for services
— Require services contracts exceeding $1 billion to contain cost efficiency objectives
Increase small-business participation in providing services
Reduce Non-Productive Processes and Bureaucracy Assess all internal reviews to ensure that they focus
their purpose on the major acquisition investment decisions
Review all DoD Component-required acquisition documents for redundancy with OSD-required documents and eliminate redundant documents and non-value-added content. Ensure that such documents are focused on content needed to make DoD Component-level decisions
Assess the value of all internally-generated reporting requirements with a goal to eliminating at least 50 percent of the reports and substantially shorten the ones remaining. Assign reasonable page-count caps (based upon the nature of the information requested) when you assign lead responsibility for report production
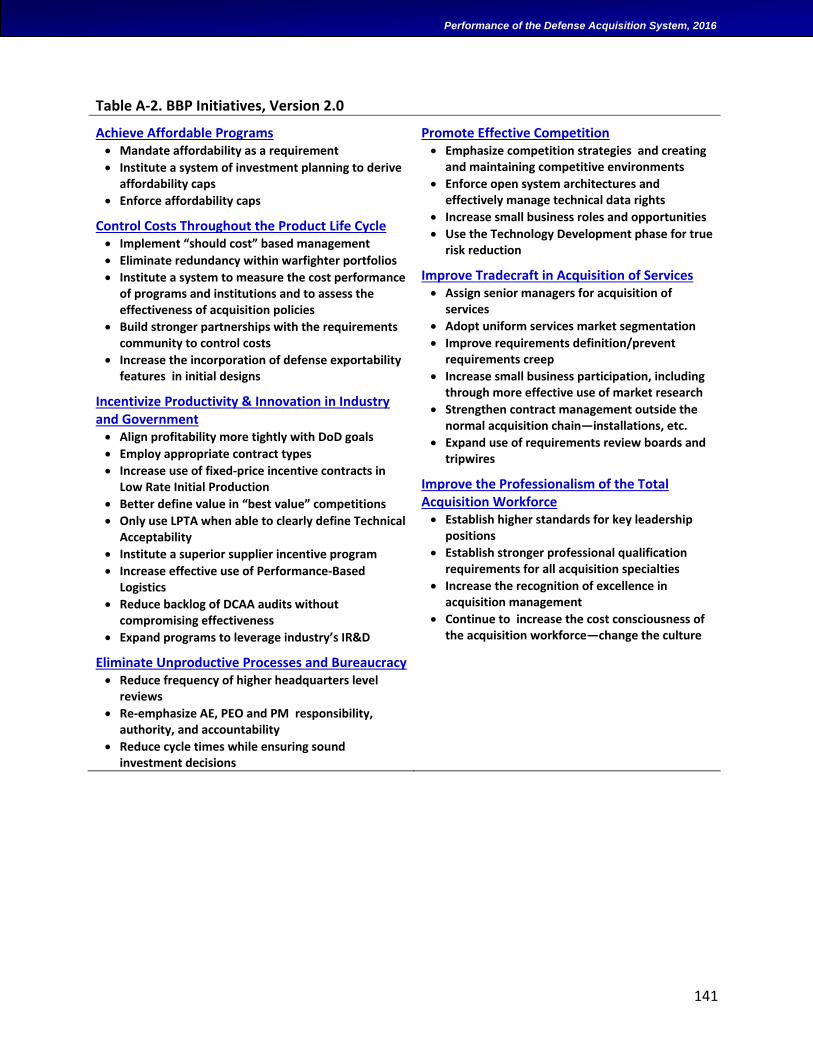
141
Performance of the Defense Acquisition System, 2016
Table A-2. BBP Initiatives, Version 2.0
Achieve Affordable Programs Mandate affordability as a requirement
Institute a system of investment planning to derive affordability caps
Enforce affordability caps
Control Costs Throughout the Product Life Cycle Implement “should cost” based management
Eliminate redundancy within warfighter portfolios
Institute a system to measure the cost performance of programs and institutions and to assess the effectiveness of acquisition policies
Build stronger partnerships with the requirements community to control costs
Increase the incorporation of defense exportability features in initial designs
Incentivize Productivity & Innovation in Industry and Government Align profitability more tightly with DoD goals
Employ appropriate contract types
Increase use of fixed-price incentive contracts in Low Rate Initial Production
Better define value in “best value” competitions
Only use LPTA when able to clearly define Technical Acceptability
Institute a superior supplier incentive program
Increase effective use of Performance-Based Logistics
Reduce backlog of DCAA audits without compromising effectiveness
Expand programs to leverage industry’s IR&D
Eliminate Unproductive Processes and Bureaucracy Reduce frequency of higher headquarters level
reviews
Re-emphasize AE, PEO and PM responsibility, authority, and accountability
Reduce cycle times while ensuring sound investment decisions
Promote Effective Competition Emphasize competition strategies and creating
and maintaining competitive environments
Enforce open system architectures and effectively manage technical data rights
Increase small business roles and opportunities
Use the Technology Development phase for true risk reduction
Improve Tradecraft in Acquisition of Services Assign senior managers for acquisition of
services
Adopt uniform services market segmentation
Improve requirements definition/prevent requirements creep
Increase small business participation, including through more effective use of market research
Strengthen contract management outside the normal acquisition chain—installations, etc.
Expand use of requirements review boards and tripwires
Improve the Professionalism of the Total Acquisition Workforce Establish higher standards for key leadership
positions
Establish stronger professional qualification requirements for all acquisition specialties
Increase the recognition of excellence in acquisition management
Continue to increase the cost consciousness of the acquisition workforce—change the culture
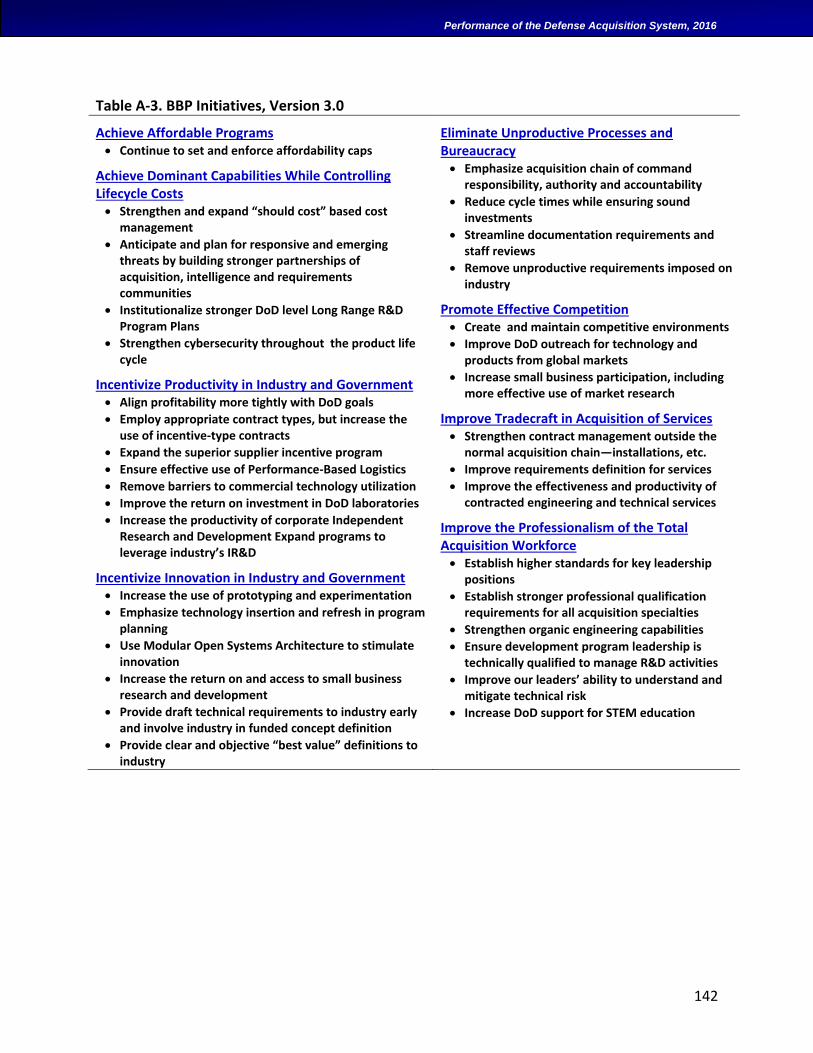
142
Performance of the Defense Acquisition System, 2016
Table A-3. BBP Initiatives, Version 3.0
Achieve Affordable Programs Continue to set and enforce affordability caps
Achieve Dominant Capabilities While Controlling Lifecycle Costs Strengthen and expand “should cost” based cost
management
Anticipate and plan for responsive and emerging threats by building stronger partnerships of acquisition, intelligence and requirements communities
Institutionalize stronger DoD level Long Range R&D Program Plans
Strengthen cybersecurity throughout the product life cycle
Incentivize Productivity in Industry and Government Align profitability more tightly with DoD goals
Employ appropriate contract types, but increase the use of incentive-type contracts
Expand the superior supplier incentive program
Ensure effective use of Performance-Based Logistics
Remove barriers to commercial technology utilization
Improve the return on investment in DoD laboratories
Increase the productivity of corporate Independent Research and Development Expand programs to leverage industry’s IR&D
Incentivize Innovation in Industry and Government Increase the use of prototyping and experimentation
Emphasize technology insertion and refresh in program planning
Use Modular Open Systems Architecture to stimulate innovation
Increase the return on and access to small business research and development
Provide draft technical requirements to industry early and involve industry in funded concept definition
Provide clear and objective “best value” definitions to industry
Eliminate Unproductive Processes and Bureaucracy Emphasize acquisition chain of command
responsibility, authority and accountability
Reduce cycle times while ensuring sound investments
Streamline documentation requirements and staff reviews
Remove unproductive requirements imposed on industry
Promote Effective Competition Create and maintain competitive environments
Improve DoD outreach for technology and products from global markets
Increase small business participation, including more effective use of market research
Improve Tradecraft in Acquisition of Services Strengthen contract management outside the
normal acquisition chain—installations, etc.
Improve requirements definition for services
Improve the effectiveness and productivity of contracted engineering and technical services
Improve the Professionalism of the Total Acquisition Workforce Establish higher standards for key leadership
positions
Establish stronger professional qualification requirements for all acquisition specialties
Strengthen organic engineering capabilities
Ensure development program leadership is technically qualified to manage R&D activities
Improve our leaders’ ability to understand and mitigate technical risk
Increase DoD support for STEM education
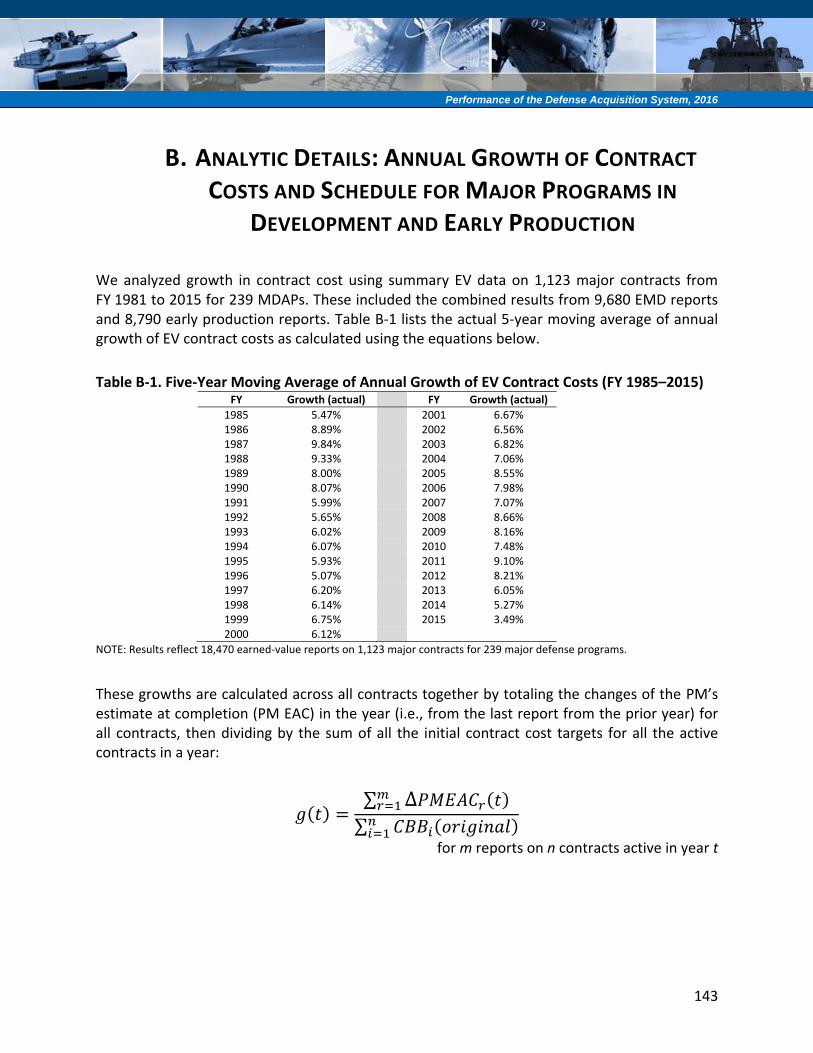
143
Performance of the Defense Acquisition System, 2016
B. ANALYTIC DETAILS: ANNUAL GROWTH OF CONTRACT
COSTS AND SCHEDULE FOR MAJOR PROGRAMS IN
DEVELOPMENT AND EARLY PRODUCTION
We analyzed growth in contract cost using summary EV data on 1,123 major contracts from FY 1981 to 2015 for 239 MDAPs. These included the combined results from 9,680 EMD reports and 8,790 early production reports. Table B-1 lists the actual 5-year moving average of annual growth of EV contract costs as calculated using the equations below.
Table B-1. Five-Year Moving Average of Annual Growth of EV Contract Costs (FY 1985–2015) FY Growth (actual) FY Growth (actual)
1985 5.47% 2001 6.67% 1986 8.89% 2002 6.56% 1987 9.84% 2003 6.82% 1988 9.33% 2004 7.06% 1989 8.00% 2005 8.55% 1990 8.07% 2006 7.98% 1991 5.99% 2007 7.07% 1992 5.65% 2008 8.66% 1993 6.02% 2009 8.16% 1994 6.07% 2010 7.48% 1995 5.93% 2011 9.10% 1996 5.07% 2012 8.21% 1997 6.20% 2013 6.05% 1998 6.14% 2014 5.27% 1999 6.75% 2015 3.49% 2000 6.12%
NOTE: Results reflect 18,470 earned-value reports on 1,123 major contracts for 239 major defense programs.
These growths are calculated across all contracts together by totaling the changes of the PM’s estimate at completion (PM EAC) in the year (i.e., from the last report from the prior year) for all contracts, then dividing by the sum of all the initial contract cost targets for all the active contracts in a year:
𝑔(𝑡) =∑ ∆𝑃𝑀𝐸𝐴𝐶𝑟(𝑡)𝑚
𝑟=1
∑ 𝐶𝐵𝐵𝑖(𝑜𝑟𝑖𝑔𝑖𝑛𝑎𝑙)𝑛𝑖=1
for m reports on n contracts active in year t
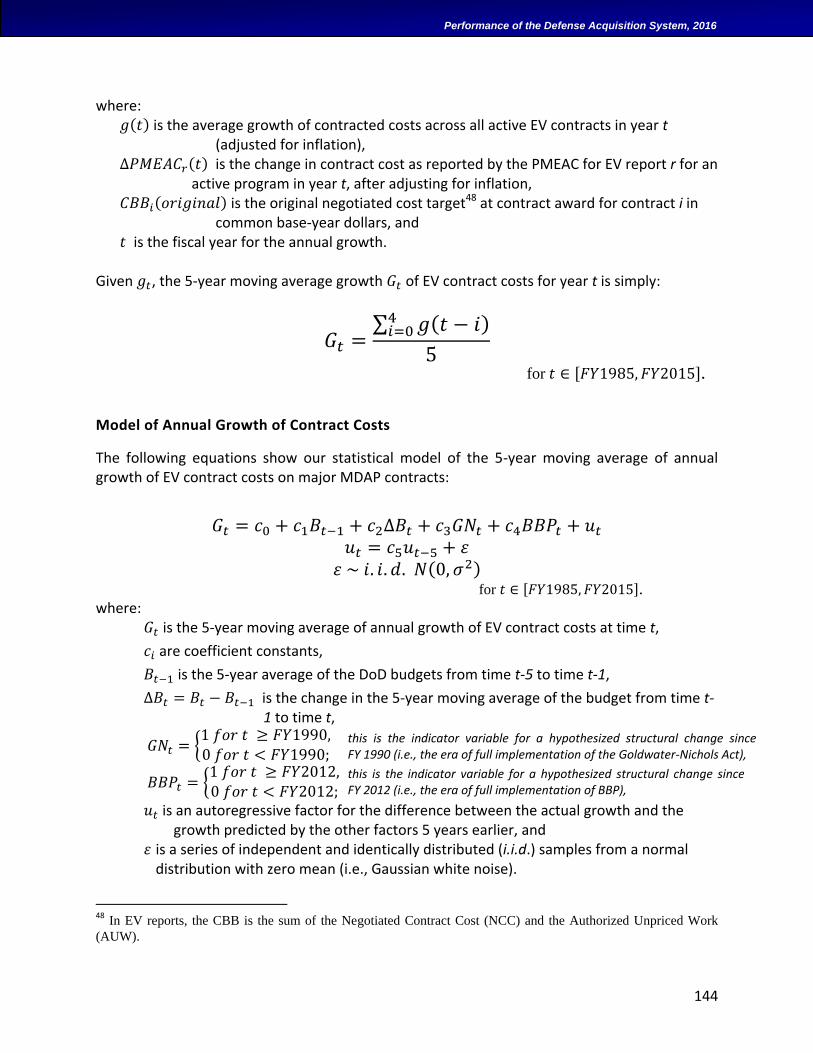
144
Performance of the Defense Acquisition System, 2016
where: 𝑔(𝑡) is the average growth of contracted costs across all active EV contracts in year t
(adjusted for inflation), ∆𝑃𝑀𝐸𝐴𝐶𝑟(𝑡) is the change in contract cost as reported by the PMEAC for EV report r for an
active program in year t, after adjusting for inflation, 𝐶𝐵𝐵𝑖(𝑜𝑟𝑖𝑔𝑖𝑛𝑎𝑙) is the original negotiated cost target48 at contract award for contract i in
common base-year dollars, and 𝑡 is the fiscal year for the annual growth.
Given 𝑔𝑡, the 5-year moving average growth 𝐺𝑡 of EV contract costs for year t is simply:
𝐺𝑡 =∑ 𝑔(𝑡 − 𝑖)4
𝑖=0
5
for 𝑡 ∈ [𝐹𝑌1985, 𝐹𝑌2015].
Model of Annual Growth of Contract Costs
The following equations show our statistical model of the 5-year moving average of annual growth of EV contract costs on major MDAP contracts:
𝐺𝑡 = 𝑐0 + 𝑐1𝐵𝑡−1 + 𝑐2∆𝐵𝑡 + 𝑐3𝐺𝑁𝑡 + 𝑐4𝐵𝐵𝑃𝑡 + 𝑢𝑡
𝑢𝑡 = 𝑐5𝑢𝑡−5 + 𝜀
𝜀 ~ 𝑖. 𝑖. 𝑑. 𝑁(0, 𝜎2) for 𝑡 ∈ [𝐹𝑌1985, 𝐹𝑌2015].
where: 𝐺𝑡 is the 5-year moving average of annual growth of EV contract costs at time t,
𝑐𝑖 are coefficient constants,
𝐵𝑡−1 is the 5-year average of the DoD budgets from time t-5 to time t-1,
∆𝐵𝑡 = 𝐵𝑡 − 𝐵𝑡−1 is the change in the 5-year moving average of the budget from time t-1 to time t,
𝐺𝑁𝑡 = {1 𝑓𝑜𝑟 𝑡 ≥ 𝐹𝑌1990,0 𝑓𝑜𝑟 𝑡 < 𝐹𝑌1990;
𝐵𝐵𝑃𝑡 = {1 𝑓𝑜𝑟 𝑡 ≥ 𝐹𝑌2012,0 𝑓𝑜𝑟 𝑡 < 𝐹𝑌2012;
𝑢𝑡 is an autoregressive factor for the difference between the actual growth and the growth predicted by the other factors 5 years earlier, and
𝜀 is a series of independent and identically distributed (i.i.d.) samples from a normal distribution with zero mean (i.e., Gaussian white noise).
48
In EV reports, the CBB is the sum of the Negotiated Contract Cost (NCC) and the Authorized Unpriced Work
(AUW).
this is the indicator variable for a hypothesized structural change since FY 1990 (i.e., the era of full implementation of the Goldwater-Nichols Act),
this is the indicator variable for a hypothesized structural change since FY 2012 (i.e., the era of full implementation of BBP),
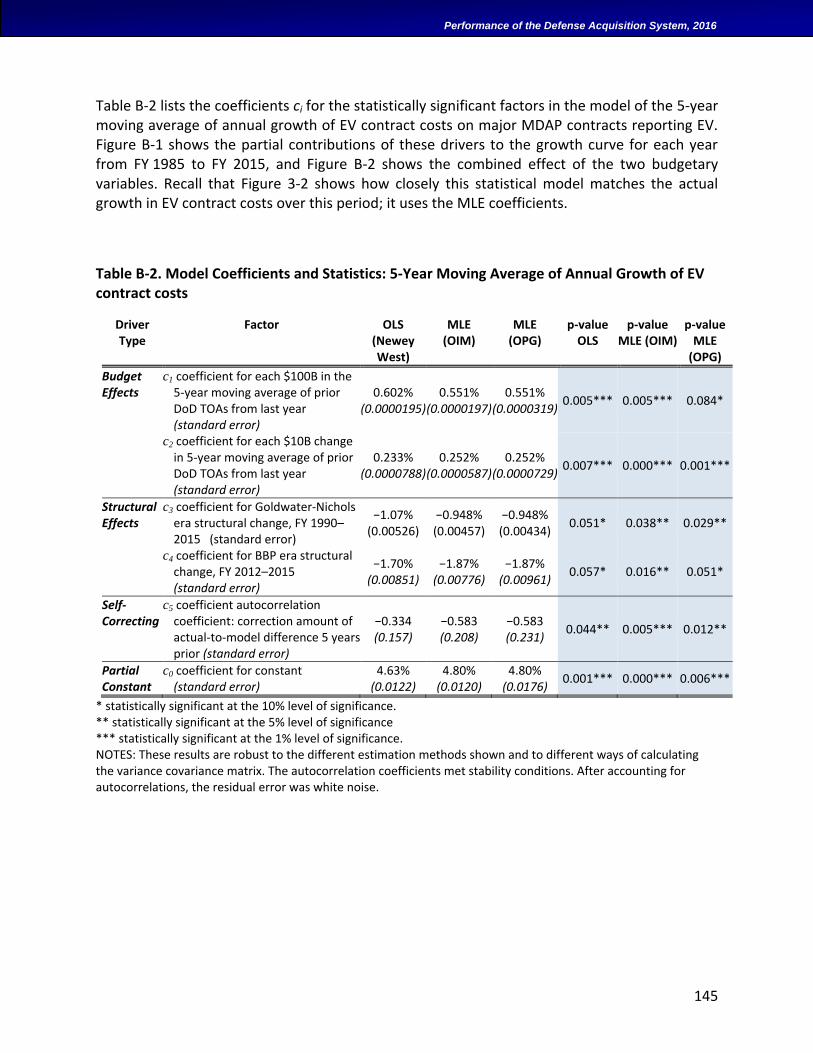
145
Performance of the Defense Acquisition System, 2016
Table B-2 lists the coefficients ci for the statistically significant factors in the model of the 5-year moving average of annual growth of EV contract costs on major MDAP contracts reporting EV. Figure B-1 shows the partial contributions of these drivers to the growth curve for each year from FY 1985 to FY 2015, and Figure B-2 shows the combined effect of the two budgetary variables. Recall that Figure 3-2 shows how closely this statistical model matches the actual growth in EV contract costs over this period; it uses the MLE coefficients.
Table B-2. Model Coefficients and Statistics: 5-Year Moving Average of Annual Growth of EV contract costs
Driver Type
Factor OLS (Newey West)
MLE (OIM)
MLE (OPG)
p-value OLS
p-value MLE (OIM)
p-value MLE
(OPG)
Budget Effects
c1 coefficient for each $100B in the 5-year moving average of prior DoD TOAs from last year (standard error)
0.602% (0.0000195)
0.551% (0.0000197)
0.551% (0.0000319)
0.005*** 0.005*** 0.084*
c2 coefficient for each $10B change in 5-year moving average of prior DoD TOAs from last year (standard error)
0.233% (0.0000788)
0.252% (0.0000587)
0.252% (0.0000729)
0.007*** 0.000*** 0.001***
Structural Effects
c3 coefficient for Goldwater-Nichols era structural change, FY 1990–2015 (standard error)
−1.07% (0.00526)
−0.948% (0.00457)
−0.948% (0.00434)
0.051* 0.038** 0.029**
c4 coefficient for BBP era structural change, FY 2012–2015 (standard error)
−1.70% (0.00851)
−1.87% (0.00776)
−1.87% (0.00961)
0.057* 0.016** 0.051*
Self-Correcting
c5 coefficient autocorrelation coefficient: correction amount of actual-to-model difference 5 years prior (standard error)
−0.334 (0.157)
−0.583 (0.208)
−0.583 (0.231)
0.044** 0.005*** 0.012**
Partial Constant
c0 coefficient for constant (standard error)
4.63% (0.0122)
4.80% (0.0120)
4.80% (0.0176)
0.001*** 0.000*** 0.006***
* statistically significant at the 10% level of significance. ** statistically significant at the 5% level of significance *** statistically significant at the 1% level of significance. NOTES: These results are robust to the different estimation methods shown and to different ways of calculating the variance covariance matrix. The autocorrelation coefficients met stability conditions. After accounting for autocorrelations, the residual error was white noise.
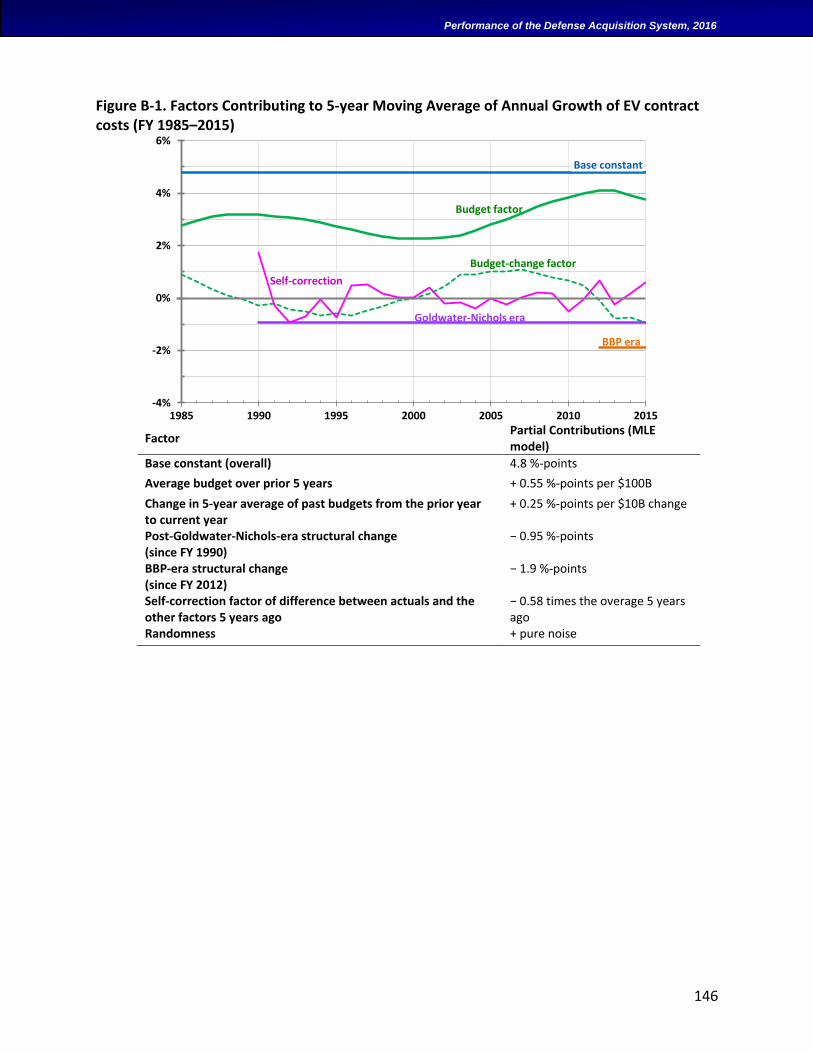
146
Performance of the Defense Acquisition System, 2016
Figure B-1. Factors Contributing to 5-year Moving Average of Annual Growth of EV contract costs (FY 1985–2015)
Factor Partial Contributions (MLE model)
Base constant (overall) 4.8 %-points
Average budget over prior 5 years + 0.55 %-points per $100B
Change in 5-year average of past budgets from the prior year to current year
+ 0.25 %-points per $10B change
Post-Goldwater-Nichols-era structural change (since FY 1990)
− 0.95 %-points
BBP-era structural change (since FY 2012)
− 1.9 %-points
Self-correction factor of difference between actuals and the other factors 5 years ago
− 0.58 times the overage 5 years ago
Randomness + pure noise
-4%
-2%
0%
2%
4%
6%
1985 1990 1995 2000 2005 2010 2015
Base constant
BBP era
Goldwater-Nichols era
Budget factor
Budget-change factor
Self-correction
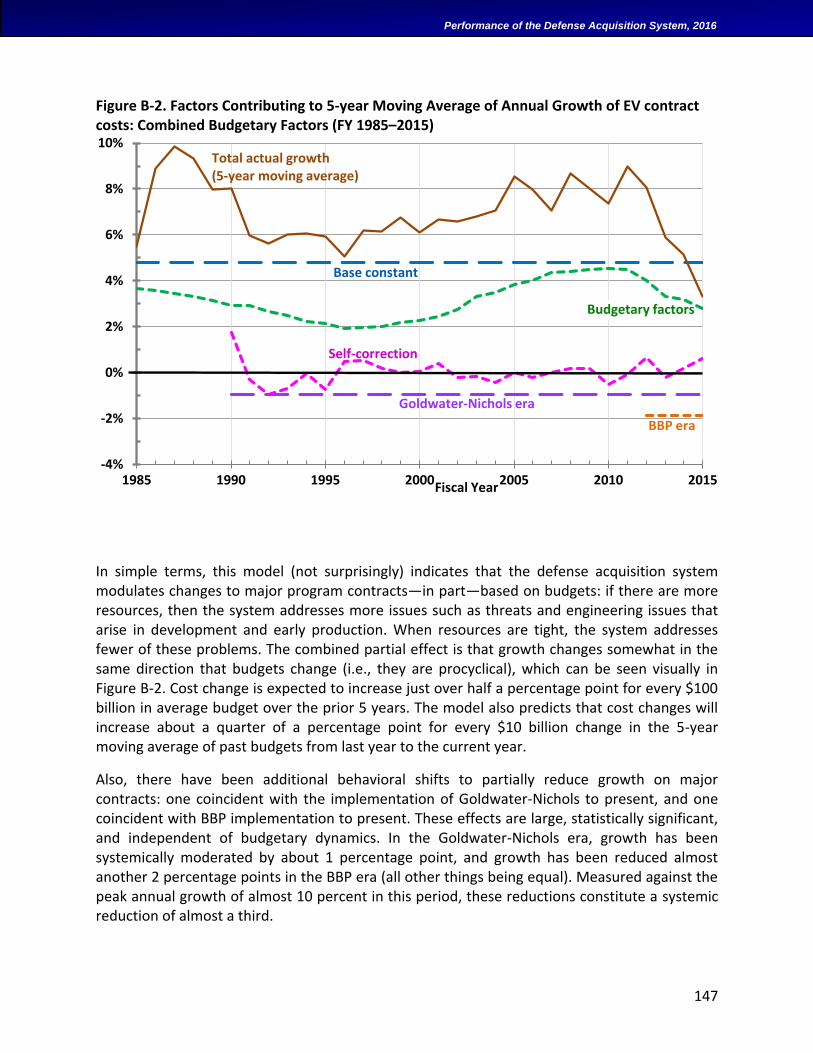
147
Performance of the Defense Acquisition System, 2016
Figure B-2. Factors Contributing to 5-year Moving Average of Annual Growth of EV contract costs: Combined Budgetary Factors (FY 1985–2015)
In simple terms, this model (not surprisingly) indicates that the defense acquisition system modulates changes to major program contracts—in part—based on budgets: if there are more resources, then the system addresses more issues such as threats and engineering issues that arise in development and early production. When resources are tight, the system addresses fewer of these problems. The combined partial effect is that growth changes somewhat in the same direction that budgets change (i.e., they are procyclical), which can be seen visually in Figure B-2. Cost change is expected to increase just over half a percentage point for every $100 billion in average budget over the prior 5 years. The model also predicts that cost changes will increase about a quarter of a percentage point for every $10 billion change in the 5-year moving average of past budgets from last year to the current year.
Also, there have been additional behavioral shifts to partially reduce growth on major contracts: one coincident with the implementation of Goldwater-Nichols to present, and one coincident with BBP implementation to present. These effects are large, statistically significant, and independent of budgetary dynamics. In the Goldwater-Nichols era, growth has been systemically moderated by about 1 percentage point, and growth has been reduced almost another 2 percentage points in the BBP era (all other things being equal). Measured against the peak annual growth of almost 10 percent in this period, these reductions constitute a systemic reduction of almost a third.
-4%
-2%
0%
2%
4%
6%
8%
10%
1985 1990 1995 2000 2005 2010 2015
Base constant
BBP era
Goldwater-Nichols era
Budgetary factors
Self-correction
Fiscal Year
Total actual growth(5-year moving average)
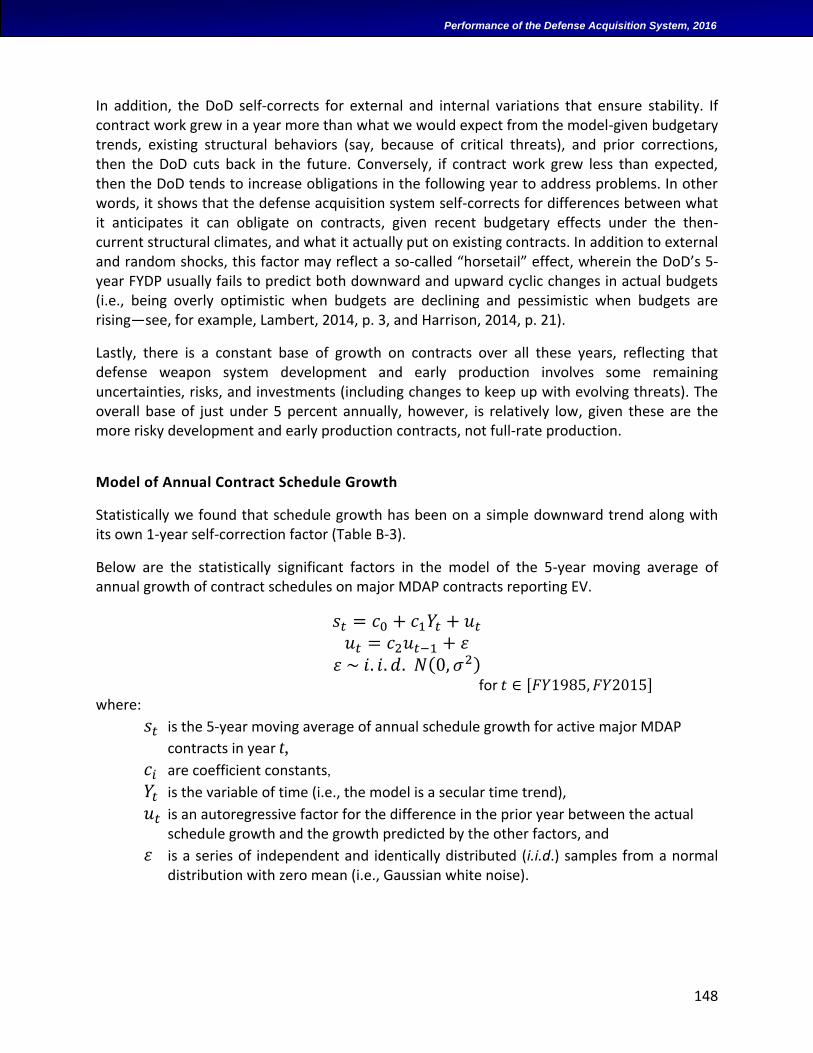
148
Performance of the Defense Acquisition System, 2016
In addition, the DoD self-corrects for external and internal variations that ensure stability. If contract work grew in a year more than what we would expect from the model-given budgetary trends, existing structural behaviors (say, because of critical threats), and prior corrections, then the DoD cuts back in the future. Conversely, if contract work grew less than expected, then the DoD tends to increase obligations in the following year to address problems. In other words, it shows that the defense acquisition system self-corrects for differences between what it anticipates it can obligate on contracts, given recent budgetary effects under the then-current structural climates, and what it actually put on existing contracts. In addition to external and random shocks, this factor may reflect a so-called “horsetail” effect, wherein the DoD’s 5-year FYDP usually fails to predict both downward and upward cyclic changes in actual budgets (i.e., being overly optimistic when budgets are declining and pessimistic when budgets are rising—see, for example, Lambert, 2014, p. 3, and Harrison, 2014, p. 21).
Lastly, there is a constant base of growth on contracts over all these years, reflecting that defense weapon system development and early production involves some remaining uncertainties, risks, and investments (including changes to keep up with evolving threats). The overall base of just under 5 percent annually, however, is relatively low, given these are the more risky development and early production contracts, not full-rate production.
Model of Annual Contract Schedule Growth
Statistically we found that schedule growth has been on a simple downward trend along with its own 1-year self-correction factor (Table B-3).
Below are the statistically significant factors in the model of the 5-year moving average of annual growth of contract schedules on major MDAP contracts reporting EV.
𝑠𝑡 = 𝑐0 + 𝑐1𝑌𝑡 + 𝑢𝑡
𝑢𝑡 = 𝑐2𝑢𝑡−1 + 𝜀
𝜀 ~ 𝑖. 𝑖. 𝑑. 𝑁(0, 𝜎2)
for 𝑡 ∈ [𝐹𝑌1985, 𝐹𝑌2015]
where:
𝑠𝑡 is the 5-year moving average of annual schedule growth for active major MDAP
contracts in year t,
𝑐𝑖 are coefficient constants,
𝑌𝑡 is the variable of time (i.e., the model is a secular time trend),
𝑢𝑡 is an autoregressive factor for the difference in the prior year between the actual schedule growth and the growth predicted by the other factors, and
𝜀 is a series of independent and identically distributed (i.i.d.) samples from a normal distribution with zero mean (i.e., Gaussian white noise).
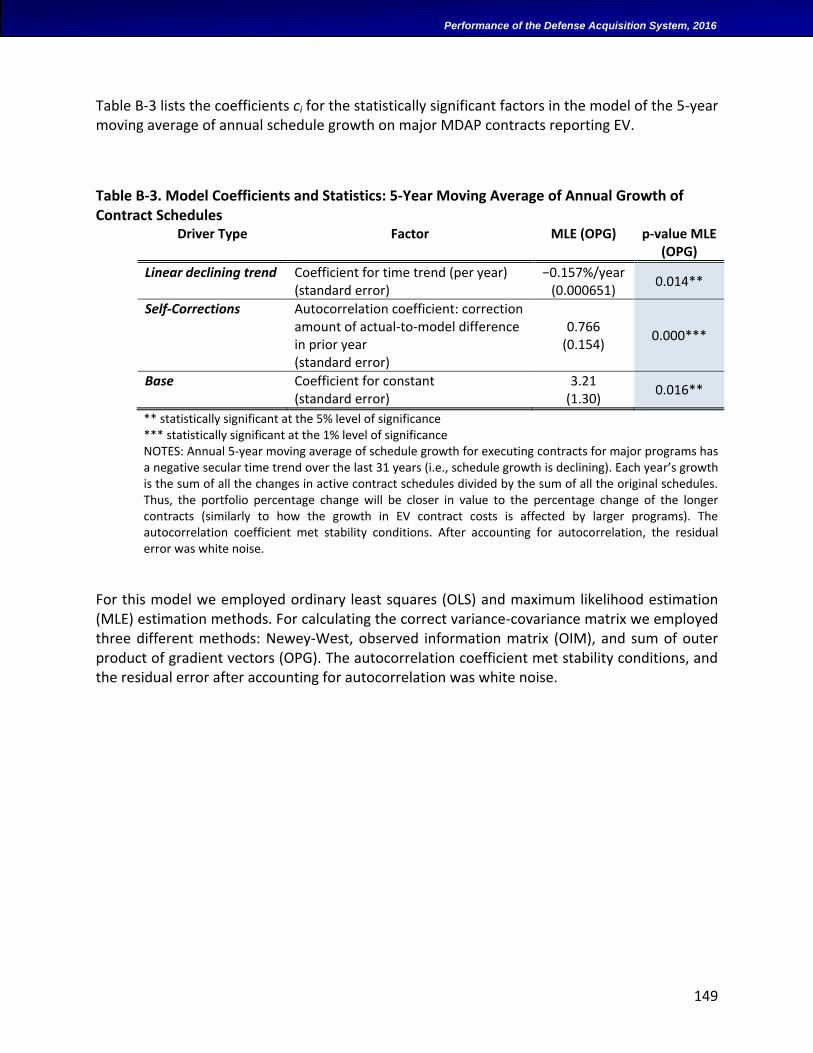
149
Performance of the Defense Acquisition System, 2016
Table B-3 lists the coefficients ci for the statistically significant factors in the model of the 5-year moving average of annual schedule growth on major MDAP contracts reporting EV.
Table B-3. Model Coefficients and Statistics: 5-Year Moving Average of Annual Growth of Contract Schedules
Driver Type Factor MLE (OPG) p-value MLE (OPG)
Linear declining trend Coefficient for time trend (per year) (standard error)
−0.157%/year (0.000651)
0.014**
Self-Corrections Autocorrelation coefficient: correction amount of actual-to-model difference in prior year (standard error)
0.766 (0.154)
0.000***
Base Coefficient for constant (standard error)
3.21 (1.30)
0.016**
** statistically significant at the 5% level of significance *** statistically significant at the 1% level of significance NOTES: Annual 5-year moving average of schedule growth for executing contracts for major programs has a negative secular time trend over the last 31 years (i.e., schedule growth is declining). Each year’s growth is the sum of all the changes in active contract schedules divided by the sum of all the original schedules. Thus, the portfolio percentage change will be closer in value to the percentage change of the longer contracts (similarly to how the growth in EV contract costs is affected by larger programs). The autocorrelation coefficient met stability conditions. After accounting for autocorrelation, the residual error was white noise.
For this model we employed ordinary least squares (OLS) and maximum likelihood estimation (MLE) estimation methods. For calculating the correct variance-covariance matrix we employed three different methods: Newey-West, observed information matrix (OIM), and sum of outer product of gradient vectors (OPG). The autocorrelation coefficient met stability conditions, and the residual error after accounting for autocorrelation was white noise.

150
Performance of the Defense Acquisition System, 2016
(This page was left blank intentionally)
151
Performance of the Defense Acquisition System, 2016
C. ANALYTIC DETAILS: TOTAL GROWTH OF MDAP
CONTRACT COSTS ALIGNED TO MILESTONE B
We analyzed the same EV data discussed in Appendix A above in the annual growth study. These data used summary EV data on 1,123 major contracts from FY 1981 to 2015 for 239 MDAPs. These included the combined results from 9,680 EMD reports and 8,790 early production reports. Table C-1 lists the actual 5-year moving average of total growth of EV contract costs aligned to MS B as calculated using the equations below.
These results are robust to different estimation methods and different ways of calculating the variance-covariance matrix. The autocorrelation coefficients met stability conditions. The residual error after accounting for autocorrelations was white noise.
Table C-1. Five-Year Moving Average of Total Growth of MDAP Contracted Costs Aligned to MS B Date (FY 1985–2012)
FY Growth (actual) FY Growth (actual)
1985 36.3% 1999 63.8% 1986 35.5% 2000 63.9% 1987 50.3% 2001 72.6% 1988 58.9% 2002 54.0% 1989 84.2% 2003 52.4% 1990 77.1% 2004 47.4% 1991 73.0% 2005 47.2% 1992 58.7% 2006 40.5% 1993 66.0% 2007 36.5% 1994 40.1% 2008 46.1% 1995 37.7% 2009 42.8% 1996 38.1% 2010 46.3% 1997 61.5% 2011 44.8% 1998 51.1% 2012 42.8%
NOTE: Results reflect 18,470 earned-value reports on 1,123 major contracts for 239 major defense programs, including work-content growth (which dominates EV cost growth generally) and cost-over-target (i.e., overruns relative to the contract target). Because these are five-year moving averages, the values for 1985–1988 include data before 1985. Also, there was no MS B date after 2012 for the MDAPS that these contracts supported, but the dates up to 2012 include cost data through 2015.
These growths are calculated across all contracts together by totaling for each year the latest changes of the PM EAC for all contracts for the MDAP that had an MS B in that year, then dividing by the sum of all the initial contract cost targets for those contracts:
𝑔(𝑡) =∑ ∆𝑃𝑀𝐸𝐴𝐶𝑟(𝑡)𝑚
𝑟=1
∑ 𝐶𝐵𝐵𝑖(𝑜𝑟𝑖𝑔𝑖𝑛𝑎𝑙)𝑛𝑖=1
for m reports on n contracts for MDAPs that passed MS B in year t
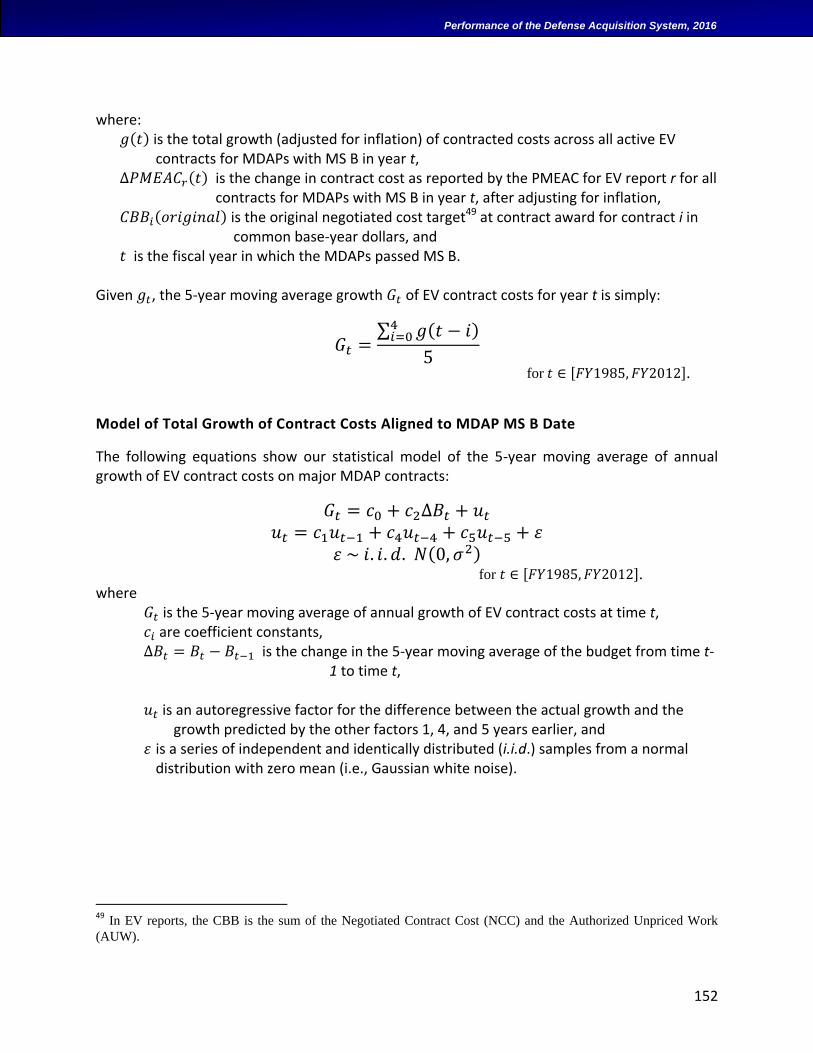
152
Performance of the Defense Acquisition System, 2016
where: 𝑔(𝑡) is the total growth (adjusted for inflation) of contracted costs across all active EV
contracts for MDAPs with MS B in year t, ∆𝑃𝑀𝐸𝐴𝐶𝑟(𝑡) is the change in contract cost as reported by the PMEAC for EV report r for all
contracts for MDAPs with MS B in year t, after adjusting for inflation, 𝐶𝐵𝐵𝑖(𝑜𝑟𝑖𝑔𝑖𝑛𝑎𝑙) is the original negotiated cost target49 at contract award for contract i in
common base-year dollars, and 𝑡 is the fiscal year in which the MDAPs passed MS B.
Given 𝑔𝑡, the 5-year moving average growth 𝐺𝑡 of EV contract costs for year t is simply:
𝐺𝑡 =∑ 𝑔(𝑡 − 𝑖)4
𝑖=0
5
for 𝑡 ∈ [𝐹𝑌1985, 𝐹𝑌2012].
Model of Total Growth of Contract Costs Aligned to MDAP MS B Date
The following equations show our statistical model of the 5-year moving average of annual growth of EV contract costs on major MDAP contracts:
𝐺𝑡 = 𝑐0 + 𝑐2∆𝐵𝑡 + 𝑢𝑡
𝑢𝑡 = 𝑐1𝑢𝑡−1 + 𝑐4𝑢𝑡−4 + 𝑐5𝑢𝑡−5 + 𝜀
𝜀 ~ 𝑖. 𝑖. 𝑑. 𝑁(0, 𝜎2) for 𝑡 ∈ [𝐹𝑌1985, 𝐹𝑌2012].
where 𝐺𝑡 is the 5-year moving average of annual growth of EV contract costs at time t, 𝑐𝑖 are coefficient constants, ∆𝐵𝑡 = 𝐵𝑡 − 𝐵𝑡−1 is the change in the 5-year moving average of the budget from time t-
1 to time t, 𝑢𝑡 is an autoregressive factor for the difference between the actual growth and the
growth predicted by the other factors 1, 4, and 5 years earlier, and 𝜀 is a series of independent and identically distributed (i.i.d.) samples from a normal
distribution with zero mean (i.e., Gaussian white noise).
49
In EV reports, the CBB is the sum of the Negotiated Contract Cost (NCC) and the Authorized Unpriced Work
(AUW).
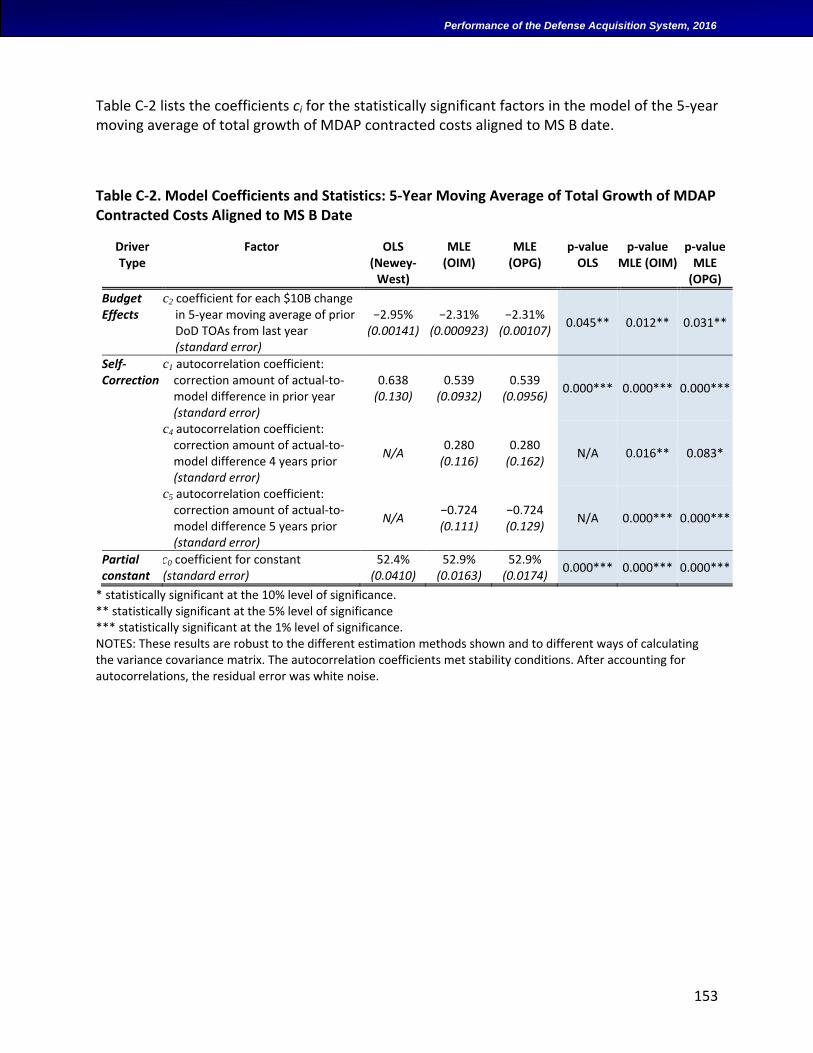
153
Performance of the Defense Acquisition System, 2016
Table C-2 lists the coefficients ci for the statistically significant factors in the model of the 5-year moving average of total growth of MDAP contracted costs aligned to MS B date.
Table C-2. Model Coefficients and Statistics: 5-Year Moving Average of Total Growth of MDAP Contracted Costs Aligned to MS B Date
Driver Type
Factor OLS (Newey-
West)
MLE (OIM)
MLE (OPG)
p-value OLS
p-value MLE (OIM)
p-value MLE
(OPG)
Budget Effects
c2 coefficient for each $10B change in 5-year moving average of prior DoD TOAs from last year (standard error)
−2.95% (0.00141)
−2.31% (0.000923)
−2.31% (0.00107)
0.045** 0.012** 0.031**
Self-Correction
c1 autocorrelation coefficient: correction amount of actual-to-model difference in prior year (standard error)
0.638 (0.130)
0.539 (0.0932)
0.539 (0.0956)
0.000*** 0.000*** 0.000***
c4 autocorrelation coefficient: correction amount of actual-to-model difference 4 years prior (standard error)
N/A 0.280
(0.116) 0.280
(0.162) N/A 0.016** 0.083*
c5 autocorrelation coefficient: correction amount of actual-to-model difference 5 years prior (standard error)
N/A −0.724 (0.111)
−0.724 (0.129)
N/A 0.000*** 0.000***
Partial constant
c0 coefficient for constant (standard error)
52.4% (0.0410)
52.9% (0.0163)
52.9% (0.0174)
0.000*** 0.000*** 0.000***
* statistically significant at the 10% level of significance. ** statistically significant at the 5% level of significance *** statistically significant at the 1% level of significance. NOTES: These results are robust to the different estimation methods shown and to different ways of calculating the variance covariance matrix. The autocorrelation coefficients met stability conditions. After accounting for autocorrelations, the residual error was white noise.

154
Performance of the Defense Acquisition System, 2016
(This page was left blank intentionally)
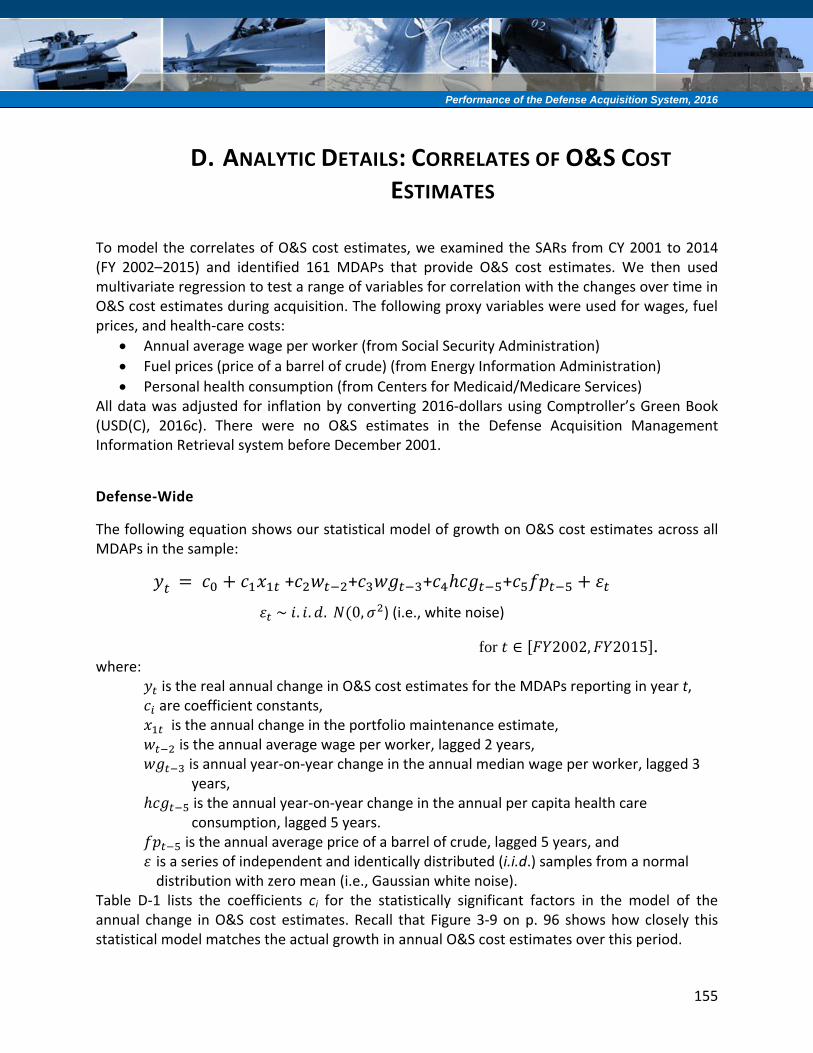
155
Performance of the Defense Acquisition System, 2016
D. ANALYTIC DETAILS: CORRELATES OF O&S COST
ESTIMATES
To model the correlates of O&S cost estimates, we examined the SARs from CY 2001 to 2014 (FY 2002–2015) and identified 161 MDAPs that provide O&S cost estimates. We then used multivariate regression to test a range of variables for correlation with the changes over time in O&S cost estimates during acquisition. The following proxy variables were used for wages, fuel prices, and health-care costs:
Annual average wage per worker (from Social Security Administration)
Fuel prices (price of a barrel of crude) (from Energy Information Administration)
Personal health consumption (from Centers for Medicaid/Medicare Services) All data was adjusted for inflation by converting 2016-dollars using Comptroller’s Green Book (USD(C), 2016c). There were no O&S estimates in the Defense Acquisition Management Information Retrieval system before December 2001.
Defense-Wide
The following equation shows our statistical model of growth on O&S cost estimates across all MDAPs in the sample:
for 𝑡 ∈ [𝐹𝑌2002, 𝐹𝑌2015]. where:
𝑦𝑡 is the real annual change in O&S cost estimates for the MDAPs reporting in year t, 𝑐𝑖 are coefficient constants, 𝑥1𝑡 is the annual change in the portfolio maintenance estimate, 𝑤𝑡−2 is the annual average wage per worker, lagged 2 years, 𝑤𝑔𝑡−3 is annual year-on-year change in the annual median wage per worker, lagged 3
years, ℎ𝑐𝑔𝑡−5 is the annual year-on-year change in the annual per capita health care
consumption, lagged 5 years. 𝑓𝑝𝑡−5 is the annual average price of a barrel of crude, lagged 5 years, and 𝜀 is a series of independent and identically distributed (i.i.d.) samples from a normal
distribution with zero mean (i.e., Gaussian white noise). Table D-1 lists the coefficients ci for the statistically significant factors in the model of the annual change in O&S cost estimates. Recall that Figure 3-9 on p. 96 shows how closely this statistical model matches the actual growth in annual O&S cost estimates over this period.
𝑦𝑡 = 𝑐0 + 𝑐1𝑥1𝑡 +𝑐2𝑤𝑡−2+𝑐3𝑤𝑔𝑡−3+𝑐4ℎ𝑐𝑔𝑡−5+𝑐5𝑓𝑝𝑡−5 + 𝜀𝑡
𝜀𝑡 ~ 𝑖. 𝑖. 𝑑. 𝑁(0, 𝜎2) (i.e., white noise)
t [2002, 2015]
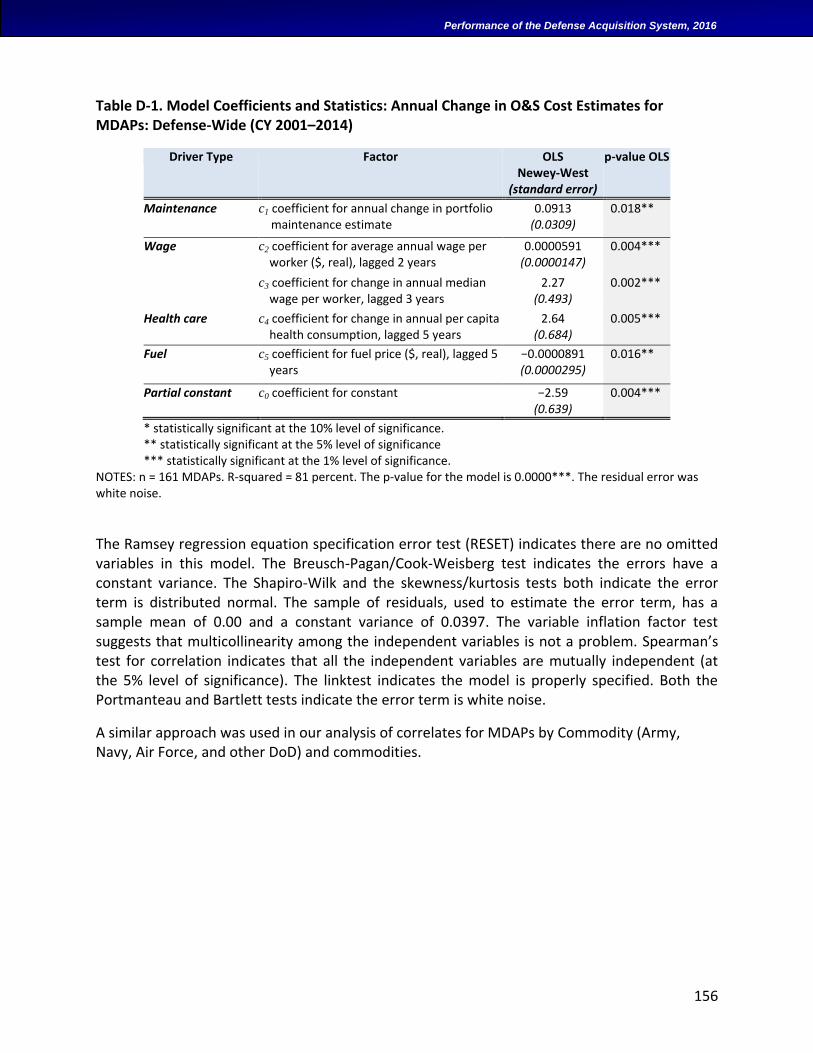
156
Performance of the Defense Acquisition System, 2016
Table D-1. Model Coefficients and Statistics: Annual Change in O&S Cost Estimates for MDAPs: Defense-Wide (CY 2001–2014)
Driver Type Factor OLS Newey-West
(standard error)
p-value OLS
Maintenance c1 coefficient for annual change in portfolio maintenance estimate
0.0913 (0.0309)
0.018**
Wage c2 coefficient for average annual wage per worker ($, real), lagged 2 years
0.0000591 (0.0000147)
0.004***
c3 coefficient for change in annual median wage per worker, lagged 3 years
2.27 (0.493)
0.002***
Health care c4 coefficient for change in annual per capita health consumption, lagged 5 years
2.64 (0.684)
0.005***
Fuel c5 coefficient for fuel price ($, real), lagged 5 years
−0.0000891 (0.0000295)
0.016**
Partial constant c0 coefficient for constant −2.59 (0.639)
0.004***
* statistically significant at the 10% level of significance. ** statistically significant at the 5% level of significance *** statistically significant at the 1% level of significance.
NOTES: n = 161 MDAPs. R-squared = 81 percent. The p-value for the model is 0.0000***. The residual error was white noise.
The Ramsey regression equation specification error test (RESET) indicates there are no omitted variables in this model. The Breusch-Pagan/Cook-Weisberg test indicates the errors have a constant variance. The Shapiro-Wilk and the skewness/kurtosis tests both indicate the error term is distributed normal. The sample of residuals, used to estimate the error term, has a sample mean of 0.00 and a constant variance of 0.0397. The variable inflation factor test suggests that multicollinearity among the independent variables is not a problem. Spearman’s test for correlation indicates that all the independent variables are mutually independent (at the 5% level of significance). The linktest indicates the model is properly specified. Both the Portmanteau and Bartlett tests indicate the error term is white noise.
A similar approach was used in our analysis of correlates for MDAPs by Commodity (Army, Navy, Air Force, and other DoD) and commodities.
157
Performance of the Defense Acquisition System, 2016
E. FURTHER STATISTICAL ANALYSIS DETAILS
Generally, statistical analyses conducted for this report involved both parametric and nonparametric tests, as discussed below.
Supporting Sample Analysis for Regressions
In our linear multivariate regression analyses, we conducted supporting sample analysis tests for normality of residuals (Smirnov-Kolmogorov and Shapiro-Wilk tests), heteroskedasticity (Cook-Weisberg test), multicollinearity (variance inflation factor test), omitted variables (Ramsey RESET), and correct model specification (linktest). We also used bootstrap simulations to obtain unbiased coefficient estimates, correct standard errors, and correct confidence intervals.
Single Variable Analysis Tests
Single variable analyses allowed us to focus on differences by a single factor (e.g., phase, contract type, cost or price growth, schedule growth, or final margin). Nonparametric tests (Wilcoxon rank-sum and Kolmogorov-Smirnov) were used to test for statistical significance between populations, and the median was used as the measure of central tendency because the distributions were skewed. The chi-squared test was used to determine statistical significance for categorical variables.
Interpreting Box-and-Whisker Diagrams and Percentile Plots
Throughout this report, the so-called “box and whisker” charts (described in Figure E-1) help visualize the distribution of a particular variable. The gray boxes show the second and third quartiles (i.e., the 25th to the 50th percentile, and the 50th to the 75th percentile). The minimum and maximum are shown with a small bar at the end of the vertical line (or may run off the chart in some instances). The median (50th percentile, where half of the occurrences are above it and half below) is the best measure of central tendency in the data because the distributions are skewed. Note that the quartiles do not convey the actual distributions within the quartiles. As seen by the illustrations on the left of the figure, these distributions can be “lumpy” or nonuniform, but the charts do provide a quick visual for comparing two distributions. The charts also convey a sense of how much of the distribution is, say, negative or larger than a value of interest.
Next to some box-and-whisker charts we show the actual distributions so that we can see the distributions within each quartile. Figure E-2 shows how these percentile charts compare to the
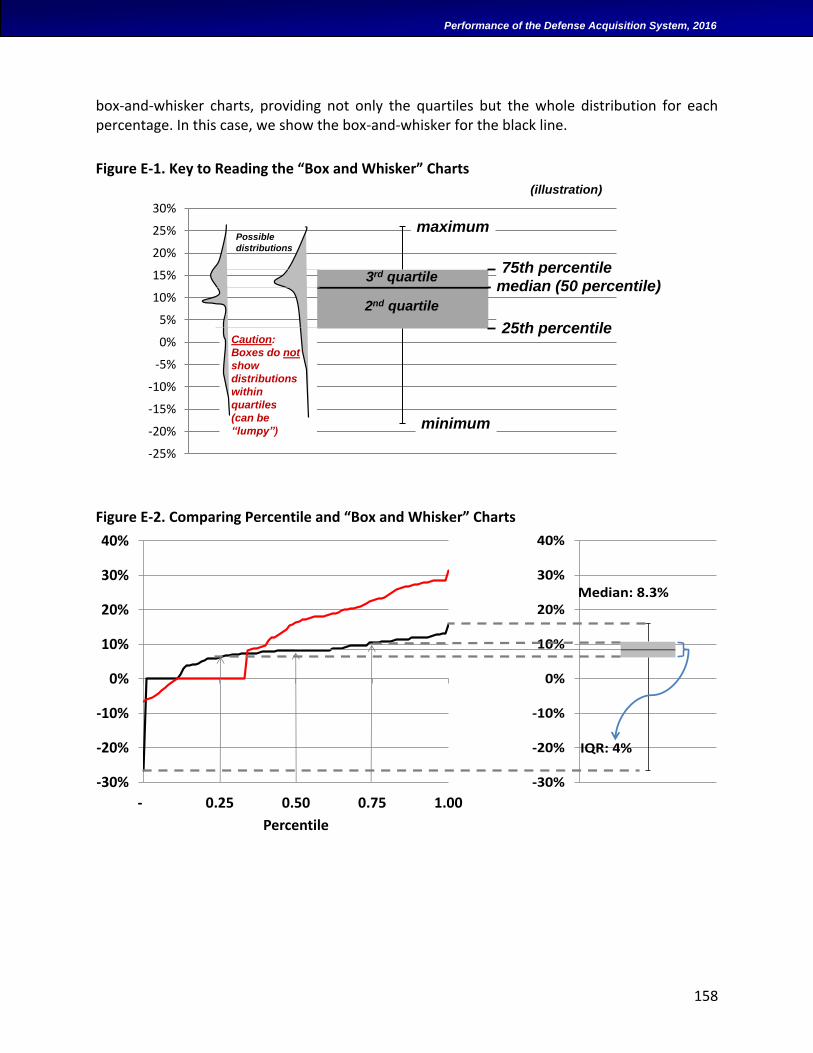
158
Performance of the Defense Acquisition System, 2016
box-and-whisker charts, providing not only the quartiles but the whole distribution for each percentage. In this case, we show the box-and-whisker for the black line.
Figure E-1. Key to Reading the “Box and Whisker” Charts
Figure E-2. Comparing Percentile and “Box and Whisker” Charts
-25%
-20%
-15%
-10%
-5%
0%
5%
10%
15%
20%
25%
30%
Margin for fixed-price contracts (unweighted)
maximum
minimum
(illustration)
2nd quartile
3rd quartile
25th percentile
75th percentile
Caution:
Boxes do not
show
distributions
within
quartiles
(can be
“lumpy”)
Possible
distributions
median (50 percentile)
-30%
-20%
-10%
0%
10%
20%
30%
40%
IQR: 4%
Median: 8.3%
-30%
-20%
-10%
0%
10%
20%
30%
40%
- 0.25 0.50 0.75 1.00
Percentile
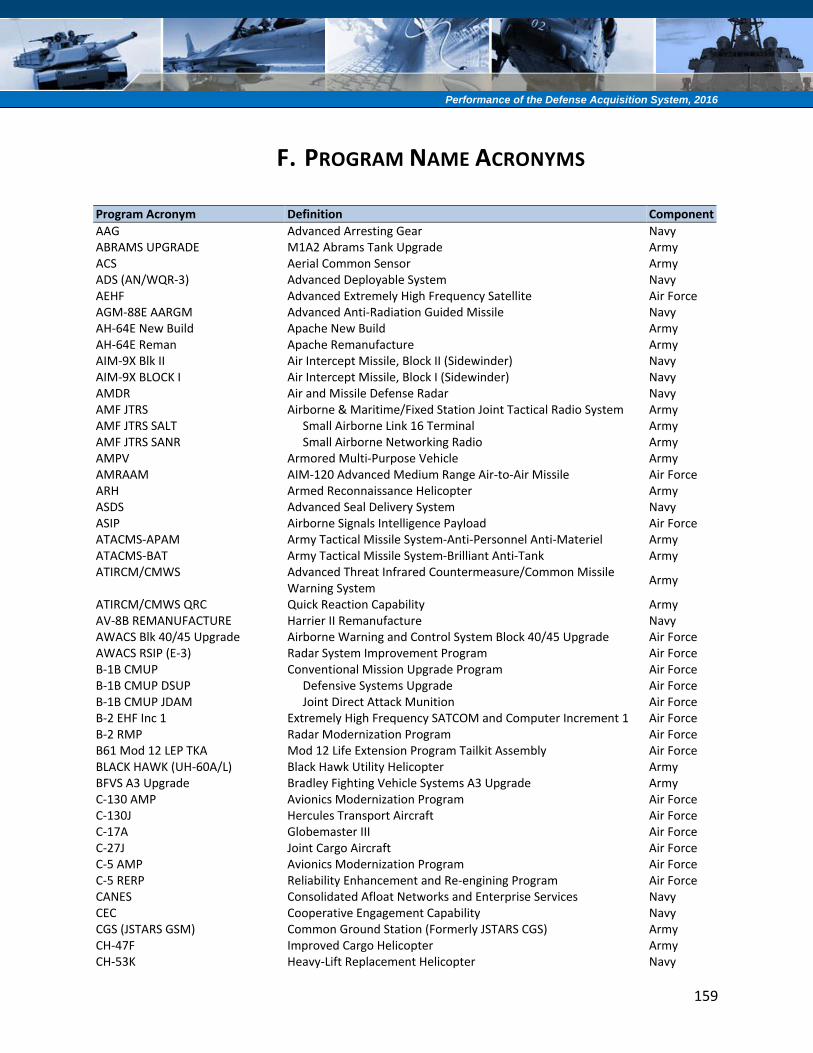
159
Performance of the Defense Acquisition System, 2016
F. PROGRAM NAME ACRONYMS
Program Acronym Definition Component
AAG Advanced Arresting Gear Navy ABRAMS UPGRADE M1A2 Abrams Tank Upgrade Army ACS Aerial Common Sensor Army ADS (AN/WQR-3) Advanced Deployable System Navy AEHF Advanced Extremely High Frequency Satellite Air Force AGM-88E AARGM Advanced Anti-Radiation Guided Missile Navy AH-64E New Build Apache New Build Army AH-64E Reman Apache Remanufacture Army AIM-9X Blk II Air Intercept Missile, Block II (Sidewinder) Navy AIM-9X BLOCK I Air Intercept Missile, Block I (Sidewinder) Navy AMDR Air and Missile Defense Radar Navy AMF JTRS Airborne & Maritime/Fixed Station Joint Tactical Radio System Army AMF JTRS SALT Small Airborne Link 16 Terminal Army AMF JTRS SANR Small Airborne Networking Radio Army AMPV Armored Multi-Purpose Vehicle Army AMRAAM AIM-120 Advanced Medium Range Air-to-Air Missile Air Force ARH Armed Reconnaissance Helicopter Army ASDS Advanced Seal Delivery System Navy ASIP Airborne Signals Intelligence Payload Air Force ATACMS-APAM Army Tactical Missile System-Anti-Personnel Anti-Materiel Army ATACMS-BAT Army Tactical Missile System-Brilliant Anti-Tank Army ATIRCM/CMWS Advanced Threat Infrared Countermeasure/Common Missile
Warning System Army
ATIRCM/CMWS QRC Quick Reaction Capability Army AV-8B REMANUFACTURE Harrier II Remanufacture Navy AWACS Blk 40/45 Upgrade Airborne Warning and Control System Block 40/45 Upgrade Air Force AWACS RSIP (E-3) Radar System Improvement Program Air Force B-1B CMUP Conventional Mission Upgrade Program Air Force B-1B CMUP DSUP Defensive Systems Upgrade Air Force B-1B CMUP JDAM Joint Direct Attack Munition Air Force B-2 EHF Inc 1 Extremely High Frequency SATCOM and Computer Increment 1 Air Force B-2 RMP Radar Modernization Program Air Force B61 Mod 12 LEP TKA Mod 12 Life Extension Program Tailkit Assembly Air Force BLACK HAWK (UH-60A/L) Black Hawk Utility Helicopter Army BFVS A3 Upgrade Bradley Fighting Vehicle Systems A3 Upgrade Army C-130 AMP Avionics Modernization Program Air Force C-130J Hercules Transport Aircraft Air Force C-17A Globemaster III Air Force C-27J Joint Cargo Aircraft Air Force C-5 AMP Avionics Modernization Program Air Force C-5 RERP Reliability Enhancement and Re-engining Program Air Force CANES Consolidated Afloat Networks and Enterprise Services Navy CEC Cooperative Engagement Capability Navy CGS (JSTARS GSM) Common Ground Station (Formerly JSTARS CGS) Army CH-47F Improved Cargo Helicopter Army CH-53K Heavy-Lift Replacement Helicopter Navy
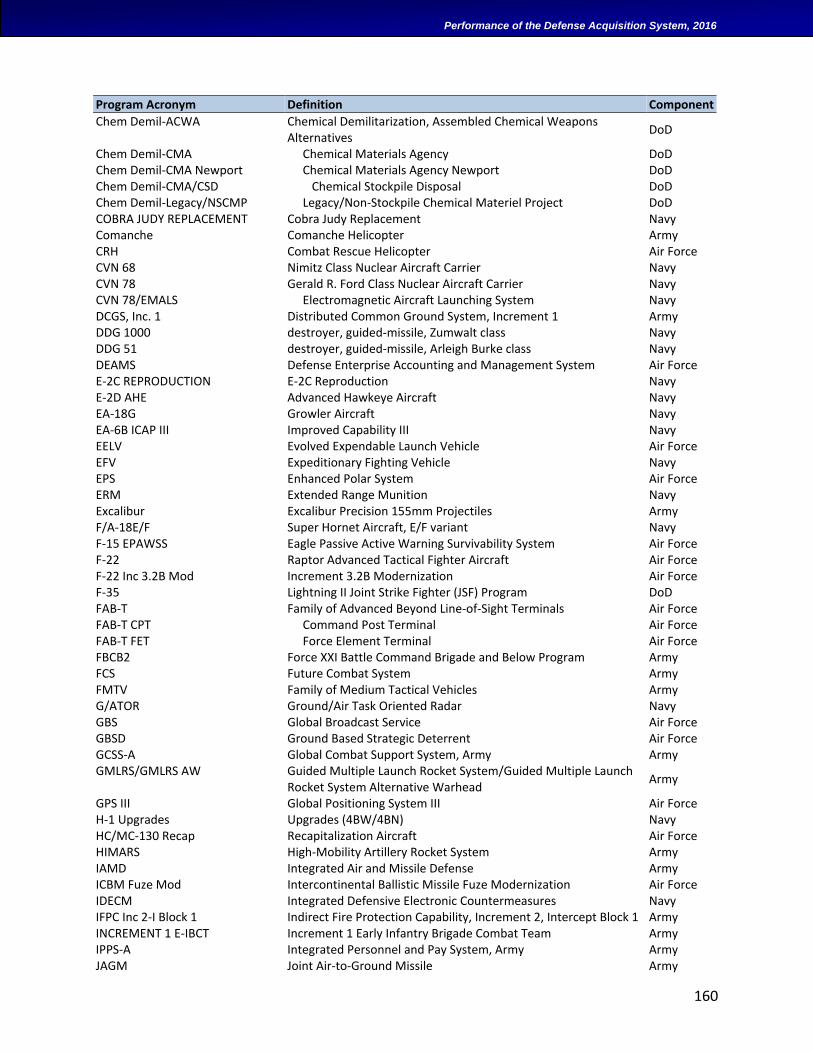
160
Performance of the Defense Acquisition System, 2016
Program Acronym Definition Component
Chem Demil-ACWA Chemical Demilitarization, Assembled Chemical Weapons Alternatives
DoD
Chem Demil-CMA Chemical Materials Agency DoD Chem Demil-CMA Newport Chemical Materials Agency Newport DoD Chem Demil-CMA/CSD Chemical Stockpile Disposal DoD Chem Demil-Legacy/NSCMP Legacy/Non-Stockpile Chemical Materiel Project DoD COBRA JUDY REPLACEMENT Cobra Judy Replacement Navy Comanche Comanche Helicopter Army CRH Combat Rescue Helicopter Air Force CVN 68 Nimitz Class Nuclear Aircraft Carrier Navy CVN 78 Gerald R. Ford Class Nuclear Aircraft Carrier Navy CVN 78/EMALS Electromagnetic Aircraft Launching System Navy DCGS, Inc. 1 Distributed Common Ground System, Increment 1 Army DDG 1000 destroyer, guided-missile, Zumwalt class Navy DDG 51 destroyer, guided-missile, Arleigh Burke class Navy DEAMS Defense Enterprise Accounting and Management System Air Force E-2C REPRODUCTION E-2C Reproduction Navy E-2D AHE Advanced Hawkeye Aircraft Navy EA-18G Growler Aircraft Navy EA-6B ICAP III Improved Capability III Navy EELV Evolved Expendable Launch Vehicle Air Force EFV Expeditionary Fighting Vehicle Navy EPS Enhanced Polar System Air Force ERM Extended Range Munition Navy Excalibur Excalibur Precision 155mm Projectiles Army F/A-18E/F Super Hornet Aircraft, E/F variant Navy F-15 EPAWSS Eagle Passive Active Warning Survivability System Air Force F-22 Raptor Advanced Tactical Fighter Aircraft Air Force F-22 Inc 3.2B Mod Increment 3.2B Modernization Air Force F-35 Lightning II Joint Strike Fighter (JSF) Program DoD FAB-T Family of Advanced Beyond Line-of-Sight Terminals Air Force FAB-T CPT Command Post Terminal Air Force FAB-T FET Force Element Terminal Air Force FBCB2 Force XXI Battle Command Brigade and Below Program Army FCS Future Combat System Army FMTV Family of Medium Tactical Vehicles Army G/ATOR Ground/Air Task Oriented Radar Navy GBS Global Broadcast Service Air Force GBSD Ground Based Strategic Deterrent Air Force GCSS-A Global Combat Support System, Army Army GMLRS/GMLRS AW Guided Multiple Launch Rocket System/Guided Multiple Launch
Rocket System Alternative Warhead Army
GPS III Global Positioning System III Air Force H-1 Upgrades Upgrades (4BW/4BN) Navy HC/MC-130 Recap Recapitalization Aircraft Air Force HIMARS High-Mobility Artillery Rocket System Army IAMD Integrated Air and Missile Defense Army ICBM Fuze Mod Intercontinental Ballistic Missile Fuze Modernization Air Force IDECM Integrated Defensive Electronic Countermeasures Navy IFPC Inc 2-I Block 1 Indirect Fire Protection Capability, Increment 2, Intercept Block 1 Army INCREMENT 1 E-IBCT Increment 1 Early Infantry Brigade Combat Team Army IPPS-A Integrated Personnel and Pay System, Army Army JAGM Joint Air-to-Ground Missile Army
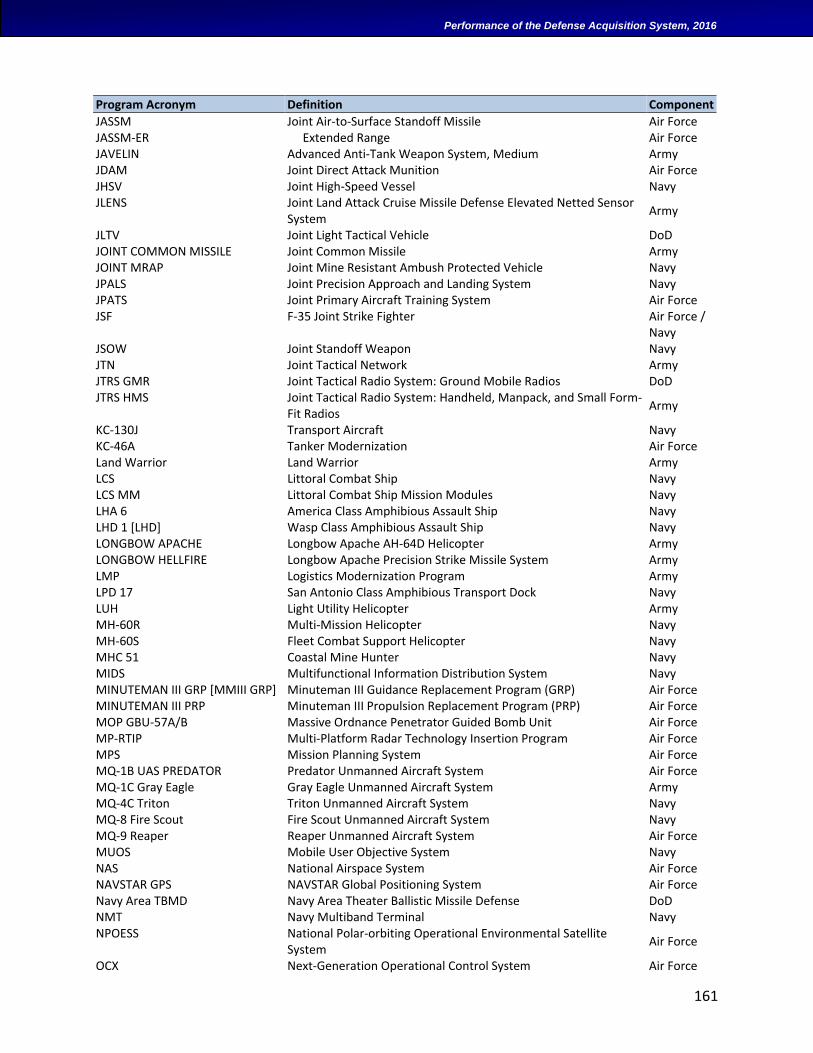
161
Performance of the Defense Acquisition System, 2016
Program Acronym Definition Component
JASSM Joint Air-to-Surface Standoff Missile Air Force JASSM-ER Extended Range Air Force JAVELIN Advanced Anti-Tank Weapon System, Medium Army JDAM Joint Direct Attack Munition Air Force JHSV Joint High-Speed Vessel Navy JLENS Joint Land Attack Cruise Missile Defense Elevated Netted Sensor
System Army
JLTV Joint Light Tactical Vehicle DoD JOINT COMMON MISSILE Joint Common Missile Army JOINT MRAP Joint Mine Resistant Ambush Protected Vehicle Navy JPALS Joint Precision Approach and Landing System Navy JPATS Joint Primary Aircraft Training System Air Force JSF F-35 Joint Strike Fighter Air Force /
Navy JSOW Joint Standoff Weapon Navy JTN Joint Tactical Network Army JTRS GMR Joint Tactical Radio System: Ground Mobile Radios DoD JTRS HMS Joint Tactical Radio System: Handheld, Manpack, and Small Form-
Fit Radios Army
KC-130J Transport Aircraft Navy KC-46A Tanker Modernization Air Force Land Warrior Land Warrior Army LCS Littoral Combat Ship Navy LCS MM Littoral Combat Ship Mission Modules Navy LHA 6 America Class Amphibious Assault Ship Navy LHD 1 [LHD] Wasp Class Amphibious Assault Ship Navy LONGBOW APACHE Longbow Apache AH-64D Helicopter Army LONGBOW HELLFIRE Longbow Apache Precision Strike Missile System Army LMP Logistics Modernization Program Army LPD 17 San Antonio Class Amphibious Transport Dock Navy LUH Light Utility Helicopter Army MH-60R Multi-Mission Helicopter Navy MH-60S Fleet Combat Support Helicopter Navy MHC 51 Coastal Mine Hunter Navy MIDS Multifunctional Information Distribution System Navy MINUTEMAN III GRP [MMIII GRP] Minuteman III Guidance Replacement Program (GRP) Air Force MINUTEMAN III PRP Minuteman III Propulsion Replacement Program (PRP) Air Force MOP GBU-57A/B Massive Ordnance Penetrator Guided Bomb Unit Air Force MP-RTIP Multi-Platform Radar Technology Insertion Program Air Force MPS Mission Planning System Air Force MQ-1B UAS PREDATOR Predator Unmanned Aircraft System Air Force MQ-1C Gray Eagle Gray Eagle Unmanned Aircraft System Army MQ-4C Triton Triton Unmanned Aircraft System Navy MQ-8 Fire Scout Fire Scout Unmanned Aircraft System Navy MQ-9 Reaper Reaper Unmanned Aircraft System Air Force MUOS Mobile User Objective System Navy NAS National Airspace System Air Force NAVSTAR GPS NAVSTAR Global Positioning System Air Force Navy Area TBMD Navy Area Theater Ballistic Missile Defense DoD NMT Navy Multiband Terminal Navy NPOESS National Polar-orbiting Operational Environmental Satellite
System Air Force
OCX Next-Generation Operational Control System Air Force
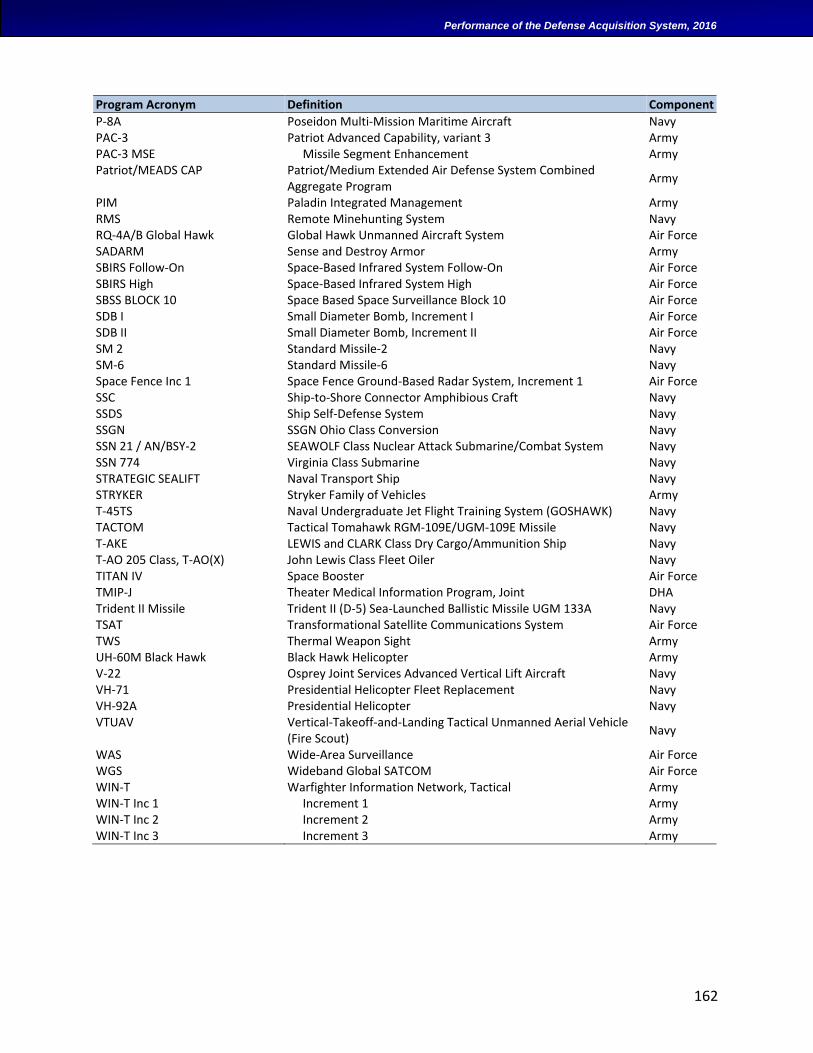
162
Performance of the Defense Acquisition System, 2016
Program Acronym Definition Component
P-8A Poseidon Multi-Mission Maritime Aircraft Navy PAC-3 Patriot Advanced Capability, variant 3 Army PAC-3 MSE Missile Segment Enhancement Army Patriot/MEADS CAP Patriot/Medium Extended Air Defense System Combined
Aggregate Program Army
PIM Paladin Integrated Management Army RMS Remote Minehunting System Navy RQ-4A/B Global Hawk Global Hawk Unmanned Aircraft System Air Force SADARM Sense and Destroy Armor Army SBIRS Follow-On Space-Based Infrared System Follow-On Air Force SBIRS High Space-Based Infrared System High Air Force SBSS BLOCK 10 Space Based Space Surveillance Block 10 Air Force SDB I Small Diameter Bomb, Increment I Air Force SDB II Small Diameter Bomb, Increment II Air Force SM 2 Standard Missile-2 Navy SM-6 Standard Missile-6 Navy Space Fence Inc 1 Space Fence Ground-Based Radar System, Increment 1 Air Force SSC Ship-to-Shore Connector Amphibious Craft Navy SSDS Ship Self-Defense System Navy SSGN SSGN Ohio Class Conversion Navy SSN 21 / AN/BSY-2 SEAWOLF Class Nuclear Attack Submarine/Combat System Navy SSN 774 Virginia Class Submarine Navy STRATEGIC SEALIFT Naval Transport Ship Navy STRYKER Stryker Family of Vehicles Army T-45TS Naval Undergraduate Jet Flight Training System (GOSHAWK) Navy TACTOM Tactical Tomahawk RGM-109E/UGM-109E Missile Navy T-AKE LEWIS and CLARK Class Dry Cargo/Ammunition Ship Navy T-AO 205 Class, T-AO(X) John Lewis Class Fleet Oiler Navy TITAN IV Space Booster Air Force TMIP-J Theater Medical Information Program, Joint DHA Trident II Missile Trident II (D-5) Sea-Launched Ballistic Missile UGM 133A Navy TSAT Transformational Satellite Communications System Air Force TWS Thermal Weapon Sight Army UH-60M Black Hawk Black Hawk Helicopter Army V-22 Osprey Joint Services Advanced Vertical Lift Aircraft Navy VH-71 Presidential Helicopter Fleet Replacement Navy VH-92A Presidential Helicopter Navy VTUAV Vertical-Takeoff-and-Landing Tactical Unmanned Aerial Vehicle
(Fire Scout) Navy
WAS Wide-Area Surveillance Air Force WGS Wideband Global SATCOM Air Force WIN-T Warfighter Information Network, Tactical Army WIN-T Inc 1 Increment 1 Army WIN-T Inc 2 Increment 2 Army WIN-T Inc 3 Increment 3 Army
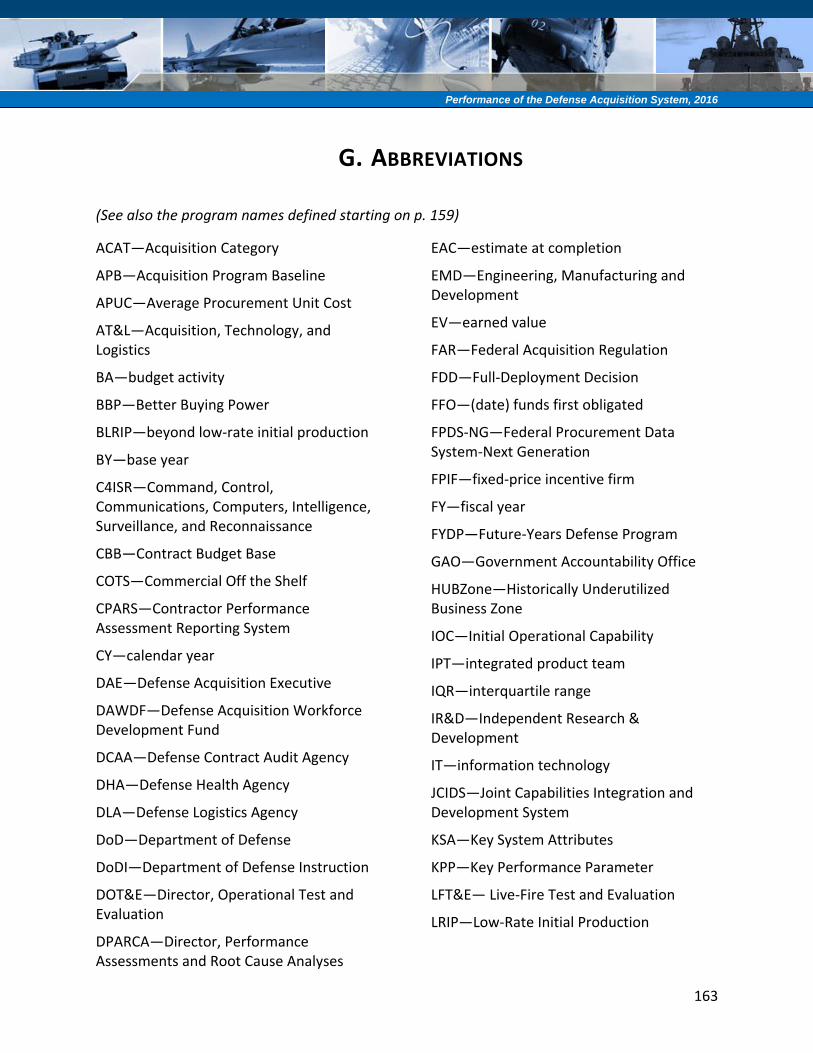
163
Performance of the Defense Acquisition System, 2016
G. ABBREVIATIONS
(See also the program names defined starting on p. 159)
ACAT—Acquisition Category
APB—Acquisition Program Baseline
APUC—Average Procurement Unit Cost
AT&L—Acquisition, Technology, and Logistics
BA—budget activity
BBP—Better Buying Power
BLRIP—beyond low-rate initial production
BY—base year
C4ISR—Command, Control, Communications, Computers, Intelligence, Surveillance, and Reconnaissance
CBB—Contract Budget Base
COTS—Commercial Off the Shelf
CPARS—Contractor Performance Assessment Reporting System
CY—calendar year
DAE—Defense Acquisition Executive
DAWDF—Defense Acquisition Workforce Development Fund
DCAA—Defense Contract Audit Agency
DHA—Defense Health Agency
DLA—Defense Logistics Agency
DoD—Department of Defense
DoDI—Department of Defense Instruction
DOT&E—Director, Operational Test and Evaluation
DPARCA—Director, Performance Assessments and Root Cause Analyses
EAC—estimate at completion
EMD—Engineering, Manufacturing and Development
EV—earned value
FAR—Federal Acquisition Regulation
FDD—Full-Deployment Decision
FFO—(date) funds first obligated
FPDS-NG—Federal Procurement Data System-Next Generation
FPIF—fixed-price incentive firm
FY—fiscal year
FYDP—Future-Years Defense Program
GAO—Government Accountability Office
HUBZone—Historically Underutilized Business Zone
IOC—Initial Operational Capability
IPT—integrated product team
IQR—interquartile range
IR&D—Independent Research & Development
IT—information technology
JCIDS—Joint Capabilities Integration and Development System
KSA—Key System Attributes
KPP—Key Performance Parameter
LFT&E— Live-Fire Test and Evaluation
LRIP—Low-Rate Initial Production
164
Performance of the Defense Acquisition System, 2016
MAIS—Major Automated Information Systems
MAR—MAIS Annual Report
MDA—Milestone Decision Authority
MDAP—Major Defense Acquisition Program
MDD—Materiel Development Decision
MOE—MAR original estimate
MPS—Mission Planning System
MS—Milestone
NDAA—National Defense Authorization Act
O&M—Operations and Maintenance
O&S—Operating and Support
OCO—Overseas Contingency Operations
OSD—Office of the Secretary of Defense
OT&E—operational test and evaluation
PARCA—Performance Assessments and Root Cause Analyses
PAUC—Program Acquisition Unit Cost
PB—President’s budget (request)
PBL—performance-based logistics
PEO—Program Executive Officer
PM—program manager
PM EAC—Program manager’s estimate at completion
PSC—product service code
Q—quarter
R&D—research and development
RDT&E—Research Development Test and Evaluation
RESET—Ramsey regression equation specification error test
SAE—Service Acquisition Executive
SAIC—Science Applications International Corp.
SAR—Selected Acquisition Report
SSIP—Superior Supplier Incentive Program
TMRR—Technology Maturation and Risk Reduction
TOA—Total Obligation Authority
TSPR—Total System Performance Responsibility
TY—then year (not adjusted for inflation)
UAV—unmanned aerial vehicle
UCA—undefinitized contract action
ULA—United Launch Alliance
ULS—United Launch Services
USD—Under Secretary of Defense
U.S.C.—United States Code
USD(AT&L)—Under Secretary of Defense, Acquisition, Technology, and Logistics
WSARA—Weapon System Acquisition Reform Act (of 2009)
165
Performance of the Defense Acquisition System, 2016
H. INDICES
INDEX OF FIGURES
Figure H-1. Program Cost-Related Development Performance Baselined in DAE Periods ....................................... xxiv Figure H-2. Program Cost-Related Procurement Performance Baselined in DAE Periods ........................................ xxv Figure H-3. Planned Reductions in Program Funding ............................................................................................... xxvii Figure H-4. Actual Growth of Contract Costs (FY 1985–2015) ................................................................................ xxviii Figure H-5. Program Cost-Related Performance: Procurement ................................................................................ xxx Figure H-6. Program Cost-Related Biennial Performance: Development .................................................................. xxxi Figure H-7. Program Cost-Related Biennial Performance: Procurement ................................................................. xxxii Figure H-8. Program Cost-Related Performance: Information Systems .................................................................. xxxiii Figure H-9. Program Cost-Related Performance: Nunn-McCurdy Breaches ............................................................ xxxv Figure H-10. Median MDAP Schedule Growth for Active Programs (SAR Years 1997–2015) ................................ xxxvii Figure H-11. Contract Schedule Growth (FY 1985–2015) ...................................................................................... xxxviii Figure H-12. Program Length: Information Systems ............................................................................................. xxxviii Figure H-13. Program Schedule Growth: Information Systems ............................................................................... xxxix Figure H-14. Small-Business Prime Contracting Utilization Trends: Goals and Actuals (FY 2001–FY 2015) ................. xl Figure H-15. System Operational Test Performance ................................................................................................... xli Figure H-16. Program Cost-Related Performance: Development .............................................................................. xlii Figure H-17. Competition Trends: Goals and Actuals (FY 2006–2015) ...................................................................... xliii Figure H-18. Frequency of New MDAP Starts: 3-Year Moving Average (CY 1996–2015) .......................................... xliv Figure H-19. Actual Quantity Procured Compared to Original MS B Plans for Completed Programs (1997–2015
SARs) ...................................................................................................................................................... xlv Figure H-20. Number of Protests Sustained by GAO (FY 2001–2015) ...................................................................... xlvii Figure H-21. Historical EBITDA Margin of the Six Largest DoD Primes (CY 2010–2015) .......................................... xlviii Figure 1-1. Output Measures for the Defense Acquisition System ............................................................................... 2 Figure 1-2. Typical Phases of Acquisition Programs ...................................................................................................... 3 Figure 1-3. Defense Budget Breakouts PB 2017 (billions of 2017 dollars) .................................................................... 4 Figure 1-4. DoD Funding by Budget Accounts: Historical and PB 2017 (FY 1962–FY 2021) .......................................... 4 Figure 1-5. Recent and Projected DoD RDT&E Funding as of PB 2017 (FY 1996–2021) ................................................ 5 Figure 1-6. Total DoD Contract Obligations Split Between Goods and Services (FY 2015) ........................................... 7 Figure 1-7. Total DoD Contract Obligations by Portfolio Group (FY 2008–FY 2015) ..................................................... 7 Figure 2-1. Program Cost-Related Development Performance Baselined in DAE Periods .......................................... 13 Figure 2-2. Program Cost-Related Procurement Performance Baselined in DAE Periods ........................................... 14 Figure 2-3. System Operational Test Performance ...................................................................................................... 17 Figure 2-4. System Operational Test Performance: Effectiveness by Commodity ...................................................... 19 Figure 2-5. System Operational Test Performance: Suitability by Commodity ........................................................... 19 Figure 2-6. Critical Nunn-McCurdy MDAP Breaches (SAR Years 2007–2016Q2) ......................................................... 25 Figure 2-7. Major Information System Sizes ................................................................................................................ 31 Figure 2-8. Program Cost-Related Performance: Information Systems ...................................................................... 32 Figure 2-9. Program Cost-Related Performance: Information Systems by Decision Authority ................................... 33 Figure 2-10. Program Schedule Growth: Information Systems ................................................................................... 34 Figure 2-11. Program Cost-Related Performance: Development ................................................................................ 36 Figure 2-12. Program Cost-Related Performance: Development (Weighted by Program Size in Dollars) .................. 37 Figure 2-13. Program Cost-Related Performance Outliers: Development .................................................................. 39 Figure 2-14. Program Cost-Related Biennial Performance: Development .................................................................. 40 Figure 2-15. Program Cost-Related Biennial Performance: Development (Weighted by Program Size in Dollars) .... 41
166
Performance of the Defense Acquisition System, 2016
Figure 2-16. Program Cost-Related Biennial Performance Outliers: Development .................................................... 42 Figure 2-17. Program Cost-Related Performance: Development ................................................................................ 43 Figure 2-18. Reductions to Planned Program Funding: Development ........................................................................ 44 Figure 2-19. MDAP Schedule Growth from MS B or C to IOC (Original Baseline; CY 1981–2015) ............................... 47 Figure 2-20. Median MDAP Schedule Growth for Active Programs (MS B to IOC From Original Baseline; SAR Years
1997–2015) ............................................................................................................................................. 48 Figure 2-21. Program Length: Information Systems .................................................................................................... 49 Figure 2-22. Program Cost-Related Performance: Procurement................................................................................. 51 Figure 2-23. Program Cost-Related Performance: Procurement (Weighted by Program Size in Dollars) ................... 52 Figure 2-24. Program Cost-Related Performance Outliers: Procurement ................................................................... 53 Figure 2-25. Program Cost-Related Biennial Performance: Procurement ................................................................... 55 Figure 2-26. Program Cost-Related Biennial Performance: Procurement (Weighted by Program Size in Dollars) ..... 56 Figure 2-27. Program Cost-Related Biennial Performance Outliers: Procurement ..................................................... 57 Figure 2-28. Program Cost-Related Performance: Procurement................................................................................. 58 Figure 2-29. Reductions to Planned Program Funding: Procurement ......................................................................... 59 Figure 2-30. Average Annual Development Contract Cycle Time (FY 1981–2015) ...................................................... 60 Figure 2-31. Statistical Model Fit to Actual EV Contract Schedule Growth (FY 1985–2015) ....................................... 61 Figure 2-32. System Operational Test Performance: Effectiveness by DoD Component ............................................ 62 Figure 2-33. System Operational Test Performance: Suitability by DoD Component ................................................. 63 Figure 2-34. Program Cost-Related Performance: Nunn-McCurdy Breaches by DoD Component ............................. 64 Figure 2-35. Army Program Cost-Related Development Performance Baselined in SAE Periods ............................... 69 Figure 2-36. Navy Program Cost-Related Development Performance Baselined in SAE Periods ................................ 70 Figure 2-37. Air Force Program Cost-Related Development Performance Baselined in SAE Periods ......................... 71 Figure 2-38. Army Program Cost-Related Procurement Performance Baselined in SAE Periods ................................ 72 Figure 2-39. Navy Program Cost-Related Procurement Performance Baselined in SAE Periods ................................ 73 Figure 2-40. Air Force Program Cost-Related Procurement Performance Baselined in SAE Periods .......................... 74 Figure 2-41. Historical EBITDA Margin of the Six Largest DoD Primes (2010–2015) ................................................... 81 Figure 3-1. Five-year Moving Average of Annual Growth of EV Contract Costs (FY 1985–2015) ................................ 84 Figure 3-2. Statistical Model Fit to Actual Growth of EV Contract Costs (FY 1985–2015) ........................................... 86 Figure 3-3. Actual Growth Less Modeled Budget Effects (FY 1985–2015) .................................................................. 87 Figure 3-4. Portfolio Split Between Development and Early Production Contracts .................................................... 89 Figure 3-5. Separate Growth Rates for Development and Early Production Contracts .............................................. 89 Figure 3-6. Comparing Growth in Schedule and Cost on Major Contracts (FY 1985–2015) ........................................ 90 Figure 3-7. Five-year Moving Average of Total Growth of Contracted Costs for MDAPs Aligned to Milestone B date
(FY 1985–2012) ....................................................................................................................................... 93 Figure 3-8. Statistical Model Fit to Actual Growth of Total MDAP Contract Costs by MS B (FY 1985–2012) .............. 94 Figure 3-9. Model Fit: Annual Change in Portfolio O&S Cost Estimates: DoD-Wide (CY 2001–2014) ......................... 96 Figure 3-10. Fraction of MDAPs with Traceable Performance Requirement Changes Between MS B APB and Latest
SAR (CY 1988–2015) .............................................................................................................................. 101 Figure 3-11. Stringency of Performance Requirement Changes by Commodity Types (CY 1988–2015) .................. 102 Figure 3-12. Actual Quantity Procured Compared to Original MS B Plans for Completed Programs (1997–2015 SARs)
.............................................................................................................................................................. 105 Figure 3-13. Actual and Estimated Quantities Procured or Planned Compared to Original MS B Plans for Active and
Completed MDAPs (1997–2015 SARs) .................................................................................................. 106 Figure 3-14. Approximate Sunk RDT&E Costs of MDAPs Canceled After MS B (1997–2015 SARs) ........................... 108 Figure 3-15. Frequency of New MDAP Starts: 3-Year Moving Average (CY 1994–2015) .......................................... 109 Figure 3-16. Total Acquisition Cost of New MDAP Starts by Year of First MS B/C (CY 1997–2015) .......................... 110 Figure 3-17. Net and Total Number of Issues and Successes Raised in PM Annual Assessments to the DAE (CY 2016)
.............................................................................................................................................................. 112 Figure 3-18. Top-15 Net Successes: PM Annual Assessments to the DAE (CY 2016) ................................................ 113 Figure 3-19. Top-15 Net Issues: PM Annual Assessments to the DAE (CY 2016)....................................................... 113 Figure 4-1. Acquisition Workforce Total Size (FY 2005–2021) ................................................................................... 120 Figure 4-2. Acquisition Workforce Meeting Certification Standards (FY 2008–2016Q1) .......................................... 121 Figure 4-3. Civilian Acquisition Workforce Demographics (FY 2008–2016Q1) .......................................................... 123
167
Performance of the Defense Acquisition System, 2016
Figure 4-4. Change in Civilian Acquisition Workforce Demographics from FY 2008 to 2015 .................................... 123 Figure 4-5. Number of Protest Received by GAO (FY 2001–2015) ............................................................................ 127 Figure 4-6. Number of Protests Sustained by GAO (FY 2001–2015) ......................................................................... 127 Figure 4-7. GAO Protest Sustainment Rates (FY 2001–2015) .................................................................................... 128 Figure 4-8. Prime-Contracting Small-Business Subcategory Utilization Trends: Goals and Actuals (FY 2001–FY 2015)
.............................................................................................................................................................. 136 Figure 4-9. Pre-Award Audits: Completion Time and System Acceptability Rates (FY 2012–2016) .......................... 137 Figure 4-10. Incurred-Cost Audit Inventory (FY 2011–2016) ..................................................................................... 138 Figure B-1. Factors Contributing to 5-year Moving Average of Annual Growth of EV contract costs (FY 1985–2015)
.............................................................................................................................................................. 146 Figure B-2. Factors Contributing to 5-year Moving Average of Annual Growth of EV contract costs: Combined
Budgetary Factors (FY 1985–2015) ....................................................................................................... 147 Figure E-1. Key to Reading the “Box and Whisker” Charts ........................................................................................ 158 Figure E-2. Comparing Percentile and “Box and Whisker” Charts ............................................................................. 158
168
Performance of the Defense Acquisition System, 2016
INDEX OF TABLES
Table H-1. Changes in MDAP Cost Growth from 2014 to 2015 SARs ____________________________________ xxix Table H-2. Military Department MDAP “Overrun” Calculations and Penalties (SAR Years 2014–2015) ________ xxxiv Table 2-1. Causes of Failure to Meet Required Reliability Threshold in Operational Testing (FY 1984–2016Q1) ___ 18 Table 2-2. Correlation Between System Effectiveness and Suitability During Initial Operational Tests (FY 1997–
2016Q1) __________________________________________________________________________ 20 Table 2-3. Observed Operational Test Effectiveness Conditional Probabilities (FY 1997–2016Q1) _____________ 21 Table 2-4. Observed Operational Test Suitability Conditional Probabilities (FY 1997–2016Q1) ________________ 22 Table 2-5. Official DoD List of Nunn-McCurdy Breaches (SAR Years 1997–2016Q2) _________________________ 24 Table 2-6. Causes of Recent Nunn-McCurdy Breaches (CY 2014–2016Q2) ________________________________ 26 Table 2-7. Root Causes of Critical Nunn-McCurdy Breaches and Selected Programs ________________________ 28 Table 2-8. Nunn-McCurdy Breach Rate by Commodity _______________________________________________ 30 Table 2-9. Average Portfolio Cycle Time (from MS B/C to IOC) for MDAPs Past IOC (1997–2015 SARs) __________ 46 Table 2-10. Nunn-McCurdy Breaches by DoD Component _____________________________________________ 65 Table 2-11. Military Department MDAP “Overrun” Calculations and Penalties (FY 2015) ____________________ 67 Table 2-12. Military Department MDAP “Overrun” Calculations and Penalties (FY 2016) ____________________ 68 Table 2-13. Army Contractors by SSIP Tiers (FY 2014–2016) ___________________________________________ 76 Table 2-14. Navy SSIP Tiers by Contractor Division (FY 2014–2016)______________________________________ 77 Table 2-15. Air Force SSIP Tiers by Contractor Division (FY 2014–2016) __________________________________ 78 Table 2-16. DLA SSIP Ratings by Contractor Division (FY 2014–2016) ____________________________________ 79 Table 2-17. Count of SSIP Rating Changes by DoD Component Between FY 2015 and 2016 ___________________ 80 Table 3-1. Correlates of O&S Cost-Estimate Growth: DoD Wide (CY 2001–2014) ___________________________ 96 Table 3-2. Example: Modeled cost growth in DoD-wide MDAP O&S estimate for CY 2014 ___________________ 97 Table 3-3. Correlates of O&S Cost-Estimate Growth by DoD Component (CY 2001–2014) ____________________ 98 Table 3-4. Correlates of O&S Cost-Estimate Growth by Commodity (CY 2001–2014) ________________________ 99 Table 3-5. Programs with Changes Assessed as More or Less Stringent by Commodity Types (CY 1988–2015)___ 103 Table 3-6. Approximate Sunk RDT&E Costs of MDAPs Canceled After MS B (1997–2015 SARs) _______________ 107 Table 4-1. Growth of AWF by Functional Area (FY 2005–2015) ________________________________________ 120 Table 4-2. Filers that Lost at Least Three Bid Protests to GAO (FY 2005Q2–2015) _________________________ 130 Table 4-3. 50 Largest Defense Companies with Any GAO Protests (FY 2005Q2–2015) ______________________ 131 Table 4-4. 51st to 100th Largest Defense Companies With Any GAO Protests (FY 2005Q2–2015) ______________ 132 Table 4-5. Fifty Top Protesters by Number of GAO Protests Filed (FY 2005Q2–2015) _______________________ 133 Table 4-6. 51st to 100th Top Protesters by Number of GAO Protests Filed (FY 2005Q2–2015) ________________ 134 Table A-1. BBP Initiatives, Version 1.0 ____________________________________________________________ 140 Table A-2. BBP Initiatives, Version 2.0 ____________________________________________________________ 141 Table A-3. BBP Initiatives, Version 3.0 ____________________________________________________________ 142 Table B-1. Five-Year Moving Average of Annual Growth of EV Contract Costs (FY 1985–2015) _______________ 143 Table B-2. Model Coefficients and Statistics: 5-Year Moving Average of Annual Growth of EV contract costs ___ 145 Table B-3. Model Coefficients and Statistics: 5-Year Moving Average of Annual Growth of Contract Schedules __ 149 Table C-1. Five-Year Moving Average of Total Growth of MDAP Contracted Costs Aligned to MS B Date (FY 1985–
2012) ___________________________________________________________________________ 151 Table C-2. Model Coefficients and Statistics: 5-Year Moving Average of Total Growth of MDAP Contracted Costs
Aligned to MS B Date ______________________________________________________________ 153 Table D-1. Model Coefficients and Statistics: Annual Change in O&S Cost Estimates for MDAPs: Defense-Wide (CY
2001–2014) ______________________________________________________________________ 156
169
Performance of the Defense Acquisition System, 2016
I. REFERENCES
Army. (2016). U.S. Army announces fiscal year 2016 Superior Supplier Incentive Program list.
Washington, DC. Retrieved from
https://www.army.mil/article/172126/us_army_announces_fiscal_year_2016_superior_supplier_incentive_program_list
Assistant Secretary of the Army for Acquisition, Logistics, and Technology. (2015). Top defense firms recognized for superior performance. Washington, DC: Army News Service, Department of the Army. Retrieved from
http://www.army.mil/article/152251/Top_defense_firms_recognized_for_superior_performance/ Assistant Secretary of Defense for Logistics and Materiel Readiness. (2016). PBL Guidebook: A
Guide to Developing Performance-Based Arrangements. Washington, DC: Department of Defense.
Assistant Secretary of the Navy for Research, Development and Acquisition. (2014). Department of the Navy names superior suppliers for 2014 (Story Number: NNS140613-20). Washington, DC: Navy News Service, Department of the Navy. Retrieved from
http://www.navy.mil/submit/display.asp?story_id=81669 Assistant Secretary of the Navy for Research, Development and Acquisition. (2015). Department
of the Navy names superior suppliers for 2015 (Story Number: NNS150714-15). Washington, DC: Navy News Service, Department of the Navy. Retrieved from
http://www.navy.mil/submit/display.asp?story_id=90129 Assistant Secretary of the Navy for Research, Development and Acquisition. (2016). Department
of the Navy names superior suppliers for 2016 (Story Number: NNS160726-12), Washington, DC: Navy News Service, Department of the Navy. Retrieved from
http://www.navy.mil/submit/display.asp?story_id=95874
Boeing. (2016, July 20). Form 10-Q. Chicago, IL. Retrieved from
https://www.sec.gov/Archives/edgar/data/12927/000001292716000143/a201606jun3010-q.htm
Chairman of the Joint Chiefs of Staff. (2015). Manual for the Operation of the Joint Capabilities Integration and Development System (JCIDS). Washington, DC: Department of Defense.
Constable, S. (2012, August 2). In translation: Ebitda. Wall Street Journal. Retrieved from
http://www.wsj.com/articles/SB10000872396390444025204577545353669390264 Defense Logistics Agency. (2014). Defense Logistics Agency announces superior suppliers for
2013, 2014. Fort Belvoir, VA: DLA Public Affairs. Defense Logistics Agency. (2015). Defense Logistics Agency announces superior suppliers for
2015. Fort Belvoir, VA: DLA News Center, DLA Public Affairs. Defense Logistics Agency. (2016). Defense Logistics Agency announces superior suppliers for
2015. Fort Belvoir, VA: DLA News Center, DLA Public Affairs. Retrieved from
http://www.dla.mil/AboutDLA/News/NewsArticleView/Article/855585/defense-logistics-agency-announces-superior-suppliers-for-2015/
170
Performance of the Defense Acquisition System, 2016
Department of Defense. (2011). Contractor Performance Assessment Reporting System (CPARS) policy guide. Washington, DC. Retrieved from https://www.cpars.gov/cparsfiles/pdfs/DoD-CPARS-Guide.pdf
Department of Defense Chief Information Officer. (2016). Risk Management Framework (RMF)
for DoD information technology (IT) (Instruction 8510.01, incorporating Change 1, effective May 24, 2016). Washington, DC: Department of Defense. Retrieved from
http://www.dtic.mil/whs/directives/corres/pdf/851001_2014.pdf Director of Defense Procurement and Acquisition Policy. (2008). Peer reviews of contracts for
supplies and services (Memorandum). Washington, DC: Office of the USD(AT&L), Department of Defense. Retrieved from http://www.acq.osd.mil/dpap/cpic/cp/peer_reviews.html
Director of Defense Procurement and Acquisition Policy. (2016a). Source selection procedures: Department of Defense (Defense Federal Acquisition Regulation Supplement, Procedures, Guidance and Information; Subpart 215.3—Source Selection). Washington, DC: Department of Defense. Retrieved from
http://www.acq.osd.mil/dpap/policy/policyvault/USA004370-14-DPAP.pdf Director of Defense Procurement and Acquisition Policy. (2016b). Guidance on using incentive
and other contract types. Washington, DC: Office of the USD(AT&L), Department of Defense. Retrieved from
http://www.acq.osd.mil/dpap/policy/policyvault/USA001270-16-DPAP.pdf Director of Defense Procurement and Acquisition Policy. (2016c). Peer reviews. Washington,
DC: Office of the USD(AT&L), Department of Defense. Retrieved from
http://www.acq.osd.mil/dpap/cpic/cp/peer_reviews.html Director of Program Assessments and Root Cause Analyses. (2010a). PARCA root cause analysis
for the Wideband Global Satellite (WGS) Program (Memorandum). Washington, DC: Department of Defense.
Director of Program Assessments and Root Cause Analyses. (2010b). PARCA root cause analysis for the Advanced Threat Infrared Countermeasure/Common Missile Warning System (ATIRCM/CMWS) Program (Memorandum). Washington, DC: Department of Defense.
Director of Program Assessments and Root Cause Analyses. (2010c). PARCA root cause analysis for the Remote Minehunting System (RMS) (Memorandum). Washington, DC: Department of Defense. Retrieved from
http://www.acq.osd.mil/parca/docs/2010-05-20-parca-rca-rms.pdf Director of Program Assessments and Root Cause Analyses. (2010d). PARCA root cause analysis
for the Apache Longbow Block III Program (Memorandum). Washington, DC: Department of Defense.
Director of Program Assessments and Root Cause Analyses. (2010e). PARCA root cause analysis for the DDG-1000 Program (Memorandum). Washington, DC: Department of Defense.
Director of Program Assessments and Root Cause Analyses. (2010f). PARCA root cause analysis for the Joint Strike Fighter (JSF) [F-35] Program (Memorandum). Washington, DC: Department of Defense.
Director of Program Assessments and Root Cause Analyses. (2010g). PARCA root cause analysis for the Excalibur Program (Memorandum). Washington, DC: Department of Defense.
Director of Program Assessments and Root Cause Analyses. (2011a). PARCA root cause analysis for the Enterprise Resource Planning Systems (Memorandum). Washington, DC:
171
Performance of the Defense Acquisition System, 2016
Department of Defense. [Includes GCSS-MC, Navy ERP, and early analysis of the Air Force Expeditionary Combat Support System (ECSS).]
Director of Program Assessments and Root Cause Analyses. (2011b). PARCA root cause analysis of the Assembled Chemical Weapons Alternatives (ACWA) Program (Memorandum). Washington, DC: Department of Defense.
Director of Program Assessments and Root Cause Analyses. (2011c). PARCA root cause analysis of the [RQ-4A/B] Global Hawk Program (Memorandum). Washington, DC: Department of Defense.
Director of Program Assessments and Root Cause Analyses. (2011d). PARCA root cause analysis of the Joint Tactical Radio System Ground Mobile Radios (JTRS GMR) Program (Memorandum). Washington, DC: Department of Defense.
Director of Program Assessments and Root Cause Analyses. (2011e). PARCA root cause analysis of the Family of Advanced Beyond Line-of-Sight Terminals (FAB-T) Program (Memorandum). Washington, DC: Department of Defense.
Director of Program Assessments and Root Cause Analyses. (2012a). Results for PARCA’s root cause analysis of the Joint Land Attack Cruise Missile Defense Elevated Netted Sensor System [JLENS] Program (Memorandum). Washington, DC: Department of Defense.
Director of Program Assessments and Root Cause Analyses. (2012b). PARCA’s discretionary root cause analysis of the [P-8A] Poseidon Program (Memorandum). Washington, DC: Department of Defense.
Director of Program Assessments and Root Cause Analyses. (2012c). PARCA’s root cause analysis of the Evolved Expendable Launch Vehicle [EELV] Program (Memorandum). Washington, DC: Department of Defense.
Director of Program Assessments and Root Cause Analyses. (2013). Root cause analysis of the [Air Force] Expeditionary Combat Support System [ECSS] Program (Memorandum). Washington, DC: Department of Defense.
Director of Program Assessments and Root Cause Analyses. (2014a). PARCA root cause analysis of the Joint Precision Approach and Landing System Increment 1A (JPALS [Increment] 1A) Program (Memorandum). Washington, DC: Department of Defense.
Director of Program Assessments and Root Cause Analyses. (2014b). PARCA root cause analysis of the MQ-8 Vertical Takeoff and Landing Tactical Unmanned Aerial Vehicle Fire Scout (VTUAV) Program (Memorandum). Washington, DC: Department of Defense.
Director of Program Assessments and Root Cause Analyses. (2016). Root cause analysis of the Next Generation Operational Control System (OCX) Program (Memorandum). Washington, DC: Department of Defense.
General Services Administration. (2011). Product and service codes manual—Federal Procurement Data System. Office of Government-wide Policy. Washington, DC.
Gibson, A. C. (2016). AF releases 2016 supplier performance ratings. Washington, DC: Secretary of the Air Force Public Affairs Command Information, Department of the Air Force. Retrieved from http://www.af.mil/News/ArticleDisplay/tabid/223/Article/855626/af-releases-2016-supplier-performance-ratings.aspx
Government Accountability Office. (2009). DCAA audits: Widespread problems with audit quality require significant reform (GAO-09-468). Washington DC. Retrieved from
http://www.gao.gov/products/GAO-09-468
172
Performance of the Defense Acquisition System, 2016
Government Accountability Office. (2014). Defense acquisitions: Defense acquisitions assessments of selected weapon programs (GAO-14-340SP). Washington, DC. Retrieved from http://www.gao.gov/products/GAO-14-340SP
Government Accountability Office. (2015a). Defense acquisitions: Defense acquisitions assessments of selected weapon programs (GAO-15-342SP). Washington, DC. Retrieved from http://www.gao.gov/products/GAO-15-342SP
Government Accountability Office. (2015b). Defense acquisition process: Military service chiefs’ concerns reflect need to better define requirements before programs start (GAO-15-469). Washington, DC. Retrieved from http://www.gao.gov/products/GAO-15-469
Government Accountability Office. (2016, August 18). Matter of Latvian Connection LLC (Decision, File #B-413442). Washington, DC. Retrieved from http://www.gao.gov/products/B-
413442 Harrison, T. (2014). Analysis of the FY 2015 defense budget. Washington, DC: Center for
Strategic and Budgetary Assessments. Retrieved from
http://csbaonline.org/research/publications/analysis-of-the-fy2015-defense-budget
Haux, H. (2015). AF releases SSIP results to DoD contractors. Washington, DC: Secretary of the Air Force Public Affairs Command Information, Department of the Air Force. Retrieved
from http://www.af.mil/News/ArticleDisplay/tabid/223/Article/608569/af-releases-ssip-results-to-dod-contractors.aspx
Investopedia. (2016), EBITDA—Earnings Before Interest, Taxes, Depreciation and Amortization. Oakland, CA. Retrieved from
http://www.investopedia.com/terms/e/ebitda.asp Kendall, F. (2013, March-April). Use of fixed-price incentive firm (FPIF) contracts in development
and production. 2–4. Retrieved from
http://www.dau.mil/pubscats/ATL%20Docs/Mar_Apr_2013/Kendall.pdf Kendall, F. (2016a, January-February). Better Buying Power principles: What are they? Defense
AT&L. Retrieved from
http://dau.dodlive.mil/2015/12/28/better-buying-power-principles-what-are-they/ Kendall, F. (2016b, July-August). Improving acquisition from within: Suggestions from our PEOs.
Defense AT&L. Retrieved from
http://dau.dodlive.mil/files/2016/06/Kendall.pdf Lambert, B. (2014, August 5). Sequestration: What was the impact and how do we recover the
industrial base. Washington, DC: AFCEA Defense Acquisition Modernization Symposium. Retrieved from http://www.afcea.org/events/modernization/14/documents/AFCEA_Lambert_Aug2014-1.pdf
McClure, B. (2014, September 14). A clear look at EBITDA. Oakland, CA: Investopedia. Retrieved
from http://www.investopedia.com/articles/06/ebitda.asp McNicol, D. L., & Wu, L. (2014) Evidence on the effect of DoD acquisition policy and process on
cost growth of major defense acquisition programs (P-5126). Alexandria, VA: Institute for Defense Analyses. Retrieved from
http://www.dtic.mil/dtic/tr/fulltext/u2/a609472.pdf Reuters. (2016). EBITDA. Financial Glossary. New York, NY. Retrieved from
http://glossary.reuters.com/index.php?title=EBITDA Schwartz, M. (2010) The Nunn-McCurdy Act: Background, analysis, and issues for Congress.
Washington, DC: Congressional Research Service. Schwartz, M. & Manuel, K. M. (2015). GAO bid protests: Trends and analysis, Washington, DC:
Congressional Research Service.
173
Performance of the Defense Acquisition System, 2016
Thompson, L. (2012, January 10). National security space: Past, present, prospects: Remarks to the Space Enterprise Council. Arlington, VA: Lexington Institute. Retrieved from
http://lexingtoninstitute.org/national-security-space-past-present-prospects/ Under Secretary of Defense for Acquisition, Technology, and Logistics. (2010, November 3).
Implementation directive for Better Buying Power—Obtaining greater efficiency and productivity in defense spending (Memorandum). Washington, DC: Department of Defense.
Under Secretary of Defense for Acquisition, Technology, and Logistics. (2013a, April 24). Implementation directive for Better Buying Power 2.0—Achieving greater efficiency and productivity in defense spending (Memorandum). Washington, DC: Department of Defense.
Under Secretary of Defense for Acquisition, Technology, and Logistics. (2013b). Performance of the defense acquisition system, 2013 annual report. Washington, DC: Department of Defense.
Under Secretary of Defense for Acquisition, Technology, and Logistics. (2014a). Performance of the defense acquisition system, 2014 annual report. Washington, DC: Department of Defense.
Under Secretary of Defense for Acquisition, Technology, and Logistics. (2014b). Guidelines for creating and maintaining a competitive environment for supplies and services in the Department of Defense. Washington, DC: Department of Defense. Retrieved from
http://www.acq.osd.mil/dpap/cpic/cp/docs/BBP_2-0_Comp_Guidelines_Update_(3_Dec_2014).pdf Under Secretary of Defense for Acquisition, Technology, and Logistics. (2015a). Operation of the
defense acquisition system (Instruction 5000.02). Washington, DC: Department of Defense.
Under Secretary of Defense for Acquisition, Technology, and Logistics. (2015b). Performance of the defense acquisition system, 2015 annual report. Washington, DC: Department of Defense. Retrieved from
http://go.usa.gov/3u8Uh Under Secretary of Defense for Acquisition, Technology, and Logistics. (2015c). Compendium of
annual program manager assessments for 2015. Washington, DC: Department of Defense. Retrieved from
http://www.acq.osd.mil/fo/docs/Compendium-PM-Assessments-2015.pdf Under Secretary of Defense for Acquisition, Technology, and Logistics. (2015d, April 9).
Implementation directive for Better Buying Power 3.0—Achieving dominant capabilities through technical excellence and innovation (Memorandum). Washington, DC: Department of Defense.
Under Secretary of Defense for Acquisition, Technology, and Logistics. (2016). Defense acquisition of services (Instruction 5000.74). Washington, DC: Department of Defense. Retrieved from http://www.dtic.mil/whs/directives/corres/pdf/500074p.pdf
Under Secretary of Defense (Comptroller). (2016a, February 9). Fiscal year 2017 budget request. Washington, DC: Department of Defense. Retrieved from
http://comptroller.defense.gov/Portals/45/Documents/defbudget/fy2017/FY2017_Budget_Request.pdf Under Secretary of Defense (Comptroller). (2016b, February). Program acquisition cost by
weapon system: Fiscal year 2017 budget request, Washington, DC: Department of
174
Performance of the Defense Acquisition System, 2016
Defense. Retrieved from
http://comptroller.defense.gov/Portals/45/Documents/defbudget/fy2017/FY2017_Weapons.pdf Under Secretary of Defense (Comptroller). (2016c, March). National defense budget estimates
for FY 2017 (Green Book). Washington, DC: Department of Defense. Retrieved from
http://comptroller.defense.gov/Portals/45/Documents/defbudget/fy2017/FY17_Green_Book.pdf Vergun, D. (2015). Key defense suppliers recognized for stellar delivery to warfighters.
Washington, DC: Department of the Army. [NOTE: This article covers both Army and Air Force SSIP results for 2015.] Retrieved from
http://www.army.mil/article/142449/Key_defense_suppliers_recognized_for_stellar_delivery_to_warfighters/