Embed Size (px)
Citation preview

Lincoln National Corporation®
2016 ANNUAL REPORT TO SHAREHOLDERS
____________________ 1 A reconciliation of non-GAAP measures to their most comparable GAAP measures appears on the next page.
2016 Annual Letter to Shareholders
Dear Shareholders, As a leading public life insurance company in the United States, we are committed to creating long-term value for our shareholders. This is enabled by our over 9,000 talented employees delivering products and services that offer financial security and peace of mind to our 17 million customers. Our business model has a demonstrated track record of stability and financial success. Since 2009, we have grown income from operations per share at a 13% annual rate, improved our operating return on equity by 360 basis points, increased book value per share, excluding accumulated other comprehensive income (“AOCI”), at a 7% annual rate and returned $5 billion of capital to shareholders through share buybacks and dividends.1
Included in this solid long-term performance were strong results in 2016 as we again delivered consistent and profitable growth including:
• Income from operations per share of $6.50, a record and up 19%1 • Assets under management totaled $229 billion, a year-end record • Book value per share, excluding AOCI, exceeded $57, up 9%1 • Operating return on equity, excluding AOCI, was 12%1 • Capital returned to shareholders remained robust at $1.1 billion or 72% of operating earnings • Statutory capital as of year-end approached $9 billion, up 5%
We are particularly pleased with this year’s results given the backdrop of global economic and political uncertainty. As a company that recently celebrated our 110th anniversary, we have a history of responding and successfully adapting to various environments, including regulatory changes, shifts in consumer preferences and technological advancements. Therefore, we truly believe companies need to stay attuned to cyclical and structural shifts in the marketplace and the impact those shifts have on all stakeholders. A recent notable shift for us on the regulatory front relates to the Department of Labor (“DOL”) Fiduciary Rule. We have supported the intent of the DOL rule and its overarching goal to further ensure that our clients’ best interests are served while working to improve parts of the rule. The DOL acknowledged in the final rule that both commissions and fees can be appropriate forms of compensation, and we have moved to refresh and introduce new annuities that maintain invaluable guaranteed lifetime income benefits while providing compensation choice for consumers. To respond to the rapid pace of technological advancement, we recently hired a Chief Digital Officer and launched another dimension of our technology strategy focused on digitization. The “born digital” companies are raising customer service expectations, and we are moving to meet these expectations. Our primary focus is to improve our customers’ experiences and increase our efficiency. We have already seen benefits from leveraging digital and mobile capabilities. For example, in our Retirement Plan Services (“RPS”) business, we have enhanced and simplified the web experience for participants with the launch of an easy “click to contribute” feature. Since inception, we have seen more than 19,000 participants better prepare for retirement by increasing contribution rates, securing $45 million in additional retirement savings. We expect our digital strategy to result in additional successes and further enhance our reputation as a premier provider of products that meet critical consumer needs that are unmet by other industries. Our Life Insurance business enables legacy planning, and last year we paid nearly $2 billion in claims that helped secure families’ futures following the passing of a loved one. Our Annuities business has nearly $70 billion of account value in products that offer guaranteed lifetime income, which fills a void from most corporations eliminating defined benefit pensions. We also recognize the importance of a vibrant workforce. We invest in attracting and developing our workforce to ensure we have a competitive edge from an internal and external perspective. Talent is a key driver at Lincoln. Since 2009, we have increased our employee base and have seen salaries for non-executives increase at a faster rate than the average wages for the United States population. We couple this with a deep commitment to employee development and promotion opportunities, diversity and inclusion, retirement planning and our role in the broader community. Notably, all Lincoln employees are deeply connected to the communities within the key cities where we operate. Our employees contribute thousands of volunteer hours, and our Lincoln Financial Foundation reinforces our commitment through significant charitable investments to more than 400 nonprofits. We are investing for long-term growth through approximately $1 billion in annual capital allocated towards writing new business and a commitment to employee enrichment. However, we generate a significant amount of capital, leaving us with excess capital that we have efficiently returned to shareholders. Over the past 6 years the majority, or $4 billion, of capital returned to shareholders has been put towards buybacks, and our share price as of December 31, 2016, was 76% above our average repurchase price over that period.
____________________ 2 Lincoln defines its peer group for 2016 as AEGON N.V.; Ameriprise Financial, Inc.; Manulife Financial Corp.; MetLife, Inc.; Principal Financial Group, Inc.; Prudential Financial, Inc.; Sun Life Financial, Inc.; Torchmark Corp.; Unum Group; and Voya Financial, Inc. Prior period performance also includes Genworth Financial; however, it excludes AEGON N.V.; Ameriprise Financial, Inc.; and Voya Financial, Inc., which were not identified as peers in prior year proxy statements.
Importantly, our long-term commitments and alignment with all our key stakeholders are rewarding shareholders. In 2016, Lincoln’s share price increased 32% — outperforming our peers, which increased by an average of 18%.2 This marked the fourth consecutive three-year cycle where our total return to shareholders was among the best in the industry. Over this time, our share price increased 138% compared to a 49% gain for our peer group.2 As we look forward, we remain confident that our key strategic objectives – manufacture only retail products, target the fastest growing segments of the broader U.S. market, maintain industry leading risk management, utilize digitization to drive a differentiated customer experience and actively direct capital to the highest and best uses – will drive long-term, sustainable growth in our four business segments: Life Insurance, Annuities, RPS and Group Protection. On a personal note, we want to express our gratitude to William (Billy) Porter Payne, who has announced plans to retire and will not be standing for re-election to our Board of Directors this year. Billy has provided thoughtful counsel and guidance, and we are sincerely appreciative of his many years of dedication and leadership, which resulted in significant contributions to Lincoln. In closing, on behalf of Lincoln’s Board of Directors, management and all our employees, we want to thank you for your continued trust and investment. We are excited about the opportunities ahead and our ability to continue creating long-term value for our shareholders.
Dennis R. Glass William H. Cunningham President and CEO Chairman of the Board March 27, 2017 Forward-Looking Statements – Cautionary Language Statements in this letter that are not historical facts are forward-looking statements. Actual results may differ materially from those projected in the forward-looking statements. See “Forward-Looking Statements – Cautionary Language” beginning on page 34 and “Risk Factors” beginning on page 16. Definitions of Non-GAAP Measures Income (loss) from operations, operating revenues and operating return on equity (“ROE”) are financial measures we use to evaluate and assess our results. These financial measures are non-GAAP financial measures and do not replace GAAP revenues, net income (loss) and ROE, the most directly comparable GAAP measures. Income (Loss) from Operations Income (loss) from operations is GAAP net income excluding the after-tax effects of the following items, as applicable: • Realized gains and losses associated with the following (“excluded realized gain (loss)”):
Sales or disposals and impairments of securities; Changes in the fair value of derivatives, embedded derivatives within certain reinsurance arrangements and trading securities; Changes in the fair value of the derivatives we own to hedge our guaranteed death benefit (“GDB”) riders within our variable
annuities; Changes in the fair value of the embedded derivatives of our guaranteed living benefit (“GLB”) riders reflected within variable
annuity net derivative results accounting for at fair value; Changes in the fair value of the derivatives we own to hedge our GLB riders reflected within variable annuity net derivative
results; and Changes in the fair value of the embedded derivative liabilities related to index call options we may purchase in the future to
hedge contract holder index allocations applicable to future reset periods for our indexed annuity products accounted for at fair value;
• Changes in reserves resulting from benefit ratio unlocking on our GDB and GLB riders;
• Income (loss) from reserve changes, net of related amortization, on business sold through reinsurance;
• Gains (losses) on early extinguishment of debt;
• Losses from the impairment of intangible assets;
• Income (loss) from discontinued operations; and
• Income (loss) from the initial adoption of new accounting standards.
Operating Revenues Operating revenues represent GAAP revenues excluding the pre-tax effects of the following items, as applicable: • Excluded realized gain (loss);
• Revenue adjustments from the initial adoption of new accounting standards;
• Amortization of DFEL arising from changes in GDB and GLB benefit ratio unlocking; and
• Amortization of deferred gains arising from reserve changes on business sold through reinsurance.
Operating ROE Operating ROE measures how efficiently we generate profits from the resources provided by our net assets. Operating ROE as used herein is calculated by dividing income (loss) from operations by average equity, excluding AOCI. Book Value Per Share Excluding AOCI Book value per share excluding AOCI is calculated based upon a non-GAAP financial measure. It is calculated by dividing stockholders’ equity excluding AOCI by common shares outstanding. We provide book value per share excluding AOCI to enable investors to analyze the amount of our net worth that is primarily attributable to our business operations. Management believes book value per share excluding AOCI is useful to investors because it eliminates the effect of items that can fluctuate significantly from period to period, primarily based on changes in interest rates. Book value per share is the most directly comparable GAAP measure.
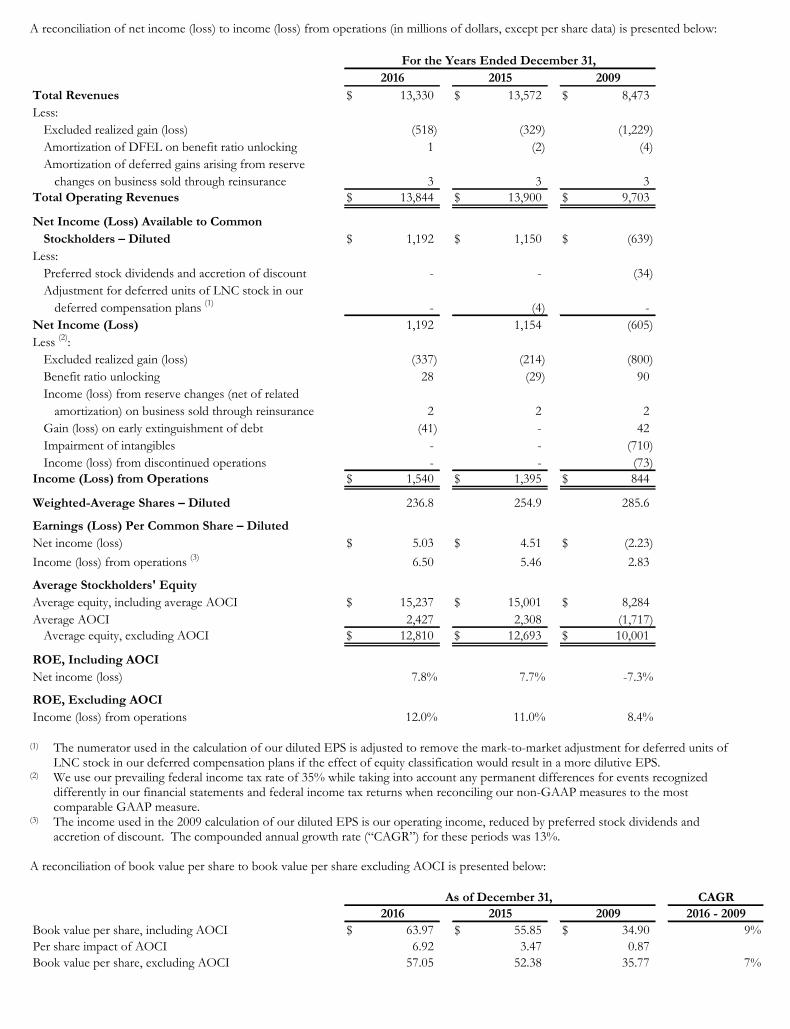
A reconciliation of net income (loss) to income (loss) from operations (in millions of dollars, except per share data) is presented below:
Total Revenues $ 13,330 $ 13,572 $ 8,473 Less:
Excluded realized gain (loss) (518) (329) (1,229) Amortization of DFEL on benefit ratio unlocking 1 (2) (4) Amortization of deferred gains arising from reserve
changes on business sold through reinsurance 3 3 3 Total Operating Revenues $ 13,844 $ 13,900 $ 9,703
Net Income (Loss) Available to Common Stockholders – Diluted $ 1,192 $ 1,150 $ (639)
Less:Preferred stock dividends and accretion of discount - - (34) Adjustment for deferred units of LNC stock in our
deferred compensation plans (1) - (4) - Net Income (Loss) 1,192 1,154 (605) Less (2):
Excluded realized gain (loss) (337) (214) (800) Benefit ratio unlocking 28 (29) 90 Income (loss) from reserve changes (net of related
amortization) on business sold through reinsurance 2 2 2 Gain (loss) on early extinguishment of debt (41) - 42 Impairment of intangibles - - (710) Income (loss) from discontinued operations - - (73)
Income (Loss) from Operations $ 1,540 $ 1,395 $ 844
Weighted-Average Shares – Diluted 236.8 254.9 285.6
Earnings (Loss) Per Common Share – DilutedNet income (loss) $ 5.03 $ 4.51 $ (2.23)
Income (loss) from operations (3) 6.50 5.46 2.83
Average Stockholders' EquityAverage equity, including average AOCI $ 15,237 $ 15,001 $ 8,284 Average AOCI 2,427 2,308 (1,717)
Average equity, excluding AOCI $ 12,810 $ 12,693 $ 10,001
ROE, Including AOCINet income (loss) 7.8% 7.7% -7.3%
ROE, Excluding AOCIIncome (loss) from operations 12.0% 11.0% 8.4%
For the Years Ended December 31, 20152016 2009
(1) The numerator used in the calculation of our diluted EPS is adjusted to remove the mark-to-market adjustment for deferred units of LNC stock in our deferred compensation plans if the effect of equity classification would result in a more dilutive EPS. (2) We use our prevailing federal income tax rate of 35% while taking into account any permanent differences for events recognized differently in our financial statements and federal income tax returns when reconciling our non-GAAP measures to the most comparable GAAP measure. (3) The income used in the 2009 calculation of our diluted EPS is our operating income, reduced by preferred stock dividends and accretion of discount. The compounded annual growth rate (“CAGR”) for these periods was 13%. A reconciliation of book value per share to book value per share excluding AOCI is presented below:
Book value per share, including AOCI $ 63.97 $ 55.85 $ 34.90 9%Per share impact of AOCI 6.92 3.47 0.87 Book value per share, excluding AOCI 57.05 52.38 35.77 7%
CAGR2016 - 2009
As of December 31, 200920152016
UNITED STATES SECURITIES AND EXCHANGE COMMISSION
WASHINGTON, D. C. 20549
FORM 10-K
(Mark One) Annual Report Pursuant to Section 13 or 15(d) of the Securities Exchange Act of 1934
For the fiscal year ended December 31, 2016 OR
Transition Report Pursuant to Section 13 or 15(d) of the Securities Exchange Act of 1934 For the transition period from to .
Commission File Number 1-6028
LINCOLN NATIONAL CORPORATION (Exact name of registrant as specified in its charter)
Indiana 35-1140070 (State or other jurisdiction of incorporation or organization) (I.R.S. Employer Identification No.)
150 N. Radnor-Chester Road, Suite A305, Radnor, Pennsylvania 19087 (Address of principal executive offices) (Zip Code)
Registrant’s telephone number, including area code: (484) 583-1400
Securities registered pursuant to Section 12(b) of the Act:
Title of each class
Name of each exchange on which registered
Common Stock New York Warrants, each to purchase one share of common stock New York
Securities registered pursuant to Section 12(g) of the Act: None
Indicate by check mark if the registrant is a well-known seasoned issuer, as defined in Rule 405 of the Securities Act. Yes No
Indicate by check mark if the registrant is not required to file reports pursuant to Section 13 or Section 15(d) of the Act. Yes No
Indicate by check mark whether the registrant (1) has filed all reports required to be filed by Section 13 or 15(d) of the Securities Exchange Act of 1934 during the preceding 12 months (or for such shorter period that the registrant was required to file such reports), and (2) has been subject to such filing requirements for the past 90 days. Yes No
Indicate by check mark whether the registrant has submitted electronically and posted on its corporate Web site, if any, every Interactive Data File required to be submitted and posted pursuant to Rule 405 of Regulation S-T (§ 232.405 of this chapter) during the preceding 12 months (or for such shorter period that the registrant was required to submit and post such files). Yes No
Indicate by check mark if disclosure of delinquent filers pursuant to Item 405 of Regulation S-K (§ 229.405 of this chapter) is not contained herein, and will not be contained, to the best of registrant’s knowledge, in definitive proxy or information statements incorporated by reference in Part III of this Form 10-K or any amendment to this Form 10-K.
Indicate by check mark whether the registrant is a large accelerated filer, an accelerated filer, a non-accelerated filer, or a smaller reporting company. See the definitions of “large accelerated filer,” “accelerated filer” and “smaller reporting company” in Rule 12b-2 of the Exchange Act. Large accelerated filer Accelerated filer Non-accelerated filer (Do not check if a smaller reporting company) Smaller reporting company
Indicate by check mark whether the registrant is a shell company (as defined in Rule 12b-2 of the Act). Yes No The aggregate market value of the shares of the registrant’s common stock held by non-affiliates (based upon the closing price
of these shares on the New York Stock Exchange) as of the last business day of the registrant’s most recently completed second fiscal quarter was $9.0 billion.
As of February 17, 2017, 225,213,415 shares of common stock of the registrant were outstanding.
Documents Incorporated by Reference:
Selected portions of the Proxy Statement for the Annual Meeting of Shareholders, scheduled for May 26, 2017, have been incorporated by reference into Part III of this Form 10-K. ________________________________________________________________________________________________________
Lincoln National Corporation
Table of Contents
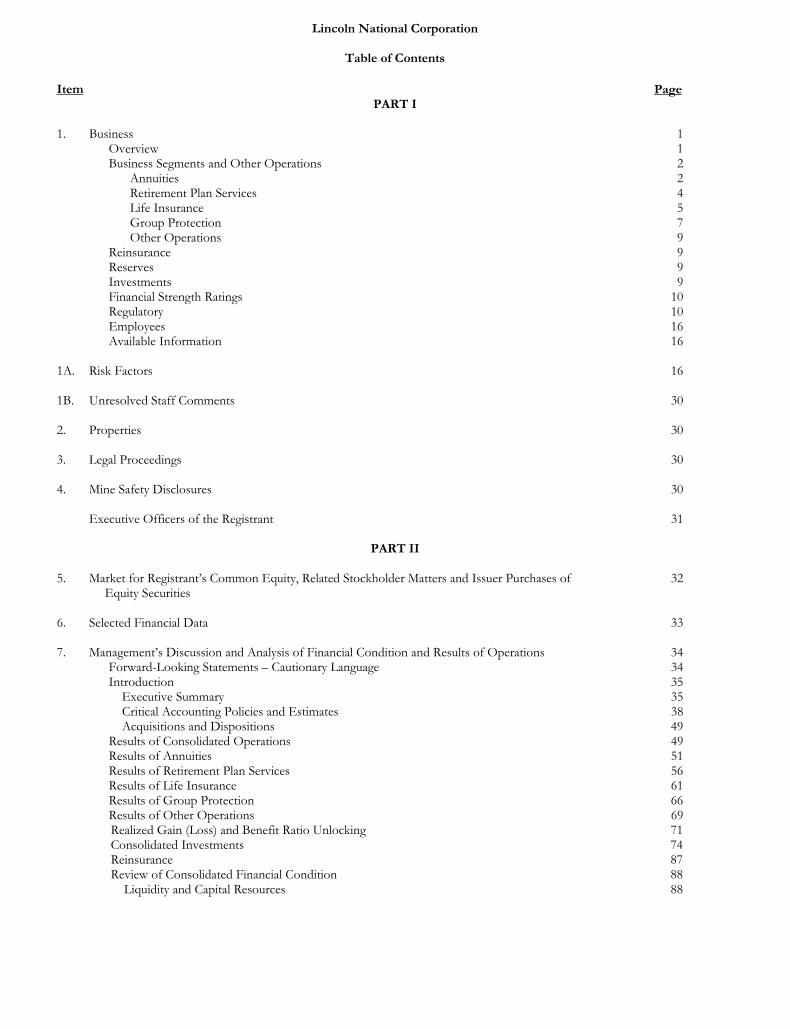
Item Page PART I
1. Business 1
Overview 1 Business Segments and Other Operations 2 Annuities 2 Retirement Plan Services 4 Life Insurance 5 Group Protection 7 Other Operations 9 Reinsurance 9 Reserves 9 Investments 9 Financial Strength Ratings 10 Regulatory 10 Employees 16 Available Information 16
1A. Risk Factors 16 1B. Unresolved Staff Comments 30 2. Properties 30 3. Legal Proceedings 30 4. Mine Safety Disclosures 30
Executive Officers of the Registrant 31
PART II 5. Market for Registrant’s Common Equity, Related Stockholder Matters and Issuer Purchases of
Equity Securities 32
6. Selected Financial Data 33 7. Management’s Discussion and Analysis of Financial Condition and Results of Operations 34
Forward-Looking Statements – Cautionary Language 34 Introduction 35 Executive Summary 35 Critical Accounting Policies and Estimates 38 Acquisitions and Dispositions 49 Results of Consolidated Operations 49 Results of Annuities 51 Results of Retirement Plan Services 56 Results of Life Insurance 61 Results of Group Protection 66 Results of Other Operations 69 Realized Gain (Loss) and Benefit Ratio Unlocking 71 Consolidated Investments 74 Reinsurance 87 Review of Consolidated Financial Condition 88 Liquidity and Capital Resources 88
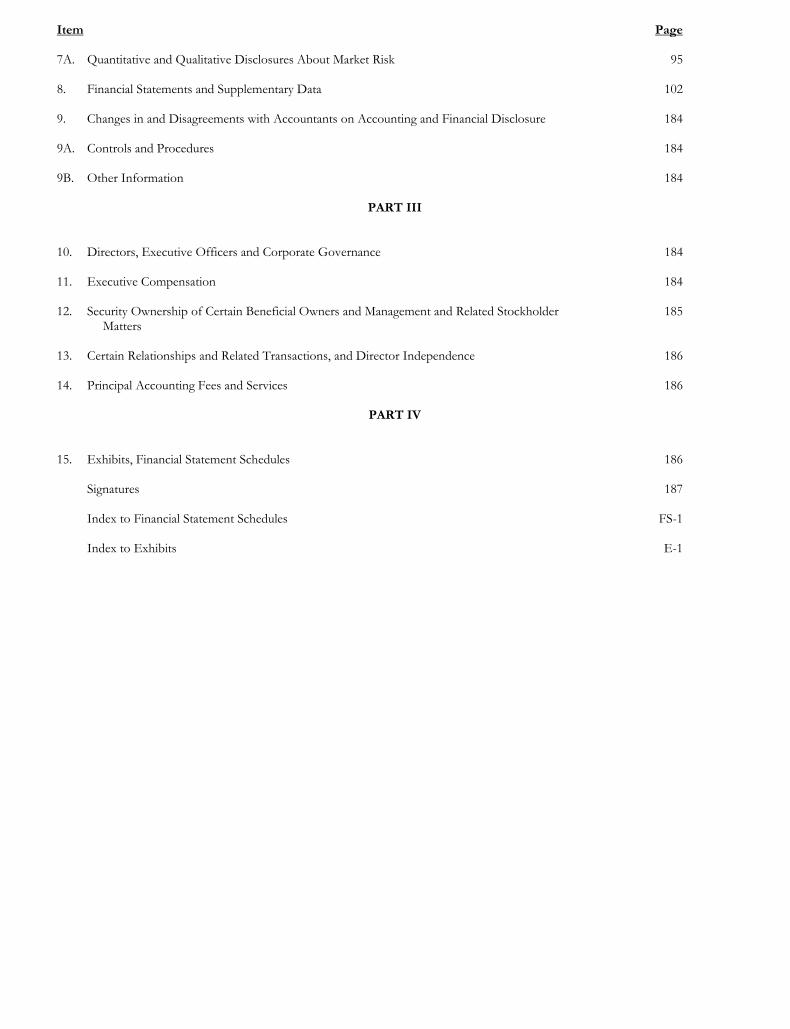
Item Page 7A. Quantitative and Qualitative Disclosures About Market Risk 95 8. Financial Statements and Supplementary Data 102 9. Changes in and Disagreements with Accountants on Accounting and Financial Disclosure 184 9A. Controls and Procedures 184 9B. Other Information 184
PART III 10. Directors, Executive Officers and Corporate Governance 184 11. Executive Compensation 184 12. Security Ownership of Certain Beneficial Owners and Management and Related Stockholder
Matters 185
13. Certain Relationships and Related Transactions, and Director Independence 186 14. Principal Accounting Fees and Services 186
PART IV 15. Exhibits, Financial Statement Schedules 186
Signatures 187
Index to Financial Statement Schedules FS-1
Index to Exhibits E-1
1
PART I
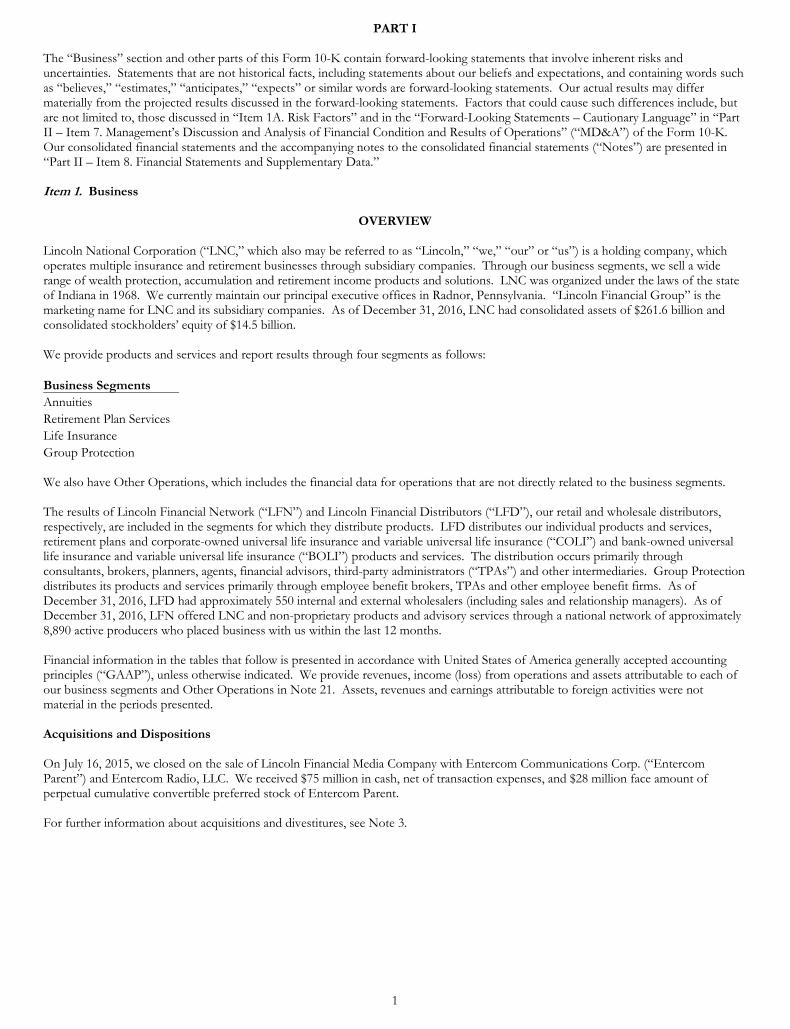
The “Business” section and other parts of this Form 10-K contain forward-looking statements that involve inherent risks and uncertainties. Statements that are not historical facts, including statements about our beliefs and expectations, and containing words such as “believes,” “estimates,” “anticipates,” “expects” or similar words are forward-looking statements. Our actual results may differ materially from the projected results discussed in the forward-looking statements. Factors that could cause such differences include, but are not limited to, those discussed in “Item 1A. Risk Factors” and in the “Forward-Looking Statements – Cautionary Language” in “Part II – Item 7. Management’s Discussion and Analysis of Financial Condition and Results of Operations” (“MD&A”) of the Form 10-K. Our consolidated financial statements and the accompanying notes to the consolidated financial statements (“Notes”) are presented in “Part II – Item 8. Financial Statements and Supplementary Data.” Item 1. Business
OVERVIEW Lincoln National Corporation (“LNC,” which also may be referred to as “Lincoln,” “we,” “our” or “us”) is a holding company, which operates multiple insurance and retirement businesses through subsidiary companies. Through our business segments, we sell a wide range of wealth protection, accumulation and retirement income products and solutions. LNC was organized under the laws of the state of Indiana in 1968. We currently maintain our principal executive offices in Radnor, Pennsylvania. “Lincoln Financial Group” is the marketing name for LNC and its subsidiary companies. As of December 31, 2016, LNC had consolidated assets of $261.6 billion and consolidated stockholders’ equity of $14.5 billion. We provide products and services and report results through four segments as follows:
Business Segments Annuities Retirement Plan Services Life Insurance Group Protection We also have Other Operations, which includes the financial data for operations that are not directly related to the business segments. The results of Lincoln Financial Network (“LFN”) and Lincoln Financial Distributors (“LFD”), our retail and wholesale distributors, respectively, are included in the segments for which they distribute products. LFD distributes our individual products and services, retirement plans and corporate-owned universal life insurance and variable universal life insurance (“COLI”) and bank-owned universal life insurance and variable universal life insurance (“BOLI”) products and services. The distribution occurs primarily through consultants, brokers, planners, agents, financial advisors, third-party administrators (“TPAs”) and other intermediaries. Group Protection distributes its products and services primarily through employee benefit brokers, TPAs and other employee benefit firms. As of December 31, 2016, LFD had approximately 550 internal and external wholesalers (including sales and relationship managers). As of December 31, 2016, LFN offered LNC and non-proprietary products and advisory services through a national network of approximately 8,890 active producers who placed business with us within the last 12 months. Financial information in the tables that follow is presented in accordance with United States of America generally accepted accounting principles (“GAAP”), unless otherwise indicated. We provide revenues, income (loss) from operations and assets attributable to each of our business segments and Other Operations in Note 21. Assets, revenues and earnings attributable to foreign activities were not material in the periods presented. Acquisitions and Dispositions On July 16, 2015, we closed on the sale of Lincoln Financial Media Company with Entercom Communications Corp. (“Entercom Parent”) and Entercom Radio, LLC. We received $75 million in cash, net of transaction expenses, and $28 million face amount of perpetual cumulative convertible preferred stock of Entercom Parent. For further information about acquisitions and divestitures, see Note 3.
2
BUSINESS SEGMENTS AND OTHER OPERATIONS
ANNUITIES Overview The Annuities segment provides tax-deferred investment growth and lifetime income opportunities for its clients by offering fixed (including indexed) and variable annuities. The “fixed” and “variable” classifications describe whether we or the contract holders bear the investment risk of the assets supporting the contract. This also determines the manner in which we earn investment margin profits from these products, either as investment spreads for fixed products or as asset-based fees charged to variable products. Annuities have several features that are attractive to customers. Annuities are unique in that contract holders can select a variety of payout alternatives to help provide an income flow for life. Many annuity contracts also include guarantee features (living and death benefits) that are not found in any other investment vehicle and, we believe, make annuities attractive especially in times of economic uncertainty. In addition, growth on the underlying principal in certain annuities is granted tax-deferred treatment, thereby deferring the tax consequences of the growth in value until withdrawals are made from the accumulation values, often at lower tax rates occurring during retirement. Products In general, an annuity is a contract between an insurance company and an individual or group in which the insurance company, after receipt of one or more premium payments, agrees to pay an amount of money either in one lump sum or on a periodic basis (i.e., annually, semi-annually, quarterly or monthly), beginning on a certain date and continuing for a period of time as specified in the contract or as requested. Periodic payments can begin within 12 months after the premium is received (referred to as an immediate annuity) or at a future date in time (referred to as a deferred annuity). This retirement vehicle helps protect an individual from outliving his or her money. Variable Annuities A variable annuity provides the contract holder the ability to direct the investment of premium deposits into one or more variable sub-accounts (“variable funds”) offered through the product (“variable portion”) and, for a specified period, into a fixed account with a guaranteed return (“fixed portion”). The value of the variable portion of the contract holder’s account varies with the performance of the underlying variable funds chosen by the contract holder. Our variable funds include the Managed Risk Strategies fund options, a series of funds that embed volatility risk management and, with some funds, capital protection strategies, inside the funds themselves. These funds seek to reduce equity market volatility risk for both the contract holder and us. As of December 31, 2016 and 2015, the Managed Risk Strategies funds totaled $34.9 billion and $32.2 billion, or 33% and 31% of total variable annuity account values, respectively. We charge mortality and expense assessments and administrative fees on variable annuity accounts to cover insurance and administrative expenses. These assessments are built into accumulation unit values, which when multiplied by the number of units owned for any variable fund equals the contract holder’s account value for that variable fund. In addition, for some contracts, we impose surrender charges, which are typically applicable during the early years of the annuity contract, with a declining level of surrender charges over time. We offer guaranteed benefit riders with certain of our variable annuity products, such as a guaranteed death benefit (“GDB”), a guaranteed withdrawal benefit (“GWB”), a guaranteed income benefit (“GIB”) and a combination of such benefits. The GDB features offered in 2016 included those where we contractually guarantee to the contract holder that upon death, depending on the particular product, we will return no less than: the current contract value; the total deposits made to the contract, adjusted to reflect any partial withdrawals; the highest contract value on a specified anniversary date adjusted to reflect any partial withdrawals following the contract anniversary; or the current contract value plus a specified percentage of contract earnings, not to exceed a covered earnings limit. In 2016, we offered product riders including the Lincoln Lifetime IncomeSM Advantage 2.0 (Managed Risk) and Lincoln Market SelectSM Advantage riders, which are hybrid benefit riders combining aspects of GWB and GIB. These benefit riders allow the contract holder the ability to take income at a maximum rate of up to 5% of the guaranteed amount when they are above the lifetime income age or income through i4LIFE® Advantage with the GIB. Lincoln Lifetime Income Advantage 2.0 (Managed Risk) and Lincoln Market Select Advantage riders provide higher income if the contract holder delays withdrawals. Lincoln Lifetime Income Advantage 2.0 (Managed Risks) includes both a 5% enhancement to the guaranteed amount each year a withdrawal is not taken for a specified period of time and an annual step-up of the guaranteed amount to the current contract value, while Lincoln Market Select Advantage only offers an annual step-up of the guaranteed amount to the current contract value. Contract holders under Lincoln Lifetime Income Advantage 2.0 (Managed Risk) are subject to the allocation of their account value to our Managed Risk Strategies fund options and certain fixed-income options. Contract holders under Lincoln Market Select Advantage are subject to restrictions on the allocation of their account value within the various investment choices.
3
We also offered the i4LIFE® Advantage, i4LIFE® Advantage Guaranteed Income Benefit (Managed Risk) and i4LIFE® Advantage Guaranteed Income Benefit riders. These riders, which are covered by U.S. patents, allow variable annuity contract holders access and control during a portion of the income distribution phase of their contract. This added flexibility allows the contract holder to access the account value for transfers, additional withdrawals and other service features like portfolio rebalancing. In general, GIB is an optional feature available with i4LIFE Advantage and a non-optional feature on i4LIFE Advantage Guaranteed Income Benefit (Managed Risk) and i4LIFE Advantage Guaranteed Income Benefit that guarantees regular income payments will not fall below the greater of a minimum income floor set at benefit issue and 75% of the highest income payment on a specified anniversary date (reduced for any subsequent withdrawals). Contract holders under i4LIFE Advantage Guaranteed Income Benefit (Managed Risk) are subject to the allocation of their account value to our Managed Risk Strategies fund options and certain fixed-income options. Contract holders under i4LIFE Advantage Guaranteed Income Benefit are subject to restrictions on the allocation of their account value within the various investment choices. We also offered the 4LATER® Advantage (Managed Risk) rider. This rider provides a minimum income base used to determine the GIB floor when a client begins income payments under i4LIFE Advantage Guaranteed Income Benefit (Managed Risk). 4LATER Advantage (Managed Risk) rider provides growth during the accumulation phase through both a 5% enhancement to the income base each year a withdrawal is not taken for a specified period of time and an annual step-up of the income base to the current contract value. Contract holders under the 4LATER Advantage (Managed Risk) rider are subject to the allocation of their account value to our Managed Risk Strategies fund options and certain fixed-income options. We design and actively manage the features and structure of our guaranteed benefit riders to maintain a competitive suite of products consistent with profitability and risk management goals. To mitigate the increased risks associated with guaranteed benefits, we developed a dynamic hedging program. The customized dynamic hedging program uses equity, interest rate and currency futures positions, interest rate and total return swaps and equity-based options depending upon the risks underlying the guarantees. For more information on our hedging program, see “Critical Accounting Policies and Estimates – Derivatives” and “Realized Gain (Loss) and Benefit Ratio Unlocking” in the MD&A. For information regarding risks related to guaranteed benefits, see “Item 1A. Risk Factors – Market Conditions – Changes in the equity markets, interest rates and/or volatility affect the profitability of our products with guaranteed benefits; therefore, such changes may have a material adverse effect on our business and profitability.” Although we do not have any significant concentration of customers, our American Legacy Variable Annuity (“ALVA”) product is significant to this segment. The ALVA product accounted for 21%, 18% and 20% of our variable annuity product deposits in 2016, 2015 and 2014, respectively, and represented 41%, 42% and 44% of the segment’s total variable annuity product account values as of December 31, 2016, 2015 and 2014, respectively. In addition, fund choices for certain of our other variable annuity products offered include American Fund Insurance SeriesSM (“AFIS”) funds. AFIS funds accounted for 23%, 20% and 22% of variable annuity product deposits in 2016, 2015 and 2014, respectively, and represented 47%, 48% and 50% of the segment’s total variable annuity product account values as of December 31, 2016, 2015 and 2014, respectively. Fixed Annuities A fixed annuity preserves the principal value of the contract while guaranteeing a minimum interest rate to be credited to the accumulation value. Our fixed annuity product offerings as of December 31, 2016, consisted of traditional fixed-rate and fixed indexed deferred annuities, as well as fixed-rate immediate and deferred income annuities with various payment options, including lifetime incomes. Fixed annuity contracts are general account obligations. We bear the investment risk for fixed annuity contracts. To protect from premature withdrawals, we impose surrender charges. Surrender charges are typically applicable during the early years of the annuity contract, with a declining level of surrender charges over time. We expect to earn a spread between what we earn on the underlying general account investments supporting the fixed annuity product line and what we credit to our fixed annuity contract holders’ accounts. We offer single and flexible premium fixed deferred annuities. Single premium fixed deferred annuities are contracts that allow only a single premium to be paid. Flexible premium fixed deferred annuities are contracts that allow multiple premium payments on either a scheduled or non-scheduled basis. Our fixed indexed annuities allow the contract holder to choose between a fixed interest crediting rate and an indexed interest crediting rate, which is based on the performance of the Standard & Poor’s (“S&P”) 500 Index® (“S&P 500”) or the S&P 500 Daily Risk Control 5%TM Index. The indexed interest credit is guaranteed never to be less than zero. Available with certain of our fixed indexed annuities, Lincoln Lifetime IncomeSM Edge provides the contract holder a guaranteed lifetime withdrawal benefit. We use derivatives to hedge the equity market risk associated with our fixed indexed annuity products. For more information on our hedging program, see “Critical Accounting Policies and Estimates – Derivatives” and “Realized Gain (Loss) and Benefit Ratio Unlocking” in the MD&A. Distribution The Annuities segment distributes its individual fixed and variable annuity products through LFD. LFD’s distribution channels give the Annuities segment access to its target markets. LFD distributes the segment’s products to a large number of financial intermediaries, including LFN. The financial intermediaries include wire/regional firms, independent financial planners, financial institutions and managing general agents.
4
Competition The annuities market is very competitive and consists of many companies, with no one company dominating the market for all products. The Annuities segment competes with numerous other financial services companies. The main factors upon which entities in this market compete are distribution channel access and the quality of wholesalers, investment performance, cost, product features, speed to market, brand recognition, financial strength ratings, crediting rates and client service.
RETIREMENT PLAN SERVICES Overview The Retirement Plan Services segment provides employers with retirement plan products and services, primarily in the defined contribution retirement plan marketplace. While our focus is employer-sponsored defined contribution plans, we also serve the defined benefit plan and individual retirement account (“IRA”) markets. We provide a variety of plan investment vehicles, including individual and group variable annuities, group fixed annuities and mutual fund-based programs. We also offer a broad array of plan services including plan recordkeeping, compliance testing, participant education and trust and custodial services through our affiliated trust company, the Lincoln Financial Group Trust Company. Defined contribution plans are a popular employee benefit offered by many employers across a wide spectrum of industries and by employers large and small. Retirement Plan Services primarily focuses on the mid to large market, which accounted for 55% of this segment’s total assets under management as of December 31, 2016. In addition, Retirement Plan Services focuses on the small market 401(k) business, which accounted for 17% of this segment’s total assets under management as of December 31, 2016. Products and Services The Retirement Plan Services segment currently brings three primary offerings to the employer-sponsored market: LINCOLN DIRECTORSM group variable annuity, LINCOLN ALLIANCE® program and Multi-Fund® variable annuity. In 2014, we introduced the Lincoln Secured Retirement IncomeSM, a GWB product available through a group variable annuity contract. Retirement Plan Services also provides a series of IRA products, including the Lincoln Next Step® and the Lincoln Next Step Select® IRA. LINCOLN DIRECTOR and Multi-Fund products are variable annuities. The LINCOLN ALLIANCE program is a mutual fund-based record-keeping platform. These offerings primarily cover the 403(b), 401(k) and 457 plan marketplace. The 403(b) plans are available to employees of educational institutions, not-for-profit healthcare organizations and certain other not-for-profit entities; 401(k) plans are generally available to employees of for-profit entities; and 457 plans are available to employees of not-for-profit entities and state and local government entities. The investment options for our annuities encompass the spectrum of asset classes with varying levels of risk and include both equity and fixed-income. LINCOLN DIRECTOR group variable annuity is a 401(k) defined contribution retirement plan solution available to small businesses, typically those with plans having less than $10 million in account values. The LINCOLN DIRECTOR product offers participants a broad array of investment options from several fund families and a fixed account. In 2016, several enhancements were introduced to the DIRECTOR product offering including more fund choices, enriched services and additional pricing options. The Retirement Plan Services segment earns revenue through asset charges or separate account charges to collect recordkeeping fees from this product. We also receive fees from the underlying mutual fund companies for the services we provide, and we earn investment margins on assets in the fixed account. The LINCOLN ALLIANCE program is a defined contribution retirement plan solution aimed at mid to large employers, typically those that have defined contribution plans with $10 million or more in account value. The target market is primarily healthcare providers, public sector employers, corporations and educational institutions. The program bundles our traditional fixed annuity products with the employer’s choice of mutual funds, along with recordkeeping, plan compliance services and customized employee education services. The program allows the use of any mutual fund. We earn fees for our recordkeeping and educational services and other services that we provide to plan sponsors and participants. We also earn investment margins on fixed annuities. The Lincoln Secured Retirement IncomeSM product is a guaranteed minimum withdrawal benefit (“GMWB”) available through group variable annuity contracts. This product is intended to fulfill future needs of retirement security. By offering a GMWB in-plan, we provide to plan sponsors and participants the ability to participate in market gains, protect their income and receive guaranteed income for life while still enabling access to their retirement asset market value. Multi-Fund Variable Annuity is a defined contribution retirement plan solution with full-bundled administrative services and investment choices for small- to mid-sized healthcare, education, governmental and not-for-profit employers sponsoring 403(b) plans. The product is available to the employer through the Multi-Fund group variable annuity contract or directly to the individual through the Multi-Fund Select variable annuity contract. We earn mortality and expense charges, investment income on the fixed account and surrender charges from this product. We also receive fees for services that we provide to funds in the underlying separate accounts. In addition, the Lincoln Next Step® series of products is a suite of mutual fund-based IRAs available exclusively for participants in Lincoln-serviced retirement plans and their spouses. The products can accept rollovers and transfers from other providers as well as
5
ongoing contributions. The Lincoln Next Step® IRA product has no annual account charges and offers an array of mutual fund investment options provided by 20 fund families all offered at net asset value. The Lincoln Next Step Select® IRA has an annual record keeping charge and offers an even wider array of mutual fund investment options from 20 families, all at net asset value. We earn 12b-1 and service fees on the mutual funds within the product. Distribution Retirement Plan Services products are primarily distributed in two ways: through our Institutional Retirement Distribution team and by LFD. Wholesalers distribute these products through advisors, consultants, banks, wirehouses, TPAs and individual planners. We expanded the distribution of the segment’s products as of the end of 2016 to 83 by growing the number of wholesalers and by other means, including continuing to increase relationship management expertise and growing the number of broker-dealer relationships. The Multi-Fund® program is sold primarily by affiliated advisors. The LINCOLN ALLIANCE® program is sold primarily through consultants, registered independent advisors, and both affiliated and non-affiliated financial advisors, planners and wirehouses. LINCOLN DIRECTORSM group variable annuity is sold in the small marketplace by intermediaries, including financial advisors, TPAs, planners and wirehouses. Competition The retirement plan marketplace is very competitive and is comprised of many providers with no one company dominating the market for all products. As stated above, we compete in the small, mid and large markets. We compete with numerous other financial services companies. The main factors upon which entities in this market compete are distribution channel access and the quality of wholesalers, investment performance, cost, product features, speed to market, brand recognition, financial strength ratings, crediting rates, client service and client compliance and fiduciary services.
LIFE INSURANCE Overview The Life Insurance segment focuses on the creation and protection of wealth for its clients by providing life insurance products, including term insurance, both single (including COLI and BOLI) and survivorship versions of universal life insurance (“UL”), variable universal life insurance (“VUL”) and indexed universal life insurance (“IUL”) products, a linked-benefit product (which is UL with riders providing for long-term care costs) and a critical illness rider, which can be attached to UL, VUL or IUL policies. Some of our products include secondary guarantees, which are discussed more fully below. Generally, this segment has higher sales during the second half of the year with the fourth quarter being the strongest. Mortality margins, morbidity margins, investment margins, expense margins and surrender fees drive life insurance profits. Similar to the annuity product classifications described above, life products can be classified as “fixed” (including indexed) or “variable” contracts. This classification describes whether we or the contract holders bear the investment risk of the assets supporting the policy. This also determines the manner in which we earn investment margin profits from these products, either as investment spreads for fixed products or as asset-based fees charged to variable products. Products We offer four categories of life insurance products consisting of: UL UL insurance products provide life insurance with account values that earn rates of return based on company-declared interest rates. Contract holder account values are invested in our general account investment portfolio, so we bear the risk of investment performance. We offer a variety of UL products, such as Lincoln LifeGuarantee® UL, Lincoln LifeCurrent® UL and Lincoln LifeReserve® UL. In a UL contract, contract holders typically have flexibility in the timing and amount of premium payments and the amount of death benefit, provided there is sufficient account value to cover all policy charges for cost of insurance and expenses for the coming period. Under certain contract holder options and market conditions, the death benefit amount may increase or decrease. Premiums received on a UL product, net of expense loads and charges, are added to the contract holder’s account value and accrued with interest. The client has access to their account value (or a portion thereof), less surrender charges and policy loan payoffs, through contractual liquidity features such as loans, partial withdrawals and full surrenders. Loans and withdrawals reduce the death benefit amount payable and are limited to certain contractual maximums (some of which are required under state law), and interest is charged on all loans. Our UL contracts assess surrender charges against the policies’ account values for full or partial surrenders and certain policy changes that occur during the contractual surrender charge period. Depending on the product selected, surrender charge periods can range from 0 to 25 years.
6
We also offer fixed IUL products that function similarly to a traditional UL policy, with the added flexibility of allowing contract holders to have portions of their account values earn credits based on the performance of indexes such as the S&P 500. These products include Lincoln WealthAdvantage® IUL and Lincoln LifeReserve® IUL Accumulator. As mentioned previously, we offer survivorship versions of our individual UL and IUL products. These products insure two lives with a single policy and pay death benefits upon the second death. These products include Lincoln LifeGuarantee® SUL and Lincoln WealthPreserve® Survivorship IUL. A UL policy with a secondary guarantee can stay in force, even if the base policy cash value is zero, as long as secondary guarantee requirements have been met. These products include Lincoln LifeGuarantee® UL and Lincoln LifeGuarantee® SUL. The secondary guarantee requirement is based on the payment of a required minimum premium or on the evaluation of a reference value within the policy, calculated in a manner similar to the base policy account value, but using different expense charges, cost of insurance charges and credited interest rates. The parameters for the secondary guarantee requirement are listed in the contract. As long as the contract holder pays the minimum premium or funds the policy to a level that keeps this calculated reference value positive, the policy is guaranteed to stay in force. The reference value has no actual monetary value to the contract holder; it is only a calculated value used to determine whether or not the policy will lapse should the base policy cash value be less than zero. Our secondary guarantee benefits maintain the flexibility of a traditional UL policy, which allows a contract holder to take loans or withdrawals. Although loans and withdrawals are likely to shorten the time period of the secondary guarantee, the guarantee is not automatically or completely forfeited. The length of the guarantee may be increased at any time through additional excess premium deposits. Reserves on UL products with secondary guarantees represented approximately 30% of total life reserves for the years ended December 31, 2016 and 2015, respectively. VUL VUL products are UL products that provide a return on account values linked to an underlying investment portfolio of variable funds offered through the product. The value of the variable portion of the contract holder’s account is driven by the performance of the underlying variable funds chosen by the contract holder. As the return on the investment portfolio increases or decreases, the account value of the VUL policy will increase or decrease. In addition, VUL products offer a fixed account option that is managed by us. As with fixed UL products, contract holders have access, within contractual maximums, to account values through loans, withdrawals and surrenders. Surrender charges are assessed during the surrender charge period, ranging from 0 to 20 years depending on the product. Our single life VUL products include Lincoln AssetEdge® VUL and Lincoln VULONE. Our COLI products are also VUL-type products. We also offer survivorship versions of our individual VUL products, Lincoln SVULONE and Lincoln Preservation Edge® SVUL. These products insure two lives with a single policy and pay death benefits upon the second death. We offer guaranteed benefit riders with certain of our VUL products, Lincoln VULONE and Lincoln SVULONE. The ONE rider features offered in 2016 contractually guarantee to the contract holder that upon death, as long as secondary guarantee requirements have been met, the death benefit will be payable even if the account value equals zero. Linked-Benefit Life Products and Products with Critical Illness Riders Our linked-benefit life product, Lincoln MoneyGuard®, combines UL with long-term care insurance through the use of riders. One type of rider allows the contract holder to accelerate death benefits on a tax-free basis in the event of a qualified long-term care need, reducing the remaining death benefit. Another rider extends the long-term care insurance benefits for an additional limited period of time if the death benefit is fully accelerated. Certain policies also provide a reduced death benefit to the contract holder’s beneficiary if the death benefit has been fully accelerated as long-term care benefits during the contract holder’s life. Some life products provide for critical illness insurance by the use of riders attached to UL, VUL or IUL policies. These riders allow the contract holder to accelerate death benefits on a tax-free basis in the event of a qualified critical illness condition. Term Life Insurance Term life insurance provides a fixed death benefit for a scheduled period of time. Some of our term life insurance products give the policyholder the option to reduce the death benefit at a future time. They usually do not offer cash values. Scheduled policy premiums are required to be paid at least annually. These products include Lincoln TermAccel® Level Term and Lincoln LifeElements® Level Term. Distribution The Life Insurance segment’s products are sold through LFD. LFD provides the Life Insurance segment with access to financial intermediaries in the following primary distribution channels: wire/regional firms; independent planner firms (including LFN); financial institutions; and managing general agents/independent marketing organizations. LFD distributes COLI products and services to small- to mid-sized banks and mid- to large-sized corporations, primarily through intermediaries who specialize in one or both of these markets and who are serviced through a network of internal and external LFD sales professionals.
7
Competition The life insurance industry is very competitive and consists of many companies with no one company dominating the market for all products. According to the American Council of Life Insurers (November 2016), the U.S. life insurance industry is made up of over 800 companies with sales and operations across the country. The Life Insurance segment primarily targets the affluent to high net worth markets, defined as households with at least $1 million of financial assets. For those individual policies we sold in 2016, the average face amount (excluding MoneyGuard® products) was approximately $1 million and average first year premiums paid were approximately $24,000. The Life Insurance segment competes primarily on product design, underwriting and issue process and customer service. In 2016, the Life Insurance segment introduced LincXpress® that allows for streamlined underwriting and new business capabilities. With respect to customer service, management tracks the speed, accuracy and responsiveness of service to customers’ calls and transaction requests. Further, management tracks the turnaround time and quality for various client services such as processing of applications. Additional competitive factors relevant to the Life Insurance segment include product breadth, speed to market, underwriting and risk management, financial strength ratings and extent of distribution network. Underwriting In the context of life insurance, underwriting is the process of evaluating medical and non-medical information about an individual and determining the effect these factors statistically have on mortality. This process of evaluation is often referred to as risk classification. Of course, no one can accurately predict how long any individual will live, but certain risk factors can affect life expectancy and are evaluated during the underwriting process. Claims Administration Claims service is handled primarily in-house, and claims examiners are assigned to each claim notification based on coverage amount, type of claim and the experience of the examiner. Claims meeting certain criteria are referred to senior claims examiners. A formal quality assurance program is carried out to ensure the consistency and effectiveness of claims examining activities. A network of in-house legal counsel, compliance officers, medical personnel and an anti-fraud investigative unit also support claims examiners. A special team of claims examiners, in conjunction with claims management, focus on more complex claims matters such as claims incurred during the contestable period, beneficiary disputes and litigated claims.
GROUP PROTECTION
Overview The Group Protection segment offers group non-medical insurance products, including term life, disability, dental, vision and accident and critical illness benefits and services to the employer marketplace through various forms of employee-paid and employer-paid plans. Although we sell to employer groups of all sizes, our target market is to employers with at least 100 employees and fewer than 5,000 employees. Products Life Insurance We offer employer-sponsored group term life insurance products including basic, optional and voluntary term life insurance to employees and their dependents. Additional benefits may be provided in the event of a covered individual’s accidental death or dismemberment. Disability Insurance We offer short- and long-term employer-sponsored group disability insurance, which protects an employee against loss of wages due to illness or injury. Short-term disability generally provides benefits for up to 26 weeks following a short waiting period, ranging from 1 to 30 days. Long-term disability provides benefits following a longer waiting period, usually between 90 and 180 days and provides benefits for a longer period, at least 2 years and typically extending to normal (Social Security) retirement age. The monthly benefits provided are subject to reduction when Social Security benefits are also paid. Absence Management We offer to manage employers’ family medical and company leave in conjunction with our disability coverage. The service provides a simple, compliant way to report and manage both leave and disability through a single source with integrated intake, claims management, communications and reporting, along with state of the art self-service capabilities via a mobile application and web portal.
8
Dental and Vision We offer a variety of employer-sponsored group dental insurance plans, which cover a portion of the cost of eligible dental procedures for employees and their dependents. Products offered include indemnity coverage, which does not distinguish benefits based on a dental provider’s participation in a network arrangement, a Preferred Provider Organization (“PPO”) product that does reflect the dental provider’s participation in the PPO network arrangement, including an agreement with network fee schedules, and a Dental Health Maintenance Organization product that limits benefit coverage to a closed panel of network providers. We offer comprehensive employer-sponsored fully-insured vision plans with a wide range of benefits for protecting employees’ and their covered dependents’ sight and vision health. All plans provide access to a national network of providers, with in and out-of-network benefits. Accident and Critical Illness Insurance We offer employer-sponsored group accident insurance products for employees and their covered dependents. This product is predominantly purchased on an employee-paid basis. Accident insurance provides scheduled benefits for over 30 types of benefit triggers related to accidental causes, and it is available for non-occupational accidents exclusively or on a 24-hour coverage basis. We offer employer-sponsored group critical illness insurance to employees and their covered dependents. This product is predominantly purchased on an employee-paid basis. The coverage provides for lump sum payouts upon the occurrence of one of the specified critical illness benefit triggers covered within a critical illness insurance policy. This product also includes Lincoln CareCompass®, a package of benefits and services that assists employees and their family members in prevention, early detection and treatment of critical illness events. Distribution The segment’s products are marketed primarily through a national distribution system, including approximately 170 managers and marketing representatives. The managers and marketing representatives develop business through employee benefit brokers, consultants, TPAs and other employee benefit firms that work with employers to provide access to our products. Competition The group protection marketplace is very competitive. Principal competitive factors include particular product features, price, quality of customer service and claims management, technological capabilities, quality and efficiency of distribution and financial strength ratings. In this market, the Group Protection segment competes with a number of major companies and regionally with other companies offering all or some of the products within our product set. In addition, there is competition in attracting brokers to actively market our products and attracting and retaining sales representatives to sell our products. Key competitive factors in attracting brokers and sales representatives include product offerings and features, financial strength, support services and compensation. Underwriting The Group Protection segment’s underwriters evaluate the risk characteristics of each employer group. Generally, the relevant characteristics evaluated include employee census information (such as age, gender, income and occupation), employer industry classification, geographic location, benefit design elements and other factors. The segment employs detailed underwriting policies, guidelines and procedures designed to assist the underwriter to properly assess and quantify risks. The segment uses technology to efficiently review, price and issue smaller cases, utilizing its underwriting staff on larger, more complex cases. Individual underwriting techniques (including evaluation of individual medical history information) may be used on certain covered individuals selecting larger benefit amounts. For voluntary and other forms of employee paid coverages, minimum participation requirements are used to obtain a better spread of risk and minimize the risk of anti-selection. Claims Administration Claims for the Group Protection segment are managed by in-house claim specialists and outsourced third-party resources. Claims are evaluated for eligibility and payment of benefits pursuant to the group insurance contract and in compliance with federal and state regulations. Disability claims management is especially important to segment results, as results depend on both the incidence and the length of approved disability claims. The segment employs a variety of clinical experts, including internal and external medical professionals and rehabilitation specialists, to evaluate medically supported functional capabilities, assess employability and develop return to work plans. The accuracy and speed of life claims are important customer service and risk management factors. Some life policies provide for the waiver of premium coverage in the event of the insured’s disability where our disability claims management expertise is utilized. Dental claims management focuses on assisting plan administrators and members with the rising costs of insurance by utilizing tools to optimize dental claims payment accuracy through advanced claims review and validation, improved data analysis, enhanced clinical review of claims and provider utilization monitoring.

9
OTHER OPERATIONS Other Operations includes the financial data for operations that are not directly related to the business segments. Other Operations includes investments related to the excess capital in our insurance subsidiaries; corporate investments; benefit plan net liability; the unamortized deferred gain on indemnity reinsurance related to the sale to Swiss Re Life & Health America, Inc. (“Swiss Re”) in 2001; the results of certain disability income business; our run-off Institutional Pension business in the form of group annuity and insured funding-type of contracts; debt; and strategic digitization expense. Other Operations also included our investment in media properties that were sold in July 2015, as described above. For more information on our strategic digitization initiative, see “Item 7. Management’s Discussion and Analysis of Financial Condition and Results of Operations – Introduction – Executive Summary – Significant Operational Matters.”
REINSURANCE Our reinsurance strategy is designed to protect our insurance subsidiaries against the severity of losses on individual claims and unusually serious occurrences in which a number of claims produce an aggregate extraordinary loss. Although reinsurance does not discharge the insurance subsidiaries from their primary liabilities to their contract holders for losses insured under the insurance policies, it does make the assuming reinsurer liable to the insurance subsidiaries for the reinsured portion of the risk. Because we bear the risk of nonpayment by one or more of our reinsurers, we primarily cede reinsurance to well-capitalized, highly rated unaffiliated reinsurers. We also utilize inter-company reinsurance agreements to manage our statutory capital position as well as our hedge program for variable annuity guarantees. These inter-company agreements do not have an effect on our consolidated financial statements. As of December 31, 2016, the policy for our reinsurance program was to retain up to $20 million on a single insured life. As the amount we retain varies by policy, we reinsured approximately 25% of the mortality risk on newly issued life insurance contracts in 2016. As of December 31, 2016, approximately 41% of our total individual life in-force amount is reinsured. Portions of our deferred annuity business have been reinsured on a modified coinsurance (“Modco”) basis with other companies to limit our exposure associated with fixed and variable annuities. In a Modco program, we as the ceding company retain the reserves, as well as the assets backing those reserves, and the reinsurer shares proportionally in all financial terms of the reinsured policies (i.e., premiums, expenses, claims, etc.) based on their respective percentage of the risk. In addition, we acquire other reinsurance to cover products other than as discussed above with retentions and limits that management believes are appropriate for the circumstances. For example, we use reinsurance to cover larger life and disability claims in our Group Protection business. We obtain reinsurance from a diverse group of reinsurers, and we monitor concentration and financial strength ratings of our principal reinsurers. Swiss Re represents our largest reinsurance exposure. The amounts recoverable from reinsurers were $5.3 billion and $5.6 billion as of December 31, 2016 and 2015, respectively, of which $2.1 billion and $2.4 billion were recoverable from Swiss Re related to the sale of our reinsurance business to Swiss Re for the respective periods. For more information regarding reinsurance, see “Reinsurance” in the MD&A and Note 9. For risks involving reinsurance, see “Item 1A. Risk Factors – Operational Matters – We face risks of non-collectability of reinsurance and increased reinsurance rates, which could materially affect our results of operations.”
RESERVES
The applicable insurance laws under which insurance companies operate require that they report, as liabilities, policy reserves to meet future obligations on their outstanding policies. These reserves are the amounts that, with the additional premiums to be received and interest thereon compounded annually at certain assumed rates, are calculated to be sufficient to meet the various policy and contract obligations as they mature. These laws specify that the reserves shall not be less than reserves calculated using certain specified mortality and morbidity tables, interest rates and methods of valuation. For more information on reserves, see “Critical Accounting Policies and Estimates – Derivatives” and “Critical Accounting Policies and Estimates – Future Contract Benefits and Other Contract Holder Obligations” in the MD&A. See “Regulatory” below for information on permitted practices and proposed regulations that may impact the amount of statutory reserves necessary to support our current insurance liabilities. For risks related to reserves, see “Item 1A. Risk Factors – Market Conditions – Changes in interest rates and sustained low interest rates may cause interest rate spreads to decrease and changes in interest rates may also result in increased contract withdrawals” and “Item 1A. Risk Factors – Legislative, Regulatory and Tax – Attempts to mitigate the impact of Regulation XXX and Actuarial Guideline 38 may fail in whole or in part resulting in an adverse effect on our financial condition and results of operations.”
INVESTMENTS
An important component of our financial results is the return on invested assets. Our investment strategy is to balance the need for current income with prudent risk management, with an emphasis on generating sufficient current income to meet our obligations. This
10
approach requires the evaluation of risk and expected return of each asset class utilized, while still meeting our income objectives. This approach also permits us to be more effective in our asset-liability management because decisions can be made based upon both the economic and current investment income considerations affecting assets and liabilities. Investments by our insurance subsidiaries must comply with the insurance laws and regulations of the states of domicile. Derivatives are used primarily for hedging purposes and, to a lesser extent, income generation. Hedging strategies are employed for a number of reasons including, but not limited to, hedging certain portions of our exposure to changes in our GDB, GWB and GIB liabilities, interest rate fluctuations, the widening of bond yield spreads over comparable maturity U.S. government obligations and credit, foreign exchange and equity risks. Income generation strategies include credit default swaps through replication synthetic asset transactions. These derivatives synthetically create exposure in the general account to corporate debt, similar to investing in the credit markets. For additional information on our investments, including carrying values by category, quality ratings and net investment income, see “Consolidated Investments” in the MD&A, as well as Notes 1 and 5.
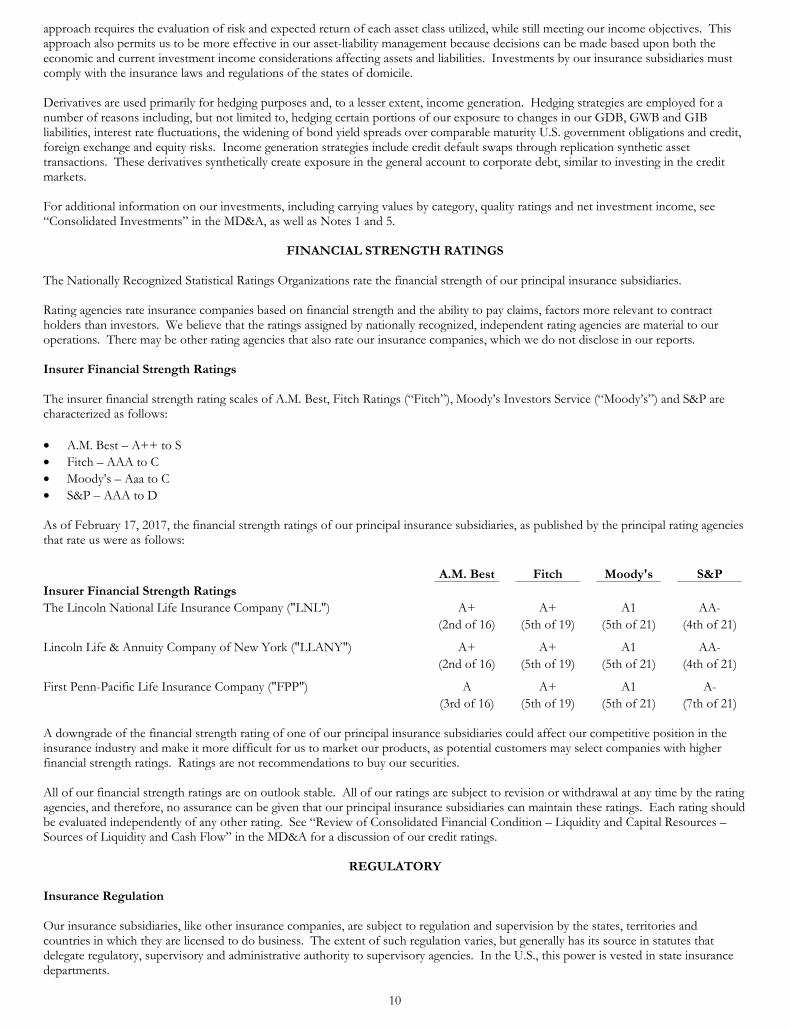
FINANCIAL STRENGTH RATINGS The Nationally Recognized Statistical Ratings Organizations rate the financial strength of our principal insurance subsidiaries. Rating agencies rate insurance companies based on financial strength and the ability to pay claims, factors more relevant to contract holders than investors. We believe that the ratings assigned by nationally recognized, independent rating agencies are material to our operations. There may be other rating agencies that also rate our insurance companies, which we do not disclose in our reports. Insurer Financial Strength Ratings The insurer financial strength rating scales of A.M. Best, Fitch Ratings (“Fitch”), Moody’s Investors Service (“Moody’s”) and S&P are characterized as follows: • A.M. Best – A++ to S • Fitch – AAA to C • Moody’s – Aaa to C • S&P – AAA to D As of February 17, 2017, the financial strength ratings of our principal insurance subsidiaries, as published by the principal rating agencies that rate us were as follows:
A.M. Best Fitch Moody's S&P Insurer Financial Strength Ratings The Lincoln National Life Insurance Company ("LNL") A+ A+ A1 AA- (2nd of 16) (5th of 19) (5th of 21) (4th of 21)
Lincoln Life & Annuity Company of New York ("LLANY") A+ A+ A1 AA- (2nd of 16) (5th of 19) (5th of 21) (4th of 21)
First Penn-Pacific Life Insurance Company ("FPP") A A+ A1 A- (3rd of 16) (5th of 19) (5th of 21) (7th of 21) A downgrade of the financial strength rating of one of our principal insurance subsidiaries could affect our competitive position in the insurance industry and make it more difficult for us to market our products, as potential customers may select companies with higher financial strength ratings. Ratings are not recommendations to buy our securities. All of our financial strength ratings are on outlook stable. All of our ratings are subject to revision or withdrawal at any time by the rating agencies, and therefore, no assurance can be given that our principal insurance subsidiaries can maintain these ratings. Each rating should be evaluated independently of any other rating. See “Review of Consolidated Financial Condition – Liquidity and Capital Resources – Sources of Liquidity and Cash Flow” in the MD&A for a discussion of our credit ratings.
REGULATORY
Insurance Regulation Our insurance subsidiaries, like other insurance companies, are subject to regulation and supervision by the states, territories and countries in which they are licensed to do business. The extent of such regulation varies, but generally has its source in statutes that delegate regulatory, supervisory and administrative authority to supervisory agencies. In the U.S., this power is vested in state insurance departments.
11
In supervising and regulating insurance companies, state insurance departments, charged primarily with protecting contract holders and the public rather than investors, enjoy broad authority and discretion in applying applicable insurance laws and regulation for that purpose. Our principal insurance subsidiaries, LNL, LLANY and FPP, are domiciled in the states of Indiana, New York and Indiana, respectively. The insurance departments of the domiciliary states exercise principal regulatory jurisdiction over our insurance subsidiaries. The extent of regulation by the states varies, but in general, most jurisdictions have laws and regulations governing standards of solvency, adequacy of reserves, reinsurance, capital adequacy, licensing of companies and agents to transact business, prescribing and approving policy forms, regulating premium rates for some lines of business, prescribing the form and content of financial statements and reports, regulating the type and amount of investments permitted and standards of business conduct. Insurance company regulation is discussed further under “Insurance Holding Company Regulation” and “Restrictions on Subsidiaries’ Dividends and Other Payments.” As part of their regulatory oversight process, state insurance departments conduct periodic, generally once every three to five years, examinations of the books, records, accounts and business practices of insurers domiciled in their states. Examinations are generally carried out in cooperation with the insurance regulators of other states under guidelines promulgated by the National Association of Insurance Commissioners (“NAIC”). State and federal insurance and securities regulatory authorities and other state law enforcement agencies and Attorneys General also, from time to time, make inquiries and conduct examinations or investigations regarding the compliance by our company, as well as other companies in our industry, with, among other things, insurance laws and securities laws. Our captive reinsurance and reinsurance subsidiaries are subject to periodic financial examinations by their respective domiciliary state insurance regulators. We have not received any material adverse findings resulting from state insurance department examinations of our insurance, reinsurance and captive reinsurance subsidiaries conducted during the three-year period ended December 31, 2016. State insurance laws and regulations require our U.S. insurance companies to file financial statements with state insurance departments everywhere they do business, and the operations of our U.S. insurance companies and accounts are subject to examination by those departments at any time. Our U.S. insurance companies prepare statutory financial statements in accordance with accounting practices and procedures prescribed or permitted by these departments. The NAIC has approved a series of statutory accounting principles that have been adopted, in some cases with minor modifications, by virtually all state insurance departments. Changes in these statutory accounting principles can significantly affect our capital and surplus. For more information, see “Item 1A. Risk Factors – Attempts to mitigate the impact of Regulation XXX and Actuarial Guideline 38 may fail in whole or in part resulting in an adverse effect on our financial condition and results of operations.” The NAIC’s adoption of the new Valuation Manual that defines a principles-based reserving framework for newly issued life insurance policies is effective January 1, 2017. Principles-based reserving will place a greater weight on our past experience and anticipated future experience as well as consider current economic conditions in calculating life insurance product reserves in accordance with statutory accounting principles. The framework may be phased in over three years and must be applied for all new life insurance policies issued January 1, 2020, and later. The new reserving approach will not affect reserves for policies in force prior to January 1, 2017. We plan to initially adopt the new framework in 2017 for primarily our newly issued term business and will phase in the framework prior to January 1, 2020, for all other newly issued life insurance products. We believe that these changes may reduce our future use of captive reinsurance and reinsurance subsidiaries for reserve financing transactions for our life insurance business. Additionally, the NAIC through its various committees, task forces and working groups has been evaluating the adequacy of existing NAIC model regulations with a focus on targeted improvements to the statutory reserving and accounting framework for variable annuities. For more information, see “Item 1A. Risk Factors – Changes in accounting standards issued by the Financial Accounting Standards Board or other standard-setting bodies may adversely affect our financial statements.” For more information on statutory reserving and our use of captive reinsurance structures, see “Review of Consolidated Financial Condition – Liquidity and Capital Resources – Sources of Liquidity and Cash Flow – Insurance Subsidiaries’ Statutory Capital and Surplus” in the MD&A. Insurance Holding Company Regulation LNC and its primary insurance subsidiaries are subject to regulation pursuant to the insurance holding company laws of the states of Indiana and New York. These insurance holding company laws generally require an insurance holding company and insurers that are members of such insurance holding company’s system to register with the insurance department authorities, to file with it certain reports disclosing information, including their capital structure, ownership, management, financial condition and certain inter-company transactions, including material transfers of assets and inter-company business agreements and to report material changes in that information. These laws also require that inter-company transactions be fair and reasonable and, under certain circumstances, prior approval of the insurance departments must be received before entering into an inter-company transaction. Further, these laws require that an insurer’s contract holders’ surplus following any dividends or distributions to shareholder affiliates is reasonable in relation to the insurer’s outstanding liabilities and adequate for its financial needs. In general, under state holding company regulations, no person may acquire, directly or indirectly, a controlling interest in our capital stock unless such person, corporation or other entity has obtained prior approval from the applicable insurance commissioner for such acquisition of control. Pursuant to such laws, in general, any person acquiring, controlling or holding the power to vote, directly or indirectly, 10% or more of the voting securities of an insurance company, is presumed to have “control” of such company. This presumption may be rebutted by a showing that control does not exist in fact. The insurance commissioner, however, may find that
12
“control” exists in circumstances in which a person owns or controls a smaller amount of voting securities. To obtain approval from the insurance commissioner of any acquisition of control of an insurance company, the proposed acquirer must file with the applicable commissioner an application containing information regarding: the identity and background of the acquirer and its affiliates; the nature, source and amount of funds to be used to carry out the acquisition; the financial statements of the acquirer and its affiliates; any potential plans for disposition of the securities or business of the insurer; the number and type of securities to be acquired; any contracts with respect to the securities to be acquired; any agreements with broker-dealers; and other matters. Other jurisdictions in which our insurance subsidiaries are licensed to transact business may have similar or additional requirements for prior approval of any acquisition of control of an insurance or reinsurance company licensed or authorized to transact business in those jurisdictions. Additional requirements in those jurisdictions may include re-licensing or subsequent approval for renewal of existing licenses upon an acquisition of control. As further described below, laws that govern the holding company structure also govern payment of dividends to us by our insurance subsidiaries. Restrictions on Subsidiaries’ Dividends and Other Payments We are a holding company that transacts substantially all of our business directly and indirectly through subsidiaries. Our primary assets are the stock of our operating subsidiaries. Our ability to meet our obligations on our outstanding debt and to pay dividends and our general and administrative expenses depends on the surplus and earnings of our subsidiaries and the ability of our subsidiaries to pay dividends or to advance or repay funds to us. Our insurance subsidiaries are subject to certain insurance department regulatory restrictions as to the transfer of funds and payment of dividends to the holding company. Under Indiana laws and regulations, our Indiana insurance subsidiaries, including our primary insurance subsidiary, LNL, may pay dividends to LNC without prior approval of the Indiana Insurance Commissioner (the “Commissioner”), only from unassigned surplus or must receive prior approval of the Commissioner to pay a dividend if such dividend, along with all other dividends paid within the preceding 12 consecutive months, would exceed the statutory limitation. The current statutory limitation is the lesser of 10% of the insurer’s contract holders’ surplus, as shown on its last annual statement on file with the Commissioner or the insurer’s statutory net gain from operations for the previous 12 months, but in no event to exceed statutory unassigned surplus. Indiana law gives the Commissioner broad discretion to disapprove requests for dividends in excess of these limits. LNL’s subsidiary, LLANY, a New York-domiciled insurance company, is bound by similar restrictions under New York law, with the applicable statutory limitation on dividends equal to the lesser of 10% of surplus to contract holders as of the immediately preceding calendar year or net gain from operations for the immediately preceding calendar year, not including realized capital gains. Indiana law also provides that following the payment of any dividend, the insurer’s contract holders’ surplus must be reasonable in relation to its outstanding liabilities and adequate for its financial needs, and permits the Commissioner to bring an action to rescind a dividend that violates these standards. In the event the Commissioner determines that the contract holders’ surplus of one subsidiary is inadequate, the Commissioner could use his or her broad discretionary authority to seek to require us to apply payments received from another subsidiary for the benefit of that insurance subsidiary. For information regarding dividends paid to us during 2016 from our insurance subsidiaries, see “Review of Consolidated Financial Condition – Liquidity and Capital Resources – Sources of Liquidity and Cash Flow” in the MD&A. Risk-Based Capital The NAIC has adopted risk-based capital (“RBC”) requirements for life insurance companies to evaluate the adequacy of statutory capital and surplus in relation to investment and insurance risks. The requirements provide a means of measuring the minimum amount of statutory surplus appropriate for an insurance company to support its overall business operations based on its size and risk profile. There are five major risks involved in determining the requirements:
Category Name Description Asset risk – affiliates C-0 Risk of assets' default for certain affiliated investments Asset risk – others C-1 Risk of assets' default of principal and interest or fluctuation in fair value Insurance risk C-2 Risk of underestimating liabilities from business already written or inadequately pricing business to be written in the future Interest rate risk, health credit C-3 Risk of losses due to changes in interest rate levels, risk that health benefits prepaid to
risk and market risk providers become the obligation of the health insurer once again and risk of loss due to changes in market levels associated with variable products with guarantees
Business risk C-4 Risk of general business A company’s risk-based statutory surplus is calculated by applying factors and performing calculations relating to various asset, premium, claim, expense and reserve items. Regulators can then measure adequacy of a company’s statutory surplus by comparing it to the RBC determined by the formula. Under RBC requirements, regulatory compliance is determined by the ratio of a company’s total adjusted capital, as defined by the NAIC, to its company action level of RBC (known as the RBC ratio), also as defined by the NAIC. Accordingly, factors that have an impact on the total adjusted capital of our insurance subsidiaries, such as the permitted practices discussed above, will also affect their RBC levels.
13
Four levels of regulatory attention may be triggered if the RBC ratio is insufficient: • “Company action level” – If the RBC ratio is between 75% and 100%, then the insurer must submit a plan to the regulator detailing
corrective action it proposes to undertake; • “Regulatory action level” – If the RBC ratio is between 50% and 75%, then the insurer must submit a plan, but a regulator may also
issue a corrective order requiring the insurer to comply within a specified period; • “Authorized control level” – If the RBC ratio is between 35% and 50%, then the regulatory response is the same as at the
“Regulatory action level,” but in addition, the regulator may take action to rehabilitate or liquidate the insurer; and • “Mandatory control level” – If the RBC ratio is less than 35%, then the regulator must rehabilitate or liquidate the insurer. As of December 31, 2016, the RBC ratios of LNL, LLANY and FPP reported to their respective states of domicile and the NAIC all exceeded the “company action level.” We believe that we will be able to maintain the RBC ratios of our insurance subsidiaries in excess of “company action level” through prudent underwriting, claims handling, investing and capital management. However, no assurances can be given that developments affecting the insurance subsidiaries, many of which could be outside of our control, will not cause the RBC ratios to fall below our targeted levels. These developments may include, but may not be limited to: changes to the manner in which the RBC ratio is calculated; new regulatory requirements for calculating reserves, such as principles-based reserving; economic conditions leading to higher levels of impairments of securities in our insurance subsidiaries’ general accounts; and an inability to finance life reserves including the issuing of letters of credit (“LOCs”) supporting inter-company reinsurance structures. See “Item 1A. Risk Factors – Liquidity and Capital Position – A decrease in the capital and surplus of our insurance subsidiaries may result in a downgrade to our credit and insurer financial strength ratings.” Privacy Regulations In the course of our business, we collect and maintain personal data from our customers including personally identifiable non-public financial and health information, which subjects us to regulation under federal and state privacy laws. These laws require that we institute certain policies and procedures in our business to safeguard this information from improper use or disclosure. While we employ a robust and tested information security program, if federal or state regulators establish further regulations for addressing customer privacy, we may need to amend our policies and adapt our internal procedures. For information regarding cybersecurity risks, see “Item 1A. Risk Factors – Operational Matters – Our information systems may experience interruptions or breaches in security and a failure of disaster recovery systems could result in a loss or disclosure of confidential information, damage to our reputation and impairment of our ability to conduct business effectively.” Federal Initiatives The U.S. federal government does not directly regulate the insurance industry; however, federal initiatives from time to time can impact the insurance industry. Although much of the initial rulemaking has been completed, the implementation process continues and the marketplace continues to evolve in the changing regulatory environment. Financial Reform Legislation Since it was enacted in 2010, the Dodd-Frank Wall Street Reform and Consumer Protection Act (“Dodd-Frank Act”) has imposed considerable reform in the financial services industry. The ongoing implementation continues to present challenges and uncertainties for financial market participants. For instance, the Dodd-Frank Act imposed significant changes to the regulation of derivatives transactions, which we use to mitigate many types of risk in our business. The mandate to clear interest rate swaps requires us to post initial margin in support of these transactions, which was not required when we and our industry peers were permitted to transact these trades in the over-the-counter market. We also expect increased clearing costs as the marketplace responds to the evolving regulatory environment, including changes to capital requirements imposed on our bank counterparties. Swap documentation and processing requirements will change in light of recently-finalized rules for margining uncleared swaps, and the ultimate impact on our derivatives use remains unclear. The exchange of variation margin in over-the counter trades is already part of our standard practice, but the requirement to post initial margin beginning in 2020 will require us to manage our derivatives trading and the attendant liquidity requirements in ways we continue to evaluate. Although the newly-adopted rules provide some flexibility in the categories of eligible collateral, it is still possible that we may be required to hold more of our assets in cash and other low-yielding investments in order to satisfy margin requirements. Documentation requirements attendant to the new margining regime are potentially burdensome and costly. The new regulations may reduce the level of risk exposure we have to our derivatives counterparties (currently managed by holding collateral), but will increase our exposure to central clearinghouses and clearing members with which we transact. Central clearinghouses and regulators alike continue to evaluate the appropriate allocation of risk in the event of the failure of a clearing member or clearinghouse, and the results of these deliberations may change our use of derivatives in ways we cannot yet determine. The standardization of derivatives products for clearing may make customized products unavailable or uneconomical, potentially decreasing the effectiveness of some of our hedging activities. As implementation of the new regulatory framework continues and the marketplace continues to evolve, the extent to which our derivatives costs and strategies may change and the extent to which those changes may affect the range or pricing of our products remains uncertain.
14
In addition, the Dodd-Frank Act requires new regulations governing broker-dealers and investment advisers. In particular, the fiduciary standard rulemaking could potentially have broad implications for how our products are designed and sold in the future. In January 2011, the Securities and Exchange Commission (“SEC”) released a study on the obligations and standards of conduct of financial professionals, as required under the Dodd-Frank Act. The SEC staff recommended establishing a uniform fiduciary standard for investment advisers and broker-dealers when providing investment advice about securities, including guidance for principal trading and definitions of the duties of loyalty and care owed to retail customers that would be consistent with the standard that currently applies to investment advisers. A more uniform fiduciary standard could potentially affect our business in areas including, but not limited to: design and availability of proprietary products; commission-based compensation arrangements; advertising and other communications; use of finders or solicitors of clients (i.e., business contacts who provide referrals); and continuing education requirements for advisors. Additional provisions of the Dodd-Frank Act include, among other things, the creation of a new Consumer Financial Protection Bureau to protect consumers of certain financial products; and changes to certain corporate governance rules. The SEC has postponed rule making on a number of these provisions through 2017. In December 2013, the new Federal Insurance Office established under the Dodd-Frank Act issued a wide-ranging report on the state of insurance regulation in the U.S., together with a series of recommendations on ways to monitor and improve the regulatory environment. The ultimate impact of these recommendations on our business is undeterminable at this time. Department of Labor Regulation On April 8, 2016, the Department of Labor (the “DOL”) released the final Definition of Fiduciary; Conflict of Interest Rule and related prohibited transaction exemptions (the “DOL Fiduciary Rule”), which, when effective, will substantially expand the range of activities that would be considered to be fiduciary investment advice under the Employee Retirement Income Security Act of 1974 (“ERISA”) and the Internal Revenue Code. The DOL Fiduciary Rule provides for a phased implementation of the provisions of this new regulation, the first of which will be effective on April 10, 2017, with full implementation by January 1, 2018. Under the DOL Fiduciary Rule, the investment-related information and support that our advisors and employees may provide to plan sponsors, participants and IRA holders on a non-fiduciary basis will be limited beyond what is allowed under the current law. As a result, changes to the methods that we use to (i) deliver products and services, and (ii) pay or receive compensation for our investment-related products and services may be required, which may impact sales or margins. In addition, to the extent that advisors with our affiliated retail broker-dealers (LFN) provide fiduciary investment advice as defined in the DOL Fiduciary Rule, it could expose those broker-dealers and their advisors to additional risk of legal liability in connection with that advice, which ultimately impacts us. As of the date of this filing, President Trump directed the DOL to prepare an updated economic and legal analysis on whether the DOL Fiduciary Rule (i) has harmed or is likely to harm investors due to a reduction of Americans’ access to certain retirement savings offerings, retirement product structures, retirement savings information or related advice, (ii) has resulted in dislocations or disruptions within the retirement services industry that may adversely affect investors or retirees and (iii) is likely to cause an increase in litigation and an increase in prices that investors or retirees must pay to gain access to retirement services. This analysis may result in an implementation delay beyond the April 10, 2017, date. Federal Tax Legislation Both President Trump and key members of Congress have indicated that comprehensive tax reform is a high priority for the new Administration. If comprehensive tax reform legislation moves forward, there may be an impact to the life insurance company tax regime. Current discussions focus on three major changes: (i) lowering the corporate and individual tax rates and reducing the number of tax brackets, (ii) moving towards a cash-flow based system of taxation for corporations and other businesses, and (iii) reforming the international tax regime by moving to a territorial system of international taxation. However, none of the proposals being discussed include sufficient detail to understand their full effect. At this point, it is impossible to predict the likelihood of tax reform in 2017 or beyond, or the enactment of any of the proposals, whether as part of a comprehensive tax reform act or as discrete legislative changes. We continue to closely monitor developments related to potential changes in the tax law, and assess, when possible, the potential impact to both our earnings and the products we sell. The uncertainty of federal funding and the future of the Social Security Disability Insurance (“SSDI”) program can have a substantial impact on the entire group benefit market, because SSDI benefits are a direct offset to the cost of group disability benefits. Congress alleviated some of this uncertainty by passing the Bipartisan Budget Act of 2015. As a result, the Social Security Administration’s 2016 Annual Report projects that the SSDI reserves will not be depleted until the third quarter of 2023. Health Care Reform Legislation In March 2010, President Obama signed into law the Patient Protection and Affordable Care Act, which was subsequently amended by the Health Care and Education Reconciliation Act. This legislation, as well as subsequent state and federal laws and regulations, includes provisions that provide for additional taxes to help finance the cost of these reforms and substantive changes and additions to health care and related laws, which could potentially impact some of our lines of businesses.
15
Patriot Act The USA PATRIOT Act of 2001 includes anti-money laundering and financial transparency laws as well as various regulations applicable to broker-dealers and other financial services companies, including insurance companies. Financial institutions are required to collect information regarding the identity of their customers, watch for and report suspicious transactions, respond to requests for information by regulatory authorities and law enforcement agencies and share information with other financial institutions. As a result, we are required to maintain certain internal compliance practices, procedures and controls. ERISA Considerations ERISA is a comprehensive federal statute that applies to U.S. employee benefit plans sponsored by private employers and labor unions. Plans subject to ERISA include pension and profit sharing plans and welfare plans, including health, life and disability plans. ERISA provisions include reporting and disclosure rules, standards of conduct that apply to plan fiduciaries and prohibitions on transactions known as “prohibited transactions,” such as conflict-of-interest transactions and certain transactions between a benefit plan and a party in interest. ERISA also provides for a scheme of civil and criminal penalties and enforcement. Our insurance, asset management, plan administrative services and other businesses provide services to employee benefit plans subject to ERISA, including services where we may act as an ERISA fiduciary. In addition to ERISA regulation of businesses providing products and services to ERISA plans, we become subject to ERISA’s prohibited transaction rules for transactions with those plans, which may affect our ability to enter transactions, or the terms on which transactions may be entered, with those plans, even in businesses unrelated to those giving rise to party in interest status. Broker-Dealer and Securities Regulation In addition to being registered under the Securities Act of 1933, some of our separate accounts as well as mutual funds that we sponsor are registered as investment companies under the Investment Company Act of 1940, and the shares of certain of these entities are qualified for sale in some or all states and the District of Columbia. We also have several subsidiaries that are registered as broker-dealers under the Securities Exchange Act of 1934, as amended (“Exchange Act”) and are subject to federal and state regulation, including, but not limited to, the Financial Industry Regulation Authority’s (“FINRA”) net capital rules. In addition, we have several subsidiaries that are investment advisors registered under the Investment Advisers Act of 1940. Agents and employees registered or associated with any of our broker-dealer subsidiaries are subject to the Exchange Act and to examination requirements and regulation by the SEC, FINRA and state securities commissioners. Regulation also extends to various LNC entities that employ or control those individuals. The SEC and other governmental agencies and self-regulatory organizations, as well as state securities commissions in the U.S., have the power to conduct administrative proceedings that can result in censure, fines, the issuance of cease-and-desist orders or suspension and termination or limitation of the activities of the regulated entity or its employees. Environmental Considerations Federal, state and local environmental laws and regulations apply to our ownership and operation of real property. Inherent in owning and operating real property are the risks of hidden environmental liabilities and the costs of any required clean-up. Under the laws of certain states, contamination of a property may give rise to a lien on the property to secure recovery of the costs of clean-up, which could adversely affect our commercial mortgage lending. In several states, this lien has priority over the lien of an existing mortgage against such property. In addition, in some states and under the federal Comprehensive Environmental Response, Compensation, and Liability Act of 1980 (“CERCLA”), we may be liable, as an “owner” or “operator,” for costs of cleaning-up releases or threatened releases of hazardous substances at a property mortgaged to us. We also risk environmental liability when we foreclose on a property mortgaged to us. Federal legislation provides for a safe harbor from CERCLA liability for secured lenders that foreclose and sell the mortgaged real estate, provided that certain requirements are met. However, there are circumstances in which actions taken could still expose us to CERCLA liability. Application of various other federal and state environmental laws could also result in the imposition of liability on us for costs associated with environmental hazards. We routinely conduct environmental assessments for real estate we acquire for investment and before taking title through foreclosure to real property collateralizing mortgages that we hold. Although unexpected environmental liabilities can always arise, based on these environmental assessments and compliance with our internal procedures, we believe that any costs associated with compliance with environmental laws and regulations or any clean-up of properties would not have a material adverse effect on our results of operations. Intellectual Property We rely on a combination of copyright, trademark, patent and trade secret laws to establish and protect our intellectual property. We have implemented a patent strategy designed to protect innovative aspects of our products and processes which we believe distinguish us from competitors. We currently own several issued U.S. patents and have additional patent applications pending in the U.S. Patent and Trademark Office. We regard our patents as valuable assets and intend to protect them against infringement. However, complex legal and factual determinations and changes in patent law make protection uncertain, and while we believe our patents provide us with a competitive advantage, we cannot be certain that patents will be issued from any of our pending patent applications or that any issued patents will
16
have sufficient breadth to offer meaningful protection. In addition, our issued patents may be successfully challenged, invalidated, circumvented or found unenforceable so that our patent rights would not create an effective competitive barrier. Finally, we have an extensive portfolio of trademarks and service marks that we consider important in the marketing of our products and services, including, among others, the trademarks of the Lincoln National and Lincoln Financial names, the Lincoln silhouette logo and the combination of these marks. Trademark registrations may be renewed indefinitely subject to continued use and registration requirements. We regard our trademarks as valuable assets in marketing our products and services and intend to protect them against infringement and dilution.
EMPLOYEES
As of December 31, 2016, we had a total of 9,057 employees. In addition, we had a total of 1,225 planners and agents who had active sales contracts with one of our insurance subsidiaries. None of our employees are represented by a labor union, and we are not a party to any collective bargaining agreements. We consider our employee relations to be good.
AVAILABLE INFORMATION
We file annual, quarterly and current reports, proxy statements and other documents with the SEC under the Exchange Act. The public may read and copy any materials that we file with the SEC at the SEC’s Public Reference Room at 100 F Street, NE, Washington, DC 20549. The public may obtain information on the operation of the Public Reference Room by calling the SEC at 1-800-SEC-0330. Also, the SEC maintains a website that contains reports, proxy and information statements and other information regarding issuers, including LNC, that file electronically with the SEC. The public can obtain any documents that we file with the SEC at www.sec.gov. We also make available, free of charge, on or through our website, www.lfg.com, our Annual Report on Form 10-K, Quarterly Reports on Form 10-Q, Current Reports on Form 8-K and amendments to those reports filed or furnished pursuant to Section 13(a) or 15(d) of the Exchange Act as soon as reasonably practicable after we electronically file such material with, or furnish it to, the SEC. Item 1A. Risk Factors You should carefully consider the risks described below before investing in our securities. The risks and uncertainties described below are not the only ones facing our Company. Additional risks and uncertainties not presently known to us or that we currently deem immaterial may also impair our business operations. If any of these risks actually occur, our business, financial condition and results of operations could be materially affected. In that case, the value of our securities could decline substantially. Legislative, Regulatory and Tax Our businesses are heavily regulated and changes in regulation may affect our insurance subsidiary capital requirements or reduce our profitability. State Regulation Our insurance subsidiaries are subject to extensive supervision and regulation in the states in which we do business. The supervision and regulation relate to numerous aspects of our business and financial condition. The primary purpose of the supervision and regulation is the protection of our insurance contract holders, and not our investors. The extent of regulation varies, but generally is governed by state statutes. These statutes delegate regulatory, supervisory and administrative authority to state insurance departments. This system of supervision and regulation covers, among other things: • Standards of minimum capital requirements and solvency, including RBC measurements; • Restrictions on certain transactions, including, but not limited to, reinsurance between our insurance subsidiaries and their affiliates; • Restrictions on the nature, quality and concentration of investments; • Restrictions on the receipt of reinsurance credit; • Restrictions on the types of terms and conditions that we can include in the insurance policies offered by our primary insurance
operations; • Limitations on the amount of dividends that insurance subsidiaries can pay; • Licensing status of the company; • Certain required methods of accounting pursuant to statutory accounting principles (“SAP”); • Reserves for unearned premiums, losses and other purposes; • Payment of policy benefits (claims); and • Assignment of residual market business and potential assessments for the provision of funds necessary for the settlement of covered
claims under certain policies provided by impaired, insolvent or failed insurance companies. State insurance regulators and the NAIC regularly re-examine existing laws and regulations applicable to insurance companies and their products. Changes in these laws and regulations, or in interpretations thereof, sometimes lead to additional expense for the insurer and, thus, could have a material adverse effect on our financial condition and results of operations. For example, the NAIC is currently considering changes to the accounting and reserve regulations related to variable annuity business.
17
Although we endeavor to maintain all required licenses and approvals our businesses may not fully comply with the wide variety of applicable laws and regulations or the relevant authority’s interpretation of the laws and regulations, which may change from time to time. Also, regulatory authorities have relatively broad discretion to grant, renew or revoke licenses and approvals. If we do not have the requisite licenses and approvals or do not comply with applicable regulatory requirements, the insurance regulatory authorities could preclude or temporarily suspend us from carrying on some or all of our activities or impose substantial fines. Further, insurance regulatory authorities have relatively broad discretion to issue orders of supervision, which permit such authorities to supervise the business and operations of an insurance company. As of December 31, 2016, no state insurance regulatory authority had imposed on us any material fines or revoked or suspended any of our licenses to conduct insurance business in any state or issued an order of supervision with respect to our insurance subsidiaries, which would have a material adverse effect on our results of operations or financial condition. Attempts to mitigate the impact of Regulation XXX and Actuarial Guideline 38 may fail in whole or in part resulting in an adverse effect on our financial condition and results of operations. The Valuation of Life Insurance Policies Model Regulation (“XXX”) requires insurers to establish additional statutory reserves for term life insurance policies with long-term premium guarantees and UL policies with secondary guarantees. In addition, Actuarial Guideline 38 (“AG38”) clarifies the application of XXX with respect to certain UL insurance policies with secondary guarantees. Virtually all of our newly issued term and a portion of our newly issued UL insurance products are affected by XXX and AG38. The application of both AG38 and XXX involve numerous interpretations. If state insurance departments do not agree with our interpretations, we may have to increase reserves related to such policies. The New York State Department of Financial Services does not recognize the NAIC revisions to AG38 in applying the New York law governing the reserves to be held for UL and VUL products containing secondary guarantees. The change, which was effective as of December 31, 2013, impacted our New York-domiciled insurance subsidiary, LLANY. Although LLANY discontinued the sale of these products in early 2013, the change affected those policies previously sold. We began phasing in the increase in reserves in 2013 at $90 million per year over five years, with the final increase in reserves occurring in 2017. As of December 31, 2016, we had increased reserves by $360 million. In April 2016, LLANY entered into a third-party reinsurance arrangement primarily covering UL policies containing secondary guarantees issued between 2002 through 2014 that mitigates the financial impact of the increase of the aforementioned reserves. We have implemented, and plan to continue to implement, reinsurance and capital management transactions to mitigate the capital impact of XXX and AG38, including the use of captive reinsurance subsidiaries. The NAIC adopted Actuarial Guideline 48 (“AG48”) regulating the terms of these arrangements that are entered into or amended in certain ways after December 31, 2014. This guideline imposed restrictions on the types of assets that can be used to support the reinsurance in these kinds of transactions. While we have executed an AG48 compliant reserve financing transaction, we cannot provide assurance that in light of AG48 and/or future rules and regulations that we will be able to continue to efficiently implement transactions or take other actions to mitigate the impact of XXX or AG38 on future sales of term and UL insurance products. If we are unable to continue to efficiently implement such solutions for any reason, we may realize lower than anticipated returns and/or reduced sales on such products. Federal Regulation In addition, our broker-dealer and investment advisor subsidiaries as well as our variable annuities and variable life insurance products, are subject to regulation and supervision by the SEC and FINRA. These laws and regulations generally grant supervisory agencies and self-regulatory organizations broad administrative powers, including the power to limit or restrict the subsidiaries from carrying on their businesses in the event that they fail to comply with such laws and regulations. The foregoing regulatory or governmental bodies, as well as the DOL and others, have the authority to review our products and business practices and those of our agents, advisors, registered representatives, associated persons and employees. In recent years, there has been increased scrutiny of the insurance industry by these bodies, which has included more extensive examinations, regular sweep inquiries and more detailed review of disclosure documents. These regulatory or governmental bodies may bring regulatory or other legal actions against us if, in their view, our practices, or those of our agents or employees, are improper. These actions can result in substantial fines, penalties or prohibitions or restrictions on our business activities and could have a material adverse effect on our business, results of operations or financial condition. Department of Labor regulation defining fiduciary could cause changes to the manner in which we deliver products and services as well as changes in nature and amount of compensation and fees. On April 8, 2016, the DOL released the DOL Fiduciary Rule, which, when effective, will substantially expand the range of activities that would be considered to be fiduciary investment advice under ERISA and the Internal Revenue Code. The DOL Fiduciary Rule provides for a phased implementation of the provisions of this new regulation, the first of which will be effective on April 10, 2017, with full implementation by January 1, 2018. Under the DOL Fiduciary Rule, the investment-related information and support that our advisors and employees may provide to plan sponsors, participants and IRA holders on a non-fiduciary basis will be limited beyond what is allowed under the current law. As a result, changes to the methods that we use to (i) deliver products and services, and (ii) pay and receive compensation for our investment-related products and services may be required, which may impact sales or margins. In addition, to the extent that advisors with our affiliated retail broker-dealers (LFN) provide fiduciary investment advice as defined in the DOL Fiduciary Rule, it could expose those broker-dealers and their advisors to additional risk of legal liability in connection with that advice, which ultimately impacts us.

18
As of the date of this filing, President Trump directed the DOL to prepare an updated economic and legal analysis on whether the DOL Fiduciary Rule (i) has harmed or is likely to harm investors due to a reduction of Americans’ access to certain retirement savings offerings, retirement product structures, retirement savings information or related advice, (ii) has resulted in dislocations or disruptions within the retirement services industry that may adversely affect investors or retirees and (iii) is likely to cause an increase in litigation and an increase in prices that investors or retirees must pay to gain access to retirement services. This analysis may result in an implementation delay beyond the April 10, 2017, date. Changes in U.S. federal income tax law could impact our tax costs and the products that we sell. Changes to the Internal Revenue Code, the issuance of administrative rulings or court decisions could increase our effective tax rate, make our products less desirable and lower our net income on both a statutory accounting and GAAP basis. For example, the Republican members of the House Ways and Means Committee released “A Better Way, Our Vision for a Confident America” on June 24, 2016, which provides an outline for comprehensive tax reform. While, at this point, we cannot predict the likelihood of tax reform occurring in 2017 or beyond, both President Trump and key members of Congress have indicated that comprehensive tax reform is a high priority for the new Administration. If comprehensive tax reform legislation moves forward, there may be an impact to the life insurance company tax regime. Current discussions focus on three major changes: (i) lowering the corporate and individual tax rates and reducing the number of tax brackets, (ii) moving towards a cash-flow based system of taxation for corporations and other businesses and (iii) reforming the international tax regime by moving to a territorial system of international taxation. However, none of the proposals being discussed include sufficient detail to understand their full effect. Based on the detail that has been provided, these proposals could, among other things, change the method used to determine the amount of dividend income received by a life insurance company on assets held in separate accounts used to support products, including variable life insurance and variable annuity contracts, that are eligible for the dividends-received deduction. The dividends-received deduction reduces the amount of dividend income subject to tax and is a significant component of the difference between our actual tax expense and expected amount determined using the federal statutory tax rate of 35%. Our income tax provision for the year ended December 31, 2016, included a tax benefit for the separate account dividends-received deduction benefit of $182 million relating to the 2016 tax year. In addition, should the current proposals move forward, they could change the manner in which we deduct policy acquisition expenses, impose limitations on the deductibility of interest expense and the availability of net operating loss deductions and repeal the corporate Alternative Minimum Tax. These and other changes have been proposed in the context of tax simplification and as part of a plan to reduce the statutory corporate tax rate from a current rate of 35% to a rate of 20%. At this point, it is impossible to predict the enactment of any of the proposals, whether as part of a comprehensive tax reform act or as discrete legislative changes. We continue to closely monitor developments related to potential changes in the tax law and assess, when possible, the potential impact to both our earnings and the products we sell. Legal and regulatory actions are inherent in our businesses and could result in financial losses or harm our businesses. We are, and in the future may be, subject to legal and regulatory actions in the ordinary course of our insurance and retirement operations. Pending legal actions include proceedings relating to aspects of our businesses and operations that are specific to us and proceedings that are typical of the businesses in which we operate. Some of these proceedings have been brought on behalf of various alleged classes of complainants. In certain of these matters, the plaintiffs are seeking large and/or indeterminate amounts, including punitive or exemplary damages. Substantial legal liability in these or future legal or regulatory actions could have a material financial effect or cause significant harm to our reputation, which in turn could materially harm our business prospects. See Note 13 for a description of legal and regulatory proceedings and actions. Implementation of the provisions of the Dodd-Frank Wall Street Reform and Consumer Protection Act may subject us to substantial additional federal regulation, and we cannot predict the effect on our business, results of operations, cash flows or financial condition. Since it was enacted in 2010, the Dodd-Frank Act has brought wide-ranging changes to the financial services industry, including changes to the rules governing derivatives; a study by the SEC of the rules governing broker-dealers and investment advisers with respect to individual investors and investment advice, followed potentially by rulemaking; the creation of a new Federal Insurance Office within the U.S. Treasury to gather information and make recommendations regarding regulation of the insurance industry; the creation of a resolution authority to unwind failing institutions; the creation of a new Consumer Financial Protection Bureau to protect consumers of certain financial products; and changes to executive compensation and certain corporate governance rules, among other things. The Dodd-Frank Act requires significant rulemaking across numerous agencies within the federal government, some of which has been implemented. The implementation of newly-adopted rules will continue throughout 2017, as will the rulemaking process. The ultimate impact of these provisions on our businesses (including product offerings), results of operations and liquidity and capital resources is currently indeterminable.
19
Changes in accounting standards issued by the Financial Accounting Standards Board or other standard-setting bodies may adversely affect our financial statements. Our financial statements are prepared in accordance with GAAP as identified in the Financial Accounting Standards Board (“FASB”) Accounting Standards CodificationTM (“ASC”). From time to time, we are required to adopt new or revised accounting standards or guidance that are incorporated into the FASB ASC. It is possible that future accounting standards we are required to adopt could change the current accounting treatment that we apply to our consolidated financial statements and that such changes could have a material adverse effect on our financial condition and results of operations. Specifically, the FASB is working on a project that could result in significant changes to how we account for and report our insurance contracts and deferred acquisition costs (“DAC”). Depending on the magnitude of the changes ultimately adopted by the FASB, the proposed changes to GAAP may impose special demands on issuers in the areas of employee training, internal controls, contract fulfillment and disclosure and may affect how we manage our business, as it may affect other business processes such as design of compensation plans, product design, etc. The effective dates and transition methods are not known; however, issuers may be required to or may choose to adopt the new standards retrospectively. In this case, the issuer will report results under the new accounting method as of the effective date, as well as for all periods presented. Our domestic insurance subsidiaries are subject to SAP. Any changes in the method of calculating reserves for our life insurance and annuity products under SAP may result in increased reserve requirements. The NAIC continues to review the statutory accounting and capital requirements for variable annuities for potential changes with assistance from Oliver Wyman. Additional testing of these potential changes is expected to occur during 2017. Once any changes are finalized by the NAIC, the resulting new variable annuity framework could result in changes in reserve and/or capital requirements and statutory surplus and could impact the volatility of those item(s). The NAIC is evaluating changes to the C-1 (asset default) capital charges used in the NAIC RBC formula. Once any changes are finalized by the NAIC, it may impact the level of the C-1 related RBC we are required to hold. Anti-takeover provisions could delay, deter or prevent our change in control, even if the change in control would be beneficial to LNC shareholders. We are an Indiana corporation subject to Indiana state law. Certain provisions of Indiana law could interfere with or restrict takeover bids or other change in control events affecting us. Also, provisions in our articles of incorporation, bylaws and other agreements to which we are a party could delay, deter or prevent our change in control, even if a change in control would be beneficial to shareholders. In addition, under Indiana law, directors may, in considering the best interests of a corporation, consider the effects of any action on shareholders, employees, suppliers and customers of the corporation and the communities in which offices and other facilities are located, and other factors the directors consider pertinent. One statutory provision prohibits, except under specified circumstances, LNC from engaging in any business combination with any shareholder who owns 10% or more of our common stock (which shareholder, under the statute, would be considered an “interested shareholder”) for a period of five years following the time that such shareholder became an interested shareholder, unless such business combination is approved by the board of directors prior to such person becoming an interested shareholder. In addition, our articles of incorporation contain a provision requiring holders of at least three-fourths of our voting shares then outstanding and entitled to vote at an election of directors, voting together, to approve a transaction with an interested shareholder rather than the simple majority required under Indiana law, unless certain price thresholds are met. In addition to the anti-takeover provisions of Indiana law, there are other factors that may delay, deter or prevent our change in control. As an insurance holding company, we are regulated as an insurance holding company and are subject to the insurance holding company acts of the states in which our insurance company subsidiaries are domiciled. The insurance holding company acts and regulations restrict the ability of any person to obtain control of an insurance company without prior regulatory approval. Under those statutes and regulations, without such approval (or an exemption), no person may acquire any voting security of a domestic insurance company, or an insurance holding company which controls an insurance company, or merge with such a holding company, if as a result of such transaction such person would “control” the insurance holding company or insurance company. “Control” is generally defined as the direct or indirect power to direct or cause the direction of the management and policies of a person and is presumed to exist if a person directly or indirectly owns or controls 10% or more of the voting securities of another person. Market Conditions Weak conditions in the global capital markets and the economy generally may materially adversely affect our business and results of operations. Our results of operations are materially affected by conditions in the global capital markets and the economy generally, both in the U.S. and elsewhere around the world. Continued unconventional easing from the major central banks, slowing of global growth, continued impact of falling global energy and other commodity prices, and the ability of the U.S. government to proactively address the fiscal imbalance remain key challenges for markets and our business. These macro-economic conditions may have an adverse effect on us given our credit and equity market exposure. In the event of extreme prolonged market events, such as the global credit crisis and recession that occurred during 2008 and 2009, we could incur significant losses. Even in the absence of a market downturn, we are exposed to substantial risk of loss due to market volatility.

20
Factors such as consumer spending, business investment, domestic and foreign government spending, the volatility and strength of the capital markets, the potential for inflation or deflation and uncertainty over domestic and foreign government actions all affect the business and economic environment and, ultimately, the amount and profitability of our business. In an economic downturn characterized by higher unemployment, lower disposable income, lower corporate earnings, lower business investment and lower consumer spending, the demand for our financial and insurance products could be adversely affected. In addition, we may experience an elevated incidence of claims and lapses or surrenders of policies. Our contract holders may choose to defer paying insurance premiums or stop paying insurance premiums altogether. Adverse changes in the economy could affect earnings negatively and could have a material adverse effect on our business, results of operations and financial condition. Changes in interest rates and sustained low interest rates may cause interest rate spreads to decrease and changes in interest rates may also result in increased contract withdrawals. Interest rate fluctuations and/or a sustained period of low interest rates could negatively affect our profitability. Some of our products, principally fixed annuities and UL, including IUL and linked-benefit UL, have interest rate guarantees that expose us to the risk that changes in interest rates will reduce our spread, or the difference between the amounts that we are required to pay under the contracts and the amounts we are able to earn on our general account investments intended to support our obligations under the contracts. Spreads are an important component of our net income. Declines in our spread or instances where the returns on our general account investments are not enough to support the interest rate guarantees on these products could have a material adverse effect on our businesses or results of operations. In addition, low rates increase the cost of providing variable annuity living benefit guarantees, which could negatively affect our variable annuity profitability. In periods when interest rates are declining or remain at low levels, we may have to reinvest the cash we receive as interest or return of principal on our investments in lower yielding instruments reducing our spread. Moreover, borrowers may prepay fixed-income securities, commercial mortgages and mortgage-backed securities in our general account in order to borrow at lower market rates, which exacerbates this risk. Lowering interest crediting rates helps to mitigate the effect of spread compression on some of our products. However, because we are entitled to reset the interest rates on our fixed-rate annuities only at limited, pre-established intervals, and since many of our contracts have guaranteed minimum interest or crediting rates, our spreads could still decrease. As of December 31, 2016, 41% of our annuities business, 88% of our retirement plan services business and 95% of our life insurance business with guaranteed minimum interest or crediting rates are at their guaranteed minimums. Our expectation for future spreads is an important component in the amortization of DAC and value of business acquired (“VOBA”) as it affects the future profitability of the business. Currently, new money rates continue to be at historically low levels. The Federal Reserve Board forecasts point toward short-term rates likely moving above 1% at the end of 2017. For additional information on interest rate risks, see “Part II – Item 7A. Quantitative and Qualitative Disclosures About Market Risk – Interest Rate Risk.” A decline in market interest rates could also reduce our return on investments that do not support particular policy obligations. During periods of sustained lower interest rates, our recorded policy liabilities may not be sufficient to meet future policy obligations and may need to be strengthened, thereby reducing net income in the affected reporting period. Accordingly, declining interest rates may materially affect our results of operations, financial condition and cash flows and significantly reduce our profitability. Increases in market interest rates may also negatively affect our profitability. In periods of rapidly increasing interest rates, we may not be able to replace the assets in our general account with higher yielding assets needed to fund the higher crediting rates necessary to keep our interest-sensitive products competitive. We, therefore, may have to accept a lower spread and thus lower profitability or face a decline in sales and greater loss of existing contracts and related assets. Increases in interest rates may cause increased surrenders and withdrawals of insurance products. In periods of increasing interest rates, policy loans and surrenders and withdrawals of life insurance policies and annuity contracts may increase as contract holders seek to buy products with perceived higher returns. This process may lead to a flow of cash out of our businesses. These outflows may require investment assets to be sold at a time when the prices of those assets are lower because of the increase in market interest rates, which may result in realized investment losses. A sudden demand among consumers to change product types or withdraw funds could lead us to sell assets at a loss to meet the demand for funds. Furthermore, unanticipated increases in withdrawals and termination may cause us to unlock our DAC and VOBA assets, which would reduce net income. An increase in market interest rates could also have a material adverse effect on the value of our investment portfolio, for example, by decreasing the estimated fair values of the fixed-income securities that comprise a substantial portion of our investment portfolio. An increase in interest rates could also result in decreased fee income associated with a decline in the value of variable annuity account balances invested in fixed-income funds. Because the equity markets and other factors impact the profitability and expected profitability of many of our products, changes in equity markets and other factors may significantly affect our business and profitability. The fee income that we earn on variable annuities and VUL insurance policies is based primarily upon account values. Because strong equity markets result in higher account values, strong equity markets positively affect our net income through increased fee income. Conversely, a weakening of the equity markets results in lower fee income and may have a material adverse effect on our results of operations and capital resources. The increased fee income resulting from strong equity markets increases the estimated gross profits (“EGPs”) from variable insurance products as do better than expected lapses, mortality rates and expenses. As a result, higher EGPs may result in lower net amortized
21
costs related to DAC, deferred sales inducements (“DSI”), VOBA, deferred front-end loads (“DFEL”) and changes in future contract benefits. However, a decrease in the equity markets, as well as worse than expected increases in lapses, mortality rates and expenses, depending upon their significance, may result in higher net amortized costs associated with DAC, DSI, VOBA, DFEL and changes in future contract benefits and may have a material adverse effect on our results of operations and capital resources. If we had unlocked our reversion to the mean (“RTM”) assumption in the corridor as of December 31, 2016, we would have recorded favorable unlocking of approximately $110 million, pre-tax, for our Annuities segment and approximately $20 million, pre-tax, for our Retirement Plan Services and Life Insurance segments, respectively. For further information about our RTM process, see “Critical Accounting Policies and Estimates – DAC, VOBA, DSI and DFEL – Reversion to the Mean” in the MD&A. Changes in the equity markets, interest rates and/or volatility affect the profitability of our products with guaranteed benefits; therefore, such changes may have a material adverse effect on our business and profitability. Certain of our variable annuity products include optional guaranteed benefit riders. These include GDB, GWB and GIB riders. Our GWB, GIB and 4LATER® (a form of GIB rider) features have elements of both insurance benefits accounted for under the Financial Services – Insurance – Claim Costs and Liabilities for Future Policy Benefits Subtopic of the FASB ASC (“benefit reserves”) and embedded derivatives accounted for under the Derivatives and Hedging and the Fair Value Measurements and Disclosures Topics of the FASB ASC (“embedded derivative reserves”). We calculate the value of the embedded derivative reserve and the benefit reserves based on the specific characteristics of each guaranteed living benefit feature. The amount of reserves related to GDB for variable annuities is related to the difference between the value of the underlying accounts and the GDB, calculated using a benefit ratio approach. The GDB reserves take into account the present value of total expected GDB payments, the present value of total expected GDB assessments over the life of the contract, claims paid to date and assessments to date. Reserves for our GIB and certain GWB with lifetime benefits are based on a combination of fair value of the underlying benefit and a benefit ratio approach. The benefit ratio approach takes into account, among other things, the present value of expected GIB payments, the present value of total expected GIB assessments over the life of the contract, claims paid to date and assessments to date. The amount of reserves related to those GWB that do not have lifetime benefits is based on the fair value of the underlying benefit. Both the level of expected payments and expected total assessments used in calculating the benefit reserves are affected by the equity markets. The liabilities related to fair value are impacted by changes in equity markets, interest rates, volatility, foreign exchange rates and credit spreads. Accordingly, strong equity markets, increases in interest rates and decreases in volatility will generally decrease the reserves calculated using fair value. Conversely, a decrease in the equity markets along with a decrease in interest rates and an increase in volatility will generally result in an increase in the reserves calculated using fair value. Increases in reserves would result in a charge to our earnings in the quarter in which the increase occurs. Therefore, we maintain a customized dynamic hedge program that is designed to mitigate the risks associated with income volatility around the change in reserves on guaranteed benefits. However, the hedge positions may not be effective to exactly offset the changes in the carrying value of the guarantees due to, among other things, the time lag between changes in their values and corresponding changes in the hedge positions, high levels of volatility in the equity markets and derivatives markets, extreme swings in interest rates, contract holder behavior different than expected, a strategic decision to adjust the hedging strategy in reaction to extreme market conditions or inconsistencies between economic and statutory reserving guidelines and divergence between the performance of the underlying funds and hedging indices. In addition, we remain liable for the guaranteed benefits in the event that derivative or reinsurance counterparties are unable or unwilling to pay, and we are also subject to the risk that the cost of hedging these guaranteed benefits increases, resulting in a reduction to net income. These, individually or collectively, may have a material adverse effect on net income, financial condition or liquidity. Liquidity and Capital Position Adverse capital and credit market conditions may affect our ability to meet liquidity needs, access to capital and cost of capital. We need liquidity to pay our operating expenses, interest on our debt and dividends on our capital stock, to maintain our securities lending activities and to replace certain maturing liabilities. Without sufficient liquidity, we will be forced to curtail our operations, and our business will suffer. When considering our liquidity and capital position, it is important to distinguish between the needs of our insurance subsidiaries and the needs of the holding company. For our insurance and other subsidiaries, the principal sources of liquidity are insurance premiums and fees, annuity considerations and cash flow from our investment portfolio and assets, consisting mainly of cash or assets that are readily convertible into cash. In the event that current resources do not satisfy our needs, we may have to seek additional financing. The availability of additional financing will depend on a variety of factors such as market conditions, the general availability of credit, the volume of trading activities, the overall availability of credit to the financial services industry, our credit ratings and credit capacity, as well as the possibility that customers or lenders could develop a negative perception of our long- or short-term financial prospects if we incur large investment losses or if the level of our business activity decreases due to a market downturn. Similarly, our access to funds may be impaired if regulatory authorities or rating agencies take negative actions against us. See “Review of Consolidated Financial Condition – Liquidity and Capital Resources – Sources of Liquidity and Cash Flow” in the MD&A for a description of our credit ratings. Our internal sources of liquidity may prove to be insufficient, and in such case, we may not be able to successfully obtain additional financing on favorable terms, or at all.
22
Disruptions, uncertainty or volatility in the capital and credit markets may also limit our access to capital required to operate our business, most significantly our insurance operations. Such market conditions may limit our ability to replace, in a timely manner, maturing liabilities; satisfy statutory capital requirements; generate fee income and market-related revenue to meet liquidity needs; and access the capital necessary to grow our business. As such, we may be forced to delay raising capital, issue shorter term securities than we prefer or bear an unattractive cost of capital which could decrease our profitability and significantly reduce our financial flexibility. Our results of operations, financial condition, cash flows and statutory capital position could be materially adversely affected by disruptions in the financial markets. Because we are a holding company with no direct operations, the inability of our subsidiaries to pay dividends to us in sufficient amounts would harm our ability to meet our obligations. We are a holding company and we have no direct operations. Our principal asset is the capital stock of our insurance subsidiaries. Our ability to meet our obligations for payment of interest and principal on outstanding debt obligations and to pay dividends to shareholders, repurchase our securities and pay corporate expenses depends primarily on the ability of our subsidiaries to pay dividends or to advance or repay funds to us. Under Indiana laws and regulations, our Indiana insurance subsidiaries, including LNL, our primary insurance subsidiary, may pay dividends to us without prior approval of the Commissioner up to a certain threshold, or must receive prior approval of the Commissioner to pay a dividend if such dividend, along with all other dividends paid within the preceding 12 consecutive months, exceed the statutory limitation. The current Indiana statutory limitation is the lesser of 10% of the insurer’s contract holders’ surplus, as shown on its last annual statement on file with the Commissioner, or the insurer’s statutory net gain from operations for the previous 12 months, but in no event to exceed statutory unassigned surplus. In addition, payments of dividends and advances or repayment of funds to us by our insurance subsidiaries are restricted by the applicable laws of their respective jurisdictions requiring that our insurance subsidiaries hold a specified amount of minimum reserves in order to meet future obligations on their outstanding policies. These regulations specify that the minimum reserves shall be calculated to be sufficient to meet future obligations, after giving consideration to future required premiums to be received, and are based on certain specified mortality and morbidity tables, interest rates and methods of valuation, which are subject to change. In order to meet their claims-paying obligations, our insurance subsidiaries regularly monitor their reserves to ensure we hold sufficient amounts to cover actual or expected contract and claims payments. At times, we may determine that reserves in excess of the minimum may be needed to ensure sufficiency. Changes in, or reinterpretations of, these laws can constrain the ability of our subsidiaries to pay dividends or to advance or repay funds to us in sufficient amounts and at times necessary to meet our debt obligations and corporate expenses. Requiring our insurance subsidiaries to hold additional reserves has the potential to constrain their ability to pay dividends to the holding company. See “Legislative, Regulatory and Tax – Attempts to mitigate the impact of Regulation XXX and Actuarial Guideline 38 may fail in whole or in part resulting in an adverse effect on our financial condition and results of operations” above for additional information on potential changes in these laws. The earnings of our insurance subsidiaries impact contract holders’ surplus. Lower earnings constrain the growth in our insurance subsidiaries’ capital, and therefore, can constrain the payment of dividends and advances or repayment of funds to us. In addition, the amount of surplus that our insurance subsidiaries could pay as dividends is constrained by the amount of surplus they hold to maintain their financial strength ratings, to provide an additional layer of margin for risk protection and for future investment in our businesses. Notwithstanding the foregoing, we believe that our insurance subsidiaries have sufficient liquidity to meet their contract holder obligations and maintain their operations. A decrease in the capital and surplus of our insurance subsidiaries may result in a downgrade to our credit and insurer financial strength ratings. In any particular year, statutory surplus amounts and RBC ratios may increase or decrease depending on a variety of factors, including the amount of statutory income or losses generated by our insurance subsidiaries (which itself is sensitive to equity market and credit market conditions), the amount of additional capital our insurance subsidiaries must hold to support business growth, changes in reserving requirements, such as principles-based reserving, our inability to obtain reserve relief, changes in equity market levels, the value of certain fixed-income and equity securities in our investment portfolio, the value of certain derivative instruments that do not get hedge accounting treatment, changes in interest rates and foreign currency exchange rates, as well as changes to the NAIC RBC formulas. The RBC ratio is also affected by the product mix of the in-force book of business (i.e., the amount of business without guarantees is not subject to the same level of reserves as the business with guarantees). Most of these factors are outside of our control. Our credit and insurer financial strength ratings are significantly influenced by the statutory surplus amounts and RBC ratios of our insurance company subsidiaries. The RBC ratio of LNL is an important factor in the determination of the credit and financial strength ratings of LNC and its subsidiaries. In addition, rating agencies may implement changes to their internal models that have the effect of increasing or decreasing the amount of statutory capital we must hold in order to maintain our current ratings. In extreme scenarios of equity market declines, the amount of additional statutory reserves that we are required to hold for our variable annuity guarantees may increase at a rate greater than the rate of change of the markets. Increases in reserves reduce the statutory surplus used in calculating our RBC ratios. To the extent that our statutory capital resources are deemed to be insufficient to maintain a particular rating by one or more rating agencies, we may seek to raise additional capital through public or private equity or debt financing, which may be on terms not as favorable as in the past.
23
Alternatively, if we were not to raise additional capital in such a scenario, either at our discretion or because we were unable to do so, our financial strength and credit ratings might be downgraded by one or more rating agencies. For more information on risks regarding our ratings, see “Covenants and Ratings – A downgrade in our financial strength or credit ratings could limit our ability to market products, increase the number or value of policies being surrendered and/or hurt our relationships with creditors” below. An inability to access our credit facilities could result in a reduction in our liquidity and lead to downgrades in our credit and financial strength ratings. We have a $2.5 billion unsecured facility, which expires on June 30, 2021. We also have other facilities that we enter into in the ordinary course of business. See “Review of Consolidated Financial Condition – Liquidity and Capital Resources – Sources of Liquidity and Cash Flow – Financing Activities” in the MD&A and Note 12. We rely on our credit facilities as a potential source of liquidity. We also use the credit facility as a potential backstop to provide variable annuity statutory reserve credit. While our variable annuity hedge assets have normally exceeded the statutory reserves, in certain severely stressed market conditions, it is possible that the hedge assets could be less than the statutory reserve. Our credit facility is available to provide reserve credit to LNL in such a case. If we were unable to access our facility in such circumstances, it could materially impact LNL’s capital position. The availability of these facilities could be critical to our credit and financial strength ratings and our ability to meet our obligations as they come due in a market when alternative sources of credit are tight. The credit facilities contain certain administrative, reporting, legal and financial covenants. We must comply with covenants under our credit facilities, including a requirement to maintain a specified minimum consolidated net worth. Our right to borrow funds under these facilities is subject to the fulfillment of certain important conditions, including our compliance with all covenants, and our ability to borrow under these facilities is also subject to the continued willingness and ability of the lenders that are parties to the facilities to provide funds. Our failure to comply with the covenants in the credit facilities or fulfill the conditions to borrowings, or the failure of lenders to fund their lending commitments (whether due to insolvency, illiquidity or other reasons) in the amounts provided for under the terms of the facilities, would restrict our ability to access these credit facilities when needed and, consequently, could have a material adverse effect on our financial condition and results of operations. Assumptions and Estimates As a result of changes in assumptions, estimates and methods in calculating reserves, our reserves for future policy benefits and claims related to our current and future business as well as businesses we may acquire in the future may prove to be inadequate. We establish and carry, as a liability, reserves based on estimates of how much we will need to pay for future benefits and claims. For our insurance products, we calculate these reserves based on many assumptions and estimates, including, but not limited to, estimated premiums we will receive over the assumed life of the policies, the timing of the events covered by the insurance policies, the lapse rate of the policies, the amount of benefits or claims to be paid and the investment returns on the assets we purchase with the premiums we receive. The sensitivity of our statutory reserves and surplus established for our variable annuity base contracts and riders to changes in the equity markets will vary depending on the magnitude of the decline. The sensitivity will be affected by the level of account values relative to the level of guaranteed amounts, product design and reinsurance. Statutory reserves for variable annuities depend upon the cumulative equity market impacts on the business in force, and therefore, result in non-linear relationships with respect to the level of equity market performance within any reporting period. The assumptions and estimates we use in connection with establishing and carrying our reserves are inherently uncertain. Accordingly, we cannot determine with precision the ultimate amount or the timing of the payment of actual benefits and claims or whether the assets supporting the policy liabilities will grow to the level we assume prior to payment of benefits or claims. If our actual experience is different from our assumptions or estimates, our reserves may prove to be inadequate in relation to our estimated future benefits and claims. Increases in reserves have a negative effect on income from operations in the quarter incurred. If our businesses do not perform well and/or their estimated fair values decline or the price of our common stock does not increase, we may be required to recognize an impairment of our goodwill or to establish a valuation allowance against the deferred income tax asset, which could have a material adverse effect on our results of operations and financial condition. Goodwill represents the excess of the acquisition price incurred to acquire subsidiaries and other businesses over the fair value of their net assets as of the date of acquisition. As of December 31, 2016, we had a total of $2.3 billion of goodwill on our Consolidated Balance Sheets. We test goodwill at least annually for indications of value impairment with consideration given to financial performance, mergers and acquisitions and other relevant factors. In addition, certain events, including a significant and adverse change in legal factors, accounting standards or the business climate, an adverse action or assessment by a regulator or unanticipated competition, would cause us to review the carrying amounts of goodwill for impairment. Impairment testing is performed based upon estimates of the fair value of the “reporting unit” to which the goodwill relates. Subsequent reviews of goodwill could result in an impairment of goodwill, and such write-downs could have a material adverse effect on our net income and book value, but will not affect the statutory capital of our insurance subsidiaries.
24
In January 2017, the FASB issued amendments to the goodwill impairment accounting guidance. For more information regarding this new accounting standard, see “ASU 2017-04, Simplifying the Test for Goodwill Impairment” in Note 2. For more information on goodwill, see “Critical Accounting Policies and Estimates – Goodwill and Other Intangible Assets” in the MD&A and Note 10. Deferred income tax represents the tax effect of the differences between the book and tax basis of assets and liabilities. Deferred tax assets are assessed periodically by management to determine if they are realizable. As of December 31, 2016, we had a deferred tax asset of $1.8 billion. Factors in management’s determination include the performance of the business, including the ability to generate capital gains from a variety of sources and tax planning strategies. If, based on available information, it is more likely than not that the deferred income tax asset will not be realized, then a valuation allowance must be established with a corresponding charge to net income. Such valuation allowance could have a material adverse effect on our results of operations and financial condition. The determination of the amount of allowances and impairments taken on our investments is highly subjective and could materially impact our results of operations or financial condition. The determination of the amount of allowances and impairments varies by investment type and is based upon our periodic evaluation and assessment of known and inherent risks associated with the respective asset class. Such evaluations and assessments are revised as conditions change and new information becomes available. Management updates its evaluations regularly and reflects changes in allowances and impairments in operations as such evaluations are revised. There can be no assurance that our management has accurately assessed the level of impairments taken and allowances reflected in our financial statements. Furthermore, additional impairments may need to be taken or allowances provided for in the future. Historical trends may not be indicative of future impairments or allowances. We regularly review our available-for-sale (“AFS”) securities for declines in fair value that we determine to be other-than-temporary. For an equity security, if we do not have the ability and intent to hold the security for a sufficient period of time to allow for a recovery in value, we conclude that an other-than-temporary impairment (“OTTI”) has occurred, and the amortized cost of the equity security is written down to the current fair value, with a corresponding change to realized gain (loss) on our Consolidated Statements of Comprehensive Income (Loss). When assessing our ability and intent to hold the equity security to recovery, we consider, among other things, the severity and duration of the decline in fair value of the equity security as well as the cause of decline, a fundamental analysis of the liquidity, business prospects and overall financial condition of the issuer. For a debt security, if we intend to sell a security or it is more likely than not we will be required to sell a debt security before recovery of its amortized cost basis and the fair value of the debt security is below amortized cost, we conclude that an OTTI has occurred and the amortized cost is written down to current fair value, with a corresponding change to realized gain (loss) on our Consolidated Statements of Comprehensive Income (Loss). If we do not intend to sell a debt security or it is not more likely than not we will be required to sell a debt security before recovery of its amortized cost basis but the present value of the cash flows expected to be collected is less than the amortized cost of the debt security (referred to as the credit loss), we conclude that an OTTI has occurred, and the amortized cost is written down to the estimated recovery value with a corresponding change to realized gain (loss) on our Consolidated Statements of Comprehensive Income (Loss), as this is also deemed the credit portion of the OTTI. The remainder of the decline to fair value is recorded in other comprehensive income (loss) (“OCI”) to unrealized OTTI on AFS securities on our Consolidated Statements of Stockholders’ Equity, as this is considered a noncredit (i.e., recoverable) impairment. In June 2016, the FASB issued amendments to the accounting guidance for measuring credit losses on financial instruments. For more information regarding the new accounting standard, see “ASU 2016-13, Measurement of Credit Losses on Financial Instruments” in Note 2. Related to our unrealized losses, we establish deferred tax assets for the tax benefit we may receive in the event that losses are realized. The realization of significant realized losses could result in an inability to recover the tax benefits and may result in the establishment of valuation allowances against our deferred tax assets. Realized losses or impairments may have a material adverse impact on our results of operations and financial condition. Our valuation of fixed maturity, equity and trading securities may include methodologies, estimations and assumptions which are subject to differing interpretations and could result in changes to investment valuations that may materially adversely affect our results of operations or financial condition. Fixed maturity, equity and trading securities and short-term investments, which are reported at fair value on our Consolidated Balance Sheets, represented the majority of our total cash and invested assets. We have categorized these securities into a three-level hierarchy, based on the priority of the inputs to the respective valuation technique. The fair value hierarchy gives the highest priority to quoted prices in active markets for identical assets or liabilities (Level 1) and the lowest priority to unobservable inputs (Level 3). The determination of fair values in the absence of quoted market prices is based on valuation methodologies, securities we deem to be comparable and assumptions deemed appropriate given the circumstances. The fair value estimates are made at a specific point in time, based on available market information and judgments about financial instruments, including estimates of the timing and amounts of expected future cash flows and the credit standing of the issuer or counterparty. Factors considered in estimating fair value include coupon rate, maturity, estimated duration, call provisions, sinking fund requirements, credit rating, industry sector of the issuer and
25
quoted market prices of comparable securities. The use of different methodologies and assumptions may have a material effect on the estimated fair value amounts. During periods of market disruption, including periods of significantly increasing/decreasing or high/low interest rates, rapidly widening credit spreads or illiquidity, it may be difficult to value certain securities if trading becomes less frequent and/or market data becomes less observable. There may be certain asset classes that were in active markets with significant observable data that become illiquid due to the current financial environment. In such cases, more securities may fall to Level 3 and thus require more subjectivity and management judgment. As such, valuations may include inputs and assumptions that are less observable or require greater estimation, as well as valuation methods which are more sophisticated or require greater estimation, thereby resulting in values which may be less than the value at which the investments may be ultimately sold. Further, rapidly changing and unprecedented credit and equity market conditions could materially impact the valuation of securities as reported within our consolidated financial statements and the period-to-period changes in value could vary significantly. Decreases in value may have a material adverse effect on our results of operations or financial condition. Significant adverse mortality experience may result in the loss of, or higher prices for, reinsurance. We reinsure a significant amount of the mortality risk on fully underwritten, newly issued, individual life insurance contracts. We regularly review retention limits for continued appropriateness and they may be changed in the future. If we were to experience adverse mortality or morbidity experience, a significant portion of that would be reimbursed by our reinsurers. Prolonged or severe adverse mortality or morbidity experience could result in increased reinsurance costs, and ultimately, reinsurers being unwilling to offer coverage. If we are unable to maintain our current level of reinsurance or purchase new reinsurance protection at comparable rates to what we are paying currently, we may have to accept an increase in our net exposures or revise our pricing to reflect higher reinsurance premiums or both. If this were to occur, we may be exposed to reduced profitability and cash flow strain or we may not be able to price new business at competitive rates. Catastrophes may adversely impact liabilities for contract holder claims. Our insurance operations are exposed to the risk of catastrophic mortality, such as a pandemic, an act of terrorism, natural disaster or other event that causes a large number of deaths or injuries. Significant influenza pandemics have occurred three times in the last century, but the likelihood, timing or severity of a future pandemic cannot be predicted. Additionally, the impact of climate change could cause changes in weather patterns, resulting in more severe and more frequent natural disasters such as forest fires, hurricanes, tornados, floods and storm surges. In our group insurance operations, a localized event that affects the workplace of one or more of our group insurance customers could cause a significant loss due to mortality or morbidity claims. These events could cause a material adverse effect on our results of operations in any period and, depending on their severity, could also materially and adversely affect our financial condition. The extent of losses from a catastrophe is a function of both the total amount of insured exposure in the area affected by the event and the severity of the event. Pandemics, natural disasters and man-made catastrophes, including terrorism, may produce significant damage in larger areas, especially those that are heavily populated. Claims resulting from natural or man-made catastrophic events could cause substantial volatility in our financial results for any fiscal quarter or year and could materially reduce our profitability or harm our financial condition. Also, catastrophic events could harm the financial condition of our reinsurers and thereby increase the probability of default on reinsurance recoveries. Accordingly, our ability to write new business could also be affected. Consistent with industry practice and accounting standards, we establish liabilities for claims arising from a catastrophe only after assessing the probable losses arising from the event. We cannot be certain that the liabilities we have established or applicable reinsurance will be adequate to cover actual claim liabilities, and a catastrophic event or multiple catastrophic events could have a material adverse effect on our business, results of operations and financial condition. Operational Matters Our enterprise risk management policies and procedures may leave us exposed to unidentified or unanticipated risk, which could negatively affect our businesses or result in losses. We have devoted significant resources to develop our enterprise risk management policies and procedures and expect to continue to do so in the future. Nonetheless, our policies and procedures to identify, monitor and manage risks may not be fully effective. Many of our methods of managing risk and exposures are based upon our use of observed historical market behavior or statistics based on historical models. As a result, these methods may not predict future exposures, which could be significantly greater than the historical measures indicate, such as the risk of pandemics causing a large number of deaths. Other risk management methods depend upon the evaluation of information regarding markets, clients, catastrophe occurrence or other matters that is publicly available or otherwise accessible to us, which may not always be accurate, complete, up-to-date or properly evaluated. Management of operational, legal and regulatory risks requires, among other things, policies and procedures to record properly and verify a large number of transactions and events, and these policies and procedures may not be fully effective. We face risks of non-collectability of reinsurance and increased reinsurance rates, which could materially affect our results of operations. We follow the insurance practice of reinsuring with other insurance and reinsurance companies a portion of the risks under the policies written by our insurance subsidiaries (known as “ceding”). As of December 31, 2016, we ceded $288.0 billion of life insurance in force to
26
reinsurers for reinsurance protection. Although reinsurance does not discharge our subsidiaries from their primary obligation to pay contract holders for losses insured under the policies we issue, reinsurance does make the assuming reinsurer liable to the insurance subsidiaries for the reinsured portion of the risk. As of December 31, 2016, we had $5.3 billion of reinsurance receivables from reinsurers for paid and unpaid losses, for which they are obligated to reimburse us under our reinsurance contracts. Of this amount, $2.1 billion related to the sale of our reinsurance business to Swiss Re in 2001 through an indemnity reinsurance agreement. Swiss Re has funded a trust to support this business. The balance in the trust changes as a result of ongoing reinsurance activity and was $2.6 billion as of December 31, 2016. Furthermore, we hold trading securities to support the $495 million of funds withheld liabilities related to the Swiss Re treaties for which we would have the right of offset to the corresponding reinsurance receivables in the event of a default by Swiss Re. The balance of the reinsurance is due from a diverse group of reinsurers. The collectability of reinsurance is largely a function of the solvency of the individual reinsurers. We perform annual credit reviews on our reinsurers, focusing on, among other things, financial capacity, stability, trends and commitment to the reinsurance business. We also require assets in trust, LOCs or other acceptable collateral to support balances due from reinsurers not authorized to transact business in the applicable jurisdictions. Despite these measures, a reinsurer’s insolvency, inability or unwillingness to make payments under the terms of a reinsurance contract, especially Swiss Re, could have a material adverse effect on our results of operations and financial condition. Reinsurers also may attempt to increase rates with respect to our existing reinsurance arrangements. The ability of our reinsurers to increase rates depends upon the terms of each reinsurance contract. An increase in reinsurance rates may affect the profitability of our insurance business. Competition for our employees is intense, and we may not be able to attract and retain the highly skilled people we need to support our business. Our success depends, in large part, on our ability to attract and retain key people. Intense competition exists for the key employees with demonstrated ability, and we may be unable to hire or retain such employees. The unexpected loss of services of one or more of our key personnel could have a material adverse effect on our operations due to their skills, knowledge of our business, their years of industry experience and the potential difficulty of promptly finding qualified replacement employees. We compete with other financial institutions primarily on the basis of our products, compensation, support services and financial condition. Sales in our businesses and our results of operations and financial condition could be materially adversely affected if we are unsuccessful in attracting and retaining key employees, including financial advisors, wholesalers and other employees, as well as independent distributors of our products. We may not be able to protect our intellectual property and may be subject to infringement claims. We rely on a combination of contractual rights and copyright, trademark, patent and trade secret laws to establish and protect our intellectual property. Although we use a broad range of measures to protect our intellectual property rights, third parties may infringe or misappropriate our intellectual property. We may have to litigate to enforce and protect our copyrights, trademarks, patents, trade secrets and know-how or to determine their scope, validity or enforceability, which represents a diversion of resources that may be significant in amount and may not prove successful. Additionally, complex legal and factual determinations and evolving laws and court interpretations make the scope of protection afforded our intellectual property uncertain, particularly in relation to our patents. While we believe our patents provide us with a competitive advantage, we cannot be certain that any issued patents will be interpreted with sufficient breadth to offer meaningful protection. In addition, our issued patents may be successfully challenged, invalidated, circumvented or found unenforceable so that our patent rights would not create an effective competitive barrier. The loss of intellectual property protection or the inability to secure or enforce the protection of our intellectual property assets could have a material adverse effect on our business and our ability to compete. We also may be subject to costly litigation in the event that another party alleges our operations or activities infringe upon another party’s intellectual property rights. Third parties may have, or may eventually be issued, patents that could be infringed by our products, methods, processes or services. Any party that holds such a patent could make a claim of infringement against us. We may also be subject to claims by third parties for breach of copyright, trademark, trade secret or license usage rights. Any such claims and any resulting litigation could result in significant liability for damages. If we were found to have infringed a third-party patent or other intellectual property rights, we could incur substantial liability, and in some circumstances could be enjoined from providing certain products or services to our customers or utilizing and benefiting from certain methods, processes, copyrights, trademarks, trade secrets or licenses, or alternatively could be required to enter into costly licensing arrangements with third parties, all of which could have a material adverse effect on our business, results of operations and financial condition. Our information systems may experience interruptions or breaches in security and a failure of disaster recovery systems could result in a loss or disclosure of confidential information, damage to our reputation and impairment of our ability to conduct business effectively. Our information systems are critical to the operation of our business. We collect, process, maintain, retain and distribute large amounts of personal financial and health information and other confidential and sensitive data about our customers in the ordinary course of our business. Our business therefore depends on our customers’ willingness to entrust us with their personal information. Any failure, interruption or breach in security could result in disruptions to our critical systems and adversely affect our customer relationships. Although hackers have attempted and continue to try to infiltrate our computer systems, to date, we have not had a material security breach. While we employ a robust and tested information security program, given the increasing sophistication of cyberattacks, a cyberattack could occur and persist for an extended period of time without detection. There can be no assurance that any such failure,

27
interruption or security breach will not occur or, if any does occur, that it will be detected in a timely manner or that it can be sufficiently remediated. In the event of a disaster such as a natural catastrophe, epidemic, industrial accident, blackout, computer virus, terrorist attack, cyberattack or war, unanticipated problems with our disaster recovery systems could have a material adverse impact on our ability to conduct business and on our results of operations and financial condition, particularly if those problems affect our computer-based data processing, transmission, storage and retrieval systems and destroy valuable data. In addition, in the event that a significant number of our managers were unavailable following a disaster, our ability to effectively conduct business could be severely compromised. These interruptions also may interfere with our suppliers’ ability to provide goods and services and our employees’ ability to perform their job responsibilities. The failure of our computer systems and/or our disaster recovery plans for any reason could cause significant interruptions in our operations and result in a failure to maintain the security, confidentiality or privacy of sensitive data, including personal information relating to our customers. The occurrence of any such failure, interruption or security breach of our systems could damage our reputation, result in a loss of customer business, subject us to additional regulatory scrutiny, or expose us to civil litigation and financial liability. Although we conduct due diligence, negotiate contractual provisions and, in many cases, conduct periodic reviews of our vendors, distributors, and other third parties that provide operational or information technology services to us to confirm compliance with our information security standards, the failure of such third parties’ computer systems and/or their disaster recovery plans for any reason might cause significant interruptions in our operations and result in a failure to maintain the security, confidentiality or privacy of sensitive data, including personal information relating to our customers. Such a failure could harm our reputation, subject us to regulatory sanctions and legal claims, lead to a loss of customers and revenues and otherwise adversely affect our business and financial results. While we maintain cyber liability insurance that provides both third-party liability and first party liability coverages, our insurance may not be sufficient to protect us against all losses. Covenants and Ratings A downgrade in our financial strength or credit ratings could limit our ability to market products, increase the number or value of policies being surrendered and/or hurt our relationships with creditors. Nationally recognized rating agencies rate the financial strength of our principal insurance subsidiaries and rate our debt. Ratings are not recommendations to buy our securities. Each of the rating agencies reviews its ratings periodically, and our current ratings may not be maintained in the future. Our financial strength ratings, which are intended to measure our ability to meet contract holder obligations, are an important factor affecting public confidence in most of our products and, as a result, our competitiveness. A downgrade of the financial strength rating of one of our principal insurance subsidiaries could affect our competitive position in the insurance industry by making it more difficult for us to market our products as potential customers may select companies with higher financial strength ratings and by leading to increased withdrawals by current customers seeking companies with higher financial strength ratings. This could lead to a decrease in fees as net outflows of assets increase, and therefore, result in lower fee income. Furthermore, sales of assets to meet customer withdrawal demands could also result in losses, depending on market conditions. The interest rates we pay on our borrowings are largely dependent on our credit ratings. A downgrade of our debt ratings could affect our ability to raise additional debt, including bank lines of credit, with terms and conditions similar to our current debt, and accordingly, likely increase our cost of capital. All of our ratings and ratings of our principal insurance subsidiaries are subject to revision or withdrawal at any time by the rating agencies, and therefore, no assurance can be given that our principal insurance subsidiaries or we can maintain these ratings. See “Item 1. Business – Financial Strength Ratings” and “Liquidity and Capital Resources – Sources of Liquidity and Cash Flow” in the MD&A for a description of our ratings. We will be required to pay interest on our capital securities with proceeds from the issuance of qualifying securities if we fail to achieve capital adequacy or net income and stockholders’ equity levels. As of December 31, 2016, we had approximately $1.2 billion in principal amount of capital securities outstanding. All of the capital securities contain covenants that require us to make interest payments in accordance with an alternative coupon satisfaction mechanism (“ACSM”) if we determine that one of the following triggers exists as of the 30th day prior to an interest payment date, or the “determination date”: 1. LNL’s RBC ratio is less than 175% (based on the most recent annual financial statement filed with the State of Indiana); or 2. (i) The sum of our consolidated net income for the four trailing fiscal quarters ending on the quarter that is two quarters prior to the most recently completed quarter prior to the determination date is zero or negative, and (ii) our consolidated stockholders’ equity (excluding accumulated OCI and any increase in stockholders’ equity resulting from the issuance of preferred stock during a quarter), or “adjusted stockholders’ equity,” as of (x) the most recently completed quarter and (y) the end of the quarter that is two quarters before
28
the most recently completed quarter, has declined by 10% or more as compared to the quarter that is ten fiscal quarters prior to the last completed quarter, or the “benchmark quarter.” The ACSM would generally require us to use commercially reasonable efforts to satisfy our obligation to pay interest in full on the capital securities with the net proceeds from sales of our common stock and warrants to purchase our common stock with an exercise price greater than the market price. We would have to utilize the ACSM until the trigger events above no longer existed, and, in the case of test 2 above, until our adjusted stockholders’ equity amount increased or declined by less than 10% as compared to the adjusted stockholders’ equity at the end of the benchmark quarter for each interest payment date as to which interest payment restrictions were imposed by test 2 above. If we were required to utilize the ACSM and were successful in selling sufficient shares of common stock or warrants to satisfy the interest payment, we would dilute the current holders of our common stock. Furthermore, while a trigger event is occurring and if we do not pay accrued interest in full, we may not, among other things, pay dividends on or repurchase our capital stock. Our failure to pay interest pursuant to the ACSM will not result in an event of default with respect to the capital securities, nor will a nonpayment of interest, unless it lasts for ten consecutive years, although such breaches may result in monetary damages to the holders of the capital securities. The calculations of RBC, net income (loss) and adjusted stockholders’ equity are subject to adjustments and the capital securities are subject to additional terms and conditions as further described in supplemental indentures filed as exhibits to our Forms 8-K filed on March 13, 2007, and May 17, 2006. Certain blocks of our insurance business purchased from third-party insurers under indemnity reinsurance agreements may require us to place assets in trust, secure letters of credit or return the business, if the financial strength ratings and/or capital ratios of certain insurance subsidiaries are not maintained at specified levels. Under certain indemnity reinsurance agreements, two of our insurance subsidiaries, LNL and LLANY, provide 100% indemnity reinsurance for the business assumed; however, the third-party insurer, or the “cedent,” remains primarily liable on the underlying insurance business. Under these types of agreements, as of December 31, 2016, we held statutory reserves of $5.9 billion. These indemnity reinsurance arrangements require that our subsidiary, as the reinsurer, maintain certain insurer financial strength ratings and capital ratios. If these ratings or capital ratios are not maintained, depending upon the reinsurance agreement, the cedent may recapture the business, or require us to place assets in trust or provide LOCs at least equal to the relevant statutory reserves. Under the LNL reinsurance arrangement, we held approximately $3.5 billion of statutory reserves. LNL must maintain an A.M. Best financial strength rating of at least B++, an S&P financial strength rating of at least BBB- and a Moody’s financial strength rating of at least Baa3. This arrangement may require LNL to place assets in trust equal to the relevant statutory reserves. Under LLANY’s largest indemnity reinsurance arrangement, we held approximately $1.6 billion of statutory reserves as of December 31, 2016. LLANY must maintain an A.M. Best financial strength rating of at least B+, an S&P financial strength rating of at least BB+ and a Moody’s financial strength rating of at least Ba1, as well as maintain an RBC ratio of at least 160% or an S&P capital adequacy ratio of 100%, or the cedent may recapture the business. Under two other LLANY arrangements, by which we established $761 million of statutory reserves, LLANY must maintain an A.M. Best financial strength rating of at least B++, an S&P financial strength rating of at least BBB- and a Moody’s financial strength rating of at least Baa3. One of these arrangements also requires LLANY to maintain an RBC ratio of at least 185% or an S&P capital adequacy ratio of 115%. Each of these arrangements may require LLANY to place assets in trust equal to the relevant statutory reserves. As of December 31, 2016, LNL’s and LLANY’s RBC ratios exceeded the required ratio. See “Item 1. Business – Financial Strength Ratings” for a description of our financial strength ratings. If the cedent recaptured the business, LNL and LLANY would be required to release reserves and transfer assets to the cedent. Such a recapture could adversely impact our future profits. Alternatively, if LNL and LLANY established a security trust for the cedent, the ability to transfer assets out of the trust could be severely restricted, thus negatively impacting our liquidity. Investments Some of our investments are relatively illiquid and are in asset classes that have been experiencing significant market valuation fluctuations. We hold certain investments that may lack liquidity, such as privately placed fixed maturity securities, mortgage loans, policy loans and other limited partnership interests. These asset classes represented 25% of the carrying value of our total cash and invested assets as of December 31, 2016. If we require significant amounts of cash on short notice in excess of normal cash requirements or are required to post or return collateral in connection with our investment portfolio, derivatives transactions or securities lending activities, we may have difficulty selling these investments in a timely manner, be forced to sell them for less than we otherwise would have been able to realize, or both. The reported value of our relatively illiquid types of investments, our investments in the asset classes described in the paragraph above and, at times, our high quality, generally liquid asset classes, do not necessarily reflect the lowest current market price for the asset. If we were forced to sell certain of our assets in the current market, there can be no assurance that we would be able to sell them for the prices at which we have recorded them, and we might be forced to sell them at significantly lower prices.
29
We invest a portion of our invested assets in investment funds, many of which make private equity investments. The amount and timing of income from such investment funds tends to be uneven as a result of the performance of the underlying investments, including private equity investments. The timing of distributions from the funds, which depends on particular events relating to the underlying investments, as well as the funds’ schedules for making distributions and their needs for cash, can be difficult to predict. As a result, the amount of income that we record from these investments can vary substantially from quarter to quarter. Defaults on our mortgage loans and write-downs of mortgage equity may adversely affect our profitability. Our mortgage loans face default risk and are principally collateralized by commercial properties. The performance of our mortgage loan investments may fluctuate in the future. In addition, some of our mortgage loan investments have balloon payment maturities. An increase in the default rate of our mortgage loan investments could have a material adverse effect on our business, results of operations and financial condition. Further, any geographic or sector exposure in our mortgage loans may have adverse effects on our investment portfolios and consequently on our consolidated results of operations or financial condition. While we seek to mitigate this risk by having a broadly diversified portfolio, events or developments that have a negative effect on any particular geographic region or sector may have a greater adverse effect on the investment portfolios to the extent that the portfolios are exposed. The difficulties faced by other financial institutions could adversely affect us. We have exposure to many different industries and counterparties, and routinely execute transactions with counterparties in the financial services industry, including brokers and dealers, commercial banks, investment banks and other institutions. Many of these transactions expose us to credit risk in the event of default of our counterparty. In addition, with respect to secured transactions, our credit risk may be exacerbated when the collateral held by us cannot be realized upon or is liquidated at prices not sufficient to recover the full amount of the loan or derivative exposure due to it. We also may have exposure to these financial institutions in the form of unsecured debt instruments, derivative transactions and/or equity investments. These parties may default on their obligations to us due to bankruptcy, lack of liquidity, downturns in the economy or real estate values, operational failure, corporate governance issues or other reasons. A downturn in the U.S. and other economies could result in increased impairments. There can be no assurance that any such losses or impairments to the carrying value of these assets would not materially and adversely affect our business and results of operations. Our requirements to post collateral or make payments related to declines in market value of specified assets may adversely affect our liquidity and expose us to counterparty credit risk. Many of our transactions with financial and other institutions, including settling futures positions, specify the circumstances under which the parties are required to post collateral. The amount of collateral we may be required to post under these agreements may increase under certain circumstances, which could adversely affect our liquidity. In addition, under the terms of some of our transactions, we may be required to make payments to our counterparties related to any decline in the market value of the specified assets. Our investments are reflected within our consolidated financial statements utilizing different accounting bases, and, accordingly, there may be significant differences between cost and fair value that are not recorded in our consolidated financial statements. Our principal investments are in fixed maturity and equity securities, mortgage loans on real estate, policy loans, short-term investments, derivative instruments, limited partnerships and other invested assets. The carrying value of such investments is as follows: • Fixed maturity and equity securities are classified as AFS, except for those designated as trading securities, and are reported at their
estimated fair value. The difference between the estimated fair value and amortized cost of such securities (i.e., unrealized investment gains and losses) is recorded as a separate component of OCI, net of adjustments to DAC, contract holder related amounts and deferred income taxes;
• Fixed maturity and equity securities designated as trading securities are recorded at fair value with subsequent changes in fair value recognized in realized gain (loss). However, in certain cases, the trading securities support reinsurance arrangements. In those cases, offsetting the changes to fair value of the trading securities are corresponding changes in the fair value of the embedded derivative liability associated with the underlying reinsurance arrangement. In other words, the investment results for the trading securities, including gains and losses from sales, are passed directly to the reinsurers through the contractual terms of the reinsurance arrangements. These types of securities represent 46% of our trading securities;
• Short-term investments include investments with remaining maturities of one year or less, but greater than three months, at the time of acquisition and are stated at amortized cost, which approximates fair value;
• Also, mortgage loans on real estate are carried at unpaid principal balances, adjusted for any unamortized premiums or discounts and deferred fees or expenses, net of valuation allowances;
• Policy loans are carried at unpaid principal balances; • Real estate joint ventures and other limited partnership interests are carried using the equity method of accounting; and • Other invested assets consist principally of derivatives with positive fair values. Derivatives are carried at fair value with changes in
fair value reflected in income from non-qualifying derivatives and derivatives in fair value hedging relationships. Derivatives in cash flow hedging relationships are reflected as a separate component of OCI.
Investments not carried at fair value on our consolidated financial statements, principally, mortgage loans, policy loans and real estate, may have fair values that are substantially higher or lower than the carrying value reflected on our consolidated financial statements. In
30
addition, unrealized losses are not reflected in net income unless we realize the losses by either selling the security at below amortized cost or determine that the decline in fair value is deemed to be other-than-temporary (i.e., impaired). Each of such asset classes is regularly evaluated for impairment under the accounting guidance appropriate to the respective asset class. Competition Intense competition could negatively affect our ability to maintain or increase our profitability. Our businesses are intensely competitive. We compete based on a number of factors, including name recognition, service, the quality of investment advice, investment performance, product features, price, perceived financial strength and claims-paying and credit ratings. Our competitors include insurers, broker-dealers, financial advisors, asset managers, hedge funds and other financial institutions. A number of our business units face competitors that have greater market share, offer a broader range of products or have higher financial strength or credit ratings than we do. In recent years, there has been consolidation and convergence among companies in the financial services industry resulting in increased competition from large, well-capitalized financial services firms. Many of these firms also have been able to increase their distribution systems through mergers or contractual arrangements. Furthermore, larger competitors may have lower operating costs and an ability to absorb greater risk while maintaining their financial strength ratings, thereby allowing them to price their products more competitively. Our sales representatives are not captive and may sell products of our competitors. We sell our annuity and life insurance products through independent sales representatives. These representatives are not captive, which means they may also sell our competitors’ products. If our competitors offer products that are more attractive than ours, or pay higher commission rates to the sales representatives than we do, these representatives may concentrate their efforts in selling our competitors’ products instead of ours. Item 1B. Unresolved Staff Comments None. Item 2. Properties As of December 31, 2016, LNC and our subsidiaries owned or leased approximately 2.7 million square feet of office and other space. We leased 0.1 million square feet of office space in Philadelphia, Pennsylvania, which includes space for LFN. We leased 0.2 million square feet of office space in Radnor, Pennsylvania for our corporate center and for LFD. We owned or leased 0.8 million square feet of office space in Fort Wayne, Indiana, primarily for our Annuities and Retirement Plan Services segments. We owned or leased 0.8 million square feet of office space in Greensboro, North Carolina, primarily for our Life Insurance segment. We owned or leased 0.3 million square feet of office space in Omaha, Nebraska, and 0.1 million square feet of office space in Atlanta, Georgia, primarily for our Group Protection segment. An additional 0.4 million square feet of office space is owned or leased in other U.S. cities for branch offices. As provided in Note 13, the rental expense on operating leases for office space and equipment was $44 million for 2016. This discussion regarding properties does not include information on field offices and investment properties. Item 3. Legal Proceedings For information regarding legal proceedings, see “Regulatory and Litigation Matters” in Note 13, which is incorporated herein by reference. Item 4. Mine Safety Disclosures Not applicable.
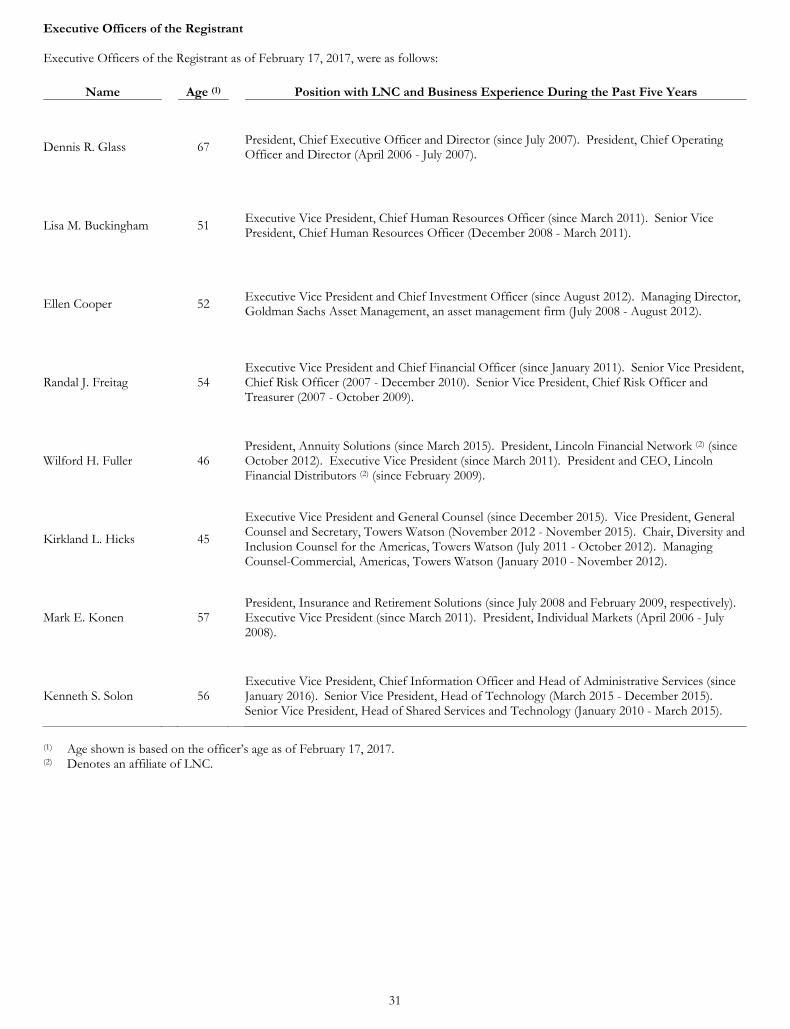
31
Executive Officers of the Registrant
Executive Officers of the Registrant as of February 17, 2017, were as follows:
Name Age (1) Position with LNC and Business Experience During the Past Five Years
Dennis R. Glass 67 President, Chief Executive Officer and Director (since July 2007). President, Chief Operating Officer and Director (April 2006 - July 2007).
Lisa M. Buckingham 51 Executive Vice President, Chief Human Resources Officer (since March 2011). Senior Vice President, Chief Human Resources Officer (December 2008 - March 2011).
Ellen Cooper 52 Executive Vice President and Chief Investment Officer (since August 2012). Managing Director, Goldman Sachs Asset Management, an asset management firm (July 2008 - August 2012).
Randal J. Freitag 54 Executive Vice President and Chief Financial Officer (since January 2011). Senior Vice President, Chief Risk Officer (2007 - December 2010). Senior Vice President, Chief Risk Officer and Treasurer (2007 - October 2009).
Wilford H. Fuller 46 President, Annuity Solutions (since March 2015). President, Lincoln Financial Network (2) (since October 2012). Executive Vice President (since March 2011). President and CEO, Lincoln Financial Distributors (2) (since February 2009).
Kirkland L. Hicks 45
Executive Vice President and General Counsel (since December 2015). Vice President, General Counsel and Secretary, Towers Watson (November 2012 - November 2015). Chair, Diversity and Inclusion Counsel for the Americas, Towers Watson (July 2011 - October 2012). Managing Counsel-Commercial, Americas, Towers Watson (January 2010 - November 2012).
Mark E. Konen 57 President, Insurance and Retirement Solutions (since July 2008 and February 2009, respectively). Executive Vice President (since March 2011). President, Individual Markets (April 2006 - July 2008).
Kenneth S. Solon 56 Executive Vice President, Chief Information Officer and Head of Administrative Services (since January 2016). Senior Vice President, Head of Technology (March 2015 - December 2015). Senior Vice President, Head of Shared Services and Technology (January 2010 - March 2015).
(1) Age shown is based on the officer’s age as of February 17, 2017. (2) Denotes an affiliate of LNC.
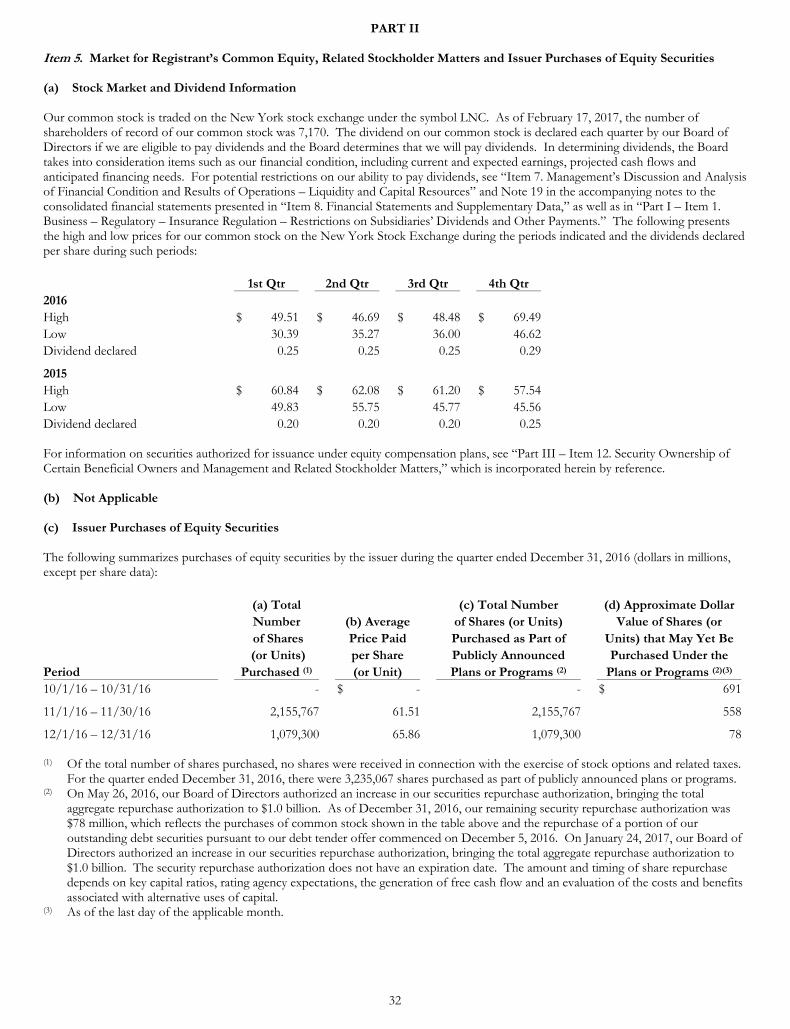
32
PART II
Item 5. Market for Registrant’s Common Equity, Related Stockholder Matters and Issuer Purchases of Equity Securities (a) Stock Market and Dividend Information Our common stock is traded on the New York stock exchange under the symbol LNC. As of February 17, 2017, the number of shareholders of record of our common stock was 7,170. The dividend on our common stock is declared each quarter by our Board of Directors if we are eligible to pay dividends and the Board determines that we will pay dividends. In determining dividends, the Board takes into consideration items such as our financial condition, including current and expected earnings, projected cash flows and anticipated financing needs. For potential restrictions on our ability to pay dividends, see “Item 7. Management’s Discussion and Analysis of Financial Condition and Results of Operations – Liquidity and Capital Resources” and Note 19 in the accompanying notes to the consolidated financial statements presented in “Item 8. Financial Statements and Supplementary Data,” as well as in “Part I – Item 1. Business – Regulatory – Insurance Regulation – Restrictions on Subsidiaries’ Dividends and Other Payments.” The following presents the high and low prices for our common stock on the New York Stock Exchange during the periods indicated and the dividends declared per share during such periods:
1st Qtr 2nd Qtr 3rd Qtr 4th Qtr 2016 High $ 49.51 $ 46.69 $ 48.48 $ 69.49 Low 30.39 35.27 36.00 46.62 Dividend declared 0.25 0.25 0.25 0.29
2015 High $ 60.84 $ 62.08 $ 61.20 $ 57.54 Low 49.83 55.75 45.77 45.56 Dividend declared 0.20 0.20 0.20 0.25 For information on securities authorized for issuance under equity compensation plans, see “Part III – Item 12. Security Ownership of Certain Beneficial Owners and Management and Related Stockholder Matters,” which is incorporated herein by reference. (b) Not Applicable (c) Issuer Purchases of Equity Securities The following summarizes purchases of equity securities by the issuer during the quarter ended December 31, 2016 (dollars in millions, except per share data):
(a) Total (c) Total Number (d) Approximate Dollar Number (b) Average of Shares (or Units) Value of Shares (or of Shares Price Paid Purchased as Part of Units) that May Yet Be (or Units) per Share Publicly Announced Purchased Under the Period Purchased (1) (or Unit) Plans or Programs (2) Plans or Programs (2)(3) 10/1/16 – 10/31/16 - $ - - $ 691
11/1/16 – 11/30/16 2,155,767 61.51 2,155,767 558
12/1/16 – 12/31/16 1,079,300 65.86 1,079,300 78 (1) Of the total number of shares purchased, no shares were received in connection with the exercise of stock options and related taxes.
For the quarter ended December 31, 2016, there were 3,235,067 shares purchased as part of publicly announced plans or programs. (2) On May 26, 2016, our Board of Directors authorized an increase in our securities repurchase authorization, bringing the total
aggregate repurchase authorization to $1.0 billion. As of December 31, 2016, our remaining security repurchase authorization was $78 million, which reflects the purchases of common stock shown in the table above and the repurchase of a portion of our outstanding debt securities pursuant to our debt tender offer commenced on December 5, 2016. On January 24, 2017, our Board of Directors authorized an increase in our securities repurchase authorization, bringing the total aggregate repurchase authorization to $1.0 billion. The security repurchase authorization does not have an expiration date. The amount and timing of share repurchase depends on key capital ratios, rating agency expectations, the generation of free cash flow and an evaluation of the costs and benefits associated with alternative uses of capital.
(3) As of the last day of the applicable month.
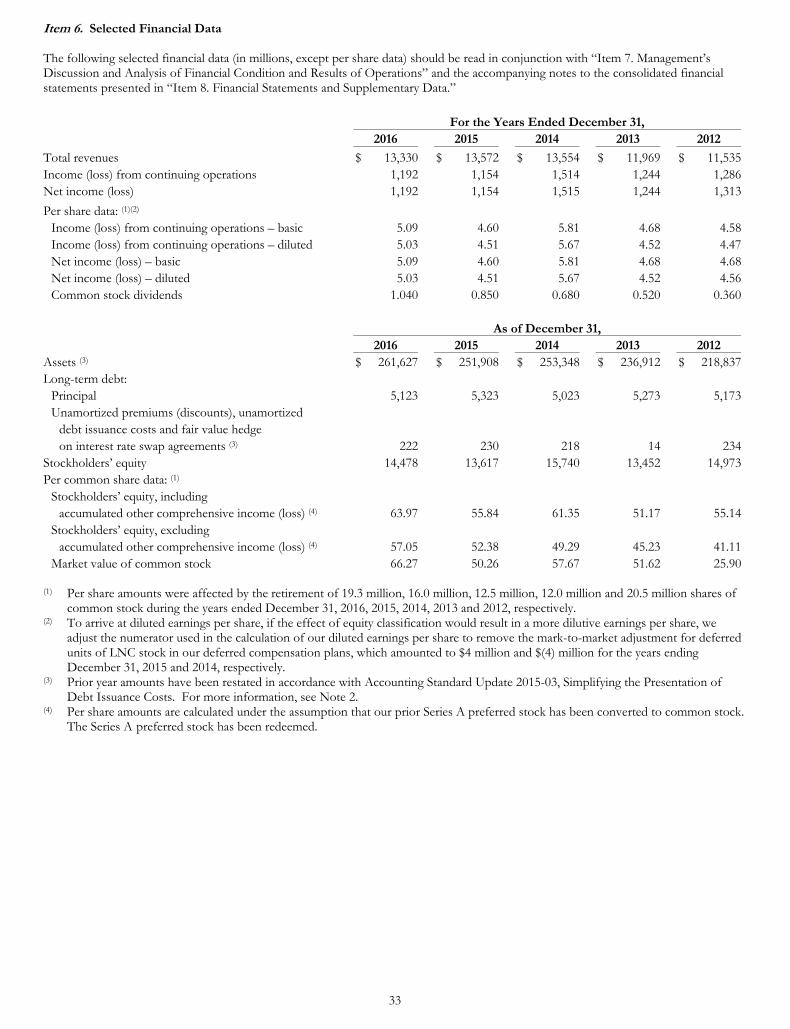
33
Item 6. Selected Financial Data The following selected financial data (in millions, except per share data) should be read in conjunction with “Item 7. Management’s Discussion and Analysis of Financial Condition and Results of Operations” and the accompanying notes to the consolidated financial statements presented in “Item 8. Financial Statements and Supplementary Data.”
For the Years Ended December 31, 2016 2015 2014 2013 2012
Total revenues $ 13,330 $ 13,572 $ 13,554 $ 11,969 $ 11,535Income (loss) from continuing operations 1,192 1,154 1,514 1,244 1,286Net income (loss) 1,192 1,154 1,515 1,244 1,313
Per share data: (1)(2) Income (loss) from continuing operations – basic 5.09 4.60 5.81 4.68 4.58Income (loss) from continuing operations – diluted 5.03 4.51 5.67 4.52 4.47Net income (loss) – basic 5.09 4.60 5.81 4.68 4.68Net income (loss) – diluted 5.03 4.51 5.67 4.52 4.56Common stock dividends 1.040 0.850 0.680 0.520 0.360
As of December 31, 2016 2015 2014 2013 2012 Assets (3) $ 261,627 $ 251,908 $ 253,348 $ 236,912 $ 218,837Long-term debt:
Principal 5,123 5,323 5,023 5,273 5,173Unamortized premiums (discounts), unamortized
debt issuance costs and fair value hedge on interest rate swap agreements (3) 222 230 218 14 234
Stockholders’ equity 14,478 13,617 15,740 13,452 14,973Per common share data: (1)
Stockholders’ equity, including accumulated other comprehensive income (loss) (4) 63.97 55.84 61.35 51.17 55.14
Stockholders’ equity, excluding accumulated other comprehensive income (loss) (4) 57.05 52.38 49.29 45.23 41.11
Market value of common stock 66.27 50.26 57.67 51.62 25.90 (1) Per share amounts were affected by the retirement of 19.3 million, 16.0 million, 12.5 million, 12.0 million and 20.5 million shares of
common stock during the years ended December 31, 2016, 2015, 2014, 2013 and 2012, respectively. (2) To arrive at diluted earnings per share, if the effect of equity classification would result in a more dilutive earnings per share, we
adjust the numerator used in the calculation of our diluted earnings per share to remove the mark-to-market adjustment for deferred units of LNC stock in our deferred compensation plans, which amounted to $4 million and $(4) million for the years ending December 31, 2015 and 2014, respectively.
(3) Prior year amounts have been restated in accordance with Accounting Standard Update 2015-03, Simplifying the Presentation of Debt Issuance Costs. For more information, see Note 2.
(4) Per share amounts are calculated under the assumption that our prior Series A preferred stock has been converted to common stock. The Series A preferred stock has been redeemed.
34
Item 7. Management’s Discussion and Analysis of Financial Condition and Results of Operations The following Management’s Discussion and Analysis (“MD&A”) is intended to help the reader understand the financial condition as of December 31, 2016, compared with December 31, 2015, and the results of operations in 2016 and 2015, compared with the immediately preceding year of Lincoln National Corporation and its consolidated subsidiaries. Unless otherwise stated or the context otherwise requires, “LNC,” “Company,” “we,” “our” or “us” refers to Lincoln National Corporation and its consolidated subsidiaries. The MD&A is provided as a supplement to, and should be read in conjunction with our consolidated financial statements and the accompanying notes to the consolidated financial statements (“Notes”) presented in “Part II – Item 8. Financial Statements and Supplementary Data,” as well as “Part I – Item 1A. Risk Factors” above. In this report, in addition to providing consolidated revenues and net income (loss), we also provide segment operating revenues and income (loss) from operations because we believe they are meaningful measures of revenues and the profitability of our operating segments. Financial information that follows is presented in accordance with United States of America generally accepted accounting principles (“GAAP”), unless otherwise indicated. See Note 1 for a discussion of GAAP. Operating revenues and income (loss) from operations are the financial performance measures we use to evaluate and assess the results of our segments. Accordingly, we define and report operating revenues and income (loss) from operations by segment in Note 21. Our management believes that operating revenues and income (loss) from operations explain the results of our ongoing businesses in a manner that allows for a better understanding of the underlying trends in our current businesses because the excluded items are unpredictable and not necessarily indicative of current operating fundamentals or future performance of the business segments, and, in many instances, decisions regarding these items do not necessarily relate to the operations of the individual segments. In addition, we believe that our definitions of operating revenues and income (loss) from operations will provide investors with a more valuable measure of our performance because it better reveals trends in our business.
FORWARD-LOOKING STATEMENTS – CAUTIONARY LANGUAGE
Certain statements made in this report and in other written or oral statements made by us or on our behalf are “forward-looking statements” within the meaning of the Private Securities Litigation Reform Act of 1995 (“PSLRA”). A forward-looking statement is a statement that is not a historical fact and, without limitation, includes any statement that may predict, forecast, indicate or imply future results, performance or achievements, and may contain words like: “believe,” “anticipate,” “expect,” “estimate,” “project,” “will,” “shall” and other words or phrases with similar meaning in connection with a discussion of future operating or financial performance. In particular, these include statements relating to future actions, trends in our businesses, prospective services or products, future performance or financial results and the outcome of contingencies, such as legal proceedings. We claim the protection afforded by the safe harbor for forward-looking statements provided by the PSLRA. Forward-looking statements involve risks and uncertainties that may cause actual results to differ materially from the results contained in the forward-looking statements. Risks and uncertainties that may cause actual results to vary materially, some of which are described within the forward-looking statements, include, among others: • Deterioration in general economic and business conditions that may affect account values, investment results, guaranteed benefit
liabilities, premium levels, claims experience and the level of pension benefit costs, funding and investment results; • Adverse global capital and credit market conditions could affect our ability to raise capital, if necessary, and may cause us to realize
impairments on investments and certain intangible assets, including goodwill and the valuation allowance against deferred tax assets, which may reduce future earnings and/or affect our financial condition and ability to raise additional capital or refinance existing debt as it matures;
• Because of our holding company structure, the inability of our subsidiaries to pay dividends to the holding company in sufficient amounts could harm the holding company’s ability to meet its obligations;
• Legislative, regulatory or tax changes, both domestic and foreign, that affect: the cost of, or demand for, our subsidiaries’ products, the required amount of reserves and/or surplus, our ability to conduct business and our captive reinsurance arrangements as well as restrictions on revenue sharing and 12b-1 payments, the potential for U.S. federal tax reform and the effect of the Department of Labor’s (“DOL”) regulation defining fiduciary;
• Actions taken by reinsurers to raise rates on in-force business; • Declines in or sustained low interest rates causing a reduction in investment income, the interest margins of our businesses, estimated
gross profits (“EGPs”) and demand for our products; • Rapidly increasing interest rates causing contract holders to surrender life insurance and annuity policies, thereby causing realized
investment losses, and reduced hedge performance related to variable annuities; • Uncertainty about the effect of continuing promulgation and implementation of rules and regulations under the Dodd-Frank Wall
Street Reform and Consumer Protection Act on us and the economy and financial services sector in particular; • The initiation of legal or regulatory proceedings against us, and the outcome of any legal or regulatory proceedings, such as: adverse
actions related to present or past business practices common in businesses in which we compete; adverse decisions in significant actions including, but not limited to, actions brought by federal and state authorities and class action cases; new decisions that result in changes in law; and unexpected trial court rulings;
• A decline in the equity markets causing a reduction in the sales of our subsidiaries’ products, a reduction of asset-based fees that our subsidiaries charge on various investment and insurance products, an acceleration of the net amortization of deferred acquisition
35
costs (“DAC”), value of business acquired (“VOBA”), deferred sales inducements (“DSI”) and deferred front-end loads (“DFEL”) and an increase in liabilities related to guaranteed benefit features of our subsidiaries’ variable annuity products;
• Ineffectiveness of our risk management policies and procedures, including various hedging strategies used to offset the effect of changes in the value of liabilities due to changes in the level and volatility of the equity markets and interest rates;
• A deviation in actual experience regarding future persistency, mortality, morbidity, interest rates or equity market returns from the assumptions used in pricing our subsidiaries’ products, in establishing related insurance reserves and in the net amortization of DAC, VOBA, DSI and DFEL, which may reduce future earnings;
• Changes in GAAP that may result in unanticipated changes to our net income; • Lowering of one or more of our debt ratings issued by nationally recognized statistical rating organizations and the adverse effect
such action may have on our ability to raise capital and on our liquidity and financial condition; • Lowering of one or more of the insurer financial strength ratings of our insurance subsidiaries and the adverse effect such action may
have on the premium writings, policy retention, profitability of our insurance subsidiaries and liquidity; • Significant credit, accounting, fraud, corporate governance or other issues that may adversely affect the value of certain investments
in our portfolios, as well as counterparties to which we are exposed to credit risk, requiring that we realize losses on investments; • Inability to protect our intellectual property rights or claims of infringement of the intellectual property rights of others; • Interruption in telecommunication, information technology or other operational systems or failure to safeguard the confidentiality or
privacy of sensitive data on such systems from cyberattacks or other breaches of our data security systems; • The effect of acquisitions and divestitures, restructurings, product withdrawals and other unusual items; • The adequacy and collectability of reinsurance that we have purchased; • Acts of terrorism, a pandemic, war or other man-made and natural catastrophes that may adversely affect our businesses and the cost
and availability of reinsurance; • Competitive conditions, including pricing pressures, new product offerings and the emergence of new competitors, that may affect
the level of premiums and fees that our subsidiaries can charge for their products; • The unknown effect on our subsidiaries’ businesses resulting from changes in the demographics of their client base, as aging baby-
boomers move from the asset-accumulation stage to the asset-distribution stage of life; and • The unanticipated loss of key management, financial planners or wholesalers.
The risks included here are not exhaustive. Other sections of this report, quarterly reports on Form 10-Q, current reports on Form 8-K and other documents filed with the Securities and Exchange Commission (“SEC”) include additional factors that could affect our businesses and financial performance, including “Part I – Item 1A. Risk Factors” and “Item 7A. Quantitative and Qualitative Disclosures About Market Risk,” which are incorporated herein by reference. Moreover, we operate in a rapidly changing and competitive environment. New risk factors emerge from time to time, and it is not possible for management to predict all such risk factors. Further, it is not possible to assess the effect of all risk factors on our businesses or the extent to which any factor, or combination of factors, may cause actual results to differ materially from those contained in any forward-looking statements. Given these risks and uncertainties, investors should not place undue reliance on forward-looking statements as a prediction of actual results. In addition, we disclaim any obligation to update any forward-looking statements to reflect events or circumstances that occur after the date of this report.
INTRODUCTION
Executive Summary We are a holding company that operates multiple insurance and retirement businesses through subsidiary companies. Through our business segments, we sell a wide range of wealth protection, accumulation and retirement income products and solutions. These products include fixed and indexed annuities, variable annuities, universal life insurance (“UL”), variable universal life insurance (“VUL”), linked-benefit UL, indexed universal life insurance (“IUL”), term life insurance, employer-sponsored retirement plans and services, and group life, disability and dental. We provide products and services and report results through our Annuities, Retirement Plan Services, Life Insurance and Group Protection segments. We also have Other Operations. These segments and Other Operations are described in “Part I – Item 1. Business” above. For information on how we derive our revenues, see the discussion in results of operations by segment below.
36
Industry Trends We continue to be influenced by a variety of trends that affect the industry. Financial and Economic Environment The level of long-term interest rates and the shape of the yield curve can have a negative effect on the demand for and the profitability of spread-based products such as fixed annuities and UL. Low long-term rates can also increase the cost of providing variable annuity living benefit guarantees. A flat or inverted yield curve and low long-term interest rates are affecting new money rates on corporate bonds. Equity market performance can also affect the profitability of life insurers, as product demand and fee income from variable annuities and fee income from pension products tied to separate account balances often reflect equity market performance. Insurance premium growth, with respect to group life and disability products, for example, is closely tied to employers’ total payroll growth. Additionally, the potential market for these products is expanded by new business creation. Although improvements in the labor and inflation market conditions occurred during 2016, concerns about the tightening of U.S. monetary policy and its impact on growth and credit market fundamentals remain. The Federal Reserve’s forecast for 2017, as reported in December of 2016, indicated that economic activity will grow at an approximate rate of 2% over the next year, labor market indicators will remain firm and inflation will begin to near its target of 2%. Additionally, the Federal Reserve increased the Federal Funds Target Rate by 25 basis points in December 2016 for the second time in the past year and indicated that any future rate increases would be gradual and data dependent. Regulatory Environment U.S.-domiciled insurance entities are regulated at the state level, while certain products and services are also subject to federal regulation. Regulators may refine capital requirements and introduce new reserving standards for the life insurance industry. For example, the National Association of Insurance Commissioner’s (“NAIC”) adoption of the new Valuation Manual that defines principles-based reserving for newly issued life insurance policies is effective January 1, 2017. Principles-based reserving will place a greater weight on our past experience and anticipated future experience as well as consider current economic conditions in calculating life insurance product (i.e., term and UL) reserves in accordance with statutory accounting principles. Regulations recently adopted or currently under review can potentially affect the capital requirements and profitability of the industry and result in increased regulation and oversight for the industry. Recently, there has been significant focus on the DOL’s final fiduciary advice regulation released April 8, 2016, which has the potential of requiring us to change the way we deliver products and services and could impact the sales or margins of some of our products, especially variable and fixed indexed annuities. We believe that we can, if necessary, reallocate capital to share buybacks to blunt the near-term effect on earnings per share if there is a sales disruption. See “Part I – Item 1. Business – Regulatory” for a discussion of the potential effects of regulatory changes on our industry. Demographics In the coming decade, a key driver shaping the actions of the insurance industry will be the escalation of income protection and wealth accumulation goals and needs of the retiring baby-boomers. As a result of increasing longevity, retirees will need to accumulate sufficient savings to finance retirements that may span 30 or more years. Helping the baby-boomers to accumulate assets for retirement and subsequently to convert these assets into retirement income represents an opportunity for the insurance industry. Moreover, the insurance industry’s products, and the needs they are designed to address, are complex. We believe that individuals approaching retirement age will need to seek information to plan for and manage their retirements. In the workplace, as employees take greater responsibility for their benefit options and retirement planning, they will need information about their possible individual needs. One of the challenges for the insurance industry will be the delivery of this information in a cost effective manner. Competitive Environment See the “Competition” sections for each of our segments in “Part 1 – Business – Business Segments and Other Operations” for discussion of the competitive environment in which we operate. Significant Operational Matters Strategic Digitization Initiative We continue to make strategic investments in our businesses to grow revenues, further spur productivity and improve our efficiency and service to our customers. These efforts include an enterprise-wide digitization initiative that intends to significantly enhance our customer experience and provide operational efficiencies over time to meet evolving consumer preferences and marketplace shifts. We expect to incur annual net costs of approximately $40 million, pre-tax, in Other Operations, during the first two years of this initiative. We expect our digitization initiative will provide an opportunity for meaningful cost savings over the next four to five years.
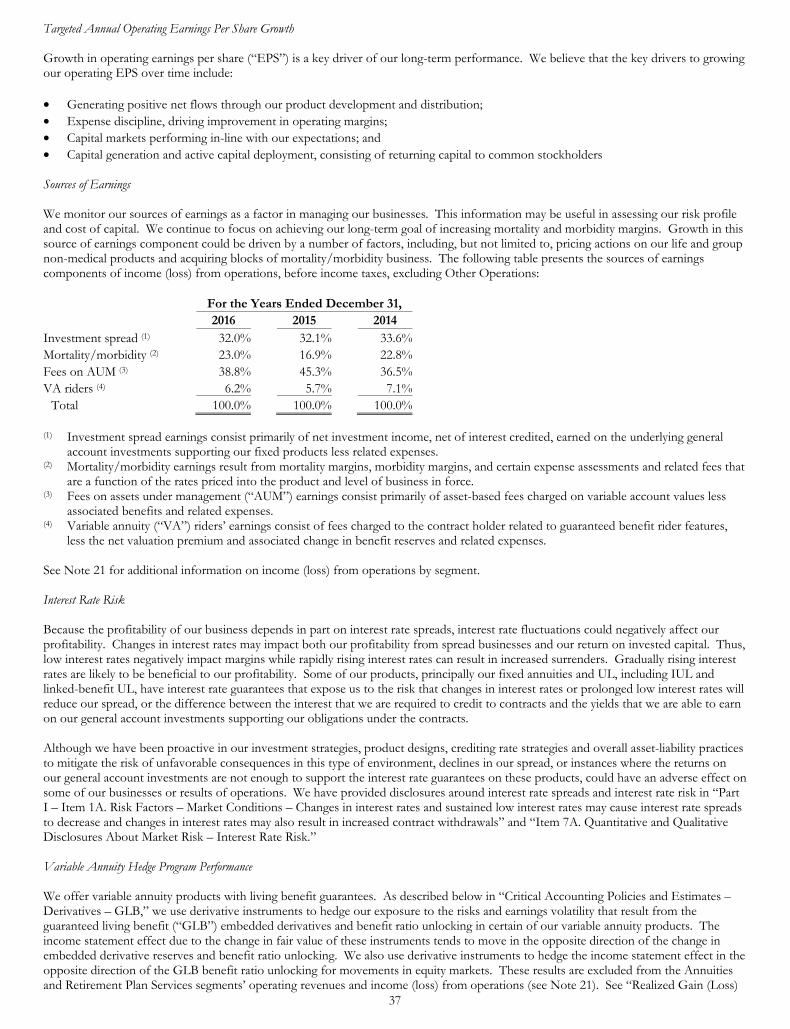
37
Targeted Annual Operating Earnings Per Share Growth Growth in operating earnings per share (“EPS”) is a key driver of our long-term performance. We believe that the key drivers to growing our operating EPS over time include: • Generating positive net flows through our product development and distribution; • Expense discipline, driving improvement in operating margins; • Capital markets performing in-line with our expectations; and • Capital generation and active capital deployment, consisting of returning capital to common stockholders
Sources of Earnings We monitor our sources of earnings as a factor in managing our businesses. This information may be useful in assessing our risk profile and cost of capital. We continue to focus on achieving our long-term goal of increasing mortality and morbidity margins. Growth in this source of earnings component could be driven by a number of factors, including, but not limited to, pricing actions on our life and group non-medical products and acquiring blocks of mortality/morbidity business. The following table presents the sources of earnings components of income (loss) from operations, before income taxes, excluding Other Operations:
For the Years Ended December 31, 2016 2015 2014 Investment spread (1) 32.0% 32.1% 33.6% Mortality/morbidity (2) 23.0% 16.9% 22.8% Fees on AUM (3) 38.8% 45.3% 36.5% VA riders (4) 6.2% 5.7% 7.1%
Total 100.0% 100.0% 100.0% (1) Investment spread earnings consist primarily of net investment income, net of interest credited, earned on the underlying general
account investments supporting our fixed products less related expenses. (2) Mortality/morbidity earnings result from mortality margins, morbidity margins, and certain expense assessments and related fees that
are a function of the rates priced into the product and level of business in force. (3) Fees on assets under management (“AUM”) earnings consist primarily of asset-based fees charged on variable account values less
associated benefits and related expenses. (4) Variable annuity (“VA”) riders’ earnings consist of fees charged to the contract holder related to guaranteed benefit rider features,
less the net valuation premium and associated change in benefit reserves and related expenses. See Note 21 for additional information on income (loss) from operations by segment. Interest Rate Risk Because the profitability of our business depends in part on interest rate spreads, interest rate fluctuations could negatively affect our profitability. Changes in interest rates may impact both our profitability from spread businesses and our return on invested capital. Thus, low interest rates negatively impact margins while rapidly rising interest rates can result in increased surrenders. Gradually rising interest rates are likely to be beneficial to our profitability. Some of our products, principally our fixed annuities and UL, including IUL and linked-benefit UL, have interest rate guarantees that expose us to the risk that changes in interest rates or prolonged low interest rates will reduce our spread, or the difference between the interest that we are required to credit to contracts and the yields that we are able to earn on our general account investments supporting our obligations under the contracts. Although we have been proactive in our investment strategies, product designs, crediting rate strategies and overall asset-liability practices to mitigate the risk of unfavorable consequences in this type of environment, declines in our spread, or instances where the returns on our general account investments are not enough to support the interest rate guarantees on these products, could have an adverse effect on some of our businesses or results of operations. We have provided disclosures around interest rate spreads and interest rate risk in “Part I – Item 1A. Risk Factors – Market Conditions – Changes in interest rates and sustained low interest rates may cause interest rate spreads to decrease and changes in interest rates may also result in increased contract withdrawals” and “Item 7A. Quantitative and Qualitative Disclosures About Market Risk – Interest Rate Risk.” Variable Annuity Hedge Program Performance We offer variable annuity products with living benefit guarantees. As described below in “Critical Accounting Policies and Estimates – Derivatives – GLB,” we use derivative instruments to hedge our exposure to the risks and earnings volatility that result from the guaranteed living benefit (“GLB”) embedded derivatives and benefit ratio unlocking in certain of our variable annuity products. The income statement effect due to the change in fair value of these instruments tends to move in the opposite direction of the change in embedded derivative reserves and benefit ratio unlocking. We also use derivative instruments to hedge the income statement effect in the opposite direction of the GLB benefit ratio unlocking for movements in equity markets. These results are excluded from the Annuities and Retirement Plan Services segments’ operating revenues and income (loss) from operations (see Note 21). See “Realized Gain (Loss)
38
and Benefit Ratio Unlocking – Variable Annuity Net Derivatives Results” below for information on our methodology for calculating the non-performance risk (“NPR”), which affects the discount rate used in the calculation of the GLB embedded derivative reserves. We also offer variable annuity products with death benefit guarantees. As described below in “Critical Accounting Policies and Estimates – Future Contract Benefits and Other Contract Holder Obligations – GDB,” we use derivative instruments to hedge the income statement effect of the guaranteed death benefit (“GDB”) benefit ratio unlocking for movements in equity markets. These results are excluded from income (loss) from operations (see Note 21). The costs of derivative instruments that we use to hedge these variable annuity products may increase as a result of the low interest rate environment. Earnings from Account Values The Annuities and Retirement Plan Services segments are the most sensitive to the equity markets, as well as, to a lesser extent, our Life Insurance segment. We discuss the earnings effect of the equity markets on account values and the related asset-based earnings below in “Item 7A. Quantitative and Qualitative Disclosures About Market Risk – Equity Market Risk – Effect of Equity Market Sensitivity.” Account values increased $9.8 billion during 2016 driven primarily by an increase in equity markets and positive net flows. Issues and Outlook Going into 2017, significant issues include: • Ongoing actions by government and regulatory authorities to introduce regulations or change existing regulations or guidance, such
as the DOL fiduciary advice regulation discussed above, in a manner that could have a significant effect on our capital, earnings and/or business models;
• Overall market uncertainty and evolving market trends that have impacted sales of variable annuities; and • Volatility in the capital markets that could include changes in equity markets and interest rates and/or adverse credit market
conditions. In the face of these uncertainties, we expect to focus on the following: • Continuing to make investments in our businesses, primarily in technology/digitization, product innovation and distribution, to grow
revenues, drive margin expansion and reduce costs; • Utilizing our product development and distribution resources to help us respond to regulatory changes, such as the DOL fiduciary
advice regulation discussed above, and to shift our new business mix to focus on products in line with our long-term growth strategies;
• Closely monitoring ongoing activities in the legal and regulatory environment and taking an active role in the legislative and/or regulatory process;
• Closely monitoring our capital and liquidity positions taking into account changing economic conditions and monetary policy, ongoing regulatory activities regarding statutory reserves, including the adoption of principles-based reserving, and captive structures, and our capital deployment strategy;
• Continuing to explore additional financing strategies addressing the statutory reserve strain related to our term products and UL products containing secondary guarantees in order to manage our capital position effectively;
• Maintaining the flexibility to adjust the risk profile of assets within our investment portfolio; and • Managing our expenses aggressively through process improvement initiatives combined with continued financial discipline and
execution excellence throughout our operations. For additional factors that could cause actual results to differ materially from those set forth in this section, see “Part I – Item 1A. Risk Factors” and “Forward-Looking Statements – Cautionary Language” above.
Critical Accounting Policies and Estimates We have identified the accounting policies below as critical to the understanding of our results of operations and our financial condition. In applying these critical accounting policies in preparing our financial statements, management must use critical assumptions, estimates and judgments concerning future results or other developments, including the likelihood, timing or amount of one or more future events. Actual results may differ from these estimates under different assumptions or conditions. On an ongoing basis, we evaluate our assumptions, estimates and judgments based upon historical experience and various other information that we believe to be reasonable under the circumstances. For a detailed discussion of other significant accounting policies, see Note 1. DAC, VOBA, DSI and DFEL Accounting for intangible assets requires numerous assumptions, such as estimates of expected future profitability for our operations and our ability to retain existing blocks of life and annuity business in force. Our accounting policies for DAC, VOBA, DSI and DFEL affect the Annuities, Retirement Plan Services, Life Insurance and Group Protection segments.
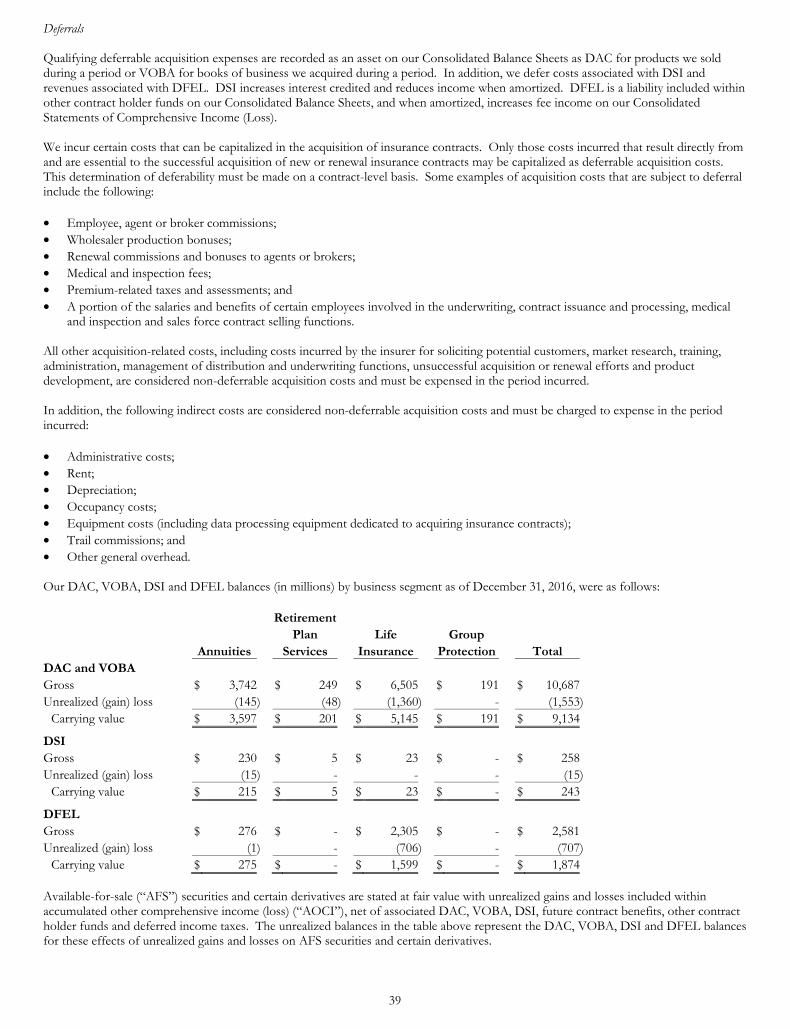
39
Deferrals Qualifying deferrable acquisition expenses are recorded as an asset on our Consolidated Balance Sheets as DAC for products we sold during a period or VOBA for books of business we acquired during a period. In addition, we defer costs associated with DSI and revenues associated with DFEL. DSI increases interest credited and reduces income when amortized. DFEL is a liability included within other contract holder funds on our Consolidated Balance Sheets, and when amortized, increases fee income on our Consolidated Statements of Comprehensive Income (Loss). We incur certain costs that can be capitalized in the acquisition of insurance contracts. Only those costs incurred that result directly from and are essential to the successful acquisition of new or renewal insurance contracts may be capitalized as deferrable acquisition costs. This determination of deferability must be made on a contract-level basis. Some examples of acquisition costs that are subject to deferral include the following: • Employee, agent or broker commissions; • Wholesaler production bonuses; • Renewal commissions and bonuses to agents or brokers; • Medical and inspection fees; • Premium-related taxes and assessments; and • A portion of the salaries and benefits of certain employees involved in the underwriting, contract issuance and processing, medical
and inspection and sales force contract selling functions. All other acquisition-related costs, including costs incurred by the insurer for soliciting potential customers, market research, training, administration, management of distribution and underwriting functions, unsuccessful acquisition or renewal efforts and product development, are considered non-deferrable acquisition costs and must be expensed in the period incurred. In addition, the following indirect costs are considered non-deferrable acquisition costs and must be charged to expense in the period incurred: • Administrative costs; • Rent; • Depreciation; • Occupancy costs; • Equipment costs (including data processing equipment dedicated to acquiring insurance contracts); • Trail commissions; and • Other general overhead. Our DAC, VOBA, DSI and DFEL balances (in millions) by business segment as of December 31, 2016, were as follows:
Retirement Plan Life Group Annuities Services Insurance Protection Total DAC and VOBA Gross $ 3,742 $ 249 $ 6,505 $ 191 $ 10,687 Unrealized (gain) loss (145) (48) (1,360) - (1,553)
Carrying value $ 3,597 $ 201 $ 5,145 $ 191 $ 9,134
DSI Gross $ 230 $ 5 $ 23 $ - $ 258 Unrealized (gain) loss (15) - - - (15)
Carrying value $ 215 $ 5 $ 23 $ - $ 243
DFEL Gross $ 276 $ - $ 2,305 $ - $ 2,581 Unrealized (gain) loss (1) - (706) - (707)
Carrying value $ 275 $ - $ 1,599 $ - $ 1,874 Available-for-sale (“AFS”) securities and certain derivatives are stated at fair value with unrealized gains and losses included within accumulated other comprehensive income (loss) (“AOCI”), net of associated DAC, VOBA, DSI, future contract benefits, other contract holder funds and deferred income taxes. The unrealized balances in the table above represent the DAC, VOBA, DSI and DFEL balances for these effects of unrealized gains and losses on AFS securities and certain derivatives.
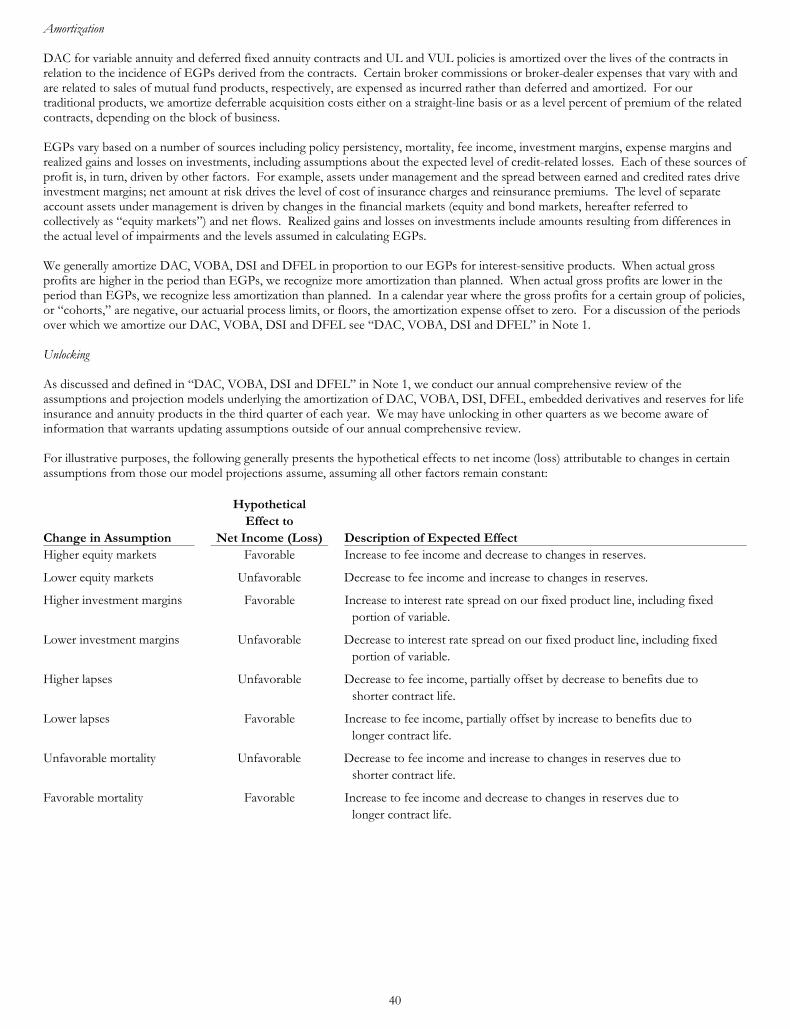
40
Amortization DAC for variable annuity and deferred fixed annuity contracts and UL and VUL policies is amortized over the lives of the contracts in relation to the incidence of EGPs derived from the contracts. Certain broker commissions or broker-dealer expenses that vary with and are related to sales of mutual fund products, respectively, are expensed as incurred rather than deferred and amortized. For our traditional products, we amortize deferrable acquisition costs either on a straight-line basis or as a level percent of premium of the related contracts, depending on the block of business. EGPs vary based on a number of sources including policy persistency, mortality, fee income, investment margins, expense margins and realized gains and losses on investments, including assumptions about the expected level of credit-related losses. Each of these sources of profit is, in turn, driven by other factors. For example, assets under management and the spread between earned and credited rates drive investment margins; net amount at risk drives the level of cost of insurance charges and reinsurance premiums. The level of separate account assets under management is driven by changes in the financial markets (equity and bond markets, hereafter referred to collectively as “equity markets”) and net flows. Realized gains and losses on investments include amounts resulting from differences in the actual level of impairments and the levels assumed in calculating EGPs. We generally amortize DAC, VOBA, DSI and DFEL in proportion to our EGPs for interest-sensitive products. When actual gross profits are higher in the period than EGPs, we recognize more amortization than planned. When actual gross profits are lower in the period than EGPs, we recognize less amortization than planned. In a calendar year where the gross profits for a certain group of policies, or “cohorts,” are negative, our actuarial process limits, or floors, the amortization expense offset to zero. For a discussion of the periods over which we amortize our DAC, VOBA, DSI and DFEL see “DAC, VOBA, DSI and DFEL” in Note 1. Unlocking As discussed and defined in “DAC, VOBA, DSI and DFEL” in Note 1, we conduct our annual comprehensive review of the assumptions and projection models underlying the amortization of DAC, VOBA, DSI, DFEL, embedded derivatives and reserves for life insurance and annuity products in the third quarter of each year. We may have unlocking in other quarters as we become aware of information that warrants updating assumptions outside of our annual comprehensive review. For illustrative purposes, the following generally presents the hypothetical effects to net income (loss) attributable to changes in certain assumptions from those our model projections assume, assuming all other factors remain constant:
Hypothetical Effect to
Change in Assumption Net Income (Loss) Description of Expected Effect Higher equity markets Favorable Increase to fee income and decrease to changes in reserves.
Lower equity markets Unfavorable Decrease to fee income and increase to changes in reserves.
Higher investment margins Favorable Increase to interest rate spread on our fixed product line, including fixed portion of variable.
Lower investment margins Unfavorable Decrease to interest rate spread on our fixed product line, including fixed portion of variable.
Higher lapses Unfavorable Decrease to fee income, partially offset by decrease to benefits due to shorter contract life.
Lower lapses Favorable Increase to fee income, partially offset by increase to benefits due to longer contract life.
Unfavorable mortality Unfavorable Decrease to fee income and increase to changes in reserves due to shorter contract life.
Favorable mortality Favorable Increase to fee income and decrease to changes in reserves due to longer contract life.
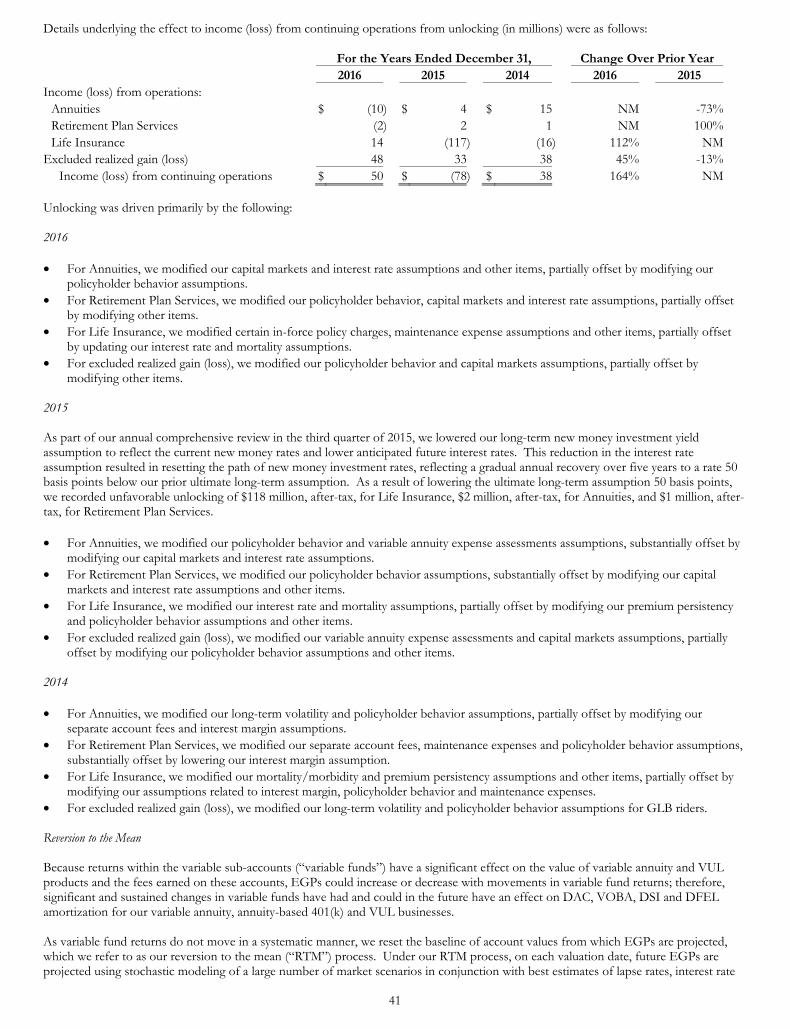
41
Details underlying the effect to income (loss) from continuing operations from unlocking (in millions) were as follows:
For the Years Ended December 31, Change Over Prior Year 2016 2015 2014 2016 2015 Income (loss) from operations:
Annuities $ (10) $ 4 $ 15 NM -73%Retirement Plan Services (2) 2 1 NM 100%Life Insurance 14 (117) (16) 112% NM
Excluded realized gain (loss) 48 33 38 45% -13%Income (loss) from continuing operations $ 50 $ (78) $ 38 164% NM
Unlocking was driven primarily by the following: 2016 • For Annuities, we modified our capital markets and interest rate assumptions and other items, partially offset by modifying our
policyholder behavior assumptions. • For Retirement Plan Services, we modified our policyholder behavior, capital markets and interest rate assumptions, partially offset
by modifying other items. • For Life Insurance, we modified certain in-force policy charges, maintenance expense assumptions and other items, partially offset
by updating our interest rate and mortality assumptions. • For excluded realized gain (loss), we modified our policyholder behavior and capital markets assumptions, partially offset by
modifying other items. 2015 As part of our annual comprehensive review in the third quarter of 2015, we lowered our long-term new money investment yield assumption to reflect the current new money rates and lower anticipated future interest rates. This reduction in the interest rate assumption resulted in resetting the path of new money investment rates, reflecting a gradual annual recovery over five years to a rate 50 basis points below our prior ultimate long-term assumption. As a result of lowering the ultimate long-term assumption 50 basis points, we recorded unfavorable unlocking of $118 million, after-tax, for Life Insurance, $2 million, after-tax, for Annuities, and $1 million, after-tax, for Retirement Plan Services. • For Annuities, we modified our policyholder behavior and variable annuity expense assessments assumptions, substantially offset by
modifying our capital markets and interest rate assumptions. • For Retirement Plan Services, we modified our policyholder behavior assumptions, substantially offset by modifying our capital
markets and interest rate assumptions and other items. • For Life Insurance, we modified our interest rate and mortality assumptions, partially offset by modifying our premium persistency
and policyholder behavior assumptions and other items. • For excluded realized gain (loss), we modified our variable annuity expense assessments and capital markets assumptions, partially
offset by modifying our policyholder behavior assumptions and other items. 2014
• For Annuities, we modified our long-term volatility and policyholder behavior assumptions, partially offset by modifying our
separate account fees and interest margin assumptions. • For Retirement Plan Services, we modified our separate account fees, maintenance expenses and policyholder behavior assumptions,
substantially offset by lowering our interest margin assumption. • For Life Insurance, we modified our mortality/morbidity and premium persistency assumptions and other items, partially offset by
modifying our assumptions related to interest margin, policyholder behavior and maintenance expenses. • For excluded realized gain (loss), we modified our long-term volatility and policyholder behavior assumptions for GLB riders. Reversion to the Mean Because returns within the variable sub-accounts (“variable funds”) have a significant effect on the value of variable annuity and VUL products and the fees earned on these accounts, EGPs could increase or decrease with movements in variable fund returns; therefore, significant and sustained changes in variable funds have had and could in the future have an effect on DAC, VOBA, DSI and DFEL amortization for our variable annuity, annuity-based 401(k) and VUL businesses. As variable fund returns do not move in a systematic manner, we reset the baseline of account values from which EGPs are projected, which we refer to as our reversion to the mean (“RTM”) process. Under our RTM process, on each valuation date, future EGPs are projected using stochastic modeling of a large number of market scenarios in conjunction with best estimates of lapse rates, interest rate
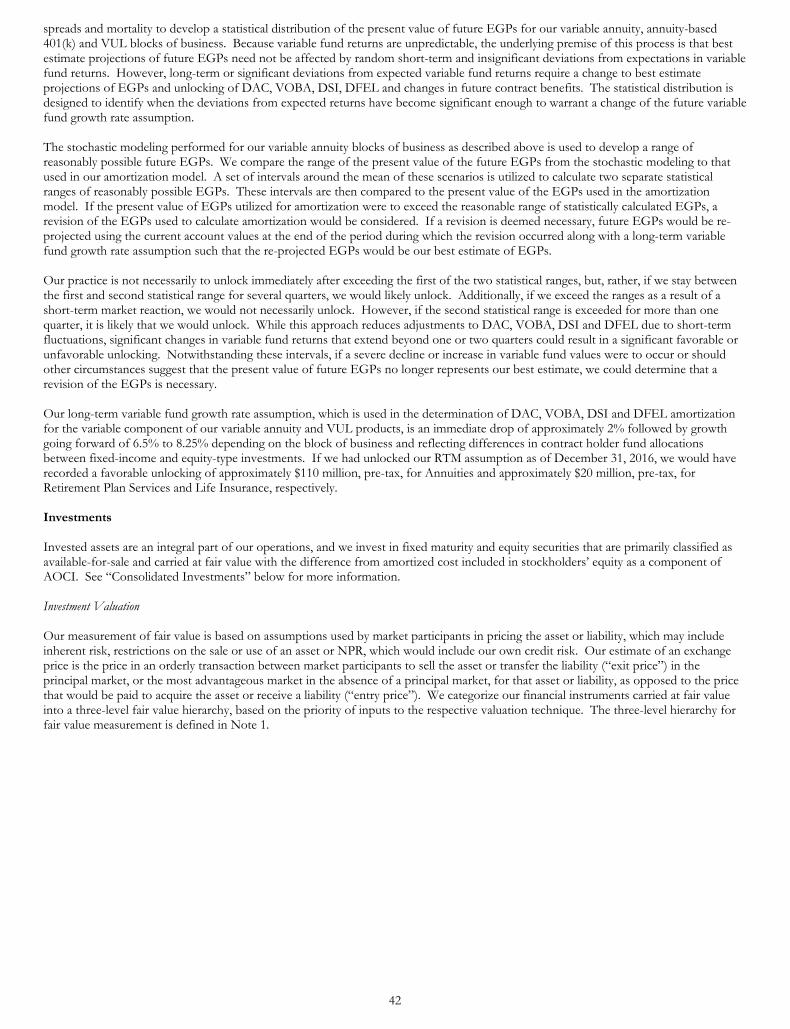
42
spreads and mortality to develop a statistical distribution of the present value of future EGPs for our variable annuity, annuity-based 401(k) and VUL blocks of business. Because variable fund returns are unpredictable, the underlying premise of this process is that best estimate projections of future EGPs need not be affected by random short-term and insignificant deviations from expectations in variable fund returns. However, long-term or significant deviations from expected variable fund returns require a change to best estimate projections of EGPs and unlocking of DAC, VOBA, DSI, DFEL and changes in future contract benefits. The statistical distribution is designed to identify when the deviations from expected returns have become significant enough to warrant a change of the future variable fund growth rate assumption. The stochastic modeling performed for our variable annuity blocks of business as described above is used to develop a range of reasonably possible future EGPs. We compare the range of the present value of the future EGPs from the stochastic modeling to that used in our amortization model. A set of intervals around the mean of these scenarios is utilized to calculate two separate statistical ranges of reasonably possible EGPs. These intervals are then compared to the present value of the EGPs used in the amortization model. If the present value of EGPs utilized for amortization were to exceed the reasonable range of statistically calculated EGPs, a revision of the EGPs used to calculate amortization would be considered. If a revision is deemed necessary, future EGPs would be re-projected using the current account values at the end of the period during which the revision occurred along with a long-term variable fund growth rate assumption such that the re-projected EGPs would be our best estimate of EGPs. Our practice is not necessarily to unlock immediately after exceeding the first of the two statistical ranges, but, rather, if we stay between the first and second statistical range for several quarters, we would likely unlock. Additionally, if we exceed the ranges as a result of a short-term market reaction, we would not necessarily unlock. However, if the second statistical range is exceeded for more than one quarter, it is likely that we would unlock. While this approach reduces adjustments to DAC, VOBA, DSI and DFEL due to short-term fluctuations, significant changes in variable fund returns that extend beyond one or two quarters could result in a significant favorable or unfavorable unlocking. Notwithstanding these intervals, if a severe decline or increase in variable fund values were to occur or should other circumstances suggest that the present value of future EGPs no longer represents our best estimate, we could determine that a revision of the EGPs is necessary. Our long-term variable fund growth rate assumption, which is used in the determination of DAC, VOBA, DSI and DFEL amortization for the variable component of our variable annuity and VUL products, is an immediate drop of approximately 2% followed by growth going forward of 6.5% to 8.25% depending on the block of business and reflecting differences in contract holder fund allocations between fixed-income and equity-type investments. If we had unlocked our RTM assumption as of December 31, 2016, we would have recorded a favorable unlocking of approximately $110 million, pre-tax, for Annuities and approximately $20 million, pre-tax, for Retirement Plan Services and Life Insurance, respectively. Investments Invested assets are an integral part of our operations, and we invest in fixed maturity and equity securities that are primarily classified as available-for-sale and carried at fair value with the difference from amortized cost included in stockholders’ equity as a component of AOCI. See “Consolidated Investments” below for more information. Investment Valuation Our measurement of fair value is based on assumptions used by market participants in pricing the asset or liability, which may include inherent risk, restrictions on the sale or use of an asset or NPR, which would include our own credit risk. Our estimate of an exchange price is the price in an orderly transaction between market participants to sell the asset or transfer the liability (“exit price”) in the principal market, or the most advantageous market in the absence of a principal market, for that asset or liability, as opposed to the price that would be paid to acquire the asset or receive a liability (“entry price”). We categorize our financial instruments carried at fair value into a three-level fair value hierarchy, based on the priority of inputs to the respective valuation technique. The three-level hierarchy for fair value measurement is defined in Note 1.
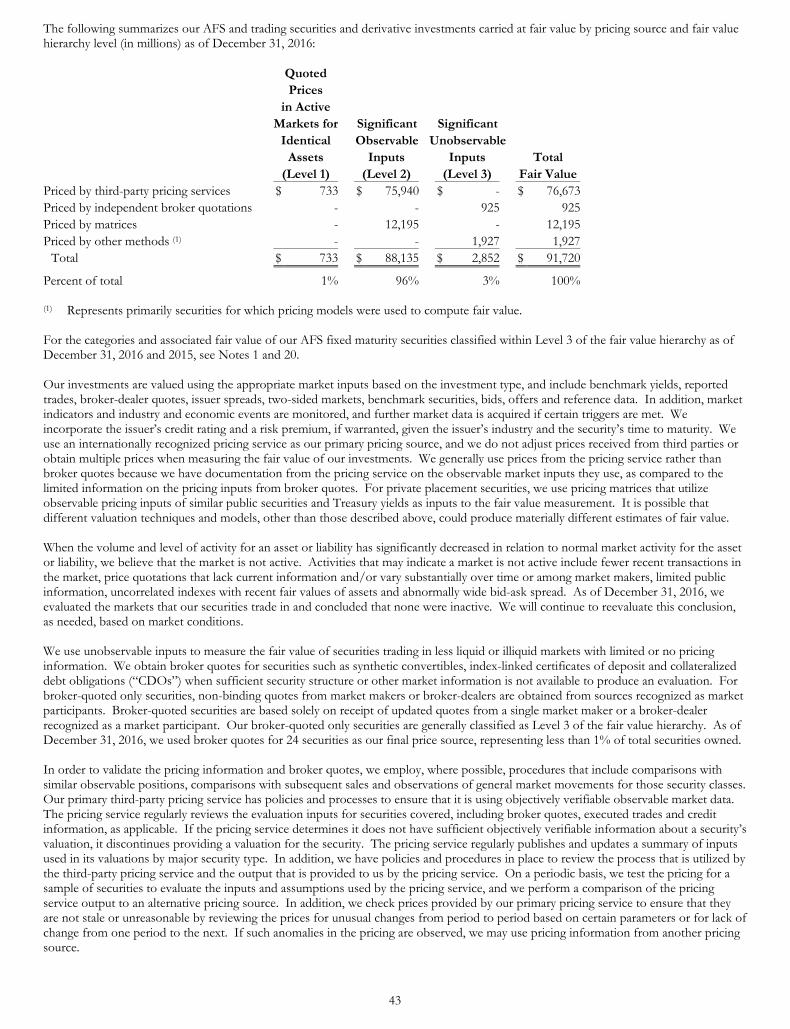
43
The following summarizes our AFS and trading securities and derivative investments carried at fair value by pricing source and fair value hierarchy level (in millions) as of December 31, 2016:
Quoted Prices in Active Markets for Significant Significant Identical Observable Unobservable Assets Inputs Inputs Total (Level 1) (Level 2) (Level 3) Fair Value Priced by third-party pricing services $ 733 $ 75,940 $ - $ 76,673 Priced by independent broker quotations - - 925 925 Priced by matrices - 12,195 - 12,195 Priced by other methods (1) - - 1,927 1,927
Total $ 733 $ 88,135 $ 2,852 $ 91,720
Percent of total 1% 96% 3% 100% (1) Represents primarily securities for which pricing models were used to compute fair value. For the categories and associated fair value of our AFS fixed maturity securities classified within Level 3 of the fair value hierarchy as of December 31, 2016 and 2015, see Notes 1 and 20. Our investments are valued using the appropriate market inputs based on the investment type, and include benchmark yields, reported trades, broker-dealer quotes, issuer spreads, two-sided markets, benchmark securities, bids, offers and reference data. In addition, market indicators and industry and economic events are monitored, and further market data is acquired if certain triggers are met. We incorporate the issuer’s credit rating and a risk premium, if warranted, given the issuer’s industry and the security’s time to maturity. We use an internationally recognized pricing service as our primary pricing source, and we do not adjust prices received from third parties or obtain multiple prices when measuring the fair value of our investments. We generally use prices from the pricing service rather than broker quotes because we have documentation from the pricing service on the observable market inputs they use, as compared to the limited information on the pricing inputs from broker quotes. For private placement securities, we use pricing matrices that utilize observable pricing inputs of similar public securities and Treasury yields as inputs to the fair value measurement. It is possible that different valuation techniques and models, other than those described above, could produce materially different estimates of fair value. When the volume and level of activity for an asset or liability has significantly decreased in relation to normal market activity for the asset or liability, we believe that the market is not active. Activities that may indicate a market is not active include fewer recent transactions in the market, price quotations that lack current information and/or vary substantially over time or among market makers, limited public information, uncorrelated indexes with recent fair values of assets and abnormally wide bid-ask spread. As of December 31, 2016, we evaluated the markets that our securities trade in and concluded that none were inactive. We will continue to reevaluate this conclusion, as needed, based on market conditions. We use unobservable inputs to measure the fair value of securities trading in less liquid or illiquid markets with limited or no pricing information. We obtain broker quotes for securities such as synthetic convertibles, index-linked certificates of deposit and collateralized debt obligations (“CDOs”) when sufficient security structure or other market information is not available to produce an evaluation. For broker-quoted only securities, non-binding quotes from market makers or broker-dealers are obtained from sources recognized as market participants. Broker-quoted securities are based solely on receipt of updated quotes from a single market maker or a broker-dealer recognized as a market participant. Our broker-quoted only securities are generally classified as Level 3 of the fair value hierarchy. As of December 31, 2016, we used broker quotes for 24 securities as our final price source, representing less than 1% of total securities owned. In order to validate the pricing information and broker quotes, we employ, where possible, procedures that include comparisons with similar observable positions, comparisons with subsequent sales and observations of general market movements for those security classes. Our primary third-party pricing service has policies and processes to ensure that it is using objectively verifiable observable market data. The pricing service regularly reviews the evaluation inputs for securities covered, including broker quotes, executed trades and credit information, as applicable. If the pricing service determines it does not have sufficient objectively verifiable information about a security’s valuation, it discontinues providing a valuation for the security. The pricing service regularly publishes and updates a summary of inputs used in its valuations by major security type. In addition, we have policies and procedures in place to review the process that is utilized by the third-party pricing service and the output that is provided to us by the pricing service. On a periodic basis, we test the pricing for a sample of securities to evaluate the inputs and assumptions used by the pricing service, and we perform a comparison of the pricing service output to an alternative pricing source. In addition, we check prices provided by our primary pricing service to ensure that they are not stale or unreasonable by reviewing the prices for unusual changes from period to period based on certain parameters or for lack of change from one period to the next. If such anomalies in the pricing are observed, we may use pricing information from another pricing source.
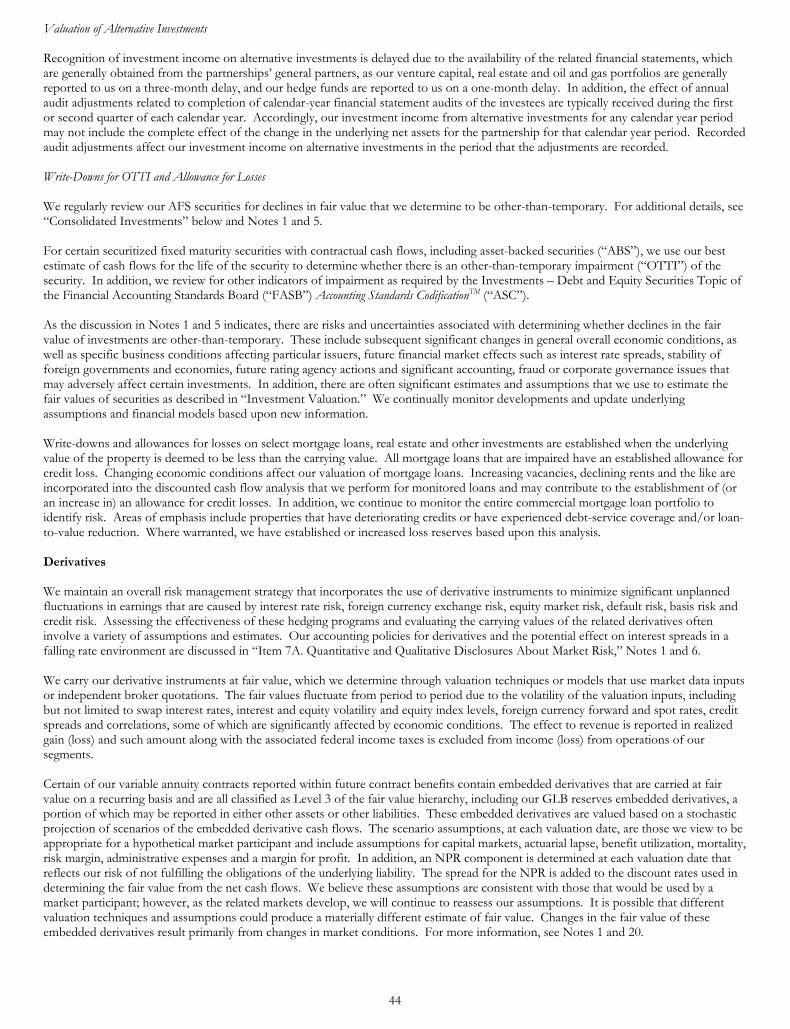
44
Valuation of Alternative Investments Recognition of investment income on alternative investments is delayed due to the availability of the related financial statements, which are generally obtained from the partnerships’ general partners, as our venture capital, real estate and oil and gas portfolios are generally reported to us on a three-month delay, and our hedge funds are reported to us on a one-month delay. In addition, the effect of annual audit adjustments related to completion of calendar-year financial statement audits of the investees are typically received during the first or second quarter of each calendar year. Accordingly, our investment income from alternative investments for any calendar year period may not include the complete effect of the change in the underlying net assets for the partnership for that calendar year period. Recorded audit adjustments affect our investment income on alternative investments in the period that the adjustments are recorded. Write-Downs for OTTI and Allowance for Losses We regularly review our AFS securities for declines in fair value that we determine to be other-than-temporary. For additional details, see “Consolidated Investments” below and Notes 1 and 5. For certain securitized fixed maturity securities with contractual cash flows, including asset-backed securities (“ABS”), we use our best estimate of cash flows for the life of the security to determine whether there is an other-than-temporary impairment (“OTTI”) of the security. In addition, we review for other indicators of impairment as required by the Investments – Debt and Equity Securities Topic of the Financial Accounting Standards Board (“FASB”) Accounting Standards CodificationTM (“ASC”). As the discussion in Notes 1 and 5 indicates, there are risks and uncertainties associated with determining whether declines in the fair value of investments are other-than-temporary. These include subsequent significant changes in general overall economic conditions, as well as specific business conditions affecting particular issuers, future financial market effects such as interest rate spreads, stability of foreign governments and economies, future rating agency actions and significant accounting, fraud or corporate governance issues that may adversely affect certain investments. In addition, there are often significant estimates and assumptions that we use to estimate the fair values of securities as described in “Investment Valuation.” We continually monitor developments and update underlying assumptions and financial models based upon new information. Write-downs and allowances for losses on select mortgage loans, real estate and other investments are established when the underlying value of the property is deemed to be less than the carrying value. All mortgage loans that are impaired have an established allowance for credit loss. Changing economic conditions affect our valuation of mortgage loans. Increasing vacancies, declining rents and the like are incorporated into the discounted cash flow analysis that we perform for monitored loans and may contribute to the establishment of (or an increase in) an allowance for credit losses. In addition, we continue to monitor the entire commercial mortgage loan portfolio to identify risk. Areas of emphasis include properties that have deteriorating credits or have experienced debt-service coverage and/or loan-to-value reduction. Where warranted, we have established or increased loss reserves based upon this analysis. Derivatives We maintain an overall risk management strategy that incorporates the use of derivative instruments to minimize significant unplanned fluctuations in earnings that are caused by interest rate risk, foreign currency exchange risk, equity market risk, default risk, basis risk and credit risk. Assessing the effectiveness of these hedging programs and evaluating the carrying values of the related derivatives often involve a variety of assumptions and estimates. Our accounting policies for derivatives and the potential effect on interest spreads in a falling rate environment are discussed in “Item 7A. Quantitative and Qualitative Disclosures About Market Risk,” Notes 1 and 6. We carry our derivative instruments at fair value, which we determine through valuation techniques or models that use market data inputs or independent broker quotations. The fair values fluctuate from period to period due to the volatility of the valuation inputs, including but not limited to swap interest rates, interest and equity volatility and equity index levels, foreign currency forward and spot rates, credit spreads and correlations, some of which are significantly affected by economic conditions. The effect to revenue is reported in realized gain (loss) and such amount along with the associated federal income taxes is excluded from income (loss) from operations of our segments. Certain of our variable annuity contracts reported within future contract benefits contain embedded derivatives that are carried at fair value on a recurring basis and are all classified as Level 3 of the fair value hierarchy, including our GLB reserves embedded derivatives, a portion of which may be reported in either other assets or other liabilities. These embedded derivatives are valued based on a stochastic projection of scenarios of the embedded derivative cash flows. The scenario assumptions, at each valuation date, are those we view to be appropriate for a hypothetical market participant and include assumptions for capital markets, actuarial lapse, benefit utilization, mortality, risk margin, administrative expenses and a margin for profit. In addition, an NPR component is determined at each valuation date that reflects our risk of not fulfilling the obligations of the underlying liability. The spread for the NPR is added to the discount rates used in determining the fair value from the net cash flows. We believe these assumptions are consistent with those that would be used by a market participant; however, as the related markets develop, we will continue to reassess our assumptions. It is possible that different valuation techniques and assumptions could produce a materially different estimate of fair value. Changes in the fair value of these embedded derivatives result primarily from changes in market conditions. For more information, see Notes 1 and 20.
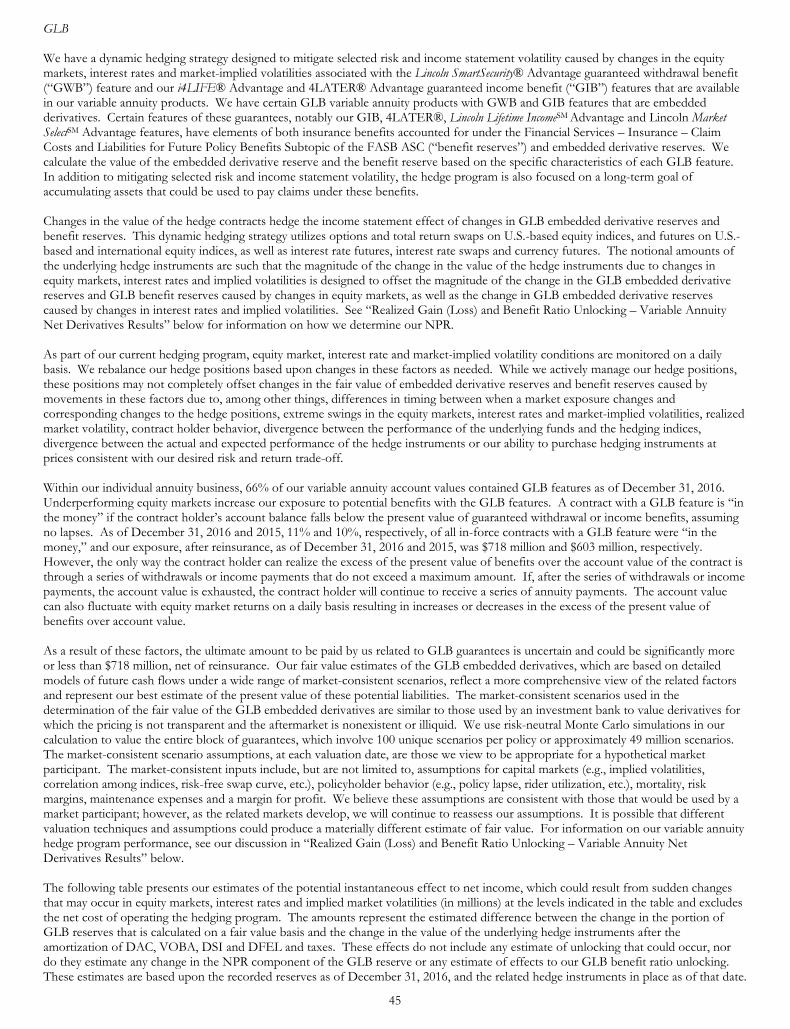
45
GLB We have a dynamic hedging strategy designed to mitigate selected risk and income statement volatility caused by changes in the equity markets, interest rates and market-implied volatilities associated with the Lincoln SmartSecurity® Advantage guaranteed withdrawal benefit (“GWB”) feature and our i4LIFE® Advantage and 4LATER® Advantage guaranteed income benefit (“GIB”) features that are available in our variable annuity products. We have certain GLB variable annuity products with GWB and GIB features that are embedded derivatives. Certain features of these guarantees, notably our GIB, 4LATER®, Lincoln Lifetime IncomeSM Advantage and Lincoln Market SelectSM Advantage features, have elements of both insurance benefits accounted for under the Financial Services – Insurance – Claim Costs and Liabilities for Future Policy Benefits Subtopic of the FASB ASC (“benefit reserves”) and embedded derivative reserves. We calculate the value of the embedded derivative reserve and the benefit reserve based on the specific characteristics of each GLB feature. In addition to mitigating selected risk and income statement volatility, the hedge program is also focused on a long-term goal of accumulating assets that could be used to pay claims under these benefits. Changes in the value of the hedge contracts hedge the income statement effect of changes in GLB embedded derivative reserves and benefit reserves. This dynamic hedging strategy utilizes options and total return swaps on U.S.-based equity indices, and futures on U.S.-based and international equity indices, as well as interest rate futures, interest rate swaps and currency futures. The notional amounts of the underlying hedge instruments are such that the magnitude of the change in the value of the hedge instruments due to changes in equity markets, interest rates and implied volatilities is designed to offset the magnitude of the change in the GLB embedded derivative reserves and GLB benefit reserves caused by changes in equity markets, as well as the change in GLB embedded derivative reserves caused by changes in interest rates and implied volatilities. See “Realized Gain (Loss) and Benefit Ratio Unlocking – Variable Annuity Net Derivatives Results” below for information on how we determine our NPR. As part of our current hedging program, equity market, interest rate and market-implied volatility conditions are monitored on a daily basis. We rebalance our hedge positions based upon changes in these factors as needed. While we actively manage our hedge positions, these positions may not completely offset changes in the fair value of embedded derivative reserves and benefit reserves caused by movements in these factors due to, among other things, differences in timing between when a market exposure changes and corresponding changes to the hedge positions, extreme swings in the equity markets, interest rates and market-implied volatilities, realized market volatility, contract holder behavior, divergence between the performance of the underlying funds and the hedging indices, divergence between the actual and expected performance of the hedge instruments or our ability to purchase hedging instruments at prices consistent with our desired risk and return trade-off. Within our individual annuity business, 66% of our variable annuity account values contained GLB features as of December 31, 2016. Underperforming equity markets increase our exposure to potential benefits with the GLB features. A contract with a GLB feature is “in the money” if the contract holder’s account balance falls below the present value of guaranteed withdrawal or income benefits, assuming no lapses. As of December 31, 2016 and 2015, 11% and 10%, respectively, of all in-force contracts with a GLB feature were “in the money,” and our exposure, after reinsurance, as of December 31, 2016 and 2015, was $718 million and $603 million, respectively. However, the only way the contract holder can realize the excess of the present value of benefits over the account value of the contract is through a series of withdrawals or income payments that do not exceed a maximum amount. If, after the series of withdrawals or income payments, the account value is exhausted, the contract holder will continue to receive a series of annuity payments. The account value can also fluctuate with equity market returns on a daily basis resulting in increases or decreases in the excess of the present value of benefits over account value. As a result of these factors, the ultimate amount to be paid by us related to GLB guarantees is uncertain and could be significantly more or less than $718 million, net of reinsurance. Our fair value estimates of the GLB embedded derivatives, which are based on detailed models of future cash flows under a wide range of market-consistent scenarios, reflect a more comprehensive view of the related factors and represent our best estimate of the present value of these potential liabilities. The market-consistent scenarios used in the determination of the fair value of the GLB embedded derivatives are similar to those used by an investment bank to value derivatives for which the pricing is not transparent and the aftermarket is nonexistent or illiquid. We use risk-neutral Monte Carlo simulations in our calculation to value the entire block of guarantees, which involve 100 unique scenarios per policy or approximately 49 million scenarios. The market-consistent scenario assumptions, at each valuation date, are those we view to be appropriate for a hypothetical market participant. The market-consistent inputs include, but are not limited to, assumptions for capital markets (e.g., implied volatilities, correlation among indices, risk-free swap curve, etc.), policyholder behavior (e.g., policy lapse, rider utilization, etc.), mortality, risk margins, maintenance expenses and a margin for profit. We believe these assumptions are consistent with those that would be used by a market participant; however, as the related markets develop, we will continue to reassess our assumptions. It is possible that different valuation techniques and assumptions could produce a materially different estimate of fair value. For information on our variable annuity hedge program performance, see our discussion in “Realized Gain (Loss) and Benefit Ratio Unlocking – Variable Annuity Net Derivatives Results” below. The following table presents our estimates of the potential instantaneous effect to net income, which could result from sudden changes that may occur in equity markets, interest rates and implied market volatilities (in millions) at the levels indicated in the table and excludes the net cost of operating the hedging program. The amounts represent the estimated difference between the change in the portion of GLB reserves that is calculated on a fair value basis and the change in the value of the underlying hedge instruments after the amortization of DAC, VOBA, DSI and DFEL and taxes. These effects do not include any estimate of unlocking that could occur, nor do they estimate any change in the NPR component of the GLB reserve or any estimate of effects to our GLB benefit ratio unlocking. These estimates are based upon the recorded reserves as of December 31, 2016, and the related hedge instruments in place as of that date.
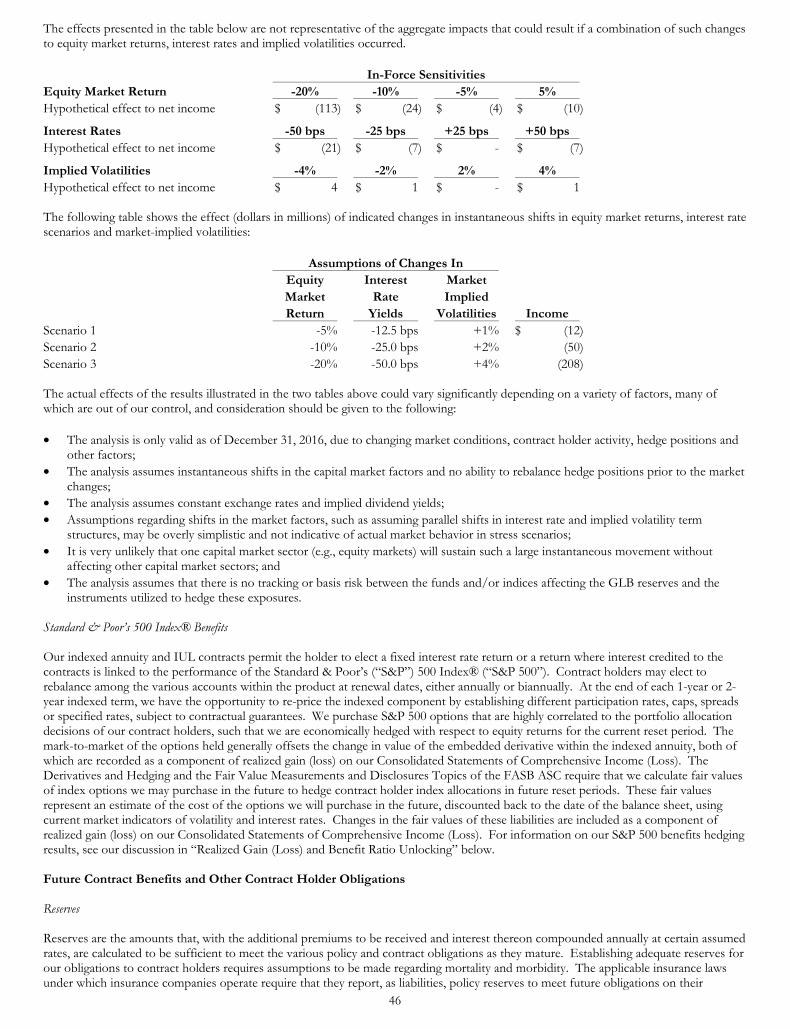
46
The effects presented in the table below are not representative of the aggregate impacts that could result if a combination of such changes to equity market returns, interest rates and implied volatilities occurred.
In-Force Sensitivities Equity Market Return -20% -10% -5% 5% Hypothetical effect to net income $ (113) $ (24) $ (4) $ (10)
Interest Rates -50 bps -25 bps +25 bps +50 bps Hypothetical effect to net income $ (21) $ (7) $ - $ (7)
Implied Volatilities -4% -2% 2% 4% Hypothetical effect to net income $ 4 $ 1 $ - $ 1 The following table shows the effect (dollars in millions) of indicated changes in instantaneous shifts in equity market returns, interest rate scenarios and market-implied volatilities:
Assumptions of Changes In Equity Interest Market Market Rate Implied Return Yields Volatilities Income Scenario 1 -5% -12.5 bps +1% $ (12) Scenario 2 -10% -25.0 bps +2% (50) Scenario 3 -20% -50.0 bps +4% (208) The actual effects of the results illustrated in the two tables above could vary significantly depending on a variety of factors, many of which are out of our control, and consideration should be given to the following: • The analysis is only valid as of December 31, 2016, due to changing market conditions, contract holder activity, hedge positions and
other factors; • The analysis assumes instantaneous shifts in the capital market factors and no ability to rebalance hedge positions prior to the market
changes; • The analysis assumes constant exchange rates and implied dividend yields; • Assumptions regarding shifts in the market factors, such as assuming parallel shifts in interest rate and implied volatility term
structures, may be overly simplistic and not indicative of actual market behavior in stress scenarios; • It is very unlikely that one capital market sector (e.g., equity markets) will sustain such a large instantaneous movement without
affecting other capital market sectors; and • The analysis assumes that there is no tracking or basis risk between the funds and/or indices affecting the GLB reserves and the
instruments utilized to hedge these exposures. Standard & Poor’s 500 Index® Benefits Our indexed annuity and IUL contracts permit the holder to elect a fixed interest rate return or a return where interest credited to the contracts is linked to the performance of the Standard & Poor’s (“S&P”) 500 Index® (“S&P 500”). Contract holders may elect to rebalance among the various accounts within the product at renewal dates, either annually or biannually. At the end of each 1-year or 2-year indexed term, we have the opportunity to re-price the indexed component by establishing different participation rates, caps, spreads or specified rates, subject to contractual guarantees. We purchase S&P 500 options that are highly correlated to the portfolio allocation decisions of our contract holders, such that we are economically hedged with respect to equity returns for the current reset period. The mark-to-market of the options held generally offsets the change in value of the embedded derivative within the indexed annuity, both of which are recorded as a component of realized gain (loss) on our Consolidated Statements of Comprehensive Income (Loss). The Derivatives and Hedging and the Fair Value Measurements and Disclosures Topics of the FASB ASC require that we calculate fair values of index options we may purchase in the future to hedge contract holder index allocations in future reset periods. These fair values represent an estimate of the cost of the options we will purchase in the future, discounted back to the date of the balance sheet, using current market indicators of volatility and interest rates. Changes in the fair values of these liabilities are included as a component of realized gain (loss) on our Consolidated Statements of Comprehensive Income (Loss). For information on our S&P 500 benefits hedging results, see our discussion in “Realized Gain (Loss) and Benefit Ratio Unlocking” below. Future Contract Benefits and Other Contract Holder Obligations Reserves Reserves are the amounts that, with the additional premiums to be received and interest thereon compounded annually at certain assumed rates, are calculated to be sufficient to meet the various policy and contract obligations as they mature. Establishing adequate reserves for our obligations to contract holders requires assumptions to be made regarding mortality and morbidity. The applicable insurance laws under which insurance companies operate require that they report, as liabilities, policy reserves to meet future obligations on their
47
outstanding contracts. These laws specify that the reserves shall not be less than reserves calculated using certain specified mortality and morbidity tables, interest rates and methods of valuation. The reserves reported in our consolidated financial statements contained herein are calculated in accordance with GAAP and differ from those specified by the laws of the various states and carried in the statutory financial statements of the life insurance subsidiaries. These differences arise from the use of mortality and morbidity tables, interest, persistency and other assumptions that we believe to be more representative of the expected experience for these contracts than those required for statutory accounting purposes and from differences in actuarial reserving methods. The assumptions on which reserves are based are intended to represent an estimation of experience for the period that policy benefits are payable. If actual experience is better than or equal to the assumptions, then reserves should be adequate to provide for future benefits and expenses. If experience is worse than the assumptions, additional reserves may be required. This would result in a charge to our net income during the period the increase in reserves occurred. The key experience assumptions include mortality rates, policy persistency and interest rates. We periodically review our experience and update our policy reserves for new issues and reserve for all claims incurred, as we believe appropriate. GDB The reserves related to the GDB features available in our variable annuity products are based on the application of a “benefit ratio” (the present value of total expected benefit payments over the life of the contract divided by the present value of total expected assessments over the life of the contract) to total variable annuity assessments received in the period. The level and direction of the change in reserves will vary over time based on the emergence of the benefit ratio and the level of assessments associated with the variable annuity. We utilize a delta hedging strategy for variable annuity products with a GDB feature, which uses futures on U.S.-based equity market indices to hedge against movements in equity markets. The hedging strategy is designed to hedge our exposure to earnings volatility that results from equity market driven changes in the reserve for GDB contracts. Because the GDB reserves are based upon projected long-term equity market return assumptions, and because the value of the hedging contracts will reflect current capital market conditions, the quarterly changes in values for the GDB reserves and the hedging contracts may not exactly offset each other. For information on our variable annuity hedge program performance, see our discussion in “Realized Gain (Loss) and Benefit Ratio Unlocking – Variable Annuity Net Derivatives Results” below. UL Products with Secondary Guarantees We issue UL contracts where we provide a secondary guarantee to the contract holder. The policy can remain in force, even if the base policy account value is zero, as long as contractual secondary guarantee requirements have been met. The reserves related to UL products with secondary guarantees are based on the application of a benefit ratio the same as our GDB features, which are discussed above. The level and direction of the change in reserves will vary over time based on the emergence of the benefit ratio and the level of assessments associated with the contracts. For more discussion, see “Results of Life Insurance” below. Goodwill and Other Intangible Assets Goodwill and intangible assets with indefinite lives are not amortized, but are reviewed at least annually by us as of October 1 for indications of value impairment, with consideration given to financial performance and other relevant factors. Intangibles that do not have indefinite lives are amortized over their estimated useful lives. We perform a two-step test in our evaluation of the carrying value of goodwill for each of our reporting units. The results of one test on one reporting unit cannot subsidize the results of another reporting unit. In Step 1 of the evaluation, the fair value of each reporting unit is determined and compared to the carrying value of the reporting unit. If the fair value is greater than the carrying value, then the carrying value of the reporting unit is deemed to be recoverable, and Step 2 is not required. If the fair value estimate is less than the carrying value, it is an indicator that impairment may exist, and Step 2 is required. In Step 2, the implied fair value of goodwill is determined for the reporting unit. The reporting unit’s fair value as determined in Step 1 is assigned to all of its net assets (recognized and unrecognized) as if the reporting unit were acquired in a business combination as of the date of the impairment test. If the implied fair value of the reporting unit’s goodwill is lower than its carrying amount, goodwill is impaired and written down to its fair value. For the purposes of the evaluation of the carrying value of goodwill, our reporting units (Annuities, Retirement Plan Services, Life Insurance and Group Protection) correspond with our reporting segments. The fair values of our reporting units are comprised of the value of in-force (i.e., existing) business and the value of new business. New business is also a fair value input that impacts the calculation of the implied fair value of goodwill. Specifically, new business is representative of cash flows and profitability associated with policies or contracts we expect to issue in the future, reflecting our forecasts of future sales volume and product mix over a 10-year period. Factors that could affect production levels and profitability of new business include mix of new business, pricing changes, customer acceptance of our products and distribution strength. To determine the values of in-force and new business, we use a discounted cash flows technique that applies a discount rate reflecting the market expected, weighted-average rate of return adjusted for the risk factors associated with operations to the projected future cash flows for each reporting unit. Current low interest rates have applied downward pressure to the interest rate inputs used in the discount
48
rate calculation. Spread compression and related effects to profitability caused by lower interest rates affect the valuation of in-force business more significantly than the valuation of new business, as new business pricing assumptions reflect the current and anticipated future interest rate environment. As a result, the effect of interest rate movements on the value of new business is primarily related to the discount rate. Refer to Note 10 of our consolidated financial statements for goodwill and specifically identifiable intangible assets by segment. All of the discussion that follows represents our analysis as of October 1, 2016. Step 1 Results We performed a Step 1 analysis on all of our reporting units. Our Annuities, Retirement Plan Services and Group Protection reporting units passed the Step 1 analysis. Given the Step 1 results, we also performed a Step 2 analysis for Life Insurance. For Annuities, Retirement Plan Services and Group Protection, we updated our estimates of discount rates based upon current market observable inputs. We used discount rates ranging from 9% to 12% for Annuities, 8.75% to 9.75% for Retirement Plan Services and 8% to 9% for Group Protection. Based upon our Step 1 analysis for Annuities, Retirement Plan Services and Group Protection, our estimated implied fair value was well in excess of each reporting unit’s carrying value of net assets, including goodwill. Step 2 Results and Information for our Life Insurance Reporting Unit In our Step 2 analysis of Life Insurance, we estimated the implied fair value of goodwill using the following key assumptions: • New business for 10 years; • Expense synergies assumption that would be expected to be realized in a market-participant transaction similar to prior market
observable transactions and our prior experience; and • Interest rates used to discount new business cash flows ranging from 7.5% to 9.5%. Based upon our Step 2 analysis for Life Insurance, we determined that there was no impairment. Outlook Factors that can influence the value of goodwill include the capital markets, competitive landscape, regulatory environment, consumer confidence and any items that can directly or indirectly affect new business future cash flows. For example, unfavorable changes to assumptions as compared to our October 1, 2016, analysis or factors that could result in impairment include, but are not limited to, the following: • Lower expectations for future sales levels or future sales profitability; • Higher discount rates on new business assumptions; • Weakened expectations for the ability to execute future reserve financing transactions for life insurance business over the long-term
or expectations for significant increases in the associated costs; • Legislative, regulatory or tax changes that affect the cost of, or demand for, our subsidiaries’ products, the required amount of
reserves and/or surplus, or otherwise affect our ability to conduct business, including changes to statutory reserve requirements or changes to risk-based capital (“RBC”) requirements; and
• Valuations of significant mergers or acquisitions of companies or blocks of business that would provide relevant market-based inputs for our impairment assessment that could support less favorable conclusions regarding the estimated fair value of our reporting units.
In January 2017, the FASB issued amendments to the goodwill impairment accounting guidance. For more information regarding this new accounting standard, see “ASU 2017-04, Simplifying the Test for Goodwill Impairment” in Note 2. Income Taxes Management uses certain assumptions and estimates in determining the income taxes payable or refundable for the current year, the deferred income tax liabilities and assets for items recognized differently in its financial statements from amounts shown on its income tax returns and the federal income tax expense. Determining these amounts requires analysis and interpretation of current tax laws and regulations. Management exercises considerable judgment in evaluating the amount and timing of recognition of the resulting income tax liabilities and assets. These judgments and estimates are re-evaluated on a continual basis as regulatory and business factors change. Legislative changes to the Internal Revenue Code of 1986, as amended, modification or new regulations, administrative rulings, or court decisions could increase our effective tax rate. The application of GAAP requires us to evaluate the recoverability of our deferred tax assets and establish a valuation allowance, if necessary, to reduce our deferred tax asset to an amount that is more likely than not to be realizable. Considerable judgment and the use
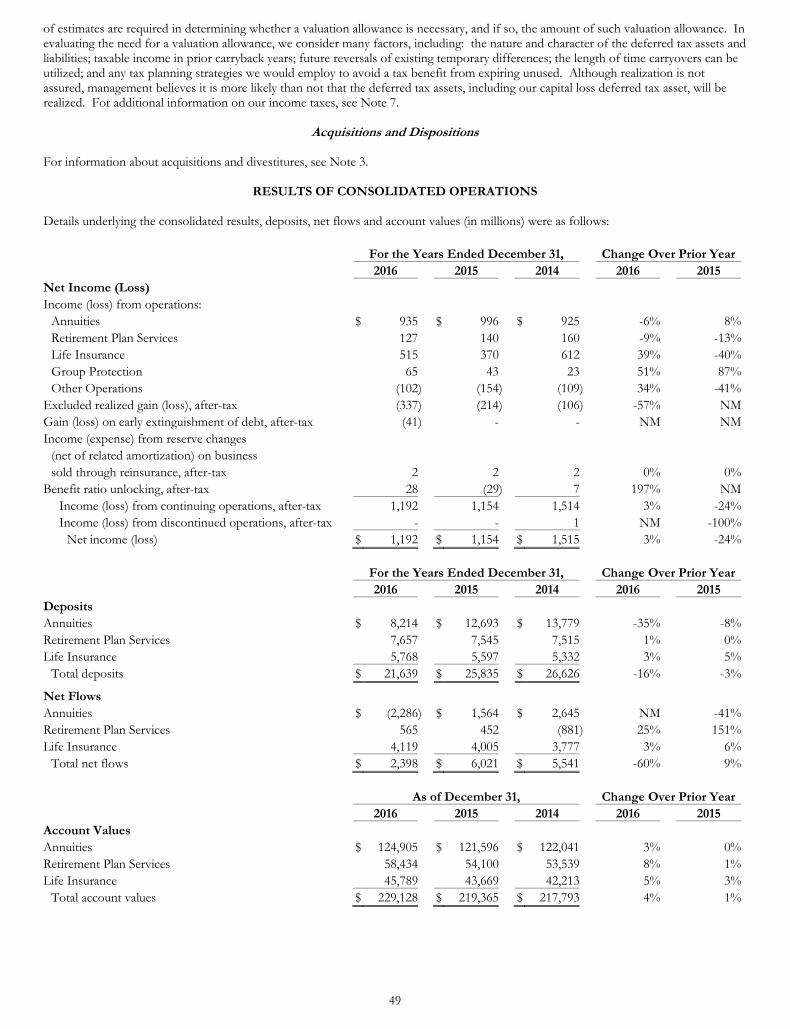
49
of estimates are required in determining whether a valuation allowance is necessary, and if so, the amount of such valuation allowance. In evaluating the need for a valuation allowance, we consider many factors, including: the nature and character of the deferred tax assets and liabilities; taxable income in prior carryback years; future reversals of existing temporary differences; the length of time carryovers can be utilized; and any tax planning strategies we would employ to avoid a tax benefit from expiring unused. Although realization is not assured, management believes it is more likely than not that the deferred tax assets, including our capital loss deferred tax asset, will be realized. For additional information on our income taxes, see Note 7.
Acquisitions and Dispositions For information about acquisitions and divestitures, see Note 3.
RESULTS OF CONSOLIDATED OPERATIONS
Details underlying the consolidated results, deposits, net flows and account values (in millions) were as follows:
For the Years Ended December 31, Change Over Prior Year 2016 2015 2014 2016 2015 Net Income (Loss) Income (loss) from operations:
Annuities $ 935 $ 996 $ 925 -6% 8%Retirement Plan Services 127 140 160 -9% -13%Life Insurance 515 370 612 39% -40%Group Protection 65 43 23 51% 87%Other Operations (102) (154) (109) 34% -41%
Excluded realized gain (loss), after-tax (337) (214) (106) -57% NMGain (loss) on early extinguishment of debt, after-tax (41) - - NM NMIncome (expense) from reserve changes
(net of related amortization) on business sold through reinsurance, after-tax 2 2 2 0% 0%
Benefit ratio unlocking, after-tax 28 (29) 7 197% NMIncome (loss) from continuing operations, after-tax 1,192 1,154 1,514 3% -24%Income (loss) from discontinued operations, after-tax - - 1 NM -100%
Net income (loss) $ 1,192 $ 1,154 $ 1,515 3% -24%
For the Years Ended December 31, Change Over Prior Year 2016 2015 2014 2016 2015 Deposits Annuities $ 8,214 $ 12,693 $ 13,779 -35% -8%Retirement Plan Services 7,657 7,545 7,515 1% 0%Life Insurance 5,768 5,597 5,332 3% 5%
Total deposits $ 21,639 $ 25,835 $ 26,626 -16% -3%
Net Flows Annuities $ (2,286) $ 1,564 $ 2,645 NM -41%Retirement Plan Services 565 452 (881) 25% 151%Life Insurance 4,119 4,005 3,777 3% 6%
Total net flows $ 2,398 $ 6,021 $ 5,541 -60% 9%
As of December 31, Change Over Prior Year 2016 2015 2014 2016 2015 Account Values Annuities $ 124,905 $ 121,596 $ 122,041 3% 0%Retirement Plan Services 58,434 54,100 53,539 8% 1%Life Insurance 45,789 43,669 42,213 5% 3%
Total account values $ 229,128 $ 219,365 $ 217,793 4% 1%
50
Comparison of 2016 to 2015 Net income increased due primarily to the following: • Growth in business in force and average account values. • The effect of unlocking. • Higher legal expenses during 2015. • Gains on the mark-to-market on certain investments. • More favorable total non-medical loss ratio experience in our Group Protection segment. The increase in net income was partially offset by the following:
• Higher realized losses driven by asset disposals and an increase in OTTI attributable to individual credit risks within our corporate
bond holdings. • Higher losses on variable annuity net derivative results. • Loss on early extinguishment of debt. • Higher legal expenses related to certain investments. • Spread compression due to average new money rates trailing our current portfolio yields, partially offset by actions implemented to
reduce interest crediting rates. Comparison of 2015 to 2014 Net income decreased due primarily to the following: • The effect of unlocking primarily in the Life Insurance segment. • Higher benefits due to unfavorable mortality during the first half of 2015 and growth of business in force in our Life Insurance
segment. • Realized losses during 2015 due primarily to the impact of volatile capital markets on our hedge program. • The recapture of certain traditional and interest sensitive business under several yearly renewable term reinsurance treaties that were
originally ceded to a reinsurer during 2014. • Higher legal expenses in 2015. • Less favorable investment income on alternative investments and lower prepayment and bond make-whole premiums. • Spread compression due to average new money rates trailing our current portfolio yields, partially offset by actions implemented to
reduce interest crediting rates. The decrease in net income was partially offset by the following: • Growth in average account values and business in force. • Realized loss in 2014 related to the sale of Lincoln Financial Media Company (“LFM”). • More favorable total non-medical loss ratio experience in our Group Protection segment.
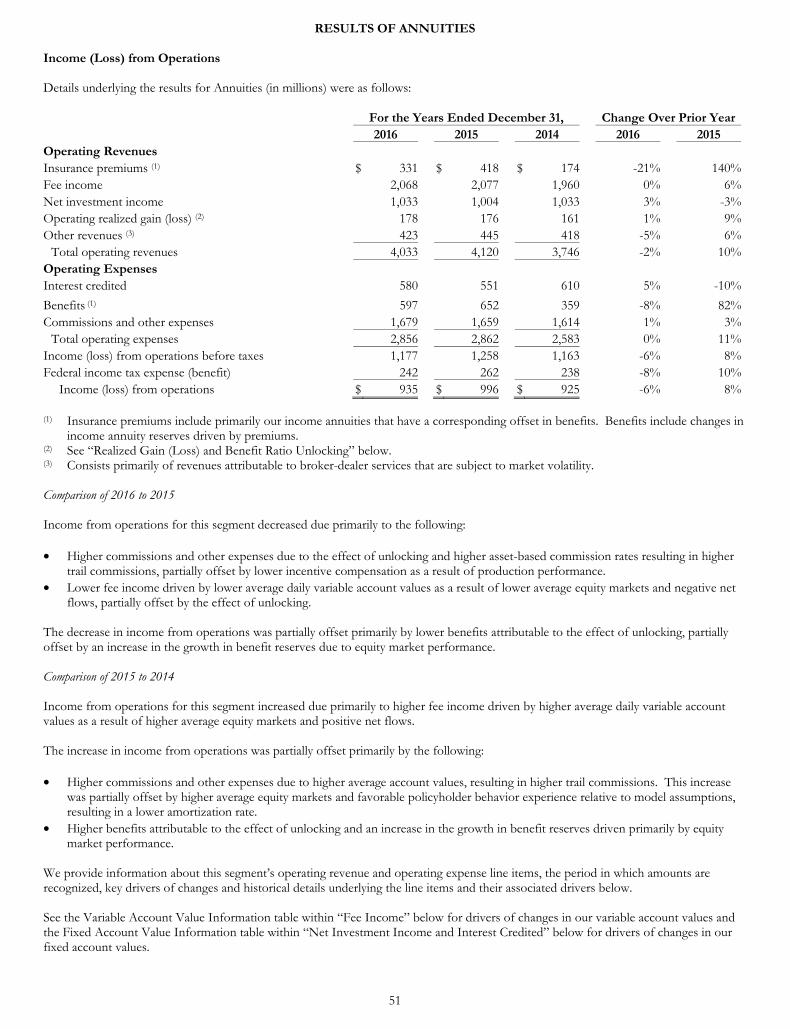
51
RESULTS OF ANNUITIES Income (Loss) from Operations Details underlying the results for Annuities (in millions) were as follows:
For the Years Ended December 31, Change Over Prior Year 2016 2015 2014 2016 2015 Operating Revenues Insurance premiums (1) $ 331 $ 418 $ 174 -21% 140%Fee income 2,068 2,077 1,960 0% 6%Net investment income 1,033 1,004 1,033 3% -3%Operating realized gain (loss) (2) 178 176 161 1% 9%Other revenues (3) 423 445 418 -5% 6%
Total operating revenues 4,033 4,120 3,746 -2% 10%Operating Expenses Interest credited 580 551 610 5% -10%
Benefits (1) 597 652 359 -8% 82%Commissions and other expenses 1,679 1,659 1,614 1% 3%
Total operating expenses 2,856 2,862 2,583 0% 11%Income (loss) from operations before taxes 1,177 1,258 1,163 -6% 8%Federal income tax expense (benefit) 242 262 238 -8% 10%
Income (loss) from operations $ 935 $ 996 $ 925 -6% 8% (1) Insurance premiums include primarily our income annuities that have a corresponding offset in benefits. Benefits include changes in
income annuity reserves driven by premiums. (2) See “Realized Gain (Loss) and Benefit Ratio Unlocking” below. (3) Consists primarily of revenues attributable to broker-dealer services that are subject to market volatility. Comparison of 2016 to 2015 Income from operations for this segment decreased due primarily to the following: • Higher commissions and other expenses due to the effect of unlocking and higher asset-based commission rates resulting in higher
trail commissions, partially offset by lower incentive compensation as a result of production performance. • Lower fee income driven by lower average daily variable account values as a result of lower average equity markets and negative net
flows, partially offset by the effect of unlocking. The decrease in income from operations was partially offset primarily by lower benefits attributable to the effect of unlocking, partially offset by an increase in the growth in benefit reserves due to equity market performance. Comparison of 2015 to 2014 Income from operations for this segment increased due primarily to higher fee income driven by higher average daily variable account values as a result of higher average equity markets and positive net flows.
The increase in income from operations was partially offset primarily by the following: • Higher commissions and other expenses due to higher average account values, resulting in higher trail commissions. This increase
was partially offset by higher average equity markets and favorable policyholder behavior experience relative to model assumptions, resulting in a lower amortization rate.
• Higher benefits attributable to the effect of unlocking and an increase in the growth in benefit reserves driven primarily by equity market performance.
We provide information about this segment’s operating revenue and operating expense line items, the period in which amounts are recognized, key drivers of changes and historical details underlying the line items and their associated drivers below. See the Variable Account Value Information table within “Fee Income” below for drivers of changes in our variable account values and the Fixed Account Value Information table within “Net Investment Income and Interest Credited” below for drivers of changes in our fixed account values.
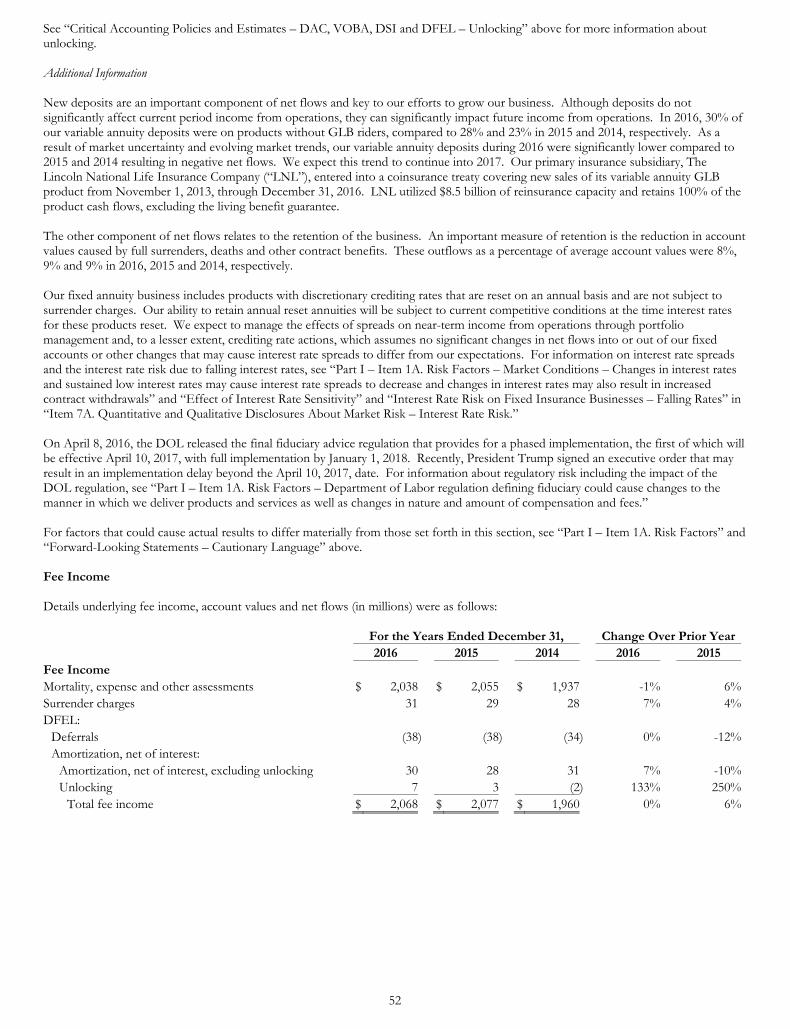
52
See “Critical Accounting Policies and Estimates – DAC, VOBA, DSI and DFEL – Unlocking” above for more information about unlocking. Additional Information New deposits are an important component of net flows and key to our efforts to grow our business. Although deposits do not significantly affect current period income from operations, they can significantly impact future income from operations. In 2016, 30% of our variable annuity deposits were on products without GLB riders, compared to 28% and 23% in 2015 and 2014, respectively. As a result of market uncertainty and evolving market trends, our variable annuity deposits during 2016 were significantly lower compared to 2015 and 2014 resulting in negative net flows. We expect this trend to continue into 2017. Our primary insurance subsidiary, The Lincoln National Life Insurance Company (“LNL”), entered into a coinsurance treaty covering new sales of its variable annuity GLB product from November 1, 2013, through December 31, 2016. LNL utilized $8.5 billion of reinsurance capacity and retains 100% of the product cash flows, excluding the living benefit guarantee. The other component of net flows relates to the retention of the business. An important measure of retention is the reduction in account values caused by full surrenders, deaths and other contract benefits. These outflows as a percentage of average account values were 8%, 9% and 9% in 2016, 2015 and 2014, respectively. Our fixed annuity business includes products with discretionary crediting rates that are reset on an annual basis and are not subject to surrender charges. Our ability to retain annual reset annuities will be subject to current competitive conditions at the time interest rates for these products reset. We expect to manage the effects of spreads on near-term income from operations through portfolio management and, to a lesser extent, crediting rate actions, which assumes no significant changes in net flows into or out of our fixed accounts or other changes that may cause interest rate spreads to differ from our expectations. For information on interest rate spreads and the interest rate risk due to falling interest rates, see “Part I – Item 1A. Risk Factors – Market Conditions – Changes in interest rates and sustained low interest rates may cause interest rate spreads to decrease and changes in interest rates may also result in increased contract withdrawals” and “Effect of Interest Rate Sensitivity” and “Interest Rate Risk on Fixed Insurance Businesses – Falling Rates” in “Item 7A. Quantitative and Qualitative Disclosures About Market Risk – Interest Rate Risk.” On April 8, 2016, the DOL released the final fiduciary advice regulation that provides for a phased implementation, the first of which will be effective April 10, 2017, with full implementation by January 1, 2018. Recently, President Trump signed an executive order that may result in an implementation delay beyond the April 10, 2017, date. For information about regulatory risk including the impact of the DOL regulation, see “Part I – Item 1A. Risk Factors – Department of Labor regulation defining fiduciary could cause changes to the manner in which we deliver products and services as well as changes in nature and amount of compensation and fees.” For factors that could cause actual results to differ materially from those set forth in this section, see “Part I – Item 1A. Risk Factors” and “Forward-Looking Statements – Cautionary Language” above. Fee Income Details underlying fee income, account values and net flows (in millions) were as follows:
For the Years Ended December 31, Change Over Prior Year 2016 2015 2014 2016 2015 Fee Income Mortality, expense and other assessments $ 2,038 $ 2,055 $ 1,937 -1% 6%Surrender charges 31 29 28 7% 4%DFEL:
Deferrals (38) (38) (34) 0% -12%Amortization, net of interest:
Amortization, net of interest, excluding unlocking 30 28 31 7% -10%Unlocking 7 3 (2) 133% 250%
Total fee income $ 2,068 $ 2,077 $ 1,960 0% 6%
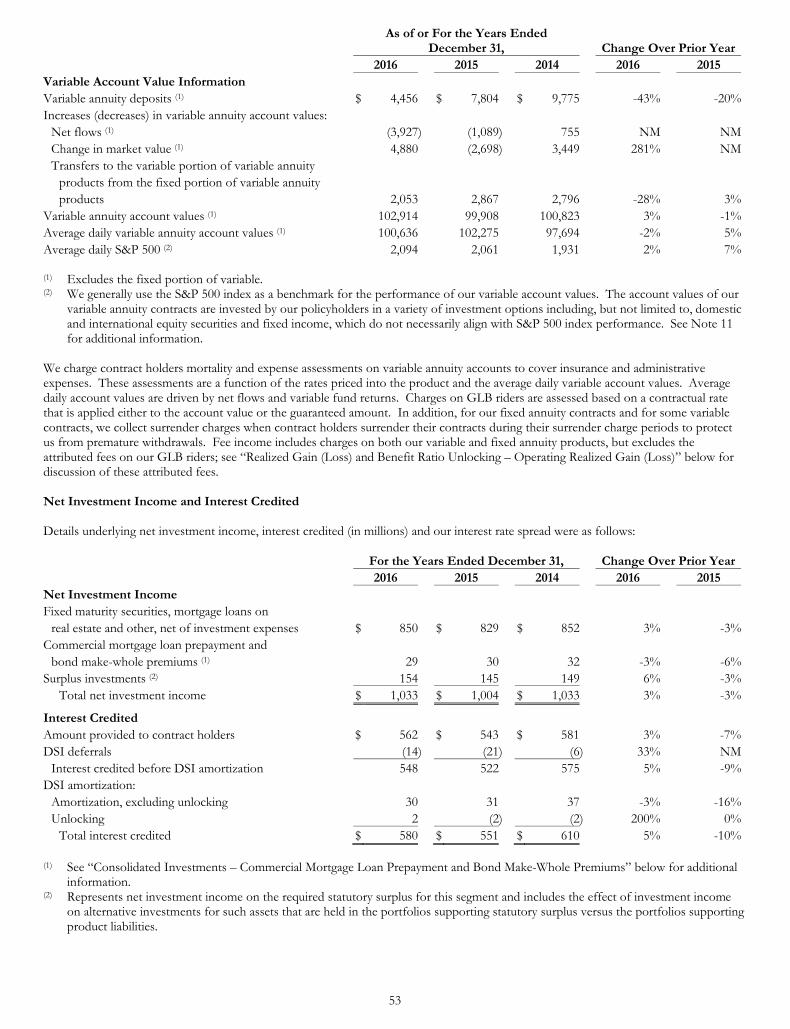
53
As of or For the Years Ended
December 31, Change Over Prior Year 2016 2015 2014 2016 2015 Variable Account Value Information Variable annuity deposits (1) $ 4,456 $ 7,804 $ 9,775 -43% -20%Increases (decreases) in variable annuity account values:
Net flows (1) (3,927) (1,089) 755 NM NMChange in market value (1) 4,880 (2,698) 3,449 281% NMTransfers to the variable portion of variable annuity
products from the fixed portion of variable annuity products 2,053 2,867 2,796 -28% 3%
Variable annuity account values (1) 102,914 99,908 100,823 3% -1%Average daily variable annuity account values (1) 100,636 102,275 97,694 -2% 5%Average daily S&P 500 (2) 2,094 2,061 1,931 2% 7% (1) Excludes the fixed portion of variable. (2) We generally use the S&P 500 index as a benchmark for the performance of our variable account values. The account values of our
variable annuity contracts are invested by our policyholders in a variety of investment options including, but not limited to, domestic and international equity securities and fixed income, which do not necessarily align with S&P 500 index performance. See Note 11 for additional information.
We charge contract holders mortality and expense assessments on variable annuity accounts to cover insurance and administrative expenses. These assessments are a function of the rates priced into the product and the average daily variable account values. Average daily account values are driven by net flows and variable fund returns. Charges on GLB riders are assessed based on a contractual rate that is applied either to the account value or the guaranteed amount. In addition, for our fixed annuity contracts and for some variable contracts, we collect surrender charges when contract holders surrender their contracts during their surrender charge periods to protect us from premature withdrawals. Fee income includes charges on both our variable and fixed annuity products, but excludes the attributed fees on our GLB riders; see “Realized Gain (Loss) and Benefit Ratio Unlocking – Operating Realized Gain (Loss)” below for discussion of these attributed fees. Net Investment Income and Interest Credited Details underlying net investment income, interest credited (in millions) and our interest rate spread were as follows:
For the Years Ended December 31, Change Over Prior Year 2016 2015 2014 2016 2015 Net Investment Income Fixed maturity securities, mortgage loans on
real estate and other, net of investment expenses $ 850 $ 829 $ 852 3% -3%Commercial mortgage loan prepayment and
bond make-whole premiums (1) 29 30 32 -3% -6%Surplus investments (2) 154 145 149 6% -3%
Total net investment income $ 1,033 $ 1,004 $ 1,033 3% -3%
Interest Credited Amount provided to contract holders $ 562 $ 543 $ 581 3% -7%DSI deferrals (14) (21) (6) 33% NM
Interest credited before DSI amortization 548 522 575 5% -9%DSI amortization:
Amortization, excluding unlocking 30 31 37 -3% -16%Unlocking 2 (2) (2) 200% 0%
Total interest credited $ 580 $ 551 $ 610 5% -10% (1) See “Consolidated Investments – Commercial Mortgage Loan Prepayment and Bond Make-Whole Premiums” below for additional
information. (2) Represents net investment income on the required statutory surplus for this segment and includes the effect of investment income
on alternative investments for such assets that are held in the portfolios supporting statutory surplus versus the portfolios supporting product liabilities.
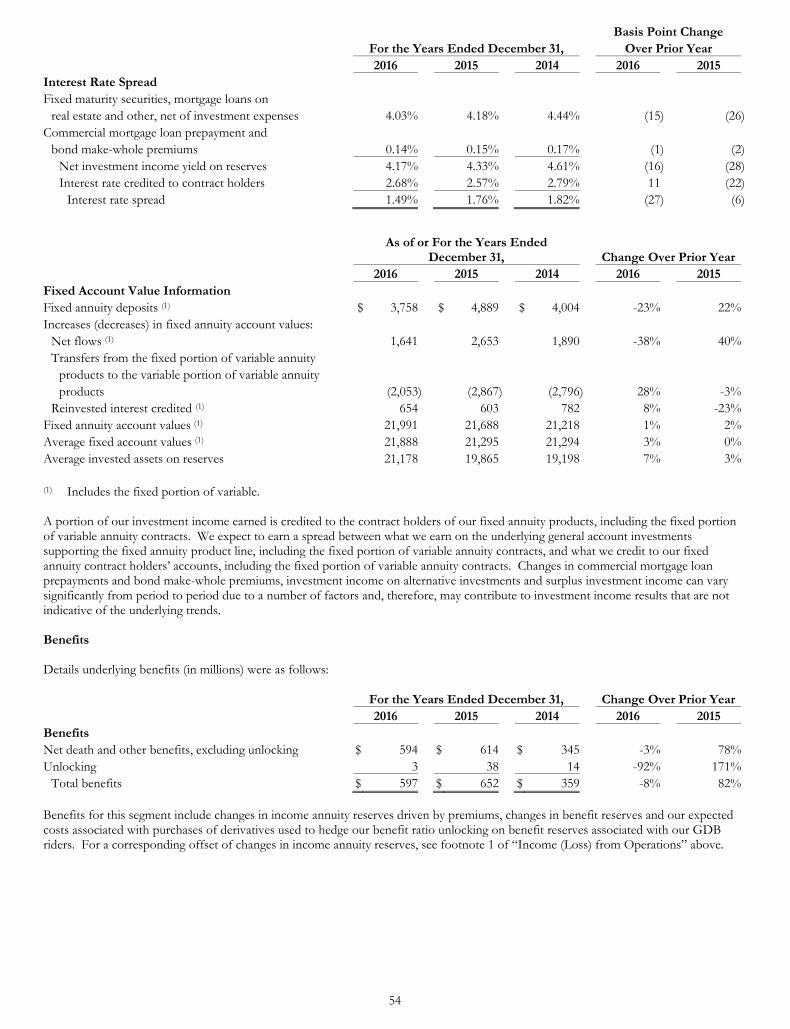
54
Basis Point Change For the Years Ended December 31, Over Prior Year 2016 2015 2014 2016 2015 Interest Rate Spread Fixed maturity securities, mortgage loans on
real estate and other, net of investment expenses 4.03% 4.18% 4.44% (15) (26)Commercial mortgage loan prepayment and
bond make-whole premiums 0.14% 0.15% 0.17% (1) (2)Net investment income yield on reserves 4.17% 4.33% 4.61% (16) (28)Interest rate credited to contract holders 2.68% 2.57% 2.79% 11 (22)
Interest rate spread 1.49% 1.76% 1.82% (27) (6)
As of or For the Years Ended
December 31, Change Over Prior Year 2016 2015 2014 2016 2015 Fixed Account Value Information Fixed annuity deposits (1) $ 3,758 $ 4,889 $ 4,004 -23% 22%Increases (decreases) in fixed annuity account values:
Net flows (1) 1,641 2,653 1,890 -38% 40%Transfers from the fixed portion of variable annuity
products to the variable portion of variable annuity products (2,053) (2,867) (2,796) 28% -3%
Reinvested interest credited (1) 654 603 782 8% -23%Fixed annuity account values (1) 21,991 21,688 21,218 1% 2%Average fixed account values (1) 21,888 21,295 21,294 3% 0%Average invested assets on reserves 21,178 19,865 19,198 7% 3% (1) Includes the fixed portion of variable. A portion of our investment income earned is credited to the contract holders of our fixed annuity products, including the fixed portion of variable annuity contracts. We expect to earn a spread between what we earn on the underlying general account investments supporting the fixed annuity product line, including the fixed portion of variable annuity contracts, and what we credit to our fixed annuity contract holders’ accounts, including the fixed portion of variable annuity contracts. Changes in commercial mortgage loan prepayments and bond make-whole premiums, investment income on alternative investments and surplus investment income can vary significantly from period to period due to a number of factors and, therefore, may contribute to investment income results that are not indicative of the underlying trends. Benefits Details underlying benefits (in millions) were as follows:
For the Years Ended December 31, Change Over Prior Year 2016 2015 2014 2016 2015 Benefits Net death and other benefits, excluding unlocking $ 594 $ 614 $ 345 -3% 78%Unlocking 3 38 14 -92% 171%
Total benefits $ 597 $ 652 $ 359 -8% 82% Benefits for this segment include changes in income annuity reserves driven by premiums, changes in benefit reserves and our expected costs associated with purchases of derivatives used to hedge our benefit ratio unlocking on benefit reserves associated with our GDB riders. For a corresponding offset of changes in income annuity reserves, see footnote 1 of “Income (Loss) from Operations” above.
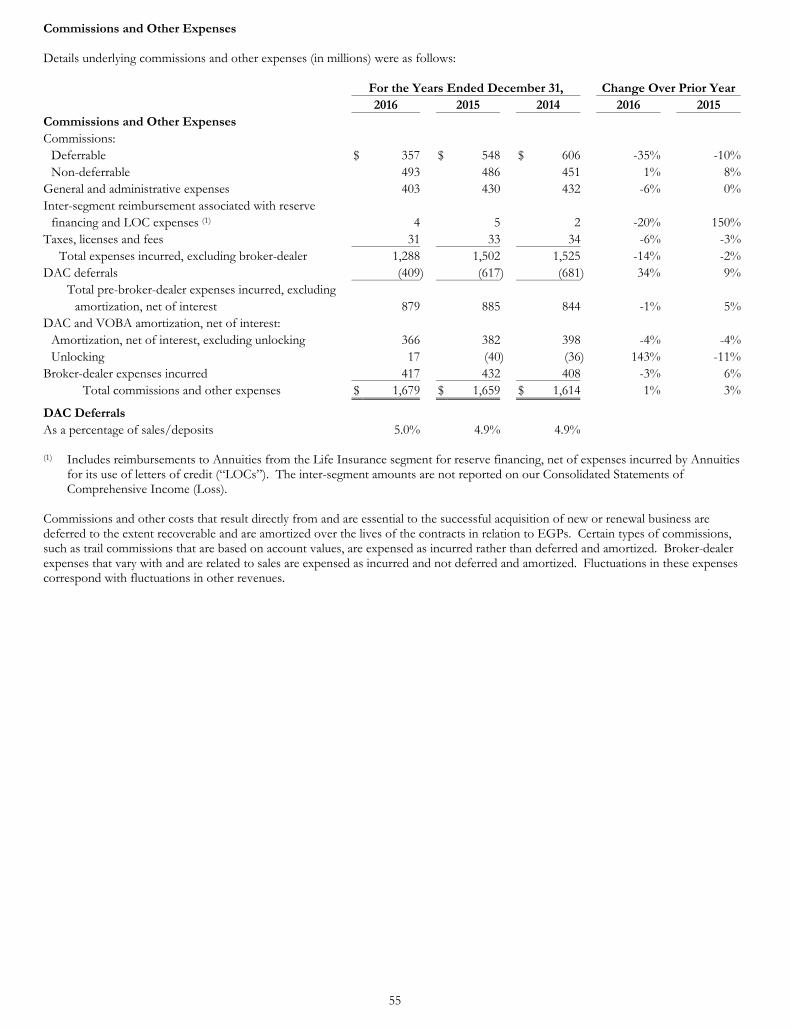
55
Commissions and Other Expenses Details underlying commissions and other expenses (in millions) were as follows:
For the Years Ended December 31, Change Over Prior Year 2016 2015 2014 2016 2015 Commissions and Other Expenses Commissions:
Deferrable $ 357 $ 548 $ 606 -35% -10%Non-deferrable 493 486 451 1% 8%
General and administrative expenses 403 430 432 -6% 0%Inter-segment reimbursement associated with reserve
financing and LOC expenses (1) 4 5 2 -20% 150%Taxes, licenses and fees 31 33 34 -6% -3%
Total expenses incurred, excluding broker-dealer 1,288 1,502 1,525 -14% -2%DAC deferrals (409) (617) (681) 34% 9%
Total pre-broker-dealer expenses incurred, excluding amortization, net of interest 879 885 844 -1% 5%
DAC and VOBA amortization, net of interest: Amortization, net of interest, excluding unlocking 366 382 398 -4% -4%Unlocking 17 (40) (36) 143% -11%
Broker-dealer expenses incurred 417 432 408 -3% 6%Total commissions and other expenses $ 1,679 $ 1,659 $ 1,614 1% 3%
DAC Deferrals As a percentage of sales/deposits 5.0% 4.9% 4.9% (1) Includes reimbursements to Annuities from the Life Insurance segment for reserve financing, net of expenses incurred by Annuities
for its use of letters of credit (“LOCs”). The inter-segment amounts are not reported on our Consolidated Statements of Comprehensive Income (Loss).
Commissions and other costs that result directly from and are essential to the successful acquisition of new or renewal business are deferred to the extent recoverable and are amortized over the lives of the contracts in relation to EGPs. Certain types of commissions, such as trail commissions that are based on account values, are expensed as incurred rather than deferred and amortized. Broker-dealer expenses that vary with and are related to sales are expensed as incurred and not deferred and amortized. Fluctuations in these expenses correspond with fluctuations in other revenues.
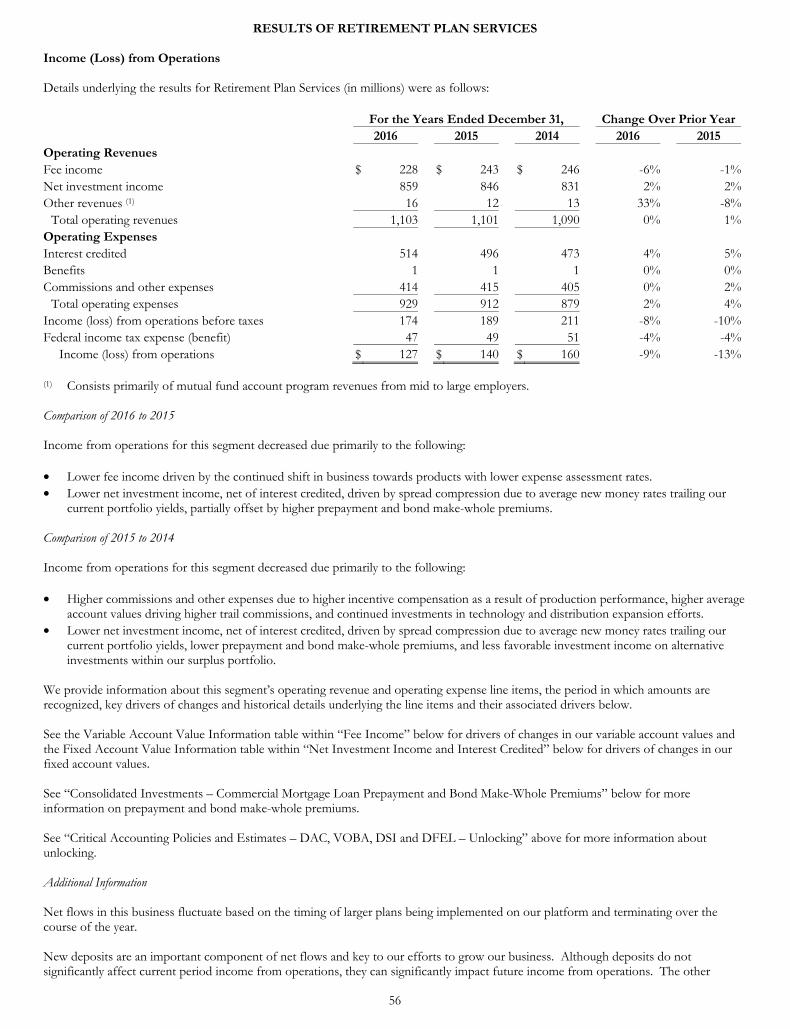
56
RESULTS OF RETIREMENT PLAN SERVICES Income (Loss) from Operations Details underlying the results for Retirement Plan Services (in millions) were as follows:
For the Years Ended December 31, Change Over Prior Year 2016 2015 2014 2016 2015 Operating Revenues Fee income $ 228 $ 243 $ 246 -6% -1%Net investment income 859 846 831 2% 2%Other revenues (1) 16 12 13 33% -8%
Total operating revenues 1,103 1,101 1,090 0% 1%Operating Expenses Interest credited 514 496 473 4% 5%Benefits 1 1 1 0% 0%Commissions and other expenses 414 415 405 0% 2%
Total operating expenses 929 912 879 2% 4%Income (loss) from operations before taxes 174 189 211 -8% -10%Federal income tax expense (benefit) 47 49 51 -4% -4%
Income (loss) from operations $ 127 $ 140 $ 160 -9% -13% (1) Consists primarily of mutual fund account program revenues from mid to large employers. Comparison of 2016 to 2015 Income from operations for this segment decreased due primarily to the following: • Lower fee income driven by the continued shift in business towards products with lower expense assessment rates. • Lower net investment income, net of interest credited, driven by spread compression due to average new money rates trailing our
current portfolio yields, partially offset by higher prepayment and bond make-whole premiums. Comparison of 2015 to 2014 Income from operations for this segment decreased due primarily to the following: • Higher commissions and other expenses due to higher incentive compensation as a result of production performance, higher average
account values driving higher trail commissions, and continued investments in technology and distribution expansion efforts. • Lower net investment income, net of interest credited, driven by spread compression due to average new money rates trailing our
current portfolio yields, lower prepayment and bond make-whole premiums, and less favorable investment income on alternative investments within our surplus portfolio.
We provide information about this segment’s operating revenue and operating expense line items, the period in which amounts are recognized, key drivers of changes and historical details underlying the line items and their associated drivers below. See the Variable Account Value Information table within “Fee Income” below for drivers of changes in our variable account values and the Fixed Account Value Information table within “Net Investment Income and Interest Credited” below for drivers of changes in our fixed account values. See “Consolidated Investments – Commercial Mortgage Loan Prepayment and Bond Make-Whole Premiums” below for more information on prepayment and bond make-whole premiums. See “Critical Accounting Policies and Estimates – DAC, VOBA, DSI and DFEL – Unlocking” above for more information about unlocking. Additional Information Net flows in this business fluctuate based on the timing of larger plans being implemented on our platform and terminating over the course of the year. New deposits are an important component of net flows and key to our efforts to grow our business. Although deposits do not significantly affect current period income from operations, they can significantly impact future income from operations. The other
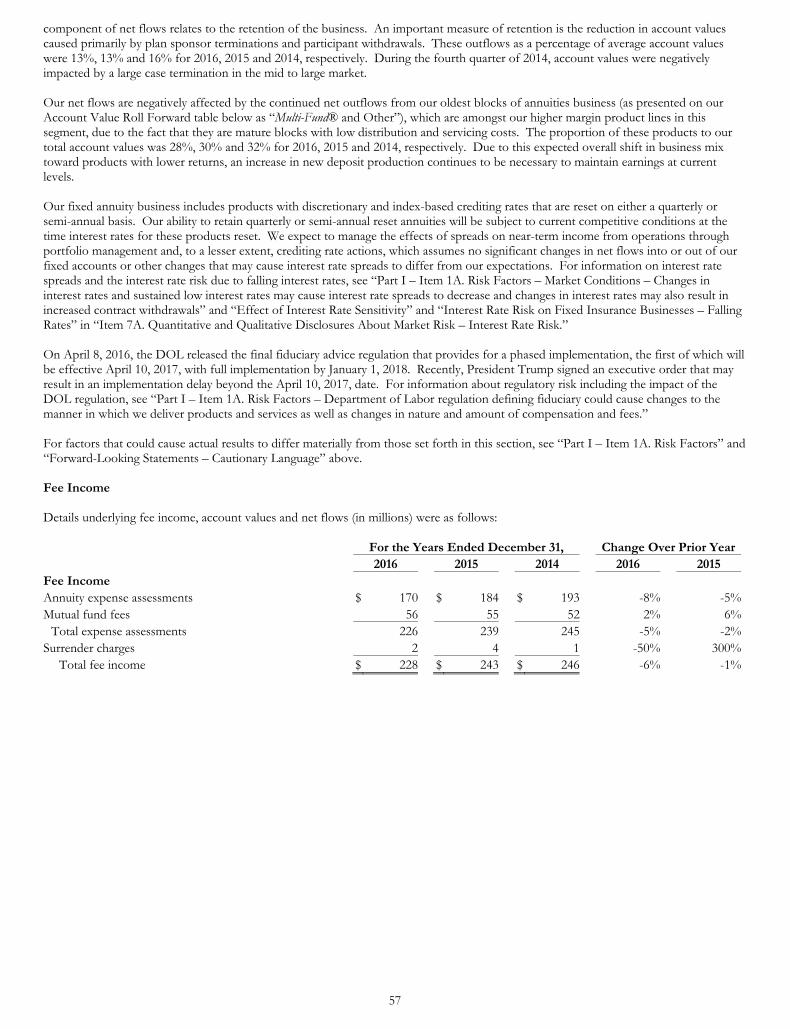
57
component of net flows relates to the retention of the business. An important measure of retention is the reduction in account values caused primarily by plan sponsor terminations and participant withdrawals. These outflows as a percentage of average account values were 13%, 13% and 16% for 2016, 2015 and 2014, respectively. During the fourth quarter of 2014, account values were negatively impacted by a large case termination in the mid to large market. Our net flows are negatively affected by the continued net outflows from our oldest blocks of annuities business (as presented on our Account Value Roll Forward table below as “Multi-Fund® and Other”), which are amongst our higher margin product lines in this segment, due to the fact that they are mature blocks with low distribution and servicing costs. The proportion of these products to our total account values was 28%, 30% and 32% for 2016, 2015 and 2014, respectively. Due to this expected overall shift in business mix toward products with lower returns, an increase in new deposit production continues to be necessary to maintain earnings at current levels. Our fixed annuity business includes products with discretionary and index-based crediting rates that are reset on either a quarterly or semi-annual basis. Our ability to retain quarterly or semi-annual reset annuities will be subject to current competitive conditions at the time interest rates for these products reset. We expect to manage the effects of spreads on near-term income from operations through portfolio management and, to a lesser extent, crediting rate actions, which assumes no significant changes in net flows into or out of our fixed accounts or other changes that may cause interest rate spreads to differ from our expectations. For information on interest rate spreads and the interest rate risk due to falling interest rates, see “Part I – Item 1A. Risk Factors – Market Conditions – Changes in interest rates and sustained low interest rates may cause interest rate spreads to decrease and changes in interest rates may also result in increased contract withdrawals” and “Effect of Interest Rate Sensitivity” and “Interest Rate Risk on Fixed Insurance Businesses – Falling Rates” in “Item 7A. Quantitative and Qualitative Disclosures About Market Risk – Interest Rate Risk.” On April 8, 2016, the DOL released the final fiduciary advice regulation that provides for a phased implementation, the first of which will be effective April 10, 2017, with full implementation by January 1, 2018. Recently, President Trump signed an executive order that may result in an implementation delay beyond the April 10, 2017, date. For information about regulatory risk including the impact of the DOL regulation, see “Part I – Item 1A. Risk Factors – Department of Labor regulation defining fiduciary could cause changes to the manner in which we deliver products and services as well as changes in nature and amount of compensation and fees.” For factors that could cause actual results to differ materially from those set forth in this section, see “Part I – Item 1A. Risk Factors” and “Forward-Looking Statements – Cautionary Language” above. Fee Income Details underlying fee income, account values and net flows (in millions) were as follows:
For the Years Ended December 31, Change Over Prior Year 2016 2015 2014 2016 2015 Fee Income Annuity expense assessments $ 170 $ 184 $ 193 -8% -5%Mutual fund fees 56 55 52 2% 6%
Total expense assessments 226 239 245 -5% -2%Surrender charges 2 4 1 -50% 300%
Total fee income $ 228 $ 243 $ 246 -6% -1%
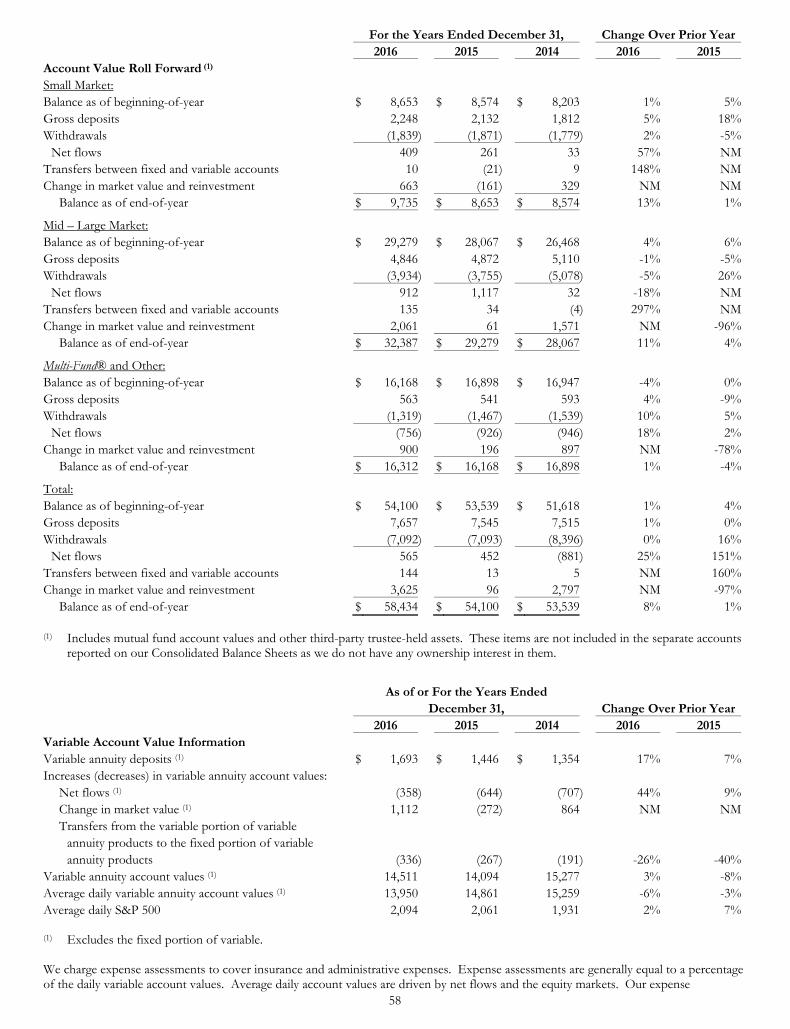
58
For the Years Ended December 31, Change Over Prior Year 2016 2015 2014 2016 2015 Account Value Roll Forward (1) Small Market: Balance as of beginning-of-year $ 8,653 $ 8,574 $ 8,203 1% 5%Gross deposits 2,248 2,132 1,812 5% 18%Withdrawals (1,839) (1,871) (1,779) 2% -5%
Net flows 409 261 33 57% NMTransfers between fixed and variable accounts 10 (21) 9 148% NMChange in market value and reinvestment 663 (161) 329 NM NM
Balance as of end-of-year $ 9,735 $ 8,653 $ 8,574 13% 1%
Mid – Large Market: Balance as of beginning-of-year $ 29,279 $ 28,067 $ 26,468 4% 6%Gross deposits 4,846 4,872 5,110 -1% -5%Withdrawals (3,934) (3,755) (5,078) -5% 26%
Net flows 912 1,117 32 -18% NMTransfers between fixed and variable accounts 135 34 (4) 297% NMChange in market value and reinvestment 2,061 61 1,571 NM -96%
Balance as of end-of-year $ 32,387 $ 29,279 $ 28,067 11% 4%
Multi-Fund® and Other: Balance as of beginning-of-year $ 16,168 $ 16,898 $ 16,947 -4% 0%Gross deposits 563 541 593 4% -9%Withdrawals (1,319) (1,467) (1,539) 10% 5%
Net flows (756) (926) (946) 18% 2%Change in market value and reinvestment 900 196 897 NM -78%
Balance as of end-of-year $ 16,312 $ 16,168 $ 16,898 1% -4%
Total: Balance as of beginning-of-year $ 54,100 $ 53,539 $ 51,618 1% 4%Gross deposits 7,657 7,545 7,515 1% 0%Withdrawals (7,092) (7,093) (8,396) 0% 16%
Net flows 565 452 (881) 25% 151%Transfers between fixed and variable accounts 144 13 5 NM 160%Change in market value and reinvestment 3,625 96 2,797 NM -97%
Balance as of end-of-year $ 58,434 $ 54,100 $ 53,539 8% 1% (1) Includes mutual fund account values and other third-party trustee-held assets. These items are not included in the separate accounts
reported on our Consolidated Balance Sheets as we do not have any ownership interest in them.
As of or For the Years Ended December 31, Change Over Prior Year 2016 2015 2014 2016 2015 Variable Account Value Information Variable annuity deposits (1) $ 1,693 $ 1,446 $ 1,354 17% 7%Increases (decreases) in variable annuity account values:
Net flows (1) (358) (644) (707) 44% 9%Change in market value (1) 1,112 (272) 864 NM NMTransfers from the variable portion of variable
annuity products to the fixed portion of variable annuity products (336) (267) (191) -26% -40%
Variable annuity account values (1) 14,511 14,094 15,277 3% -8%Average daily variable annuity account values (1) 13,950 14,861 15,259 -6% -3%Average daily S&P 500 2,094 2,061 1,931 2% 7% (1) Excludes the fixed portion of variable. We charge expense assessments to cover insurance and administrative expenses. Expense assessments are generally equal to a percentage of the daily variable account values. Average daily account values are driven by net flows and the equity markets. Our expense
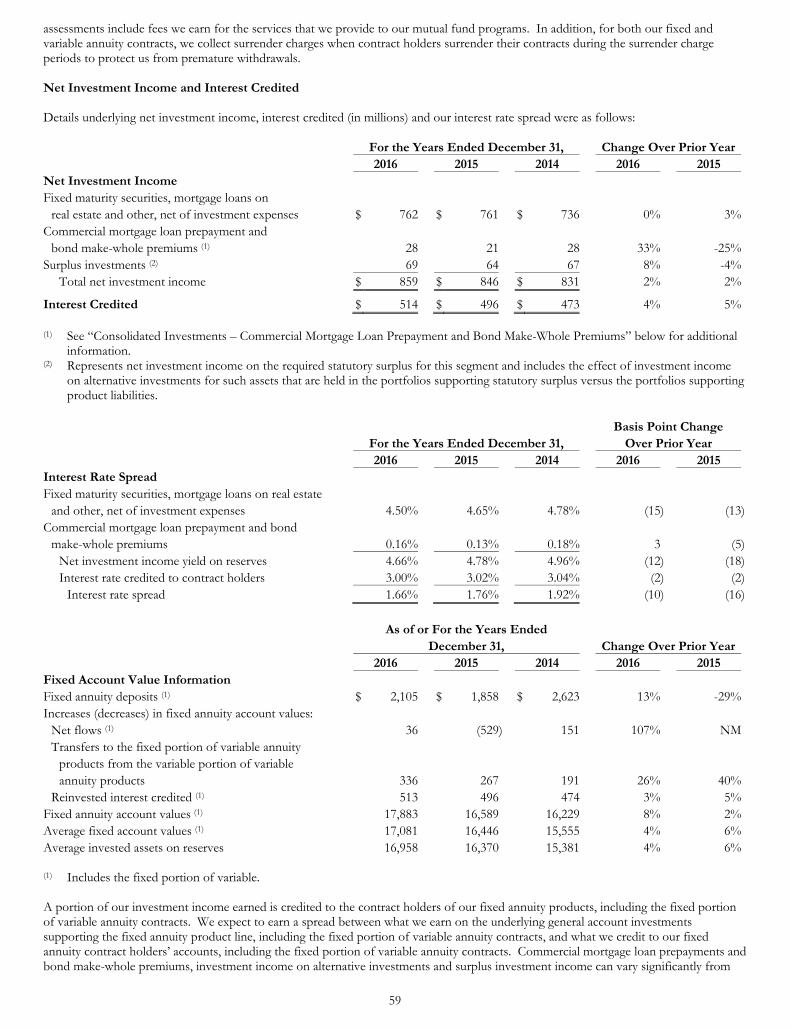
59
assessments include fees we earn for the services that we provide to our mutual fund programs. In addition, for both our fixed and variable annuity contracts, we collect surrender charges when contract holders surrender their contracts during the surrender charge periods to protect us from premature withdrawals. Net Investment Income and Interest Credited Details underlying net investment income, interest credited (in millions) and our interest rate spread were as follows:
For the Years Ended December 31, Change Over Prior Year 2016 2015 2014 2016 2015 Net Investment Income Fixed maturity securities, mortgage loans on
real estate and other, net of investment expenses $ 762 $ 761 $ 736 0% 3%Commercial mortgage loan prepayment and
bond make-whole premiums (1) 28 21 28 33% -25%Surplus investments (2) 69 64 67 8% -4%
Total net investment income $ 859 $ 846 $ 831 2% 2%
Interest Credited $ 514 $ 496 $ 473 4% 5% (1) See “Consolidated Investments – Commercial Mortgage Loan Prepayment and Bond Make-Whole Premiums” below for additional
information. (2) Represents net investment income on the required statutory surplus for this segment and includes the effect of investment income
on alternative investments for such assets that are held in the portfolios supporting statutory surplus versus the portfolios supporting product liabilities.
Basis Point Change For the Years Ended December 31, Over Prior Year 2016 2015 2014 2016 2015 Interest Rate Spread Fixed maturity securities, mortgage loans on real estate
and other, net of investment expenses 4.50% 4.65% 4.78% (15) (13)Commercial mortgage loan prepayment and bond
make-whole premiums 0.16% 0.13% 0.18% 3 (5)Net investment income yield on reserves 4.66% 4.78% 4.96% (12) (18)Interest rate credited to contract holders 3.00% 3.02% 3.04% (2) (2)
Interest rate spread 1.66% 1.76% 1.92% (10) (16)
As of or For the Years Ended December 31, Change Over Prior Year 2016 2015 2014 2016 2015 Fixed Account Value Information Fixed annuity deposits (1) $ 2,105 $ 1,858 $ 2,623 13% -29%Increases (decreases) in fixed annuity account values:
Net flows (1) 36 (529) 151 107% NMTransfers to the fixed portion of variable annuity
products from the variable portion of variable annuity products 336 267 191 26% 40%
Reinvested interest credited (1) 513 496 474 3% 5%Fixed annuity account values (1) 17,883 16,589 16,229 8% 2%Average fixed account values (1) 17,081 16,446 15,555 4% 6%Average invested assets on reserves 16,958 16,370 15,381 4% 6% (1) Includes the fixed portion of variable. A portion of our investment income earned is credited to the contract holders of our fixed annuity products, including the fixed portion of variable annuity contracts. We expect to earn a spread between what we earn on the underlying general account investments supporting the fixed annuity product line, including the fixed portion of variable annuity contracts, and what we credit to our fixed annuity contract holders’ accounts, including the fixed portion of variable annuity contracts. Commercial mortgage loan prepayments and bond make-whole premiums, investment income on alternative investments and surplus investment income can vary significantly from
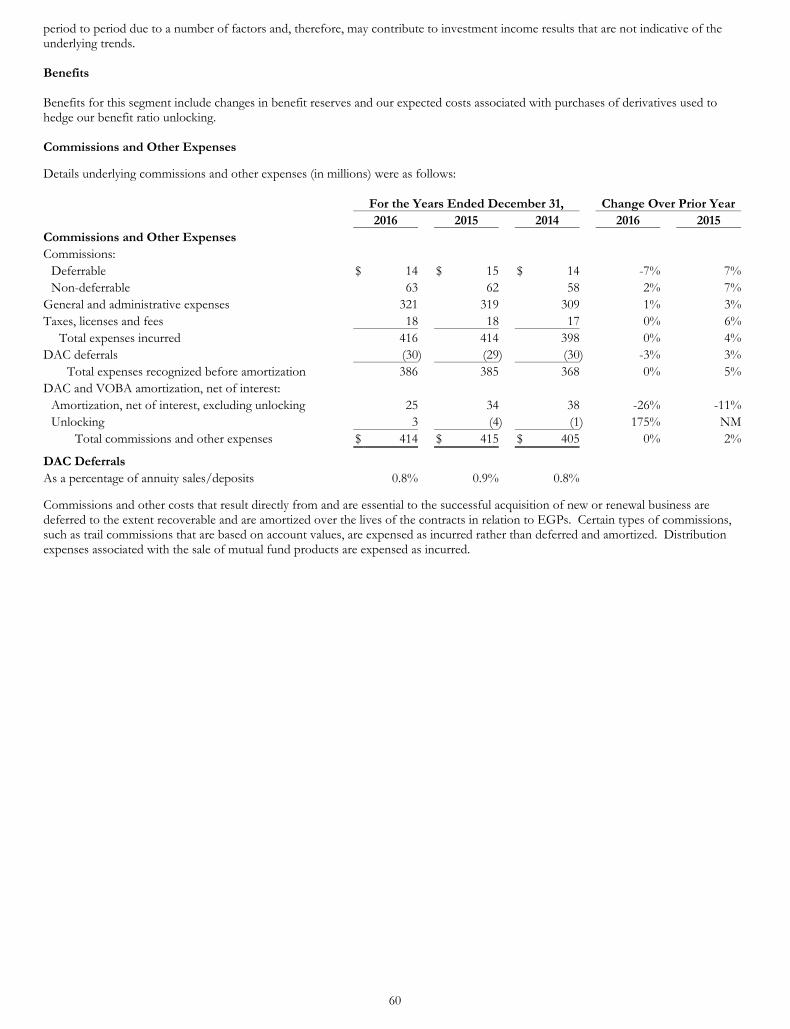
60
period to period due to a number of factors and, therefore, may contribute to investment income results that are not indicative of the underlying trends. Benefits Benefits for this segment include changes in benefit reserves and our expected costs associated with purchases of derivatives used to hedge our benefit ratio unlocking. Commissions and Other Expenses Details underlying commissions and other expenses (in millions) were as follows:
For the Years Ended December 31, Change Over Prior Year 2016 2015 2014 2016 2015 Commissions and Other Expenses Commissions:
Deferrable $ 14 $ 15 $ 14 -7% 7%Non-deferrable 63 62 58 2% 7%
General and administrative expenses 321 319 309 1% 3%Taxes, licenses and fees 18 18 17 0% 6%
Total expenses incurred 416 414 398 0% 4%DAC deferrals (30) (29) (30) -3% 3%
Total expenses recognized before amortization 386 385 368 0% 5%DAC and VOBA amortization, net of interest:
Amortization, net of interest, excluding unlocking 25 34 38 -26% -11%Unlocking 3 (4) (1) 175% NM
Total commissions and other expenses $ 414 $ 415 $ 405 0% 2%
DAC Deferrals As a percentage of annuity sales/deposits 0.8% 0.9% 0.8% Commissions and other costs that result directly from and are essential to the successful acquisition of new or renewal business are deferred to the extent recoverable and are amortized over the lives of the contracts in relation to EGPs. Certain types of commissions, such as trail commissions that are based on account values, are expensed as incurred rather than deferred and amortized. Distribution expenses associated with the sale of mutual fund products are expensed as incurred.
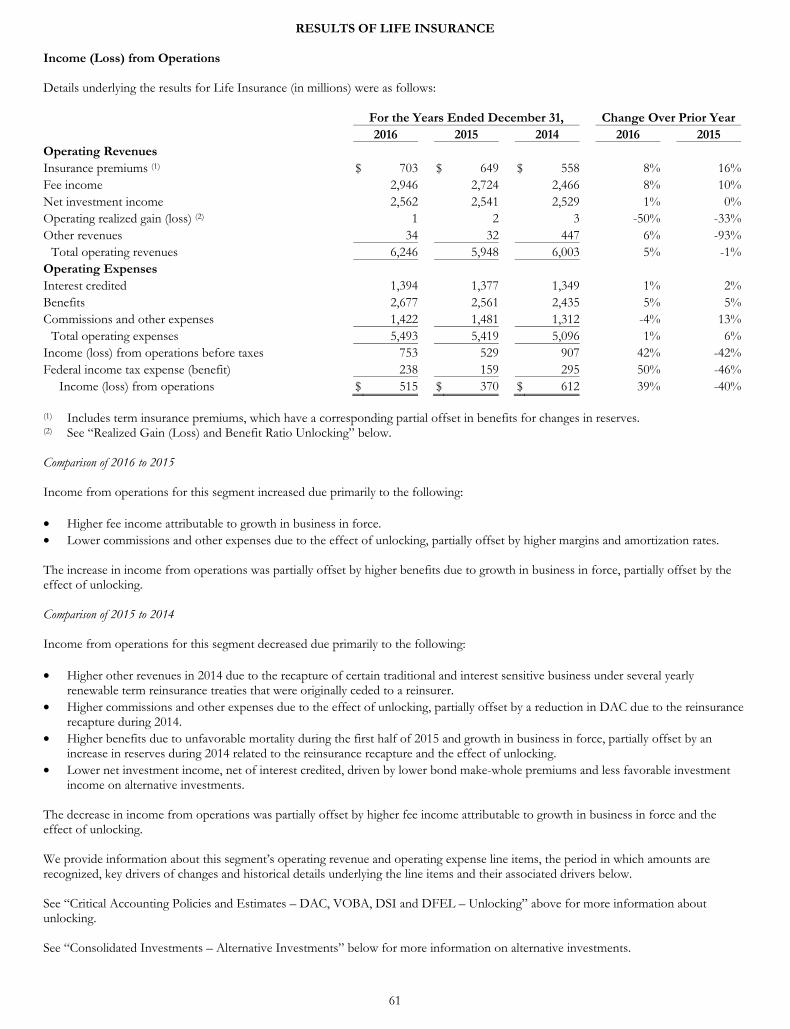
61
RESULTS OF LIFE INSURANCE Income (Loss) from Operations Details underlying the results for Life Insurance (in millions) were as follows:
For the Years Ended December 31, Change Over Prior Year 2016 2015 2014 2016 2015 Operating Revenues Insurance premiums (1) $ 703 $ 649 $ 558 8% 16%Fee income 2,946 2,724 2,466 8% 10%Net investment income 2,562 2,541 2,529 1% 0%Operating realized gain (loss) (2) 1 2 3 -50% -33%Other revenues 34 32 447 6% -93%
Total operating revenues 6,246 5,948 6,003 5% -1%Operating Expenses Interest credited 1,394 1,377 1,349 1% 2%Benefits 2,677 2,561 2,435 5% 5%Commissions and other expenses 1,422 1,481 1,312 -4% 13%
Total operating expenses 5,493 5,419 5,096 1% 6%Income (loss) from operations before taxes 753 529 907 42% -42%Federal income tax expense (benefit) 238 159 295 50% -46%
Income (loss) from operations $ 515 $ 370 $ 612 39% -40% (1) Includes term insurance premiums, which have a corresponding partial offset in benefits for changes in reserves. (2) See “Realized Gain (Loss) and Benefit Ratio Unlocking” below. Comparison of 2016 to 2015 Income from operations for this segment increased due primarily to the following: • Higher fee income attributable to growth in business in force. • Lower commissions and other expenses due to the effect of unlocking, partially offset by higher margins and amortization rates. The increase in income from operations was partially offset by higher benefits due to growth in business in force, partially offset by the effect of unlocking. Comparison of 2015 to 2014 Income from operations for this segment decreased due primarily to the following: • Higher other revenues in 2014 due to the recapture of certain traditional and interest sensitive business under several yearly
renewable term reinsurance treaties that were originally ceded to a reinsurer. • Higher commissions and other expenses due to the effect of unlocking, partially offset by a reduction in DAC due to the reinsurance
recapture during 2014. • Higher benefits due to unfavorable mortality during the first half of 2015 and growth in business in force, partially offset by an
increase in reserves during 2014 related to the reinsurance recapture and the effect of unlocking. • Lower net investment income, net of interest credited, driven by lower bond make-whole premiums and less favorable investment
income on alternative investments. The decrease in income from operations was partially offset by higher fee income attributable to growth in business in force and the effect of unlocking. We provide information about this segment’s operating revenue and operating expense line items, the period in which amounts are recognized, key drivers of changes and historical details underlying the line items and their associated drivers below. See “Critical Accounting Policies and Estimates – DAC, VOBA, DSI and DFEL – Unlocking” above for more information about unlocking. See “Consolidated Investments – Alternative Investments” below for more information on alternative investments.
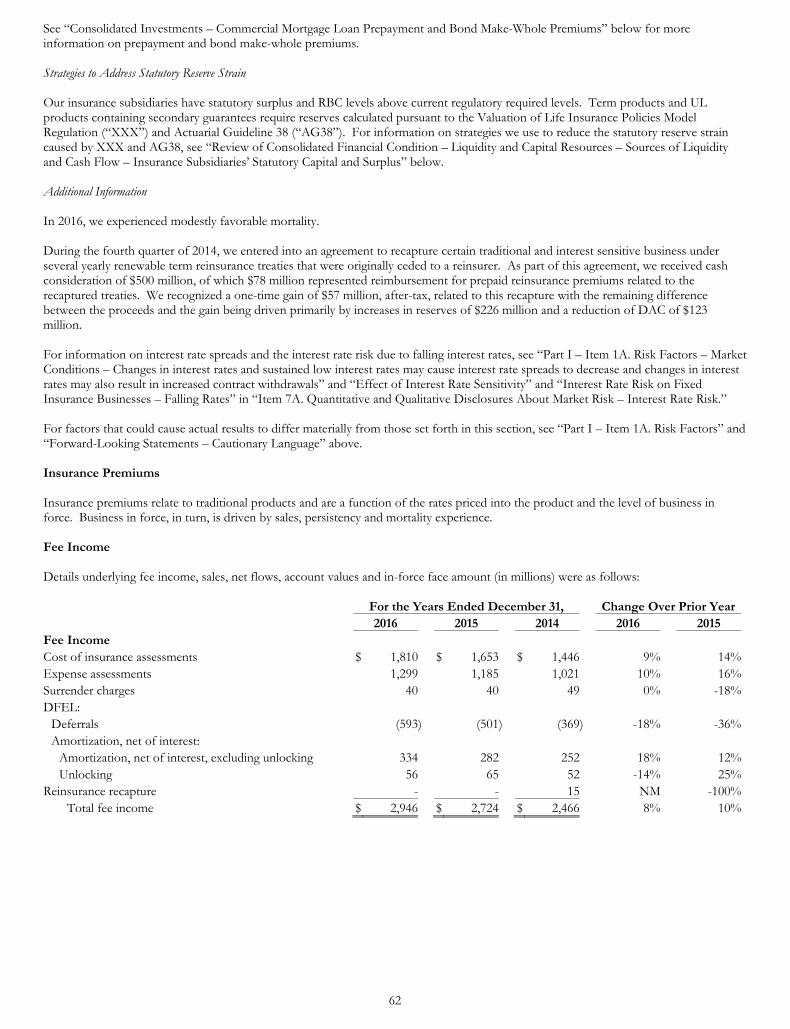
62
See “Consolidated Investments – Commercial Mortgage Loan Prepayment and Bond Make-Whole Premiums” below for more information on prepayment and bond make-whole premiums. Strategies to Address Statutory Reserve Strain Our insurance subsidiaries have statutory surplus and RBC levels above current regulatory required levels. Term products and UL products containing secondary guarantees require reserves calculated pursuant to the Valuation of Life Insurance Policies Model Regulation (“XXX”) and Actuarial Guideline 38 (“AG38”). For information on strategies we use to reduce the statutory reserve strain caused by XXX and AG38, see “Review of Consolidated Financial Condition – Liquidity and Capital Resources – Sources of Liquidity and Cash Flow – Insurance Subsidiaries’ Statutory Capital and Surplus” below. Additional Information In 2016, we experienced modestly favorable mortality. During the fourth quarter of 2014, we entered into an agreement to recapture certain traditional and interest sensitive business under several yearly renewable term reinsurance treaties that were originally ceded to a reinsurer. As part of this agreement, we received cash consideration of $500 million, of which $78 million represented reimbursement for prepaid reinsurance premiums related to the recaptured treaties. We recognized a one-time gain of $57 million, after-tax, related to this recapture with the remaining difference between the proceeds and the gain being driven primarily by increases in reserves of $226 million and a reduction of DAC of $123 million. For information on interest rate spreads and the interest rate risk due to falling interest rates, see “Part I – Item 1A. Risk Factors – Market Conditions – Changes in interest rates and sustained low interest rates may cause interest rate spreads to decrease and changes in interest rates may also result in increased contract withdrawals” and “Effect of Interest Rate Sensitivity” and “Interest Rate Risk on Fixed Insurance Businesses – Falling Rates” in “Item 7A. Quantitative and Qualitative Disclosures About Market Risk – Interest Rate Risk.” For factors that could cause actual results to differ materially from those set forth in this section, see “Part I – Item 1A. Risk Factors” and “Forward-Looking Statements – Cautionary Language” above. Insurance Premiums Insurance premiums relate to traditional products and are a function of the rates priced into the product and the level of business in force. Business in force, in turn, is driven by sales, persistency and mortality experience. Fee Income Details underlying fee income, sales, net flows, account values and in-force face amount (in millions) were as follows:
For the Years Ended December 31, Change Over Prior Year 2016 2015 2014 2016 2015 Fee Income Cost of insurance assessments $ 1,810 $ 1,653 $ 1,446 9% 14%Expense assessments 1,299 1,185 1,021 10% 16%Surrender charges 40 40 49 0% -18%DFEL:
Deferrals (593) (501) (369) -18% -36%Amortization, net of interest:
Amortization, net of interest, excluding unlocking 334 282 252 18% 12%Unlocking 56 65 52 -14% 25%
Reinsurance recapture - - 15 NM -100%Total fee income $ 2,946 $ 2,724 $ 2,466 8% 10%
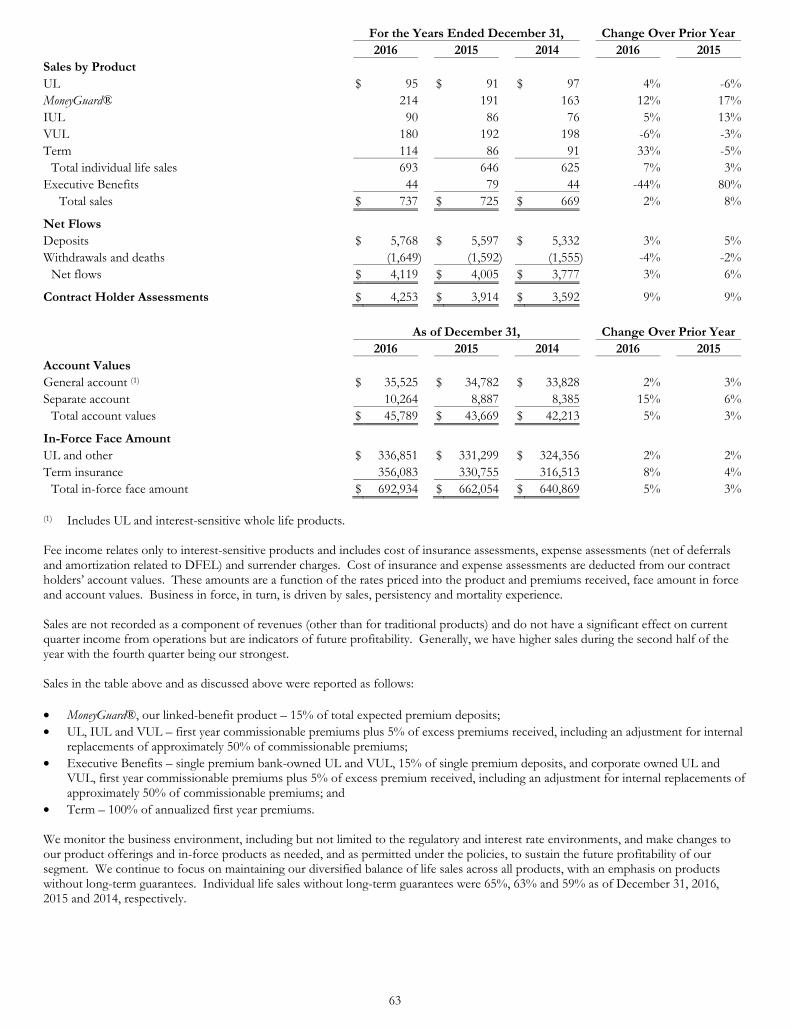
63
For the Years Ended December 31, Change Over Prior Year 2016 2015 2014 2016 2015 Sales by Product UL $ 95 $ 91 $ 97 4% -6%MoneyGuard® 214 191 163 12% 17%IUL 90 86 76 5% 13%VUL 180 192 198 -6% -3%Term 114 86 91 33% -5%
Total individual life sales 693 646 625 7% 3%Executive Benefits 44 79 44 -44% 80%
Total sales $ 737 $ 725 $ 669 2% 8%
Net Flows Deposits $ 5,768 $ 5,597 $ 5,332 3% 5%Withdrawals and deaths (1,649) (1,592) (1,555) -4% -2%
Net flows $ 4,119 $ 4,005 $ 3,777 3% 6%
Contract Holder Assessments $ 4,253 $ 3,914 $ 3,592 9% 9%
As of December 31, Change Over Prior Year 2016 2015 2014 2016 2015 Account Values General account (1) $ 35,525 $ 34,782 $ 33,828 2% 3%Separate account 10,264 8,887 8,385 15% 6%
Total account values $ 45,789 $ 43,669 $ 42,213 5% 3%
In-Force Face Amount UL and other $ 336,851 $ 331,299 $ 324,356 2% 2%Term insurance 356,083 330,755 316,513 8% 4%
Total in-force face amount $ 692,934 $ 662,054 $ 640,869 5% 3% (1) Includes UL and interest-sensitive whole life products. Fee income relates only to interest-sensitive products and includes cost of insurance assessments, expense assessments (net of deferrals and amortization related to DFEL) and surrender charges. Cost of insurance and expense assessments are deducted from our contract holders’ account values. These amounts are a function of the rates priced into the product and premiums received, face amount in force and account values. Business in force, in turn, is driven by sales, persistency and mortality experience. Sales are not recorded as a component of revenues (other than for traditional products) and do not have a significant effect on current quarter income from operations but are indicators of future profitability. Generally, we have higher sales during the second half of the year with the fourth quarter being our strongest. Sales in the table above and as discussed above were reported as follows: • MoneyGuard®, our linked-benefit product – 15% of total expected premium deposits; • UL, IUL and VUL – first year commissionable premiums plus 5% of excess premiums received, including an adjustment for internal
replacements of approximately 50% of commissionable premiums; • Executive Benefits – single premium bank-owned UL and VUL, 15% of single premium deposits, and corporate owned UL and
VUL, first year commissionable premiums plus 5% of excess premium received, including an adjustment for internal replacements of approximately 50% of commissionable premiums; and
• Term – 100% of annualized first year premiums. We monitor the business environment, including but not limited to the regulatory and interest rate environments, and make changes to our product offerings and in-force products as needed, and as permitted under the policies, to sustain the future profitability of our segment. We continue to focus on maintaining our diversified balance of life sales across all products, with an emphasis on products without long-term guarantees. Individual life sales without long-term guarantees were 65%, 63% and 59% as of December 31, 2016, 2015 and 2014, respectively.
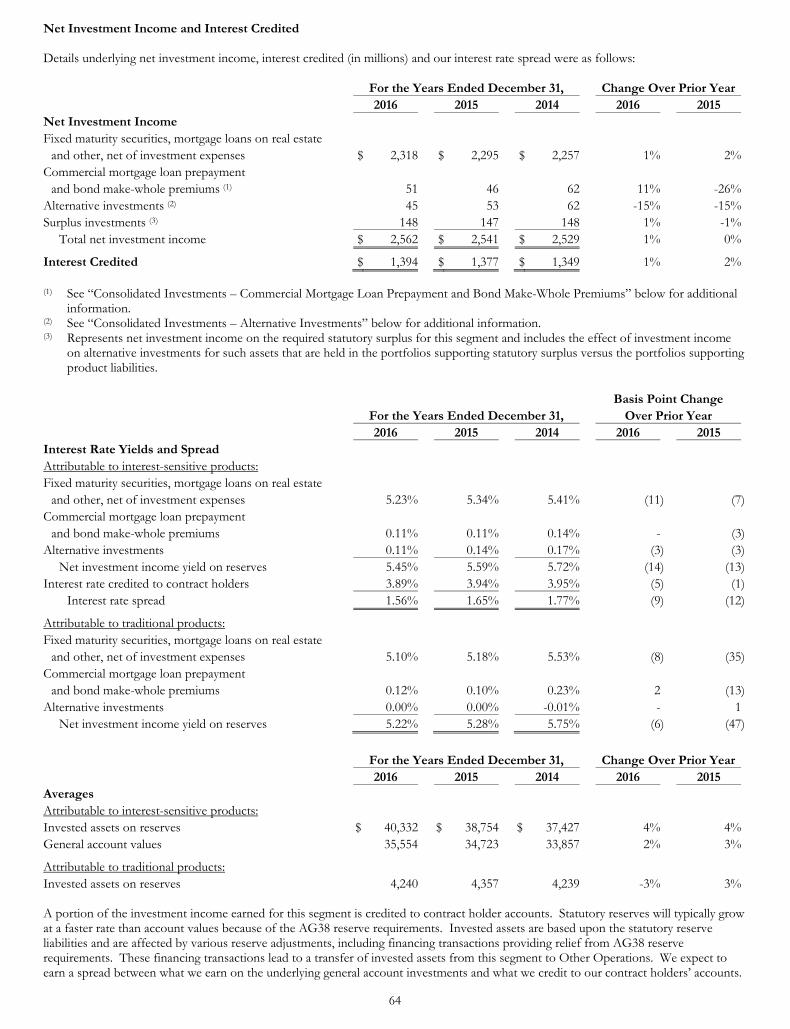
64
Net Investment Income and Interest Credited Details underlying net investment income, interest credited (in millions) and our interest rate spread were as follows:
For the Years Ended December 31, Change Over Prior Year 2016 2015 2014 2016 2015 Net Investment Income Fixed maturity securities, mortgage loans on real estate
and other, net of investment expenses $ 2,318 $ 2,295 $ 2,257 1% 2%Commercial mortgage loan prepayment
and bond make-whole premiums (1) 51 46 62 11% -26%Alternative investments (2) 45 53 62 -15% -15%Surplus investments (3) 148 147 148 1% -1%
Total net investment income $ 2,562 $ 2,541 $ 2,529 1% 0%
Interest Credited $ 1,394 $ 1,377 $ 1,349 1% 2% (1) See “Consolidated Investments – Commercial Mortgage Loan Prepayment and Bond Make-Whole Premiums” below for additional
information. (2) See “Consolidated Investments – Alternative Investments” below for additional information. (3) Represents net investment income on the required statutory surplus for this segment and includes the effect of investment income
on alternative investments for such assets that are held in the portfolios supporting statutory surplus versus the portfolios supporting product liabilities.
Basis Point Change For the Years Ended December 31, Over Prior Year 2016 2015 2014 2016 2015 Interest Rate Yields and Spread Attributable to interest-sensitive products: Fixed maturity securities, mortgage loans on real estate
and other, net of investment expenses 5.23% 5.34% 5.41% (11) (7)Commercial mortgage loan prepayment
and bond make-whole premiums 0.11% 0.11% 0.14% - (3)Alternative investments 0.11% 0.14% 0.17% (3) (3)
Net investment income yield on reserves 5.45% 5.59% 5.72% (14) (13)Interest rate credited to contract holders 3.89% 3.94% 3.95% (5) (1)
Interest rate spread 1.56% 1.65% 1.77% (9) (12)
Attributable to traditional products: Fixed maturity securities, mortgage loans on real estate
and other, net of investment expenses 5.10% 5.18% 5.53% (8) (35)Commercial mortgage loan prepayment
and bond make-whole premiums 0.12% 0.10% 0.23% 2 (13)Alternative investments 0.00% 0.00% -0.01% - 1
Net investment income yield on reserves 5.22% 5.28% 5.75% (6) (47)
For the Years Ended December 31, Change Over Prior Year 2016 2015 2014 2016 2015 Averages Attributable to interest-sensitive products: Invested assets on reserves $ 40,332 $ 38,754 $ 37,427 4% 4%General account values 35,554 34,723 33,857 2% 3%
Attributable to traditional products: Invested assets on reserves 4,240 4,357 4,239 -3% 3% A portion of the investment income earned for this segment is credited to contract holder accounts. Statutory reserves will typically grow at a faster rate than account values because of the AG38 reserve requirements. Invested assets are based upon the statutory reserve liabilities and are affected by various reserve adjustments, including financing transactions providing relief from AG38 reserve requirements. These financing transactions lead to a transfer of invested assets from this segment to Other Operations. We expect to earn a spread between what we earn on the underlying general account investments and what we credit to our contract holders’ accounts.
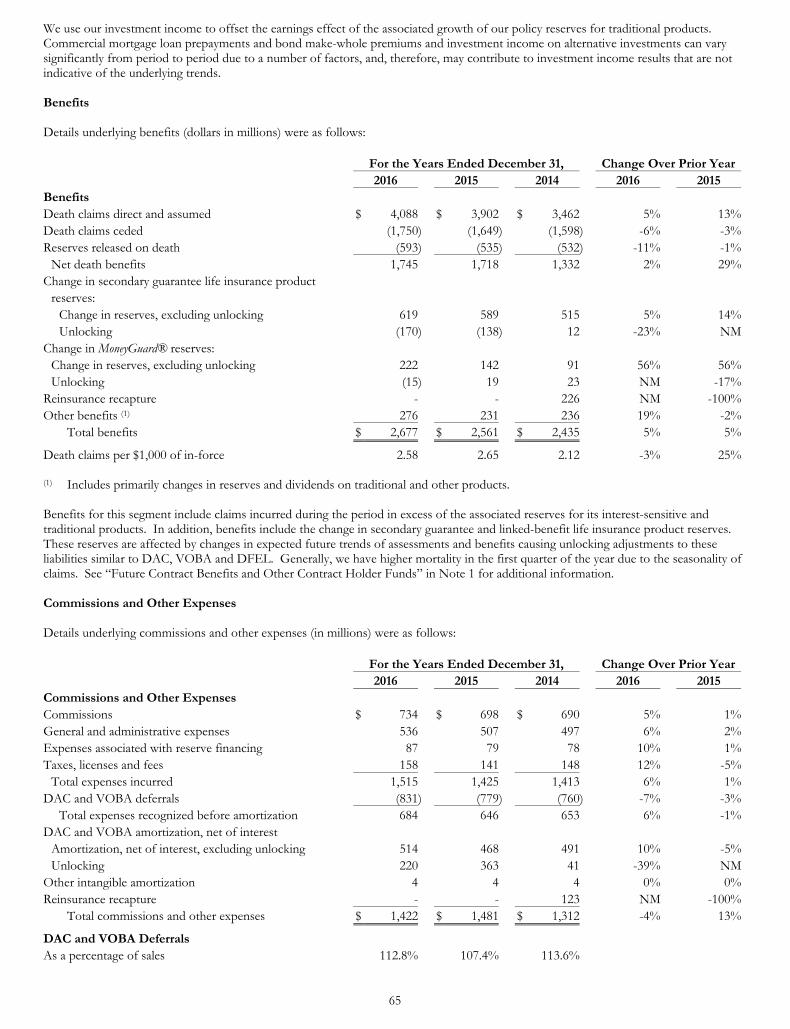
65
We use our investment income to offset the earnings effect of the associated growth of our policy reserves for traditional products. Commercial mortgage loan prepayments and bond make-whole premiums and investment income on alternative investments can vary significantly from period to period due to a number of factors, and, therefore, may contribute to investment income results that are not indicative of the underlying trends. Benefits Details underlying benefits (dollars in millions) were as follows:
For the Years Ended December 31, Change Over Prior Year 2016 2015 2014 2016 2015 Benefits Death claims direct and assumed $ 4,088 $ 3,902 $ 3,462 5% 13%Death claims ceded (1,750) (1,649) (1,598) -6% -3%Reserves released on death (593) (535) (532) -11% -1%
Net death benefits 1,745 1,718 1,332 2% 29%Change in secondary guarantee life insurance product
reserves: Change in reserves, excluding unlocking 619 589 515 5% 14%Unlocking (170) (138) 12 -23% NM
Change in MoneyGuard® reserves: Change in reserves, excluding unlocking 222 142 91 56% 56%Unlocking (15) 19 23 NM -17%
Reinsurance recapture - - 226 NM -100%Other benefits (1) 276 231 236 19% -2%
Total benefits $ 2,677 $ 2,561 $ 2,435 5% 5%
Death claims per $1,000 of in-force 2.58 2.65 2.12 -3% 25% (1) Includes primarily changes in reserves and dividends on traditional and other products. Benefits for this segment include claims incurred during the period in excess of the associated reserves for its interest-sensitive and traditional products. In addition, benefits include the change in secondary guarantee and linked-benefit life insurance product reserves. These reserves are affected by changes in expected future trends of assessments and benefits causing unlocking adjustments to these liabilities similar to DAC, VOBA and DFEL. Generally, we have higher mortality in the first quarter of the year due to the seasonality of claims. See “Future Contract Benefits and Other Contract Holder Funds” in Note 1 for additional information. Commissions and Other Expenses Details underlying commissions and other expenses (in millions) were as follows:
For the Years Ended December 31, Change Over Prior Year 2016 2015 2014 2016 2015 Commissions and Other Expenses Commissions $ 734 $ 698 $ 690 5% 1%General and administrative expenses 536 507 497 6% 2%Expenses associated with reserve financing 87 79 78 10% 1%Taxes, licenses and fees 158 141 148 12% -5%
Total expenses incurred 1,515 1,425 1,413 6% 1%DAC and VOBA deferrals (831) (779) (760) -7% -3%
Total expenses recognized before amortization 684 646 653 6% -1%DAC and VOBA amortization, net of interest
Amortization, net of interest, excluding unlocking 514 468 491 10% -5%Unlocking 220 363 41 -39% NM
Other intangible amortization 4 4 4 0% 0%Reinsurance recapture - - 123 NM -100%
Total commissions and other expenses $ 1,422 $ 1,481 $ 1,312 -4% 13%
DAC and VOBA Deferrals As a percentage of sales 112.8% 107.4% 113.6%
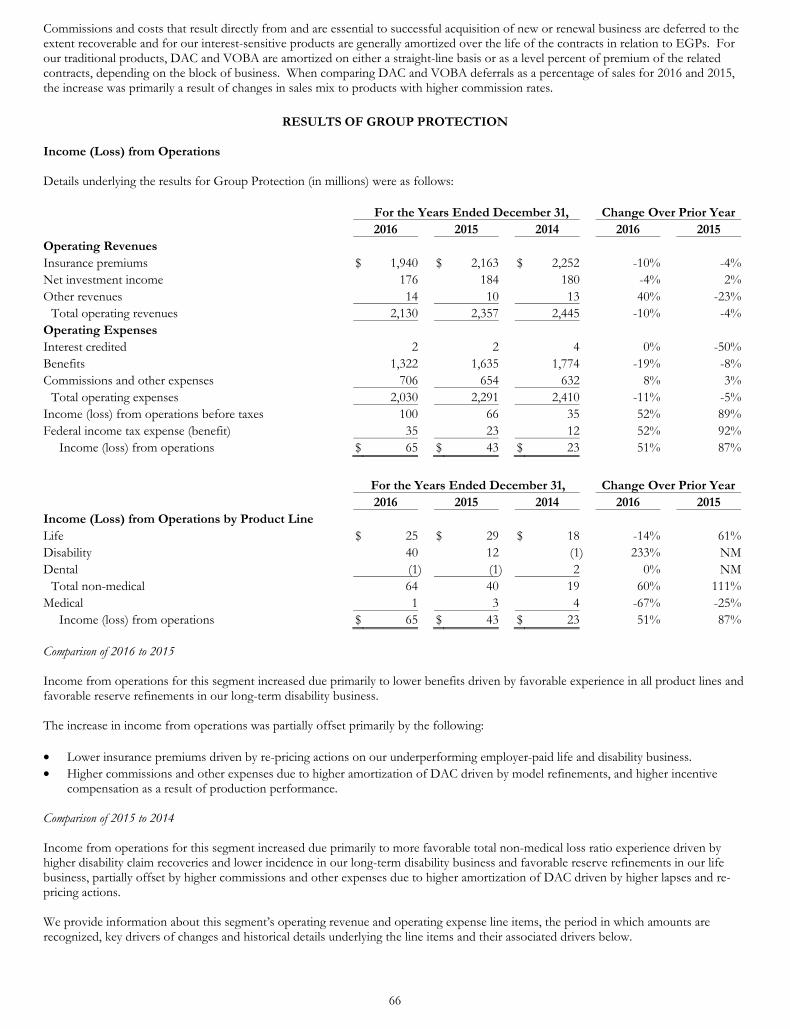
66
Commissions and costs that result directly from and are essential to successful acquisition of new or renewal business are deferred to the extent recoverable and for our interest-sensitive products are generally amortized over the life of the contracts in relation to EGPs. For our traditional products, DAC and VOBA are amortized on either a straight-line basis or as a level percent of premium of the related contracts, depending on the block of business. When comparing DAC and VOBA deferrals as a percentage of sales for 2016 and 2015, the increase was primarily a result of changes in sales mix to products with higher commission rates.
RESULTS OF GROUP PROTECTION
Income (Loss) from Operations Details underlying the results for Group Protection (in millions) were as follows:
For the Years Ended December 31, Change Over Prior Year 2016 2015 2014 2016 2015 Operating Revenues Insurance premiums $ 1,940 $ 2,163 $ 2,252 -10% -4%Net investment income 176 184 180 -4% 2%Other revenues 14 10 13 40% -23%
Total operating revenues 2,130 2,357 2,445 -10% -4%Operating Expenses Interest credited 2 2 4 0% -50%Benefits 1,322 1,635 1,774 -19% -8%Commissions and other expenses 706 654 632 8% 3%
Total operating expenses 2,030 2,291 2,410 -11% -5%Income (loss) from operations before taxes 100 66 35 52% 89%Federal income tax expense (benefit) 35 23 12 52% 92%
Income (loss) from operations $ 65 $ 43 $ 23 51% 87%
For the Years Ended December 31, Change Over Prior Year 2016 2015 2014 2016 2015 Income (Loss) from Operations by Product Line Life $ 25 $ 29 $ 18 -14% 61%Disability 40 12 (1) 233% NMDental (1) (1) 2 0% NM
Total non-medical 64 40 19 60% 111%Medical 1 3 4 -67% -25%
Income (loss) from operations $ 65 $ 43 $ 23 51% 87% Comparison of 2016 to 2015 Income from operations for this segment increased due primarily to lower benefits driven by favorable experience in all product lines and favorable reserve refinements in our long-term disability business. The increase in income from operations was partially offset primarily by the following: • Lower insurance premiums driven by re-pricing actions on our underperforming employer-paid life and disability business. • Higher commissions and other expenses due to higher amortization of DAC driven by model refinements, and higher incentive
compensation as a result of production performance. Comparison of 2015 to 2014 Income from operations for this segment increased due primarily to more favorable total non-medical loss ratio experience driven by higher disability claim recoveries and lower incidence in our long-term disability business and favorable reserve refinements in our life business, partially offset by higher commissions and other expenses due to higher amortization of DAC driven by higher lapses and re-pricing actions. We provide information about this segment’s operating revenue and operating expense line items, the period in which amounts are recognized, key drivers of changes and historical details underlying the line items and their associated drivers below.
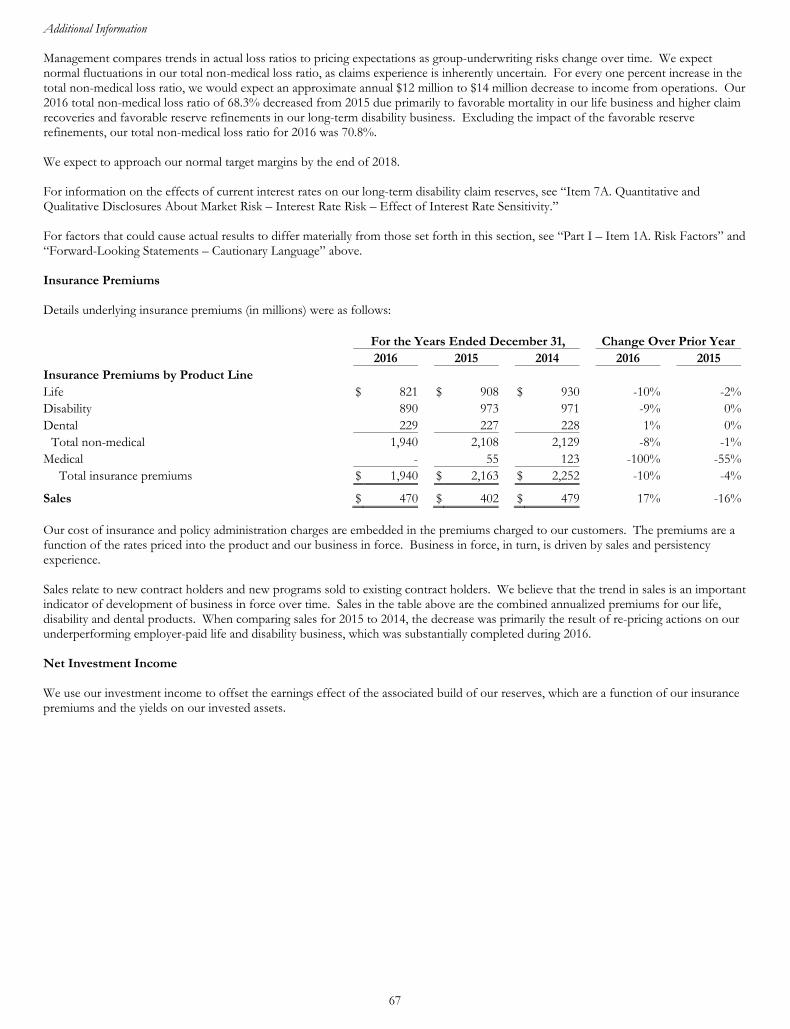
67
Additional Information Management compares trends in actual loss ratios to pricing expectations as group-underwriting risks change over time. We expect normal fluctuations in our total non-medical loss ratio, as claims experience is inherently uncertain. For every one percent increase in the total non-medical loss ratio, we would expect an approximate annual $12 million to $14 million decrease to income from operations. Our 2016 total non-medical loss ratio of 68.3% decreased from 2015 due primarily to favorable mortality in our life business and higher claim recoveries and favorable reserve refinements in our long-term disability business. Excluding the impact of the favorable reserve refinements, our total non-medical loss ratio for 2016 was 70.8%. We expect to approach our normal target margins by the end of 2018. For information on the effects of current interest rates on our long-term disability claim reserves, see “Item 7A. Quantitative and Qualitative Disclosures About Market Risk – Interest Rate Risk – Effect of Interest Rate Sensitivity.” For factors that could cause actual results to differ materially from those set forth in this section, see “Part I – Item 1A. Risk Factors” and “Forward-Looking Statements – Cautionary Language” above. Insurance Premiums Details underlying insurance premiums (in millions) were as follows:
For the Years Ended December 31, Change Over Prior Year 2016 2015 2014 2016 2015 Insurance Premiums by Product Line Life $ 821 $ 908 $ 930 -10% -2%Disability 890 973 971 -9% 0%Dental 229 227 228 1% 0%
Total non-medical 1,940 2,108 2,129 -8% -1%Medical - 55 123 -100% -55%
Total insurance premiums $ 1,940 $ 2,163 $ 2,252 -10% -4%
Sales $ 470 $ 402 $ 479 17% -16% Our cost of insurance and policy administration charges are embedded in the premiums charged to our customers. The premiums are a function of the rates priced into the product and our business in force. Business in force, in turn, is driven by sales and persistency experience. Sales relate to new contract holders and new programs sold to existing contract holders. We believe that the trend in sales is an important indicator of development of business in force over time. Sales in the table above are the combined annualized premiums for our life, disability and dental products. When comparing sales for 2015 to 2014, the decrease was primarily the result of re-pricing actions on our underperforming employer-paid life and disability business, which was substantially completed during 2016. Net Investment Income We use our investment income to offset the earnings effect of the associated build of our reserves, which are a function of our insurance premiums and the yields on our invested assets.
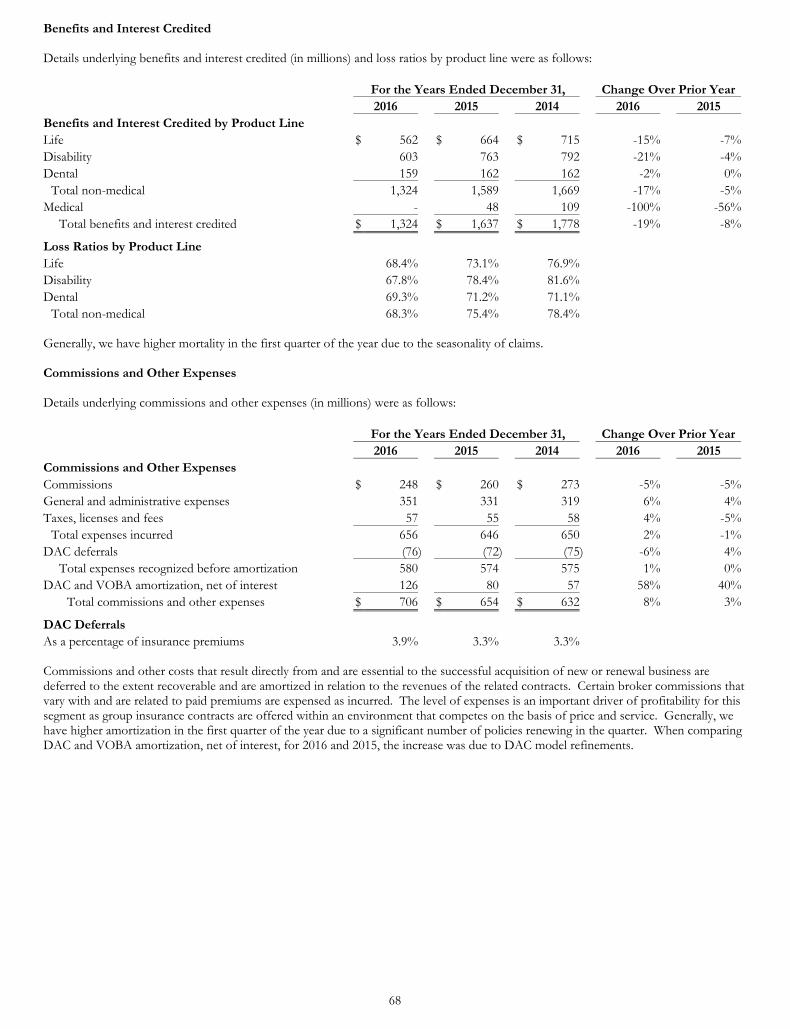
68
Benefits and Interest Credited Details underlying benefits and interest credited (in millions) and loss ratios by product line were as follows:
For the Years Ended December 31, Change Over Prior Year 2016 2015 2014 2016 2015 Benefits and Interest Credited by Product Line Life $ 562 $ 664 $ 715 -15% -7%Disability 603 763 792 -21% -4%Dental 159 162 162 -2% 0%
Total non-medical 1,324 1,589 1,669 -17% -5%Medical - 48 109 -100% -56%
Total benefits and interest credited $ 1,324 $ 1,637 $ 1,778 -19% -8%
Loss Ratios by Product Line Life 68.4% 73.1% 76.9% Disability 67.8% 78.4% 81.6% Dental 69.3% 71.2% 71.1%
Total non-medical 68.3% 75.4% 78.4% Generally, we have higher mortality in the first quarter of the year due to the seasonality of claims. Commissions and Other Expenses Details underlying commissions and other expenses (in millions) were as follows:
For the Years Ended December 31, Change Over Prior Year 2016 2015 2014 2016 2015 Commissions and Other Expenses Commissions $ 248 $ 260 $ 273 -5% -5%General and administrative expenses 351 331 319 6% 4%Taxes, licenses and fees 57 55 58 4% -5%
Total expenses incurred 656 646 650 2% -1%DAC deferrals (76) (72) (75) -6% 4%
Total expenses recognized before amortization 580 574 575 1% 0%DAC and VOBA amortization, net of interest 126 80 57 58% 40%
Total commissions and other expenses $ 706 $ 654 $ 632 8% 3%
DAC Deferrals As a percentage of insurance premiums 3.9% 3.3% 3.3% Commissions and other costs that result directly from and are essential to the successful acquisition of new or renewal business are deferred to the extent recoverable and are amortized in relation to the revenues of the related contracts. Certain broker commissions that vary with and are related to paid premiums are expensed as incurred. The level of expenses is an important driver of profitability for this segment as group insurance contracts are offered within an environment that competes on the basis of price and service. Generally, we have higher amortization in the first quarter of the year due to a significant number of policies renewing in the quarter. When comparing DAC and VOBA amortization, net of interest, for 2016 and 2015, the increase was due to DAC model refinements.
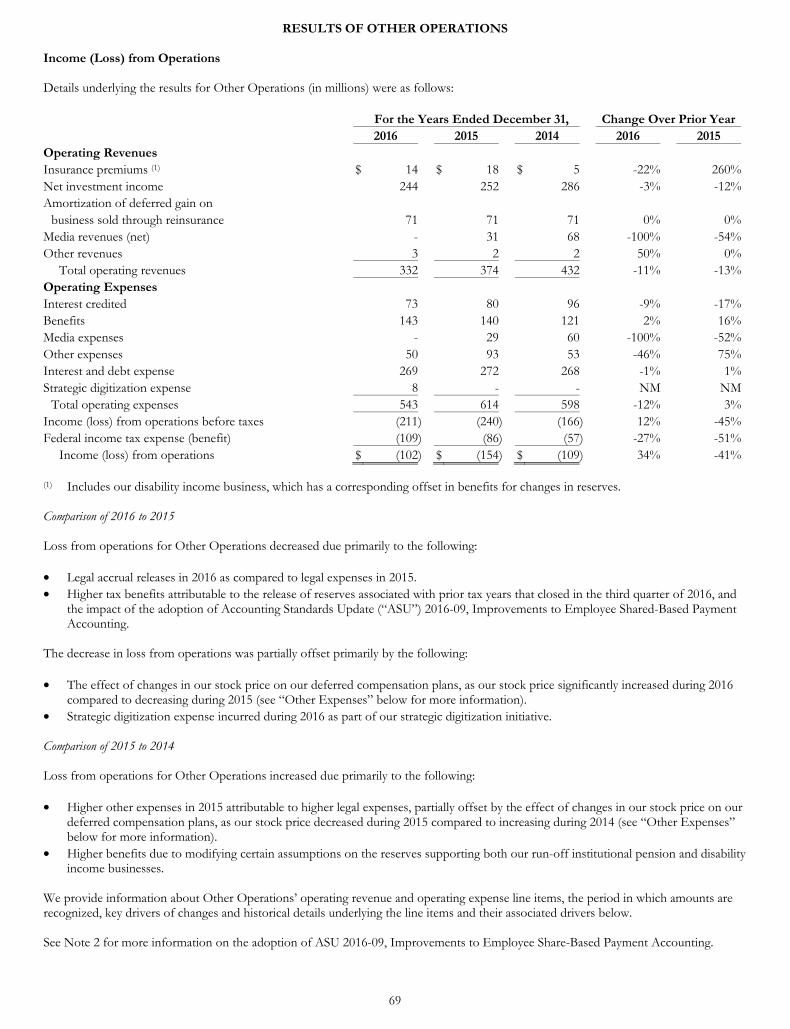
69
RESULTS OF OTHER OPERATIONS
Income (Loss) from Operations Details underlying the results for Other Operations (in millions) were as follows:
For the Years Ended December 31, Change Over Prior Year 2016 2015 2014 2016 2015 Operating Revenues Insurance premiums (1) $ 14 $ 18 $ 5 -22% 260%Net investment income 244 252 286 -3% -12%Amortization of deferred gain on
business sold through reinsurance 71 71 71 0% 0%Media revenues (net) - 31 68 -100% -54%Other revenues 3 2 2 50% 0%
Total operating revenues 332 374 432 -11% -13%Operating Expenses Interest credited 73 80 96 -9% -17%Benefits 143 140 121 2% 16%Media expenses - 29 60 -100% -52%Other expenses 50 93 53 -46% 75%Interest and debt expense 269 272 268 -1% 1%Strategic digitization expense 8 - - NM NM
Total operating expenses 543 614 598 -12% 3%Income (loss) from operations before taxes (211) (240) (166) 12% -45%Federal income tax expense (benefit) (109) (86) (57) -27% -51%
Income (loss) from operations $ (102) $ (154) $ (109) 34% -41% (1) Includes our disability income business, which has a corresponding offset in benefits for changes in reserves. Comparison of 2016 to 2015 Loss from operations for Other Operations decreased due primarily to the following: • Legal accrual releases in 2016 as compared to legal expenses in 2015. • Higher tax benefits attributable to the release of reserves associated with prior tax years that closed in the third quarter of 2016, and
the impact of the adoption of Accounting Standards Update (“ASU”) 2016-09, Improvements to Employee Shared-Based Payment Accounting.
The decrease in loss from operations was partially offset primarily by the following: • The effect of changes in our stock price on our deferred compensation plans, as our stock price significantly increased during 2016
compared to decreasing during 2015 (see “Other Expenses” below for more information). • Strategic digitization expense incurred during 2016 as part of our strategic digitization initiative. Comparison of 2015 to 2014 Loss from operations for Other Operations increased due primarily to the following: • Higher other expenses in 2015 attributable to higher legal expenses, partially offset by the effect of changes in our stock price on our
deferred compensation plans, as our stock price decreased during 2015 compared to increasing during 2014 (see “Other Expenses” below for more information).
• Higher benefits due to modifying certain assumptions on the reserves supporting both our run-off institutional pension and disability income businesses.
We provide information about Other Operations’ operating revenue and operating expense line items, the period in which amounts are recognized, key drivers of changes and historical details underlying the line items and their associated drivers below. See Note 2 for more information on the adoption of ASU 2016-09, Improvements to Employee Share-Based Payment Accounting.
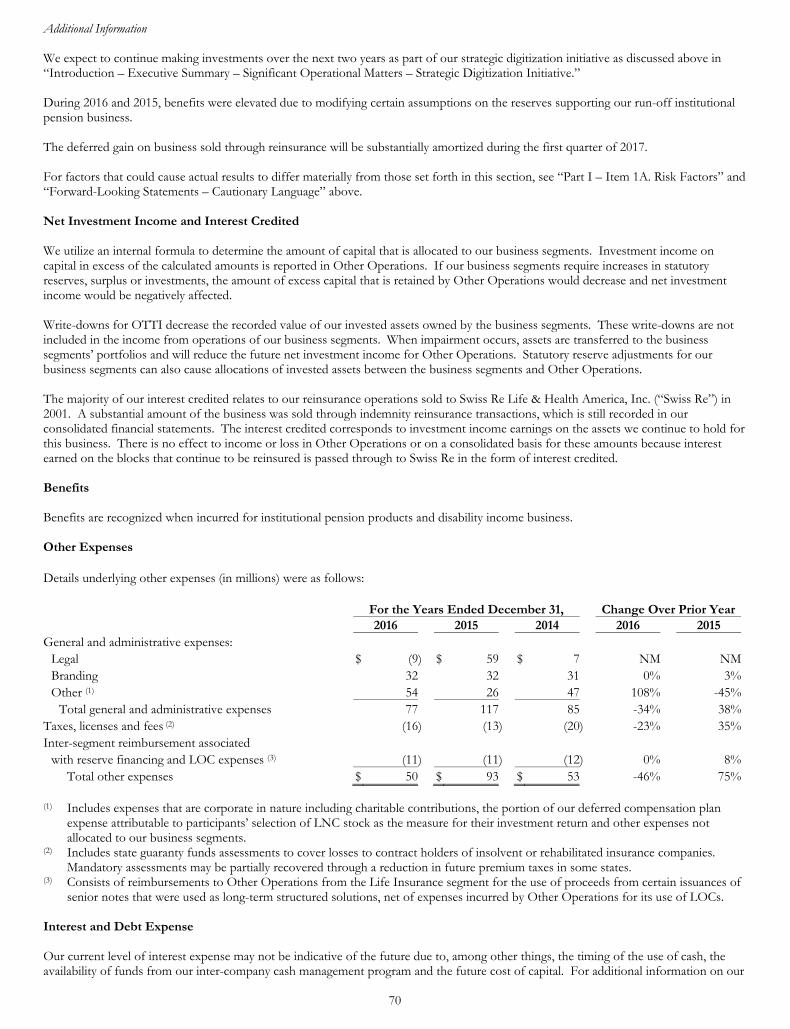
70
Additional Information We expect to continue making investments over the next two years as part of our strategic digitization initiative as discussed above in “Introduction – Executive Summary – Significant Operational Matters – Strategic Digitization Initiative.” During 2016 and 2015, benefits were elevated due to modifying certain assumptions on the reserves supporting our run-off institutional pension business. The deferred gain on business sold through reinsurance will be substantially amortized during the first quarter of 2017. For factors that could cause actual results to differ materially from those set forth in this section, see “Part I – Item 1A. Risk Factors” and “Forward-Looking Statements – Cautionary Language” above. Net Investment Income and Interest Credited We utilize an internal formula to determine the amount of capital that is allocated to our business segments. Investment income on capital in excess of the calculated amounts is reported in Other Operations. If our business segments require increases in statutory reserves, surplus or investments, the amount of excess capital that is retained by Other Operations would decrease and net investment income would be negatively affected. Write-downs for OTTI decrease the recorded value of our invested assets owned by the business segments. These write-downs are not included in the income from operations of our business segments. When impairment occurs, assets are transferred to the business segments’ portfolios and will reduce the future net investment income for Other Operations. Statutory reserve adjustments for our business segments can also cause allocations of invested assets between the business segments and Other Operations. The majority of our interest credited relates to our reinsurance operations sold to Swiss Re Life & Health America, Inc. (“Swiss Re”) in 2001. A substantial amount of the business was sold through indemnity reinsurance transactions, which is still recorded in our consolidated financial statements. The interest credited corresponds to investment income earnings on the assets we continue to hold for this business. There is no effect to income or loss in Other Operations or on a consolidated basis for these amounts because interest earned on the blocks that continue to be reinsured is passed through to Swiss Re in the form of interest credited. Benefits Benefits are recognized when incurred for institutional pension products and disability income business. Other Expenses
Details underlying other expenses (in millions) were as follows:
For the Years Ended December 31, Change Over Prior Year 2016 2015 2014 2016 2015 General and administrative expenses:
Legal $ (9) $ 59 $ 7 NM NMBranding 32 32 31 0% 3%Other (1) 54 26 47 108% -45%
Total general and administrative expenses 77 117 85 -34% 38%Taxes, licenses and fees (2) (16) (13) (20) -23% 35%Inter-segment reimbursement associated
with reserve financing and LOC expenses (3) (11) (11) (12) 0% 8%Total other expenses $ 50 $ 93 $ 53 -46% 75%
(1) Includes expenses that are corporate in nature including charitable contributions, the portion of our deferred compensation plan
expense attributable to participants’ selection of LNC stock as the measure for their investment return and other expenses not allocated to our business segments.
(2) Includes state guaranty funds assessments to cover losses to contract holders of insolvent or rehabilitated insurance companies. Mandatory assessments may be partially recovered through a reduction in future premium taxes in some states.
(3) Consists of reimbursements to Other Operations from the Life Insurance segment for the use of proceeds from certain issuances of senior notes that were used as long-term structured solutions, net of expenses incurred by Other Operations for its use of LOCs.
Interest and Debt Expense Our current level of interest expense may not be indicative of the future due to, among other things, the timing of the use of cash, the availability of funds from our inter-company cash management program and the future cost of capital. For additional information on our
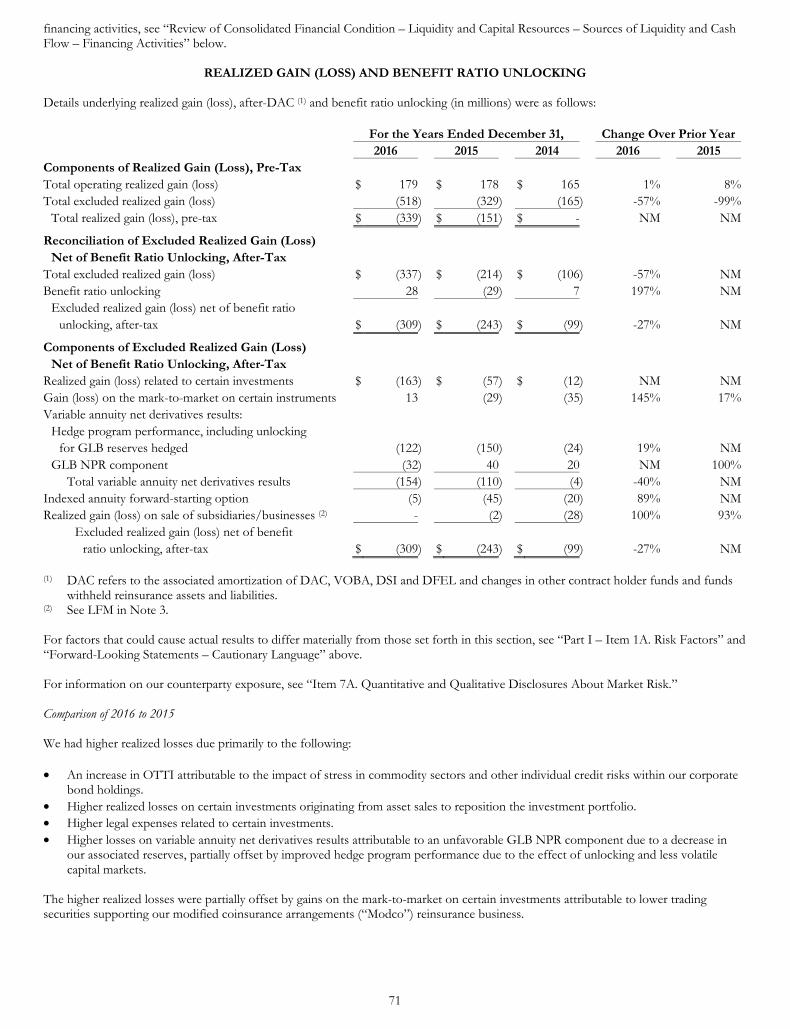
71
financing activities, see “Review of Consolidated Financial Condition – Liquidity and Capital Resources – Sources of Liquidity and Cash Flow – Financing Activities” below.
REALIZED GAIN (LOSS) AND BENEFIT RATIO UNLOCKING
Details underlying realized gain (loss), after-DAC (1) and benefit ratio unlocking (in millions) were as follows:
For the Years Ended December 31, Change Over Prior Year 2016 2015 2014 2016 2015 Components of Realized Gain (Loss), Pre-Tax Total operating realized gain (loss) $ 179 $ 178 $ 165 1% 8%Total excluded realized gain (loss) (518) (329) (165) -57% -99%
Total realized gain (loss), pre-tax $ (339) $ (151) $ - NM NM
Reconciliation of Excluded Realized Gain (Loss) Net of Benefit Ratio Unlocking, After-Tax
Total excluded realized gain (loss) $ (337) $ (214) $ (106) -57% NMBenefit ratio unlocking 28 (29) 7 197% NM
Excluded realized gain (loss) net of benefit ratio unlocking, after-tax $ (309) $ (243) $ (99) -27% NM
Components of Excluded Realized Gain (Loss) Net of Benefit Ratio Unlocking, After-Tax
Realized gain (loss) related to certain investments $ (163) $ (57) $ (12) NM NMGain (loss) on the mark-to-market on certain instruments 13 (29) (35) 145% 17%Variable annuity net derivatives results:
Hedge program performance, including unlocking for GLB reserves hedged (122) (150) (24) 19% NM
GLB NPR component (32) 40 20 NM 100%Total variable annuity net derivatives results (154) (110) (4) -40% NM
Indexed annuity forward-starting option (5) (45) (20) 89% NMRealized gain (loss) on sale of subsidiaries/businesses (2) - (2) (28) 100% 93%
Excluded realized gain (loss) net of benefit ratio unlocking, after-tax $ (309) $ (243) $ (99) -27% NM
(1) DAC refers to the associated amortization of DAC, VOBA, DSI and DFEL and changes in other contract holder funds and funds
withheld reinsurance assets and liabilities. (2) See LFM in Note 3. For factors that could cause actual results to differ materially from those set forth in this section, see “Part I – Item 1A. Risk Factors” and “Forward-Looking Statements – Cautionary Language” above. For information on our counterparty exposure, see “Item 7A. Quantitative and Qualitative Disclosures About Market Risk.” Comparison of 2016 to 2015
We had higher realized losses due primarily to the following:
• An increase in OTTI attributable to the impact of stress in commodity sectors and other individual credit risks within our corporate
bond holdings. • Higher realized losses on certain investments originating from asset sales to reposition the investment portfolio. • Higher legal expenses related to certain investments. • Higher losses on variable annuity net derivatives results attributable to an unfavorable GLB NPR component due to a decrease in
our associated reserves, partially offset by improved hedge program performance due to the effect of unlocking and less volatile capital markets.
The higher realized losses were partially offset by gains on the mark-to-market on certain investments attributable to lower trading securities supporting our modified coinsurance arrangements (“Modco”) reinsurance business.
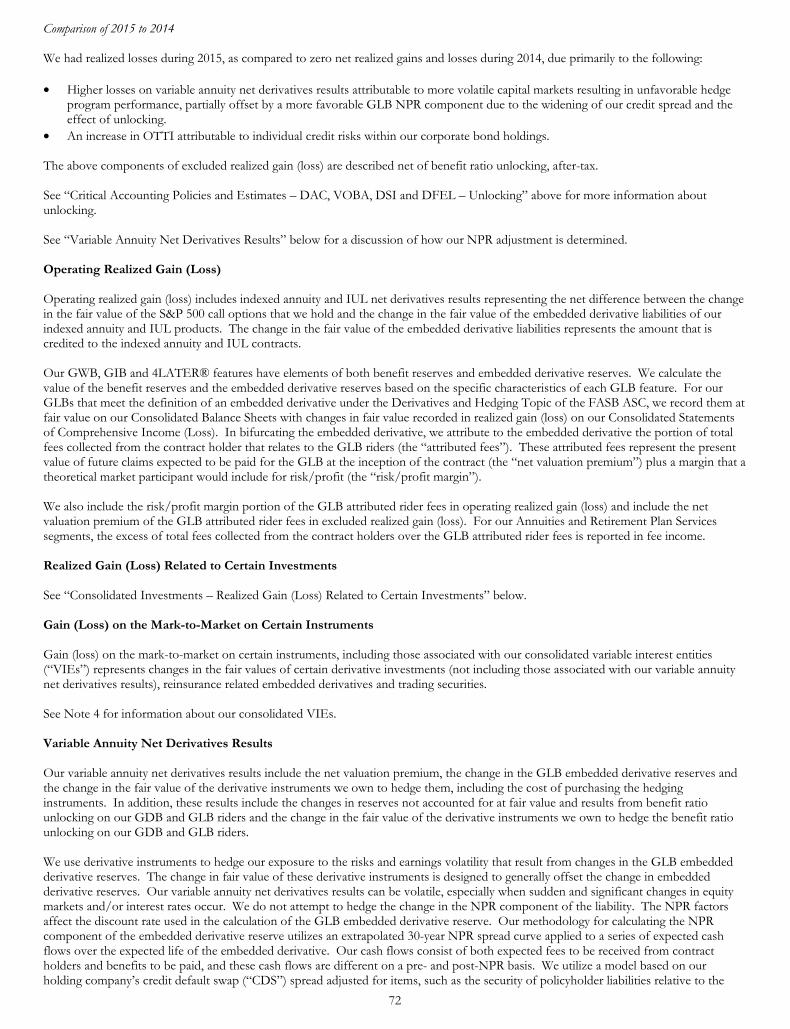
72
Comparison of 2015 to 2014 We had realized losses during 2015, as compared to zero net realized gains and losses during 2014, due primarily to the following: • Higher losses on variable annuity net derivatives results attributable to more volatile capital markets resulting in unfavorable hedge
program performance, partially offset by a more favorable GLB NPR component due to the widening of our credit spread and the effect of unlocking.
• An increase in OTTI attributable to individual credit risks within our corporate bond holdings. The above components of excluded realized gain (loss) are described net of benefit ratio unlocking, after-tax. See “Critical Accounting Policies and Estimates – DAC, VOBA, DSI and DFEL – Unlocking” above for more information about unlocking. See “Variable Annuity Net Derivatives Results” below for a discussion of how our NPR adjustment is determined. Operating Realized Gain (Loss) Operating realized gain (loss) includes indexed annuity and IUL net derivatives results representing the net difference between the change in the fair value of the S&P 500 call options that we hold and the change in the fair value of the embedded derivative liabilities of our indexed annuity and IUL products. The change in the fair value of the embedded derivative liabilities represents the amount that is credited to the indexed annuity and IUL contracts. Our GWB, GIB and 4LATER® features have elements of both benefit reserves and embedded derivative reserves. We calculate the value of the benefit reserves and the embedded derivative reserves based on the specific characteristics of each GLB feature. For our GLBs that meet the definition of an embedded derivative under the Derivatives and Hedging Topic of the FASB ASC, we record them at fair value on our Consolidated Balance Sheets with changes in fair value recorded in realized gain (loss) on our Consolidated Statements of Comprehensive Income (Loss). In bifurcating the embedded derivative, we attribute to the embedded derivative the portion of total fees collected from the contract holder that relates to the GLB riders (the “attributed fees”). These attributed fees represent the present value of future claims expected to be paid for the GLB at the inception of the contract (the “net valuation premium”) plus a margin that a theoretical market participant would include for risk/profit (the “risk/profit margin”). We also include the risk/profit margin portion of the GLB attributed rider fees in operating realized gain (loss) and include the net valuation premium of the GLB attributed rider fees in excluded realized gain (loss). For our Annuities and Retirement Plan Services segments, the excess of total fees collected from the contract holders over the GLB attributed rider fees is reported in fee income. Realized Gain (Loss) Related to Certain Investments See “Consolidated Investments – Realized Gain (Loss) Related to Certain Investments” below. Gain (Loss) on the Mark-to-Market on Certain Instruments Gain (loss) on the mark-to-market on certain instruments, including those associated with our consolidated variable interest entities (“VIEs”) represents changes in the fair values of certain derivative investments (not including those associated with our variable annuity net derivatives results), reinsurance related embedded derivatives and trading securities. See Note 4 for information about our consolidated VIEs. Variable Annuity Net Derivatives Results Our variable annuity net derivatives results include the net valuation premium, the change in the GLB embedded derivative reserves and the change in the fair value of the derivative instruments we own to hedge them, including the cost of purchasing the hedging instruments. In addition, these results include the changes in reserves not accounted for at fair value and results from benefit ratio unlocking on our GDB and GLB riders and the change in the fair value of the derivative instruments we own to hedge the benefit ratio unlocking on our GDB and GLB riders. We use derivative instruments to hedge our exposure to the risks and earnings volatility that result from changes in the GLB embedded derivative reserves. The change in fair value of these derivative instruments is designed to generally offset the change in embedded derivative reserves. Our variable annuity net derivatives results can be volatile, especially when sudden and significant changes in equity markets and/or interest rates occur. We do not attempt to hedge the change in the NPR component of the liability. The NPR factors affect the discount rate used in the calculation of the GLB embedded derivative reserve. Our methodology for calculating the NPR component of the embedded derivative reserve utilizes an extrapolated 30-year NPR spread curve applied to a series of expected cash flows over the expected life of the embedded derivative. Our cash flows consist of both expected fees to be received from contract holders and benefits to be paid, and these cash flows are different on a pre- and post-NPR basis. We utilize a model based on our holding company’s credit default swap (“CDS”) spread adjusted for items, such as the security of policyholder liabilities relative to the
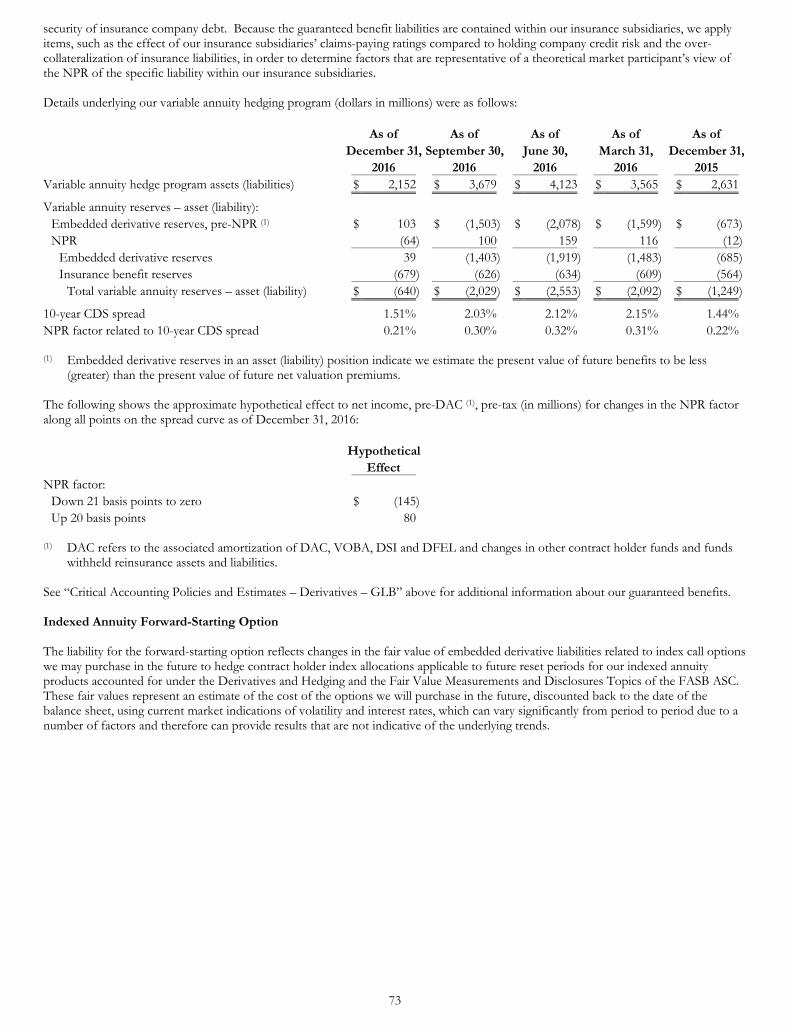
73
security of insurance company debt. Because the guaranteed benefit liabilities are contained within our insurance subsidiaries, we apply items, such as the effect of our insurance subsidiaries’ claims-paying ratings compared to holding company credit risk and the over-collateralization of insurance liabilities, in order to determine factors that are representative of a theoretical market participant’s view of the NPR of the specific liability within our insurance subsidiaries. Details underlying our variable annuity hedging program (dollars in millions) were as follows:
As of As of As of As of As of December 31, September 30, June 30, March 31, December 31, 2016 2016 2016 2016 2015 Variable annuity hedge program assets (liabilities) $ 2,152 $ 3,679 $ 4,123 $ 3,565 $ 2,631
Variable annuity reserves – asset (liability): Embedded derivative reserves, pre-NPR (1) $ 103 $ (1,503) $ (2,078) $ (1,599) $ (673)NPR (64) 100 159 116 (12)
Embedded derivative reserves 39 (1,403) (1,919) (1,483) (685)Insurance benefit reserves (679) (626) (634) (609) (564)
Total variable annuity reserves – asset (liability) $ (640) $ (2,029) $ (2,553) $ (2,092) $ (1,249)
10-year CDS spread 1.51% 2.03% 2.12% 2.15% 1.44%NPR factor related to 10-year CDS spread 0.21% 0.30% 0.32% 0.31% 0.22% (1) Embedded derivative reserves in an asset (liability) position indicate we estimate the present value of future benefits to be less
(greater) than the present value of future net valuation premiums. The following shows the approximate hypothetical effect to net income, pre-DAC (1), pre-tax (in millions) for changes in the NPR factor along all points on the spread curve as of December 31, 2016:
Hypothetical Effect NPR factor:
Down 21 basis points to zero $ (145) Up 20 basis points 80
(1) DAC refers to the associated amortization of DAC, VOBA, DSI and DFEL and changes in other contract holder funds and funds
withheld reinsurance assets and liabilities. See “Critical Accounting Policies and Estimates – Derivatives – GLB” above for additional information about our guaranteed benefits. Indexed Annuity Forward-Starting Option The liability for the forward-starting option reflects changes in the fair value of embedded derivative liabilities related to index call options we may purchase in the future to hedge contract holder index allocations applicable to future reset periods for our indexed annuity products accounted for under the Derivatives and Hedging and the Fair Value Measurements and Disclosures Topics of the FASB ASC. These fair values represent an estimate of the cost of the options we will purchase in the future, discounted back to the date of the balance sheet, using current market indications of volatility and interest rates, which can vary significantly from period to period due to a number of factors and therefore can provide results that are not indicative of the underlying trends.
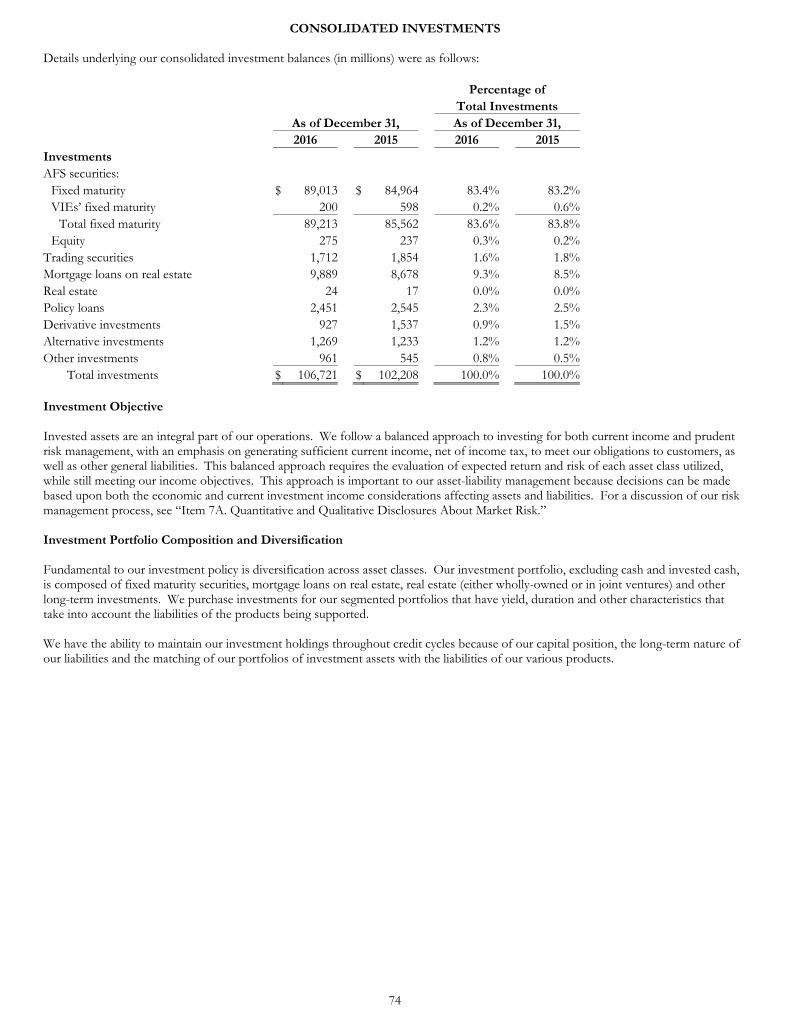
74
CONSOLIDATED INVESTMENTS Details underlying our consolidated investment balances (in millions) were as follows:
Percentage of Total Investments As of December 31, As of December 31, 2016 2015 2016 2015 Investments AFS securities:
Fixed maturity $ 89,013 $ 84,964 83.4% 83.2% VIEs’ fixed maturity 200 598 0.2% 0.6%
Total fixed maturity 89,213 85,562 83.6% 83.8% Equity 275 237 0.3% 0.2%
Trading securities 1,712 1,854 1.6% 1.8% Mortgage loans on real estate 9,889 8,678 9.3% 8.5% Real estate 24 17 0.0% 0.0% Policy loans 2,451 2,545 2.3% 2.5% Derivative investments 927 1,537 0.9% 1.5% Alternative investments 1,269 1,233 1.2% 1.2% Other investments 961 545 0.8% 0.5%
Total investments $ 106,721 $ 102,208 100.0% 100.0% Investment Objective Invested assets are an integral part of our operations. We follow a balanced approach to investing for both current income and prudent risk management, with an emphasis on generating sufficient current income, net of income tax, to meet our obligations to customers, as well as other general liabilities. This balanced approach requires the evaluation of expected return and risk of each asset class utilized, while still meeting our income objectives. This approach is important to our asset-liability management because decisions can be made based upon both the economic and current investment income considerations affecting assets and liabilities. For a discussion of our risk management process, see “Item 7A. Quantitative and Qualitative Disclosures About Market Risk.” Investment Portfolio Composition and Diversification Fundamental to our investment policy is diversification across asset classes. Our investment portfolio, excluding cash and invested cash, is composed of fixed maturity securities, mortgage loans on real estate, real estate (either wholly-owned or in joint ventures) and other long-term investments. We purchase investments for our segmented portfolios that have yield, duration and other characteristics that take into account the liabilities of the products being supported. We have the ability to maintain our investment holdings throughout credit cycles because of our capital position, the long-term nature of our liabilities and the matching of our portfolios of investment assets with the liabilities of our various products.
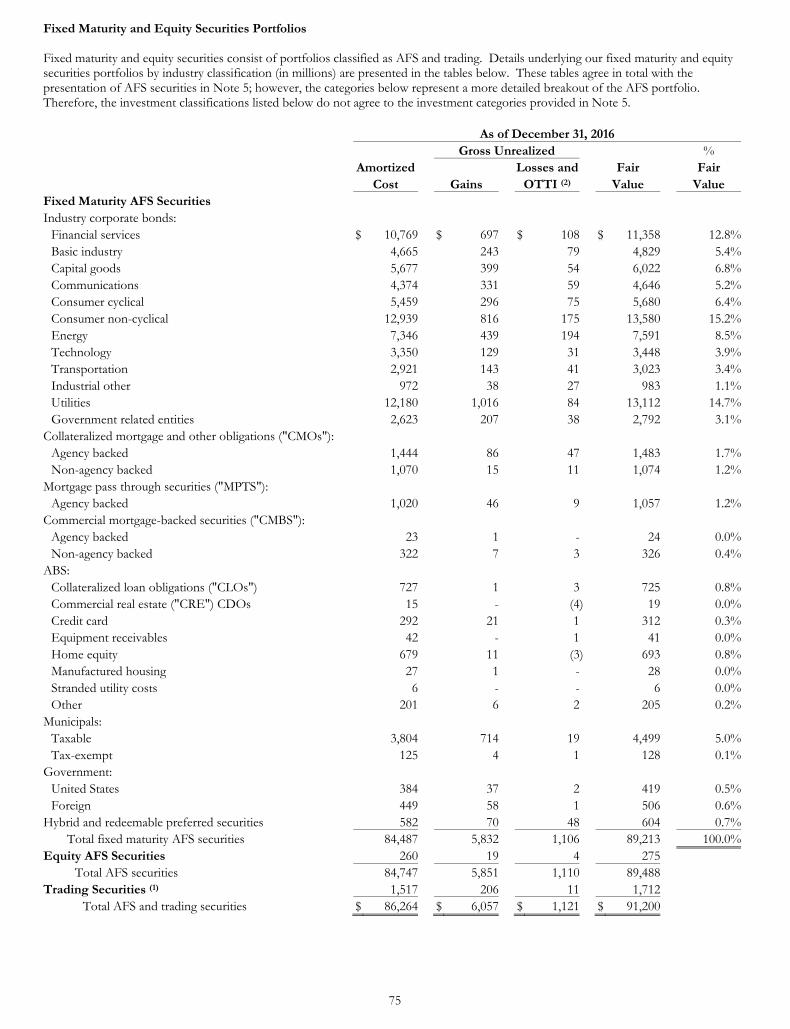
75
Fixed Maturity and Equity Securities Portfolios Fixed maturity and equity securities consist of portfolios classified as AFS and trading. Details underlying our fixed maturity and equity securities portfolios by industry classification (in millions) are presented in the tables below. These tables agree in total with the presentation of AFS securities in Note 5; however, the categories below represent a more detailed breakout of the AFS portfolio. Therefore, the investment classifications listed below do not agree to the investment categories provided in Note 5.
As of December 31, 2016 Gross Unrealized % Amortized Losses and Fair Fair Cost Gains OTTI (2) Value Value Fixed Maturity AFS Securities Industry corporate bonds:
Financial services $ 10,769 $ 697 $ 108 $ 11,358 12.8%Basic industry 4,665 243 79 4,829 5.4%Capital goods 5,677 399 54 6,022 6.8%Communications 4,374 331 59 4,646 5.2%Consumer cyclical 5,459 296 75 5,680 6.4%Consumer non-cyclical 12,939 816 175 13,580 15.2%Energy 7,346 439 194 7,591 8.5%Technology 3,350 129 31 3,448 3.9%Transportation 2,921 143 41 3,023 3.4%Industrial other 972 38 27 983 1.1%Utilities 12,180 1,016 84 13,112 14.7%Government related entities 2,623 207 38 2,792 3.1%
Collateralized mortgage and other obligations ("CMOs"): Agency backed 1,444 86 47 1,483 1.7%Non-agency backed 1,070 15 11 1,074 1.2%
Mortgage pass through securities ("MPTS"): Agency backed 1,020 46 9 1,057 1.2%
Commercial mortgage-backed securities ("CMBS"): Agency backed 23 1 - 24 0.0%Non-agency backed 322 7 3 326 0.4%
ABS: Collateralized loan obligations ("CLOs") 727 1 3 725 0.8%Commercial real estate ("CRE") CDOs 15 - (4) 19 0.0%Credit card 292 21 1 312 0.3%Equipment receivables 42 - 1 41 0.0%Home equity 679 11 (3) 693 0.8%Manufactured housing 27 1 - 28 0.0%Stranded utility costs 6 - - 6 0.0%Other 201 6 2 205 0.2%
Municipals: Taxable 3,804 714 19 4,499 5.0%Tax-exempt 125 4 1 128 0.1%
Government: United States 384 37 2 419 0.5%Foreign 449 58 1 506 0.6%
Hybrid and redeemable preferred securities 582 70 48 604 0.7%Total fixed maturity AFS securities 84,487 5,832 1,106 89,213 100.0%
Equity AFS Securities 260 19 4 275Total AFS securities 84,747 5,851 1,110 89,488
Trading Securities (1) 1,517 206 11 1,712 Total AFS and trading securities $ 86,264 $ 6,057 $ 1,121 $ 91,200
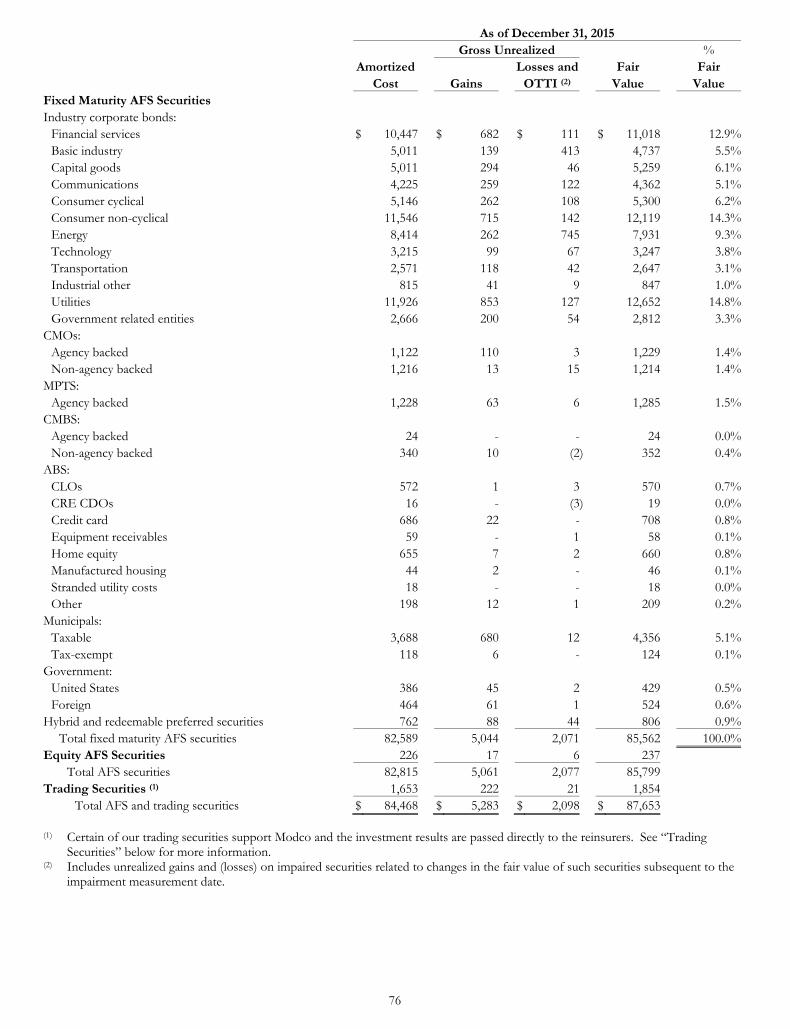
76
As of December 31, 2015 Gross Unrealized % Amortized Losses and Fair Fair Cost Gains OTTI (2) Value Value Fixed Maturity AFS Securities Industry corporate bonds:
Financial services $ 10,447 $ 682 $ 111 $ 11,018 12.9%Basic industry 5,011 139 413 4,737 5.5%Capital goods 5,011 294 46 5,259 6.1%Communications 4,225 259 122 4,362 5.1%Consumer cyclical 5,146 262 108 5,300 6.2%Consumer non-cyclical 11,546 715 142 12,119 14.3%Energy 8,414 262 745 7,931 9.3%Technology 3,215 99 67 3,247 3.8%Transportation 2,571 118 42 2,647 3.1%Industrial other 815 41 9 847 1.0%Utilities 11,926 853 127 12,652 14.8%Government related entities 2,666 200 54 2,812 3.3%
CMOs: Agency backed 1,122 110 3 1,229 1.4%Non-agency backed 1,216 13 15 1,214 1.4%
MPTS: Agency backed 1,228 63 6 1,285 1.5%
CMBS: Agency backed 24 - - 24 0.0%Non-agency backed 340 10 (2) 352 0.4%
ABS: CLOs 572 1 3 570 0.7%CRE CDOs 16 - (3) 19 0.0%Credit card 686 22 - 708 0.8%Equipment receivables 59 - 1 58 0.1%Home equity 655 7 2 660 0.8%Manufactured housing 44 2 - 46 0.1%Stranded utility costs 18 - - 18 0.0%Other 198 12 1 209 0.2%
Municipals: Taxable 3,688 680 12 4,356 5.1%Tax-exempt 118 6 - 124 0.1%
Government: United States 386 45 2 429 0.5%Foreign 464 61 1 524 0.6%
Hybrid and redeemable preferred securities 762 88 44 806 0.9%Total fixed maturity AFS securities 82,589 5,044 2,071 85,562 100.0%
Equity AFS Securities 226 17 6 237Total AFS securities 82,815 5,061 2,077 85,799
Trading Securities (1) 1,653 222 21 1,854 Total AFS and trading securities $ 84,468 $ 5,283 $ 2,098 $ 87,653
(1) Certain of our trading securities support Modco and the investment results are passed directly to the reinsurers. See “Trading
Securities” below for more information. (2) Includes unrealized gains and (losses) on impaired securities related to changes in the fair value of such securities subsequent to the
impairment measurement date.
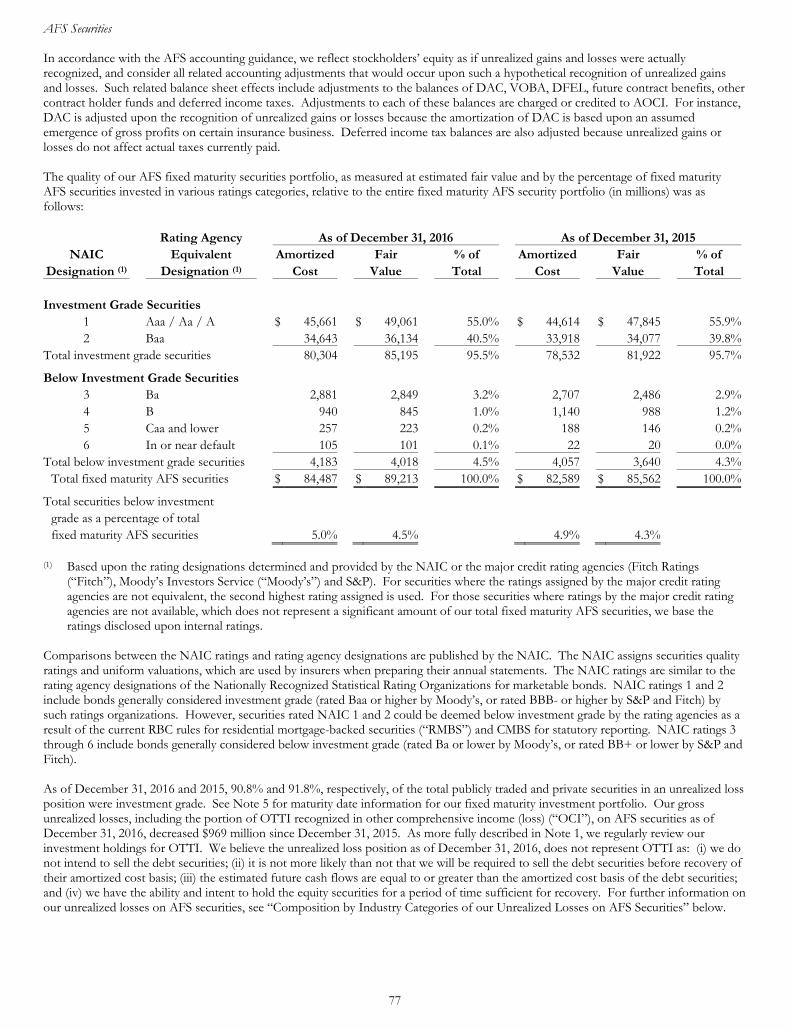
77
AFS Securities In accordance with the AFS accounting guidance, we reflect stockholders’ equity as if unrealized gains and losses were actually recognized, and consider all related accounting adjustments that would occur upon such a hypothetical recognition of unrealized gains and losses. Such related balance sheet effects include adjustments to the balances of DAC, VOBA, DFEL, future contract benefits, other contract holder funds and deferred income taxes. Adjustments to each of these balances are charged or credited to AOCI. For instance, DAC is adjusted upon the recognition of unrealized gains or losses because the amortization of DAC is based upon an assumed emergence of gross profits on certain insurance business. Deferred income tax balances are also adjusted because unrealized gains or losses do not affect actual taxes currently paid. The quality of our AFS fixed maturity securities portfolio, as measured at estimated fair value and by the percentage of fixed maturity AFS securities invested in various ratings categories, relative to the entire fixed maturity AFS security portfolio (in millions) was as follows:
Rating Agency As of December 31, 2016 As of December 31, 2015
NAIC Equivalent Amortized Fair % of Amortized Fair % of Designation (1) Designation (1) Cost Value Total Cost Value Total
Investment Grade Securities
1 Aaa / Aa / A $ 45,661 $ 49,061 55.0% $ 44,614 $ 47,845 55.9%2 Baa 34,643 36,134 40.5% 33,918 34,077 39.8%
Total investment grade securities 80,304 85,195 95.5% 78,532 81,922 95.7%
Below Investment Grade Securities 3 Ba 2,881 2,849 3.2% 2,707 2,486 2.9%4 B 940 845 1.0% 1,140 988 1.2%5 Caa and lower 257 223 0.2% 188 146 0.2%6 In or near default 105 101 0.1% 22 20 0.0%
Total below investment grade securities 4,183 4,018 4.5% 4,057 3,640 4.3%Total fixed maturity AFS securities $ 84,487 $ 89,213 100.0% $ 82,589 $ 85,562 100.0%
Total securities below investment grade as a percentage of total fixed maturity AFS securities 5.0% 4.5% 4.9% 4.3%
(1) Based upon the rating designations determined and provided by the NAIC or the major credit rating agencies (Fitch Ratings
(“Fitch”), Moody’s Investors Service (“Moody’s”) and S&P). For securities where the ratings assigned by the major credit rating agencies are not equivalent, the second highest rating assigned is used. For those securities where ratings by the major credit rating agencies are not available, which does not represent a significant amount of our total fixed maturity AFS securities, we base the ratings disclosed upon internal ratings.
Comparisons between the NAIC ratings and rating agency designations are published by the NAIC. The NAIC assigns securities quality ratings and uniform valuations, which are used by insurers when preparing their annual statements. The NAIC ratings are similar to the rating agency designations of the Nationally Recognized Statistical Rating Organizations for marketable bonds. NAIC ratings 1 and 2 include bonds generally considered investment grade (rated Baa or higher by Moody’s, or rated BBB- or higher by S&P and Fitch) by such ratings organizations. However, securities rated NAIC 1 and 2 could be deemed below investment grade by the rating agencies as a result of the current RBC rules for residential mortgage-backed securities (“RMBS”) and CMBS for statutory reporting. NAIC ratings 3 through 6 include bonds generally considered below investment grade (rated Ba or lower by Moody’s, or rated BB+ or lower by S&P and Fitch). As of December 31, 2016 and 2015, 90.8% and 91.8%, respectively, of the total publicly traded and private securities in an unrealized loss position were investment grade. See Note 5 for maturity date information for our fixed maturity investment portfolio. Our gross unrealized losses, including the portion of OTTI recognized in other comprehensive income (loss) (“OCI”), on AFS securities as of December 31, 2016, decreased $969 million since December 31, 2015. As more fully described in Note 1, we regularly review our investment holdings for OTTI. We believe the unrealized loss position as of December 31, 2016, does not represent OTTI as: (i) we do not intend to sell the debt securities; (ii) it is not more likely than not that we will be required to sell the debt securities before recovery of their amortized cost basis; (iii) the estimated future cash flows are equal to or greater than the amortized cost basis of the debt securities; and (iv) we have the ability and intent to hold the equity securities for a period of time sufficient for recovery. For further information on our unrealized losses on AFS securities, see “Composition by Industry Categories of our Unrealized Losses on AFS Securities” below.
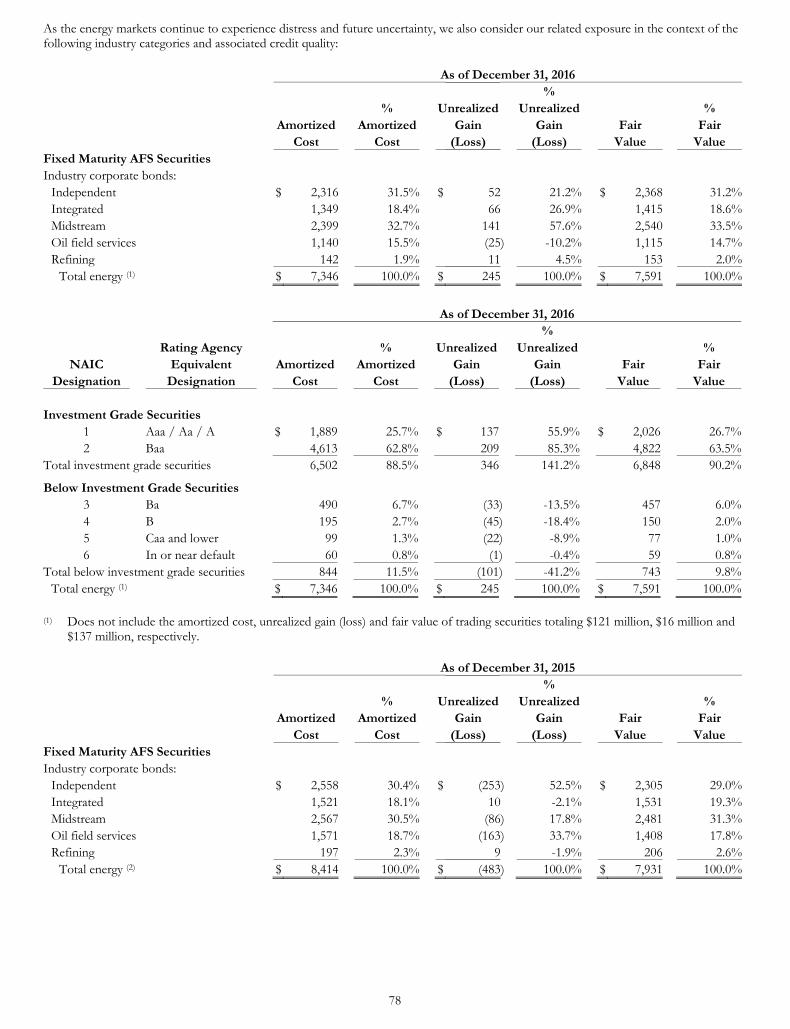
78
As the energy markets continue to experience distress and future uncertainty, we also consider our related exposure in the context of the following industry categories and associated credit quality:
As of December 31, 2016 % % Unrealized Unrealized % Amortized Amortized Gain Gain Fair Fair Cost Cost (Loss) (Loss) Value Value Fixed Maturity AFS Securities Industry corporate bonds:
Independent $ 2,316 31.5% $ 52 21.2% $ 2,368 31.2%Integrated 1,349 18.4% 66 26.9% 1,415 18.6%Midstream 2,399 32.7% 141 57.6% 2,540 33.5%Oil field services 1,140 15.5% (25) -10.2% 1,115 14.7%Refining 142 1.9% 11 4.5% 153 2.0%
Total energy (1) $ 7,346 100.0% $ 245 100.0% $ 7,591 100.0%
As of December 31, 2016 % Rating Agency % Unrealized Unrealized %
NAIC Equivalent Amortized Amortized Gain Gain Fair Fair Designation Designation Cost Cost (Loss) (Loss) Value Value
Investment Grade Securities
1 Aaa / Aa / A $ 1,889 25.7% $ 137 55.9% $ 2,026 26.7%2 Baa 4,613 62.8% 209 85.3% 4,822 63.5%
Total investment grade securities 6,502 88.5% 346 141.2% 6,848 90.2%
Below Investment Grade Securities 3 Ba 490 6.7% (33) -13.5% 457 6.0%4 B 195 2.7% (45) -18.4% 150 2.0%5 Caa and lower 99 1.3% (22) -8.9% 77 1.0%6 In or near default 60 0.8% (1) -0.4% 59 0.8%
Total below investment grade securities 844 11.5% (101) -41.2% 743 9.8%Total energy (1) $ 7,346 100.0% $ 245 100.0% $ 7,591 100.0%
(1) Does not include the amortized cost, unrealized gain (loss) and fair value of trading securities totaling $121 million, $16 million and $137 million, respectively.
As of December 31, 2015 % % Unrealized Unrealized % Amortized Amortized Gain Gain Fair Fair Cost Cost (Loss) (Loss) Value Value Fixed Maturity AFS Securities Industry corporate bonds:
Independent $ 2,558 30.4% $ (253) 52.5% $ 2,305 29.0%Integrated 1,521 18.1% 10 -2.1% 1,531 19.3%Midstream 2,567 30.5% (86) 17.8% 2,481 31.3%Oil field services 1,571 18.7% (163) 33.7% 1,408 17.8%Refining 197 2.3% 9 -1.9% 206 2.6%
Total energy (2) $ 8,414 100.0% $ (483) 100.0% $ 7,931 100.0%
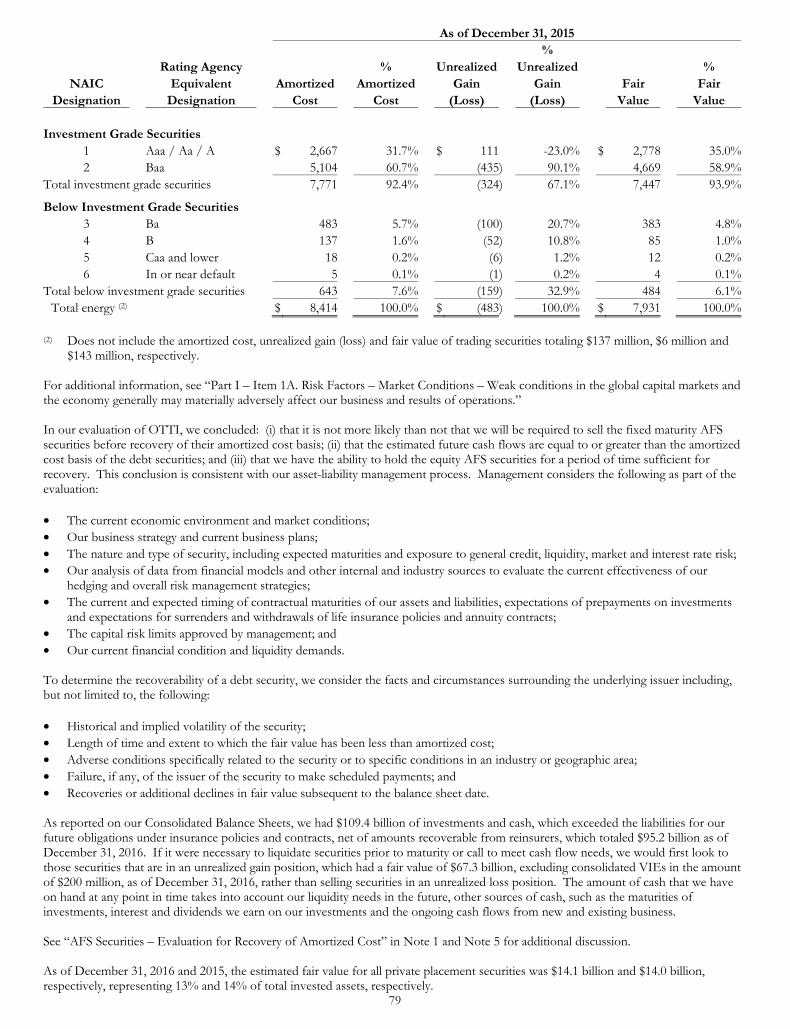
79
As of December 31, 2015 % Rating Agency % Unrealized Unrealized %
NAIC Equivalent Amortized Amortized Gain Gain Fair Fair Designation Designation Cost Cost (Loss) (Loss) Value Value
Investment Grade Securities
1 Aaa / Aa / A $ 2,667 31.7% $ 111 -23.0% $ 2,778 35.0%2 Baa 5,104 60.7% (435) 90.1% 4,669 58.9%
Total investment grade securities 7,771 92.4% (324) 67.1% 7,447 93.9%
Below Investment Grade Securities 3 Ba 483 5.7% (100) 20.7% 383 4.8%4 B 137 1.6% (52) 10.8% 85 1.0%5 Caa and lower 18 0.2% (6) 1.2% 12 0.2%6 In or near default 5 0.1% (1) 0.2% 4 0.1%
Total below investment grade securities 643 7.6% (159) 32.9% 484 6.1%Total energy (2) $ 8,414 100.0% $ (483) 100.0% $ 7,931 100.0%
(2) Does not include the amortized cost, unrealized gain (loss) and fair value of trading securities totaling $137 million, $6 million and $143 million, respectively.
For additional information, see “Part I – Item 1A. Risk Factors – Market Conditions – Weak conditions in the global capital markets and the economy generally may materially adversely affect our business and results of operations.” In our evaluation of OTTI, we concluded: (i) that it is not more likely than not that we will be required to sell the fixed maturity AFS securities before recovery of their amortized cost basis; (ii) that the estimated future cash flows are equal to or greater than the amortized cost basis of the debt securities; and (iii) that we have the ability to hold the equity AFS securities for a period of time sufficient for recovery. This conclusion is consistent with our asset-liability management process. Management considers the following as part of the evaluation: • The current economic environment and market conditions; • Our business strategy and current business plans; • The nature and type of security, including expected maturities and exposure to general credit, liquidity, market and interest rate risk; • Our analysis of data from financial models and other internal and industry sources to evaluate the current effectiveness of our
hedging and overall risk management strategies; • The current and expected timing of contractual maturities of our assets and liabilities, expectations of prepayments on investments
and expectations for surrenders and withdrawals of life insurance policies and annuity contracts; • The capital risk limits approved by management; and • Our current financial condition and liquidity demands. To determine the recoverability of a debt security, we consider the facts and circumstances surrounding the underlying issuer including, but not limited to, the following: • Historical and implied volatility of the security; • Length of time and extent to which the fair value has been less than amortized cost; • Adverse conditions specifically related to the security or to specific conditions in an industry or geographic area; • Failure, if any, of the issuer of the security to make scheduled payments; and • Recoveries or additional declines in fair value subsequent to the balance sheet date. As reported on our Consolidated Balance Sheets, we had $109.4 billion of investments and cash, which exceeded the liabilities for our future obligations under insurance policies and contracts, net of amounts recoverable from reinsurers, which totaled $95.2 billion as of December 31, 2016. If it were necessary to liquidate securities prior to maturity or call to meet cash flow needs, we would first look to those securities that are in an unrealized gain position, which had a fair value of $67.3 billion, excluding consolidated VIEs in the amount of $200 million, as of December 31, 2016, rather than selling securities in an unrealized loss position. The amount of cash that we have on hand at any point in time takes into account our liquidity needs in the future, other sources of cash, such as the maturities of investments, interest and dividends we earn on our investments and the ongoing cash flows from new and existing business. See “AFS Securities – Evaluation for Recovery of Amortized Cost” in Note 1 and Note 5 for additional discussion. As of December 31, 2016 and 2015, the estimated fair value for all private placement securities was $14.1 billion and $14.0 billion, respectively, representing 13% and 14% of total invested assets, respectively.
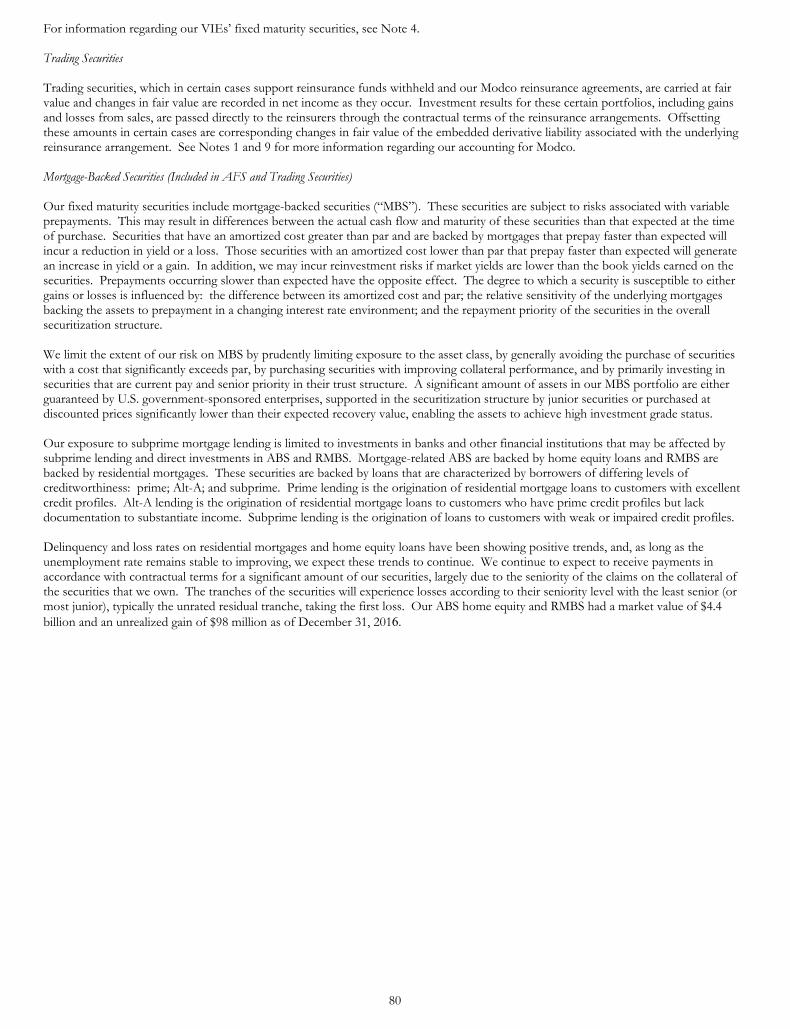
80
For information regarding our VIEs’ fixed maturity securities, see Note 4. Trading Securities Trading securities, which in certain cases support reinsurance funds withheld and our Modco reinsurance agreements, are carried at fair value and changes in fair value are recorded in net income as they occur. Investment results for these certain portfolios, including gains and losses from sales, are passed directly to the reinsurers through the contractual terms of the reinsurance arrangements. Offsetting these amounts in certain cases are corresponding changes in fair value of the embedded derivative liability associated with the underlying reinsurance arrangement. See Notes 1 and 9 for more information regarding our accounting for Modco. Mortgage-Backed Securities (Included in AFS and Trading Securities) Our fixed maturity securities include mortgage-backed securities (“MBS”). These securities are subject to risks associated with variable prepayments. This may result in differences between the actual cash flow and maturity of these securities than that expected at the time of purchase. Securities that have an amortized cost greater than par and are backed by mortgages that prepay faster than expected will incur a reduction in yield or a loss. Those securities with an amortized cost lower than par that prepay faster than expected will generate an increase in yield or a gain. In addition, we may incur reinvestment risks if market yields are lower than the book yields earned on the securities. Prepayments occurring slower than expected have the opposite effect. The degree to which a security is susceptible to either gains or losses is influenced by: the difference between its amortized cost and par; the relative sensitivity of the underlying mortgages backing the assets to prepayment in a changing interest rate environment; and the repayment priority of the securities in the overall securitization structure. We limit the extent of our risk on MBS by prudently limiting exposure to the asset class, by generally avoiding the purchase of securities with a cost that significantly exceeds par, by purchasing securities with improving collateral performance, and by primarily investing in securities that are current pay and senior priority in their trust structure. A significant amount of assets in our MBS portfolio are either guaranteed by U.S. government-sponsored enterprises, supported in the securitization structure by junior securities or purchased at discounted prices significantly lower than their expected recovery value, enabling the assets to achieve high investment grade status. Our exposure to subprime mortgage lending is limited to investments in banks and other financial institutions that may be affected by subprime lending and direct investments in ABS and RMBS. Mortgage-related ABS are backed by home equity loans and RMBS are backed by residential mortgages. These securities are backed by loans that are characterized by borrowers of differing levels of creditworthiness: prime; Alt-A; and subprime. Prime lending is the origination of residential mortgage loans to customers with excellent credit profiles. Alt-A lending is the origination of residential mortgage loans to customers who have prime credit profiles but lack documentation to substantiate income. Subprime lending is the origination of loans to customers with weak or impaired credit profiles. Delinquency and loss rates on residential mortgages and home equity loans have been showing positive trends, and, as long as the unemployment rate remains stable to improving, we expect these trends to continue. We continue to expect to receive payments in accordance with contractual terms for a significant amount of our securities, largely due to the seniority of the claims on the collateral of the securities that we own. The tranches of the securities will experience losses according to their seniority level with the least senior (or most junior), typically the unrated residual tranche, taking the first loss. Our ABS home equity and RMBS had a market value of $4.4 billion and an unrealized gain of $98 million as of December 31, 2016.
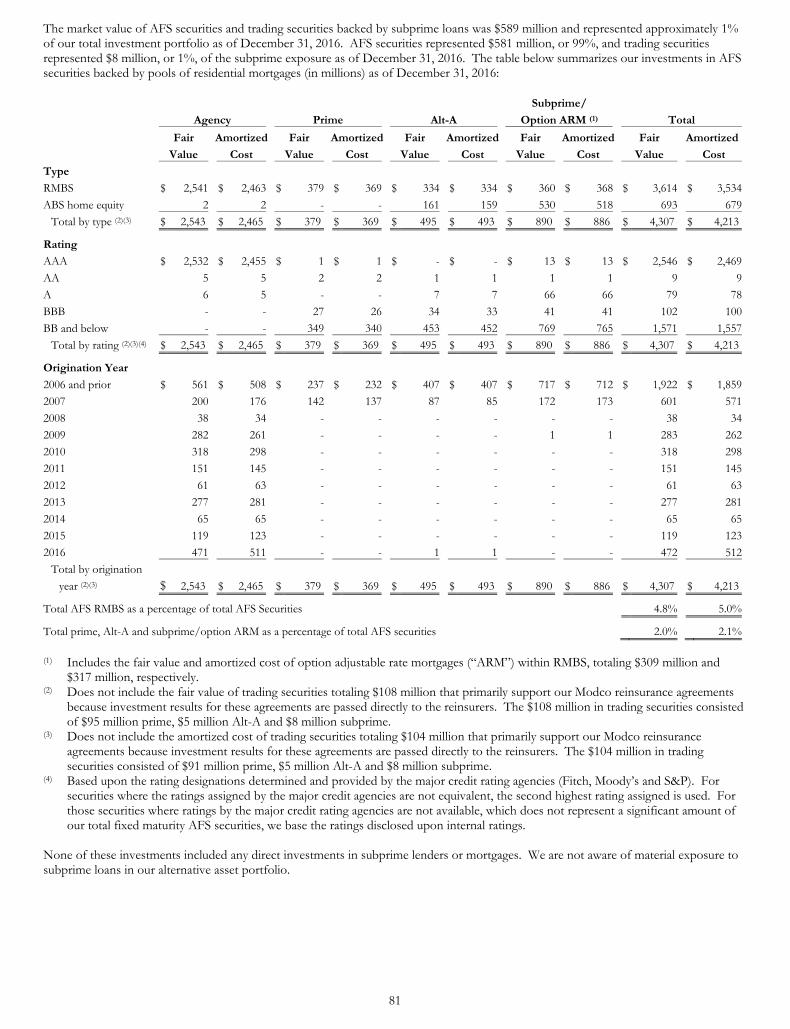
81
The market value of AFS securities and trading securities backed by subprime loans was $589 million and represented approximately 1% of our total investment portfolio as of December 31, 2016. AFS securities represented $581 million, or 99%, and trading securities represented $8 million, or 1%, of the subprime exposure as of December 31, 2016. The table below summarizes our investments in AFS securities backed by pools of residential mortgages (in millions) as of December 31, 2016:
Subprime/
Agency Prime Alt-A Option ARM (1) Total
Fair Amortized Fair Amortized Fair Amortized Fair Amortized Fair Amortized
Value Cost Value Cost Value Cost Value Cost Value Cost
Type
RMBS $ 2,541 $ 2,463 $ 379 $ 369 $ 334 $ 334 $ 360 $ 368 $ 3,614 $ 3,534
ABS home equity 2 2 - - 161 159 530 518 693 679
Total by type (2)(3) $ 2,543 $ 2,465 $ 379 $ 369 $ 495 $ 493 $ 890 $ 886 $ 4,307 $ 4,213
Rating
AAA $ 2,532 $ 2,455 $ 1 $ 1 $ - $ - $ 13 $ 13 $ 2,546 $ 2,469
AA 5 5 2 2 1 1 1 1 9 9
A 6 5 - - 7 7 66 66 79 78
BBB - - 27 26 34 33 41 41 102 100
BB and below - - 349 340 453 452 769 765 1,571 1,557
Total by rating (2)(3)(4) $ 2,543 $ 2,465 $ 379 $ 369 $ 495 $ 493 $ 890 $ 886 $ 4,307 $ 4,213
Origination Year
2006 and prior $ 561 $ 508 $ 237 $ 232 $ 407 $ 407 $ 717 $ 712 $ 1,922 $ 1,859
2007 200 176 142 137 87 85 172 173 601 571
2008 38 34 - - - - - - 38 34
2009 282 261 - - - - 1 1 283 262
2010 318 298 - - - - - - 318 298
2011 151 145 - - - - - - 151 145
2012 61 63 - - - - - - 61 63
2013 277 281 - - - - - - 277 281
2014 65 65 - - - - - - 65 65
2015 119 123 - - - - - - 119 123
2016 471 511 - - 1 1 - - 472 512
Total by origination
year (2)(3) $ 2,543 $ 2,465 $ 379 $ 369 $ 495 $ 493 $ 890 $ 886 $ 4,307 $ 4,213
Total AFS RMBS as a percentage of total AFS Securities 4.8% 5.0%
Total prime, Alt-A and subprime/option ARM as a percentage of total AFS securities 2.0% 2.1% (1) Includes the fair value and amortized cost of option adjustable rate mortgages (“ARM”) within RMBS, totaling $309 million and
$317 million, respectively. (2) Does not include the fair value of trading securities totaling $108 million that primarily support our Modco reinsurance agreements
because investment results for these agreements are passed directly to the reinsurers. The $108 million in trading securities consisted of $95 million prime, $5 million Alt-A and $8 million subprime.
(3) Does not include the amortized cost of trading securities totaling $104 million that primarily support our Modco reinsurance agreements because investment results for these agreements are passed directly to the reinsurers. The $104 million in trading securities consisted of $91 million prime, $5 million Alt-A and $8 million subprime.
(4) Based upon the rating designations determined and provided by the major credit rating agencies (Fitch, Moody’s and S&P). For securities where the ratings assigned by the major credit agencies are not equivalent, the second highest rating assigned is used. For those securities where ratings by the major credit rating agencies are not available, which does not represent a significant amount of our total fixed maturity AFS securities, we base the ratings disclosed upon internal ratings.
None of these investments included any direct investments in subprime lenders or mortgages. We are not aware of material exposure to subprime loans in our alternative asset portfolio.
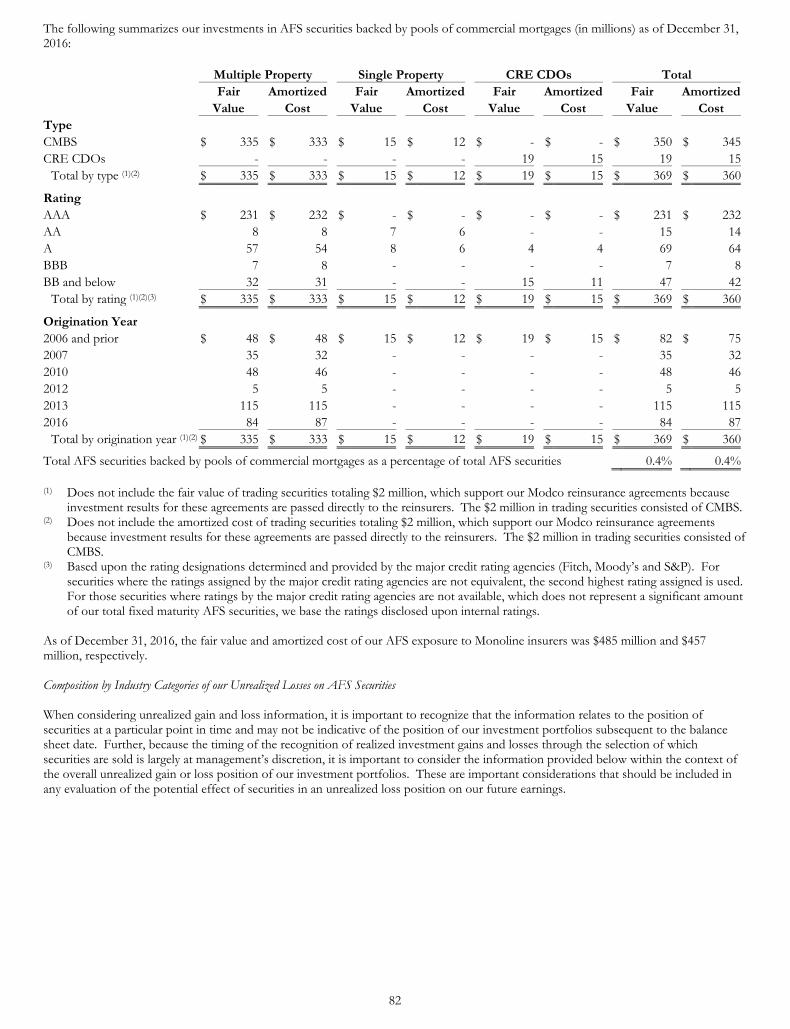
82
The following summarizes our investments in AFS securities backed by pools of commercial mortgages (in millions) as of December 31, 2016:
Multiple Property Single Property CRE CDOs Total Fair Amortized Fair Amortized Fair Amortized Fair Amortized Value Cost Value Cost Value Cost Value Cost Type CMBS $ 335 $ 333 $ 15 $ 12 $ - $ - $ 350 $ 345CRE CDOs - - - - 19 15 19 15
Total by type (1)(2) $ 335 $ 333 $ 15 $ 12 $ 19 $ 15 $ 369 $ 360
Rating AAA $ 231 $ 232 $ - $ - $ - $ - $ 231 $ 232AA 8 8 7 6 - - 15 14A 57 54 8 6 4 4 69 64BBB 7 8 - - - - 7 8BB and below 32 31 - - 15 11 47 42
Total by rating (1)(2)(3) $ 335 $ 333 $ 15 $ 12 $ 19 $ 15 $ 369 $ 360
Origination Year 2006 and prior $ 48 $ 48 $ 15 $ 12 $ 19 $ 15 $ 82 $ 752007 35 32 - - - - 35 322010 48 46 - - - - 48 462012 5 5 - - - - 5 52013 115 115 - - - - 115 1152016 84 87 - - - - 84 87
Total by origination year (1)(2) $ 335 $ 333 $ 15 $ 12 $ 19 $ 15 $ 369 $ 360
Total AFS securities backed by pools of commercial mortgages as a percentage of total AFS securities 0.4% 0.4% (1) Does not include the fair value of trading securities totaling $2 million, which support our Modco reinsurance agreements because
investment results for these agreements are passed directly to the reinsurers. The $2 million in trading securities consisted of CMBS. (2) Does not include the amortized cost of trading securities totaling $2 million, which support our Modco reinsurance agreements
because investment results for these agreements are passed directly to the reinsurers. The $2 million in trading securities consisted of CMBS.
(3) Based upon the rating designations determined and provided by the major credit rating agencies (Fitch, Moody’s and S&P). For securities where the ratings assigned by the major credit rating agencies are not equivalent, the second highest rating assigned is used. For those securities where ratings by the major credit rating agencies are not available, which does not represent a significant amount of our total fixed maturity AFS securities, we base the ratings disclosed upon internal ratings.
As of December 31, 2016, the fair value and amortized cost of our AFS exposure to Monoline insurers was $485 million and $457 million, respectively. Composition by Industry Categories of our Unrealized Losses on AFS Securities When considering unrealized gain and loss information, it is important to recognize that the information relates to the position of securities at a particular point in time and may not be indicative of the position of our investment portfolios subsequent to the balance sheet date. Further, because the timing of the recognition of realized investment gains and losses through the selection of which securities are sold is largely at management’s discretion, it is important to consider the information provided below within the context of the overall unrealized gain or loss position of our investment portfolios. These are important considerations that should be included in any evaluation of the potential effect of securities in an unrealized loss position on our future earnings.
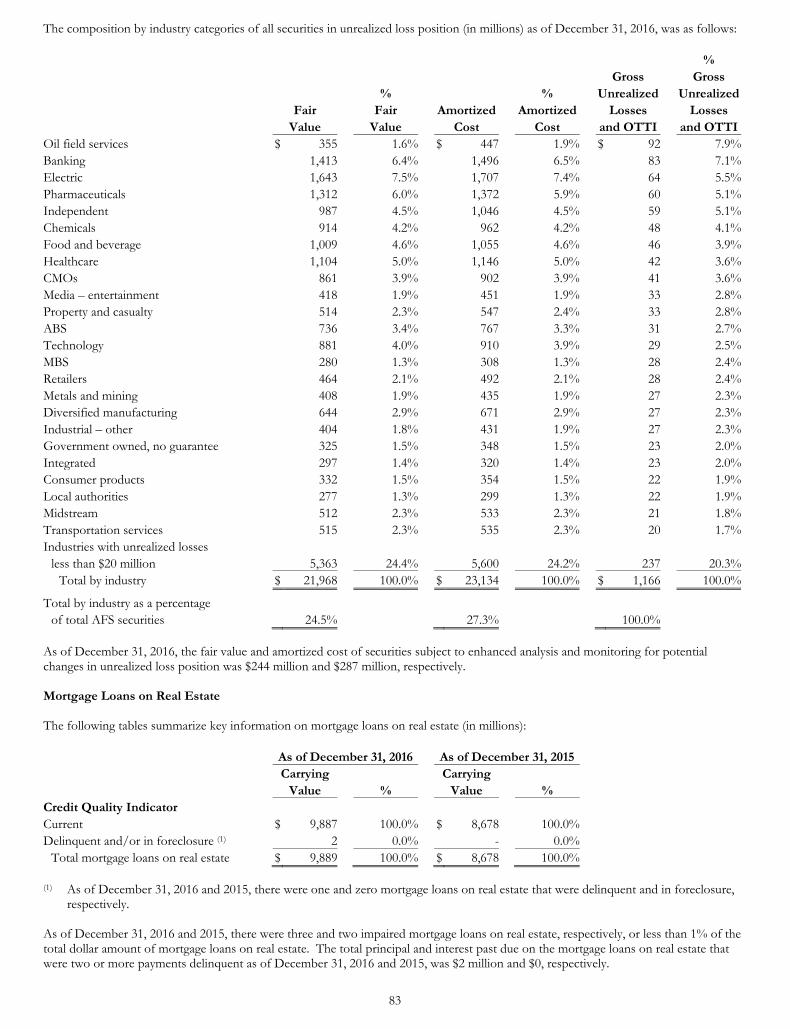
83
The composition by industry categories of all securities in unrealized loss position (in millions) as of December 31, 2016, was as follows:
% Gross Gross % % Unrealized Unrealized Fair Fair Amortized Amortized Losses Losses Value Value Cost Cost and OTTI and OTTIOil field services $ 355 1.6% $ 447 1.9% $ 92 7.9%Banking 1,413 6.4% 1,496 6.5% 83 7.1%Electric 1,643 7.5% 1,707 7.4% 64 5.5%Pharmaceuticals 1,312 6.0% 1,372 5.9% 60 5.1%Independent 987 4.5% 1,046 4.5% 59 5.1%Chemicals 914 4.2% 962 4.2% 48 4.1%Food and beverage 1,009 4.6% 1,055 4.6% 46 3.9%Healthcare 1,104 5.0% 1,146 5.0% 42 3.6%CMOs 861 3.9% 902 3.9% 41 3.6%Media – entertainment 418 1.9% 451 1.9% 33 2.8%Property and casualty 514 2.3% 547 2.4% 33 2.8%ABS 736 3.4% 767 3.3% 31 2.7%Technology 881 4.0% 910 3.9% 29 2.5%MBS 280 1.3% 308 1.3% 28 2.4%Retailers 464 2.1% 492 2.1% 28 2.4%Metals and mining 408 1.9% 435 1.9% 27 2.3%Diversified manufacturing 644 2.9% 671 2.9% 27 2.3%Industrial – other 404 1.8% 431 1.9% 27 2.3%Government owned, no guarantee 325 1.5% 348 1.5% 23 2.0%Integrated 297 1.4% 320 1.4% 23 2.0%Consumer products 332 1.5% 354 1.5% 22 1.9%Local authorities 277 1.3% 299 1.3% 22 1.9%Midstream 512 2.3% 533 2.3% 21 1.8%Transportation services 515 2.3% 535 2.3% 20 1.7%Industries with unrealized losses
less than $20 million 5,363 24.4% 5,600 24.2% 237 20.3%Total by industry $ 21,968 100.0% $ 23,134 100.0% $ 1,166 100.0%
Total by industry as a percentage of total AFS securities 24.5% 27.3% 100.0%
As of December 31, 2016, the fair value and amortized cost of securities subject to enhanced analysis and monitoring for potential changes in unrealized loss position was $244 million and $287 million, respectively. Mortgage Loans on Real Estate The following tables summarize key information on mortgage loans on real estate (in millions):
As of December 31, 2016 As of December 31, 2015 Carrying Carrying Value % Value % Credit Quality Indicator Current $ 9,887 100.0% $ 8,678 100.0% Delinquent and/or in foreclosure (1) 2 0.0% - 0.0%
Total mortgage loans on real estate $ 9,889 100.0% $ 8,678 100.0% (1) As of December 31, 2016 and 2015, there were one and zero mortgage loans on real estate that were delinquent and in foreclosure,
respectively. As of December 31, 2016 and 2015, there were three and two impaired mortgage loans on real estate, respectively, or less than 1% of the total dollar amount of mortgage loans on real estate. The total principal and interest past due on the mortgage loans on real estate that were two or more payments delinquent as of December 31, 2016 and 2015, was $2 million and $0, respectively.

84
See Note 1 for more information regarding our accounting policy relating to the impairment of mortgage loans on real estate.
As of December 31, 2016 2015 By Segment Annuities $ 2,699 $ 2,027 Retirement Plan Services 2,663 2,082 Life Insurance 3,837 3,944 Group Protection 310 294 Other Operations 380 331
Total mortgage loans on real estate $ 9,889 $ 8,678
As of December 31, 2016 As of December 31, 2016 Carrying Carrying Value % Value % Property Type State Exposure Apartment $ 3,378 34.2% CA $ 1,939 19.6%Office building 2,285 23.1% TX 1,115 11.3%Industrial 1,727 17.4% MD 567 5.7%Retail 1,819 18.4% NY 471 4.8%Mixed use 344 3.5% OH 454 4.6%Other commercial 293 3.0% GA 438 4.4%Hotel/motel 43 0.4% FL 433 4.4%
Total $ 9,889 100.0% VA 416 4.2%Geographic Region PA 392 4.0%Pacific $ 2,548 25.8% NC 369 3.7%South Atlantic 2,426 24.5% TN 368 3.7%East North Central 1,109 11.2% WA 362 3.7%West South Central 1,175 11.8% WI 306 3.1%Middle Atlantic 895 9.1% AZ 251 2.5%Mountain 628 6.4% OR 247 2.5%East South Central 506 5.1% MN 210 2.1%West North Central 419 4.2% Other states under 2% 1,551 15.7%New England 183 1.9% Total $ 9,889 100.0%
Total $ 9,889 100.0%
As of December 31, 2016 As of December 31, 2016 Principal Principal Amount % Amount % Origination Year Future Principal Payments 2011 and prior $ 2,877 29.1% 2017 $ 392 4.0%2012 762 7.7% 2018 615 6.2%2013 993 10.0% 2019 235 2.4%2014 1,247 12.6% 2020 159 1.6%2015 1,899 19.2% 2021 693 7.0%2016 2,112 21.4% 2022 and thereafter 7,796 78.8%
Total $ 9,890 100.0% Total $ 9,890 100.0% See Note 5 for information regarding our loan-to-value and debt-service coverage ratios and our allowance for loan losses.
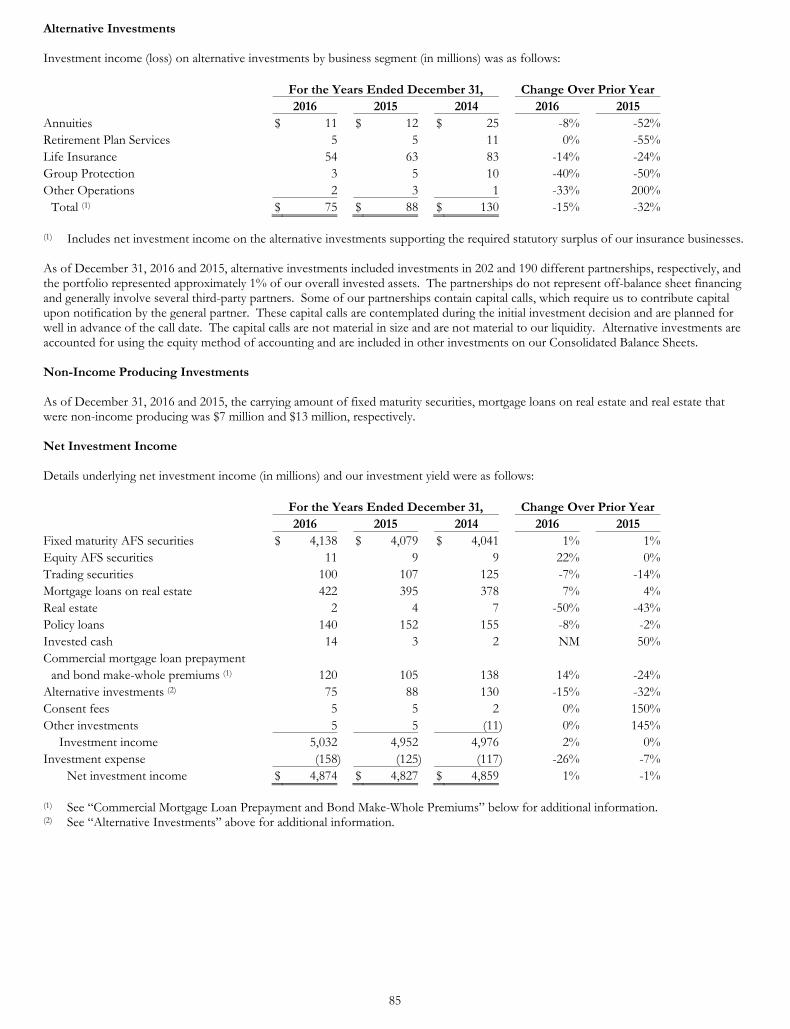
85
Alternative Investments Investment income (loss) on alternative investments by business segment (in millions) was as follows:
For the Years Ended December 31, Change Over Prior Year 2016 2015 2014 2016 2015 Annuities $ 11 $ 12 $ 25 -8% -52%Retirement Plan Services 5 5 11 0% -55%Life Insurance 54 63 83 -14% -24%Group Protection 3 5 10 -40% -50%Other Operations 2 3 1 -33% 200%
Total (1) $ 75 $ 88 $ 130 -15% -32% (1) Includes net investment income on the alternative investments supporting the required statutory surplus of our insurance businesses. As of December 31, 2016 and 2015, alternative investments included investments in 202 and 190 different partnerships, respectively, and the portfolio represented approximately 1% of our overall invested assets. The partnerships do not represent off-balance sheet financing and generally involve several third-party partners. Some of our partnerships contain capital calls, which require us to contribute capital upon notification by the general partner. These capital calls are contemplated during the initial investment decision and are planned for well in advance of the call date. The capital calls are not material in size and are not material to our liquidity. Alternative investments are accounted for using the equity method of accounting and are included in other investments on our Consolidated Balance Sheets. Non-Income Producing Investments As of December 31, 2016 and 2015, the carrying amount of fixed maturity securities, mortgage loans on real estate and real estate that were non-income producing was $7 million and $13 million, respectively. Net Investment Income Details underlying net investment income (in millions) and our investment yield were as follows:
For the Years Ended December 31, Change Over Prior Year 2016 2015 2014 2016 2015 Fixed maturity AFS securities $ 4,138 $ 4,079 $ 4,041 1% 1%Equity AFS securities 11 9 9 22% 0%Trading securities 100 107 125 -7% -14%Mortgage loans on real estate 422 395 378 7% 4%Real estate 2 4 7 -50% -43%Policy loans 140 152 155 -8% -2%Invested cash 14 3 2 NM 50%Commercial mortgage loan prepayment
and bond make-whole premiums (1) 120 105 138 14% -24%Alternative investments (2) 75 88 130 -15% -32%Consent fees 5 5 2 0% 150%Other investments 5 5 (11) 0% 145%
Investment income 5,032 4,952 4,976 2% 0%Investment expense (158) (125) (117) -26% -7%
Net investment income $ 4,874 $ 4,827 $ 4,859 1% -1% (1) See “Commercial Mortgage Loan Prepayment and Bond Make-Whole Premiums” below for additional information. (2) See “Alternative Investments” above for additional information.
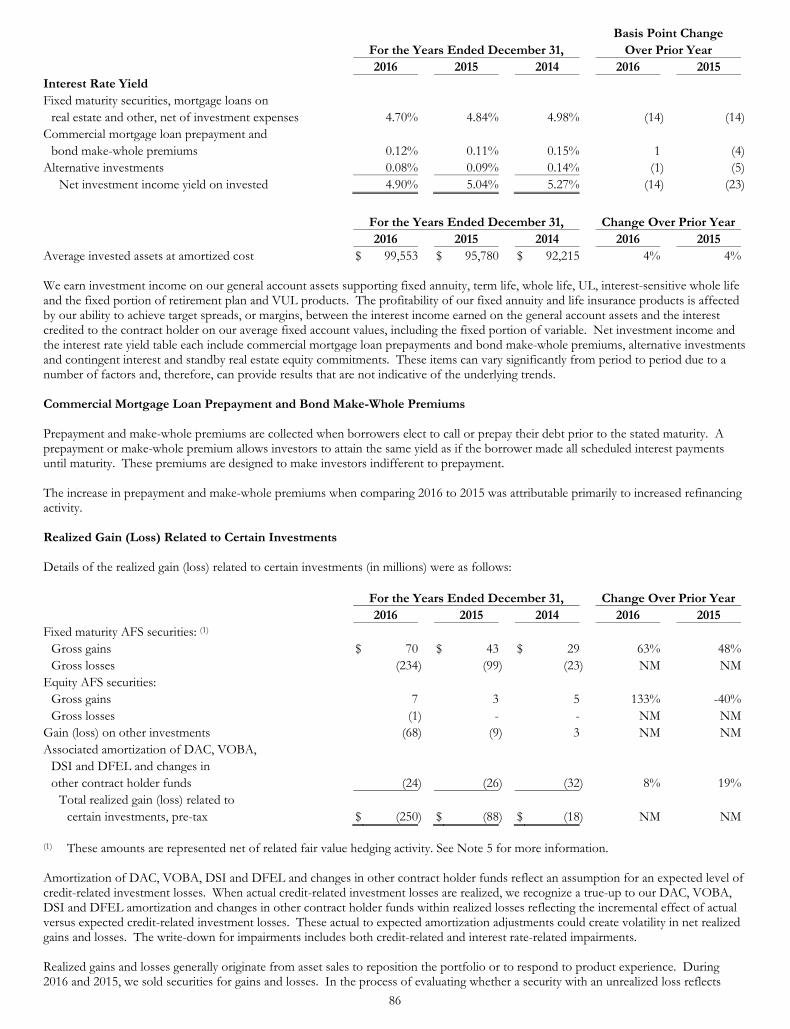
86
Basis Point Change For the Years Ended December 31, Over Prior Year 2016 2015 2014 2016 2015 Interest Rate Yield Fixed maturity securities, mortgage loans on
real estate and other, net of investment expenses 4.70% 4.84% 4.98% (14) (14)Commercial mortgage loan prepayment and
bond make-whole premiums 0.12% 0.11% 0.15% 1 (4)Alternative investments 0.08% 0.09% 0.14% (1) (5)
Net investment income yield on invested 4.90% 5.04% 5.27% (14) (23)
For the Years Ended December 31, Change Over Prior Year 2016 2015 2014 2016 2015 Average invested assets at amortized cost $ 99,553 $ 95,780 $ 92,215 4% 4% We earn investment income on our general account assets supporting fixed annuity, term life, whole life, UL, interest-sensitive whole life and the fixed portion of retirement plan and VUL products. The profitability of our fixed annuity and life insurance products is affected by our ability to achieve target spreads, or margins, between the interest income earned on the general account assets and the interest credited to the contract holder on our average fixed account values, including the fixed portion of variable. Net investment income and the interest rate yield table each include commercial mortgage loan prepayments and bond make-whole premiums, alternative investments and contingent interest and standby real estate equity commitments. These items can vary significantly from period to period due to a number of factors and, therefore, can provide results that are not indicative of the underlying trends. Commercial Mortgage Loan Prepayment and Bond Make-Whole Premiums Prepayment and make-whole premiums are collected when borrowers elect to call or prepay their debt prior to the stated maturity. A prepayment or make-whole premium allows investors to attain the same yield as if the borrower made all scheduled interest payments until maturity. These premiums are designed to make investors indifferent to prepayment. The increase in prepayment and make-whole premiums when comparing 2016 to 2015 was attributable primarily to increased refinancing activity. Realized Gain (Loss) Related to Certain Investments Details of the realized gain (loss) related to certain investments (in millions) were as follows:
For the Years Ended December 31, Change Over Prior Year 2016 2015 2014 2016 2015 Fixed maturity AFS securities: (1)
Gross gains $ 70 $ 43 $ 29 63% 48%Gross losses (234) (99) (23) NM NM
Equity AFS securities: Gross gains 7 3 5 133% -40%Gross losses (1) - - NM NM
Gain (loss) on other investments (68) (9) 3 NM NMAssociated amortization of DAC, VOBA,
DSI and DFEL and changes in other contract holder funds (24) (26) (32) 8% 19%
Total realized gain (loss) related to certain investments, pre-tax $ (250) $ (88) $ (18) NM NM
(1) These amounts are represented net of related fair value hedging activity. See Note 5 for more information. Amortization of DAC, VOBA, DSI and DFEL and changes in other contract holder funds reflect an assumption for an expected level of credit-related investment losses. When actual credit-related investment losses are realized, we recognize a true-up to our DAC, VOBA, DSI and DFEL amortization and changes in other contract holder funds within realized losses reflecting the incremental effect of actual versus expected credit-related investment losses. These actual to expected amortization adjustments could create volatility in net realized gains and losses. The write-down for impairments includes both credit-related and interest rate-related impairments. Realized gains and losses generally originate from asset sales to reposition the portfolio or to respond to product experience. During 2016 and 2015, we sold securities for gains and losses. In the process of evaluating whether a security with an unrealized loss reflects
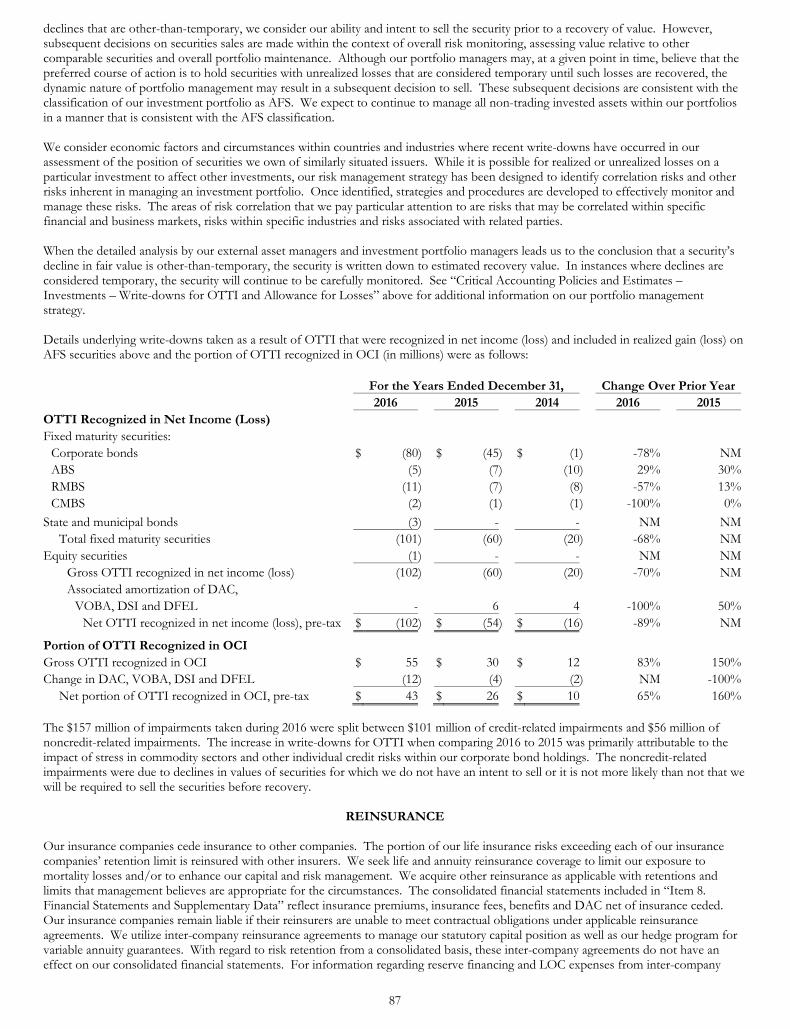
87
declines that are other-than-temporary, we consider our ability and intent to sell the security prior to a recovery of value. However, subsequent decisions on securities sales are made within the context of overall risk monitoring, assessing value relative to other comparable securities and overall portfolio maintenance. Although our portfolio managers may, at a given point in time, believe that the preferred course of action is to hold securities with unrealized losses that are considered temporary until such losses are recovered, the dynamic nature of portfolio management may result in a subsequent decision to sell. These subsequent decisions are consistent with the classification of our investment portfolio as AFS. We expect to continue to manage all non-trading invested assets within our portfolios in a manner that is consistent with the AFS classification. We consider economic factors and circumstances within countries and industries where recent write-downs have occurred in our assessment of the position of securities we own of similarly situated issuers. While it is possible for realized or unrealized losses on a particular investment to affect other investments, our risk management strategy has been designed to identify correlation risks and other risks inherent in managing an investment portfolio. Once identified, strategies and procedures are developed to effectively monitor and manage these risks. The areas of risk correlation that we pay particular attention to are risks that may be correlated within specific financial and business markets, risks within specific industries and risks associated with related parties. When the detailed analysis by our external asset managers and investment portfolio managers leads us to the conclusion that a security’s decline in fair value is other-than-temporary, the security is written down to estimated recovery value. In instances where declines are considered temporary, the security will continue to be carefully monitored. See “Critical Accounting Policies and Estimates – Investments – Write-downs for OTTI and Allowance for Losses” above for additional information on our portfolio management strategy. Details underlying write-downs taken as a result of OTTI that were recognized in net income (loss) and included in realized gain (loss) on AFS securities above and the portion of OTTI recognized in OCI (in millions) were as follows:
For the Years Ended December 31, Change Over Prior Year 2016 2015 2014 2016 2015 OTTI Recognized in Net Income (Loss) Fixed maturity securities:
Corporate bonds $ (80) $ (45) $ (1) -78% NMABS (5) (7) (10) 29% 30%RMBS (11) (7) (8) -57% 13%CMBS (2) (1) (1) -100% 0%
State and municipal bonds (3) - - NM NMTotal fixed maturity securities (101) (60) (20) -68% NM
Equity securities (1) - - NM NMGross OTTI recognized in net income (loss) (102) (60) (20) -70% NMAssociated amortization of DAC,
VOBA, DSI and DFEL - 6 4 -100% 50%Net OTTI recognized in net income (loss), pre-tax $ (102) $ (54) $ (16) -89% NM
Portion of OTTI Recognized in OCI Gross OTTI recognized in OCI $ 55 $ 30 $ 12 83% 150%Change in DAC, VOBA, DSI and DFEL (12) (4) (2) NM -100%
Net portion of OTTI recognized in OCI, pre-tax $ 43 $ 26 $ 10 65% 160% The $157 million of impairments taken during 2016 were split between $101 million of credit-related impairments and $56 million of noncredit-related impairments. The increase in write-downs for OTTI when comparing 2016 to 2015 was primarily attributable to the impact of stress in commodity sectors and other individual credit risks within our corporate bond holdings. The noncredit-related impairments were due to declines in values of securities for which we do not have an intent to sell or it is not more likely than not that we will be required to sell the securities before recovery.
REINSURANCE Our insurance companies cede insurance to other companies. The portion of our life insurance risks exceeding each of our insurance companies’ retention limit is reinsured with other insurers. We seek life and annuity reinsurance coverage to limit our exposure to mortality losses and/or to enhance our capital and risk management. We acquire other reinsurance as applicable with retentions and limits that management believes are appropriate for the circumstances. The consolidated financial statements included in “Item 8. Financial Statements and Supplementary Data” reflect insurance premiums, insurance fees, benefits and DAC net of insurance ceded. Our insurance companies remain liable if their reinsurers are unable to meet contractual obligations under applicable reinsurance agreements. We utilize inter-company reinsurance agreements to manage our statutory capital position as well as our hedge program for variable annuity guarantees. With regard to risk retention from a consolidated basis, these inter-company agreements do not have an effect on our consolidated financial statements. For information regarding reserve financing and LOC expenses from inter-company
88
reinsurance agreements, see “Review of Consolidated Financial Condition – Liquidity and Capital Resources – Uses of Capital – Contractual Obligations” below. We focus on obtaining reinsurance from a diverse group of reinsurers. We have established standards and criteria for our use and selection of reinsurers. In order for a new reinsurer to participate in our current program, we require the reinsurer to have an A.M. Best rating of A+ or greater or an S&P rating of AA- or better and a specified RBC percentage. If the reinsurer does not have these ratings, we generally require them to post collateral as described below; however, we may initially waive the collateral requirements based on the facts and circumstances. In addition, we may require collateral from a reinsurer to mitigate credit/collectability risk. Typically, in such cases, the reinsurer must either maintain minimum specified ratings and RBC ratios or establish the specified quality and quantity of collateral. Similarly, we have also required collateral in connection with books of business sold pursuant to indemnity reinsurance agreements. Reinsurers, including affiliated reinsurers, that are not licensed, accredited or authorized in the state of domicile of the reinsured (“ceding company”), i.e., unauthorized reinsurers, are required to post statutorily prescribed forms of collateral for the ceding company to receive reinsurance credit. The three primary forms of collateral are: (i) qualifying assets held in a reserve credit trust; (ii) irrevocable, unconditional, evergreen LOCs issued by a qualified U.S. financial institution; and (iii) assets held by the ceding company in a segregated funds withheld account. Collateral must be maintained in accordance with the rules of the ceding company’s state of domicile and must be readily accessible by the ceding company to cover claims under the reinsurance agreement. Accordingly, our insurance subsidiaries require unauthorized reinsurers to post acceptable forms of collateral to support their reinsurance obligations to us. Our amounts recoverable from reinsurers represent receivables from and reserves ceded to reinsurers. As of December 31, 2016, approximately 77%, or $4.1 billion, of our total reinsurance recoverable was secured by collateral for our benefit. Of this amount, $3.5 billion was held by reinsurers in reserve credit trusts (such reserve credit trusts are held by non-affiliated reinsurers; therefore, they are not reflected on our Consolidated Balance Sheets), $509 million was reflected as funds withheld reinsurance liabilities on our Consolidated Balance Sheets and $69 million was secured by LOCs for which we are the beneficiary, an off-balance sheet arrangement. We regularly evaluate the financial condition of our reinsurers and monitor concentration risk with our largest reinsurers at least annually. We monitor all of our existing reinsurers’ financial strength ratings on a monthly basis. We also monitor our reinsurers’ financial health, trends and commitment to the reinsurance business, statutory surplus, RBC levels, statutory earnings and fluctuations, current claims payment aging and our reinsurers’ own reinsurers. In addition, we present at least annually information regarding our reinsurance exposures to the Finance Committee of our Board of Directors. For more discussion of our counterparty risk with our reinsurers, see “Part I – Item 1A. Risk Factors – Operational Matters – We face risks of non-collectability of reinsurance and increased reinsurance rates, which could materially affect our results of operations.” See Note 9 and “Results of Life Insurance – Income (Loss) from Operations – Additional Information” for more information about reinsurance. For factors that could cause actual results to differ materially from those set forth in this section, see “Part I – Item 1A. Risk Factors” and “Forward-Looking Statements – Cautionary Language” above.
REVIEW OF CONSOLIDATED FINANCIAL CONDITION
Liquidity and Capital Resources
Sources of Liquidity and Cash Flow Liquidity refers to the ability of an enterprise to generate adequate amounts of cash from its normal operations to meet cash requirements with a prudent margin of safety. Our principal sources of cash flow from operating activities are insurance premiums and fees and investment income, while sources of cash flows from investing activities result from maturities and sales of invested assets. Our operating activities provided cash of $1.3 billion, $2.2 billion and $2.5 billion in 2016, 2015 and 2014, respectively. When considering our liquidity and cash flow, it is important to distinguish between the needs of our insurance subsidiaries and the needs of the holding company, LNC. As a holding company with no operations of its own, LNC derives its cash primarily from its operating subsidiaries. The sources of liquidity of the holding company are principally comprised of dividends and interest payments from subsidiaries, augmented by holding company short-term investments, bank lines of credit and the ongoing availability of long-term public financing under an SEC-filed shelf registration statement. These sources of liquidity and cash flow support the general corporate needs of the holding company, including its common stock dividends, interest and debt service, funding of callable securities, securities repurchases, acquisitions and investment in core businesses.
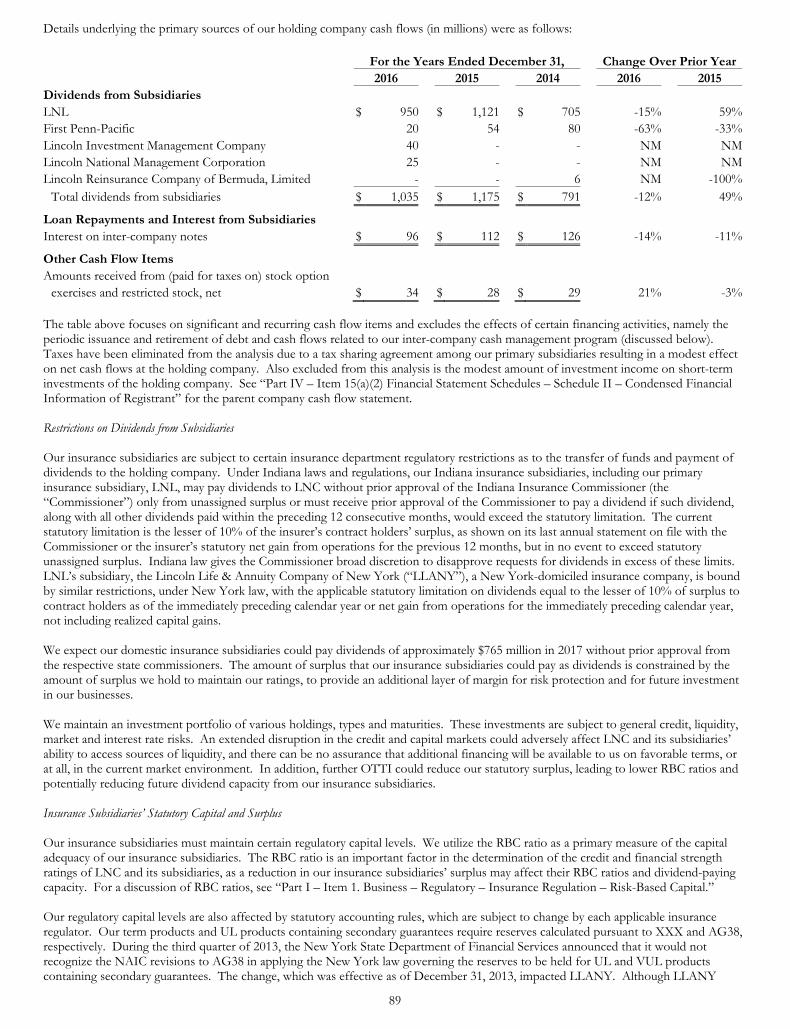
89
Details underlying the primary sources of our holding company cash flows (in millions) were as follows:
For the Years Ended December 31, Change Over Prior Year 2016 2015 2014 2016 2015 Dividends from Subsidiaries LNL $ 950 $ 1,121 $ 705 -15% 59%First Penn-Pacific 20 54 80 -63% -33%Lincoln Investment Management Company 40 - - NM NMLincoln National Management Corporation 25 - - NM NMLincoln Reinsurance Company of Bermuda, Limited - - 6 NM -100%
Total dividends from subsidiaries $ 1,035 $ 1,175 $ 791 -12% 49%
Loan Repayments and Interest from Subsidiaries Interest on inter-company notes $ 96 $ 112 $ 126 -14% -11%
Other Cash Flow Items Amounts received from (paid for taxes on) stock option
exercises and restricted stock, net $ 34 $ 28 $ 29 21% -3% The table above focuses on significant and recurring cash flow items and excludes the effects of certain financing activities, namely the periodic issuance and retirement of debt and cash flows related to our inter-company cash management program (discussed below). Taxes have been eliminated from the analysis due to a tax sharing agreement among our primary subsidiaries resulting in a modest effect on net cash flows at the holding company. Also excluded from this analysis is the modest amount of investment income on short-term investments of the holding company. See “Part IV – Item 15(a)(2) Financial Statement Schedules – Schedule II – Condensed Financial Information of Registrant” for the parent company cash flow statement. Restrictions on Dividends from Subsidiaries Our insurance subsidiaries are subject to certain insurance department regulatory restrictions as to the transfer of funds and payment of dividends to the holding company. Under Indiana laws and regulations, our Indiana insurance subsidiaries, including our primary insurance subsidiary, LNL, may pay dividends to LNC without prior approval of the Indiana Insurance Commissioner (the “Commissioner”) only from unassigned surplus or must receive prior approval of the Commissioner to pay a dividend if such dividend, along with all other dividends paid within the preceding 12 consecutive months, would exceed the statutory limitation. The current statutory limitation is the lesser of 10% of the insurer’s contract holders’ surplus, as shown on its last annual statement on file with the Commissioner or the insurer’s statutory net gain from operations for the previous 12 months, but in no event to exceed statutory unassigned surplus. Indiana law gives the Commissioner broad discretion to disapprove requests for dividends in excess of these limits. LNL’s subsidiary, the Lincoln Life & Annuity Company of New York (“LLANY”), a New York-domiciled insurance company, is bound by similar restrictions, under New York law, with the applicable statutory limitation on dividends equal to the lesser of 10% of surplus to contract holders as of the immediately preceding calendar year or net gain from operations for the immediately preceding calendar year, not including realized capital gains. We expect our domestic insurance subsidiaries could pay dividends of approximately $765 million in 2017 without prior approval from the respective state commissioners. The amount of surplus that our insurance subsidiaries could pay as dividends is constrained by the amount of surplus we hold to maintain our ratings, to provide an additional layer of margin for risk protection and for future investment in our businesses. We maintain an investment portfolio of various holdings, types and maturities. These investments are subject to general credit, liquidity, market and interest rate risks. An extended disruption in the credit and capital markets could adversely affect LNC and its subsidiaries’ ability to access sources of liquidity, and there can be no assurance that additional financing will be available to us on favorable terms, or at all, in the current market environment. In addition, further OTTI could reduce our statutory surplus, leading to lower RBC ratios and potentially reducing future dividend capacity from our insurance subsidiaries. Insurance Subsidiaries’ Statutory Capital and Surplus Our insurance subsidiaries must maintain certain regulatory capital levels. We utilize the RBC ratio as a primary measure of the capital adequacy of our insurance subsidiaries. The RBC ratio is an important factor in the determination of the credit and financial strength ratings of LNC and its subsidiaries, as a reduction in our insurance subsidiaries’ surplus may affect their RBC ratios and dividend-paying capacity. For a discussion of RBC ratios, see “Part I – Item 1. Business – Regulatory – Insurance Regulation – Risk-Based Capital.” Our regulatory capital levels are also affected by statutory accounting rules, which are subject to change by each applicable insurance regulator. Our term products and UL products containing secondary guarantees require reserves calculated pursuant to XXX and AG38, respectively. During the third quarter of 2013, the New York State Department of Financial Services announced that it would not recognize the NAIC revisions to AG38 in applying the New York law governing the reserves to be held for UL and VUL products containing secondary guarantees. The change, which was effective as of December 31, 2013, impacted LLANY. Although LLANY

90
discontinued the sale of these products in early 2013, the change affected those policies previously sold. We began phasing in the increase in reserves in 2013 at $90 million per year over five years, with the final increase in reserves occurring in 2017. As of December 31, 2016, we had increased reserves by $360 million. In April 2016, LLANY entered into a third-party reinsurance arrangement primarily covering UL policies containing secondary guarantees issued between 2002 through 2014 that mitigates the financial impact of the increase of these reserves. As discussed in “Part I – Item 1. Risk Factors – Legislative, Regulatory, and Tax – Attempts to mitigate the impact of Regulation XXX and Actuarial Guideline 38 may fail in whole or in part resulting in an adverse effect on our financial condition and result of operations,” our insurance subsidiaries employ strategies to reduce the strain caused by XXX and AG38 by reinsuring the business to insurance captives. Our captive reinsurance and reinsurance subsidiaries provide a mechanism for financing a portion of the excess reserve amounts in a more efficient manner. We use long-dated LOCs and debt financing as well as other financing strategies to finance those reserves. Included in the LOCs issued as of December 31, 2016, and reported in the credit facilities table in Note 12, was approximately $3.7 billion of long-dated LOCs issued to support inter-company reinsurance arrangements. Approximately $2.6 billion of such LOCs were issued to support reinsurance for UL products containing secondary guarantees ($350 million will expire in 2019, $320 million will expire in 2021 and $1.9 billion will expire in 2031), and $1.1 billion of such LOCs that will expire in 2023 were issued to support reinsurance for term business. We have also used the proceeds from senior note issuances of $875 million to execute long-term structured solutions supporting reinsurance of UL products containing secondary guarantees. Additionally, our captive reinsurance and reinsurance subsidiaries have issued long-term notes of $1.8 billion as of December 31, 2016, to finance a portion of the excess reserves. For information on these long-term notes issued by our captive reinsurance and reinsurance subsidiaries, see Note 4. LOCs and related capital market solutions lower the capital effect of term products and UL products containing secondary guarantees. An inability to obtain appropriate capital market solutions could affect our returns on our in-force term products and UL products containing secondary guarantees. However, we believe that we have sufficient capital to support the increase in statutory reserves, based on our current reserve projections, if such structures were no longer available. Our captive reinsurance and reinsurance subsidiaries free up capital the insurance subsidiaries can use for any number of purposes, including paying dividends to the holding company. Actuarial Guideline 48 (“AG48”) regulates the terms of captive reinsurance arrangements that are entered into or amended in certain ways after December 31, 2014. AG48 imposes restrictions on the types of assets that can be used to support these arrangements. We have implemented and plan to continue to implement these arrangements in compliance with AG48. The NAIC’s adoption of the new Valuation Manual that defines a principles-based reserving framework for newly issued life insurance policies is effective January 1, 2017. Principles-based reserving will place a greater weight on our past experience and anticipated future experience as well as consider current economic conditions in calculating life insurance product reserves in accordance with statutory accounting principles. We plan to initially adopt the new framework in 2017 for primarily our newly issued term business and will phase in the framework prior to January 1, 2020, for all other newly issued life insurance products. We believe that these changes may reduce our future use of captive reinsurance and reinsurance subsidiaries for reserve financing transactions for our life insurance business. For more information on principles-based reserving, see “Part I – Item 1. Business – Regulatory – Insurance Regulation.” Statutory reserves established for variable annuity contracts and riders are sensitive to changes in the equity markets and are affected by the level of account values relative to the level of any guarantees, product design and reinsurance arrangements. As a result, the relationship between reserve changes and equity market performance is non-linear during any given reporting period. Market conditions greatly influence the ultimate capital required due to its effect on the valuation of reserves and derivative assets hedging these reserves. We also utilize inter-company reinsurance arrangements to manage our hedge program for variable annuity guarantees. The NAIC through its various committees, task forces and working groups has been evaluating the adequacy of existing NAIC model regulations with a focus on targeted improvements to the statutory reserving and accounting framework for variable annuities. For more information, see “Part I – Item 1A. Risk Factors – Federal Regulation – Changes in accounting standards issued by the Financial Accounting Standards Board or other standard-setting bodies may adversely affect our financial statements.” Changes in equity markets may also affect the capital position of our insurance subsidiaries. We may decide to reallocate available capital among our insurance subsidiaries, including our captive reinsurance subsidiaries, which would result in different RBC ratios for our insurance subsidiaries. In addition, changes in the equity markets can affect the value of our variable annuity separate accounts. When the market value of our separate account assets increases, the statutory surplus within our insurance subsidiaries also increases. Contrarily, when the market value of our separate account assets decreases, the statutory surplus within our insurance subsidiaries may also decrease, which may affect RBC ratios, and in the case of our separate account assets becoming less than the related product liabilities, we must allocate additional capital to fund the difference. We continue to analyze the use of our existing captive reinsurance structures, as well as additional third-party reinsurance arrangements, and our current hedging strategies relative to managing the effects of equity markets and interest rates on the statutory reserves, statutory capital and the dividend capacity of our life insurance subsidiaries. Financing Activities Although our subsidiaries currently generate adequate cash flow to meet the needs of our normal operations, periodically we may issue debt or equity securities to maintain ratings and increase liquidity, as well as to fund internal growth, acquisitions and the retirement of our debt and equity securities.
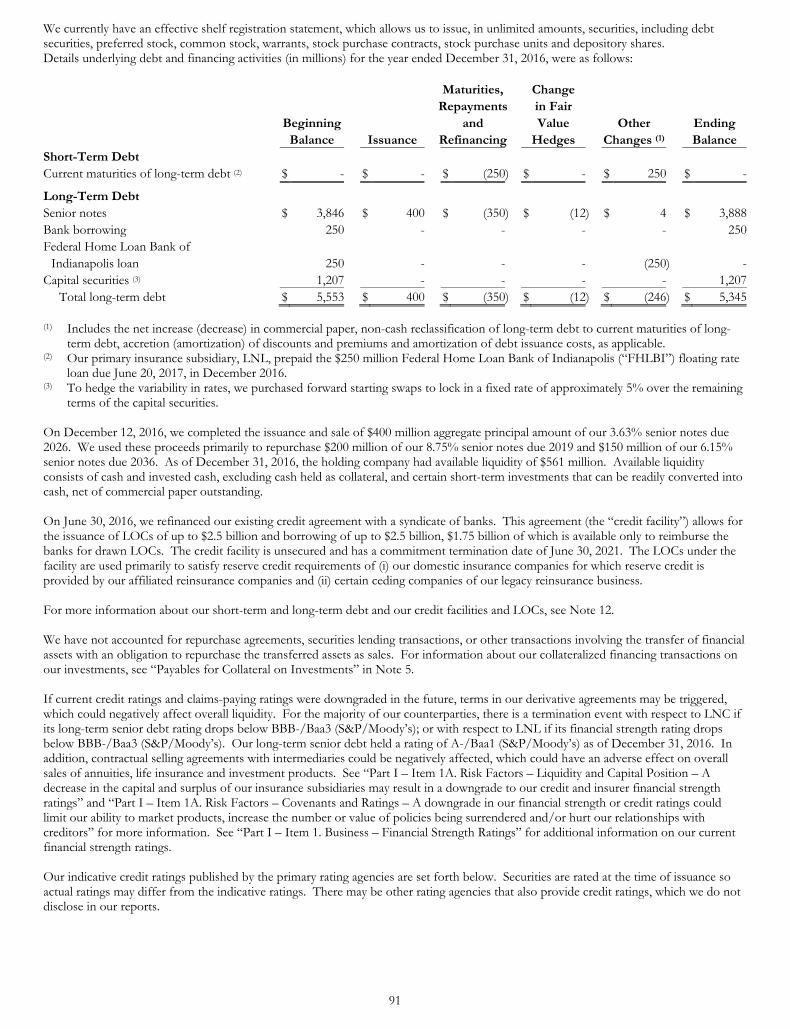
91
We currently have an effective shelf registration statement, which allows us to issue, in unlimited amounts, securities, including debt securities, preferred stock, common stock, warrants, stock purchase contracts, stock purchase units and depository shares. Details underlying debt and financing activities (in millions) for the year ended December 31, 2016, were as follows:
Maturities, Change Repayments in Fair Beginning and Value Other Ending Balance Issuance Refinancing Hedges Changes (1) Balance Short-Term Debt Current maturities of long-term debt (2) $ - $ - $ (250) $ - $ 250 $ -
Long-Term Debt Senior notes $ 3,846 $ 400 $ (350) $ (12) $ 4 $ 3,888Bank borrowing 250 - - - - 250Federal Home Loan Bank of
Indianapolis loan 250 - - - (250) -Capital securities (3) 1,207 - - - - 1,207
Total long-term debt $ 5,553 $ 400 $ (350) $ (12) $ (246) $ 5,345 (1) Includes the net increase (decrease) in commercial paper, non-cash reclassification of long-term debt to current maturities of long-
term debt, accretion (amortization) of discounts and premiums and amortization of debt issuance costs, as applicable. (2) Our primary insurance subsidiary, LNL, prepaid the $250 million Federal Home Loan Bank of Indianapolis (“FHLBI”) floating rate
loan due June 20, 2017, in December 2016. (3) To hedge the variability in rates, we purchased forward starting swaps to lock in a fixed rate of approximately 5% over the remaining
terms of the capital securities. On December 12, 2016, we completed the issuance and sale of $400 million aggregate principal amount of our 3.63% senior notes due 2026. We used these proceeds primarily to repurchase $200 million of our 8.75% senior notes due 2019 and $150 million of our 6.15% senior notes due 2036. As of December 31, 2016, the holding company had available liquidity of $561 million. Available liquidity consists of cash and invested cash, excluding cash held as collateral, and certain short-term investments that can be readily converted into cash, net of commercial paper outstanding. On June 30, 2016, we refinanced our existing credit agreement with a syndicate of banks. This agreement (the “credit facility”) allows for the issuance of LOCs of up to $2.5 billion and borrowing of up to $2.5 billion, $1.75 billion of which is available only to reimburse the banks for drawn LOCs. The credit facility is unsecured and has a commitment termination date of June 30, 2021. The LOCs under the facility are used primarily to satisfy reserve credit requirements of (i) our domestic insurance companies for which reserve credit is provided by our affiliated reinsurance companies and (ii) certain ceding companies of our legacy reinsurance business. For more information about our short-term and long-term debt and our credit facilities and LOCs, see Note 12. We have not accounted for repurchase agreements, securities lending transactions, or other transactions involving the transfer of financial assets with an obligation to repurchase the transferred assets as sales. For information about our collateralized financing transactions on our investments, see “Payables for Collateral on Investments” in Note 5. If current credit ratings and claims-paying ratings were downgraded in the future, terms in our derivative agreements may be triggered, which could negatively affect overall liquidity. For the majority of our counterparties, there is a termination event with respect to LNC if its long-term senior debt rating drops below BBB-/Baa3 (S&P/Moody’s); or with respect to LNL if its financial strength rating drops below BBB-/Baa3 (S&P/Moody’s). Our long-term senior debt held a rating of A-/Baa1 (S&P/Moody’s) as of December 31, 2016. In addition, contractual selling agreements with intermediaries could be negatively affected, which could have an adverse effect on overall sales of annuities, life insurance and investment products. See “Part I – Item 1A. Risk Factors – Liquidity and Capital Position – A decrease in the capital and surplus of our insurance subsidiaries may result in a downgrade to our credit and insurer financial strength ratings” and “Part I – Item 1A. Risk Factors – Covenants and Ratings – A downgrade in our financial strength or credit ratings could limit our ability to market products, increase the number or value of policies being surrendered and/or hurt our relationships with creditors” for more information. See “Part I – Item 1. Business – Financial Strength Ratings” for additional information on our current financial strength ratings. Our indicative credit ratings published by the primary rating agencies are set forth below. Securities are rated at the time of issuance so actual ratings may differ from the indicative ratings. There may be other rating agencies that also provide credit ratings, which we do not disclose in our reports.
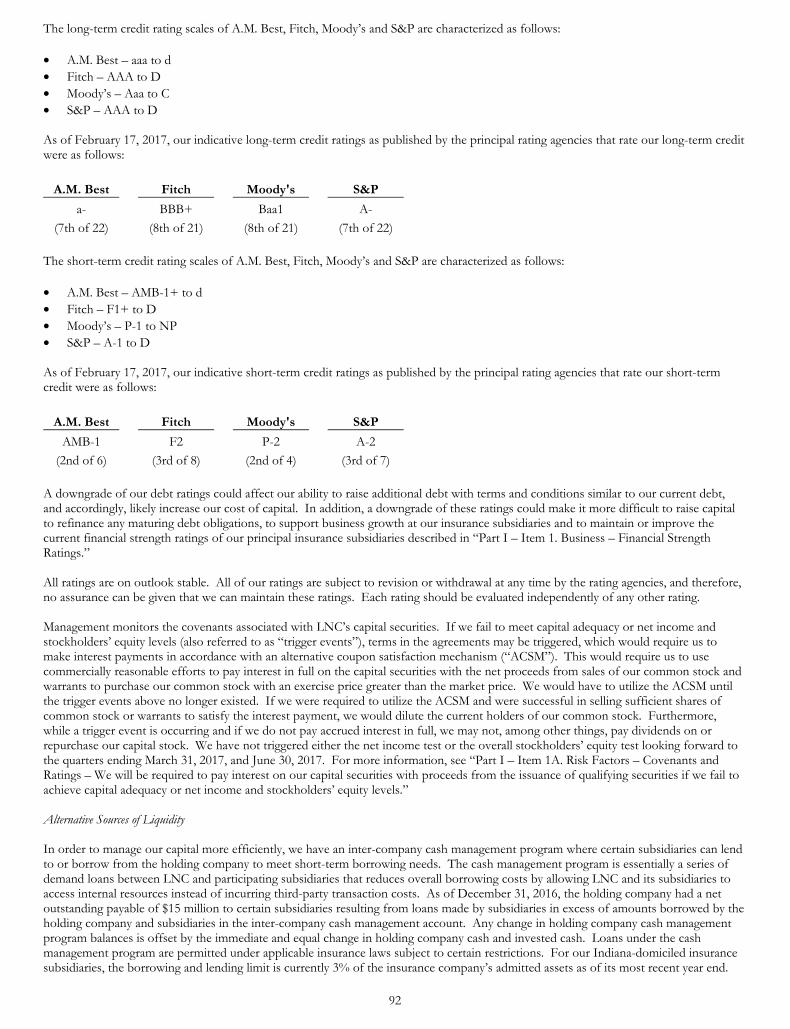
92
The long-term credit rating scales of A.M. Best, Fitch, Moody’s and S&P are characterized as follows: • A.M. Best – aaa to d • Fitch – AAA to D • Moody’s – Aaa to C • S&P – AAA to D As of February 17, 2017, our indicative long-term credit ratings as published by the principal rating agencies that rate our long-term credit were as follows:
A.M. Best Fitch Moody's S&P
a- BBB+ Baa1 A-
(7th of 22) (8th of 21) (8th of 21) (7th of 22) The short-term credit rating scales of A.M. Best, Fitch, Moody’s and S&P are characterized as follows: • A.M. Best – AMB-1+ to d • Fitch – F1+ to D • Moody’s – P-1 to NP • S&P – A-1 to D As of February 17, 2017, our indicative short-term credit ratings as published by the principal rating agencies that rate our short-term credit were as follows:
A.M. Best Fitch Moody's S&P
AMB-1 F2 P-2 A-2
(2nd of 6) (3rd of 8) (2nd of 4) (3rd of 7) A downgrade of our debt ratings could affect our ability to raise additional debt with terms and conditions similar to our current debt, and accordingly, likely increase our cost of capital. In addition, a downgrade of these ratings could make it more difficult to raise capital to refinance any maturing debt obligations, to support business growth at our insurance subsidiaries and to maintain or improve the current financial strength ratings of our principal insurance subsidiaries described in “Part I – Item 1. Business – Financial Strength Ratings.” All ratings are on outlook stable. All of our ratings are subject to revision or withdrawal at any time by the rating agencies, and therefore, no assurance can be given that we can maintain these ratings. Each rating should be evaluated independently of any other rating. Management monitors the covenants associated with LNC’s capital securities. If we fail to meet capital adequacy or net income and stockholders’ equity levels (also referred to as “trigger events”), terms in the agreements may be triggered, which would require us to make interest payments in accordance with an alternative coupon satisfaction mechanism (“ACSM”). This would require us to use commercially reasonable efforts to pay interest in full on the capital securities with the net proceeds from sales of our common stock and warrants to purchase our common stock with an exercise price greater than the market price. We would have to utilize the ACSM until the trigger events above no longer existed. If we were required to utilize the ACSM and were successful in selling sufficient shares of common stock or warrants to satisfy the interest payment, we would dilute the current holders of our common stock. Furthermore, while a trigger event is occurring and if we do not pay accrued interest in full, we may not, among other things, pay dividends on or repurchase our capital stock. We have not triggered either the net income test or the overall stockholders’ equity test looking forward to the quarters ending March 31, 2017, and June 30, 2017. For more information, see “Part I – Item 1A. Risk Factors – Covenants and Ratings – We will be required to pay interest on our capital securities with proceeds from the issuance of qualifying securities if we fail to achieve capital adequacy or net income and stockholders’ equity levels.” Alternative Sources of Liquidity In order to manage our capital more efficiently, we have an inter-company cash management program where certain subsidiaries can lend to or borrow from the holding company to meet short-term borrowing needs. The cash management program is essentially a series of demand loans between LNC and participating subsidiaries that reduces overall borrowing costs by allowing LNC and its subsidiaries to access internal resources instead of incurring third-party transaction costs. As of December 31, 2016, the holding company had a net outstanding payable of $15 million to certain subsidiaries resulting from loans made by subsidiaries in excess of amounts borrowed by the holding company and subsidiaries in the inter-company cash management account. Any change in holding company cash management program balances is offset by the immediate and equal change in holding company cash and invested cash. Loans under the cash management program are permitted under applicable insurance laws subject to certain restrictions. For our Indiana-domiciled insurance subsidiaries, the borrowing and lending limit is currently 3% of the insurance company’s admitted assets as of its most recent year end.
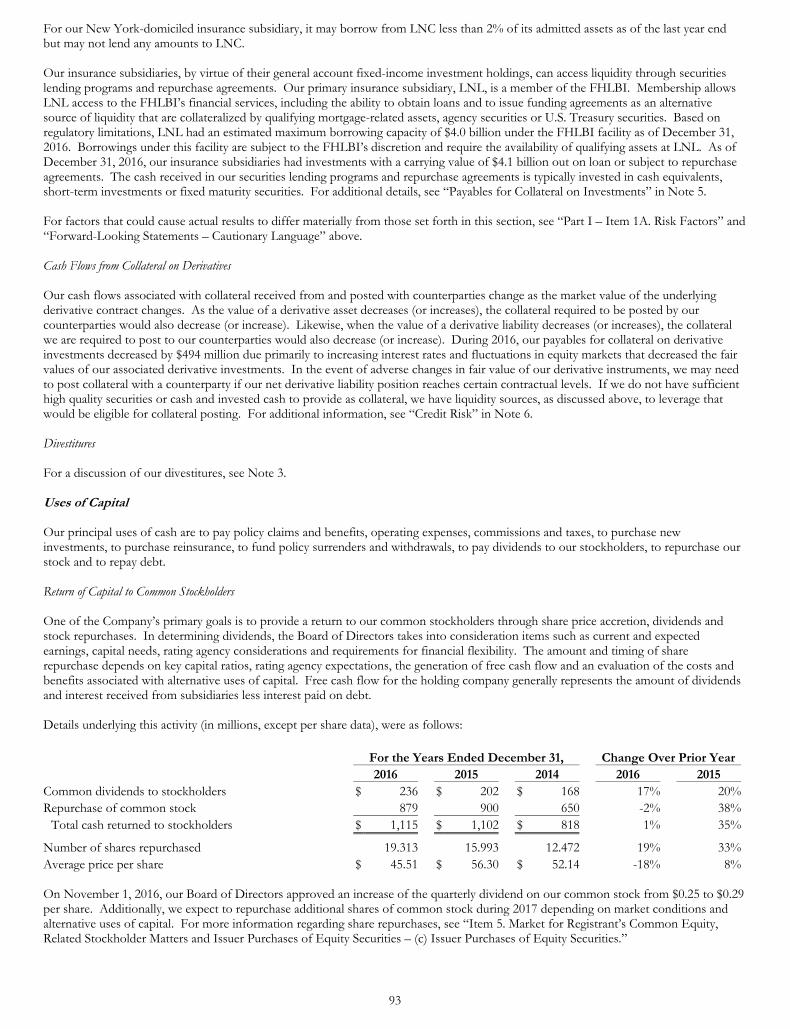
93
For our New York-domiciled insurance subsidiary, it may borrow from LNC less than 2% of its admitted assets as of the last year end but may not lend any amounts to LNC. Our insurance subsidiaries, by virtue of their general account fixed-income investment holdings, can access liquidity through securities lending programs and repurchase agreements. Our primary insurance subsidiary, LNL, is a member of the FHLBI. Membership allows LNL access to the FHLBI’s financial services, including the ability to obtain loans and to issue funding agreements as an alternative source of liquidity that are collateralized by qualifying mortgage-related assets, agency securities or U.S. Treasury securities. Based on regulatory limitations, LNL had an estimated maximum borrowing capacity of $4.0 billion under the FHLBI facility as of December 31, 2016. Borrowings under this facility are subject to the FHLBI’s discretion and require the availability of qualifying assets at LNL. As of December 31, 2016, our insurance subsidiaries had investments with a carrying value of $4.1 billion out on loan or subject to repurchase agreements. The cash received in our securities lending programs and repurchase agreements is typically invested in cash equivalents, short-term investments or fixed maturity securities. For additional details, see “Payables for Collateral on Investments” in Note 5. For factors that could cause actual results to differ materially from those set forth in this section, see “Part I – Item 1A. Risk Factors” and “Forward-Looking Statements – Cautionary Language” above. Cash Flows from Collateral on Derivatives Our cash flows associated with collateral received from and posted with counterparties change as the market value of the underlying derivative contract changes. As the value of a derivative asset decreases (or increases), the collateral required to be posted by our counterparties would also decrease (or increase). Likewise, when the value of a derivative liability decreases (or increases), the collateral we are required to post to our counterparties would also decrease (or increase). During 2016, our payables for collateral on derivative investments decreased by $494 million due primarily to increasing interest rates and fluctuations in equity markets that decreased the fair values of our associated derivative investments. In the event of adverse changes in fair value of our derivative instruments, we may need to post collateral with a counterparty if our net derivative liability position reaches certain contractual levels. If we do not have sufficient high quality securities or cash and invested cash to provide as collateral, we have liquidity sources, as discussed above, to leverage that would be eligible for collateral posting. For additional information, see “Credit Risk” in Note 6. Divestitures For a discussion of our divestitures, see Note 3. Uses of Capital Our principal uses of cash are to pay policy claims and benefits, operating expenses, commissions and taxes, to purchase new investments, to purchase reinsurance, to fund policy surrenders and withdrawals, to pay dividends to our stockholders, to repurchase our stock and to repay debt. Return of Capital to Common Stockholders One of the Company’s primary goals is to provide a return to our common stockholders through share price accretion, dividends and stock repurchases. In determining dividends, the Board of Directors takes into consideration items such as current and expected earnings, capital needs, rating agency considerations and requirements for financial flexibility. The amount and timing of share repurchase depends on key capital ratios, rating agency expectations, the generation of free cash flow and an evaluation of the costs and benefits associated with alternative uses of capital. Free cash flow for the holding company generally represents the amount of dividends and interest received from subsidiaries less interest paid on debt. Details underlying this activity (in millions, except per share data), were as follows:
For the Years Ended December 31, Change Over Prior Year 2016 2015 2014 2016 2015 Common dividends to stockholders $ 236 $ 202 $ 168 17% 20%Repurchase of common stock 879 900 650 -2% 38%
Total cash returned to stockholders $ 1,115 $ 1,102 $ 818 1% 35%
Number of shares repurchased 19.313 15.993 12.472 19% 33%Average price per share $ 45.51 $ 56.30 $ 52.14 -18% 8% On November 1, 2016, our Board of Directors approved an increase of the quarterly dividend on our common stock from $0.25 to $0.29 per share. Additionally, we expect to repurchase additional shares of common stock during 2017 depending on market conditions and alternative uses of capital. For more information regarding share repurchases, see “Item 5. Market for Registrant’s Common Equity, Related Stockholder Matters and Issuer Purchases of Equity Securities – (c) Issuer Purchases of Equity Securities.”
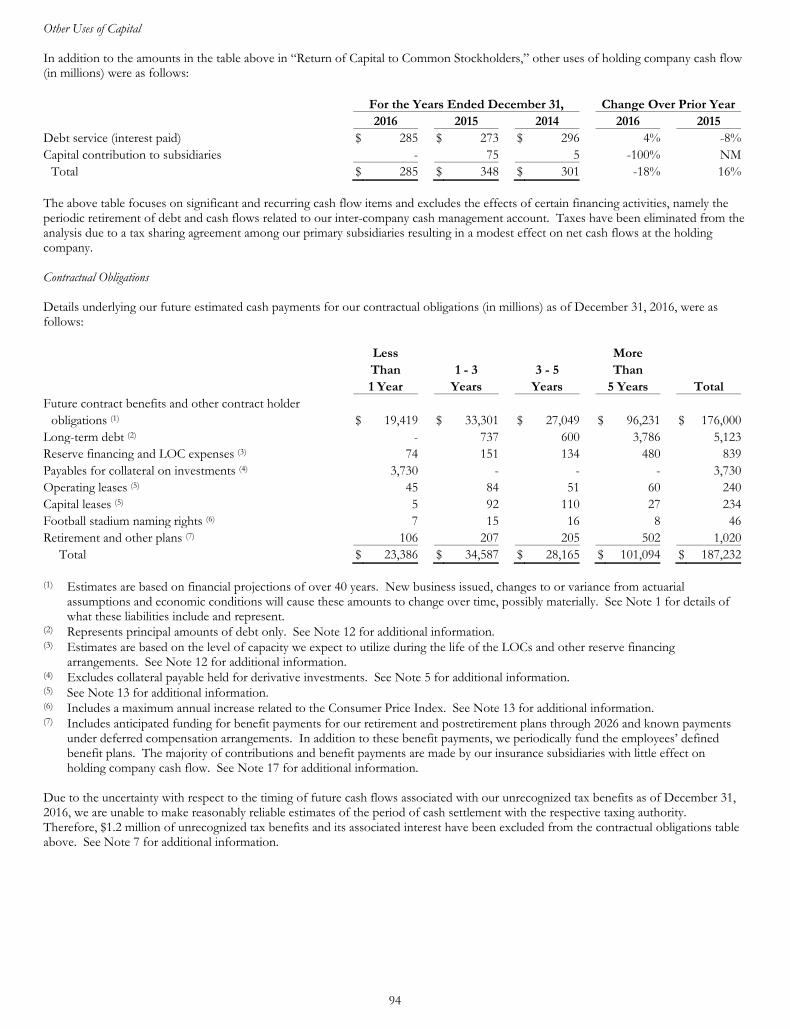
94
Other Uses of Capital In addition to the amounts in the table above in “Return of Capital to Common Stockholders,” other uses of holding company cash flow (in millions) were as follows:
For the Years Ended December 31, Change Over Prior Year 2016 2015 2014 2016 2015 Debt service (interest paid) $ 285 $ 273 $ 296 4% -8%Capital contribution to subsidiaries - 75 5 -100% NM
Total $ 285 $ 348 $ 301 -18% 16% The above table focuses on significant and recurring cash flow items and excludes the effects of certain financing activities, namely the periodic retirement of debt and cash flows related to our inter-company cash management account. Taxes have been eliminated from the analysis due to a tax sharing agreement among our primary subsidiaries resulting in a modest effect on net cash flows at the holding company. Contractual Obligations Details underlying our future estimated cash payments for our contractual obligations (in millions) as of December 31, 2016, were as follows:
Less More Than 1 - 3 3 - 5 Than 1 Year Years Years 5 Years Total Future contract benefits and other contract holder
obligations (1) $ 19,419 $ 33,301 $ 27,049 $ 96,231 $ 176,000Long-term debt (2) - 737 600 3,786 5,123Reserve financing and LOC expenses (3) 74 151 134 480 839Payables for collateral on investments (4) 3,730 - - - 3,730Operating leases (5) 45 84 51 60 240Capital leases (5) 5 92 110 27 234Football stadium naming rights (6) 7 15 16 8 46Retirement and other plans (7) 106 207 205 502 1,020
Total $ 23,386 $ 34,587 $ 28,165 $ 101,094 $ 187,232 (1) Estimates are based on financial projections of over 40 years. New business issued, changes to or variance from actuarial
assumptions and economic conditions will cause these amounts to change over time, possibly materially. See Note 1 for details of what these liabilities include and represent.
(2) Represents principal amounts of debt only. See Note 12 for additional information. (3) Estimates are based on the level of capacity we expect to utilize during the life of the LOCs and other reserve financing
arrangements. See Note 12 for additional information. (4) Excludes collateral payable held for derivative investments. See Note 5 for additional information. (5) See Note 13 for additional information. (6) Includes a maximum annual increase related to the Consumer Price Index. See Note 13 for additional information. (7) Includes anticipated funding for benefit payments for our retirement and postretirement plans through 2026 and known payments
under deferred compensation arrangements. In addition to these benefit payments, we periodically fund the employees’ defined benefit plans. The majority of contributions and benefit payments are made by our insurance subsidiaries with little effect on holding company cash flow. See Note 17 for additional information.
Due to the uncertainty with respect to the timing of future cash flows associated with our unrecognized tax benefits as of December 31, 2016, we are unable to make reasonably reliable estimates of the period of cash settlement with the respective taxing authority. Therefore, $1.2 million of unrecognized tax benefits and its associated interest have been excluded from the contractual obligations table above. See Note 7 for additional information.
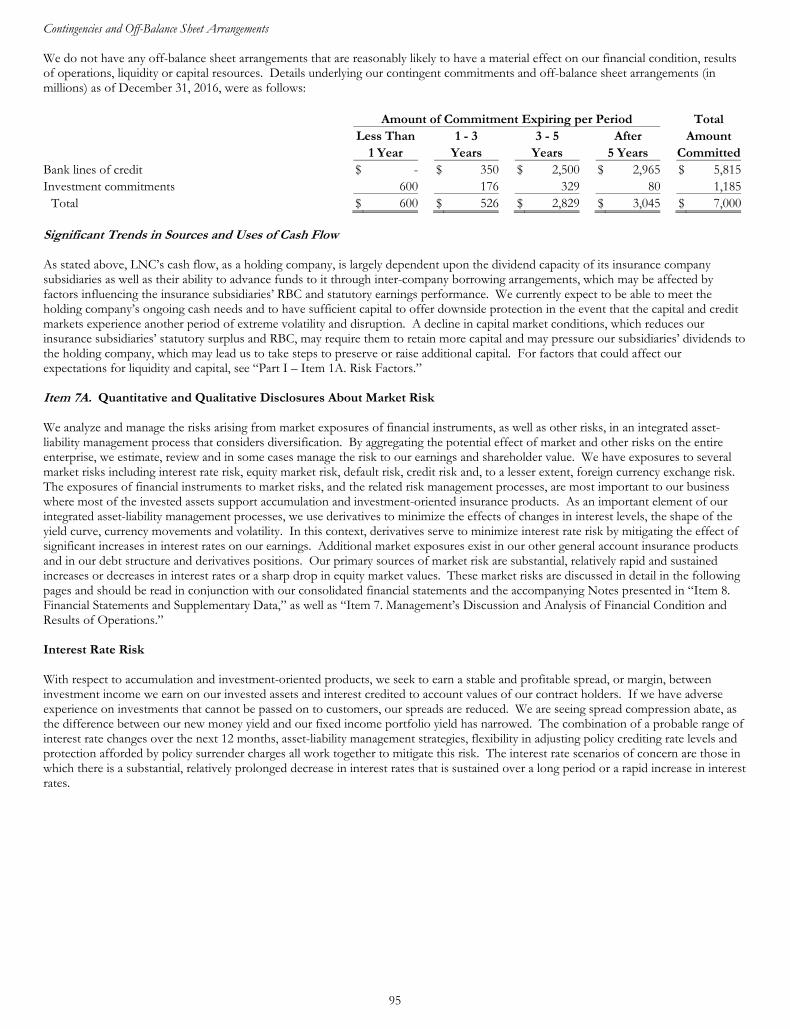
95
Contingencies and Off-Balance Sheet Arrangements We do not have any off-balance sheet arrangements that are reasonably likely to have a material effect on our financial condition, results of operations, liquidity or capital resources. Details underlying our contingent commitments and off-balance sheet arrangements (in millions) as of December 31, 2016, were as follows:
Amount of Commitment Expiring per Period Total Less Than 1 - 3 3 - 5 After Amount 1 Year Years Years 5 Years CommittedBank lines of credit $ - $ 350 $ 2,500 $ 2,965 $ 5,815Investment commitments 600 176 329 80 1,185
Total $ 600 $ 526 $ 2,829 $ 3,045 $ 7,000 Significant Trends in Sources and Uses of Cash Flow As stated above, LNC’s cash flow, as a holding company, is largely dependent upon the dividend capacity of its insurance company subsidiaries as well as their ability to advance funds to it through inter-company borrowing arrangements, which may be affected by factors influencing the insurance subsidiaries’ RBC and statutory earnings performance. We currently expect to be able to meet the holding company’s ongoing cash needs and to have sufficient capital to offer downside protection in the event that the capital and credit markets experience another period of extreme volatility and disruption. A decline in capital market conditions, which reduces our insurance subsidiaries’ statutory surplus and RBC, may require them to retain more capital and may pressure our subsidiaries’ dividends to the holding company, which may lead us to take steps to preserve or raise additional capital. For factors that could affect our expectations for liquidity and capital, see “Part I – Item 1A. Risk Factors.” Item 7A. Quantitative and Qualitative Disclosures About Market Risk We analyze and manage the risks arising from market exposures of financial instruments, as well as other risks, in an integrated asset-liability management process that considers diversification. By aggregating the potential effect of market and other risks on the entire enterprise, we estimate, review and in some cases manage the risk to our earnings and shareholder value. We have exposures to several market risks including interest rate risk, equity market risk, default risk, credit risk and, to a lesser extent, foreign currency exchange risk. The exposures of financial instruments to market risks, and the related risk management processes, are most important to our business where most of the invested assets support accumulation and investment-oriented insurance products. As an important element of our integrated asset-liability management processes, we use derivatives to minimize the effects of changes in interest levels, the shape of the yield curve, currency movements and volatility. In this context, derivatives serve to minimize interest rate risk by mitigating the effect of significant increases in interest rates on our earnings. Additional market exposures exist in our other general account insurance products and in our debt structure and derivatives positions. Our primary sources of market risk are substantial, relatively rapid and sustained increases or decreases in interest rates or a sharp drop in equity market values. These market risks are discussed in detail in the following pages and should be read in conjunction with our consolidated financial statements and the accompanying Notes presented in “Item 8. Financial Statements and Supplementary Data,” as well as “Item 7. Management’s Discussion and Analysis of Financial Condition and Results of Operations.” Interest Rate Risk With respect to accumulation and investment-oriented products, we seek to earn a stable and profitable spread, or margin, between investment income we earn on our invested assets and interest credited to account values of our contract holders. If we have adverse experience on investments that cannot be passed on to customers, our spreads are reduced. We are seeing spread compression abate, as the difference between our new money yield and our fixed income portfolio yield has narrowed. The combination of a probable range of interest rate changes over the next 12 months, asset-liability management strategies, flexibility in adjusting policy crediting rate levels and protection afforded by policy surrender charges all work together to mitigate this risk. The interest rate scenarios of concern are those in which there is a substantial, relatively prolonged decrease in interest rates that is sustained over a long period or a rapid increase in interest rates.
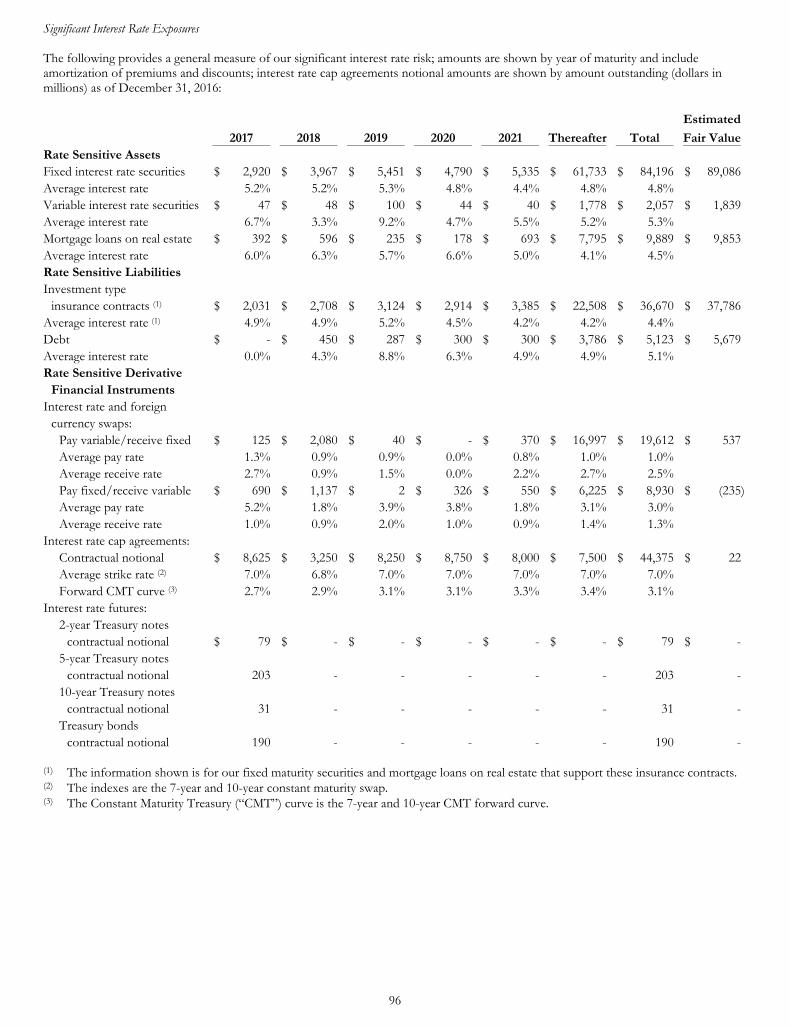
96
Significant Interest Rate Exposures The following provides a general measure of our significant interest rate risk; amounts are shown by year of maturity and include amortization of premiums and discounts; interest rate cap agreements notional amounts are shown by amount outstanding (dollars in millions) as of December 31, 2016:
Estimated
2017 2018 2019 2020 2021 Thereafter Total Fair ValueRate Sensitive Assets Fixed interest rate securities $ 2,920 $ 3,967 $ 5,451 $ 4,790 $ 5,335 $ 61,733 $ 84,196 $ 89,086Average interest rate 5.2% 5.2% 5.3% 4.8% 4.4% 4.8% 4.8% Variable interest rate securities $ 47 $ 48 $ 100 $ 44 $ 40 $ 1,778 $ 2,057 $ 1,839Average interest rate 6.7% 3.3% 9.2% 4.7% 5.5% 5.2% 5.3% Mortgage loans on real estate $ 392 $ 596 $ 235 $ 178 $ 693 $ 7,795 $ 9,889 $ 9,853Average interest rate 6.0% 6.3% 5.7% 6.6% 5.0% 4.1% 4.5% Rate Sensitive Liabilities Investment type
insurance contracts (1) $ 2,031 $ 2,708 $ 3,124 $ 2,914 $ 3,385 $ 22,508 $ 36,670 $ 37,786Average interest rate (1) 4.9% 4.9% 5.2% 4.5% 4.2% 4.2% 4.4% Debt $ - $ 450 $ 287 $ 300 $ 300 $ 3,786 $ 5,123 $ 5,679Average interest rate 0.0% 4.3% 8.8% 6.3% 4.9% 4.9% 5.1% Rate Sensitive Derivative
Financial Instruments Interest rate and foreign
currency swaps: Pay variable/receive fixed $ 125 $ 2,080 $ 40 $ - $ 370 $ 16,997 $ 19,612 $ 537Average pay rate 1.3% 0.9% 0.9% 0.0% 0.8% 1.0% 1.0% Average receive rate 2.7% 0.9% 1.5% 0.0% 2.2% 2.7% 2.5% Pay fixed/receive variable $ 690 $ 1,137 $ 2 $ 326 $ 550 $ 6,225 $ 8,930 $ (235)Average pay rate 5.2% 1.8% 3.9% 3.8% 1.8% 3.1% 3.0% Average receive rate 1.0% 0.9% 2.0% 1.0% 0.9% 1.4% 1.3%
Interest rate cap agreements: Contractual notional $ 8,625 $ 3,250 $ 8,250 $ 8,750 $ 8,000 $ 7,500 $ 44,375 $ 22Average strike rate (2) 7.0% 6.8% 7.0% 7.0% 7.0% 7.0% 7.0% Forward CMT curve (3) 2.7% 2.9% 3.1% 3.1% 3.3% 3.4% 3.1%
Interest rate futures: 2-year Treasury notes
contractual notional $ 79 $ - $ - $ - $ - $ - $ 79 $ -5-year Treasury notes
contractual notional 203 - - - - - 203 -10-year Treasury notes
contractual notional 31 - - - - - 31 -Treasury bonds
contractual notional 190 - - - - - 190 - (1) The information shown is for our fixed maturity securities and mortgage loans on real estate that support these insurance contracts. (2) The indexes are the 7-year and 10-year constant maturity swap. (3) The Constant Maturity Treasury (“CMT”) curve is the 7-year and 10-year CMT forward curve.
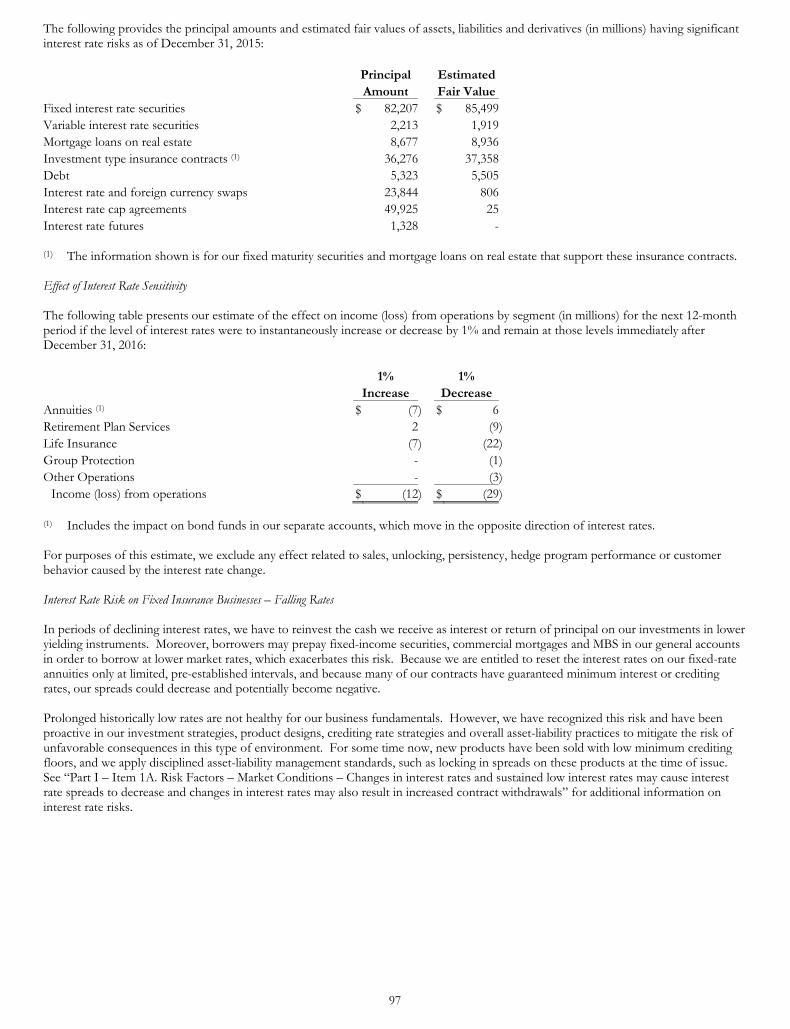
97
The following provides the principal amounts and estimated fair values of assets, liabilities and derivatives (in millions) having significant interest rate risks as of December 31, 2015:
Principal Estimated Amount Fair Value Fixed interest rate securities $ 82,207 $ 85,499 Variable interest rate securities 2,213 1,919 Mortgage loans on real estate 8,677 8,936 Investment type insurance contracts (1) 36,276 37,358 Debt 5,323 5,505 Interest rate and foreign currency swaps 23,844 806 Interest rate cap agreements 49,925 25 Interest rate futures 1,328 - (1) The information shown is for our fixed maturity securities and mortgage loans on real estate that support these insurance contracts. Effect of Interest Rate Sensitivity The following table presents our estimate of the effect on income (loss) from operations by segment (in millions) for the next 12-month period if the level of interest rates were to instantaneously increase or decrease by 1% and remain at those levels immediately after December 31, 2016:
1% 1% Increase Decrease Annuities (1) $ (7) $ 6 Retirement Plan Services 2 (9) Life Insurance (7) (22) Group Protection - (1) Other Operations - (3)
Income (loss) from operations $ (12) $ (29) (1) Includes the impact on bond funds in our separate accounts, which move in the opposite direction of interest rates. For purposes of this estimate, we exclude any effect related to sales, unlocking, persistency, hedge program performance or customer behavior caused by the interest rate change. Interest Rate Risk on Fixed Insurance Businesses – Falling Rates In periods of declining interest rates, we have to reinvest the cash we receive as interest or return of principal on our investments in lower yielding instruments. Moreover, borrowers may prepay fixed-income securities, commercial mortgages and MBS in our general accounts in order to borrow at lower market rates, which exacerbates this risk. Because we are entitled to reset the interest rates on our fixed-rate annuities only at limited, pre-established intervals, and because many of our contracts have guaranteed minimum interest or crediting rates, our spreads could decrease and potentially become negative. Prolonged historically low rates are not healthy for our business fundamentals. However, we have recognized this risk and have been proactive in our investment strategies, product designs, crediting rate strategies and overall asset-liability practices to mitigate the risk of unfavorable consequences in this type of environment. For some time now, new products have been sold with low minimum crediting floors, and we apply disciplined asset-liability management standards, such as locking in spreads on these products at the time of issue. See “Part I – Item 1A. Risk Factors – Market Conditions – Changes in interest rates and sustained low interest rates may cause interest rate spreads to decrease and changes in interest rates may also result in increased contract withdrawals” for additional information on interest rate risks.
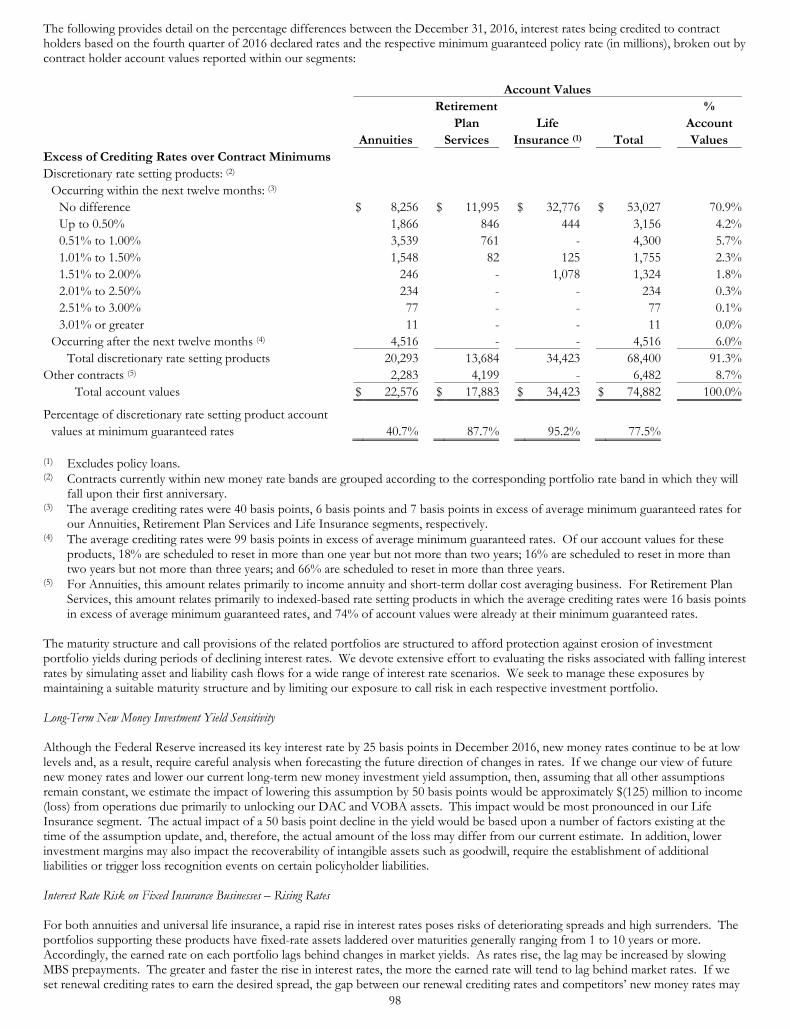
98
The following provides detail on the percentage differences between the December 31, 2016, interest rates being credited to contract holders based on the fourth quarter of 2016 declared rates and the respective minimum guaranteed policy rate (in millions), broken out by contract holder account values reported within our segments:
Account Values Retirement % Plan Life Account Annuities Services Insurance (1) Total Values Excess of Crediting Rates over Contract Minimums Discretionary rate setting products: (2)
Occurring within the next twelve months: (3) No difference $ 8,256 $ 11,995 $ 32,776 $ 53,027 70.9%Up to 0.50% 1,866 846 444 3,156 4.2%0.51% to 1.00% 3,539 761 - 4,300 5.7%1.01% to 1.50% 1,548 82 125 1,755 2.3%1.51% to 2.00% 246 - 1,078 1,324 1.8%2.01% to 2.50% 234 - - 234 0.3%2.51% to 3.00% 77 - - 77 0.1%3.01% or greater 11 - - 11 0.0%
Occurring after the next twelve months (4) 4,516 - - 4,516 6.0%Total discretionary rate setting products 20,293 13,684 34,423 68,400 91.3%
Other contracts (5) 2,283 4,199 - 6,482 8.7%Total account values $ 22,576 $ 17,883 $ 34,423 $ 74,882 100.0%
Percentage of discretionary rate setting product account values at minimum guaranteed rates 40.7% 87.7% 95.2% 77.5%
(1) Excludes policy loans. (2) Contracts currently within new money rate bands are grouped according to the corresponding portfolio rate band in which they will
fall upon their first anniversary. (3) The average crediting rates were 40 basis points, 6 basis points and 7 basis points in excess of average minimum guaranteed rates for
our Annuities, Retirement Plan Services and Life Insurance segments, respectively. (4) The average crediting rates were 99 basis points in excess of average minimum guaranteed rates. Of our account values for these
products, 18% are scheduled to reset in more than one year but not more than two years; 16% are scheduled to reset in more than two years but not more than three years; and 66% are scheduled to reset in more than three years.
(5) For Annuities, this amount relates primarily to income annuity and short-term dollar cost averaging business. For Retirement Plan Services, this amount relates primarily to indexed-based rate setting products in which the average crediting rates were 16 basis points in excess of average minimum guaranteed rates, and 74% of account values were already at their minimum guaranteed rates.
The maturity structure and call provisions of the related portfolios are structured to afford protection against erosion of investment portfolio yields during periods of declining interest rates. We devote extensive effort to evaluating the risks associated with falling interest rates by simulating asset and liability cash flows for a wide range of interest rate scenarios. We seek to manage these exposures by maintaining a suitable maturity structure and by limiting our exposure to call risk in each respective investment portfolio. Long-Term New Money Investment Yield Sensitivity Although the Federal Reserve increased its key interest rate by 25 basis points in December 2016, new money rates continue to be at low levels and, as a result, require careful analysis when forecasting the future direction of changes in rates. If we change our view of future new money rates and lower our current long-term new money investment yield assumption, then, assuming that all other assumptions remain constant, we estimate the impact of lowering this assumption by 50 basis points would be approximately $(125) million to income (loss) from operations due primarily to unlocking our DAC and VOBA assets. This impact would be most pronounced in our Life Insurance segment. The actual impact of a 50 basis point decline in the yield would be based upon a number of factors existing at the time of the assumption update, and, therefore, the actual amount of the loss may differ from our current estimate. In addition, lower investment margins may also impact the recoverability of intangible assets such as goodwill, require the establishment of additional liabilities or trigger loss recognition events on certain policyholder liabilities. Interest Rate Risk on Fixed Insurance Businesses – Rising Rates For both annuities and universal life insurance, a rapid rise in interest rates poses risks of deteriorating spreads and high surrenders. The portfolios supporting these products have fixed-rate assets laddered over maturities generally ranging from 1 to 10 years or more. Accordingly, the earned rate on each portfolio lags behind changes in market yields. As rates rise, the lag may be increased by slowing MBS prepayments. The greater and faster the rise in interest rates, the more the earned rate will tend to lag behind market rates. If we set renewal crediting rates to earn the desired spread, the gap between our renewal crediting rates and competitors’ new money rates may
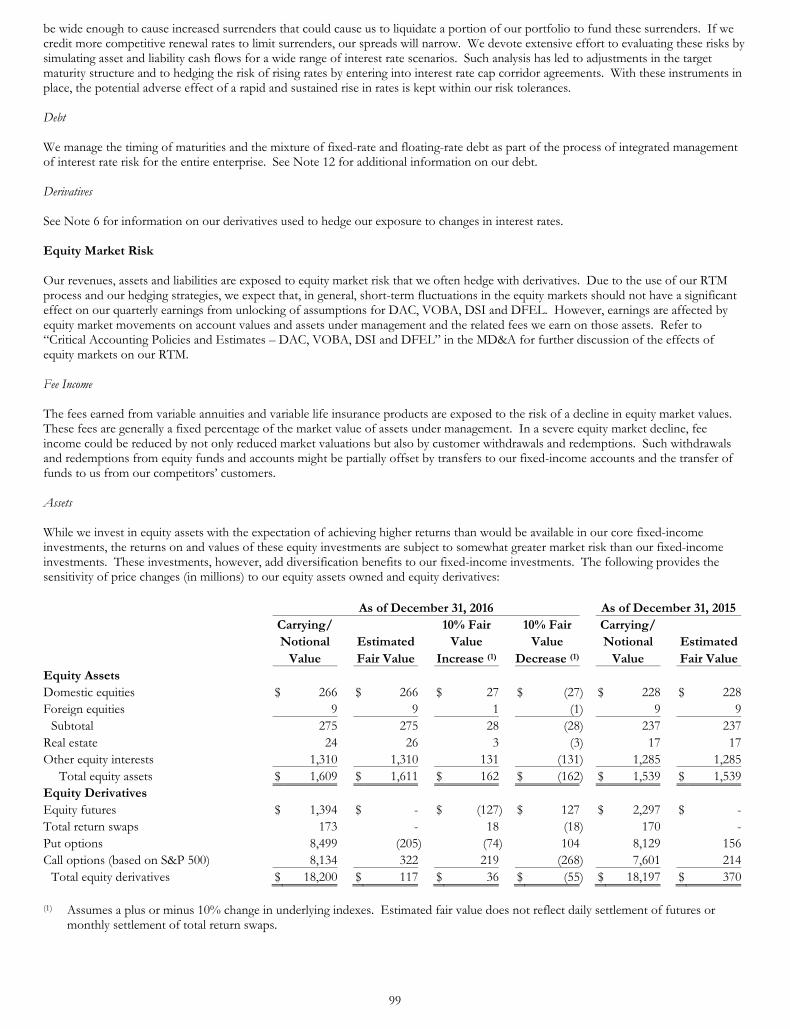
99
be wide enough to cause increased surrenders that could cause us to liquidate a portion of our portfolio to fund these surrenders. If we credit more competitive renewal rates to limit surrenders, our spreads will narrow. We devote extensive effort to evaluating these risks by simulating asset and liability cash flows for a wide range of interest rate scenarios. Such analysis has led to adjustments in the target maturity structure and to hedging the risk of rising rates by entering into interest rate cap corridor agreements. With these instruments in place, the potential adverse effect of a rapid and sustained rise in rates is kept within our risk tolerances. Debt We manage the timing of maturities and the mixture of fixed-rate and floating-rate debt as part of the process of integrated management of interest rate risk for the entire enterprise. See Note 12 for additional information on our debt. Derivatives See Note 6 for information on our derivatives used to hedge our exposure to changes in interest rates. Equity Market Risk Our revenues, assets and liabilities are exposed to equity market risk that we often hedge with derivatives. Due to the use of our RTM process and our hedging strategies, we expect that, in general, short-term fluctuations in the equity markets should not have a significant effect on our quarterly earnings from unlocking of assumptions for DAC, VOBA, DSI and DFEL. However, earnings are affected by equity market movements on account values and assets under management and the related fees we earn on those assets. Refer to “Critical Accounting Policies and Estimates – DAC, VOBA, DSI and DFEL” in the MD&A for further discussion of the effects of equity markets on our RTM. Fee Income The fees earned from variable annuities and variable life insurance products are exposed to the risk of a decline in equity market values. These fees are generally a fixed percentage of the market value of assets under management. In a severe equity market decline, fee income could be reduced by not only reduced market valuations but also by customer withdrawals and redemptions. Such withdrawals and redemptions from equity funds and accounts might be partially offset by transfers to our fixed-income accounts and the transfer of funds to us from our competitors’ customers. Assets While we invest in equity assets with the expectation of achieving higher returns than would be available in our core fixed-income investments, the returns on and values of these equity investments are subject to somewhat greater market risk than our fixed-income investments. These investments, however, add diversification benefits to our fixed-income investments. The following provides the sensitivity of price changes (in millions) to our equity assets owned and equity derivatives:
As of December 31, 2016 As of December 31, 2015
Carrying/ 10% Fair 10% Fair Carrying/ Notional Estimated Value Value Notional Estimated
Value Fair Value Increase (1) Decrease (1) Value Fair ValueEquity Assets Domestic equities $ 266 $ 266 $ 27 $ (27) $ 228 $ 228Foreign equities 9 9 1 (1) 9 9
Subtotal 275 275 28 (28) 237 237Real estate 24 26 3 (3) 17 17Other equity interests 1,310 1,310 131 (131) 1,285 1,285
Total equity assets $ 1,609 $ 1,611 $ 162 $ (162) $ 1,539 $ 1,539Equity Derivatives Equity futures $ 1,394 $ - $ (127) $ 127 $ 2,297 $ -Total return swaps 173 - 18 (18) 170 -Put options 8,499 (205) (74) 104 8,129 156Call options (based on S&P 500) 8,134 322 219 (268) 7,601 214
Total equity derivatives $ 18,200 $ 117 $ 36 $ (55) $ 18,197 $ 370
(1) Assumes a plus or minus 10% change in underlying indexes. Estimated fair value does not reflect daily settlement of futures or
monthly settlement of total return swaps.
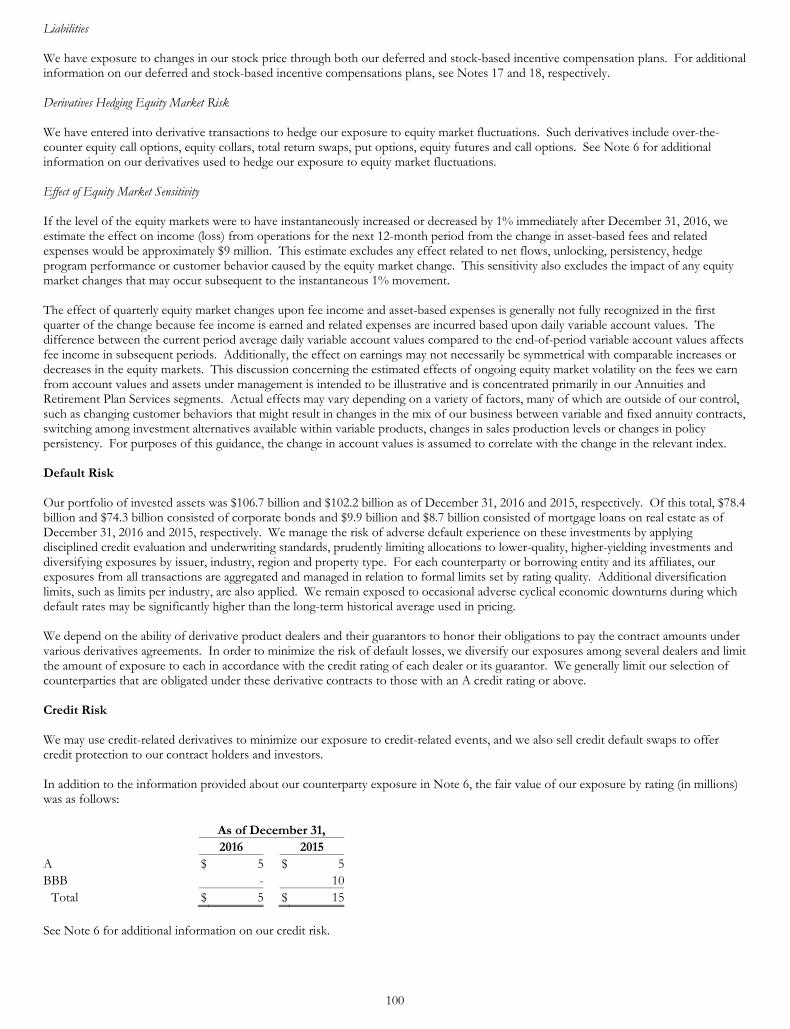
100
Liabilities We have exposure to changes in our stock price through both our deferred and stock-based incentive compensation plans. For additional information on our deferred and stock-based incentive compensations plans, see Notes 17 and 18, respectively. Derivatives Hedging Equity Market Risk We have entered into derivative transactions to hedge our exposure to equity market fluctuations. Such derivatives include over-the-counter equity call options, equity collars, total return swaps, put options, equity futures and call options. See Note 6 for additional information on our derivatives used to hedge our exposure to equity market fluctuations. Effect of Equity Market Sensitivity If the level of the equity markets were to have instantaneously increased or decreased by 1% immediately after December 31, 2016, we estimate the effect on income (loss) from operations for the next 12-month period from the change in asset-based fees and related expenses would be approximately $9 million. This estimate excludes any effect related to net flows, unlocking, persistency, hedge program performance or customer behavior caused by the equity market change. This sensitivity also excludes the impact of any equity market changes that may occur subsequent to the instantaneous 1% movement. The effect of quarterly equity market changes upon fee income and asset-based expenses is generally not fully recognized in the first quarter of the change because fee income is earned and related expenses are incurred based upon daily variable account values. The difference between the current period average daily variable account values compared to the end-of-period variable account values affects fee income in subsequent periods. Additionally, the effect on earnings may not necessarily be symmetrical with comparable increases or decreases in the equity markets. This discussion concerning the estimated effects of ongoing equity market volatility on the fees we earn from account values and assets under management is intended to be illustrative and is concentrated primarily in our Annuities and Retirement Plan Services segments. Actual effects may vary depending on a variety of factors, many of which are outside of our control, such as changing customer behaviors that might result in changes in the mix of our business between variable and fixed annuity contracts, switching among investment alternatives available within variable products, changes in sales production levels or changes in policy persistency. For purposes of this guidance, the change in account values is assumed to correlate with the change in the relevant index. Default Risk Our portfolio of invested assets was $106.7 billion and $102.2 billion as of December 31, 2016 and 2015, respectively. Of this total, $78.4 billion and $74.3 billion consisted of corporate bonds and $9.9 billion and $8.7 billion consisted of mortgage loans on real estate as of December 31, 2016 and 2015, respectively. We manage the risk of adverse default experience on these investments by applying disciplined credit evaluation and underwriting standards, prudently limiting allocations to lower-quality, higher-yielding investments and diversifying exposures by issuer, industry, region and property type. For each counterparty or borrowing entity and its affiliates, our exposures from all transactions are aggregated and managed in relation to formal limits set by rating quality. Additional diversification limits, such as limits per industry, are also applied. We remain exposed to occasional adverse cyclical economic downturns during which default rates may be significantly higher than the long-term historical average used in pricing. We depend on the ability of derivative product dealers and their guarantors to honor their obligations to pay the contract amounts under various derivatives agreements. In order to minimize the risk of default losses, we diversify our exposures among several dealers and limit the amount of exposure to each in accordance with the credit rating of each dealer or its guarantor. We generally limit our selection of counterparties that are obligated under these derivative contracts to those with an A credit rating or above. Credit Risk We may use credit-related derivatives to minimize our exposure to credit-related events, and we also sell credit default swaps to offer credit protection to our contract holders and investors. In addition to the information provided about our counterparty exposure in Note 6, the fair value of our exposure by rating (in millions) was as follows:
As of December 31, 2016 2015 A $ 5 $ 5 BBB - 10
Total $ 5 $ 15
See Note 6 for additional information on our credit risk.
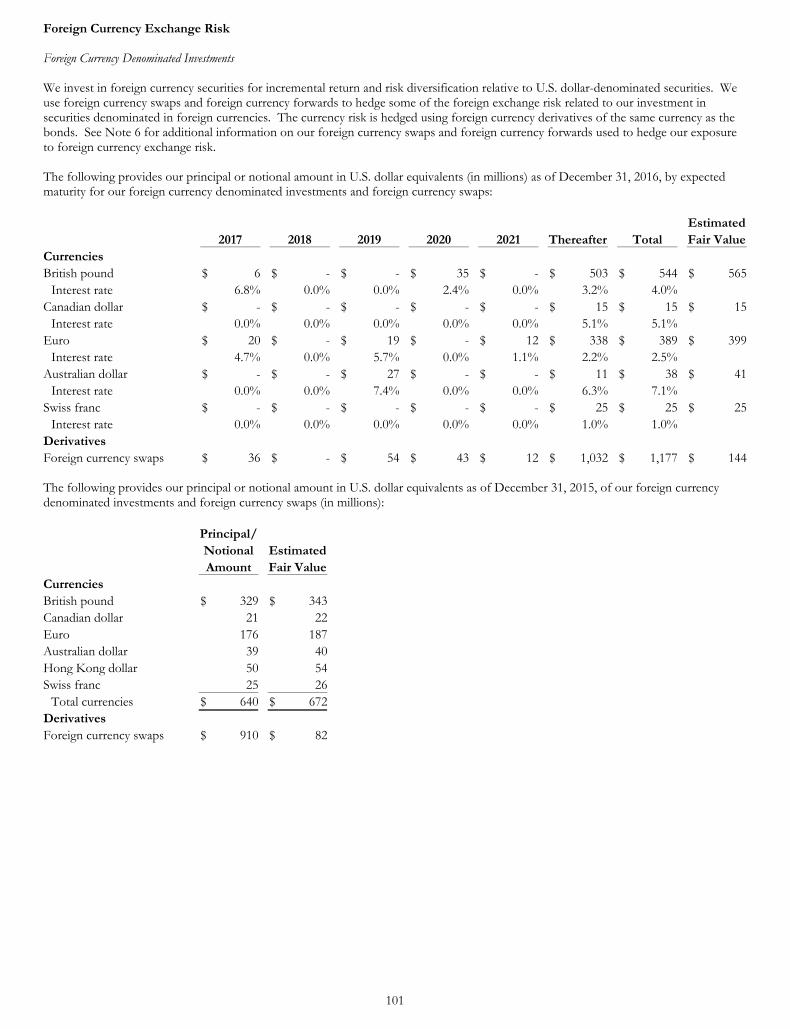
101
Foreign Currency Exchange Risk Foreign Currency Denominated Investments We invest in foreign currency securities for incremental return and risk diversification relative to U.S. dollar-denominated securities. We use foreign currency swaps and foreign currency forwards to hedge some of the foreign exchange risk related to our investment in securities denominated in foreign currencies. The currency risk is hedged using foreign currency derivatives of the same currency as the bonds. See Note 6 for additional information on our foreign currency swaps and foreign currency forwards used to hedge our exposure to foreign currency exchange risk. The following provides our principal or notional amount in U.S. dollar equivalents (in millions) as of December 31, 2016, by expected maturity for our foreign currency denominated investments and foreign currency swaps:
Estimated 2017 2018 2019 2020 2021 Thereafter Total Fair ValueCurrencies British pound $ 6 $ - $ - $ 35 $ - $ 503 $ 544 $ 565
Interest rate 6.8% 0.0% 0.0% 2.4% 0.0% 3.2% 4.0% Canadian dollar $ - $ - $ - $ - $ - $ 15 $ 15 $ 15
Interest rate 0.0% 0.0% 0.0% 0.0% 0.0% 5.1% 5.1% Euro $ 20 $ - $ 19 $ - $ 12 $ 338 $ 389 $ 399
Interest rate 4.7% 0.0% 5.7% 0.0% 1.1% 2.2% 2.5% Australian dollar $ - $ - $ 27 $ - $ - $ 11 $ 38 $ 41
Interest rate 0.0% 0.0% 7.4% 0.0% 0.0% 6.3% 7.1% Swiss franc $ - $ - $ - $ - $ - $ 25 $ 25 $ 25
Interest rate 0.0% 0.0% 0.0% 0.0% 0.0% 1.0% 1.0% Derivatives Foreign currency swaps $ 36 $ - $ 54 $ 43 $ 12 $ 1,032 $ 1,177 $ 144 The following provides our principal or notional amount in U.S. dollar equivalents as of December 31, 2015, of our foreign currency denominated investments and foreign currency swaps (in millions):
Principal/ Notional Estimated Amount Fair Value Currencies British pound $ 329 $ 343 Canadian dollar 21 22 Euro 176 187 Australian dollar 39 40 Hong Kong dollar 50 54 Swiss franc 25 26
Total currencies $ 640 $ 672 Derivatives Foreign currency swaps $ 910 $ 82

102
Item 8. Financial Statements and Supplementary Data
MANAGEMENT REPORT ON INTERNAL CONTROL OVER FINANCIAL REPORTING Management is responsible for establishing and maintaining adequate internal control over financial reporting for Lincoln National Corporation to provide reasonable assurance regarding the reliability of our financial reporting and the preparation of financial statements for external purposes in accordance with generally accepted accounting principles. Internal control over financial reporting includes those policies and procedures that: (1) pertain to the maintenance of records that, in reasonable detail, accurately and fairly reflect the transactions and dispositions of our assets; (2) provide reasonable assurance that transactions are recorded as necessary to permit preparation of financial statements in accordance with United States of America generally accepted accounting principles, and that our receipts and expenditures are being made only in accordance with authorizations of our management and directors; and (3) provide reasonable assurance regarding prevention or timely detection of unauthorized acquisition, use or disposition of our assets that could have a material effect on the financial statements. Because of its inherent limitations, internal control over financial reporting may not prevent or detect misstatements. Projections of any evaluation of internal control over financial reporting effectiveness to future periods are subject to risks. Over time, controls may become inadequate because of changes in conditions or deterioration in the degree of compliance with policies or procedures. Management assessed our internal control over financial reporting as of December 31, 2016, the end of our fiscal year. Management based its assessment on criteria established in Internal Control-Integrated Framework issued by the Committee of Sponsoring Organizations of the Treadway Commission (2013 framework). Management’s assessment included evaluation of such elements as the design and operating effectiveness of key financial reporting controls, process documentation, accounting policies, and our overall control environment. Based on the assessment, management has concluded that our internal control over financial reporting was effective as of the end of the fiscal year to provide reasonable assurance regarding the reliability of financial reporting and the preparation of financial statements for external reporting purposes in accordance with United States of America generally accepted accounting principles. The effectiveness of our internal control over financial reporting as of December 31, 2016, has been audited by Ernst & Young LLP, an independent registered public accounting firm, as stated in their report which is included on the following page.
103
Report of Independent Registered Public Accounting Firm The Board of Directors and Stockholders of Lincoln National Corporation We have audited Lincoln National Corporation’s (the “Corporation”) internal control over financial reporting as of December 31, 2016, based on criteria established in Internal Control—Integrated Framework issued by the Committee of Sponsoring Organizations of the Treadway Commission (2013 framework) (the “COSO criteria”). The Corporation’s management is responsible for maintaining effective internal control over financial reporting, and for its assessment of the effectiveness of internal control over financial reporting included in the accompanying Management Report on Internal Control Over Financial Reporting. Our responsibility is to express an opinion on the Corporation’s internal control over financial reporting based on our audit. We conducted our audit in accordance with the standards of the Public Company Accounting Oversight Board (United States). Those standards require that we plan and perform the audit to obtain reasonable assurance about whether effective internal control over financial reporting was maintained in all material respects. Our audit included obtaining an understanding of internal control over financial reporting, assessing the risk that a material weakness exists, testing and evaluating the design and operating effectiveness of internal control based on the assessed risk, and performing such other procedures as we considered necessary in the circumstances. We believe that our audit provides a reasonable basis for our opinion. A company’s internal control over financial reporting is a process designed to provide reasonable assurance regarding the reliability of financial reporting and the preparation of financial statements for external purposes in accordance with generally accepted accounting principles. A company’s internal control over financial reporting includes those policies and procedures that (1) pertain to the maintenance of records that, in reasonable detail, accurately and fairly reflect the transactions and dispositions of the assets of the company; (2) provide reasonable assurance that transactions are recorded as necessary to permit preparation of financial statements in accordance with generally accepted accounting principles, and that receipts and expenditures of the company are being made only in accordance with authorizations of management and directors of the company; and (3) provide reasonable assurance regarding prevention or timely detection of unauthorized acquisition, use, or disposition of the company’s assets that could have a material effect on the financial statements. Because of its inherent limitations, internal control over financial reporting may not prevent or detect misstatements. Also, projections of any evaluation of effectiveness to future periods are subject to the risk that controls may become inadequate because of changes in conditions, or that the degree of compliance with the policies or procedures may deteriorate. In our opinion, Lincoln National Corporation maintained, in all material respects, effective internal control over financial reporting as of December 31, 2016, based on the COSO criteria. We also have audited, in accordance with the standards of the Public Company Accounting Oversight Board (United States), the consolidated balance sheets of Lincoln National Corporation as of December 31, 2016 and 2015, and the related consolidated statements of comprehensive income (loss), stockholders’ equity, and cash flows for each of the three years in the period ended December 31, 2016 and our report dated February 23, 2017, expressed an unqualified opinion thereon. /s/ Ernst & Young LLP Philadelphia, Pennsylvania February 23, 2017

104
Report of Independent Registered Public Accounting Firm The Board of Directors and Stockholders of Lincoln National Corporation We have audited the accompanying consolidated balance sheets of Lincoln National Corporation (the “Corporation”) as of December 31, 2016 and 2015, and the related consolidated statements of comprehensive income (loss), stockholders’ equity, and cash flows for each of the three years in the period ended December 31, 2016. Our audits also included the financial statement schedules listed in the Index at Item 15(a)(2). These financial statements and schedules are the responsibility of the Corporation’s management. Our responsibility is to express an opinion on these financial statements and schedules based on our audits. We conducted our audits in accordance with the standards of the Public Company Accounting Oversight Board (United States). Those standards require that we plan and perform the audit to obtain reasonable assurance about whether the financial statements are free of material misstatement. An audit includes examining, on a test basis, evidence supporting the amounts and disclosures in the financial statements. An audit also includes assessing the accounting principles used and significant estimates made by management, as well as evaluating the overall financial statement presentation. We believe that our audits provide a reasonable basis for our opinion. In our opinion, the financial statements referred to above present fairly, in all material respects, the consolidated financial position of Lincoln National Corporation at December 31, 2016 and 2015, and the consolidated results of its operations and its cash flows for each of the three years in the period ended December 31, 2016, in conformity with U.S. generally accepted accounting principles. Also, in our opinion, the related financial statement schedules, when considered in relation to the basic financial statements taken as a whole, present fairly in all material respects the information set forth therein. We also have audited, in accordance with the standards of the Public Company Accounting Oversight Board (United States), Lincoln National Corporation’s internal control over financial reporting as of December 31, 2016, based on criteria established in Internal Control-Integrated Framework issued by the Committee of Sponsoring Organizations of the Treadway Commission (2013 framework) and our report dated February 23, 2017, expressed an unqualified opinion thereon. /s/ Ernst & Young LLP Philadelphia, Pennsylvania February 23, 2017
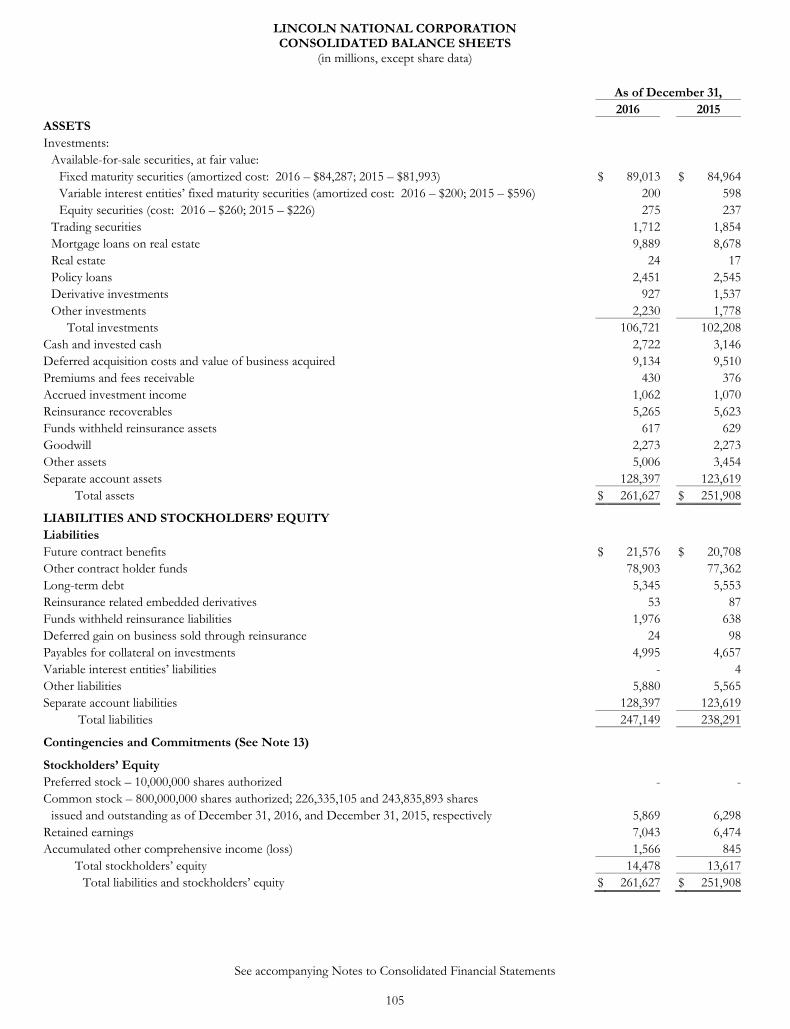
See accompanying Notes to Consolidated Financial Statements
105
LINCOLN NATIONAL CORPORATION CONSOLIDATED BALANCE SHEETS
(in millions, except share data)
As of December 31, 2016 2015 ASSETS Investments:
Available-for-sale securities, at fair value: Fixed maturity securities (amortized cost: 2016 – $84,287; 2015 – $81,993) $ 89,013 $ 84,964Variable interest entities’ fixed maturity securities (amortized cost: 2016 – $200; 2015 – $596) 200 598Equity securities (cost: 2016 – $260; 2015 – $226) 275 237
Trading securities 1,712 1,854Mortgage loans on real estate 9,889 8,678Real estate 24 17Policy loans 2,451 2,545Derivative investments 927 1,537Other investments 2,230 1,778
Total investments 106,721 102,208Cash and invested cash 2,722 3,146Deferred acquisition costs and value of business acquired 9,134 9,510Premiums and fees receivable 430 376Accrued investment income 1,062 1,070Reinsurance recoverables 5,265 5,623Funds withheld reinsurance assets 617 629Goodwill 2,273 2,273Other assets 5,006 3,454Separate account assets 128,397 123,619
Total assets $ 261,627 $ 251,908
LIABILITIES AND STOCKHOLDERS’ EQUITY Liabilities Future contract benefits $ 21,576 $ 20,708Other contract holder funds 78,903 77,362Long-term debt 5,345 5,553Reinsurance related embedded derivatives 53 87Funds withheld reinsurance liabilities 1,976 638Deferred gain on business sold through reinsurance 24 98Payables for collateral on investments 4,995 4,657Variable interest entities’ liabilities - 4Other liabilities 5,880 5,565Separate account liabilities 128,397 123,619
Total liabilities 247,149 238,291
Contingencies and Commitments (See Note 13)
Stockholders’ Equity Preferred stock – 10,000,000 shares authorized - -Common stock – 800,000,000 shares authorized; 226,335,105 and 243,835,893 shares
issued and outstanding as of December 31, 2016, and December 31, 2015, respectively 5,869 6,298Retained earnings 7,043 6,474Accumulated other comprehensive income (loss) 1,566 845
Total stockholders’ equity 14,478 13,617Total liabilities and stockholders’ equity $ 261,627 $ 251,908
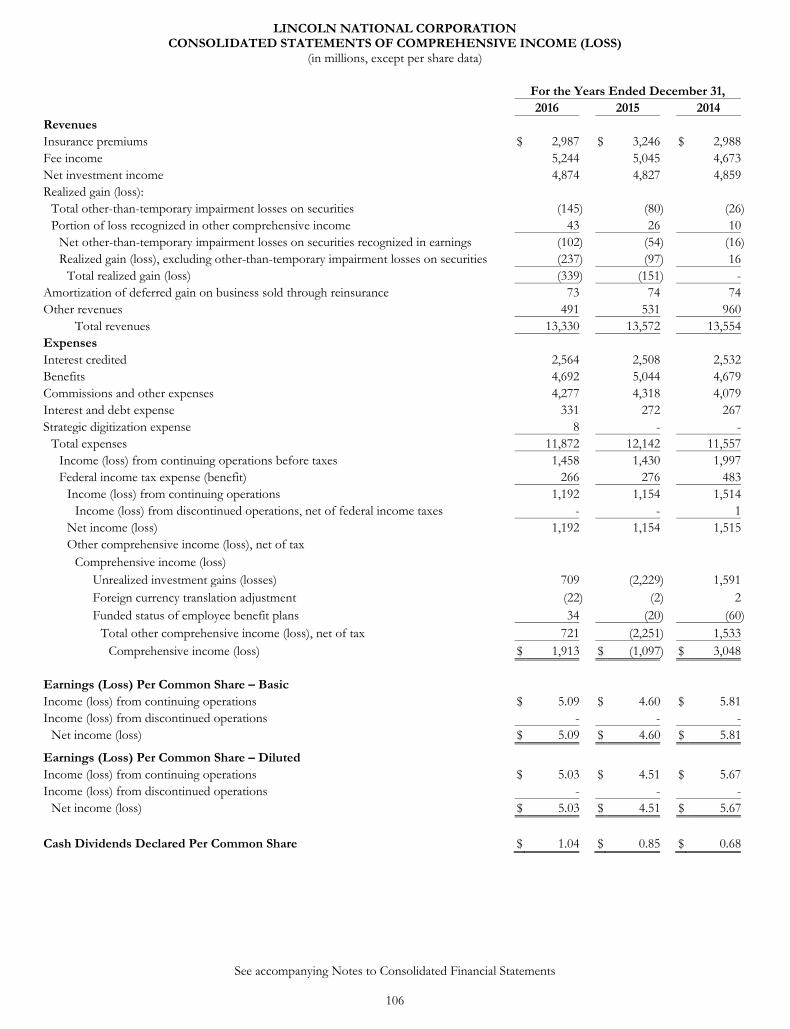
See accompanying Notes to Consolidated Financial Statements
106
LINCOLN NATIONAL CORPORATION CONSOLIDATED STATEMENTS OF COMPREHENSIVE INCOME (LOSS)
(in millions, except per share data)
For the Years Ended December 31, 2016 2015 2014 Revenues Insurance premiums $ 2,987 $ 3,246 $ 2,988Fee income 5,244 5,045 4,673Net investment income 4,874 4,827 4,859Realized gain (loss):
Total other-than-temporary impairment losses on securities (145) (80) (26)Portion of loss recognized in other comprehensive income 43 26 10
Net other-than-temporary impairment losses on securities recognized in earnings (102) (54) (16)Realized gain (loss), excluding other-than-temporary impairment losses on securities (237) (97) 16
Total realized gain (loss) (339) (151) -Amortization of deferred gain on business sold through reinsurance 73 74 74Other revenues 491 531 960
Total revenues 13,330 13,572 13,554Expenses Interest credited 2,564 2,508 2,532Benefits 4,692 5,044 4,679Commissions and other expenses 4,277 4,318 4,079Interest and debt expense 331 272 267Strategic digitization expense 8 - -
Total expenses 11,872 12,142 11,557Income (loss) from continuing operations before taxes 1,458 1,430 1,997Federal income tax expense (benefit) 266 276 483
Income (loss) from continuing operations 1,192 1,154 1,514Income (loss) from discontinued operations, net of federal income taxes - - 1
Net income (loss) 1,192 1,154 1,515Other comprehensive income (loss), net of tax
Comprehensive income (loss) Unrealized investment gains (losses) 709 (2,229) 1,591 Foreign currency translation adjustment (22) (2) 2 Funded status of employee benefit plans 34 (20) (60)
Total other comprehensive income (loss), net of tax 721 (2,251) 1,533 Comprehensive income (loss) $ 1,913 $ (1,097) $ 3,048
Earnings (Loss) Per Common Share – Basic Income (loss) from continuing operations $ 5.09 $ 4.60 $ 5.81Income (loss) from discontinued operations - - -
Net income (loss) $ 5.09 $ 4.60 $ 5.81
Earnings (Loss) Per Common Share – Diluted Income (loss) from continuing operations $ 5.03 $ 4.51 $ 5.67Income (loss) from discontinued operations - - -
Net income (loss) $ 5.03 $ 4.51 $ 5.67
Cash Dividends Declared Per Common Share $ 1.04 $ 0.85 $ 0.68
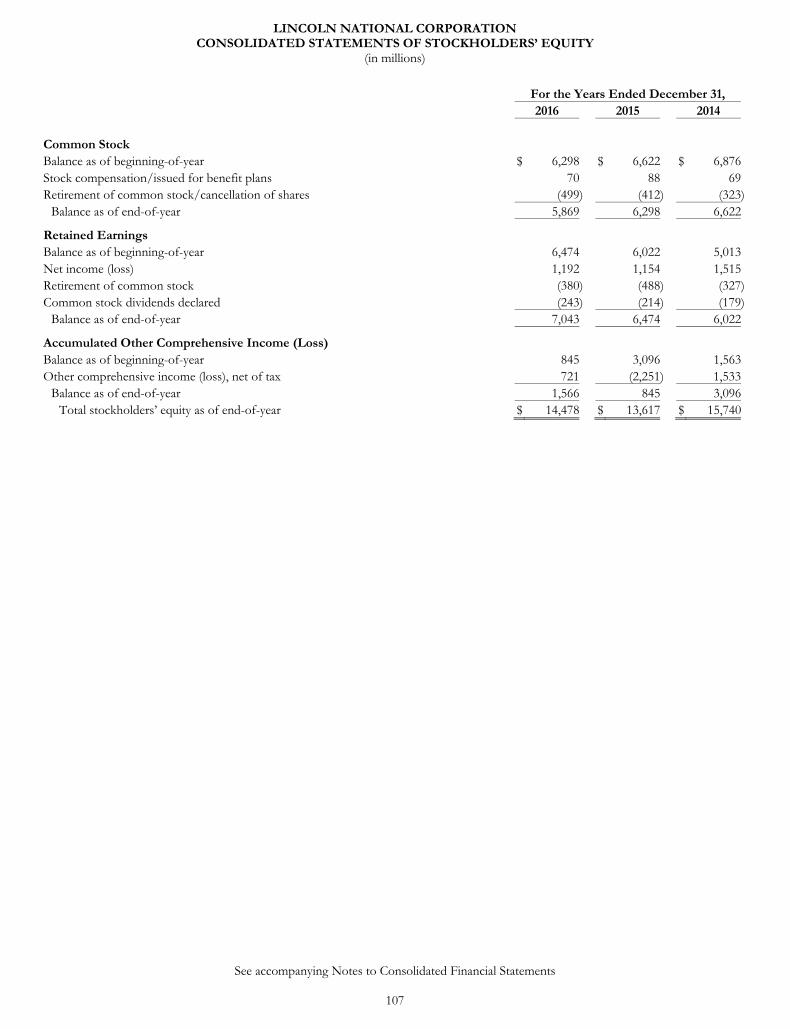
See accompanying Notes to Consolidated Financial Statements
107
LINCOLN NATIONAL CORPORATION CONSOLIDATED STATEMENTS OF STOCKHOLDERS’ EQUITY
(in millions)
For the Years Ended December 31, 2016 2015 2014 Common Stock Balance as of beginning-of-year $ 6,298 $ 6,622 $ 6,876Stock compensation/issued for benefit plans 70 88 69Retirement of common stock/cancellation of shares (499) (412) (323)
Balance as of end-of-year 5,869 6,298 6,622
Retained Earnings Balance as of beginning-of-year 6,474 6,022 5,013Net income (loss) 1,192 1,154 1,515Retirement of common stock (380) (488) (327)Common stock dividends declared (243) (214) (179)
Balance as of end-of-year 7,043 6,474 6,022
Accumulated Other Comprehensive Income (Loss) Balance as of beginning-of-year 845 3,096 1,563Other comprehensive income (loss), net of tax 721 (2,251) 1,533
Balance as of end-of-year 1,566 845 3,096Total stockholders’ equity as of end-of-year $ 14,478 $ 13,617 $ 15,740
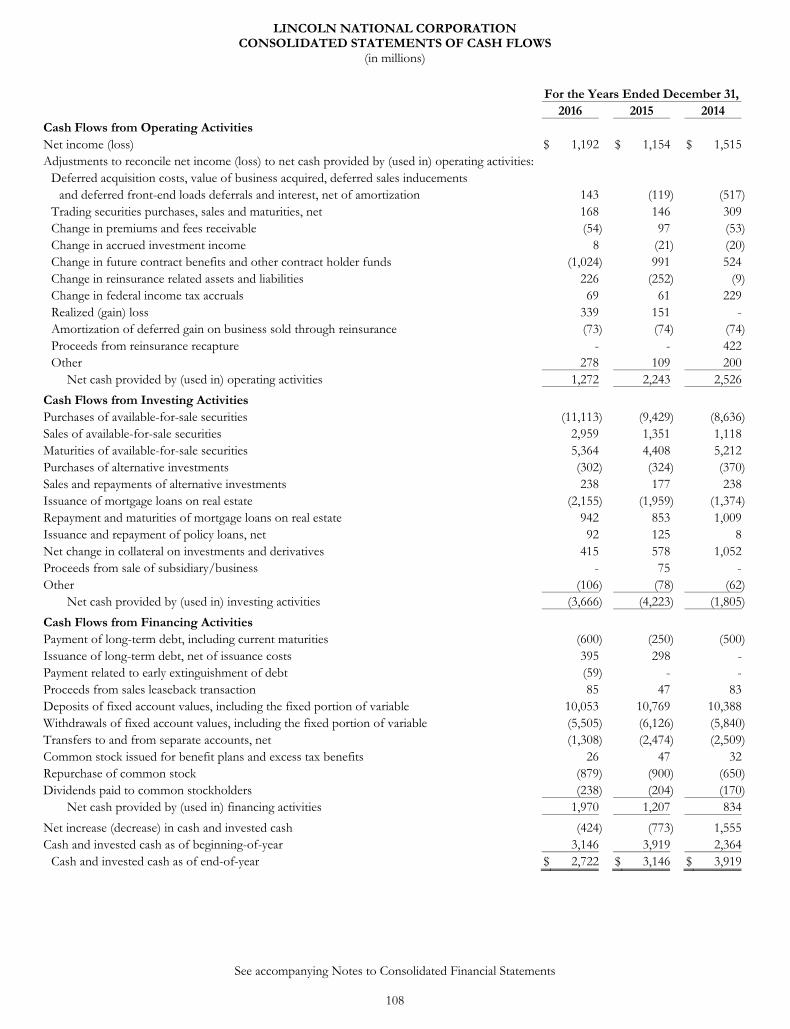
See accompanying Notes to Consolidated Financial Statements
108
LINCOLN NATIONAL CORPORATION CONSOLIDATED STATEMENTS OF CASH FLOWS
(in millions)
For the Years Ended December 31, 2016 2015 2014 Cash Flows from Operating Activities Net income (loss) $ 1,192 $ 1,154 $ 1,515Adjustments to reconcile net income (loss) to net cash provided by (used in) operating activities:
Deferred acquisition costs, value of business acquired, deferred sales inducements and deferred front-end loads deferrals and interest, net of amortization 143 (119) (517)
Trading securities purchases, sales and maturities, net 168 146 309Change in premiums and fees receivable (54) 97 (53)Change in accrued investment income 8 (21) (20)Change in future contract benefits and other contract holder funds (1,024) 991 524Change in reinsurance related assets and liabilities 226 (252) (9)Change in federal income tax accruals 69 61 229Realized (gain) loss 339 151 -Amortization of deferred gain on business sold through reinsurance (73) (74) (74)Proceeds from reinsurance recapture - - 422Other 278 109 200
Net cash provided by (used in) operating activities 1,272 2,243 2,526
Cash Flows from Investing Activities Purchases of available-for-sale securities (11,113) (9,429) (8,636)Sales of available-for-sale securities 2,959 1,351 1,118Maturities of available-for-sale securities 5,364 4,408 5,212Purchases of alternative investments (302) (324) (370)Sales and repayments of alternative investments 238 177 238Issuance of mortgage loans on real estate (2,155) (1,959) (1,374)Repayment and maturities of mortgage loans on real estate 942 853 1,009Issuance and repayment of policy loans, net 92 125 8Net change in collateral on investments and derivatives 415 578 1,052Proceeds from sale of subsidiary/business - 75 -Other (106) (78) (62)
Net cash provided by (used in) investing activities (3,666) (4,223) (1,805)
Cash Flows from Financing Activities Payment of long-term debt, including current maturities (600) (250) (500)Issuance of long-term debt, net of issuance costs 395 298 -Payment related to early extinguishment of debt (59) - -Proceeds from sales leaseback transaction 85 47 83Deposits of fixed account values, including the fixed portion of variable 10,053 10,769 10,388Withdrawals of fixed account values, including the fixed portion of variable (5,505) (6,126) (5,840)Transfers to and from separate accounts, net (1,308) (2,474) (2,509)Common stock issued for benefit plans and excess tax benefits 26 47 32Repurchase of common stock (879) (900) (650)Dividends paid to common stockholders (238) (204) (170)
Net cash provided by (used in) financing activities 1,970 1,207 834
Net increase (decrease) in cash and invested cash (424) (773) 1,555Cash and invested cash as of beginning-of-year 3,146 3,919 2,364
Cash and invested cash as of end-of-year $ 2,722 $ 3,146 $ 3,919
109
LINCOLN NATIONAL CORPORATION NOTES TO CONSOLIDATED FINANCIAL STATEMENTS
1. Nature of Operations, Basis of Presentation and Summary of Significant Accounting Policies Nature of Operations Lincoln National Corporation and its majority-owned subsidiaries (“LNC” or the “Company,” which also may be referred to as “we,” “our” or “us”) operate multiple insurance businesses through four business segments. See Note 21 for additional details. The collective group of businesses uses “Lincoln Financial Group” as its marketing identity. Through our business segments, we sell a wide range of wealth protection, accumulation and retirement income products and solutions. These products include fixed and indexed annuities, variable annuities, universal life insurance (“UL”), variable universal life insurance (“VUL”), linked-benefit UL, indexed universal life insurance (“IUL”), term life insurance, employer-sponsored retirement plans and services, and group life, disability and dental. Basis of Presentation The accompanying consolidated financial statements are prepared in accordance with United States of America generally accepted accounting principles (“GAAP”). Certain GAAP policies, which significantly affect the determination of financial condition, results of operations and cash flows, are summarized below. Certain amounts reported in prior years’ consolidated financial statements have been reclassified to conform to the presentation adopted in the current year. Specifically, we reclassified cash flows from certain investing activities into their own respective line items within the Consolidated Statements of Cash Flows. Previously, these amounts were reported within purchases of other investments or sales or maturities of other investments line items, as applicable, within cash flows from investing activities. These reclassifications had no effect on net income (loss), net cash provided by (used in) investing activities, or stockholders’ equity for the prior years. Summary of Significant Accounting Policies Principles of Consolidation The accompanying consolidated financial statements include the accounts of LNC and all other entities in which we have a controlling financial interest and any variable interest entities (“VIEs”) in which we are the primary beneficiary. Entities in which we do not have a controlling financial interest and do not exercise significant management influence over the operating and financing decisions are reported using the equity method. All material inter-company accounts and transactions have been eliminated in consolidation. Our involvement with VIEs is primarily to invest in assets that allow us to gain exposure to a broadly diversified portfolio of asset classes. A VIE is an entity that does not have sufficient equity to finance its own activities without additional financial support or where investors lack certain characteristics of a controlling financial interest. We assess our contractual, ownership or other interests in a VIE to determine if our interest participates in the variability the VIE was designed to absorb and pass onto variable interest holders. We perform an ongoing qualitative assessment of our variable interests in VIEs to determine whether we have a controlling financial interest and would therefore be considered the primary beneficiary of the VIE. If we determine we are the primary beneficiary of a VIE, we consolidate the assets and liabilities of the VIE in our consolidated financial statements. Accounting Estimates and Assumptions The preparation of financial statements in conformity with GAAP requires management to make estimates and assumptions affecting the reported amounts of assets and liabilities and the disclosures of contingent assets and liabilities as of the date of the financial statements and the reported amounts of revenues and expenses for the reporting period. Those estimates are inherently subject to change and actual results could differ from those estimates. Included among the material (or potentially material) reported amounts and disclosures that require extensive use of estimates are: fair value of certain invested assets and derivatives, other-than-temporary impairment (“OTTI”) and asset valuation allowances, deferred acquisition costs (“DAC”), value of business acquired (“VOBA”), deferred sales inducements (“DSI”), goodwill, future contract benefits, other contract holder funds including deferred front-end loads (“DFEL”), pension plans, stock-based incentive compensation, income taxes and the potential effects of resolving litigated matters. Business Combinations We use the acquisition method of accounting for all business combination transactions, and accordingly, recognize the fair values of assets acquired, liabilities assumed and any noncontrolling interests in our consolidated financial statements. The allocation of fair values may be subject to adjustment after the initial allocation for up to a one-year period as more information becomes available relative to the fair values as of the acquisition date. The consolidated financial statements include the results of operations of any acquired company since the acquisition date.
110
Fair Value Measurement Our measurement of fair value is based on assumptions used by market participants in pricing the asset or liability, which may include inherent risk, restrictions on the sale or use of an asset or non-performance risk (“NPR”), which would include our own credit risk. Our estimate of an exchange price is the price in an orderly transaction between market participants to sell the asset or transfer the liability (“exit price”) in the principal market, or the most advantageous market in the absence of a principal market, for that asset or liability, as opposed to the price that would be paid to acquire the asset or receive a liability (“entry price”). Pursuant to the Fair Value Measurements and Disclosures Topic of the Financial Accounting Standards Board (“FASB”) Accounting Standards CodificationTM (“ASC”), we categorize our financial instruments carried at fair value into a three-level fair value hierarchy, based on the priority of inputs to the respective valuation technique. The three-level hierarchy for fair value measurement is defined as follows: • Level 1 – inputs to the valuation methodology are quoted prices available in active markets for identical investments as of the
reporting date, except for large holdings subject to “blockage discounts” that are excluded; • Level 2 – inputs to the valuation methodology are other than quoted prices in active markets, which are either directly or indirectly
observable as of the reporting date, and fair value can be determined through the use of models or other valuation methodologies; and
• Level 3 – inputs to the valuation methodology are unobservable inputs in situations where there is little or no market activity for the asset or liability, and we make estimates and assumptions related to the pricing of the asset or liability, including assumptions regarding risk.
In certain cases, the inputs used to measure fair value may fall into different levels of the fair value hierarchy. In such cases, the level within the fair value hierarchy is based on the lowest level of input that is significant to the fair value measurement. Our assessment of the significance of a particular input to the fair value measurement in its entirety requires judgment and considers factors specific to the investment. When a determination is made to classify an asset or liability within Level 3 of the fair value hierarchy, the determination is based upon the significance of the unobservable inputs to the overall fair value measurement. Because certain securities trade in less liquid or illiquid markets with limited or no pricing information, the determination of fair value for these securities is inherently more difficult. However, Level 3 fair value investments may include, in addition to the unobservable or Level 3 inputs, observable components, which are components that are actively quoted or can be validated to market-based sources. Available-For-Sale Securities – Fair Valuation Methodologies and Associated Inputs Securities classified as available-for-sale (“AFS”) consist of fixed maturity and equity securities and are stated at fair value with unrealized gains and losses included within accumulated other comprehensive income (loss) (“AOCI”), net of associated DAC, VOBA, DSI, future contract benefits, other contract holder funds and deferred income taxes. We measure the fair value of our securities classified as AFS based on assumptions used by market participants in pricing the security. The most appropriate valuation methodology is selected based on the specific characteristics of the fixed maturity or equity security, and we consistently apply the valuation methodology to measure the security’s fair value. Our fair value measurement is based on a market approach that utilizes prices and other relevant information generated by market transactions involving identical or comparable securities. Sources of inputs to the market approach primarily include third-party pricing services, independent broker quotations or pricing matrices. We do not adjust prices received from third parties; however, we do analyze the third-party pricing services’ valuation methodologies and related inputs and perform additional evaluation to determine the appropriate level within the fair value hierarchy. The observable and unobservable inputs to our valuation methodologies are based on a set of standard inputs that we generally use to evaluate all of our AFS securities. Observable inputs include benchmark yields, reported trades, broker-dealer quotes, issuer spreads, two-sided markets, benchmark securities, bids, offers and reference data. In addition, market indicators, industry and economic events are monitored, and further market data is acquired if certain triggers are met. For certain security types, additional inputs may be used, or some of the inputs described above may not be applicable. For private placement securities, we use pricing matrices that utilize observable pricing inputs of similar public securities and Treasury yields as inputs to the fair value measurement. Depending on the type of security or the daily market activity, standard inputs may be prioritized differently or may not be available for all AFS securities on any given day. For broker-quoted only securities, non-binding quotes from market makers or broker-dealers are obtained from sources recognized as market participants. For securities trading in less liquid or illiquid markets with limited or no pricing information, we use unobservable inputs to measure fair value. The following summarizes our fair valuation methodologies and associated inputs, which are particular to the specified security type and are in addition to the defined standard inputs to our valuation methodologies for all of our AFS securities discussed above: • Corporate bonds and U.S. government bonds – We also use Trade Reporting and Compliance EngineTM reported tables for our
corporate bonds and vendor trading platform data for our U.S. government bonds. • Mortgage- and asset-backed securities (“ABS”) – We also utilize additional inputs, which include new issues data, monthly payment
information and monthly collateral performance, including prepayments, severity, delinquencies, step-down features and over collateralization features for each of our mortgage-backed securities (“MBS”), which include collateralized mortgage obligations and
111
mortgage pass through securities backed by residential mortgages (“RMBS”), commercial mortgage-backed securities (“CMBS”), collateralized loan obligations (“CLOs”) and collateralized debt obligations (“CDOs”).
• State and municipal bonds – We also use additional inputs that include information from the Municipal Securities Rule Making Board, as well as material event notices, new issue data, issuer financial statements and Municipal Market Data benchmark yields for our state and municipal bonds.
• Hybrid and redeemable preferred and equity securities – We also utilize additional inputs of exchange prices (underlying and common stock of the same issuer) for our hybrid and redeemable preferred and equity securities.
In order to validate the pricing information and broker-dealer quotes, we employ, where possible, procedures that include comparisons with similar observable positions, comparisons with subsequent sales and observations of general market movements for those security classes. We have policies and procedures in place to review the process that is utilized by our third-party pricing service and the output that is provided to us by the pricing service. On a periodic basis, we test the pricing for a sample of securities to evaluate the inputs and assumptions used by the pricing service, and we perform a comparison of the pricing service output to an alternative pricing source. We also evaluate prices provided by our primary pricing service to ensure that they are not stale or unreasonable by reviewing the prices for unusual changes from period to period based on certain parameters or for lack of change from one period to the next. AFS Securities – Evaluation for Recovery of Amortized Cost We regularly review our AFS securities for declines in fair value that we determine to be other-than-temporary. For an equity security, if we do not have the ability and intent to hold the security for a sufficient period of time to allow for a recovery in value, we conclude that an OTTI has occurred and the amortized cost of the equity security is written down to the current fair value, with a corresponding charge to realized gain (loss) on our Consolidated Statements of Comprehensive Income (Loss). When assessing our ability and intent to hold the equity security to recovery, we consider, among other things, the severity and duration of the decline in fair value of the equity security as well as the cause of the decline, a fundamental analysis of the liquidity, and business prospects and overall financial condition of the issuer. For our fixed maturity AFS securities (also referred to as “debt securities”), we generally consider the following to determine whether our debt securities with unrealized losses are other-than-temporarily impaired: • The estimated range and average period until recovery; • The estimated range and average holding period to maturity; • Remaining payment terms of the security; • Current delinquencies and nonperforming assets of underlying collateral; • Expected future default rates; • Collateral value by vintage, geographic region, industry concentration or property type; • Subordination levels or other credit enhancements as of the balance sheet date as compared to origination; and • Contractual and regulatory cash obligations. For a debt security, if we intend to sell a security, or it is more likely than not we will be required to sell a debt security before recovery of its amortized cost basis and the fair value of the debt security is below amortized cost, we conclude that an OTTI has occurred and the amortized cost is written down to current fair value, with a corresponding charge to realized gain (loss) on our Consolidated Statements of Comprehensive Income (Loss). If we do not intend to sell a debt security, or it is not more likely than not we will be required to sell a debt security before recovery of its amortized cost basis but the present value of the cash flows expected to be collected is less than the amortized cost of the debt security (referred to as the credit loss), we conclude that an OTTI has occurred and the amortized cost is written down to the estimated recovery value with a corresponding charge to realized gain (loss) on our Consolidated Statements of Comprehensive Income (Loss), as this amount is deemed the credit portion of the OTTI. The remainder of the decline to fair value is recorded in other comprehensive income (“OCI”) to unrealized OTTI on AFS securities on our Consolidated Statements of Stockholders’ Equity, as this amount is considered a noncredit (i.e., recoverable) impairment. When assessing our intent to sell a debt security, or if it is more likely than not we will be required to sell a debt security before recovery of its cost basis, we evaluate facts and circumstances such as, but not limited to, decisions to reposition our security portfolio, sales of securities to meet cash flow needs and sales of securities to capitalize on favorable pricing. Management considers the following as part of the evaluation: • The current economic environment and market conditions; • Our business strategy and current business plans; • The nature and type of security, including expected maturities and exposure to general credit, liquidity, market and interest rate risk; • Our analysis of data from financial models and other internal and industry sources to evaluate the current effectiveness of our
hedging and overall risk management strategies; • The current and expected timing of contractual maturities of our assets and liabilities, expectations of prepayments on investments
and expectations for surrenders and withdrawals of life insurance policies and annuity contracts; • The capital risk limits approved by management; and • Our current financial condition and liquidity demands.
112
In order to determine the amount of the credit loss for a debt security, we calculate the recovery value by performing a discounted cash flow analysis based on the current cash flows and future cash flows we expect to recover. The discount rate is the effective interest rate implicit in the underlying debt security. The effective interest rate is the original yield, or the coupon if the debt security was previously impaired. See the discussion below for additional information on the methodology and significant inputs, by security type, that we use to determine the amount of a credit loss. To determine the recovery period of a debt security, we consider the facts and circumstances surrounding the underlying issuer including, but not limited to, the following: • Historical and implied volatility of the security; • Length of time and extent to which the fair value has been less than amortized cost; • Adverse conditions specifically related to the security or to specific conditions in an industry or geographic area; • Failure, if any, of the issuer of the security to make scheduled payments; and • Recoveries or additional declines in fair value subsequent to the balance sheet date. In periods subsequent to the recognition of an OTTI, the AFS security is accounted for as if it had been purchased on the measurement date of the OTTI. Therefore, for the fixed maturity AFS security, the original discount or reduced premium is reflected in net investment income over the contractual term of the investment in a manner that produces a constant effective yield. To determine recovery value of a corporate bond, CLO or CDO, we perform additional analysis related to the underlying issuer including, but not limited to, the following:
• Fundamentals of the issuer to determine what we would recover if they were to file bankruptcy versus the price at which the market
is trading; • Fundamentals of the industry in which the issuer operates; • Earnings multiples for the given industry or sector of an industry that the underlying issuer operates within, divided by the
outstanding debt to determine an expected recovery value of the security in the case of a liquidation; • Expected cash flows of the issuer (e.g., whether the issuer has cash flows in excess of what is required to fund its operations); • Expectations regarding defaults and recovery rates; • Changes to the rating of the security by a rating agency; and • Additional market information (e.g., if there has been a replacement of the corporate debt security). Each quarter we review the cash flows for the MBS to determine whether or not they are sufficient to provide for the recovery of our amortized cost. We revise our cash flow projections only for those securities that are at most risk for impairment based on current credit enhancement and trends in the underlying collateral performance. To determine recovery value of a MBS, we perform additional analysis related to the underlying issuer including, but not limited to, the following: • Discounted cash flow analysis based on the current cash flows and future cash flows we expect to recover; • Level of creditworthiness of the home equity loans or residential mortgages that back an RMBS or commercial mortgages that back a
CMBS; • Susceptibility to fair value fluctuations for changes in the interest rate environment; • Susceptibility to reinvestment risks, in cases where market yields are lower than the securities’ book yield earned; • Susceptibility to reinvestment risks, in cases where market yields are higher than the book yields earned on a security; • Expectations of sale of such a security where market yields are higher than the book yields earned on a security; and • Susceptibility to variability of prepayments. When evaluating MBS and mortgage-related ABS, we consider a number of pool-specific factors as well as market level factors when determining whether or not the impairment on the security is temporary or other-than-temporary. The most important factor is the performance of the underlying collateral in the security and the trends of that performance in the prior periods. We use this information about the collateral to forecast the timing and rate of mortgage loan defaults, including making projections for loans that are already delinquent and for those loans that are currently performing but may become delinquent in the future. Other factors used in this analysis include the credit characteristics of borrowers, geographic distribution of underlying loans and timing of liquidations by state. Once default rates and timing assumptions are determined, we then make assumptions regarding the severity of a default if it were to occur. Factors that impact the severity assumption include expectations for future home price appreciation or depreciation, loan size, first lien versus second lien, existence of loan level private mortgage insurance, type of occupancy and geographic distribution of loans. Once default and severity assumptions are determined for the security in question, cash flows for the underlying collateral are projected including expected defaults and prepayments. These cash flows on the collateral are then translated to cash flows on our tranche based on the cash flow waterfall of the entire capital security structure. If this analysis indicates the entire principal on a particular security will not be returned, the security is reviewed for OTTI by comparing the expected cash flows to amortized cost. To the extent that the security has already been impaired or was purchased at a discount, such that the amortized cost of the security is less than or equal to the present value of cash flows expected to be collected, no impairment is required. Otherwise, if the amortized cost of the security is greater than the present value of the cash flows expected to be collected, and the security was not purchased at a discount greater than the expected principal loss, then impairment is recognized.
113
We further monitor the cash flows of all of our AFS securities backed by mortgages on an ongoing basis. We also perform detailed analysis on all of our subprime, Alt-A, non-agency residential MBS and on a significant percentage of our AFS securities backed by pools of commercial mortgages. The detailed analysis includes revising projected cash flows by updating the cash flows for actual cash received and applying assumptions with respect to expected defaults, foreclosures and recoveries in the future. These revised projected cash flows are then compared to the amount of credit enhancement (subordination) in the structure to determine whether the amortized cost of the security is recoverable. If it is not recoverable, we record an impairment of the security. Trading Securities Trading securities consist of fixed maturity and equity securities in designated portfolios, some of which support modified coinsurance (“Modco”) and coinsurance with funds withheld (“CFW”) reinsurance arrangements. Investment results for the portfolios that support Modco and CFW reinsurance arrangements, including gains and losses from sales, are passed directly to the reinsurers pursuant to contractual terms of the reinsurance arrangements. Trading securities are carried at fair value, and changes in fair value and changes in the fair value of embedded derivative liabilities associated with the underlying reinsurance arrangements are recorded in realized gain (loss) on our Consolidated Statements of Comprehensive Income (Loss) as they occur. Alternative Investments Alternative investments, which consist primarily of investments in limited partnerships (“LPs”), are included in other investments on our Consolidated Balance Sheets. We account for our investments in LPs using the equity method to determine the carrying value. Recognition of alternative investment income is delayed due to the availability of the related financial statements, which are generally obtained from the partnerships’ general partners. As a result, our venture capital, real estate and oil and gas portfolios are generally on a three-month delay and our hedge funds are on a one-month delay. In addition, the impact of audit adjustments related to completion of calendar-year financial statement audits of the investees are typically received during the second quarter of each calendar year. Accordingly, our investment income from alternative investments for any calendar-year period may not include the complete impact of the change in the underlying net assets for the partnership for that calendar-year period. Payables for Collateral on Investments When we enter into collateralized financing transactions on our investments, a liability is recorded equal to the cash or non-cash collateral received. This liability is included within payables for collateral on investments on our Consolidated Balance Sheets. Income and expenses associated with these transactions are recorded as investment income and investment expenses within net investment income on our Consolidated Statements of Comprehensive Income (Loss). Changes in payables for collateral on investments are reflected within cash flows from investing activities on our Consolidated Statements of Cash Flows. Mortgage Loans on Real Estate Mortgage loans on real estate are carried at unpaid principal balances adjusted for amortization of premiums and accretion of discounts and are net of valuation allowances. Interest income is accrued on the principal balance of the loan based on the loan’s contractual interest rate. Premiums and discounts are amortized using the effective yield method over the life of the loan. Interest income and amortization of premiums and discounts are reported in net investment income on our Consolidated Statements of Comprehensive Income (Loss) along with mortgage loan fees, which are recorded as they are incurred. Our commercial loan portfolio is comprised of long-term loans secured by existing commercial real estate. As such, it does not exhibit risk characteristics unique to mezzanine, construction, residential, agricultural, land or other types of real estate loans. We believe all of the loans in our portfolio share three primary risks: borrower creditworthiness; sustainability of the cash flow of the property; and market risk; therefore, our methods for monitoring and assessing credit risk are consistent for our entire portfolio. Loans are considered impaired when it is probable that, based upon current information and events, we will be unable to collect all amounts due under the contractual terms of the loan agreement. When we determine that a loan is impaired, a valuation allowance is established for the excess carrying value of the loan over its estimated value. The loan’s estimated value is based on: the present value of expected future cash flows discounted at the loan’s effective interest rate; the loan’s observable market price; or the fair value of the loan’s collateral. Valuation allowances are maintained at a level we believe is adequate to absorb estimated probable credit losses of each specific loan. Our periodic evaluation of the adequacy of the allowance for losses is based on our past loan loss experience, known and inherent risks in the portfolio, adverse situations that may affect the borrower’s ability to repay (including the timing of future payments), the estimated value of the underlying collateral, composition of the loan portfolio, current economic conditions and other relevant factors. Trends in market vacancy and rental rates are incorporated into the analysis that we perform for monitored loans and may contribute to the establishment of (or an increase or decrease in) an allowance for credit losses. In addition, we review each loan individually in our commercial mortgage loan portfolio on an annual basis to identify emerging risks. We focus on properties that experienced a reduction in debt-service coverage or that have significant exposure to tenants with deteriorating credit profiles. Where warranted, we establish or increase loss reserves for a specific loan based upon this analysis. Our process for determining past due or delinquency status begins when a payment date is missed, at which time the borrower is contacted. After the grace period expiration that may last up to 10 days, we send a default notice. The default notice generally provides a short time period to cure the default. Our policy is to report loans that are 60 or more days past due, which equates to two or more payments missed, as delinquent. We do not accrue interest on loans 90 days past due, and any interest received on these loans is either applied to the principal or recorded in net investment income on our Consolidated Statements of Comprehensive Income (Loss) when received, depending on the assessment of the collectability of the loan. We resume accruing interest

114
once a loan complies with all of its original terms or restructured terms. Mortgage loans deemed uncollectable are charged against the allowance for losses, and subsequent recoveries, if any, are credited to the allowance for losses. All mortgage loans that are impaired have an established allowance for credit losses. Changes in valuation allowances are reported in realized gain (loss) on our Consolidated Statements of Comprehensive Income (Loss). We measure and assess the credit quality of our mortgage loans by using loan-to-value and debt-service coverage ratios. The loan-to-value ratio compares the principal amount of the loan to the fair value at origination of the underlying property collateralizing the loan and is commonly expressed as a percentage. Loan-to-value ratios greater than 100% indicate that the principal amount is greater than the collateral value. Therefore, all else being equal, a lower loan-to-value ratio generally indicates a higher quality loan. The debt-service coverage ratio compares a property’s net operating income to its debt-service payments. Debt-service coverage ratios of less than 1.0 indicate that property operations do not generate enough income to cover its current debt payments. Therefore, all else being equal, a higher debt-service coverage ratio generally indicates a higher quality loan. Policy Loans Policy loans represent loans we issue to contract holders that use the cash surrender value of their life insurance policy as collateral. Policy loans are carried at unpaid principal balances. Real Estate Real estate includes both real estate held for the production of income and real estate held-for-sale. Real estate held for the production of income is carried at cost less accumulated depreciation. Depreciation is calculated on a straight-line basis over the estimated useful life of the asset. We periodically review properties held for the production of income for impairment. Properties whose carrying values are greater than their projected undiscounted cash flows are written down to estimated fair value, with impairment losses reported in realized gain (loss) on our Consolidated Statements of Comprehensive Income (Loss). The estimated fair value of real estate is generally computed using the present value of expected future cash flows from the real estate discounted at a rate commensurate with the underlying risks. Real estate classified as held-for-sale is stated at the lower of depreciated cost or fair value less expected disposition costs at the time classified as held-for-sale. Real estate is not depreciated while it is classified as held-for-sale. Also, valuation allowances for losses are established, as appropriate, for real estate held-for-sale and any changes to the valuation allowances are reported in realized gain (loss) on our Consolidated Statements of Comprehensive Income (Loss). Real estate acquired through foreclosure proceedings is recorded at fair value at the settlement date. Derivative Instruments We hedge certain portions of our exposure to interest rate risk, foreign currency exchange risk, equity market risk and credit risk by entering into derivative transactions. All of our derivative instruments are recognized as either assets or liabilities on our Consolidated Balance Sheets at estimated fair value. We categorized derivatives into a three-level hierarchy, based on the priority of the inputs to the respective valuation technique as discussed above in “Fair Value Measurement.” The accounting for changes in the estimated fair value of a derivative instrument depends on whether it has been designated and qualifies as part of a hedging relationship, and further, on the type of hedging relationship. For those derivative instruments that are designated and qualify as hedging instruments, we designate the hedging instrument based upon the exposure being hedged: as a cash flow hedge or a fair value hedge. For derivative instruments that are designated and qualify as a cash flow hedge, the effective portion of the gain or loss on the derivative instrument is reported as a component of AOCI and reclassified into net income in the same period or periods during which the hedged transaction affects net income. The remaining gain or loss on the derivative instrument in excess of the cumulative change in the present value of designated future cash flows of the hedged item (hedge ineffectiveness), if any, is recognized in net income during the period of change. For derivative instruments that are designated and qualify as a fair value hedge, the gain or loss on the derivative instrument, as well as the offsetting gain or loss on the hedged item attributable to the hedged risk are recognized in net income during the period of change in estimated fair values. For derivative instruments not designated as hedging instruments, but that are economic hedges, the gain or loss is recognized in net income. We purchase and issue financial instruments and products that contain embedded derivative instruments. When it is determined that the embedded derivative possesses economic characteristics that are not clearly and closely related to the economic characteristics of the host contract, and a separate instrument with the same terms would qualify as a derivative instrument, the embedded derivative is bifurcated from the host for measurement purposes. The embedded derivative is carried at fair value with changes in fair value recognized in net income during the period of change. We employ several different methods for determining the fair value of our derivative instruments. The fair value of our derivative contracts are measured based on current settlement values, which are based on quoted market prices, industry standard models that are commercially available and broker quotes. These techniques project cash flows of the derivatives using current and implied future market conditions. We calculate the present value of the cash flows to measure the current fair market value of the derivative.
115
Cash and Invested Cash Cash and invested cash is carried at cost and includes all highly liquid debt instruments purchased with an original maturity of three months or less. DAC, VOBA, DSI and DFEL Acquisition costs directly related to successful contract acquisitions or renewals of UL insurance, VUL insurance, traditional life insurance, annuities and other investment contracts have been deferred (i.e., DAC) to the extent recoverable. VOBA is an intangible asset that reflects the estimated fair value of in-force contracts in a life insurance company acquisition and represents the portion of the purchase price that is allocated to the value of the right to receive future cash flows from the business in force at the acquisition date. Bonus credits and excess interest for dollar cost averaging contracts are considered DSI. Contract sales charges that are collected in the early years of an insurance contract are deferred (i.e., DFEL), and the unamortized balance is reported in other contract holder funds on our Consolidated Balance Sheets. Both DAC and VOBA amortization, excluding amounts reported in realized gain (loss), is reported within commissions and other expenses on our Consolidated Statements of Comprehensive Income (Loss). DSI amortization, excluding amounts reported in realized gain (loss), is reported in interest credited on our Consolidated Statements of Comprehensive Income (Loss). The amortization of DFEL, excluding amounts reported in realized gain (loss), is reported within fee income on our Consolidated Statements of Comprehensive Income (Loss). The methodology for determining the amortization of DAC, VOBA, DSI and DFEL varies by product type. For all insurance contracts, amortization is based on assumptions consistent with those used in the development of the underlying contract adjusted for emerging experience and expected trends. Acquisition costs for UL and VUL insurance and investment-type products, which include fixed and variable deferred annuities, are generally amortized over the lives of the policies in relation to the incidence of estimated gross profits (“EGPs”) from surrender charges, investment, mortality net of reinsurance ceded and expense margins and actual realized gain (loss) on investments. Contract lives for UL and VUL policies are estimated to be 30 to 40 years based on the expected lives of the contracts. Contract lives for fixed and variable deferred annuities are generally between 15 and 30 years, while some of our fixed multi-year guarantee products have amortization periods equal to the guarantee period. The front-end load annuity product has an assumed life of 25 years. Longer lives are assigned to those blocks that have demonstrated favorable lapse experience. Acquisition costs for all traditional contracts, including traditional life insurance contracts, such as individual whole life, group business and term life insurance, are amortized over the expected premium-paying period that generally results in amortization less than 30 years. Acquisition costs are either amortized on a straight-line basis or as a level percent of premium of the related policies depending on the block of business. There is currently no DAC, VOBA, DSI or DFEL balance or related amortization for fixed and variable payout annuities. We account for modifications of insurance contracts that result in a substantially unchanged contract as a continuation of the replaced contract. We account for modifications of insurance contracts that result in a substantially changed contract as an extinguishment of the replaced contract. The carrying amounts of DAC, VOBA, DSI and DFEL are adjusted for the effects of realized and unrealized gains and losses on securities classified as AFS and certain derivatives and embedded derivatives. Amortization expense of DAC, VOBA, DSI and DFEL reflects an assumption for an expected level of credit-related investment losses. When actual credit-related investment losses are realized, we recognize a true-up to our DAC, VOBA, DSI and DFEL amortization within realized gain (loss) on our Consolidated Statements of Comprehensive Income (Loss) reflecting the incremental effect of actual versus expected credit-related investment losses. These actual to expected amortization adjustments can create volatility from period to period in realized gain (loss). During the third quarter of each year, we conduct our annual comprehensive review of the assumptions and the projection models used for our estimates of future gross profits underlying the amortization of DAC, VOBA, DSI and DFEL and the calculations of the embedded derivatives and reserves for life insurance and annuity products. These assumptions include, but are not limited to, capital markets, investment margins, mortality, retention, rider utilization and maintenance expenses (costs associated with maintaining records relating to insurance and individual and group annuity contracts, and with the processing of premium collections, deposits, withdrawals and commissions). Based on our review, the cumulative balances of DAC, VOBA, DSI and DFEL included on our Consolidated Balance Sheets are adjusted with an offsetting benefit or charge to revenue or amortization expense to reflect such change related to our expectations of future EGPs (“unlocking”). We may have unlocking in other quarters as we become aware of information that warrants updating assumptions outside of our annual comprehensive review. We may also identify and implement actuarial modeling refinements that result in increases or decreases to the carrying values of DAC, VOBA, DSI, DFEL, embedded derivatives and reserves for life insurance and annuity products with living benefit and death benefit guarantees. DAC, VOBA, DSI and DFEL are reviewed to ensure that the unamortized portion does not exceed the expected recoverable amounts.
116
Reinsurance Our insurance companies enter into reinsurance agreements with other companies in the normal course of business. Assets and liabilities and premiums and benefits from certain reinsurance contracts that grant statutory surplus relief to other insurance companies are netted on our Consolidated Balance Sheets and Consolidated Statements of Comprehensive Income (Loss), respectively, because there is a right of offset. All other reinsurance agreements are reported on a gross basis on our Consolidated Balance Sheets as an asset for amounts recoverable from reinsurers or as a component of other liabilities for amounts, such as premiums, owed to the reinsurers, with the exception of Modco agreements for which the right of offset also exists. Reinsurance premiums and benefits paid or provided are accounted for on bases consistent with those used in accounting for the original policies issued and the terms of the reinsurance contracts. Premiums, benefits and DAC are reported net of insurance ceded. Goodwill We recognize the excess of the purchase price, plus the fair value of any noncontrolling interest in the acquiree, over the fair value of identifiable net assets acquired as goodwill. Goodwill is not amortized, but is reviewed at least annually for indications of value impairment, with consideration given to financial performance and other relevant factors. We perform a two-step test in our evaluation of the carrying value of goodwill for each of our reporting units. The results of one test on one reporting unit cannot subsidize the results of another reporting unit. In Step 1 of the evaluation, the fair value of each reporting unit is determined and compared to the carrying value of the reporting unit. If the fair value is greater than the carrying value, then the carrying value of the reporting unit is deemed to be recoverable, and Step 2 is not required. If the fair value estimate is less than the carrying value, it is an indicator that impairment may exist, and Step 2 is required. In Step 2, the implied fair value of goodwill is determined for the reporting unit. The reporting unit’s fair value as determined in Step 1 is assigned to all of its net assets (recognized and unrecognized) as if the reporting unit were acquired in a business combination as of the date of the impairment test. If the implied fair value of the reporting unit’s goodwill is lower than its carrying amount, goodwill is impaired and written down to its fair value; and a charge is reported in impairment of intangibles on our Consolidated Statements of Comprehensive Income (Loss). Other Assets and Other Liabilities Other assets consist primarily of DSI, specifically identifiable intangible assets, property and equipment owned by the Company, balances associated with corporate-owned and bank-owned life insurance, certain reinsurance assets, receivables resulting from sales of securities that had not yet settled as of the balance sheet date, debt issuance costs associated with line-of-credit arrangements, assets under capital leases and other prepaid expenses. Other liabilities consist primarily of current and deferred taxes, pension and other employee benefit liabilities, derivative instrument liabilities, certain reinsurance payables, payables resulting from purchases of securities that had not yet settled as of the balance sheet date, interest on borrowed funds, obligations under capital leases and other accrued expenses. Other assets and other liabilities on our Consolidated Balance Sheets include guaranteed living benefit (“GLB”) features and remaining guaranteed interest and similar contracts that are carried at fair value, which may be reported in either other assets or other liabilities. The fair value of these items represents approximate exit price including an estimate for our NPR. Certain of these features have elements of both insurance benefits and embedded derivatives. Through our hybrid accounting approach, for reserve calculation purposes we assign product cash flows to the embedded derivative or insurance portion of the reserves based on the life-contingent nature of the benefits. We classify these GLB reserves embedded derivatives in Level 3 within the hierarchy levels described above in “Fair Value Measurement.” We report the insurance portion of the reserves in future contract benefits. The carrying values of specifically identifiable intangible assets are reviewed at least annually for indicators of impairment in value that are other-than-temporary, including unexpected or adverse changes in the following: the economic or competitive environments in which the company operates; profitability analyses; cash flow analyses; and the fair value of the relevant business operation. If there was an indication of impairment, then the discounted cash flow method would be used to measure the impairment, and the carrying value would be adjusted as necessary and reported in impairment of intangibles on our Consolidated Statements of Comprehensive Income (Loss). Sales force intangibles are attributable to the value of the new business distribution system acquired through business combinations. These assets are amortized on a straight-line basis over their useful life of 25 years. Property and equipment owned for company use is carried at cost less allowances for depreciation. Provisions for depreciation of investment real estate and property and equipment owned for company use are computed principally on the straight-line method over the estimated useful lives of the assets, which include buildings, computer hardware and software and other property and equipment. Certain assets on our Consolidated Balance Sheets are related to capital leases. These assets under capital leases are depreciated in a manner consistent with our current depreciation policy for owned assets. We periodically review the carrying value of our long-lived assets, including property and equipment, for impairment whenever events or circumstances indicate that the carrying amount of such assets may not be fully recoverable. For long-lived assets to be held and used, impairments are recognized when the carrying amount of a long-lived asset is not recoverable and exceeds its fair value. The carrying amount of a long-lived asset is not recoverable if it exceeds the sum of the undiscounted cash flows expected to result from the use and eventual disposition of the asset. An impairment loss is measured as the amount by which the carrying amount of a long-lived asset exceeds its fair value. Long-lived assets to be disposed of by abandonment or in an exchange for a similar productive long-lived asset are classified as held-for-use until they are disposed. Long-lived assets to be sold are classified as held-for-sale and are no longer depreciated. Certain criteria have
117
to be met in order for the long-lived asset to be classified as held-for-sale, including that a sale is probable and expected to occur within one year. Long-lived assets classified as held-for-sale are recorded at the lower of their carrying amount or fair value less cost to sell. Separate Account Assets and Liabilities We maintain separate account assets, which are reported at fair value. The related liabilities are reported at an amount equivalent to the separate account assets. Investment risks associated with market value changes are borne by the contract holders, except to the extent of minimum guarantees made by the Company with respect to certain accounts. We issue variable annuity contracts through our separate accounts for which investment income and investment gains and losses accrue directly to, and investment risk is borne by, the contract holder (traditional variable annuities). We also issue variable annuity and life contracts through separate accounts that may include various types of guaranteed death benefit (“GDB”), guaranteed withdrawal benefit (“GWB”) and guaranteed income benefit (“GIB”) features. The GDB features include those where we contractually guarantee to the contract holder either: return of no less than total deposits made to the contract less any partial withdrawals (“return of net deposits”); total deposits made to the contract less any partial withdrawals plus a minimum return (“minimum return”); or the highest contract value on any contract anniversary date through age 80. The highest contract value is increased by purchase payments and is decreased by withdrawals subsequent to that anniversary date in the same proportion that withdrawals reduce the contract value. As discussed in Note 6, certain features of these guarantees are accounted for as embedded derivative reserves, whereas other guarantees are accounted for as benefit reserves. Other guarantees contain characteristics of both and are accounted for under an approach that calculates the value of the embedded derivative reserve and the benefit reserve based on the specific characteristics of each GLB feature. We use derivative instruments to hedge our exposure to the risks and earnings volatility that result from the embedded derivatives for living benefits in certain of our variable annuity products. The change in fair value of these instruments tends to move in the opposite direction of the change in the value of the associated reserves. The net impact of these changes is reported as a component of realized gain (loss) on our Consolidated Statements of Comprehensive Income (Loss). The “market consistent scenarios” used in the determination of the fair value of the GLB liability are similar to those used by an investment bank to value derivatives for which the pricing is not transparent and the aftermarket is nonexistent or illiquid. We use risk-neutral Monte Carlo simulations in our calculation to value the entire block of guarantees, which involve 100 unique scenarios per policy or approximately 49 million scenarios. The market consistent scenario assumptions, as of each valuation date, are those we view to be appropriate for a hypothetical market participant. The market consistent inputs include, but are not limited to, assumptions for capital markets (e.g., implied volatilities, correlation among indices, risk-free swap curve, etc.), policyholder behavior (e.g., policy lapse, rider utilization, etc.), mortality, risk margins, maintenance expenses and a margin for profit. We believe these assumptions are consistent with those that would be used by a market participant; however, as the related markets develop we will continue to reassess our assumptions. It is possible that different valuation techniques and assumptions could produce a materially different estimate of fair value. Future Contract Benefits and Other Contract Holder Funds Future contract benefits represent liability reserves that we have established and carry based on estimates of how much we will need to pay for future benefits and claims. Other contract holder funds represent liabilities for fixed account values, including the fixed portion of variable, dividends payable, premium deposit funds, undistributed earnings on participating business and other contract holder funds as well the carrying value of DFEL discussed above. The liabilities for future contract benefits and claim reserves for UL and VUL insurance policies consist of contract account balances that accrue to the benefit of the contract holders, excluding surrender charges. The liabilities for future insurance contract benefits and claim reserves for traditional life policies are computed using assumptions for investment yields, mortality and withdrawals based principally on generally accepted actuarial methods and assumptions at the time of contract issue. Investment yield assumptions for traditional direct individual life reserves for all contracts range from 2.25% to 7.75% depending on the time of contract issue. The investment yield assumptions for immediate and deferred paid-up annuities range from 1.25% to 12.75%. These investment yield assumptions are intended to represent an estimation of the interest rate experience for the period that these contract benefits are payable. The liabilities for future claim reserves for variable annuity products containing GDB features are calculated by estimating the present value of total expected benefit payments over the life of the contract from inception divided by the present value of total expected assessments over the life of the contract (“benefit ratio”) multiplied by the cumulative assessments recorded from the contract inception through the balance sheet date less the cumulative GDB payments plus interest on the liability. The change in the liability for a period is the benefit ratio multiplied by the assessments recorded for the period less GDB claims paid in the period plus interest. As experience or assumption changes result in a change in expected benefit payments or assessments, the benefit ratio is unlocked, that is, recalculated using the updated expected benefit payments and assessments over the life of the contract since inception. The revised benefit ratio is then applied to the liability calculation described above, with the resulting change in liability reported in benefits on our Consolidated Statements of Comprehensive Income (Loss). With respect to our future contract benefits and other contract holder funds, we continually review overall reserve position, reserving techniques and reinsurance arrangements. As experience develops and new information becomes known, liabilities are adjusted as deemed necessary. The effects of changes in estimates are included in the operating results for the period in which such changes occur.

118
The business written or assumed by us includes participating life insurance contracts, under which the contract holder is entitled to share in the earnings of such contracts via receipt of dividends. The dividend scale for participating policies is reviewed annually and may be adjusted to reflect recent experience and future expectations. As of December 31, 2016 and 2015, participating policies comprised less than 1% of the face amount of business in force, and dividend expenses were $59 million, $67 million and $64 million for the years ended December 31, 2016, 2015 and 2014, respectively. Liabilities for the secondary guarantees on UL-type products are calculated by multiplying the benefit ratio by the cumulative assessments recorded from contract inception through the balance sheet date less the cumulative secondary guarantee benefit payments plus interest. If experience or assumption changes result in a new benefit ratio, the reserves are adjusted to reflect the changes in a manner similar to the unlocking of DAC, VOBA, DFEL and DSI. The accounting for secondary guarantee benefits impacts, and is impacted by, EGPs used to calculate amortization of DAC, VOBA, DFEL and DSI. Certain of our variable annuity contracts reported within future contract benefits contain GLB reserves embedded derivatives, a portion of which may be reported in either other assets or other liabilities, and include guaranteed interest and similar contracts, that are carried at fair value on our Consolidated Balance Sheets, which represents approximate exit price including an estimate for our NPR. Certain of these features have elements of both insurance benefits and embedded derivatives. Through our hybrid accounting approach, for reserve calculation purposes we assign product cash flows to the embedded derivative or insurance portion of the reserves based on the life-contingent nature of the benefits. We classify these GLB reserves embedded derivatives items in Level 3 within the hierarchy levels described above in “Fair Value Measurement.” We report the insurance portion of the reserves in future contract benefits. The fair value of our indexed annuity contracts is based on their approximate surrender values. Borrowed Funds LNC’s short-term borrowings are defined as borrowings with contractual or expected maturities of one year or less. Long-term borrowings have contractual or expected maturities greater than one year. Deferred Gain on Business Sold Through Reinsurance Our reinsurance operations were acquired by Swiss Re Life & Health America, Inc. (“Swiss Re”) in December 2001 through a series of indemnity reinsurance transactions. We are recognizing the gain related to these transactions at the rate that earnings on the reinsured business are expected to emerge, over a period of 15 years from the date of sale. Contingencies and Commitments Contingencies arising from environmental remediation costs, regulatory judgments, claims, assessments, guarantees, litigation, recourse reserves, fines, penalties and other sources are recorded when deemed probable and reasonably estimable. Fee Income Fee income for investment and interest-sensitive life insurance contracts consist of asset-based fees, cost of insurance charges, percent of premium charges, contract administration charges and surrender charges that are assessed against contract holder account balances. Investment products consist primarily of individual and group variable and fixed deferred annuities. Interest-sensitive life insurance products include UL insurance, VUL insurance and other interest-sensitive life insurance policies. These products include life insurance sold to individuals, corporate-owned life insurance and bank-owned life insurance. In bifurcating the embedded derivative of our GLB features on our variable annuity products, we attribute to the embedded derivative the portion of total fees collected from the contract holder that relate to the GLB riders (the “attributed fees”), which are not reported within fee income on our Consolidated Statements of Comprehensive Income (Loss). These attributed fees represent the present value of future claims expected to be paid for the GLB at the inception of the contract plus a margin that a theoretical market participant would include for risk/profit and are reported within realized gain (loss) on our Consolidated Statements of Comprehensive Income (Loss). The timing of revenue recognition as it relates to fees assessed on investment contracts is determined based on the nature of such fees. Asset-based fees, cost of insurance and contract administration charges are assessed on a daily or monthly basis and recognized as revenue when assessed and earned. Percent of premium charges are assessed at the time of premium payment and recognized as revenue when assessed and earned. Certain amounts assessed that represent compensation for services to be provided in future periods are reported as unearned revenue and recognized in income over the periods benefited. Surrender charges are recognized upon surrender of a contract by the contract holder in accordance with contractual terms. For investment and interest-sensitive life insurance contracts, the amounts collected from contract holders are considered deposits and are not included in revenue.
119
Insurance Premiums Our insurance premiums for traditional life insurance and group insurance products are recognized as revenue when due from the contract holder. Our traditional life insurance products include those products with fixed and guaranteed premiums and benefits and consist primarily of whole life insurance, limited-payment life insurance, term life insurance and certain annuities with life contingencies. Our group non-medical insurance products consist primarily of term life, disability and dental. Net Investment Income Dividends and interest income, recorded in net investment income, are recognized when earned. Amortization of premiums and accretion of discounts on investments in debt securities are reflected in net investment income over the contractual terms of the investments in a manner that produces a constant effective yield. For CLOs and MBS, included in the trading and AFS fixed maturity securities portfolios, we recognize income using a constant effective yield based on anticipated prepayments and the estimated economic life of the securities. When actual prepayments differ significantly from originally anticipated prepayments, the retrospective effective yield is recalculated to reflect actual payments to date and a catch up adjustment is recorded in the current period. In addition, the new effective yield, which reflects anticipated future payments, is used prospectively. Any adjustments resulting from changes in effective yield are reflected in net investment income on our Consolidated Statements of Comprehensive Income (Loss). Realized Gain (Loss) Realized gain (loss) on our Consolidated Statements of Comprehensive Income (Loss) includes realized gains and losses from the sale of investments, write-downs for other-than-temporary impairments of investments, certain derivative and embedded derivative gains and losses, gains and losses on the sale of subsidiaries and businesses and net gains and losses on reinsurance embedded derivatives and trading securities. Realized gains and losses on the sale of investments are determined using the specific identification method. Realized gain (loss) is recognized in net income, net of associated amortization of DAC, VOBA, DSI and DFEL. Realized gain (loss) is also net of allocations of investment gains and losses to certain contract holders and certain funds withheld on reinsurance arrangements for which we have a contractual obligation. Other Revenues Other revenues consists primarily of fees attributable to broker-dealer services recorded as earned at the time of sale, changes in the market value of our seed capital investments, proceeds from reinsurance recaptures and communications sales recognized as earned, net of agency and representative commissions. Interest Credited Interest credited includes interest credited to contract holder account balances. Interest crediting rates associated with funds invested in the general account of LNC’s insurance subsidiaries during 2014 through 2016 ranged from 1% to 10%. Benefits Benefits for UL and other interest-sensitive life insurance products include benefit claims incurred during the period in excess of contract account balances. Benefits also include the change in reserves for life insurance products with secondary guarantee benefits, annuity products with guaranteed death and living benefits and certain annuities with life contingencies. For traditional life, group health and disability income products, benefits are recognized when incurred in a manner consistent with the related premium recognition policies. Strategic Digitization Expense Strategic digitization expense consists primarily of costs related to our enterprise-wide digitization initiative. Pension and Other Postretirement Benefit Plans Pursuant to the accounting rules for our obligations to employees and agents under our various pension and other postretirement benefit plans, we are required to make a number of assumptions to estimate related liabilities and expenses. The mortality assumption is based on actual and anticipated plan experience, determined using acceptable actuarial methods. We use assumptions for the weighted-average discount rate and expected return on plan assets to estimate pension expense. The discount rate assumptions are determined using an analysis of current market information and the projected benefit flows associated with these plans. The expected long-term rate of return on plan assets is based on historical and projected future rates of return on the funds invested in the plan. The calculation of our accumulated postretirement benefit obligation also uses an assumption of weighted-average annual rate of increase in the per capita cost of covered benefits, which reflects a health care cost trend rate.
120
Stock-Based Compensation In general, we expense the fair value of stock awards included in our incentive compensation plans. As of the date our stock awards are approved, the fair value of stock options is determined using a Black-Scholes options valuation methodology, and the fair value of other stock awards is based upon the market value of the stock. The fair value of the awards is expensed over the performance or service period, which generally corresponds to the vesting period, and is recognized as an increase to common stock in stockholders’ equity. We classify certain stock awards as liabilities. For these awards, the settlement value is classified as a liability on our Consolidated Balance Sheets, and the liability is marked-to-market through net income at the end of each reporting period. In accordance with our early adoption of Accounting Standards Update (“ASU”) 2016-09, Improvements to Employee Share-Based Payment Accounting, we have elected to continue applying an estimated forfeiture rate to our accrual of compensation costs. Stock-based compensation expense is reflected in commissions and other expenses on our Consolidated Statements of Comprehensive Income (Loss). Interest and Debt Expense Interest expense on our short-term and long-term debt is recognized as due and any associated premiums, discounts and costs are amortized (accreted) over the term of the related borrowing utilizing the effective interest method. In addition, gains or losses related to certain derivative instruments associated with debt are recognized in interest and debt expense during the period of the change. Income Taxes We file a U.S. consolidated income tax return that includes all of our eligible subsidiaries. Ineligible subsidiaries file separate individual corporate tax returns. Subsidiaries operating outside of the U.S. are taxed, and income tax expense is recorded based on applicable foreign statutes. Deferred income taxes are recognized, based on enacted rates, when assets and liabilities have different values for financial statement and tax reporting purposes. A valuation allowance is recorded to the extent required. Considerable judgment and the use of estimates are required in determining whether a valuation allowance is necessary and, if so, the amount of such valuation allowance. In evaluating the need for a valuation allowance, we consider many factors, including: the nature and character of the deferred tax assets and liabilities; taxable income in prior carryback years; future reversals of temporary differences; the length of time carryovers can be utilized; and any tax planning strategies we would employ to avoid a tax benefit from expiring unused. Discontinued Operations The results of operations of a component of the Company that either has been disposed of or is classified as held-for-sale are reported in income (loss) from discontinued operations, net of federal income taxes, if the disposal represents a strategic shift that has, or will have, a major effect on our consolidated financial condition and results of operations. Foreign Currency Translation The balance sheet accounts and income statement items of foreign subsidiaries, reported in functional currencies other than the U.S. dollar are translated at the current and average exchange rates for the year, respectively. Resulting translation adjustments and other translation adjustments for foreign currency transactions that affect cash flows are reported in AOCI, a component of stockholders’ equity. Earnings Per Share Basic earnings per share (“EPS”) is computed by dividing earnings available to common shareholders by the average common shares outstanding. Diluted EPS is computed assuming the conversion or exercise of dilutive convertible preferred securities, nonvested stock, stock options, performance share units and warrants outstanding during the year. Effective October 1, 2016, we early adopted ASU 2016-09, Improvements to Employee Share-Based Payment Accounting. We have updated certain previously reported interim results and metrics as of January 1, 2016, in accordance with the new guidance. The adoption of this ASU did not have a material effect on our diluted EPS calculation. Our deferred compensation plans allow participants the option to diversify from LNC stock to other investment alternatives. When calculating our weighted-average dilutive shares, we presume the investment option will be settled in cash and exclude these shares from our calculation, unless the effect of settlement in shares would be more dilutive to our diluted EPS calculation. For any period where a loss from continuing operations is experienced, shares used in the diluted EPS calculation represent basic shares because using diluted shares would be anti-dilutive to the calculation.
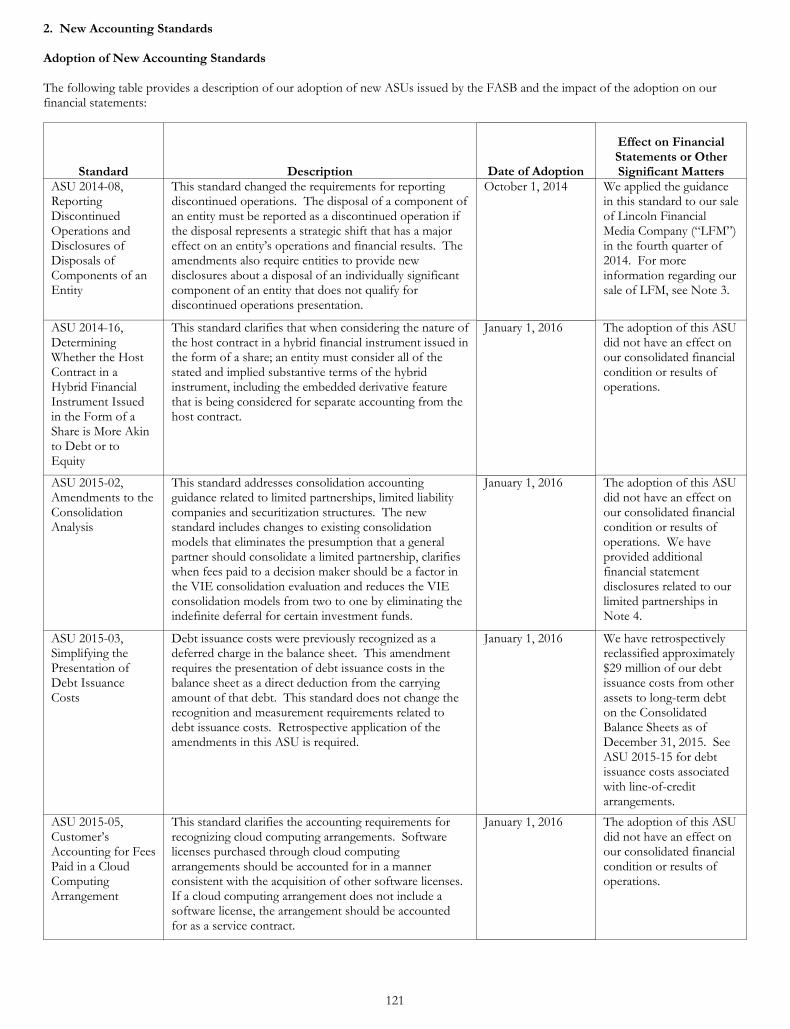
121
2. New Accounting Standards Adoption of New Accounting Standards The following table provides a description of our adoption of new ASUs issued by the FASB and the impact of the adoption on our financial statements:
Standard Description Date of Adoption
Effect on Financial Statements or Other Significant Matters
ASU 2014-08, Reporting Discontinued Operations and Disclosures of Disposals of Components of an Entity
This standard changed the requirements for reporting discontinued operations. The disposal of a component of an entity must be reported as a discontinued operation if the disposal represents a strategic shift that has a major effect on an entity’s operations and financial results. The amendments also require entities to provide new disclosures about a disposal of an individually significant component of an entity that does not qualify for discontinued operations presentation.
October 1, 2014 We applied the guidance in this standard to our sale of Lincoln Financial Media Company (“LFM”) in the fourth quarter of 2014. For more information regarding our sale of LFM, see Note 3.
ASU 2014-16, Determining Whether the Host Contract in a Hybrid Financial Instrument Issued in the Form of a Share is More Akin to Debt or to Equity
This standard clarifies that when considering the nature of the host contract in a hybrid financial instrument issued in the form of a share; an entity must consider all of the stated and implied substantive terms of the hybrid instrument, including the embedded derivative feature that is being considered for separate accounting from the host contract.
January 1, 2016 The adoption of this ASU did not have an effect on our consolidated financial condition or results of operations.
ASU 2015-02, Amendments to the Consolidation Analysis
This standard addresses consolidation accounting guidance related to limited partnerships, limited liability companies and securitization structures. The new standard includes changes to existing consolidation models that eliminates the presumption that a general partner should consolidate a limited partnership, clarifies when fees paid to a decision maker should be a factor in the VIE consolidation evaluation and reduces the VIE consolidation models from two to one by eliminating the indefinite deferral for certain investment funds.
January 1, 2016 The adoption of this ASU did not have an effect on our consolidated financial condition or results of operations. We have provided additional financial statement disclosures related to our limited partnerships in Note 4.
ASU 2015-03, Simplifying the Presentation of Debt Issuance Costs
Debt issuance costs were previously recognized as a deferred charge in the balance sheet. This amendment requires the presentation of debt issuance costs in the balance sheet as a direct deduction from the carrying amount of that debt. This standard does not change the recognition and measurement requirements related to debt issuance costs. Retrospective application of the amendments in this ASU is required.
January 1, 2016 We have retrospectively reclassified approximately $29 million of our debt issuance costs from other assets to long-term debt on the Consolidated Balance Sheets as of December 31, 2015. See ASU 2015-15 for debt issuance costs associated with line-of-credit arrangements.
ASU 2015-05, Customer’s Accounting for Fees Paid in a Cloud Computing Arrangement
This standard clarifies the accounting requirements for recognizing cloud computing arrangements. Software licenses purchased through cloud computing arrangements should be accounted for in a manner consistent with the acquisition of other software licenses. If a cloud computing arrangement does not include a software license, the arrangement should be accounted for as a service contract.
January 1, 2016 The adoption of this ASU did not have an effect on our consolidated financial condition or results of operations.
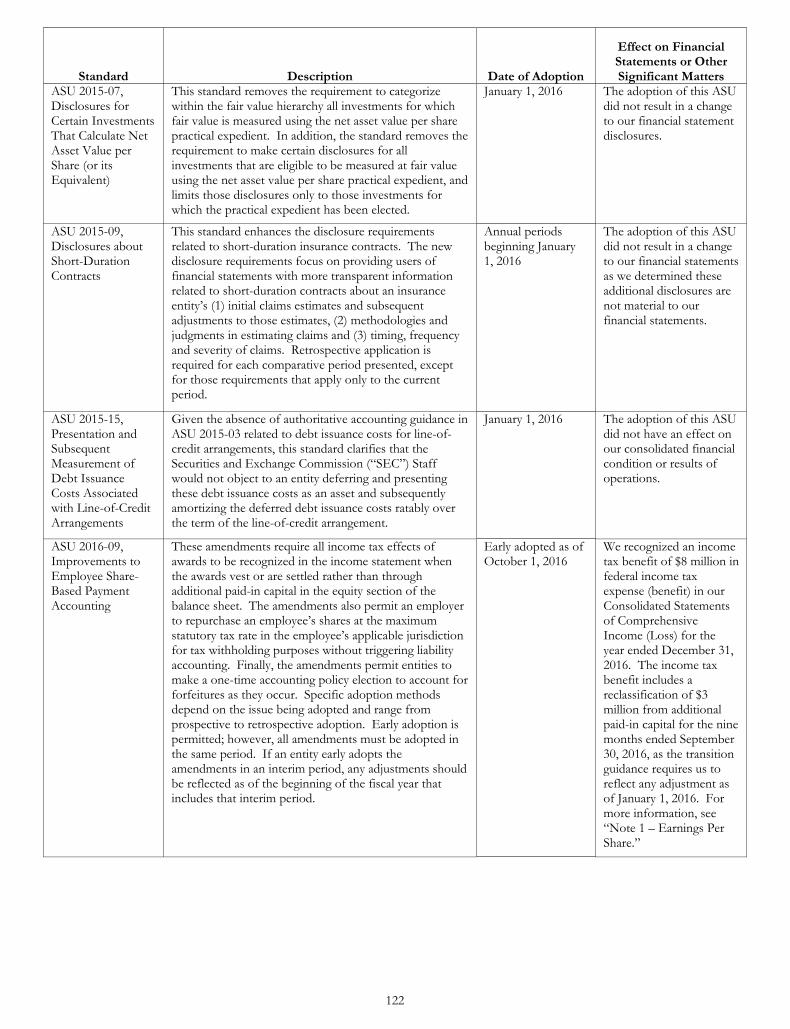
122
Standard Description Date of Adoption
Effect on Financial Statements or Other Significant Matters
ASU 2015-07, Disclosures for Certain Investments That Calculate Net Asset Value per Share (or its Equivalent)
This standard removes the requirement to categorize within the fair value hierarchy all investments for which fair value is measured using the net asset value per share practical expedient. In addition, the standard removes the requirement to make certain disclosures for all investments that are eligible to be measured at fair value using the net asset value per share practical expedient, and limits those disclosures only to those investments for which the practical expedient has been elected.
January 1, 2016 The adoption of this ASU did not result in a change to our financial statement disclosures.
ASU 2015-09, Disclosures about Short-Duration Contracts
This standard enhances the disclosure requirements related to short-duration insurance contracts. The new disclosure requirements focus on providing users of financial statements with more transparent information related to short-duration contracts about an insurance entity’s (1) initial claims estimates and subsequent adjustments to those estimates, (2) methodologies and judgments in estimating claims and (3) timing, frequency and severity of claims. Retrospective application is required for each comparative period presented, except for those requirements that apply only to the current period.
Annual periods beginning January 1, 2016
The adoption of this ASU did not result in a change to our financial statements as we determined these additional disclosures are not material to our financial statements.
ASU 2015-15, Presentation and Subsequent Measurement of Debt Issuance Costs Associated with Line-of-Credit Arrangements
Given the absence of authoritative accounting guidance in ASU 2015-03 related to debt issuance costs for line-of-credit arrangements, this standard clarifies that the Securities and Exchange Commission (“SEC”) Staff would not object to an entity deferring and presenting these debt issuance costs as an asset and subsequently amortizing the deferred debt issuance costs ratably over the term of the line-of-credit arrangement.
January 1, 2016 The adoption of this ASU did not have an effect on our consolidated financial condition or results of operations.
ASU 2016-09, Improvements to Employee Share-Based Payment Accounting
These amendments require all income tax effects of awards to be recognized in the income statement when the awards vest or are settled rather than through additional paid-in capital in the equity section of the balance sheet. The amendments also permit an employer to repurchase an employee’s shares at the maximum statutory tax rate in the employee’s applicable jurisdiction for tax withholding purposes without triggering liability accounting. Finally, the amendments permit entities to make a one-time accounting policy election to account for forfeitures as they occur. Specific adoption methods depend on the issue being adopted and range from prospective to retrospective adoption. Early adoption is permitted; however, all amendments must be adopted in the same period. If an entity early adopts the amendments in an interim period, any adjustments should be reflected as of the beginning of the fiscal year that includes that interim period.
Early adopted as of October 1, 2016
We recognized an income tax benefit of $8 million in federal income tax expense (benefit) in our Consolidated Statements of Comprehensive Income (Loss) for the year ended December 31, 2016. The income tax benefit includes a reclassification of $3 million from additional paid-in capital for the nine months ended September 30, 2016, as the transition guidance requires us to reflect any adjustment as of January 1, 2016. For more information, see “Note 1 – Earnings Per Share.”
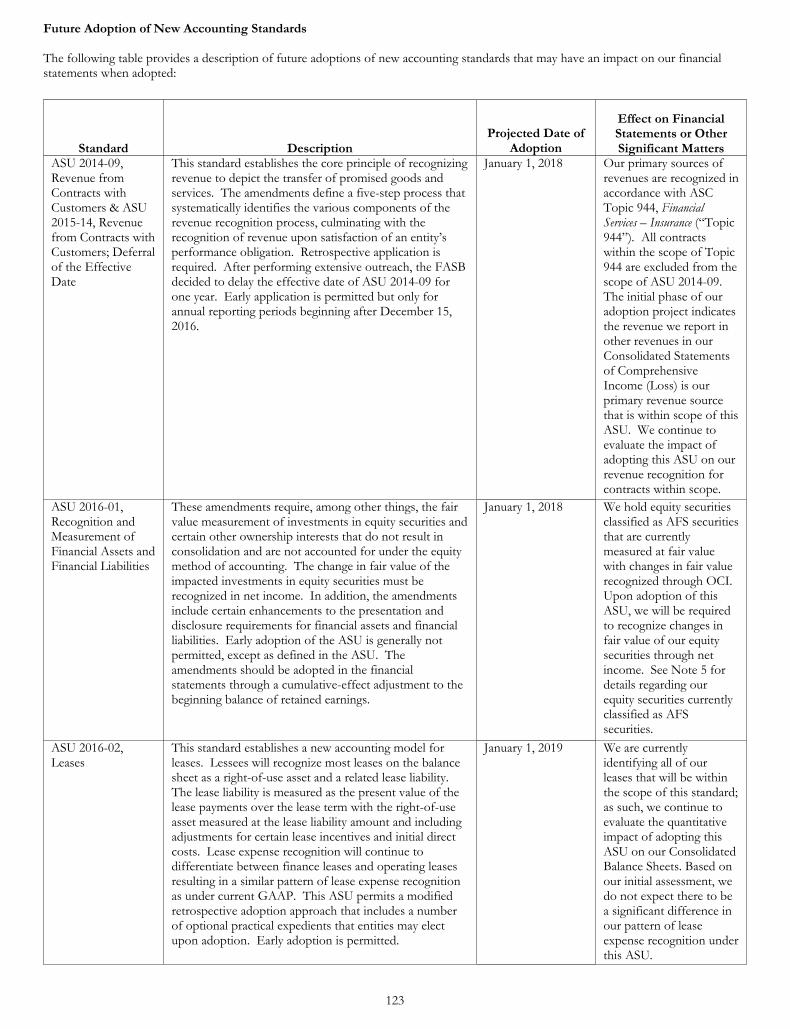
123
Future Adoption of New Accounting Standards The following table provides a description of future adoptions of new accounting standards that may have an impact on our financial statements when adopted:
Standard Description Projected Date of
Adoption
Effect on Financial Statements or Other Significant Matters
ASU 2014-09, Revenue from Contracts with Customers & ASU 2015-14, Revenue from Contracts with Customers; Deferral of the Effective Date
This standard establishes the core principle of recognizing revenue to depict the transfer of promised goods and services. The amendments define a five-step process that systematically identifies the various components of the revenue recognition process, culminating with the recognition of revenue upon satisfaction of an entity’s performance obligation. Retrospective application is required. After performing extensive outreach, the FASB decided to delay the effective date of ASU 2014-09 for one year. Early application is permitted but only for annual reporting periods beginning after December 15, 2016.
January 1, 2018 Our primary sources of revenues are recognized in accordance with ASC Topic 944, Financial Services – Insurance (“Topic 944”). All contracts within the scope of Topic 944 are excluded from the scope of ASU 2014-09. The initial phase of our adoption project indicates the revenue we report in other revenues in our Consolidated Statements of Comprehensive Income (Loss) is our primary revenue source that is within scope of this ASU. We continue to evaluate the impact of adopting this ASU on our revenue recognition for contracts within scope.
ASU 2016-01, Recognition and Measurement of Financial Assets and Financial Liabilities
These amendments require, among other things, the fair value measurement of investments in equity securities and certain other ownership interests that do not result in consolidation and are not accounted for under the equity method of accounting. The change in fair value of the impacted investments in equity securities must be recognized in net income. In addition, the amendments include certain enhancements to the presentation and disclosure requirements for financial assets and financial liabilities. Early adoption of the ASU is generally not permitted, except as defined in the ASU. The amendments should be adopted in the financial statements through a cumulative-effect adjustment to the beginning balance of retained earnings.
January 1, 2018 We hold equity securities classified as AFS securities that are currently measured at fair value with changes in fair value recognized through OCI. Upon adoption of this ASU, we will be required to recognize changes in fair value of our equity securities through net income. See Note 5 for details regarding our equity securities currently classified as AFS securities.
ASU 2016-02, Leases
This standard establishes a new accounting model for leases. Lessees will recognize most leases on the balance sheet as a right-of-use asset and a related lease liability. The lease liability is measured as the present value of the lease payments over the lease term with the right-of-use asset measured at the lease liability amount and including adjustments for certain lease incentives and initial direct costs. Lease expense recognition will continue to differentiate between finance leases and operating leases resulting in a similar pattern of lease expense recognition as under current GAAP. This ASU permits a modified retrospective adoption approach that includes a number of optional practical expedients that entities may elect upon adoption. Early adoption is permitted.
January 1, 2019 We are currently identifying all of our leases that will be within the scope of this standard; as such, we continue to evaluate the quantitative impact of adopting this ASU on our Consolidated Balance Sheets. Based on our initial assessment, we do not expect there to be a significant difference in our pattern of lease expense recognition under this ASU.
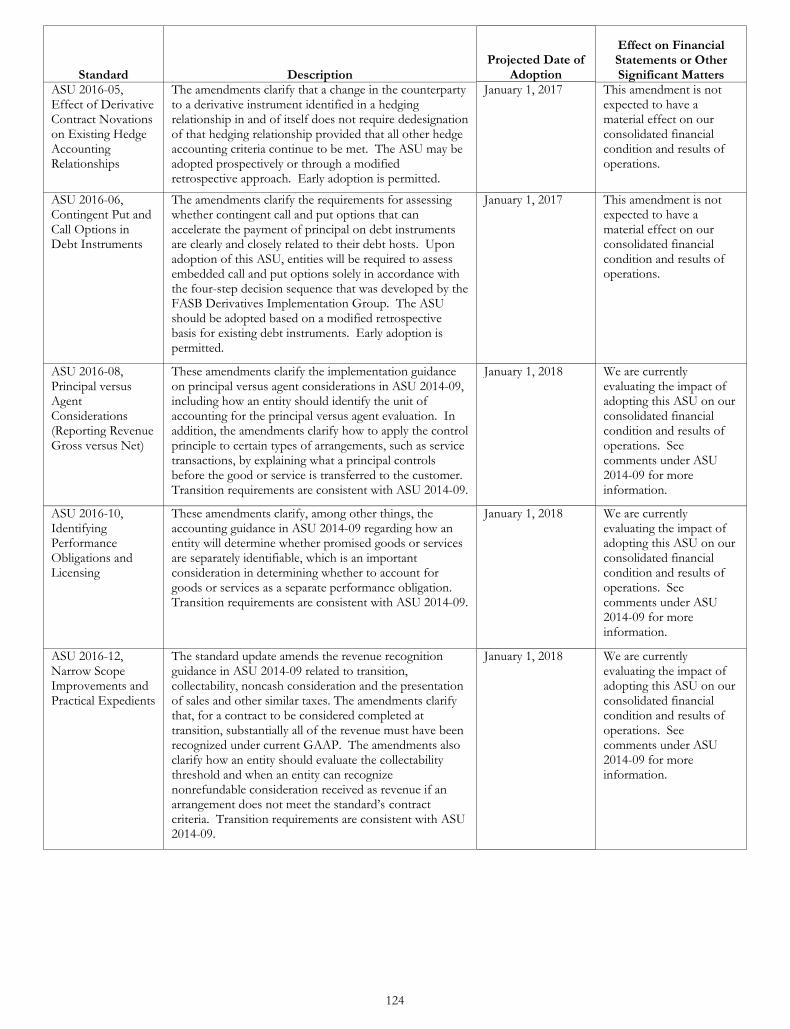
124
Standard Description Projected Date of
Adoption
Effect on Financial Statements or Other Significant Matters
ASU 2016-05, Effect of Derivative Contract Novations on Existing Hedge Accounting Relationships
The amendments clarify that a change in the counterparty to a derivative instrument identified in a hedging relationship in and of itself does not require dedesignation of that hedging relationship provided that all other hedge accounting criteria continue to be met. The ASU may be adopted prospectively or through a modified retrospective approach. Early adoption is permitted.
January 1, 2017 This amendment is not expected to have a material effect on our consolidated financial condition and results of operations.
ASU 2016-06, Contingent Put and Call Options in Debt Instruments
The amendments clarify the requirements for assessing whether contingent call and put options that can accelerate the payment of principal on debt instruments are clearly and closely related to their debt hosts. Upon adoption of this ASU, entities will be required to assess embedded call and put options solely in accordance with the four-step decision sequence that was developed by the FASB Derivatives Implementation Group. The ASU should be adopted based on a modified retrospective basis for existing debt instruments. Early adoption is permitted.
January 1, 2017 This amendment is not expected to have a material effect on our consolidated financial condition and results of operations.
ASU 2016-08, Principal versus Agent Considerations (Reporting Revenue Gross versus Net)
These amendments clarify the implementation guidance on principal versus agent considerations in ASU 2014-09, including how an entity should identify the unit of accounting for the principal versus agent evaluation. In addition, the amendments clarify how to apply the control principle to certain types of arrangements, such as service transactions, by explaining what a principal controls before the good or service is transferred to the customer. Transition requirements are consistent with ASU 2014-09.
January 1, 2018 We are currently evaluating the impact of adopting this ASU on our consolidated financial condition and results of operations. See comments under ASU 2014-09 for more information.
ASU 2016-10, Identifying Performance Obligations and Licensing
These amendments clarify, among other things, the accounting guidance in ASU 2014-09 regarding how an entity will determine whether promised goods or services are separately identifiable, which is an important consideration in determining whether to account for goods or services as a separate performance obligation. Transition requirements are consistent with ASU 2014-09.
January 1, 2018 We are currently evaluating the impact of adopting this ASU on our consolidated financial condition and results of operations. See comments under ASU 2014-09 for more information.
ASU 2016-12, Narrow Scope Improvements and Practical Expedients
The standard update amends the revenue recognition guidance in ASU 2014-09 related to transition, collectability, noncash consideration and the presentation of sales and other similar taxes. The amendments clarify that, for a contract to be considered completed at transition, substantially all of the revenue must have been recognized under current GAAP. The amendments also clarify how an entity should evaluate the collectability threshold and when an entity can recognize nonrefundable consideration received as revenue if an arrangement does not meet the standard’s contract criteria. Transition requirements are consistent with ASU 2014-09.
January 1, 2018 We are currently evaluating the impact of adopting this ASU on our consolidated financial condition and results of operations. See comments under ASU 2014-09 for more information.
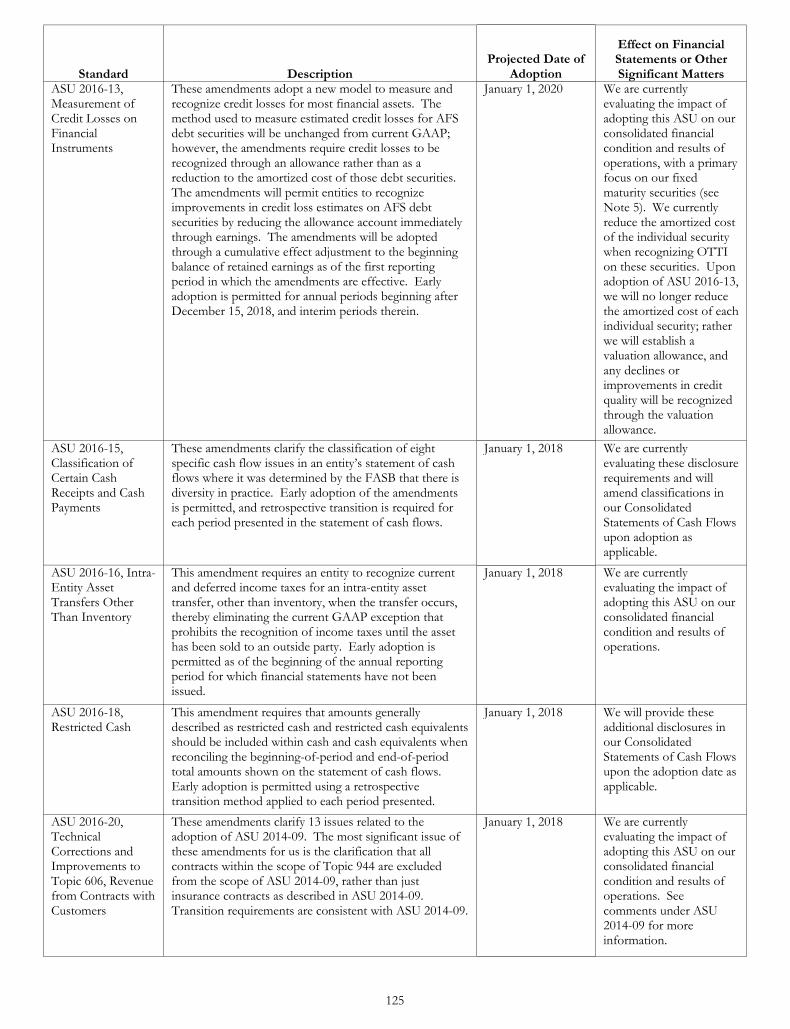
125
Standard Description Projected Date of
Adoption
Effect on Financial Statements or Other Significant Matters
ASU 2016-13, Measurement of Credit Losses on Financial Instruments
These amendments adopt a new model to measure and recognize credit losses for most financial assets. The method used to measure estimated credit losses for AFS debt securities will be unchanged from current GAAP; however, the amendments require credit losses to be recognized through an allowance rather than as a reduction to the amortized cost of those debt securities. The amendments will permit entities to recognize improvements in credit loss estimates on AFS debt securities by reducing the allowance account immediately through earnings. The amendments will be adopted through a cumulative effect adjustment to the beginning balance of retained earnings as of the first reporting period in which the amendments are effective. Early adoption is permitted for annual periods beginning after December 15, 2018, and interim periods therein.
January 1, 2020 We are currently evaluating the impact of adopting this ASU on our consolidated financial condition and results of operations, with a primary focus on our fixed maturity securities (see Note 5). We currently reduce the amortized cost of the individual security when recognizing OTTI on these securities. Upon adoption of ASU 2016-13, we will no longer reduce the amortized cost of each individual security; rather we will establish a valuation allowance, and any declines or improvements in credit quality will be recognized through the valuation allowance.
ASU 2016-15, Classification of Certain Cash Receipts and Cash Payments
These amendments clarify the classification of eight specific cash flow issues in an entity’s statement of cash flows where it was determined by the FASB that there is diversity in practice. Early adoption of the amendments is permitted, and retrospective transition is required for each period presented in the statement of cash flows.
January 1, 2018 We are currently evaluating these disclosure requirements and will amend classifications in our Consolidated Statements of Cash Flows upon adoption as applicable.
ASU 2016-16, Intra-Entity Asset Transfers Other Than Inventory
This amendment requires an entity to recognize current and deferred income taxes for an intra-entity asset transfer, other than inventory, when the transfer occurs, thereby eliminating the current GAAP exception that prohibits the recognition of income taxes until the asset has been sold to an outside party. Early adoption is permitted as of the beginning of the annual reporting period for which financial statements have not been issued.
January 1, 2018 We are currently evaluating the impact of adopting this ASU on our consolidated financial condition and results of operations.
ASU 2016-18, Restricted Cash
This amendment requires that amounts generally described as restricted cash and restricted cash equivalents should be included within cash and cash equivalents when reconciling the beginning-of-period and end-of-period total amounts shown on the statement of cash flows. Early adoption is permitted using a retrospective transition method applied to each period presented.
January 1, 2018 We will provide these additional disclosures in our Consolidated Statements of Cash Flows upon the adoption date as applicable.
ASU 2016-20, Technical Corrections and Improvements to Topic 606, Revenue from Contracts with Customers
These amendments clarify 13 issues related to the adoption of ASU 2014-09. The most significant issue of these amendments for us is the clarification that all contracts within the scope of Topic 944 are excluded from the scope of ASU 2014-09, rather than just insurance contracts as described in ASU 2014-09. Transition requirements are consistent with ASU 2014-09.
January 1, 2018 We are currently evaluating the impact of adopting this ASU on our consolidated financial condition and results of operations. See comments under ASU 2014-09 for more information.
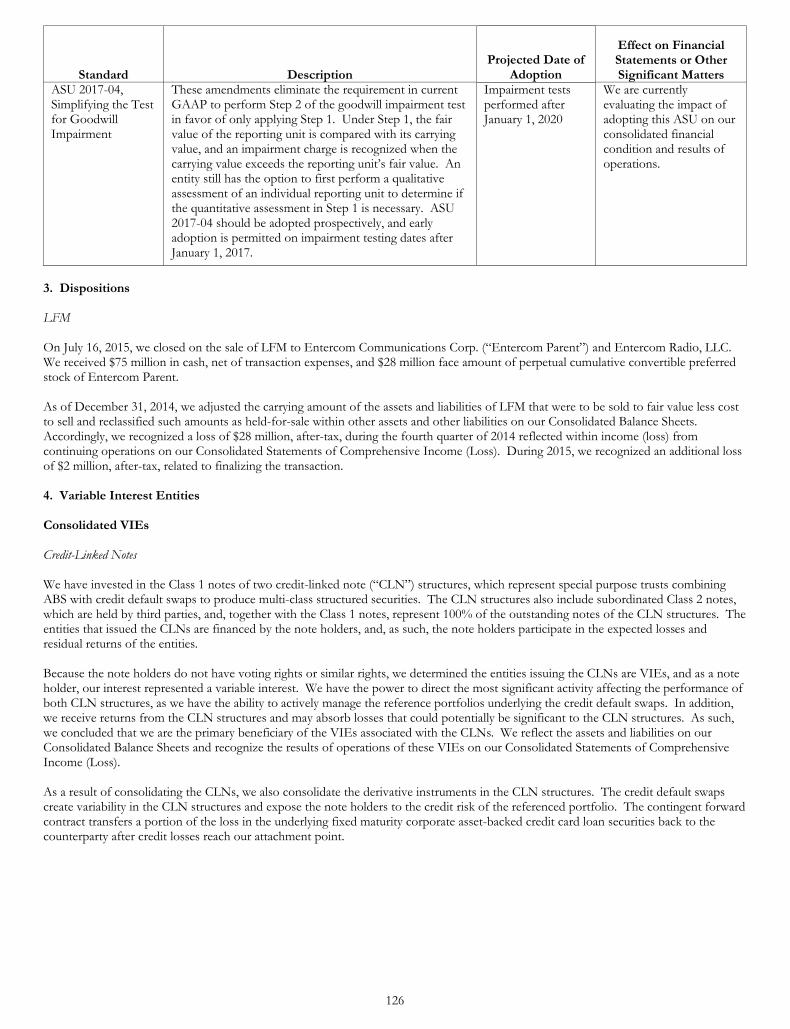
126
Standard Description Projected Date of
Adoption
Effect on Financial Statements or Other Significant Matters
ASU 2017-04, Simplifying the Test for Goodwill Impairment
These amendments eliminate the requirement in current GAAP to perform Step 2 of the goodwill impairment test in favor of only applying Step 1. Under Step 1, the fair value of the reporting unit is compared with its carrying value, and an impairment charge is recognized when the carrying value exceeds the reporting unit’s fair value. An entity still has the option to first perform a qualitative assessment of an individual reporting unit to determine if the quantitative assessment in Step 1 is necessary. ASU 2017-04 should be adopted prospectively, and early adoption is permitted on impairment testing dates after January 1, 2017.
Impairment tests performed after January 1, 2020
We are currently evaluating the impact of adopting this ASU on our consolidated financial condition and results of operations.
3. Dispositions LFM On July 16, 2015, we closed on the sale of LFM to Entercom Communications Corp. (“Entercom Parent”) and Entercom Radio, LLC. We received $75 million in cash, net of transaction expenses, and $28 million face amount of perpetual cumulative convertible preferred stock of Entercom Parent. As of December 31, 2014, we adjusted the carrying amount of the assets and liabilities of LFM that were to be sold to fair value less cost to sell and reclassified such amounts as held-for-sale within other assets and other liabilities on our Consolidated Balance Sheets. Accordingly, we recognized a loss of $28 million, after-tax, during the fourth quarter of 2014 reflected within income (loss) from continuing operations on our Consolidated Statements of Comprehensive Income (Loss). During 2015, we recognized an additional loss of $2 million, after-tax, related to finalizing the transaction. 4. Variable Interest Entities Consolidated VIEs Credit-Linked Notes We have invested in the Class 1 notes of two credit-linked note (“CLN”) structures, which represent special purpose trusts combining ABS with credit default swaps to produce multi-class structured securities. The CLN structures also include subordinated Class 2 notes, which are held by third parties, and, together with the Class 1 notes, represent 100% of the outstanding notes of the CLN structures. The entities that issued the CLNs are financed by the note holders, and, as such, the note holders participate in the expected losses and residual returns of the entities. Because the note holders do not have voting rights or similar rights, we determined the entities issuing the CLNs are VIEs, and as a note holder, our interest represented a variable interest. We have the power to direct the most significant activity affecting the performance of both CLN structures, as we have the ability to actively manage the reference portfolios underlying the credit default swaps. In addition, we receive returns from the CLN structures and may absorb losses that could potentially be significant to the CLN structures. As such, we concluded that we are the primary beneficiary of the VIEs associated with the CLNs. We reflect the assets and liabilities on our Consolidated Balance Sheets and recognize the results of operations of these VIEs on our Consolidated Statements of Comprehensive Income (Loss). As a result of consolidating the CLNs, we also consolidate the derivative instruments in the CLN structures. The credit default swaps create variability in the CLN structures and expose the note holders to the credit risk of the referenced portfolio. The contingent forward contract transfers a portion of the loss in the underlying fixed maturity corporate asset-backed credit card loan securities back to the counterparty after credit losses reach our attachment point.
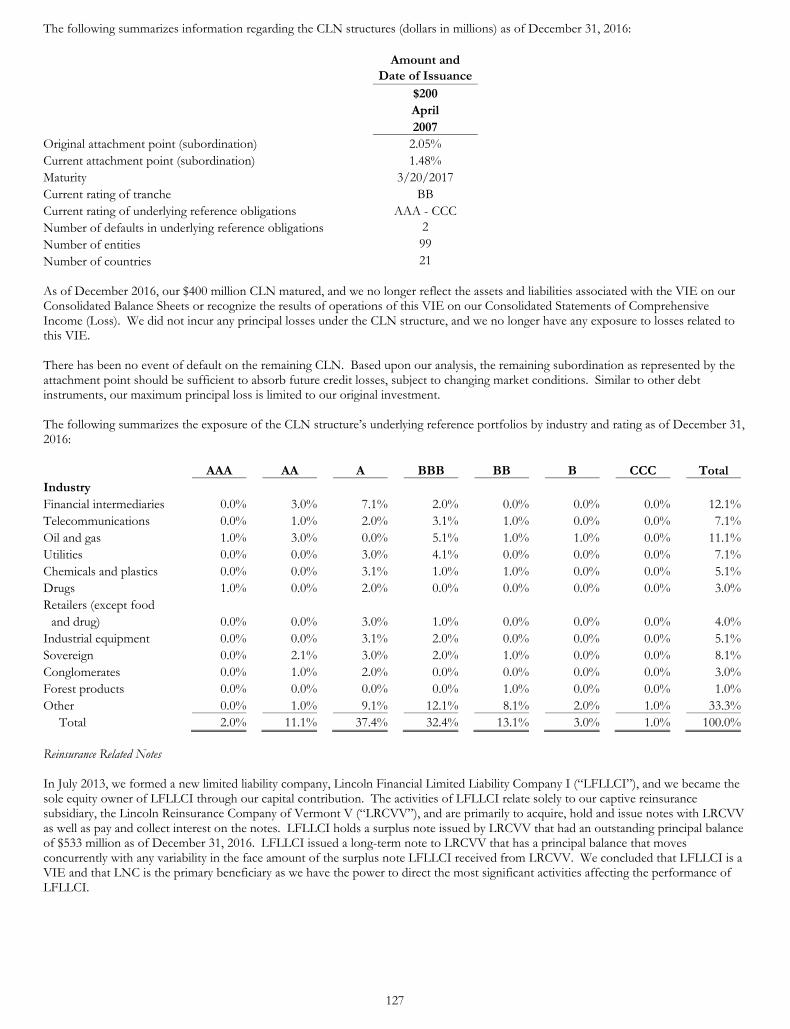
127
The following summarizes information regarding the CLN structures (dollars in millions) as of December 31, 2016:
Amount and Date of Issuance $200 April 2007 Original attachment point (subordination) 2.05% Current attachment point (subordination) 1.48% Maturity 3/20/2017 Current rating of tranche BB Current rating of underlying reference obligations AAA - CCC Number of defaults in underlying reference obligations 2 Number of entities 99 Number of countries 21 As of December 2016, our $400 million CLN matured, and we no longer reflect the assets and liabilities associated with the VIE on our Consolidated Balance Sheets or recognize the results of operations of this VIE on our Consolidated Statements of Comprehensive Income (Loss). We did not incur any principal losses under the CLN structure, and we no longer have any exposure to losses related to this VIE. There has been no event of default on the remaining CLN. Based upon our analysis, the remaining subordination as represented by the attachment point should be sufficient to absorb future credit losses, subject to changing market conditions. Similar to other debt instruments, our maximum principal loss is limited to our original investment. The following summarizes the exposure of the CLN structure’s underlying reference portfolios by industry and rating as of December 31, 2016:
AAA AA A BBB BB B CCC Total Industry Financial intermediaries 0.0% 3.0% 7.1% 2.0% 0.0% 0.0% 0.0% 12.1%Telecommunications 0.0% 1.0% 2.0% 3.1% 1.0% 0.0% 0.0% 7.1%Oil and gas 1.0% 3.0% 0.0% 5.1% 1.0% 1.0% 0.0% 11.1%Utilities 0.0% 0.0% 3.0% 4.1% 0.0% 0.0% 0.0% 7.1%Chemicals and plastics 0.0% 0.0% 3.1% 1.0% 1.0% 0.0% 0.0% 5.1%Drugs 1.0% 0.0% 2.0% 0.0% 0.0% 0.0% 0.0% 3.0%Retailers (except food
and drug) 0.0% 0.0% 3.0% 1.0% 0.0% 0.0% 0.0% 4.0%Industrial equipment 0.0% 0.0% 3.1% 2.0% 0.0% 0.0% 0.0% 5.1%Sovereign 0.0% 2.1% 3.0% 2.0% 1.0% 0.0% 0.0% 8.1%Conglomerates 0.0% 1.0% 2.0% 0.0% 0.0% 0.0% 0.0% 3.0%Forest products 0.0% 0.0% 0.0% 0.0% 1.0% 0.0% 0.0% 1.0%Other 0.0% 1.0% 9.1% 12.1% 8.1% 2.0% 1.0% 33.3%
Total 2.0% 11.1% 37.4% 32.4% 13.1% 3.0% 1.0% 100.0% Reinsurance Related Notes In July 2013, we formed a new limited liability company, Lincoln Financial Limited Liability Company I (“LFLLCI”), and we became the sole equity owner of LFLLCI through our capital contribution. The activities of LFLLCI relate solely to our captive reinsurance subsidiary, the Lincoln Reinsurance Company of Vermont V (“LRCVV”), and are primarily to acquire, hold and issue notes with LRCVV as well as pay and collect interest on the notes. LFLLCI holds a surplus note issued by LRCVV that had an outstanding principal balance of $533 million as of December 31, 2016. LFLLCI issued a long-term note to LRCVV that has a principal balance that moves concurrently with any variability in the face amount of the surplus note LFLLCI received from LRCVV. We concluded that LFLLCI is a VIE and that LNC is the primary beneficiary as we have the power to direct the most significant activities affecting the performance of LFLLCI.
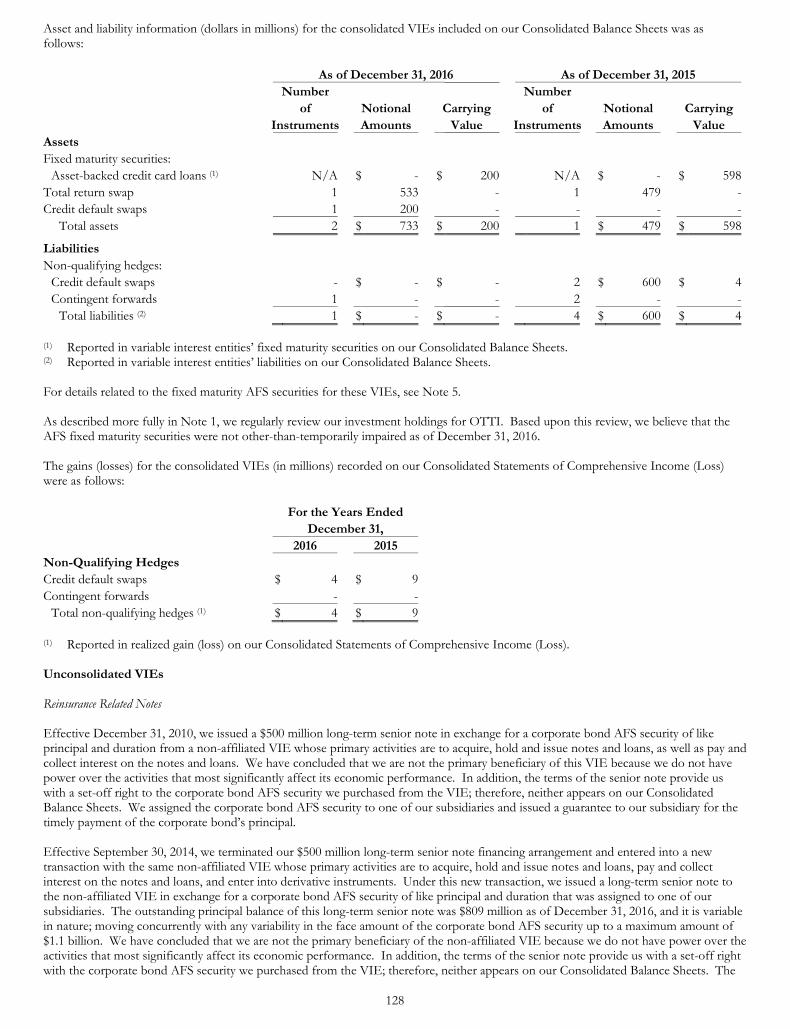
128
Asset and liability information (dollars in millions) for the consolidated VIEs included on our Consolidated Balance Sheets was as follows:
As of December 31, 2016 As of December 31, 2015 Number Number of Notional Carrying of Notional Carrying Instruments Amounts Value Instruments Amounts Value Assets Fixed maturity securities:
Asset-backed credit card loans (1) N/A $ - $ 200 N/A $ - $ 598Total return swap 1 533 - 1 479 -Credit default swaps 1 200 - - - -
Total assets 2 $ 733 $ 200 1 $ 479 $ 598
Liabilities Non-qualifying hedges:
Credit default swaps - $ - $ - 2 $ 600 $ 4Contingent forwards 1 - - 2 - -
Total liabilities (2) 1 $ - $ - 4 $ 600 $ 4 (1) Reported in variable interest entities’ fixed maturity securities on our Consolidated Balance Sheets. (2) Reported in variable interest entities’ liabilities on our Consolidated Balance Sheets. For details related to the fixed maturity AFS securities for these VIEs, see Note 5. As described more fully in Note 1, we regularly review our investment holdings for OTTI. Based upon this review, we believe that the AFS fixed maturity securities were not other-than-temporarily impaired as of December 31, 2016. The gains (losses) for the consolidated VIEs (in millions) recorded on our Consolidated Statements of Comprehensive Income (Loss) were as follows:
For the Years Ended
December 31, 2016 2015 Non-Qualifying Hedges Credit default swaps $ 4 $ 9 Contingent forwards - -
Total non-qualifying hedges (1) $ 4 $ 9 (1) Reported in realized gain (loss) on our Consolidated Statements of Comprehensive Income (Loss). Unconsolidated VIEs Reinsurance Related Notes Effective December 31, 2010, we issued a $500 million long-term senior note in exchange for a corporate bond AFS security of like principal and duration from a non-affiliated VIE whose primary activities are to acquire, hold and issue notes and loans, as well as pay and collect interest on the notes and loans. We have concluded that we are not the primary beneficiary of this VIE because we do not have power over the activities that most significantly affect its economic performance. In addition, the terms of the senior note provide us with a set-off right to the corporate bond AFS security we purchased from the VIE; therefore, neither appears on our Consolidated Balance Sheets. We assigned the corporate bond AFS security to one of our subsidiaries and issued a guarantee to our subsidiary for the timely payment of the corporate bond’s principal. Effective September 30, 2014, we terminated our $500 million long-term senior note financing arrangement and entered into a new transaction with the same non-affiliated VIE whose primary activities are to acquire, hold and issue notes and loans, pay and collect interest on the notes and loans, and enter into derivative instruments. Under this new transaction, we issued a long-term senior note to the non-affiliated VIE in exchange for a corporate bond AFS security of like principal and duration that was assigned to one of our subsidiaries. The outstanding principal balance of this long-term senior note was $809 million as of December 31, 2016, and it is variable in nature; moving concurrently with any variability in the face amount of the corporate bond AFS security up to a maximum amount of $1.1 billion. We have concluded that we are not the primary beneficiary of the non-affiliated VIE because we do not have power over the activities that most significantly affect its economic performance. In addition, the terms of the senior note provide us with a set-off right with the corporate bond AFS security we purchased from the VIE; therefore, neither appears on our Consolidated Balance Sheets. The
129
VIE has entered into a total return swap with an unaffiliated third-party that supports any necessary principal funding of the corporate bond AFS security required by our subsidiaries while the security is outstanding. Effective October 1, 2015, our captive reinsurance subsidiary, the Lincoln Reinsurance Company of Vermont VI, issued a long-term surplus note for $275 million to a non-affiliated VIE in exchange for two corporate bond AFS securities of like principal and duration. The activities of the VIE are primarily to acquire, hold and issue notes and loans and to pay and collect interest on the notes and loans. The outstanding principal balance of the long-term surplus note was $474 million as of December 31, 2016, and is variable in nature; moving concurrently with any variability in the face amount of the corporate bond AFS securities. We have concluded that we are not the primary beneficiary of the non-affiliated VIE because we do not have power over the activities that most significantly affect its economic performance. In addition, the terms of the long-term surplus note provide us with a set-off right with the corporate bond AFS securities we purchased from the VIE; therefore, neither appears on our Consolidated Balance Sheets. Structured Securities Through our investment activities, we make passive investments in structured securities issued by VIEs for which we are not the manager. These structured securities include our RMBS, CMBS, CLOs and CDOs. We have not provided financial or other support with respect to these VIEs other than our original investment. We have determined that we are not the primary beneficiary of these VIEs due to the relative size of our investment in comparison to the principal amount of the structured securities issued by the VIEs and the level of credit subordination that reduces our obligation to absorb losses or right to receive benefits. Our maximum exposure to loss on these structured securities is limited to the amortized cost for these investments. We recognize our variable interest in these VIEs at fair value on our Consolidated Balance Sheets. For information about these structured securities, see Note 5. Limited Partnerships and Limited Liability Companies We invest in certain LPs and limited liability companies (“LLCs”), including qualified affordable housing projects, that we have concluded are VIEs. We do not hold any substantive kick-out or participation rights in the LPs and LLCs, and we do not receive any performance fees or decision maker fees from the LPs and LLCs. Based on our analysis of the LPs and LLCs, we are not the primary beneficiary of the VIEs as we do not have the power to direct the most significant activities of the LPs and LLCs. The carrying amounts of our investments in the LPs and LLCs are recognized in other investments on our Consolidated Balance Sheets and were $1.3 billion and $1.2 billion as of December 31, 2016 and 2015, respectively. Included in these carrying amounts are our investments in qualified affordable housing projects, which were $37 million and $47 million as of December 31, 2016 and 2015, respectively. We do not have any contingent commitments to provide additional capital funding to these qualified affordable housing projects. We receive returns from these qualified affordable housing projects in the form of income tax credits and other tax benefits, which are recognized in federal income tax expense (benefit) on our Consolidated Statements of Comprehensive Income (Loss) and were $3 million and less than $1 million for the years ended December 31, 2016 and 2015, respectively. Our exposure to loss is limited to the capital we invest in the LPs and LLCs, and there have been no indicators of impairment that would require us to recognize an impairment loss related to the LPs and LLCs as of December 31, 2016. 5. Investments AFS Securities Pursuant to the Fair Value Measurements and Disclosures Topic of the FASB ASC, we have categorized AFS securities into a three-level hierarchy, based on the priority of the inputs to the respective valuation technique. The fair value hierarchy gives the highest priority to quoted prices in active markets for identical assets or liabilities (Level 1) and the lowest priority to unobservable inputs (Level 3), as described in Note 1, which also includes additional disclosures regarding our fair value measurements.
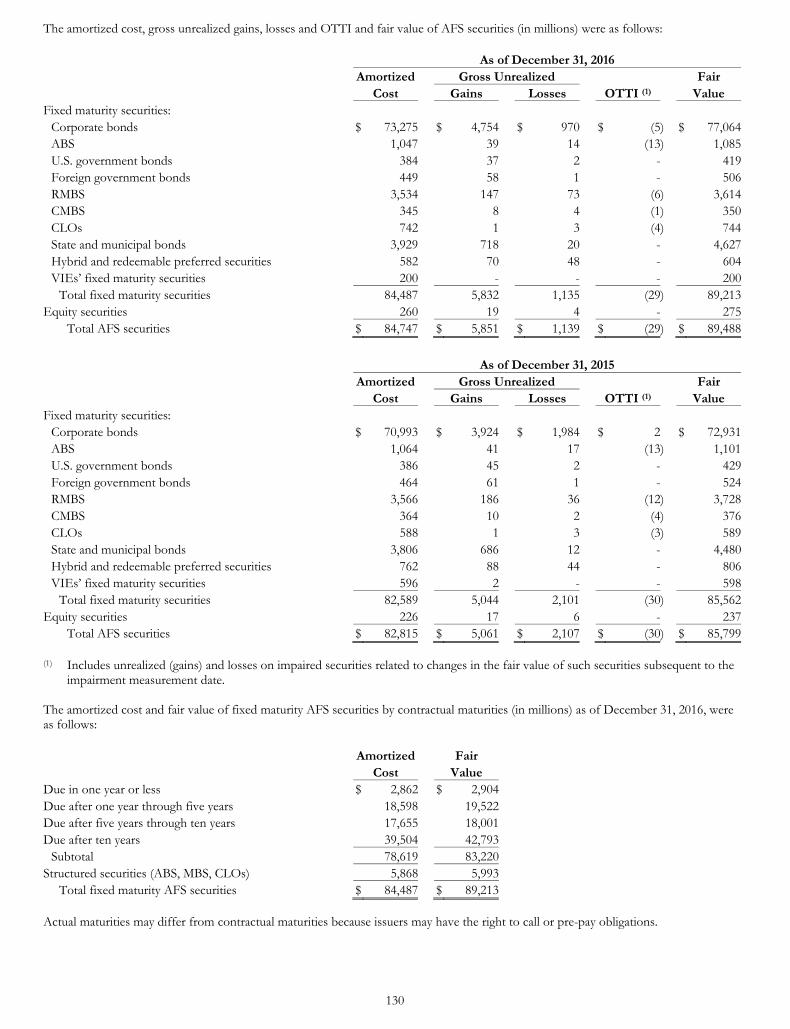
130
The amortized cost, gross unrealized gains, losses and OTTI and fair value of AFS securities (in millions) were as follows:
As of December 31, 2016 Amortized Gross Unrealized Fair Cost Gains Losses OTTI (1) Value Fixed maturity securities:
Corporate bonds $ 73,275 $ 4,754 $ 970 $ (5) $ 77,064ABS 1,047 39 14 (13) 1,085U.S. government bonds 384 37 2 - 419Foreign government bonds 449 58 1 - 506RMBS 3,534 147 73 (6) 3,614CMBS 345 8 4 (1) 350CLOs 742 1 3 (4) 744State and municipal bonds 3,929 718 20 - 4,627Hybrid and redeemable preferred securities 582 70 48 - 604VIEs’ fixed maturity securities 200 - - - 200
Total fixed maturity securities 84,487 5,832 1,135 (29) 89,213Equity securities 260 19 4 - 275
Total AFS securities $ 84,747 $ 5,851 $ 1,139 $ (29) $ 89,488
As of December 31, 2015 Amortized Gross Unrealized Fair Cost Gains Losses OTTI (1) Value Fixed maturity securities:
Corporate bonds $ 70,993 $ 3,924 $ 1,984 $ 2 $ 72,931ABS 1,064 41 17 (13) 1,101U.S. government bonds 386 45 2 - 429Foreign government bonds 464 61 1 - 524RMBS 3,566 186 36 (12) 3,728CMBS 364 10 2 (4) 376CLOs 588 1 3 (3) 589State and municipal bonds 3,806 686 12 - 4,480Hybrid and redeemable preferred securities 762 88 44 - 806VIEs’ fixed maturity securities 596 2 - - 598
Total fixed maturity securities 82,589 5,044 2,101 (30) 85,562Equity securities 226 17 6 - 237
Total AFS securities $ 82,815 $ 5,061 $ 2,107 $ (30) $ 85,799 (1) Includes unrealized (gains) and losses on impaired securities related to changes in the fair value of such securities subsequent to the
impairment measurement date. The amortized cost and fair value of fixed maturity AFS securities by contractual maturities (in millions) as of December 31, 2016, were as follows:
Amortized Fair Cost Value Due in one year or less $ 2,862 $ 2,904 Due after one year through five years 18,598 19,522 Due after five years through ten years 17,655 18,001 Due after ten years 39,504 42,793
Subtotal 78,619 83,220 Structured securities (ABS, MBS, CLOs) 5,868 5,993
Total fixed maturity AFS securities $ 84,487 $ 89,213 Actual maturities may differ from contractual maturities because issuers may have the right to call or pre-pay obligations.
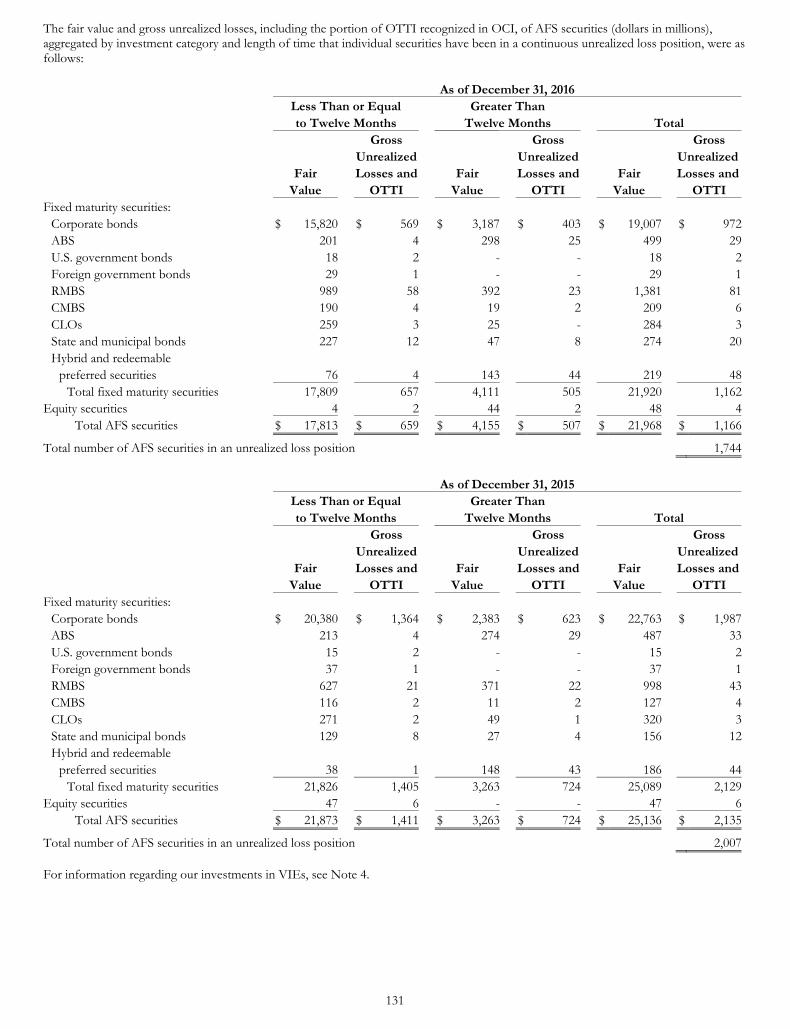
131
The fair value and gross unrealized losses, including the portion of OTTI recognized in OCI, of AFS securities (dollars in millions), aggregated by investment category and length of time that individual securities have been in a continuous unrealized loss position, were as follows:
As of December 31, 2016 Less Than or Equal Greater Than to Twelve Months Twelve Months Total Gross Gross Gross Unrealized Unrealized Unrealized Fair Losses and Fair Losses and Fair Losses and Value OTTI Value OTTI Value OTTI Fixed maturity securities:
Corporate bonds $ 15,820 $ 569 $ 3,187 $ 403 $ 19,007 $ 972ABS 201 4 298 25 499 29U.S. government bonds 18 2 - - 18 2Foreign government bonds 29 1 - - 29 1RMBS 989 58 392 23 1,381 81CMBS 190 4 19 2 209 6CLOs 259 3 25 - 284 3State and municipal bonds 227 12 47 8 274 20Hybrid and redeemable
preferred securities 76 4 143 44 219 48Total fixed maturity securities 17,809 657 4,111 505 21,920 1,162
Equity securities 4 2 44 2 48 4Total AFS securities $ 17,813 $ 659 $ 4,155 $ 507 $ 21,968 $ 1,166
Total number of AFS securities in an unrealized loss position 1,744
As of December 31, 2015 Less Than or Equal Greater Than to Twelve Months Twelve Months Total Gross Gross Gross Unrealized Unrealized Unrealized Fair Losses and Fair Losses and Fair Losses and Value OTTI Value OTTI Value OTTI Fixed maturity securities:
Corporate bonds $ 20,380 $ 1,364 $ 2,383 $ 623 $ 22,763 $ 1,987ABS 213 4 274 29 487 33U.S. government bonds 15 2 - - 15 2Foreign government bonds 37 1 - - 37 1RMBS 627 21 371 22 998 43CMBS 116 2 11 2 127 4CLOs 271 2 49 1 320 3State and municipal bonds 129 8 27 4 156 12Hybrid and redeemable
preferred securities 38 1 148 43 186 44Total fixed maturity securities 21,826 1,405 3,263 724 25,089 2,129
Equity securities 47 6 - - 47 6Total AFS securities $ 21,873 $ 1,411 $ 3,263 $ 724 $ 25,136 $ 2,135
Total number of AFS securities in an unrealized loss position 2,007 For information regarding our investments in VIEs, see Note 4.
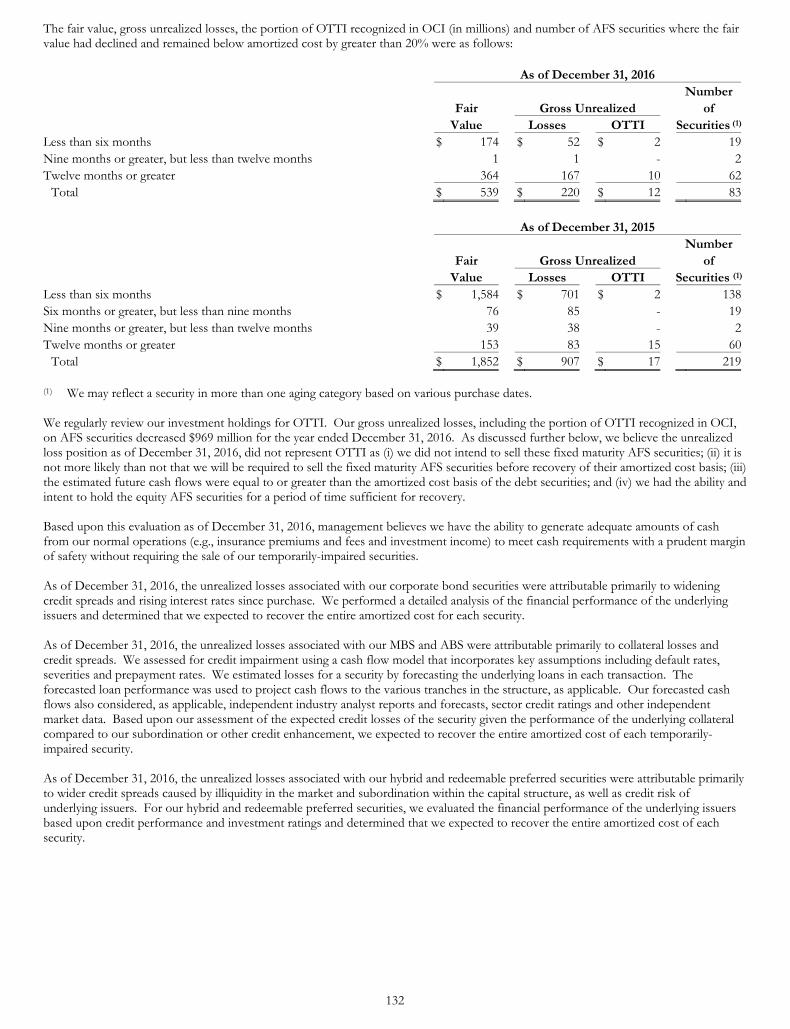
132
The fair value, gross unrealized losses, the portion of OTTI recognized in OCI (in millions) and number of AFS securities where the fair value had declined and remained below amortized cost by greater than 20% were as follows:
As of December 31, 2016 Number Fair Gross Unrealized of Value Losses OTTI Securities (1)
Less than six months $ 174 $ 52 $ 2 19Nine months or greater, but less than twelve months 1 1 - 2Twelve months or greater 364 167 10 62
Total $ 539 $ 220 $ 12 83
As of December 31, 2015 Number Fair Gross Unrealized of Value Losses OTTI Securities (1)
Less than six months $ 1,584 $ 701 $ 2 138Six months or greater, but less than nine months 76 85 - 19Nine months or greater, but less than twelve months 39 38 - 2Twelve months or greater 153 83 15 60
Total $ 1,852 $ 907 $ 17 219 (1) We may reflect a security in more than one aging category based on various purchase dates. We regularly review our investment holdings for OTTI. Our gross unrealized losses, including the portion of OTTI recognized in OCI, on AFS securities decreased $969 million for the year ended December 31, 2016. As discussed further below, we believe the unrealized loss position as of December 31, 2016, did not represent OTTI as (i) we did not intend to sell these fixed maturity AFS securities; (ii) it is not more likely than not that we will be required to sell the fixed maturity AFS securities before recovery of their amortized cost basis; (iii) the estimated future cash flows were equal to or greater than the amortized cost basis of the debt securities; and (iv) we had the ability and intent to hold the equity AFS securities for a period of time sufficient for recovery. Based upon this evaluation as of December 31, 2016, management believes we have the ability to generate adequate amounts of cash from our normal operations (e.g., insurance premiums and fees and investment income) to meet cash requirements with a prudent margin of safety without requiring the sale of our temporarily-impaired securities. As of December 31, 2016, the unrealized losses associated with our corporate bond securities were attributable primarily to widening credit spreads and rising interest rates since purchase. We performed a detailed analysis of the financial performance of the underlying issuers and determined that we expected to recover the entire amortized cost for each security. As of December 31, 2016, the unrealized losses associated with our MBS and ABS were attributable primarily to collateral losses and credit spreads. We assessed for credit impairment using a cash flow model that incorporates key assumptions including default rates, severities and prepayment rates. We estimated losses for a security by forecasting the underlying loans in each transaction. The forecasted loan performance was used to project cash flows to the various tranches in the structure, as applicable. Our forecasted cash flows also considered, as applicable, independent industry analyst reports and forecasts, sector credit ratings and other independent market data. Based upon our assessment of the expected credit losses of the security given the performance of the underlying collateral compared to our subordination or other credit enhancement, we expected to recover the entire amortized cost of each temporarily-impaired security. As of December 31, 2016, the unrealized losses associated with our hybrid and redeemable preferred securities were attributable primarily to wider credit spreads caused by illiquidity in the market and subordination within the capital structure, as well as credit risk of underlying issuers. For our hybrid and redeemable preferred securities, we evaluated the financial performance of the underlying issuers based upon credit performance and investment ratings and determined that we expected to recover the entire amortized cost of each security.
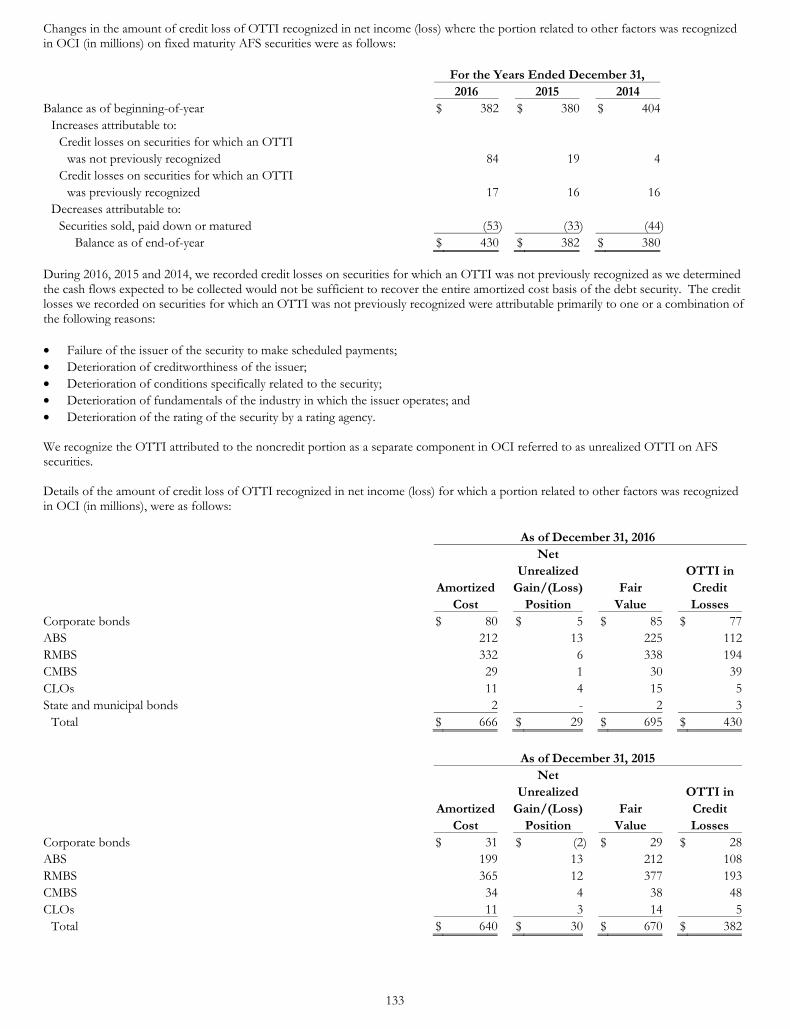
133
Changes in the amount of credit loss of OTTI recognized in net income (loss) where the portion related to other factors was recognized in OCI (in millions) on fixed maturity AFS securities were as follows:
For the Years Ended December 31, 2016 2015 2014 Balance as of beginning-of-year $ 382 $ 380 $ 404
Increases attributable to: Credit losses on securities for which an OTTI
was not previously recognized 84 19 4 Credit losses on securities for which an OTTI
was previously recognized 17 16 16 Decreases attributable to:
Securities sold, paid down or matured (53) (33) (44) Balance as of end-of-year $ 430 $ 382 $ 380
During 2016, 2015 and 2014, we recorded credit losses on securities for which an OTTI was not previously recognized as we determined the cash flows expected to be collected would not be sufficient to recover the entire amortized cost basis of the debt security. The credit losses we recorded on securities for which an OTTI was not previously recognized were attributable primarily to one or a combination of the following reasons: • Failure of the issuer of the security to make scheduled payments; • Deterioration of creditworthiness of the issuer; • Deterioration of conditions specifically related to the security; • Deterioration of fundamentals of the industry in which the issuer operates; and • Deterioration of the rating of the security by a rating agency. We recognize the OTTI attributed to the noncredit portion as a separate component in OCI referred to as unrealized OTTI on AFS securities. Details of the amount of credit loss of OTTI recognized in net income (loss) for which a portion related to other factors was recognized in OCI (in millions), were as follows:
As of December 31, 2016 Net Unrealized OTTI in Amortized Gain/(Loss) Fair Credit Cost Position Value Losses Corporate bonds $ 80 $ 5 $ 85 $ 77ABS 212 13 225 112RMBS 332 6 338 194CMBS 29 1 30 39CLOs 11 4 15 5State and municipal bonds 2 - 2 3
Total $ 666 $ 29 $ 695 $ 430
As of December 31, 2015 Net Unrealized OTTI in Amortized Gain/(Loss) Fair Credit Cost Position Value Losses Corporate bonds $ 31 $ (2) $ 29 $ 28ABS 199 13 212 108RMBS 365 12 377 193CMBS 34 4 38 48CLOs 11 3 14 5
Total $ 640 $ 30 $ 670 $ 382
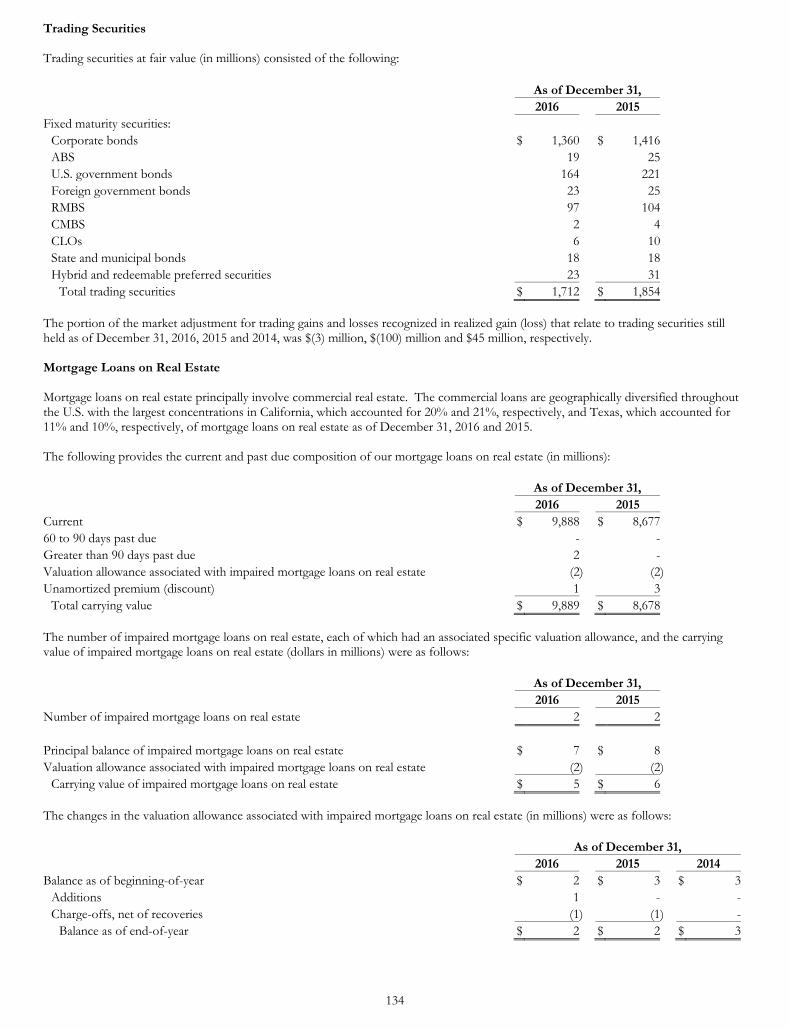
134
Trading Securities Trading securities at fair value (in millions) consisted of the following:
As of December 31, 2016 2015 Fixed maturity securities:
Corporate bonds $ 1,360 $ 1,416 ABS 19 25 U.S. government bonds 164 221 Foreign government bonds 23 25 RMBS 97 104 CMBS 2 4 CLOs 6 10 State and municipal bonds 18 18 Hybrid and redeemable preferred securities 23 31
Total trading securities $ 1,712 $ 1,854 The portion of the market adjustment for trading gains and losses recognized in realized gain (loss) that relate to trading securities still held as of December 31, 2016, 2015 and 2014, was $(3) million, $(100) million and $45 million, respectively. Mortgage Loans on Real Estate Mortgage loans on real estate principally involve commercial real estate. The commercial loans are geographically diversified throughout the U.S. with the largest concentrations in California, which accounted for 20% and 21%, respectively, and Texas, which accounted for 11% and 10%, respectively, of mortgage loans on real estate as of December 31, 2016 and 2015. The following provides the current and past due composition of our mortgage loans on real estate (in millions):
As of December 31, 2016 2015 Current $ 9,888 $ 8,67760 to 90 days past due - -Greater than 90 days past due 2 -Valuation allowance associated with impaired mortgage loans on real estate (2) (2) Unamortized premium (discount) 1 3
Total carrying value $ 9,889 $ 8,678 The number of impaired mortgage loans on real estate, each of which had an associated specific valuation allowance, and the carrying value of impaired mortgage loans on real estate (dollars in millions) were as follows:
As of December 31, 2016 2015 Number of impaired mortgage loans on real estate 2 2 Principal balance of impaired mortgage loans on real estate $ 7 $ 8 Valuation allowance associated with impaired mortgage loans on real estate (2) (2)
Carrying value of impaired mortgage loans on real estate $ 5 $ 6 The changes in the valuation allowance associated with impaired mortgage loans on real estate (in millions) were as follows:
As of December 31, 2016 2015 2014 Balance as of beginning-of-year $ 2 $ 3 $ 3
Additions 1 - -Charge-offs, net of recoveries (1) (1) -
Balance as of end-of-year $ 2 $ 2 $ 3
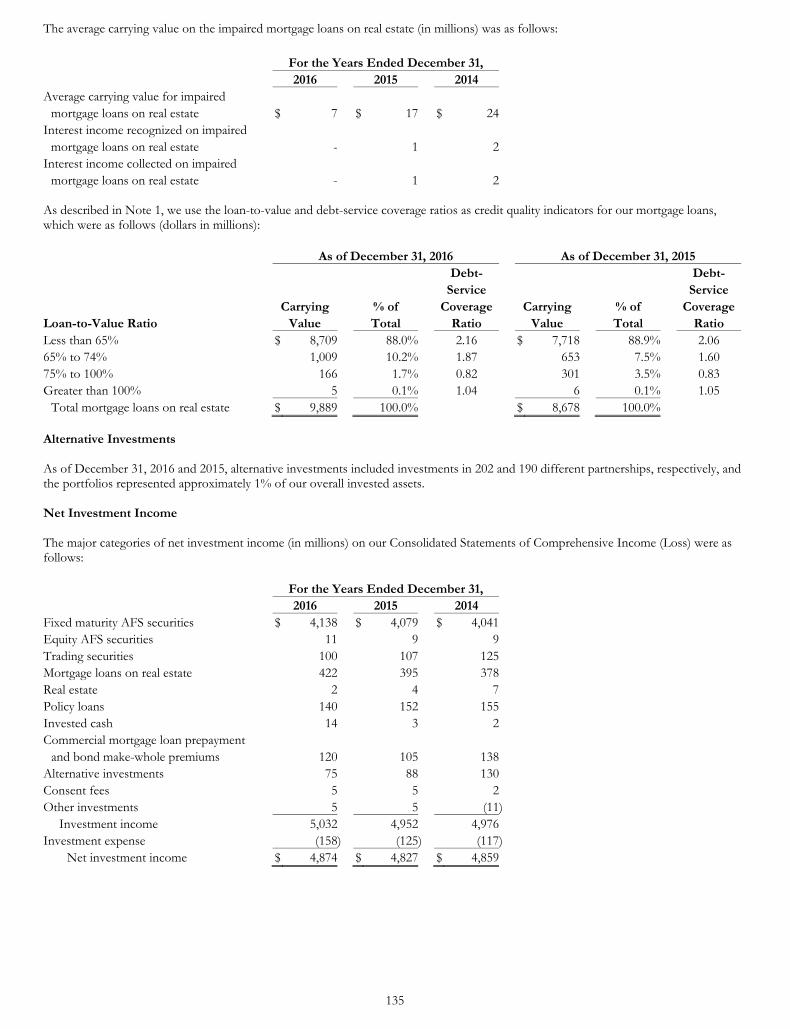
135
The average carrying value on the impaired mortgage loans on real estate (in millions) was as follows:
For the Years Ended December 31, 2016 2015 2014 Average carrying value for impaired
mortgage loans on real estate $ 7 $ 17 $ 24 Interest income recognized on impaired
mortgage loans on real estate - 1 2 Interest income collected on impaired
mortgage loans on real estate - 1 2 As described in Note 1, we use the loan-to-value and debt-service coverage ratios as credit quality indicators for our mortgage loans, which were as follows (dollars in millions):
As of December 31, 2016 As of December 31, 2015 Debt- Debt- Service Service Carrying % of Coverage Carrying % of CoverageLoan-to-Value Ratio Value Total Ratio Value Total Ratio Less than 65% $ 8,709 88.0% 2.16 $ 7,718 88.9% 2.06 65% to 74% 1,009 10.2% 1.87 653 7.5% 1.60 75% to 100% 166 1.7% 0.82 301 3.5% 0.83 Greater than 100% 5 0.1% 1.04 6 0.1% 1.05
Total mortgage loans on real estate $ 9,889 100.0% $ 8,678 100.0% Alternative Investments As of December 31, 2016 and 2015, alternative investments included investments in 202 and 190 different partnerships, respectively, and the portfolios represented approximately 1% of our overall invested assets. Net Investment Income The major categories of net investment income (in millions) on our Consolidated Statements of Comprehensive Income (Loss) were as follows:
For the Years Ended December 31, 2016 2015 2014 Fixed maturity AFS securities $ 4,138 $ 4,079 $ 4,041 Equity AFS securities 11 9 9 Trading securities 100 107 125 Mortgage loans on real estate 422 395 378 Real estate 2 4 7 Policy loans 140 152 155 Invested cash 14 3 2 Commercial mortgage loan prepayment
and bond make-whole premiums 120 105 138 Alternative investments 75 88 130 Consent fees 5 5 2 Other investments 5 5 (11)
Investment income 5,032 4,952 4,976 Investment expense (158) (125) (117)
Net investment income $ 4,874 $ 4,827 $ 4,859
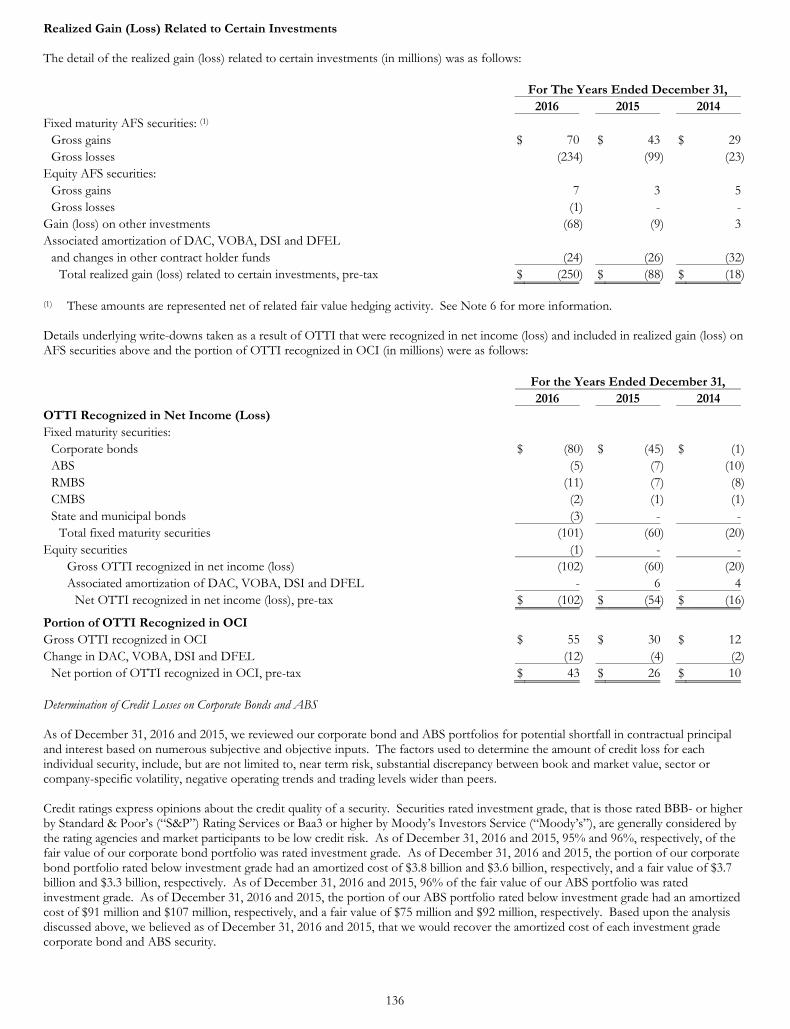
136
Realized Gain (Loss) Related to Certain Investments The detail of the realized gain (loss) related to certain investments (in millions) was as follows:
For The Years Ended December 31, 2016 2015 2014 Fixed maturity AFS securities: (1)
Gross gains $ 70 $ 43 $ 29Gross losses (234) (99) (23)
Equity AFS securities: Gross gains 7 3 5Gross losses (1) - -
Gain (loss) on other investments (68) (9) 3Associated amortization of DAC, VOBA, DSI and DFEL
and changes in other contract holder funds (24) (26) (32)Total realized gain (loss) related to certain investments, pre-tax $ (250) $ (88) $ (18)
(1) These amounts are represented net of related fair value hedging activity. See Note 6 for more information. Details underlying write-downs taken as a result of OTTI that were recognized in net income (loss) and included in realized gain (loss) on AFS securities above and the portion of OTTI recognized in OCI (in millions) were as follows:
For the Years Ended December 31, 2016 2015 2014 OTTI Recognized in Net Income (Loss) Fixed maturity securities:
Corporate bonds $ (80) $ (45) $ (1)ABS (5) (7) (10)RMBS (11) (7) (8)CMBS (2) (1) (1)State and municipal bonds (3) - -
Total fixed maturity securities (101) (60) (20)Equity securities (1) - -
Gross OTTI recognized in net income (loss) (102) (60) (20)Associated amortization of DAC, VOBA, DSI and DFEL - 6 4
Net OTTI recognized in net income (loss), pre-tax $ (102) $ (54) $ (16)
Portion of OTTI Recognized in OCI Gross OTTI recognized in OCI $ 55 $ 30 $ 12Change in DAC, VOBA, DSI and DFEL (12) (4) (2)
Net portion of OTTI recognized in OCI, pre-tax $ 43 $ 26 $ 10 Determination of Credit Losses on Corporate Bonds and ABS As of December 31, 2016 and 2015, we reviewed our corporate bond and ABS portfolios for potential shortfall in contractual principal and interest based on numerous subjective and objective inputs. The factors used to determine the amount of credit loss for each individual security, include, but are not limited to, near term risk, substantial discrepancy between book and market value, sector or company-specific volatility, negative operating trends and trading levels wider than peers. Credit ratings express opinions about the credit quality of a security. Securities rated investment grade, that is those rated BBB- or higher by Standard & Poor’s (“S&P”) Rating Services or Baa3 or higher by Moody’s Investors Service (“Moody’s”), are generally considered by the rating agencies and market participants to be low credit risk. As of December 31, 2016 and 2015, 95% and 96%, respectively, of the fair value of our corporate bond portfolio was rated investment grade. As of December 31, 2016 and 2015, the portion of our corporate bond portfolio rated below investment grade had an amortized cost of $3.8 billion and $3.6 billion, respectively, and a fair value of $3.7 billion and $3.3 billion, respectively. As of December 31, 2016 and 2015, 96% of the fair value of our ABS portfolio was rated investment grade. As of December 31, 2016 and 2015, the portion of our ABS portfolio rated below investment grade had an amortized cost of $91 million and $107 million, respectively, and a fair value of $75 million and $92 million, respectively. Based upon the analysis discussed above, we believed as of December 31, 2016 and 2015, that we would recover the amortized cost of each investment grade corporate bond and ABS security.
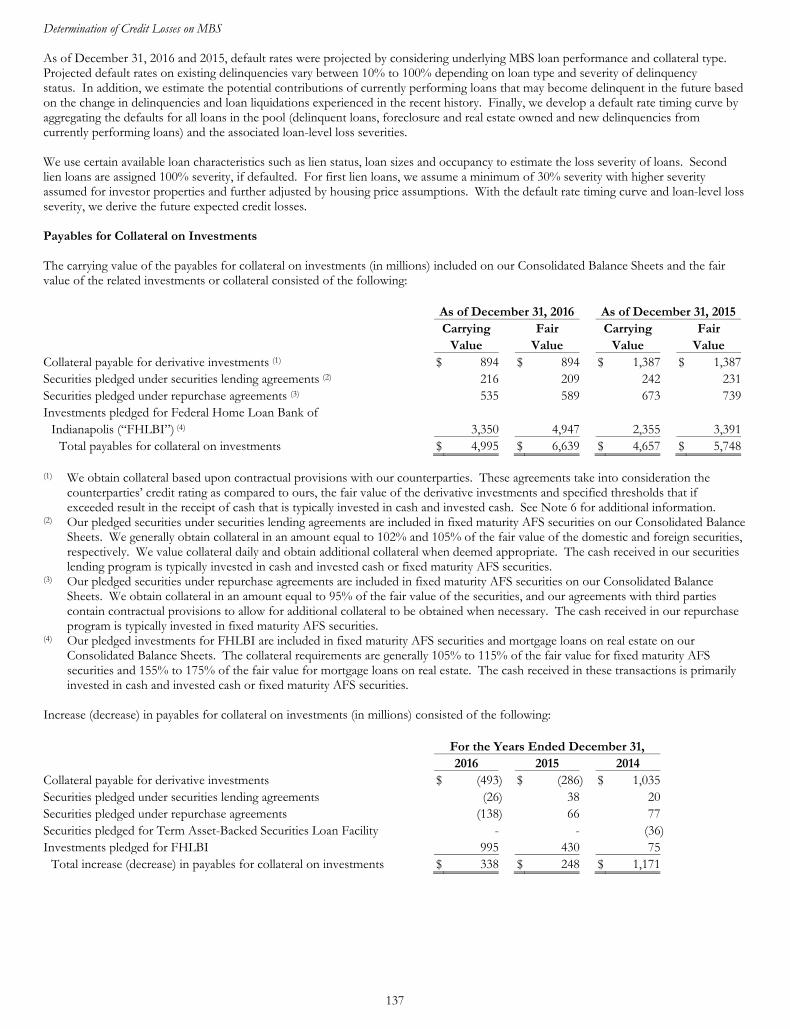
137
Determination of Credit Losses on MBS As of December 31, 2016 and 2015, default rates were projected by considering underlying MBS loan performance and collateral type. Projected default rates on existing delinquencies vary between 10% to 100% depending on loan type and severity of delinquency status. In addition, we estimate the potential contributions of currently performing loans that may become delinquent in the future based on the change in delinquencies and loan liquidations experienced in the recent history. Finally, we develop a default rate timing curve by aggregating the defaults for all loans in the pool (delinquent loans, foreclosure and real estate owned and new delinquencies from currently performing loans) and the associated loan-level loss severities. We use certain available loan characteristics such as lien status, loan sizes and occupancy to estimate the loss severity of loans. Second lien loans are assigned 100% severity, if defaulted. For first lien loans, we assume a minimum of 30% severity with higher severity assumed for investor properties and further adjusted by housing price assumptions. With the default rate timing curve and loan-level loss severity, we derive the future expected credit losses. Payables for Collateral on Investments The carrying value of the payables for collateral on investments (in millions) included on our Consolidated Balance Sheets and the fair value of the related investments or collateral consisted of the following:
As of December 31, 2016 As of December 31, 2015 Carrying Fair Carrying Fair Value Value Value Value Collateral payable for derivative investments (1) $ 894 $ 894 $ 1,387 $ 1,387Securities pledged under securities lending agreements (2) 216 209 242 231Securities pledged under repurchase agreements (3) 535 589 673 739Investments pledged for Federal Home Loan Bank of
Indianapolis (“FHLBI”) (4) 3,350 4,947 2,355 3,391Total payables for collateral on investments $ 4,995 $ 6,639 $ 4,657 $ 5,748
(1) We obtain collateral based upon contractual provisions with our counterparties. These agreements take into consideration the
counterparties’ credit rating as compared to ours, the fair value of the derivative investments and specified thresholds that if exceeded result in the receipt of cash that is typically invested in cash and invested cash. See Note 6 for additional information.
(2) Our pledged securities under securities lending agreements are included in fixed maturity AFS securities on our Consolidated Balance Sheets. We generally obtain collateral in an amount equal to 102% and 105% of the fair value of the domestic and foreign securities, respectively. We value collateral daily and obtain additional collateral when deemed appropriate. The cash received in our securities lending program is typically invested in cash and invested cash or fixed maturity AFS securities.
(3) Our pledged securities under repurchase agreements are included in fixed maturity AFS securities on our Consolidated Balance Sheets. We obtain collateral in an amount equal to 95% of the fair value of the securities, and our agreements with third parties contain contractual provisions to allow for additional collateral to be obtained when necessary. The cash received in our repurchase program is typically invested in fixed maturity AFS securities.
(4) Our pledged investments for FHLBI are included in fixed maturity AFS securities and mortgage loans on real estate on our Consolidated Balance Sheets. The collateral requirements are generally 105% to 115% of the fair value for fixed maturity AFS securities and 155% to 175% of the fair value for mortgage loans on real estate. The cash received in these transactions is primarily invested in cash and invested cash or fixed maturity AFS securities.
Increase (decrease) in payables for collateral on investments (in millions) consisted of the following:
For the Years Ended December 31, 2016 2015 2014
Collateral payable for derivative investments $ (493) $ (286) $ 1,035 Securities pledged under securities lending agreements (26) 38 20 Securities pledged under repurchase agreements (138) 66 77 Securities pledged for Term Asset-Backed Securities Loan Facility - - (36) Investments pledged for FHLBI 995 430 75
Total increase (decrease) in payables for collateral on investments $ 338 $ 248 $ 1,171
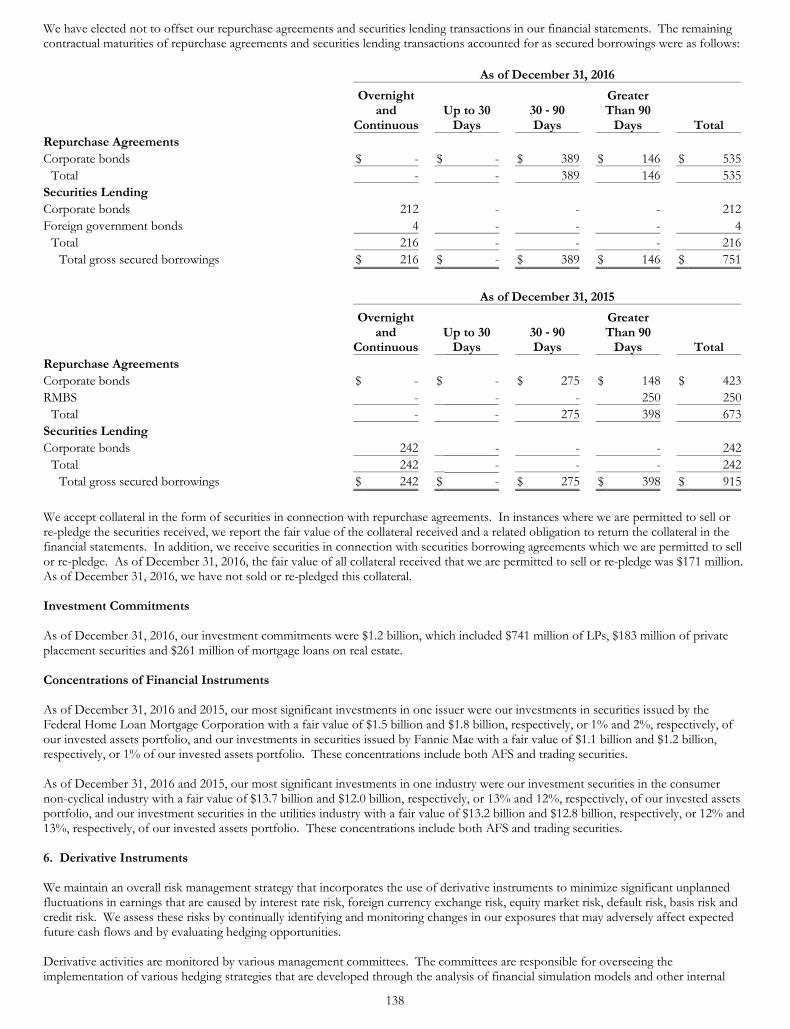
138
We have elected not to offset our repurchase agreements and securities lending transactions in our financial statements. The remaining contractual maturities of repurchase agreements and securities lending transactions accounted for as secured borrowings were as follows:
As of December 31, 2016
Overnight and
ContinuousUp to 30
Days 30 - 90 Days
Greater Than 90
Days Total Repurchase Agreements Corporate bonds $ - $ - $ 389 $ 146 $ 535
Total - - 389 146 535Securities Lending Corporate bonds 212 - - - 212Foreign government bonds 4 - - - 4
Total 216 - - - 216Total gross secured borrowings $ 216 $ - $ 389 $ 146 $ 751
As of December 31, 2015
Overnight and
ContinuousUp to 30
Days 30 - 90 Days
Greater Than 90
Days Total Repurchase Agreements Corporate bonds $ - $ - $ 275 $ 148 $ 423RMBS - - - 250 250
Total - - 275 398 673Securities Lending Corporate bonds 242 - - - 242
Total 242 - - - 242Total gross secured borrowings $ 242 $ - $ 275 $ 398 $ 915
We accept collateral in the form of securities in connection with repurchase agreements. In instances where we are permitted to sell or re-pledge the securities received, we report the fair value of the collateral received and a related obligation to return the collateral in the financial statements. In addition, we receive securities in connection with securities borrowing agreements which we are permitted to sell or re-pledge. As of December 31, 2016, the fair value of all collateral received that we are permitted to sell or re-pledge was $171 million. As of December 31, 2016, we have not sold or re-pledged this collateral. Investment Commitments As of December 31, 2016, our investment commitments were $1.2 billion, which included $741 million of LPs, $183 million of private placement securities and $261 million of mortgage loans on real estate. Concentrations of Financial Instruments As of December 31, 2016 and 2015, our most significant investments in one issuer were our investments in securities issued by the Federal Home Loan Mortgage Corporation with a fair value of $1.5 billion and $1.8 billion, respectively, or 1% and 2%, respectively, of our invested assets portfolio, and our investments in securities issued by Fannie Mae with a fair value of $1.1 billion and $1.2 billion, respectively, or 1% of our invested assets portfolio. These concentrations include both AFS and trading securities. As of December 31, 2016 and 2015, our most significant investments in one industry were our investment securities in the consumer non-cyclical industry with a fair value of $13.7 billion and $12.0 billion, respectively, or 13% and 12%, respectively, of our invested assets portfolio, and our investment securities in the utilities industry with a fair value of $13.2 billion and $12.8 billion, respectively, or 12% and 13%, respectively, of our invested assets portfolio. These concentrations include both AFS and trading securities. 6. Derivative Instruments We maintain an overall risk management strategy that incorporates the use of derivative instruments to minimize significant unplanned fluctuations in earnings that are caused by interest rate risk, foreign currency exchange risk, equity market risk, default risk, basis risk and credit risk. We assess these risks by continually identifying and monitoring changes in our exposures that may adversely affect expected future cash flows and by evaluating hedging opportunities. Derivative activities are monitored by various management committees. The committees are responsible for overseeing the implementation of various hedging strategies that are developed through the analysis of financial simulation models and other internal

139
and industry sources. The resulting hedging strategies are incorporated into our overall risk management strategies. See Note 1 for a detailed discussion of the accounting treatment for derivative instruments. See Note 20 for additional disclosures related to the fair value of our derivative instruments and Note 4 for derivative instruments related to our consolidated VIEs. Interest Rate Contracts We use derivative instruments as part of our interest rate risk management strategy. These instruments are economic hedges unless otherwise noted and include: Forward-Starting Interest Rate Swaps We use forward-starting interest rate swaps designated and qualifying as cash flow hedges to hedge our exposure to interest rate fluctuations related to the forecasted purchases of certain assets and liabilities and anticipated issuances of fixed-rate securities. Interest Rate Cap Corridors We use interest rate cap corridors to provide a level of protection from the effect of rising interest rates for certain life insurance products and annuity contracts. Interest rate cap corridors involve purchasing an interest rate cap at a specific cap rate and selling an interest rate cap with a higher cap rate. For each corridor, the amount of quarterly payments, if any, is determined by the rate at which the underlying index rate resets above the original capped rate. The corridor limits the benefit the purchaser can receive as the related interest rate index rises above the higher capped rate. There is no additional liability to us other than the purchase price associated with the interest rate cap corridor. Interest Rate Futures We use interest rate futures contracts to hedge the liability exposure on certain options in variable annuity products. These futures contracts require payment between our counterparty and us on a daily basis for changes in the futures index price. Interest Rate Swap Agreements We use interest rate swap agreements to hedge the liability exposure on certain options in variable annuity products. We also use interest rate swap agreements designated and qualifying as cash flow hedges to hedge the interest rate risk of floating-rate bond coupon payments by replicating a fixed-rate bond. Finally, we use interest rate swap agreements designated and qualifying as fair value hedges to hedge against changes in the fair value of certain fixed-rate long-term debt and fixed maturity securities due to interest rate risks. Treasury and Reverse Treasury Locks We use treasury locks designated and qualifying as cash flow hedges to hedge the interest rate exposure related to our issuance of fixed-rate securities or the anticipated future cash flows of floating-rate fixed maturity securities due to changes in interest rates. In addition, we use reverse treasury locks designated and qualifying as cash flow hedges to hedge the interest rate exposure related to the anticipated purchase of fixed-rate securities or the anticipated future cash flows of floating-rate fixed maturity securities due to changes in interest rates. These derivatives are primarily structured to hedge interest rate risk inherent in the assumptions used to price certain liabilities. Foreign Currency Contracts We use derivative instruments as part of our foreign currency risk management strategy. These instruments are economic hedges unless otherwise noted and include: Currency Futures We use currency futures to hedge foreign exchange risk associated with certain options in variable annuity products. Currency futures exchange one currency for another at a specified date in the future at a specified exchange rate. Foreign Currency Swaps We use foreign currency swaps designated and qualifying as cash flow hedges, to hedge foreign exchange risk of investments in fixed maturity securities denominated in foreign currencies. A foreign currency swap is a contractual agreement to exchange one currency for another at specified dates in the future at a specified exchange rate.

140
Equity Market Contracts We use derivative instruments as part of our equity market risk management strategy that are economic hedges and include: Call Options Based on the S&P 500 Index® Our indexed annuity and IUL contracts permit the holder to elect an interest rate return or an equity market component, where interest credited to the contracts is linked to the performance of the S&P 500 Index® (“S&P 500”). Contract holders may elect to rebalance index options at renewal dates, either annually or biannually. As of each renewal date, we have the opportunity to re-price the indexed component by establishing participation rates, caps, spreads and specified rates, subject to contractual guarantees. We purchase call options that are highly correlated to the portfolio allocation decisions of our contract holders, such that we are economically hedged with respect to equity returns for the current reset period. Consumer Price Index Swaps We use consumer price index swaps to hedge the liability exposure on certain options in fixed annuity products. Consumer price index swaps are contracts entered into at no cost and whose payoff is the difference between the consumer price index inflation rate and the fixed-rate determined as of inception. Equity Futures We use equity futures contracts to hedge the liability exposure on certain options in variable annuity products. These futures contracts require payment between our counterparty and us on a daily basis for changes in the futures index price. Put Options We use put options to hedge the liability exposure on certain options in variable annuity products. Put options are contracts that require counterparties to pay us at a specified future date the amount, if any, by which a specified equity index is less than the strike rate stated in the agreement, applied to a notional amount. Total Return Swaps We use total return swaps to hedge the liability exposure on certain options in variable annuity products. We receive the total return on a portfolio of indexes and pay a floating-rate of interest. In addition, we use total return swaps to hedge a portion of the liability related to our deferred compensation plans. We receive the total return on a portfolio of indexes and pay a floating-rate of interest. Variance Swaps We use variance swaps to hedge the liability exposure on certain options in variable annuity products. Variance swaps are contracts entered into at no cost whose payoff is the difference between the realized variance rate of an underlying index and the fixed variance rate determined as of inception of the contract. Credit Contracts We use derivative instruments as part of our credit risk management strategy that are economic hedges and include: Credit Default Swaps – Buying Protection We use credit default swaps to hedge the liability exposure on certain options in variable annuity products. We buy credit default swaps to hedge against a drop in bond prices due to credit concerns of certain bond issuers. A credit default swap allows us to put the bond back to the counterparty at par upon a default event by the bond issuer. A default event is defined as bankruptcy, failure to pay, obligation acceleration or restructuring. Credit Default Swaps – Selling Protection We sell credit default swaps to offer credit protection to contract holders and investors. The credit default swaps hedge the contract holders and investors against a drop in bond prices due to credit concerns of certain bond issuers. A credit default swap allows the investor to put the bond back to us at par upon a default event by the bond issuer. A default event is defined as bankruptcy, failure to pay, obligation acceleration or restructuring.

141
Embedded Derivatives We have embedded derivatives that include: GLB Reserves Embedded Derivatives We use a hedging strategy designed to mitigate the risk and income statement volatility caused by changes in the equity markets, interest rates and volatility associated with GLBs offered in our variable annuity products, including products with GWB and GIB features. Changes in the value of the hedge contracts due to changes in equity markets, interest rates and implied volatilities hedge the income statement effect of changes in embedded derivative GLB reserves caused by those same factors. We rebalance our hedge positions based upon changes in these factors as needed. While we actively manage our hedge positions, these hedge positions may not be totally effective in offsetting changes in the embedded derivative reserve due to, among other things, differences in timing between when a market exposure changes and corresponding changes to the hedge positions, extreme swings in the equity markets and interest rates, market volatility, contract holder behavior, divergence between the performance of the underlying funds and the hedging indices, divergence between the actual and expected performance of the hedge instruments and our ability to purchase hedging instruments at prices consistent with our desired risk and return trade-off. Certain features of these guarantees have elements of both insurance benefits accounted for under the Financial Services – Insurance – Claim Costs and Liabilities for Future Policy Benefits Subtopic of the FASB ASC (“benefit reserves”) and embedded derivatives accounted for under the Derivatives and Hedging and the Fair Value Measurements and Disclosures Topics of the FASB ASC (“embedded derivative reserves”). We calculate the value of the benefit reserves and the embedded derivative reserves based on the specific characteristics of each GLB feature. Indexed Annuity and IUL Contracts Embedded Derivatives Our indexed annuity and IUL contracts permit the holder to elect an interest rate return or an equity market component, where interest credited to the contracts is linked to the performance of the S&P 500. Contract holders may elect to rebalance index options at renewal dates, either annually or biannually. As of each renewal date, we have the opportunity to re-price the indexed component by establishing participation rates, caps, spreads and specified rates, subject to contractual guarantees. We purchase S&P 500 call options that are highly correlated to the portfolio allocation decisions of our contract holders, such that we are economically hedged with respect to equity returns for the current reset period. Reinsurance Related Embedded Derivatives We have certain modified coinsurance arrangements and coinsurance with funds withheld reinsurance arrangements with embedded derivatives related to the withheld assets of the related funds. These derivatives are considered total return swaps with contractual returns that are attributable to various assets and liabilities associated with these reinsurance arrangements.

142
We have derivative instruments with off-balance-sheet risks whose notional or contract amounts exceed the related credit exposure. Outstanding derivative instruments with off-balance-sheet risks (in millions) were as follows:
As of December 31, 2016 As of December 31, 2015 Notional Fair Value Notional Fair Value Amounts Asset Liability Amounts Asset LiabilityQualifying Hedges Cash flow hedges:
Interest rate contracts (1) $ 3,552 $ 68 $ 122 $ 2,937 $ 192 $ 46Foreign currency contracts (1) 1,177 153 10 910 84 2
Total cash flow hedges 4,729 221 132 3,847 276 48Fair value hedges:
Interest rate contracts (1) 1,512 258 182 1,529 269 198Non-Qualifying Hedges Interest rate contracts (1) 70,290 985 701 71,898 1,088 330Foreign currency contracts (1) 14 - - 74 - -Equity market contracts (1) 28,315 541 616 27,882 680 269Credit contracts (2) 66 - - 103 - 9Embedded derivatives:
GLB reserves (2) - - 371 - - 953Reinsurance related (3) - - 53 - - 87Indexed annuity and IUL contracts (4) - - 1,139 - - 1,100
Total derivative instruments $ 104,926 $ 2,005 $ 3,194 $ 105,333 $ 2,313 $ 2,994 (1) Reported in derivative investments and other liabilities on our Consolidated Balance Sheets. (2) Reported in other liabilities on our Consolidated Balance Sheets. (3) Reported in reinsurance related embedded derivatives on our Consolidated Balance Sheets. (4) Reported in future contract benefits on our Consolidated Balance Sheets. The maturity of the notional amounts of derivative instruments (in millions) was as follows:
Remaining Life as of December 31, 2016
Less Than 1 - 5 6 - 10 11 - 30 Over 30 1 Year Years Years Years Years Total Interest rate contracts (1) $ 11,102 $ 25,530 $ 23,164 $ 14,345 $ 1,213 $ 75,354Foreign currency contracts (2) 50 109 346 686 - 1,191Equity market contracts 15,924 9,369 1,872 17 1,133 28,315Credit contracts 50 16 - - - 66
Total derivative instruments with notional amounts $ 27,126 $ 35,024 $ 25,382 $ 15,048 $ 2,346 $ 104,926
(1) As of December 31, 2016, the latest maturity date for which we were hedging our exposure to the variability in future cash flows for
these instruments was April 2067. (2) As of December 31, 2016, the latest maturity date for which we were hedging our exposure to the variability in future cash flows for
these instruments was December 2045.
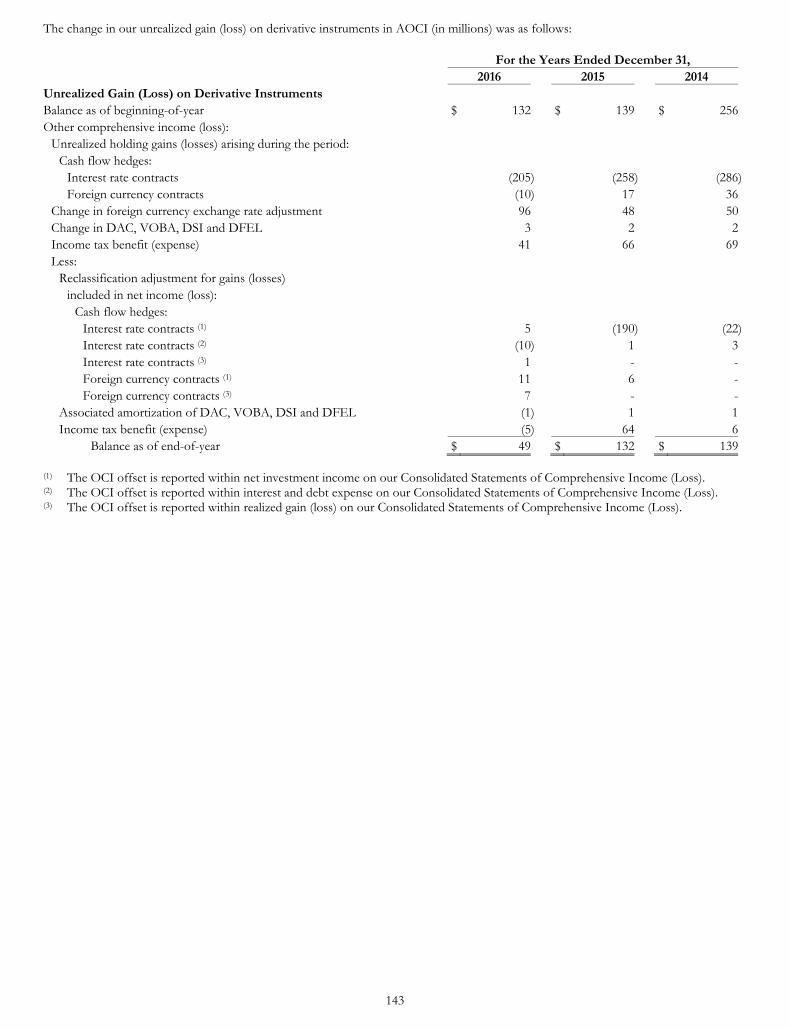
143
The change in our unrealized gain (loss) on derivative instruments in AOCI (in millions) was as follows:
For the Years Ended December 31,
2016 2015 2014 Unrealized Gain (Loss) on Derivative Instruments Balance as of beginning-of-year $ 132 $ 139 $ 256Other comprehensive income (loss):
Unrealized holding gains (losses) arising during the period: Cash flow hedges:
Interest rate contracts (205) (258 ) (286)Foreign currency contracts (10) 17 36
Change in foreign currency exchange rate adjustment 96 48 50Change in DAC, VOBA, DSI and DFEL 3 2 2Income tax benefit (expense) 41 66 69Less:
Reclassification adjustment for gains (losses) included in net income (loss):
Cash flow hedges: Interest rate contracts (1) 5 (190 ) (22)Interest rate contracts (2) (10) 1 3Interest rate contracts (3) 1 - -Foreign currency contracts (1) 11 6 -Foreign currency contracts (3) 7 - -
Associated amortization of DAC, VOBA, DSI and DFEL (1) 1 1Income tax benefit (expense) (5) 64 6
Balance as of end-of-year $ 49 $ 132 $ 139 (1) The OCI offset is reported within net investment income on our Consolidated Statements of Comprehensive Income (Loss). (2) The OCI offset is reported within interest and debt expense on our Consolidated Statements of Comprehensive Income (Loss). (3) The OCI offset is reported within realized gain (loss) on our Consolidated Statements of Comprehensive Income (Loss).
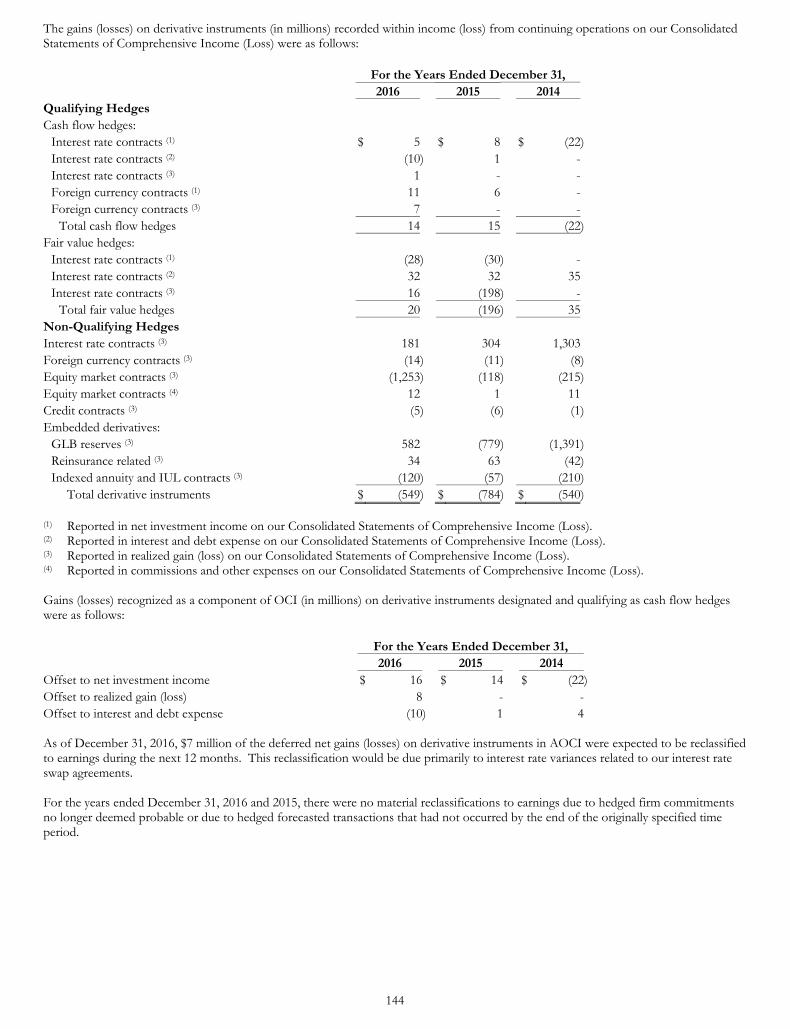
144
The gains (losses) on derivative instruments (in millions) recorded within income (loss) from continuing operations on our Consolidated Statements of Comprehensive Income (Loss) were as follows:
For the Years Ended December 31, 2016 2015 2014 Qualifying Hedges Cash flow hedges:
Interest rate contracts (1) $ 5 $ 8 $ (22) Interest rate contracts (2) (10) 1 - Interest rate contracts (3) 1 - - Foreign currency contracts (1) 11 6 - Foreign currency contracts (3) 7 - -
Total cash flow hedges 14 15 (22) Fair value hedges:
Interest rate contracts (1) (28) (30) - Interest rate contracts (2) 32 32 35 Interest rate contracts (3) 16 (198) -
Total fair value hedges 20 (196) 35 Non-Qualifying Hedges Interest rate contracts (3) 181 304 1,303 Foreign currency contracts (3) (14) (11) (8) Equity market contracts (3) (1,253) (118) (215) Equity market contracts (4) 12 1 11 Credit contracts (3) (5) (6) (1) Embedded derivatives:
GLB reserves (3) 582 (779) (1,391) Reinsurance related (3) 34 63 (42) Indexed annuity and IUL contracts (3) (120) (57) (210)
Total derivative instruments $ (549) $ (784) $ (540) (1) Reported in net investment income on our Consolidated Statements of Comprehensive Income (Loss). (2) Reported in interest and debt expense on our Consolidated Statements of Comprehensive Income (Loss). (3) Reported in realized gain (loss) on our Consolidated Statements of Comprehensive Income (Loss). (4) Reported in commissions and other expenses on our Consolidated Statements of Comprehensive Income (Loss). Gains (losses) recognized as a component of OCI (in millions) on derivative instruments designated and qualifying as cash flow hedges were as follows:
For the Years Ended December 31, 2016 2015 2014 Offset to net investment income $ 16 $ 14 $ (22) Offset to realized gain (loss) 8 - - Offset to interest and debt expense (10) 1 4 As of December 31, 2016, $7 million of the deferred net gains (losses) on derivative instruments in AOCI were expected to be reclassified to earnings during the next 12 months. This reclassification would be due primarily to interest rate variances related to our interest rate swap agreements. For the years ended December 31, 2016 and 2015, there were no material reclassifications to earnings due to hedged firm commitments no longer deemed probable or due to hedged forecasted transactions that had not occurred by the end of the originally specified time period.

145
Information related to our credit default swap liabilities for which we are the seller (dollars in millions) was as follows:
As of December 31, 2016
Credit Reason Nature Rating of Number Maximum for of Underlying of Fair Potential
Maturity Entering Recourse Obligation (1) Instruments Value (2) Payout 3/20/2017 (3) (4) (5) BBB+ 2 $ - $ 40
2 $ - $ 40
As of December 31, 2015 Credit Reason Nature Rating of Number Maximum for of Underlying of Fair Potential
Maturity Entering Recourse Obligation (1) Instruments Value (2) Payout 12/20/2016 (3) (4) (5) BBB- 2 $ (2 ) $ 45 3/20/2017 (3) (4) (5) BBB- 3 (7 ) 58
5 $ (9 ) $ 103 (1) Represents average credit ratings based on the midpoint of the applicable ratings among Moody's, S&P and Fitch Ratings, as scaled
to the corresponding S&P ratings. (2) Broker quotes are used to determine the market value of our credit default swaps. (3) These credit default swaps were sold to a counterparty of the consolidated VIEs discussed in Note 4. (4) Credit default swaps were entered into in order to generate income by providing default protection in return for a quarterly payment. (5) Sellers do not have the right to demand indemnification or compensation from third parties in case of a loss (payment) on the
contract. Details underlying the associated collateral of our credit default swaps for which we are the seller if credit risk-related contingent features were triggered (in millions) were as follows:
As of As of December 31, December 31, 2016 2015 Maximum potential payout $ 40 $ 103 Less: Counterparty thresholds - -
Maximum collateral potentially required to post $ 40 $ 103 Certain of our credit default swap agreements contain contractual provisions that allow for the netting of collateral with our counterparties related to all of our collateralized financing transactions that we have outstanding. If these netting agreements were not in place, we would have been required to post less than $1 million of collateral as of December 31, 2016. Credit Risk We are exposed to credit loss in the event of non-performance by our counterparties on various derivative contracts and reflect assumptions regarding the credit or NPR. The NPR is based upon assumptions for each counterparty’s credit spread over the estimated weighted average life of the counterparty exposure, less collateral held. As of December 31, 2016, the NPR adjustment was less than $1 million. The credit risk associated with such agreements is minimized by entering into agreements with financial institutions with long-standing, superior performance records. Additionally, we maintain a policy of requiring derivative contracts to be governed by an International Swaps and Derivatives Association (“ISDA”) Master Agreement. We are required to maintain minimum ratings as a matter of routine practice in negotiating ISDA agreements. Under some ISDA agreements, our insurance subsidiaries have agreed to maintain certain financial strength or claims-paying ratings. A downgrade below these levels could result in termination of derivative contracts, at which time any amounts payable by us would be dependent on the market value of the underlying derivative contracts. In certain transactions, we and the counterparty have entered into a credit support annex requiring either party to post collateral when net exposures exceed pre-determined thresholds. These thresholds vary by counterparty and credit rating. The amount of such exposure is essentially the net replacement cost or market value less collateral held for such agreements with each counterparty if the net market value is in our favor. As of December 31, 2016, our exposure was $5 million.
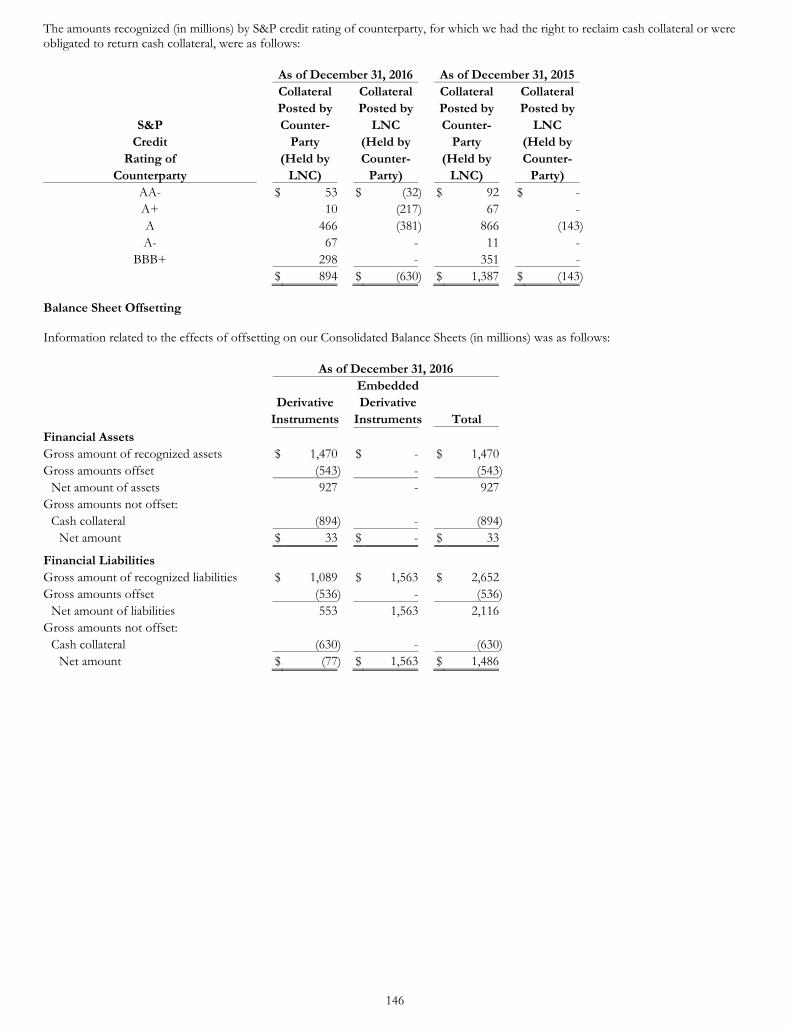
146
The amounts recognized (in millions) by S&P credit rating of counterparty, for which we had the right to reclaim cash collateral or were obligated to return cash collateral, were as follows:
As of December 31, 2016 As of December 31, 2015 Collateral Collateral Collateral Collateral Posted by Posted by Posted by Posted by
S&P Counter- LNC Counter- LNC Credit Party (Held by Party (Held by
Rating of (Held by Counter- (Held by Counter- Counterparty LNC) Party) LNC) Party)
AA- $ 53 $ (32) $ 92 $ - A+ 10 (217) 67 - A 466 (381) 866 (143) A- 67 - 11 -
BBB+ 298 - 351 - $ 894 $ (630) $ 1,387 $ (143) Balance Sheet Offsetting Information related to the effects of offsetting on our Consolidated Balance Sheets (in millions) was as follows:
As of December 31, 2016 Embedded Derivative Derivative Instruments Instruments Total Financial Assets Gross amount of recognized assets $ 1,470 $ - $ 1,470 Gross amounts offset (543) - (543)
Net amount of assets 927 - 927 Gross amounts not offset:
Cash collateral (894) - (894) Net amount $ 33 $ - $ 33
Financial Liabilities Gross amount of recognized liabilities $ 1,089 $ 1,563 $ 2,652 Gross amounts offset (536) - (536)
Net amount of liabilities 553 1,563 2,116 Gross amounts not offset:
Cash collateral (630) - (630) Net amount $ (77) $ 1,563 $ 1,486
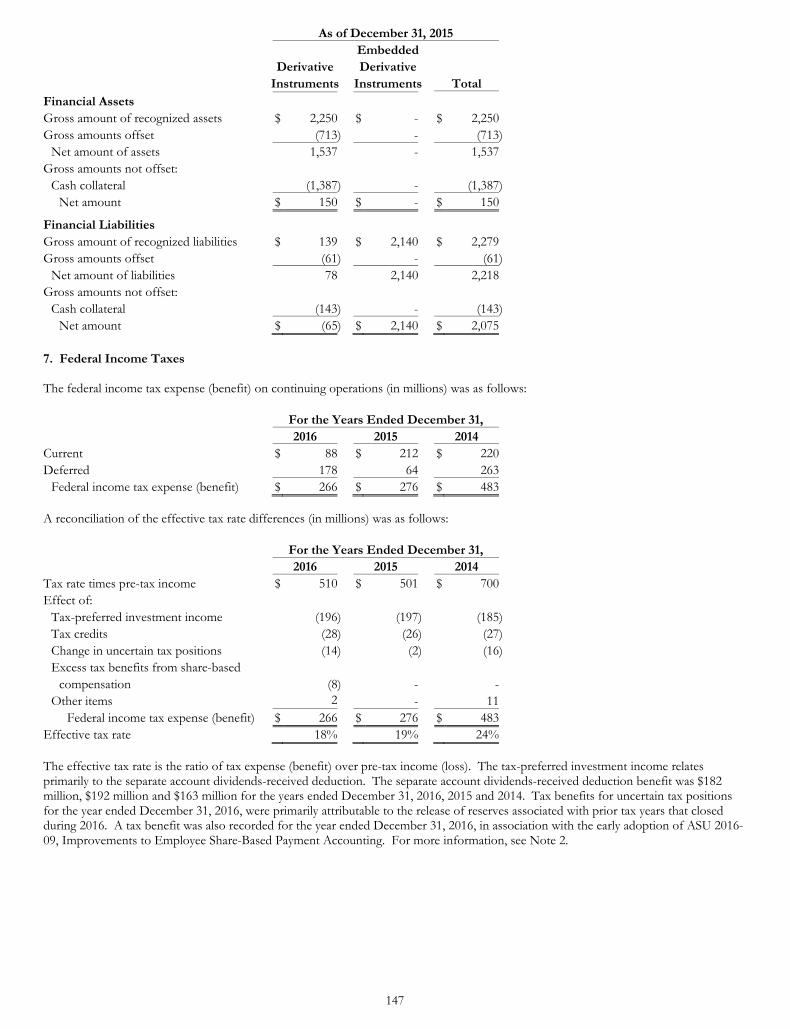
147
As of December 31, 2015 Embedded Derivative Derivative Instruments Instruments Total Financial Assets Gross amount of recognized assets $ 2,250 $ - $ 2,250 Gross amounts offset (713) - (713)
Net amount of assets 1,537 - 1,537 Gross amounts not offset:
Cash collateral (1,387) - (1,387) Net amount $ 150 $ - $ 150
Financial Liabilities Gross amount of recognized liabilities $ 139 $ 2,140 $ 2,279 Gross amounts offset (61) - (61)
Net amount of liabilities 78 2,140 2,218 Gross amounts not offset:
Cash collateral (143) - (143) Net amount $ (65) $ 2,140 $ 2,075
7. Federal Income Taxes The federal income tax expense (benefit) on continuing operations (in millions) was as follows:
For the Years Ended December 31, 2016 2015 2014 Current $ 88 $ 212 $ 220 Deferred 178 64 263
Federal income tax expense (benefit) $ 266 $ 276 $ 483 A reconciliation of the effective tax rate differences (in millions) was as follows:
For the Years Ended December 31, 2016 2015 2014 Tax rate times pre-tax income $ 510 $ 501 $ 700 Effect of:
Tax-preferred investment income (196) (197) (185) Tax credits (28) (26) (27) Change in uncertain tax positions (14) (2) (16) Excess tax benefits from share-based
compensation (8) - - Other items 2 - 11
Federal income tax expense (benefit) $ 266 $ 276 $ 483 Effective tax rate 18% 19% 24%
The effective tax rate is the ratio of tax expense (benefit) over pre-tax income (loss). The tax-preferred investment income relates primarily to the separate account dividends-received deduction. The separate account dividends-received deduction benefit was $182 million, $192 million and $163 million for the years ended December 31, 2016, 2015 and 2014. Tax benefits for uncertain tax positions for the year ended December 31, 2016, were primarily attributable to the release of reserves associated with prior tax years that closed during 2016. A tax benefit was also recorded for the year ended December 31, 2016, in association with the early adoption of ASU 2016-09, Improvements to Employee Share-Based Payment Accounting. For more information, see Note 2.
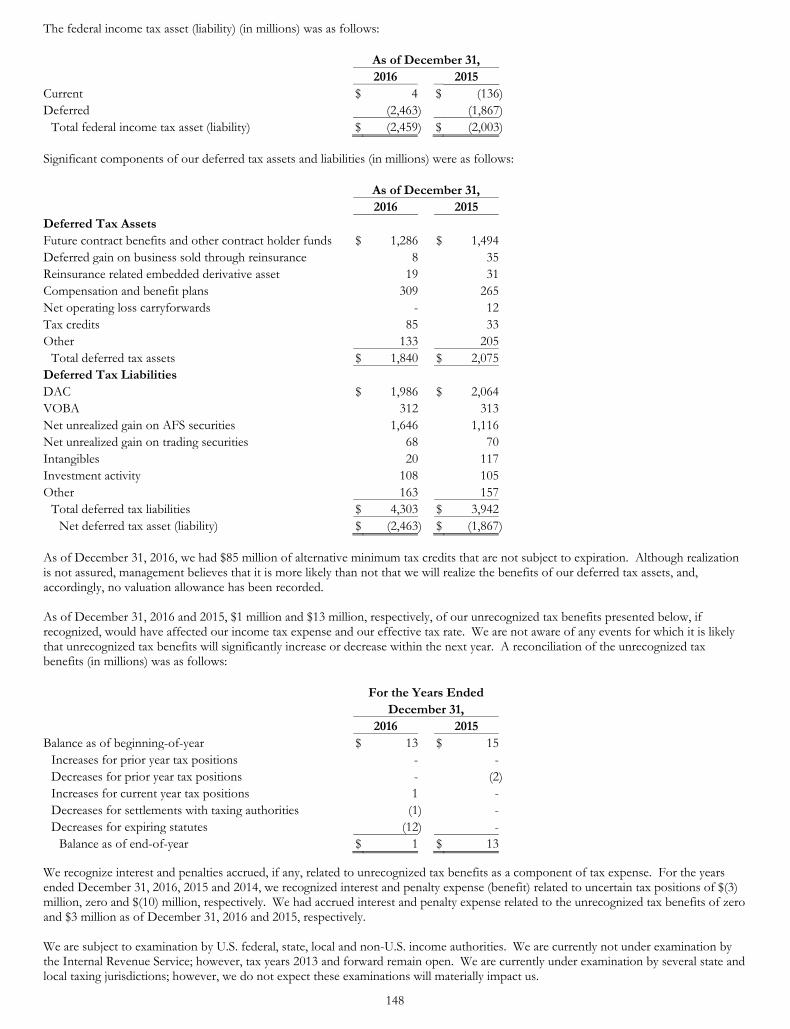
148
The federal income tax asset (liability) (in millions) was as follows:
As of December 31, 2016 2015 Current $ 4 $ (136) Deferred (2,463) (1,867)
Total federal income tax asset (liability) $ (2,459) $ (2,003) Significant components of our deferred tax assets and liabilities (in millions) were as follows:
As of December 31, 2016 2015 Deferred Tax Assets Future contract benefits and other contract holder funds $ 1,286 $ 1,494 Deferred gain on business sold through reinsurance 8 35 Reinsurance related embedded derivative asset 19 31 Compensation and benefit plans 309 265 Net operating loss carryforwards - 12 Tax credits 85 33 Other 133 205
Total deferred tax assets $ 1,840 $ 2,075 Deferred Tax Liabilities DAC $ 1,986 $ 2,064 VOBA 312 313 Net unrealized gain on AFS securities 1,646 1,116 Net unrealized gain on trading securities 68 70 Intangibles 20 117 Investment activity 108 105 Other 163 157
Total deferred tax liabilities $ 4,303 $ 3,942 Net deferred tax asset (liability) $ (2,463) $ (1,867)
As of December 31, 2016, we had $85 million of alternative minimum tax credits that are not subject to expiration. Although realization is not assured, management believes that it is more likely than not that we will realize the benefits of our deferred tax assets, and, accordingly, no valuation allowance has been recorded. As of December 31, 2016 and 2015, $1 million and $13 million, respectively, of our unrecognized tax benefits presented below, if recognized, would have affected our income tax expense and our effective tax rate. We are not aware of any events for which it is likely that unrecognized tax benefits will significantly increase or decrease within the next year. A reconciliation of the unrecognized tax benefits (in millions) was as follows:
For the Years Ended December 31, 2016 2015 Balance as of beginning-of-year $ 13 $ 15
Increases for prior year tax positions - - Decreases for prior year tax positions - (2) Increases for current year tax positions 1 - Decreases for settlements with taxing authorities (1) - Decreases for expiring statutes (12) -
Balance as of end-of-year $ 1 $ 13 We recognize interest and penalties accrued, if any, related to unrecognized tax benefits as a component of tax expense. For the years ended December 31, 2016, 2015 and 2014, we recognized interest and penalty expense (benefit) related to uncertain tax positions of $(3) million, zero and $(10) million, respectively. We had accrued interest and penalty expense related to the unrecognized tax benefits of zero and $3 million as of December 31, 2016 and 2015, respectively. We are subject to examination by U.S. federal, state, local and non-U.S. income authorities. We are currently not under examination by the Internal Revenue Service; however, tax years 2013 and forward remain open. We are currently under examination by several state and local taxing jurisdictions; however, we do not expect these examinations will materially impact us.
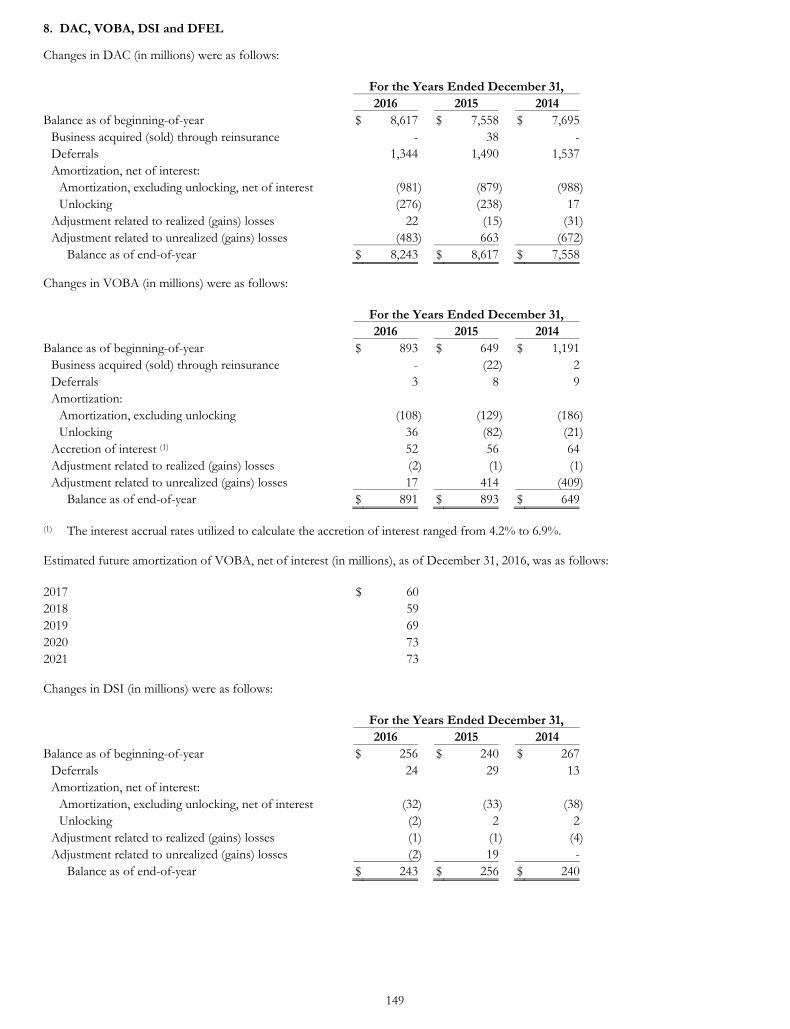
149
8. DAC, VOBA, DSI and DFEL Changes in DAC (in millions) were as follows:
For the Years Ended December 31, 2016 2015 2014 Balance as of beginning-of-year $ 8,617 $ 7,558 $ 7,695
Business acquired (sold) through reinsurance - 38 - Deferrals 1,344 1,490 1,537 Amortization, net of interest:
Amortization, excluding unlocking, net of interest (981) (879) (988) Unlocking (276) (238) 17
Adjustment related to realized (gains) losses 22 (15) (31) Adjustment related to unrealized (gains) losses (483) 663 (672)
Balance as of end-of-year $ 8,243 $ 8,617 $ 7,558 Changes in VOBA (in millions) were as follows:
For the Years Ended December 31, 2016 2015 2014 Balance as of beginning-of-year $ 893 $ 649 $ 1,191
Business acquired (sold) through reinsurance - (22) 2 Deferrals 3 8 9 Amortization:
Amortization, excluding unlocking (108) (129) (186) Unlocking 36 (82) (21)
Accretion of interest (1) 52 56 64 Adjustment related to realized (gains) losses (2) (1) (1) Adjustment related to unrealized (gains) losses 17 414 (409)
Balance as of end-of-year $ 891 $ 893 $ 649 (1) The interest accrual rates utilized to calculate the accretion of interest ranged from 4.2% to 6.9%. Estimated future amortization of VOBA, net of interest (in millions), as of December 31, 2016, was as follows:
2017 $ 60 2018 59 2019 69 2020 73 2021 73 Changes in DSI (in millions) were as follows:
For the Years Ended December 31, 2016 2015 2014 Balance as of beginning-of-year $ 256 $ 240 $ 267
Deferrals 24 29 13 Amortization, net of interest:
Amortization, excluding unlocking, net of interest (32) (33) (38) Unlocking (2) 2 2
Adjustment related to realized (gains) losses (1) (1) (4) Adjustment related to unrealized (gains) losses (2) 19 -
Balance as of end-of-year $ 243 $ 256 $ 240
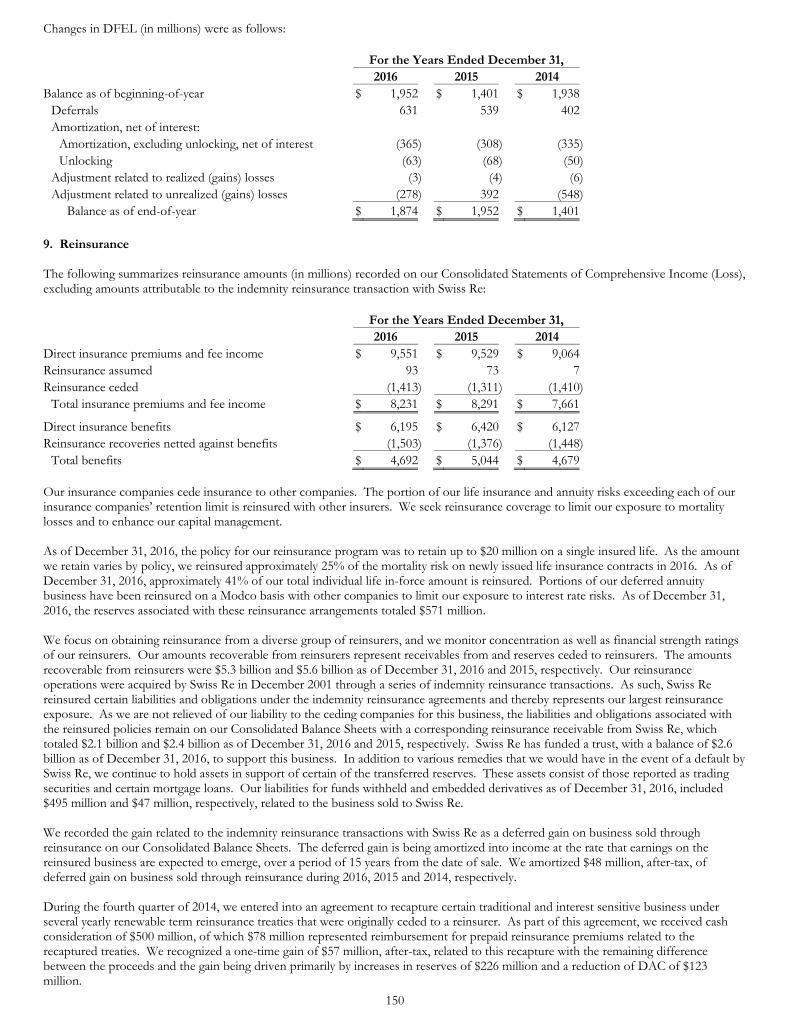
150
Changes in DFEL (in millions) were as follows:
For the Years Ended December 31, 2016 2015 2014 Balance as of beginning-of-year $ 1,952 $ 1,401 $ 1,938
Deferrals 631 539 402 Amortization, net of interest:
Amortization, excluding unlocking, net of interest (365) (308) (335) Unlocking (63) (68) (50)
Adjustment related to realized (gains) losses (3) (4) (6) Adjustment related to unrealized (gains) losses (278) 392 (548)
Balance as of end-of-year $ 1,874 $ 1,952 $ 1,401
9. Reinsurance The following summarizes reinsurance amounts (in millions) recorded on our Consolidated Statements of Comprehensive Income (Loss), excluding amounts attributable to the indemnity reinsurance transaction with Swiss Re:
For the Years Ended December 31, 2016 2015 2014 Direct insurance premiums and fee income $ 9,551 $ 9,529 $ 9,064 Reinsurance assumed 93 73 7 Reinsurance ceded (1,413) (1,311) (1,410)
Total insurance premiums and fee income $ 8,231 $ 8,291 $ 7,661
Direct insurance benefits $ 6,195 $ 6,420 $ 6,127 Reinsurance recoveries netted against benefits (1,503) (1,376) (1,448)
Total benefits $ 4,692 $ 5,044 $ 4,679 Our insurance companies cede insurance to other companies. The portion of our life insurance and annuity risks exceeding each of our insurance companies’ retention limit is reinsured with other insurers. We seek reinsurance coverage to limit our exposure to mortality losses and to enhance our capital management. As of December 31, 2016, the policy for our reinsurance program was to retain up to $20 million on a single insured life. As the amount we retain varies by policy, we reinsured approximately 25% of the mortality risk on newly issued life insurance contracts in 2016. As of December 31, 2016, approximately 41% of our total individual life in-force amount is reinsured. Portions of our deferred annuity business have been reinsured on a Modco basis with other companies to limit our exposure to interest rate risks. As of December 31, 2016, the reserves associated with these reinsurance arrangements totaled $571 million. We focus on obtaining reinsurance from a diverse group of reinsurers, and we monitor concentration as well as financial strength ratings of our reinsurers. Our amounts recoverable from reinsurers represent receivables from and reserves ceded to reinsurers. The amounts recoverable from reinsurers were $5.3 billion and $5.6 billion as of December 31, 2016 and 2015, respectively. Our reinsurance operations were acquired by Swiss Re in December 2001 through a series of indemnity reinsurance transactions. As such, Swiss Re reinsured certain liabilities and obligations under the indemnity reinsurance agreements and thereby represents our largest reinsurance exposure. As we are not relieved of our liability to the ceding companies for this business, the liabilities and obligations associated with the reinsured policies remain on our Consolidated Balance Sheets with a corresponding reinsurance receivable from Swiss Re, which totaled $2.1 billion and $2.4 billion as of December 31, 2016 and 2015, respectively. Swiss Re has funded a trust, with a balance of $2.6 billion as of December 31, 2016, to support this business. In addition to various remedies that we would have in the event of a default by Swiss Re, we continue to hold assets in support of certain of the transferred reserves. These assets consist of those reported as trading securities and certain mortgage loans. Our liabilities for funds withheld and embedded derivatives as of December 31, 2016, included $495 million and $47 million, respectively, related to the business sold to Swiss Re. We recorded the gain related to the indemnity reinsurance transactions with Swiss Re as a deferred gain on business sold through reinsurance on our Consolidated Balance Sheets. The deferred gain is being amortized into income at the rate that earnings on the reinsured business are expected to emerge, over a period of 15 years from the date of sale. We amortized $48 million, after-tax, of deferred gain on business sold through reinsurance during 2016, 2015 and 2014, respectively. During the fourth quarter of 2014, we entered into an agreement to recapture certain traditional and interest sensitive business under several yearly renewable term reinsurance treaties that were originally ceded to a reinsurer. As part of this agreement, we received cash consideration of $500 million, of which $78 million represented reimbursement for prepaid reinsurance premiums related to the recaptured treaties. We recognized a one-time gain of $57 million, after-tax, related to this recapture with the remaining difference between the proceeds and the gain being driven primarily by increases in reserves of $226 million and a reduction of DAC of $123 million.
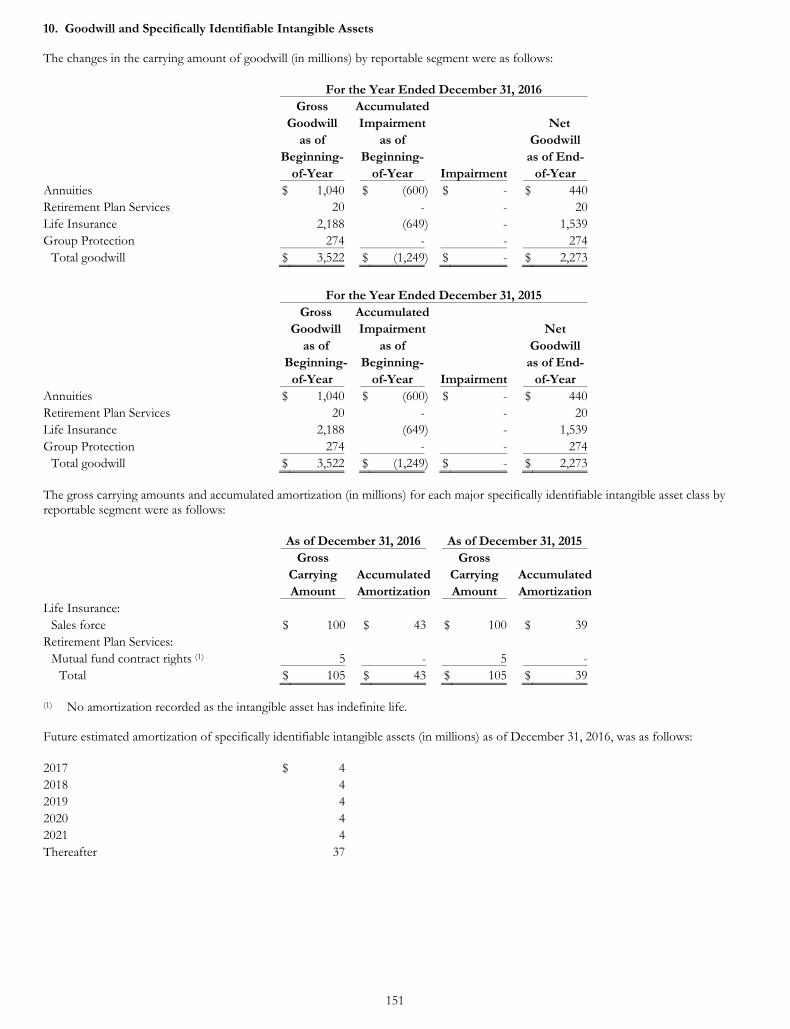
151
10. Goodwill and Specifically Identifiable Intangible Assets The changes in the carrying amount of goodwill (in millions) by reportable segment were as follows:
For the Year Ended December 31, 2016 Gross Accumulated Goodwill Impairment Net as of as of Goodwill Beginning- Beginning- as of End- of-Year of-Year Impairment of-Year Annuities $ 1,040 $ (600) $ - $ 440 Retirement Plan Services 20 - - 20 Life Insurance 2,188 (649) - 1,539 Group Protection 274 - - 274
Total goodwill $ 3,522 $ (1,249) $ - $ 2,273
For the Year Ended December 31, 2015 Gross Accumulated Goodwill Impairment Net as of as of Goodwill Beginning- Beginning- as of End- of-Year of-Year Impairment of-Year Annuities $ 1,040 $ (600) $ - $ 440 Retirement Plan Services 20 - - 20 Life Insurance 2,188 (649) - 1,539 Group Protection 274 - - 274
Total goodwill $ 3,522 $ (1,249) $ - $ 2,273 The gross carrying amounts and accumulated amortization (in millions) for each major specifically identifiable intangible asset class by reportable segment were as follows:
As of December 31, 2016 As of December 31, 2015 Gross Gross Carrying Accumulated Carrying Accumulated Amount Amortization Amount Amortization Life Insurance:
Sales force $ 100 $ 43 $ 100 $ 39 Retirement Plan Services:
Mutual fund contract rights (1) 5 - 5 - Total $ 105 $ 43 $ 105 $ 39
(1) No amortization recorded as the intangible asset has indefinite life. Future estimated amortization of specifically identifiable intangible assets (in millions) as of December 31, 2016, was as follows:
2017 $ 4 2018 4 2019 4 2020 4 2021 4 Thereafter 37
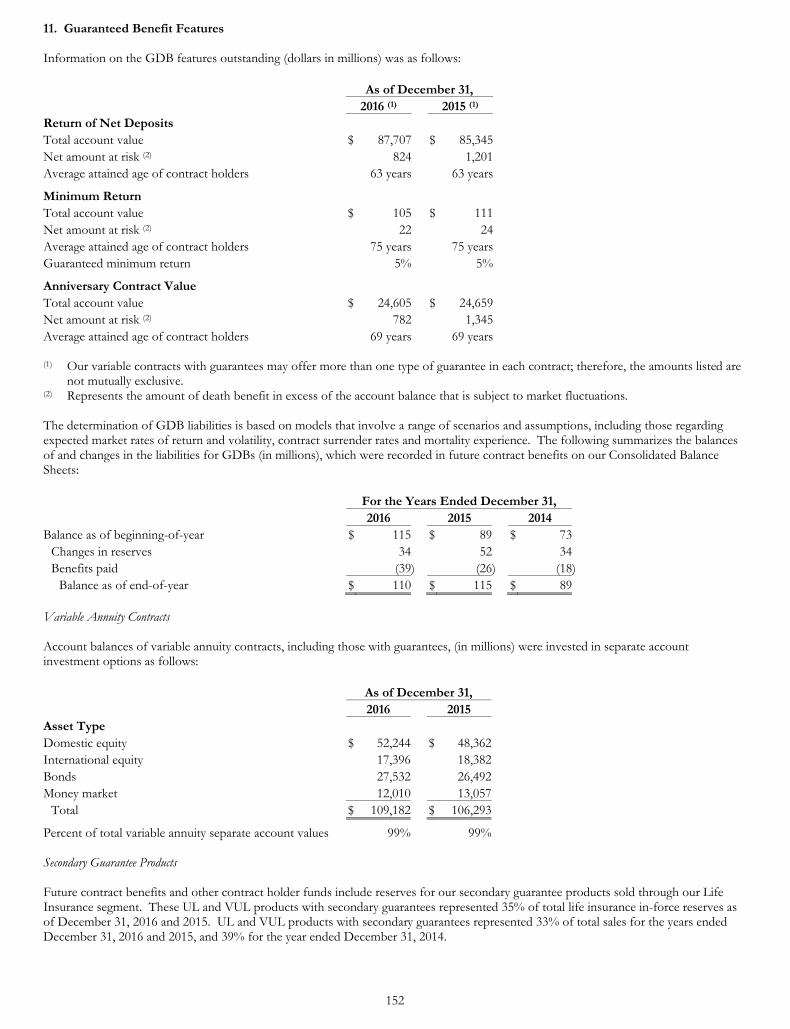
152
11. Guaranteed Benefit Features Information on the GDB features outstanding (dollars in millions) was as follows:
As of December 31, 2016 (1) 2015 (1) Return of Net Deposits Total account value $ 87,707 $ 85,345 Net amount at risk (2) 824 1,201 Average attained age of contract holders 63 years 63 years
Minimum Return Total account value $ 105 $ 111 Net amount at risk (2) 22 24 Average attained age of contract holders 75 years 75 years Guaranteed minimum return 5% 5%
Anniversary Contract Value Total account value $ 24,605 $ 24,659 Net amount at risk (2) 782 1,345 Average attained age of contract holders 69 years 69 years
(1) Our variable contracts with guarantees may offer more than one type of guarantee in each contract; therefore, the amounts listed are
not mutually exclusive. (2) Represents the amount of death benefit in excess of the account balance that is subject to market fluctuations. The determination of GDB liabilities is based on models that involve a range of scenarios and assumptions, including those regarding expected market rates of return and volatility, contract surrender rates and mortality experience. The following summarizes the balances of and changes in the liabilities for GDBs (in millions), which were recorded in future contract benefits on our Consolidated Balance Sheets:
For the Years Ended December 31, 2016 2015 2014 Balance as of beginning-of-year $ 115 $ 89 $ 73
Changes in reserves 34 52 34 Benefits paid (39) (26) (18)
Balance as of end-of-year $ 110 $ 115 $ 89 Variable Annuity Contracts Account balances of variable annuity contracts, including those with guarantees, (in millions) were invested in separate account investment options as follows:
As of December 31, 2016 2015 Asset Type Domestic equity $ 52,244 $ 48,362 International equity 17,396 18,382 Bonds 27,532 26,492 Money market 12,010 13,057
Total $ 109,182 $ 106,293
Percent of total variable annuity separate account values 99% 99% Secondary Guarantee Products Future contract benefits and other contract holder funds include reserves for our secondary guarantee products sold through our Life Insurance segment. These UL and VUL products with secondary guarantees represented 35% of total life insurance in-force reserves as of December 31, 2016 and 2015. UL and VUL products with secondary guarantees represented 33% of total sales for the years ended December 31, 2016 and 2015, and 39% for the year ended December 31, 2014.
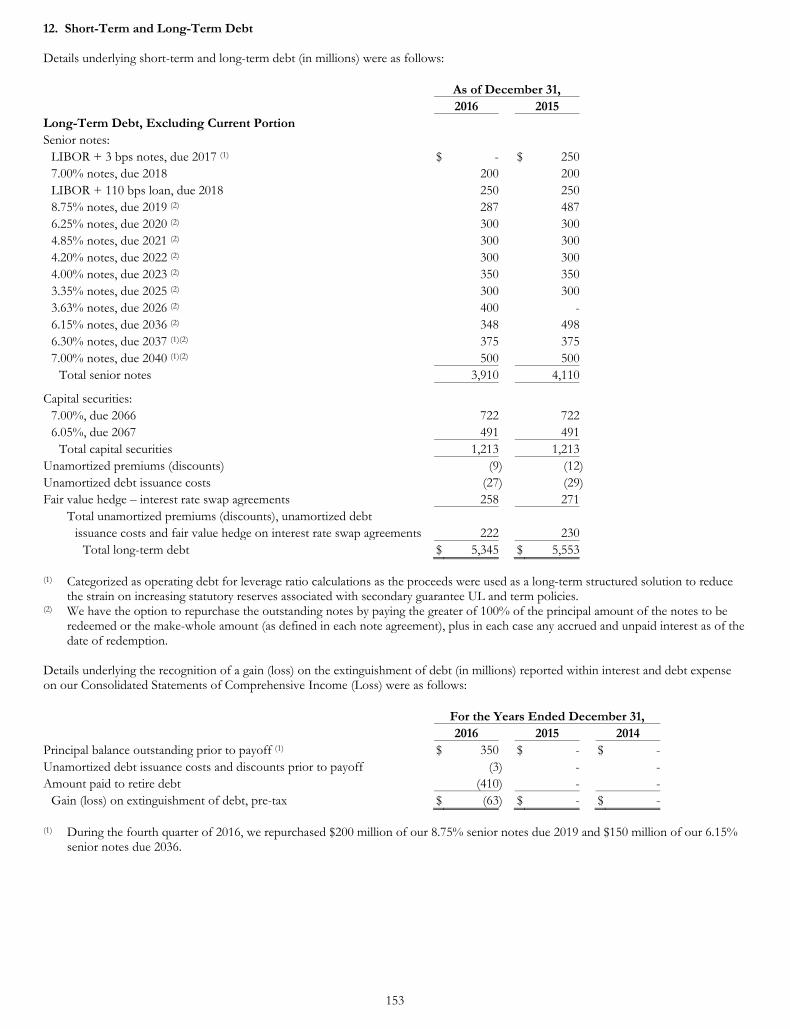
153
12. Short-Term and Long-Term Debt Details underlying short-term and long-term debt (in millions) were as follows:
As of December 31, 2016 2015 Long-Term Debt, Excluding Current Portion Senior notes:
LIBOR + 3 bps notes, due 2017 (1) $ - $ 250 7.00% notes, due 2018 200 200 LIBOR + 110 bps loan, due 2018 250 250 8.75% notes, due 2019 (2) 287 487 6.25% notes, due 2020 (2) 300 300 4.85% notes, due 2021 (2) 300 300 4.20% notes, due 2022 (2) 300 300 4.00% notes, due 2023 (2) 350 350 3.35% notes, due 2025 (2) 300 300 3.63% notes, due 2026 (2) 400 - 6.15% notes, due 2036 (2) 348 498 6.30% notes, due 2037 (1)(2) 375 375 7.00% notes, due 2040 (1)(2) 500 500
Total senior notes 3,910 4,110
Capital securities: 7.00%, due 2066 722 722 6.05%, due 2067 491 491
Total capital securities 1,213 1,213 Unamortized premiums (discounts) (9) (12) Unamortized debt issuance costs (27) (29) Fair value hedge – interest rate swap agreements 258 271
Total unamortized premiums (discounts), unamortized debt issuance costs and fair value hedge on interest rate swap agreements 222 230
Total long-term debt $ 5,345 $ 5,553 (1) Categorized as operating debt for leverage ratio calculations as the proceeds were used as a long-term structured solution to reduce
the strain on increasing statutory reserves associated with secondary guarantee UL and term policies. (2) We have the option to repurchase the outstanding notes by paying the greater of 100% of the principal amount of the notes to be
redeemed or the make-whole amount (as defined in each note agreement), plus in each case any accrued and unpaid interest as of the date of redemption.
Details underlying the recognition of a gain (loss) on the extinguishment of debt (in millions) reported within interest and debt expense on our Consolidated Statements of Comprehensive Income (Loss) were as follows:
For the Years Ended December 31, 2016 2015 2014 Principal balance outstanding prior to payoff (1) $ 350 $ - $ - Unamortized debt issuance costs and discounts prior to payoff (3) - - Amount paid to retire debt (410) - -
Gain (loss) on extinguishment of debt, pre-tax $ (63) $ - $ -
(1) During the fourth quarter of 2016, we repurchased $200 million of our 8.75% senior notes due 2019 and $150 million of our 6.15% senior notes due 2036.
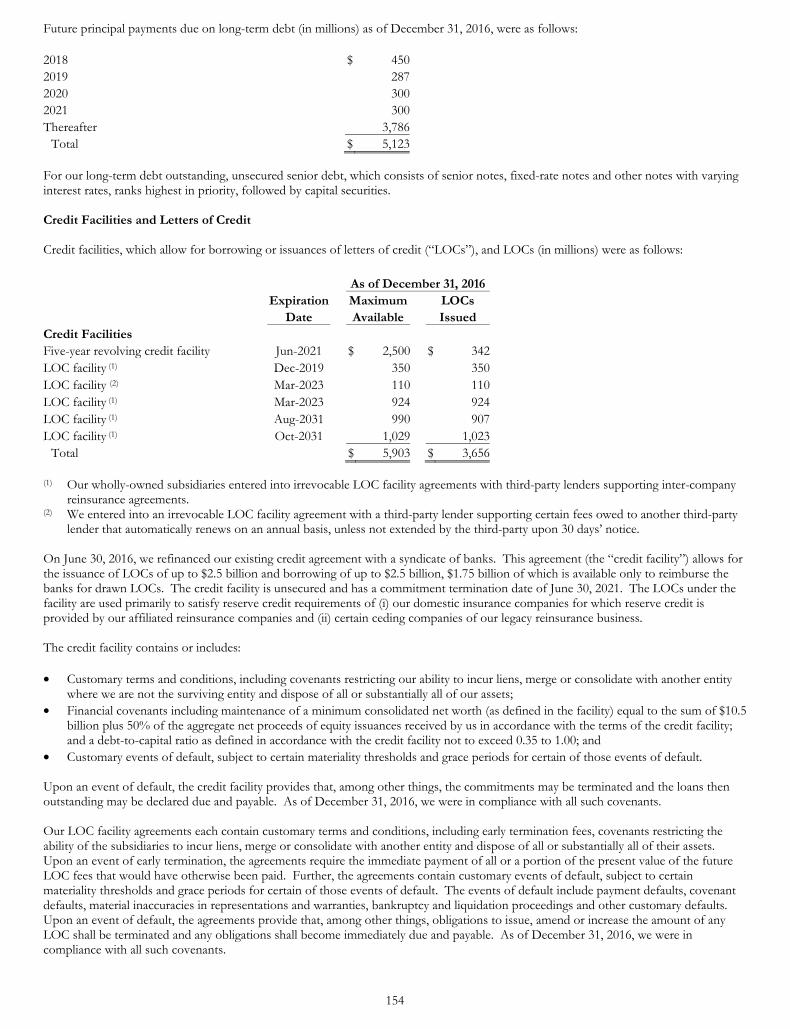
154
Future principal payments due on long-term debt (in millions) as of December 31, 2016, were as follows:
2018 $ 450 2019 287 2020 300 2021 300 Thereafter 3,786
Total $ 5,123 For our long-term debt outstanding, unsecured senior debt, which consists of senior notes, fixed-rate notes and other notes with varying interest rates, ranks highest in priority, followed by capital securities. Credit Facilities and Letters of Credit Credit facilities, which allow for borrowing or issuances of letters of credit (“LOCs”), and LOCs (in millions) were as follows:
As of December 31, 2016 Expiration Maximum LOCs Date Available Issued Credit Facilities Five-year revolving credit facility Jun-2021 $ 2,500 $ 342 LOC facility (1) Dec-2019 350 350 LOC facility (2) Mar-2023 110 110 LOC facility (1) Mar-2023 924 924 LOC facility (1) Aug-2031 990 907 LOC facility (1) Oct-2031 1,029 1,023
Total $ 5,903 $ 3,656
(1) Our wholly-owned subsidiaries entered into irrevocable LOC facility agreements with third-party lenders supporting inter-company reinsurance agreements.
(2) We entered into an irrevocable LOC facility agreement with a third-party lender supporting certain fees owed to another third-party lender that automatically renews on an annual basis, unless not extended by the third-party upon 30 days’ notice.
On June 30, 2016, we refinanced our existing credit agreement with a syndicate of banks. This agreement (the “credit facility”) allows for the issuance of LOCs of up to $2.5 billion and borrowing of up to $2.5 billion, $1.75 billion of which is available only to reimburse the banks for drawn LOCs. The credit facility is unsecured and has a commitment termination date of June 30, 2021. The LOCs under the facility are used primarily to satisfy reserve credit requirements of (i) our domestic insurance companies for which reserve credit is provided by our affiliated reinsurance companies and (ii) certain ceding companies of our legacy reinsurance business. The credit facility contains or includes: • Customary terms and conditions, including covenants restricting our ability to incur liens, merge or consolidate with another entity
where we are not the surviving entity and dispose of all or substantially all of our assets; • Financial covenants including maintenance of a minimum consolidated net worth (as defined in the facility) equal to the sum of $10.5
billion plus 50% of the aggregate net proceeds of equity issuances received by us in accordance with the terms of the credit facility; and a debt-to-capital ratio as defined in accordance with the credit facility not to exceed 0.35 to 1.00; and
• Customary events of default, subject to certain materiality thresholds and grace periods for certain of those events of default. Upon an event of default, the credit facility provides that, among other things, the commitments may be terminated and the loans then outstanding may be declared due and payable. As of December 31, 2016, we were in compliance with all such covenants. Our LOC facility agreements each contain customary terms and conditions, including early termination fees, covenants restricting the ability of the subsidiaries to incur liens, merge or consolidate with another entity and dispose of all or substantially all of their assets. Upon an event of early termination, the agreements require the immediate payment of all or a portion of the present value of the future LOC fees that would have otherwise been paid. Further, the agreements contain customary events of default, subject to certain materiality thresholds and grace periods for certain of those events of default. The events of default include payment defaults, covenant defaults, material inaccuracies in representations and warranties, bankruptcy and liquidation proceedings and other customary defaults. Upon an event of default, the agreements provide that, among other things, obligations to issue, amend or increase the amount of any LOC shall be terminated and any obligations shall become immediately due and payable. As of December 31, 2016, we were in compliance with all such covenants.
155
Shelf Registration We currently have an effective shelf registration statement, which allows us to issue, in unlimited amounts, securities, including debt securities, preferred stock, common stock, warrants, stock purchase contracts, stock purchase units and depository shares. Certain Debt Covenants on Capital Securities Our $1.2 billion in principal amount of capital securities outstanding contain certain covenants that require us to make interest payments in accordance with an alternative coupon satisfaction mechanism (“ACSM”) if we determine that one of the following trigger events exists as of the 30th day prior to an interest payment date (“determination date”): • The Lincoln National Life Insurance Company’s (“LNL”) risk-based capital (“RBC”) ratio is less than 175% (based on the most
recent annual financial statement filed with the State of Indiana); or • (i) The sum of our consolidated net income for the four trailing fiscal quarters ending on the quarter that is two quarters prior to the
most recently completed quarter prior to the determination date is zero or negative; and (ii) our consolidated stockholders’ equity (excluding AOCI and any increase in stockholders’ equity resulting from the issuance of preferred stock during a quarter), or “adjusted stockholders’ equity,” as of (x) the most recently completed quarter and (y) the end of the quarter that is two quarters before the most recently completed quarter, has declined by 10% or more as compared to the quarter that is 10 fiscal quarters prior to the last completed quarter, or the “benchmark quarter.”
The ACSM would generally require us to use commercially reasonable efforts to satisfy our obligation to pay interest in full on the capital securities with the net proceeds from sales of our common stock and warrants to purchase our common stock with an exercise price greater than the market price. We would have to utilize the ACSM until the trigger events no longer existed. Our failure to pay interest pursuant to the ACSM will not result in an event of default with respect to the capital securities nor will a nonpayment of interest unless it lasts for 10 consecutive years, although such breaches may result in monetary damages to the holders of the capital securities. As of December 31, 2016, we were in compliance with all such covenants. 13. Contingencies and Commitments Contingencies Regulatory and Litigation Matters Regulatory bodies, such as state insurance departments, the SEC, Financial Industry Regulatory Authority and other regulatory bodies regularly make inquiries and conduct examinations or investigations concerning our compliance with, among other things, insurance laws, securities laws, laws governing the activities of broker-dealers, registered investment advisors and unclaimed property laws. LNC is involved in various pending or threatened legal or regulatory proceedings, including purported class actions, arising from the conduct of business both in the ordinary course and otherwise. In some of the matters, very large and/or indeterminate amounts, including punitive and treble damages, are sought. Modern pleading practice in the U.S. permits considerable variation in the assertion of monetary damages or other relief. Jurisdictions may permit claimants not to specify the monetary damages sought or may permit claimants to state only that the amount sought is sufficient to invoke the jurisdiction of the trial court. In addition, jurisdictions may permit plaintiffs to allege monetary damages in amounts well exceeding verdicts obtained in the jurisdiction for similar matters. This variability in pleadings, together with the actual experiences of LNC in litigating or resolving through settlement numerous claims over an extended period of time, demonstrates to management that the monetary relief which may be specified in a lawsuit or claim bears little relevance to its merits or disposition value. Due to the unpredictable nature of litigation, the outcome of a litigation matter and the amount or range of potential loss at particular points in time is normally difficult to ascertain. Uncertainties can include how fact finders will evaluate documentary evidence and the credibility and effectiveness of witness testimony, and how trial and appellate courts will apply the law in the context of the pleadings or evidence presented, whether by motion practice, or at trial or on appeal. Disposition valuations are also subject to the uncertainty of how opposing parties and their counsel will themselves view the relevant evidence and applicable law. We establish liabilities for litigation and regulatory loss contingencies when information related to the loss contingencies shows both that it is probable that a loss has been incurred and the amount of the loss can be reasonably estimated. It is possible that some matters could require us to pay damages or make other expenditures or establish accruals in amounts that could not be estimated as of December 31, 2016. While the potential future charges could be material in the particular quarterly or annual periods in which they are recorded, based on information currently known by management, management does not believe any such charges are likely to have a material adverse effect on LNC’s financial condition. For some matters, the Company is able to estimate a reasonably possible range of loss. For such matters in which a loss is probable, an accrual has been made. For such matters where a loss is believed to be reasonably possible, but not probable, no accrual has been made. Accordingly, the estimate contained in this paragraph reflects two types of matters. For some matters included within this estimate, an accrual has been made, but there is a reasonable possibility that an exposure exists in excess of the amount accrued. In these cases, the estimate reflects the reasonably possible range of loss in excess of the accrued amount. For other matters included within this estimation,

156
no accrual has been made because a loss, while potentially estimable, is believed to be reasonably possible but not probable. In these cases, the estimate reflects the reasonably possible loss or range of loss. As of December 31, 2016, we estimate the aggregate range of reasonably possible losses to be up to approximately $50 million. For other matters, we are not currently able to estimate the reasonably possible loss or range of loss. We are often unable to estimate the possible loss or range of loss until developments in such matters have provided sufficient information to support an assessment of the range of possible loss, such as quantification of a damage demand from plaintiffs, discovery from other parties and investigation of factual allegations, rulings by the court on motions or appeals, analysis by experts and the progress of settlement negotiations. On a quarterly and annual basis, we review relevant information with respect to litigation contingencies and update our accruals, disclosures and estimates of reasonably possible losses or ranges of loss based on such reviews. Cost of Insurance Litigation Glover v. Connecticut General Life Insurance Company and The Lincoln National Life Insurance Company, filed in the U.S. District Court for the District of Connecticut, No. 3:16cv00827, is a putative class action that was served on LNL on June 8, 2016. Plaintiff is the owner of a universal life insurance policy who alleges that LNL charged more for cost of insurance than permitted by the policy. Plaintiff seeks to represent all universal life and variable universal life policyholders who owned policies containing cost of insurance provisions that are similar to those of Plaintiff’s policy and seeks damages on behalf of all such policyholders. We are vigorously defending this matter. Helen Hanks v. The Lincoln Life and Annuity Company of New York (“LLANY”) and Voya Retirement Insurance and Annuity Company (“Voya”), filed in the U.S. District Court for the Southern District of New York, No. 16cv6399, is a putative class action that was served on LLANY on August 12, 2016. Plaintiff owns a universal life policy originally issued by Aetna (now Voya) and alleges that (i) Voya breached the terms of the policy when it increased cost of insurance rates on Plaintiff’s policy; and (ii) LLANY, as reinsurer and administrator of Plaintiff’s policy, engaged in wrongful conduct related to the cost of insurance increase and was unjustly enriched as a result. Plaintiff seeks to represent all owners of Aetna life insurance policies that were subject to cost of insurance rate increases in 2016 and seeks damages on their behalf. We are vigorously defending this matter. Bharwani, et al. v. Lincoln National Corporation and Lincoln National Life Insurance Company, pending in the U.S. District Court for the Eastern District of Pennsylvania, No. 16-cv-06605, is a putative class action filed on December 23, 2016. Plaintiffs own universal life insurance policies originally issued by Jefferson-Pilot (now Lincoln). Plaintiffs allege that Lincoln and LNL breached the terms of policyholders’ contracts when they increased cost of insurance rates beginning in September 2016. Plaintiffs seek to represent three classes of policyowners and seek damages on their behalf. We are vigorously defending this matter. Mukamal, et al. v. Lincoln National Life Insurance Company and Lincoln National Corporation, pending in the U.S. District Court for the Eastern District of Pennsylvania, No. 17-cv-00234, is a putative class action filed on January 17, 2017. This action is substantially similar to a lawsuit filed in the U.S. District Court for the Southern District of Florida in December 2016 that was subsequently dismissed. Plaintiffs, Barry Mukamal, as Trustee for the Mutual Benefits Keep Policy Trust, and Milgram Investments, LP, own universal life insurance policies originally issued by Jefferson-Pilot (now Lincoln). Plaintiffs allege that Lincoln and LNL breached the terms of policyholders’ contracts when they increased cost of insurance rates beginning in September 2016. Plaintiffs seek to represent three classes of policyowners and seek damages on their behalf. We are vigorously defending this matter. US Life 1 Renditefonds GmbH & Co. Kg and US Life 2 Renditefonds GmbH & Co. Kg v. The Lincoln National Life Insurance Company, pending in the U.S. District Court for the Eastern District of Pennsylvania, No. 2:17-cv-00307, is a putative class action filed on January 20, 2017. Plaintiffs own Legend Series universal life insurance policies originally issued by Jefferson-Pilot (now Lincoln). Plaintiffs allege that Lincoln breached the terms of policyholders’ contracts when it increased cost of insurance rates beginning in 2016. Plaintiffs seek to represent two classes of policyowners and seek damages on their behalf. We are vigorously defending this matter. EFG Bank AG, Cayman Branch, et al. v. The Lincoln National Life Insurance Company, pending in the U.S. District Court for the Central District of California, No. 2:17-cv-00817, is a civil action filed on February 1, 2017. Plaintiffs own Legend Series universal life insurance policies originally issued by Jefferson-Pilot (now Lincoln). Plaintiffs allege that Lincoln breached the terms of policyholders’ contracts when it increased cost of insurance rates beginning in 2016. We are vigorously defending this matter. Swenson, et al. v. The Lincoln National Life Insurance Company, Lincoln Life & Annuity Company of New York, Lincoln National Corporation, Voya Retirement Insurance and Annuity Company, and Voya Financial, Inc., pending in the U.S. District Court for the Eastern District of Washington, No. 2:17-cv-00048, is a putative class action filed on February 1, 2017. Plaintiffs own universal life insurance policies originally issued by Aetna (now Voya). Plaintiffs allege that Lincoln breached the terms of policyholders’ contracts when it increased cost of insurance rates beginning in 2016. Plaintiffs seek to represent multiple subclasses of policy owners and seek damages on their behalf. We are vigorously defending this matter. Commitments Operating Leases Certain subsidiaries of ours lease their home office properties. In 2006, we exercised the right and option to extend the Fort Wayne lease for two extended terms such that the lease shall expire in 2019. We retain our right and option to exercise the remaining four extended
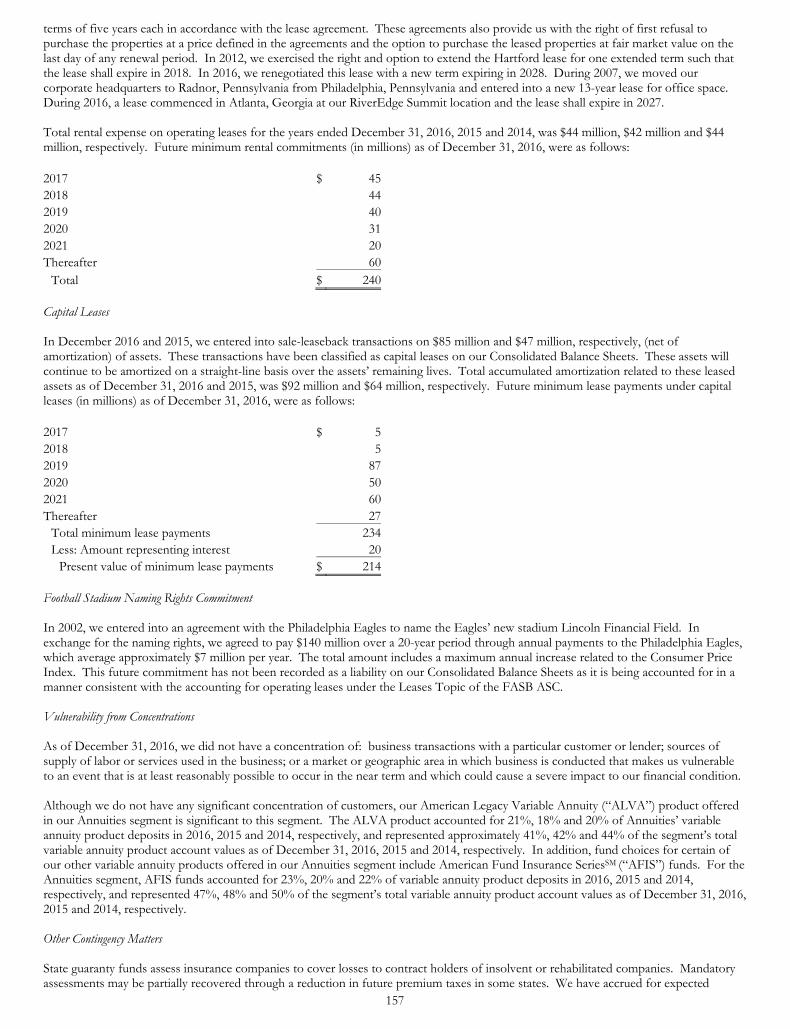
157
terms of five years each in accordance with the lease agreement. These agreements also provide us with the right of first refusal to purchase the properties at a price defined in the agreements and the option to purchase the leased properties at fair market value on the last day of any renewal period. In 2012, we exercised the right and option to extend the Hartford lease for one extended term such that the lease shall expire in 2018. In 2016, we renegotiated this lease with a new term expiring in 2028. During 2007, we moved our corporate headquarters to Radnor, Pennsylvania from Philadelphia, Pennsylvania and entered into a new 13-year lease for office space. During 2016, a lease commenced in Atlanta, Georgia at our RiverEdge Summit location and the lease shall expire in 2027. Total rental expense on operating leases for the years ended December 31, 2016, 2015 and 2014, was $44 million, $42 million and $44 million, respectively. Future minimum rental commitments (in millions) as of December 31, 2016, were as follows:
2017 $ 45 2018 44 2019 40 2020 31 2021 20 Thereafter 60
Total $ 240 Capital Leases In December 2016 and 2015, we entered into sale-leaseback transactions on $85 million and $47 million, respectively, (net of amortization) of assets. These transactions have been classified as capital leases on our Consolidated Balance Sheets. These assets will continue to be amortized on a straight-line basis over the assets’ remaining lives. Total accumulated amortization related to these leased assets as of December 31, 2016 and 2015, was $92 million and $64 million, respectively. Future minimum lease payments under capital leases (in millions) as of December 31, 2016, were as follows:
2017 $ 5 2018 5 2019 87 2020 50 2021 60 Thereafter 27
Total minimum lease payments 234 Less: Amount representing interest 20
Present value of minimum lease payments $ 214 Football Stadium Naming Rights Commitment In 2002, we entered into an agreement with the Philadelphia Eagles to name the Eagles’ new stadium Lincoln Financial Field. In exchange for the naming rights, we agreed to pay $140 million over a 20-year period through annual payments to the Philadelphia Eagles, which average approximately $7 million per year. The total amount includes a maximum annual increase related to the Consumer Price Index. This future commitment has not been recorded as a liability on our Consolidated Balance Sheets as it is being accounted for in a manner consistent with the accounting for operating leases under the Leases Topic of the FASB ASC. Vulnerability from Concentrations As of December 31, 2016, we did not have a concentration of: business transactions with a particular customer or lender; sources of supply of labor or services used in the business; or a market or geographic area in which business is conducted that makes us vulnerable to an event that is at least reasonably possible to occur in the near term and which could cause a severe impact to our financial condition. Although we do not have any significant concentration of customers, our American Legacy Variable Annuity (“ALVA”) product offered in our Annuities segment is significant to this segment. The ALVA product accounted for 21%, 18% and 20% of Annuities’ variable annuity product deposits in 2016, 2015 and 2014, respectively, and represented approximately 41%, 42% and 44% of the segment’s total variable annuity product account values as of December 31, 2016, 2015 and 2014, respectively. In addition, fund choices for certain of our other variable annuity products offered in our Annuities segment include American Fund Insurance SeriesSM (“AFIS”) funds. For the Annuities segment, AFIS funds accounted for 23%, 20% and 22% of variable annuity product deposits in 2016, 2015 and 2014, respectively, and represented 47%, 48% and 50% of the segment’s total variable annuity product account values as of December 31, 2016, 2015 and 2014, respectively. Other Contingency Matters State guaranty funds assess insurance companies to cover losses to contract holders of insolvent or rehabilitated companies. Mandatory assessments may be partially recovered through a reduction in future premium taxes in some states. We have accrued for expected
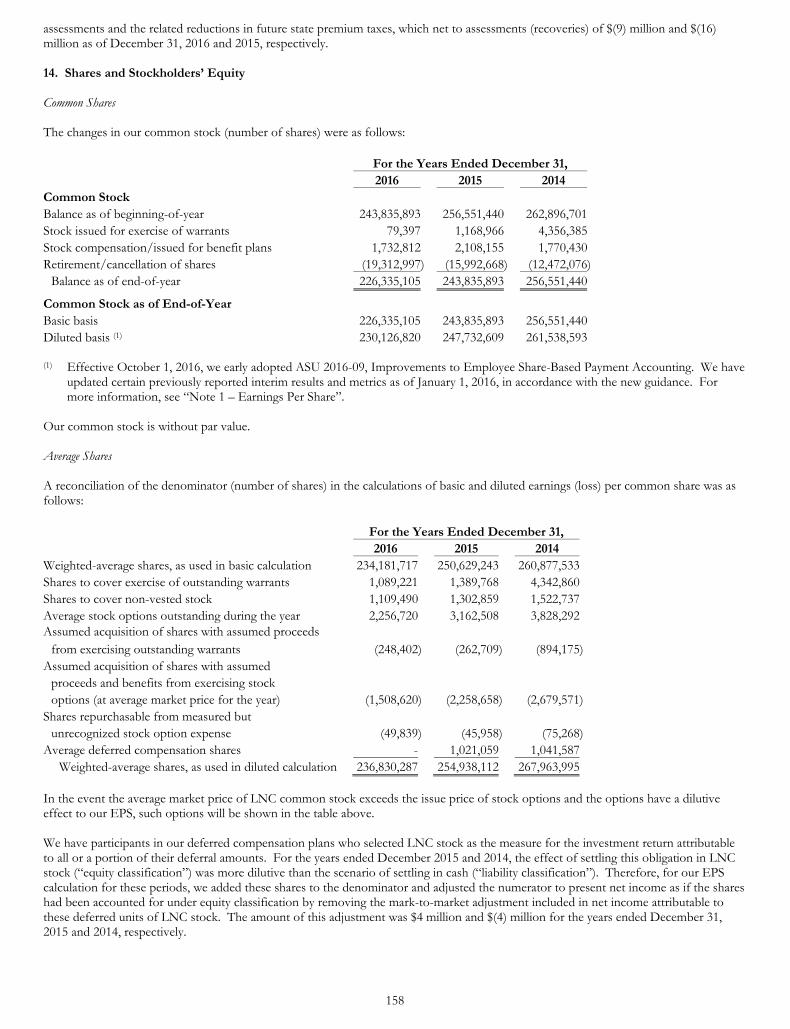
158
assessments and the related reductions in future state premium taxes, which net to assessments (recoveries) of $(9) million and $(16) million as of December 31, 2016 and 2015, respectively. 14. Shares and Stockholders’ Equity Common Shares The changes in our common stock (number of shares) were as follows:
For the Years Ended December 31, 2016 2015 2014 Common Stock Balance as of beginning-of-year 243,835,893 256,551,440 262,896,701 Stock issued for exercise of warrants 79,397 1,168,966 4,356,385 Stock compensation/issued for benefit plans 1,732,812 2,108,155 1,770,430 Retirement/cancellation of shares (19,312,997) (15,992,668) (12,472,076)
Balance as of end-of-year 226,335,105 243,835,893 256,551,440
Common Stock as of End-of-Year Basic basis 226,335,105 243,835,893 256,551,440 Diluted basis (1) 230,126,820 247,732,609 261,538,593 (1) Effective October 1, 2016, we early adopted ASU 2016-09, Improvements to Employee Share-Based Payment Accounting. We have
updated certain previously reported interim results and metrics as of January 1, 2016, in accordance with the new guidance. For more information, see “Note 1 – Earnings Per Share”.
Our common stock is without par value. Average Shares A reconciliation of the denominator (number of shares) in the calculations of basic and diluted earnings (loss) per common share was as follows:
For the Years Ended December 31, 2016 2015 2014 Weighted-average shares, as used in basic calculation 234,181,717 250,629,243 260,877,533 Shares to cover exercise of outstanding warrants 1,089,221 1,389,768 4,342,860 Shares to cover non-vested stock 1,109,490 1,302,859 1,522,737 Average stock options outstanding during the year 2,256,720 3,162,508 3,828,292 Assumed acquisition of shares with assumed proceeds
from exercising outstanding warrants (248,402) (262,709) (894,175) Assumed acquisition of shares with assumed
proceeds and benefits from exercising stock options (at average market price for the year) (1,508,620) (2,258,658) (2,679,571)
Shares repurchasable from measured but unrecognized stock option expense (49,839) (45,958) (75,268)
Average deferred compensation shares - 1,021,059 1,041,587 Weighted-average shares, as used in diluted calculation 236,830,287 254,938,112 267,963,995
In the event the average market price of LNC common stock exceeds the issue price of stock options and the options have a dilutive effect to our EPS, such options will be shown in the table above. We have participants in our deferred compensation plans who selected LNC stock as the measure for the investment return attributable to all or a portion of their deferral amounts. For the years ended December 2015 and 2014, the effect of settling this obligation in LNC stock (“equity classification”) was more dilutive than the scenario of settling in cash (“liability classification”). Therefore, for our EPS calculation for these periods, we added these shares to the denominator and adjusted the numerator to present net income as if the shares had been accounted for under equity classification by removing the mark-to-market adjustment included in net income attributable to these deferred units of LNC stock. The amount of this adjustment was $4 million and $(4) million for the years ended December 31, 2015 and 2014, respectively.
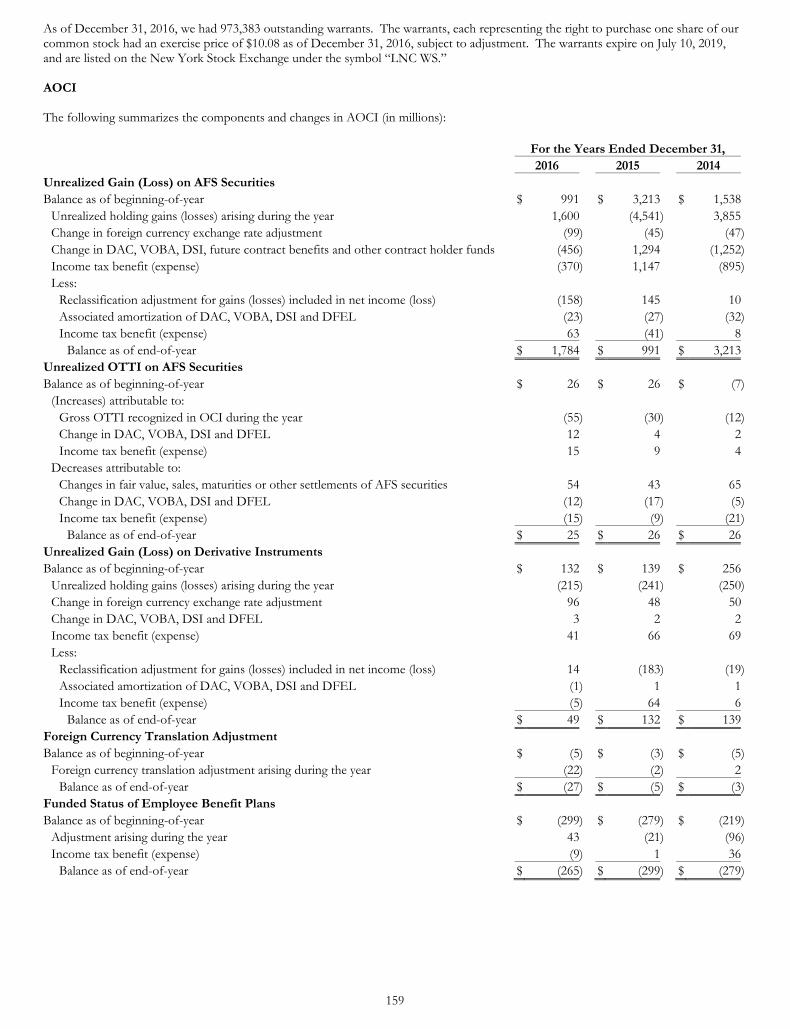
159
As of December 31, 2016, we had 973,383 outstanding warrants. The warrants, each representing the right to purchase one share of our common stock had an exercise price of $10.08 as of December 31, 2016, subject to adjustment. The warrants expire on July 10, 2019, and are listed on the New York Stock Exchange under the symbol “LNC WS.” AOCI The following summarizes the components and changes in AOCI (in millions):
For the Years Ended December 31, 2016 2015 2014 Unrealized Gain (Loss) on AFS Securities Balance as of beginning-of-year $ 991 $ 3,213 $ 1,538
Unrealized holding gains (losses) arising during the year 1,600 (4,541) 3,855Change in foreign currency exchange rate adjustment (99) (45) (47)Change in DAC, VOBA, DSI, future contract benefits and other contract holder funds (456) 1,294 (1,252)Income tax benefit (expense) (370) 1,147 (895)Less:
Reclassification adjustment for gains (losses) included in net income (loss) (158) 145 10Associated amortization of DAC, VOBA, DSI and DFEL (23) (27) (32)Income tax benefit (expense) 63 (41) 8
Balance as of end-of-year $ 1,784 $ 991 $ 3,213Unrealized OTTI on AFS Securities Balance as of beginning-of-year $ 26 $ 26 $ (7)
(Increases) attributable to: Gross OTTI recognized in OCI during the year (55) (30) (12)Change in DAC, VOBA, DSI and DFEL 12 4 2Income tax benefit (expense) 15 9 4
Decreases attributable to: Changes in fair value, sales, maturities or other settlements of AFS securities 54 43 65Change in DAC, VOBA, DSI and DFEL (12) (17) (5)Income tax benefit (expense) (15) (9) (21)
Balance as of end-of-year $ 25 $ 26 $ 26Unrealized Gain (Loss) on Derivative Instruments Balance as of beginning-of-year $ 132 $ 139 $ 256
Unrealized holding gains (losses) arising during the year (215) (241) (250)Change in foreign currency exchange rate adjustment 96 48 50Change in DAC, VOBA, DSI and DFEL 3 2 2Income tax benefit (expense) 41 66 69Less:
Reclassification adjustment for gains (losses) included in net income (loss) 14 (183) (19)Associated amortization of DAC, VOBA, DSI and DFEL (1) 1 1Income tax benefit (expense) (5) 64 6
Balance as of end-of-year $ 49 $ 132 $ 139Foreign Currency Translation Adjustment Balance as of beginning-of-year $ (5) $ (3) $ (5)
Foreign currency translation adjustment arising during the year (22) (2) 2Balance as of end-of-year $ (27) $ (5) $ (3)
Funded Status of Employee Benefit Plans Balance as of beginning-of-year $ (299) $ (279) $ (219)
Adjustment arising during the year 43 (21) (96)Income tax benefit (expense) (9) 1 36
Balance as of end-of-year $ (265) $ (299) $ (279)
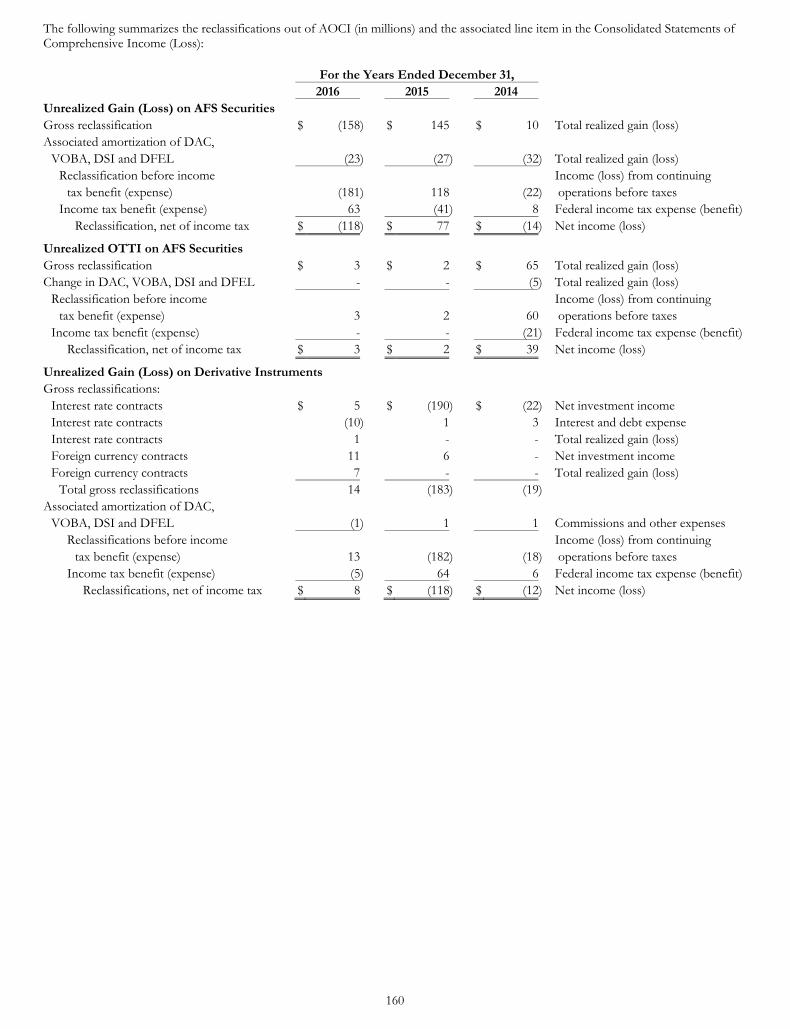
160
The following summarizes the reclassifications out of AOCI (in millions) and the associated line item in the Consolidated Statements of Comprehensive Income (Loss):
For the Years Ended December 31, 2016 2015 2014 Unrealized Gain (Loss) on AFS Securities Gross reclassification $ (158) $ 145 $ 10 Total realized gain (loss) Associated amortization of DAC,
VOBA, DSI and DFEL (23) (27) (32) Total realized gain (loss) Reclassification before income Income (loss) from continuing
tax benefit (expense) (181) 118 (22) operations before taxes Income tax benefit (expense) 63 (41) 8 Federal income tax expense (benefit)
Reclassification, net of income tax $ (118) $ 77 $ (14) Net income (loss)
Unrealized OTTI on AFS Securities Gross reclassification $ 3 $ 2 $ 65 Total realized gain (loss) Change in DAC, VOBA, DSI and DFEL - - (5) Total realized gain (loss)
Reclassification before income Income (loss) from continuing tax benefit (expense) 3 2 60 operations before taxes
Income tax benefit (expense) - - (21) Federal income tax expense (benefit)Reclassification, net of income tax $ 3 $ 2 $ 39 Net income (loss)
Unrealized Gain (Loss) on Derivative Instruments Gross reclassifications:
Interest rate contracts $ 5 $ (190) $ (22) Net investment income Interest rate contracts (10) 1 3 Interest and debt expense Interest rate contracts 1 - - Total realized gain (loss) Foreign currency contracts 11 6 - Net investment income Foreign currency contracts 7 - - Total realized gain (loss)
Total gross reclassifications 14 (183) (19) Associated amortization of DAC,
VOBA, DSI and DFEL (1) 1 1 Commissions and other expenses Reclassifications before income Income (loss) from continuing
tax benefit (expense) 13 (182) (18) operations before taxes Income tax benefit (expense) (5) 64 6 Federal income tax expense (benefit)
Reclassifications, net of income tax $ 8 $ (118) $ (12) Net income (loss)
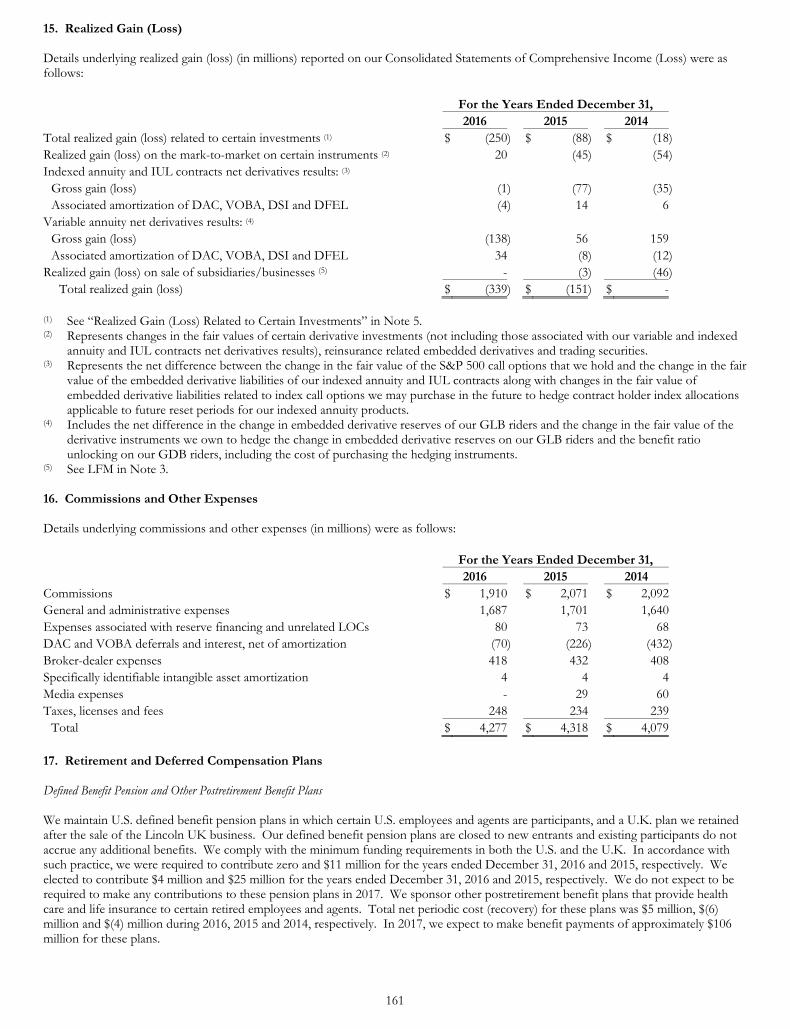
161
15. Realized Gain (Loss) Details underlying realized gain (loss) (in millions) reported on our Consolidated Statements of Comprehensive Income (Loss) were as follows:
For the Years Ended December 31, 2016 2015 2014 Total realized gain (loss) related to certain investments (1) $ (250) $ (88) $ (18) Realized gain (loss) on the mark-to-market on certain instruments (2) 20 (45) (54) Indexed annuity and IUL contracts net derivatives results: (3)
Gross gain (loss) (1) (77) (35) Associated amortization of DAC, VOBA, DSI and DFEL (4) 14 6
Variable annuity net derivatives results: (4) Gross gain (loss) (138) 56 159 Associated amortization of DAC, VOBA, DSI and DFEL 34 (8) (12)
Realized gain (loss) on sale of subsidiaries/businesses (5) - (3) (46) Total realized gain (loss) $ (339) $ (151) $ -
(1) See “Realized Gain (Loss) Related to Certain Investments” in Note 5. (2) Represents changes in the fair values of certain derivative investments (not including those associated with our variable and indexed
annuity and IUL contracts net derivatives results), reinsurance related embedded derivatives and trading securities. (3) Represents the net difference between the change in the fair value of the S&P 500 call options that we hold and the change in the fair
value of the embedded derivative liabilities of our indexed annuity and IUL contracts along with changes in the fair value of embedded derivative liabilities related to index call options we may purchase in the future to hedge contract holder index allocations applicable to future reset periods for our indexed annuity products.
(4) Includes the net difference in the change in embedded derivative reserves of our GLB riders and the change in the fair value of the derivative instruments we own to hedge the change in embedded derivative reserves on our GLB riders and the benefit ratio unlocking on our GDB riders, including the cost of purchasing the hedging instruments.
(5) See LFM in Note 3. 16. Commissions and Other Expenses Details underlying commissions and other expenses (in millions) were as follows:
For the Years Ended December 31, 2016 2015 2014 Commissions $ 1,910 $ 2,071 $ 2,092 General and administrative expenses 1,687 1,701 1,640 Expenses associated with reserve financing and unrelated LOCs 80 73 68 DAC and VOBA deferrals and interest, net of amortization (70) (226) (432) Broker-dealer expenses 418 432 408 Specifically identifiable intangible asset amortization 4 4 4 Media expenses - 29 60 Taxes, licenses and fees 248 234 239
Total $ 4,277 $ 4,318 $ 4,079
17. Retirement and Deferred Compensation Plans Defined Benefit Pension and Other Postretirement Benefit Plans We maintain U.S. defined benefit pension plans in which certain U.S. employees and agents are participants, and a U.K. plan we retained after the sale of the Lincoln UK business. Our defined benefit pension plans are closed to new entrants and existing participants do not accrue any additional benefits. We comply with the minimum funding requirements in both the U.S. and the U.K. In accordance with such practice, we were required to contribute zero and $11 million for the years ended December 31, 2016 and 2015, respectively. We elected to contribute $4 million and $25 million for the years ended December 31, 2016 and 2015, respectively. We do not expect to be required to make any contributions to these pension plans in 2017. We sponsor other postretirement benefit plans that provide health care and life insurance to certain retired employees and agents. Total net periodic cost (recovery) for these plans was $5 million, $(6) million and $(4) million during 2016, 2015 and 2014, respectively. In 2017, we expect to make benefit payments of approximately $106 million for these plans.
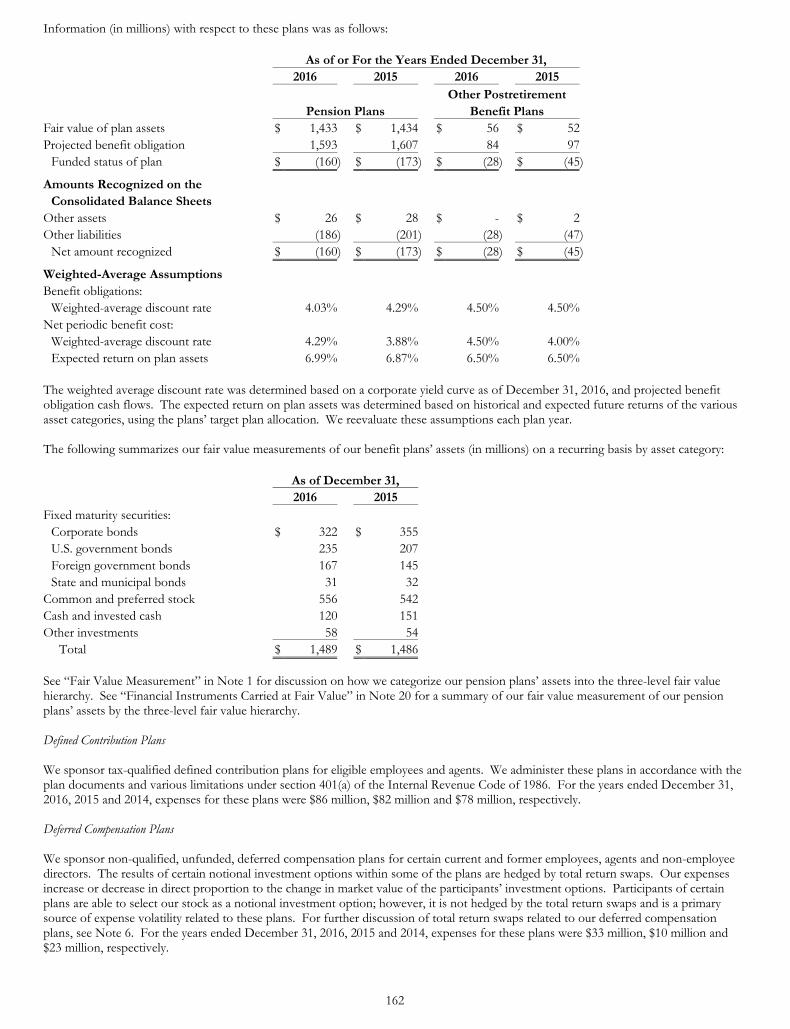
162
Information (in millions) with respect to these plans was as follows:
As of or For the Years Ended December 31, 2016 2015 2016 2015 Other Postretirement Pension Plans Benefit Plans Fair value of plan assets $ 1,433 $ 1,434 $ 56 $ 52 Projected benefit obligation 1,593 1,607 84 97
Funded status of plan $ (160) $ (173) $ (28) $ (45)
Amounts Recognized on the Consolidated Balance Sheets
Other assets $ 26 $ 28 $ - $ 2 Other liabilities (186) (201) (28) (47)
Net amount recognized $ (160) $ (173) $ (28) $ (45)
Weighted-Average Assumptions Benefit obligations:
Weighted-average discount rate 4.03% 4.29% 4.50% 4.50% Net periodic benefit cost:
Weighted-average discount rate 4.29% 3.88% 4.50% 4.00% Expected return on plan assets 6.99% 6.87% 6.50% 6.50%
The weighted average discount rate was determined based on a corporate yield curve as of December 31, 2016, and projected benefit obligation cash flows. The expected return on plan assets was determined based on historical and expected future returns of the various asset categories, using the plans’ target plan allocation. We reevaluate these assumptions each plan year. The following summarizes our fair value measurements of our benefit plans’ assets (in millions) on a recurring basis by asset category:
As of December 31, 2016 2015 Fixed maturity securities:
Corporate bonds $ 322 $ 355 U.S. government bonds 235 207 Foreign government bonds 167 145 State and municipal bonds 31 32
Common and preferred stock 556 542 Cash and invested cash 120 151 Other investments 58 54
Total $ 1,489 $ 1,486
See “Fair Value Measurement” in Note 1 for discussion on how we categorize our pension plans’ assets into the three-level fair value hierarchy. See “Financial Instruments Carried at Fair Value” in Note 20 for a summary of our fair value measurement of our pension plans’ assets by the three-level fair value hierarchy. Defined Contribution Plans We sponsor tax-qualified defined contribution plans for eligible employees and agents. We administer these plans in accordance with the plan documents and various limitations under section 401(a) of the Internal Revenue Code of 1986. For the years ended December 31, 2016, 2015 and 2014, expenses for these plans were $86 million, $82 million and $78 million, respectively. Deferred Compensation Plans We sponsor non-qualified, unfunded, deferred compensation plans for certain current and former employees, agents and non-employee directors. The results of certain notional investment options within some of the plans are hedged by total return swaps. Our expenses increase or decrease in direct proportion to the change in market value of the participants’ investment options. Participants of certain plans are able to select our stock as a notional investment option; however, it is not hedged by the total return swaps and is a primary source of expense volatility related to these plans. For further discussion of total return swaps related to our deferred compensation plans, see Note 6. For the years ended December 31, 2016, 2015 and 2014, expenses for these plans were $33 million, $10 million and $23 million, respectively.
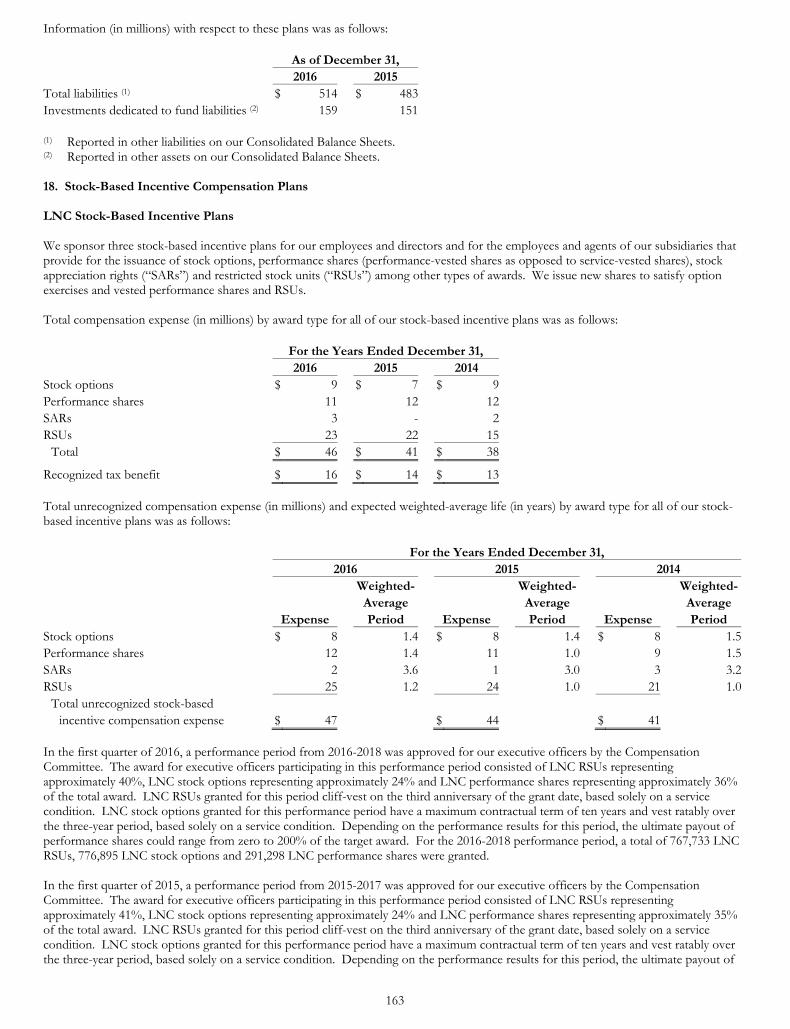
163
Information (in millions) with respect to these plans was as follows:
As of December 31, 2016 2015 Total liabilities (1) $ 514 $ 483 Investments dedicated to fund liabilities (2) 159 151 (1) Reported in other liabilities on our Consolidated Balance Sheets. (2) Reported in other assets on our Consolidated Balance Sheets. 18. Stock-Based Incentive Compensation Plans LNC Stock-Based Incentive Plans We sponsor three stock-based incentive plans for our employees and directors and for the employees and agents of our subsidiaries that provide for the issuance of stock options, performance shares (performance-vested shares as opposed to service-vested shares), stock appreciation rights (“SARs”) and restricted stock units (“RSUs”) among other types of awards. We issue new shares to satisfy option exercises and vested performance shares and RSUs. Total compensation expense (in millions) by award type for all of our stock-based incentive plans was as follows:
For the Years Ended December 31, 2016 2015 2014 Stock options $ 9 $ 7 $ 9 Performance shares 11 12 12 SARs 3 - 2 RSUs 23 22 15
Total $ 46 $ 41 $ 38
Recognized tax benefit $ 16 $ 14 $ 13 Total unrecognized compensation expense (in millions) and expected weighted-average life (in years) by award type for all of our stock-based incentive plans was as follows:
For the Years Ended December 31, 2016 2015 2014 Weighted- Weighted- Weighted- Average Average Average Expense Period Expense Period Expense Period Stock options $ 8 1.4 $ 8 1.4 $ 8 1.5Performance shares 12 1.4 11 1.0 9 1.5SARs 2 3.6 1 3.0 3 3.2RSUs 25 1.2 24 1.0 21 1.0
Total unrecognized stock-based incentive compensation expense $ 47 $ 44 $ 41
In the first quarter of 2016, a performance period from 2016-2018 was approved for our executive officers by the Compensation Committee. The award for executive officers participating in this performance period consisted of LNC RSUs representing approximately 40%, LNC stock options representing approximately 24% and LNC performance shares representing approximately 36% of the total award. LNC RSUs granted for this period cliff-vest on the third anniversary of the grant date, based solely on a service condition. LNC stock options granted for this performance period have a maximum contractual term of ten years and vest ratably over the three-year period, based solely on a service condition. Depending on the performance results for this period, the ultimate payout of performance shares could range from zero to 200% of the target award. For the 2016-2018 performance period, a total of 767,733 LNC RSUs, 776,895 LNC stock options and 291,298 LNC performance shares were granted. In the first quarter of 2015, a performance period from 2015-2017 was approved for our executive officers by the Compensation Committee. The award for executive officers participating in this performance period consisted of LNC RSUs representing approximately 41%, LNC stock options representing approximately 24% and LNC performance shares representing approximately 35% of the total award. LNC RSUs granted for this period cliff-vest on the third anniversary of the grant date, based solely on a service condition. LNC stock options granted for this performance period have a maximum contractual term of ten years and vest ratably over the three-year period, based solely on a service condition. Depending on the performance results for this period, the ultimate payout of
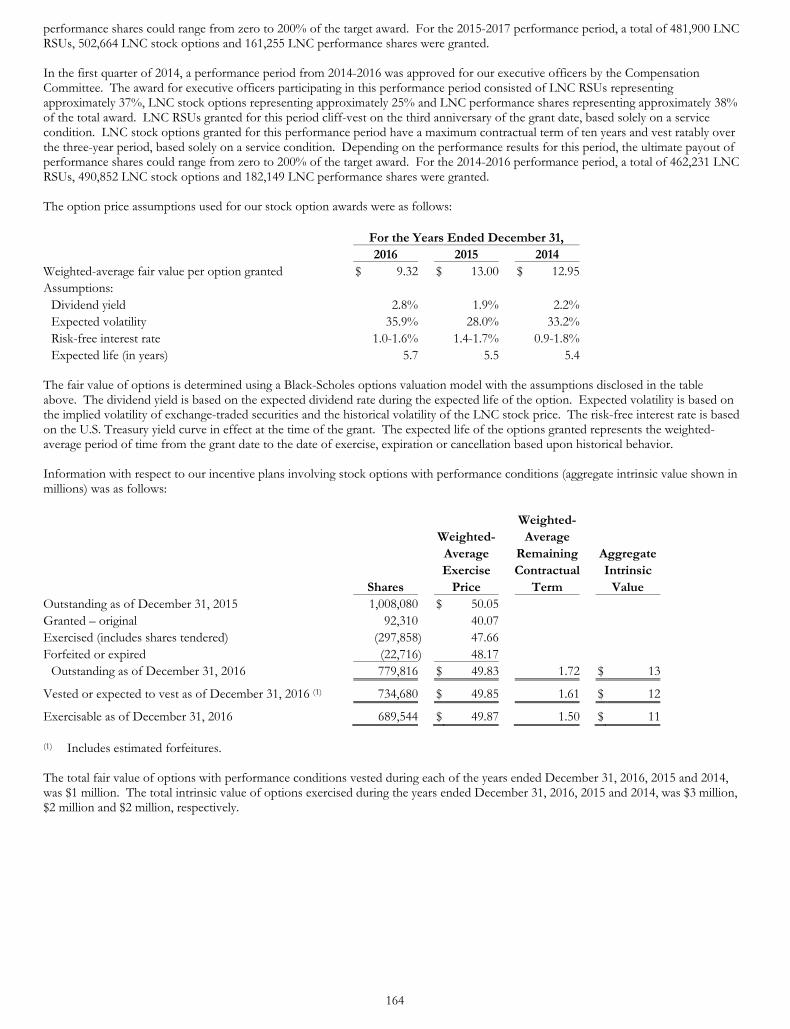
164
performance shares could range from zero to 200% of the target award. For the 2015-2017 performance period, a total of 481,900 LNC RSUs, 502,664 LNC stock options and 161,255 LNC performance shares were granted. In the first quarter of 2014, a performance period from 2014-2016 was approved for our executive officers by the Compensation Committee. The award for executive officers participating in this performance period consisted of LNC RSUs representing approximately 37%, LNC stock options representing approximately 25% and LNC performance shares representing approximately 38% of the total award. LNC RSUs granted for this period cliff-vest on the third anniversary of the grant date, based solely on a service condition. LNC stock options granted for this performance period have a maximum contractual term of ten years and vest ratably over the three-year period, based solely on a service condition. Depending on the performance results for this period, the ultimate payout of performance shares could range from zero to 200% of the target award. For the 2014-2016 performance period, a total of 462,231 LNC RSUs, 490,852 LNC stock options and 182,149 LNC performance shares were granted. The option price assumptions used for our stock option awards were as follows:
For the Years Ended December 31, 2016 2015 2014 Weighted-average fair value per option granted $ 9.32 $ 13.00 $ 12.95 Assumptions:
Dividend yield 2.8% 1.9% 2.2% Expected volatility 35.9% 28.0% 33.2% Risk-free interest rate 1.0-1.6% 1.4-1.7% 0.9-1.8% Expected life (in years) 5.7 5.5 5.4
The fair value of options is determined using a Black-Scholes options valuation model with the assumptions disclosed in the table above. The dividend yield is based on the expected dividend rate during the expected life of the option. Expected volatility is based on the implied volatility of exchange-traded securities and the historical volatility of the LNC stock price. The risk-free interest rate is based on the U.S. Treasury yield curve in effect at the time of the grant. The expected life of the options granted represents the weighted-average period of time from the grant date to the date of exercise, expiration or cancellation based upon historical behavior. Information with respect to our incentive plans involving stock options with performance conditions (aggregate intrinsic value shown in millions) was as follows:
Weighted- Weighted- Average Average Remaining Aggregate Exercise Contractual Intrinsic Shares Price Term Value Outstanding as of December 31, 2015 1,008,080 $ 50.05 Granted – original 92,310 40.07 Exercised (includes shares tendered) (297,858) 47.66 Forfeited or expired (22,716) 48.17
Outstanding as of December 31, 2016 779,816 $ 49.83 1.72 $ 13
Vested or expected to vest as of December 31, 2016 (1) 734,680 $ 49.85 1.61 $ 12
Exercisable as of December 31, 2016 689,544 $ 49.87 1.50 $ 11 (1) Includes estimated forfeitures. The total fair value of options with performance conditions vested during each of the years ended December 31, 2016, 2015 and 2014, was $1 million. The total intrinsic value of options exercised during the years ended December 31, 2016, 2015 and 2014, was $3 million, $2 million and $2 million, respectively.
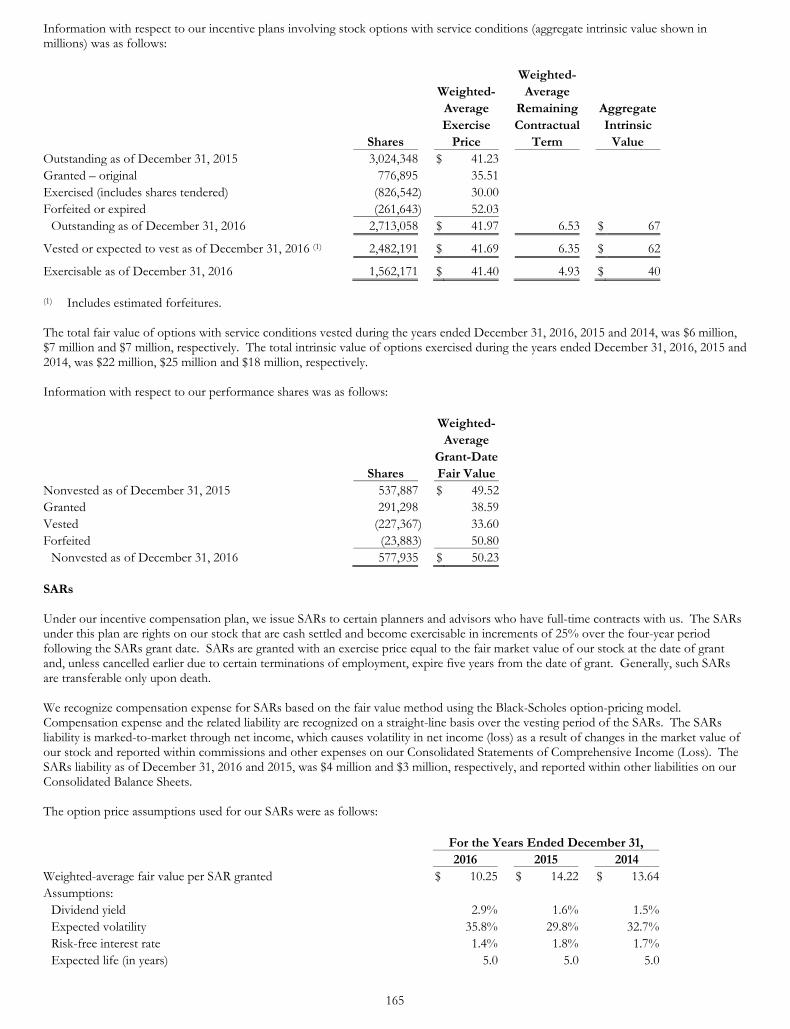
165
Information with respect to our incentive plans involving stock options with service conditions (aggregate intrinsic value shown in millions) was as follows:
Weighted- Weighted- Average Average Remaining Aggregate Exercise Contractual Intrinsic Shares Price Term Value Outstanding as of December 31, 2015 3,024,348 $ 41.23 Granted – original 776,895 35.51 Exercised (includes shares tendered) (826,542) 30.00 Forfeited or expired (261,643) 52.03
Outstanding as of December 31, 2016 2,713,058 $ 41.97 6.53 $ 67
Vested or expected to vest as of December 31, 2016 (1) 2,482,191 $ 41.69 6.35 $ 62
Exercisable as of December 31, 2016 1,562,171 $ 41.40 4.93 $ 40 (1) Includes estimated forfeitures. The total fair value of options with service conditions vested during the years ended December 31, 2016, 2015 and 2014, was $6 million, $7 million and $7 million, respectively. The total intrinsic value of options exercised during the years ended December 31, 2016, 2015 and 2014, was $22 million, $25 million and $18 million, respectively. Information with respect to our performance shares was as follows:
Weighted- Average Grant-Date Shares Fair Value Nonvested as of December 31, 2015 537,887 $ 49.52 Granted 291,298 38.59 Vested (227,367) 33.60 Forfeited (23,883) 50.80
Nonvested as of December 31, 2016 577,935 $ 50.23 SARs Under our incentive compensation plan, we issue SARs to certain planners and advisors who have full-time contracts with us. The SARs under this plan are rights on our stock that are cash settled and become exercisable in increments of 25% over the four-year period following the SARs grant date. SARs are granted with an exercise price equal to the fair market value of our stock at the date of grant and, unless cancelled earlier due to certain terminations of employment, expire five years from the date of grant. Generally, such SARs are transferable only upon death. We recognize compensation expense for SARs based on the fair value method using the Black-Scholes option-pricing model. Compensation expense and the related liability are recognized on a straight-line basis over the vesting period of the SARs. The SARs liability is marked-to-market through net income, which causes volatility in net income (loss) as a result of changes in the market value of our stock and reported within commissions and other expenses on our Consolidated Statements of Comprehensive Income (Loss). The SARs liability as of December 31, 2016 and 2015, was $4 million and $3 million, respectively, and reported within other liabilities on our Consolidated Balance Sheets. The option price assumptions used for our SARs were as follows:
For the Years Ended December 31, 2016 2015 2014 Weighted-average fair value per SAR granted $ 10.25 $ 14.22 $ 13.64 Assumptions:
Dividend yield 2.9% 1.6% 1.5% Expected volatility 35.8% 29.8% 32.7% Risk-free interest rate 1.4% 1.8% 1.7% Expected life (in years) 5.0 5.0 5.0
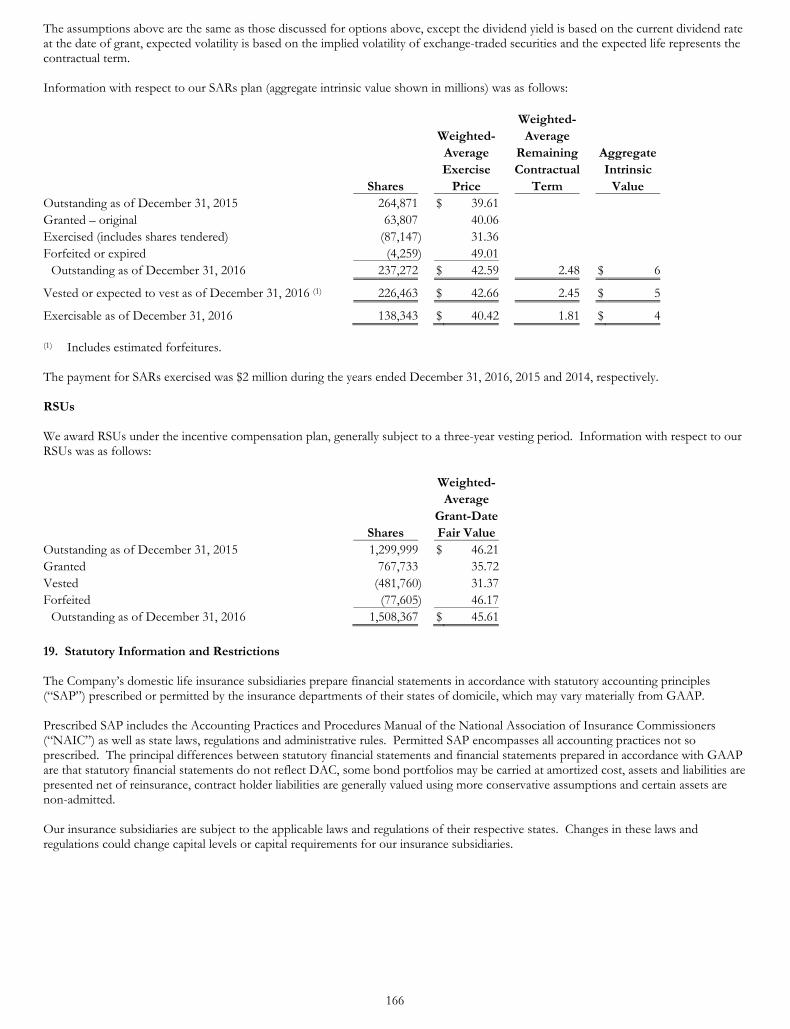
166
The assumptions above are the same as those discussed for options above, except the dividend yield is based on the current dividend rate at the date of grant, expected volatility is based on the implied volatility of exchange-traded securities and the expected life represents the contractual term. Information with respect to our SARs plan (aggregate intrinsic value shown in millions) was as follows:
Weighted- Weighted- Average Average Remaining Aggregate Exercise Contractual Intrinsic Shares Price Term Value Outstanding as of December 31, 2015 264,871 $ 39.61 Granted – original 63,807 40.06 Exercised (includes shares tendered) (87,147) 31.36 Forfeited or expired (4,259) 49.01
Outstanding as of December 31, 2016 237,272 $ 42.59 2.48 $ 6
Vested or expected to vest as of December 31, 2016 (1) 226,463 $ 42.66 2.45 $ 5
Exercisable as of December 31, 2016 138,343 $ 40.42 1.81 $ 4 (1) Includes estimated forfeitures. The payment for SARs exercised was $2 million during the years ended December 31, 2016, 2015 and 2014, respectively. RSUs We award RSUs under the incentive compensation plan, generally subject to a three-year vesting period. Information with respect to our RSUs was as follows:
Weighted- Average Grant-Date Shares Fair Value Outstanding as of December 31, 2015 1,299,999 $ 46.21 Granted 767,733 35.72 Vested (481,760) 31.37 Forfeited (77,605) 46.17
Outstanding as of December 31, 2016 1,508,367 $ 45.61
19. Statutory Information and Restrictions The Company’s domestic life insurance subsidiaries prepare financial statements in accordance with statutory accounting principles (“SAP”) prescribed or permitted by the insurance departments of their states of domicile, which may vary materially from GAAP. Prescribed SAP includes the Accounting Practices and Procedures Manual of the National Association of Insurance Commissioners (“NAIC”) as well as state laws, regulations and administrative rules. Permitted SAP encompasses all accounting practices not so prescribed. The principal differences between statutory financial statements and financial statements prepared in accordance with GAAP are that statutory financial statements do not reflect DAC, some bond portfolios may be carried at amortized cost, assets and liabilities are presented net of reinsurance, contract holder liabilities are generally valued using more conservative assumptions and certain assets are non-admitted. Our insurance subsidiaries are subject to the applicable laws and regulations of their respective states. Changes in these laws and regulations could change capital levels or capital requirements for our insurance subsidiaries.
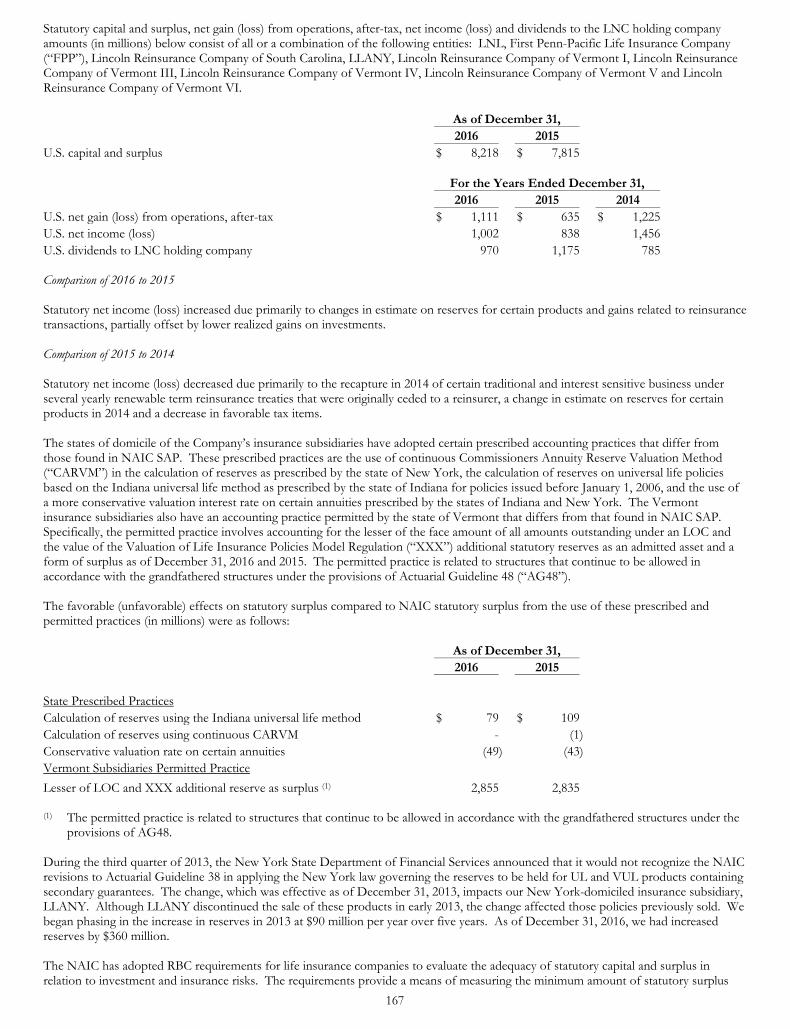
167
Statutory capital and surplus, net gain (loss) from operations, after-tax, net income (loss) and dividends to the LNC holding company amounts (in millions) below consist of all or a combination of the following entities: LNL, First Penn-Pacific Life Insurance Company (“FPP”), Lincoln Reinsurance Company of South Carolina, LLANY, Lincoln Reinsurance Company of Vermont I, Lincoln Reinsurance Company of Vermont III, Lincoln Reinsurance Company of Vermont IV, Lincoln Reinsurance Company of Vermont V and Lincoln Reinsurance Company of Vermont VI.
As of December 31, 2016 2015 U.S. capital and surplus $ 8,218 $ 7,815
For the Years Ended December 31, 2016 2015 2014 U.S. net gain (loss) from operations, after-tax $ 1,111 $ 635 $ 1,225 U.S. net income (loss) 1,002 838 1,456 U.S. dividends to LNC holding company 970 1,175 785 Comparison of 2016 to 2015 Statutory net income (loss) increased due primarily to changes in estimate on reserves for certain products and gains related to reinsurance transactions, partially offset by lower realized gains on investments. Comparison of 2015 to 2014 Statutory net income (loss) decreased due primarily to the recapture in 2014 of certain traditional and interest sensitive business under several yearly renewable term reinsurance treaties that were originally ceded to a reinsurer, a change in estimate on reserves for certain products in 2014 and a decrease in favorable tax items. The states of domicile of the Company’s insurance subsidiaries have adopted certain prescribed accounting practices that differ from those found in NAIC SAP. These prescribed practices are the use of continuous Commissioners Annuity Reserve Valuation Method (“CARVM”) in the calculation of reserves as prescribed by the state of New York, the calculation of reserves on universal life policies based on the Indiana universal life method as prescribed by the state of Indiana for policies issued before January 1, 2006, and the use of a more conservative valuation interest rate on certain annuities prescribed by the states of Indiana and New York. The Vermont insurance subsidiaries also have an accounting practice permitted by the state of Vermont that differs from that found in NAIC SAP. Specifically, the permitted practice involves accounting for the lesser of the face amount of all amounts outstanding under an LOC and the value of the Valuation of Life Insurance Policies Model Regulation (“XXX”) additional statutory reserves as an admitted asset and a form of surplus as of December 31, 2016 and 2015. The permitted practice is related to structures that continue to be allowed in accordance with the grandfathered structures under the provisions of Actuarial Guideline 48 (“AG48”). The favorable (unfavorable) effects on statutory surplus compared to NAIC statutory surplus from the use of these prescribed and permitted practices (in millions) were as follows:
As of December 31, 2016 2015 State Prescribed Practices Calculation of reserves using the Indiana universal life method $ 79 $ 109 Calculation of reserves using continuous CARVM - (1) Conservative valuation rate on certain annuities (49) (43) Vermont Subsidiaries Permitted Practice
Lesser of LOC and XXX additional reserve as surplus (1) 2,855 2,835 (1) The permitted practice is related to structures that continue to be allowed in accordance with the grandfathered structures under the
provisions of AG48. During the third quarter of 2013, the New York State Department of Financial Services announced that it would not recognize the NAIC revisions to Actuarial Guideline 38 in applying the New York law governing the reserves to be held for UL and VUL products containing secondary guarantees. The change, which was effective as of December 31, 2013, impacts our New York-domiciled insurance subsidiary, LLANY. Although LLANY discontinued the sale of these products in early 2013, the change affected those policies previously sold. We began phasing in the increase in reserves in 2013 at $90 million per year over five years. As of December 31, 2016, we had increased reserves by $360 million. The NAIC has adopted RBC requirements for life insurance companies to evaluate the adequacy of statutory capital and surplus in relation to investment and insurance risks. The requirements provide a means of measuring the minimum amount of statutory surplus

168
appropriate for an insurance company to support its overall business operations based on its size and risk profile. Under RBC requirements, regulatory compliance is determined by the ratio of a company’s total adjusted capital, as defined by the NAIC, to its company action level of RBC (known as the “RBC ratio”), also as defined by the NAIC. The company action level may be triggered if the RBC ratio is between 75% and 100%, which would require the insurer to submit a plan to the regulator detailing corrective action it proposes to undertake. As of December 31, 2016, the combined RBC ratio of LNL, LLANY and FPP reported to their respective states of domicile and the NAIC was nearly five times the aforementioned company action level. Our insurance subsidiaries are subject to certain insurance department regulatory restrictions as to the transfer of funds and payment of dividends to the holding company. Under Indiana laws and regulations, our Indiana insurance subsidiaries, including our primary insurance subsidiary, LNL, may pay dividends to LNC without prior approval of the Indiana Insurance Commissioner (the “Commissioner”), only from unassigned surplus and must receive prior approval of the Commissioner to pay a dividend if such dividend, along with all other dividends paid within the preceding 12 consecutive months, would exceed the statutory limitation. The current statutory limitation is the lesser of 10% of the insurer’s contract holders’ surplus, as shown on its last annual statement on file with the Commissioner or the insurer’s statutory net gain from operations for the previous 12 months, but in no event to exceed statutory unassigned surplus. Indiana law gives the Commissioner broad discretion to disapprove requests for dividends in excess of these limits. LNL’s subsidiary, LLANY, a New York domiciled insurance company, is bound by similar restrictions, under New York law, with the applicable statutory limitation on dividends equal to the lesser of 10% of surplus to contract holders as of the immediately preceding calendar year or net gain from operations for the immediately preceding calendar year, not including realized capital gains. We expect our domestic insurance subsidiaries could pay dividends of approximately $765 million in 2017 without prior approval from the respective state commissioner. All payments of principal and interest on surplus notes between LNC and our insurance subsidiaries must be approved by the respective Commissioner of Insurance.
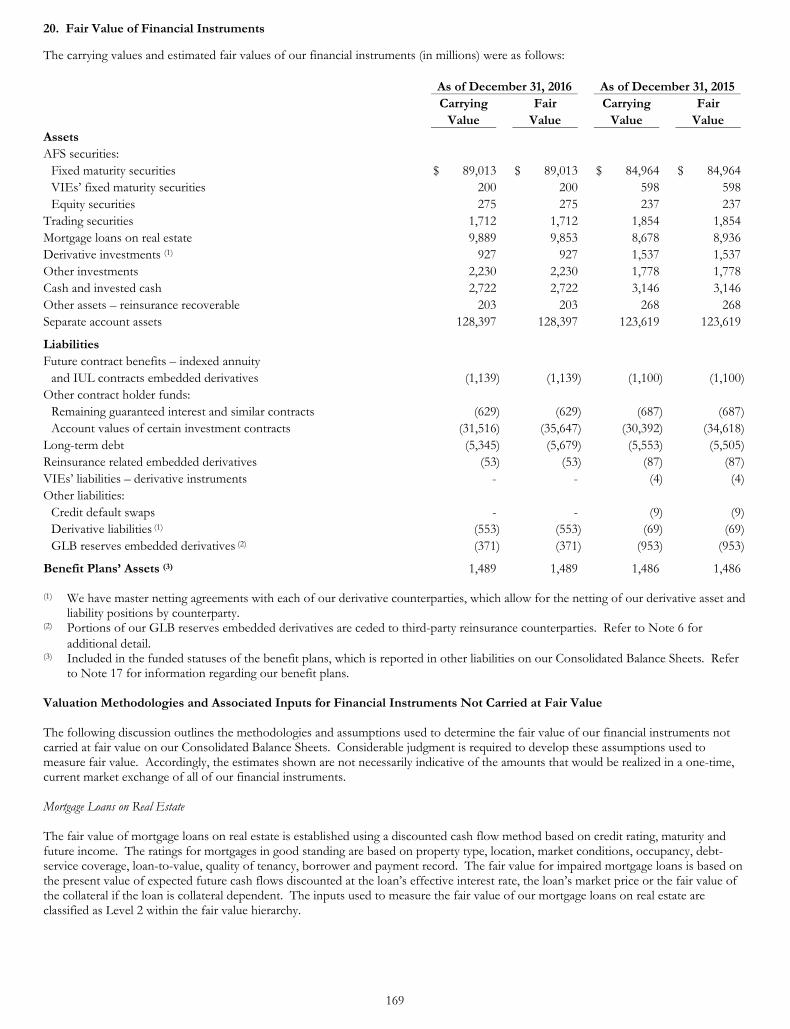
169
20. Fair Value of Financial Instruments The carrying values and estimated fair values of our financial instruments (in millions) were as follows:
As of December 31, 2016 As of December 31, 2015
Carrying Fair Carrying Fair Value Value Value Value Assets AFS securities:
Fixed maturity securities $ 89,013 $ 89,013 $ 84,964 $ 84,964VIEs’ fixed maturity securities 200 200 598 598Equity securities 275 275 237 237
Trading securities 1,712 1,712 1,854 1,854Mortgage loans on real estate 9,889 9,853 8,678 8,936Derivative investments (1) 927 927 1,537 1,537Other investments 2,230 2,230 1,778 1,778Cash and invested cash 2,722 2,722 3,146 3,146Other assets – reinsurance recoverable 203 203 268 268Separate account assets 128,397 128,397 123,619 123,619
Liabilities Future contract benefits – indexed annuity
and IUL contracts embedded derivatives (1,139) (1,139) (1,100) (1,100)Other contract holder funds:
Remaining guaranteed interest and similar contracts (629) (629) (687) (687)Account values of certain investment contracts (31,516) (35,647) (30,392) (34,618)
Long-term debt (5,345) (5,679) (5,553) (5,505)Reinsurance related embedded derivatives (53) (53) (87) (87)VIEs’ liabilities – derivative instruments - - (4) (4)Other liabilities:
Credit default swaps - - (9) (9)Derivative liabilities (1) (553) (553) (69) (69)GLB reserves embedded derivatives (2) (371) (371) (953) (953)
Benefit Plans’ Assets (3) 1,489 1,489 1,486 1,486 (1) We have master netting agreements with each of our derivative counterparties, which allow for the netting of our derivative asset and
liability positions by counterparty. (2) Portions of our GLB reserves embedded derivatives are ceded to third-party reinsurance counterparties. Refer to Note 6 for
additional detail. (3) Included in the funded statuses of the benefit plans, which is reported in other liabilities on our Consolidated Balance Sheets. Refer
to Note 17 for information regarding our benefit plans. Valuation Methodologies and Associated Inputs for Financial Instruments Not Carried at Fair Value The following discussion outlines the methodologies and assumptions used to determine the fair value of our financial instruments not carried at fair value on our Consolidated Balance Sheets. Considerable judgment is required to develop these assumptions used to measure fair value. Accordingly, the estimates shown are not necessarily indicative of the amounts that would be realized in a one-time, current market exchange of all of our financial instruments. Mortgage Loans on Real Estate The fair value of mortgage loans on real estate is established using a discounted cash flow method based on credit rating, maturity and future income. The ratings for mortgages in good standing are based on property type, location, market conditions, occupancy, debt-service coverage, loan-to-value, quality of tenancy, borrower and payment record. The fair value for impaired mortgage loans is based on the present value of expected future cash flows discounted at the loan’s effective interest rate, the loan’s market price or the fair value of the collateral if the loan is collateral dependent. The inputs used to measure the fair value of our mortgage loans on real estate are classified as Level 2 within the fair value hierarchy.

170
Other Investments The carrying value of our assets classified as other investments approximates fair value. Other investments includes primarily LPs and other privately held investments that are accounted for using the equity method of accounting and the carrying value is based on our proportional share of the net assets of the LPs. The inputs used to measure the fair value of our LPs and other privately held investments are classified as Level 3 within the fair value hierarchy. Other investments also includes securities that are not LPs or other privately held investments and the inputs used to measure the fair value of these securities are classified as Level 1 within the fair value hierarchy. Other Contract Holder Funds Other contract holder funds include remaining guaranteed interest and similar contracts and account values of certain investment contracts. The fair value for the remaining guaranteed interest and similar contracts is estimated using discounted cash flow calculations as of the balance sheet date. These calculations are based on interest rates currently offered on similar contracts with maturities that are consistent with those remaining for the contracts being valued. As of December 31, 2016 and 2015, the remaining guaranteed interest and similar contracts carrying value approximated fair value. The fair value of the account values of certain investment contracts is based on their approximate surrender value as of the balance sheet date. The inputs used to measure the fair value of our other contract holder funds are classified as Level 3 within the fair value hierarchy. Long-Term Debt The fair value of long-term debt is based on quoted market prices. The inputs used to measure the fair value of our long-term debt are classified as Level 2 within the fair value hierarchy. Financial Instruments Carried at Fair Value We did not have any assets or liabilities measured at fair value on a nonrecurring basis as of December 31, 2016 or 2015, and we noted no changes in our valuation methodologies between these periods.
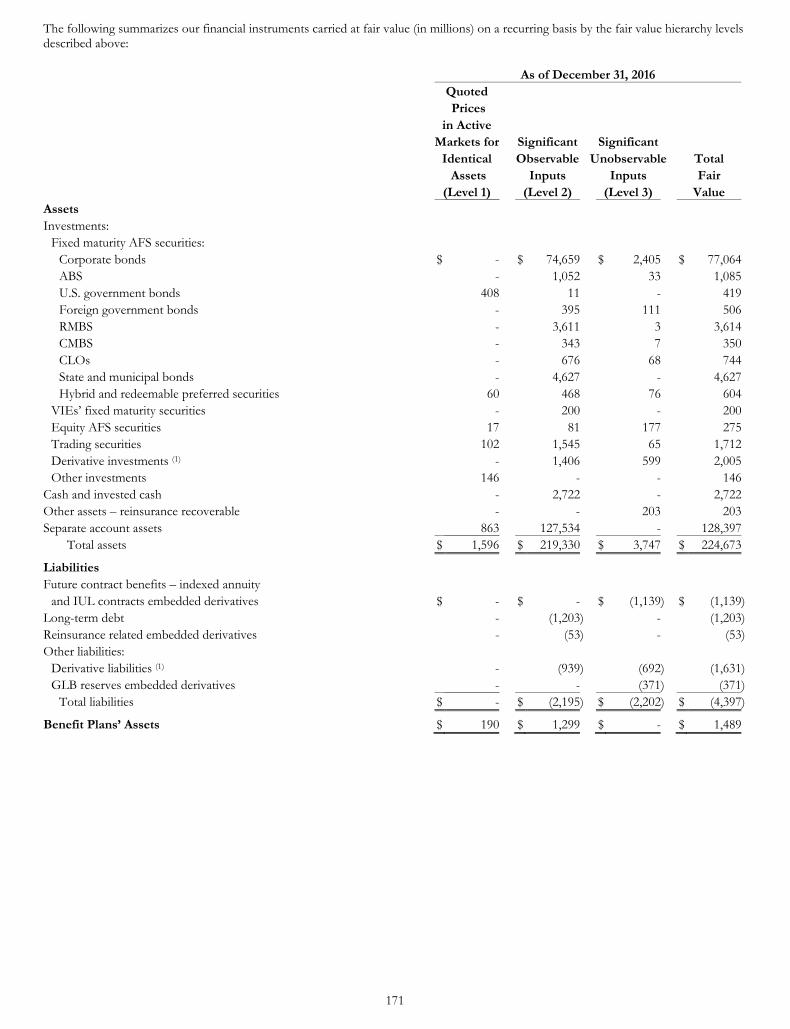
171
The following summarizes our financial instruments carried at fair value (in millions) on a recurring basis by the fair value hierarchy levels described above:
As of December 31, 2016 Quoted Prices in Active Markets for Significant Significant Identical Observable Unobservable Total Assets Inputs Inputs Fair (Level 1) (Level 2) (Level 3) Value Assets Investments:
Fixed maturity AFS securities: Corporate bonds $ - $ 74,659 $ 2,405 $ 77,064ABS - 1,052 33 1,085U.S. government bonds 408 11 - 419Foreign government bonds - 395 111 506RMBS - 3,611 3 3,614CMBS - 343 7 350CLOs - 676 68 744State and municipal bonds - 4,627 - 4,627Hybrid and redeemable preferred securities 60 468 76 604
VIEs’ fixed maturity securities - 200 - 200Equity AFS securities 17 81 177 275Trading securities 102 1,545 65 1,712Derivative investments (1) - 1,406 599 2,005Other investments 146 - - 146
Cash and invested cash - 2,722 - 2,722Other assets – reinsurance recoverable - - 203 203Separate account assets 863 127,534 - 128,397
Total assets $ 1,596 $ 219,330 $ 3,747 $ 224,673
Liabilities Future contract benefits – indexed annuity
and IUL contracts embedded derivatives $ - $ - $ (1,139) $ (1,139)Long-term debt - (1,203) - (1,203)Reinsurance related embedded derivatives - (53) - (53)Other liabilities:
Derivative liabilities (1) - (939) (692) (1,631)GLB reserves embedded derivatives - - (371) (371)
Total liabilities $ - $ (2,195) $ (2,202) $ (4,397)
Benefit Plans’ Assets $ 190 $ 1,299 $ - $ 1,489
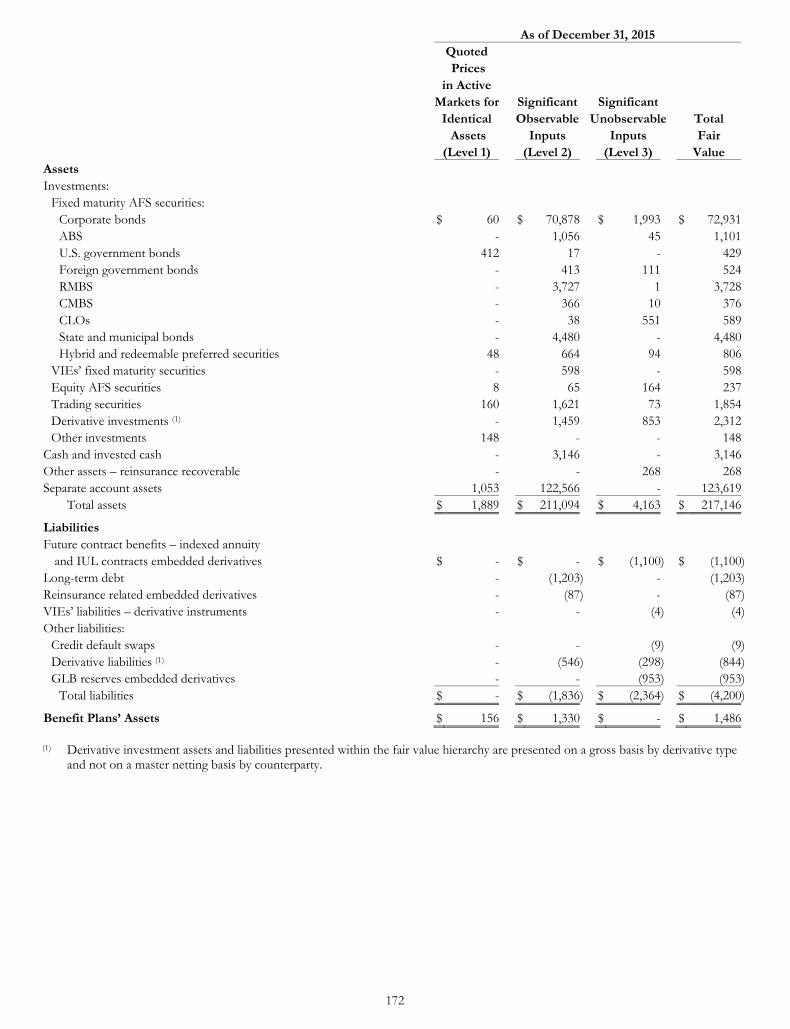
172
As of December 31, 2015 Quoted Prices in Active
Markets for Significant Significant Identical Observable Unobservable Total Assets Inputs Inputs Fair (Level 1) (Level 2) (Level 3) Value Assets Investments:
Fixed maturity AFS securities: Corporate bonds $ 60 $ 70,878 $ 1,993 $ 72,931ABS - 1,056 45 1,101U.S. government bonds 412 17 - 429Foreign government bonds - 413 111 524RMBS - 3,727 1 3,728CMBS - 366 10 376CLOs - 38 551 589State and municipal bonds - 4,480 - 4,480Hybrid and redeemable preferred securities 48 664 94 806
VIEs’ fixed maturity securities - 598 - 598Equity AFS securities 8 65 164 237Trading securities 160 1,621 73 1,854Derivative investments (1) - 1,459 853 2,312Other investments 148 - - 148
Cash and invested cash - 3,146 - 3,146Other assets – reinsurance recoverable - - 268 268Separate account assets 1,053 122,566 - 123,619
Total assets $ 1,889 $ 211,094 $ 4,163 $ 217,146
Liabilities Future contract benefits – indexed annuity
and IUL contracts embedded derivatives $ - $ - $ (1,100) $ (1,100)Long-term debt - (1,203) - (1,203)Reinsurance related embedded derivatives - (87) - (87)VIEs’ liabilities – derivative instruments - - (4) (4)Other liabilities:
Credit default swaps - - (9) (9)Derivative liabilities (1) - (546) (298) (844)GLB reserves embedded derivatives - - (953) (953)
Total liabilities $ - $ (1,836) $ (2,364) $ (4,200)
Benefit Plans’ Assets $ 156 $ 1,330 $ - $ 1,486 (1) Derivative investment assets and liabilities presented within the fair value hierarchy are presented on a gross basis by derivative type
and not on a master netting basis by counterparty.
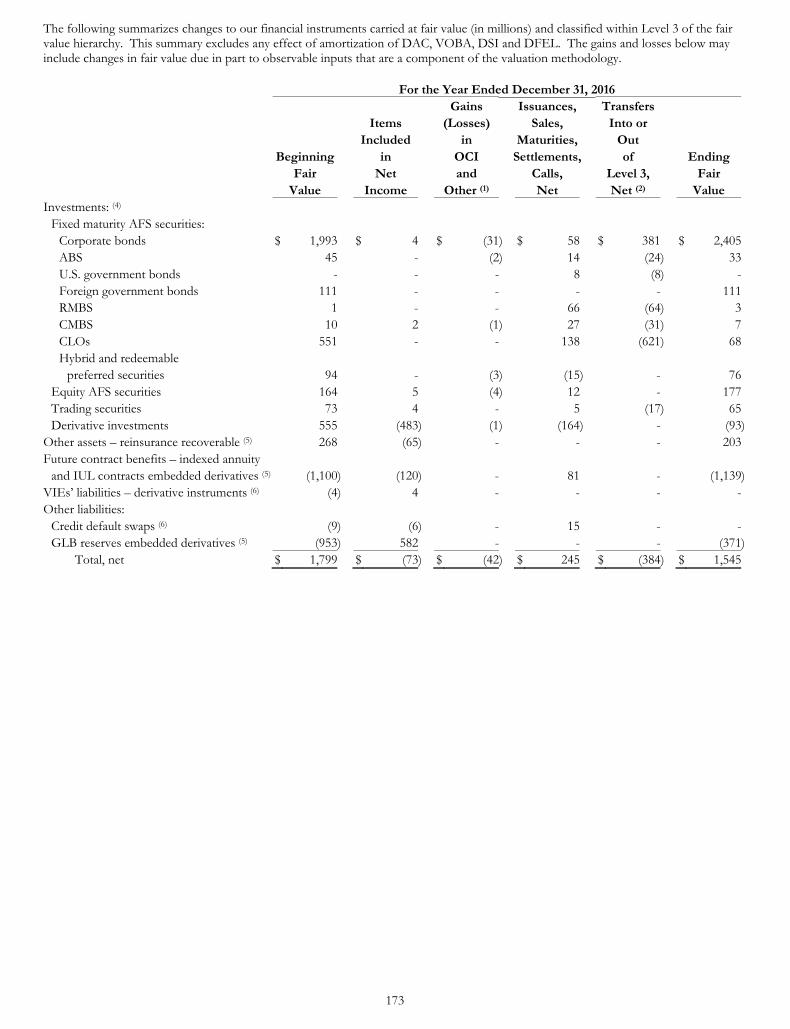
173
The following summarizes changes to our financial instruments carried at fair value (in millions) and classified within Level 3 of the fair value hierarchy. This summary excludes any effect of amortization of DAC, VOBA, DSI and DFEL. The gains and losses below may include changes in fair value due in part to observable inputs that are a component of the valuation methodology.
For the Year Ended December 31, 2016 Gains Issuances, Transfers Items (Losses) Sales, Into or Included in Maturities, Out Beginning in OCI Settlements, of Ending Fair Net and Calls, Level 3, Fair Value Income Other (1) Net Net (2) Value Investments: (4)
Fixed maturity AFS securities: Corporate bonds $ 1,993 $ 4 $ (31) $ 58 $ 381 $ 2,405ABS 45 - (2) 14 (24) 33U.S. government bonds - - - 8 (8) -Foreign government bonds 111 - - - - 111RMBS 1 - - 66 (64) 3CMBS 10 2 (1) 27 (31) 7CLOs 551 - - 138 (621) 68Hybrid and redeemable
preferred securities 94 - (3) (15) - 76Equity AFS securities 164 5 (4) 12 - 177Trading securities 73 4 - 5 (17) 65Derivative investments 555 (483) (1) (164) - (93)
Other assets – reinsurance recoverable (5) 268 (65) - - - 203Future contract benefits – indexed annuity
and IUL contracts embedded derivatives (5) (1,100) (120) - 81 - (1,139)VIEs’ liabilities – derivative instruments (6) (4) 4 - - - -Other liabilities:
Credit default swaps (6) (9) (6) - 15 - -GLB reserves embedded derivatives (5) (953) 582 - - - (371)
Total, net $ 1,799 $ (73) $ (42) $ 245 $ (384) $ 1,545
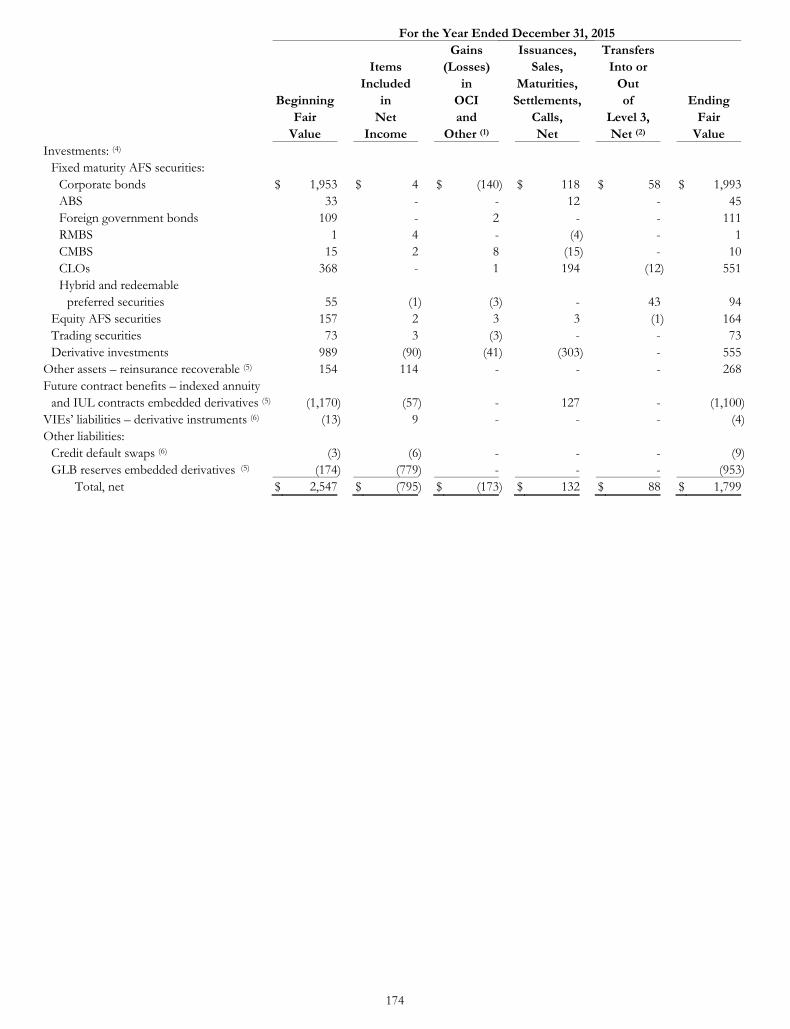
174
For the Year Ended December 31, 2015 Gains Issuances, Transfers Items (Losses) Sales, Into or Included in Maturities, Out Beginning in OCI Settlements, of Ending Fair Net and Calls, Level 3, Fair Value Income Other (1) Net Net (2) Value Investments: (4)
Fixed maturity AFS securities: Corporate bonds $ 1,953 $ 4 $ (140) $ 118 $ 58 $ 1,993ABS 33 - - 12 - 45Foreign government bonds 109 - 2 - - 111RMBS 1 4 - (4) - 1CMBS 15 2 8 (15) - 10CLOs 368 - 1 194 (12) 551Hybrid and redeemable
preferred securities 55 (1) (3) - 43 94Equity AFS securities 157 2 3 3 (1) 164Trading securities 73 3 (3) - - 73Derivative investments 989 (90) (41) (303) - 555
Other assets – reinsurance recoverable (5) 154 114 - - - 268Future contract benefits – indexed annuity
and IUL contracts embedded derivatives (5) (1,170) (57) - 127 - (1,100)VIEs’ liabilities – derivative instruments (6) (13) 9 - - - (4)Other liabilities:
Credit default swaps (6) (3) (6) - - - (9)GLB reserves embedded derivatives (5) (174) (779) - - - (953)
Total, net $ 2,547 $ (795) $ (173) $ 132 $ 88 $ 1,799
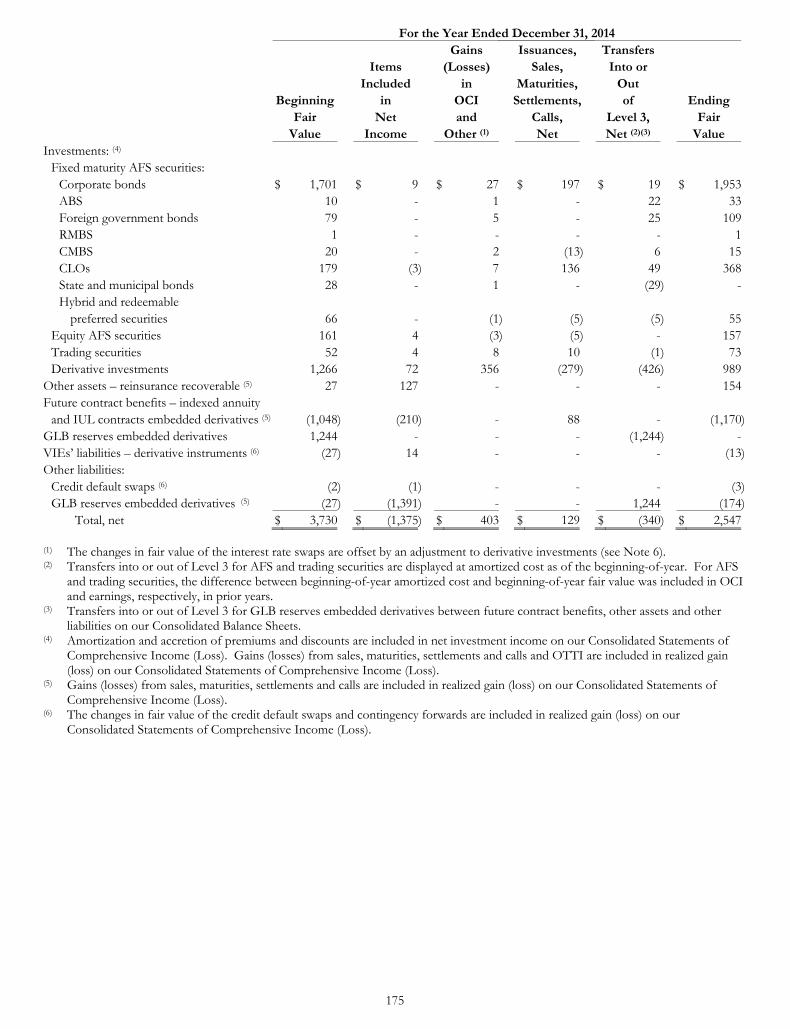
175
For the Year Ended December 31, 2014 Gains Issuances, Transfers Items (Losses) Sales, Into or Included in Maturities, Out Beginning in OCI Settlements, of Ending Fair Net and Calls, Level 3, Fair Value Income Other (1) Net Net (2)(3) Value Investments: (4)
Fixed maturity AFS securities: Corporate bonds $ 1,701 $ 9 $ 27 $ 197 $ 19 $ 1,953ABS 10 - 1 - 22 33Foreign government bonds 79 - 5 - 25 109RMBS 1 - - - - 1CMBS 20 - 2 (13) 6 15CLOs 179 (3) 7 136 49 368State and municipal bonds 28 - 1 - (29) -Hybrid and redeemable
preferred securities 66 - (1) (5) (5) 55Equity AFS securities 161 4 (3) (5) - 157Trading securities 52 4 8 10 (1) 73Derivative investments 1,266 72 356 (279) (426) 989
Other assets – reinsurance recoverable (5) 27 127 - - - 154Future contract benefits – indexed annuity
and IUL contracts embedded derivatives (5) (1,048) (210) - 88 - (1,170)GLB reserves embedded derivatives 1,244 - - - (1,244) -VIEs’ liabilities – derivative instruments (6) (27) 14 - - - (13)Other liabilities:
Credit default swaps (6) (2) (1) - - - (3)GLB reserves embedded derivatives (5) (27) (1,391) - - 1,244 (174)
Total, net $ 3,730 $ (1,375) $ 403 $ 129 $ (340) $ 2,547 (1) The changes in fair value of the interest rate swaps are offset by an adjustment to derivative investments (see Note 6). (2) Transfers into or out of Level 3 for AFS and trading securities are displayed at amortized cost as of the beginning-of-year. For AFS
and trading securities, the difference between beginning-of-year amortized cost and beginning-of-year fair value was included in OCI and earnings, respectively, in prior years.
(3) Transfers into or out of Level 3 for GLB reserves embedded derivatives between future contract benefits, other assets and other liabilities on our Consolidated Balance Sheets.
(4) Amortization and accretion of premiums and discounts are included in net investment income on our Consolidated Statements of Comprehensive Income (Loss). Gains (losses) from sales, maturities, settlements and calls and OTTI are included in realized gain (loss) on our Consolidated Statements of Comprehensive Income (Loss).
(5) Gains (losses) from sales, maturities, settlements and calls are included in realized gain (loss) on our Consolidated Statements of Comprehensive Income (Loss).
(6) The changes in fair value of the credit default swaps and contingency forwards are included in realized gain (loss) on our Consolidated Statements of Comprehensive Income (Loss).
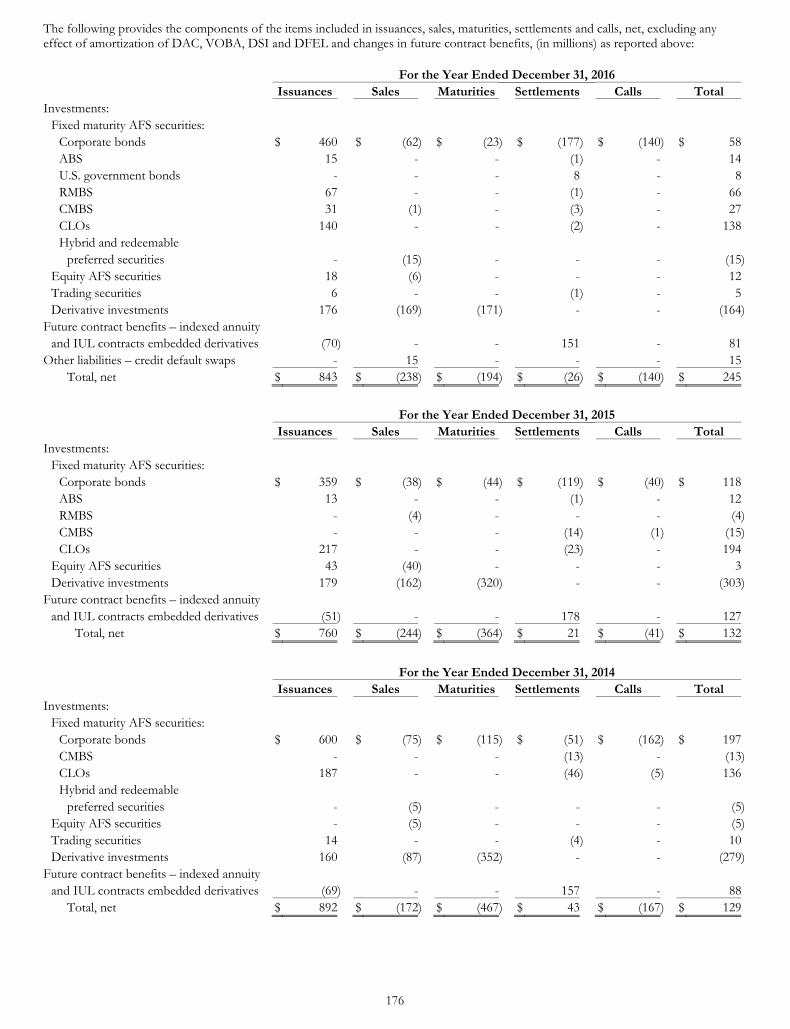
176
The following provides the components of the items included in issuances, sales, maturities, settlements and calls, net, excluding any effect of amortization of DAC, VOBA, DSI and DFEL and changes in future contract benefits, (in millions) as reported above:
For the Year Ended December 31, 2016 Issuances Sales Maturities Settlements Calls Total Investments:
Fixed maturity AFS securities: Corporate bonds $ 460 $ (62) $ (23) $ (177) $ (140) $ 58ABS 15 - - (1) - 14U.S. government bonds - - - 8 - 8RMBS 67 - - (1) - 66CMBS 31 (1) - (3) - 27CLOs 140 - - (2) - 138Hybrid and redeemable
preferred securities - (15) - - - (15)Equity AFS securities 18 (6) - - - 12Trading securities 6 - - (1) - 5Derivative investments 176 (169) (171) - - (164)
Future contract benefits – indexed annuity and IUL contracts embedded derivatives (70) - - 151 - 81
Other liabilities – credit default swaps - 15 - - - 15Total, net $ 843 $ (238) $ (194) $ (26) $ (140) $ 245
For the Year Ended December 31, 2015 Issuances Sales Maturities Settlements Calls Total Investments:
Fixed maturity AFS securities: Corporate bonds $ 359 $ (38) $ (44) $ (119) $ (40) $ 118ABS 13 - - (1) - 12RMBS - (4) - - - (4)CMBS - - - (14) (1) (15)CLOs 217 - - (23) - 194
Equity AFS securities 43 (40) - - - 3Derivative investments 179 (162) (320) - - (303)
Future contract benefits – indexed annuity and IUL contracts embedded derivatives (51) - - 178 - 127
Total, net $ 760 $ (244) $ (364) $ 21 $ (41) $ 132
For the Year Ended December 31, 2014 Issuances Sales Maturities Settlements Calls Total Investments:
Fixed maturity AFS securities: Corporate bonds $ 600 $ (75) $ (115) $ (51) $ (162) $ 197CMBS - - - (13) - (13)CLOs 187 - - (46) (5) 136Hybrid and redeemable
preferred securities - (5) - - - (5)Equity AFS securities - (5) - - - (5)Trading securities 14 - - (4) - 10Derivative investments 160 (87) (352) - - (279)
Future contract benefits – indexed annuity and IUL contracts embedded derivatives (69) - - 157 - 88
Total, net $ 892 $ (172) $ (467) $ 43 $ (167) $ 129
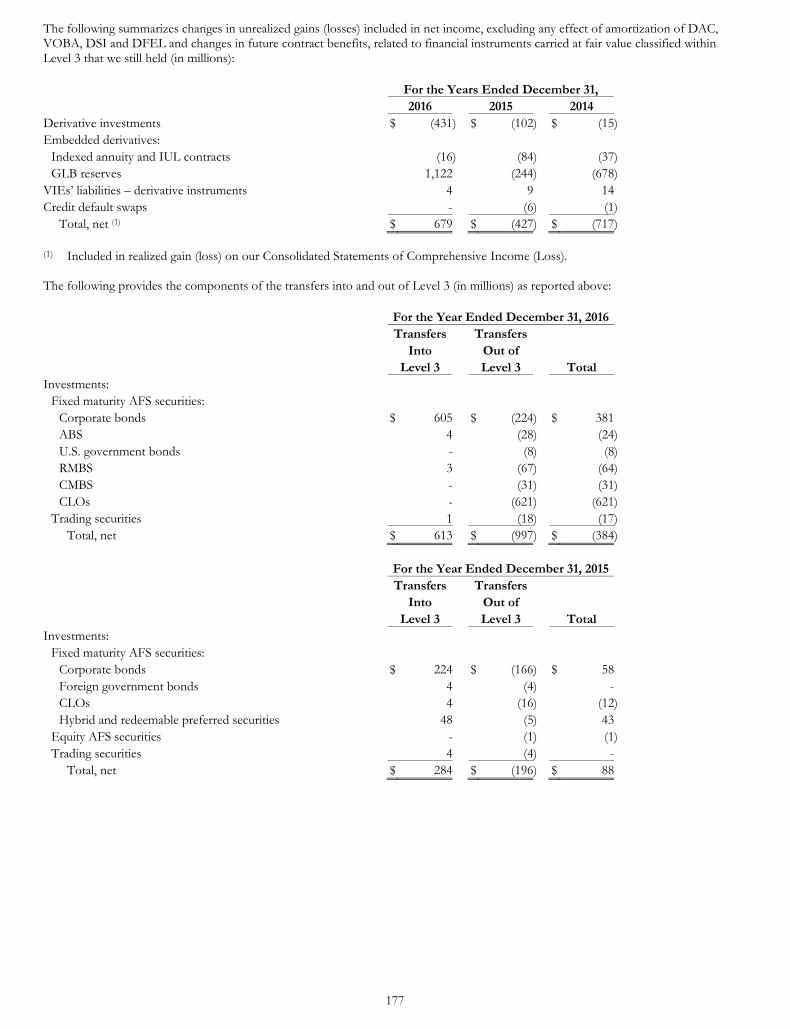
177
The following summarizes changes in unrealized gains (losses) included in net income, excluding any effect of amortization of DAC, VOBA, DSI and DFEL and changes in future contract benefits, related to financial instruments carried at fair value classified within Level 3 that we still held (in millions):
For the Years Ended December 31, 2016 2015 2014 Derivative investments $ (431) $ (102) $ (15) Embedded derivatives:
Indexed annuity and IUL contracts (16) (84) (37) GLB reserves 1,122 (244) (678)
VIEs’ liabilities – derivative instruments 4 9 14 Credit default swaps - (6) (1)
Total, net (1) $ 679 $ (427) $ (717) (1) Included in realized gain (loss) on our Consolidated Statements of Comprehensive Income (Loss). The following provides the components of the transfers into and out of Level 3 (in millions) as reported above:
For the Year Ended December 31, 2016 Transfers Transfers Into Out of Level 3 Level 3 Total Investments:
Fixed maturity AFS securities: Corporate bonds $ 605 $ (224) $ 381 ABS 4 (28) (24) U.S. government bonds - (8) (8) RMBS 3 (67) (64) CMBS - (31) (31) CLOs - (621) (621)
Trading securities 1 (18) (17) Total, net $ 613 $ (997) $ (384)
For the Year Ended December 31, 2015 Transfers Transfers Into Out of Level 3 Level 3 Total Investments:
Fixed maturity AFS securities: Corporate bonds $ 224 $ (166) $ 58 Foreign government bonds 4 (4) - CLOs 4 (16) (12) Hybrid and redeemable preferred securities 48 (5) 43
Equity AFS securities - (1) (1) Trading securities 4 (4) -
Total, net $ 284 $ (196) $ 88
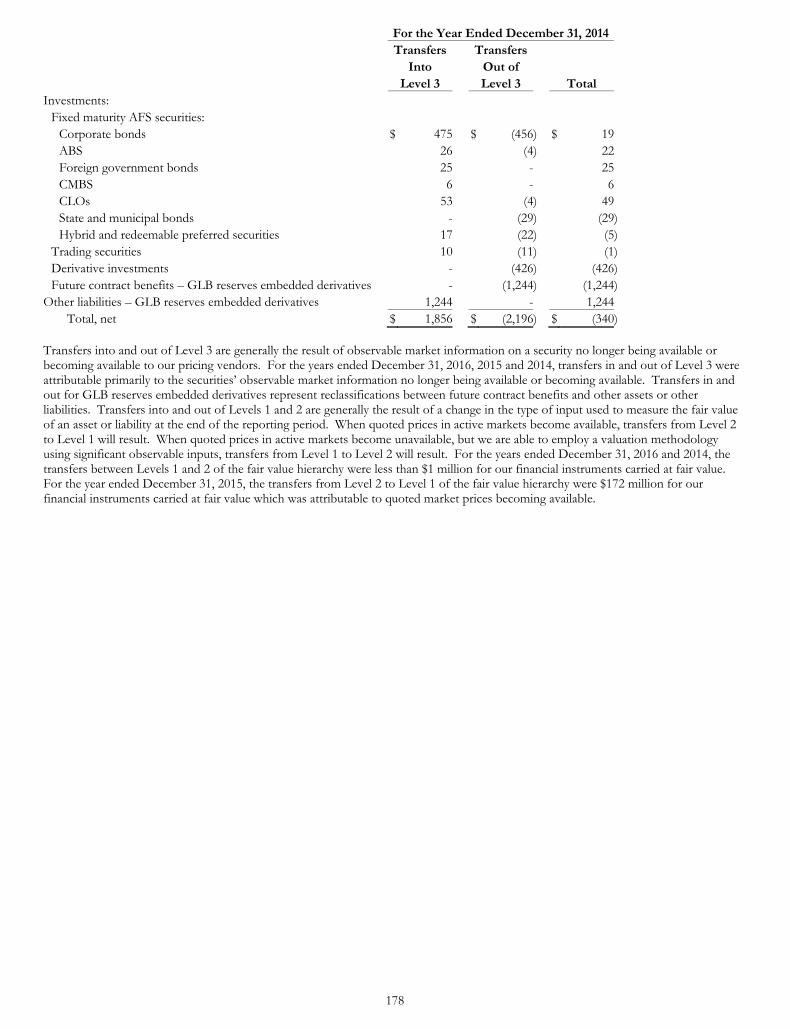
178
For the Year Ended December 31, 2014 Transfers Transfers Into Out of Level 3 Level 3 Total Investments:
Fixed maturity AFS securities: Corporate bonds $ 475 $ (456) $ 19 ABS 26 (4) 22 Foreign government bonds 25 - 25 CMBS 6 - 6 CLOs 53 (4) 49 State and municipal bonds - (29) (29) Hybrid and redeemable preferred securities 17 (22) (5)
Trading securities 10 (11) (1) Derivative investments - (426) (426) Future contract benefits – GLB reserves embedded derivatives - (1,244) (1,244)
Other liabilities – GLB reserves embedded derivatives 1,244 - 1,244 Total, net $ 1,856 $ (2,196) $ (340)
Transfers into and out of Level 3 are generally the result of observable market information on a security no longer being available or becoming available to our pricing vendors. For the years ended December 31, 2016, 2015 and 2014, transfers in and out of Level 3 were attributable primarily to the securities’ observable market information no longer being available or becoming available. Transfers in and out for GLB reserves embedded derivatives represent reclassifications between future contract benefits and other assets or other liabilities. Transfers into and out of Levels 1 and 2 are generally the result of a change in the type of input used to measure the fair value of an asset or liability at the end of the reporting period. When quoted prices in active markets become available, transfers from Level 2 to Level 1 will result. When quoted prices in active markets become unavailable, but we are able to employ a valuation methodology using significant observable inputs, transfers from Level 1 to Level 2 will result. For the years ended December 31, 2016 and 2014, the transfers between Levels 1 and 2 of the fair value hierarchy were less than $1 million for our financial instruments carried at fair value. For the year ended December 31, 2015, the transfers from Level 2 to Level 1 of the fair value hierarchy were $172 million for our financial instruments carried at fair value which was attributable to quoted market prices becoming available.
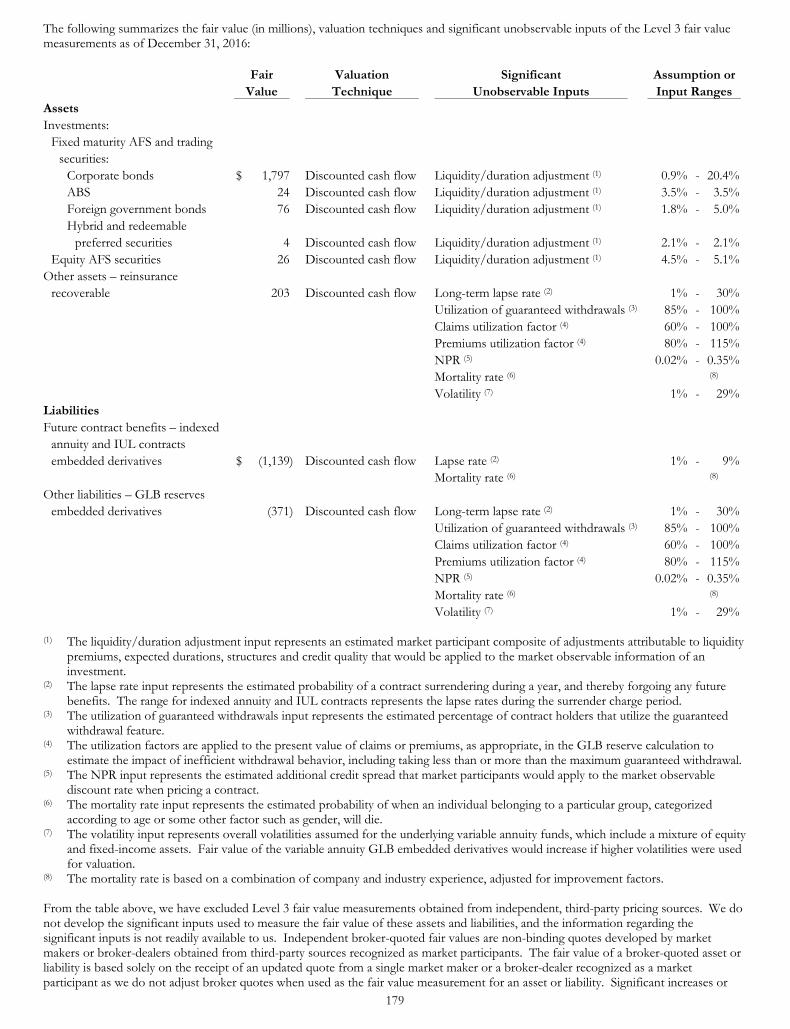
179
The following summarizes the fair value (in millions), valuation techniques and significant unobservable inputs of the Level 3 fair value measurements as of December 31, 2016:
Fair Valuation Significant Assumption or Value Technique Unobservable Inputs Input RangesAssets Investments:
Fixed maturity AFS and trading securities:
Corporate bonds $ 1,797 Discounted cash flow Liquidity/duration adjustment (1) 0.9% - 20.4%ABS 24 Discounted cash flow Liquidity/duration adjustment (1) 3.5% - 3.5%Foreign government bonds 76 Discounted cash flow Liquidity/duration adjustment (1) 1.8% - 5.0%Hybrid and redeemable
preferred securities 4 Discounted cash flow Liquidity/duration adjustment (1) 2.1% - 2.1%Equity AFS securities 26 Discounted cash flow Liquidity/duration adjustment (1) 4.5% - 5.1%
Other assets – reinsurance recoverable 203 Discounted cash flow Long-term lapse rate (2) 1% - 30%
Utilization of guaranteed withdrawals (3) 85% - 100% Claims utilization factor (4) 60% - 100%
Premiums utilization factor (4) 80% - 115% NPR (5) 0.02% - 0.35% Mortality rate (6) (8)
Volatility (7) 1% - 29%Liabilities Future contract benefits – indexed
annuity and IUL contracts embedded derivatives $ (1,139) Discounted cash flow Lapse rate (2) 1% - 9%
Mortality rate (6) (8) Other liabilities – GLB reserves
embedded derivatives (371) Discounted cash flow Long-term lapse rate (2) 1% - 30% Utilization of guaranteed withdrawals (3) 85% - 100% Claims utilization factor (4) 60% - 100% Premiums utilization factor (4) 80% - 115% NPR (5) 0.02% - 0.35% Mortality rate (6) (8)
Volatility (7) 1% - 29% (1) The liquidity/duration adjustment input represents an estimated market participant composite of adjustments attributable to liquidity
premiums, expected durations, structures and credit quality that would be applied to the market observable information of an investment.
(2) The lapse rate input represents the estimated probability of a contract surrendering during a year, and thereby forgoing any future benefits. The range for indexed annuity and IUL contracts represents the lapse rates during the surrender charge period.
(3) The utilization of guaranteed withdrawals input represents the estimated percentage of contract holders that utilize the guaranteed withdrawal feature.
(4) The utilization factors are applied to the present value of claims or premiums, as appropriate, in the GLB reserve calculation to estimate the impact of inefficient withdrawal behavior, including taking less than or more than the maximum guaranteed withdrawal.
(5) The NPR input represents the estimated additional credit spread that market participants would apply to the market observable discount rate when pricing a contract.
(6) The mortality rate input represents the estimated probability of when an individual belonging to a particular group, categorized according to age or some other factor such as gender, will die.
(7) The volatility input represents overall volatilities assumed for the underlying variable annuity funds, which include a mixture of equity and fixed-income assets. Fair value of the variable annuity GLB embedded derivatives would increase if higher volatilities were used for valuation.
(8) The mortality rate is based on a combination of company and industry experience, adjusted for improvement factors. From the table above, we have excluded Level 3 fair value measurements obtained from independent, third-party pricing sources. We do not develop the significant inputs used to measure the fair value of these assets and liabilities, and the information regarding the significant inputs is not readily available to us. Independent broker-quoted fair values are non-binding quotes developed by market makers or broker-dealers obtained from third-party sources recognized as market participants. The fair value of a broker-quoted asset or liability is based solely on the receipt of an updated quote from a single market maker or a broker-dealer recognized as a market participant as we do not adjust broker quotes when used as the fair value measurement for an asset or liability. Significant increases or
180
decreases in any of the quotes received from a third-party broker-dealer may result in a significantly higher or lower fair value measurement. Changes in any of the significant inputs presented in the table above may result in a significant change in the fair value measurement of the asset or liability as follows: • Investments – An increase in the liquidity/duration adjustment input would result in a decrease in the fair value measurement. • Reinsurance recoverable asset – An increase in our lapse rate, NPR or mortality rate inputs would result in a decrease in the fair value
measurement; and an increase in the utilization of guaranteed withdrawal or volatility inputs would result in an increase in the fair value measurement.
• Indexed annuity and IUL contracts embedded derivatives – An increase in the lapse rate or mortality rate inputs would result in a decrease in the fair value measurement.
• GLB reserves embedded derivatives – Assuming our GLB reserves embedded derivatives are in a liability position: an increase in our lapse rate, NPR or mortality rate inputs would result in a decrease in the fair value measurement; and an increase in the utilization of guaranteed withdrawal or volatility inputs would result in an increase in the fair value measurement.
For each category discussed above, the unobservable inputs are not inter-related; therefore, a directional change in one input will not affect the other inputs. As part of our ongoing valuation process, we assess the reasonableness of our valuation techniques or models and make adjustments as necessary. For more information, see “Summary of Significant Accounting Policies” above. 21. Segment Information We provide products and services and report results through our Annuities, Retirement Plan Services, Life Insurance and Group Protection segments. We also have Other Operations, which includes the financial data for operations that are not directly related to the business segments. Our reporting segments reflect the manner by which our chief operating decision makers view and manage the business. The following is a brief description of these segments and Other Operations. The Annuities segment provides tax-deferred investment growth and lifetime income opportunities for its clients by offering fixed (including indexed) and variable annuities. The Retirement Plan Services segment provides employer-sponsored defined benefit and individual retirement accounts, as well as individual and group variable annuities, group fixed annuities and mutual-fund based programs in the retirement plan marketplace. The Life Insurance segment focuses in the creation and protection of wealth through life insurance products, including term insurance, a linked-benefit product (which is a UL policy linked with riders that provide for long-term care costs), IUL and both single and survivorship versions of UL and VUL, including corporate-owned UL and VUL insurance and bank-owned UL and VUL insurance products. The Group Protection segment offers principally group non-medical insurance products, including term life, universal life, disability, dental, vision, accident and critical illness insurance to the employer market place through various forms of contributory and non-contributory plans. Its products are marketed primarily through a national distribution system of regional group offices. These offices develop business through employee benefit brokers, third-party administrators and other employee benefit firms. Other Operations includes investments related to the excess capital in our insurance subsidiaries; investments in media properties (see Note 3 for more information) and other corporate investments; benefit plan net liability; the unamortized deferred gain on indemnity reinsurance related to the sale of reinsurance; the results of certain disability income business; our run-off institutional pension business, the majority of which was sold on a group annuity basis; and debt costs. Segment operating revenues and income (loss) from operations are internal measures used by our management and Board of Directors to evaluate and assess the results of our segments. Income (loss) from operations is GAAP net income excluding the after-tax effects of the following items, as applicable: • Realized gains and losses associated with the following (“excluded realized gain (loss)”):
Sales or disposals and impairments of securities; Changes in the fair value of derivatives, embedded derivatives within certain reinsurance arrangements and trading securities; Changes in the fair value of the derivatives we own to hedge our GDB riders within our variable annuities; Changes in the fair value of the embedded derivatives of our GLB riders reflected within variable annuity net derivative results
accounted for at fair value; Changes in the fair value of the derivatives we own to hedge our GLB riders reflected within variable annuity net derivative
results; and
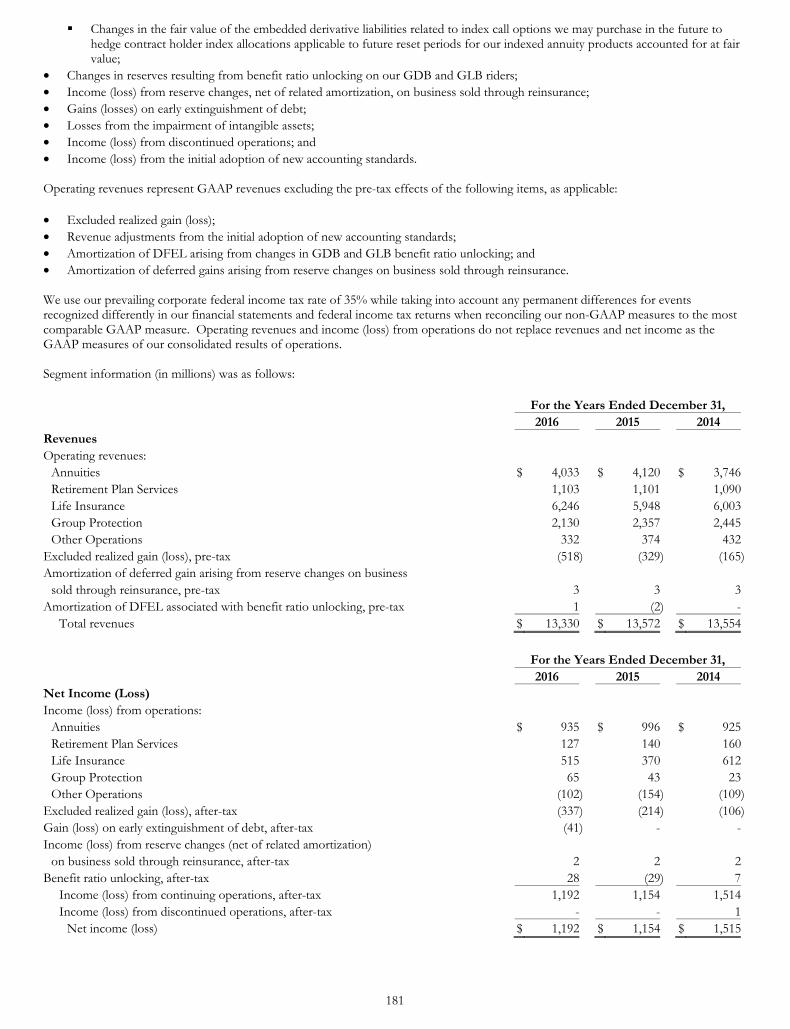
181
Changes in the fair value of the embedded derivative liabilities related to index call options we may purchase in the future to hedge contract holder index allocations applicable to future reset periods for our indexed annuity products accounted for at fair value;
• Changes in reserves resulting from benefit ratio unlocking on our GDB and GLB riders; • Income (loss) from reserve changes, net of related amortization, on business sold through reinsurance; • Gains (losses) on early extinguishment of debt; • Losses from the impairment of intangible assets; • Income (loss) from discontinued operations; and • Income (loss) from the initial adoption of new accounting standards. Operating revenues represent GAAP revenues excluding the pre-tax effects of the following items, as applicable: • Excluded realized gain (loss); • Revenue adjustments from the initial adoption of new accounting standards; • Amortization of DFEL arising from changes in GDB and GLB benefit ratio unlocking; and • Amortization of deferred gains arising from reserve changes on business sold through reinsurance. We use our prevailing corporate federal income tax rate of 35% while taking into account any permanent differences for events recognized differently in our financial statements and federal income tax returns when reconciling our non-GAAP measures to the most comparable GAAP measure. Operating revenues and income (loss) from operations do not replace revenues and net income as the GAAP measures of our consolidated results of operations. Segment information (in millions) was as follows:
For the Years Ended December 31, 2016 2015 2014 Revenues Operating revenues:
Annuities $ 4,033 $ 4,120 $ 3,746Retirement Plan Services 1,103 1,101 1,090Life Insurance 6,246 5,948 6,003Group Protection 2,130 2,357 2,445Other Operations 332 374 432
Excluded realized gain (loss), pre-tax (518) (329) (165)Amortization of deferred gain arising from reserve changes on business
sold through reinsurance, pre-tax 3 3 3Amortization of DFEL associated with benefit ratio unlocking, pre-tax 1 (2) -
Total revenues $ 13,330 $ 13,572 $ 13,554
For the Years Ended December 31, 2016 2015 2014 Net Income (Loss) Income (loss) from operations:
Annuities $ 935 $ 996 $ 925Retirement Plan Services 127 140 160Life Insurance 515 370 612Group Protection 65 43 23Other Operations (102) (154) (109)
Excluded realized gain (loss), after-tax (337) (214) (106)Gain (loss) on early extinguishment of debt, after-tax (41) - -Income (loss) from reserve changes (net of related amortization)
on business sold through reinsurance, after-tax 2 2 2Benefit ratio unlocking, after-tax 28 (29) 7
Income (loss) from continuing operations, after-tax 1,192 1,154 1,514Income (loss) from discontinued operations, after-tax - - 1
Net income (loss) $ 1,192 $ 1,154 $ 1,515
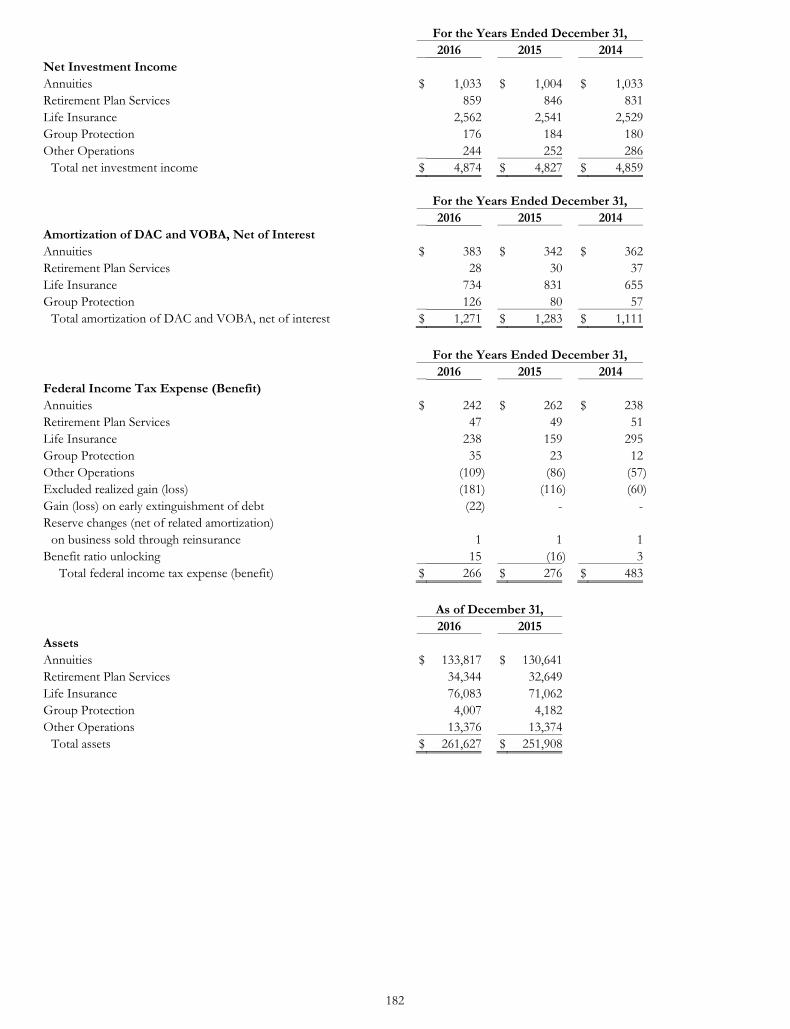
182
For the Years Ended December 31, 2016 2015 2014 Net Investment Income Annuities $ 1,033 $ 1,004 $ 1,033 Retirement Plan Services 859 846 831 Life Insurance 2,562 2,541 2,529 Group Protection 176 184 180 Other Operations 244 252 286
Total net investment income $ 4,874 $ 4,827 $ 4,859
For the Years Ended December 31, 2016 2015 2014 Amortization of DAC and VOBA, Net of Interest Annuities $ 383 $ 342 $ 362 Retirement Plan Services 28 30 37 Life Insurance 734 831 655 Group Protection 126 80 57
Total amortization of DAC and VOBA, net of interest $ 1,271 $ 1,283 $ 1,111
For the Years Ended December 31, 2016 2015 2014 Federal Income Tax Expense (Benefit) Annuities $ 242 $ 262 $ 238 Retirement Plan Services 47 49 51 Life Insurance 238 159 295 Group Protection 35 23 12 Other Operations (109) (86) (57) Excluded realized gain (loss) (181) (116) (60) Gain (loss) on early extinguishment of debt (22) - - Reserve changes (net of related amortization)
on business sold through reinsurance 1 1 1 Benefit ratio unlocking 15 (16) 3
Total federal income tax expense (benefit) $ 266 $ 276 $ 483
As of December 31, 2016 2015 Assets Annuities $ 133,817 $ 130,641 Retirement Plan Services 34,344 32,649 Life Insurance 76,083 71,062 Group Protection 4,007 4,182 Other Operations 13,376 13,374
Total assets $ 261,627 $ 251,908
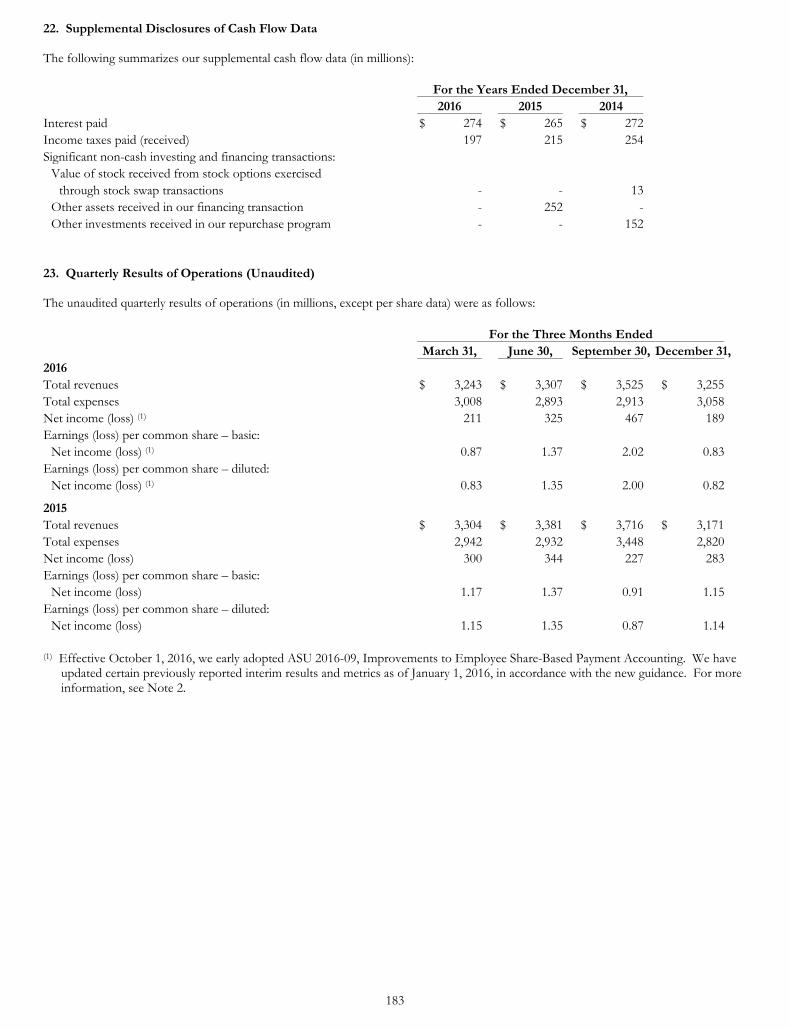
183
22. Supplemental Disclosures of Cash Flow Data The following summarizes our supplemental cash flow data (in millions):
For the Years Ended December 31, 2016 2015 2014 Interest paid $ 274 $ 265 $ 272 Income taxes paid (received) 197 215 254 Significant non-cash investing and financing transactions:
Value of stock received from stock options exercised through stock swap transactions - - 13
Other assets received in our financing transaction - 252 - Other investments received in our repurchase program - - 152
23. Quarterly Results of Operations (Unaudited) The unaudited quarterly results of operations (in millions, except per share data) were as follows:
For the Three Months Ended March 31, June 30, September 30, December 31,2016 Total revenues $ 3,243 $ 3,307 $ 3,525 $ 3,255 Total expenses 3,008 2,893 2,913 3,058 Net income (loss) (1) 211 325 467 189 Earnings (loss) per common share – basic:
Net income (loss) (1) 0.87 1.37 2.02 0.83 Earnings (loss) per common share – diluted:
Net income (loss) (1) 0.83 1.35 2.00 0.82
2015 Total revenues $ 3,304 $ 3,381 $ 3,716 $ 3,171 Total expenses 2,942 2,932 3,448 2,820 Net income (loss) 300 344 227 283 Earnings (loss) per common share – basic:
Net income (loss) 1.17 1.37 0.91 1.15 Earnings (loss) per common share – diluted:
Net income (loss) 1.15 1.35 0.87 1.14
(1) Effective October 1, 2016, we early adopted ASU 2016-09, Improvements to Employee Share-Based Payment Accounting. We have
updated certain previously reported interim results and metrics as of January 1, 2016, in accordance with the new guidance. For more information, see Note 2.
184
Item 9. Changes in and Disagreements with Accountants on Accounting and Financial Disclosure None. Item 9A. Controls and Procedures (a) Conclusions Regarding Disclosure Controls and Procedures We maintain disclosure controls and procedures, which are designed to ensure that information required to be disclosed in the reports we file or submit under the Securities Exchange Act of 1934, as amended (the “Exchange Act”), is recorded, processed, summarized and reported within the time periods specified in the Securities and Exchange Commission’s rules and forms, and that such information is accumulated and communicated to the Company’s management, including our Chief Executive Officer and Chief Financial Officer, as appropriate to allow timely decisions regarding required disclosure. As of the end of the period required by this report, we, under the supervision and with the participation of our Chief Executive Officer and Chief Financial Officer, conducted an evaluation of the effectiveness of our disclosure controls and procedures (as defined in Rule 13a-15(e) of the Exchange Act). Based on that evaluation, our Chief Executive Officer and Chief Financial Officer have concluded that our disclosure controls and procedures are effective in timely alerting them to material information relating to us and our consolidated subsidiaries required to be disclosed in our periodic reports under the Exchange Act. (b) Management’s Report on Internal Control Over Financial Reporting Management’s Report on Internal Control Over Financial Reporting is included on page 102 of “Item 8. Financial Statements and Supplementary Data” and is incorporated herein by reference. A control system, no matter how well designed and operated, can provide only reasonable assurance that the control system’s objectives will be met. Further, because of the inherent limitations in all control systems, no evaluation of controls can provide absolute assurance that misstatements due to error or fraud will not occur or that all control issues and instances of fraud, if any, within the Company have been detected. Projections of any evaluation of controls’ effectiveness to future periods are subject to risks. Over time, controls may become inadequate because of changes in conditions or deterioration in the degree of compliance with policies or procedures. (c) Changes in Internal Control Over Financial Reporting There was no change in our internal control over financial reporting (as that term is defined in rules 13a-15(f) and 15d-15(f) under the Exchange Act) that occurred during the quarter ended December 31, 2016, that has materially affected, or is reasonably likely to materially affect, our internal control over financial reporting. Item 9B. Other Information None.
PART III Item 10. Directors, Executive Officers and Corporate Governance Information for this item relating to officers of LNC is incorporated by reference to “Part I – Executive Officers of the Registrant.” Information for this item relating to directors of LNC is incorporated by reference to the sections captioned “GOVERNANCE OF THE COMPANY – Our Corporate Governance Guidelines,” “GOVERNANCE OF THE COMPANY – Director Nomination Process,” “THE BOARD OF DIRECTORS AND COMMITTEES – Current Committee Membership and Meetings Held During 2013,” “THE BOARD OF DIRECTORS AND COMMITTEES – Audit Committee,” “ITEM 1 – Election of Directors,” “COMPLIANCE WITH BENEFICIAL OWNERSHIP REPORTING” and “GENERAL – Shareholder Proposals” of LNC’s Proxy Statement for the Annual Meeting scheduled for May 26, 2017. We have adopted a code of ethics, which we refer to as our “Code of Conduct,” that applies, among others, to our principal executive officer, principal financial officer, principal accounting officer or controller and other persons performing similar functions. The Code of Conduct is posted on our website, www.lfg.com. LNC will provide to any person without charge, upon request, a copy of such code. Requests for the Code of Conduct should be directed to: Corporate Secretary, Lincoln National Corporation, 150 N. Radnor-Chester Road, Suite A305, Radnor, PA 19087. We intend to disclose any amendment to or waiver from the provisions of our Code of Conduct that applies to our directors and executive officers on our website, www.lfg.com. Item 11. Executive Compensation Information for this item is incorporated by reference to the sections captioned “COMPENSATION OF DIRECTORS,” “COMPENSATION DISCUSSION & ANALYSIS,” “EXECUTIVE COMPENSATION TABLES” and “COMPENSATION COMMITTEE INTERLOCKS AND INSIDER PARTICIPATION” of LNC’s Proxy Statement for the Annual Meeting scheduled for May 26, 2017.
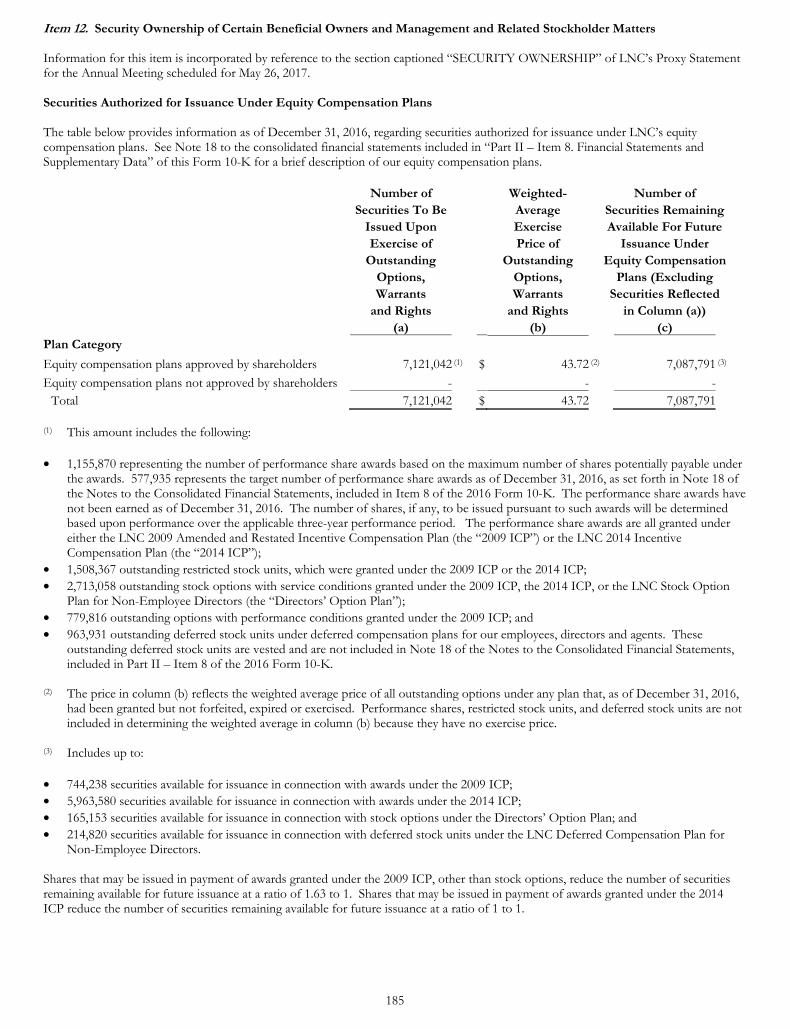
185
Item 12. Security Ownership of Certain Beneficial Owners and Management and Related Stockholder Matters Information for this item is incorporated by reference to the section captioned “SECURITY OWNERSHIP” of LNC’s Proxy Statement for the Annual Meeting scheduled for May 26, 2017. Securities Authorized for Issuance Under Equity Compensation Plans The table below provides information as of December 31, 2016, regarding securities authorized for issuance under LNC’s equity compensation plans. See Note 18 to the consolidated financial statements included in “Part II – Item 8. Financial Statements and Supplementary Data” of this Form 10-K for a brief description of our equity compensation plans.
Number of Weighted- Number of Securities To Be Average Securities Remaining Issued Upon Exercise Available For Future Exercise of Price of Issuance Under Outstanding Outstanding Equity Compensation Options, Options, Plans (Excluding Warrants Warrants Securities Reflected and Rights and Rights in Column (a)) (a) (b) (c) Plan Category
Equity compensation plans approved by shareholders 7,121,042 (1) $ 43.72 (2) 7,087,791 (3)
Equity compensation plans not approved by shareholders - - -Total 7,121,042 $ 43.72 7,087,791
(1) This amount includes the following: • 1,155,870 representing the number of performance share awards based on the maximum number of shares potentially payable under
the awards. 577,935 represents the target number of performance share awards as of December 31, 2016, as set forth in Note 18 of the Notes to the Consolidated Financial Statements, included in Item 8 of the 2016 Form 10-K. The performance share awards have not been earned as of December 31, 2016. The number of shares, if any, to be issued pursuant to such awards will be determined based upon performance over the applicable three-year performance period. The performance share awards are all granted under either the LNC 2009 Amended and Restated Incentive Compensation Plan (the “2009 ICP”) or the LNC 2014 Incentive Compensation Plan (the “2014 ICP”);
• 1,508,367 outstanding restricted stock units, which were granted under the 2009 ICP or the 2014 ICP; • 2,713,058 outstanding stock options with service conditions granted under the 2009 ICP, the 2014 ICP, or the LNC Stock Option
Plan for Non-Employee Directors (the “Directors’ Option Plan”); • 779,816 outstanding options with performance conditions granted under the 2009 ICP; and • 963,931 outstanding deferred stock units under deferred compensation plans for our employees, directors and agents. These
outstanding deferred stock units are vested and are not included in Note 18 of the Notes to the Consolidated Financial Statements, included in Part II – Item 8 of the 2016 Form 10-K.
(2) The price in column (b) reflects the weighted average price of all outstanding options under any plan that, as of December 31, 2016,
had been granted but not forfeited, expired or exercised. Performance shares, restricted stock units, and deferred stock units are not included in determining the weighted average in column (b) because they have no exercise price.
(3) Includes up to: • 744,238 securities available for issuance in connection with awards under the 2009 ICP; • 5,963,580 securities available for issuance in connection with awards under the 2014 ICP; • 165,153 securities available for issuance in connection with stock options under the Directors’ Option Plan; and • 214,820 securities available for issuance in connection with deferred stock units under the LNC Deferred Compensation Plan for
Non-Employee Directors. Shares that may be issued in payment of awards granted under the 2009 ICP, other than stock options, reduce the number of securities remaining available for future issuance at a ratio of 1.63 to 1. Shares that may be issued in payment of awards granted under the 2014 ICP reduce the number of securities remaining available for future issuance at a ratio of 1 to 1.

186
Item 13. Certain Relationships and Related Transactions, and Director Independence Information for this item is incorporated by reference to the sections captioned “RELATED PARTY TRANSACTIONS” and “GOVERNANCE OF THE COMPANY – Director Independence” of LNC’s Proxy Statement for the Annual Meeting scheduled for May 26, 2017. Item 14. Principal Accounting Fees and Services Information for this item is incorporated by reference to the sections captioned “ITEM 2 – RATIFICATION OF THE APPOINTMENT OF THE INDEPENDENT REGISTERED PUBLIC ACCOUNTING FIRM” of LNC’s Proxy Statement for the Annual Meeting scheduled for May 26, 2017.
PART IV
Item 15. Exhibits, Financial Statement Schedules (a) (1) Financial Statements The following Consolidated Financial Statements of Lincoln National Corporation are included in Part II – Item 8:
Management Report on Internal Control Over Financial Reporting Reports of Independent Registered Public Accounting Firm Consolidated Balance Sheets – December 31, 2016 and 2015 Consolidated Statements of Comprehensive Income (Loss) – Years ended December 31, 2016, 2015 and 2014 Consolidated Statements of Stockholders’ Equity – Years ended December 31, 2016, 2015 and 2014 Consolidated Statements of Cash Flows – Years ended December 31, 2016, 2015 and 2014 Notes to Consolidated Financial Statements
(a) (2) Financial Statement Schedules The Financial Statement Schedules are listed in the Index to Financial Statement Schedules on page FS-1, which is incorporated herein by reference. (a) (3) Listing of Exhibits The Exhibits are listed in the Index to Exhibits beginning on page E-1, which is incorporated herein by reference. (c) The Financial Statement Schedules for Lincoln National Corporation begin on page FS-2, which are incorporated herein by reference.

187
SIGNATURES Pursuant to the requirements of Section 13 or 15(d) of the Securities Exchange Act of 1934, LNC has duly caused this report to be signed on its behalf by the undersigned, thereunto duly authorized.
LINCOLN NATIONAL CORPORATION
Dated: February 23, 2017 By: /s/ Randal J. Freitag Randal J. Freitag Executive Vice President and Chief Financial Officer Pursuant to the requirements of the Securities Exchange Act of 1934, this report has been signed below by the following persons on behalf of the registrant and in the capacities indicated on February 23, 2017.
Signature Title
/s/ Dennis R. Glass President, Chief Executive Officer and Director
Dennis R. Glass (Principal Executive Officer)
/s/ Randal J. Freitag Executive Vice President and Chief Financial Officer Randal J. Freitag (Principal Financial Officer)
/s/ Christine A. Janofsky Senior Vice President and Chief Accounting Officer Christine A. Janofsky (Principal Accounting Officer)
/s/ Deirdre P. Connelly Director Deirdre P. Connelly
/s/ William H. Cunningham Director William H. Cunningham
/s/ George W. Henderson, III Director George W. Henderson, III
/s/ Eric G. Johnson Director
Eric G. Johnson
/s/ Gary C. Kelly Director Gary C. Kelly
/s/ M. Leanne Lachman Director M. Leanne Lachman
/s/ Michael F. Mee Director Michael F. Mee
/s/ William Porter Payne Director William Porter Payne
/s/ Patrick S. Pittard Director Patrick S. Pittard
/s/ Isaiah Tidwell Director Isaiah Tidwell

FS-1
Index to Financial Statement Schedules
I – Summary of Investments – Other than Investments in Related Parties FS-2 II – Condensed Financial Information of Registrant FS-3 III – Supplementary Insurance Information FS-6 IV – Reinsurance FS-8 All other schedules for which provision is made in the applicable accounting regulation of the Securities and Exchange Commission are not required under the related instructions, are inapplicable, or the required information is included in the consolidated financial statements, and therefore omitted. See “Part II – Item 7. Management’s Discussion and Analysis of Financial Condition and Results of Operations – Critical Accounting Policies and Estimates” on page 38 for more detail on items contained within these schedules.
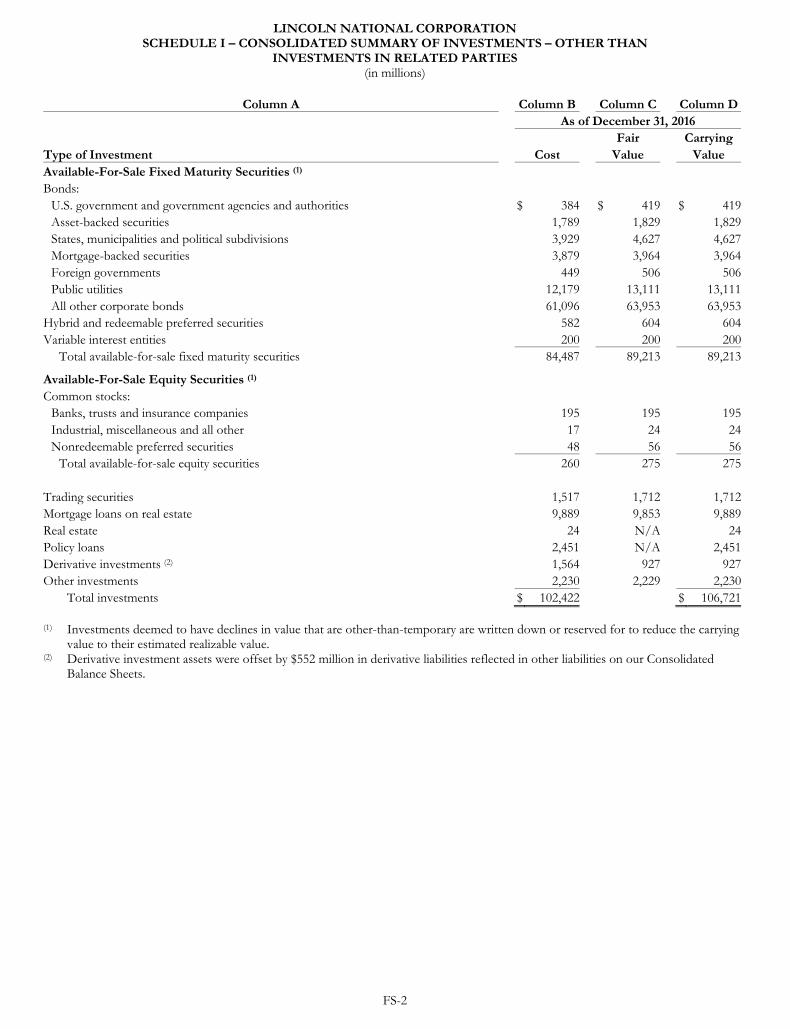
FS-2
LINCOLN NATIONAL CORPORATION SCHEDULE I – CONSOLIDATED SUMMARY OF INVESTMENTS – OTHER THAN
INVESTMENTS IN RELATED PARTIES (in millions)
Column A Column B Column C Column D
As of December 31, 2016 Fair CarryingType of Investment Cost Value Value Available-For-Sale Fixed Maturity Securities (1) Bonds:
U.S. government and government agencies and authorities $ 384 $ 419 $ 419Asset-backed securities 1,789 1,829 1,829States, municipalities and political subdivisions 3,929 4,627 4,627Mortgage-backed securities 3,879 3,964 3,964Foreign governments 449 506 506Public utilities 12,179 13,111 13,111All other corporate bonds 61,096 63,953 63,953
Hybrid and redeemable preferred securities 582 604 604Variable interest entities 200 200 200
Total available-for-sale fixed maturity securities 84,487 89,213 89,213
Available-For-Sale Equity Securities (1) Common stocks:
Banks, trusts and insurance companies 195 195 195Industrial, miscellaneous and all other 17 24 24Nonredeemable preferred securities 48 56 56
Total available-for-sale equity securities 260 275 275
Trading securities 1,517 1,712 1,712Mortgage loans on real estate 9,889 9,853 9,889Real estate 24 N/A 24Policy loans 2,451 N/A 2,451Derivative investments (2) 1,564 927 927Other investments 2,230 2,229 2,230
Total investments $ 102,422 $ 106,721 (1) Investments deemed to have declines in value that are other-than-temporary are written down or reserved for to reduce the carrying
value to their estimated realizable value. (2) Derivative investment assets were offset by $552 million in derivative liabilities reflected in other liabilities on our Consolidated
Balance Sheets.
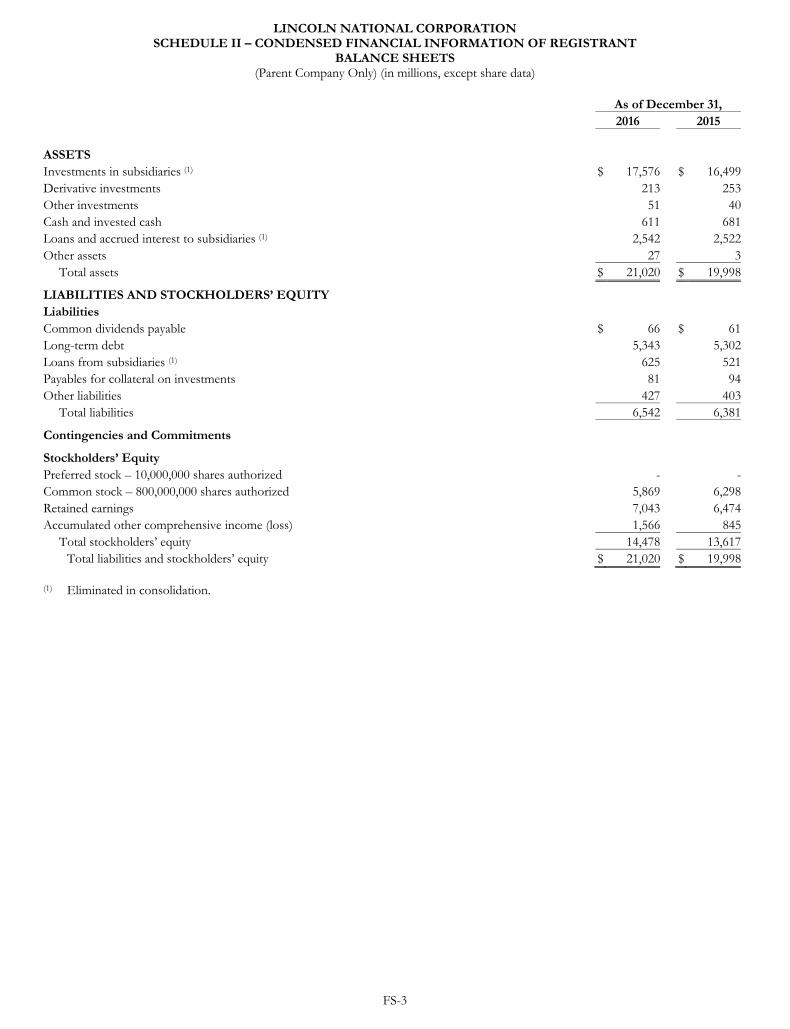
FS-3
LINCOLN NATIONAL CORPORATION SCHEDULE II – CONDENSED FINANCIAL INFORMATION OF REGISTRANT
BALANCE SHEETS (Parent Company Only) (in millions, except share data)
As of December 31, 2016 2015 ASSETS Investments in subsidiaries (1) $ 17,576 $ 16,499Derivative investments 213 253Other investments 51 40Cash and invested cash 611 681Loans and accrued interest to subsidiaries (1) 2,542 2,522Other assets 27 3
Total assets $ 21,020 $ 19,998
LIABILITIES AND STOCKHOLDERS’ EQUITY Liabilities Common dividends payable $ 66 $ 61Long-term debt 5,343 5,302Loans from subsidiaries (1) 625 521Payables for collateral on investments 81 94Other liabilities 427 403
Total liabilities 6,542 6,381
Contingencies and Commitments
Stockholders’ Equity Preferred stock – 10,000,000 shares authorized - -Common stock – 800,000,000 shares authorized 5,869 6,298Retained earnings 7,043 6,474Accumulated other comprehensive income (loss) 1,566 845
Total stockholders’ equity 14,478 13,617Total liabilities and stockholders’ equity $ 21,020 $ 19,998
(1) Eliminated in consolidation.
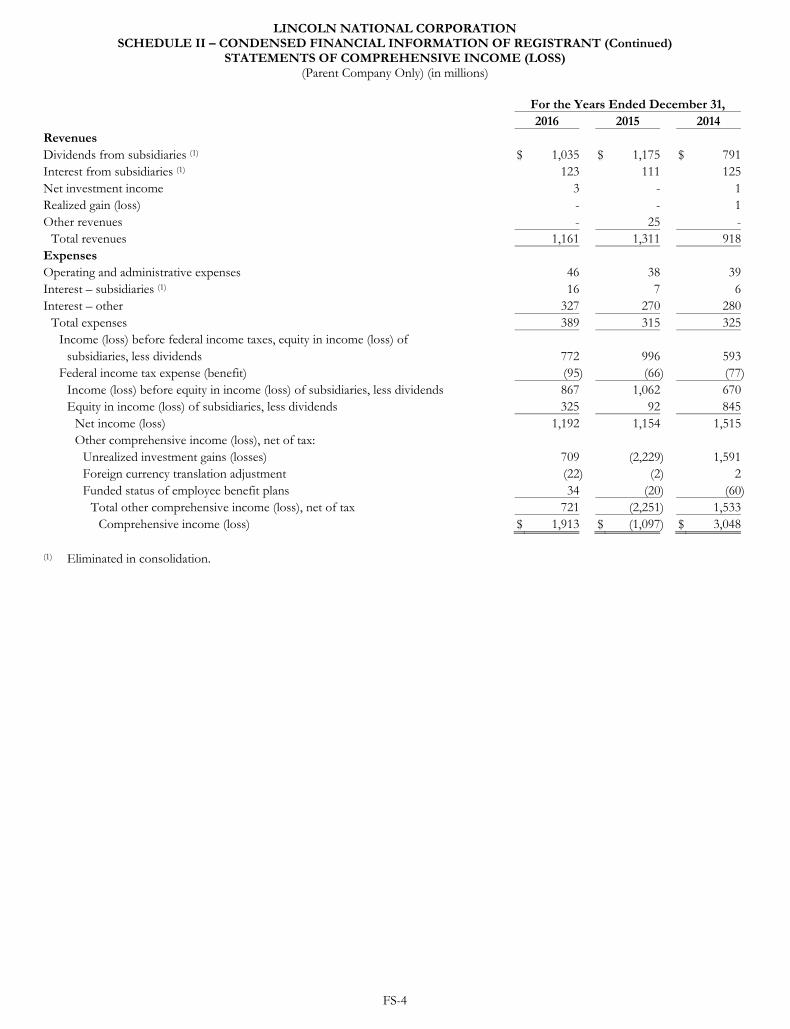
FS-4
LINCOLN NATIONAL CORPORATION SCHEDULE II – CONDENSED FINANCIAL INFORMATION OF REGISTRANT (Continued)
STATEMENTS OF COMPREHENSIVE INCOME (LOSS) (Parent Company Only) (in millions)
For the Years Ended December 31, 2016 2015 2014 Revenues Dividends from subsidiaries (1) $ 1,035 $ 1,175 $ 791Interest from subsidiaries (1) 123 111 125Net investment income 3 - 1Realized gain (loss) - - 1Other revenues - 25 -
Total revenues 1,161 1,311 918Expenses Operating and administrative expenses 46 38 39Interest – subsidiaries (1) 16 7 6Interest – other 327 270 280
Total expenses 389 315 325Income (loss) before federal income taxes, equity in income (loss) of
subsidiaries, less dividends 772 996 593Federal income tax expense (benefit) (95) (66) (77)
Income (loss) before equity in income (loss) of subsidiaries, less dividends 867 1,062 670Equity in income (loss) of subsidiaries, less dividends 325 92 845
Net income (loss) 1,192 1,154 1,515Other comprehensive income (loss), net of tax:
Unrealized investment gains (losses) 709 (2,229) 1,591Foreign currency translation adjustment (22) (2) 2Funded status of employee benefit plans 34 (20) (60)
Total other comprehensive income (loss), net of tax 721 (2,251) 1,533Comprehensive income (loss) $ 1,913 $ (1,097) $ 3,048
(1) Eliminated in consolidation.
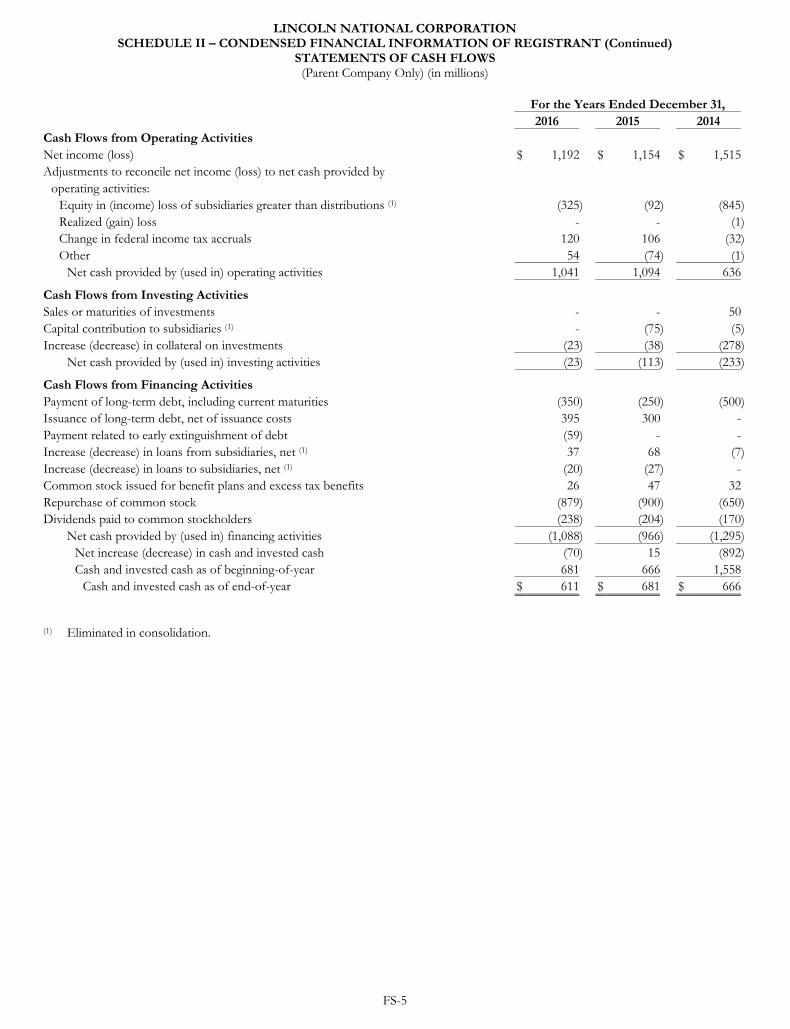
FS-5
LINCOLN NATIONAL CORPORATION SCHEDULE II – CONDENSED FINANCIAL INFORMATION OF REGISTRANT (Continued)
STATEMENTS OF CASH FLOWS (Parent Company Only) (in millions)
For the Years Ended December 31, 2016 2015 2014 Cash Flows from Operating Activities Net income (loss) $ 1,192 $ 1,154 $ 1,515Adjustments to reconcile net income (loss) to net cash provided by
operating activities: Equity in (income) loss of subsidiaries greater than distributions (1) (325) (92) (845)Realized (gain) loss - - (1)Change in federal income tax accruals 120 106 (32)Other 54 (74) (1)
Net cash provided by (used in) operating activities 1,041 1,094 636
Cash Flows from Investing Activities Sales or maturities of investments - - 50Capital contribution to subsidiaries (1) - (75) (5)Increase (decrease) in collateral on investments (23) (38) (278)
Net cash provided by (used in) investing activities (23) (113) (233)
Cash Flows from Financing Activities Payment of long-term debt, including current maturities (350) (250) (500)Issuance of long-term debt, net of issuance costs 395 300 -Payment related to early extinguishment of debt (59) - -Increase (decrease) in loans from subsidiaries, net (1) 37 68 (7)Increase (decrease) in loans to subsidiaries, net (1) (20) (27) -Common stock issued for benefit plans and excess tax benefits 26 47 32Repurchase of common stock (879) (900) (650)Dividends paid to common stockholders (238) (204) (170)
Net cash provided by (used in) financing activities (1,088) (966) (1,295)Net increase (decrease) in cash and invested cash (70) 15 (892)Cash and invested cash as of beginning-of-year 681 666 1,558
Cash and invested cash as of end-of-year $ 611 $ 681 $ 666 (1) Eliminated in consolidation.
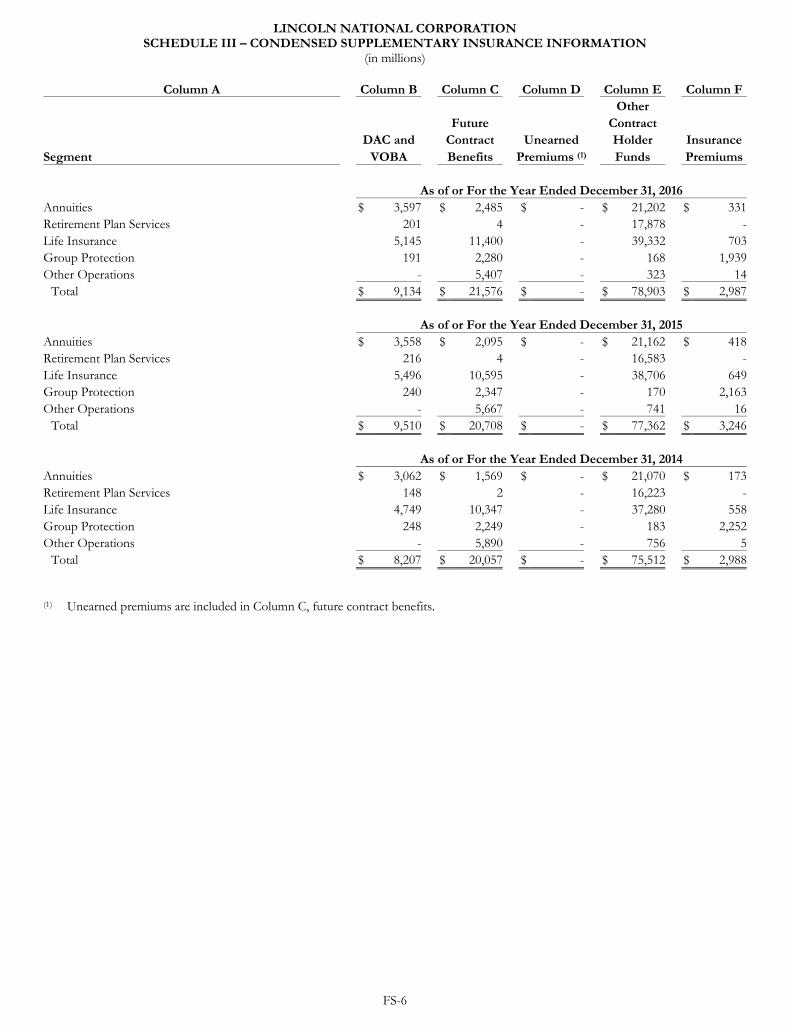
FS-6
LINCOLN NATIONAL CORPORATION SCHEDULE III – CONDENSED SUPPLEMENTARY INSURANCE INFORMATION
(in millions)
Column A Column B Column C Column D Column E Column F
Other Future Contract DAC and Contract Unearned Holder InsuranceSegment VOBA Benefits Premiums (1) Funds Premiums As of or For the Year Ended December 31, 2016 Annuities $ 3,597 $ 2,485 $ - $ 21,202 $ 331Retirement Plan Services 201 4 - 17,878 -Life Insurance 5,145 11,400 - 39,332 703Group Protection 191 2,280 - 168 1,939Other Operations - 5,407 - 323 14
Total $ 9,134 $ 21,576 $ - $ 78,903 $ 2,987 As of or For the Year Ended December 31, 2015 Annuities $ 3,558 $ 2,095 $ - $ 21,162 $ 418Retirement Plan Services 216 4 - 16,583 -Life Insurance 5,496 10,595 - 38,706 649Group Protection 240 2,347 - 170 2,163Other Operations - 5,667 - 741 16
Total $ 9,510 $ 20,708 $ - $ 77,362 $ 3,246 As of or For the Year Ended December 31, 2014 Annuities $ 3,062 $ 1,569 $ - $ 21,070 $ 173Retirement Plan Services 148 2 - 16,223 -Life Insurance 4,749 10,347 - 37,280 558Group Protection 248 2,249 - 183 2,252Other Operations - 5,890 - 756 5
Total $ 8,207 $ 20,057 $ - $ 75,512 $ 2,988 (1) Unearned premiums are included in Column C, future contract benefits.
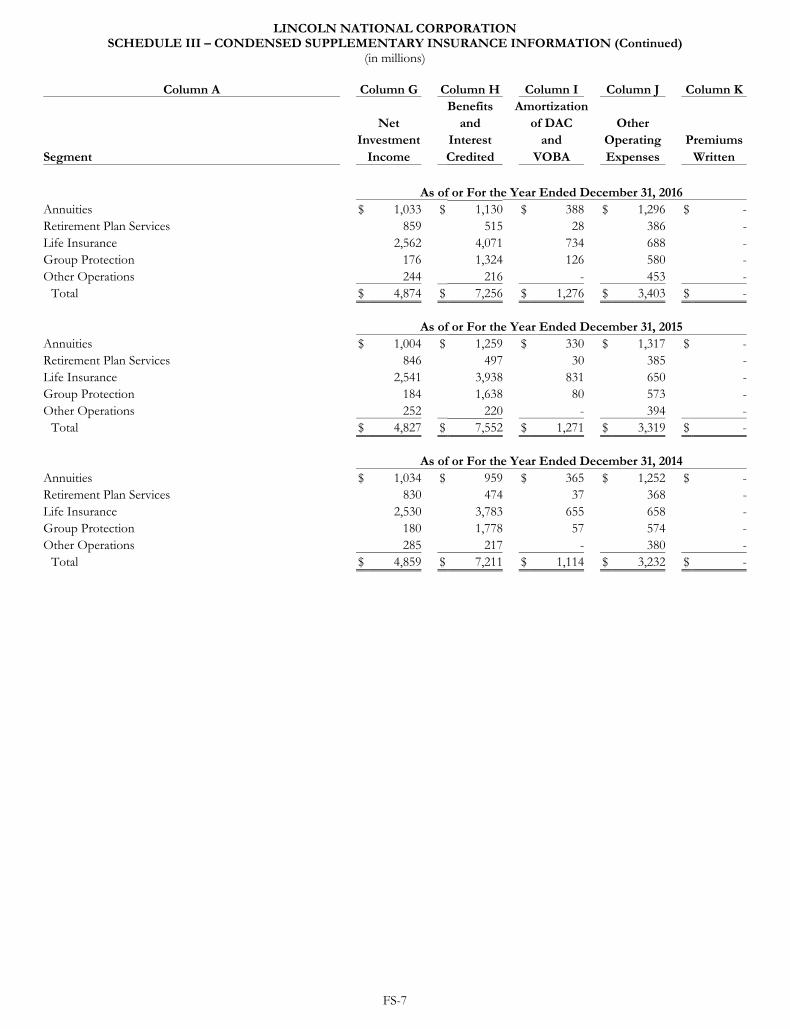
FS-7
LINCOLN NATIONAL CORPORATION SCHEDULE III – CONDENSED SUPPLEMENTARY INSURANCE INFORMATION (Continued)
(in millions)
Column A Column G Column H Column I Column J Column K
Benefits Amortization Net and of DAC Other Investment Interest and Operating PremiumsSegment Income Credited VOBA Expenses Written
As of or For the Year Ended December 31, 2016 Annuities $ 1,033 $ 1,130 $ 388 $ 1,296 $ -Retirement Plan Services 859 515 28 386 -Life Insurance 2,562 4,071 734 688 -Group Protection 176 1,324 126 580 -Other Operations 244 216 - 453 -
Total $ 4,874 $ 7,256 $ 1,276 $ 3,403 $ - As of or For the Year Ended December 31, 2015 Annuities $ 1,004 $ 1,259 $ 330 $ 1,317 $ -Retirement Plan Services 846 497 30 385 -Life Insurance 2,541 3,938 831 650 -Group Protection 184 1,638 80 573 -Other Operations 252 220 - 394 -
Total $ 4,827 $ 7,552 $ 1,271 $ 3,319 $ - As of or For the Year Ended December 31, 2014 Annuities $ 1,034 $ 959 $ 365 $ 1,252 $ -Retirement Plan Services 830 474 37 368 -Life Insurance 2,530 3,783 655 658 -Group Protection 180 1,778 57 574 -Other Operations 285 217 - 380 -
Total $ 4,859 $ 7,211 $ 1,114 $ 3,232 $ -
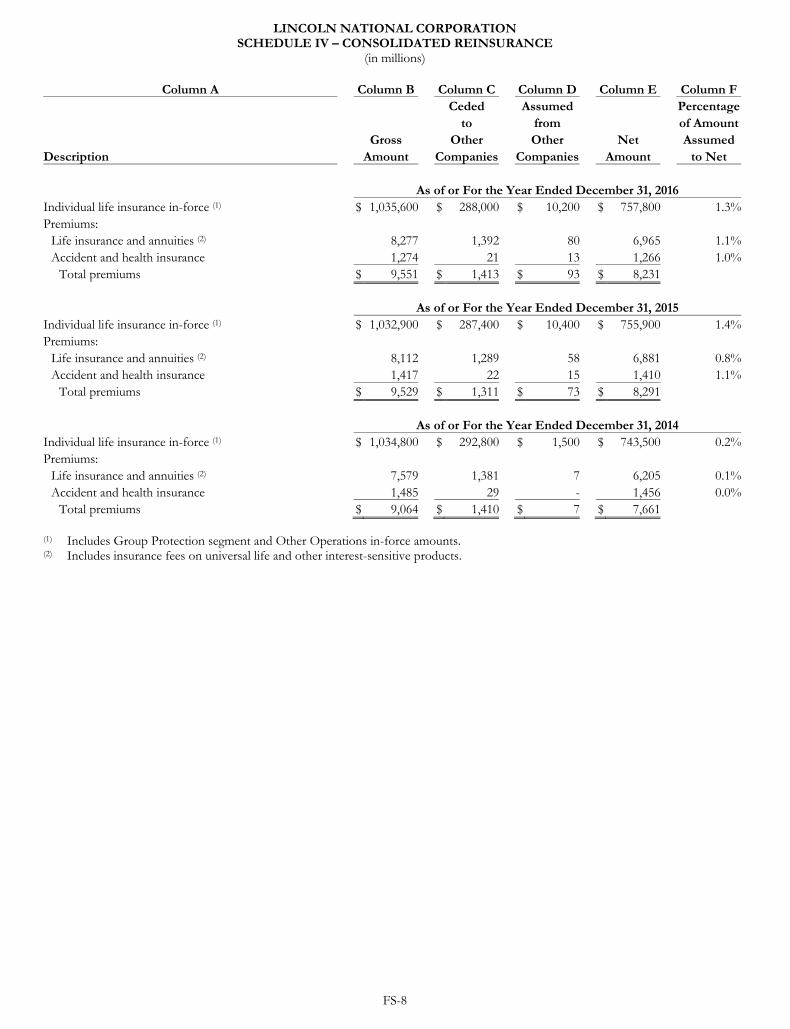
FS-8
LINCOLN NATIONAL CORPORATION SCHEDULE IV – CONSOLIDATED REINSURANCE
(in millions)
Column A Column B Column C Column D Column E Column F
Ceded Assumed Percentage to from of Amount Gross Other Other Net AssumedDescription Amount Companies Companies Amount to Net As of or For the Year Ended December 31, 2016 Individual life insurance in-force (1) $ 1,035,600 $ 288,000 $ 10,200 $ 757,800 1.3%Premiums:
Life insurance and annuities (2) 8,277 1,392 80 6,965 1.1%Accident and health insurance 1,274 21 13 1,266 1.0%
Total premiums $ 9,551 $ 1,413 $ 93 $ 8,231 As of or For the Year Ended December 31, 2015 Individual life insurance in-force (1) $ 1,032,900 $ 287,400 $ 10,400 $ 755,900 1.4%Premiums:
Life insurance and annuities (2) 8,112 1,289 58 6,881 0.8%Accident and health insurance 1,417 22 15 1,410 1.1%
Total premiums $ 9,529 $ 1,311 $ 73 $ 8,291 As of or For the Year Ended December 31, 2014 Individual life insurance in-force (1) $ 1,034,800 $ 292,800 $ 1,500 $ 743,500 0.2%Premiums:
Life insurance and annuities (2) 7,579 1,381 7 6,205 0.1%Accident and health insurance 1,485 29 - 1,456 0.0%
Total premiums $ 9,064 $ 1,410 $ 7 $ 7,661 (1) Includes Group Protection segment and Other Operations in-force amounts. (2) Includes insurance fees on universal life and other interest-sensitive products.
E-1
INDEX TO EXHIBITS
3.1 Restated Articles of Incorporation of LNC are incorporated by reference to Exhibit 3.1 to LNC’s Form 8-K (File No. 1-6028) filed with the SEC on July 8, 2013.
3.2 Amended and Restated Bylaws of LNC (effective January 24, 2017) are incorporated by reference to Exhibit 3.1 to LNC’s
Form 8-K (File No. 1-6028) filed on January 30, 2017.
4.1 Indenture of LNC, dated as of September 15, 1994, between LNC and The Bank of New York, as trustee, is incorporated by
reference to Exhibit 4(c) to LNC’s Registration Statement on Form S-3/A (File No. 33-55379) filed with the SEC on September 15, 1994.
4.2 First Supplemental Indenture, dated as of November 1, 2006, to Indenture dated as of September 15, 1994, is incorporated
by reference to Exhibit 4.4 to LNC’s Form 10-K (File No. 1-6028) for the year ended December 31, 2006.
4.3 Junior Subordinated Indenture, dated as of May 1, 1996, between LNC and The Bank of New York Trust Company, N.A.
(successor in interest to J.P. Morgan Trust Company and The First National Bank of Chicago) is incorporated by reference to Exhibit 4(j) to LNC’s Form 10-K (File No. 1-6028) for the year ended December 31, 2001.
4.4 Third Supplemental Junior Subordinated Indenture dated May 17, 2006, to Junior Subordinated Indenture, dated as of May
1, 1996, is incorporated by reference to Exhibit 4.1 to LNC’s Form 8-K (File No. 1-6028) filed with the SEC on May 17, 2006.
4.5 Fourth Supplemental Junior Subordinated Indenture, dated as of November 1, 2006, to Junior Subordinated Indenture, dated
May 1, 1996, is incorporated by reference to Exhibit 4.9 to LNC’s Form 10-K (File No. 1-6028) for the year ended December 31, 2006.
4.6 Fifth Supplemental Junior Subordinated Indenture, dated as of March 13, 2007, to Junior Subordinated Indenture, dated May
1, 1996, is incorporated by reference to Exhibit 4.1 to LNC’s Form 8-K (File No. 1-6028) filed with the SEC on March 13, 2007.
4.7 Senior Indenture, dated as of March 10, 2009, between LNC and the Bank of New York Mellon, is incorporated by reference
to LNC’s Form S-3ASR (File No. 333-157822) filed with the SEC on March 10, 2009.
4.8 Junior Subordinated Indenture, dated as of March 10, 2009, between LNC and the Bank of New York Mellon, is
incorporated by reference to LNC’s Form S-3ASR (File No. 333-157822) filed with the SEC on March 10, 2009.
4.9 Form of 7.00% Notes due March 15, 2018, incorporated by reference to Exhibit 4.2 to LNC’s Form 8-K (File No. 1-6028)
filed with the SEC on March 24, 1998.
4.10 Form of 7.00% Capital Securities due 2066 of LNC is incorporated by reference to Exhibit 4.2 to LNC’s Form 8-K (File No. 1-6028) filed with the SEC on May 17, 2006.
4.11 Form of 6.15% Senior Notes due April 6, 2036 is incorporated by reference to Exhibit 4.2 to LNC’s Form 8-K (File No. 1-
6028) filed with the SEC on April 7, 2006.
4.12 Form of 6.05% Capital Securities due 2067 is incorporated by reference to Exhibit 4.2 to LNC’s Form 8-K (File No. 1-6028)
filed with the SEC on March 13, 2007.
4.13 Form of 6.30% Senior Notes due 2037 is incorporated by reference to Exhibit 4.1 to LNC’s Form 8-K (File No. 1-6028)
filed with the SEC on October 9, 2007.
4.14 Form of 8.75% Senior Notes due 2019 is incorporated by reference to Exhibit 4.1 to LNC’s Form 8-K (File No. 1-6028)
filed with the SEC on June 22, 2009.
E-2
4.15 Form of 6.25% Senior Notes due 2020 is incorporated by reference to Exhibit 4.1 to LNC’s Form 8-K (File No. 1-6028) filed with the SEC on December 11, 2009.
4.16 Form of 4.30% Senior Notes due 2015 incorporated by reference to Exhibit 4.1 to LNC’s Form 8-K (File No. 1-6028) filed
with the SEC on June 18, 2010.
4.17 Form of 7.00% Senior Notes due 2040 incorporated by reference to Exhibit 4.1 to LNC’s Form 8-K (File No. 1-6028) filed
with the SEC on June 18, 2010.
4.18 Form of 4.85% Senior Notes due 2021 incorporated by reference to Exhibit 4.1 to LNC’s Form 8-K (File No. 1-6028) filed
with the SEC on June 24, 2011.
4.19 Form of 4.20% Senior Notes due 2022 incorporated by reference to Exhibit 4.1 to LNC’s Form 8-K (File No. 1-6028) filed
with the SEC on March 29, 2012.
4.20 Form of 4.00% Senior Notes due 2023 incorporated by reference to Exhibit 4.1 to LNC’s Form 8-K (File No. 1-6028) filed
with the SEC on August 16, 2013.
4.21 Form of 3.50% Senior Notes due 2025 incorporated by reference to Exhibit 4.1 to LNC’s Form 8-K (File No. 1-6028) filed
with the SEC on March 9, 2015.
4.22 Form of 3.625% Senior Notes due 2026 incorporated by reference to Exhibit 4.1 to LNC’s Form 8-K (File No. 1-6028) filed
with the SEC on December 12, 2016.
10.1 LNC 2014 Incentive Compensation Plan (effective May 22, 2014) is incorporated by reference to Exhibit 10.1 to LNC’s
Form 8-K (File No. 1-6028) filed with the SEC on May 28, 2014.*
10.2 LNC 2009 Amended and Restated Incentive Compensation Plan (as amended and restated on May 14, 2009) is incorporated
by reference to Exhibit 4 to LNC’s Proxy Statement (File No. 1-6028) filed with the SEC on April 9, 2009.*
10.3 LNC Stock Option Plan for Non-Employee Directors is incorporated by reference to Exhibit 5 to LNC’s Proxy Statement
(File No. 1-6028) filed with the SEC on April 4, 2007.*
10.4 Non-Qualified Stock Option Agreement for the LNC Stock Option Plan for Non-Employee Directors is incorporated by
reference to Exhibit 10.3 to LNC’s Form 8-K (File No. 1-6028) filed with the SEC on May 10, 2007.*
10.5 2017 Non-Employee Director Fees are filed herewith.*
10.6 Amended and Restated LNC Supplemental Retirement Plan is incorporated by reference to Exhibit 10.10 to LNC’s Form
10-K (File No. 1-6028) for the year ended December 31, 2007.*
10.7 The Severance Plan for Officers of LNC (Amended and Restated effective as of February 24, 2016) is incorporated by
reference to Exhibit 10.4 to LNC’s Form 10-Q (File No.1-6028) for the quarter ended March 31, 2016.*
10.8 The LNC Outside Directors’ Value Sharing Plan, last amended March 8, 2001, is incorporated by reference to Exhibit 10(e)
to LNC’s Form 10-K (File No. 1-6028) for the year ended December 31, 2001.*
10.9 LNC Deferred Compensation and Supplemental/Excess Retirement Plan, as amended and restated effective December 31,
2013, is incorporated by reference to Exhibit 10.13 to LNC’s Form 10-K (File No. 1-6028) for the year ended December 31, 2013.*
10.10 Amendment No. 1 to the LNC Deferred Compensation & Supplemental/Excess Retirement Plan, dated December 18, 2014,
is incorporated by reference to Exhibit 10.15 to LNC’s Form 10-K (File No. 1-6028) for the year ended December 31, 2014.*
E-3
10.11 Amendment No. 2 to the LNC Deferred Compensation & Supplemental/Excess Retirement Plan, effective December 31, 2015, is incorporated by reference to Exhibit 10.11 to LNC’s Form 10-K (File No. 1-6028) for the year ended December 31, 2015.*
10.12 LNC 1993 Stock Plan for Non-Employee Directors, as last amended May 10, 2001, is incorporated by reference to Exhibit
10(g), to LNC’s Form 10-K (File No. 1-6028) for the year ended December 31, 2001.*
10.13 Amendment No. 2 to the LNC 1993 Stock Plan for Non-Employee Directors (effective February 1, 2006) is incorporated by reference to Exhibit 10.1 to LNC’s Form 8-K (File No. 1-6028) filed with the SEC on January 13, 2006.*
10.14 LNC Executives’ Severance Benefit Plan (effective August 7, 2008) is incorporated by reference to Exhibit 10.3 to LNC’s
Form 10-Q (File No. 1-6028) for the quarter ended June 30, 2008.*
10.15 Amendment No. 1 to the LNC Executives’ Severance Benefit Plan (effective November 9, 2011) is incorporated by
reference to Exhibit 10.22 to LNC’s Form 10-K (File No. 1-6028) for the year ended December 31, 2011.*
10.16 Amended and Restated LNC Excess Retirement Plan is incorporated by reference to Exhibit 10.26 to LNC’s Form 10-K
(File No. 1-6028) for the year ended December 31, 2007.*
10.17 LNC Deferred Compensation Plan for Non-Employee Directors, as amended and restated November 5, 2008, is
incorporated by reference to Exhibit 10.23 to LNC’s Form 10-K (File No. 1-6028) for the year ended December 31, 2008.*
10.18 Form of 2008 Non-Qualified Stock Option Agreement under the LNC Amended and Restated Incentive Compensation Plan
is incorporated by reference to Exhibit 10.2 of LNC’s Form 8-K (File No. 1-6028) filed with the SEC on February 13, 2008.*
10.19 Form of Indemnification between LNC and each director incorporated by reference to Exhibit 10.1 to LNC’s Form 10-Q
(File No. 1-6028) for the quarter ended September 30, 2009.*
10.20 Form of Non-Qualified Stock Option Award Agreement is incorporated by Reference to Exhibit 10.9 to LNC’s Form 10-K
(File No. 1-6028) for the year ended December 31, 2012.*
10.21 Amendment #1 to the Form of Non-Qualified Stock Option Award Agreements, effective August 13, 2014, is incorporated
by reference to Exhibit 10.28 to LNC’s Form 10-K (File No. 1-6028) for the year ended December 31, 2014.*
10.22 Amendment #2 to the Form of Non-Qualified Stock Option Award Agreements, effective August 13, 2014, is incorporated
by reference to Exhibit 10.29 to LNC’s Form 10-K (File No. 1-6028) for the year ended December 31, 2014.*
10.23 Form of 2014-2016 Performance Cycle Agreement for the Senior Management Committee and the Corporate Leadership
Group under the LNC 2009 Amended and Restated Incentive Compensation Plan is incorporated by Reference to Exhibit 10.1 to LNC’s Form 10-Q (File No. 1-6028) for the quarter ended March 31, 2014.*
10.24 Form of Restricted Stock Unit Award Agreement for 2015 under the LNC 2014 Incentive Compensation Plan is
incorporated by Reference to Exhibit 10.1 to LNC’s Form 10-Q (File No. 1-6028) for the quarter ended March 31, 2015.*
10.25 Form of Nonqualified Stock Option Agreement under the LNC 2014 Incentive Compensation Plan is incorporated by
Reference to Exhibit 10.2 to LNC’s Form 10-Q (File No. 1-6028) for the quarter ended March 31, 2015.*
10.26 Form of 2015-2017 Performance Cycle Agreement for 2015 under the LNC 2014 Incentive Compensation Plan is
incorporated by Reference to Exhibit 10.3 to LNC’s Form 10-Q (File No. 1-6028) for the quarter ended March 31, 2015.*
10.27 Form of Restricted Stock Unit Award Agreement for Senior Management Committee (Other than CEO) is incorporated by
reference to Exhibit 10.1 to LNC’s Form 10-Q (File No. 1-6028) for the quarter ended March 31, 2016.*
10.28 Form of Nonqualified Stock Option Award Agreement for Senior Management Committee (Other than CEO) is
incorporated by reference to Exhibit 10.2 to LNC’s Form 10-Q (File No. 1-6028) for the quarter ended March 31, 2016.*

E-4
10.29 Form of 2016-2018 Performance Cycle Agreement for Senior Management Committee (Other than CEO) is incorporated by reference to Exhibit 10.3 to LNC’s Form 10-Q (File No. 1-6028) for the quarter ended March 31, 2016.*
10.30 LNC Domestic Relocation Policy Home Sale Assistance Plan, effective as of September 6, 2007, is incorporated by reference
to Exhibit 10.35 to LNC’s Form 10-K (File No. 1-6028) for the year ended December 31, 2009.*
10.31 Jefferson Pilot Corporation Long Term Stock Incentive Plan, as amended in February 2005, is incorporated by reference to
Exhibit 10(iii) of Jefferson-Pilot’s Form 10-K (File No. 1-5955) for the year ended December 31, 2004.*
10.32 Jefferson Pilot Corporation Non-Employee Directors’ Stock Option Plan, as amended in February 2005, is incorporated by reference to Exhibit 10(iv) of Jefferson-Pilot’s Form 10-K (File No. 1-5955) for the year ended December 31, 2004.*
10.33 Jefferson Pilot Corporation Non-Employee Directors’ Stock Option Plan, as last amended in 1999, is incorporated by
reference to Exhibit 10(vii) of Jefferson-Pilot’s Form 10-K (File No. 1-5955) for the year ended December 31, 1998.*
10.34 Jefferson Pilot Corporation forms of stock option terms for non-employee directors are incorporated by reference to Exhibit
10(xi) of Jefferson-Pilot’s Form 10-K (File No. 1-5955) for the year ended December 31, 2004 and to Exhibit 10.2 of Jefferson-Pilot’s Form 8-K filed with the SEC on February 17, 2006.*
10.35 Jefferson Pilot Corporation forms of stock option terms for officers are incorporated by reference to Exhibit 10(xi) of
Jefferson-Pilot’s Form 10-K (File No. 1-5955) for the year ended December 31, 2004 and to Exhibit 10.1 of Jefferson-Pilot’s Form 8-K filed with the SEC on February 17, 2006.*
10.36 Jefferson-Pilot Deferred Fee Plan for Non-Employee Directors, as amended and restated November 5, 2008 is incorporated
by reference to Exhibit 10.55 to LNC’s Form 10-K (File No. 1-6028) for the year ended December 31, 2008.*
10.37 Lease and Agreement dated August 1, 1984, with respect to LNL’s offices located at Clinton Street and Harrison Street, Fort
Wayne, Indiana is incorporated by reference to Exhibit 10(n) to LNC’s Form 10-K (File No. 1-6028) for the year ended December 31, 1995.
10.38 First Amendment of Lease, dated as of June 16, 2006, between Trona Cogeneration Corporation and The Lincoln National
Life Insurance Company, is incorporated by reference to Exhibit 10.22 to LNC’s Form 10-Q (File No. 1-6028) for the quarter ended June 30, 2006.
10.39 Agreement of Lease dated February 17, 1998, with respect to LNL’s offices located at 350 Church Street, Hartford,
Connecticut is incorporated by reference to Exhibit 10(q) to LNC’s Form 10-K (File No. 1-6028) for the year ended December 31, 1997.
10.40 Stock and Asset Purchase Agreement by and among LNC, The Lincoln National Life Insurance Company, Lincoln National
Reinsurance Company (Barbados) Limited and Swiss Re Life & Health America Inc. dated July 27, 2001 is incorporated by reference to Exhibit 99.1 to LNC’s Form 8-K (File No. 1-6028) filed with the Commission on August 1, 2001. Omitted schedules and exhibits listed in the Agreement will be furnished to the Commission upon request.
10.41 Indemnity Reinsurance Agreement, dated as of January 1, 1998, between Connecticut General Life Insurance Company and
Lincoln Life & Annuity Company of New York is incorporated by reference to Exhibit 10.67 to LNC’s Form 10-K (File No. 1-6028) for the year ended December 31, 2008.**
10.42 Coinsurance Agreement, dated as of October 1, 1998, AETNA Life Insurance and Annuity Company and Lincoln Life &
Annuity Company of New York is incorporated by reference to Exhibit 10.68 to LNC’s Form 10-K (File No. 1-6028) for the year ended December 31, 2008.**

E-5
10.43 Credit Agreement, dated as of June 30, 2016, among Lincoln National Corporation, as an Account Party and Guarantor, the Subsidiary Account Parties, as additional Account Parties, JPMorgan Chase Bank, N.A. as administrative agent, and the other lenders named therein, incorporated by reference to Exhibit 10.1 to LNC’s Form 8-K (File No. 1-6028) filed with the SEC on July 6, 2016.
12 Historical Ratio of Earnings to Fixed Charges.
21 Subsidiaries List.
23 Consent of Independent Registered Public Accounting Firm.
31.1 Certification of the Chief Executive Officer pursuant to Section 302 of the Sarbanes-Oxley Act of 2002.
31.2 Certification of the Chief Financial Officer pursuant to Section 302 of the Sarbanes-Oxley Act of 2002.
32.1 Certification of the Chief Executive Officer pursuant to 18 U.S.C. Section 1350, as adopted pursuant to Section 906 of the Sarbanes-Oxley Act of 2002.
32.2 Certification of the Chief Financial Officer pursuant to 18 U.S.C. Section 1350, as adopted pursuant to Section 906 of the
Sarbanes-Oxley Act of 2002.
101.INS XBRL Instance Document.
101.SCH XBRL Taxonomy Extension Schema Document.
101.CAL XBRL Taxonomy Extension Calculation Linkbase Document.
101.LAB XBRL Taxonomy Extension Label Linkbase Document.
101.PRE XBRL Taxonomy Extension Presentation Linkbase Document.
101.DEF XBRL Taxonomy Extension Definition Linkbase Document.
* This exhibit is a management contract or compensatory plan or arrangement. ** Schedules to the agreement have been omitted pursuant to Item 601(b)(2) of Regulation S-K. LNC will furnish supplementally a copy of the schedule to the SEC, upon request.
We will furnish to the SEC, upon request, a copy of any of our long-term debt agreements not otherwise filed with the SEC. NOTE: This is an abbreviated version of the Lincoln National Corporation Form 10-K. Copies of the full Form 10-K and these exhibits are available electronically at www.sec.gov or www.lfg.com, or by writing to the Corporate Secretary at Lincoln National Corporation, 150 N. Radnor-Chester Road, Suite A305, Radnor, PA 19087.
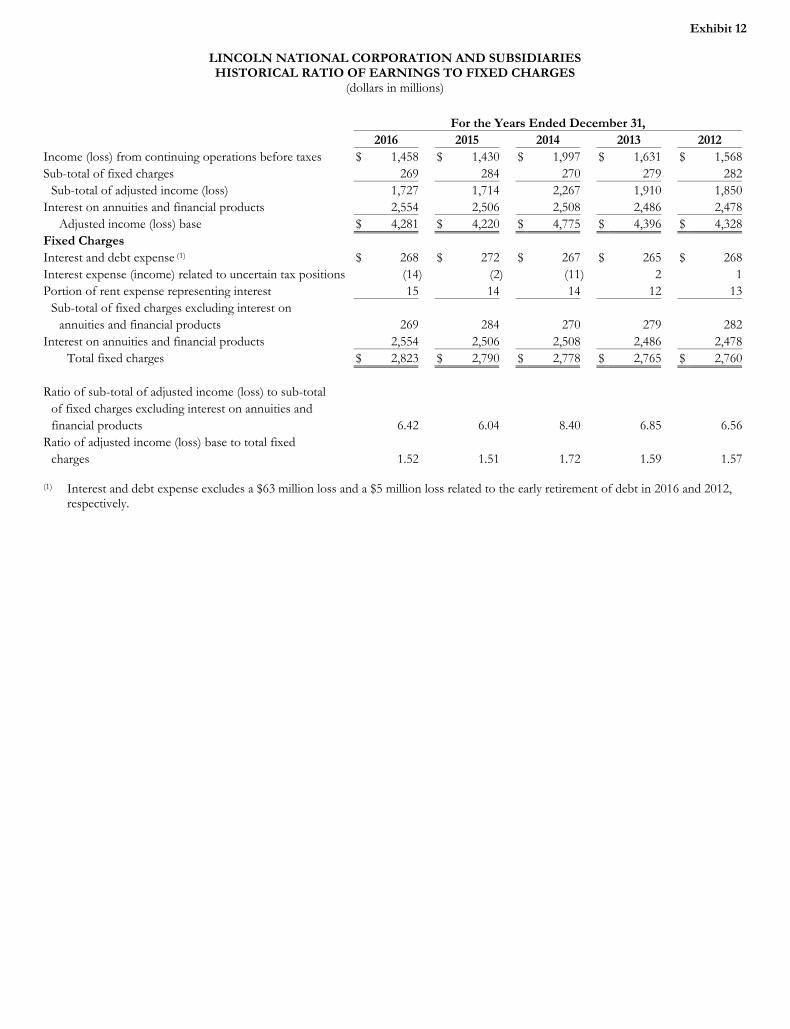
Exhibit 12
LINCOLN NATIONAL CORPORATION AND SUBSIDIARIES HISTORICAL RATIO OF EARNINGS TO FIXED CHARGES
(dollars in millions)
For the Years Ended December 31, 2016 2015 2014 2013 2012 Income (loss) from continuing operations before taxes $ 1,458 $ 1,430 $ 1,997 $ 1,631 $ 1,568Sub-total of fixed charges 269 284 270 279 282
Sub-total of adjusted income (loss) 1,727 1,714 2,267 1,910 1,850Interest on annuities and financial products 2,554 2,506 2,508 2,486 2,478
Adjusted income (loss) base $ 4,281 $ 4,220 $ 4,775 $ 4,396 $ 4,328Fixed Charges Interest and debt expense (1) $ 268 $ 272 $ 267 $ 265 $ 268Interest expense (income) related to uncertain tax positions (14) (2) (11) 2 1Portion of rent expense representing interest 15 14 14 12 13
Sub-total of fixed charges excluding interest on annuities and financial products 269 284 270 279 282
Interest on annuities and financial products 2,554 2,506 2,508 2,486 2,478Total fixed charges $ 2,823 $ 2,790 $ 2,778 $ 2,765 $ 2,760
Ratio of sub-total of adjusted income (loss) to sub-total
of fixed charges excluding interest on annuities and financial products 6.42 6.04 8.40 6.85 6.56
Ratio of adjusted income (loss) base to total fixed charges 1.52 1.51 1.72 1.59 1.57
(1) Interest and debt expense excludes a $63 million loss and a $5 million loss related to the early retirement of debt in 2016 and 2012,
respectively.
Exhibit 23
CONSENT OF INDEPENDENT REGISTERED PUBLIC ACCOUNTING FIRM
We consent to the incorporation by reference in the following registration statements of Lincoln National Corporation and in the related prospectuses listed below: 1. Forms S-3
a. No. 333-201103 pertaining to the Lincoln National Corporation automatic shelf registration for certain securities, b. Nos. 333-133086, 333-159314 and 333-181052 pertaining to the Jefferson-Pilot Corporation Long Term Stock Incentive Plan, c. Nos. 333-131943 and 333-163672 pertaining to the Lincoln National Life Insurance Company Agents’ Savings and Profit
Sharing Plan, 333-185105 and 333-208110 pertaining to the LNL Agents’ 401(k) Plan, d. Nos. 333-142871 pertaining to the Lincoln National Corporation Amended and Restated Incentive Compensation Plan and 333-
159290, 333-181049 and 333-203699 pertaining to the Lincoln National Corporation 2009 Amended and Restated Incentive Compensation Plan,
e. Nos. 333-84728, 333-84728-01, 333-84728-02, 333-84728-03 and 333-84728-04 pertaining to the Lincoln National Corporation shelf registration for certain securities,
f. No. 333-32667 pertaining to the Lincoln National Corporation 1997 Incentive Compensation Plan, and g. Nos. 333-146213, 33-51415, 333-165504, 333-187320, 333-189136 and 333-211879 pertaining to the Lincoln National
Corporation Deferred Compensation Plan for Agents; 2. Form S-4 (No. 333-130226) pertaining to the proposed business combination with Jefferson-Pilot Corporation; 3. Forms S-8
a. No. 333-203690 pertaining to the Lincoln National Corporation 2009 Amended and Restated Incentive Compensation Plan and the Jefferson-Pilot Corporation Long-Term Stock Incentive Plan,
b. No. 333-196233 pertaining to the Lincoln National Corporation 2014 Incentive Compensation Plan, c. No. 333-155385 pertaining to the Lincoln National Corporation Deferred Compensation and Supplemental/Excess Retirement
Plan, d. No. 333-142872 pertaining to the Lincoln National Corporation Stock Option Plan for Non-Employee Directors, e. No. 333-133039 pertaining to various Jefferson-Pilot Corporation benefit plans, f. Nos. 333-143796 and 333-126452 pertaining to the Lincoln National Corporation Executive Deferred Compensation Plan for
Employees, g. Nos. 333-126020 pertaining to the Lincoln National Corporation Employees’ Savings and Profit Sharing Plan and 333-161989
pertaining to the LNC Employees’ 401(k) Plan, h. Nos. 333-143795 and 333-121069 pertaining to the Lincoln National Corporation Deferred Compensation Plan for Non-
Employee Directors, i. No. 033-58113 pertaining to the Lincoln National Corporation 1993 Stock Plan for Non-Employee Directors, and j. No. 333-105344 pertaining to the Lincoln National Corporation 1993 Stock Plan for Non-Employee Directors;
of our reports dated February 23, 2017, with respect to the consolidated financial statements and financial statement schedules of Lincoln National Corporation and the effectiveness of internal control over financial reporting of Lincoln National Corporation, included in this Annual Report (Form 10-K) for the year ended December 31, 2016. /s/ Ernst & Young LLP Philadelphia, Pennsylvania February 23, 2017
Exhibit 31.1
Certification Pursuant to Section 302 of the Sarbanes-Oxley Act of 2002
I, Dennis R. Glass, President and Chief Executive Officer, certify that: 1. I have reviewed this annual report on Form 10-K of Lincoln National Corporation; 2. Based on my knowledge, this report does not contain any untrue statement of a material fact or omit to state a material fact
necessary to make the statements made, in light of the circumstances under which such statements were made, not misleading with respect to the period covered by this report;
3. Based on my knowledge, the financial statements, and other financial information included in this report, fairly present in all
material respects the financial condition, results of operations and cash flows of the registrant as of, and for, the periods presented in this report;
4. The registrant’s other certifying officer and I are responsible for establishing and maintaining disclosure controls and procedures
(as defined in Exchange Act Rules 13a-15(e) and 15d-15(e)) and internal control over financial reporting (as defined in Exchange Act Rules 13a-15(f) and 15d-15(f)) for the registrant and have:
a) Designed such disclosure controls and procedures, or caused such disclosure controls and procedures to be designed under
our supervision, to ensure that material information relating to the registrant, including its consolidated subsidiaries, is made known to us by others within those entities, particularly during the period in which this report is being prepared;
b) Designed such internal control over financial reporting, or caused such internal control over financial reporting to be
designed under our supervision, to provide reasonable assurance regarding the reliability of financial reporting and the preparation of financial statements for external purposes in accordance with generally accepted accounting principles;
c) Evaluated the effectiveness of the registrant’s disclosure controls and procedures and presented in this report our
conclusions about the effectiveness of the disclosure controls and procedures, as of the end of the period covered by this report based on such evaluation; and
d) Disclosed in this report any change in the registrant’s internal control over financial reporting that occurred during the
registrant’s most recent fiscal quarter (the registrant’s fourth fiscal quarter in the case of an annual report) that has materially affected, or is reasonably likely to materially affect, the registrant’s internal control over financial reporting; and
5. The registrant’s other certifying officer and I have disclosed, based on our most recent evaluation of internal control over financial reporting, to the registrant’s auditors and the audit committee of the registrant’s board of directors (or persons performing the equivalent functions):
a) All significant deficiencies and material weaknesses in the design or operation of internal control over financial reporting
which are reasonably likely to adversely affect the registrant’s ability to record, process, summarize and report financial information; and
b) Any fraud, whether or not material, that involves management or other employees who have a significant role in the
registrant’s internal control over financial reporting.
Dated: February 23, 2017 /s/ Dennis R. Glass Name: Dennis R. Glass Title: President and Chief Executive Officer
Exhibit 31.2
Certification Pursuant to Section 302 of the Sarbanes-Oxley Act of 2002
I, Randal J. Freitag, Executive Vice President and Chief Financial Officer, certify that: 1. I have reviewed this annual report on Form 10-K of Lincoln National Corporation; 2. Based on my knowledge, this report does not contain any untrue statement of a material fact or omit to state a material fact
necessary to make the statements made, in light of the circumstances under which such statements were made, not misleading with respect to the period covered by this report;
3. Based on my knowledge, the financial statements, and other financial information included in this report, fairly present in all
material respects the financial condition, results of operations and cash flows of the registrant as of, and for, the periods presented in this report;
4. The registrant’s other certifying officer and I are responsible for establishing and maintaining disclosure controls and procedures
(as defined in Exchange Act Rules 13a-15(e) and 15d-15(e)) and internal control over financial reporting (as defined in Exchange Act Rules 13a-15(f) and 15d-15(f)) for the registrant and have:
a) Designed such disclosure controls and procedures, or caused such disclosure controls and procedures to be designed under
our supervision, to ensure that material information relating to the registrant, including its consolidated subsidiaries, is made known to us by others within those entities, particularly during the period in which this report is being prepared;
b) Designed such internal control over financial reporting, or caused such internal control over financial reporting to be
designed under our supervision, to provide reasonable assurance regarding the reliability of financial reporting and the preparation of financial statements for external purposes in accordance with generally accepted accounting principles;
c) Evaluated the effectiveness of the registrant’s disclosure controls and procedures and presented in this report our
conclusions about the effectiveness of the disclosure controls and procedures, as of the end of the period covered by this report based on such evaluation; and
d) Disclosed in this report any change in the registrant’s internal control over financial reporting that occurred during the
registrant’s most recent fiscal quarter (the registrant’s fourth fiscal quarter in the case of an annual report) that has materially affected, or is reasonably likely to materially affect, the registrant’s internal control over financial reporting; and
5. The registrant’s other certifying officer and I have disclosed, based on our most recent evaluation of internal control over financial reporting, to the registrant’s auditors and the audit committee of the registrant’s board of directors (or persons performing the equivalent functions):
a) All significant deficiencies and material weaknesses in the design or operation of internal control over financial reporting
which are reasonably likely to adversely affect the registrant’s ability to record, process, summarize and report financial information; and
b) Any fraud, whether or not material, that involves management or other employees who have a significant role in the
registrant’s internal control over financial reporting.
Dated: February 23, 2017 /s/ Randal J. Freitag Name: Randal J. Freitag Title: Executive Vice President and Chief Financial Officer

Exhibit 32.1
Certification Pursuant to 18 U.S.C. Section 1350, As Adopted Pursuant to Section 906 of the Sarbanes-Oxley Act of 2002
Pursuant to 18 U.S.C. § 1350, the undersigned officer of Lincoln National Corporation (the “Company”), hereby certifies that the Company’s Annual Report on Form 10-K for the year ended December 31, 2016, (the “Report”) fully complies with the requirements of Section 13(a) or 15(d), as applicable, of the Securities Exchange Act of 1934 and that the information contained in the Report fairly presents, in all material respects, the financial condition and results of operations of the Company.
Dated: February 23, 2017 /s/ Dennis R. Glass Name: Dennis R. Glass Title: President and Chief Executive Officer The foregoing certification is being furnished solely pursuant to 18 U.S.C. § 1350 and is not being filed as part of the Report or as a separate disclosure document. A signed original of this written statement required under Section 906 has been provided to the Company and will be retained by the Company and furnished to the Securities and Exchange Commission or its staff upon request.

Exhibit 32.2
Certification Pursuant to 18 U.S.C. Section 1350, As Adopted Pursuant to Section 906 of the Sarbanes-Oxley Act of 2002
Pursuant to 18 U.S.C. § 1350, the undersigned officer of Lincoln National Corporation (the “Company”), hereby certifies that the Company’s Annual Report on Form 10-K for the year ended December 31, 2016, (the “Report”) fully complies with the requirements of Section 13(a) or 15(d), as applicable, of the Securities Exchange Act of 1934 and that the information contained in the Report fairly presents, in all material respects, the financial condition and results of operations of the Company.
Dated: February 23, 2017 /s/ Randal J. Freitag Name: Randal J. Freitag Title: Executive Vice President and Chief Financial Officer The foregoing certification is being furnished solely pursuant to 18 U.S.C. § 1350 and is not being filed as part of the Report or as a separate disclosure document. A signed original of this written statement required under Section 906 has been provided to the Company and will be retained by the Company and furnished to the Securities and Exchange Commission or its staff upon request.
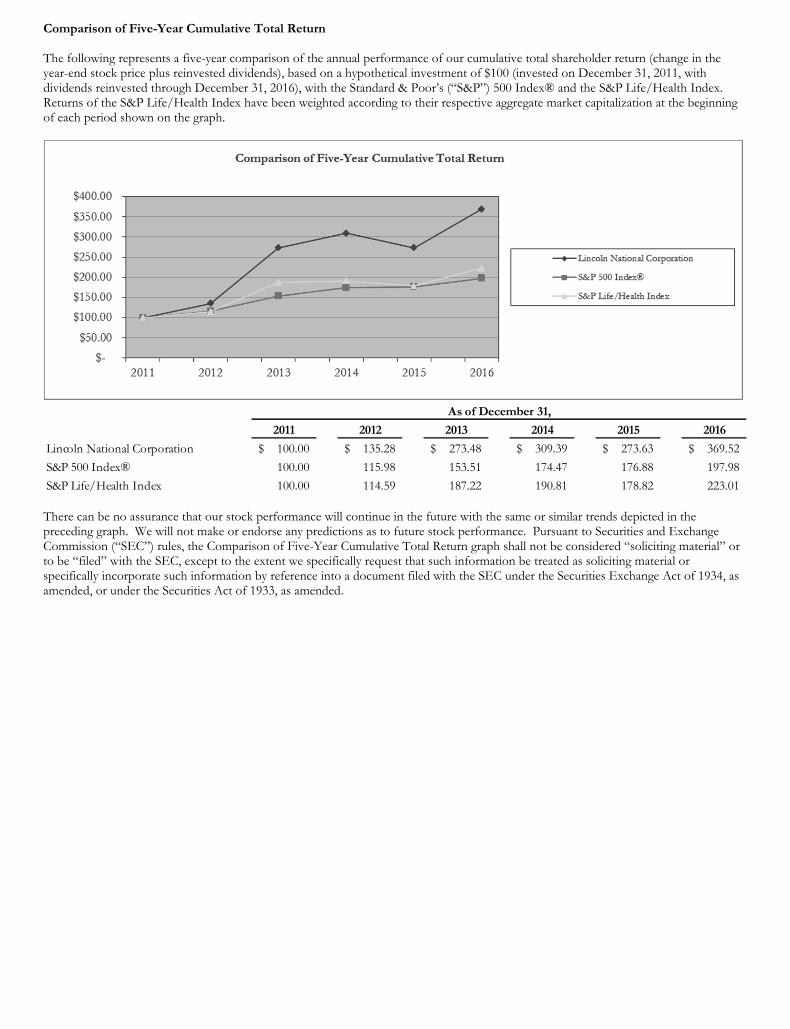
Comparison of Five-Year Cumulative Total Return
The following represents a five-year comparison of the annual performance of our cumulative total shareholder return (change in the year-end stock price plus reinvested dividends), based on a hypothetical investment of $100 (invested on December 31, 2011, with dividends reinvested through December 31, 2016), with the Standard & Poor’s (“S&P”) 500 Index® and the S&P Life/Health Index. Returns of the S&P Life/Health Index have been weighted according to their respective aggregate market capitalization at the beginning of each period shown on the graph.
There can be no assurance that our stock performance will continue in the future with the same or similar trends depicted in the preceding graph. We will not make or endorse any predictions as to future stock performance. Pursuant to Securities and Exchange Commission (“SEC”) rules, the Comparison of Five-Year Cumulative Total Return graph shall not be considered “soliciting material” or to be “filed” with the SEC, except to the extent we specifically request that such information be treated as soliciting material or specifically incorporate such information by reference into a document filed with the SEC under the Securities Exchange Act of 1934, as amended, or under the Securities Act of 1933, as amended.
2011 2012 2013 2014 2015 2016
Lincoln National Corporation 100.00$ 135.28$ 273.48$ 309.39$ 273.63$ 369.52$
S&P 500 Index® 100.00 115.98 153.51 174.47 176.88 197.98
S&P Life/Health Index 100.00 114.59 187.22 190.81 178.82 223.01
As of December 31,

Board of Directors Deirdre P. Connelly Retired President North American Pharmaceuticals of GlaxoSmithKline William H. Cunningham Professor The University of Texas at Austin Dennis R. Glass President and CEO Lincoln National Corporation George W. Henderson, III Retired Chairman and CEO Burlington Industries, Inc. Eric G. Johnson President and CEO Baldwin Richardson Foods Company Gary C. Kelly Chairman, President and CEO Southwest Airlines, Co. M. Leanne Lachman President Lachman Associates LLC Michael F. Mee Retired EVP and CFO Bristol-Myers Squibb Company William Porter Payne Chairman Centennial Holding Company, LLC Patrick S. Pittard Chairman PatrickPittard Advisors LLC Isaiah Tidwell Retired EVP and Georgia Wealth Management Director Wachovia Bank, N.A.
Corporate Headquarters Lincoln National Corporation 150 N. Radnor-Chester Road Radnor, PA 19087-5238 Internet Information Information on LNC’s financial results and its products and services as well as SEC filings are available on our website at www.lfg.com. Stock Listings LNC’s common stock is traded on the New York stock exchange under the symbol LNC. Inquiries Analysts and institutional investors should contact: Chris Giovanni Senior Vice President – Investor Relations Lincoln National Corporation 150 N. Radnor Chester Road Radnor, PA 19087 E-mail: [email protected] Annual Meeting of Shareholders The annual meeting of shareholders will be held at The Ritz-Carlton Hotel, 10 Avenue of the Arts, Philadelphia, PA 19102, at 9 a.m. (local time) on Friday, May 26, 2017. Shareholder Services General inquiries or concerns about LNC shareholder services may be directed to shareholder services at 1-800-237-2920 or by email at [email protected]. Questions that are specific in nature, such as transfer of stock, change of address or general inquiries regarding stock or dividend matters, should be directed to the transfer agent and registrar. Transfer Agent and Registrar For regular mailings use: For registered or overnight mailings use: Wells Fargo Shareowner Services Wells Fargo Shareowner Services P.O. Box 64874 1110 Centre Point Curve, Suite 101 St. Paul, MN 55164-0874 Mendota Heights, MN 55120 1-866-541-9693 www.shareowneronline.com
Dividend Reinvestment Program/Direct Stock Purchase Plan LNC has a Dividend Reinvestment and Cash Investment Plan. For further information, write to Wells Fargo Shareowner Services at the addresses noted above. Direct Deposit of Dividends Quarterly dividends can be electronically deposited to shareholders’ checking or savings accounts on the dividend payment date. Telephone inquiries may be directed to Wells Fargo Shareowner Services at 1-866-541-9693. Dividend Payment Schedule Dividends on LNC common stock are paid February 1, May 1, August 1 and November 1. Lincoln Financial Group is a registered service mark of LNC.

Lincoln National Corporation150 N. Radnor-Chester Road
Radnor, PA 19087
Lincoln Financial Group is the marketing name for Lincoln National
Corporation and its affiliates.
AR-LNC-16