Embed Size (px)
Citation preview
2016ANNUALREPORT
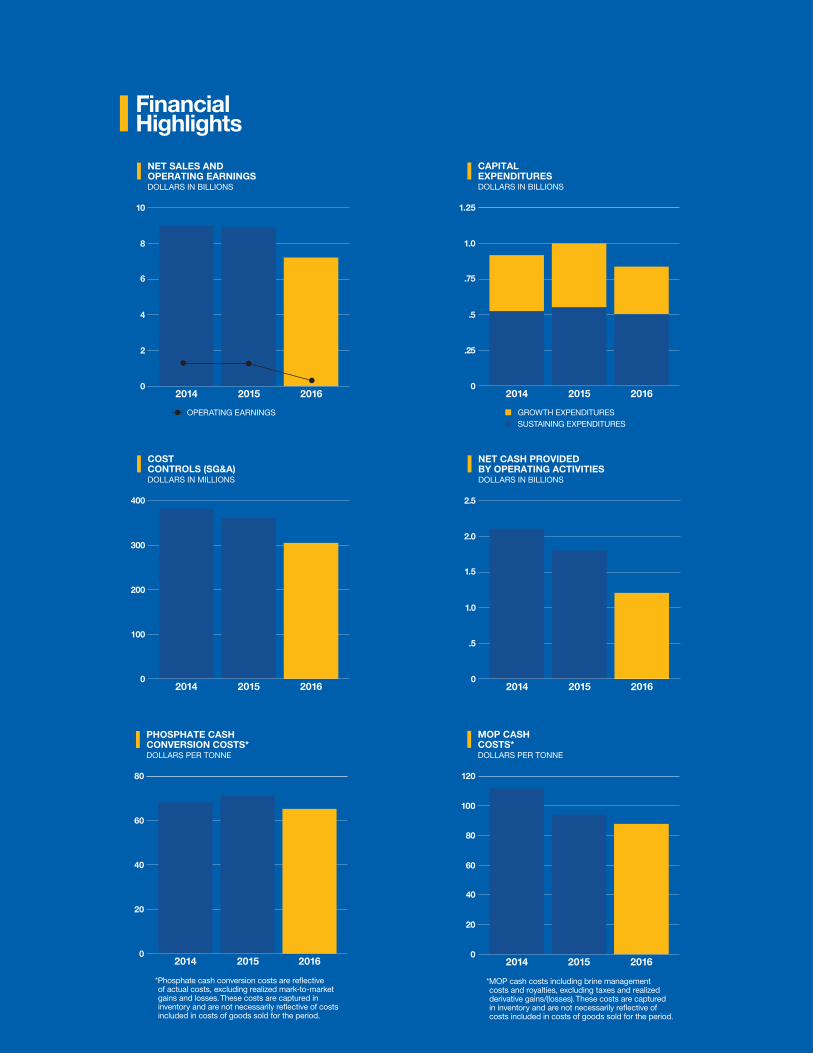
Financial Highlights
0
2
4
6
8
10
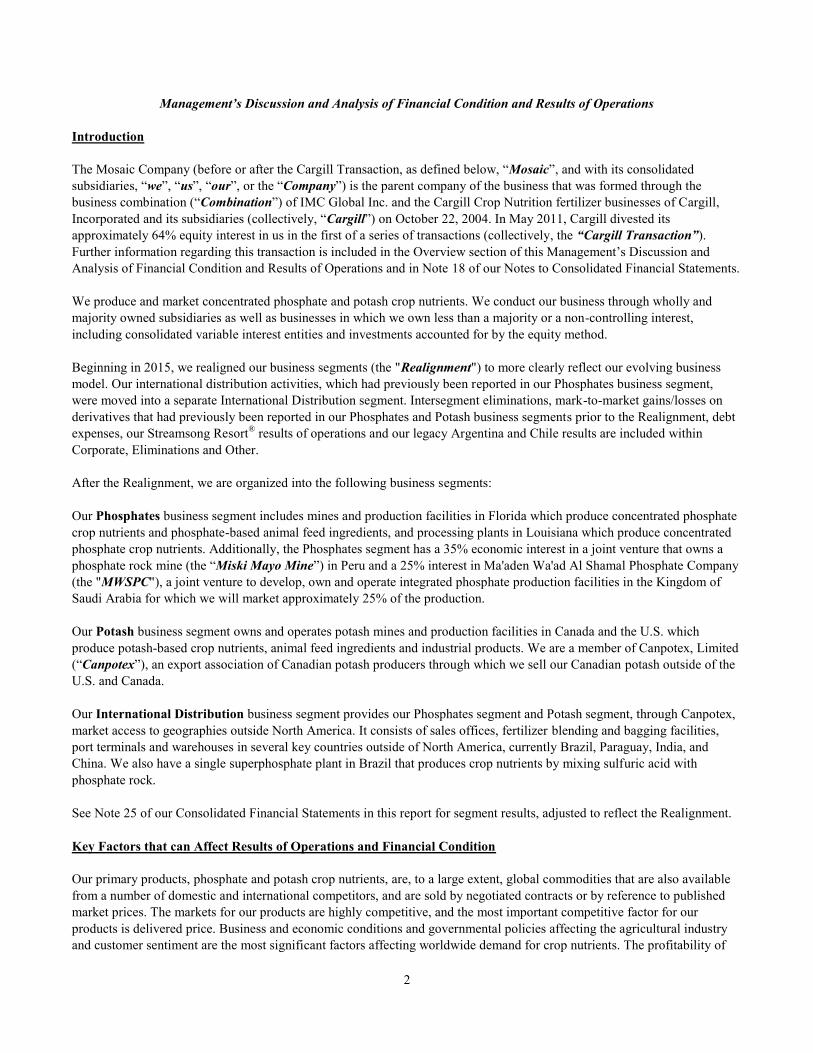
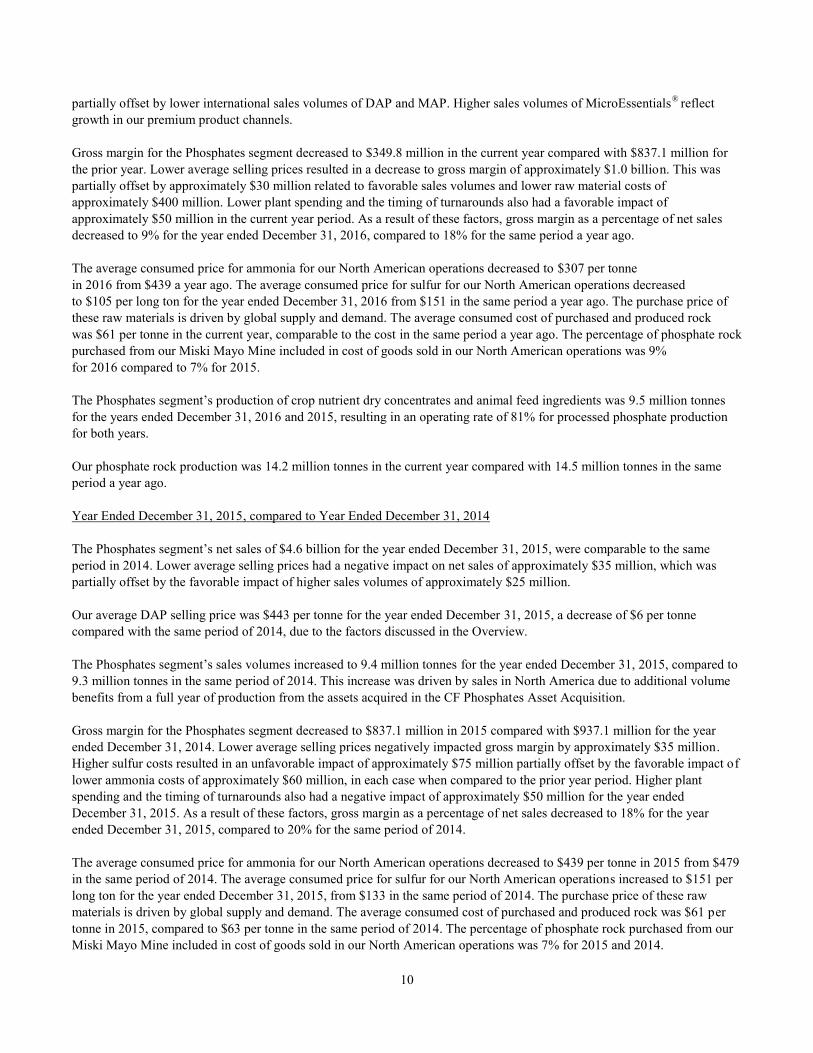
NET SALES ANDOPERATING EARNINGS DOLLARS IN BILLIONS
OPERATING EARNINGS
2014 2015 2016
10
8
6
4
2
0
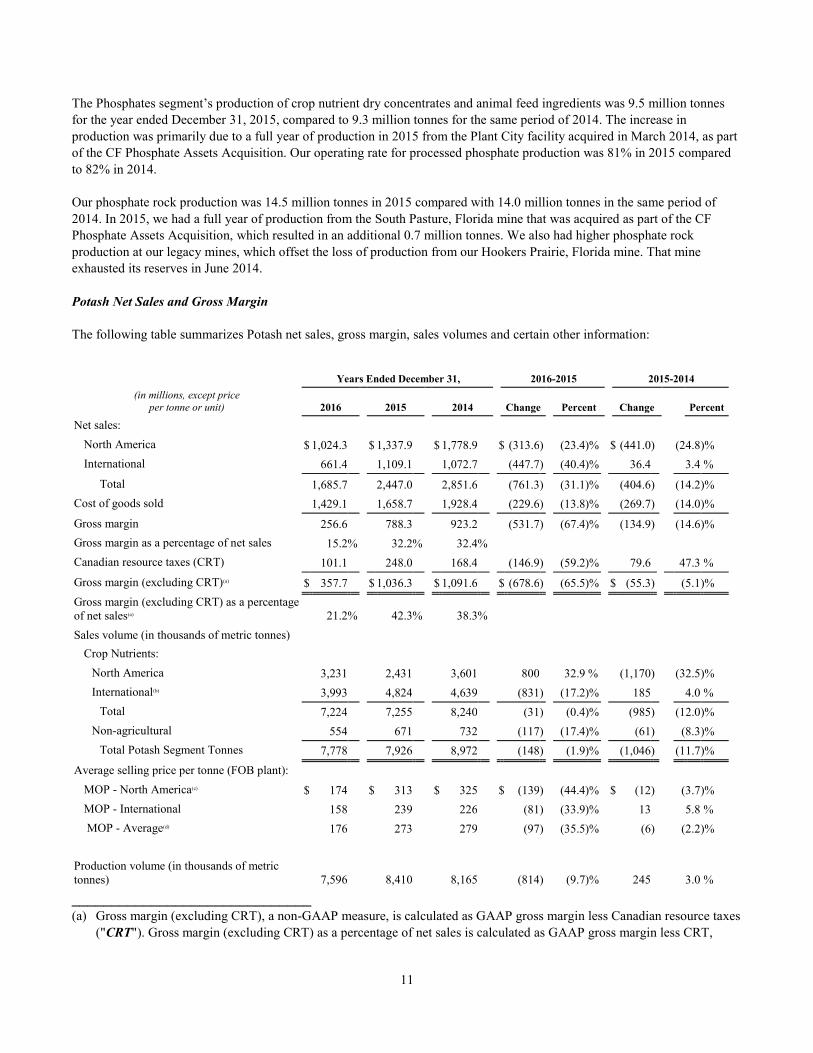
CAPITAL EXPENDITURES DOLLARS IN BILLIONS
2014 2015 2016
1.25
0
GROWTH EXPENDITURESSUSTAINING EXPENDITURES
1.0
.75
.5
.25
0.0
0.2
0.4
0.6
0.8
1.0
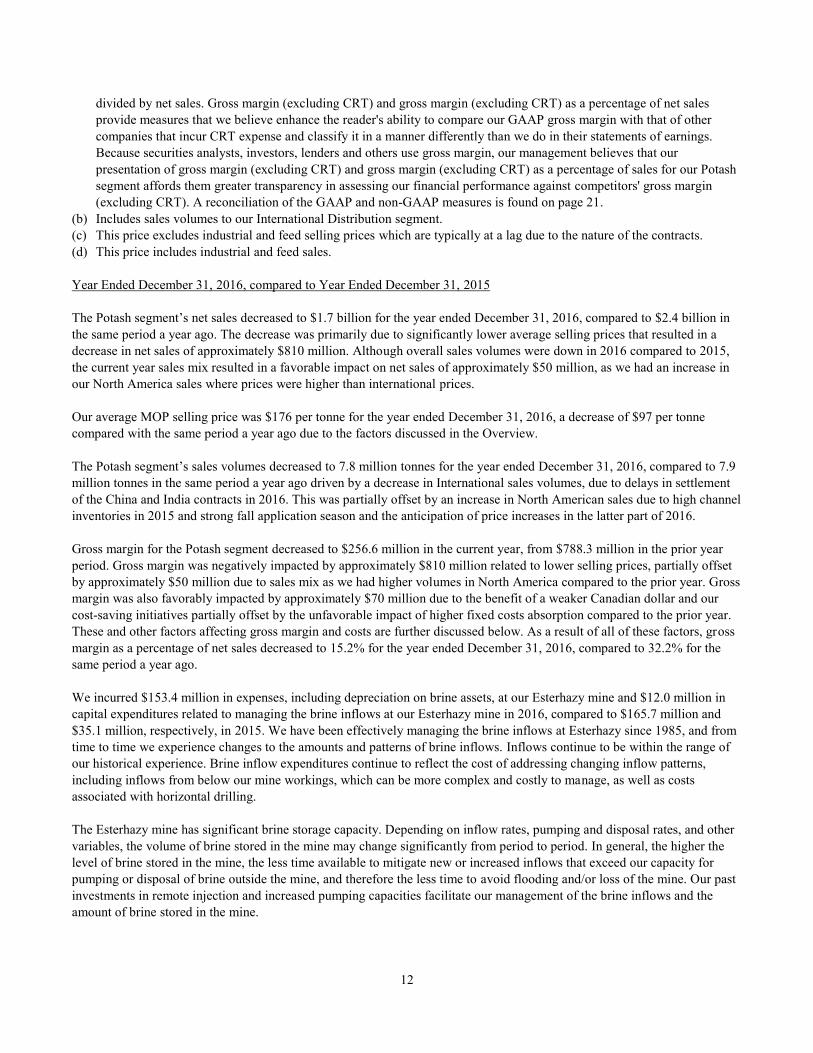
COST CONTROLS (SG&A)DOLLARS IN MILLIONS
2014 2015 2016
400
300
200
100
00
50
100
150
200
250
300
350
400
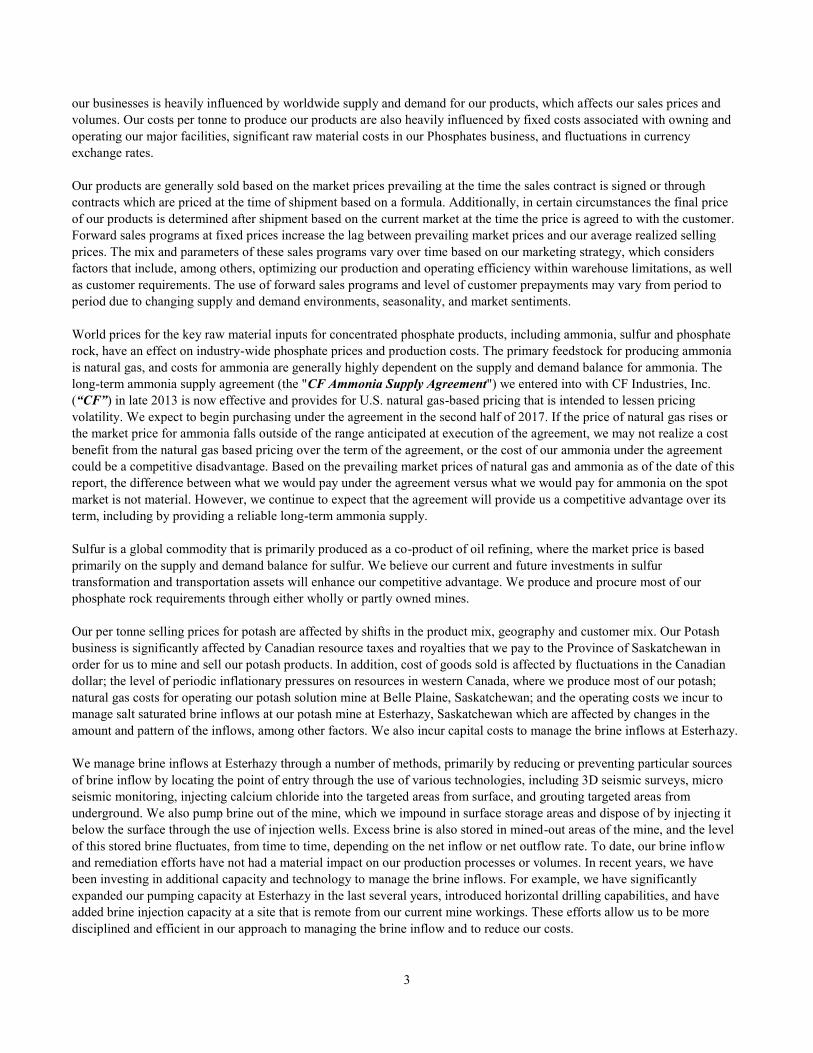
NET CASH PROVIDEDBY OPERATING ACTIVITIES DOLLARS IN BILLIONS
2014 2015 20160
2.5
2.0
1.5
1.0
.5
0.0
0.5
1.0
1.5
2.0
2.5
80
60
40
20
PHOSPHATE CASHCONVERSION COSTS*DOLLARS PER TONNE
2014 2015 201600
10
20
30
40
50
60
70
80
*Phosphate cash conversion costs are re�ective of actual costs, excluding realized mark-to-market gains and losses. These costs are captured in inventory and are not necessarily re�ective of costs included in costs of goods sold for the period.
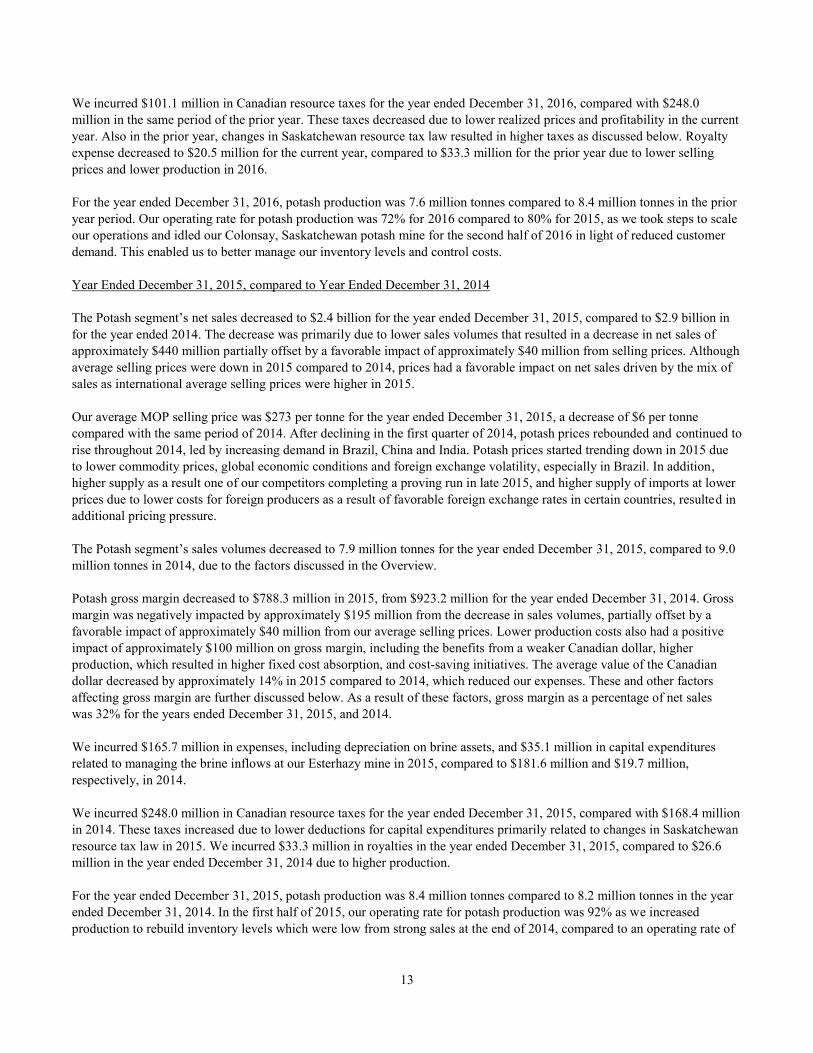
*MOP cash costs including brine management costs and royalties, excluding taxes and realized derivative gains/(losses). These costs are captured in inventory and are not necessarily re�ective of costs included in costs of goods sold for the period.
MOP CASH COSTS*DOLLARS PER TONNE
2014 2015 2016
120
0
100
40
60
80
20
0
20
40
60
80
100
120
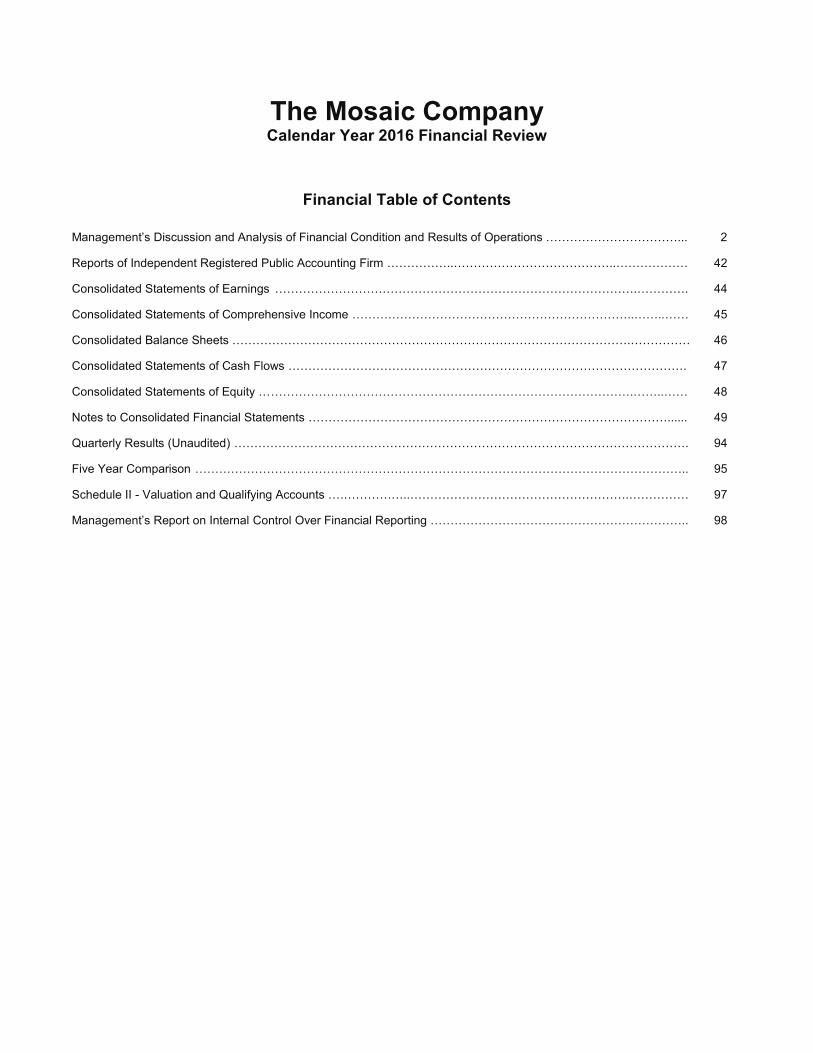
The Mosaic Company Calendar Year 2016 Financial Review
Financial Table of Contents Management’s Discussion and Analysis of Financial Condition and Results of Operations ……………………………... 2
Reports of Independent Registered Public Accounting Firm ……………..…………………………………..……………… 42
Consolidated Statements of Earnings ……………………………………………………………………………….…………. 44
Consolidated Statements of Comprehensive Income ……………………………………………………………..……..…… 45
Consolidated Balance Sheets ……………………………………………………………………………………….…………… 46
Consolidated Statements of Cash Flows ………………………………………………………………………………………. 47
Consolidated Statements of Equity ………………………………………………………………………………….……..…… 48
Notes to Consolidated Financial Statements ………………………………………………………………………………...... 49
Quarterly Results (Unaudited)……………………………………………………………………………………………………. 94
Five Year Comparison…………………………………………………………………………………………………………….. 95
Schedule II - Valuation and Qualifying Accounts ….……………..……………………………………………….…………… 97
Management’s Report on Internal Control Over Financial Reporting ……………………………………………………….. 98
2
Management’s Discussion and Analysis of Financial Condition and Results of Operations
Introduction
The Mosaic Company (before or after the Cargill Transaction, as defined below, “Mosaic”, and with its consolidated
subsidiaries, “we”, “us”, “our”, or the “Company”) is the parent company of the business that was formed through the
business combination (“Combination”) of IMC Global Inc. and the Cargill Crop Nutrition fertilizer businesses of Cargill,
Incorporated and its subsidiaries (collectively, “Cargill”) on October 22, 2004. In May 2011, Cargill divested its
approximately 64% equity interest in us in the first of a series of transactions (collectively, the “Cargill Transaction”).
Further information regarding this transaction is included in the Overview section of this Management’s Discussion and
Analysis of Financial Condition and Results of Operations and in Note 18 of our Notes to Consolidated Financial Statements.
We produce and market concentrated phosphate and potash crop nutrients. We conduct our business through wholly and
majority owned subsidiaries as well as businesses in which we own less than a majority or a non-controlling interest,
including consolidated variable interest entities and investments accounted for by the equity method.
Beginning in 2015, we realigned our business segments (the "Realignment") to more clearly reflect our evolving business
model. Our international distribution activities, which had previously been reported in our Phosphates business segment,
were moved into a separate International Distribution segment. Intersegment eliminations, mark-to-market gains/losses on
derivatives that had previously been reported in our Phosphates and Potash business segments prior to the Realignment, debt
expenses, our Streamsong Resort® results of operations and our legacy Argentina and Chile results are included within
Corporate, Eliminations and Other.
After the Realignment, we are organized into the following business segments:
Our Phosphates business segment includes mines and production facilities in Florida which produce concentrated phosphate
crop nutrients and phosphate-based animal feed ingredients, and processing plants in Louisiana which produce concentrated
phosphate crop nutrients. Additionally, the Phosphates segment has a 35% economic interest in a joint venture that owns a
phosphate rock mine (the “Miski Mayo Mine”) in Peru and a 25% interest in Ma'aden Wa'ad Al Shamal Phosphate Company
(the "MWSPC"), a joint venture to develop, own and operate integrated phosphate production facilities in the Kingdom of
Saudi Arabia for which we will market approximately 25% of the production.
Our Potash business segment owns and operates potash mines and production facilities in Canada and the U.S. which
produce potash-based crop nutrients, animal feed ingredients and industrial products. We are a member of Canpotex, Limited
(“Canpotex”), an export association of Canadian potash producers through which we sell our Canadian potash outside of the
U.S. and Canada.
Our International Distribution business segment provides our Phosphates segment and Potash segment, through Canpotex,
market access to geographies outside North America. It consists of sales offices, fertilizer blending and bagging facilities,
port terminals and warehouses in several key countries outside of North America, currently Brazil, Paraguay, India, and
China. We also have a single superphosphate plant in Brazil that produces crop nutrients by mixing sulfuric acid with
phosphate rock.
See Note 25 of our Consolidated Financial Statements in this report for segment results, adjusted to reflect the Realignment.
Key Factors that can Affect Results of Operations and Financial Condition
Our primary products, phosphate and potash crop nutrients, are, to a large extent, global commodities that are also available
from a number of domestic and international competitors, and are sold by negotiated contracts or by reference to published
market prices. The markets for our products are highly competitive, and the most important competitive factor for our
products is delivered price. Business and economic conditions and governmental policies affecting the agricultural industry
and customer sentiment are the most significant factors affecting worldwide demand for crop nutrients. The profitability of
3
our businesses is heavily influenced by worldwide supply and demand for our products, which affects our sales prices and
volumes. Our costs per tonne to produce our products are also heavily influenced by fixed costs associated with owning and
operating our major facilities, significant raw material costs in our Phosphates business, and fluctuations in currency
exchange rates.
Our products are generally sold based on the market prices prevailing at the time the sales contract is signed or through
contracts which are priced at the time of shipment based on a formula. Additionally, in certain circumstances the final price
of our products is determined after shipment based on the current market at the time the price is agreed to with the customer.
Forward sales programs at fixed prices increase the lag between prevailing market prices and our average realized selling
prices. The mix and parameters of these sales programs vary over time based on our marketing strategy, which considers
factors that include, among others, optimizing our production and operating efficiency within warehouse limitations, as well
as customer requirements. The use of forward sales programs and level of customer prepayments may vary from period to
period due to changing supply and demand environments, seasonality, and market sentiments.
World prices for the key raw material inputs for concentrated phosphate products, including ammonia, sulfur and phosphate
rock, have an effect on industry-wide phosphate prices and production costs. The primary feedstock for producing ammonia
is natural gas, and costs for ammonia are generally highly dependent on the supply and demand balance for ammonia. The
long-term ammonia supply agreement (the "CF Ammonia Supply Agreement") we entered into with CF Industries, Inc.
(“CF”) in late 2013 is now effective and provides for U.S. natural gas-based pricing that is intended to lessen pricing
volatility. We expect to begin purchasing under the agreement in the second half of 2017. If the price of natural gas rises or
the market price for ammonia falls outside of the range anticipated at execution of the agreement, we may not realize a cost
benefit from the natural gas based pricing over the term of the agreement, or the cost of our ammonia under the agreement
could be a competitive disadvantage. Based on the prevailing market prices of natural gas and ammonia as of the date of this
report, the difference between what we would pay under the agreement versus what we would pay for ammonia on the spot
market is not material. However, we continue to expect that the agreement will provide us a competitive advantage over its
term, including by providing a reliable long-term ammonia supply.
Sulfur is a global commodity that is primarily produced as a co-product of oil refining, where the market price is based
primarily on the supply and demand balance for sulfur. We believe our current and future investments in sulfur
transformation and transportation assets will enhance our competitive advantage. We produce and procure most of our
phosphate rock requirements through either wholly or partly owned mines.
Our per tonne selling prices for potash are affected by shifts in the product mix, geography and customer mix. Our Potash
business is significantly affected by Canadian resource taxes and royalties that we pay to the Province of Saskatchewan in
order for us to mine and sell our potash products. In addition, cost of goods sold is affected by fluctuations in the Canadian
dollar; the level of periodic inflationary pressures on resources in western Canada, where we produce most of our potash;
natural gas costs for operating our potash solution mine at Belle Plaine, Saskatchewan; and the operating costs we incur to
manage salt saturated brine inflows at our potash mine at Esterhazy, Saskatchewan which are affected by changes in the
amount and pattern of the inflows, among other factors. We also incur capital costs to manage the brine inflows at Esterhazy.
We manage brine inflows at Esterhazy through a number of methods, primarily by reducing or preventing particular sources
of brine inflow by locating the point of entry through the use of various technologies, including 3D seismic surveys, micro
seismic monitoring, injecting calcium chloride into the targeted areas from surface, and grouting targeted areas from
underground. We also pump brine out of the mine, which we impound in surface storage areas and dispose of by injecting it
below the surface through the use of injection wells. Excess brine is also stored in mined-out areas of the mine, and the level
of this stored brine fluctuates, from time to time, depending on the net inflow or net outflow rate. To date, our brine inflow
and remediation efforts have not had a material impact on our production processes or volumes. In recent years, we have
been investing in additional capacity and technology to manage the brine inflows. For example, we have significantly
expanded our pumping capacity at Esterhazy in the last several years, introduced horizontal drilling capabilities, and have
added brine injection capacity at a site that is remote from our current mine workings. These efforts allow us to be more
disciplined and efficient in our approach to managing the brine inflow and to reduce our costs.
4
Our results of operations are also affected by changes in currency exchange rates due to our international footprint. The most
significant currency impacts are generally from the Canadian dollar and the Brazilian real.
A discussion of these and other factors that affected our results of operations and financial condition for the periods covered
by this Management’s Discussion and Analysis of Financial Condition and Results of Operations is set forth in further detail
below. This Management’s Discussion and Analysis of Financial Condition and Results of Operations should also be read in
conjunction with the narrative description of our business in Item 1, and the risk factors described in Item 1A, of Part I of this
annual report on Form 10-K, and our Consolidated Financial Statements, accompanying notes and other information listed in
the accompanying Financial Table of Contents.
Throughout the discussion below, we measure units of production, sales and raw materials in metric tonnes which are the
equivalent of 2,205 pounds, unless we specifically state that we mean short or long ton(s) which are the equivalent of 2,000
pounds and 2,240 pounds, respectively. In addition, we measure natural gas, a raw material used in the production of our
products, in MMBTU, which stands for one million British Thermal Units (BTU). One BTU is equivalent to 1.06 Joules.
In the following table, there are certain percentages that are not considered to be meaningful and are represented by “NM”.
Results of Operations
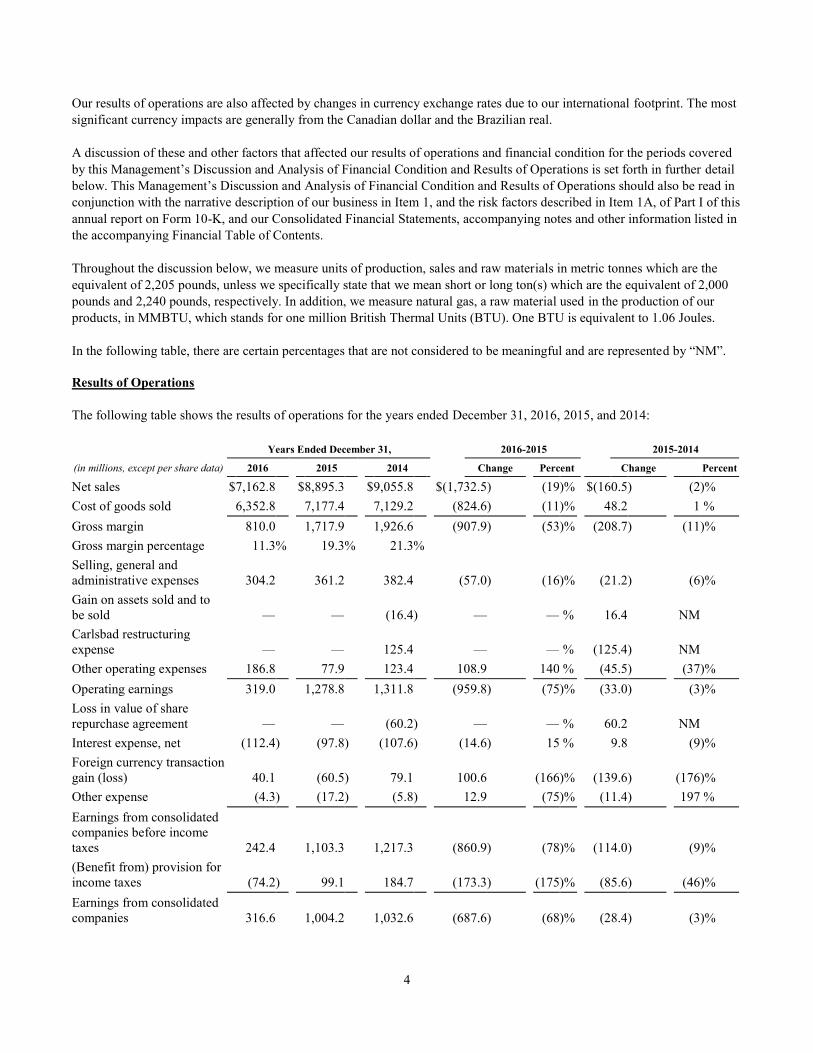
The following table shows the results of operations for the years ended December 31, 2016, 2015, and 2014:
Years Ended December 31, 2016-2015 2015-2014
(in millions, except per share data) 2016 2015 2014 Change Percent Change Percent
Net sales $ 7,162.8
$ 8,895.3
$ 9,055.8
$ (1,732.5 ) (19 )% $ (160.5 ) (2 )%
Cost of goods sold 6,352.8
7,177.4
7,129.2
(824.6 ) (11 )% 48.2
1 %
Gross margin 810.0
1,717.9
1,926.6
(907.9 ) (53 )% (208.7 ) (11 )%
Gross margin percentage 11.3 % 19.3 % 21.3 %
Selling, general and
administrative expenses 304.2
361.2
382.4
(57.0 ) (16 )% (21.2 ) (6 )%
Gain on assets sold and to
be sold —
—
(16.4 ) —
— % 16.4
NM
Carlsbad restructuring
expense —
—
125.4
—
— % (125.4 ) NM
Other operating expenses 186.8
77.9
123.4
108.9
140 % (45.5 ) (37 )%
Operating earnings 319.0
1,278.8
1,311.8
(959.8 ) (75 )% (33.0 ) (3 )%
Loss in value of share
repurchase agreement —
—
(60.2 ) —
— % 60.2
NM
Interest expense, net (112.4 ) (97.8 ) (107.6 ) (14.6 ) 15 % 9.8
(9 )%
Foreign currency transaction
gain (loss) 40.1
(60.5 ) 79.1
100.6
(166 )% (139.6 ) (176 )%
Other expense (4.3 ) (17.2 ) (5.8 ) 12.9
(75 )% (11.4 ) 197 %
Earnings from consolidated
companies before income
taxes 242.4
1,103.3
1,217.3
(860.9 ) (78 )% (114.0 ) (9 )%
(Benefit from) provision for
income taxes (74.2 ) 99.1
184.7
(173.3 ) (175 )% (85.6 ) (46 )%
Earnings from consolidated
companies 316.6
1,004.2
1,032.6
(687.6 ) (68 )% (28.4 ) (3 )%
5
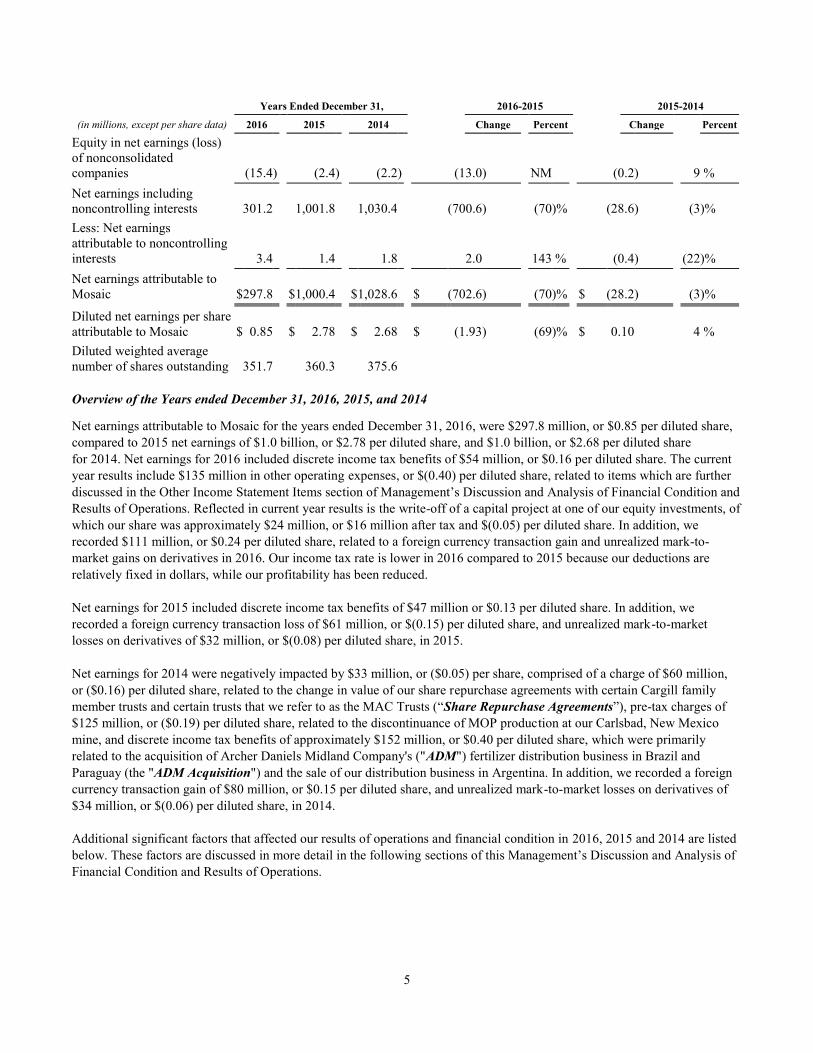
Years Ended December 31, 2016-2015 2015-2014
(in millions, except per share data) 2016 2015 2014 Change Percent Change Percent
Equity in net earnings (loss)
of nonconsolidated
companies (15.4 ) (2.4 ) (2.2 ) (13.0 ) NM
(0.2 ) 9 %
Net earnings including
noncontrolling interests 301.2
1,001.8
1,030.4
(700.6 ) (70 )% (28.6 ) (3 )%
Less: Net earnings
attributable to noncontrolling
interests 3.4
1.4
1.8
2.0
143 % (0.4 ) (22 )%
Net earnings attributable to
Mosaic $ 297.8
$ 1,000.4
$ 1,028.6
$ (702.6 ) (70 )% $ (28.2 ) (3 )%
Diluted net earnings per share
attributable to Mosaic $ 0.85
$ 2.78
$ 2.68
$ (1.93 ) (69 )% $ 0.10
4 %
Diluted weighted average
number of shares outstanding 351.7
360.3
375.6
Overview of the Years ended December 31, 2016, 2015, and 2014
Net earnings attributable to Mosaic for the years ended December 31, 2016, were $297.8 million, or $0.85 per diluted share,
compared to 2015 net earnings of $1.0 billion, or $2.78 per diluted share, and $1.0 billion, or $2.68 per diluted share
for 2014. Net earnings for 2016 included discrete income tax benefits of $54 million, or $0.16 per diluted share. The current
year results include $135 million in other operating expenses, or $(0.40) per diluted share, related to items which are further
discussed in the Other Income Statement Items section of Management’s Discussion and Analysis of Financial Condition and
Results of Operations. Reflected in current year results is the write-off of a capital project at one of our equity investments, of
which our share was approximately $24 million, or $16 million after tax and $(0.05) per diluted share. In addition, we
recorded $111 million, or $0.24 per diluted share, related to a foreign currency transaction gain and unrealized mark-to-
market gains on derivatives in 2016. Our income tax rate is lower in 2016 compared to 2015 because our deductions are
relatively fixed in dollars, while our profitability has been reduced.
Net earnings for 2015 included discrete income tax benefits of $47 million or $0.13 per diluted share. In addition, we
recorded a foreign currency transaction loss of $61 million, or $(0.15) per diluted share, and unrealized mark-to-market
losses on derivatives of $32 million, or $(0.08) per diluted share, in 2015.
Net earnings for 2014 were negatively impacted by $33 million, or ($0.05) per share, comprised of a charge of $60 million,
or ($0.16) per diluted share, related to the change in value of our share repurchase agreements with certain Cargill family
member trusts and certain trusts that we refer to as the MAC Trusts (“Share Repurchase Agreements”), pre-tax charges of
$125 million, or ($0.19) per diluted share, related to the discontinuance of MOP production at our Carlsbad, New Mexico
mine, and discrete income tax benefits of approximately $152 million, or $0.40 per diluted share, which were primarily
related to the acquisition of Archer Daniels Midland Company's ("ADM") fertilizer distribution business in Brazil and
Paraguay (the "ADM Acquisition") and the sale of our distribution business in Argentina. In addition, we recorded a foreign
currency transaction gain of $80 million, or $0.15 per diluted share, and unrealized mark-to-market losses on derivatives of
$34 million, or $(0.06) per diluted share, in 2014.
Additional significant factors that affected our results of operations and financial condition in 2016, 2015 and 2014 are listed
below. These factors are discussed in more detail in the following sections of this Management’s Discussion and Analysis of
Financial Condition and Results of Operations.
6
Year ended December 31, 2016
Operating earnings for the year ended December 31, 2016, were unfavorably impacted by significantly lower average selling
prices for phosphates and potash, partially offset by lower phosphates raw material costs and higher phosphates sales
volumes.
Our net sales and operating results for the year ended December 31, 2016, were negatively impacted by a decline in
phosphates average selling prices compared to the prior year. Phosphates average selling prices in the current year were
unfavorably impacted by cautious purchasing behavior in the first half of the year, driven by aggressive pricing by global
producers and lower grain and oilseed prices. Selling prices were also influenced by lower raw material prices driven by
global supply and demand of sulfur and ammonia. In the second half of 2016, sales volumes increased due to low phosphate
pipeline inventory levels and concerns about tightness in product availability. A significant portion of the increase in our
sales volumes was from sales of MicroEssentials® in North America and Brazil.
Lower potash average selling prices unfavorably impacted net sales and operating results in the current year compared to the
prior year. In 2016, potash average selling prices were negatively impacted by the global competitive environment, driven by
a strengthening of the U.S. dollar versus significantly devalued local currencies of other producers. Potash prices have also
been influenced by lower global grain and oilseed prices. Delays in settlement of the Chinese potash contract and high
inventory levels early in 2016 also added downward pressure to potash selling prices during the first half of 2016.
In the fourth quarter of 2016, average selling prices for phosphates and potash began to increase due to a change in sentiment
that helped drive higher demand. These increases have continued in 2017, but with their benefit partially offset by higher raw
material costs.
Other highlights in 2016:
During 2016, we took the following steps toward achieving our strategic priorities:
• Growth: Grow our production of essential crop nutrients and operate with increasing efficiency
• On December 19, 2016, we entered into an agreement to acquire Vale S.A.'s global phosphate and potash operations
conducted through Vale Fertilizantes S.A. for a purchase price valued at $2.5 billion, consisting of $1.25 billion in
cash and 42,286,874 shares of Mosaic common stock. When completed, this transaction will increase our finished
phosphates capacity by approximately five million tonnes and our finished potash capacity by approximately
500,000 tonnes. The assets we will acquire upon closing include five Brazilian phosphate rock mines; four chemical
plants; a potash mine in Brazil; an additional 40% economic interest in the Miski Mayo Mine, which will increase
our aggregate interest to 75%; a Kronau, Saskatchewan potash project; and a 20% interest in the Tiplam port. We
also have an option under the agreement to purchase a potash mine in Rio Colorado, Argentina. Upon closing,
Mosaic expects to become the leading fertilizer production and distribution company in Brazil. On February 6, 2017
we received notice from the U.S. Federal Trade Commission that it had granted early termination of the applicable
waiting period under the Hart-Scott-Rodino Antitrust Improvements Act of 1976, satisfying one of the conditions to
closing. The transaction is expected to close in late 2017 and is subject to the satisfaction of other regulatory and
closing conditions.
• During 2016, we made equity contributions of $220 million to MWSPC, our joint venture with Saudi Arabian
Mining Company (“Ma’aden”) and Saudi Basic Industries Corporation (“SABIC”) to develop, own and operate
integrated phosphate production facilities in the Kingdom of Saudi Arabia. Our cash investment at December 31,
2016, and as of the date of this report, was approximately $707 million. We currently estimate that our total cash
investment in MWSPC, including the amount we have invested to date, will approximate $850 million. We expect
our future cash contributions to be approximately $143 million. We estimate the total cost to develop and construct
the integrated phosphate production facilities to be approximately $8.0 billion. If the total project cost exceeds $8.0
7
billion, our investment is expected to increase by 25% of the amount above $8.0 billion. We expect this amount to
be funded through external debt facilities, and investments by the joint venture members.
• We continued the expansion of capacity in our Potash segment with the K3 shafts at our Esterhazy mine, which we
expect to begin mining potash ore in 2017 and, following ramp-up, to add an estimated 0.9 million tonnes to our
potash operational capacity. Once completed, this will provide us the opportunity to mitigate future brine inflow
management costs and risk.
• On November 15, 2016, the U.S. Army Corps of Engineers issued the final permit that will allow us to extend our
mining operations from our South Pasture mine onto the adjoining South Pasture Extension, which includes land
parcels totaling approximately 7,500 acres. We believe this will enable us to extend our mining operations at South
Pasture for an additional 14 years.
• In 2016, we commenced a proving run at our Belle Plaine, Saskatchewan potash mine which was completed on
February 7, 2017, and will be taken into account in determining our Canpotex allocation in the second half of 2017.
• Market Access: Expand our reach and impact by continuously strengthening our distribution network
• We had record sales volumes of 6.8 million tonnes in our International Distribution segment in 2016.
• Innovation: Build on our industry-leading products, process and sustainability innovations
• We completed our investments to expand our MicroEssentials® capacity, adding an incremental 1.2 million tonnes
and bringing our total capacity to 3.5 million tonnes in 2017. Our sales volumes of MicroEssentials® products in
2016 were 2.2 million tonnes, including sales from our International Distribution segment, which represents an
increase of 23% over 2015.
• Total Shareholder Return: Deliver strong financial performance and provide meaningful returns to our shareholders
• On November 18, 2016 we upsized and extended our prior $1.5 billion unsecured revolving credit facility, and
refinanced our prior term loan facility, with a new unsecured five-year credit facility comprised of a revolving credit
facility of up to $2.0 billion and a $720 million term loan facility.
• We entered into, and in March 2016 settled, an accelerated share repurchase transaction under which we received a
total of 2,766,588 shares of our Common Stock in exchange for a payment of $75 million. The transaction was
conducted under the $1.5 billion repurchase program authorized by our Board of Directors in May 2015 (the "2015
Repurchase Program").
• We continued to execute against our cost saving initiatives in ways that are positively impacting financial results:
◦ We are on track to meet the goal we set to achieve $500 million in pre-tax cost savings by the end of 2018.
We are approximately 80% of the way toward meeting this goal.
◦ We are targeting an additional $75 million in savings in our support functions. We realized some of these
savings in 2016 and expect to realize most of the remainder by the end of 2017. Selling, general and
administrative expenses in 2016 were the lowest amount in the last ten years, benefiting from our ongoing
expense management initiatives.
◦ We are managing our capital through the reduction, deferral or elimination of certain capital spending.
Capital expenditures in 2016 were the lowest in over five years.
8
◦ In July 2016, we temporarily idled our Colonsay, Saskatchewan potash mine for the remainder of 2016 in
light of reduced customer demand while adapting to challenging potash market conditions. Our lower-cost
Esterhazy and Belle Plaine mines, in combination with existing inventory, allowed us to meet our short-
term potash supply needs for 2016. We resumed production at Colonsay in January 2017.
• Subsequent to year-end, we announced that our Board of Directors has approved a reduction in our target annual
dividend to $0.60 per share, effective with our next declaration, expected in May 2017.
Year ended December 31, 2015
Operating earnings for the year ended December 31, 2015, were unfavorably impacted by lower average selling prices for
phosphates, lower Potash sales volumes and higher Canadian Resource Tax expense as a result of Saskatchewan law changes
enacted in 2015 regarding the treatment of capital expenditures. This was partially offset by lower costs in our Potash
segment from our cost saving initiatives and the benefit from a weaker Canadian dollar compared to the same period in 2014.
In 2015, lower Potash sales volumes were primarily driven by lower sales volumes in North America as a result of excess
supply and lower demand due to cautious customers' purchasing behavior. In the first half of 2015, there were increased
imports into North America as foreign currency fluctuations allowed foreign competitors the ability to more economically
ship product into North America. In the second half of the year, customers delayed purchases as a result of cautious
purchasing behavior, when compared to the prior year.
Phosphates average selling prices started 2015 higher than the prior year due in part to the reduction in supply from the
closure of certain phosphate U.S. production facilities owned by our competitors. However, in the second half of 2015,
phosphates average selling prices started to decline below the prior year's level, primarily due to lower raw material costs and
lower commodity prices in 2015.
Year ended December 31, 2014
Operating earnings for the year ended December 31, 2014, reflected net costs of approximately $109.0 million related to
improving utilization of our asset base, including our decision to permanently discontinue production of MOP at our
Carlsbad, New Mexico facility, sell our Hersey salt operations and exit our distribution businesses in Argentina and Chile.
Operating earnings were favorably impacted by Phosphates sales volumes which were 9.3 million tonnes in 2014 compared
to 8.3 million tonnes in 2013. On March 17, 2014, we completed the acquisition of the Florida phosphate assets and
assumption of certain liabilities (the "CF Phosphate Assets Acquisition") of CF. The increase in sales volumes from the prior
year was primarily due to more tonnes available following this acquisition. Lower raw material costs also favorably impacted
operating earnings in 2014 compared to 2013.
Potash sales volumes were 9.0 million tonnes for the year ended December 31, 2014, compared to 7.7 million tonnes in the
prior year as we experienced an increase in demand in 2014 compared to 2013. In 2013, Potash sales volumes were
constrained by sentiments in the market driving customers to purchase fertilizer only as needed, combined with delayed
purchases in anticipation of the signing of supply contracts in China. Despite strong demand, and the fact that potash selling
prices grew stronger each quarter in 2014, potash selling prices did not recover to the price levels seen in the first half of
2013. Potash selling prices began to decrease in 2013 due to uncertainty in the potash market and weak customer sentiment,
which was exacerbated in July 2013, when one of our global competitors announced its intention to increase production
volumes and corresponding sales volumes.
9
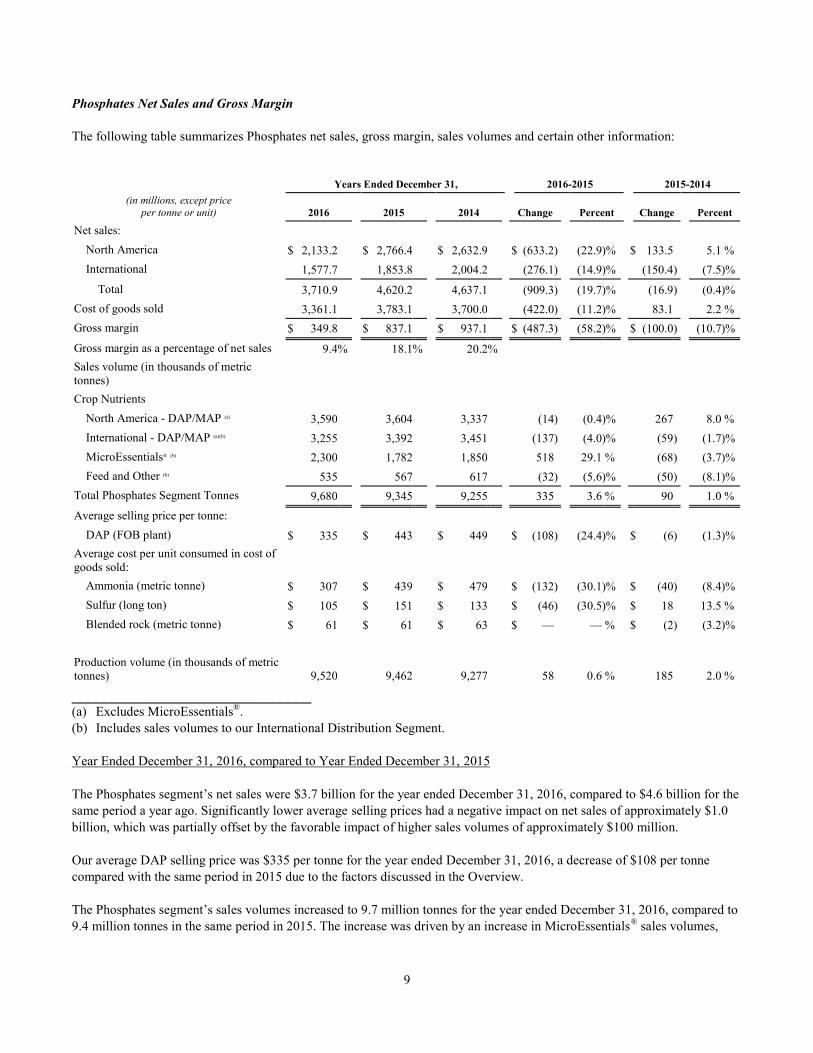
Phosphates Net Sales and Gross Margin
The following table summarizes Phosphates net sales, gross margin, sales volumes and certain other information:
Years Ended December 31, 2016-2015 2015-2014
(in millions, except price
per tonne or unit) 2016 2015 2014 Change Percent Change Percent
Net sales:
North America $ 2,133.2
$ 2,766.4
$ 2,632.9
$ (633.2 ) (22.9 )% $ 133.5
5.1 %
International 1,577.7
1,853.8
2,004.2
(276.1 ) (14.9 )% (150.4 ) (7.5 )%
Total 3,710.9
4,620.2
4,637.1
(909.3 ) (19.7 )% (16.9 ) (0.4 )%
Cost of goods sold 3,361.1
3,783.1
3,700.0
(422.0 ) (11.2 )% 83.1
2.2 %
Gross margin $ 349.8
$ 837.1
$ 937.1
$ (487.3 ) (58.2 )% $ (100.0 ) (10.7 )%
Gross margin as a percentage of net sales 9.4 % 18.1 % 20.2 %
Sales volume (in thousands of metric
tonnes)
Crop Nutrients
North America - DAP/MAP (a) 3,590
3,604
3,337
(14 ) (0.4 )% 267
8.0 %
International - DAP/MAP (a)(b) 3,255
3,392
3,451
(137 ) (4.0 )% (59 ) (1.7 )%
MicroEssentials® (b) 2,300
1,782
1,850
518
29.1 % (68 ) (3.7 )%
Feed and Other (b) 535
567
617
(32 ) (5.6 )% (50 ) (8.1 )%
Total Phosphates Segment Tonnes 9,680
9,345
9,255
335
3.6 % 90
1.0 %
Average selling price per tonne:
DAP (FOB plant) $ 335
$ 443
$ 449
$ (108 ) (24.4 )% $ (6 ) (1.3 )%
Average cost per unit consumed in cost of
goods sold:
Ammonia (metric tonne) $ 307
$ 439
$ 479
$ (132 ) (30.1 )% $ (40 ) (8.4 )%
Sulfur (long ton) $ 105
$ 151
$ 133
$ (46 ) (30.5 )% $ 18
13.5 %
Blended rock (metric tonne) $ 61
$ 61
$ 63
$ —
— % $ (2 ) (3.2 )%
Production volume (in thousands of metric
tonnes) 9,520
9,462
9,277
58
0.6 % 185
2.0 %
______________________________ (a) Excludes MicroEssentials
®.
(b) Includes sales volumes to our International Distribution Segment.
Year Ended December 31, 2016, compared to Year Ended December 31, 2015
The Phosphates segment’s net sales were $3.7 billion for the year ended December 31, 2016, compared to $4.6 billion for the
same period a year ago. Significantly lower average selling prices had a negative impact on net sales of approximately $1.0
billion, which was partially offset by the favorable impact of higher sales volumes of approximately $100 million.
Our average DAP selling price was $335 per tonne for the year ended December 31, 2016, a decrease of $108 per tonne
compared with the same period in 2015 due to the factors discussed in the Overview.
The Phosphates segment’s sales volumes increased to 9.7 million tonnes for the year ended December 31, 2016, compared to
9.4 million tonnes in the same period in 2015. The increase was driven by an increase in MicroEssentials® sales volumes,
10
partially offset by lower international sales volumes of DAP and MAP. Higher sales volumes of MicroEssentials®
reflect
growth in our premium product channels.
Gross margin for the Phosphates segment decreased to $349.8 million in the current year compared with $837.1 million for
the prior year. Lower average selling prices resulted in a decrease to gross margin of approximately $1.0 billion. This was
partially offset by approximately $30 million related to favorable sales volumes and lower raw material costs of
approximately $400 million. Lower plant spending and the timing of turnarounds also had a favorable impact of
approximately $50 million in the current year period. As a result of these factors, gross margin as a percentage of net sales
decreased to 9% for the year ended December 31, 2016, compared to 18% for the same period a year ago.
The average consumed price for ammonia for our North American operations decreased to $307 per tonne
in 2016 from $439 a year ago. The average consumed price for sulfur for our North American operations decreased
to $105 per long ton for the year ended December 31, 2016 from $151 in the same period a year ago. The purchase price of
these raw materials is driven by global supply and demand. The average consumed cost of purchased and produced rock
was $61 per tonne in the current year, comparable to the cost in the same period a year ago. The percentage of phosphate rock
purchased from our Miski Mayo Mine included in cost of goods sold in our North American operations was 9%
for 2016 compared to 7% for 2015.
The Phosphates segment’s production of crop nutrient dry concentrates and animal feed ingredients was 9.5 million tonnes
for the years ended December 31, 2016 and 2015, resulting in an operating rate of 81% for processed phosphate production
for both years.
Our phosphate rock production was 14.2 million tonnes in the current year compared with 14.5 million tonnes in the same
period a year ago.
Year Ended December 31, 2015, compared to Year Ended December 31, 2014
The Phosphates segment’s net sales of $4.6 billion for the year ended December 31, 2015, were comparable to the same
period in 2014. Lower average selling prices had a negative impact on net sales of approximately $35 million, which was
partially offset by the favorable impact of higher sales volumes of approximately $25 million.
Our average DAP selling price was $443 per tonne for the year ended December 31, 2015, a decrease of $6 per tonne
compared with the same period of 2014, due to the factors discussed in the Overview.
The Phosphates segment’s sales volumes increased to 9.4 million tonnes for the year ended December 31, 2015, compared to
9.3 million tonnes in the same period of 2014. This increase was driven by sales in North America due to additional volume
benefits from a full year of production from the assets acquired in the CF Phosphates Asset Acquisition.
Gross margin for the Phosphates segment decreased to $837.1 million in 2015 compared with $937.1 million for the year
ended December 31, 2014. Lower average selling prices negatively impacted gross margin by approximately $35 million.
Higher sulfur costs resulted in an unfavorable impact of approximately $75 million partially offset by the favorable impact of
lower ammonia costs of approximately $60 million, in each case when compared to the prior year period. Higher plant
spending and the timing of turnarounds also had a negative impact of approximately $50 million for the year ended
December 31, 2015. As a result of these factors, gross margin as a percentage of net sales decreased to 18% for the year
ended December 31, 2015, compared to 20% for the same period of 2014.
The average consumed price for ammonia for our North American operations decreased to $439 per tonne in 2015 from $479
in the same period of 2014. The average consumed price for sulfur for our North American operations increased to $151 per
long ton for the year ended December 31, 2015, from $133 in the same period of 2014. The purchase price of these raw
materials is driven by global supply and demand. The average consumed cost of purchased and produced rock was $61 per
tonne in 2015, compared to $63 per tonne in the same period of 2014. The percentage of phosphate rock purchased from our
Miski Mayo Mine included in cost of goods sold in our North American operations was 7% for 2015 and 2014.
11
The Phosphates segment’s production of crop nutrient dry concentrates and animal feed ingredients was 9.5 million tonnes
for the year ended December 31, 2015, compared to 9.3 million tonnes for the same period of 2014. The increase in
production was primarily due to a full year of production in 2015 from the Plant City facility acquired in March 2014, as part
of the CF Phosphate Assets Acquisition. Our operating rate for processed phosphate production was 81% in 2015 compared
to 82% in 2014.
Our phosphate rock production was 14.5 million tonnes in 2015 compared with 14.0 million tonnes in the same period of
2014. In 2015, we had a full year of production from the South Pasture, Florida mine that was acquired as part of the CF
Phosphate Assets Acquisition, which resulted in an additional 0.7 million tonnes. We also had higher phosphate rock
production at our legacy mines, which offset the loss of production from our Hookers Prairie, Florida mine. That mine
exhausted its reserves in June 2014.
Potash Net Sales and Gross Margin
The following table summarizes Potash net sales, gross margin, sales volumes and certain other information:
Years Ended December 31, 2016-2015 2015-2014
(in millions, except price
per tonne or unit) 2016 2015 2014 Change Percent Change Percent
Net sales:
North America $ 1,024.3
$ 1,337.9
$ 1,778.9
$ (313.6 ) (23.4 )% $ (441.0 ) (24.8 )%
International 661.4
1,109.1
1,072.7
(447.7 ) (40.4 )% 36.4
3.4 %
Total 1,685.7
2,447.0
2,851.6
(761.3 ) (31.1 )% (404.6 ) (14.2 )%
Cost of goods sold 1,429.1
1,658.7
1,928.4
(229.6 ) (13.8 )% (269.7 ) (14.0 )%
Gross margin 256.6
788.3
923.2
(531.7 ) (67.4 )% (134.9 ) (14.6 )%
Gross margin as a percentage of net sales 15.2 % 32.2 % 32.4 %
Canadian resource taxes (CRT) 101.1
248.0
168.4
(146.9 ) (59.2 )% 79.6
47.3 %
Gross margin (excluding CRT)(a) $ 357.7
$ 1,036.3
$ 1,091.6
$ (678.6 ) (65.5 )% $ (55.3 ) (5.1 )%
Gross margin (excluding CRT) as a percentage
of net sales(a) 21.2 % 42.3 % 38.3 %
Sales volume (in thousands of metric tonnes)
Crop Nutrients:
North America 3,231
2,431
3,601
800
32.9 % (1,170 ) (32.5 )%
International(b) 3,993
4,824
4,639
(831 ) (17.2 )% 185
4.0 %
Total 7,224
7,255
8,240
(31 ) (0.4 )% (985 ) (12.0 )%
Non-agricultural 554
671
732
(117 ) (17.4 )% (61 ) (8.3 )%
Total Potash Segment Tonnes 7,778
7,926
8,972
(148 ) (1.9 )% (1,046 ) (11.7 )%
Average selling price per tonne (FOB plant):
MOP - North America(c) $ 174
$ 313
$ 325
$ (139 ) (44.4 )% $ (12 ) (3.7 )%
MOP - International 158
239
226
(81 ) (33.9 )% 13
5.8 %
MOP - Average(d) 176
273
279
(97 ) (35.5 )% (6 ) (2.2 )%
Production volume (in thousands of metric
tonnes) 7,596
8,410
8,165
(814 ) (9.7 )% 245
3.0 %
______________________________
(a) Gross margin (excluding CRT), a non-GAAP measure, is calculated as GAAP gross margin less Canadian resource taxes
("CRT"). Gross margin (excluding CRT) as a percentage of net sales is calculated as GAAP gross margin less CRT,
12
divided by net sales. Gross margin (excluding CRT) and gross margin (excluding CRT) as a percentage of net sales
provide measures that we believe enhance the reader's ability to compare our GAAP gross margin with that of other
companies that incur CRT expense and classify it in a manner differently than we do in their statements of earnings.
Because securities analysts, investors, lenders and others use gross margin, our management believes that our
presentation of gross margin (excluding CRT) and gross margin (excluding CRT) as a percentage of sales for our Potash
segment affords them greater transparency in assessing our financial performance against competitors' gross margin
(excluding CRT). A reconciliation of the GAAP and non-GAAP measures is found on page 21.
(b) Includes sales volumes to our International Distribution segment.
(c) This price excludes industrial and feed selling prices which are typically at a lag due to the nature of the contracts.
(d) This price includes industrial and feed sales.
Year Ended December 31, 2016, compared to Year Ended December 31, 2015
The Potash segment’s net sales decreased to $1.7 billion for the year ended December 31, 2016, compared to $2.4 billion in
the same period a year ago. The decrease was primarily due to significantly lower average selling prices that resulted in a
decrease in net sales of approximately $810 million. Although overall sales volumes were down in 2016 compared to 2015,
the current year sales mix resulted in a favorable impact on net sales of approximately $50 million, as we had an increase in
our North America sales where prices were higher than international prices.
Our average MOP selling price was $176 per tonne for the year ended December 31, 2016, a decrease of $97 per tonne
compared with the same period a year ago due to the factors discussed in the Overview.
The Potash segment’s sales volumes decreased to 7.8 million tonnes for the year ended December 31, 2016, compared to 7.9
million tonnes in the same period a year ago driven by a decrease in International sales volumes, due to delays in settlement
of the China and India contracts in 2016. This was partially offset by an increase in North American sales due to high channel
inventories in 2015 and strong fall application season and the anticipation of price increases in the latter part of 2016.
Gross margin for the Potash segment decreased to $256.6 million in the current year, from $788.3 million in the prior year
period. Gross margin was negatively impacted by approximately $810 million related to lower selling prices, partially offset
by approximately $50 million due to sales mix as we had higher volumes in North America compared to the prior year. Gross
margin was also favorably impacted by approximately $70 million due to the benefit of a weaker Canadian dollar and our
cost-saving initiatives partially offset by the unfavorable impact of higher fixed costs absorption compared to the prior year.
These and other factors affecting gross margin and costs are further discussed below. As a result of all of these factors, gross
margin as a percentage of net sales decreased to 15.2% for the year ended December 31, 2016, compared to 32.2% for the
same period a year ago.
We incurred $153.4 million in expenses, including depreciation on brine assets, at our Esterhazy mine and $12.0 million in
capital expenditures related to managing the brine inflows at our Esterhazy mine in 2016, compared to $165.7 million and
$35.1 million, respectively, in 2015. We have been effectively managing the brine inflows at Esterhazy since 1985, and from
time to time we experience changes to the amounts and patterns of brine inflows. Inflows continue to be within the range of
our historical experience. Brine inflow expenditures continue to reflect the cost of addressing changing inflow patterns,
including inflows from below our mine workings, which can be more complex and costly to manage, as well as costs
associated with horizontal drilling.
The Esterhazy mine has significant brine storage capacity. Depending on inflow rates, pumping and disposal rates, and other
variables, the volume of brine stored in the mine may change significantly from period to period. In general, the higher the
level of brine stored in the mine, the less time available to mitigate new or increased inflows that exceed our capacity for
pumping or disposal of brine outside the mine, and therefore the less time to avoid flooding and/or loss of the mine. Our past
investments in remote injection and increased pumping capacities facilitate our management of the brine inflows and the
amount of brine stored in the mine.
13
We incurred $101.1 million in Canadian resource taxes for the year ended December 31, 2016, compared with $248.0
million in the same period of the prior year. These taxes decreased due to lower realized prices and profitability in the current
year. Also in the prior year, changes in Saskatchewan resource tax law resulted in higher taxes as discussed below. Royalty
expense decreased to $20.5 million for the current year, compared to $33.3 million for the prior year due to lower selling
prices and lower production in 2016.
For the year ended December 31, 2016, potash production was 7.6 million tonnes compared to 8.4 million tonnes in the prior
year period. Our operating rate for potash production was 72% for 2016 compared to 80% for 2015, as we took steps to scale
our operations and idled our Colonsay, Saskatchewan potash mine for the second half of 2016 in light of reduced customer
demand. This enabled us to better manage our inventory levels and control costs.
Year Ended December 31, 2015, compared to Year Ended December 31, 2014
The Potash segment’s net sales decreased to $2.4 billion for the year ended December 31, 2015, compared to $2.9 billion in
for the year ended 2014. The decrease was primarily due to lower sales volumes that resulted in a decrease in net sales of
approximately $440 million partially offset by a favorable impact of approximately $40 million from selling prices. Although
average selling prices were down in 2015 compared to 2014, prices had a favorable impact on net sales driven by the mix of
sales as international average selling prices were higher in 2015.
Our average MOP selling price was $273 per tonne for the year ended December 31, 2015, a decrease of $6 per tonne
compared with the same period of 2014. After declining in the first quarter of 2014, potash prices rebounded and continued to
rise throughout 2014, led by increasing demand in Brazil, China and India. Potash prices started trending down in 2015 due
to lower commodity prices, global economic conditions and foreign exchange volatility, especially in Brazil. In addition,
higher supply as a result one of our competitors completing a proving run in late 2015, and higher supply of imports at lower
prices due to lower costs for foreign producers as a result of favorable foreign exchange rates in certain countries, resulted in
additional pricing pressure.
The Potash segment’s sales volumes decreased to 7.9 million tonnes for the year ended December 31, 2015, compared to 9.0
million tonnes in 2014, due to the factors discussed in the Overview.
Potash gross margin decreased to $788.3 million in 2015, from $923.2 million for the year ended December 31, 2014. Gross
margin was negatively impacted by approximately $195 million from the decrease in sales volumes, partially offset by a
favorable impact of approximately $40 million from our average selling prices. Lower production costs also had a positive
impact of approximately $100 million on gross margin, including the benefits from a weaker Canadian dollar, higher
production, which resulted in higher fixed cost absorption, and cost-saving initiatives. The average value of the Canadian
dollar decreased by approximately 14% in 2015 compared to 2014, which reduced our expenses. These and other factors
affecting gross margin are further discussed below. As a result of these factors, gross margin as a percentage of net sales
was 32% for the years ended December 31, 2015, and 2014.
We incurred $165.7 million in expenses, including depreciation on brine assets, and $35.1 million in capital expenditures
related to managing the brine inflows at our Esterhazy mine in 2015, compared to $181.6 million and $19.7 million,
respectively, in 2014.
We incurred $248.0 million in Canadian resource taxes for the year ended December 31, 2015, compared with $168.4 million
in 2014. These taxes increased due to lower deductions for capital expenditures primarily related to changes in Saskatchewan
resource tax law in 2015. We incurred $33.3 million in royalties in the year ended December 31, 2015, compared to $26.6
million in the year ended December 31, 2014 due to higher production.
For the year ended December 31, 2015, potash production was 8.4 million tonnes compared to 8.2 million tonnes in the year
ended December 31, 2014. In the first half of 2015, our operating rate for potash production was 92% as we increased
production to rebuild inventory levels which were low from strong sales at the end of 2014, compared to an operating rate of
14
73% in the first half of 2014. In the second half of 2015, our operating rate was 69%, compared to an operating rate of 79%
in the second half of 2014 when we were completing a proving run at our Colonsay, Saskatchewan mine.
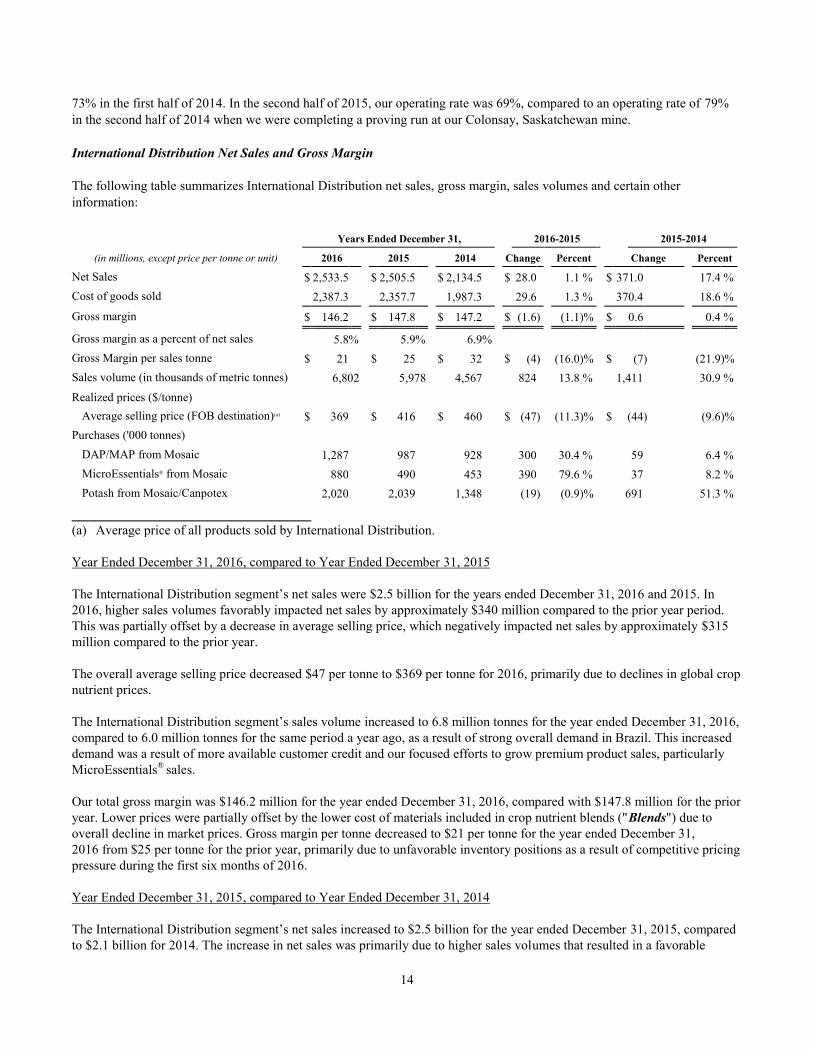
International Distribution Net Sales and Gross Margin
The following table summarizes International Distribution net sales, gross margin, sales volumes and certain other
information:
Years Ended December 31, 2016-2015 2015-2014
(in millions, except price per tonne or unit) 2016 2015 2014 Change Percent Change Percent
Net Sales $ 2,533.5
$ 2,505.5
$ 2,134.5
$ 28.0
1.1 % $ 371.0
17.4 %
Cost of goods sold 2,387.3
2,357.7
1,987.3
29.6
1.3 % 370.4
18.6 %
Gross margin $ 146.2
$ 147.8
$ 147.2
$ (1.6 ) (1.1 )% $ 0.6
0.4 %
Gross margin as a percent of net sales 5.8 % 5.9 % 6.9 %
Gross Margin per sales tonne $ 21
$ 25
$ 32
$ (4 ) (16.0 )% $ (7 ) (21.9 )%
Sales volume (in thousands of metric tonnes) 6,802 5,978 4,567
824
13.8 % 1,411
30.9 %
Realized prices ($/tonne)
Average selling price (FOB destination)(a) $ 369
$ 416
$ 460
$ (47 ) (11.3 )% $ (44 ) (9.6 )%
Purchases ('000 tonnes)
DAP/MAP from Mosaic 1,287
987
928
300
30.4 % 59
6.4 %
MicroEssentials® from Mosaic 880
490
453
390
79.6 % 37
8.2 %
Potash from Mosaic/Canpotex 2,020
2,039
1,348
(19 ) (0.9 )% 691
51.3 %
______________________________ (a) Average price of all products sold by International Distribution.
Year Ended December 31, 2016, compared to Year Ended December 31, 2015
The International Distribution segment’s net sales were $2.5 billion for the years ended December 31, 2016 and 2015. In
2016, higher sales volumes favorably impacted net sales by approximately $340 million compared to the prior year period.
This was partially offset by a decrease in average selling price, which negatively impacted net sales by approximately $315
million compared to the prior year.
The overall average selling price decreased $47 per tonne to $369 per tonne for 2016, primarily due to declines in global crop
nutrient prices.
The International Distribution segment’s sales volume increased to 6.8 million tonnes for the year ended December 31, 2016,
compared to 6.0 million tonnes for the same period a year ago, as a result of strong overall demand in Brazil. This increased
demand was a result of more available customer credit and our focused efforts to grow premium product sales, particularly
MicroEssentials®
sales.
Our total gross margin was $146.2 million for the year ended December 31, 2016, compared with $147.8 million for the prior
year. Lower prices were partially offset by the lower cost of materials included in crop nutrient blends ("Blends") due to
overall decline in market prices. Gross margin per tonne decreased to $21 per tonne for the year ended December 31,
2016 from $25 per tonne for the prior year, primarily due to unfavorable inventory positions as a result of competitive pricing
pressure during the first six months of 2016.
Year Ended December 31, 2015, compared to Year Ended December 31, 2014
The International Distribution segment’s net sales increased to $2.5 billion for the year ended December 31, 2015, compared
to $2.1 billion for 2014. The increase in net sales was primarily due to higher sales volumes that resulted in a favorable
15
impact of approximately $650 million, partially offset by the negative impact from lower selling prices of
approximately $280 million compared to 2014.
The International Distribution segment’s sales volume increased to 6.0 million tonnes for the year ended December 31, 2015,
compared to 4.6 million tonnes for the same period of 2014, driven primarily by additional tonnes from the December 2014
ADM Acquisition in Brazil. The overall average selling price decreased $44 per tonne to $416 per tonne in the year ended
December 31, 2015, primarily due to a decline in the Brazilian price of materials included in Blends, and increased demand
for lower value products.
Total gross margin of $147.8 million for the year ended December 31, 2015, remained flat compared to 2014 due to lower
selling prices. The lower prices were offset by the lower cost of materials included in Blends and margins from increased
sales volumes as discussed above. Gross margin per tonne decreased to $25 per tonne for the year ended December 31, 2015,
from $32 per tonne for 2014, primarily due to lower margins in Brazil. The margins in Brazil in the current year were
unfavorably impacted by lower prices driven by weaker demand as a result of lack of access to credit, lower commodity
prices and volatility in the Brazilian real.
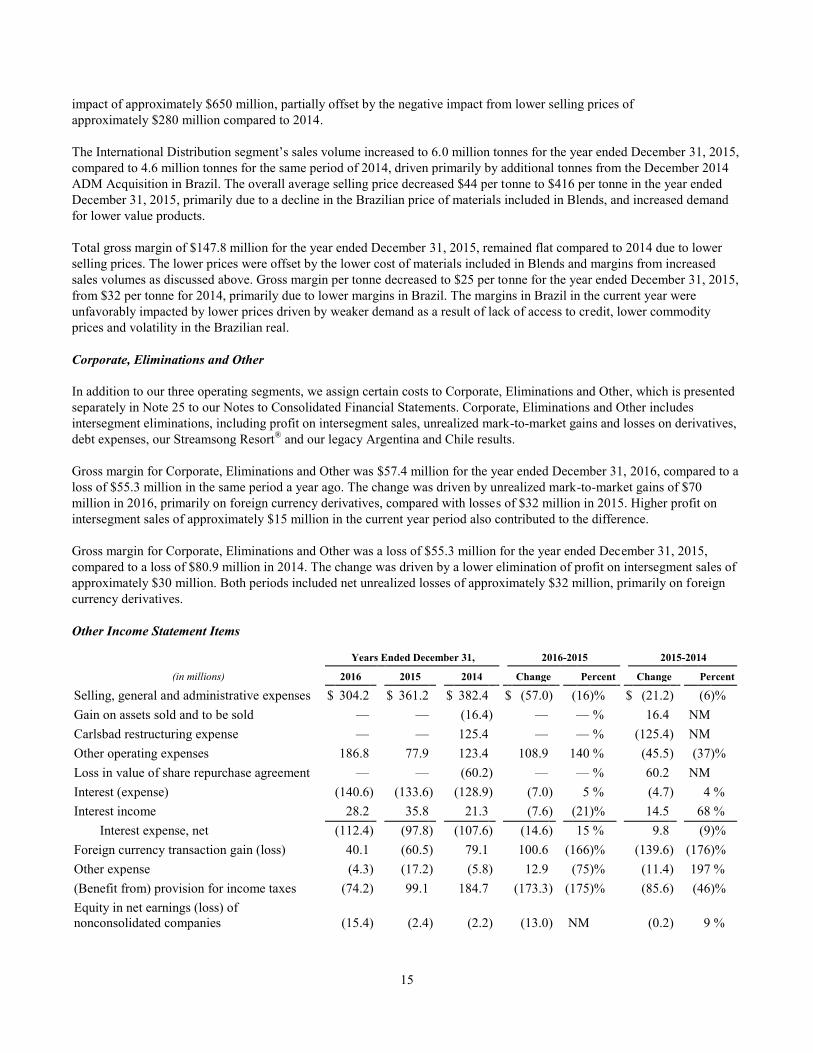
Corporate, Eliminations and Other
In addition to our three operating segments, we assign certain costs to Corporate, Eliminations and Other, which is presented
separately in Note 25 to our Notes to Consolidated Financial Statements. Corporate, Eliminations and Other includes
intersegment eliminations, including profit on intersegment sales, unrealized mark-to-market gains and losses on derivatives,
debt expenses, our Streamsong Resort® and our legacy Argentina and Chile results.
Gross margin for Corporate, Eliminations and Other was $57.4 million for the year ended December 31, 2016, compared to a
loss of $55.3 million in the same period a year ago. The change was driven by unrealized mark-to-market gains of $70
million in 2016, primarily on foreign currency derivatives, compared with losses of $32 million in 2015. Higher profit on
intersegment sales of approximately $15 million in the current year period also contributed to the difference.
Gross margin for Corporate, Eliminations and Other was a loss of $55.3 million for the year ended December 31, 2015,
compared to a loss of $80.9 million in 2014. The change was driven by a lower elimination of profit on intersegment sales of
approximately $30 million. Both periods included net unrealized losses of approximately $32 million, primarily on foreign
currency derivatives.
Other Income Statement Items
Years Ended December 31, 2016-2015 2015-2014
(in millions) 2016 2015 2014 Change Percent Change Percent
Selling, general and administrative expenses $ 304.2
$ 361.2
$ 382.4
$ (57.0 ) (16 )% $ (21.2 ) (6 )%
Gain on assets sold and to be sold —
—
(16.4 ) —
— % 16.4
NM
Carlsbad restructuring expense —
—
125.4
—
— % (125.4 ) NM
Other operating expenses 186.8
77.9
123.4
108.9
140 % (45.5 ) (37 )%
Loss in value of share repurchase agreement —
—
(60.2 ) —
— % 60.2
NM
Interest (expense) (140.6 ) (133.6 ) (128.9 ) (7.0 ) 5 % (4.7 ) 4 %
Interest income 28.2
35.8
21.3
(7.6 ) (21 )% 14.5
68 %
Interest expense, net (112.4 ) (97.8 ) (107.6 ) (14.6 ) 15 % 9.8
(9 )%
Foreign currency transaction gain (loss) 40.1
(60.5 ) 79.1
100.6
(166 )% (139.6 ) (176 )%
Other expense (4.3 ) (17.2 ) (5.8 ) 12.9
(75 )% (11.4 ) 197 %
(Benefit from) provision for income taxes (74.2 ) 99.1
184.7
(173.3 ) (175 )% (85.6 ) (46 )%
Equity in net earnings (loss) of
nonconsolidated companies (15.4 ) (2.4 ) (2.2 ) (13.0 ) NM
(0.2 ) 9 %
16
Selling, General and Administrative Expenses
Over the past three years, our selling, general and administrative expenses have decreased, despite the CF Phosphate Assets
Acquisition and ADM Acquisition, in part as a result of successful initiatives to reduce support function costs. Selling,
general and administrative expenses were $304.2 million for the year ended December 31, 2016, compared to $361.2
million for the same period a year ago. The additional benefit of cost reduction initiatives in 2016 was approximately $30
million more than 2015. Lower incentive compensation for the year ended December 31, 2016, of approximately $20 million
compared to the same period in the prior year also contributed to lower expenses. In addition, selling, general and
administrative expenses in 2015 included integration costs related to the ADM Acquisition of approximately $11 million.
Selling, general and administrative expenses were $361.2 million for the year ended December 31, 2015, compared to $382.4
million for the same period in 2014. The year ended December 31, 2014, included costs of approximately $15 million
associated with an additional incentive grant, and integration costs from the CF Phosphate Assets Acquisition and costs
related to the exit from our distribution businesses in Argentina and Chile for an aggregate amount of approximately $17
million.
Gain on Assets Sold and To Be Sold
The gain on assets sold and to be sold of $16.4 million for the year ended December 31, 2014, includes a gain of $13.5
million from the sale of our salt operations at our Hersey, Michigan mine, combined with a gain of $8.5 million from the sale
of our distribution business in Argentina as the final sales prices of both were higher than previously estimated. This was
partially offset by a loss of $5.6 million related to the closure of our Chile distribution business.
Carlsbad Restructuring Expense
The Carlsbad restructuring expense of $125.4 million for the year ended December 31, 2014, was related to our decision to
permanently discontinue production of MOP at our Carlsbad, New Mexico facility. Further information regarding this action
is included in Note 23 of our Notes to Consolidated Financial Statements.
Other Operating Expenses
Other operating expenses were $186.8 million for the year ended December 31, 2016, compared to $77.9 million for the prior
year period. Other operating expenses typically consist of four major categories: 1) Asset Retirement Obligations (“AROs”)
2) environmental and legal reserves, 3) insurance reimbursements and 4) gain/loss on fixed assets. The increase in the current
year compared to the prior year is primarily due to an expense of $70 million related to our reserve for estimated costs
associated with a sinkhole that formed at our New Wales phosphate production facility in Florida, which is discussed further
in Note 21 to our Consolidated Financial Statements. The increase in 2016 is also attributable to a loss of $43 million related
to the cancellation of construction of a barge intended to transport ammonia as further explained in Note 16 of our Notes to
our Consolidated Financial Statements, and $19 million of severance costs related to organizational restructuring, partially
offset by the receipt of approximately $28 million in insurance proceeds related to a warehouse roof collapse at our Carlsbad,
New Mexico location in 2014.
Other operating expenses were $77.9 million for the year ended December 31, 2015, compared to $123.4 million for the prior
year period. The decrease in expenses was primarily due to nonrecurring costs in 2014 of approximately $11 million related
to the wind down of operations at our Hookers Prairie, Florida phosphates mine and $14 million related to the settlement of
certain legal matters. In 2015 we also had a sales and use tax refund of approximately $9 million.
Loss in Value of Share Repurchase Agreement
The change in value of share repurchase agreement in 2014 was related to the remeasurement of our share repurchase
obligation under the Share Repurchase Agreements to its then-present value. For the year ended December 31, 2014, we had
a loss of $60.2 million.
17
Foreign Currency Transaction Gain (Loss)
In 2016, we recorded a foreign currency transaction gain of $40.1 million. The gain was mainly the result of the weakening
of the U.S. dollar relative to the Canadian dollar on significant U.S. dollar-denominated intercompany loans and the
weakening of the U.S. dollar relative to the Brazilian real on significant U.S. dollar-denominated payables.
In 2015, we recorded a foreign currency transaction loss of $60.5 million. The loss was mainly due to the strengthening of the
U.S. dollar relative to the Brazilian real on significant U.S. dollar-denominated payables held by our Brazilian subsidiaries.
During 2015, we entered into U.S. dollar-denominated intercompany debt held by our Canadian affiliates which more than
offset gains on our U.S. dollar-denominated intercompany receivables and U.S. dollar cash held by our Canadian affiliates.
We recorded a foreign currency gain of $79.1 million for the year ended December 31, 2014. The foreign currency
transaction gain was primarily the result of the strengthening of the U.S. dollar relative to the Canadian dollar on significant
U.S. dollar denominated intercompany receivables and cash held by certain of our Canadian subsidiaries, partially offset by
the effect of the strengthening of the U.S. dollar relative to the Brazilian real on significant U.S. dollar denominated payables
held by our Brazilian subsidiaries.
Other Expense
For the year ended December 31, 2016, we had other expense of $4.3 million compared with $17.2 million for the prior year.
The current year includes realized losses from investments held by the RCRA Trusts of $10 million, partially offset by the
gain on sale of an equity investment of approximately $7 million. The expense for the year ended December 31, 2015,
includes the write down of an equity investment of approximately $8 million.
Equity in Net Loss of Nonconsolidated Companies
For the year ended December 31, 2016, we had a loss from equity of nonconsolidated companies of $15.4 million, net of tax,
compared to loss of $2.4 million, net of tax, for the prior year. The loss in the current year is due to the decision by Canpotex
not to proceed with construction of a new export terminal at the Port of Prince Rupert in British Columbia, as Canpotex
determined it currently has sufficient port access and terminal capacity options to meet its needs. Mosaic's share of the loss
was $24 million, or $16 million net of tax.
(Benefit from) Provision for Income Taxes
Effective Tax Rate
Provision for Income Taxes
Year Ended December 31, 2016 (30.6 )% $ (74.2 )
Year Ended December 31, 2015 9.0 % 99.1
Year Ended December 31, 2014 15.2 % 184.7
For all years our income tax is impacted by the mix of earnings across jurisdictions in which we operate, by a benefit
associated with depletion, and by the impact of certain entities being taxed in both their foreign jurisdiction and the US
including foreign tax credits for various taxes incurred.
In the year ended December 31, 2016, tax expense specific to the period included a benefit of $54.2 million, which includes a
domestic benefit of $85.8 million related to the resolution of an Advanced Pricing Agreement, which is a tax treaty-based
process, partially offset by a $23.3 million expense related to distributions from certain non-U.S. subsidiaries and $8.3
million of expense primarily related to share-based excess cost. For further information, please see Note 12 to our Notes to
Consolidated Financial Statements.
During 2016, our income tax rate was favorably impacted by the mix of earnings across the jurisdictions in which we operate
and by a benefit associated with depletion when compared to the year ended December 31, 2015. Exclusive of the items
18
noted above, our income tax rate for 2016 is lower compared to 2015 because our deductions are relatively fixed in dollars,
while our profitability has been reduced; therefore, the deductions are a larger percentage of income.
Income tax expense for the year ended December 31, 2015, was $99.1 million, an effective tax rate of 9.0% on pre-tax
income of $1.1 billion. The tax rate included a benefit of $46.6 million, which consists of the resolution of certain state tax
matters that resulted in a benefit of $18.4 million, a benefit of $14.5 million primarily related to changes in estimates
associated with an Advanced Pricing Agreement, which is a tax treaty-based process, a benefit of $6.2 million related to
losses on the sale of our distribution business in Chile and the reduction in the tax rate for one of our equity method
investments that resulted in a benefit of $7.5 million.
Income tax expense for the year ended December 31, 2014, was $184.7 million, an effective tax rate of 15.2% on pre-tax
income of $1.2 billion. The tax rate was favorably impacted by $53.6 million related to losses on the sale of our distribution
business in Argentina, $8.1 million related to the settlement of certain non-U.S. tax matters, and two items related to the
ADM Acquisition: $47.0 million as a result of a change in the tax status of a Brazilian subsidiary and a $32.8 million
valuation allowance reduction primarily related to net operating losses at a Brazilian subsidiary. The tax rate was negatively
impacted by $81.0 million as a result of our decision that our earnings were not permanently re-invested in certain non-U.S.
subsidiaries. Additionally, during 2014, we recorded $51.9 million of tax benefit related to the $125.4 million pre-tax charges
resulting from the decision to permanently discontinue production of MOP at our Carlsbad, New Mexico facility.
Non-GAAP Reconciliation
Years Ended December 31,
2016 2015 2014
Sales $ 1,685.7
$ 2,447.0
$ 2,851.6
Gross margin 256.6
788.3
923.2
Canadian resource taxes 101.1
248.0
168.4
Gross margin, (excluding CRT) $ 357.7
$ 1,036.3
$ 1,091.6
Gross margin (excluding CRT) as a percentage of net sales 21.2 % 42.3 % 38.3 %
In addition to gross margin for the Potash segment, we have presented in the Management's Analysis above, gross margin
(excluding CRT), calculated as GAAP gross margin less Canadian resource taxes ("CRT"), and gross margin (excluding
CRT) as a percentage of net sales, calculated as GAAP gross margin less CRT, divided by sales. Each is a non-GAAP
financial measure. Generally, a non-GAAP financial measure is a supplemental numerical measure of a company’s
performance, financial position or cash flows that either excludes or includes amounts that are not normally excluded or
included in the most directly comparable measure calculated and presented in accordance with U.S. generally accepted
accounting principles (“GAAP”). Neither gross margin (excluding CRT) nor gross margin (excluding CRT) as a percentage
of net sales is a measure of financial performance under GAAP. Because not all companies use identical calculations,
investors should consider that Mosaic’s calculation may not be comparable to other similarly titled measures presented by
other companies.
Gross margin (excluding CRT) and gross margin (excluding CRT) as a percentage of net sales provide measures that we
believe enhances the reader’s ability to compare our gross margin with that of other peer companies that incur CRT expense
and classify it in a manner differently than we do in their statement of earnings. Because securities analysts, investors, lenders
and others use gross margin (excluding CRT), our management believes that our presentation of gross margin (excluding
CRT) for Potash affords them greater transparency in assessing our financial performance against competitors. When
measuring the performance of our Potash business, our management regularly utilizes gross margin before CRT. Neither
gross margin (excluding CRT) nor gross margin (excluding CRT) as a percentage of net sales, should be considered as a
substitute for, or superior to, measures of financial performance prepared in accordance with GAAP.
19
Critical Accounting Estimates
We prepare our Consolidated Financial Statements in conformity with accounting principles generally accepted in the United
States of America which requires us to make various judgments, estimates and assumptions that could have a significant
impact on our reported results and disclosures. We base these estimates on historical experience and other assumptions
believed to be reasonable at the time we prepare our financial statements. Changes in these estimates could have a material
effect on our Consolidated Financial Statements.
Our significant accounting policies can be found in Note 2 of our Notes to Consolidated Financial Statements. We believe the
following accounting policies include a higher degree of judgment and complexity in their application and are most critical to
aid in fully understanding and evaluating our reported financial condition and results of operations.
Recoverability of Long-Lived Assets including Goodwill
Assessing the potential impairment of long-lived assets, including our investments in unconsolidated subsidiaries, is an
integral part of our normal ongoing review of operations. These assessments involve estimates that require significant
management judgment, and include inherent uncertainties that are often interdependent and do not change in isolation.
Factors that management must estimate include, among others, industry and market conditions, the economic life of the asset,
sales volume and prices, inflation, raw materials costs, cost of capital, tax rates and capital spending. These factors are even
more difficult to predict when global financial and commodity markets are highly volatile. Further, our Company faces many
uncertainties and risks related to various economic, political and regulatory environments in the countries in which we
operate. Refer to “Item 1A. Risk Factors” in Part I of our annual report on Form 10-K for 2016.
As mentioned above, these factors do not change in isolation; therefore, it is not practicable to present the impact of changing
a single factor. If management uses different assumptions or if different conditions occur in future periods, future impairment
charges could result and could be material. Impairments generally would be non-cash charges. During the years
ended December 31, 2016, 2015, and 2014, no material impairments were indicated for Mosaic’s asset groups, other than
strategic decisions where we have recorded charges as previously disclosed.
The carrying value of goodwill in our reporting units is tested annually as of October 31st for possible impairment. We
typically use an income approach valuation model, representing present value of future cash flows, to determine the fair value
of a reporting unit. Growth rates for sales and profits are determined using inputs from our annual strategic and long range
planning process. The rates used to discount projected future cash flows reflect a weighted average cost of capital based on
the Company’s industry, capital structure and risk premiums including those reflected in the current market capitalization.
When preparing these estimates, management considers each reporting unit’s historical results, current operating trends, and
specific plans in place. These estimates are impacted by various factors including inflation, the general health of the economy
and market competition. In addition, events and circumstances that might be indicators of possible impairment are assessed
during other interim periods. Due to market conditions over recent years, we have experienced a significant decline in our
market capitalization. As of October 31, 2016, the date of the annual impairment testing, the Company concluded that the fair
values of all reporting units were in excess of their respective carrying values and the goodwill for those units was not
impaired. While no impairment indicators were identified, due to the reduction of fair value in excess of carrying value there
is risk for future impairment if projected operating results are not met or other inputs into the fair value measurement
diminish. See Note 9 of our Notes to Consolidated Financial Statements for additional information regarding the goodwill
impairment analysis. As of December 31, 2016, we had $1.6 billion of goodwill.
Useful Lives of Depreciable Assets, Methods of Depreciation, and Rates of Depletion
We estimate initial useful lives of property, plant and equipment, and/or methods of depreciation, based on operational
experience, current technology, improvements made to the assets, and anticipated business plans. Factors affecting the fair
value of our assets, as noted above, may also affect the estimated useful lives of our assets and these factors can change.
Therefore, we periodically review the estimated remaining useful lives of our facilities and other significant assets and adjust
our depreciation rates prospectively where appropriate. As indicated in Note 2 of our Notes to Consolidated Financial
20
Statements we are in the process of changing to the units-of-production method of depreciation for certain assets and expect
to complete our assessment and discuss the impacts in the first quarter of 2017.
Depletion expenses for mining operations, including mineral reserves, are generally determined using the units-of-production
method based on estimates of recoverable reserves. These estimates may change based on new information regarding the
extent or quality of mineral reserves, permitting or changes in mining strategies.
Inventories
We review our inventory carrying amounts quarterly to determine if they exceed their estimated net realizable value.
Forecasted selling prices are a significant component in determining estimated net realizable value. As described in our
significant accounting policies, there are a number of demand and supply variables that can impact forecasted selling prices.
Additionally, judgment is involved in this analysis with estimating whether inventories will be sold as blends or other
products and the expected effects on costs. These factors do not change in isolation, and therefore, it is not practicable to
present the impact of changing a single factor.
Although we believe our judgments and estimates are reasonable, results could differ materially if actual selling prices differ
significantly from forecasted selling prices or if expected costs change significantly through the ultimate sale of inventory.
Charges for lower of cost or market adjustments, if any, are recognized in our Consolidated Statements of Earnings in the
period when there is evidence of a decline of market value below cost. During the years ended December 31, 2016, 2015,
and 2014 no material lower of cost or net realizable value inventory write-downs were indicated.
We allocate fixed expenses to the costs of production based on normal capacity, which refers to a range of production levels
and is considered the production expected to be achieved over a number of periods or seasons under normal circumstances,
taking into account the loss of capacity resulting from planned maintenance. Fixed overhead costs allocated to each unit of
production should not increase due to abnormally low production. Those excess costs are recognized as a current period
expense. When a production facility is completely shut down temporarily, it is considered “idle”, and all related expenses are
charged to cost of goods sold.
Environmental Liabilities and Asset Retirement Obligations
We record accrued liabilities for various environmental and reclamation matters including the demolition of former operating
facilities, and AROs.
Contingent environmental liabilities are described in Note 21 of our Notes to Consolidated Financial Statements. Accruals for
environmental matters are based primarily on third-party estimates for the cost of remediation at previously operated sites
and estimates of legal costs for ongoing environmental litigation. We regularly assess the likelihood of material adverse
judgments or outcomes, the effects of potential indemnification, as well as potential ranges or probability of losses. We
determine the amount of accruals required, if any, for contingencies after carefully analyzing each individual matter.
Estimating the ultimate settlement of environmental matters requires us to make complex and interrelated assumptions based
on experience with similar matters, our history, precedents, evidence, and facts specific to each matter. Actual costs incurred
in future periods may vary from the estimates, given the inherent uncertainties in evaluating environmental exposures. As
of December 31, 2016 and 2015, we had accrued $79.6 million and $25.6 million, respectively, for environmental matters.
As indicated in Note 13 of our Notes to Consolidated Financial Statements, we recognize AROs in the period in which we
have an existing legal obligation, and the amount of the liability can be reasonably estimated. We utilize internal engineering
experts as well as third-party consultants to assist management in determining the costs of retiring certain of our long-term
operating assets. Assumptions and estimates reflect our historical experience and our best judgments regarding future
expenditures. The assumed costs are inflated based on an estimated inflation factor and discounted based on a credit-adjusted
risk-free rate. For active facilities, fluctuations in the estimated costs (including those resulting from a change in
environmental regulations), inflation rates and discount rates can have a significant impact on the corresponding assets and
liabilities recorded in the Consolidated Balance Sheets. However, changes in the assumptions for our active facilities would
21
not have a significant impact on the Consolidated Statements of Earnings in the year they are identified. For closed facilities,
fluctuations in the estimated costs, inflation and discount rates have an impact on the Consolidated Statements of Earnings in
the year they are identified as there is no asset related to these items. Phosphate land reclamation activities generally occur
concurrently with mining operations; as such, we accrue and expense reclamation costs as we mine. As of December 31,
2016 and 2015, $849.9 million and $841.6 million, respectively, was accrued for AROs (current and noncurrent amounts). In
August 2016, Mosaic deposited $630 million into two trust funds as financial assurance to support certain estimated future
asset retirement obligations. See Note 13 of our Notes to Consolidated Financial Statements for additional information
regarding the EPA RCRA Initiative.
Pension Plans and Other Postretirement Benefits
The accounting for benefit plans is highly dependent on valuation of pension assets and actuarial estimates and assumptions.
The assumptions and actuarial estimates required to estimate the employee benefit obligations for pension plans and other
postretirement benefits include discount rate, expected salary increases, certain employee-related factors, such as turnover,
retirement age and mortality (life expectancy), expected return on assets and healthcare cost trend rates. We evaluate these
critical assumptions at least annually. Our assumptions reflect our historical experiences and our best judgments regarding
future expectations that have been deemed reasonable by management.
The judgments made in determining the costs of our benefit plans can impact our Consolidated Statements of Earnings. As a
result, we use actuarial consultants to assist management in developing reasonable assumptions and cost estimates. Actual
results in any given year will often differ from actuarial assumptions because of economic and other factors. The effects of
actual results differing from our assumptions are included as a component of other comprehensive income/(expense) as
unamortized net gains and losses, which are amortized into earnings over future periods. As of December 31, 2016 and
2015, we had $70.1 million and $75.7 million, respectively, accrued for pension and other postretirement benefit obligations.
Our pension and other postretirement benefits are further described in Note 17 of our Notes to Consolidated Financial
Statements.
Income Taxes
We make estimates for income taxes in three major areas: uncertain tax positions, valuation allowances, and U.S. deferred
income taxes on our non-U.S. subsidiaries' undistributed earnings.
Due to Mosaic’s global operations, we assess uncertainties and judgments in the application of complex tax regulations in a
multitude of jurisdictions. Future changes in judgment related to the expected ultimate resolution of uncertain tax positions
will affect earnings in the quarter of such change. While it is often difficult to predict the final outcome or the timing of
resolution of any particular uncertain tax position, our liabilities for income taxes reflect what we believe to be the more
likely than not outcome. We adjust these liabilities, as well as the related interest, in light of changing facts and
circumstances including negotiations with taxing authorities in various jurisdictions, outcomes of tax litigation, and
resolution of disputes arising from tax audits in the normal course of business. Settlement of any particular position may
require the use of cash. Based upon an analysis of tax positions taken on prior year returns and expected positions to be taken
on the current year return, management has identified gross uncertain income tax positions of $27.1 million as
of December 31, 2016.
A valuation allowance is provided for deferred tax assets for which it is more likely than not that the related tax benefits will
not be realized. Significant judgment is required in evaluating the need for and magnitude of appropriate valuation
allowances. The realization of the Company’s deferred tax assets is dependent on generating certain types of future taxable
income, using both historical and projected future operating results, the source of future income, the reversal of existing
taxable temporary differences, taxable income in prior carry-back years (if permitted) and the availability of tax planning
strategies. As of December 31, 2016 and 2015, we had a valuation allowance of $30.6 million and $11.9 million,
respectively. Changes in tax laws, assumptions with respect to future taxable income, tax planning strategies, resolution of
matters under tax audit and foreign currency exchange rates could result in adjustment to these allowances.
22
We have not recorded U.S. deferred income taxes on certain of our non-U.S. subsidiaries’ undistributed earnings as such
amounts are intended to be reinvested outside the United States indefinitely. Generally, such amounts become subject to U.S.
taxation upon the remittance of dividends and under certain other circumstances. It is not practicable to estimate the amount
of additional U.S. tax liabilities we would incur.
We have included a further discussion of income taxes in Note 12 of our Notes to Consolidated Financial Statements.
Litigation
Our operating results are affected by claims and judicial or administrative proceedings involving the Company, many of
which are incidental to the ordinary operation of the business, as described in Note 21 of our Notes to Consolidated Financial
Statements. We record accruals for such claims and proceedings when information available to us indicates it is probable that
a liability has been incurred and the amount of loss can be reasonably estimated. These accruals are established as part of an
ongoing assessment that takes into consideration such items as advice of legal counsel, developments in individual claims
and proceedings, changes in the law, changes in business focus, changes in the litigation environment, changes in opponent
strategy and tactics, ongoing discovery, and our experience in defending and settling similar claims. Adjustments to accruals,
recorded as needed in our Consolidated Statement of Earnings each quarter, are made to reflect changes in and current status
of these factors. While we have established what we currently believe are adequate accruals for pending legal matters, these
accruals frequently involve estimates based upon the current judgment of management and others and the final outcome or
potential settlement of litigation or other claims could differ materially from the recorded amounts.
Liquidity and Capital Resources
We define liquidity as the ability to generate or access adequate amounts of cash to meet current cash needs. We assess our
liquidity in terms of our ability to fund working capital requirements, fund sustaining and opportunity capital projects, pursue
strategic opportunities and capital management decisions which include making payments on and issuing indebtedness and
making distributions to our shareholders, either in the form of share repurchases or dividends. Our liquidity, to a certain
extent, is subject to general economic, financial, competitive and other factors that are beyond our control.
As of December 31, 2016, we had cash and cash equivalents of $0.7 billion, plus marketable securities held in trust to fund
future obligations of $0.6 billion, stockholders’ equity of $9.6 billion, long-term debt, including current maturities of $3.8
billion and short-term debt of $0.1 million. We have a target liquidity buffer of $2.5 billion, including cash and available
committed credit lines. We also target debt leverage ratios that are consistent with investment grade credit ratings. Our capital
allocation priorities include maintaining our investment grade rating and financial strength, sustaining our assets, including
ensuring the safety and reliability of our assets, investing to grow our business either through organic growth or taking
advantage of strategic opportunities and returning excess cash to shareholders, including paying our dividend. During 2016,
we invested $0.8 billion in capital expenditures and $220 million in MWSPC, and returned cash to shareholders through
share repurchases of $75 million (through the ASR as discussed in Note 18 of our Notes to Consolidated Financial
Statements) and cash dividends of $385.1 million.
All of our cash and cash equivalents are diversified in highly rated investment vehicles. Our cash and cash equivalents are
held either in the U.S. or held by non-U.S. subsidiaries and are not subject to significant foreign currency exposures, as the
majority are held in investments denominated in U.S. dollars as of December 31, 2016. These funds may create foreign
currency transaction gains or losses depending on the functional currency of the entity holding the cash. In addition, there are
no significant restrictions that would preclude us from bringing these funds back to the U.S.; however, there would be an
income tax expense impact on repatriating approximately $270 million of cash associated with certain undistributed earnings,
which are part of the permanently reinvested earnings discussed in Note 12 of our Notes to Consolidated Financial
Statements. We intend to use this cash for non-U.S. expansions and other investments outside the U.S.
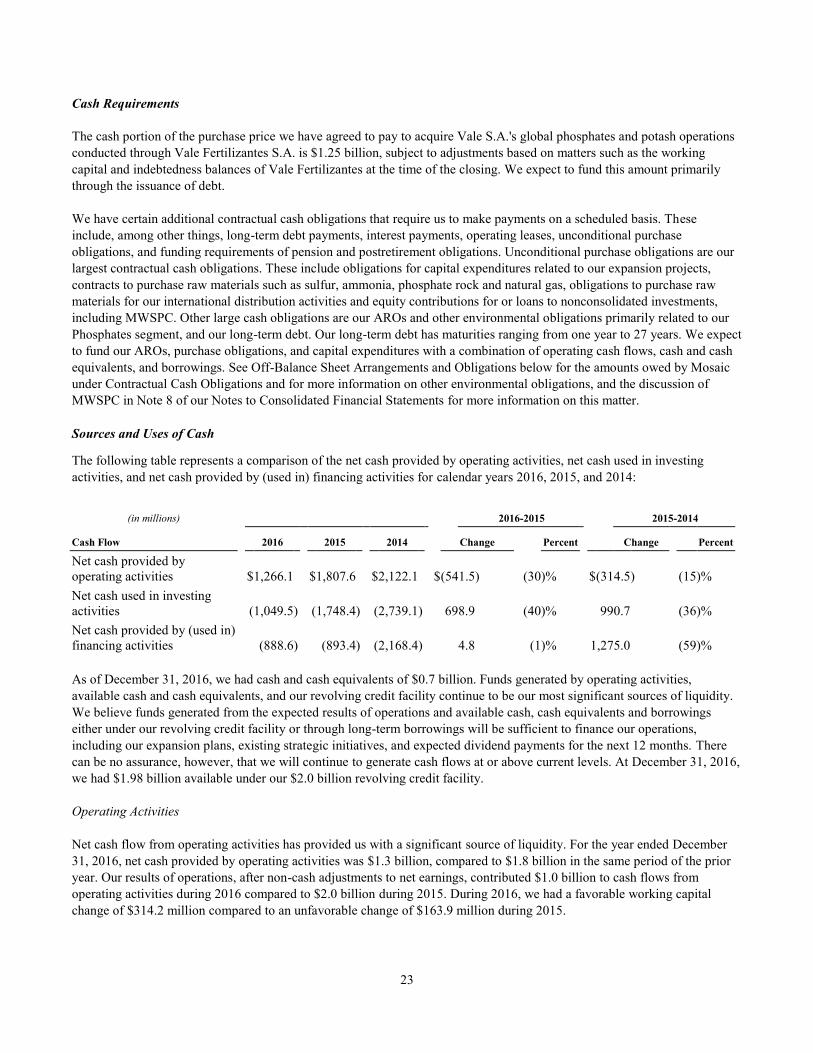
23
Cash Requirements
The cash portion of the purchase price we have agreed to pay to acquire Vale S.A.'s global phosphates and potash operations
conducted through Vale Fertilizantes S.A. is $1.25 billion, subject to adjustments based on matters such as the working
capital and indebtedness balances of Vale Fertilizantes at the time of the closing. We expect to fund this amount primarily
through the issuance of debt.
We have certain additional contractual cash obligations that require us to make payments on a scheduled basis. These
include, among other things, long-term debt payments, interest payments, operating leases, unconditional purchase
obligations, and funding requirements of pension and postretirement obligations. Unconditional purchase obligations are our
largest contractual cash obligations. These include obligations for capital expenditures related to our expansion projects,
contracts to purchase raw materials such as sulfur, ammonia, phosphate rock and natural gas, obligations to purchase raw
materials for our international distribution activities and equity contributions for or loans to nonconsolidated investments,
including MWSPC. Other large cash obligations are our AROs and other environmental obligations primarily related to our
Phosphates segment, and our long-term debt. Our long-term debt has maturities ranging from one year to 27 years. We expect
to fund our AROs, purchase obligations, and capital expenditures with a combination of operating cash flows, cash and cash
equivalents, and borrowings. See Off-Balance Sheet Arrangements and Obligations below for the amounts owed by Mosaic
under Contractual Cash Obligations and for more information on other environmental obligations, and the discussion of
MWSPC in Note 8 of our Notes to Consolidated Financial Statements for more information on this matter.
Sources and Uses of Cash
The following table represents a comparison of the net cash provided by operating activities, net cash used in investing
activities, and net cash provided by (used in) financing activities for calendar years 2016, 2015, and 2014:
(in millions) 2016-2015 2015-2014
Cash Flow 2016 2015 2014 Change Percent Change Percent
Net cash provided by
operating activities $ 1,266.1
$ 1,807.6
$ 2,122.1
$ (541.5 ) (30 )% $ (314.5 ) (15 )%
Net cash used in investing
activities (1,049.5 ) (1,748.4 ) (2,739.1 ) 698.9
(40 )% 990.7
(36 )%
Net cash provided by (used in)
financing activities (888.6 ) (893.4 ) (2,168.4 ) 4.8
(1 )% 1,275.0
(59 )%
As of December 31, 2016, we had cash and cash equivalents of $0.7 billion. Funds generated by operating activities,
available cash and cash equivalents, and our revolving credit facility continue to be our most significant sources of liquidity.
We believe funds generated from the expected results of operations and available cash, cash equivalents and borrowings
either under our revolving credit facility or through long-term borrowings will be sufficient to finance our operations,
including our expansion plans, existing strategic initiatives, and expected dividend payments for the next 12 months. There
can be no assurance, however, that we will continue to generate cash flows at or above current levels. At December 31, 2016,
we had $1.98 billion available under our $2.0 billion revolving credit facility.
Operating Activities
Net cash flow from operating activities has provided us with a significant source of liquidity. For the year ended December
31, 2016, net cash provided by operating activities was $1.3 billion, compared to $1.8 billion in the same period of the prior
year. Our results of operations, after non-cash adjustments to net earnings, contributed $1.0 billion to cash flows from
operating activities during 2016 compared to $2.0 billion during 2015. During 2016, we had a favorable working capital
change of $314.2 million compared to an unfavorable change of $163.9 million during 2015.
24
The change in assets and liabilities for the year ended December 31, 2016, was primarily driven by favorable impacts from
the changes in inventories of $263.0 million and other current and noncurrent assets of $245.7 million, partially offset by an
unfavorable impact from the change in accounts payable and accrued liabilities of $243.9 million. The change in inventories
was primarily related to the lower cost of raw material and inventory purchases in the current year. The change in other
current and noncurrent assets was driven by a decrease in the balance of final price deferred product and a decrease in income
tax receivable. The balance of our final price deferred product decreased during 2016 as rising prices late in the year caused
customers to price product at the end of 2016. Income taxes receivable decreased due to the receipt of a refund for income
taxes in 2016. The unfavorable impact in accounts payable was primarily due to our International Distribution business and
the timing of payments.
The change in working capital for the year ended December 31, 2015, was primarily driven by an unfavorable impact from
the change in other current and noncurrent assets of $313.3 million, mostly offset by a favorable impact from the change in
accounts payable of $301.8 million. The change in other current and noncurrent assets was driven by an increase in the
balance of final price deferred product and an increase in income tax receivable. The balance of our final price deferred
product increased during 2015 from a low level in December 2014 as rising prices caused customers to price product at the
end of 2014. Income taxes receivable increased due to the overpayment of estimated payments in 2015. The favorable impact
in accounts payable was primarily due to our International Distribution business and the timing of payments as we have
extended terms in Brazil.
For the year ended December 31, 2014, cash flows from operating activities were favorably impacted by the change in
working capital. This was driven by a decrease in other current assets and noncurrent assets and an increase in accounts
payable, partially offset by increases in accounts receivable and inventories. Other current and noncurrent assets decreased by
$457.7 million driven by a decrease in our income tax receivable due to the application of prior year tax refunds against
current year tax liabilities, resulting in paying less cash for taxes. It was also driven by a decline in the balance of final price
deferred products as many of these priced in December 2014, and a decrease in working capital levels of Argentina and
Chile. Accounts payable increased by $105.6 million primarily due to the timing of payments for inventory purchases in
Brazil that had not been paid for at December 31, 2014. Accounts receivable increased by $226.5 million primarily due to
higher sales in December 2014 compared to December 2013. Inventories increased by $129.7 million due to the higher cost
of raw materials used in our phosphates products in 2014.
Investing Activities
Net cash used in investing activities for the year ended December 31, 2016, was $1.0 billion, compared to $1.7 billion in the
same period a year ago. Included in net cash used in investing activities in the current year period is an investment of $220.0
million in MWSPC compared to $225.2 million during 2015. In addition, we invested $169.0 million in an affiliate in the
current year, for the construction of vessels intended to transport anhydrous ammonia, primarily for Mosaic’s operations, as
discussed in Note 16 of our Notes to Consolidated Financial Statements in this report. In the current year period, we had
capital expenditures of $843.1 million, compared to $1.0 billion in the prior year period. Also, in 2016, approximately $200
million, previously held in the Plant City Trust, was released to us after we arranged for substitute financial assurance
through delivery of a surety bond by insurance companies as discussed in Note 13 of our Notes to Consolidated Financial
Statements.
Net cash used in investing activities for the year ended December 31, 2015, was $1.7 billion, compared to $2.7 billion in the
same period a year ago. Included in net cash used in investing activities in 2015 was $630 million, which had been classified
as restricted cash included in other assets in our Consolidated Balance Sheet. This cash was placed into trust funds in August
2016, as financial assurance to support certain estimated future AROs, as discussed in Note 13 of our Notes to Consolidated
Financial Statements. In 2015, we had higher capital expenditures of $1.0 billion compared with $0.9 billion in the prior year
period, due to higher opportunity capital project spending. Also, in 2015, we received $47.9 million related to a working
capital adjustment from our ADM Acquisition and invested $225.2 million in MWSPC.
Net cash used in investing activities for the year ended December 31, 2014, was $2.7 billion. In 2014, we completed the CF
Phosphate Assets Acquisition and the ADM Acquisition for approximately $1.7 billion and invested $154.6 million in
25
MWSPC. Capital expenditures decreased by $497.5 million due to lower Potash expansion spending and the timing of
maintenance capital.
Financing Activities
Net cash used in financing activities was $0.9 billion for the years ended December 31, 2016 and 2015, respectively. Cash
used in financing activities for 2016 reflected net payments for structured accounts payable of $358.6 million and dividends
paid of $385.1 million. During the current year period, we also purchased shares of our common stock for
approximately $75.0 million under our 2015 Repurchase Program.
Net cash used in financing activities for the year ended December 31, 2015, was $0.9 billion, compared to $2.2 billion for the
year ended December 31, 2014. Cash used in financing activities primarily reflected shares repurchased during the year, for
an aggregate of approximately $709.5 million, and dividends paid of $384.7 million. These were partially offset by net
proceeds from structured accounts payable arrangements of $239.5 million in 2015.
Net cash used in financing activities for the year ended December 31, 2014, was $2.2 billion. Cash used in financing
activities primarily reflected shares repurchased during the year for an aggregate of approximately $2.8 billion, and dividends
paid of $382.5 million, partially offset by proceeds of $800 million from our 2014 term loan facility.
Debt Instruments, Guarantees and Related Covenants
See Note 10 of our Notes to Consolidated Financial Statements for additional information relating to our financing
arrangements, which is hereby incorporated by reference.
Financial Assurance Requirements
In addition to various operational and environmental regulations primarily related to our Phosphates segment, we incur
liabilities for reclamation activities under which we are subject to financial assurance requirements. In various jurisdictions in
which we operate, particularly Florida and Louisiana, we are required to pass a financial strength test or provide credit
support, typically in the form of cash deposits, surety bonds or letters of credit. See Other Commercial Commitments under
Off-Balance Sheet Arrangements and Obligations and Note 21 of our Notes to Consolidated Financial Statements for
additional information about these requirements.
Off-Balance Sheet Arrangements and Obligations
Off-Balance Sheet Arrangements
In accordance with the definition under rules of the Securities and Exchange Commission (“SEC”), the following qualify as
off-balance sheet arrangements:
• certain obligations under guarantee contracts that have “any of the characteristics identified in Financial Accounting
Standards Board (“FASB”) Accounting Standards Codification (“ASC”) paragraph ASC 460-10-15-4 (Guarantees
Topic)”;
• a retained or contingent interest in assets transferred to an unconsolidated entity or similar arrangement that serves
as credit, liquidity or market risk support to that entity for such assets;
• any obligation, including a contingent obligation, under a contract that would be accounted for as derivative
instruments except that it is both indexed to the registrant’s own stock and classified as equity; and
• any obligation, arising out of a variable interest in an unconsolidated entity that is held by, and material to, the
registrant, where such entity provides financing, liquidity, market risk or credit risk support to the registrant, or
engages in leasing, hedging or research and development services with the registrant.
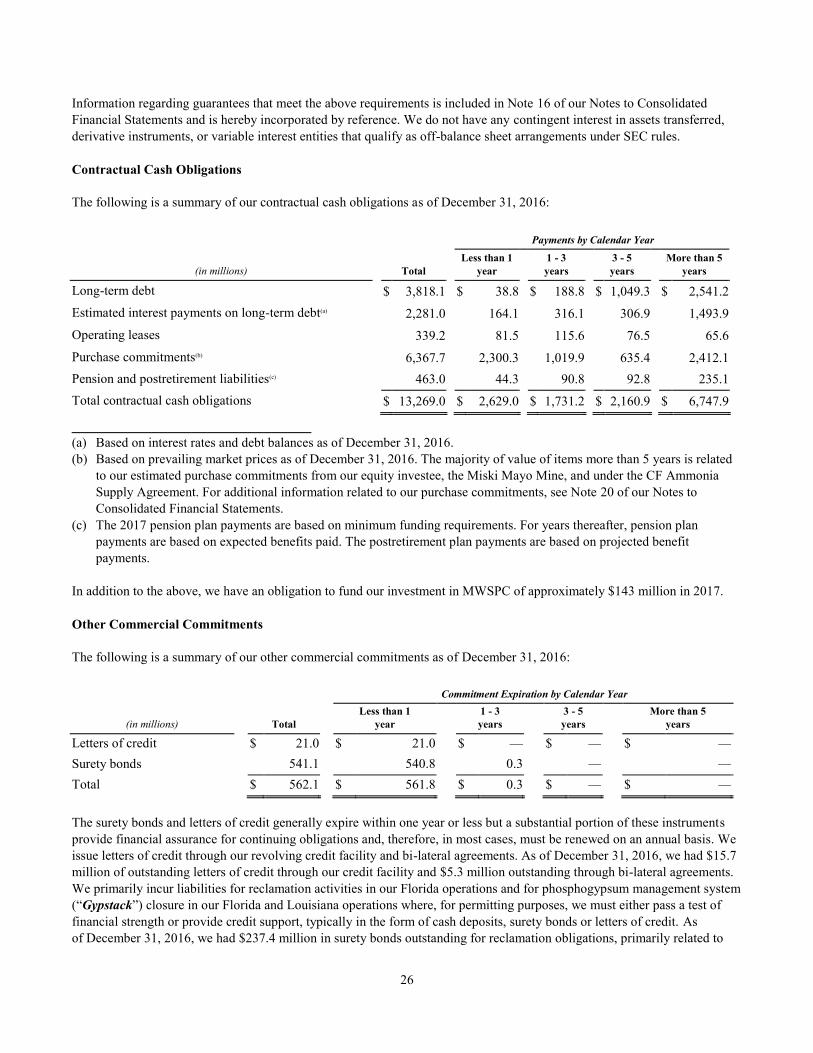
26
Information regarding guarantees that meet the above requirements is included in Note 16 of our Notes to Consolidated
Financial Statements and is hereby incorporated by reference. We do not have any contingent interest in assets transferred,
derivative instruments, or variable interest entities that qualify as off-balance sheet arrangements under SEC rules.
Contractual Cash Obligations
The following is a summary of our contractual cash obligations as of December 31, 2016:
Payments by Calendar Year
(in millions) Total Less than 1
year 1 - 3
years 3 - 5
years More than 5
years
Long-term debt $ 3,818.1
$ 38.8
$ 188.8
$ 1,049.3
$ 2,541.2
Estimated interest payments on long-term debt(a) 2,281.0
164.1
316.1
306.9
1,493.9
Operating leases 339.2
81.5
115.6
76.5
65.6
Purchase commitments(b) 6,367.7
2,300.3
1,019.9
635.4
2,412.1
Pension and postretirement liabilities(c) 463.0
44.3
90.8
92.8
235.1
Total contractual cash obligations $ 13,269.0
$ 2,629.0
$ 1,731.2
$ 2,160.9
$ 6,747.9
______________________________ (a) Based on interest rates and debt balances as of December 31, 2016.
(b) Based on prevailing market prices as of December 31, 2016. The majority of value of items more than 5 years is related
to our estimated purchase commitments from our equity investee, the Miski Mayo Mine, and under the CF Ammonia
Supply Agreement. For additional information related to our purchase commitments, see Note 20 of our Notes to
Consolidated Financial Statements.
(c) The 2017 pension plan payments are based on minimum funding requirements. For years thereafter, pension plan
payments are based on expected benefits paid. The postretirement plan payments are based on projected benefit
payments.
In addition to the above, we have an obligation to fund our investment in MWSPC of approximately $143 million in 2017.
Other Commercial Commitments
The following is a summary of our other commercial commitments as of December 31, 2016:
Commitment Expiration by Calendar Year
(in millions) Total Less than 1
year 1 - 3
years 3 - 5
years More than 5
years
Letters of credit $ 21.0
$ 21.0
$ —
$ —
$ —
Surety bonds 541.1
540.8
0.3
—
—
Total $ 562.1
$ 561.8
$ 0.3
$ —
$ —
The surety bonds and letters of credit generally expire within one year or less but a substantial portion of these instruments
provide financial assurance for continuing obligations and, therefore, in most cases, must be renewed on an annual basis. We
issue letters of credit through our revolving credit facility and bi-lateral agreements. As of December 31, 2016, we had $15.7
million of outstanding letters of credit through our credit facility and $5.3 million outstanding through bi-lateral agreements.
We primarily incur liabilities for reclamation activities in our Florida operations and for phosphogypsum management system
(“Gypstack”) closure in our Florida and Louisiana operations where, for permitting purposes, we must either pass a test of
financial strength or provide credit support, typically in the form of cash deposits, surety bonds or letters of credit. As
of December 31, 2016, we had $237.4 million in surety bonds outstanding for reclamation obligations, primarily related to
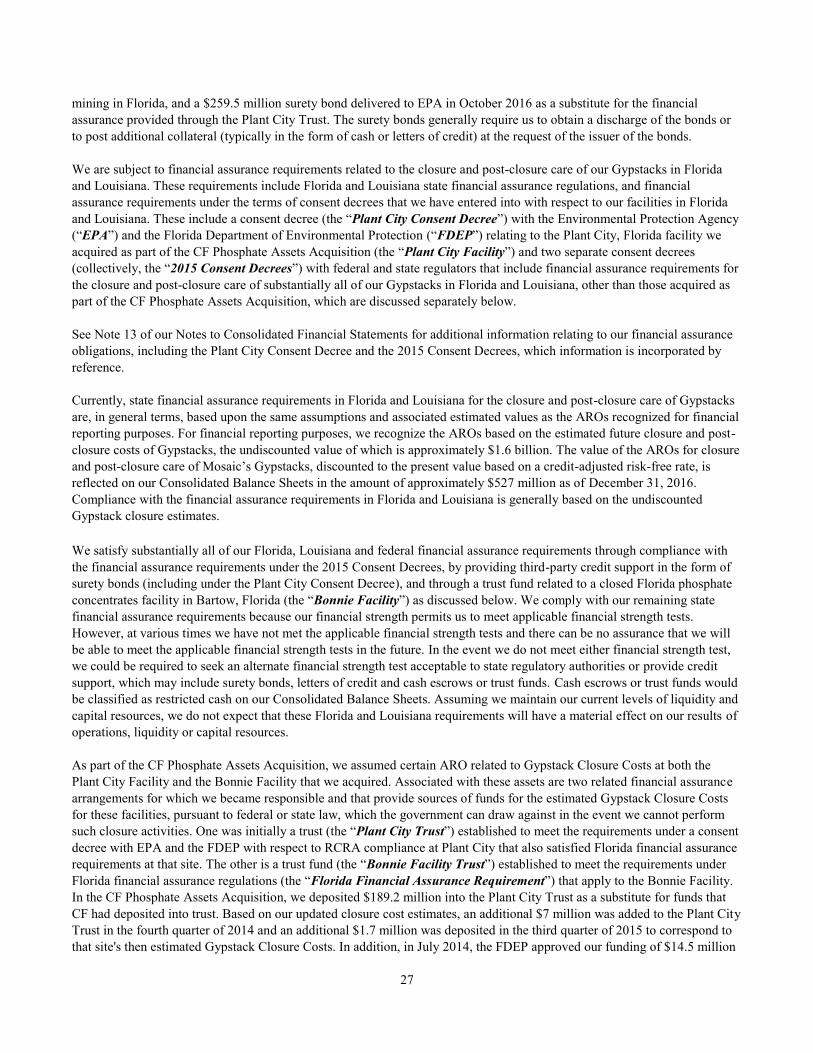
27
mining in Florida, and a $259.5 million surety bond delivered to EPA in October 2016 as a substitute for the financial
assurance provided through the Plant City Trust. The surety bonds generally require us to obtain a discharge of the bonds or
to post additional collateral (typically in the form of cash or letters of credit) at the request of the issuer of the bonds.
We are subject to financial assurance requirements related to the closure and post-closure care of our Gypstacks in Florida
and Louisiana. These requirements include Florida and Louisiana state financial assurance regulations, and financial
assurance requirements under the terms of consent decrees that we have entered into with respect to our facilities in Florida
and Louisiana. These include a consent decree (the “Plant City Consent Decree”) with the Environmental Protection Agency
(“EPA”) and the Florida Department of Environmental Protection (“FDEP”) relating to the Plant City, Florida facility we
acquired as part of the CF Phosphate Assets Acquisition (the “Plant City Facility”) and two separate consent decrees
(collectively, the “2015 Consent Decrees”) with federal and state regulators that include financial assurance requirements for
the closure and post-closure care of substantially all of our Gypstacks in Florida and Louisiana, other than those acquired as
part of the CF Phosphate Assets Acquisition, which are discussed separately below.
See Note 13 of our Notes to Consolidated Financial Statements for additional information relating to our financial assurance
obligations, including the Plant City Consent Decree and the 2015 Consent Decrees, which information is incorporated by
reference.
Currently, state financial assurance requirements in Florida and Louisiana for the closure and post-closure care of Gypstacks
are, in general terms, based upon the same assumptions and associated estimated values as the AROs recognized for financial
reporting purposes. For financial reporting purposes, we recognize the AROs based on the estimated future closure and post-
closure costs of Gypstacks, the undiscounted value of which is approximately $1.6 billion. The value of the AROs for closure
and post-closure care of Mosaic’s Gypstacks, discounted to the present value based on a credit-adjusted risk-free rate, is
reflected on our Consolidated Balance Sheets in the amount of approximately $527 million as of December 31, 2016.
Compliance with the financial assurance requirements in Florida and Louisiana is generally based on the undiscounted
Gypstack closure estimates.
We satisfy substantially all of our Florida, Louisiana and federal financial assurance requirements through compliance with
the financial assurance requirements under the 2015 Consent Decrees, by providing third-party credit support in the form of
surety bonds (including under the Plant City Consent Decree), and through a trust fund related to a closed Florida phosphate
concentrates facility in Bartow, Florida (the “Bonnie Facility”) as discussed below. We comply with our remaining state
financial assurance requirements because our financial strength permits us to meet applicable financial strength tests.
However, at various times we have not met the applicable financial strength tests and there can be no assurance that we will
be able to meet the applicable financial strength tests in the future. In the event we do not meet either financial strength test,
we could be required to seek an alternate financial strength test acceptable to state regulatory authorities or provide credit
support, which may include surety bonds, letters of credit and cash escrows or trust funds. Cash escrows or trust funds would
be classified as restricted cash on our Consolidated Balance Sheets. Assuming we maintain our current levels of liquidity and
capital resources, we do not expect that these Florida and Louisiana requirements will have a material effect on our results of
operations, liquidity or capital resources.
As part of the CF Phosphate Assets Acquisition, we assumed certain ARO related to Gypstack Closure Costs at both the
Plant City Facility and the Bonnie Facility that we acquired. Associated with these assets are two related financial assurance
arrangements for which we became responsible and that provide sources of funds for the estimated Gypstack Closure Costs
for these facilities, pursuant to federal or state law, which the government can draw against in the event we cannot perform
such closure activities. One was initially a trust (the “Plant City Trust”) established to meet the requirements under a consent
decree with EPA and the FDEP with respect to RCRA compliance at Plant City that also satisfied Florida financial assurance
requirements at that site. The other is a trust fund (the “Bonnie Facility Trust”) established to meet the requirements under
Florida financial assurance regulations (the “Florida Financial Assurance Requirement”) that apply to the Bonnie Facility.
In the CF Phosphate Assets Acquisition, we deposited $189.2 million into the Plant City Trust as a substitute for funds that
CF had deposited into trust. Based on our updated closure cost estimates, an additional $7 million was added to the Plant City
Trust in the fourth quarter of 2014 and an additional $1.7 million was deposited in the third quarter of 2015 to correspond to
that site's then estimated Gypstack Closure Costs. In addition, in July 2014, the FDEP approved our funding of $14.5 million
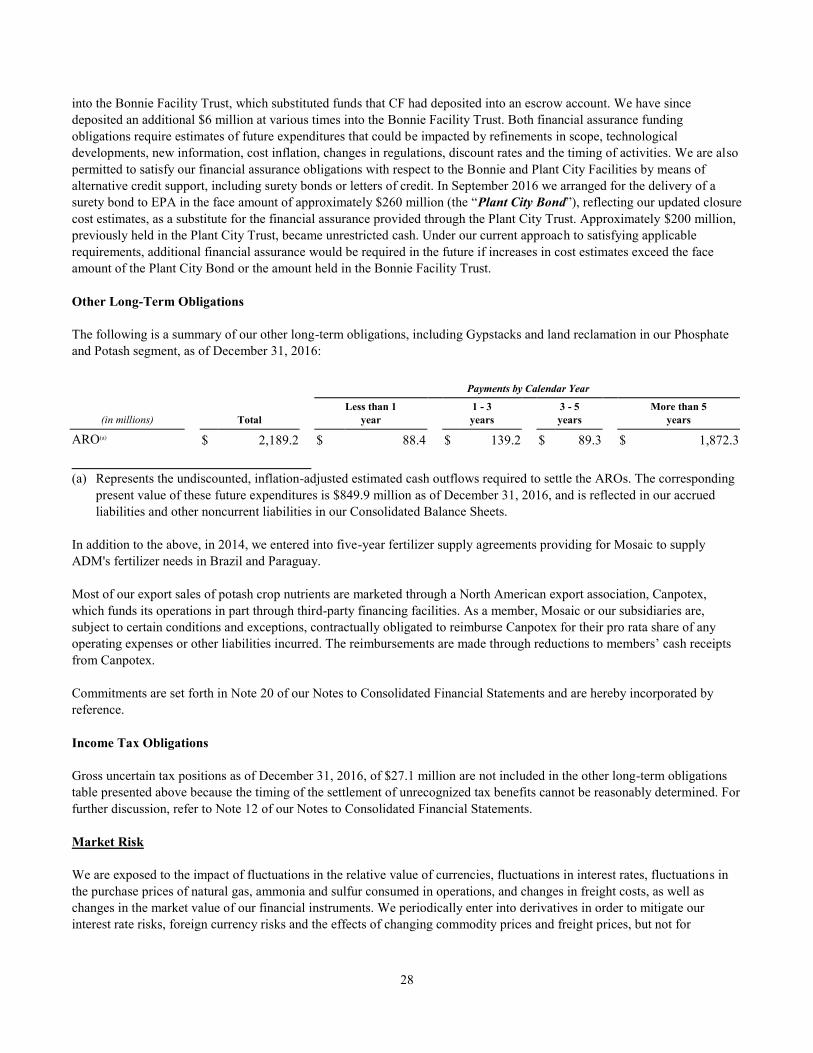
28
into the Bonnie Facility Trust, which substituted funds that CF had deposited into an escrow account. We have since
deposited an additional $6 million at various times into the Bonnie Facility Trust. Both financial assurance funding
obligations require estimates of future expenditures that could be impacted by refinements in scope, technological
developments, new information, cost inflation, changes in regulations, discount rates and the timing of activities. We are also
permitted to satisfy our financial assurance obligations with respect to the Bonnie and Plant City Facilities by means of
alternative credit support, including surety bonds or letters of credit. In September 2016 we arranged for the delivery of a
surety bond to EPA in the face amount of approximately $260 million (the “Plant City Bond”), reflecting our updated closure
cost estimates, as a substitute for the financial assurance provided through the Plant City Trust. Approximately $200 million,
previously held in the Plant City Trust, became unrestricted cash. Under our current approach to satisfying applicable
requirements, additional financial assurance would be required in the future if increases in cost estimates exceed the face
amount of the Plant City Bond or the amount held in the Bonnie Facility Trust.
Other Long-Term Obligations
The following is a summary of our other long-term obligations, including Gypstacks and land reclamation in our Phosphate
and Potash segment, as of December 31, 2016:
Payments by Calendar Year
(in millions) Total Less than 1
year 1 - 3
years 3 - 5
years More than 5
years
ARO(a) $ 2,189.2
$ 88.4
$ 139.2
$ 89.3
$ 1,872.3
______________________________ (a) Represents the undiscounted, inflation-adjusted estimated cash outflows required to settle the AROs. The corresponding
present value of these future expenditures is $849.9 million as of December 31, 2016, and is reflected in our accrued
liabilities and other noncurrent liabilities in our Consolidated Balance Sheets.
In addition to the above, in 2014, we entered into five-year fertilizer supply agreements providing for Mosaic to supply
ADM's fertilizer needs in Brazil and Paraguay.
Most of our export sales of potash crop nutrients are marketed through a North American export association, Canpotex,
which funds its operations in part through third-party financing facilities. As a member, Mosaic or our subsidiaries are,
subject to certain conditions and exceptions, contractually obligated to reimburse Canpotex for their pro rata share of any
operating expenses or other liabilities incurred. The reimbursements are made through reductions to members’ cash receipts
from Canpotex.
Commitments are set forth in Note 20 of our Notes to Consolidated Financial Statements and are hereby incorporated by
reference.
Income Tax Obligations
Gross uncertain tax positions as of December 31, 2016, of $27.1 million are not included in the other long-term obligations
table presented above because the timing of the settlement of unrecognized tax benefits cannot be reasonably determined. For
further discussion, refer to Note 12 of our Notes to Consolidated Financial Statements.
Market Risk
We are exposed to the impact of fluctuations in the relative value of currencies, fluctuations in interest rates, fluctuations in
the purchase prices of natural gas, ammonia and sulfur consumed in operations, and changes in freight costs, as well as
changes in the market value of our financial instruments. We periodically enter into derivatives in order to mitigate our
interest rate risks, foreign currency risks and the effects of changing commodity prices and freight prices, but not for
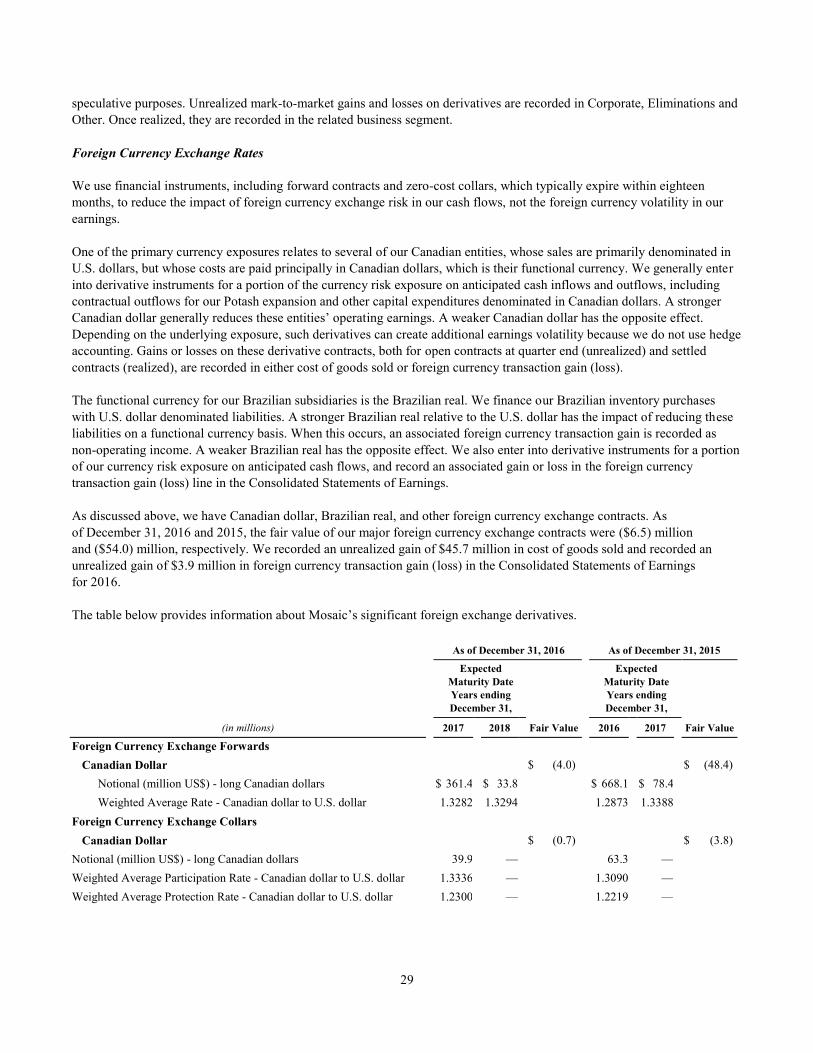
29
speculative purposes. Unrealized mark-to-market gains and losses on derivatives are recorded in Corporate, Eliminations and
Other. Once realized, they are recorded in the related business segment.
Foreign Currency Exchange Rates
We use financial instruments, including forward contracts and zero-cost collars, which typically expire within eighteen
months, to reduce the impact of foreign currency exchange risk in our cash flows, not the foreign currency volatility in our
earnings.
One of the primary currency exposures relates to several of our Canadian entities, whose sales are primarily denominated in
U.S. dollars, but whose costs are paid principally in Canadian dollars, which is their functional currency. We generally enter
into derivative instruments for a portion of the currency risk exposure on anticipated cash inflows and outflows, including
contractual outflows for our Potash expansion and other capital expenditures denominated in Canadian dollars. A stronger
Canadian dollar generally reduces these entities’ operating earnings. A weaker Canadian dollar has the opposite effect.
Depending on the underlying exposure, such derivatives can create additional earnings volatility because we do not use hedge
accounting. Gains or losses on these derivative contracts, both for open contracts at quarter end (unrealized) and settled
contracts (realized), are recorded in either cost of goods sold or foreign currency transaction gain (loss).
The functional currency for our Brazilian subsidiaries is the Brazilian real. We finance our Brazilian inventory purchases
with U.S. dollar denominated liabilities. A stronger Brazilian real relative to the U.S. dollar has the impact of reducing these
liabilities on a functional currency basis. When this occurs, an associated foreign currency transaction gain is recorded as
non-operating income. A weaker Brazilian real has the opposite effect. We also enter into derivative instruments for a portion
of our currency risk exposure on anticipated cash flows, and record an associated gain or loss in the foreign currency
transaction gain (loss) line in the Consolidated Statements of Earnings.
As discussed above, we have Canadian dollar, Brazilian real, and other foreign currency exchange contracts. As
of December 31, 2016 and 2015, the fair value of our major foreign currency exchange contracts were ($6.5) million
and ($54.0) million, respectively. We recorded an unrealized gain of $45.7 million in cost of goods sold and recorded an
unrealized gain of $3.9 million in foreign currency transaction gain (loss) in the Consolidated Statements of Earnings
for 2016.
The table below provides information about Mosaic’s significant foreign exchange derivatives.
As of December 31, 2016
As of December 31, 2015
Expected
Maturity Date
Years ending
December 31,
Expected
Maturity Date
Years ending
December 31,
(in millions) 2017 2018 Fair Value 2016 2017 Fair Value
Foreign Currency Exchange Forwards
Canadian Dollar $ (4.0 ) $ (48.4 )
Notional (million US$) - long Canadian dollars $ 361.4
$ 33.8
$ 668.1
$ 78.4
Weighted Average Rate - Canadian dollar to U.S. dollar 1.3282
1.3294
1.2873
1.3388
Foreign Currency Exchange Collars
Canadian Dollar $ (0.7 ) $ (3.8 )
Notional (million US$) - long Canadian dollars 39.9
—
63.3
—
Weighted Average Participation Rate - Canadian dollar to U.S. dollar 1.3336
—
1.3090
—
Weighted Average Protection Rate - Canadian dollar to U.S. dollar 1.2300
—
1.2219
—
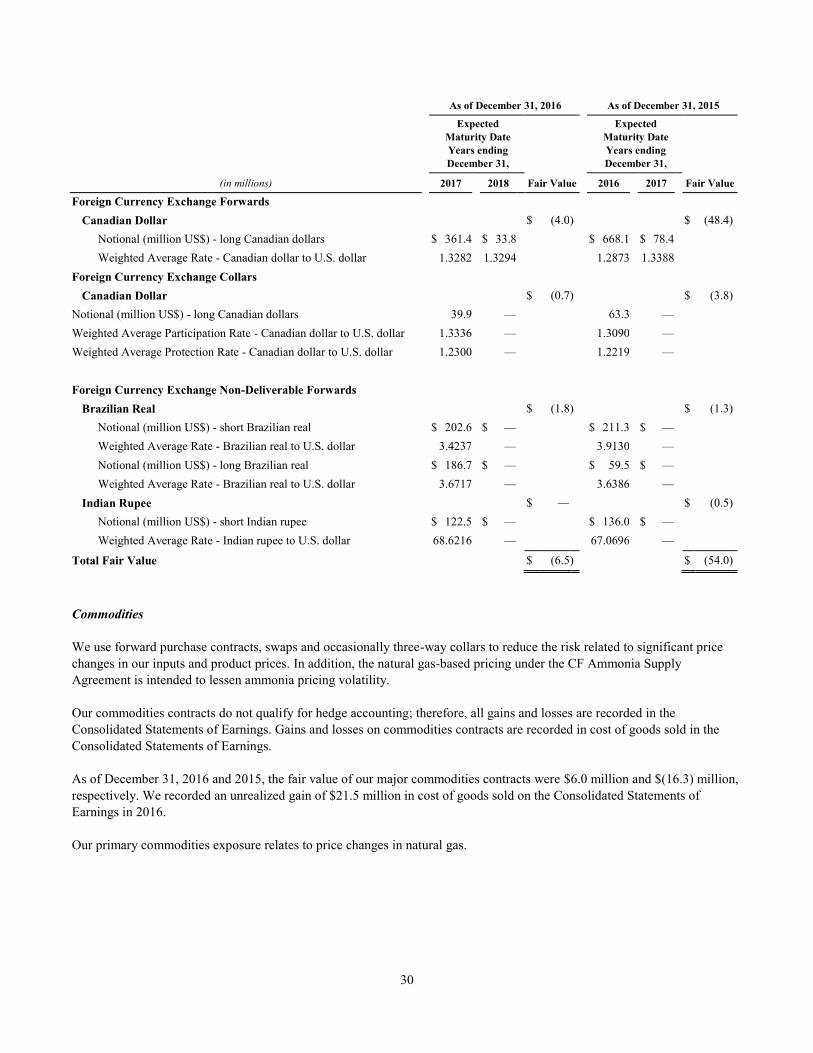
30
As of December 31, 2016
As of December 31, 2015
Expected
Maturity Date
Years ending
December 31,
Expected
Maturity Date
Years ending
December 31,
(in millions) 2017 2018 Fair Value 2016 2017 Fair Value
Foreign Currency Exchange Forwards
Canadian Dollar $ (4.0 ) $ (48.4 )
Notional (million US$) - long Canadian dollars $ 361.4
$ 33.8
$ 668.1
$ 78.4
Weighted Average Rate - Canadian dollar to U.S. dollar 1.3282
1.3294
1.2873
1.3388
Foreign Currency Exchange Collars
Canadian Dollar $ (0.7 ) $ (3.8 )
Notional (million US$) - long Canadian dollars 39.9
—
63.3
—
Weighted Average Participation Rate - Canadian dollar to U.S. dollar 1.3336
—
1.3090
—
Weighted Average Protection Rate - Canadian dollar to U.S. dollar 1.2300
—
1.2219
—
Foreign Currency Exchange Non-Deliverable Forwards
Brazilian Real $ (1.8 ) $ (1.3 )
Notional (million US$) - short Brazilian real $ 202.6
$ —
$ 211.3
$ —
Weighted Average Rate - Brazilian real to U.S. dollar 3.4237
—
3.9130
—
Notional (million US$) - long Brazilian real $ 186.7
$ —
$ 59.5
$ —
Weighted Average Rate - Brazilian real to U.S. dollar 3.6717
—
3.6386
—
Indian Rupee $ —
$ (0.5 )
Notional (million US$) - short Indian rupee $ 122.5
$ —
$ 136.0
$ —
Weighted Average Rate - Indian rupee to U.S. dollar 68.6216
—
67.0696
—
Total Fair Value $ (6.5 ) $ (54.0 )
Commodities
We use forward purchase contracts, swaps and occasionally three-way collars to reduce the risk related to significant price
changes in our inputs and product prices. In addition, the natural gas-based pricing under the CF Ammonia Supply
Agreement is intended to lessen ammonia pricing volatility.
Our commodities contracts do not qualify for hedge accounting; therefore, all gains and losses are recorded in the
Consolidated Statements of Earnings. Gains and losses on commodities contracts are recorded in cost of goods sold in the
Consolidated Statements of Earnings.
As of December 31, 2016 and 2015, the fair value of our major commodities contracts were $6.0 million and $(16.3) million,
respectively. We recorded an unrealized gain of $21.5 million in cost of goods sold on the Consolidated Statements of
Earnings in 2016.
Our primary commodities exposure relates to price changes in natural gas.
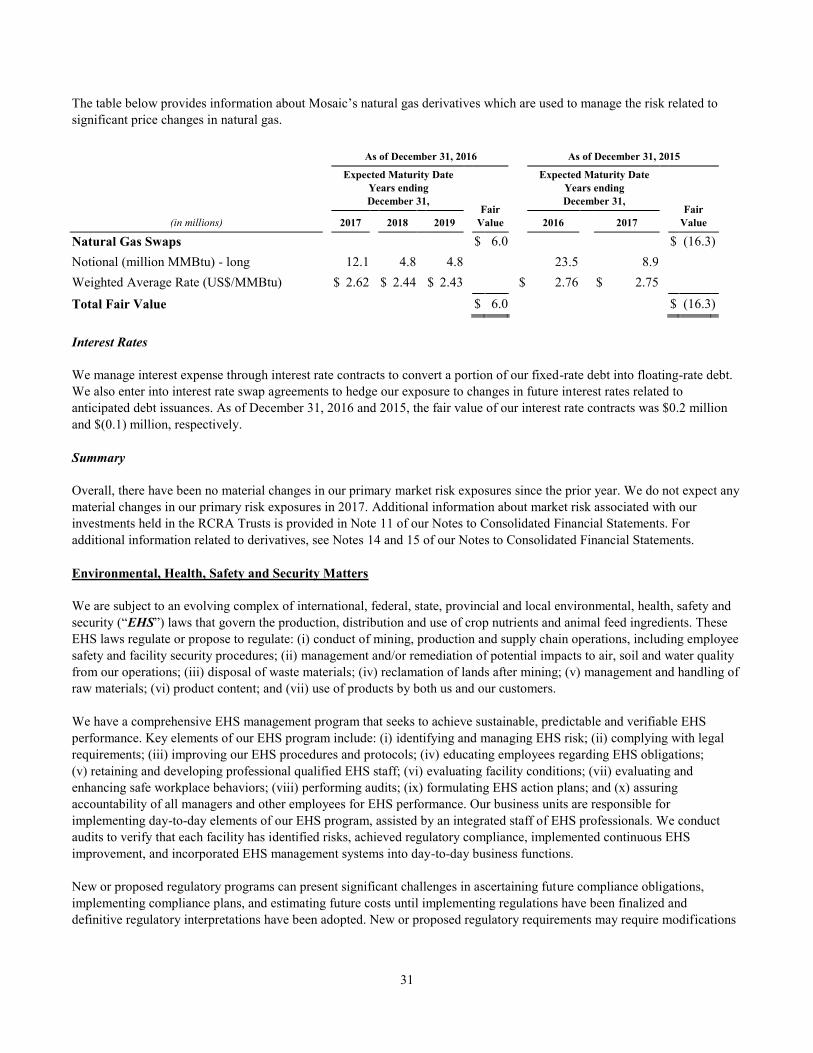
31
The table below provides information about Mosaic’s natural gas derivatives which are used to manage the risk related to
significant price changes in natural gas.
As of December 31, 2016 As of December 31, 2015
Expected Maturity Date
Years ending
December 31, Fair
Value
Expected Maturity Date
Years ending
December 31, Fair
Value (in millions) 2017 2018 2019 2016 2017
Natural Gas Swaps $ 6.0
$ (16.3 )
Notional (million MMBtu) - long 12.1
4.8
4.8
23.5
8.9
Weighted Average Rate (US$/MMBtu) $ 2.62
$ 2.44
$ 2.43
$ 2.76
$ 2.75
Total Fair Value $ 6.0
$ (16.3 )
Interest Rates
We manage interest expense through interest rate contracts to convert a portion of our fixed-rate debt into floating-rate debt.
We also enter into interest rate swap agreements to hedge our exposure to changes in future interest rates related to
anticipated debt issuances. As of December 31, 2016 and 2015, the fair value of our interest rate contracts was $0.2 million
and $(0.1) million, respectively.
Summary
Overall, there have been no material changes in our primary market risk exposures since the prior year. We do not expect any
material changes in our primary risk exposures in 2017. Additional information about market risk associated with our
investments held in the RCRA Trusts is provided in Note 11 of our Notes to Consolidated Financial Statements. For
additional information related to derivatives, see Notes 14 and 15 of our Notes to Consolidated Financial Statements.
Environmental, Health, Safety and Security Matters
We are subject to an evolving complex of international, federal, state, provincial and local environmental, health, safety and
security (“EHS”) laws that govern the production, distribution and use of crop nutrients and animal feed ingredients. These
EHS laws regulate or propose to regulate: (i) conduct of mining, production and supply chain operations, including employee
safety and facility security procedures; (ii) management and/or remediation of potential impacts to air, soil and water quality
from our operations; (iii) disposal of waste materials; (iv) reclamation of lands after mining; (v) management and handling of
raw materials; (vi) product content; and (vii) use of products by both us and our customers.
We have a comprehensive EHS management program that seeks to achieve sustainable, predictable and verifiable EHS
performance. Key elements of our EHS program include: (i) identifying and managing EHS risk; (ii) complying with legal
requirements; (iii) improving our EHS procedures and protocols; (iv) educating employees regarding EHS obligations;
(v) retaining and developing professional qualified EHS staff; (vi) evaluating facility conditions; (vii) evaluating and
enhancing safe workplace behaviors; (viii) performing audits; (ix) formulating EHS action plans; and (x) assuring
accountability of all managers and other employees for EHS performance. Our business units are responsible for
implementing day-to-day elements of our EHS program, assisted by an integrated staff of EHS professionals. We conduct
audits to verify that each facility has identified risks, achieved regulatory compliance, implemented continuous EHS
improvement, and incorporated EHS management systems into day-to-day business functions.
New or proposed regulatory programs can present significant challenges in ascertaining future compliance obligations,
implementing compliance plans, and estimating future costs until implementing regulations have been finalized and
definitive regulatory interpretations have been adopted. New or proposed regulatory requirements may require modifications
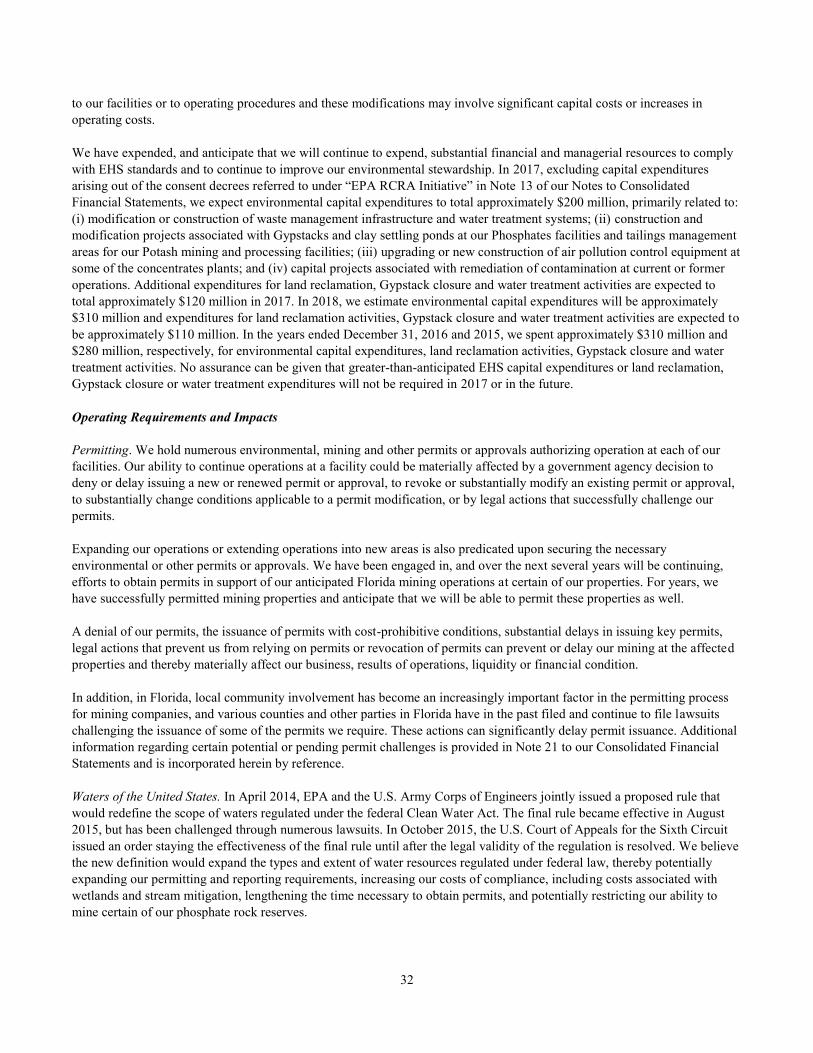
32
to our facilities or to operating procedures and these modifications may involve significant capital costs or increases in
operating costs.
We have expended, and anticipate that we will continue to expend, substantial financial and managerial resources to comply
with EHS standards and to continue to improve our environmental stewardship. In 2017, excluding capital expenditures
arising out of the consent decrees referred to under “EPA RCRA Initiative” in Note 13 of our Notes to Consolidated
Financial Statements, we expect environmental capital expenditures to total approximately $200 million, primarily related to:
(i) modification or construction of waste management infrastructure and water treatment systems; (ii) construction and
modification projects associated with Gypstacks and clay settling ponds at our Phosphates facilities and tailings management
areas for our Potash mining and processing facilities; (iii) upgrading or new construction of air pollution control equipment at
some of the concentrates plants; and (iv) capital projects associated with remediation of contamination at current or former
operations. Additional expenditures for land reclamation, Gypstack closure and water treatment activities are expected to
total approximately $120 million in 2017. In 2018, we estimate environmental capital expenditures will be approximately
$310 million and expenditures for land reclamation activities, Gypstack closure and water treatment activities are expected to
be approximately $110 million. In the years ended December 31, 2016 and 2015, we spent approximately $310 million and
$280 million, respectively, for environmental capital expenditures, land reclamation activities, Gypstack closure and water
treatment activities. No assurance can be given that greater-than-anticipated EHS capital expenditures or land reclamation,
Gypstack closure or water treatment expenditures will not be required in 2017 or in the future.
Operating Requirements and Impacts
Permitting. We hold numerous environmental, mining and other permits or approvals authorizing operation at each of our
facilities. Our ability to continue operations at a facility could be materially affected by a government agency decision to
deny or delay issuing a new or renewed permit or approval, to revoke or substantially modify an existing permit or approval,
to substantially change conditions applicable to a permit modification, or by legal actions that successfully challenge our
permits.
Expanding our operations or extending operations into new areas is also predicated upon securing the necessary
environmental or other permits or approvals. We have been engaged in, and over the next several years will be continuing,
efforts to obtain permits in support of our anticipated Florida mining operations at certain of our properties. For years, we
have successfully permitted mining properties and anticipate that we will be able to permit these properties as well.
A denial of our permits, the issuance of permits with cost-prohibitive conditions, substantial delays in issuing key permits,
legal actions that prevent us from relying on permits or revocation of permits can prevent or delay our mining at the affected
properties and thereby materially affect our business, results of operations, liquidity or financial condition.
In addition, in Florida, local community involvement has become an increasingly important factor in the permitting process
for mining companies, and various counties and other parties in Florida have in the past filed and continue to file lawsuits
challenging the issuance of some of the permits we require. These actions can significantly delay permit issuance. Additional
information regarding certain potential or pending permit challenges is provided in Note 21 to our Consolidated Financial
Statements and is incorporated herein by reference.
Waters of the United States. In April 2014, EPA and the U.S. Army Corps of Engineers jointly issued a proposed rule that
would redefine the scope of waters regulated under the federal Clean Water Act. The final rule became effective in August
2015, but has been challenged through numerous lawsuits. In October 2015, the U.S. Court of Appeals for the Sixth Circuit
issued an order staying the effectiveness of the final rule until after the legal validity of the regulation is resolved. We believe
the new definition would expand the types and extent of water resources regulated under federal law, thereby potentially
expanding our permitting and reporting requirements, increasing our costs of compliance, including costs associated with
wetlands and stream mitigation, lengthening the time necessary to obtain permits, and potentially restricting our ability to
mine certain of our phosphate rock reserves.
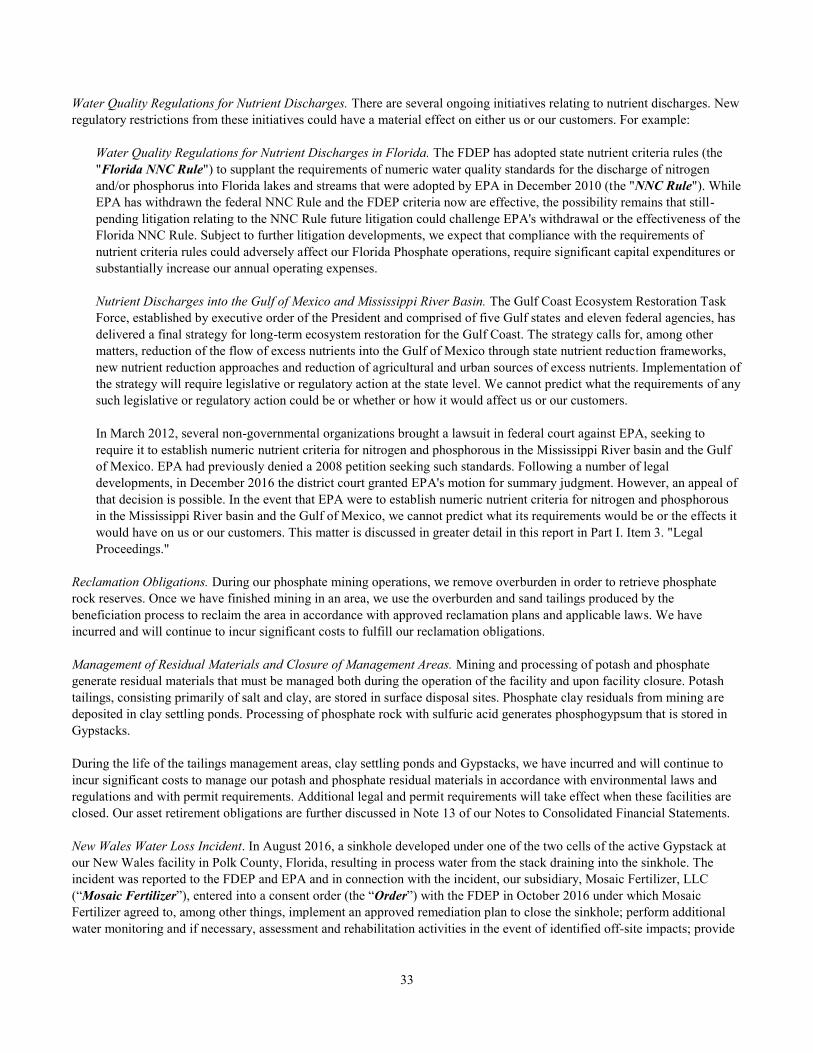
33
Water Quality Regulations for Nutrient Discharges. There are several ongoing initiatives relating to nutrient discharges. New
regulatory restrictions from these initiatives could have a material effect on either us or our customers. For example:
Water Quality Regulations for Nutrient Discharges in Florida. The FDEP has adopted state nutrient criteria rules (the
"Florida NNC Rule") to supplant the requirements of numeric water quality standards for the discharge of nitrogen
and/or phosphorus into Florida lakes and streams that were adopted by EPA in December 2010 (the "NNC Rule"). While
EPA has withdrawn the federal NNC Rule and the FDEP criteria now are effective, the possibility remains that still-
pending litigation relating to the NNC Rule future litigation could challenge EPA's withdrawal or the effectiveness of the
Florida NNC Rule. Subject to further litigation developments, we expect that compliance with the requirements of
nutrient criteria rules could adversely affect our Florida Phosphate operations, require significant capital expenditures or
substantially increase our annual operating expenses.
Nutrient Discharges into the Gulf of Mexico and Mississippi River Basin. The Gulf Coast Ecosystem Restoration Task
Force, established by executive order of the President and comprised of five Gulf states and eleven federal agencies, has
delivered a final strategy for long-term ecosystem restoration for the Gulf Coast. The strategy calls for, among other
matters, reduction of the flow of excess nutrients into the Gulf of Mexico through state nutrient reduction frameworks,
new nutrient reduction approaches and reduction of agricultural and urban sources of excess nutrients. Implementation of
the strategy will require legislative or regulatory action at the state level. We cannot predict what the requirements of any
such legislative or regulatory action could be or whether or how it would affect us or our customers.
In March 2012, several non-governmental organizations brought a lawsuit in federal court against EPA, seeking to
require it to establish numeric nutrient criteria for nitrogen and phosphorous in the Mississippi River basin and the Gulf
of Mexico. EPA had previously denied a 2008 petition seeking such standards. Following a number of legal
developments, in December 2016 the district court granted EPA's motion for summary judgment. However, an appeal of
that decision is possible. In the event that EPA were to establish numeric nutrient criteria for nitrogen and phosphorous
in the Mississippi River basin and the Gulf of Mexico, we cannot predict what its requirements would be or the effects it
would have on us or our customers. This matter is discussed in greater detail in this report in Part I. Item 3. "Legal
Proceedings."
Reclamation Obligations. During our phosphate mining operations, we remove overburden in order to retrieve phosphate
rock reserves. Once we have finished mining in an area, we use the overburden and sand tailings produced by the
beneficiation process to reclaim the area in accordance with approved reclamation plans and applicable laws. We have
incurred and will continue to incur significant costs to fulfill our reclamation obligations.
Management of Residual Materials and Closure of Management Areas. Mining and processing of potash and phosphate
generate residual materials that must be managed both during the operation of the facility and upon facility closure. Potash
tailings, consisting primarily of salt and clay, are stored in surface disposal sites. Phosphate clay residuals from mining are
deposited in clay settling ponds. Processing of phosphate rock with sulfuric acid generates phosphogypsum that is stored in
Gypstacks.
During the life of the tailings management areas, clay settling ponds and Gypstacks, we have incurred and will continue to
incur significant costs to manage our potash and phosphate residual materials in accordance with environmental laws and
regulations and with permit requirements. Additional legal and permit requirements will take effect when these facilities are
closed. Our asset retirement obligations are further discussed in Note 13 of our Notes to Consolidated Financial Statements.
New Wales Water Loss Incident. In August 2016, a sinkhole developed under one of the two cells of the active Gypstack at
our New Wales facility in Polk County, Florida, resulting in process water from the stack draining into the sinkhole. The
incident was reported to the FDEP and EPA and in connection with the incident, our subsidiary, Mosaic Fertilizer, LLC
(“Mosaic Fertilizer”), entered into a consent order (the “Order”) with the FDEP in October 2016 under which Mosaic
Fertilizer agreed to, among other things, implement an approved remediation plan to close the sinkhole; perform additional
water monitoring and if necessary, assessment and rehabilitation activities in the event of identified off-site impacts; provide
34
financial assurance; and evaluate the risk of potential future sinkhole formation at our active Florida Gypstack operations.
The incident and the Order are further discussed in Note 21 of our Notes to Consolidated Financial Statements.
Financial Assurance. Separate from our accounting treatment for reclamation and closure liabilities, some jurisdictions in
which we operate have required us either to pass a test of financial strength or provide credit support, typically cash deposits,
surety bonds, financial guarantees or letters of credit, to address phosphate mining reclamation liabilities and closure
liabilities for clay settling areas and Gypstacks. See "Other Commercial Commitments" under "Off-Balance Sheet
Arrangements and Obligations" above for additional information about these requirements. Among other matters, EPA and
its state agency analogues engaged in previous years in an ongoing review of mineral processing industries, including us and
other phosphoric acid producers, under the U.S. Resource Conservation and Recovery Act and state hazardous waste laws.
Following negotiations with EPA and state agencies, in 2015 we entered into two separate consent decrees that became
effective in 2016 and resolved claims relating to our management of certain waste materials onsite at certain fertilizer
manufacturing facilities in Florida and Louisiana. Under these consent decrees, in 2016 we deposited $630 million in cash
into two trust funds to provide additional financial assurance for the estimated costs of closure and post-closure care of our
phosphogypsum management systems. While our actual Gypstack Closure Costs are generally expected to be paid by us in
the normal course of our Phosphates business over a period that may not end until three decades or more after a Gypstack has
been closed, the funds on deposit in the RCRA Trusts can be drawn by the applicable governmental authority in the event we
cannot perform our closure and long term care obligations. If and when our estimated Gypstack Closure Costs with respect to
the facilities associated with a RCRA Trust are sufficiently lower than the amount on deposit in that RCRA Trust, we have
the right to request that the excess funds be released to us. The same is true for the RCRA Trust balance remaining after the
completion of our obligations, which will be performed over a period that may not end until three decades or more after a
Gypstack has been closed. See the discussion under “EPA RCRA Initiative” in Note 13 of our Notes to Consolidated
Financial Statements for additional information about this matter.
We have accepted a proposal by the Province of Saskatchewan under which we would establish a trust valued at $25 million
in satisfaction of financial assurance requirements for closure of our Saskatchewan potash facilities. The trust is to be fully
funded by us by 2021 in equal annual installments which began in July 2014.
In addition, in January 2017, proposed rules were issued under the U.S. Comprehensive Environmental Response,
Compensation, and Liability Act, commonly known as CERCLA or the Superfund law, that would require owners and
operators of certain classes of hardrock mines and mineral processing facilities to demonstrate financial ability to cover
potential costs of future cleanup efforts for their operations and costs of health assessments and natural resource damage. As
proposed, the rules would apply to phosphate mining, phosphate fertilizer manufacturing and potash mining operations. We
cannot predict at this time whether the rules will be promulgated as proposed or what, if any, financial assurance
requirements may ultimately be developed or required for our operations. Accordingly, we cannot predict the prospective
impact of any such financial responsibility requirements on our results of operations, liquidity or capital resources, or
whether any such effects could be material to us.
Climate Change
We are committed to finding ways to meet the challenges of crop nutrient and animal feed ingredient production and
distribution in the context of the need to reduce greenhouse gas emissions. While focused on helping the world grow the food
it needs, we have proven our commitment to using our resources more efficiently and have implemented innovative energy
recovery technologies that result in our generation of much of the energy we need, particularly in our U.S. Phosphates
operations, from high efficiency heat recovery systems that result in lower greenhouse gas emissions.
Climate Change Regulation. Various governmental initiatives to limit greenhouse gas emissions are under way or under
consideration around the world. These initiatives could restrict our operating activities, require us to make changes in our
operating activities that would increase our operating costs, reduce our efficiency or limit our output, require us to make
capital improvements to our facilities, increase our energy, raw material and transportation costs or limit their availability, or
otherwise adversely affect our results of operations, liquidity or capital resources, and these effects could be material to us.
35
The direct greenhouse gas emissions from our operations result primarily from:
• Combustion of natural gas to produce steam and dry potash products at our Belle Plaine, Saskatchewan, potash
solution mine. To a lesser extent, at our potash shaft mines, natural gas is used as a fuel to heat fresh air supplied to
the shaft mines and for drying potash products.
• The use of natural gas as a feedstock in the production of ammonia at our Faustina, Louisiana phosphates plant.
• Process reactions from naturally occurring carbonates in phosphate rock.
In addition, the production of energy and raw materials that we purchase from unrelated parties for use in our business and
energy used in the transportation of our products and raw materials are sources of greenhouse gas emissions.
Governmental greenhouse gas emission initiatives include, among others, the December 2015 agreement (the “Paris
Agreement”) which was the outcome of the 21st session of the Conference of the Parties under the United Nations
Framework Convention on Climate Change (“UNFCCC”). The Paris Agreement, which was signed by nearly 200 nations
including the United States and Canada, entered into force in late 2016 and sets out a goal of limiting the average rise in
temperatures for this century to below 2 degrees Celsius. Each signatory is expected to develop its own plan (referred to as a
Nationally Determined Contribution, or “NDC”) for reaching that goal.
The NDC submitted by the United States aims to achieve, by 2025, an economy-wide target of reducing greenhouse gas
emissions by 26-28% below its 2005 level. It also aims to use best efforts to reduce its emissions by 28%. The U.S. target
covers all greenhouse gases that were a part of the 2014 Inventory of Greenhouse Gas Emissions and Sinks. While it is
unclear whether the new U.S. executive administration will seek to implement the U.S. NDC, various legislative or
regulatory initiatives relating to greenhouse gases have been adopted or considered by the U.S. Congress, EPA or various
states and those initiatives already adopted may be used to implement the U.S. NDC. Additionally, more stringent laws and
regulations may be enacted to accomplish the goals set out in the NDC.
Canada’s intended NDC aims to achieve, by 2030, an economy-wide target of reducing greenhouse gas emissions by 30%
below 2005 levels. In addition, in late 2016 the federal government announced plans for a comprehensive tax on carbon
emissions, under which provinces opting out of the tax would have the option of adopting a cap-and-trade system. While no
tax has formally been proposed, as implementation of the Paris Agreement proceeds, more stringent laws and regulations
may be enacted to accomplish the goals set out in Canada’s NDC. In addition, the Province of Saskatchewan, in which our
Canadian potash mines are located, has passed legislation to facilitate the development and administration of climate change
regulation in Saskatchewan by the Province rather than the federal government. This legislation is not yet effective, but key
elements under consideration by the Province include establishing a provincial greenhouse gas emission reduction target, and
compliance mechanisms that would provide flexibility for regulated emitters to meet their greenhouse gas reduction
obligations. Our Saskatchewan Potash facilities will continue to work with the Saskatchewan Ministry of Environment and
Environment Canada, through participation in industry associations, to determine next steps. We will also continue to
monitor developments relating to the anticipated proposed legislation, as well as the potential future effect on our operating
activities, energy, raw material and transportation costs, results of operations, liquidity or capital resources.
It is possible that future legislation or regulation addressing climate change, including in response to the Paris Agreement or
any new international agreements, could adversely affect our operating activities, energy, raw material and transportation
costs, results of operations, liquidity or capital resources, and these effects could be material. In addition, to the extent climate
change restrictions imposed in countries where our competitors operate, such as China, India, Former Soviet Union countries
or Morocco, are less stringent than in the United States or Canada, our competitors could gain cost or other competitive
advantages over us.
Operating Impacts Due to Climate Change. The prospective impact of potential climate change on our operations and those
of our customers and farmers remains uncertain. Scientists have hypothesized that the impacts of climate change could
include changes in rainfall patterns, water shortages, changing sea levels, changing storm patterns and intensities, and
changing temperature levels and that these changes could be severe. These impacts could vary by geographic location. Severe
climate change could impact our costs and operating activities, the location and cost of global grain and oilseed production,
36
and the supply and demand for grains and oilseeds. At the present time, we cannot predict the prospective impact of potential
climate change on our results of operations, liquidity or capital resources, or whether any such effects could be material to us.
Remedial Activities
CERCLA (aka Superfund) and state analogues impose liability, without regard to fault or to the legality of a party’s conduct,
on certain categories of persons, including those who have disposed of “hazardous substances” at a third-party location.
Under Superfund, or its various state analogues, one party may be responsible for the entire site, regardless of fault or the
locality of its disposal activity. We have contingent environmental remedial liabilities that arise principally from three
sources which are further discussed below: (i) facilities currently or formerly owned by our subsidiaries or their predecessors;
(ii) facilities adjacent to currently or formerly owned facilities; and (iii) third-party Superfund or state equivalent sites where
we are alleged to have disposed of hazardous materials. Taking into consideration established accruals for environmental
remedial matters of approximately $79.6 million as of December 31, 2016, expenditures for these known conditions currently
are not expected, individually or in the aggregate, to have a material effect on our business or financial condition. However,
material expenditures could be required in the future to remediate the contamination at known sites or at other current or
former sites.
Remediation at Our Facilities. Many of our formerly owned or current facilities have been in operation for a number of
years. The historical use and handling of regulated chemical substances, crop and animal nutrients and additives as well as
by-product or process tailings at these facilities by us and predecessor operators have resulted in soil, surface water and
groundwater impacts.
At many of these facilities, spills or other releases of regulated substances have occurred previously and potentially could
occur in the future, possibly requiring us to undertake or fund cleanup efforts under Superfund or otherwise. In some
instances, we have agreed, pursuant to consent orders or agreements with the appropriate governmental agencies, to
undertake certain investigations, which currently are in progress, to determine whether remedial action may be required to
address site impacts. At other locations, we have entered into consent orders or agreements with appropriate governmental
agencies to perform required remedial activities that will address identified site conditions. Taking into account established
accruals, future expenditures for these known conditions currently are not expected, individually or in the aggregate, to have
a material adverse effect on our business or financial condition. However, material expenditures by us could be required in
the future to remediate the environmental impacts at these or at other current or former sites.
Remediation at Third-Party Facilities. Various third parties have alleged that our historical operations have impacted
neighboring off-site areas or nearby third-party facilities. In some instances, we have agreed, pursuant to orders from or
agreements with appropriate governmental agencies or agreements with private parties, to undertake or fund investigations,
some of which currently are in progress, to determine whether remedial action, under Superfund or otherwise, may be
required to address off-site impacts. Our remedial liability at these sites, either alone or in the aggregate, taking into account
established accruals, currently is not expected to have a material adverse effect on our business or financial condition. As
more information is obtained regarding these sites, this expectation could change.
Liability for Off-Site Disposal Locations. Currently, we are involved or concluding involvement for off-site disposal at
several Superfund or equivalent state sites. Moreover, we previously have entered into settlements to resolve liability with
regard to Superfund or equivalent state sites. In some cases, such settlements have included “reopeners,” which could result
in additional liability at such sites in the event of newly discovered contamination or other circumstances. Our remedial
liability at such disposal sites, either alone or in the aggregate, currently is not expected to have a material adverse effect on
our business or financial condition. As more information is obtained regarding these sites and the potentially responsible
parties involved, this expectation could change.
Product Requirements and Impacts
International, federal, state and provincial standards require us to register many of our products before these products can be
sold. The standards also impose labeling requirements on these products and require us to manufacture the products to
37
formulations set forth on the labels. We believe that, when handled and used as intended, based on the available data, crop
nutrient materials do not pose harm to human health or the environment and that any additional standards or regulatory
requirements relating to product requirements and impacts will not have a material adverse effect on our business or financial
condition.
Additional Information
For additional information about phosphate mine permitting in Florida, our environmental liabilities, the environmental
proceedings in which we are involved, our asset retirement obligations related to environmental matters, and our related
accounting policies, see Environmental Liabilities and AROs under Critical Accounting Estimates above and Notes 2, 13,
and 21 of our Notes to Consolidated Financial Statements.
Sustainability
We are committed to making informed choices that improve our corporate governance, financial strength, operational
efficiency, environmental stewardship, community engagement and resource management. Through these efforts, we intend
to sustain our business and experience lasting success.
We have included, or incorporate by reference, throughout this annual report on Form 10-K discussions of various matters
relating to our sustainability, in its broadest sense, that we believe may be material to our investors. These matters include but
are not limited to discussions about: corporate governance including the leadership and respective roles of our Board of
Directors, its committees and management as well as succession planning; recent and prospective developments in our
business; product development; risk, enterprise risk management and risk oversight; the regulatory and permitting
environment for our business and ongoing regulatory and permitting initiatives; executive compensation practices; employee
and contractor safety; and other EHS matters including climate change, water management, energy and other operational
efficiency initiatives, reclamation and asset retirement obligations. Other matters relating to sustainability are included in our
sustainability reports that are available on our website at www.mosaicco.com/sustainability. Our sustainability reports are not
incorporated by reference in this annual report on Form 10-K.
Contingencies
Information regarding contingencies in Note 21 of our Notes to Consolidated Financial Statements is incorporated herein by
reference.
Related Parties
Information regarding related party transactions is set forth in Note 22 of our Notes to Consolidated Financial Statements and
is incorporated herein by reference.
Recently Issued Accounting Guidance
Recently issued accounting guidance is set forth in Note 3 of our Notes to Consolidated Financial Statements and is
incorporated herein by reference.
Forward-Looking Statements
Cautionary Statement Regarding Forward Looking Information
All statements, other than statements of historical fact, appearing in this report constitute “forward-looking statements”
within the meaning of the Private Securities Litigation Reform Act of 1995. These statements include, among other things,
statements about our expectations, beliefs, intentions or strategies for the future, including statements about our proposed
acquisition of the global phosphate and potash operations of Vale S.A. (“Vale”) conducted through Vale Fertilizantes S.A.
38
(the “Transaction”) and the anticipated benefits and synergies of the proposed Transaction, statements about MWSPC and its
nature, impact and benefits, statements about other proposed or pending future transactions or strategic plans, statements
concerning our future operations, financial condition and prospects, statements regarding our expectations for capital
expenditures, statements concerning our level of indebtedness and other information, and any statements of assumptions
regarding any of the foregoing. In particular, forward-looking statements may include words such as "anticipate", "believe",
"could", "estimate", "expect", "intend", "may", "potential", "predict", "project" or "should". These statements involve certain
risks and uncertainties that may cause actual results to differ materially from expectations as of the date of this filing.
Factors that could cause reported results to differ materially from those expressed or implied by the forward-looking
statements include, but are not limited to, the following:
• risks and uncertainties arising from the possibility that the closing of the proposed Transaction may be delayed or
may not occur, including delays or risks arising from any inability to obtain governmental approvals of the
Transaction on the proposed terms and schedule, any inability of Vale to achieve certain other specified regulatory
and operational milestones or to successfully complete the transfer of the Cubatão business to Vale and its affiliates
in a timely manner, and the ability to satisfy any of the other closing conditions; our ability to secure financing, or
financing on satisfactory terms and in amounts sufficient to fund the cash portion of the purchase price without the
need for additional funds from other liquidity sources; and difficulties with realization of the benefits of the
proposed Transaction, including the risks that the acquired business may not be integrated successfully or that the
anticipated synergies or cost or capital expenditure savings from the Transaction may not be fully realized or may
take longer to realize than expected, including because of political and economic instability in Brazil or changes in
government policy in Brazil;
• business and economic conditions and governmental policies affecting the agricultural industry where we or our
customers operate, including price and demand volatility resulting from periodic imbalances of supply and demand;
• changes in farmers’ application rates for crop nutrients;
• changes in the operation of world phosphate or potash markets, including continuing consolidation in the crop
nutrient industry, particularly if we do not participate in the consolidation;
• pressure on prices realized by us for our products;
• the expansion or contraction of production capacity or selling efforts by competitors or new entrants in the industries
in which we operate, including the effects of actions by members of Canpotex to prove the production capacity of
potash expansion projects, through proving runs or otherwise;
• the expected cost of MWSPC and our expected investment in it, the amount, terms, availability and sufficiency of
funding for MWSPC from us, Ma'aden, SABIC and existing or future external sources, the ability of MWSPC to
obtain additional planned funding in acceptable amounts and upon acceptable terms, the timely development and
commencement of operations of production facilities in the Kingdom of Saudi Arabia, political and economic
instability in the region, and in general the future success of current plans for the joint venture and any future
changes in those plans;
• build-up of inventories in the distribution channels for our products that can adversely affect our sales volumes and
selling prices;
• the effect of future product innovations or development of new technologies on demand for our products;
• seasonality in our business that results in the need to carry significant amounts of inventory and seasonal peaks in
working capital requirements, and may result in excess inventory or product shortages;
39
• changes in the costs, or constraints on supplies, of raw materials or energy used in manufacturing our products, or in
the costs or availability of transportation for our products;
• declines in our selling prices or significant increases in costs that can require us to write down our inventories to the
lower of cost or market, or require us to impair goodwill or other long-lived assets, or establish a valuation
allowance against deferred tax assets;
• the effects on our customers of holding high cost inventories of crop nutrients in periods of rapidly declining market
prices for crop nutrients;
• the lag in realizing the benefit of falling market prices for the raw materials we use to produce our products that can
occur while we consume raw materials that we purchased or committed to purchase in the past at higher prices;
• customer expectations about future trends in the selling prices and availability of our products and in farmer
economics;
• disruptions to existing transportation or terminaling facilities, including those of Canpotex or any joint venture in
which we participate;
• shortages or other unavailability of railcars, tugs, barges and ships for carrying our products and raw materials;
• the effects of and change in trade, monetary, environmental, tax and fiscal policies, laws and regulations;
• foreign exchange rates and fluctuations in those rates;
• tax regulations, currency exchange controls and other restrictions that may affect our ability to optimize the use of
our liquidity;
• other risks associated with our international operations, including any potential adverse effects related to our joint
venture interest in the Miski Mayo mine in the event that protests against natural resource companies in Peru were to
extend to or impact the Miski Mayo mine;
• adverse weather conditions affecting our operations, including the impact of potential hurricanes, excessive heat,
cold, snow or rainfall, or drought;
• difficulties or delays in receiving, challenges to, increased costs of obtaining or satisfying conditions of, or
revocation or withdrawal of required governmental and regulatory approvals, including permitting activities;
• changes in the environmental and other governmental regulation that applies to our operations, including federal
legislation or regulatory action expanding the types and extent of water resources regulated under federal law and
the possibility of further federal or state legislation or regulatory action affecting or related to greenhouse gas
emissions, including carbon taxes or other measures that may be proposed in Canada or other jurisdictions in which
we operate, or of restrictions or liabilities related to elevated levels of naturally-occurring radiation that arise from
disturbing the ground in the course of mining activities or possible efforts to reduce the flow of nutrients into the
Gulf of Mexico, the Mississippi River basin or elsewhere;
• the potential costs and effects of implementation of federal or state water quality standards for the discharge of
nitrogen and/or phosphorus into Florida waterways;
• the financial resources of our competitors, including state-owned and government-subsidized entities in other
countries;
40
• the possibility of defaults by our customers on trade credit that we extend to them or on indebtedness that they incur
to purchase our products and that we guarantee, particularly when we are exiting our business operations or
locations that produced or sold the products to that customer;
• any significant reduction in customers’ liquidity or access to credit that they need to purchase our products;
• the effectiveness of our risk management strategy;
• the effectiveness of the processes we put in place to manage our significant strategic priorities, including the
expansion of our Potash business and our investment in MWSPC, and to successfully integrate and grow acquired
businesses;
• actual costs of various items differing from management’s current estimates, including, among others, asset
retirement, environmental remediation, reclamation or other environmental obligations and Canadian resource taxes
and royalties, or the costs of MWSPC, its existing or future funding and our commitments in support of such
funding;
• the costs and effects of legal and administrative proceedings and regulatory matters affecting us, including
environmental, tax or administrative proceedings, complaints that our operations are adversely impacting nearby
farms, businesses, other property uses or properties, settlements thereof and actions taken by courts with respect to
approvals of settlements, resolution of global tax audit activity, and other further developments in legal proceedings
and regulatory matters;
• the success of our efforts to attract and retain highly qualified and motivated employees;
• strikes, labor stoppages or slowdowns by our work force or increased costs resulting from unsuccessful labor
contract negotiations, and the potential costs and effects of compliance with new regulations affecting our
workforce, which increasingly focus on wages and hours, healthcare, retirement and other employee benefits;
• brine inflows at our Esterhazy, Saskatchewan potash mine as well as potential inflows at our other shaft mines;
• accidents or other incidents involving our properties or operations, including potential fires, explosions, seismic
events, sinkholes, unsuccessful tailings management or releases of hazardous or volatile chemicals;
• terrorism or other malicious intentional acts, including cybersecurity risks such as attempts to gain unauthorized
access to, or disable, our information technology systems, or our costs of addressing malicious intentional acts;
• other disruptions of operations at any of our key production and distribution facilities, particularly when they are
operating at high operating rates;
• changes in antitrust and competition laws or their enforcement;
• actions by the holders of controlling equity interests in businesses in which we hold a noncontrolling interest;
• changes in our relationships with other members of Canpotex or any joint venture in which we participate or their or
our exit from participation in Canpotex or any such export association or joint venture, and other changes in our
commercial arrangements with unrelated third parties;
• the adequacy of our property, business interruption and casualty insurance policies to cover potential hazards and
risks incident to our business, and our willingness and ability to maintain current levels of insurance coverage as a
result of market conditions, our loss experience and other factors;
41
• difficulties in realizing benefits under our long-term natural gas based pricing ammonia supply agreement with CF
Industries, Inc., including the risks that the cost savings initially anticipated from the agreement may not be fully
realized over the term of the agreement or that the price of natural gas or the market price for ammonia during the
agreement's term are at levels at which the agreement’s natural gas based pricing is disadvantageous to us, compared
with purchases in the spot market; and
• other risk factors reported from time to time in our Securities and Exchange Commission reports.
Material uncertainties and other factors known to us are discussed in Item 1A, “Risk Factors,” of our annual report on Form
10-K for the year ended December 31, 2016, and incorporated by reference herein as if fully stated herein.
We base our forward-looking statements on information currently available to us, and we undertake no obligation to update
or revise any of these statements, whether as a result of changes in underlying factors, new information, future events or other
developments.
42
Report of Independent Registered Public Accounting Firm
The Board of Directors and Stockholders
The Mosaic Company:
We have audited the accompanying consolidated balance sheets of The Mosaic Company and subsidiaries as of
December 31, 2016 and 2015, and the related consolidated statements of earnings, comprehensive income, cash flows, and
equity for each of the years in the three-year period ended December 31, 2016. In connection with our audits of the
consolidated financial statements, we also have audited Schedule II-Valuation and Qualifying Accounts for each of the years
in the three year period ended December 31, 2016. These consolidated financial statements and financial statement schedule
are the responsibility of the Company’s management. Our responsibility is to express an opinion on these consolidated
financial statements and financial statement schedule based on our audits.
We conducted our audits in accordance with the standards of the Public Company Accounting Oversight Board (United
States). Those standards require that we plan and perform the audit to obtain reasonable assurance about whether the financial
statements are free of material misstatement. An audit includes examining, on a test basis, evidence supporting the amounts
and disclosures in the financial statements. An audit also includes assessing the accounting principles used and significant
estimates made by management, as well as evaluating the overall financial statement presentation. We believe that our audits
provide a reasonable basis for our opinion.
In our opinion, the consolidated financial statements referred to above present fairly, in all material respects, the financial
position of The Mosaic Company and subsidiaries as of December 31, 2016 and 2015, and the results of their operations and
their cash flows for each of the years in the three-year period ended December 31, 2016, in conformity with U.S. generally
accepted accounting principles. In our opinion, the related financial statement schedule, when considered in relation to the
basic consolidated financial statements taken as a whole, presents fairly, in all material respects, the information set forth
therein.
We also have audited, in accordance with the standards of the Public Company Accounting Oversight Board (United States),
The Mosaic Company’s internal control over financial reporting as of December 31, 2016, based on criteria established
in Internal Control - Integrated Framework (2013) issued by the Committee of Sponsoring Organizations of the Treadway
Commission (COSO), and our report dated February 15, 2017, expressed an unqualified opinion on the effectiveness of the
Company’s internal control over financial reporting.
/s/ KPMG LLP
Minneapolis, Minnesota
February 15, 2017
43
Report of Independent Registered Public Accounting Firm
The Board of Directors and Stockholders
The Mosaic Company:
We have audited The Mosaic Company’s internal control over financial reporting as of December 31, 2016, based on criteria
established in Internal Control - Integrated Framework (2013) issued by the Committee of Sponsoring Organizations of the
Treadway Commission (COSO). The Mosaic Company’s management is responsible for maintaining effective internal
control over financial reporting and for its assessment of the effectiveness of internal control over financial reporting,
included in the accompanying Management’s Annual Report on Internal Control over Financial Reporting. Our responsibility
is to express an opinion on the Company’s internal control over financial reporting based on our audit.
We conducted our audit in accordance with the standards of the Public Company Accounting Oversight Board (United
States). Those standards require that we plan and perform the audit to obtain reasonable assurance about whether effective
internal control over financial reporting was maintained in all material respects. Our audit included obtaining an
understanding of internal control over financial reporting, assessing the risk that a material weakness exists, and testing and
evaluating the design and operating effectiveness of internal control based on the assessed risk. Our audit also included
performing such other procedures as we considered necessary in the circumstances. We believe that our audit provides a
reasonable basis for our opinion.
A company’s internal control over financial reporting is a process designed to provide reasonable assurance regarding the
reliability of financial reporting and the preparation of financial statements for external purposes in accordance with generally
accepted accounting principles. A company’s internal control over financial reporting includes those policies and procedures
that (1) pertain to the maintenance of records that, in reasonable detail, accurately and fairly reflect the transactions and
dispositions of the assets of the company; (2) provide reasonable assurance that transactions are recorded as necessary to
permit preparation of financial statements in accordance with generally accepted accounting principles, and that receipts and
expenditures of the company are being made only in accordance with authorizations of management and directors of the
company; and (3) provide reasonable assurance regarding prevention or timely detection of unauthorized acquisition, use, or
disposition of the company’s assets that could have a material effect on the financial statements.
Because of its inherent limitations, internal control over financial reporting may not prevent or detect misstatements. Also,
projections of any evaluation of effectiveness to future periods are subject to the risk that controls may become inadequate
because of changes in conditions, or that the degree of compliance with the policies or procedures may deteriorate.
In our opinion, The Mosaic Company maintained, in all material respects, effective internal control over financial reporting
as of December 31, 2016, based on criteria established in Internal Control - Integrated Framework (2013) issued by the
Committee of Sponsoring Organizations of the Treadway Commission (COSO).
We also have audited, in accordance with the standards of the Public Company Accounting Oversight Board (United States),
the consolidated balance sheets of The Mosaic Company and subsidiaries as of December 31, 2016 and 2015, and the related
consolidated statements of earnings, comprehensive income, cash flows, and equity for each of the years in the three-year
period ended December 31, 2016. In connection with our audits of the consolidated financial statements, we also have
audited Schedule II, Valuation of Qualifying Accounts, for each of the years in the three-year period ended December 31,
2016. Our report dated February 15, 2017 expressed an unqualified opinion on those consolidated financial statements.
/s/ KPMG LLP
Minneapolis, Minnesota
February 15, 2017
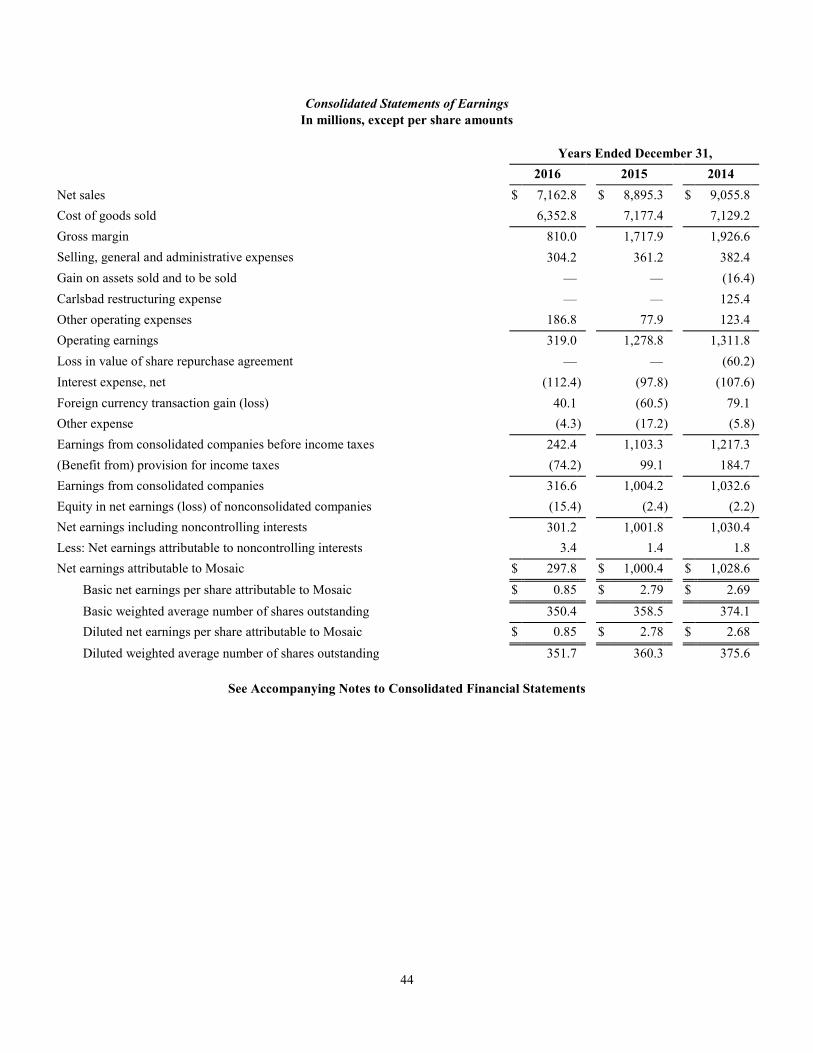
44
Consolidated Statements of Earnings
In millions, except per share amounts
Years Ended December 31,
2016 2015 2014
Net sales $ 7,162.8
$ 8,895.3
$ 9,055.8
Cost of goods sold 6,352.8
7,177.4
7,129.2
Gross margin 810.0
1,717.9
1,926.6
Selling, general and administrative expenses 304.2
361.2
382.4
Gain on assets sold and to be sold —
—
(16.4 )
Carlsbad restructuring expense —
—
125.4
Other operating expenses 186.8
77.9
123.4
Operating earnings 319.0
1,278.8
1,311.8
Loss in value of share repurchase agreement —
—
(60.2 )
Interest expense, net (112.4 ) (97.8 ) (107.6 )
Foreign currency transaction gain (loss) 40.1
(60.5 ) 79.1
Other expense (4.3 ) (17.2 ) (5.8 )
Earnings from consolidated companies before income taxes 242.4
1,103.3
1,217.3
(Benefit from) provision for income taxes (74.2 ) 99.1
184.7
Earnings from consolidated companies 316.6
1,004.2
1,032.6
Equity in net earnings (loss) of nonconsolidated companies (15.4 ) (2.4 ) (2.2 )
Net earnings including noncontrolling interests 301.2
1,001.8
1,030.4
Less: Net earnings attributable to noncontrolling interests 3.4
1.4
1.8
Net earnings attributable to Mosaic $ 297.8
$ 1,000.4
$ 1,028.6
Basic net earnings per share attributable to Mosaic $ 0.85
$ 2.79
$ 2.69
Basic weighted average number of shares outstanding 350.4
358.5
374.1
Diluted net earnings per share attributable to Mosaic $ 0.85
$ 2.78
$ 2.68
Diluted weighted average number of shares outstanding 351.7
360.3
375.6
See Accompanying Notes to Consolidated Financial Statements
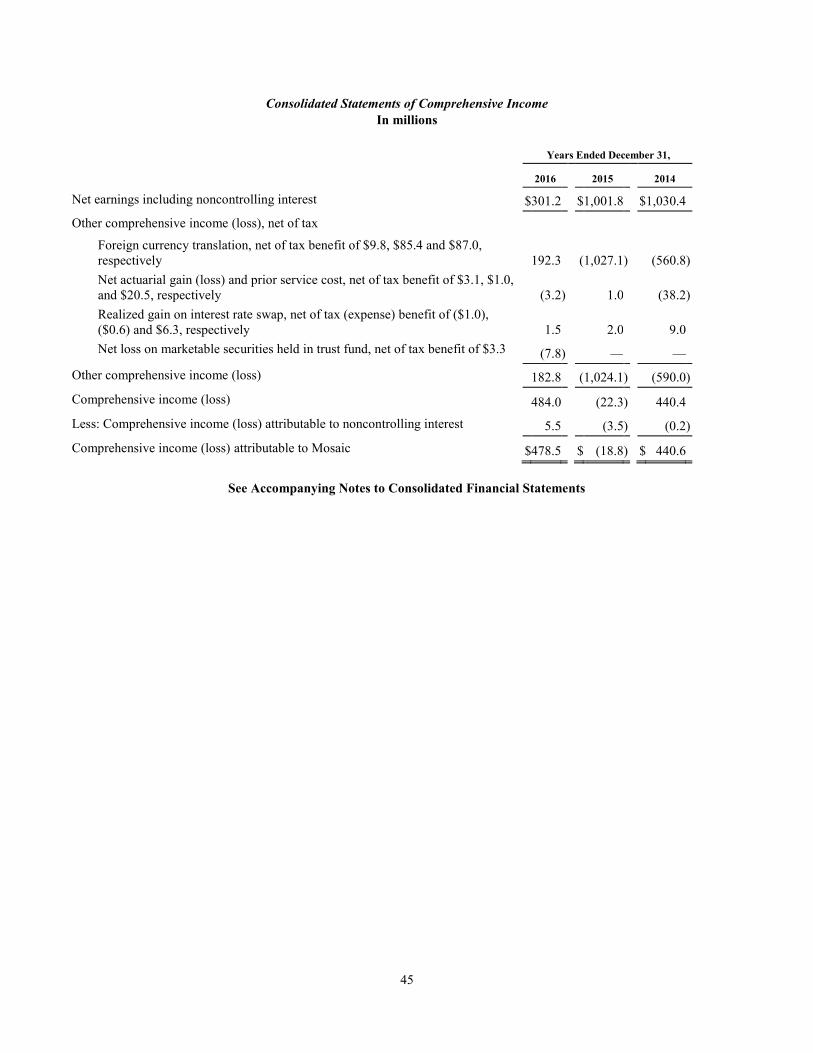
45
Consolidated Statements of Comprehensive Income
In millions
Years Ended December 31,
2016 2015 2014
Net earnings including noncontrolling interest $ 301.2
$ 1,001.8
$ 1,030.4
Other comprehensive income (loss), net of tax
Foreign currency translation, net of tax benefit of $9.8, $85.4 and $87.0,
respectively 192.3
(1,027.1 ) (560.8 )
Net actuarial gain (loss) and prior service cost, net of tax benefit of $3.1, $1.0,
and $20.5, respectively (3.2 ) 1.0
(38.2 )
Realized gain on interest rate swap, net of tax (expense) benefit of ($1.0),
($0.6) and $6.3, respectively 1.5
2.0
9.0
Net loss on marketable securities held in trust fund, net of tax benefit of $3.3 (7.8 ) —
—
Other comprehensive income (loss) 182.8
(1,024.1 ) (590.0 )
Comprehensive income (loss) 484.0
(22.3 ) 440.4
Less: Comprehensive income (loss) attributable to noncontrolling interest 5.5
(3.5 ) (0.2 )
Comprehensive income (loss) attributable to Mosaic $ 478.5
$ (18.8 ) $ 440.6
See Accompanying Notes to Consolidated Financial Statements
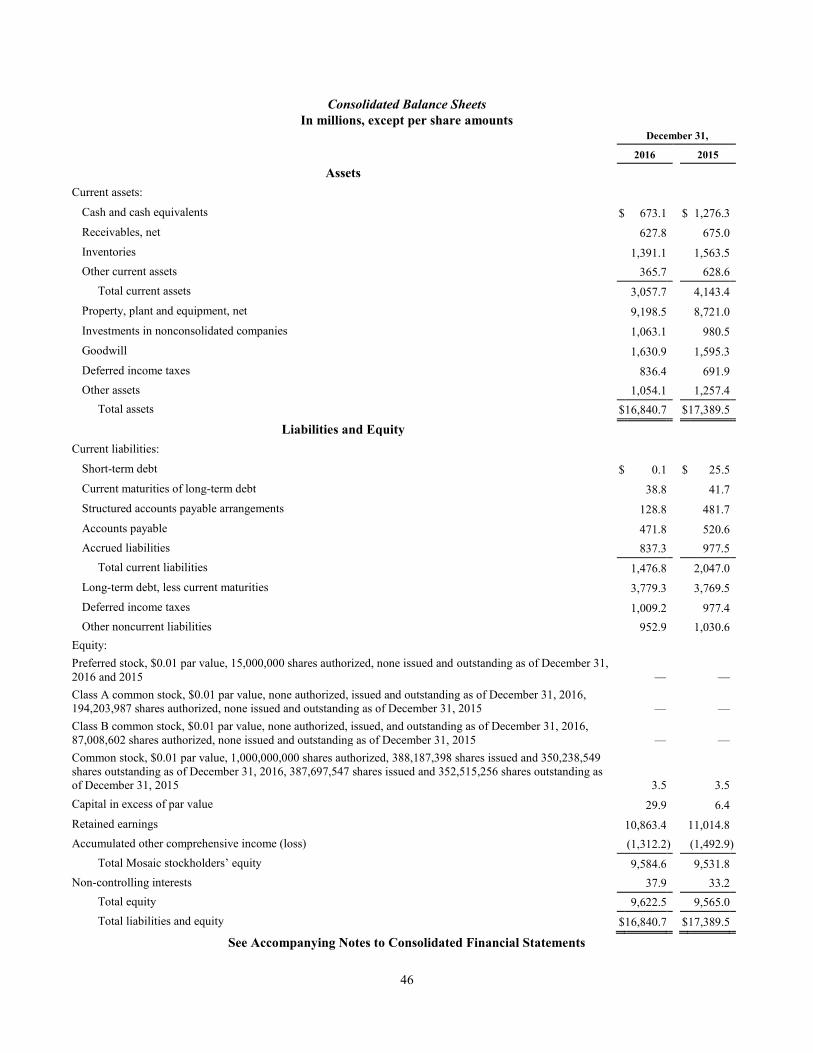
46
Consolidated Balance Sheets
In millions, except per share amounts
December 31,
2016 2015
Assets
Current assets:
Cash and cash equivalents $ 673.1
$ 1,276.3
Receivables, net 627.8
675.0
Inventories 1,391.1
1,563.5
Other current assets 365.7
628.6
Total current assets 3,057.7
4,143.4
Property, plant and equipment, net 9,198.5
8,721.0
Investments in nonconsolidated companies 1,063.1
980.5
Goodwill 1,630.9
1,595.3
Deferred income taxes 836.4
691.9
Other assets 1,054.1
1,257.4
Total assets $ 16,840.7
$ 17,389.5
Liabilities and Equity
Current liabilities:
Short-term debt $ 0.1
$ 25.5
Current maturities of long-term debt 38.8
41.7
Structured accounts payable arrangements 128.8
481.7
Accounts payable 471.8
520.6
Accrued liabilities 837.3
977.5
Total current liabilities 1,476.8
2,047.0
Long-term debt, less current maturities 3,779.3
3,769.5
Deferred income taxes 1,009.2
977.4
Other noncurrent liabilities 952.9
1,030.6
Equity:
Preferred stock, $0.01 par value, 15,000,000 shares authorized, none issued and outstanding as of December 31,
2016 and 2015 —
—
Class A common stock, $0.01 par value, none authorized, issued and outstanding as of December 31, 2016,
194,203,987 shares authorized, none issued and outstanding as of December 31, 2015 —
—
Class B common stock, $0.01 par value, none authorized, issued, and outstanding as of December 31, 2016,
87,008,602 shares authorized, none issued and outstanding as of December 31, 2015 —
—
Common stock, $0.01 par value, 1,000,000,000 shares authorized, 388,187,398 shares issued and 350,238,549
shares outstanding as of December 31, 2016, 387,697,547 shares issued and 352,515,256 shares outstanding as
of December 31, 2015 3.5
3.5
Capital in excess of par value 29.9
6.4
Retained earnings 10,863.4
11,014.8
Accumulated other comprehensive income (loss) (1,312.2 ) (1,492.9 )
Total Mosaic stockholders’ equity 9,584.6
9,531.8
Non-controlling interests 37.9
33.2
Total equity 9,622.5
9,565.0
Total liabilities and equity $ 16,840.7
$ 17,389.5
See Accompanying Notes to Consolidated Financial Statements
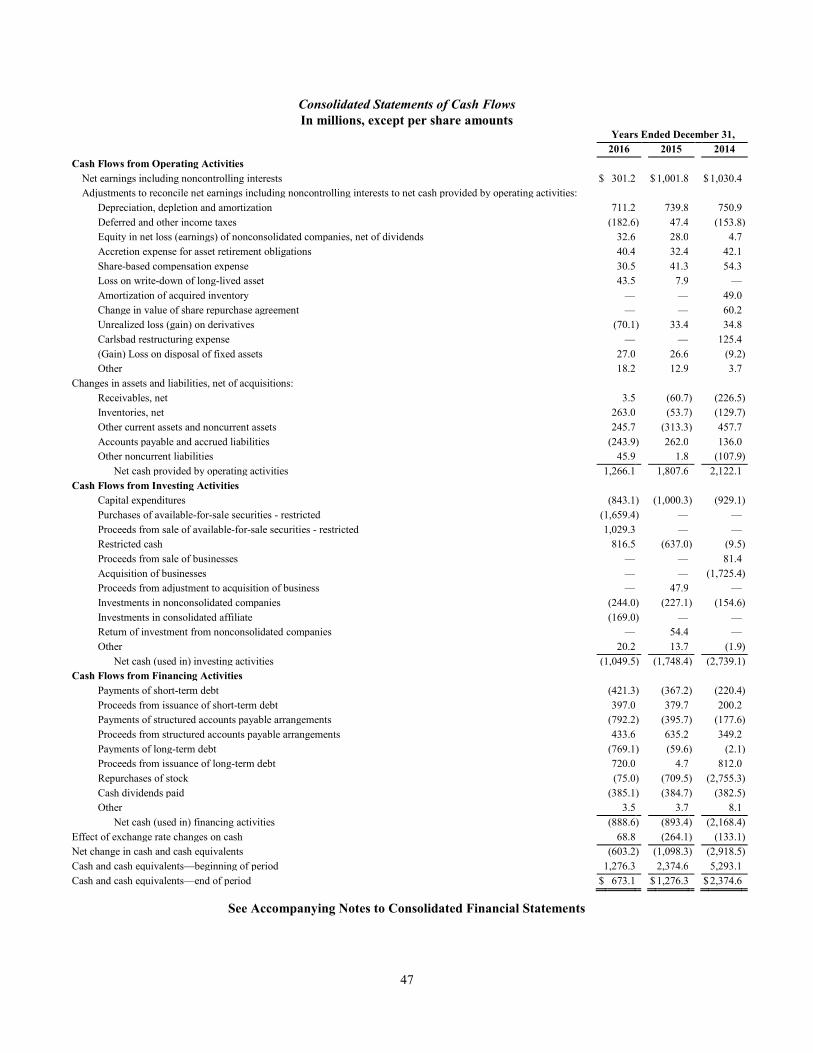
47
Consolidated Statements of Cash Flows
In millions, except per share amounts Years Ended December 31,
2016 2015 2014
Cash Flows from Operating Activities
Net earnings including noncontrolling interests $ 301.2
$ 1,001.8
$ 1,030.4 Adjustments to reconcile net earnings including noncontrolling interests to net cash provided by operating activities:
Depreciation, depletion and amortization 711.2
739.8
750.9 Deferred and other income taxes (182.6 ) 47.4
(153.8 )
Equity in net loss (earnings) of nonconsolidated companies, net of dividends 32.6
28.0
4.7 Accretion expense for asset retirement obligations 40.4
32.4
42.1
Share-based compensation expense 30.5
41.3
54.3 Loss on write-down of long-lived asset 43.5
7.9
—
Amortization of acquired inventory —
—
49.0 Change in value of share repurchase agreement —
—
60.2
Unrealized loss (gain) on derivatives (70.1 ) 33.4
34.8 Carlsbad restructuring expense —
—
125.4
(Gain) Loss on disposal of fixed assets 27.0
26.6
(9.2 )
Other 18.2
12.9
3.7 Changes in assets and liabilities, net of acquisitions:
Receivables, net 3.5
(60.7 ) (226.5 )
Inventories, net 263.0
(53.7 ) (129.7 )
Other current assets and noncurrent assets 245.7
(313.3 ) 457.7 Accounts payable and accrued liabilities (243.9 ) 262.0
136.0
Other noncurrent liabilities 45.9
1.8
(107.9 )
Net cash provided by operating activities 1,266.1
1,807.6
2,122.1 Cash Flows from Investing Activities
Capital expenditures (843.1 ) (1,000.3 ) (929.1 )
Purchases of available-for-sale securities - restricted (1,659.4 ) —
— Proceeds from sale of available-for-sale securities - restricted 1,029.3
—
—
Restricted cash 816.5
(637.0 ) (9.5 )
Proceeds from sale of businesses —
—
81.4 Acquisition of businesses —
—
(1,725.4 )
Proceeds from adjustment to acquisition of business —
47.9
— Investments in nonconsolidated companies (244.0 ) (227.1 ) (154.6 )
Investments in consolidated affiliate (169.0 ) —
— Return of investment from nonconsolidated companies —
54.4
—
Other 20.2
13.7
(1.9 )
Net cash (used in) investing activities (1,049.5 ) (1,748.4 ) (2,739.1 )
Cash Flows from Financing Activities
Payments of short-term debt (421.3 ) (367.2 ) (220.4 )
Proceeds from issuance of short-term debt 397.0
379.7
200.2 Payments of structured accounts payable arrangements (792.2 ) (395.7 ) (177.6 )
Proceeds from structured accounts payable arrangements 433.6
635.2
349.2 Payments of long-term debt (769.1 ) (59.6 ) (2.1 )
Proceeds from issuance of long-term debt 720.0
4.7
812.0 Repurchases of stock (75.0 ) (709.5 ) (2,755.3 )
Cash dividends paid (385.1 ) (384.7 ) (382.5 )
Other 3.5
3.7
8.1 Net cash (used in) financing activities (888.6 ) (893.4 ) (2,168.4 )
Effect of exchange rate changes on cash 68.8
(264.1 ) (133.1 )
Net change in cash and cash equivalents (603.2 )
(1,098.3 )
(2,918.5 )
Cash and cash equivalents—beginning of period 1,276.3
2,374.6
5,293.1 Cash and cash equivalents—end of period $ 673.1
$ 1,276.3
$ 2,374.6
See Accompanying Notes to Consolidated Financial Statements
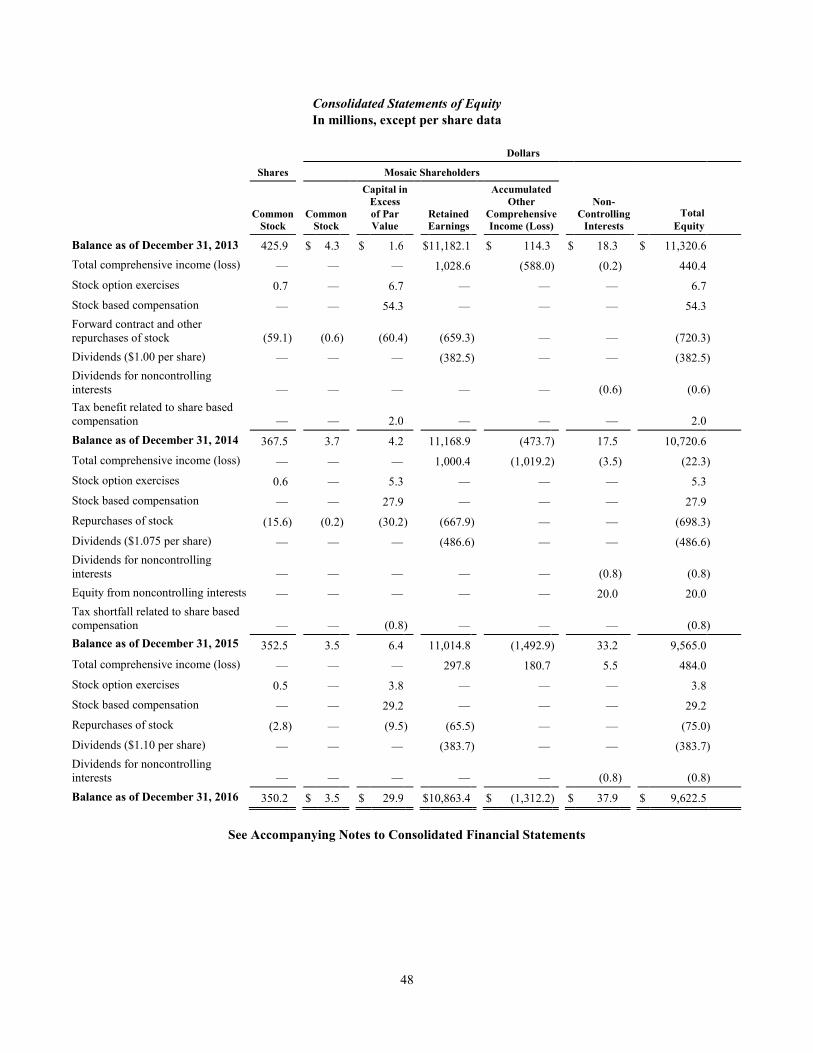
48
Consolidated Statements of Equity
In millions, except per share data
Dollars
Shares Mosaic Shareholders
Common
Stock Common
Stock
Capital in
Excess
of Par
Value Retained Earnings
Accumulated
Other
Comprehensive Income (Loss)
Non-
Controlling Interests
Total
Equity
Balance as of December 31, 2013 425.9
$ 4.3
$ 1.6
$ 11,182.1
$ 114.3
$ 18.3
$ 11,320.6
Total comprehensive income (loss) —
—
—
1,028.6
(588.0 ) (0.2 ) 440.4
Stock option exercises 0.7
—
6.7
—
—
—
6.7
Stock based compensation —
—
54.3
—
—
—
54.3
Forward contract and other
repurchases of stock (59.1 ) (0.6 ) (60.4 ) (659.3 ) —
—
(720.3 )
Dividends ($1.00 per share) —
—
—
(382.5 ) —
—
(382.5 )
Dividends for noncontrolling
interests —
—
—
—
—
(0.6 ) (0.6 )
Tax benefit related to share based
compensation —
—
2.0
—
—
—
2.0
Balance as of December 31, 2014 367.5
3.7
4.2
11,168.9
(473.7 ) 17.5
10,720.6
Total comprehensive income (loss) —
—
—
1,000.4
(1,019.2 ) (3.5 ) (22.3 )
Stock option exercises 0.6
—
5.3
—
—
—
5.3
Stock based compensation —
—
27.9
—
—
—
27.9
Repurchases of stock (15.6 ) (0.2 ) (30.2 ) (667.9 ) —
—
(698.3 )
Dividends ($1.075 per share) —
—
—
(486.6 ) —
—
(486.6 )
Dividends for noncontrolling
interests —
—
—
—
—
(0.8 ) (0.8 )
Equity from noncontrolling interests —
—
—
—
—
20.0
20.0
Tax shortfall related to share based
compensation —
—
(0.8 ) —
—
—
(0.8 )
Balance as of December 31, 2015 352.5
3.5
6.4
11,014.8
(1,492.9 ) 33.2
9,565.0
Total comprehensive income (loss) —
—
—
297.8
180.7
5.5
484.0
Stock option exercises 0.5
—
3.8
—
—
—
3.8
Stock based compensation —
—
29.2
—
—
—
29.2
Repurchases of stock (2.8 ) —
(9.5 ) (65.5 ) —
—
(75.0 )
Dividends ($1.10 per share) —
—
—
(383.7 ) —
—
(383.7 )
Dividends for noncontrolling
interests —
—
—
—
—
(0.8 ) (0.8 )
Balance as of December 31, 2016 350.2
$ 3.5
$ 29.9
$ 10,863.4
$ (1,312.2 ) $ 37.9
$ 9,622.5
See Accompanying Notes to Consolidated Financial Statements
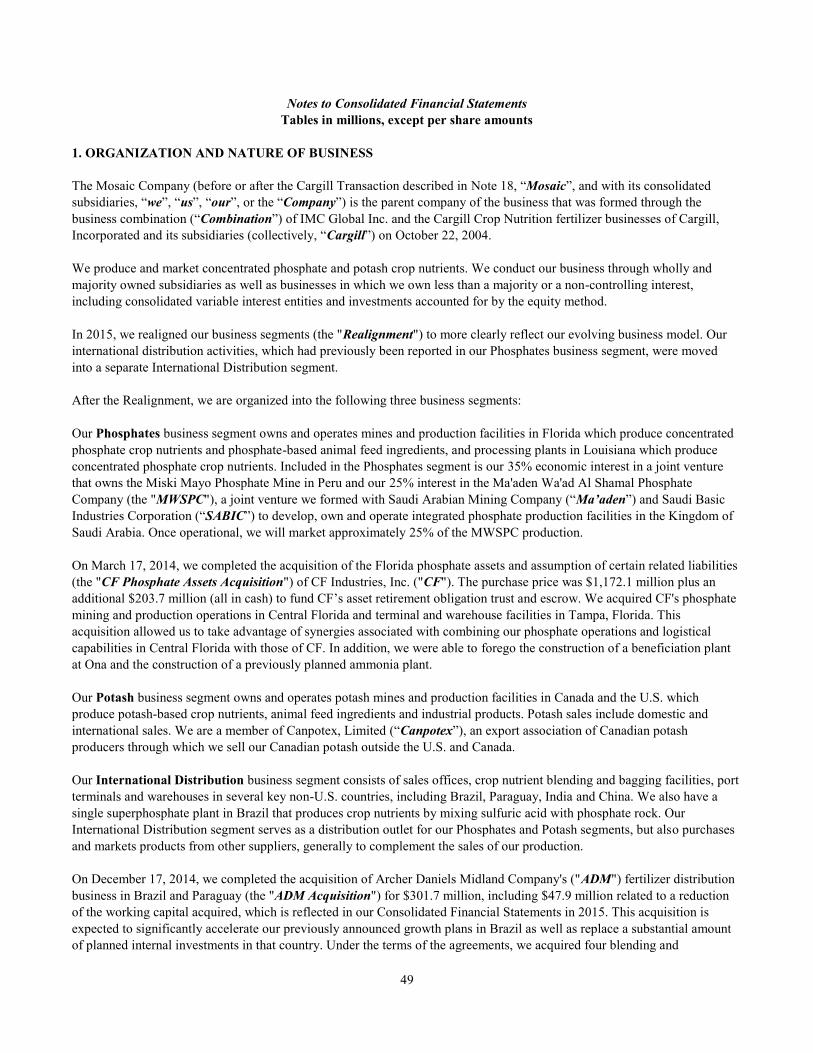
49
Notes to Consolidated Financial Statements
Tables in millions, except per share amounts
1. ORGANIZATION AND NATURE OF BUSINESS
The Mosaic Company (before or after the Cargill Transaction described in Note 18, “Mosaic”, and with its consolidated
subsidiaries, “we”, “us”, “our”, or the “Company”) is the parent company of the business that was formed through the
business combination (“Combination”) of IMC Global Inc. and the Cargill Crop Nutrition fertilizer businesses of Cargill,
Incorporated and its subsidiaries (collectively, “Cargill”) on October 22, 2004.
We produce and market concentrated phosphate and potash crop nutrients. We conduct our business through wholly and
majority owned subsidiaries as well as businesses in which we own less than a majority or a non-controlling interest,
including consolidated variable interest entities and investments accounted for by the equity method.
In 2015, we realigned our business segments (the "Realignment") to more clearly reflect our evolving business model. Our
international distribution activities, which had previously been reported in our Phosphates business segment, were moved
into a separate International Distribution segment.
After the Realignment, we are organized into the following three business segments:
Our Phosphates business segment owns and operates mines and production facilities in Florida which produce concentrated
phosphate crop nutrients and phosphate-based animal feed ingredients, and processing plants in Louisiana which produce
concentrated phosphate crop nutrients. Included in the Phosphates segment is our 35% economic interest in a joint venture
that owns the Miski Mayo Phosphate Mine in Peru and our 25% interest in the Ma'aden Wa'ad Al Shamal Phosphate
Company (the "MWSPC"), a joint venture we formed with Saudi Arabian Mining Company (“Ma’aden”) and Saudi Basic
Industries Corporation (“SABIC”) to develop, own and operate integrated phosphate production facilities in the Kingdom of
Saudi Arabia. Once operational, we will market approximately 25% of the MWSPC production.
On March 17, 2014, we completed the acquisition of the Florida phosphate assets and assumption of certain related liabilities
(the "CF Phosphate Assets Acquisition") of CF Industries, Inc. ("CF"). The purchase price was $1,172.1 million plus an
additional $203.7 million (all in cash) to fund CF’s asset retirement obligation trust and escrow. We acquired CF's phosphate
mining and production operations in Central Florida and terminal and warehouse facilities in Tampa, Florida. This
acquisition allowed us to take advantage of synergies associated with combining our phosphate operations and logistical
capabilities in Central Florida with those of CF. In addition, we were able to forego the construction of a beneficiation plant
at Ona and the construction of a previously planned ammonia plant.
Our Potash business segment owns and operates potash mines and production facilities in Canada and the U.S. which
produce potash-based crop nutrients, animal feed ingredients and industrial products. Potash sales include domestic and
international sales. We are a member of Canpotex, Limited (“Canpotex”), an export association of Canadian potash
producers through which we sell our Canadian potash outside the U.S. and Canada.
Our International Distribution business segment consists of sales offices, crop nutrient blending and bagging facilities, port
terminals and warehouses in several key non-U.S. countries, including Brazil, Paraguay, India and China. We also have a
single superphosphate plant in Brazil that produces crop nutrients by mixing sulfuric acid with phosphate rock. Our
International Distribution segment serves as a distribution outlet for our Phosphates and Potash segments, but also purchases
and markets products from other suppliers, generally to complement the sales of our production.
On December 17, 2014, we completed the acquisition of Archer Daniels Midland Company's ("ADM") fertilizer distribution
business in Brazil and Paraguay (the "ADM Acquisition") for $301.7 million, including $47.9 million related to a reduction
of the working capital acquired, which is reflected in our Consolidated Financial Statements in 2015. This acquisition is
expected to significantly accelerate our previously announced growth plans in Brazil as well as replace a substantial amount
of planned internal investments in that country. Under the terms of the agreements, we acquired four blending and
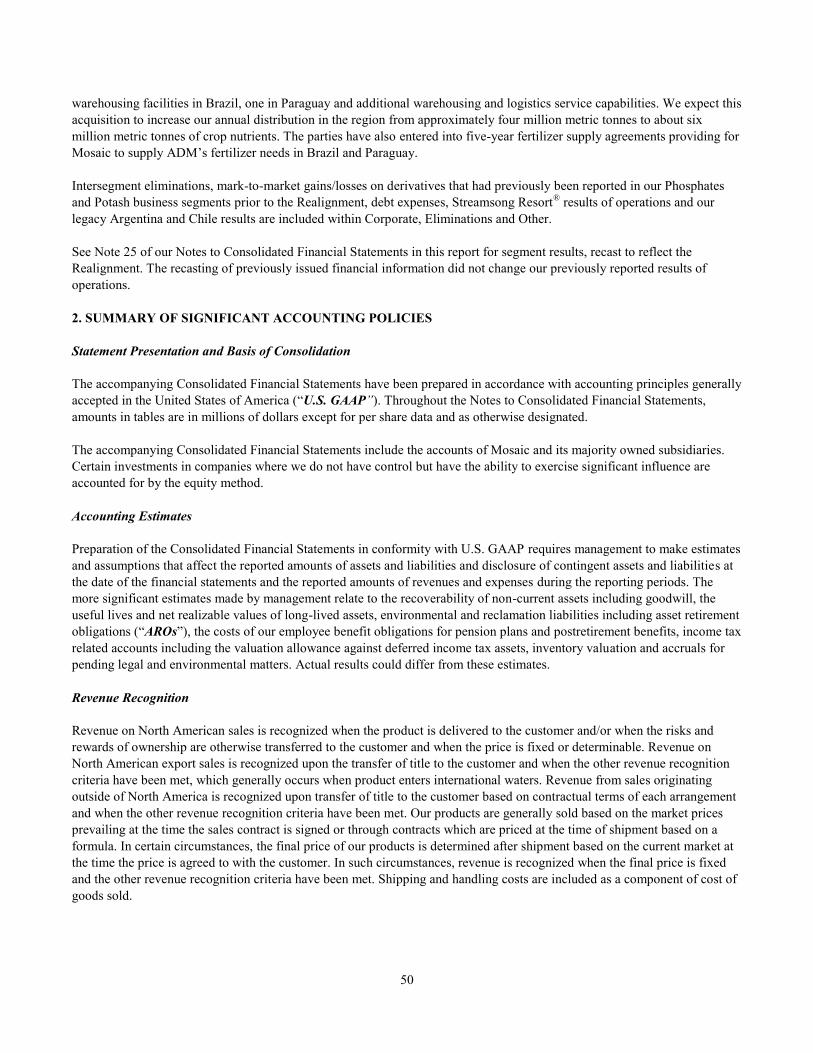
50
warehousing facilities in Brazil, one in Paraguay and additional warehousing and logistics service capabilities. We expect this
acquisition to increase our annual distribution in the region from approximately four million metric tonnes to about six
million metric tonnes of crop nutrients. The parties have also entered into five-year fertilizer supply agreements providing for
Mosaic to supply ADM’s fertilizer needs in Brazil and Paraguay.
Intersegment eliminations, mark-to-market gains/losses on derivatives that had previously been reported in our Phosphates
and Potash business segments prior to the Realignment, debt expenses, Streamsong Resort®
results of operations and our
legacy Argentina and Chile results are included within Corporate, Eliminations and Other.
See Note 25 of our Notes to Consolidated Financial Statements in this report for segment results, recast to reflect the
Realignment. The recasting of previously issued financial information did not change our previously reported results of
operations.
2. SUMMARY OF SIGNIFICANT ACCOUNTING POLICIES
Statement Presentation and Basis of Consolidation
The accompanying Consolidated Financial Statements have been prepared in accordance with accounting principles generally
accepted in the United States of America (“U.S. GAAP”). Throughout the Notes to Consolidated Financial Statements,
amounts in tables are in millions of dollars except for per share data and as otherwise designated.
The accompanying Consolidated Financial Statements include the accounts of Mosaic and its majority owned subsidiaries.
Certain investments in companies where we do not have control but have the ability to exercise significant influence are
accounted for by the equity method.
Accounting Estimates
Preparation of the Consolidated Financial Statements in conformity with U.S. GAAP requires management to make estimates
and assumptions that affect the reported amounts of assets and liabilities and disclosure of contingent assets and liabilities at
the date of the financial statements and the reported amounts of revenues and expenses during the reporting periods. The
more significant estimates made by management relate to the recoverability of non-current assets including goodwill, the
useful lives and net realizable values of long-lived assets, environmental and reclamation liabilities including asset retirement
obligations (“AROs”), the costs of our employee benefit obligations for pension plans and postretirement benefits, income tax
related accounts including the valuation allowance against deferred income tax assets, inventory valuation and accruals for
pending legal and environmental matters. Actual results could differ from these estimates.
Revenue Recognition
Revenue on North American sales is recognized when the product is delivered to the customer and/or when the risks and
rewards of ownership are otherwise transferred to the customer and when the price is fixed or determinable. Revenue on
North American export sales is recognized upon the transfer of title to the customer and when the other revenue recognition
criteria have been met, which generally occurs when product enters international waters. Revenue from sales originating
outside of North America is recognized upon transfer of title to the customer based on contractual terms of each arrangement
and when the other revenue recognition criteria have been met. Our products are generally sold based on the market prices
prevailing at the time the sales contract is signed or through contracts which are priced at the time of shipment based on a
formula. In certain circumstances, the final price of our products is determined after shipment based on the current market at
the time the price is agreed to with the customer. In such circumstances, revenue is recognized when the final price is fixed
and the other revenue recognition criteria have been met. Shipping and handling costs are included as a component of cost of
goods sold.
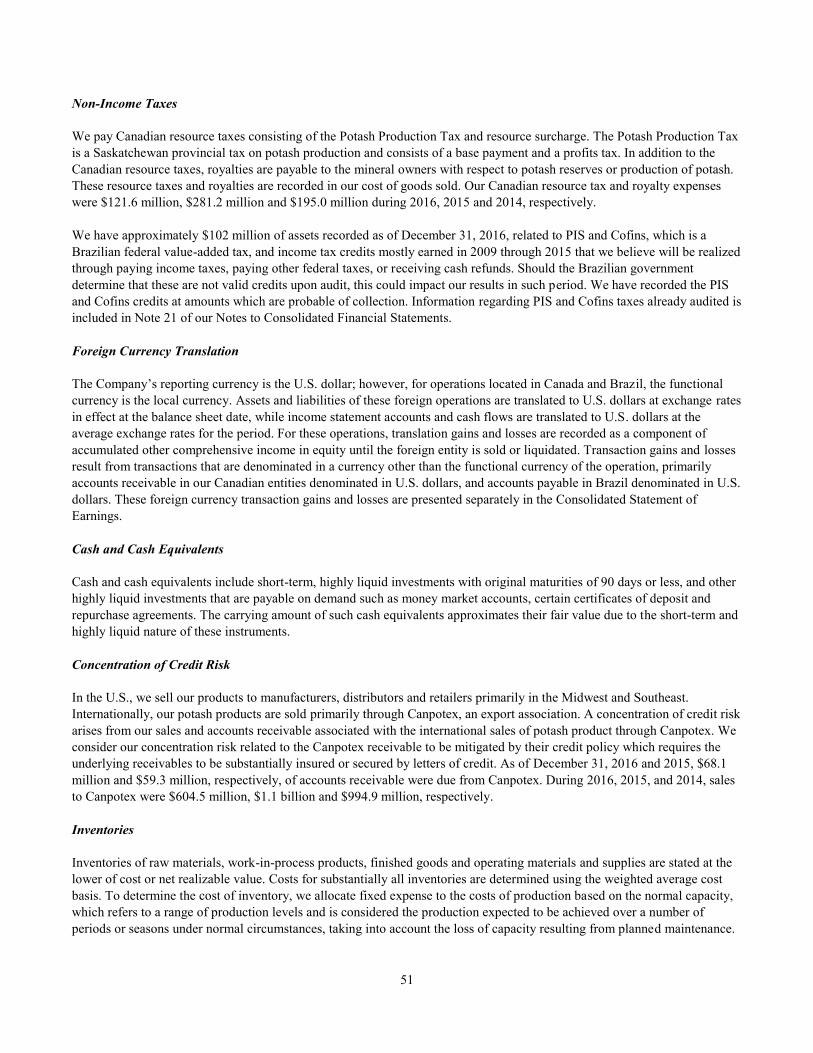
51
Non-Income Taxes
We pay Canadian resource taxes consisting of the Potash Production Tax and resource surcharge. The Potash Production Tax
is a Saskatchewan provincial tax on potash production and consists of a base payment and a profits tax. In addition to the
Canadian resource taxes, royalties are payable to the mineral owners with respect to potash reserves or production of potash.
These resource taxes and royalties are recorded in our cost of goods sold. Our Canadian resource tax and royalty expenses
were $121.6 million, $281.2 million and $195.0 million during 2016, 2015 and 2014, respectively.
We have approximately $102 million of assets recorded as of December 31, 2016, related to PIS and Cofins, which is a
Brazilian federal value-added tax, and income tax credits mostly earned in 2009 through 2015 that we believe will be realized
through paying income taxes, paying other federal taxes, or receiving cash refunds. Should the Brazilian government
determine that these are not valid credits upon audit, this could impact our results in such period. We have recorded the PIS
and Cofins credits at amounts which are probable of collection. Information regarding PIS and Cofins taxes already audited is
included in Note 21 of our Notes to Consolidated Financial Statements.
Foreign Currency Translation
The Company’s reporting currency is the U.S. dollar; however, for operations located in Canada and Brazil, the functional
currency is the local currency. Assets and liabilities of these foreign operations are translated to U.S. dollars at exchange rates
in effect at the balance sheet date, while income statement accounts and cash flows are translated to U.S. dollars at the
average exchange rates for the period. For these operations, translation gains and losses are recorded as a component of
accumulated other comprehensive income in equity until the foreign entity is sold or liquidated. Transaction gains and losses
result from transactions that are denominated in a currency other than the functional currency of the operation, primarily
accounts receivable in our Canadian entities denominated in U.S. dollars, and accounts payable in Brazil denominated in U.S.
dollars. These foreign currency transaction gains and losses are presented separately in the Consolidated Statement of
Earnings.
Cash and Cash Equivalents
Cash and cash equivalents include short-term, highly liquid investments with original maturities of 90 days or less, and other
highly liquid investments that are payable on demand such as money market accounts, certain certificates of deposit and
repurchase agreements. The carrying amount of such cash equivalents approximates their fair value due to the short-term and
highly liquid nature of these instruments.
Concentration of Credit Risk
In the U.S., we sell our products to manufacturers, distributors and retailers primarily in the Midwest and Southeast.
Internationally, our potash products are sold primarily through Canpotex, an export association. A concentration of credit risk
arises from our sales and accounts receivable associated with the international sales of potash product through Canpotex. We
consider our concentration risk related to the Canpotex receivable to be mitigated by their credit policy which requires the
underlying receivables to be substantially insured or secured by letters of credit. As of December 31, 2016 and 2015, $68.1
million and $59.3 million, respectively, of accounts receivable were due from Canpotex. During 2016, 2015, and 2014, sales
to Canpotex were $604.5 million, $1.1 billion and $994.9 million, respectively.
Inventories
Inventories of raw materials, work-in-process products, finished goods and operating materials and supplies are stated at the
lower of cost or net realizable value. Costs for substantially all inventories are determined using the weighted average cost
basis. To determine the cost of inventory, we allocate fixed expense to the costs of production based on the normal capacity,
which refers to a range of production levels and is considered the production expected to be achieved over a number of
periods or seasons under normal circumstances, taking into account the loss of capacity resulting from planned maintenance.
52
Net realizable value of our inventory is defined as forecasted selling prices less reasonably predictable selling costs.
Significant management judgment is involved in estimating forecasted selling prices including various demand and supply
variables. Examples of demand variables include grain and oilseed prices, stock-to-use ratios and changes in inventories in
the crop nutrients distribution channels. Examples of supply variables include forecasted prices of raw materials, such as
phosphate rock, sulfur, ammonia, and natural gas, estimated operating rates and industry crop nutrient inventory levels.
Results could differ materially if actual selling prices differ materially from forecasted selling prices. Charges for lower of
cost or market are recognized in our Consolidated Statements of Earnings in the period when there is evidence of a decline of
market value below cost.
Property, Plant and Equipment and Recoverability of Long-Lived Assets
Property, plant and equipment are stated at cost. Costs of significant assets include capitalized interest incurred during the
construction and development period. Repairs and maintenance, including planned major maintenance and plant turnaround
costs, are expensed when incurred.
Depletion expenses for mining operations, including mineral reserves, are generally determined using the units-of-production
method based on estimates of recoverable reserves. Depreciation is computed principally using the straight-line method over
the following useful lives: machinery and equipment three to 25 years, and buildings and leasehold
improvements three to 40 years.
We estimate initial useful lives based on experience and current technology. These estimates may be extended through
sustaining capital programs. Factors affecting the fair value of our assets or periods of expected use may also affect the
estimated useful lives of our assets and these factors can change. Therefore, we periodically review the estimated remaining
lives of our facilities and other significant assets and adjust our depreciation rates prospectively where appropriate. We are in
the process of changing to the units-of-production method of depreciation for certain assets and expect to complete our
assessment and discuss the impacts in the first quarter of 2017.
Long-lived assets are reviewed for impairment whenever events or changes in circumstances indicate that the carrying
amount may not be recoverable. The carrying amount of a long-lived asset group is not recoverable if it exceeds the sum of
the undiscounted cash flows expected to result from the use and eventual disposition of the asset group. If it is determined
that an impairment loss has occurred, the loss is measured as the amount by which the carrying amount of the long-lived asset
group exceeds its fair value.
Leases
Leases in which the risk of ownership is retained by the lessor are classified as operating leases. Leases which substantially
transfer all of the benefits and risks inherent in ownership to the lessee are classified as capital leases. Assets acquired under
capital leases are depreciated on the same basis as property, plant and equipment. Rental payments are expensed on a
straight-line basis. Leasehold improvements are depreciated over the depreciable lives of the corresponding fixed assets or
the related lease term, whichever is shorter.
Structured Accounts Payable Arrangements
In Brazil, we finance some of our potash-based fertilizer and other raw material product purchases through third-party
financing arrangements. These arrangements provide that the third-party intermediary advance the amount of the scheduled
payment to the vendor, less an appropriate discount, at a scheduled payment date and Mosaic makes payment to the third-
party intermediary at a later date, stipulated in accordance with the commercial terms negotiated. At December
31, 2016 and 2015, these structured accounts payable arrangements were $128.8 million and $481.7 million, respectively.
53
Contingencies
Accruals for environmental remediation efforts are recorded when costs are probable and can be reasonably estimated. In
determining these accruals, we use the most current information available, including similar past experiences, available
technology, consultant evaluations, regulations in effect, the timing of remediation and cost-sharing arrangements.
We are involved from time to time in claims and legal actions incidental to our operations, both as plaintiff and defendant.
We have established what we currently believe to be adequate accruals for pending legal matters. These accruals are
established as part of an ongoing worldwide assessment of claims and legal actions that takes into consideration such items as
advice of legal counsel, individual developments in court proceedings, changes in the law, changes in business focus,
changes in the litigation environment, changes in opponent strategy and tactics, new developments as a result of ongoing
discovery, and past experience in defending and settling similar claims. The litigation accruals at any time reflect updated
assessments of the then-existing claims and legal actions. The final outcome or potential settlement of litigation matters could
differ materially from the accruals which we have established. Legal costs are expensed as incurred.
Pension and Other Postretirement Benefits
Mosaic offers a number of benefit plans that provide pension and other benefits to qualified employees. These plans include
defined benefit pension plans, supplemental pension plans, defined contribution plans and other postretirement benefit plans.
We accrue the funded status of our plans, which is representative of our obligations under employee benefit plans and the
related costs, net of plan assets measured at fair value. The cost of pensions and other retirement benefits earned by
employees is generally determined with the assistance of an actuary using the projected benefit method prorated on service
and management’s best estimate of expected plan investment performance, salary escalation, retirement ages of employees
and expected healthcare costs.
Additional Accounting Policies
To facilitate a better understanding of our consolidated financial statements we have disclosed the following significant
accounting policies (with the exception of those identified above) throughout the following notes, with the related financial
disclosures by major caption:
Note Topic Page
6 Earnings per Share 56
8 Investments in Non-Consolidated Companies 58
9 Goodwill 60
12 Income Taxes 64
13 Accounting for Asset Retirement Obligations 68
14 Accounting for Derivative and Hedging Activities 71
15 Fair Value Measurements 72
19 Share-Based Payments 81
3. RECENTLY ISSUED ACCOUNTING GUIDANCE
Recently Adopted Accounting Pronouncements
In April 2015, the Financial Accounting Standards Board ("FASB") issued guidance which requires debt issuance costs to be
presented in the balance sheet as a direct deduction from the carrying amount of the associated debt liability, consistent with
the presentation of a debt discount. In August 2015, the FASB issued additional guidance which clarified that an entity may
defer and present debt issuance costs related to a line-of-credit arrangement as an asset and subsequently amortize those costs
54
ratably over the term of the arrangement, regardless of whether there are any outstanding borrowings on it. This guidance
became effective for us beginning January 1, 2016, and has been implemented retroactively. Accordingly, we reclassified
$22.9 million of deferred financing fees against outstanding long-term debt accounts and $2.9 million of deferred financing
fees related to our revolving credit facility remain recorded as an asset within the December 31, 2015, balance sheet.
In March 2016, the FASB issued guidance which simplifies several aspects of the accounting for share-based payment
transactions, including certain income tax consequences, classifications on the statement of cash flows, and accounting for
forfeitures. The guidance is effective for us beginning January 1, 2017, and early application is permitted. We adopted this
standard effective January 1, 2016. The effect of this adoption was not significant to our consolidated balance sheets,
statements of earnings or statements of cash flows.
Pronouncements Issued But Not Yet Adopted
In May 2014, the FASB issued guidance addressing how revenue is recognized from contracts with customers and related
disclosures. This standard supersedes existing revenue recognition requirements and most industry-specific guidance. This
standard was initially expected to be effective for us beginning January 1, 2017, and provides for either full retrospective
adoption or a modified retrospective adoption by which the cumulative effect of the change is recognized in retained earnings
at the date of initial application. In July 2015, the FASB approved the deferral of the effective date of this standard by one
year by allowing for adoption either at January 1, 2017 or January 1, 2018. We intend to elect the deferred adoption date of
January 1, 2018 and are modeling the transition alternatives, but have not finalized our decision regarding the method of
implementation. We have reviewed our sales contracts and practices as compared to the new guidance and are working
through implementation steps and continue to evaluate our procedural and related system requirements related to the
provisions of this standard. In 2017, we will be rewriting our revenue recognition accounting policy and drafting new revenue
disclosures to reflect the requirements of this standard. We are currently evaluating the impact that this guidance will have on
our consolidated financial statements.
In January 2016, the FASB issued guidance which addresses certain aspects of recognition, measurement, presentation, and
disclosure of financial instruments. This guidance is effective for us beginning January 1, 2018, and early adoption is not
permitted. We are currently evaluating the impact that this guidance will have on our consolidated financial statements.
In February 2016, the FASB issued guidance which requires recognizing lease assets and lease liabilities on the balance sheet
and disclosing key information about leasing arrangements. This guidance is effective for us beginning January 1, 2019, with
early adoption permitted. The provisions of this guidance are to be applied using a modified retrospective approach, which
requires application of the guidance for all periods presented. We are currently gathering data for our lease arrangements and
evaluating potential system changes to determine the impact this guidance will have on our consolidated financial statements.
4. OTHER FINANCIAL STATEMENT DATA
The following provides additional information concerning selected balance sheet accounts:
December 31,
(in millions) 2016 2015
Receivables
Trade $ 550.8 $ 572.7
Non-trade 79.7 108.2
630.5
680.9
Less allowance for doubtful accounts 2.7 5.9
$ 627.8 $ 675.0
55
December 31,
(in millions) 2016 2015
Inventories
Raw materials $ 42.9 $ 68.1
Work in process 332.9 435.9
Finished goods 936.7 991.0
Operating materials and supplies 78.6 68.5
$ 1,391.1 $ 1,563.5
Other current assets
Final price deferred(a) $ 31.6 $ 175.6
Income and other taxes receivable 146.3 249.4
Prepaid expenses 99.9 123.1
Other 87.9 80.5
$ 365.7 $ 628.6
Other assets
MRO inventory $ 115.6 $ 118.1
Marketable securities held in trust - restricted(b) 611.0 —
Restricted cash(b) 31.3 851.4
Other 296.2 287.9
$ 1,054.1
$ 1,257.4
Accrued liabilities
Accrued dividends $ 101.8 $ 104.4
Payroll and employee benefits 142.9 162.9
Asset retirement obligations 102.0 91.9
Customer prepayments 145.6 121.2
Future capital commitment — 120.0
Other 345.0 377.1
$ 837.3
$ 977.5
Other noncurrent liabilities
Asset retirement obligations $ 747.9 $ 749.7
Accrued pension and postretirement benefits 64.9 69.6
Unrecognized tax benefits 27.2 79.2
Other 112.9 132.1
$ 952.9
$ 1,030.6
______________________________ (a) Final price deferred is product that has shipped to customers, but the price has not yet been agreed upon. This has not
been included in inventory as risk of loss has passed to our customers. Amounts in this account are based on inventoried
cost.
(b) Included in restricted cash, as of December 31, 2015, was approximately $200 million that was released to us following
our replacement of the financial assurance provided by this cash with a surety bond in 2016, and approximately $630
million that was placed in trust in August 2016, following the effectiveness of the consent decrees discussed under "EPA
RCRA Initiative" in Note 13 of our Notes to Consolidated Financial Statements. The funds have been invested in
marketable securities as discussed in Note 11 of our Consolidated Financial Statements.
56
Interest expense, net was comprised of the following in 2016, 2015 and 2014:
Years Ended December 31,
(in millions) 2016 2015 2014
Interest income $ 28.2
$ 35.8
$ 21.3
Less interest expense 140.6
133.6
128.9
Interest expense, net $ (112.4 ) $ (97.8 ) $ (107.6 )
5. PROPERTY, PLANT AND EQUIPMENT
Property, plant and equipment consist of the following:
December 31,
(in millions) 2016 2015
Land $ 237.3
$ 222.3
Mineral properties and rights 3,413.2
3,329.7
Buildings and leasehold improvements 2,302.8
2,100.5
Machinery and equipment 7,226.3
6,632.7
Construction in-progress 1,737.6
1,474.7
14,917.2
13,759.9
Less: accumulated depreciation and depletion 5,718.7
5,038.9
$ 9,198.5
$ 8,721.0
Depreciation and depletion expense was $703.8 million, $732.2 million and $750.9 million for 2016, 2015 and 2014,
respectively. Capitalized interest on major construction projects was $38.5 million, $36.1 million and $34.0
million for 2016, 2015 and 2014.
6. EARNINGS PER SHARE
We use the two-class method to compute basic and diluted earnings per share ("EPS"). Earnings for the period are allocated
pro-rata between the common shareholders and the participating securities. Our only participating securities were related to
the Share Repurchase Agreements discussed in Note 18 of our Notes to Consolidated Financial Statements. The numerator
for basic and diluted EPS is net earnings for common stockholders. The denominator for basic EPS is the weighted-average
number of shares outstanding during the period. The denominator for diluted EPS also includes the weighted average number
of additional common shares that would have been outstanding if the dilutive potential common shares had been issued,
unless the shares are anti-dilutive, and excludes shares subject to forward contracts.
57
The following is a reconciliation of the numerator and denominator for the basic and diluted EPS computations:
Years Ended December 31,
(in millions) 2016 2015 2014
Net earnings attributed to Mosaic $ 297.8
$ 1,000.4
$ 1,028.6
Undistributed earnings attributable to participating securities —
—
(22.3 )
Numerator for basic and diluted earnings available to common stockholders $ 297.8
$ 1,000.4
$ 1,006.3
Basic weighted average number of shares outstanding 350.4
358.5
382.4
Shares subject to forward contract —
—
(8.3 )
Basic weighted average number of shares outstanding attributable to common
stockholders 350.4
358.5
374.1
Dilutive impact of share-based awards 1.3
1.8
1.5
Diluted weighted average number of shares outstanding 351.7
360.3
375.6
Basic net earnings per share $ 0.85
$ 2.79
$ 2.69
Diluted net earnings per share $ 0.85
$ 2.78
$ 2.68
A total of 3.0 million shares for 2016, 2.2 million shares for 2015, and 2.1 million shares for 2014 of common stock subject
to issuance upon exercise of stock awards have been excluded from the calculation of diluted EPS because the effect would
be anti-dilutive.
7. CASH FLOW INFORMATION
Supplemental disclosures of cash paid for interest and income taxes and non-cash investing and financing information is as
follows:
Years Ended December 31,
(in millions) 2016 2015 2014
Cash paid (received) during the period for:
Interest $ 163.0
$ 162.3
$ 155.9
Less amount capitalized 38.5
36.1
34.0
Cash interest, net $ 124.5
$ 126.2
$ 121.9
Income taxes $ (65.4 ) $ 193.3
$ 113.2
Acquiring or constructing property, plant and equipment by incurring a liability does not result in a cash outflow for us until
the liability is paid. In the period the liability is incurred, the change in operating accounts payable on the Consolidated
Statements of Cash Flows is adjusted by such amount. In the period the liability is paid, the amount is reflected as a cash
outflow from investing activities. The applicable net change in operating accounts payable that was classified to investing
activities on the Consolidated Statements of Cash Flows was $43.7 million, $(21.9) million and $29.3 million for 2016, 2015,
and 2014 respectively.
We accrued $96.3 million related to the dividends declared in December 2016 that will be paid in the first quarter of 2017.
In September 2014, we accrued $120 million representing the remaining liability for our portion of mineral rights value
transferred to MWSPC from Ma’aden. The offset to this liability was recorded as an investment in nonconsolidated
companies. This amount was paid in 2016.
Depreciation, depletion and amortization includes $703.8 million and $732.2 million related to depreciation and depletion of
property, plant and equipment, and $7.4 million and $7.6 million related to amortization of intangible assets for 2016 and
2015, respectively.
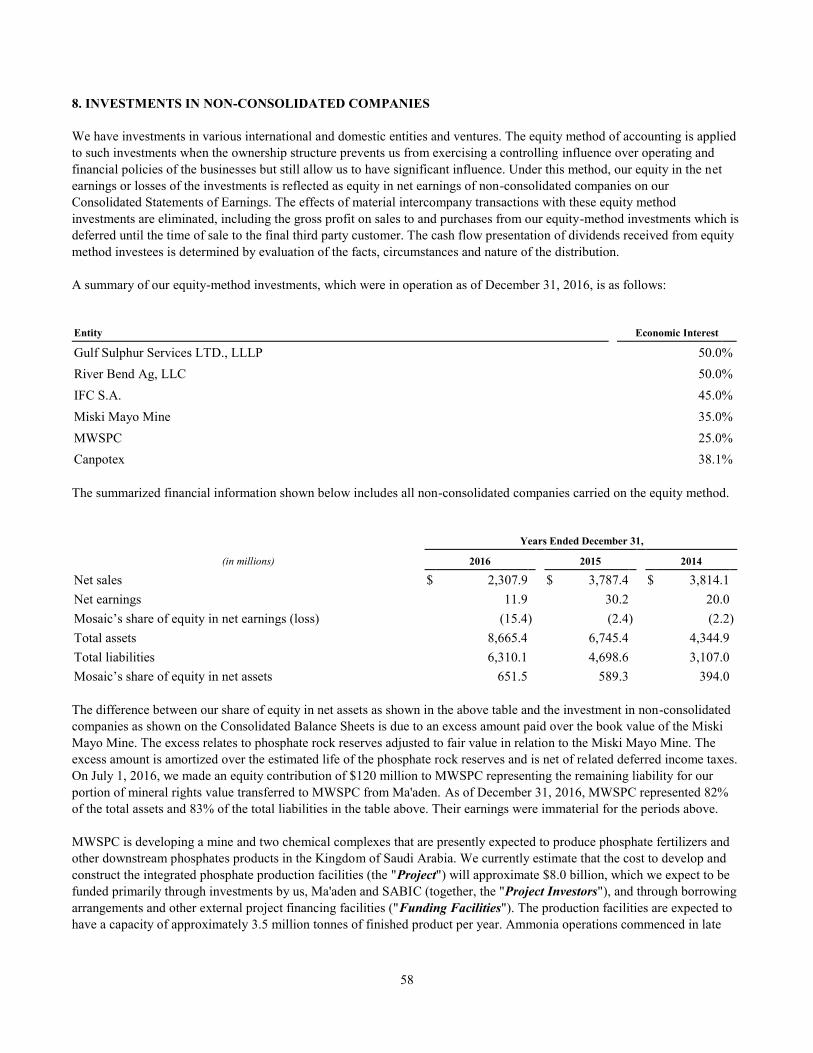
58
8. INVESTMENTS IN NON-CONSOLIDATED COMPANIES
We have investments in various international and domestic entities and ventures. The equity method of accounting is applied
to such investments when the ownership structure prevents us from exercising a controlling influence over operating and
financial policies of the businesses but still allow us to have significant influence. Under this method, our equity in the net
earnings or losses of the investments is reflected as equity in net earnings of non-consolidated companies on our
Consolidated Statements of Earnings. The effects of material intercompany transactions with these equity method
investments are eliminated, including the gross profit on sales to and purchases from our equity-method investments which is
deferred until the time of sale to the final third party customer. The cash flow presentation of dividends received from equity
method investees is determined by evaluation of the facts, circumstances and nature of the distribution.
A summary of our equity-method investments, which were in operation as of December 31, 2016, is as follows:
Entity Economic Interest
Gulf Sulphur Services LTD., LLLP 50.0 %
River Bend Ag, LLC 50.0 %
IFC S.A. 45.0 %
Miski Mayo Mine 35.0 %
MWSPC 25.0 %
Canpotex 38.1 %
The summarized financial information shown below includes all non-consolidated companies carried on the equity method.
Years Ended December 31,
(in millions) 2016 2015 2014
Net sales $ 2,307.9
$ 3,787.4
$ 3,814.1
Net earnings 11.9
30.2
20.0
Mosaic’s share of equity in net earnings (loss) (15.4 ) (2.4 ) (2.2 )
Total assets 8,665.4
6,745.4
4,344.9
Total liabilities 6,310.1
4,698.6
3,107.0
Mosaic’s share of equity in net assets 651.5
589.3
394.0
The difference between our share of equity in net assets as shown in the above table and the investment in non-consolidated
companies as shown on the Consolidated Balance Sheets is due to an excess amount paid over the book value of the Miski
Mayo Mine. The excess relates to phosphate rock reserves adjusted to fair value in relation to the Miski Mayo Mine. The
excess amount is amortized over the estimated life of the phosphate rock reserves and is net of related deferred income taxes.
On July 1, 2016, we made an equity contribution of $120 million to MWSPC representing the remaining liability for our
portion of mineral rights value transferred to MWSPC from Ma'aden. As of December 31, 2016, MWSPC represented 82%
of the total assets and 83% of the total liabilities in the table above. Their earnings were immaterial for the periods above.
MWSPC is developing a mine and two chemical complexes that are presently expected to produce phosphate fertilizers and
other downstream phosphates products in the Kingdom of Saudi Arabia. We currently estimate that the cost to develop and
construct the integrated phosphate production facilities (the "Project") will approximate $8.0 billion, which we expect to be
funded primarily through investments by us, Ma'aden and SABIC (together, the "Project Investors"), and through borrowing
arrangements and other external project financing facilities ("Funding Facilities"). The production facilities are expected to
have a capacity of approximately 3.5 million tonnes of finished product per year. Ammonia operations commenced in late
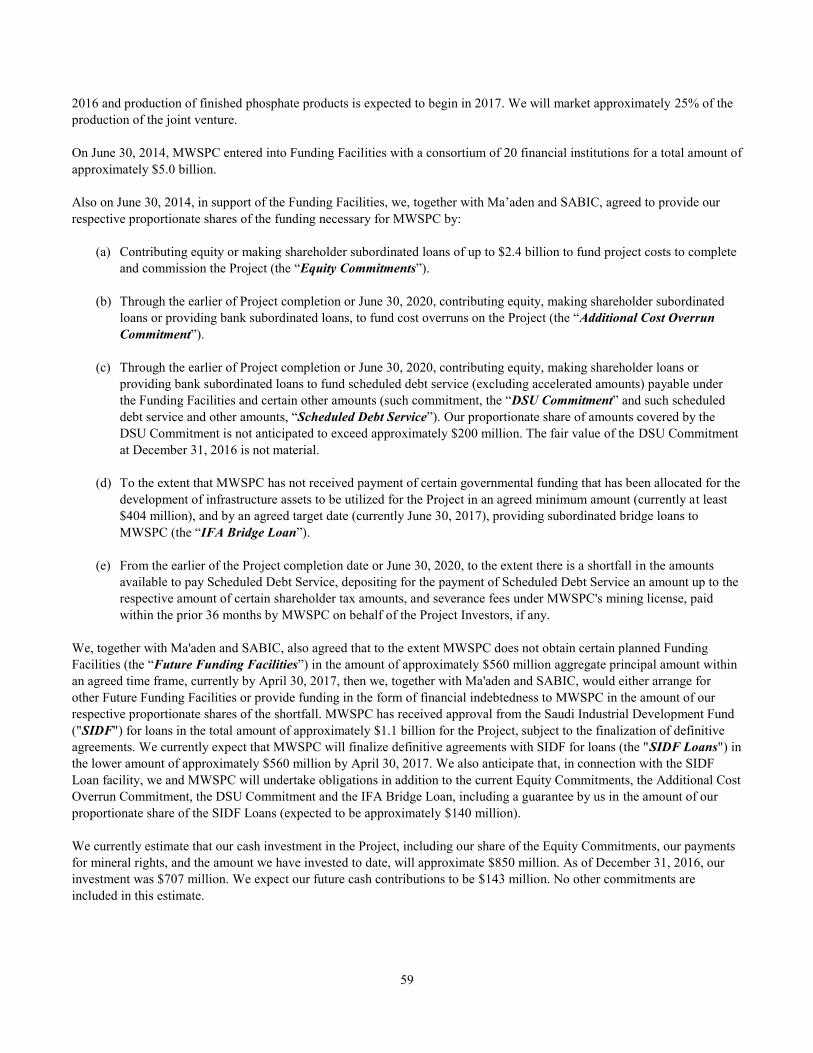
59
2016 and production of finished phosphate products is expected to begin in 2017. We will market approximately 25% of the
production of the joint venture.
On June 30, 2014, MWSPC entered into Funding Facilities with a consortium of 20 financial institutions for a total amount of
approximately $5.0 billion.
Also on June 30, 2014, in support of the Funding Facilities, we, together with Ma’aden and SABIC, agreed to provide our
respective proportionate shares of the funding necessary for MWSPC by:
(a) Contributing equity or making shareholder subordinated loans of up to $2.4 billion to fund project costs to complete
and commission the Project (the “Equity Commitments”).
(b) Through the earlier of Project completion or June 30, 2020, contributing equity, making shareholder subordinated
loans or providing bank subordinated loans, to fund cost overruns on the Project (the “Additional Cost Overrun
Commitment”).
(c) Through the earlier of Project completion or June 30, 2020, contributing equity, making shareholder loans or
providing bank subordinated loans to fund scheduled debt service (excluding accelerated amounts) payable under
the Funding Facilities and certain other amounts (such commitment, the “DSU Commitment” and such scheduled
debt service and other amounts, “Scheduled Debt Service”). Our proportionate share of amounts covered by the
DSU Commitment is not anticipated to exceed approximately $200 million. The fair value of the DSU Commitment
at December 31, 2016 is not material.
(d) To the extent that MWSPC has not received payment of certain governmental funding that has been allocated for the
development of infrastructure assets to be utilized for the Project in an agreed minimum amount (currently at least
$404 million), and by an agreed target date (currently June 30, 2017), providing subordinated bridge loans to
MWSPC (the “IFA Bridge Loan”).
(e) From the earlier of the Project completion date or June 30, 2020, to the extent there is a shortfall in the amounts
available to pay Scheduled Debt Service, depositing for the payment of Scheduled Debt Service an amount up to the
respective amount of certain shareholder tax amounts, and severance fees under MWSPC's mining license, paid
within the prior 36 months by MWSPC on behalf of the Project Investors, if any.
We, together with Ma'aden and SABIC, also agreed that to the extent MWSPC does not obtain certain planned Funding
Facilities (the “Future Funding Facilities”) in the amount of approximately $560 million aggregate principal amount within
an agreed time frame, currently by April 30, 2017, then we, together with Ma'aden and SABIC, would either arrange for
other Future Funding Facilities or provide funding in the form of financial indebtedness to MWSPC in the amount of our
respective proportionate shares of the shortfall. MWSPC has received approval from the Saudi Industrial Development Fund
("SIDF") for loans in the total amount of approximately $1.1 billion for the Project, subject to the finalization of definitive
agreements. We currently expect that MWSPC will finalize definitive agreements with SIDF for loans (the "SIDF Loans") in
the lower amount of approximately $560 million by April 30, 2017. We also anticipate that, in connection with the SIDF
Loan facility, we and MWSPC will undertake obligations in addition to the current Equity Commitments, the Additional Cost
Overrun Commitment, the DSU Commitment and the IFA Bridge Loan, including a guarantee by us in the amount of our
proportionate share of the SIDF Loans (expected to be approximately $140 million).
We currently estimate that our cash investment in the Project, including our share of the Equity Commitments, our payments
for mineral rights, and the amount we have invested to date, will approximate $850 million. As of December 31, 2016, our
investment was $707 million. We expect our future cash contributions to be $143 million. No other commitments are
included in this estimate.
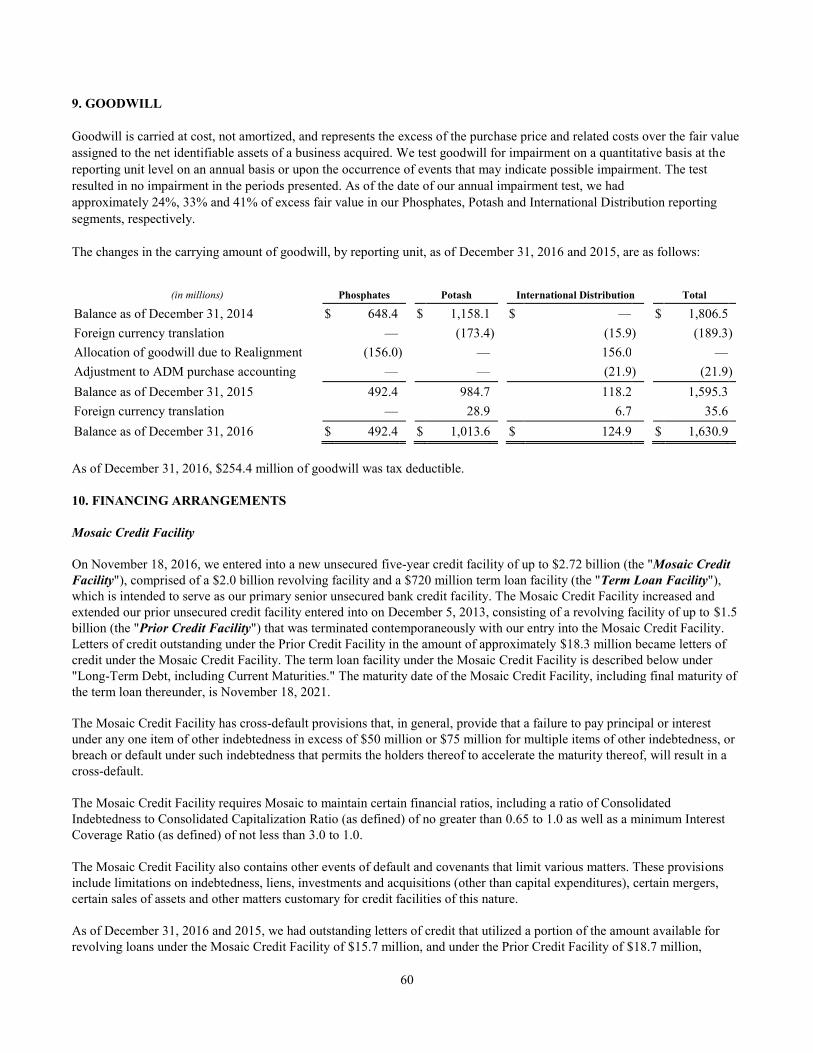
60
9. GOODWILL
Goodwill is carried at cost, not amortized, and represents the excess of the purchase price and related costs over the fair value
assigned to the net identifiable assets of a business acquired. We test goodwill for impairment on a quantitative basis at the
reporting unit level on an annual basis or upon the occurrence of events that may indicate possible impairment. The test
resulted in no impairment in the periods presented. As of the date of our annual impairment test, we had
approximately 24%, 33% and 41% of excess fair value in our Phosphates, Potash and International Distribution reporting
segments, respectively.
The changes in the carrying amount of goodwill, by reporting unit, as of December 31, 2016 and 2015, are as follows:
(in millions) Phosphates Potash International Distribution Total
Balance as of December 31, 2014 $ 648.4
$ 1,158.1
$ —
$ 1,806.5
Foreign currency translation —
(173.4 ) (15.9 ) (189.3 )
Allocation of goodwill due to Realignment (156.0 ) —
156.0
—
Adjustment to ADM purchase accounting —
—
(21.9 ) (21.9 )
Balance as of December 31, 2015 492.4
984.7
118.2
1,595.3
Foreign currency translation —
28.9
6.7
35.6
Balance as of December 31, 2016 $ 492.4
$ 1,013.6
$ 124.9
$ 1,630.9
As of December 31, 2016, $254.4 million of goodwill was tax deductible.
10. FINANCING ARRANGEMENTS
Mosaic Credit Facility
On November 18, 2016, we entered into a new unsecured five-year credit facility of up to $2.72 billion (the "Mosaic Credit
Facility"), comprised of a $2.0 billion revolving facility and a $720 million term loan facility (the "Term Loan Facility"),
which is intended to serve as our primary senior unsecured bank credit facility. The Mosaic Credit Facility increased and
extended our prior unsecured credit facility entered into on December 5, 2013, consisting of a revolving facility of up to $1.5
billion (the "Prior Credit Facility") that was terminated contemporaneously with our entry into the Mosaic Credit Facility.
Letters of credit outstanding under the Prior Credit Facility in the amount of approximately $18.3 million became letters of
credit under the Mosaic Credit Facility. The term loan facility under the Mosaic Credit Facility is described below under
"Long-Term Debt, including Current Maturities." The maturity date of the Mosaic Credit Facility, including final maturity of
the term loan thereunder, is November 18, 2021.
The Mosaic Credit Facility has cross-default provisions that, in general, provide that a failure to pay principal or interest
under any one item of other indebtedness in excess of $50 million or $75 million for multiple items of other indebtedness, or
breach or default under such indebtedness that permits the holders thereof to accelerate the maturity thereof, will result in a
cross-default.
The Mosaic Credit Facility requires Mosaic to maintain certain financial ratios, including a ratio of Consolidated
Indebtedness to Consolidated Capitalization Ratio (as defined) of no greater than 0.65 to 1.0 as well as a minimum Interest
Coverage Ratio (as defined) of not less than 3.0 to 1.0.
The Mosaic Credit Facility also contains other events of default and covenants that limit various matters. These provisions
include limitations on indebtedness, liens, investments and acquisitions (other than capital expenditures), certain mergers,
certain sales of assets and other matters customary for credit facilities of this nature.
As of December 31, 2016 and 2015, we had outstanding letters of credit that utilized a portion of the amount available for
revolving loans under the Mosaic Credit Facility of $15.7 million, and under the Prior Credit Facility of $18.7 million,
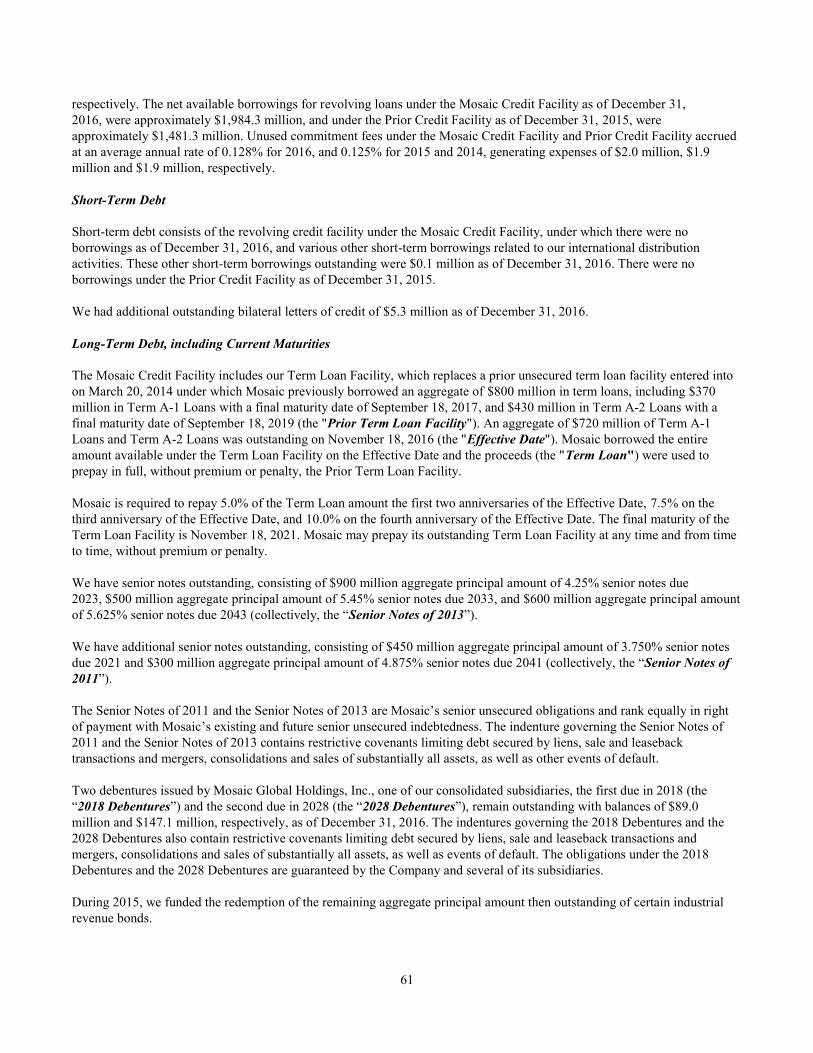
61
respectively. The net available borrowings for revolving loans under the Mosaic Credit Facility as of December 31,
2016, were approximately $1,984.3 million, and under the Prior Credit Facility as of December 31, 2015, were
approximately $1,481.3 million. Unused commitment fees under the Mosaic Credit Facility and Prior Credit Facility accrued
at an average annual rate of 0.128% for 2016, and 0.125% for 2015 and 2014, generating expenses of $2.0 million, $1.9
million and $1.9 million, respectively.
Short-Term Debt
Short-term debt consists of the revolving credit facility under the Mosaic Credit Facility, under which there were no
borrowings as of December 31, 2016, and various other short-term borrowings related to our international distribution
activities. These other short-term borrowings outstanding were $0.1 million as of December 31, 2016. There were no
borrowings under the Prior Credit Facility as of December 31, 2015.
We had additional outstanding bilateral letters of credit of $5.3 million as of December 31, 2016.
Long-Term Debt, including Current Maturities
The Mosaic Credit Facility includes our Term Loan Facility, which replaces a prior unsecured term loan facility entered into
on March 20, 2014 under which Mosaic previously borrowed an aggregate of $800 million in term loans, including $370
million in Term A-1 Loans with a final maturity date of September 18, 2017, and $430 million in Term A-2 Loans with a
final maturity date of September 18, 2019 (the "Prior Term Loan Facility"). An aggregate of $720 million of Term A-1
Loans and Term A-2 Loans was outstanding on November 18, 2016 (the "Effective Date"). Mosaic borrowed the entire
amount available under the Term Loan Facility on the Effective Date and the proceeds (the "Term Loan") were used to
prepay in full, without premium or penalty, the Prior Term Loan Facility.
Mosaic is required to repay 5.0% of the Term Loan amount the first two anniversaries of the Effective Date, 7.5% on the
third anniversary of the Effective Date, and 10.0% on the fourth anniversary of the Effective Date. The final maturity of the
Term Loan Facility is November 18, 2021. Mosaic may prepay its outstanding Term Loan Facility at any time and from time
to time, without premium or penalty.
We have senior notes outstanding, consisting of $900 million aggregate principal amount of 4.25% senior notes due
2023, $500 million aggregate principal amount of 5.45% senior notes due 2033, and $600 million aggregate principal amount
of 5.625% senior notes due 2043 (collectively, the “Senior Notes of 2013”).
We have additional senior notes outstanding, consisting of $450 million aggregate principal amount of 3.750% senior notes
due 2021 and $300 million aggregate principal amount of 4.875% senior notes due 2041 (collectively, the “Senior Notes of
2011”).
The Senior Notes of 2011 and the Senior Notes of 2013 are Mosaic’s senior unsecured obligations and rank equally in right
of payment with Mosaic’s existing and future senior unsecured indebtedness. The indenture governing the Senior Notes of
2011 and the Senior Notes of 2013 contains restrictive covenants limiting debt secured by liens, sale and leaseback
transactions and mergers, consolidations and sales of substantially all assets, as well as other events of default.
Two debentures issued by Mosaic Global Holdings, Inc., one of our consolidated subsidiaries, the first due in 2018 (the
“2018 Debentures”) and the second due in 2028 (the “2028 Debentures”), remain outstanding with balances of $89.0
million and $147.1 million, respectively, as of December 31, 2016. The indentures governing the 2018 Debentures and the
2028 Debentures also contain restrictive covenants limiting debt secured by liens, sale and leaseback transactions and
mergers, consolidations and sales of substantially all assets, as well as events of default. The obligations under the 2018
Debentures and the 2028 Debentures are guaranteed by the Company and several of its subsidiaries.
During 2015, we funded the redemption of the remaining aggregate principal amount then outstanding of certain industrial
revenue bonds.
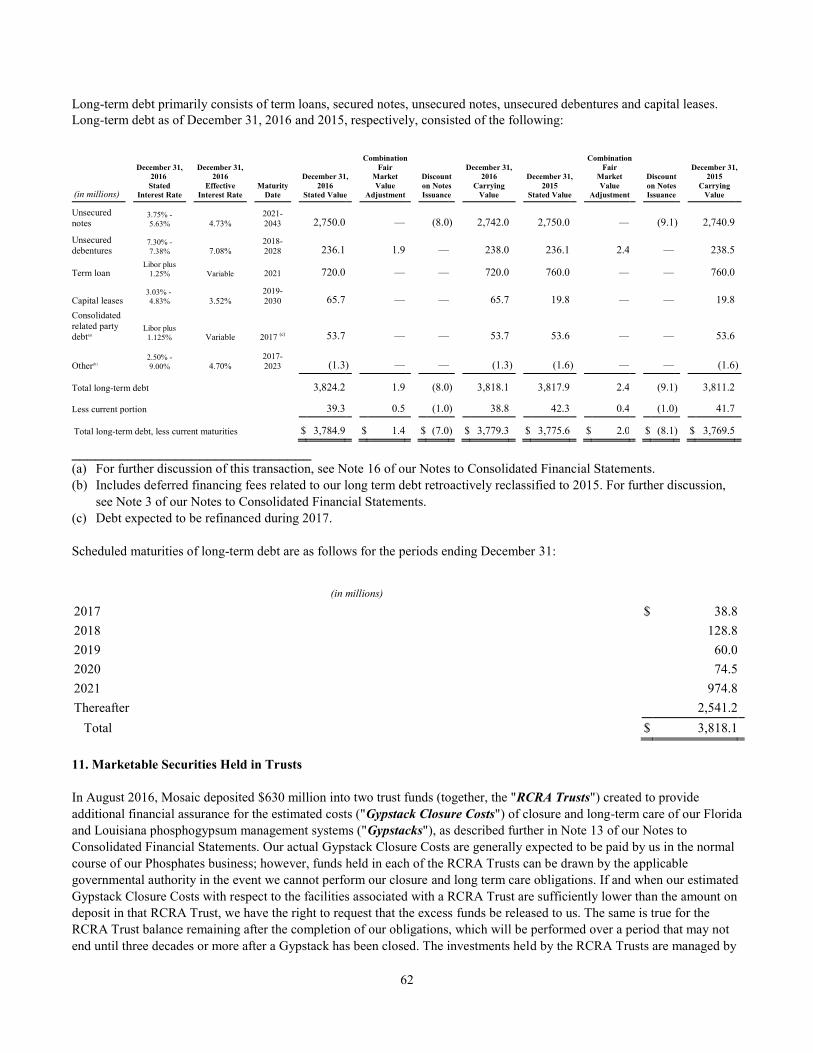
62
Long-term debt primarily consists of term loans, secured notes, unsecured notes, unsecured debentures and capital leases.
Long-term debt as of December 31, 2016 and 2015, respectively, consisted of the following:
(in millions)
December 31,
2016
Stated
Interest Rate
December 31,
2016
Effective
Interest Rate Maturity
Date
December 31,
2016
Stated Value
Combination
Fair
Market
Value
Adjustment
Discount
on Notes
Issuance
December 31,
2016
Carrying
Value
December 31,
2015
Stated Value
Combination
Fair
Market
Value
Adjustment
Discount
on Notes
Issuance
December 31,
2015
Carrying
Value
Unsecured
notes 3.75% -
5.63% 4.73% 2021-
2043 2,750.0
—
(8.0 ) 2,742.0
2,750.0
—
(9.1 ) 2,740.9
Unsecured
debentures 7.30% -
7.38% 7.08% 2018-
2028 236.1
1.9
—
238.0
236.1
2.4
—
238.5
Term loan
Libor plus
1.25% Variable 2021 720.0
—
—
720.0
760.0
—
—
760.0
Capital leases
3.03% -
4.83% 3.52% 2019-
2030 65.7
—
—
65.7
19.8
—
—
19.8
Consolidated
related party
debt(a) Libor plus
1.125% Variable 2017 (c)
53.7
—
—
53.7
53.6
—
—
53.6
Other(b)
2.50% -
9.00% 4.70% 2017-
2023 (1.3 ) —
—
(1.3 ) (1.6 ) —
—
(1.6 )
Total long-term debt 3,824.2
1.9
(8.0 )
3,818.1
3,817.9
2.4
(9.1 )
3,811.2
Less current portion 39.3
0.5
(1.0 ) 38.8
42.3
0.4
(1.0 ) 41.7
Total long-term debt, less current maturities $ 3,784.9
$ 1.4
$ (7.0 )
$ 3,779.3
$ 3,775.6
$ 2.0
$ (8.1 )
$ 3,769.5
______________________________ (a) For further discussion of this transaction, see Note 16 of our Notes to Consolidated Financial Statements.
(b) Includes deferred financing fees related to our long term debt retroactively reclassified to 2015. For further discussion,
see Note 3 of our Notes to Consolidated Financial Statements.
(c) Debt expected to be refinanced during 2017.
Scheduled maturities of long-term debt are as follows for the periods ending December 31:
(in millions)
2017 $ 38.8
2018 128.8
2019 60.0
2020 74.5
2021 974.8
Thereafter 2,541.2
Total $ 3,818.1
11. Marketable Securities Held in Trusts
In August 2016, Mosaic deposited $630 million into two trust funds (together, the "RCRA Trusts") created to provide
additional financial assurance for the estimated costs ("Gypstack Closure Costs") of closure and long-term care of our Florida
and Louisiana phosphogypsum management systems ("Gypstacks"), as described further in Note 13 of our Notes to
Consolidated Financial Statements. Our actual Gypstack Closure Costs are generally expected to be paid by us in the normal
course of our Phosphates business; however, funds held in each of the RCRA Trusts can be drawn by the applicable
governmental authority in the event we cannot perform our closure and long term care obligations. If and when our estimated
Gypstack Closure Costs with respect to the facilities associated with a RCRA Trust are sufficiently lower than the amount on
deposit in that RCRA Trust, we have the right to request that the excess funds be released to us. The same is true for the
RCRA Trust balance remaining after the completion of our obligations, which will be performed over a period that may not
end until three decades or more after a Gypstack has been closed. The investments held by the RCRA Trusts are managed by
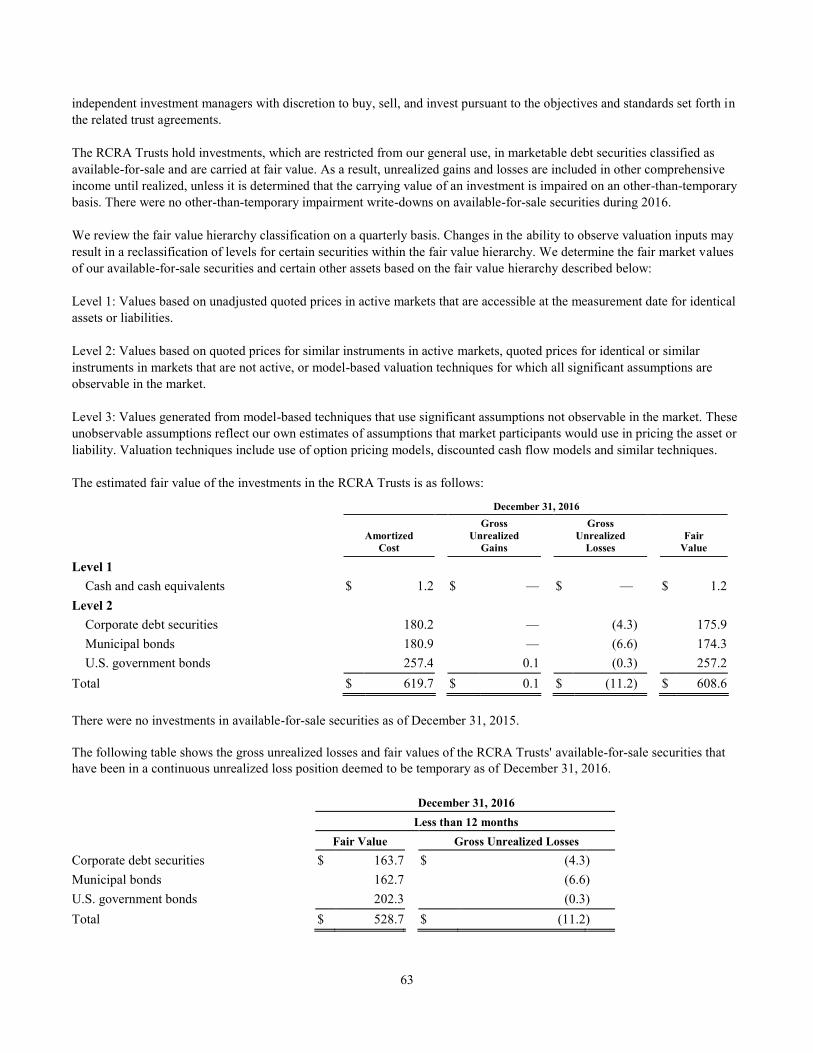
63
independent investment managers with discretion to buy, sell, and invest pursuant to the objectives and standards set forth in
the related trust agreements.
The RCRA Trusts hold investments, which are restricted from our general use, in marketable debt securities classified as
available-for-sale and are carried at fair value. As a result, unrealized gains and losses are included in other comprehensive
income until realized, unless it is determined that the carrying value of an investment is impaired on an other-than-temporary
basis. There were no other-than-temporary impairment write-downs on available-for-sale securities during 2016.
We review the fair value hierarchy classification on a quarterly basis. Changes in the ability to observe valuation inputs may
result in a reclassification of levels for certain securities within the fair value hierarchy. We determine the fair market values
of our available-for-sale securities and certain other assets based on the fair value hierarchy described below:
Level 1: Values based on unadjusted quoted prices in active markets that are accessible at the measurement date for identical
assets or liabilities.
Level 2: Values based on quoted prices for similar instruments in active markets, quoted prices for identical or similar
instruments in markets that are not active, or model-based valuation techniques for which all significant assumptions are
observable in the market.
Level 3: Values generated from model-based techniques that use significant assumptions not observable in the market. These
unobservable assumptions reflect our own estimates of assumptions that market participants would use in pricing the asset or
liability. Valuation techniques include use of option pricing models, discounted cash flow models and similar techniques.
The estimated fair value of the investments in the RCRA Trusts is as follows:
December 31, 2016
Amortized
Cost
Gross
Unrealized
Gains
Gross
Unrealized
Losses Fair
Value
Level 1
Cash and cash equivalents $ 1.2
$ —
$ —
$ 1.2
Level 2
Corporate debt securities 180.2
—
(4.3 ) 175.9
Municipal bonds 180.9
—
(6.6 ) 174.3
U.S. government bonds 257.4
0.1
(0.3 ) 257.2
Total $ 619.7
$ 0.1
$ (11.2 ) $ 608.6
There were no investments in available-for-sale securities as of December 31, 2015.
The following table shows the gross unrealized losses and fair values of the RCRA Trusts' available-for-sale securities that
have been in a continuous unrealized loss position deemed to be temporary as of December 31, 2016.
December 31, 2016
Less than 12 months
Fair Value Gross Unrealized Losses
Corporate debt securities $ 163.7
$ (4.3 )
Municipal bonds 162.7
(6.6 )
U.S. government bonds 202.3
(0.3 )
Total $ 528.7
$ (11.2 )
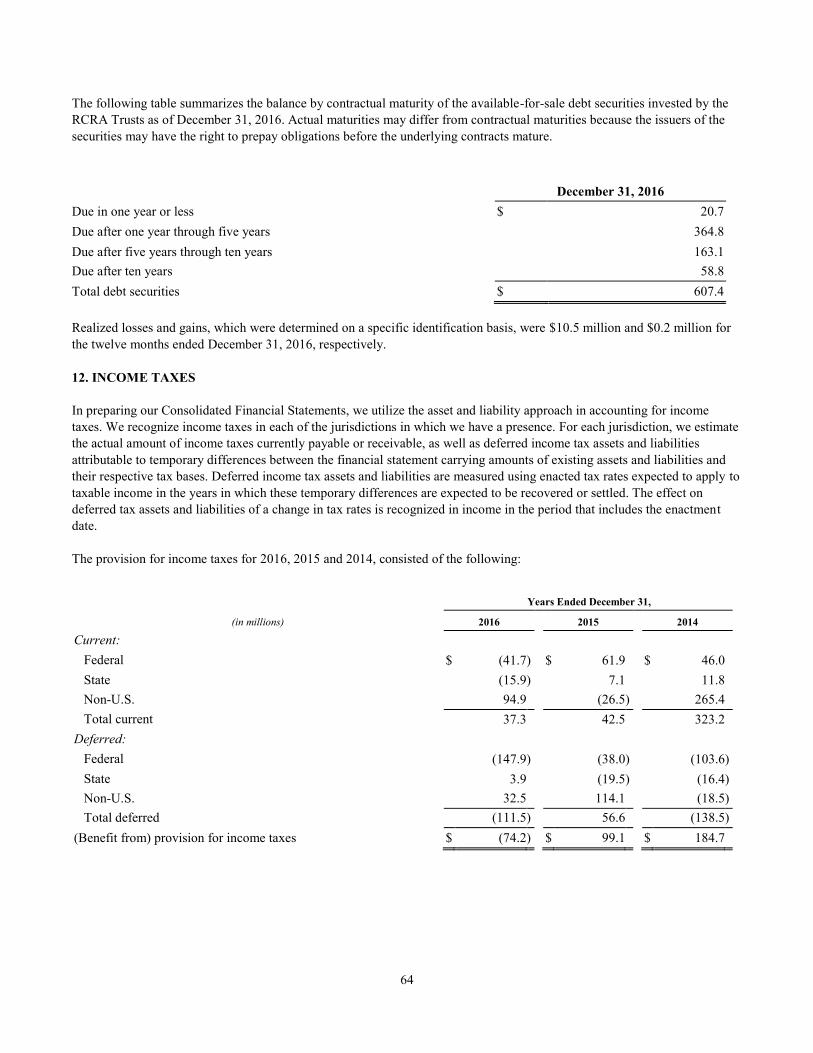
64
The following table summarizes the balance by contractual maturity of the available-for-sale debt securities invested by the
RCRA Trusts as of December 31, 2016. Actual maturities may differ from contractual maturities because the issuers of the
securities may have the right to prepay obligations before the underlying contracts mature.
December 31, 2016
Due in one year or less $ 20.7
Due after one year through five years 364.8
Due after five years through ten years 163.1
Due after ten years 58.8
Total debt securities $ 607.4
Realized losses and gains, which were determined on a specific identification basis, were $10.5 million and $0.2 million for
the twelve months ended December 31, 2016, respectively.
12. INCOME TAXES
In preparing our Consolidated Financial Statements, we utilize the asset and liability approach in accounting for income
taxes. We recognize income taxes in each of the jurisdictions in which we have a presence. For each jurisdiction, we estimate
the actual amount of income taxes currently payable or receivable, as well as deferred income tax assets and liabilities
attributable to temporary differences between the financial statement carrying amounts of existing assets and liabilities and
their respective tax bases. Deferred income tax assets and liabilities are measured using enacted tax rates expected to apply to
taxable income in the years in which these temporary differences are expected to be recovered or settled. The effect on
deferred tax assets and liabilities of a change in tax rates is recognized in income in the period that includes the enactment
date.
The provision for income taxes for 2016, 2015 and 2014, consisted of the following:
Years Ended December 31,
(in millions) 2016 2015 2014
Current:
Federal $ (41.7 ) $ 61.9
$ 46.0
State (15.9 ) 7.1
11.8
Non-U.S. 94.9
(26.5 ) 265.4
Total current 37.3
42.5
323.2
Deferred:
Federal (147.9 ) (38.0 ) (103.6 )
State 3.9
(19.5 ) (16.4 )
Non-U.S. 32.5
114.1
(18.5 )
Total deferred (111.5 ) 56.6
(138.5 )
(Benefit from) provision for income taxes $ (74.2 ) $ 99.1
$ 184.7
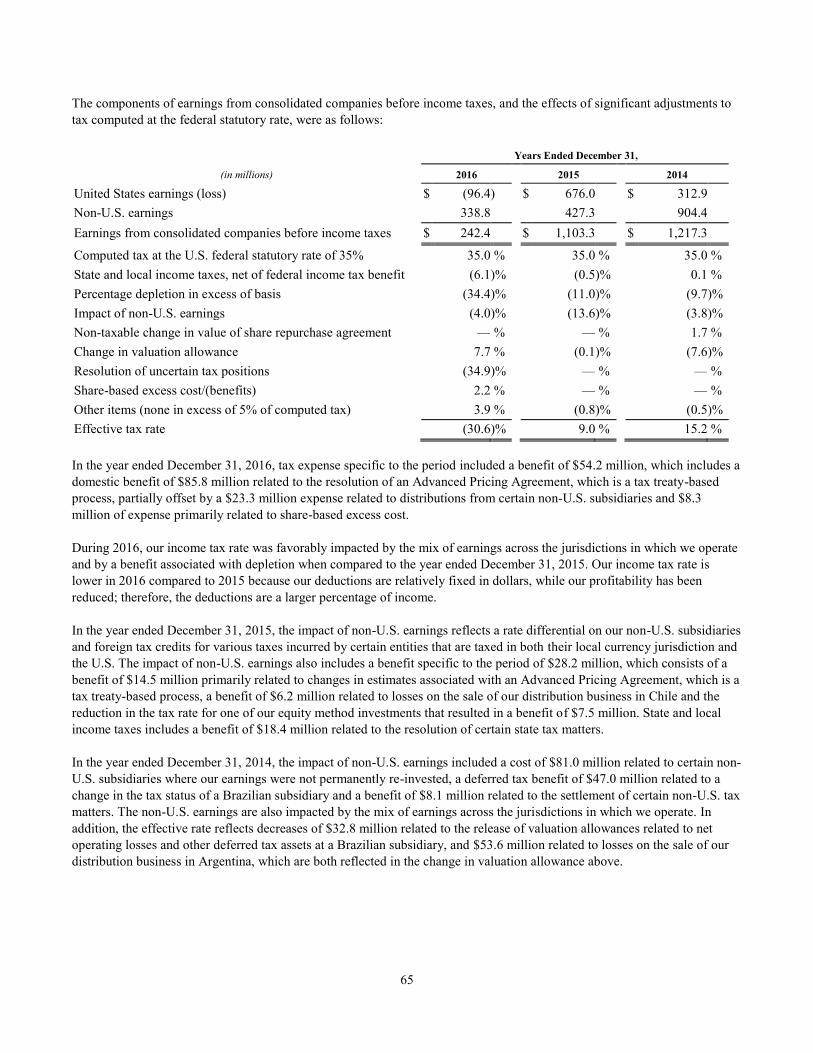
65
The components of earnings from consolidated companies before income taxes, and the effects of significant adjustments to
tax computed at the federal statutory rate, were as follows:
Years Ended December 31,
(in millions) 2016 2015 2014
United States earnings (loss) $ (96.4 ) $ 676.0
$ 312.9
Non-U.S. earnings 338.8
427.3
904.4
Earnings from consolidated companies before income taxes $ 242.4
$ 1,103.3
$ 1,217.3
Computed tax at the U.S. federal statutory rate of 35% 35.0 % 35.0 % 35.0 %
State and local income taxes, net of federal income tax benefit (6.1 )% (0.5 )% 0.1 %
Percentage depletion in excess of basis (34.4 )% (11.0 )% (9.7 )%
Impact of non-U.S. earnings (4.0 )% (13.6 )% (3.8 )%
Non-taxable change in value of share repurchase agreement — % — % 1.7 %
Change in valuation allowance 7.7 % (0.1 )% (7.6 )%
Resolution of uncertain tax positions (34.9 )% — % — %
Share-based excess cost/(benefits) 2.2 % — % — %
Other items (none in excess of 5% of computed tax) 3.9 % (0.8 )% (0.5 )%
Effective tax rate (30.6 )% 9.0 % 15.2 %
In the year ended December 31, 2016, tax expense specific to the period included a benefit of $54.2 million, which includes a
domestic benefit of $85.8 million related to the resolution of an Advanced Pricing Agreement, which is a tax treaty-based
process, partially offset by a $23.3 million expense related to distributions from certain non-U.S. subsidiaries and $8.3
million of expense primarily related to share-based excess cost.
During 2016, our income tax rate was favorably impacted by the mix of earnings across the jurisdictions in which we operate
and by a benefit associated with depletion when compared to the year ended December 31, 2015. Our income tax rate is
lower in 2016 compared to 2015 because our deductions are relatively fixed in dollars, while our profitability has been
reduced; therefore, the deductions are a larger percentage of income.
In the year ended December 31, 2015, the impact of non-U.S. earnings reflects a rate differential on our non-U.S. subsidiaries
and foreign tax credits for various taxes incurred by certain entities that are taxed in both their local currency jurisdiction and
the U.S. The impact of non-U.S. earnings also includes a benefit specific to the period of $28.2 million, which consists of a
benefit of $14.5 million primarily related to changes in estimates associated with an Advanced Pricing Agreement, which is a
tax treaty-based process, a benefit of $6.2 million related to losses on the sale of our distribution business in Chile and the
reduction in the tax rate for one of our equity method investments that resulted in a benefit of $7.5 million. State and local
income taxes includes a benefit of $18.4 million related to the resolution of certain state tax matters.
In the year ended December 31, 2014, the impact of non-U.S. earnings included a cost of $81.0 million related to certain non-
U.S. subsidiaries where our earnings were not permanently re-invested, a deferred tax benefit of $47.0 million related to a
change in the tax status of a Brazilian subsidiary and a benefit of $8.1 million related to the settlement of certain non-U.S. tax
matters. The non-U.S. earnings are also impacted by the mix of earnings across the jurisdictions in which we operate. In
addition, the effective rate reflects decreases of $32.8 million related to the release of valuation allowances related to net
operating losses and other deferred tax assets at a Brazilian subsidiary, and $53.6 million related to losses on the sale of our
distribution business in Argentina, which are both reflected in the change in valuation allowance above.
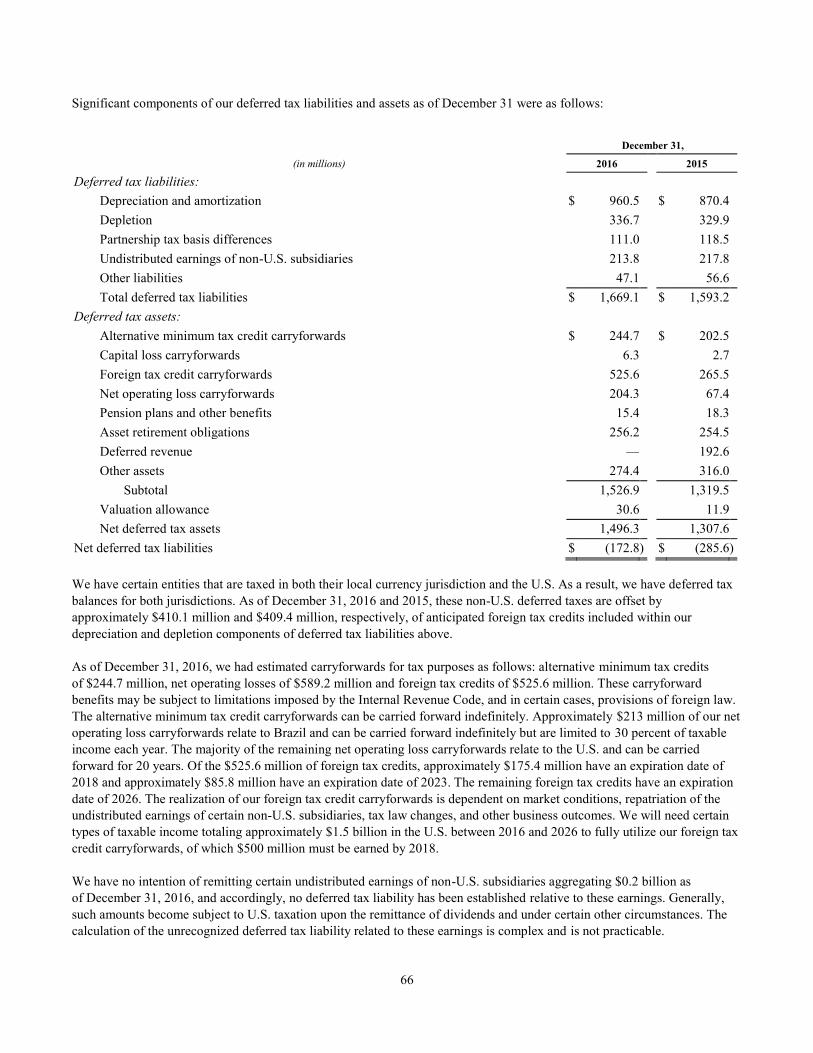
66
Significant components of our deferred tax liabilities and assets as of December 31 were as follows:
December 31,
(in millions) 2016 2015
Deferred tax liabilities:
Depreciation and amortization $ 960.5
$ 870.4
Depletion 336.7
329.9
Partnership tax basis differences 111.0
118.5
Undistributed earnings of non-U.S. subsidiaries 213.8
217.8
Other liabilities 47.1
56.6
Total deferred tax liabilities $ 1,669.1
$ 1,593.2
Deferred tax assets:
Alternative minimum tax credit carryforwards $ 244.7
$ 202.5
Capital loss carryforwards 6.3
2.7
Foreign tax credit carryforwards 525.6
265.5
Net operating loss carryforwards 204.3
67.4
Pension plans and other benefits 15.4
18.3
Asset retirement obligations 256.2
254.5
Deferred revenue —
192.6
Other assets 274.4
316.0
Subtotal 1,526.9
1,319.5
Valuation allowance 30.6
11.9
Net deferred tax assets 1,496.3
1,307.6
Net deferred tax liabilities $ (172.8 ) $ (285.6 )
We have certain entities that are taxed in both their local currency jurisdiction and the U.S. As a result, we have deferred tax
balances for both jurisdictions. As of December 31, 2016 and 2015, these non-U.S. deferred taxes are offset by
approximately $410.1 million and $409.4 million, respectively, of anticipated foreign tax credits included within our
depreciation and depletion components of deferred tax liabilities above.
As of December 31, 2016, we had estimated carryforwards for tax purposes as follows: alternative minimum tax credits
of $244.7 million, net operating losses of $589.2 million and foreign tax credits of $525.6 million. These carryforward
benefits may be subject to limitations imposed by the Internal Revenue Code, and in certain cases, provisions of foreign law.
The alternative minimum tax credit carryforwards can be carried forward indefinitely. Approximately $213 million of our net
operating loss carryforwards relate to Brazil and can be carried forward indefinitely but are limited to 30 percent of taxable
income each year. The majority of the remaining net operating loss carryforwards relate to the U.S. and can be carried
forward for 20 years. Of the $525.6 million of foreign tax credits, approximately $175.4 million have an expiration date of
2018 and approximately $85.8 million have an expiration date of 2023. The remaining foreign tax credits have an expiration
date of 2026. The realization of our foreign tax credit carryforwards is dependent on market conditions, repatriation of the
undistributed earnings of certain non-U.S. subsidiaries, tax law changes, and other business outcomes. We will need certain
types of taxable income totaling approximately $1.5 billion in the U.S. between 2016 and 2026 to fully utilize our foreign tax
credit carryforwards, of which $500 million must be earned by 2018.
We have no intention of remitting certain undistributed earnings of non-U.S. subsidiaries aggregating $0.2 billion as
of December 31, 2016, and accordingly, no deferred tax liability has been established relative to these earnings. Generally,
such amounts become subject to U.S. taxation upon the remittance of dividends and under certain other circumstances. The
calculation of the unrecognized deferred tax liability related to these earnings is complex and is not practicable.
67
Valuation Allowance
In assessing the need for a valuation allowance, we consider whether it is more likely than not that some portion or all of the
deferred tax assets will not be realized. We evaluate our ability to realize the tax benefits associated with deferred tax assets
by analyzing the relative impact of all the available positive and negative evidence regarding our forecasted taxable income
using both historical and projected future operating results, the reversal of existing taxable temporary differences, taxable
income in prior carry-back years (if permitted) and the availability of tax planning strategies. The ultimate realization of
deferred tax assets is dependent upon the generation of certain types of future taxable income during the periods in which
those temporary differences become deductible. In making this assessment, we consider the scheduled reversal of deferred
tax liabilities, our ability to carry back the deferred tax asset, projected future taxable income, and tax planning strategies. A
valuation allowance will be recorded in each jurisdiction in which a deferred income tax asset is recorded when it is more
likely than not that the deferred income tax asset will not be realized. Changes in deferred tax asset valuation allowances
typically impact income tax expense.
For the year ended December 31, 2016, the valuation allowance increased by $18.7 million primarily due to the conclusion
we are not more likely than not to use attributes at a Netherlands subsidiary and certain U.S. states.
For the year ended year ended December 31, 2015, the valuation allowance decreased $16.4 million primarily due to the sale
of the Chile distribution business.
Prior to the year ended December 31, 2014, we had provided a valuation allowance for deferred tax assets primarily related to
net operating losses at certain non-U.S. subsidiaries. As of December 31, 2014, we determined that sufficient positive
evidence existed to conclude it was more likely than not that we would realize the benefits of the net operating loss and other
deferred tax assets at a Brazilian subsidiary for which a valuation allowance had been recorded. We also concluded that it
was more likely than not that we would realize the benefits related to losses on the sale of a distribution business in a non-
U.S. subsidiary. Accordingly, during the year ended December 31, 2014, the valuation allowance decreased $100.9
million primarily related to these two items.
Uncertain Tax Positions
Accounting for uncertain income tax positions is determined by prescribing a minimum probability threshold that a tax
position must meet before a financial statement benefit is recognized. This minimum threshold is that a tax position is more
likely than not to be sustained upon examination by the applicable taxing authority, including resolution of any related
appeals or litigation processes, based on the technical merits of the position. The tax benefit to be recognized is measured as
the largest amount of benefit that is greater than a fifty percent likelihood of being realized upon ultimate settlement.
As of December 31, 2016, we had $27.1 million of gross uncertain tax positions. If recognized, the benefit to our effective
tax rate in future periods would be approximately $12.0 million of that amount. During 2016, we recorded a domestic benefit
of $85.8 million related to the resolution of an Advanced Pricing Agreement, which is a tax treaty-based process, which was
included in the amount of gross decreases related to the prior period tax positions of $91.6 million. We also recorded gross
increases in our uncertain tax positions of $20.4 million related to certain non-U.S. tax matters, of which $5.0 million
impacted the effective tax rate. This increase was offset by items not included in gross uncertain tax positions.
Based upon the information available as of December 31, 2016, it is reasonably possible that the amount of unrecognized tax
benefits will change in the next twelve months; however, the change cannot reasonably be estimated.
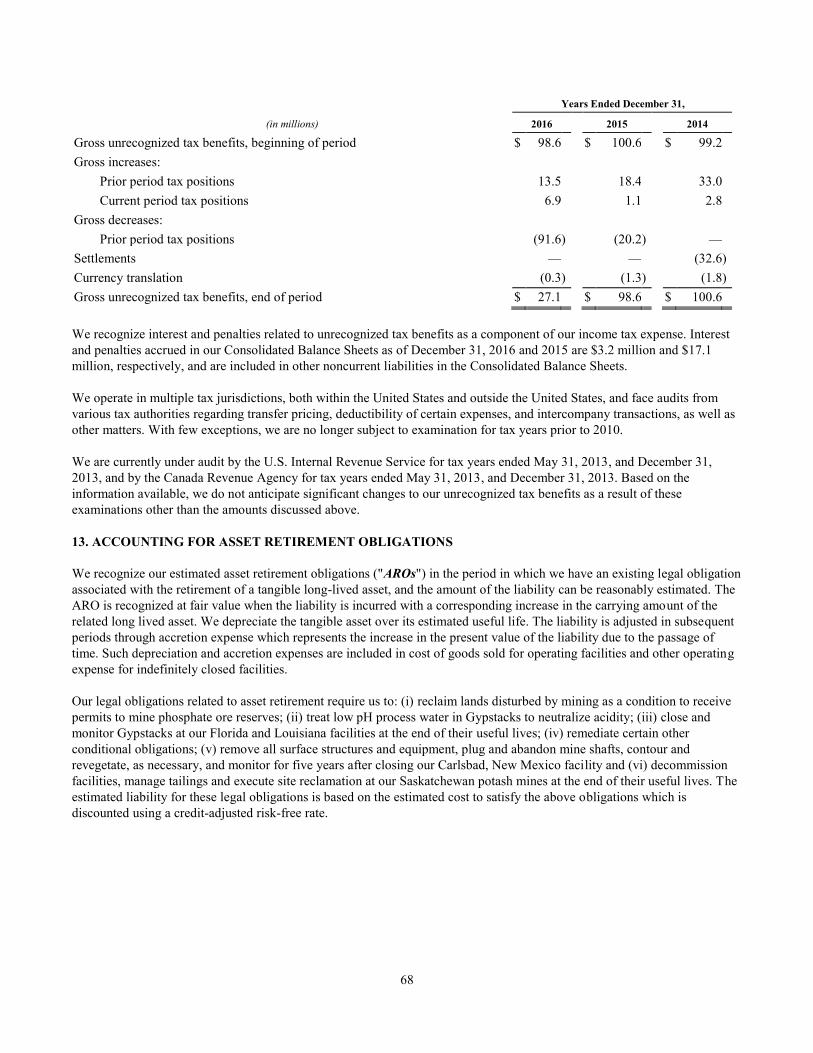
68
Years Ended December 31,
(in millions) 2016 2015 2014
Gross unrecognized tax benefits, beginning of period $ 98.6
$ 100.6
$ 99.2
Gross increases:
Prior period tax positions 13.5
18.4
33.0
Current period tax positions 6.9
1.1
2.8
Gross decreases:
Prior period tax positions (91.6 ) (20.2 ) —
Settlements —
—
(32.6 )
Currency translation (0.3 ) (1.3 ) (1.8 )
Gross unrecognized tax benefits, end of period $ 27.1
$ 98.6
$ 100.6
We recognize interest and penalties related to unrecognized tax benefits as a component of our income tax expense. Interest
and penalties accrued in our Consolidated Balance Sheets as of December 31, 2016 and 2015 are $3.2 million and $17.1
million, respectively, and are included in other noncurrent liabilities in the Consolidated Balance Sheets.
We operate in multiple tax jurisdictions, both within the United States and outside the United States, and face audits from
various tax authorities regarding transfer pricing, deductibility of certain expenses, and intercompany transactions, as well as
other matters. With few exceptions, we are no longer subject to examination for tax years prior to 2010.
We are currently under audit by the U.S. Internal Revenue Service for tax years ended May 31, 2013, and December 31,
2013, and by the Canada Revenue Agency for tax years ended May 31, 2013, and December 31, 2013. Based on the
information available, we do not anticipate significant changes to our unrecognized tax benefits as a result of these
examinations other than the amounts discussed above.
13. ACCOUNTING FOR ASSET RETIREMENT OBLIGATIONS
We recognize our estimated asset retirement obligations ("AROs") in the period in which we have an existing legal obligation
associated with the retirement of a tangible long-lived asset, and the amount of the liability can be reasonably estimated. The
ARO is recognized at fair value when the liability is incurred with a corresponding increase in the carrying amount of the
related long lived asset. We depreciate the tangible asset over its estimated useful life. The liability is adjusted in subsequent
periods through accretion expense which represents the increase in the present value of the liability due to the passage of
time. Such depreciation and accretion expenses are included in cost of goods sold for operating facilities and other operating
expense for indefinitely closed facilities.
Our legal obligations related to asset retirement require us to: (i) reclaim lands disturbed by mining as a condition to receive
permits to mine phosphate ore reserves; (ii) treat low pH process water in Gypstacks to neutralize acidity; (iii) close and
monitor Gypstacks at our Florida and Louisiana facilities at the end of their useful lives; (iv) remediate certain other
conditional obligations; (v) remove all surface structures and equipment, plug and abandon mine shafts, contour and
revegetate, as necessary, and monitor for five years after closing our Carlsbad, New Mexico facility and (vi) decommission
facilities, manage tailings and execute site reclamation at our Saskatchewan potash mines at the end of their useful lives. The
estimated liability for these legal obligations is based on the estimated cost to satisfy the above obligations which is
discounted using a credit-adjusted risk-free rate.
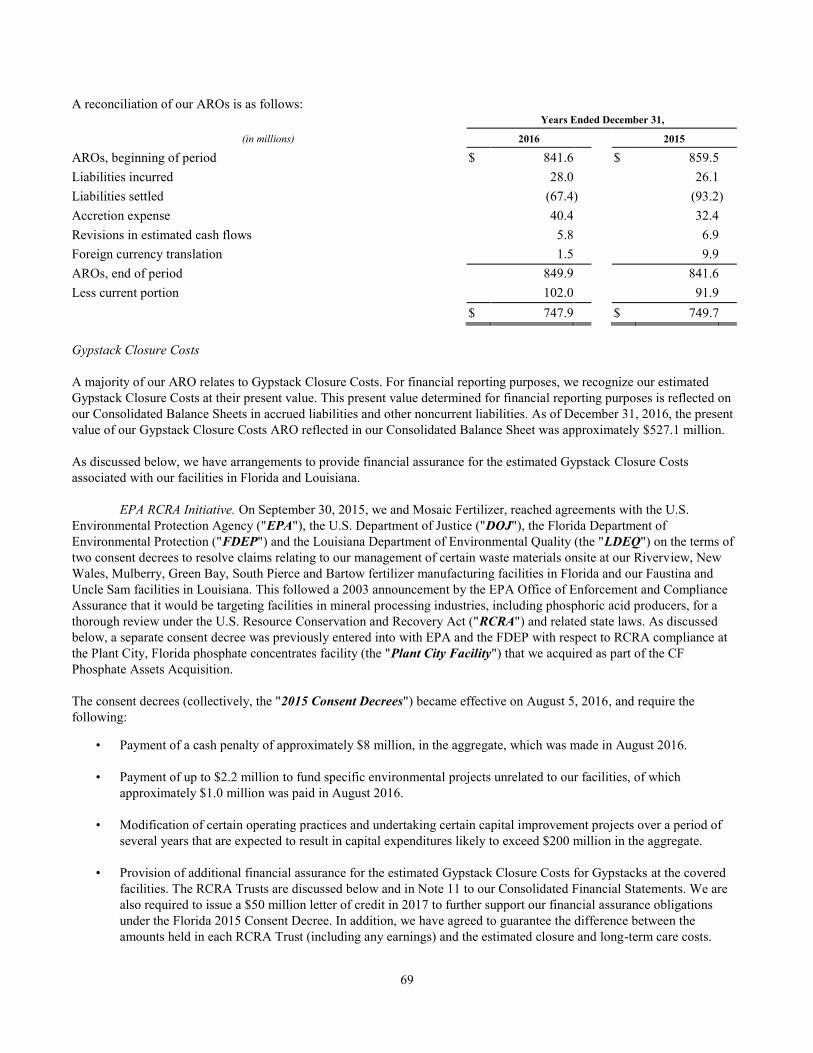
69
A reconciliation of our AROs is as follows: Years Ended December 31,
(in millions) 2016 2015
AROs, beginning of period $ 841.6
$ 859.5
Liabilities incurred 28.0
26.1
Liabilities settled (67.4 ) (93.2 )
Accretion expense 40.4
32.4
Revisions in estimated cash flows 5.8
6.9
Foreign currency translation 1.5
9.9
AROs, end of period 849.9
841.6
Less current portion 102.0
91.9
$ 747.9
$ 749.7
Gypstack Closure Costs
A majority of our ARO relates to Gypstack Closure Costs. For financial reporting purposes, we recognize our estimated
Gypstack Closure Costs at their present value. This present value determined for financial reporting purposes is reflected on
our Consolidated Balance Sheets in accrued liabilities and other noncurrent liabilities. As of December 31, 2016, the present
value of our Gypstack Closure Costs ARO reflected in our Consolidated Balance Sheet was approximately $527.1 million.
As discussed below, we have arrangements to provide financial assurance for the estimated Gypstack Closure Costs
associated with our facilities in Florida and Louisiana.
EPA RCRA Initiative. On September 30, 2015, we and Mosaic Fertilizer, reached agreements with the U.S.
Environmental Protection Agency ("EPA"), the U.S. Department of Justice ("DOJ"), the Florida Department of
Environmental Protection ("FDEP") and the Louisiana Department of Environmental Quality (the "LDEQ") on the terms of
two consent decrees to resolve claims relating to our management of certain waste materials onsite at our Riverview, New
Wales, Mulberry, Green Bay, South Pierce and Bartow fertilizer manufacturing facilities in Florida and our Faustina and
Uncle Sam facilities in Louisiana. This followed a 2003 announcement by the EPA Office of Enforcement and Compliance
Assurance that it would be targeting facilities in mineral processing industries, including phosphoric acid producers, for a
thorough review under the U.S. Resource Conservation and Recovery Act ("RCRA") and related state laws. As discussed
below, a separate consent decree was previously entered into with EPA and the FDEP with respect to RCRA compliance at
the Plant City, Florida phosphate concentrates facility (the "Plant City Facility") that we acquired as part of the CF
Phosphate Assets Acquisition.
The consent decrees (collectively, the "2015 Consent Decrees") became effective on August 5, 2016, and require the
following:
• Payment of a cash penalty of approximately $8 million, in the aggregate, which was made in August 2016.
• Payment of up to $2.2 million to fund specific environmental projects unrelated to our facilities, of which
approximately $1.0 million was paid in August 2016.
• Modification of certain operating practices and undertaking certain capital improvement projects over a period of
several years that are expected to result in capital expenditures likely to exceed $200 million in the aggregate.
• Provision of additional financial assurance for the estimated Gypstack Closure Costs for Gypstacks at the covered
facilities. The RCRA Trusts are discussed below and in Note 11 to our Consolidated Financial Statements. We are
also required to issue a $50 million letter of credit in 2017 to further support our financial assurance obligations
under the Florida 2015 Consent Decree. In addition, we have agreed to guarantee the difference between the
amounts held in each RCRA Trust (including any earnings) and the estimated closure and long-term care costs.
70
As of December 31, 2016, the undiscounted amount of our Gypstack Closure Costs ARO associated with the facilities
covered by the 2015 Consent Decrees, determined using the assumptions used for financial reporting purposes, was
approximately $1.4 billion and the present value of our Gypstack Closure Costs ARO reflected in our Consolidated Balance
Sheet for those facilities was approximately $414 million.
In August 2016 we deposited cash, in the total amount of $630 million, into the RCRA Trusts to provide financial assurance
as required under the 2015 Consent Decrees. The amount deposited corresponds to a material portion of our estimated
Gypstack Closure Costs ARO associated with the covered facilities. While our actual Gypstack Closure Costs are generally
expected to be paid by us in the normal course of our Phosphates business over a period that may not end until three decades
or more after a Gypstack has been closed, the funds on deposit in the RCRA Trusts can be drawn by the applicable
governmental authority in the event we cannot perform our closure and long term care obligations. If and when our estimated
Gypstack Closure Costs with respect to the facilities associated with a RCRA Trust are sufficiently lower than the amount on
deposit in that RCRA Trust, we have the right to request that the excess funds be released to us. The same is true for the
RCRA Trust balance remaining after the completion of our obligations, which will be performed over a period that may not
end until three decades or more after a Gypstack has been closed. At December 31, 2016 and 2015, amounts reserved to be
held or held in the RCRA Trusts (including losses or reinvested earnings) are included in other assets on our Condensed
Consolidated Balance Sheets.
Plant City and Bonnie Facilities. As part of the CF Phosphate Assets Acquisition, we assumed certain ARO related
to Gypstack Closure Costs at both the Plant City Facility and a closed Florida phosphate concentrates facility in Bartow,
Florida (the “Bonnie Facility”) that we acquired. Associated with these assets are two related financial assurance
arrangements for which we became responsible and that provide financial assurance for the estimated Gypstack Closure
Costs for these facilities, pursuant to federal or state law, which the government can utilize in the event we cannot perform
such closure activities. One arrangement was initially a trust (the “Plant City Trust”) established to meet the requirements
under a consent decree with EPA and the FDEP with respect to RCRA compliance at Plant City that also satisfies Florida
financial assurance requirements at that site. The other is a trust fund (the “Bonnie Facility Trust”) established to meet the
requirements under Florida financial assurance regulations (the “Florida Financial Assurance Requirement”) that apply to
the Bonnie Facility. In the CF Phosphate Assets Acquisition, we deposited $189.2 million into the Plant City Trust as a
substitute for funds that CF had deposited into trust. Based on our updated closure cost estimates, an additional $8.7
million was subsequently added to the Plant City Trust. In addition, in July 2014, the FDEP approved our funding of $14.5
million into the Bonnie Facility Trust, which substituted funds that CF had deposited into an escrow account. We have since
deposited an additional $6 million at various times into the Bonnie Facility Trust. Both financial assurance funding
obligations require estimates of future expenditures that could be impacted by refinements in scope, technological
developments, new information, cost inflation, changes in regulations, discount rates and the timing of activities. We also are
permitted to satisfy our financial assurance obligations with respect to the Bonnie and Plant City Facilities by means of
alternative credit support, including surety bonds or letters of credit. In September 2016 we arranged for the delivery of a
surety bond to EPA in the face amount of approximately $260 million (the “Plant City Bond”), reflecting our updated closure
cost estimates, as a substitute for the financial assurance provided through the Plant City Trust. Approximately $200
million previously held in the Plant City Trust, was returned to us and became unrestricted cash. Under our current approach
to satisfying applicable requirements, additional financial assurance would be required in the future if increases in cost
estimates exceed the face amount of the Plant City Bond or the amount held in the Bonnie Facility Trust.
At December 31, 2016, the aggregate amount of ARO associated with the Plant City and Bonnie Facilities that was included
in our consolidated balance sheet was $93.5 million. The aggregate amount represented by the Plant City Bond exceeds the
aggregate amount of ARO associated with that Facility because the amount of financial assurance we are required to provide
represents the aggregate undiscounted estimated amount to be paid by us in the normal course of our Phosphates business
over a period that may not end until three decades or more after the Gypstack has been closed, whereas the ARO included in
our Consolidated Balance Sheet reflects the discounted present value of those estimated amounts.
As part of the acquisition, we also assumed ARO related to land reclamation.
71
14. ACCOUNTING FOR DERIVATIVE INSTRUMENTS AND HEDGING ACTIVITIES
We periodically enter into derivatives to mitigate our exposure to foreign currency risks, interest rate movements and the
effects of changing commodity and freight prices. We record all derivatives on the Consolidated Balance Sheets at fair value.
The fair value of these instruments is determined by using quoted market prices, third party comparables, internal estimates
or other external pricing sources. We net our derivative asset and liability positions when we have a master netting
arrangement in place. Changes in the fair value of the foreign currency, interest rates, commodity, and freight derivatives are
immediately recognized in earnings. As of December 31, 2016 and 2015, the gross asset position of our derivative
instruments was $16.2 million and $6.8 million, respectively, and the gross liability position of our liability instruments
was $17.3 million and $79.3 million, respectively.
We do not apply hedge accounting treatments to our foreign currency exchange contracts, commodities contracts, or freight
contracts. Unrealized gains and (losses) on foreign currency exchange contracts used to hedge cash flows related to the
production of our product are included in cost of goods sold in the Consolidated Statements of Earnings. Unrealized gains
and (losses) on commodities contracts and certain forward freight agreements are also recorded in cost of goods sold in the
Consolidated Statements of Earnings. Unrealized gains or (losses) on foreign currency exchange contracts used to hedge cash
flows that are not related to the production of our products are included in the foreign currency transaction gain (loss) line in
the Consolidated Statements of Earnings in our Corporate, Eliminations and Other segment.
We apply fair value hedge accounting treatment to our fixed-to-floating interest rate contracts. Under these arrangements, we
agree to exchange, at specified intervals, the difference between fixed and floating interest amounts calculated by reference to
an agreed-upon notional principal amount. The mark-to-market of these fair value hedges is recorded as gains or losses in
interest expense and is offset by the gain or loss of the underlying debt instrument, which also is recorded in interest expense.
These fair value hedges are highly effective and, thus, as of December 31, 2016, the impact on earnings due to hedge
ineffectiveness was immaterial. Consistent with Mosaic's intent to have floating rate debt as a portion of its outstanding debt,
in December 2016, we entered into four fixed-to-floating interest rate swap agreements with a total notional amount
of $310.0 million, related to our Senior Notes due 2023. The open position for interest rate swap agreements had a total
notional amount of $175.0 million as of December 31, 2015.
In December 2016, we entered into forward starting interest rate swap agreements to hedge our exposure to changes in future
interest rates related to an anticipated debt issuance to fund the cash portion of our planned acquisition of Vale Fertilizantes
S.A. as described in Note 24. We do not apply hedge accounting treatment to these contracts and cash is expected to be
settled at the time of pricing of the related debt. As of December 31, 2016, our total notional amount was $100.0 million. The
impact of these agreements on earnings was immaterial as of December 31, 2016.
The following is the total absolute notional volume associated with our outstanding derivative instruments:
(in millions of Units)
Instrument Derivative Category Unit of Measure December 31,
2016 December 31,
2015
Foreign currency derivatives Foreign Currency US Dollars 949.9
1,230.6
Interest rate derivatives Interest Rate US Dollars 410.0
175.0
Natural gas derivatives Commodity MMbtu 21.7
32.4
Credit-Risk-Related Contingent Features
Certain of our derivative instruments contain provisions that require us to post collateral. These provisions also state that if
our debt were to be rated below investment grade, certain counterparties to the derivative instruments could request full
collateralization on derivative instruments in net liability positions. The aggregate fair value of all derivative instruments with
credit-risk-related contingent features that were in a liability position as of December 31, 2016 and 2015, was $6.0 million
and $53.4 million, respectively. We have not posted cash collateral in the normal course of business associated with these
72
contracts. If the credit-risk-related contingent features underlying these agreements were triggered on December 31, 2016, we
would be required to post an additional $5.3 million of collateral assets, which are either cash or U.S. Treasury instruments,
to the counterparties.
Counterparty Credit Risk
We enter into foreign exchange, interest rate and certain commodity derivatives, primarily with a diversified group of highly
rated counterparties. We continually monitor our positions and the credit ratings of the counterparties involved and limit the
amount of credit exposure to any one party. While we may be exposed to potential losses due to the credit risk of non-
performance by these counterparties, losses are not anticipated. We closely monitor the credit risk associated with our
counterparties and customers and to date have not experienced material losses.
15. FAIR VALUE MEASUREMENTS
Following is a summary of the valuation techniques for assets and liabilities recorded in our Consolidated Balance Sheets at
fair value on a recurring basis:
Foreign Currency Derivatives—The foreign currency derivative instruments that we currently use are forward contracts and
zero-cost collars, which typically expire within eighteen months. Most of the valuations are adjusted by a forward yield curve
or interest rates. In such cases, these derivative contracts are classified within Level 2. Some valuations are based on
exchange-quoted prices, which are classified as Level 1. Changes in the fair market values of these contracts are recognized
in the Consolidated Financial Statements as a component of cost of goods sold in our Corporate, Eliminations and Other
segment, or foreign currency transaction (gain) loss. As of December 31, 2016 and 2015, the gross asset position of our
foreign currency derivative instruments was $8.3 million and $5.7 million, respectively, and the gross liability position of our
foreign currency derivative instruments was $14.6 million and $59.6 million, respectively.
Commodity Derivatives—The commodity contracts primarily relate to natural gas. The commodity derivative instruments
that we currently use are forward purchase contracts, swaps, and three-way collars. The natural gas contracts settle using
NYMEX futures or AECO price indexes, which represent fair value at any given time. The contracts’ maturities are for future
months and settlements are scheduled to coincide with anticipated gas purchases during those future periods. Quoted market
prices from NYMEX and AECO are used to determine the fair value of these instruments. These market prices are adjusted
by a forward yield curve and are classified within Level 2. Changes in the fair market values of these contracts are recognized
in the Consolidated Financial Statements as a component of cost of goods sold in our Corporate, Eliminations and Other
segment. As of December 31, 2016 and 2015, the gross asset position of our commodity derivative instruments was $6.3
million and $1.0 million, respectively, and the gross liability position of our commodity derivative instruments was $1.3
million and $16.7 million, respectively.
Interest Rate Derivatives—We manage interest expense through interest rate contracts to convert a portion of our fixed-rate
debt into floating-rate debt. We also enter into interest rate swap agreements to hedge our exposure to changes in future
interest rates related to anticipated debt issuances. Valuations are based on external pricing sources and are classified as Level
2. Changes in the fair market values of these contracts are recognized in the Consolidated Financial Statements as a
component of interest expense. As of December 31, 2016 and 2015, the gross asset position of our interest rate swap
instruments was $1.6 million and $0.1 million, respectively, and the gross liability position of our interest rate swap
instruments was $1.4 million and $0.2 million, respectively.
73
Financial Instruments
The carrying amounts and estimated fair values of our financial instruments are as follows:
December 31,
2016 2015
Carrying Fair Carrying Fair
(in millions) Amount Value Amount Value
Cash and cash equivalents $ 673.1
$ 673.1
$ 1,276.3
$ 1,276.3
Accounts receivable 627.8
627.8
675.0
675.0
Accounts payable 471.8
471.8
520.6
520.6
Structured accounts payable arrangements 128.8
128.8
481.7
481.7
Short-term debt 0.1
0.1
25.5
25.5
Long-term debt, including current portion 3,818.1
3,854.8
3,811.2
3,860.4
For cash and cash equivalents, accounts receivable, accounts payable, structured accounts payable arrangements and short-
term debt, the carrying amount approximates fair value because of the short-term maturity of those instruments. The fair
value of long-term debt is estimated using quoted market prices for the publicly registered notes and debentures, classified as
Level 1 and Level 2, respectively, within the fair value hierarchy, depending on the market liquidity of the debt. For
information regarding the fair value of our marketable securities held in trusts, see Note 11 of our Notes to Consolidated
Financial Statements.
16. GUARANTEES AND INDEMNITIES
We enter into various contracts that include indemnification and guarantee provisions as a routine part of our business
activities. Examples of these contracts include asset purchase and sale agreements, surety bonds, financial assurances to
regulatory agencies in connection with reclamation and closure obligations, commodity sale and purchase agreements, and
other types of contractual agreements with vendors and other third parties. These agreements indemnify counterparties for
matters such as reclamation and closure obligations, tax liabilities, environmental liabilities, litigation and other matters, as
well as breaches by Mosaic of representations, warranties and covenants set forth in these agreements. In many cases, we are
essentially guaranteeing our own performance, in which case the guarantees do not fall within the scope of the accounting
and disclosures requirements under U.S. GAAP.
Our more significant guarantees and indemnities are as follows:
Guarantees to Brazilian Financial Parties. From time to time, we issue guarantees to financial parties in Brazil for certain
amounts owed the institutions by certain customers of Mosaic. The guarantees are for all or part of the customers’
obligations. In the event that the customers default on their payments to the institutions and we would be required to perform
under the guarantees, we have in most instances obtained collateral from the customers. We monitor the nonperformance risk
of the counterparties and have noted no material concerns regarding their ability to perform on their obligations. The
guarantees generally have a one-year term, but may extend up to two years or longer depending on the crop cycle, and we
expect to renew many of these guarantees on a rolling twelve-month basis. As of December 31, 2016, we have estimated the
maximum potential future payment under the guarantees to be $73.7 million. The fair value of our guarantees is immaterial to
the Consolidated Financial Statements as of December 31, 2016 and 2015.
Guarantee of Payments. In November 2015 Mosaic entered into an agreement (as amended to date, the "Bridge Loan") to
provide bridge funding to Gulf Marine Solutions, LLC ("GMS") to finance the purchase and construction of two articulated
tug and barge units (the "ATBs") intended to transport anhydrous ammonia, primarily for Mosaic’s operations. As of
December 31, 2016, the Bridge Loan limit was $185 million. In January 2017, the parties agreed to increase the Bridge Loan
limit to $235 million. GMS is a wholly owned subsidiary of Gulf Sulphur Services Ltd., LLLP (“Gulf Sulphur Services”), an
74
entity in which Mosaic owns a 50% equity interest and which is operated by Mosaic’s joint venture partner. Mosaic’s joint
venture partner is arranging for construction of the ATBs, utilizing funds borrowed from GMS, and will enter into a long-
term transportation contract with a subsidiary of Mosaic to transport anhydrous ammonia. Beginning in the quarter ended
December 31, 2015, we determined that Mosaic is the primary beneficiary of GMS, a variable interest entity, and we have
consolidated GMS's balance sheet and statement of earnings within our consolidated financial statements in our Phosphates
segment. During 2016, at Mosaic's instruction, Mosaic's joint venture partner notified the barge builder of its election under
the construction contract to cancel construction of the second barge unit, resulting in a charge of $43.5 million that is
included in other operating expense. Construction of the first barge unit and the two tugs will continue as planned. At
December 31, 2016, $176.0 million was outstanding under the Bridge Loan, and GMS had received additional loans from
Gulf Sulphur Services in the aggregate amount of $53.7 million for the ATB project that are included in long-term debt in our
Consolidated Balance Sheets. These loans obtained by GMS were in turn lent to Mosaic’s joint venture partner for use in
constructing the ATBs. The parties are seeking third-party financing for the ATB project, with proceeds to be utilized to
repay outstanding Bridge Loans and loans from Gulf Sulphur Services. In connection with the ATB project, Mosaic has also
agreed to guarantee up to $100 million of payment obligations to the barge builder. The guarantee will remain in effect until
final payment under the construction agreement.
Other Indemnities. Our maximum potential exposure under other indemnification arrangements can range from a specified
dollar amount to an unlimited amount, depending on the nature of the transaction. Total maximum potential exposure under
these indemnification arrangements is not estimable due to uncertainty as to whether claims will be made or how they will be
resolved. We do not believe that we will be required to make any material payments under these indemnity provisions.
Because many of the guarantees and indemnities we issue to third parties do not limit the amount or duration of our
obligations to perform under them, there exists a risk that we may have obligations in excess of the amounts described above.
For those guarantees and indemnities that do not limit our liability exposure, we may not be able to estimate what our liability
would be until a claim is made for payment or performance due to the contingent nature of these arrangements. See
Note 18 of our Notes to Consolidated Financial Statements for additional information for indemnification provisions related
to the Cargill Transaction.
17. PENSION PLANS AND OTHER BENEFITS
We sponsor pension and postretirement benefits through a variety of plans including defined benefit plans, defined
contribution plans, and postretirement benefit plans in North America and certain of our international locations. We reserve
the right to amend, modify, or terminate the Mosaic sponsored plans at any time, subject to provisions of the Employee
Retirement Income Security Act of 1974 (“ERISA”), prior agreements and our collective bargaining agreements.
Defined Benefit and Postretirement Medical Benefit Plans
We sponsor various defined benefit pension plans in the U.S. and in Canada. Benefits are based on different combinations of
years of service and compensation levels, depending on the plan. Generally, contributions to the U.S. plans are made to meet
minimum funding requirements of ERISA, while contributions to Canadian plans are made in accordance with Pension
Benefits Acts instituted by the provinces of Saskatchewan and Ontario. Certain employees in the U.S. and Canada, whose
pension benefits exceed Internal Revenue Code and Canada Revenue Agency limitations, respectively, are covered by
supplementary non-qualified, unfunded pension plans. In 2016, as part of an initiative to “de-risk” certain of its pension plan
obligations, Mosaic offered a one-time lump-sum window to terminated vested participants within select plans who had not
commenced distribution of their benefits. As a result of this initiative, there was a decrease of $43.3 million of projected
benefit obligations for the defined benefit plans.
We provide certain health care benefit plans for certain retired employees (“Retiree Health Plans”) which may be either
contributory or non-contributory and contain certain other cost-sharing features such as deductibles and coinsurance. The
Retiree Health Plans are unfunded and the projected benefit obligation was $44.9 million and $46.6 million as of December
31, 2016 and 2015, respectively. The related income statement effects of the Retiree Health Plans are not material to the
Company.
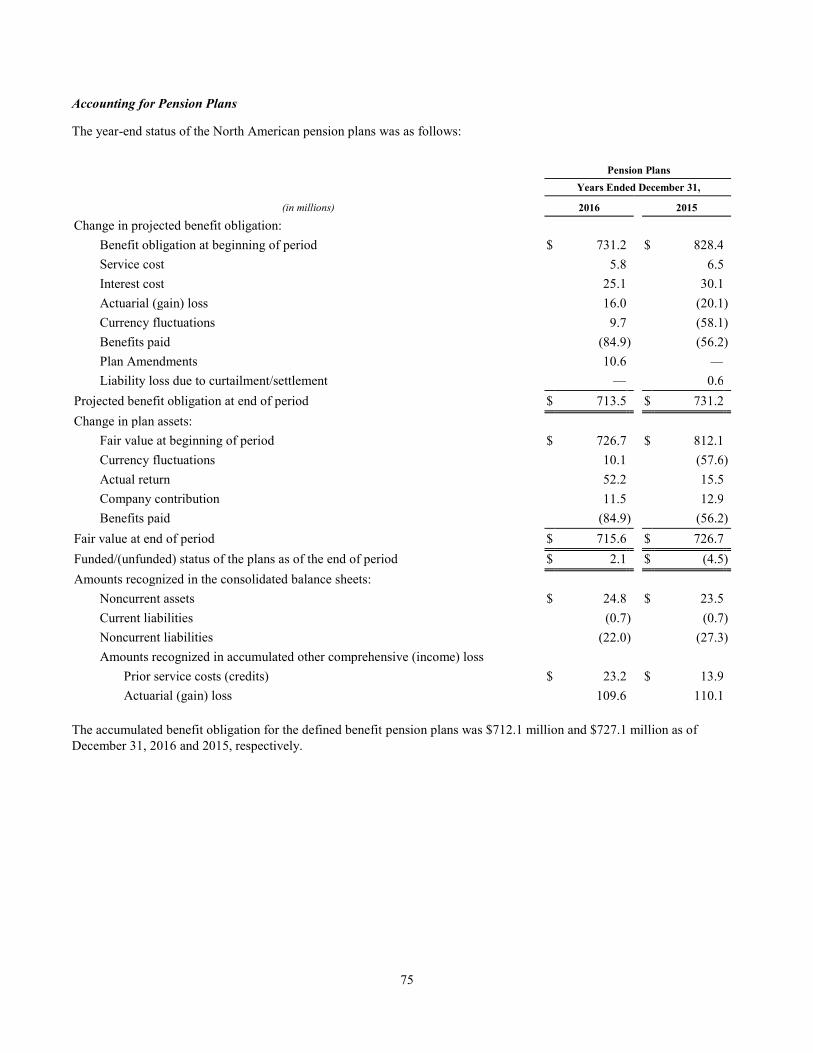
75
Accounting for Pension Plans
The year-end status of the North American pension plans was as follows:
Pension Plans
Years Ended December 31,
(in millions) 2016 2015
Change in projected benefit obligation:
Benefit obligation at beginning of period $ 731.2
$ 828.4
Service cost 5.8
6.5
Interest cost 25.1
30.1
Actuarial (gain) loss 16.0
(20.1 )
Currency fluctuations 9.7
(58.1 )
Benefits paid (84.9 ) (56.2 )
Plan Amendments 10.6
—
Liability loss due to curtailment/settlement —
0.6
Projected benefit obligation at end of period $ 713.5
$ 731.2
Change in plan assets:
Fair value at beginning of period $ 726.7
$ 812.1
Currency fluctuations 10.1
(57.6 )
Actual return 52.2
15.5
Company contribution 11.5
12.9
Benefits paid (84.9 ) (56.2 )
Fair value at end of period $ 715.6
$ 726.7
Funded/(unfunded) status of the plans as of the end of period $ 2.1
$ (4.5 )
Amounts recognized in the consolidated balance sheets:
Noncurrent assets $ 24.8
$ 23.5
Current liabilities (0.7 ) (0.7 )
Noncurrent liabilities (22.0 ) (27.3 )
Amounts recognized in accumulated other comprehensive (income) loss
Prior service costs (credits) $ 23.2
$ 13.9
Actuarial (gain) loss 109.6
110.1
The accumulated benefit obligation for the defined benefit pension plans was $712.1 million and $727.1 million as of
December 31, 2016 and 2015, respectively.
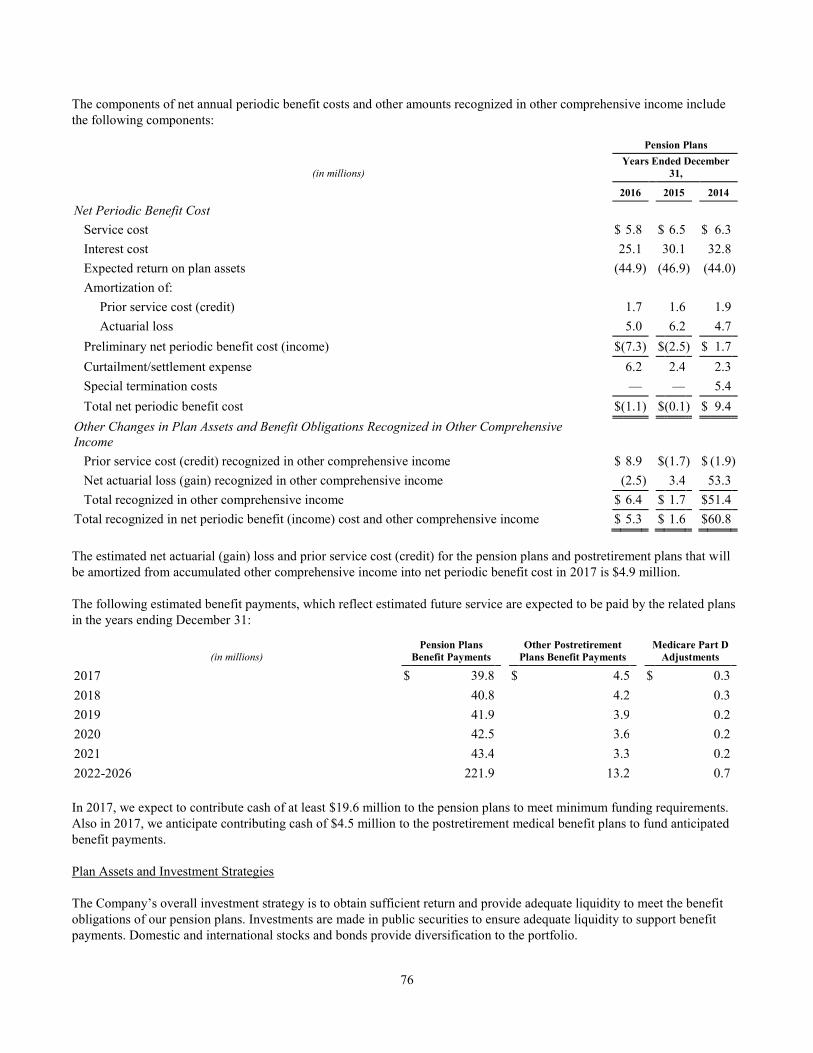
76
The components of net annual periodic benefit costs and other amounts recognized in other comprehensive income include
the following components:
Pension Plans
(in millions) Years Ended December
31,
2016 2015 2014
Net Periodic Benefit Cost
Service cost $ 5.8
$ 6.5
$ 6.3
Interest cost 25.1
30.1
32.8
Expected return on plan assets (44.9 ) (46.9 ) (44.0 )
Amortization of:
Prior service cost (credit) 1.7
1.6
1.9
Actuarial loss 5.0
6.2
4.7
Preliminary net periodic benefit cost (income) $ (7.3 ) $ (2.5 ) $ 1.7
Curtailment/settlement expense 6.2
2.4
2.3
Special termination costs —
—
5.4
Total net periodic benefit cost $ (1.1 ) $ (0.1 ) $ 9.4
Other Changes in Plan Assets and Benefit Obligations Recognized in Other Comprehensive
Income
Prior service cost (credit) recognized in other comprehensive income $ 8.9
$ (1.7 ) $ (1.9 )
Net actuarial loss (gain) recognized in other comprehensive income (2.5 ) 3.4
53.3
Total recognized in other comprehensive income $ 6.4
$ 1.7
$ 51.4
Total recognized in net periodic benefit (income) cost and other comprehensive income $ 5.3
$ 1.6
$ 60.8
The estimated net actuarial (gain) loss and prior service cost (credit) for the pension plans and postretirement plans that will
be amortized from accumulated other comprehensive income into net periodic benefit cost in 2017 is $4.9 million.
The following estimated benefit payments, which reflect estimated future service are expected to be paid by the related plans
in the years ending December 31:
(in millions) Pension Plans
Benefit Payments Other Postretirement
Plans Benefit Payments Medicare Part D
Adjustments
2017 $ 39.8
$ 4.5
$ 0.3
2018 40.8
4.2
0.3
2019 41.9
3.9
0.2
2020 42.5
3.6
0.2
2021 43.4
3.3
0.2
2022-2026 221.9
13.2
0.7
In 2017, we expect to contribute cash of at least $19.6 million to the pension plans to meet minimum funding requirements.
Also in 2017, we anticipate contributing cash of $4.5 million to the postretirement medical benefit plans to fund anticipated
benefit payments.
Plan Assets and Investment Strategies
The Company’s overall investment strategy is to obtain sufficient return and provide adequate liquidity to meet the benefit
obligations of our pension plans. Investments are made in public securities to ensure adequate liquidity to support benefit
payments. Domestic and international stocks and bonds provide diversification to the portfolio.
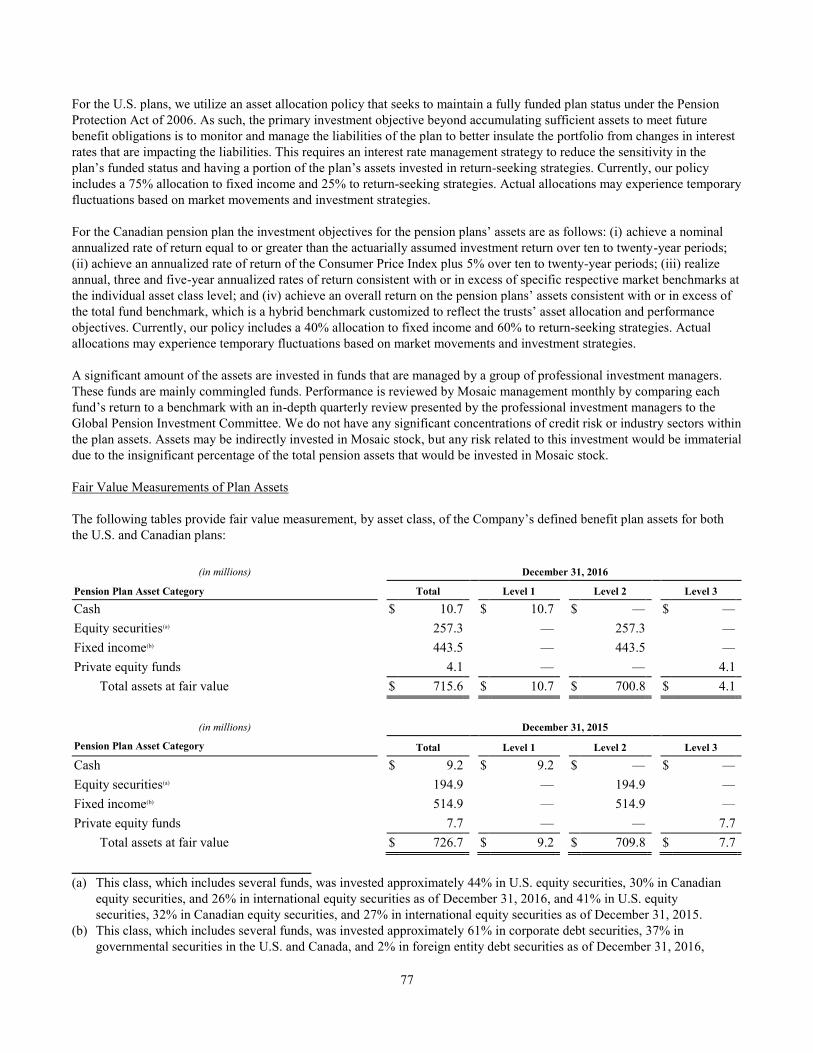
77
For the U.S. plans, we utilize an asset allocation policy that seeks to maintain a fully funded plan status under the Pension
Protection Act of 2006. As such, the primary investment objective beyond accumulating sufficient assets to meet future
benefit obligations is to monitor and manage the liabilities of the plan to better insulate the portfolio from changes in interest
rates that are impacting the liabilities. This requires an interest rate management strategy to reduce the sensitivity in the
plan’s funded status and having a portion of the plan’s assets invested in return-seeking strategies. Currently, our policy
includes a 75% allocation to fixed income and 25% to return-seeking strategies. Actual allocations may experience temporary
fluctuations based on market movements and investment strategies.
For the Canadian pension plan the investment objectives for the pension plans’ assets are as follows: (i) achieve a nominal
annualized rate of return equal to or greater than the actuarially assumed investment return over ten to twenty-year periods;
(ii) achieve an annualized rate of return of the Consumer Price Index plus 5% over ten to twenty-year periods; (iii) realize
annual, three and five-year annualized rates of return consistent with or in excess of specific respective market benchmarks at
the individual asset class level; and (iv) achieve an overall return on the pension plans’ assets consistent with or in excess of
the total fund benchmark, which is a hybrid benchmark customized to reflect the trusts’ asset allocation and performance
objectives. Currently, our policy includes a 40% allocation to fixed income and 60% to return-seeking strategies. Actual
allocations may experience temporary fluctuations based on market movements and investment strategies.
A significant amount of the assets are invested in funds that are managed by a group of professional investment managers.
These funds are mainly commingled funds. Performance is reviewed by Mosaic management monthly by comparing each
fund’s return to a benchmark with an in-depth quarterly review presented by the professional investment managers to the
Global Pension Investment Committee. We do not have any significant concentrations of credit risk or industry sectors within
the plan assets. Assets may be indirectly invested in Mosaic stock, but any risk related to this investment would be immaterial
due to the insignificant percentage of the total pension assets that would be invested in Mosaic stock.
Fair Value Measurements of Plan Assets
The following tables provide fair value measurement, by asset class, of the Company’s defined benefit plan assets for both
the U.S. and Canadian plans:
(in millions) December 31, 2016
Pension Plan Asset Category Total Level 1 Level 2 Level 3
Cash $ 10.7
$ 10.7
$ —
$ —
Equity securities(a) 257.3
—
257.3
—
Fixed income(b) 443.5
—
443.5
—
Private equity funds 4.1
—
—
4.1
Total assets at fair value $ 715.6
$ 10.7
$ 700.8
$ 4.1
(in millions) December 31, 2015
Pension Plan Asset Category Total Level 1 Level 2 Level 3
Cash $ 9.2
$ 9.2
$ —
$ —
Equity securities(a) 194.9
—
194.9
—
Fixed income(b) 514.9
—
514.9
—
Private equity funds 7.7
—
—
7.7
Total assets at fair value $ 726.7
$ 9.2
$ 709.8
$ 7.7
______________________________ (a) This class, which includes several funds, was invested approximately 44% in U.S. equity securities, 30% in Canadian
equity securities, and 26% in international equity securities as of December 31, 2016, and 41% in U.S. equity
securities, 32% in Canadian equity securities, and 27% in international equity securities as of December 31, 2015.
(b) This class, which includes several funds, was invested approximately 61% in corporate debt securities, 37% in
governmental securities in the U.S. and Canada, and 2% in foreign entity debt securities as of December 31, 2016,
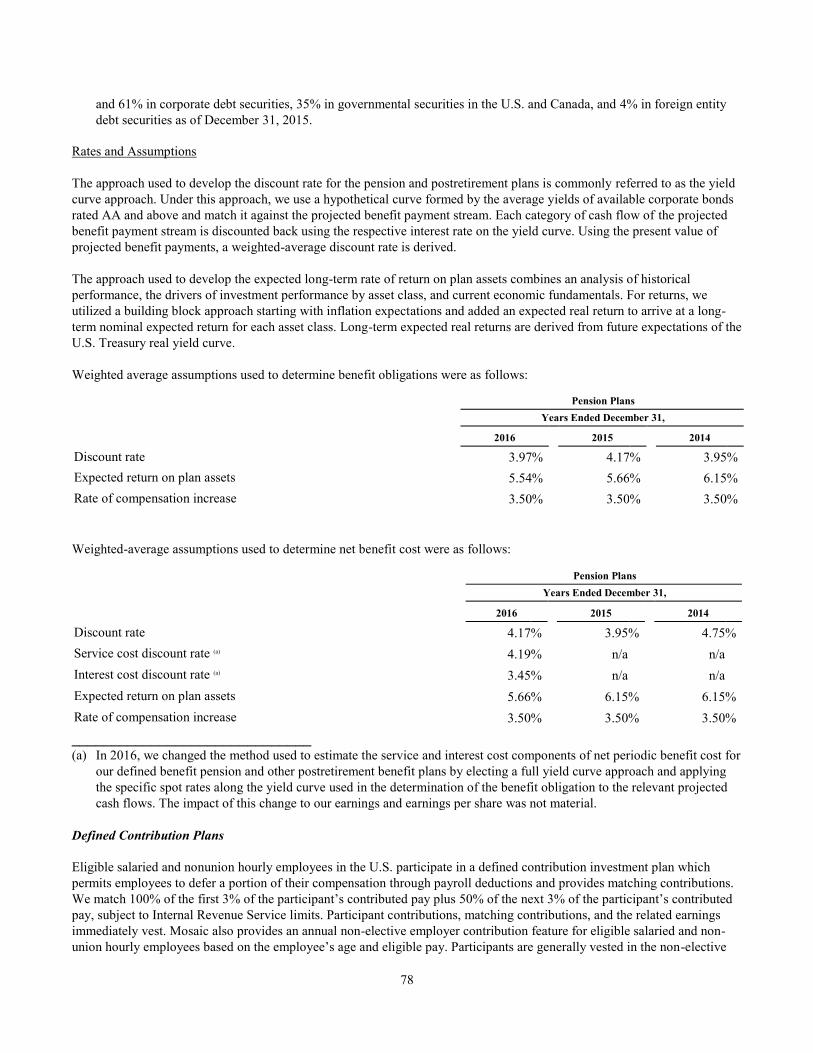
78
and 61% in corporate debt securities, 35% in governmental securities in the U.S. and Canada, and 4% in foreign entity
debt securities as of December 31, 2015.
Rates and Assumptions
The approach used to develop the discount rate for the pension and postretirement plans is commonly referred to as the yield
curve approach. Under this approach, we use a hypothetical curve formed by the average yields of available corporate bonds
rated AA and above and match it against the projected benefit payment stream. Each category of cash flow of the projected
benefit payment stream is discounted back using the respective interest rate on the yield curve. Using the present value of
projected benefit payments, a weighted-average discount rate is derived.
The approach used to develop the expected long-term rate of return on plan assets combines an analysis of historical
performance, the drivers of investment performance by asset class, and current economic fundamentals. For returns, we
utilized a building block approach starting with inflation expectations and added an expected real return to arrive at a long-
term nominal expected return for each asset class. Long-term expected real returns are derived from future expectations of the
U.S. Treasury real yield curve.
Weighted average assumptions used to determine benefit obligations were as follows:
Pension Plans
Years Ended December 31,
2016 2015 2014
Discount rate 3.97 % 4.17 % 3.95 %
Expected return on plan assets 5.54 % 5.66 % 6.15 %
Rate of compensation increase 3.50 % 3.50 % 3.50 %
Weighted-average assumptions used to determine net benefit cost were as follows:
Pension Plans
Years Ended December 31,
2016 2015 2014
Discount rate 4.17 % 3.95 % 4.75 %
Service cost discount rate (a) 4.19 % n/a
n/a
Interest cost discount rate (a) 3.45 % n/a
n/a
Expected return on plan assets 5.66 % 6.15 % 6.15 %
Rate of compensation increase 3.50 % 3.50 % 3.50 %
______________________________ (a) In 2016, we changed the method used to estimate the service and interest cost components of net periodic benefit cost for
our defined benefit pension and other postretirement benefit plans by electing a full yield curve approach and applying
the specific spot rates along the yield curve used in the determination of the benefit obligation to the relevant projected
cash flows. The impact of this change to our earnings and earnings per share was not material.
Defined Contribution Plans
Eligible salaried and nonunion hourly employees in the U.S. participate in a defined contribution investment plan which
permits employees to defer a portion of their compensation through payroll deductions and provides matching contributions.
We match 100% of the first 3% of the participant’s contributed pay plus 50% of the next 3% of the participant’s contributed
pay, subject to Internal Revenue Service limits. Participant contributions, matching contributions, and the related earnings
immediately vest. Mosaic also provides an annual non-elective employer contribution feature for eligible salaried and non-
union hourly employees based on the employee’s age and eligible pay. Participants are generally vested in the non-elective
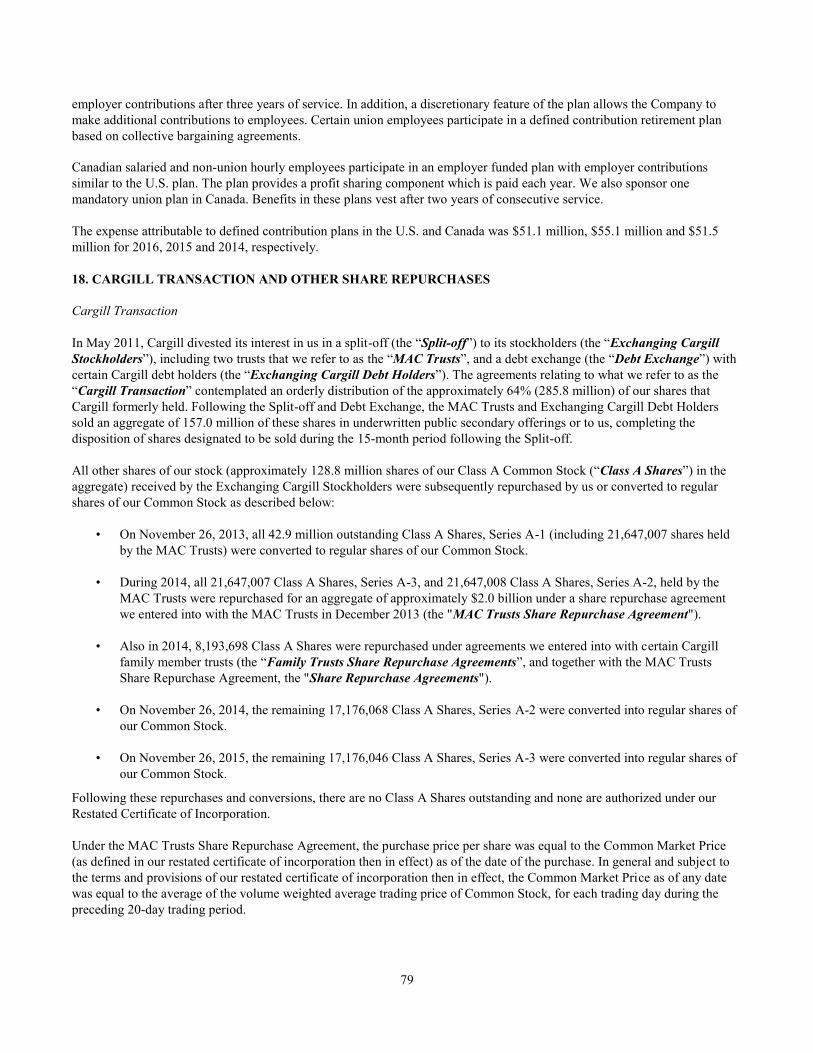
79
employer contributions after three years of service. In addition, a discretionary feature of the plan allows the Company to
make additional contributions to employees. Certain union employees participate in a defined contribution retirement plan
based on collective bargaining agreements.
Canadian salaried and non-union hourly employees participate in an employer funded plan with employer contributions
similar to the U.S. plan. The plan provides a profit sharing component which is paid each year. We also sponsor one
mandatory union plan in Canada. Benefits in these plans vest after two years of consecutive service.
The expense attributable to defined contribution plans in the U.S. and Canada was $51.1 million, $55.1 million and $51.5
million for 2016, 2015 and 2014, respectively.
18. CARGILL TRANSACTION AND OTHER SHARE REPURCHASES
Cargill Transaction
In May 2011, Cargill divested its interest in us in a split-off (the “Split-off”) to its stockholders (the “Exchanging Cargill
Stockholders”), including two trusts that we refer to as the “MAC Trusts”, and a debt exchange (the “Debt Exchange”) with
certain Cargill debt holders (the “Exchanging Cargill Debt Holders”). The agreements relating to what we refer to as the
“Cargill Transaction” contemplated an orderly distribution of the approximately 64% (285.8 million) of our shares that
Cargill formerly held. Following the Split-off and Debt Exchange, the MAC Trusts and Exchanging Cargill Debt Holders
sold an aggregate of 157.0 million of these shares in underwritten public secondary offerings or to us, completing the
disposition of shares designated to be sold during the 15-month period following the Split-off.
All other shares of our stock (approximately 128.8 million shares of our Class A Common Stock (“Class A Shares”) in the
aggregate) received by the Exchanging Cargill Stockholders were subsequently repurchased by us or converted to regular
shares of our Common Stock as described below:
• On November 26, 2013, all 42.9 million outstanding Class A Shares, Series A-1 (including 21,647,007 shares held
by the MAC Trusts) were converted to regular shares of our Common Stock.
• During 2014, all 21,647,007 Class A Shares, Series A-3, and 21,647,008 Class A Shares, Series A-2, held by the
MAC Trusts were repurchased for an aggregate of approximately $2.0 billion under a share repurchase agreement
we entered into with the MAC Trusts in December 2013 (the "MAC Trusts Share Repurchase Agreement").
• Also in 2014, 8,193,698 Class A Shares were repurchased under agreements we entered into with certain Cargill
family member trusts (the “Family Trusts Share Repurchase Agreements”, and together with the MAC Trusts
Share Repurchase Agreement, the "Share Repurchase Agreements").
• On November 26, 2014, the remaining 17,176,068 Class A Shares, Series A-2 were converted into regular shares of
our Common Stock.
• On November 26, 2015, the remaining 17,176,046 Class A Shares, Series A-3 were converted into regular shares of
our Common Stock.
Following these repurchases and conversions, there are no Class A Shares outstanding and none are authorized under our
Restated Certificate of Incorporation.
Under the MAC Trusts Share Repurchase Agreement, the purchase price per share was equal to the Common Market Price
(as defined in our restated certificate of incorporation then in effect) as of the date of the purchase. In general and subject to
the terms and provisions of our restated certificate of incorporation then in effect, the Common Market Price as of any date
was equal to the average of the volume weighted average trading price of Common Stock, for each trading day during the
preceding 20-day trading period.
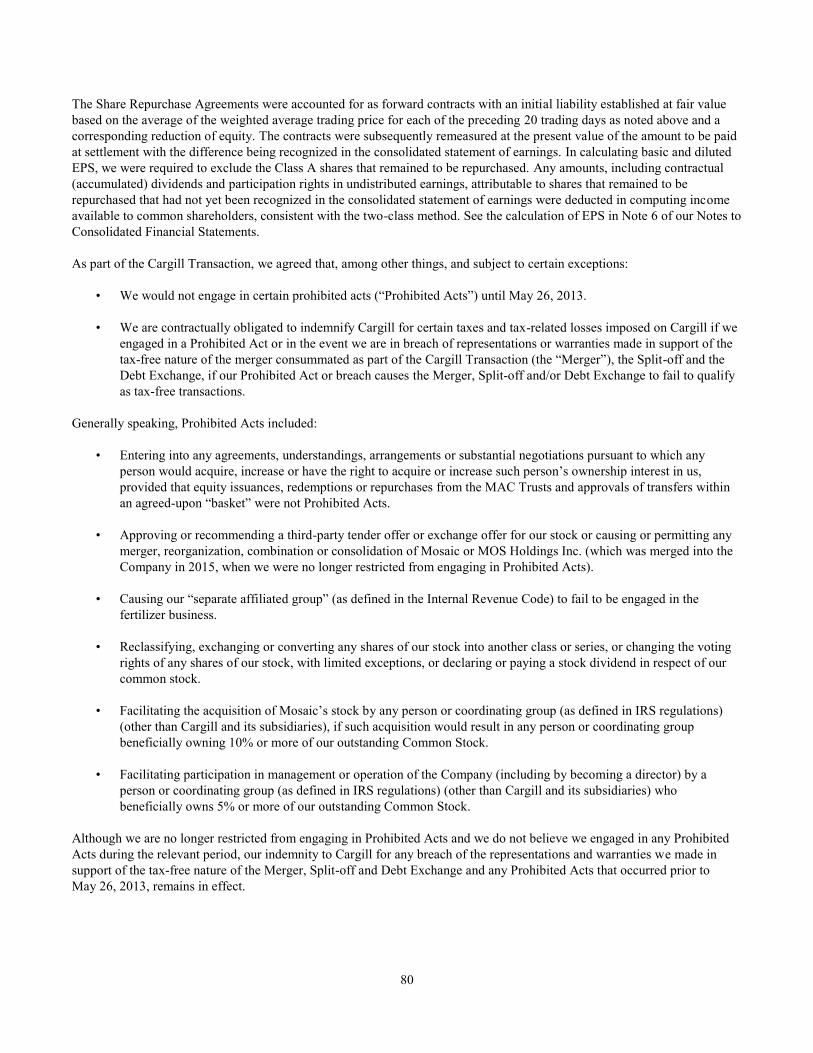
80
The Share Repurchase Agreements were accounted for as forward contracts with an initial liability established at fair value
based on the average of the weighted average trading price for each of the preceding 20 trading days as noted above and a
corresponding reduction of equity. The contracts were subsequently remeasured at the present value of the amount to be paid
at settlement with the difference being recognized in the consolidated statement of earnings. In calculating basic and diluted
EPS, we were required to exclude the Class A shares that remained to be repurchased. Any amounts, including contractual
(accumulated) dividends and participation rights in undistributed earnings, attributable to shares that remained to be
repurchased that had not yet been recognized in the consolidated statement of earnings were deducted in computing income
available to common shareholders, consistent with the two-class method. See the calculation of EPS in Note 6 of our Notes to
Consolidated Financial Statements.
As part of the Cargill Transaction, we agreed that, among other things, and subject to certain exceptions:
• We would not engage in certain prohibited acts (“Prohibited Acts”) until May 26, 2013.
• We are contractually obligated to indemnify Cargill for certain taxes and tax-related losses imposed on Cargill if we
engaged in a Prohibited Act or in the event we are in breach of representations or warranties made in support of the
tax-free nature of the merger consummated as part of the Cargill Transaction (the “Merger”), the Split-off and the
Debt Exchange, if our Prohibited Act or breach causes the Merger, Split-off and/or Debt Exchange to fail to qualify
as tax-free transactions.
Generally speaking, Prohibited Acts included:
• Entering into any agreements, understandings, arrangements or substantial negotiations pursuant to which any
person would acquire, increase or have the right to acquire or increase such person’s ownership interest in us,
provided that equity issuances, redemptions or repurchases from the MAC Trusts and approvals of transfers within
an agreed-upon “basket” were not Prohibited Acts.
• Approving or recommending a third-party tender offer or exchange offer for our stock or causing or permitting any
merger, reorganization, combination or consolidation of Mosaic or MOS Holdings Inc. (which was merged into the
Company in 2015, when we were no longer restricted from engaging in Prohibited Acts).
• Causing our “separate affiliated group” (as defined in the Internal Revenue Code) to fail to be engaged in the
fertilizer business.
• Reclassifying, exchanging or converting any shares of our stock into another class or series, or changing the voting
rights of any shares of our stock, with limited exceptions, or declaring or paying a stock dividend in respect of our
common stock.
• Facilitating the acquisition of Mosaic’s stock by any person or coordinating group (as defined in IRS regulations)
(other than Cargill and its subsidiaries), if such acquisition would result in any person or coordinating group
beneficially owning 10% or more of our outstanding Common Stock.
• Facilitating participation in management or operation of the Company (including by becoming a director) by a
person or coordinating group (as defined in IRS regulations) (other than Cargill and its subsidiaries) who
beneficially owns 5% or more of our outstanding Common Stock.
Although we are no longer restricted from engaging in Prohibited Acts and we do not believe we engaged in any Prohibited
Acts during the relevant period, our indemnity to Cargill for any breach of the representations and warranties we made in
support of the tax-free nature of the Merger, Split-off and Debt Exchange and any Prohibited Acts that occurred prior to
May 26, 2013, remains in effect.
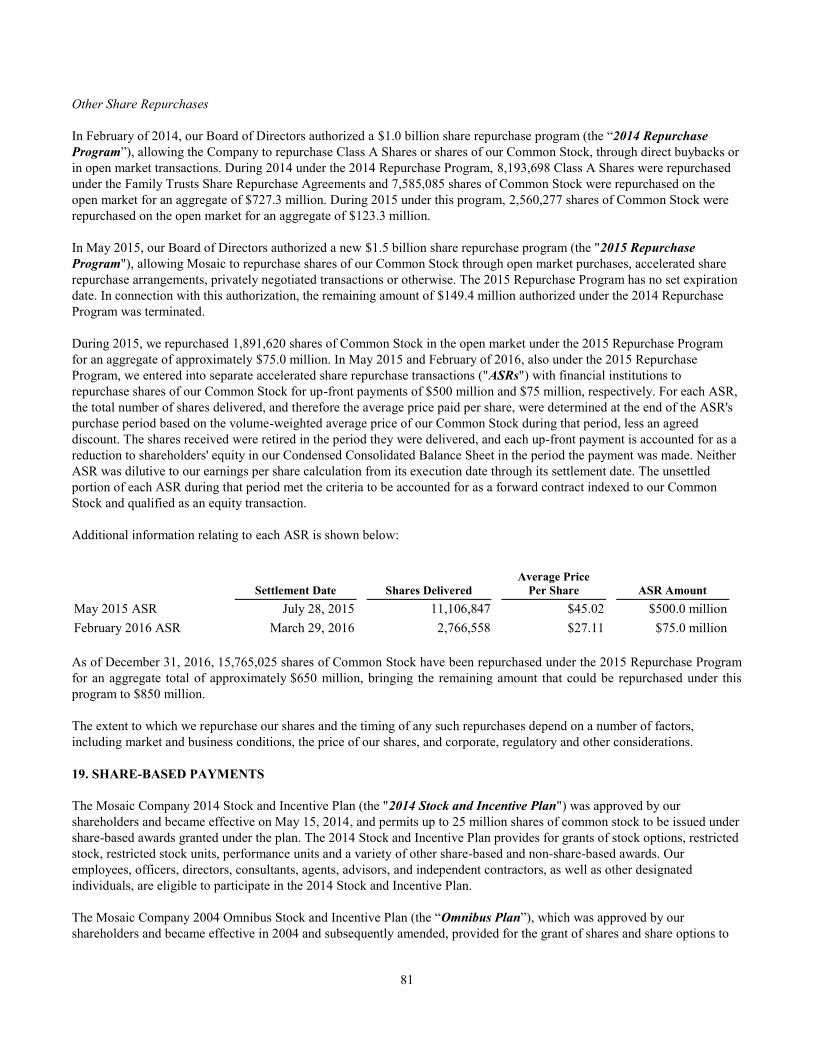
81
Other Share Repurchases
In February of 2014, our Board of Directors authorized a $1.0 billion share repurchase program (the “2014 Repurchase
Program”), allowing the Company to repurchase Class A Shares or shares of our Common Stock, through direct buybacks or
in open market transactions. During 2014 under the 2014 Repurchase Program, 8,193,698 Class A Shares were repurchased
under the Family Trusts Share Repurchase Agreements and 7,585,085 shares of Common Stock were repurchased on the
open market for an aggregate of $727.3 million. During 2015 under this program, 2,560,277 shares of Common Stock were
repurchased on the open market for an aggregate of $123.3 million.
In May 2015, our Board of Directors authorized a new $1.5 billion share repurchase program (the "2015 Repurchase
Program"), allowing Mosaic to repurchase shares of our Common Stock through open market purchases, accelerated share
repurchase arrangements, privately negotiated transactions or otherwise. The 2015 Repurchase Program has no set expiration
date. In connection with this authorization, the remaining amount of $149.4 million authorized under the 2014 Repurchase
Program was terminated.
During 2015, we repurchased 1,891,620 shares of Common Stock in the open market under the 2015 Repurchase Program
for an aggregate of approximately $75.0 million. In May 2015 and February of 2016, also under the 2015 Repurchase
Program, we entered into separate accelerated share repurchase transactions ("ASRs") with financial institutions to
repurchase shares of our Common Stock for up-front payments of $500 million and $75 million, respectively. For each ASR,
the total number of shares delivered, and therefore the average price paid per share, were determined at the end of the ASR's
purchase period based on the volume-weighted average price of our Common Stock during that period, less an agreed
discount. The shares received were retired in the period they were delivered, and each up-front payment is accounted for as a
reduction to shareholders' equity in our Condensed Consolidated Balance Sheet in the period the payment was made. Neither
ASR was dilutive to our earnings per share calculation from its execution date through its settlement date. The unsettled
portion of each ASR during that period met the criteria to be accounted for as a forward contract indexed to our Common
Stock and qualified as an equity transaction.
Additional information relating to each ASR is shown below:
Settlement Date Shares Delivered Average Price
Per Share ASR Amount
May 2015 ASR July 28, 2015 11,106,847
$45.02 $500.0 million
February 2016 ASR March 29, 2016 2,766,558
$27.11 $75.0 million
As of December 31, 2016, 15,765,025 shares of Common Stock have been repurchased under the 2015 Repurchase Program
for an aggregate total of approximately $650 million, bringing the remaining amount that could be repurchased under this
program to $850 million.
The extent to which we repurchase our shares and the timing of any such repurchases depend on a number of factors,
including market and business conditions, the price of our shares, and corporate, regulatory and other considerations.
19. SHARE-BASED PAYMENTS
The Mosaic Company 2014 Stock and Incentive Plan (the "2014 Stock and Incentive Plan") was approved by our
shareholders and became effective on May 15, 2014, and permits up to 25 million shares of common stock to be issued under
share-based awards granted under the plan. The 2014 Stock and Incentive Plan provides for grants of stock options, restricted
stock, restricted stock units, performance units and a variety of other share-based and non-share-based awards. Our
employees, officers, directors, consultants, agents, advisors, and independent contractors, as well as other designated
individuals, are eligible to participate in the 2014 Stock and Incentive Plan.
The Mosaic Company 2004 Omnibus Stock and Incentive Plan (the “Omnibus Plan”), which was approved by our
shareholders and became effective in 2004 and subsequently amended, provided for the grant of shares and share options to
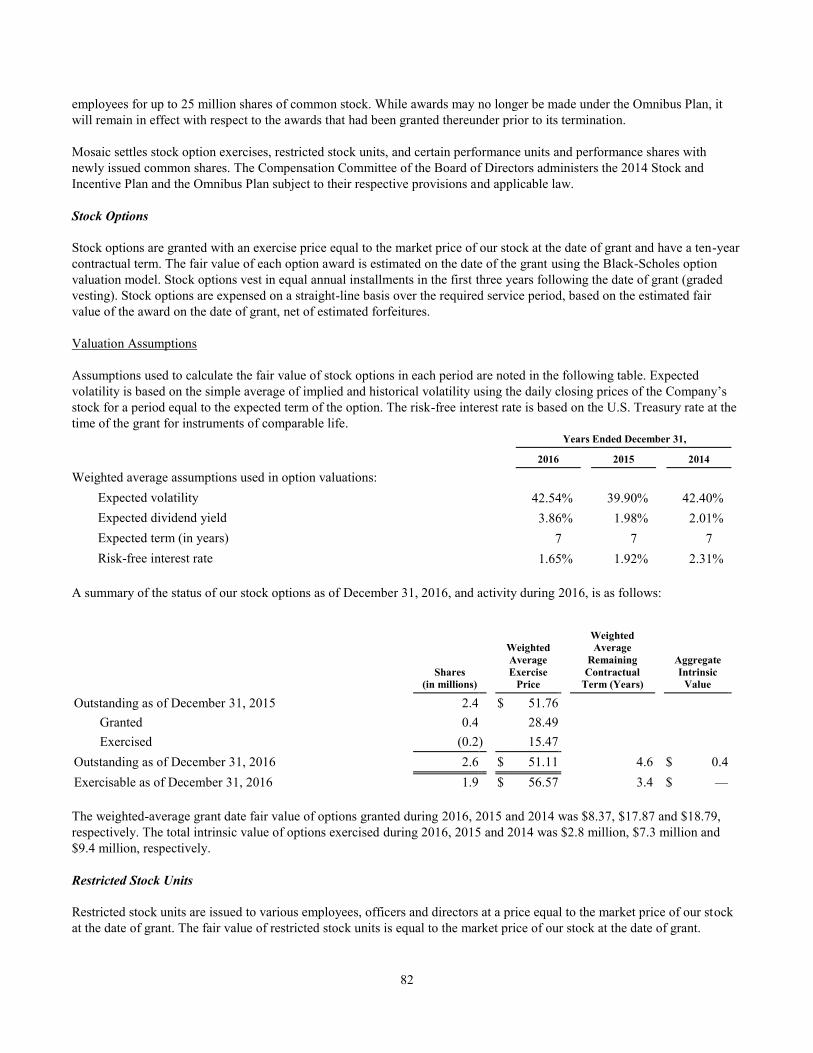
82
employees for up to 25 million shares of common stock. While awards may no longer be made under the Omnibus Plan, it
will remain in effect with respect to the awards that had been granted thereunder prior to its termination.
Mosaic settles stock option exercises, restricted stock units, and certain performance units and performance shares with
newly issued common shares. The Compensation Committee of the Board of Directors administers the 2014 Stock and
Incentive Plan and the Omnibus Plan subject to their respective provisions and applicable law.
Stock Options
Stock options are granted with an exercise price equal to the market price of our stock at the date of grant and have a ten-year
contractual term. The fair value of each option award is estimated on the date of the grant using the Black-Scholes option
valuation model. Stock options vest in equal annual installments in the first three years following the date of grant (graded
vesting). Stock options are expensed on a straight-line basis over the required service period, based on the estimated fair
value of the award on the date of grant, net of estimated forfeitures.
Valuation Assumptions
Assumptions used to calculate the fair value of stock options in each period are noted in the following table. Expected
volatility is based on the simple average of implied and historical volatility using the daily closing prices of the Company’s
stock for a period equal to the expected term of the option. The risk-free interest rate is based on the U.S. Treasury rate at the
time of the grant for instruments of comparable life. Years Ended December 31,
2016 2015 2014
Weighted average assumptions used in option valuations:
Expected volatility 42.54 % 39.90 % 42.40 %
Expected dividend yield 3.86 % 1.98 % 2.01 %
Expected term (in years) 7
7
7
Risk-free interest rate 1.65 % 1.92 % 2.31 %
A summary of the status of our stock options as of December 31, 2016, and activity during 2016, is as follows:
Shares
(in millions)
Weighted
Average
Exercise Price
Weighted
Average
Remaining
Contractual
Term (Years)
Aggregate
Intrinsic Value
Outstanding as of December 31, 2015 2.4
$ 51.76
Granted 0.4
28.49
Exercised (0.2 ) 15.47
Outstanding as of December 31, 2016 2.6
$ 51.11
4.6 $ 0.4
Exercisable as of December 31, 2016 1.9
$ 56.57
3.4 $ —
The weighted-average grant date fair value of options granted during 2016, 2015 and 2014 was $8.37, $17.87 and $18.79,
respectively. The total intrinsic value of options exercised during 2016, 2015 and 2014 was $2.8 million, $7.3 million and
$9.4 million, respectively.
Restricted Stock Units
Restricted stock units are issued to various employees, officers and directors at a price equal to the market price of our stock
at the date of grant. The fair value of restricted stock units is equal to the market price of our stock at the date of grant.
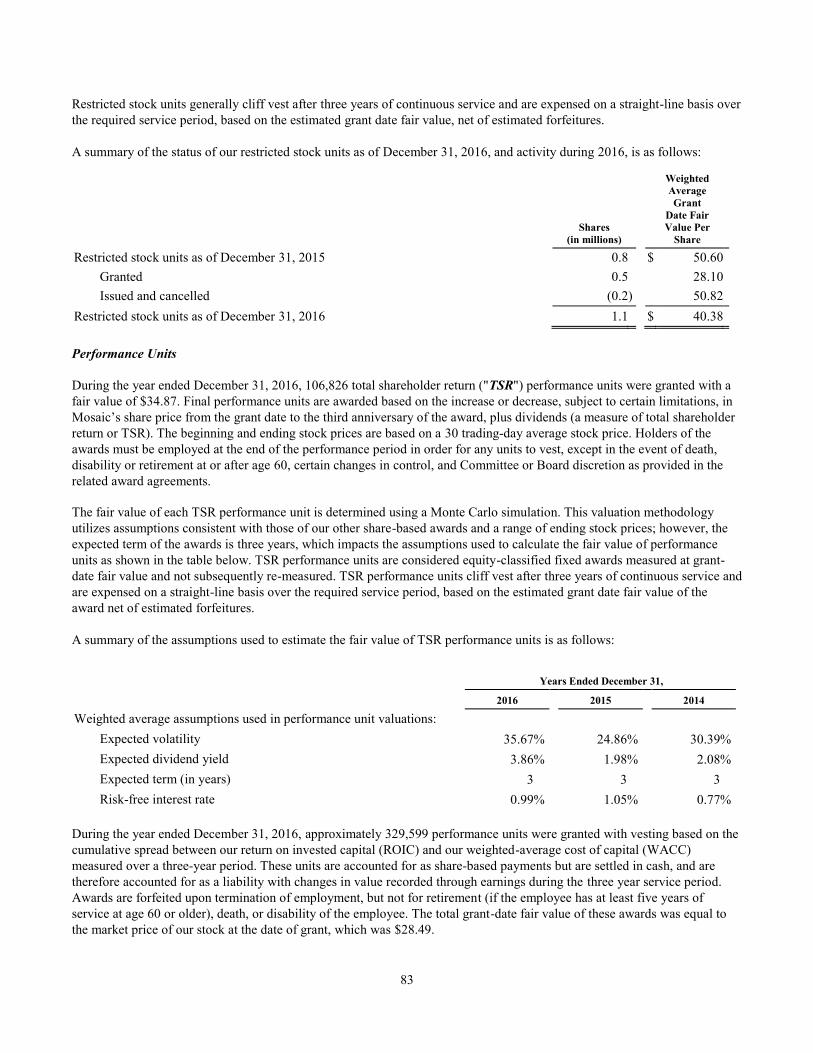
83
Restricted stock units generally cliff vest after three years of continuous service and are expensed on a straight-line basis over
the required service period, based on the estimated grant date fair value, net of estimated forfeitures.
A summary of the status of our restricted stock units as of December 31, 2016, and activity during 2016, is as follows:
Shares
(in millions)
Weighted Average
Grant
Date Fair Value Per
Share
Restricted stock units as of December 31, 2015 0.8
$ 50.60
Granted 0.5
28.10
Issued and cancelled (0.2 ) 50.82
Restricted stock units as of December 31, 2016 1.1
$ 40.38
Performance Units
During the year ended December 31, 2016, 106,826 total shareholder return ("TSR") performance units were granted with a
fair value of $34.87. Final performance units are awarded based on the increase or decrease, subject to certain limitations, in
Mosaic’s share price from the grant date to the third anniversary of the award, plus dividends (a measure of total shareholder
return or TSR). The beginning and ending stock prices are based on a 30 trading-day average stock price. Holders of the
awards must be employed at the end of the performance period in order for any units to vest, except in the event of death,
disability or retirement at or after age 60, certain changes in control, and Committee or Board discretion as provided in the
related award agreements.
The fair value of each TSR performance unit is determined using a Monte Carlo simulation. This valuation methodology
utilizes assumptions consistent with those of our other share-based awards and a range of ending stock prices; however, the
expected term of the awards is three years, which impacts the assumptions used to calculate the fair value of performance
units as shown in the table below. TSR performance units are considered equity-classified fixed awards measured at grant-
date fair value and not subsequently re-measured. TSR performance units cliff vest after three years of continuous service and
are expensed on a straight-line basis over the required service period, based on the estimated grant date fair value of the
award net of estimated forfeitures.
A summary of the assumptions used to estimate the fair value of TSR performance units is as follows:
Years Ended December 31,
2016 2015 2014
Weighted average assumptions used in performance unit valuations:
Expected volatility 35.67 % 24.86 % 30.39 %
Expected dividend yield 3.86 % 1.98 % 2.08 %
Expected term (in years) 3
3
3
Risk-free interest rate 0.99 % 1.05 % 0.77 %
During the year ended December 31, 2016, approximately 329,599 performance units were granted with vesting based on the
cumulative spread between our return on invested capital (ROIC) and our weighted-average cost of capital (WACC)
measured over a three-year period. These units are accounted for as share-based payments but are settled in cash, and are
therefore accounted for as a liability with changes in value recorded through earnings during the three year service period.
Awards are forfeited upon termination of employment, but not for retirement (if the employee has at least five years of
service at age 60 or older), death, or disability of the employee. The total grant-date fair value of these awards was equal to
the market price of our stock at the date of grant, which was $28.49.
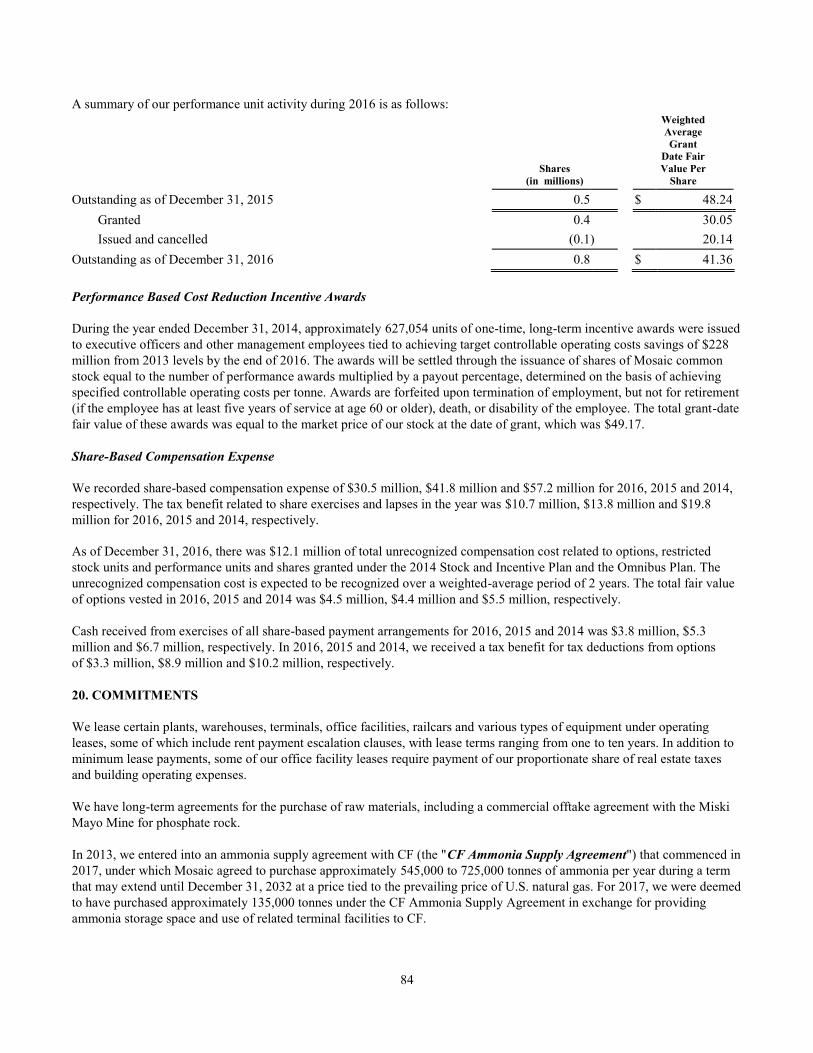
84
A summary of our performance unit activity during 2016 is as follows:
Shares
(in millions)
Weighted Average
Grant Date Fair
Value Per
Share
Outstanding as of December 31, 2015 0.5
$ 48.24
Granted 0.4
30.05
Issued and cancelled (0.1 ) 20.14
Outstanding as of December 31, 2016 0.8
$ 41.36
Performance Based Cost Reduction Incentive Awards
During the year ended December 31, 2014, approximately 627,054 units of one-time, long-term incentive awards were issued
to executive officers and other management employees tied to achieving target controllable operating costs savings of $228
million from 2013 levels by the end of 2016. The awards will be settled through the issuance of shares of Mosaic common
stock equal to the number of performance awards multiplied by a payout percentage, determined on the basis of achieving
specified controllable operating costs per tonne. Awards are forfeited upon termination of employment, but not for retirement
(if the employee has at least five years of service at age 60 or older), death, or disability of the employee. The total grant-date
fair value of these awards was equal to the market price of our stock at the date of grant, which was $49.17.
Share-Based Compensation Expense
We recorded share-based compensation expense of $30.5 million, $41.8 million and $57.2 million for 2016, 2015 and 2014,
respectively. The tax benefit related to share exercises and lapses in the year was $10.7 million, $13.8 million and $19.8
million for 2016, 2015 and 2014, respectively.
As of December 31, 2016, there was $12.1 million of total unrecognized compensation cost related to options, restricted
stock units and performance units and shares granted under the 2014 Stock and Incentive Plan and the Omnibus Plan. The
unrecognized compensation cost is expected to be recognized over a weighted-average period of 2 years. The total fair value
of options vested in 2016, 2015 and 2014 was $4.5 million, $4.4 million and $5.5 million, respectively.
Cash received from exercises of all share-based payment arrangements for 2016, 2015 and 2014 was $3.8 million, $5.3
million and $6.7 million, respectively. In 2016, 2015 and 2014, we received a tax benefit for tax deductions from options
of $3.3 million, $8.9 million and $10.2 million, respectively.
20. COMMITMENTS
We lease certain plants, warehouses, terminals, office facilities, railcars and various types of equipment under operating
leases, some of which include rent payment escalation clauses, with lease terms ranging from one to ten years. In addition to
minimum lease payments, some of our office facility leases require payment of our proportionate share of real estate taxes
and building operating expenses.
We have long-term agreements for the purchase of raw materials, including a commercial offtake agreement with the Miski
Mayo Mine for phosphate rock.
In 2013, we entered into an ammonia supply agreement with CF (the "CF Ammonia Supply Agreement") that commenced in
2017, under which Mosaic agreed to purchase approximately 545,000 to 725,000 tonnes of ammonia per year during a term
that may extend until December 31, 2032 at a price tied to the prevailing price of U.S. natural gas. For 2017, we were deemed
to have purchased approximately 135,000 tonnes under the CF Ammonia Supply Agreement in exchange for providing
ammonia storage space and use of related terminal facilities to CF.
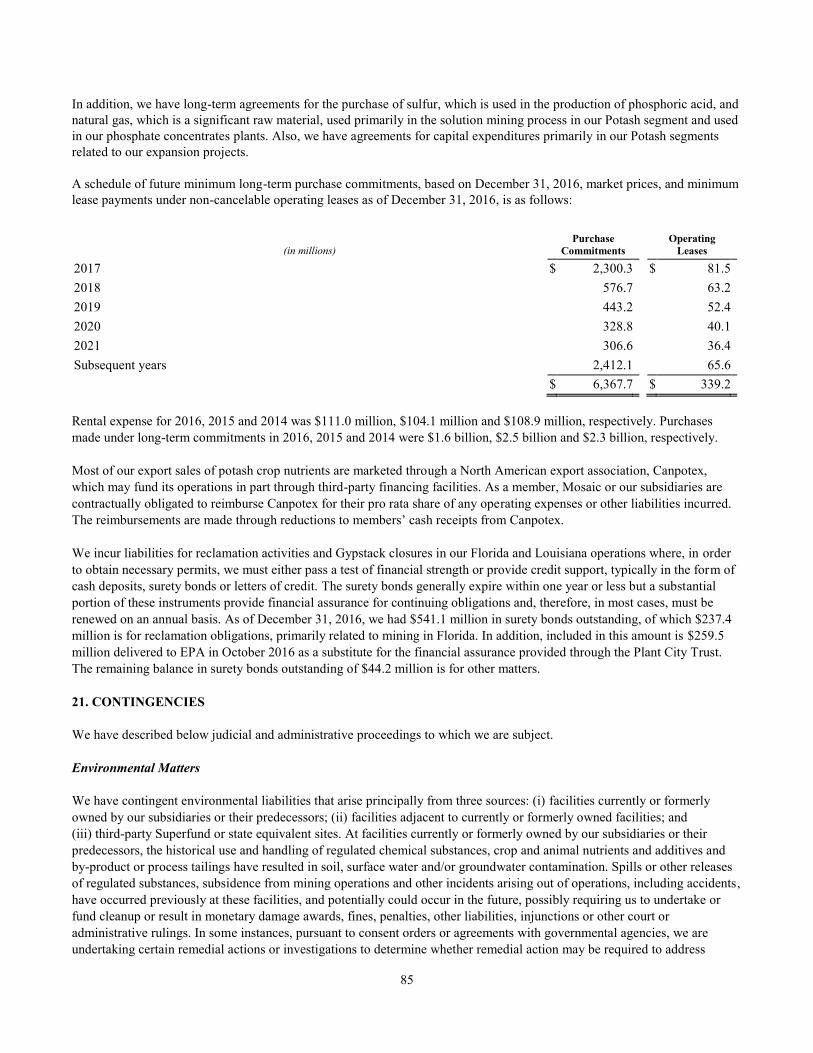
85
In addition, we have long-term agreements for the purchase of sulfur, which is used in the production of phosphoric acid, and
natural gas, which is a significant raw material, used primarily in the solution mining process in our Potash segment and used
in our phosphate concentrates plants. Also, we have agreements for capital expenditures primarily in our Potash segments
related to our expansion projects.
A schedule of future minimum long-term purchase commitments, based on December 31, 2016, market prices, and minimum
lease payments under non-cancelable operating leases as of December 31, 2016, is as follows:
(in millions) Purchase
Commitments Operating
Leases
2017 $ 2,300.3
$ 81.5
2018 576.7
63.2
2019 443.2
52.4
2020 328.8
40.1
2021 306.6
36.4
Subsequent years 2,412.1
65.6
$ 6,367.7
$ 339.2
Rental expense for 2016, 2015 and 2014 was $111.0 million, $104.1 million and $108.9 million, respectively. Purchases
made under long-term commitments in 2016, 2015 and 2014 were $1.6 billion, $2.5 billion and $2.3 billion, respectively.
Most of our export sales of potash crop nutrients are marketed through a North American export association, Canpotex,
which may fund its operations in part through third-party financing facilities. As a member, Mosaic or our subsidiaries are
contractually obligated to reimburse Canpotex for their pro rata share of any operating expenses or other liabilities incurred.
The reimbursements are made through reductions to members’ cash receipts from Canpotex.
We incur liabilities for reclamation activities and Gypstack closures in our Florida and Louisiana operations where, in order
to obtain necessary permits, we must either pass a test of financial strength or provide credit support, typically in the form of
cash deposits, surety bonds or letters of credit. The surety bonds generally expire within one year or less but a substantial
portion of these instruments provide financial assurance for continuing obligations and, therefore, in most cases, must be
renewed on an annual basis. As of December 31, 2016, we had $541.1 million in surety bonds outstanding, of which $237.4
million is for reclamation obligations, primarily related to mining in Florida. In addition, included in this amount is $259.5
million delivered to EPA in October 2016 as a substitute for the financial assurance provided through the Plant City Trust.
The remaining balance in surety bonds outstanding of $44.2 million is for other matters.
21. CONTINGENCIES
We have described below judicial and administrative proceedings to which we are subject.
Environmental Matters
We have contingent environmental liabilities that arise principally from three sources: (i) facilities currently or formerly
owned by our subsidiaries or their predecessors; (ii) facilities adjacent to currently or formerly owned facilities; and
(iii) third-party Superfund or state equivalent sites. At facilities currently or formerly owned by our subsidiaries or their
predecessors, the historical use and handling of regulated chemical substances, crop and animal nutrients and additives and
by-product or process tailings have resulted in soil, surface water and/or groundwater contamination. Spills or other releases
of regulated substances, subsidence from mining operations and other incidents arising out of operations, including accidents,
have occurred previously at these facilities, and potentially could occur in the future, possibly requiring us to undertake or
fund cleanup or result in monetary damage awards, fines, penalties, other liabilities, injunctions or other court or
administrative rulings. In some instances, pursuant to consent orders or agreements with governmental agencies, we are
undertaking certain remedial actions or investigations to determine whether remedial action may be required to address
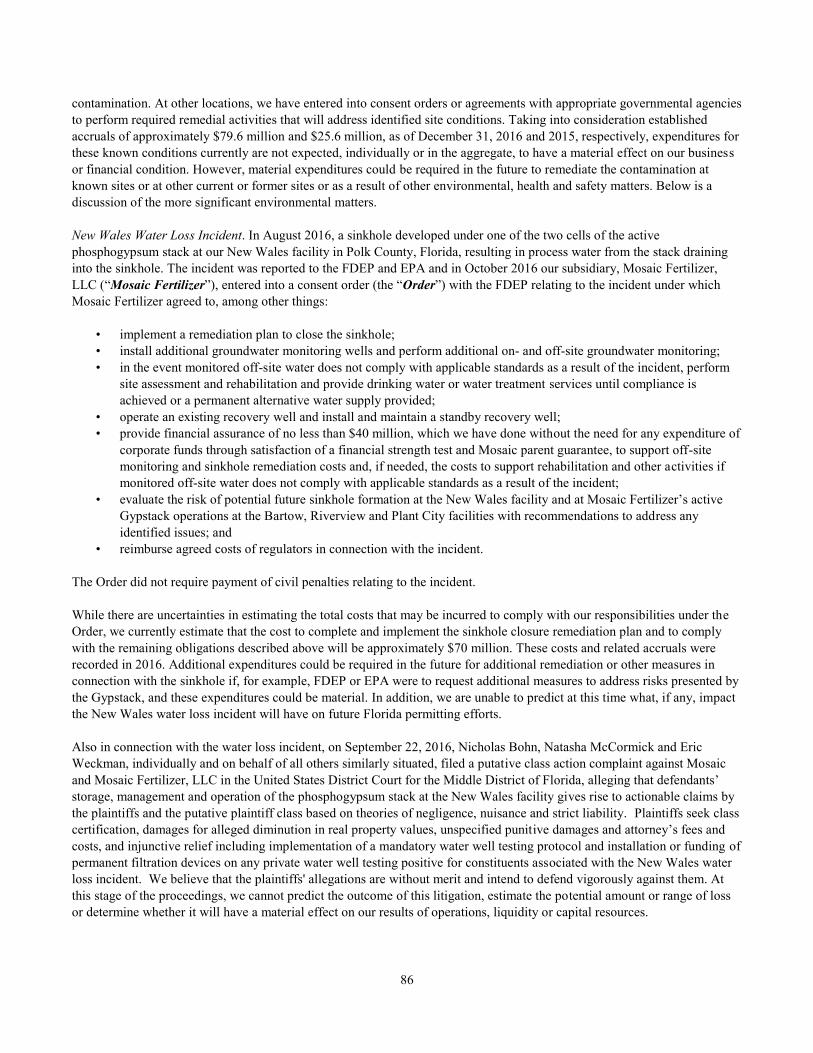
86
contamination. At other locations, we have entered into consent orders or agreements with appropriate governmental agencies
to perform required remedial activities that will address identified site conditions. Taking into consideration established
accruals of approximately $79.6 million and $25.6 million, as of December 31, 2016 and 2015, respectively, expenditures for
these known conditions currently are not expected, individually or in the aggregate, to have a material effect on our business
or financial condition. However, material expenditures could be required in the future to remediate the contamination at
known sites or at other current or former sites or as a result of other environmental, health and safety matters. Below is a
discussion of the more significant environmental matters.
New Wales Water Loss Incident. In August 2016, a sinkhole developed under one of the two cells of the active
phosphogypsum stack at our New Wales facility in Polk County, Florida, resulting in process water from the stack draining
into the sinkhole. The incident was reported to the FDEP and EPA and in October 2016 our subsidiary, Mosaic Fertilizer,
LLC (“Mosaic Fertilizer”), entered into a consent order (the “Order”) with the FDEP relating to the incident under which
Mosaic Fertilizer agreed to, among other things:
• implement a remediation plan to close the sinkhole;
• install additional groundwater monitoring wells and perform additional on- and off-site groundwater monitoring;
• in the event monitored off-site water does not comply with applicable standards as a result of the incident, perform
site assessment and rehabilitation and provide drinking water or water treatment services until compliance is
achieved or a permanent alternative water supply provided;
• operate an existing recovery well and install and maintain a standby recovery well;
• provide financial assurance of no less than $40 million, which we have done without the need for any expenditure of
corporate funds through satisfaction of a financial strength test and Mosaic parent guarantee, to support off-site
monitoring and sinkhole remediation costs and, if needed, the costs to support rehabilitation and other activities if
monitored off-site water does not comply with applicable standards as a result of the incident;
• evaluate the risk of potential future sinkhole formation at the New Wales facility and at Mosaic Fertilizer’s active
Gypstack operations at the Bartow, Riverview and Plant City facilities with recommendations to address any
identified issues; and
• reimburse agreed costs of regulators in connection with the incident.
The Order did not require payment of civil penalties relating to the incident.
While there are uncertainties in estimating the total costs that may be incurred to comply with our responsibilities under the
Order, we currently estimate that the cost to complete and implement the sinkhole closure remediation plan and to comply
with the remaining obligations described above will be approximately $70 million. These costs and related accruals were
recorded in 2016. Additional expenditures could be required in the future for additional remediation or other measures in
connection with the sinkhole if, for example, FDEP or EPA were to request additional measures to address risks presented by
the Gypstack, and these expenditures could be material. In addition, we are unable to predict at this time what, if any, impact
the New Wales water loss incident will have on future Florida permitting efforts.
Also in connection with the water loss incident, on September 22, 2016, Nicholas Bohn, Natasha McCormick and Eric
Weckman, individually and on behalf of all others similarly situated, filed a putative class action complaint against Mosaic
and Mosaic Fertilizer, LLC in the United States District Court for the Middle District of Florida, alleging that defendants’
storage, management and operation of the phosphogypsum stack at the New Wales facility gives rise to actionable claims by
the plaintiffs and the putative plaintiff class based on theories of negligence, nuisance and strict liability. Plaintiffs seek class
certification, damages for alleged diminution in real property values, unspecified punitive damages and attorney’s fees and
costs, and injunctive relief including implementation of a mandatory water well testing protocol and installation or funding of
permanent filtration devices on any private water well testing positive for constituents associated with the New Wales water
loss incident. We believe that the plaintiffs' allegations are without merit and intend to defend vigorously against them. At
this stage of the proceedings, we cannot predict the outcome of this litigation, estimate the potential amount or range of loss
or determine whether it will have a material effect on our results of operations, liquidity or capital resources.
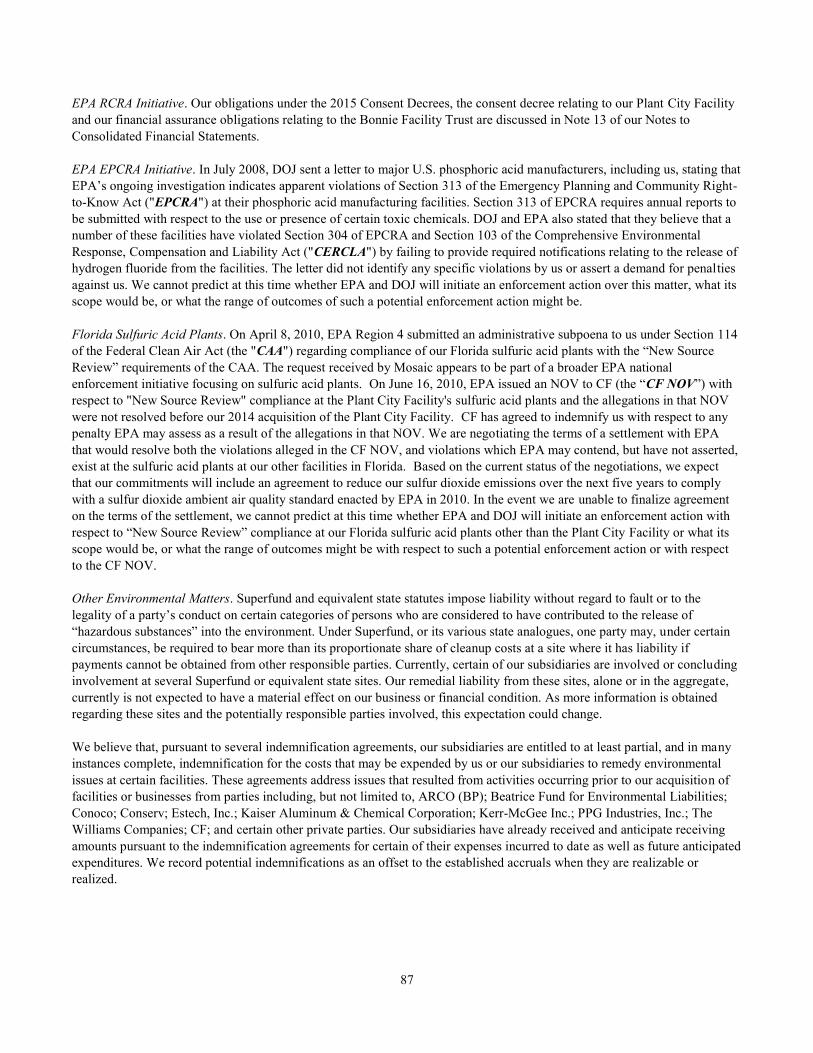
87
EPA RCRA Initiative. Our obligations under the 2015 Consent Decrees, the consent decree relating to our Plant City Facility
and our financial assurance obligations relating to the Bonnie Facility Trust are discussed in Note 13 of our Notes to
Consolidated Financial Statements.
EPA EPCRA Initiative. In July 2008, DOJ sent a letter to major U.S. phosphoric acid manufacturers, including us, stating that
EPA’s ongoing investigation indicates apparent violations of Section 313 of the Emergency Planning and Community Right-
to-Know Act ("EPCRA") at their phosphoric acid manufacturing facilities. Section 313 of EPCRA requires annual reports to
be submitted with respect to the use or presence of certain toxic chemicals. DOJ and EPA also stated that they believe that a
number of these facilities have violated Section 304 of EPCRA and Section 103 of the Comprehensive Environmental
Response, Compensation and Liability Act ("CERCLA") by failing to provide required notifications relating to the release of
hydrogen fluoride from the facilities. The letter did not identify any specific violations by us or assert a demand for penalties
against us. We cannot predict at this time whether EPA and DOJ will initiate an enforcement action over this matter, what its
scope would be, or what the range of outcomes of such a potential enforcement action might be.
Florida Sulfuric Acid Plants. On April 8, 2010, EPA Region 4 submitted an administrative subpoena to us under Section 114
of the Federal Clean Air Act (the "CAA") regarding compliance of our Florida sulfuric acid plants with the “New Source
Review” requirements of the CAA. The request received by Mosaic appears to be part of a broader EPA national
enforcement initiative focusing on sulfuric acid plants. On June 16, 2010, EPA issued an NOV to CF (the “CF NOV”) with
respect to "New Source Review" compliance at the Plant City Facility's sulfuric acid plants and the allegations in that NOV
were not resolved before our 2014 acquisition of the Plant City Facility. CF has agreed to indemnify us with respect to any
penalty EPA may assess as a result of the allegations in that NOV. We are negotiating the terms of a settlement with EPA
that would resolve both the violations alleged in the CF NOV, and violations which EPA may contend, but have not asserted,
exist at the sulfuric acid plants at our other facilities in Florida. Based on the current status of the negotiations, we expect
that our commitments will include an agreement to reduce our sulfur dioxide emissions over the next five years to comply
with a sulfur dioxide ambient air quality standard enacted by EPA in 2010. In the event we are unable to finalize agreement
on the terms of the settlement, we cannot predict at this time whether EPA and DOJ will initiate an enforcement action with
respect to “New Source Review” compliance at our Florida sulfuric acid plants other than the Plant City Facility or what its
scope would be, or what the range of outcomes might be with respect to such a potential enforcement action or with respect
to the CF NOV.
Other Environmental Matters. Superfund and equivalent state statutes impose liability without regard to fault or to the
legality of a party’s conduct on certain categories of persons who are considered to have contributed to the release of
“hazardous substances” into the environment. Under Superfund, or its various state analogues, one party may, under certain
circumstances, be required to bear more than its proportionate share of cleanup costs at a site where it has liability if
payments cannot be obtained from other responsible parties. Currently, certain of our subsidiaries are involved or concluding
involvement at several Superfund or equivalent state sites. Our remedial liability from these sites, alone or in the aggregate,
currently is not expected to have a material effect on our business or financial condition. As more information is obtained
regarding these sites and the potentially responsible parties involved, this expectation could change.
We believe that, pursuant to several indemnification agreements, our subsidiaries are entitled to at least partial, and in many
instances complete, indemnification for the costs that may be expended by us or our subsidiaries to remedy environmental
issues at certain facilities. These agreements address issues that resulted from activities occurring prior to our acquisition of
facilities or businesses from parties including, but not limited to, ARCO (BP); Beatrice Fund for Environmental Liabilities;
Conoco; Conserv; Estech, Inc.; Kaiser Aluminum & Chemical Corporation; Kerr-McGee Inc.; PPG Industries, Inc.; The
Williams Companies; CF; and certain other private parties. Our subsidiaries have already received and anticipate receiving
amounts pursuant to the indemnification agreements for certain of their expenses incurred to date as well as future anticipated
expenditures. We record potential indemnifications as an offset to the established accruals when they are realizable or
realized.
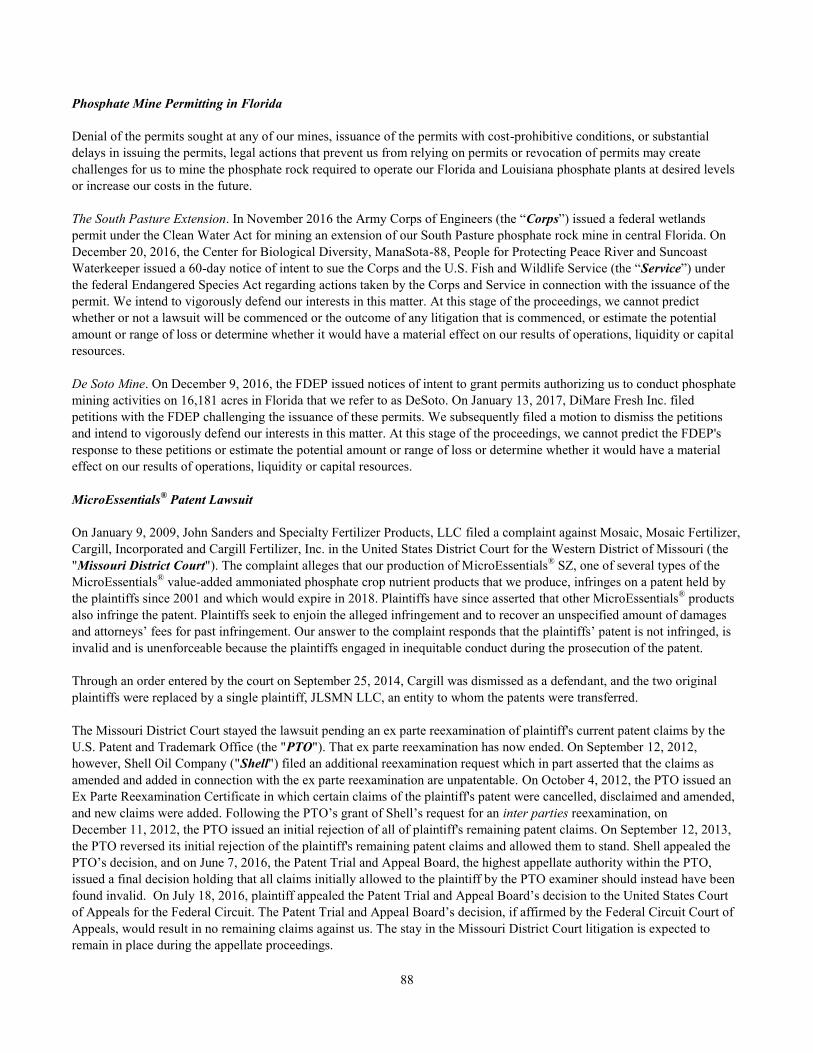
88
Phosphate Mine Permitting in Florida
Denial of the permits sought at any of our mines, issuance of the permits with cost-prohibitive conditions, or substantial
delays in issuing the permits, legal actions that prevent us from relying on permits or revocation of permits may create
challenges for us to mine the phosphate rock required to operate our Florida and Louisiana phosphate plants at desired levels
or increase our costs in the future.
The South Pasture Extension. In November 2016 the Army Corps of Engineers (the “Corps”) issued a federal wetlands
permit under the Clean Water Act for mining an extension of our South Pasture phosphate rock mine in central Florida. On
December 20, 2016, the Center for Biological Diversity, ManaSota-88, People for Protecting Peace River and Suncoast
Waterkeeper issued a 60-day notice of intent to sue the Corps and the U.S. Fish and Wildlife Service (the “Service”) under
the federal Endangered Species Act regarding actions taken by the Corps and Service in connection with the issuance of the
permit. We intend to vigorously defend our interests in this matter. At this stage of the proceedings, we cannot predict
whether or not a lawsuit will be commenced or the outcome of any litigation that is commenced, or estimate the potential
amount or range of loss or determine whether it would have a material effect on our results of operations, liquidity or capital
resources.
De Soto Mine. On December 9, 2016, the FDEP issued notices of intent to grant permits authorizing us to conduct phosphate
mining activities on 16,181 acres in Florida that we refer to as DeSoto. On January 13, 2017, DiMare Fresh Inc. filed
petitions with the FDEP challenging the issuance of these permits. We subsequently filed a motion to dismiss the petitions
and intend to vigorously defend our interests in this matter. At this stage of the proceedings, we cannot predict the FDEP's
response to these petitions or estimate the potential amount or range of loss or determine whether it would have a material
effect on our results of operations, liquidity or capital resources.
MicroEssentials® Patent Lawsuit
On January 9, 2009, John Sanders and Specialty Fertilizer Products, LLC filed a complaint against Mosaic, Mosaic Fertilizer,
Cargill, Incorporated and Cargill Fertilizer, Inc. in the United States District Court for the Western District of Missouri (the
"Missouri District Court"). The complaint alleges that our production of MicroEssentials® SZ, one of several types of the
MicroEssentials® value-added ammoniated phosphate crop nutrient products that we produce, infringes on a patent held by
the plaintiffs since 2001 and which would expire in 2018. Plaintiffs have since asserted that other MicroEssentials® products
also infringe the patent. Plaintiffs seek to enjoin the alleged infringement and to recover an unspecified amount of damages
and attorneys’ fees for past infringement. Our answer to the complaint responds that the plaintiffs’ patent is not infringed, is
invalid and is unenforceable because the plaintiffs engaged in inequitable conduct during the prosecution of the patent.
Through an order entered by the court on September 25, 2014, Cargill was dismissed as a defendant, and the two original
plaintiffs were replaced by a single plaintiff, JLSMN LLC, an entity to whom the patents were transferred.
The Missouri District Court stayed the lawsuit pending an ex parte reexamination of plaintiff's current patent claims by the
U.S. Patent and Trademark Office (the "PTO"). That ex parte reexamination has now ended. On September 12, 2012,
however, Shell Oil Company ("Shell") filed an additional reexamination request which in part asserted that the claims as
amended and added in connection with the ex parte reexamination are unpatentable. On October 4, 2012, the PTO issued an
Ex Parte Reexamination Certificate in which certain claims of the plaintiff's patent were cancelled, disclaimed and amended,
and new claims were added. Following the PTO’s grant of Shell’s request for an inter parties reexamination, on
December 11, 2012, the PTO issued an initial rejection of all of plaintiff's remaining patent claims. On September 12, 2013,
the PTO reversed its initial rejection of the plaintiff's remaining patent claims and allowed them to stand. Shell appealed the
PTO’s decision, and on June 7, 2016, the Patent Trial and Appeal Board, the highest appellate authority within the PTO,
issued a final decision holding that all claims initially allowed to the plaintiff by the PTO examiner should instead have been
found invalid. On July 18, 2016, plaintiff appealed the Patent Trial and Appeal Board’s decision to the United States Court
of Appeals for the Federal Circuit. The Patent Trial and Appeal Board’s decision, if affirmed by the Federal Circuit Court of
Appeals, would result in no remaining claims against us. The stay in the Missouri District Court litigation is expected to
remain in place during the appellate proceedings.
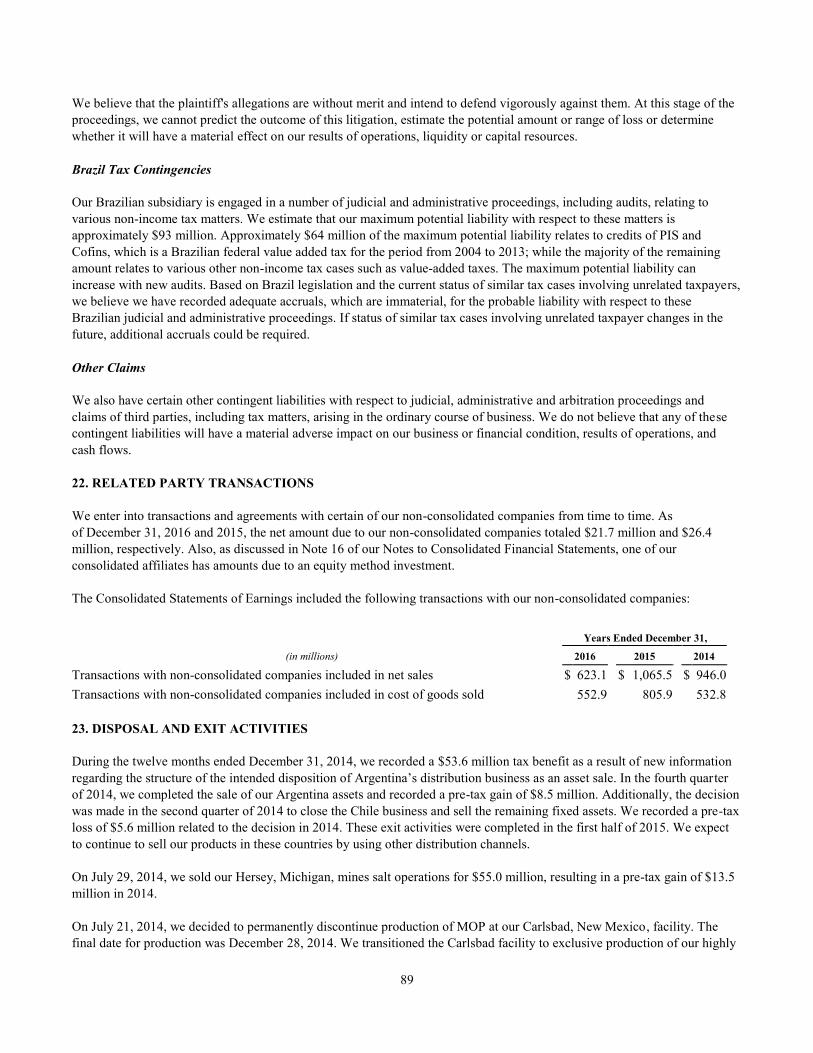
89
We believe that the plaintiff's allegations are without merit and intend to defend vigorously against them. At this stage of the
proceedings, we cannot predict the outcome of this litigation, estimate the potential amount or range of loss or determine
whether it will have a material effect on our results of operations, liquidity or capital resources.
Brazil Tax Contingencies
Our Brazilian subsidiary is engaged in a number of judicial and administrative proceedings, including audits, relating to
various non-income tax matters. We estimate that our maximum potential liability with respect to these matters is
approximately $93 million. Approximately $64 million of the maximum potential liability relates to credits of PIS and
Cofins, which is a Brazilian federal value added tax for the period from 2004 to 2013; while the majority of the remaining
amount relates to various other non-income tax cases such as value-added taxes. The maximum potential liability can
increase with new audits. Based on Brazil legislation and the current status of similar tax cases involving unrelated taxpayers,
we believe we have recorded adequate accruals, which are immaterial, for the probable liability with respect to these
Brazilian judicial and administrative proceedings. If status of similar tax cases involving unrelated taxpayer changes in the
future, additional accruals could be required.
Other Claims
We also have certain other contingent liabilities with respect to judicial, administrative and arbitration proceedings and
claims of third parties, including tax matters, arising in the ordinary course of business. We do not believe that any of these
contingent liabilities will have a material adverse impact on our business or financial condition, results of operations, and
cash flows.
22. RELATED PARTY TRANSACTIONS
We enter into transactions and agreements with certain of our non-consolidated companies from time to time. As
of December 31, 2016 and 2015, the net amount due to our non-consolidated companies totaled $21.7 million and $26.4
million, respectively. Also, as discussed in Note 16 of our Notes to Consolidated Financial Statements, one of our
consolidated affiliates has amounts due to an equity method investment.
The Consolidated Statements of Earnings included the following transactions with our non-consolidated companies:
Years Ended December 31,
(in millions) 2016 2015 2014
Transactions with non-consolidated companies included in net sales $ 623.1
$ 1,065.5
$ 946.0
Transactions with non-consolidated companies included in cost of goods sold 552.9
805.9
532.8
23. DISPOSAL AND EXIT ACTIVITIES
During the twelve months ended December 31, 2014, we recorded a $53.6 million tax benefit as a result of new information
regarding the structure of the intended disposition of Argentina’s distribution business as an asset sale. In the fourth quarter
of 2014, we completed the sale of our Argentina assets and recorded a pre-tax gain of $8.5 million. Additionally, the decision
was made in the second quarter of 2014 to close the Chile business and sell the remaining fixed assets. We recorded a pre-tax
loss of $5.6 million related to the decision in 2014. These exit activities were completed in the first half of 2015. We expect
to continue to sell our products in these countries by using other distribution channels.
On July 29, 2014, we sold our Hersey, Michigan, mines salt operations for $55.0 million, resulting in a pre-tax gain of $13.5
million in 2014.
On July 21, 2014, we decided to permanently discontinue production of MOP at our Carlsbad, New Mexico, facility. The
final date for production was December 28, 2014. We transitioned the Carlsbad facility to exclusive production of our highly
90
valued K-Mag® product line. The pre-tax charges were $125.4 million, of which approximately $100 million related to
accelerated depreciation and depletion in 2014. We also recorded a tax benefit of approximately $52 million related to these
costs in the year ended December 31, 2014.
During 2014, we recorded severance charges and other personnel related costs of approximately $11 million in connection
with the previously announced closing of our Hookers Prairie phosphate mine and certain cost saving initiatives.
24. PROPOSED ACQUISITION OF VALE FERTILIZANTES S.A.
On December 19, 2016, we entered into an agreement (the “Stock Purchase Agreement”) with Vale S.A. (“Vale”) and Vale
Fertilizer Netherlands B.V. (together with Vale and certain of its affiliates, the “Sellers”) to acquire all of the issued and
outstanding capital stock of Vale Fertilizantes S.A. (“Vale Fertilizantes”), the entity that conducts the global phosphate and
potash operations of Vale S.A. (“Vale”), for a purchase price of (i) $1.25 billion in cash and (ii) 42,286,874 shares of our
Common Stock, par value $0.01 per share (“Common Stock”). The cash portion of the purchase price is subject to
adjustments based on matters such as the working capital and indebtedness balances of Vale Fertilizantes at the time of the
closing. In addition, Mosaic has agreed to pay an additional amount in cash of up to $260 million if certain thresholds
relating to the pricing of monoammonium phosphate (“MAP”) and the strength of the Brazilian real over the two year-period
following the closing of the acquisition are satisfied. As part of the transaction, we will acquire the Sellers’ 40% economic
interest in the joint venture which owns the Miski Mayo phosphate rock mine in the Bayovar region of Peru, in which we
already hold a 35% economic interest, and Vale’s potash project at Kronau, Saskatchewan. The agreement also includes an
option for us to acquire the Sellers’ Rio Colorado, Argentina, potash project as part of the transaction.
The acquisition is subject to closing conditions including the transfer to affiliates of Vale of certain industrial complexes
located in the City of Cubatão (the “Cubatão Business”) that are operated by Vale Fertilizantes and its subsidiaries; the
expiration or termination of the applicable waiting period under U.S. antitrust law and antitrust approvals in Brazil and
Canada; the achievement of other specified regulatory and operational milestones; the absence of any governmental restraint
due to the recent water loss incident at our New Wales facility in Florida that results in a reduction or suspension of
operations or increased operating costs at the facility and would reasonably be expected to materially adversely impact
Mosaic and its subsidiaries, taken as a whole; and other customary closing conditions.
The Stock Purchase Agreement contains certain termination rights for both Mosaic and the Sellers, including if the
transaction has not been consummated by December 31, 2017. If the Stock Purchase Agreement is terminated by Mosaic or
Vale because the Sellers have not obtained certain specified third party consents within 75 days after the date of the Stock
Purchase Agreement, the Sellers may be required to pay Mosaic a termination fee of $125 million.
Mosaic has also agreed to enter into an investor agreement (“Investor Agreement”) with Vale as of the closing of the
transaction that will provide Vale with certain rights to designate up to two individuals to Mosaic’s board of directors. Under
the Investor Agreement, Vale or its affiliates receiving the shares of Common Stock to be issued by us (the “Vale
Stockholders”) will be subject to certain transfer and standstill restrictions. In addition, until the later of the third anniversary
of the closing and the date on which our board of directors no longer includes any Vale designees, the Vale Stockholders will
agree to vote their shares of our stock (i) with respect to the election of directors, in accordance with the recommendation of
our board of directors and (ii) with respect to any other proposal or resolution, at their election, either in the same manner as
and in the same proportion to all voting securities that are not beneficially held by the Vale Stockholders are voted, or in
accordance with the recommendation of our board of directors. Also under the Investor Agreement, the Vale Stockholders
will be entitled to certain demand and to customary piggyback registration rights, beginning on the second anniversary of the
closing of the transaction.
On February 6, 2017, we received notice from the U.S. Federal Trade Commission that it had granted early termination of the
applicable waiting period under the Hart-Scott-Rodino Antitrust Improvements Act of 1976, satisfying one of the conditions
to closing. The transaction is subject to the satisfaction of other regulatory and closing conditions and is expected to close in
late 2017, although there can be no assurance that the closing will occur within the expected timeframe or at all.
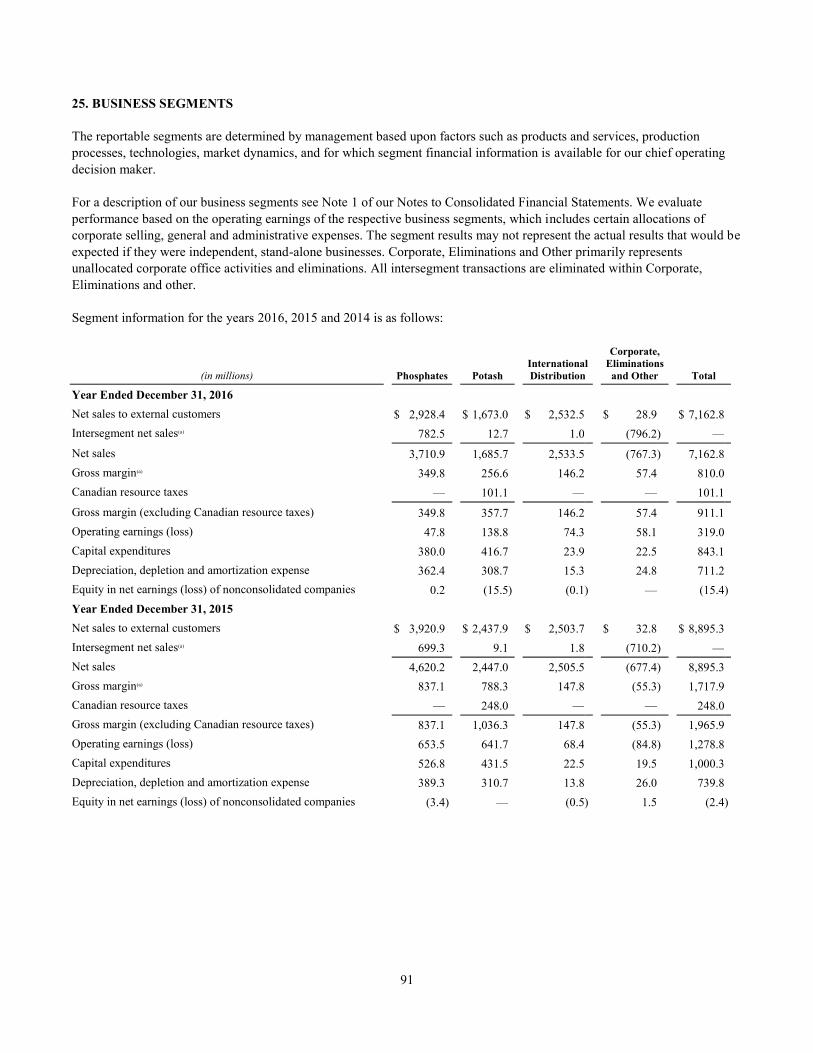
91
25. BUSINESS SEGMENTS
The reportable segments are determined by management based upon factors such as products and services, production
processes, technologies, market dynamics, and for which segment financial information is available for our chief operating
decision maker.
For a description of our business segments see Note 1 of our Notes to Consolidated Financial Statements. We evaluate
performance based on the operating earnings of the respective business segments, which includes certain allocations of
corporate selling, general and administrative expenses. The segment results may not represent the actual results that would be
expected if they were independent, stand-alone businesses. Corporate, Eliminations and Other primarily represents
unallocated corporate office activities and eliminations. All intersegment transactions are eliminated within Corporate,
Eliminations and other.
Segment information for the years 2016, 2015 and 2014 is as follows:
(in millions) Phosphates Potash International
Distribution
Corporate, Eliminations
and Other Total
Year Ended December 31, 2016
Net sales to external customers $ 2,928.4
$ 1,673.0
$ 2,532.5
$ 28.9
$ 7,162.8
Intersegment net sales(a) 782.5
12.7
1.0
(796.2 ) —
Net sales 3,710.9
1,685.7
2,533.5
(767.3 ) 7,162.8
Gross margin(a) 349.8
256.6
146.2
57.4
810.0
Canadian resource taxes —
101.1
—
—
101.1
Gross margin (excluding Canadian resource taxes) 349.8
357.7
146.2
57.4
911.1
Operating earnings (loss) 47.8
138.8
74.3
58.1
319.0
Capital expenditures 380.0
416.7
23.9
22.5
843.1
Depreciation, depletion and amortization expense 362.4
308.7
15.3
24.8
711.2
Equity in net earnings (loss) of nonconsolidated companies 0.2
(15.5 ) (0.1 ) —
(15.4 )
Year Ended December 31, 2015
Net sales to external customers $ 3,920.9
$ 2,437.9
$ 2,503.7
$ 32.8
$ 8,895.3
Intersegment net sales(a) 699.3
9.1
1.8
(710.2 ) —
Net sales 4,620.2
2,447.0
2,505.5
(677.4 ) 8,895.3
Gross margin(a) 837.1
788.3
147.8
(55.3 ) 1,717.9
Canadian resource taxes —
248.0
—
—
248.0
Gross margin (excluding Canadian resource taxes) 837.1
1,036.3
147.8
(55.3 ) 1,965.9
Operating earnings (loss) 653.5
641.7
68.4
(84.8 ) 1,278.8
Capital expenditures 526.8
431.5
22.5
19.5
1,000.3
Depreciation, depletion and amortization expense 389.3
310.7
13.8
26.0
739.8
Equity in net earnings (loss) of nonconsolidated companies (3.4 ) —
(0.5 ) 1.5
(2.4 )
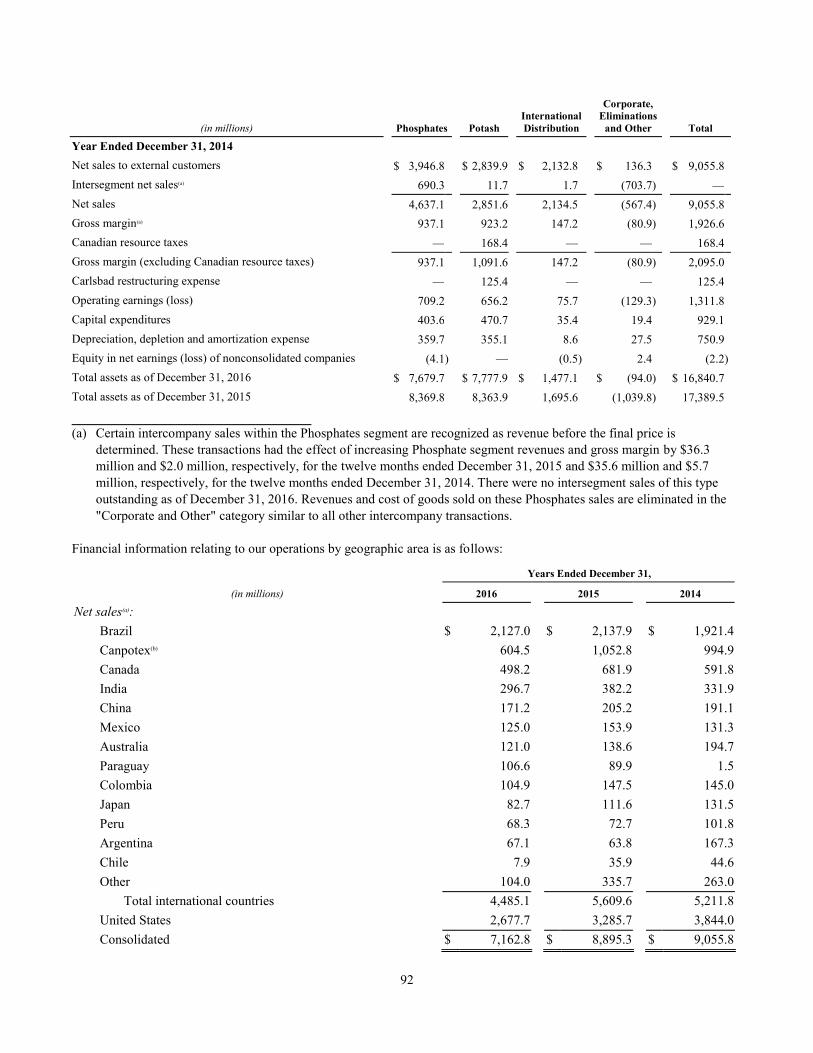
92
(in millions) Phosphates Potash International
Distribution
Corporate, Eliminations
and Other Total
Year Ended December 31, 2014
Net sales to external customers $ 3,946.8
$ 2,839.9
$ 2,132.8
$ 136.3
$ 9,055.8
Intersegment net sales(a) 690.3
11.7
1.7
(703.7 ) —
Net sales 4,637.1
2,851.6
2,134.5
(567.4 ) 9,055.8
Gross margin(a) 937.1
923.2
147.2
(80.9 ) 1,926.6
Canadian resource taxes —
168.4
—
—
168.4
Gross margin (excluding Canadian resource taxes) 937.1
1,091.6
147.2
(80.9 ) 2,095.0
Carlsbad restructuring expense —
125.4
—
—
125.4
Operating earnings (loss) 709.2
656.2
75.7
(129.3 ) 1,311.8
Capital expenditures 403.6
470.7
35.4
19.4
929.1
Depreciation, depletion and amortization expense 359.7
355.1
8.6
27.5
750.9
Equity in net earnings (loss) of nonconsolidated companies (4.1 ) —
(0.5 ) 2.4
(2.2 )
Total assets as of December 31, 2016 $ 7,679.7
$ 7,777.9
$ 1,477.1
$ (94.0 ) $ 16,840.7
Total assets as of December 31, 2015 8,369.8
8,363.9
1,695.6
(1,039.8 ) 17,389.5
______________________________ (a) Certain intercompany sales within the Phosphates segment are recognized as revenue before the final price is
determined. These transactions had the effect of increasing Phosphate segment revenues and gross margin by $36.3
million and $2.0 million, respectively, for the twelve months ended December 31, 2015 and $35.6 million and $5.7
million, respectively, for the twelve months ended December 31, 2014. There were no intersegment sales of this type
outstanding as of December 31, 2016. Revenues and cost of goods sold on these Phosphates sales are eliminated in the
"Corporate and Other" category similar to all other intercompany transactions.
Financial information relating to our operations by geographic area is as follows:
Years Ended December 31,
(in millions) 2016 2015 2014
Net sales(a):
Brazil $ 2,127.0
$ 2,137.9
$ 1,921.4
Canpotex(b) 604.5
1,052.8
994.9
Canada 498.2
681.9
591.8
India 296.7
382.2
331.9
China 171.2
205.2
191.1
Mexico 125.0
153.9
131.3
Australia 121.0
138.6
194.7
Paraguay 106.6
89.9
1.5
Colombia 104.9
147.5
145.0
Japan 82.7
111.6
131.5
Peru 68.3
72.7
101.8
Argentina 67.1
63.8
167.3
Chile 7.9
35.9
44.6
Other 104.0
335.7
263.0
Total international countries 4,485.1
5,609.6
5,211.8
United States 2,677.7
3,285.7
3,844.0
Consolidated $ 7,162.8
$ 8,895.3
$ 9,055.8
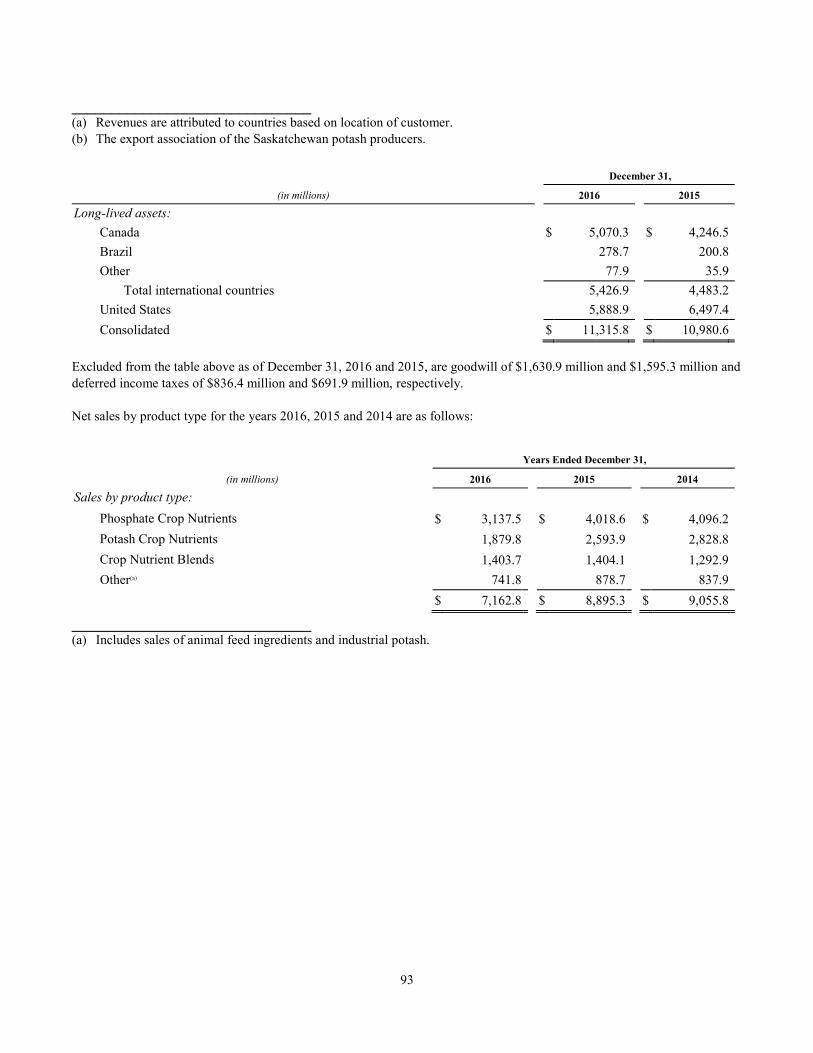
93
______________________________ (a) Revenues are attributed to countries based on location of customer.
(b) The export association of the Saskatchewan potash producers.
December 31,
(in millions) 2016 2015
Long-lived assets:
Canada $ 5,070.3
$ 4,246.5
Brazil 278.7
200.8
Other 77.9
35.9
Total international countries 5,426.9
4,483.2
United States 5,888.9
6,497.4
Consolidated $ 11,315.8
$ 10,980.6
Excluded from the table above as of December 31, 2016 and 2015, are goodwill of $1,630.9 million and $1,595.3 million and
deferred income taxes of $836.4 million and $691.9 million, respectively.
Net sales by product type for the years 2016, 2015 and 2014 are as follows:
Years Ended December 31,
(in millions) 2016 2015 2014
Sales by product type:
Phosphate Crop Nutrients $ 3,137.5
$ 4,018.6
$ 4,096.2
Potash Crop Nutrients 1,879.8
2,593.9
2,828.8
Crop Nutrient Blends 1,403.7
1,404.1
1,292.9
Other(a) 741.8
878.7
837.9
$ 7,162.8
$ 8,895.3
$ 9,055.8
______________________________ (a) Includes sales of animal feed ingredients and industrial potash.
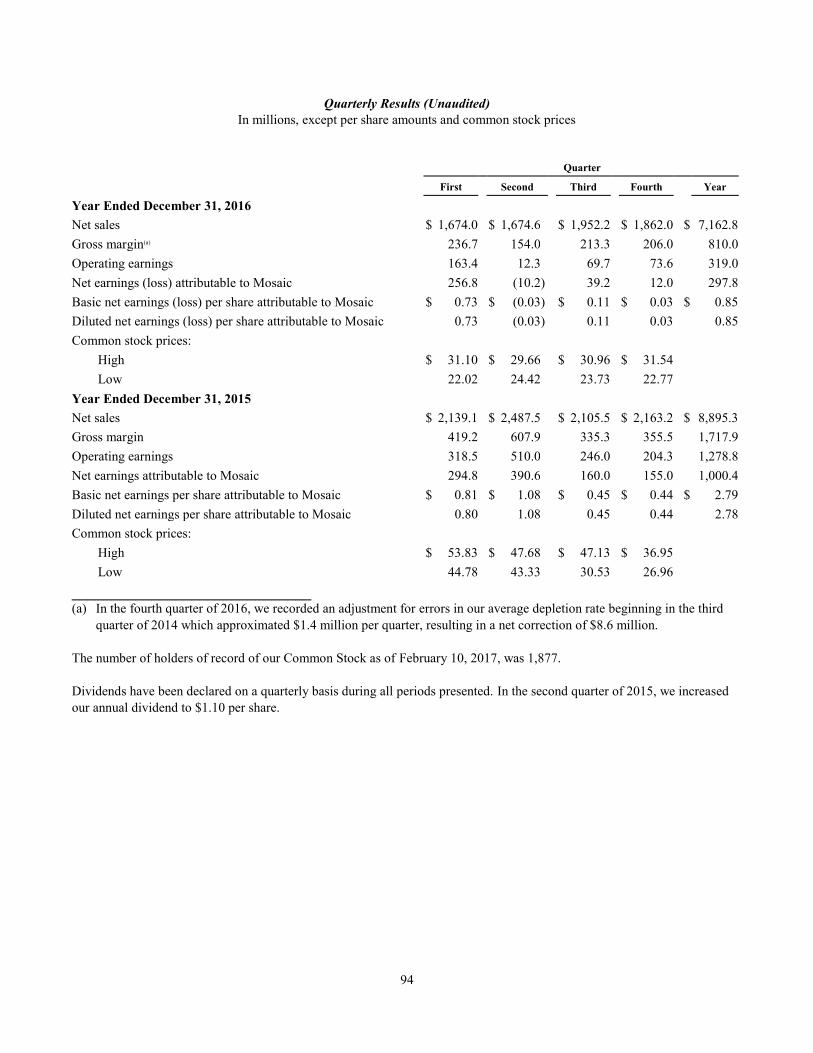
94
Quarterly Results (Unaudited)
In millions, except per share amounts and common stock prices
Quarter
First Second Third Fourth Year
Year Ended December 31, 2016
Net sales $ 1,674.0
$ 1,674.6
$ 1,952.2
$ 1,862.0
$ 7,162.8
Gross margin(a) 236.7
154.0
213.3
206.0
810.0
Operating earnings 163.4
12.3
69.7
73.6
319.0
Net earnings (loss) attributable to Mosaic 256.8
(10.2 ) 39.2
12.0
297.8
Basic net earnings (loss) per share attributable to Mosaic $ 0.73
$ (0.03 ) $ 0.11
$ 0.03
$ 0.85
Diluted net earnings (loss) per share attributable to Mosaic 0.73
(0.03 ) 0.11
0.03
0.85
Common stock prices:
High $ 31.10
$ 29.66
$ 30.96
$ 31.54
Low 22.02
24.42
23.73
22.77
Year Ended December 31, 2015
Net sales $ 2,139.1
$ 2,487.5
$ 2,105.5
$ 2,163.2
$ 8,895.3
Gross margin 419.2
607.9
335.3
355.5
1,717.9
Operating earnings 318.5
510.0
246.0
204.3
1,278.8
Net earnings attributable to Mosaic 294.8
390.6
160.0
155.0
1,000.4
Basic net earnings per share attributable to Mosaic $ 0.81
$ 1.08
$ 0.45
$ 0.44
$ 2.79
Diluted net earnings per share attributable to Mosaic 0.80
1.08
0.45
0.44
2.78
Common stock prices:
High $ 53.83
$ 47.68
$ 47.13
$ 36.95
Low 44.78
43.33
30.53
26.96
______________________________ (a) In the fourth quarter of 2016, we recorded an adjustment for errors in our average depletion rate beginning in the third
quarter of 2014 which approximated $1.4 million per quarter, resulting in a net correction of $8.6 million.
The number of holders of record of our Common Stock as of February 10, 2017, was 1,877.
Dividends have been declared on a quarterly basis during all periods presented. In the second quarter of 2015, we increased
our annual dividend to $1.10 per share.
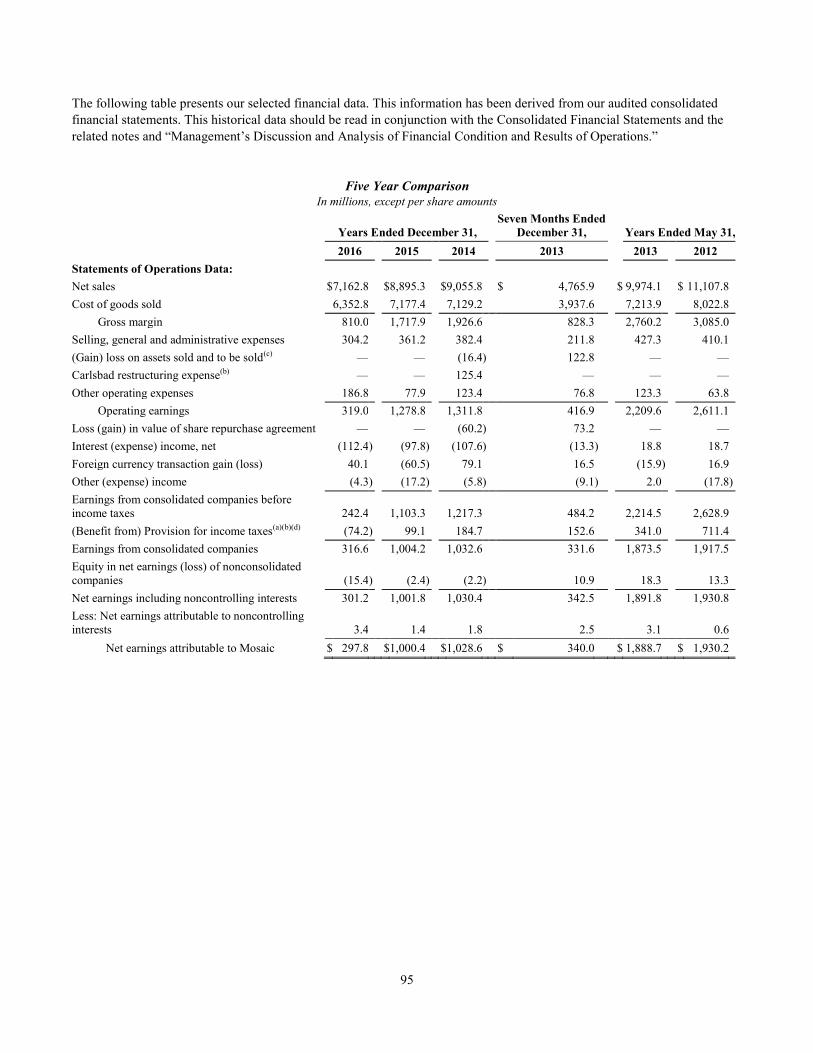
95
The following table presents our selected financial data. This information has been derived from our audited consolidated
financial statements. This historical data should be read in conjunction with the Consolidated Financial Statements and the
related notes and “Management’s Discussion and Analysis of Financial Condition and Results of Operations.”
Five Year Comparison
In millions, except per share amounts
Years Ended December 31,
Seven Months Ended
December 31, Years Ended May 31,
2016 2015 2014 2013 2013 2012
Statements of Operations Data:
Net sales $ 7,162.8
$ 8,895.3
$ 9,055.8
$ 4,765.9
$ 9,974.1
$ 11,107.8
Cost of goods sold 6,352.8
7,177.4
7,129.2
3,937.6
7,213.9
8,022.8
Gross margin 810.0
1,717.9
1,926.6
828.3
2,760.2
3,085.0
Selling, general and administrative expenses 304.2
361.2
382.4
211.8
427.3
410.1
(Gain) loss on assets sold and to be sold(c) —
—
(16.4 ) 122.8
—
—
Carlsbad restructuring expense(b) —
—
125.4
—
—
—
Other operating expenses 186.8
77.9
123.4
76.8
123.3
63.8
Operating earnings 319.0
1,278.8
1,311.8
416.9
2,209.6
2,611.1
Loss (gain) in value of share repurchase agreement —
—
(60.2 ) 73.2
—
—
Interest (expense) income, net (112.4 ) (97.8 ) (107.6 ) (13.3 ) 18.8
18.7
Foreign currency transaction gain (loss) 40.1
(60.5 ) 79.1
16.5
(15.9 ) 16.9
Other (expense) income (4.3 ) (17.2 ) (5.8 ) (9.1 ) 2.0
(17.8 )
Earnings from consolidated companies before
income taxes 242.4
1,103.3
1,217.3
484.2
2,214.5
2,628.9
(Benefit from) Provision for income taxes(a)(b)(d) (74.2 ) 99.1
184.7
152.6
341.0
711.4
Earnings from consolidated companies 316.6
1,004.2
1,032.6
331.6
1,873.5
1,917.5
Equity in net earnings (loss) of nonconsolidated
companies (15.4 ) (2.4 ) (2.2 ) 10.9
18.3
13.3
Net earnings including noncontrolling interests 301.2
1,001.8
1,030.4
342.5
1,891.8
1,930.8
Less: Net earnings attributable to noncontrolling
interests 3.4
1.4
1.8
2.5
3.1
0.6
Net earnings attributable to Mosaic $ 297.8
$ 1,000.4
$ 1,028.6
$ 340.0
$ 1,888.7
$ 1,930.2
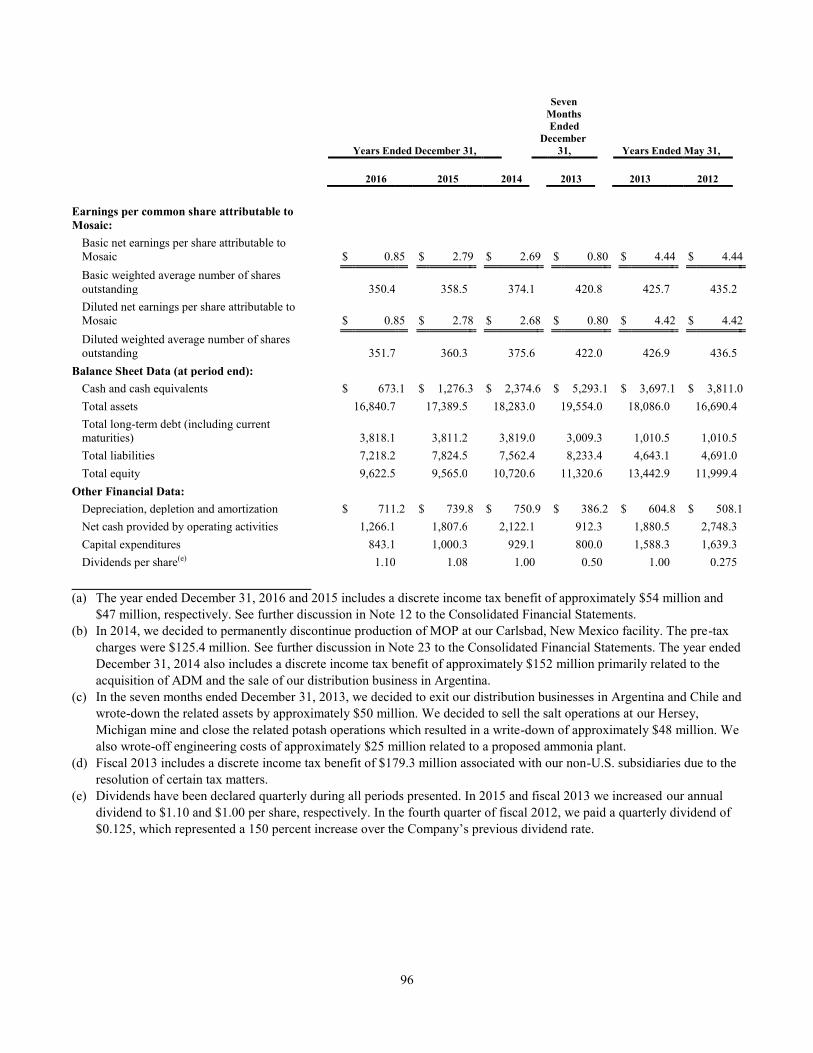
96
Years Ended December 31,
Seven
Months
Ended
December
31,
Years Ended May 31,
2016 2015 2014 2013 2013 2012
Earnings per common share attributable to
Mosaic:
Basic net earnings per share attributable to
Mosaic
$ 0.85
$ 2.79
$ 2.69
$ 0.80
$ 4.44
$ 4.44
Basic weighted average number of shares
outstanding
350.4
358.5
374.1
420.8
425.7
435.2
Diluted net earnings per share attributable to
Mosaic
$ 0.85
$ 2.78
$ 2.68
$ 0.80
$ 4.42
$ 4.42
Diluted weighted average number of shares
outstanding
351.7
360.3
375.6
422.0
426.9
436.5
Balance Sheet Data (at period end):
Cash and cash equivalents $ 673.1
$ 1,276.3
$ 2,374.6
$ 5,293.1
$ 3,697.1
$ 3,811.0
Total assets 16,840.7
17,389.5
18,283.0
19,554.0
18,086.0
16,690.4
Total long-term debt (including current
maturities)
3,818.1
3,811.2
3,819.0
3,009.3
1,010.5
1,010.5
Total liabilities 7,218.2
7,824.5
7,562.4
8,233.4
4,643.1
4,691.0
Total equity 9,622.5
9,565.0
10,720.6
11,320.6
13,442.9
11,999.4
Other Financial Data:
Depreciation, depletion and amortization $ 711.2
$ 739.8
$ 750.9
$ 386.2
$ 604.8
$ 508.1
Net cash provided by operating activities 1,266.1
1,807.6
2,122.1
912.3
1,880.5
2,748.3
Capital expenditures 843.1
1,000.3
929.1
800.0
1,588.3
1,639.3
Dividends per share(e) 1.10
1.08
1.00
0.50
1.00
0.275
______________________________ (a) The year ended December 31, 2016 and 2015 includes a discrete income tax benefit of approximately $54 million and
$47 million, respectively. See further discussion in Note 12 to the Consolidated Financial Statements.
(b) In 2014, we decided to permanently discontinue production of MOP at our Carlsbad, New Mexico facility. The pre-tax
charges were $125.4 million. See further discussion in Note 23 to the Consolidated Financial Statements. The year ended
December 31, 2014 also includes a discrete income tax benefit of approximately $152 million primarily related to the
acquisition of ADM and the sale of our distribution business in Argentina.
(c) In the seven months ended December 31, 2013, we decided to exit our distribution businesses in Argentina and Chile and
wrote-down the related assets by approximately $50 million. We decided to sell the salt operations at our Hersey,
Michigan mine and close the related potash operations which resulted in a write-down of approximately $48 million. We
also wrote-off engineering costs of approximately $25 million related to a proposed ammonia plant.
(d) Fiscal 2013 includes a discrete income tax benefit of $179.3 million associated with our non-U.S. subsidiaries due to the
resolution of certain tax matters.
(e) Dividends have been declared quarterly during all periods presented. In 2015 and fiscal 2013 we increased our annual
dividend to $1.10 and $1.00 per share, respectively. In the fourth quarter of fiscal 2012, we paid a quarterly dividend of
$0.125, which represented a 150 percent increase over the Company’s previous dividend rate.
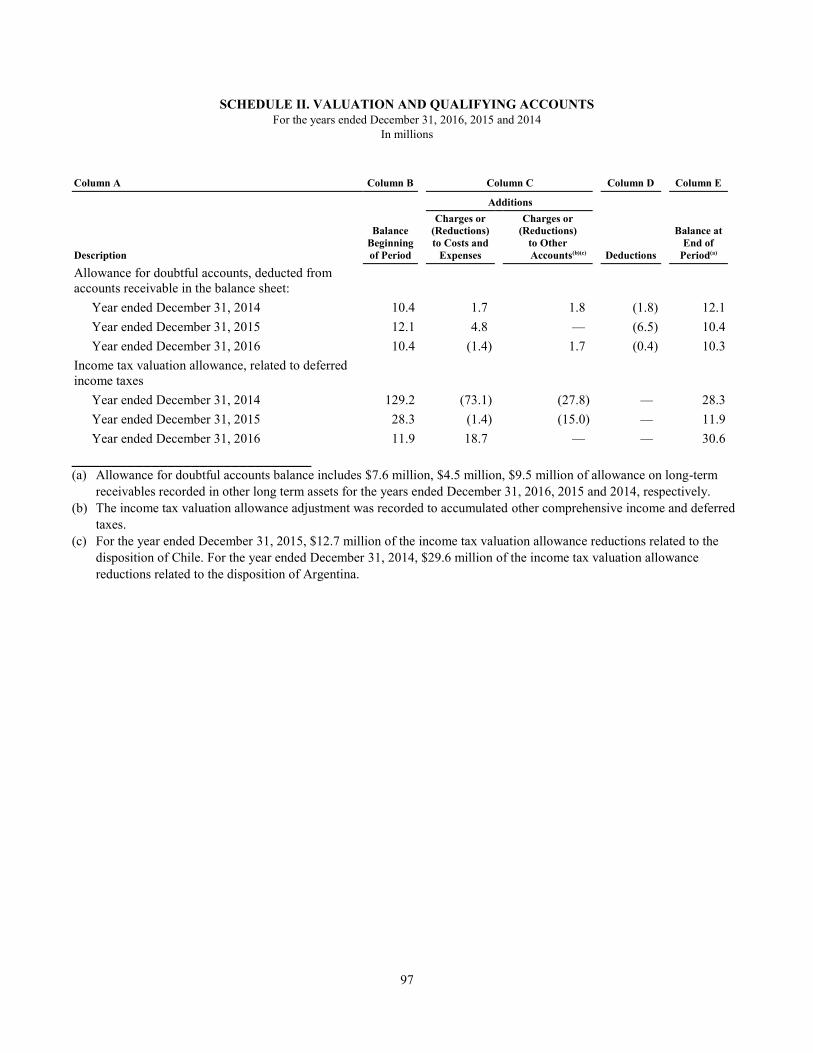
97
SCHEDULE II. VALUATION AND QUALIFYING ACCOUNTS For the years ended December 31, 2016, 2015 and 2014
In millions
Column A Column B Column C Column D Column E
Additions
Description
Balance
Beginning
of Period
Charges or (Reductions)
to Costs and
Expenses
Charges or (Reductions)
to Other
Accounts(b)(c) Deductions
Balance at
End of
Period(a)
Allowance for doubtful accounts, deducted from
accounts receivable in the balance sheet:
Year ended December 31, 2014 10.4
1.7
1.8
(1.8 ) 12.1
Year ended December 31, 2015 12.1
4.8
—
(6.5 ) 10.4
Year ended December 31, 2016 10.4
(1.4 ) 1.7
(0.4 ) 10.3
Income tax valuation allowance, related to deferred
income taxes
Year ended December 31, 2014 129.2
(73.1 ) (27.8 ) —
28.3
Year ended December 31, 2015 28.3
(1.4 ) (15.0 ) —
11.9
Year ended December 31, 2016 11.9
18.7
—
—
30.6
______________________________ (a) Allowance for doubtful accounts balance includes $7.6 million, $4.5 million, $9.5 million of allowance on long-term
receivables recorded in other long term assets for the years ended December 31, 2016, 2015 and 2014, respectively.
(b) The income tax valuation allowance adjustment was recorded to accumulated other comprehensive income and deferred
taxes.
(c) For the year ended December 31, 2015, $12.7 million of the income tax valuation allowance reductions related to the
disposition of Chile. For the year ended December 31, 2014, $29.6 million of the income tax valuation allowance
reductions related to the disposition of Argentina.
98
Management’s Report on Internal Control Over Financial Reporting
The Company’s management is responsible for establishing and maintaining effective internal control over financial
reporting, as defined in Rule 13a-15(f) under the Securities Exchange Act of 1934. The Company’s internal control system is
a process designed to provide reasonable assurance to our management, Board of Directors and stockholders regarding the
reliability of financial reporting and the preparation and fair presentation of our consolidated financial statements for external
reporting purposes in accordance with U.S. generally accepted accounting principles (U.S. GAAP), and includes those
policies and procedures that:
• Pertain to the maintenance of records that, in reasonable detail, accurately and fairly reflect the transactions and
dispositions of our assets;
• Provide reasonable assurance that transactions are recorded as necessary to permit preparation of financial
statements in conformity with U.S. GAAP, and that receipts and expenditures are being made only in accordance
with authorizations from our management and Board of Directors; and
• Provide reasonable assurance regarding prevention or timely detection of unauthorized acquisition, use or
disposition of our assets that could have a material effect on the financial statements.
Because of its inherent limitations, internal control over financial reporting may not prevent or detect misstatements. Also,
projections of any evaluation of effectiveness to future periods are subject to the risk that controls may become inadequate
because of changes in conditions, or that the degree of compliance with the policies or procedures may deteriorate.
Management assessed the effectiveness of the Company’s internal control over financial reporting as of December 31, 2016.
In assessing the effectiveness of our internal control over financial reporting as of December 31, 2016, management used the
control criteria framework of the Committee of Sponsoring Organizations (COSO) of the Treadway Commission published
in its report entitled Internal Control—Integrated Framework (2013). Based on their evaluation, management concluded that
the Company’s internal control over financial reporting was effective as of December 31, 2016. KPMG LLP, the independent
registered public accounting firm that audited the financial statements included in this annual report, has issued an auditors’
report on the Company’s internal control over financial reporting as of December 31, 2016.

99
[THIS PAGE INTENTIONALLY LEFT BLANK]
100
BOARD OF DIRECTORS
Robert L. Lumpkins
Retired Vice Chairman and Chief
Financial Officer of Cargill, Incorporated
Chairman of The Mosaic Company
Committees: Corporate Governance and
Nominating (Chair); Audit
Denise C. Johnson
Group President, Resources Industries
Group of Caterpillar, Incorporated
Committees: Compensation;
Environmental, Health, Safety and
Sustainable Development
James L. Popowich
Retired President and Chief Executive
Officer of Elk Valley Coal Corporation
Committees: Compensation;
Environmental, Health, Safety and
Sustainable Development
Nancy E. Cooper
Retired Executive Vice President and
Chief Financial Officer of CA
Technologies
Committees: Audit (Chair); Corporate
Governance and Nominating
Emery N. Koenig
Retired Vice Chairman and Chief Risk
Officer of Cargill, Incorporated
Committees: Corporate Governance
and Nominating, Environmental,
Health, Safety and Sustainable
Development
David T. Seaton
Chairman and Chief Executive Officer
of Fluor Corporation
Committees: Compensation;
Environmental, Health, Safety and
Sustainable Development
Gregory L. Ebel
Chairman of Enbridge, Inc.
Committees: Audit; Corporate
Governance and Nominating
William T. Monahan
Retired Chairman, President and Chief
Executive Officer of Imation Corp.
Committees: Compensation (Chair);
Audit
Steven M. Seibert
Attorney at The Seibert Law Firm
Committees: Environmental, Health,
Safety and Sustainable Development
(Chair); Corporate Governance and
Nominating
Timothy S. Gitzel
President and Chief Executive Officer of
Cameco Corporation
Committees: Audit; Compensation
James “Joc” C. O’Rourke
President and Chief Executive Officer
of The Mosaic Company
Kelvin R. Westbrook
President and Chief Executive Officer
of KRW Advisors, LLC
Committees: Corporate Governance
and Nominating; Environmental,
Health, Safety and Sustainable
Development
EXECUTIVE OFFICERS
James “Joc” C. O’Rourke
President and Chief Executive Officer
Mark J. Isaacson
Senior Vice President, General Counsel and Corporate Secretary
Richard N. McLellan
Senior Vice President – Brazil
Bruce M. Bodine
Senior Vice President – Potash
Richard L. Mack
Executive Vice President and Chief Financial Officer
Walter F. Precourt III
Senior Vice President – Phosphates
Corrine D. Ricard
Senior Vice President – Commercial
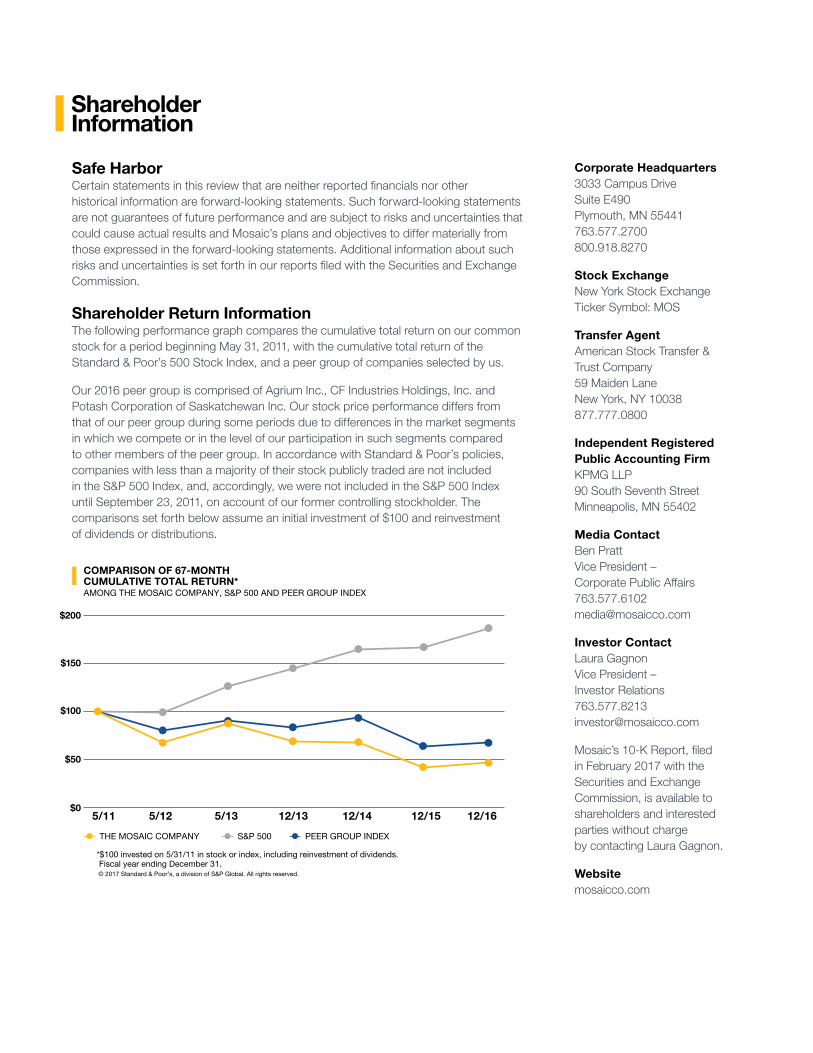
ShareholderInformation
Safe HarborCertain statements in this review that are neither reported financials nor other historical information are forward-looking statements. Such forward-looking statements are not guarantees of future performance and are subject to risks and uncertainties that could cause actual results and Mosaic’s plans and objectives to differ materially from those expressed in the forward-looking statements. Additional information about such risks and uncertainties is set forth in our reports filed with the Securities and Exchange Commission.
Shareholder Return InformationThe following performance graph compares the cumulative total return on our common stock for a period beginning May 31, 2011, with the cumulative total return of the Standard & Poor’s 500 Stock Index, and a peer group of companies selected by us.
Our 2016 peer group is comprised of Agrium Inc., CF Industries Holdings, Inc. and Potash Corporation of Saskatchewan Inc. Our stock price performance differs from that of our peer group during some periods due to differences in the market segments in which we compete or in the level of our participation in such segments compared to other members of the peer group. In accordance with Standard & Poor’s policies, companies with less than a majority of their stock publicly traded are not included in the S&P 500 Index, and, accordingly, we were not included in the S&P 500 Index until September 23, 2011, on account of our former controlling stockholder. The comparisons set forth below assume an initial investment of $100 and reinvestment of dividends or distributions.
Corporate Headquarters3033 Campus Drive Suite E490 Plymouth, MN 55441 763.577.2700 800.918.8270
Stock ExchangeNew York Stock ExchangeTicker Symbol: MOS
Transfer AgentAmerican Stock Transfer & Trust Company 59 Maiden Lane New York, NY 10038 877.777.0800
Independent Registered Public Accounting FirmKPMG LLP 90 South Seventh Street Minneapolis, MN 55402
Media ContactBen Pratt Vice President – Corporate Public Affairs 763.577.6102 [email protected]
Investor ContactLaura Gagnon Vice President – Investor Relations 763.577.8213 [email protected]
Mosaic’s 10-K Report, filed in February 2017 with the Securities and Exchange Commission, is available to shareholders and interested parties without charge by contacting Laura Gagnon.
Websitemosaicco.com
COMPARISON OF 67-MONTH CUMULATIVE TOTAL RETURN*AMONG THE MOSAIC COMPANY, S&P 500 AND PEER GROUP INDEX
5/11 5/12 5/13 12/13 12/14 12/15 12/16
$200
$150
$100
$50
$0
THE MOSAIC COMPANY S&P 500 PEER GROUP INDEX
*$100 invested on 5/31/11 in stock or index, including reinvestment of dividends. Fiscal year ending December 31. © 2017 Standard & Poor’s, a division of S&P Global. All rights reserved.
© 2017 The Mosaic Company We support and promote 4R Nutrient Stewardship:Right Source, Right Rate, Right Time, Right Place.
The Mosaic Company3033 Campus DriveSuite E490Plymouth, Minnesota 55441800.918.8270mosaicco.com
Printed on recycled paper with a Post Consumer Waste content of 10 percent.This paper is FSC® Certified.
View online.mosaicco.com/2016AnnualReport
Learn more.TheMosaicStory.com