Embed Size (px)
Citation preview

2017 ANNUAL REPORT
ORGANIZATIONAL OVERVIEW2016-17 Milk Production by the Numbers ...................................... 5
Chair’s Message .............................................................................. 6
General Manager’s Message ........................................................... 7
Members of the Board .................................................................... 9
Senior Management ........................................................................ 9
OPERATIONS BY DIVISIONCommunications Division .............................................................. 11
Legal and Board Division .............................................................. 13
Economics Division ....................................................................... 14
Marketing Growth Initiatives .......................................................... 20
Finance and Information Technology Division ............................... 20
Planning, HR, and Organizational Development Division .............. 21
Operations and Regulatory Compliance Division.......................... 22
Marketing Logistics ....................................................................... 24
The Board and Staff ...................................................................... 25
Highlights from 2016-17 ................................................................ 26
Strategic Plan ................................................................................ 27
FINANCIAL REPORTSIndependent Auditors’ Report ....................................................... 29
Statement of Financial Position ..................................................... 30
Statement of Operations & Changes............................................. 31
in Fund Balance – Unrestricted
Statement of Operations & Changes............................................. 32
in Fund Balance – Quota Exchange
Statement of Operations & Changes............................................. 32
in Fund Balance – Research
Statement of Operations & Changes............................................. 33
in Fund Balance – Accounts Receivable Financial Protection
Statement of Cash Flows .............................................................. 34
Notes to Financial Statements ...................................................... 35
DFC ACTIVITIES ................................................... 44
AND PROGRAMS
For additional copies of the 52nd Annual Report, please contact: Dairy Farmers of Ontario, 6780 Campobello Road Mississauga, Ontario L5N 2L8 t: 905-821-8970
Also available online at www.milk.org Supplement to Milk Producer magazine, February 2018
AFP: Abnormal Freezing Point
AGM: Annual General Meeting
BF: Butterfat
BPDP: Business and Product Development Program
CDC: Canadian Dairy Commission
CETA: Comprehensive Economic and Trade Agreement
CMSMC: Canadian Milk Supply Management Committee
COP: Cost of Production
CPI: Consumer Price Index
CQM: Canadian Quality Milk
DEP: Dairy Export Program
DFC: Dairy Farmers of Canada
DFIP: Dairy Farm Investment Program
DIP: Dairy Innovation Program
DDPIP: Domestic Dairy Product Innovation Program
DPC: Dairy Producer Committee
EU: European Union
IT: Information Technology
MAG: Milk Access for Growth
MMO: Milk Movement Obligation
MP: Members of Parliament
MPP: Members of Provincial Parliament
MSQ: Milk Supply Quota
MUV: Milk Utilization Verification
NAFTA: North American Free Trade Agreement
NEQAP: New Entrant Quota Assistance Program
NPP: New Producer Program
NZ: New Zealand
ODC: Ontario Dairy Council
OFPMC: Ontario Farm Products Marketing Commission
OMAFRA: Ontario Ministry of
Agriculture, Food and Rural Affairs
SCC: Somatic Cell Count
SMP: Skim Milk Powder
SMRP: Skim Milk Redirection Program
SNF: Solids-Not-Fat
TPP: Trans-Pacific Partnership
US: United States of America
WMP: Western Milk Pool
LIST OF ACRONYMS
Acronyms are commonly referenced throughout Dairy Farmers of Ontario’s (DFO) 2017 Annual Report. To assist readers and avoid repetition in the text, the following is a list of these acronyms for an easy reference guide.
4 ORGANIZATIONAL OVERVIEW
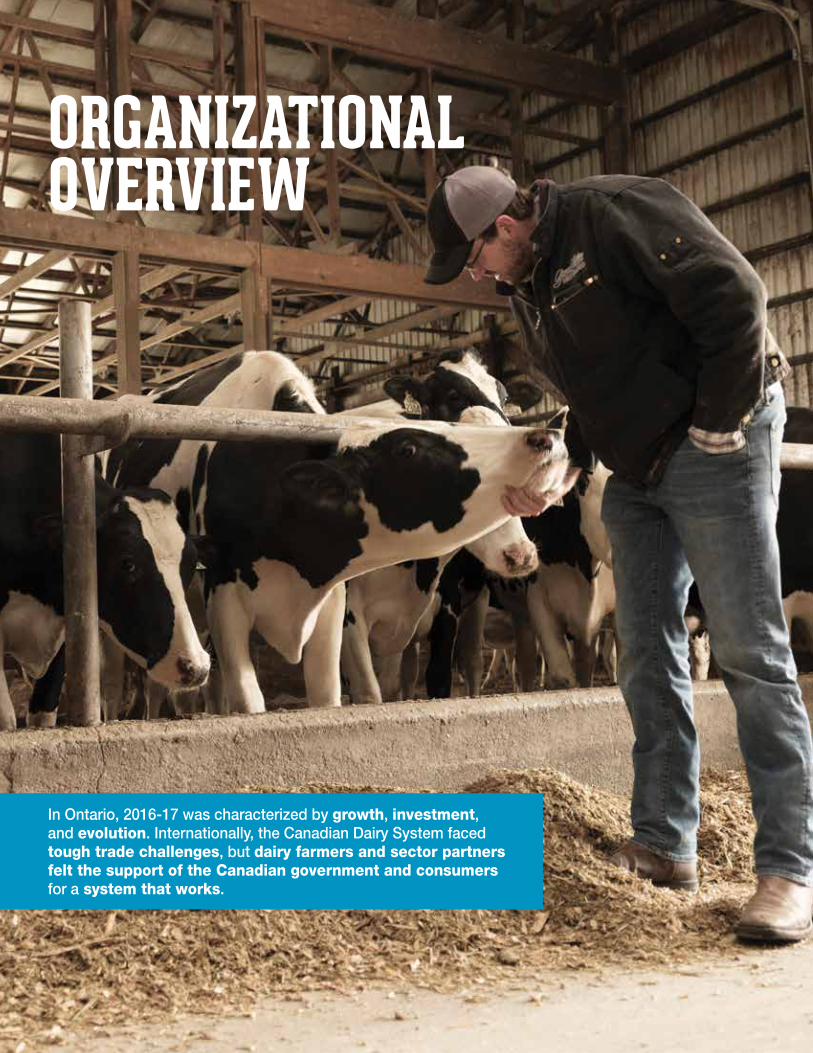
ORGANIZATIONALOVERVIEW
In Ontario, 2016-17 was characterized by growth, investment, and evolution. Internationally, the Canadian Dairy System faced tough trade challenges, but dairy farmers and sector partners felt the support of the Canadian government and consumers for a system that works.
ORGANIZATIONAL OVERVIEW 5ORGANIZATIONAL OVERVIEW 5
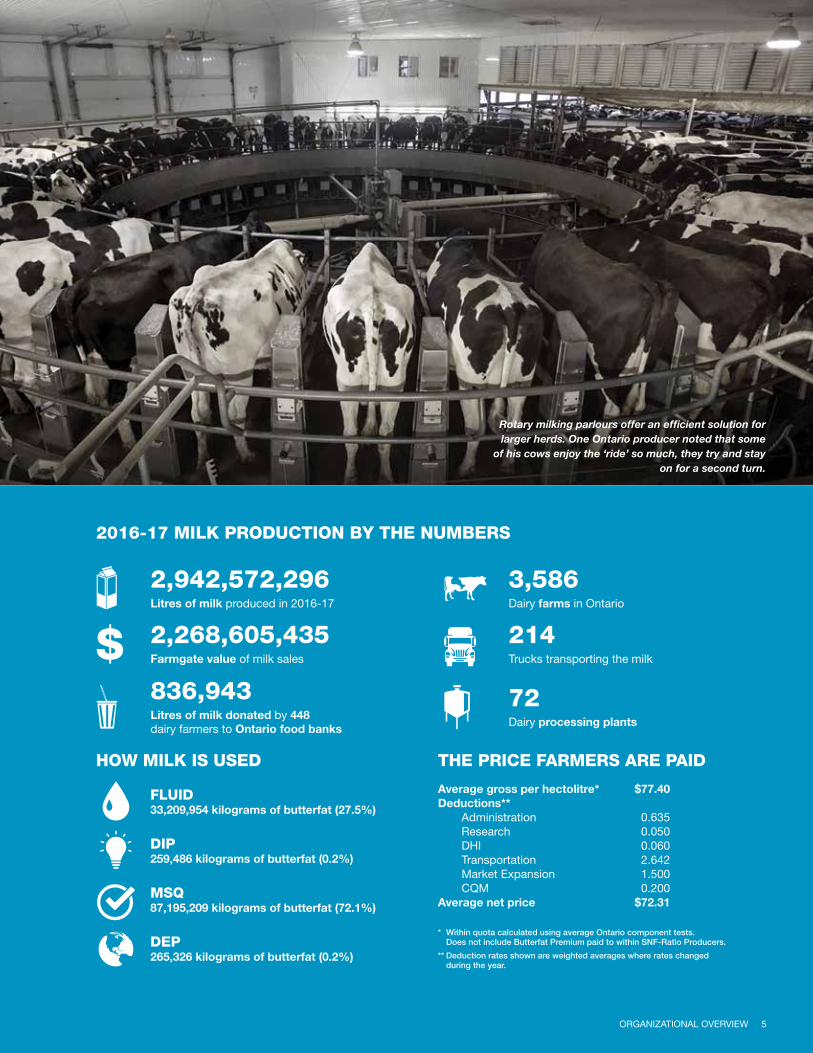
2016-17 MILK PRODUCTION BY THE NUMBERS
2,942,572,296Litres of milk produced in 2016-17
Average gross per hectolitre* $77.40Deductions** Administration 0.635 Research 0.050 DHI 0.060 Transportation 2.642 Market Expansion 1.500 CQM 0.200Average net price $72.31
HOW MILK IS USED THE PRICE FARMERS ARE PAID
836,943Litres of milk donated by 448dairy farmers to Ontario food banks
3,586Dairy farms in Ontario
72Dairy processing plants
* Within quota calculated using average Ontario component tests. Does not include Butterfat Premium paid to within SNF-Ratio Producers.
** Deduction rates shown are weighted averages where rates changed during the year.
FLUID33,209,954 kilograms of butterfat (27.5%)
DIP259,486 kilograms of butterfat (0.2%)
MSQ87,195,209 kilograms of butterfat (72.1%)
DEP265,326 kilograms of butterfat (0.2%)
2,268,605,435Farmgate value of milk sales
214Trucks transporting the milk
Rotary milking parlours offer an efficient solution for larger herds. One Ontario producer noted that some
of his cows enjoy the ‘ride’ so much, they try and stay on for a second turn.
6 ORGANIZATIONAL OVERVIEW
MESSAGE FROM OUR CHAIR, RALPH DIETRICH
Dairy Farmers of Ontario values itself as a marketing board that wants to grow the dairy industry in Canada. Our Mission Statement is “to provide leadership and excellence in the production and marketing of Canadian milk”, and our Vision Statement is for a “dynamic, profitable, growing Canadian dairy industry”. With these in mind, the Board sets policy direction that will lead a dynamic, profitable, growing industry in Canada.
During 2016-17, we continued to meet our vision and mission. Examples included the continued implementation of the National Ingredients Program, implementation of proAction®, hiring our new general manager, and continued record growth at the farm level with significant processor investment. The Board also made the decision to implement an Ontario marketing and promotion strategy.
In June 2017, the Board announced after lengthy deliberations and careful consideration that, due to challenges with securing a written agreement with DFC regarding the use and accountability of DFO promotion dollars, DFO’s Board would not provide any further promotion dollars effective January 1, 2018.
However, the Board also felt it was very important to reiterate DFO’s commitment to DFC as it pertains to it being the national voice for policy and lobby efforts. The Board’s decision affects DFC promotion activities only and DFC should continue to be a strong national voice to work on our behalf at the national level, and in particular on such issues as trade and proAction.
The Board mandated DFO senior staff to develop a plan to identify how promotion dollars can be used to grow dairy consumption. DFO is committed to using the promotion dollars in a targeted and measurable way to grow our markets.
This year also marked a very important watershed moment with the ongoing implementation of the National Ingredients Program. The National Ingredients Program is designed to provide greater opportunity for growth, innovation, and investment by providing a more competitive market for domestic dairy ingredients.
Much has been said about the strategy and its impact. What can be fairly summarized is it has indeed attracted much needed new investment and processing capacities. We are fortunate that the Canadian dairy industry is growing in both demand for products
and in new investment at the farm and processor level. We have seen 10 per cent of new producer quota in the last fiscal year and, at the same time, unprecedented processor investment, with more than $300 million in Ontario alone.
In September 2017, the formal rollout of proAction began. It is clear that a national program, like proAction, demonstrates dairy excellence and leadership, and will strengthen our reputation of providing proof to processors, retailers, and consumers that Canadian dairy producers provide safe milk, responsibly.
This last year also saw a need for us to address new trade challenges. With the election of President Trump, the US pulled out of TPP, which had been the largest trade agreement in history, and commenced the renegotiation of NAFTA. In both agreements, countries want increased access to Canadian dairy markets. It means we need to continue to strategically work with government to demonstrate why the Canadian dairy system works and deserves to be defended because it is in Canada’s best interest to do so. It is a system that provides the highest quality milk, is reliable, and that our processors and consumers value. It is why we have the growth and investment, and why the Canadian dairy industry is thriving. At the same time, unfortunately, the same simply cannot be said in other countries, as they rely on massive government subsidies and farmers are forced into bankruptcies.
Lastly, this year saw the retirement of Peter Gould as DFO’s General Manager, and the appointment of Graham Lloyd. We were very fortunate to have had Peter Gould’s guidance for more than 12 years and the Board is looking forward to working with Graham in this new capacity, where we are confident his skills, attributes, and experience will serve our organization and the industry at-large very well.
This is a great time for the Canadian dairy industry. With continued record growth and support from our government and processors, we have a very bright future to sustain our supply-managed system.

ORGANIZATIONAL OVERVIEW 7
MESSAGE FROM OUR GENERAL MANAGER, GRAHAM LLOYD
Dairy Farmers of Ontario’s Annual Report is used to showcase dairy and highlight significant industry achievements. It reflects the pride we have working for Ontario dairy producers.
It is a great privilege to write this year’s General Manager’s message. On July 31, 2017, Peter Gould formally retired from DFO. He provided excellent leadership on behalf of staff for Ontario dairy producers. I am very grateful the Board has provided me with the opportunity to lead our staff into the future. DFO’s staff is dedicated, knowledgeable, and works very hard to maintain the standard DFO has set to lead the industry.
Working for dairy producers instills great pride in DFO staff because dairy producers have earned recognition as an integral part of the fabric of Canada.
This past year, Ontario dairy produced almost three billion litres of milk with a value of approximately $2.5 billion. This contribution to our economy is extremely important. It supports more than 10,000 Ontario dairy families, contributes $5.9 billion to Ontario’s gross domestic product, and supports more than 74,000 jobs in the sector. In fact, one out of 100 Canadian jobs is created by the dairy industry. In some regions of Ontario, dairy supports up to four in 10 jobs. This naturally provides a lot of significant challenges and rewarding opportunities.
The election of President Donald Trump has increased trade risks and potential impacts for our industry. Working closely with our government representatives has allowed our industry to demonstrate Canadian dairy’s importance. DFO chair Ralph Dietrich and I have attended all the NAFTA renegotiation rounds. It is clear Canada has a team of highly-regarded trade negotiators who understand our concerns and interests and who have worked with us at each of the rounds. We will continue to work with government officials to reinforce the importance of Canada’s dairy industry.
We must continue to demonstrate why our government should support the supply management system. Operating in this system is not a right, but a privilege that warrants continued government support because it is superior to any other as evidenced by the struggles afflicting dairy producers in other countries like the US, EU, and Australia.
Our critics would do well to learn Canada’s dairy industry has experienced unprecedented growth in demand for butter, cream, and cheese. This growth has resulted in the need to produce more milk. The new growth and investment – both at the farm and processor level – is largely due to the National Ingredients Program. This program is an industry-led solution to address processing constraints and an excellent opportunity for our government to witness our industry coming together to stimulate growth.
Another good news story is producer quota increasing by 10 per cent in fiscal 2017, which amounted to more than 24 per cent in the last three years. In 2018, we anticipate needing even more milk production, up to an additional six per cent.
The opportunities our industry faces are significant because it means more investment in our communities and stronger rural economies. This is a fact we must continue to promote because it shows the enduring strength of the Canadian dairy sector.
One challenge our industry faces is proposed changes to Canada’s Food Guide and front-of-pack labelling. Consumer demand for healthy food choices has continued to increase, and dairy producers are among the leaders in the production of healthy food. The industry has benefited from research showing there is no association between dietary saturated fats and coronary heart disease and bad cholesterol.
However, current proposed government changes are not based on scientific fact. This past year, DFO led the industry in a nationwide campaign to address this challenge by introducing the website www.keepcanadianshealthy.ca, which is intended to ensure policymakers do not cause confusion among consumers.
Finally – and likely the biggest opportunity and challenge DFO faces – is the implementation of the Board’s decision to adopt an Ontario promotion and marketing plan. It is DFO’s intent to continue to invest significantly in the market to drive growth that has a direct and positive impact on milk production and quota. It will not be an easy task, but it is one we welcome.
It is important to recognize the 2016-17 fiscal dairy year as one of our strongest, and DFO’s continued leadership would not have been possible without the dedication and hard work of our staff and Board. For that, I thank them.
8 ORGANIZATIONAL OVERVIEW
OUR MISSION
To provide leadership and excellence in the production and marketing of Canadian milk.
OUR VISION
A dynamic, profitable, growing Canadian dairy industry.
CORE VALUES LEADERSHIP
We lead by committing to continuous personal and organizational development.
TRUST
We create, build, and maintain trust by being honest, open, and transparent.
RESPECT
We listen, accept differences, and work together.
INTEGRITY
We are consistent in our actions and values.
TEAMWORK
We help each other succeed through collaboration.
FAIRNESS
We ensure equitable application of rules and benefits.
ACCOUNTABILITY
We hold ourselves and each other responsible for delivering results.
ORGANIZATIONAL OVERVIEW 9
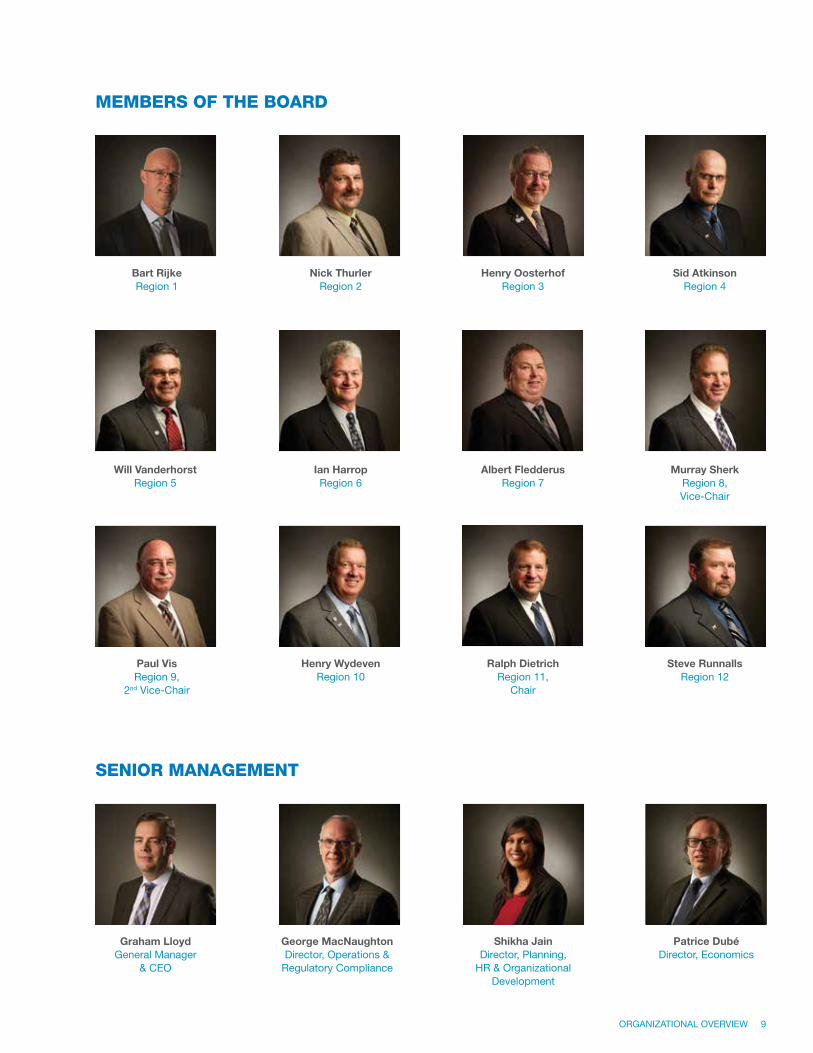
MEMBERS OF THE BOARD
Bart RijkeRegion 1
Sid AtkinsonRegion 4
Murray SherkRegion 8, Vice-Chair
Steve RunnallsRegion 12
Nick ThurlerRegion 2
Henry OosterhofRegion 3
Ralph DietrichRegion 11,
Chair
Will VanderhorstRegion 5
Paul VisRegion 9,
2nd Vice-Chair
Ian HarropRegion 6
Henry WydevenRegion 10
Albert FledderusRegion 7
SENIOR MANAGEMENT
Graham LloydGeneral Manager
& CEO
George MacNaughton Director, Operations &
Regulatory Compliance
Shikha JainDirector, Planning,
HR & Organizational Development
Patrice DubéDirector, Economics
10 OPERATIONS BY DIVISION
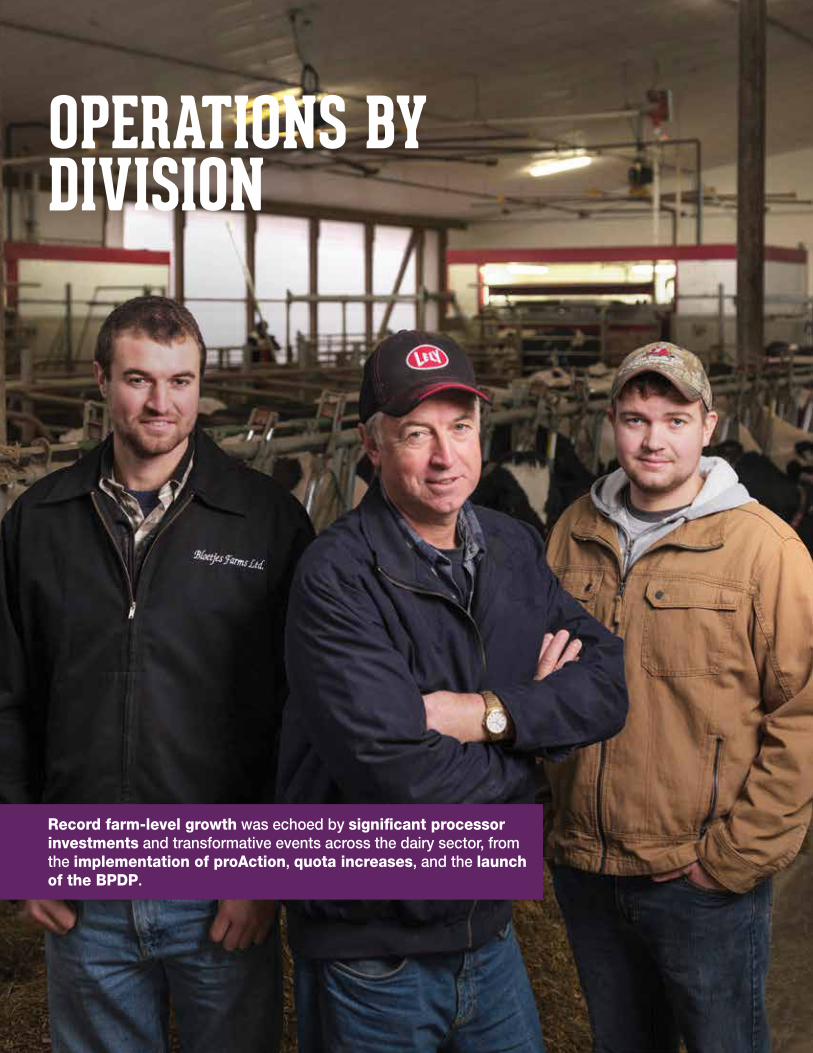
Record farm-level growth was echoed by significant processor investments and transformative events across the dairy sector, from the implementation of proAction, quota increases, and the launch of the BPDP.
OPERATIONS BYDIVISION
OPERATIONS BY DIVISION 11OPERATIONS BY DIVISION 11
Milk Producer continued to be an award-winning publication. The magazine won the 2017 Awards for Publication Excellence awards for the category of “Magazines, Journals & Tabloids - 1-2 Person – Produced”, and, “Feature Writing” for the magazine’s June 2016 cover story. Additionally, recognition of individual magazine staff was attained with the presentation of the “Silver Award” from the Canadian Farm Writers’ Federation Peter Lewington Award for Technical Feature for an article entitled “Succession Planning Do’s and Don’ts”.
Initial forecasts for Milk Producer’s budget indicated a break-even position at the end of the fiscal year. However, the magazine’s budget not only achieved the forecasted position, it exceeded the expectation and, for the first time since its inception, ended the 2017 fiscal year in a profitable position.
Dairy Farmer Update Dairy Farmer Update continued to provide producers with highlights of mainstream news and matters of importance in both a bi-weekly electronic publication and a monthly mailing. A copy of the publication continued to be made available to producers at www.milk.org in the producer password-protected section of the website.
Social MediaDFO’s Facebook page (OntarioDairy), Twitter handles (@DairyOntario and @OntarioMilk), and Instagram account (Dairy_farmersont) continued to be a communication tool for providing two-way communications between DFO and producers.
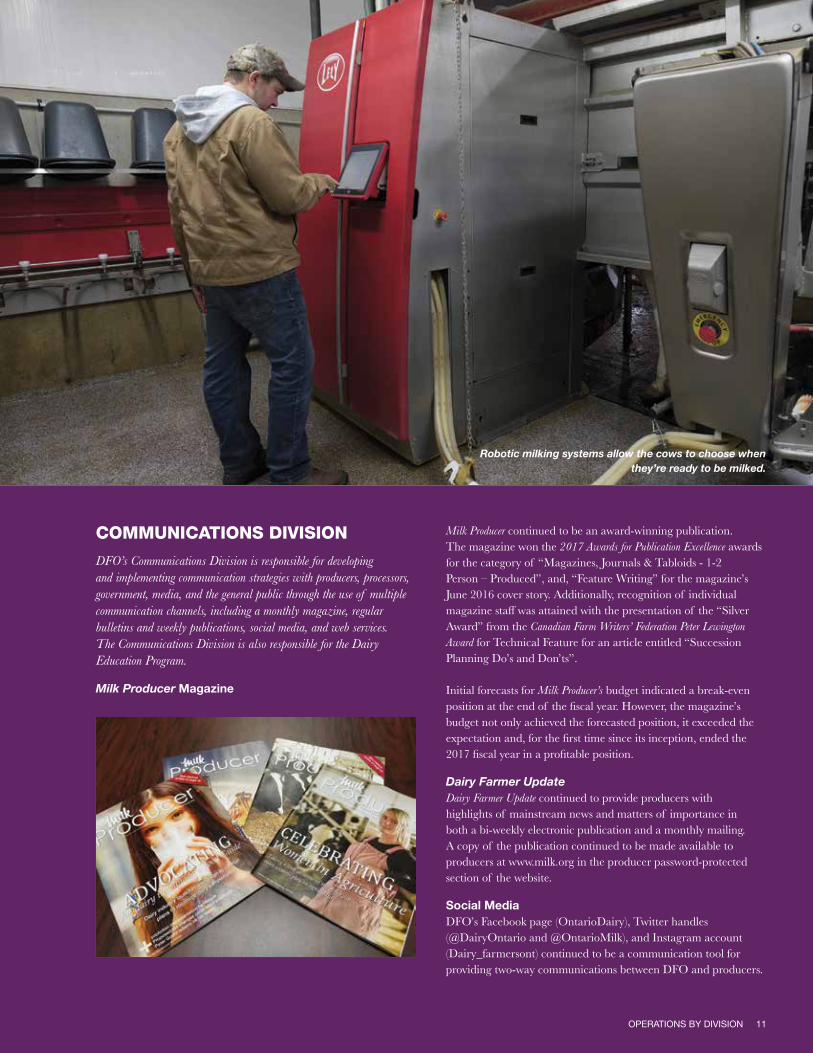
Robotic milking systems allow the cows to choose when they’re ready to be milked.
COMMUNICATIONS DIVISION
DFO’s Communications Division is responsible for developing and implementing communication strategies with producers, processors, government, media, and the general public through the use of multiple communication channels, including a monthly magazine, regular bulletins and weekly publications, social media, and web services. The Communications Division is also responsible for the Dairy Education Program.
Milk Producer Magazine
12 OPERATIONS BY DIVISION
As of October 31, 2017, OntarioDairy had 8,310 page “Likes” for the fiscal year and 8,347 followers on Facebook; @DairyOntario, designed for producers as the target audience, had 5,689 followers on Twitter, while @OntarioMilk, designed for consumers as the target audience, had 558 followers on Twitter; and, Dairy_farmersont had 1,056 followers on Instagram.
Dairy Education Program
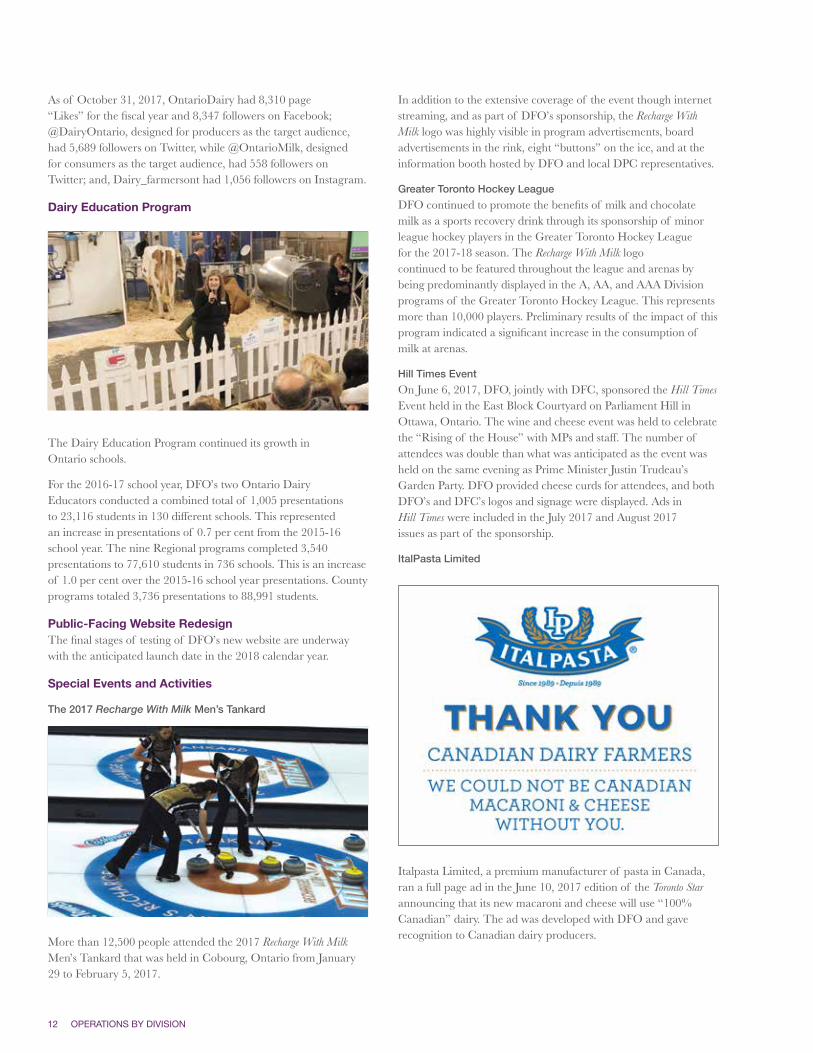
The Dairy Education Program continued its growth in Ontario schools.
For the 2016-17 school year, DFO’s two Ontario Dairy Educators conducted a combined total of 1,005 presentations to 23,116 students in 130 different schools. This represented an increase in presentations of 0.7 per cent from the 2015-16 school year. The nine Regional programs completed 3,540 presentations to 77,610 students in 736 schools. This is an increase of 1.0 per cent over the 2015-16 school year presentations. County programs totaled 3,736 presentations to 88,991 students.
Public-Facing Website Redesign The final stages of testing of DFO’s new website are underway with the anticipated launch date in the 2018 calendar year.
Special Events and Activities
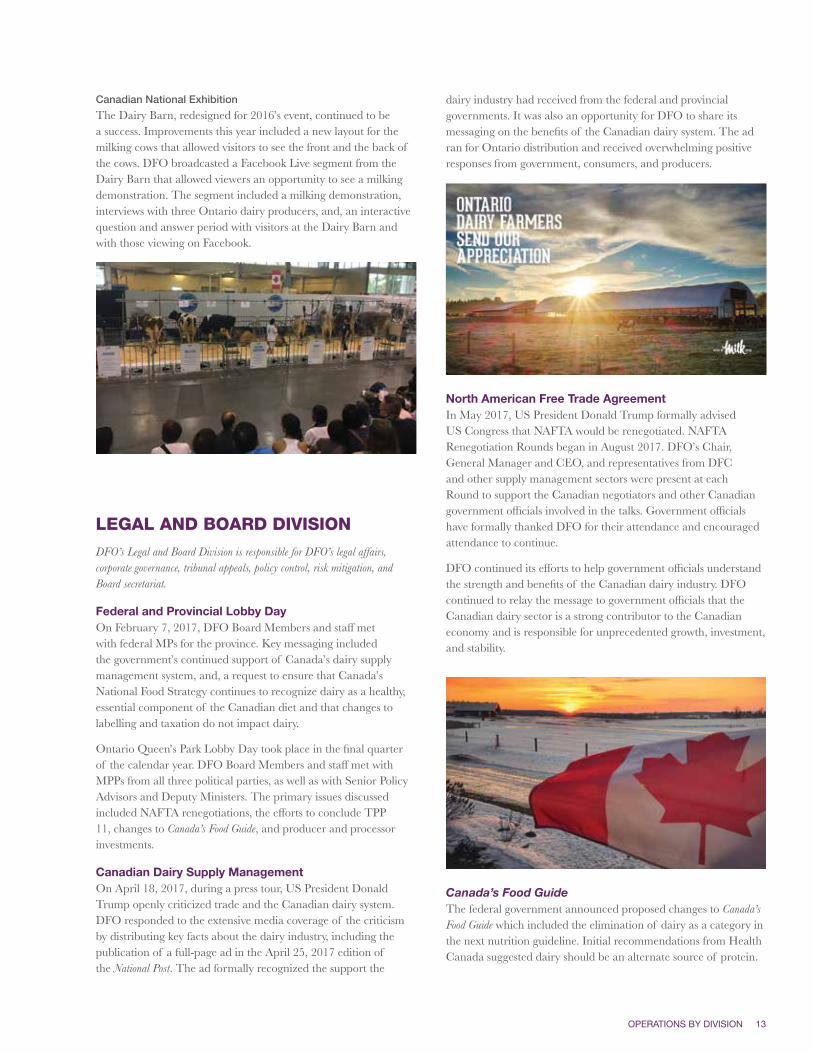
The 2017 Recharge With Milk Men’s Tankard
More than 12,500 people attended the 2017 Recharge With Milk Men’s Tankard that was held in Cobourg, Ontario from January 29 to February 5, 2017.
In addition to the extensive coverage of the event though internet streaming, and as part of DFO’s sponsorship, the Recharge With Milk logo was highly visible in program advertisements, board advertisements in the rink, eight “buttons” on the ice, and at the information booth hosted by DFO and local DPC representatives.
Greater Toronto Hockey League
DFO continued to promote the benefits of milk and chocolate milk as a sports recovery drink through its sponsorship of minor league hockey players in the Greater Toronto Hockey League for the 2017-18 season. The Recharge With Milk logo continued to be featured throughout the league and arenas by being predominantly displayed in the A, AA, and AAA Division programs of the Greater Toronto Hockey League. This represents more than 10,000 players. Preliminary results of the impact of this program indicated a significant increase in the consumption of milk at arenas.
Hill Times Event
On June 6, 2017, DFO, jointly with DFC, sponsored the Hill Times Event held in the East Block Courtyard on Parliament Hill in Ottawa, Ontario. The wine and cheese event was held to celebrate the “Rising of the House” with MPs and staff. The number of attendees was double than what was anticipated as the event was held on the same evening as Prime Minister Justin Trudeau’s Garden Party. DFO provided cheese curds for attendees, and both DFO’s and DFC’s logos and signage were displayed. Ads in Hill Times were included in the July 2017 and August 2017 issues as part of the sponsorship.
ItalPasta Limited
Italpasta Limited, a premium manufacturer of pasta in Canada, ran a full page ad in the June 10, 2017 edition of the Toronto Star announcing that its new macaroni and cheese will use “100% Canadian” dairy. The ad was developed with DFO and gave recognition to Canadian dairy producers.
OPERATIONS BY DIVISION 13
Canadian National Exhibition
The Dairy Barn, redesigned for 2016’s event, continued to be a success. Improvements this year included a new layout for the milking cows that allowed visitors to see the front and the back of the cows. DFO broadcasted a Facebook Live segment from the Dairy Barn that allowed viewers an opportunity to see a milking demonstration. The segment included a milking demonstration, interviews with three Ontario dairy producers, and, an interactive question and answer period with visitors at the Dairy Barn and with those viewing on Facebook.
LEGAL AND BOARD DIVISIONDFO’s Legal and Board Division is responsible for DFO’s legal affairs, corporate governance, tribunal appeals, policy control, risk mitigation, and Board secretariat.
Federal and Provincial Lobby Day On February 7, 2017, DFO Board Members and staff met with federal MPs for the province. Key messaging included the government’s continued support of Canada’s dairy supply management system, and, a request to ensure that Canada’s National Food Strategy continues to recognize dairy as a healthy, essential component of the Canadian diet and that changes to labelling and taxation do not impact dairy.
Ontario Queen’s Park Lobby Day took place in the final quarter of the calendar year. DFO Board Members and staff met with MPPs from all three political parties, as well as with Senior Policy Advisors and Deputy Ministers. The primary issues discussed included NAFTA renegotiations, the efforts to conclude TPP 11, changes to Canada’s Food Guide, and producer and processor investments.
Canadian Dairy Supply Management On April 18, 2017, during a press tour, US President Donald Trump openly criticized trade and the Canadian dairy system. DFO responded to the extensive media coverage of the criticism by distributing key facts about the dairy industry, including the publication of a full-page ad in the April 25, 2017 edition of the National Post. The ad formally recognized the support the
dairy industry had received from the federal and provincial governments. It was also an opportunity for DFO to share its messaging on the benefits of the Canadian dairy system. The ad ran for Ontario distribution and received overwhelming positive responses from government, consumers, and producers.
North American Free Trade AgreementIn May 2017, US President Donald Trump formally advised US Congress that NAFTA would be renegotiated. NAFTA Renegotiation Rounds began in August 2017. DFO’s Chair, General Manager and CEO, and representatives from DFC and other supply management sectors were present at each Round to support the Canadian negotiators and other Canadian government officials involved in the talks. Government officials have formally thanked DFO for their attendance and encouraged attendance to continue.
DFO continued its efforts to help government officials understand the strength and benefits of the Canadian dairy industry. DFO continued to relay the message to government officials that the Canadian dairy sector is a strong contributor to the Canadian economy and is responsible for unprecedented growth, investment, and stability.
Canada’s Food GuideThe federal government announced proposed changes to Canada’s Food Guide which included the elimination of dairy as a category in the next nutrition guideline. Initial recommendations from Health Canada suggested dairy should be an alternate source of protein.
14 OPERATIONS BY DIVISION
On August 18, 2017, DFO, with DFC and the provincial milk marketing boards, initiated lobby efforts to address the concern of the proposed changes. The primary concern was that there is no scientific evidence to support the recommendations. The key messaging included: 1) the change would actively discourage Canadians from consuming dairy products and several meat-based proteins, which opposes the advice of Health Canada’s expert advisors; 2) the change would adversely affect the health of Canadians, particularly impacting children and seniors; and, 3) the change would be devastating to Canada’s agricultural sector, especially dairy.
As part of the lobby campaign, dairy producers and consumers were invited to support the campaign by meeting with MPs, prior to Parliament resuming on September 12, 2017, to discuss concerns of the proposed change. Two websites (www.keepcanadianshealthy.ca and http://gardonslescanadiensensante.ca) were established that outlined the importance of dairy in Canada’s Food Guide. A letter for Canadians to send electronically to MPs was also available on the websites.
As of October 31, 2017, the Keep Canadians Healthy campaign reached an audience of 1,001,056, with an estimated 5,578 letter senders, totaling approximately 27,890 letters being sent.
ECONOMICS DIVISIONDFO’s Economics Division provides technical support and economic and statistical analysis to the policy development and implementation process at the national, pool, DFO Board, and staff levels. The Economics Division is also responsible for the oversight of the Ontario Dairy Farm Accounting Project which collects data from Ontario dairy farms for the national COP.
Market RequirementsOn a BF basis, P5 fluid requirements increased by 0.5 per cent, industrial milk requirements increased by 5.5 per cent, and DDPIP and DIP requirements continued to decrease over the past fiscal year. The changes in innovation requirements were a result of contracts expiring and becoming market sharing quota under DDPIP, and ‘less interest’ from processors in participating in DIP. Including the growth allowance, this translated into a net increase
of 4.1 per cent in P5 market requirements (provincial quota) for the 12 months ending October 2017. Innovation (DDPIP and DIP) accounted for less than 1.5 per cent of the P5 Provincial Quota References.
Over the same period, total market requirements, including the growth allowance, in the WMP market increased by 6.5 per cent. This consisted of a 0.5 per cent decrease in BF requirements for fluid products and an 11.3 per cent increase in industrial milk requirements.
Milk Supplies, Quota Utilization, Modest Growth Projected in Market Requirements
Production
Milk production was strong with the P5 filling 103.0 per cent of quota, which included the growth allowance during the 2016-17 fiscal year. The pool cumulative difference, or the pool credit position, was 3.15 per cent at the end of October 2017, which was over-quota. However, the CMSMC suspended over-quota and under-quota penalties until July 31, 2018, to allow time for production and markets to rebalance. A 5.0 per cent growth allowance was also approved for this time period, of which 2.0 per cent is permanent and 3.0 per cent is temporary.
Without the suspension of the over-quota penalties, the P5 would have been paying over-quota penalties starting in April 2016. Even with an over-quota position, production was still not high enough to completely fill all markets and build butter stocks. The disconnect between quota requirements and market demand was, in part, due to imports of BF outside of the system, and the lag in the quota calculation capturing quota requirements. The large increases in producer quota issuance continued to cause credits to be accumulated during the fall.
In Ontario, production was 6.2 per cent higher than last year. With 10.0 per cent new quota in the system, the fill rate on producer quota issued declined in Ontario, which resulted in a producer credit position of -9.2 days. Producers at the P5 level had a credit position of -13.0 days. This provided the potential for more production to come forward from producers in the future. However, with the quota increases, current quota issued was not being fully filled in some provinces, which resulted with more credits being accumulated through 2017, especially where barn capacity was a limiting factor in production growth.
OPERATIONS BY DIVISION 15
Markets
Market trends indicated continued growth. While the fluid market on a volume basis saw declines of approximately 1.5 per cent, cream sales in the last year were very strong, which played a role in the strong Canadian BF requirements. Butter sales have been strong since the beginning of 2017, with sales consistently greater than 3.5 per cent. Cheese classes also had excellent growth in the last year with the entire category consistently up over 3.5 per cent since the beginning of 2017. The growth is expected to continue.
Butter Stocks
At of the end of October 2017, the total industry butter stocks held by processors and the CDC were approximately 27.0 million kilograms. Increased stock levels are due in part to the supplementary imports that were brought in during the dairy year and the normal imports of 3,274 tonnes to help fill demand. Supplementary imports were predominantly used to fill the further processor market; however, the imports required started to decrease in the last months of fiscal 2017, indicating the domestic supply started to fill these markets.
Producer Quota
Given the situation of very strong industrial requirements, the lower butter stock levels, and continued need for butter imports, the P5 Quota Committee approved a 3.0 per cent quota increase in November 2016, a 2.0 increase in December 2016, and a 5.0 per cent quota increase in July 2017. The P5 Quota Committee also extended incentive days by issuing one additional day from December 2016 to July 2017. The demand for BF continued to be very strong, and with the implementation of the National Ingredients Program there was also increased domestic demand for skim milk. The demand for skim milk instead of skim milk needing to be dried freed up processing capacity for skim milk, which allowed for the quota increases. However, with new investment not expected until 2019, skimming milk may again be required in the short term, in order to produce sufficient milk to meet BF market requirements.
The P5 Quota Committee also established 10 non-cumulative incentive days for fall 2017 – two days were issued for August and November 2017, and three days for September and October 2017.
93.36
3.65
1.98
0.84
0.02
0.08
0.07
93.49
3.58
1.95
0.82
0.02
0.08
0.06
2016 2017
Net Returns
Transportation
Market Expansion Fee
Administrative Licence Fees
CQM Administrative Licence Fees
CanWest DHI
Research
PRODUCER RETURNS AND DEDUCTIONS (%)
$0.050 $0.050
$0.060 $0.060
Fiscal Year 2016
Fiscal Year2017
ADMINISTRATIVE COSTS AND DEDUCTIONS ($ PER HL)
*Excludes depreciation and includes cost of capital additions
Total Administrative Costs*
Producer Deductions
Administration Licence Fee
CQM Administrative Licence Fee
Research
Market Expansion
CanWest DHI
Total
$0.628 $0.632
$0.635 $0.635
$0.020 $0.020
$1.500 $1.500
$2.265 $2.265
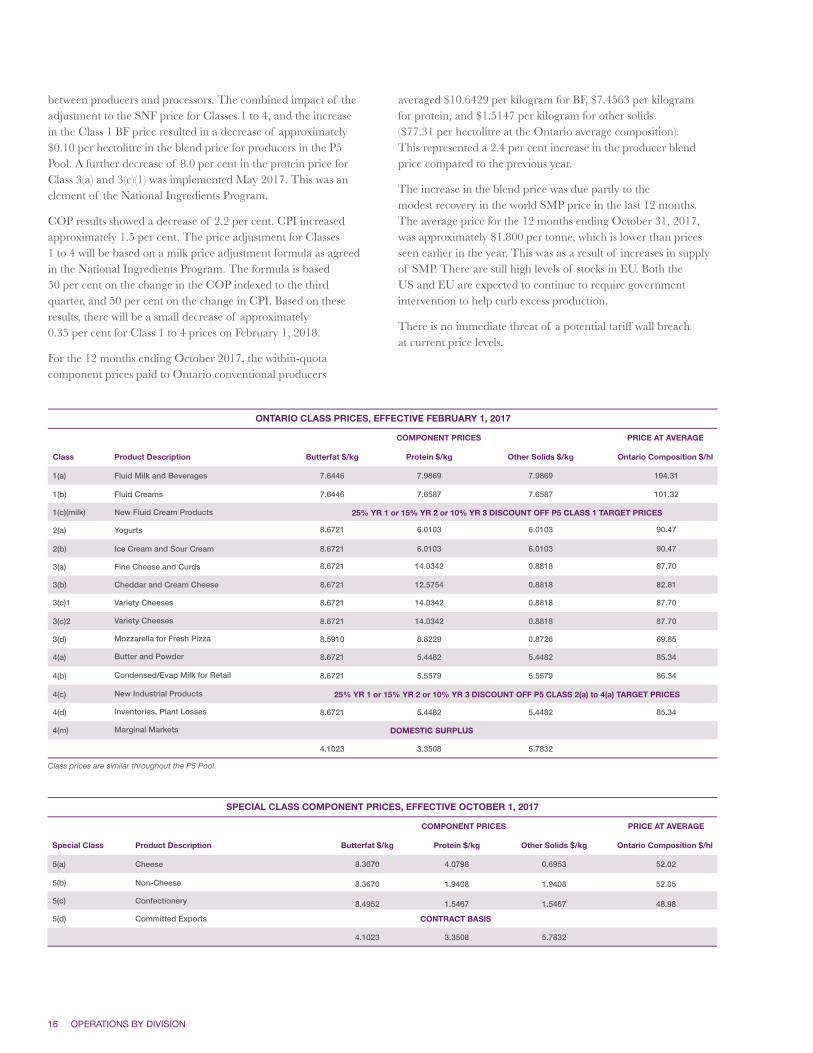
PricingA Class 1 to 4 milk price decrease was implemented across the P5 on February 1, 2017. The national formula (50 per cent CPI and 50 per cent nationsl COP), as agreed to by producers and processors, called for a February 2017 decrease of 0.4109 per cent in milk prices compared to the February 1, 2016 level. As agreed to by the P5 Supervisory Body, the decrease was applied to the SNF price. In addition, there was an increase of $0.18 per kilogram of BF applied to the Class 1 prices in February 2017. This increase was applied as a result of the national agreement
16 OPERATIONS BY DIVISION
between producers and processors. The combined impact of the adjustment to the SNF price for Classes 1 to 4, and the increase in the Class 1 BF price resulted in a decrease of approximately $0.10 per hectolitre in the blend price for producers in the P5 Pool. A further decrease of 8.0 per cent in the protein price for Class 3(a) and 3(c)(1) was implemented May 2017. This was an element of the National Ingredients Program.
COP results showed a decrease of 2.2 per cent. CPI increased approximately 1.5 per cent. The price adjustment for Classes 1 to 4 will be based on a milk price adjustment formula as agreed in the National Ingredients Program. The formula is based 50 per cent on the change in the COP indexed to the third quarter, and 50 per cent on the change in CPI. Based on these results, there will be a small decrease of approximately 0.35 per cent for Class 1 to 4 prices on February 1, 2018.
For the 12 months ending October 2017, the within-quota component prices paid to Ontario conventional producers
averaged $10.6429 per kilogram for BF, $7.4563 per kilogram for protein, and $1.5147 per kilogram for other solids ($77.31 per hectolitre at the Ontario average composition). This represented a 2.4 per cent increase in the producer blend price compared to the previous year.
The increase in the blend price was due partly to the modest recovery in the world SMP price in the last 12 months. The average price for the 12 months ending October 31, 2017, was approximately $1.800 per tonne, which is lower than prices seen earlier in the year. This was as a result of increases in supply of SMP. There are still high levels of stocks in EU. Both the US and EU are expected to continue to require government intervention to help curb excess production.
There is no immediate threat of a potential tariff wall breach at current price levels.
Class Butterfat $/kg
COMPONENT PRICES PRICE AT AVERAGE
Protein $/kg Other Solids $/kg Ontario Composition $/hlProduct Description
Class prices are similar throughout the P5 Pool.
1(a)
1(b)
1(c)(milk)
2(a)
2(b)
3(a)
3(b)
3(c)1
3(c)2
3(d)
4(a)
4(b)
4(c)
4(d)
4(m)
7.6446
7.6446
8.6721
8.6721
8.6721
8.6721
8.6721
8.6721
8.5910
8.6721
8.6721
8.6721
4.1023
25% YR 1 or 15% YR 2 or 10% YR 3 DISCOUNT OFF P5 CLASS 1 TARGET PRICES
DOMESTIC SURPLUS
25% YR 1 or 15% YR 2 or 10% YR 3 DISCOUNT OFF P5 CLASS 2(a) to 4(a) TARGET PRICES
7.9869
7.6587
6.0103
6.0103
14.0342
12.5754
14.0342
14.0342
8.8229
5.4482
5.5579
5.4482
3.3508
7.9869
7.6587
6.0103
6.0103
0.8818
0.8818
0.8818
0.8818
0.8726
5.4482
5.5579
5.4482
5.7832
104.31
101.32
90.47
90.47
87.70
82.81
87.70
87.70
69.85
85.34
86.34
85.34
Fluid Milk and Beverages
Fluid Creams
New Fluid Cream Products
Yogurts
Ice Cream and Sour Cream
Fine Cheese and Curds
Cheddar and Cream Cheese
Variety Cheeses
Variety Cheeses
Mozzarella for Fresh Pizza
Butter and Powder
Condensed/Evap Milk for Retail
New Industrial Products
Inventories, Plant Losses
Marginal Markets
ONTARIO CLASS PRICES, EFFECTIVE FEBRUARY 1, 2017
Special Class Butterfat $/kg
COMPONENT PRICES PRICE AT AVERAGE
Protein $/kg Other Solids $/kg Ontario Composition $/hlProduct Description
5(a)
5(b)
5(c)
5(d)
8.3670
8.3670
8.4952
4.1023
CONTRACT BASIS
4.0798
1.9408
1.5467
3.3508
0.6953
1.9408
1.5467
5.7832
52.02
52.05
48.98
Cheese
Non-Cheese
Confectionery
Committed Exports
SPECIAL CLASS COMPONENT PRICES, EFFECTIVE OCTOBER 1, 2017
OPERATIONS BY DIVISION 17
World Dairy Prices
ButterEffective Tariff Protection (%)
SMPEffective Tariff Protection (%)
CheeseEffective Tariff Protection (%)
MilkEffective Tariff Protection (%)
Producer Price(Standard Milk)
January 2016$/tonne US
3,800181.0%
1,78021.0%
3,20056.0%
29044.0%
34.47 Cdn/hl
4,000159.0%
1,88067.0%
3,20043.0%
33059.3%
33.04 Cdn/hl
July 2016$/tonne US
4,700200.0%
2,300102.0%
3,80057.0%
37067.0%
42.51 Cdn/hl
January 2017$/tonne US
5,900260.0%
2,00069.0%
3,80053.0%
36760.00%
43.72 Cdn/hl
July 2017$/tonne US
WORLD MARKET PRICES FOR DAIRY PRODUCTS AND PRODUCER BLEND PRICE
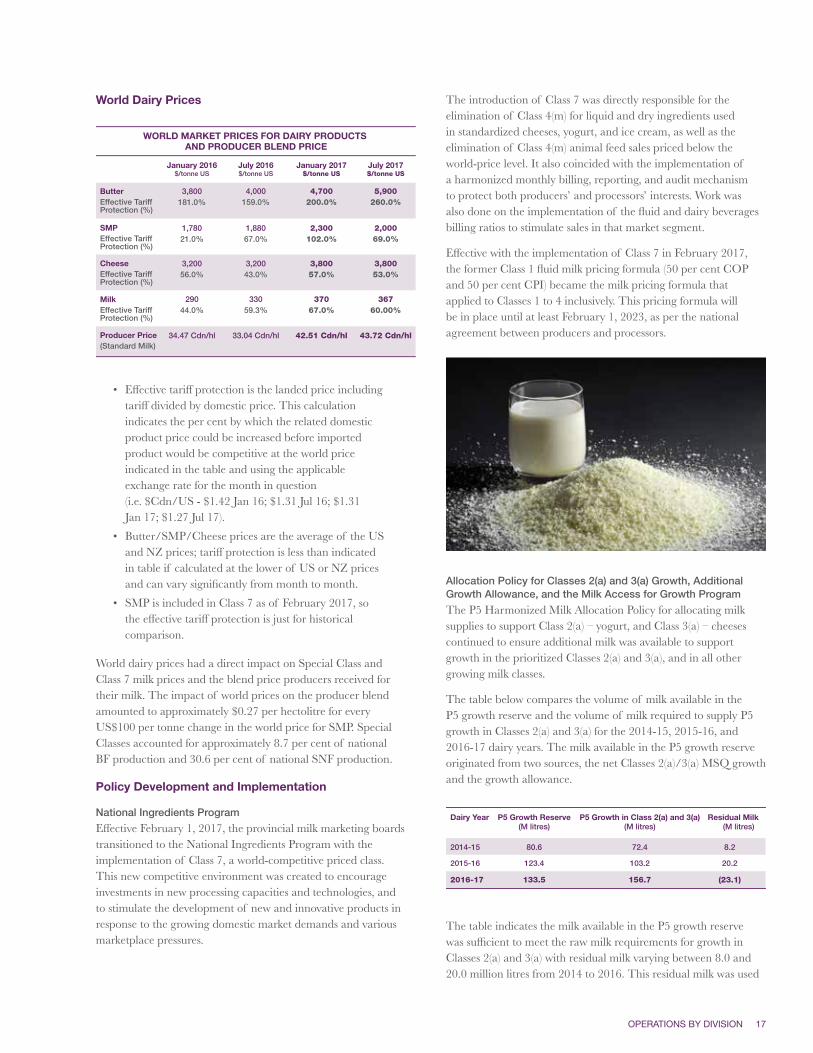
• Effective tariff protection is the landed price including tariff divided by domestic price. This calculation indicates the per cent by which the related domestic product price could be increased before imported product would be competitive at the world price indicated in the table and using the applicable exchange rate for the month in question (i.e. $Cdn/US - $1.42 Jan 16; $1.31 Jul 16; $1.31 Jan 17; $1.27 Jul 17).• Butter/SMP/Cheese prices are the average of the US and NZ prices; tariff protection is less than indicated in table if calculated at the lower of US or NZ prices and can vary significantly from month to month.• SMP is included in Class 7 as of February 2017, so the effective tariff protection is just for historical comparison.
World dairy prices had a direct impact on Special Class and Class 7 milk prices and the blend price producers received for their milk. The impact of world prices on the producer blend amounted to approximately $0.27 per hectolitre for every US$100 per tonne change in the world price for SMP. Special Classes accounted for approximately 8.7 per cent of national BF production and 30.6 per cent of national SNF production.
Policy Development and Implementation
National Ingredients Program
Effective February 1, 2017, the provincial milk marketing boards transitioned to the National Ingredients Program with the implementation of Class 7, a world-competitive priced class. This new competitive environment was created to encourage investments in new processing capacities and technologies, and to stimulate the development of new and innovative products in response to the growing domestic market demands and various marketplace pressures.
The introduction of Class 7 was directly responsible for the elimination of Class 4(m) for liquid and dry ingredients used in standardized cheeses, yogurt, and ice cream, as well as the elimination of Class 4(m) animal feed sales priced below the world-price level. It also coincided with the implementation of a harmonized monthly billing, reporting, and audit mechanism to protect both producers’ and processors’ interests. Work was also done on the implementation of the fluid and dairy beverages billing ratios to stimulate sales in that market segment.
Effective with the implementation of Class 7 in February 2017, the former Class 1 fluid milk pricing formula (50 per cent COP and 50 per cent CPI) became the milk pricing formula that applied to Classes 1 to 4 inclusively. This pricing formula will be in place until at least February 1, 2023, as per the national agreement between producers and processors.
Allocation Policy for Classes 2(a) and 3(a) Growth, Additional Growth Allowance, and the Milk Access for Growth Program
The P5 Harmonized Milk Allocation Policy for allocating milk supplies to support Class 2(a) – yogurt, and Class 3(a) – cheeses continued to ensure additional milk was available to support growth in the prioritized Classes 2(a) and 3(a), and in all other growing milk classes.
The table below compares the volume of milk available in the P5 growth reserve and the volume of milk required to supply P5 growth in Classes 2(a) and 3(a) for the 2014-15, 2015-16, and 2016-17 dairy years. The milk available in the P5 growth reserve originated from two sources, the net Classes 2(a)/3(a) MSQ growth and the growth allowance.
Dairy Year P5 Growth Reserve P5 Growth in Class 2(a) and 3(a) Residual Milk (M litres) (M litres) (M litres)
2014-15 80.6 72.4 8.2
2015-16 123.4 103.2 20.2
2016-17 133.5 156.7 (23.1)
The table indicates the milk available in the P5 growth reserve was sufficient to meet the raw milk requirements for growth in Classes 2(a) and 3(a) with residual milk varying between 8.0 and 20.0 million litres from 2014 to 2016. This residual milk was used
18 OPERATIONS BY DIVISION
to replace whole milk requirements for Class 2(a) that should have been satisfied with Class 2(a) SNF (skim milk) requirements, and to satisfy other growing industrial milk class requirements.
The available milk in the growth reserve was not sufficient to meet all of the growth in 2016-17. Milk available in the P5 growth reserve was sufficient to satisfy the net growth in Classes 2(a) and 3(a) but not sufficient to satisfy all growth. Growth is currently calculated using the volume above the base and the volume falling below a company’s base. A company is still entitled to receive the milk falling below its reference under the current policy to prevent cannibalization of markets amongst companies. The policy is being examined to determine how best to calculate growth for potential policy revision.
The CMSMC’s implementation of a 5.0 per cent growth allowance since August 2015 has now been extended to July 2018 inclusively. Of the 5.0 per cent, 2.0 per cent is now permanent and 3.0 per cent is temporary. The pools over- and under-quota penalties were also suspended until July 2018, which allowed the P5 pool to avoid paying over-quota penalties while providing additional time for rebalancing production and markets. The growth allowance level may be reviewed in early 2018 depending on the results of the Total Requirement/Total Quota evolution project.
The CMSMC also approved the initiative to support the growing market through the MAG program. The purpose of the MAG program is to encourage new investments in the dairy sector that will help grow the overall Canadian demand for milk and milk products. These investments included expansion and/or establishment of plants by Canadian dairy processors, further processors of food or any other products, or Canadian or foreign investors seeking to establish a business in Canada. The program may be used for new or existing products (dairy or other products containing dairy ingredients) with an emphasis on growth. Quota associated to a MAG contract will be allocated nationally and shared monthly based on each pool’s share of total quota. The P5 provinces have agreed that any committed volumes of milk through a MAG contract will be moved within the P5 on a MMO basis proportionate to the deliveries by the host province. Milk allocation by the host provinces will be delivered to the plant based on prevailing provincial allocation policy.
Total Requirement and Total Quota Evolution Project
In recent years, the Canadian dairy industry has evolved in an environment where measuring and forecasting total demand has been a challenge. The important evolutions in the dairy industry landscape, such as unprecedented market growth and the emergence of the impacts of unaccounted activities, are among the main reasons that explain the challenge. These realities have forced the need to further examine the traditional methods and develop more efficient tools. The overall goal is to rectify the lag between changes in total requirements and changes in total quota, upgrade forecasting models, and develop a long-term demand target by pool.
Newfoundland and Labrador and P5 Provinces Agreement
In 2017, after more than a decade of negotiations, the P5 and Dairy Farmers of Newfoundland and Labrador reached an agreement. A P6 pool was not formed despite extensive efforts from all parties. The resulting agreement took into consideration the unique context of Dairy Farmers of Newfoundland and Labrador, built upon existing policy, and marked the end of a longstanding impasse.
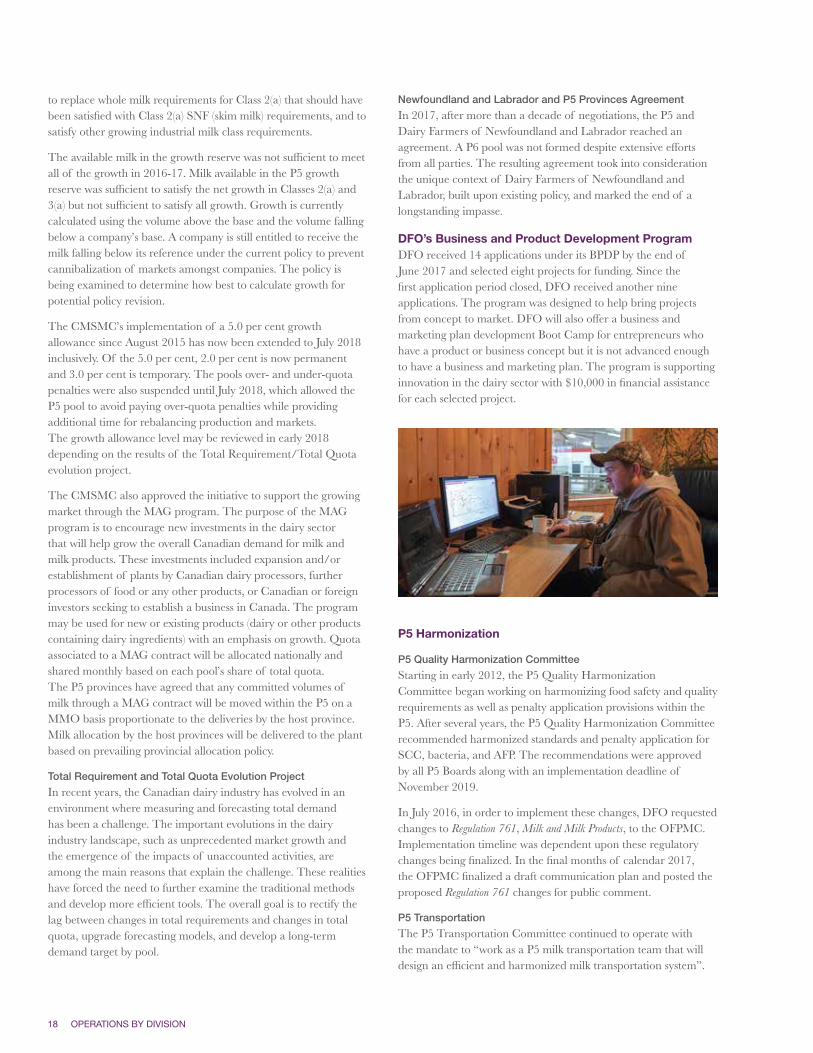
DFO’s Business and Product Development ProgramDFO received 14 applications under its BPDP by the end of June 2017 and selected eight projects for funding. Since the first application period closed, DFO received another nine applications. The program was designed to help bring projects from concept to market. DFO will also offer a business and marketing plan development Boot Camp for entrepreneurs who have a product or business concept but it is not advanced enough to have a business and marketing plan. The program is supporting innovation in the dairy sector with $10,000 in financial assistance for each selected project.
P5 Harmonization
P5 Quality Harmonization Committee
Starting in early 2012, the P5 Quality Harmonization Committee began working on harmonizing food safety and quality requirements as well as penalty application provisions within the P5. After several years, the P5 Quality Harmonization Committee recommended harmonized standards and penalty application for SCC, bacteria, and AFP. The recommendations were approved by all P5 Boards along with an implementation deadline of November 2019.
In July 2016, in order to implement these changes, DFO requested changes to Regulation 761, Milk and Milk Products, to the OFPMC. Implementation timeline was dependent upon these regulatory changes being finalized. In the final months of calendar 2017, the OFPMC finalized a draft communication plan and posted the proposed Regulation 761 changes for public comment.
P5 Transportation
The P5 Transportation Committee continued to operate with the mandate to “work as a P5 milk transportation team that will design an efficient and harmonized milk transportation system”.
OPERATIONS BY DIVISION 19
Staff from the P5 provincial milk marketing boards has worked on optimizing routes, investigating and/or implementing a fixed-cost-routes concept, and deploying GPS data collection and analysis as part of the Transportation Formula Harmonization.
P5 Quota Policy
On July 8, 2015, after consultations with producers across the P5 provinces, the P5 provincial milk marketing boards agreed to harmonize the following policies regarding quota:
• Non-saleable quota was to be converted to saleable quota with the Quota Exchange price cap being reduced from $25,000 to $24,000 rather than maintain four per cent non-saleable quota, by August 1, 2017;• NEQAP increased the amount of loaned quota from 12 kilograms to 16 kilograms with the repayment period starting in year 11 versus year 6;• Linked facilities (non-quota holding with production helping fill the quota of the primary quota-holding facility) could be set up for a maximum period of five years and must be within 10 kilometres of the primary dairy facility; • Ten per cent of the quota holdings associated with an ongoing farm operation sale must be sold on the Quota Exchange; and,• A parent who has continuously held quota for 10 years could transfer up to 50 per cent of their quota held at the time of the first transfer to a child or children with the maximum number of transfers being capped at three.
There have been 44 transfers of 877 kilograms of quota transferred to 41 children in the period of February 1, 2016 to October 31, 2017.
There have been eight linked facilities established since August 2015.
There were 47 farms sold as ongoing operations with 403.25 kilograms of quota representing at least 10 per cent of holdings being sold on the Quota Exchange since August 2015.
In 2017, the P5 Quota Committee conducted a producer survey to determine if producers can meet current market demand and processing infrastructure demand that will become operational starting in 2019. DFO also conducted an internal review of its policies to make sure policies are in place that ensure producers fill issued quota.
New Entrant Quota Assistance Program
NEQAP was introduced in August 2009 to assist new entrants to start dairy farming. In the period from March 2009 to October 2017, 72 new producers entered the industry through NEQAP. NEQAP continued to be well received, as shown in the chart below, with the deadline for 2018 applications being October 31, 2017.
Number of Applicants
2010
2011
2012
2013
2014
2015
2016
2017
65
39
36
29
26
23
19
21
10
10
10
10
10
10
7*
7*
Program Year Number Selected to Participate
*number of available positions reduced to seven in 2015 as a result of P5 Quota Policy changes.
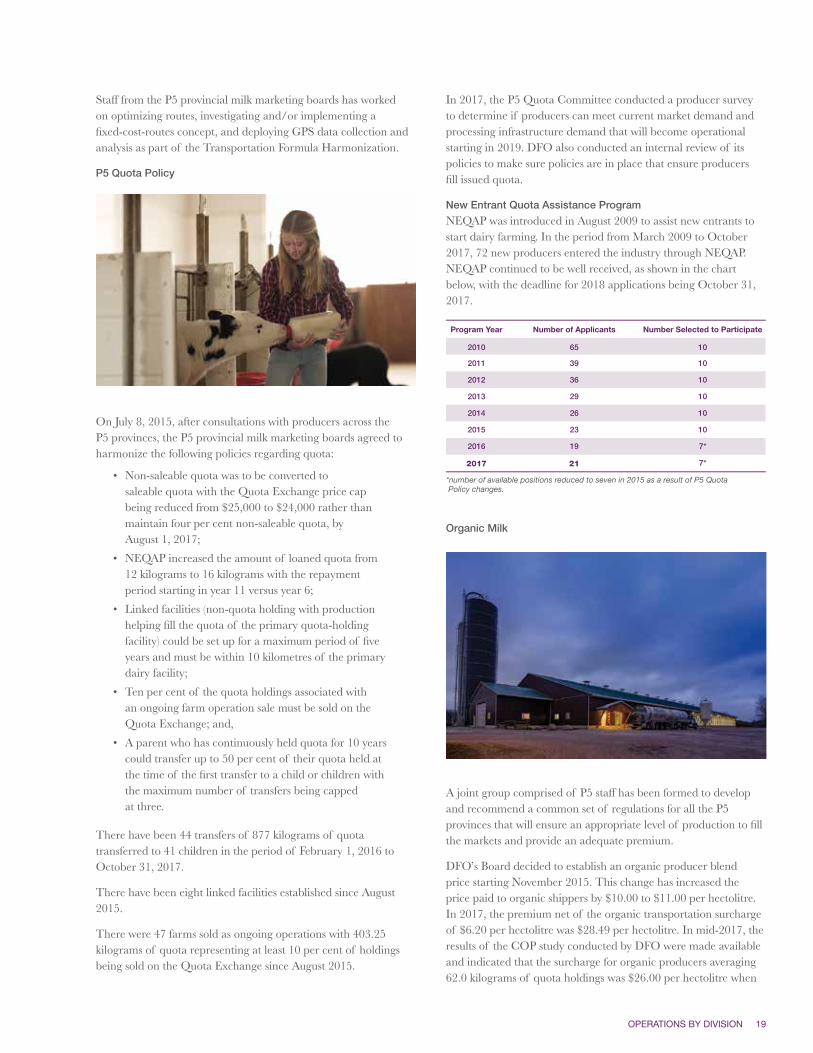
Organic Milk
A joint group comprised of P5 staff has been formed to develop and recommend a common set of regulations for all the P5 provinces that will ensure an appropriate level of production to fill the markets and provide an adequate premium.
DFO’s Board decided to establish an organic producer blend price starting November 2015. This change has increased the price paid to organic shippers by $10.00 to $11.00 per hectolitre. In 2017, the premium net of the organic transportation surcharge of $6.20 per hectolitre was $28.49 per hectolitre. In mid-2017, the results of the COP study conducted by DFO were made available and indicated that the surcharge for organic producers averaging 62.0 kilograms of quota holdings was $26.00 per hectolitre when
20 OPERATIONS BY DIVISION
considering opportunity costs for selling organic crops rather than feeding dairy cattle. The average organic quota holdings are approximately 49.0 kilograms per farm; therefore an average premium of $28.49 is relatively accurate to maintain and attract new organic shippers.
The Board gave priority access to producers wanting to ship organic milk through NEQAP. DFO received applications from six new entrants and selected three to start in 2018.
MARKETING GROWTH INITIATIVES DFO continued to monitor market growth opportunities through its BPDP, and through discussions with processors.
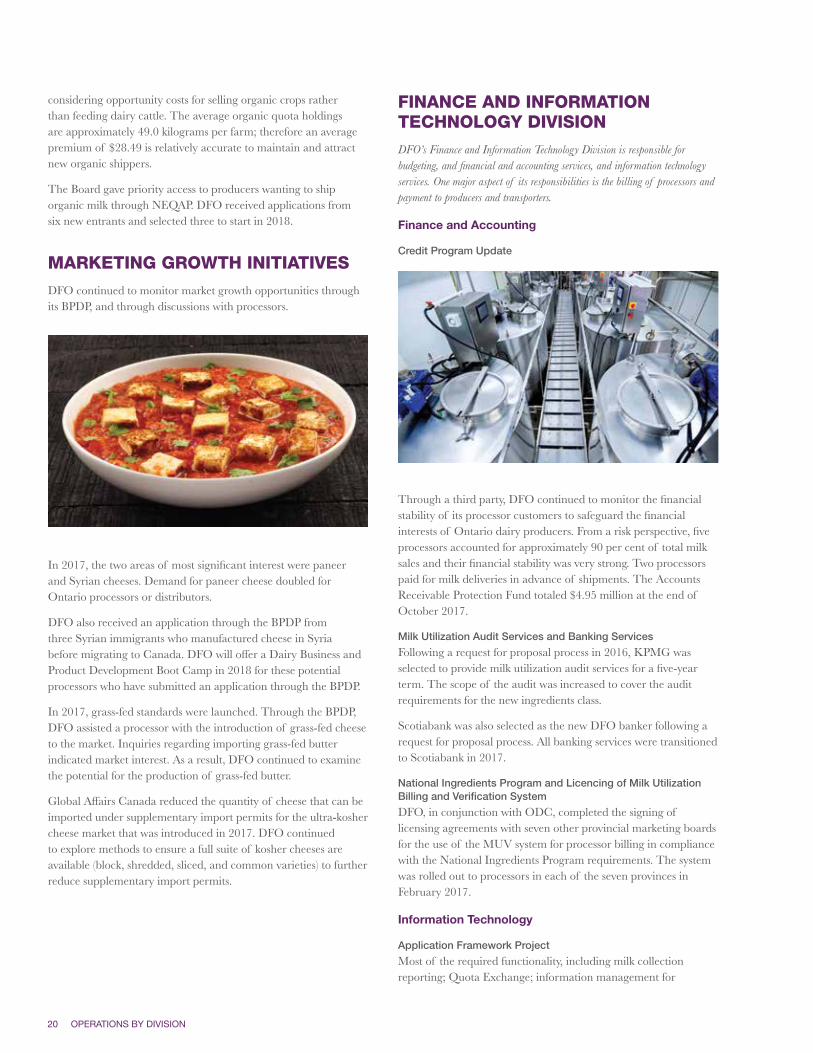
In 2017, the two areas of most significant interest were paneer and Syrian cheeses. Demand for paneer cheese doubled for Ontario processors or distributors.
DFO also received an application through the BPDP from three Syrian immigrants who manufactured cheese in Syria before migrating to Canada. DFO will offer a Dairy Business and Product Development Boot Camp in 2018 for these potential processors who have submitted an application through the BPDP.
In 2017, grass-fed standards were launched. Through the BPDP, DFO assisted a processor with the introduction of grass-fed cheese to the market. Inquiries regarding importing grass-fed butter indicated market interest. As a result, DFO continued to examine the potential for the production of grass-fed butter.
Global Affairs Canada reduced the quantity of cheese that can be imported under supplementary import permits for the ultra-kosher cheese market that was introduced in 2017. DFO continued to explore methods to ensure a full suite of kosher cheeses are available (block, shredded, sliced, and common varieties) to further reduce supplementary import permits.
FINANCE AND INFORMATION TECHNOLOGY DIVISIONDFO’s Finance and Information Technology Division is responsible for budgeting, and financial and accounting services, and information technology services. One major aspect of its responsibilities is the billing of processors and payment to producers and transporters.
Finance and Accounting
Credit Program Update
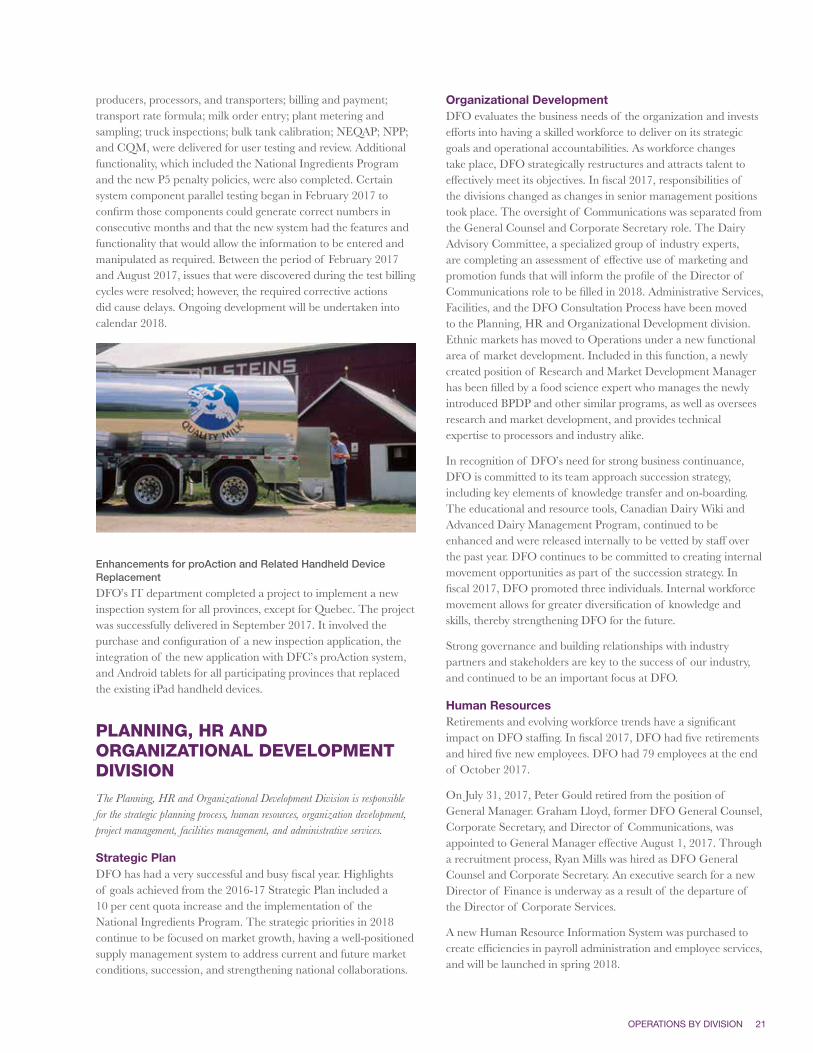
Through a third party, DFO continued to monitor the financial stability of its processor customers to safeguard the financial interests of Ontario dairy producers. From a risk perspective, five processors accounted for approximately 90 per cent of total milk sales and their financial stability was very strong. Two processors paid for milk deliveries in advance of shipments. The Accounts Receivable Protection Fund totaled $4.95 million at the end of October 2017.
Milk Utilization Audit Services and Banking Services
Following a request for proposal process in 2016, KPMG was selected to provide milk utilization audit services for a five-year term. The scope of the audit was increased to cover the audit requirements for the new ingredients class.
Scotiabank was also selected as the new DFO banker following a request for proposal process. All banking services were transitioned to Scotiabank in 2017.
National Ingredients Program and Licencing of Milk Utilization Billing and Verification System
DFO, in conjunction with ODC, completed the signing of licensing agreements with seven other provincial marketing boards for the use of the MUV system for processor billing in compliance with the National Ingredients Program requirements. The system was rolled out to processors in each of the seven provinces in February 2017.
Information Technology
Application Framework Project
Most of the required functionality, including milk collection reporting; Quota Exchange; information management for
OPERATIONS BY DIVISION 21
producers, processors, and transporters; billing and payment; transport rate formula; milk order entry; plant metering and sampling; truck inspections; bulk tank calibration; NEQAP; NPP; and CQM, were delivered for user testing and review. Additional functionality, which included the National Ingredients Program and the new P5 penalty policies, were also completed. Certain system component parallel testing began in February 2017 to confirm those components could generate correct numbers in consecutive months and that the new system had the features and functionality that would allow the information to be entered and manipulated as required. Between the period of February 2017 and August 2017, issues that were discovered during the test billing cycles were resolved; however, the required corrective actions did cause delays. Ongoing development will be undertaken into calendar 2018.
Enhancements for proAction and Related Handheld Device Replacement
DFO’s IT department completed a project to implement a new inspection system for all provinces, except for Quebec. The project was successfully delivered in September 2017. It involved the purchase and configuration of a new inspection application, the integration of the new application with DFC’s proAction system, and Android tablets for all participating provinces that replaced the existing iPad handheld devices.
PLANNING, HR AND ORGANIZATIONAL DEVELOPMENT DIVISIONThe Planning, HR and Organizational Development Division is responsible for the strategic planning process, human resources, organization development, project management, facilities management, and administrative services.
Strategic PlanDFO has had a very successful and busy fiscal year. Highlights of goals achieved from the 2016-17 Strategic Plan included a 10 per cent quota increase and the implementation of the National Ingredients Program. The strategic priorities in 2018 continue to be focused on market growth, having a well-positioned supply management system to address current and future market conditions, succession, and strengthening national collaborations.
Organizational DevelopmentDFO evaluates the business needs of the organization and invests efforts into having a skilled workforce to deliver on its strategic goals and operational accountabilities. As workforce changes take place, DFO strategically restructures and attracts talent to effectively meet its objectives. In fiscal 2017, responsibilities of the divisions changed as changes in senior management positions took place. The oversight of Communications was separated from the General Counsel and Corporate Secretary role. The Dairy Advisory Committee, a specialized group of industry experts, are completing an assessment of effective use of marketing and promotion funds that will inform the profile of the Director of Communications role to be filled in 2018. Administrative Services, Facilities, and the DFO Consultation Process have been moved to the Planning, HR and Organizational Development division. Ethnic markets has moved to Operations under a new functional area of market development. Included in this function, a newly created position of Research and Market Development Manager has been filled by a food science expert who manages the newly introduced BPDP and other similar programs, as well as oversees research and market development, and provides technical expertise to processors and industry alike.
In recognition of DFO’s need for strong business continuance, DFO is committed to its team approach succession strategy, including key elements of knowledge transfer and on-boarding. The educational and resource tools, Canadian Dairy Wiki and Advanced Dairy Management Program, continued to be enhanced and were released internally to be vetted by staff over the past year. DFO continues to be committed to creating internal movement opportunities as part of the succession strategy. In fiscal 2017, DFO promoted three individuals. Internal workforce movement allows for greater diversification of knowledge and skills, thereby strengthening DFO for the future.
Strong governance and building relationships with industry partners and stakeholders are key to the success of our industry, and continued to be an important focus at DFO.
Human ResourcesRetirements and evolving workforce trends have a significant impact on DFO staffing. In fiscal 2017, DFO had five retirements and hired five new employees. DFO had 79 employees at the end of October 2017.
On July 31, 2017, Peter Gould retired from the position of General Manager. Graham Lloyd, former DFO General Counsel, Corporate Secretary, and Director of Communications, was appointed to General Manager effective August 1, 2017. Through a recruitment process, Ryan Mills was hired as DFO General Counsel and Corporate Secretary. An executive search for a new Director of Finance is underway as a result of the departure of the Director of Corporate Services.
A new Human Resource Information System was purchased to create efficiencies in payroll administration and employee services, and will be launched in spring 2018.
22 OPERATIONS BY DIVISION
Building FacilitiesIn order to maximize the value of the property at 6780 Campobello Road, DFO continued to rent out a section of the building to DFC and an engineering company. The engineering company’s lease expired during 2017 and DFO is renegotiating terms for another five-year extension. Facilities has embarked on updating its Health and Safety Program to ensure regulatory compliance with current standards and to formalize processes and procedures that provide optimal workplace safety.
OPERATIONS AND REGULATORY COMPLIANCE DIVISIONDFO’s Operations and Regulatory Compliance Division is responsible for farm quota, quality assurance regulations and policies, milk and sample transportation, milk allocation logistics, and research.
Producers
For the fiscal year ending October 31, 2017, there were 3,586 producers representing a decrease of 5.1 per cent from the previous year’s 3,780 producers. These licensed dairy producers continued to support more than 10,000 Ontario farm families and generated revenue of $2,268,605,435.
2004 5,240
2005 4,971
2006 4,695
2007 4,511
2008 4,375
2009 4,218
2010 4,174
2011 4,116
2012 4,042
2013 3,980
2014 3,896
2015 3,780
2016 3,705
2017 3,586
NUMBER OF LICENSED ONTARIO MILK PRODUCERS
2.92.82.72.62.52.42.32.22.1 3.0
2,489,099,5362009
2010
2011
2012
2013
2,664,415,246
2014
2015
2,771,786,1822016
2017
2,494,915,458
2,523,618,498
2,601,927,222
2,562,999,551
2,538,844,872
TOTAL ANNUAL SHIPMENTS MARKETED BY DAIRY FARMERS OF ONTARIO 2009-17 (BILLIONS OF LITRES)
2,942,572,296
New Producer Program
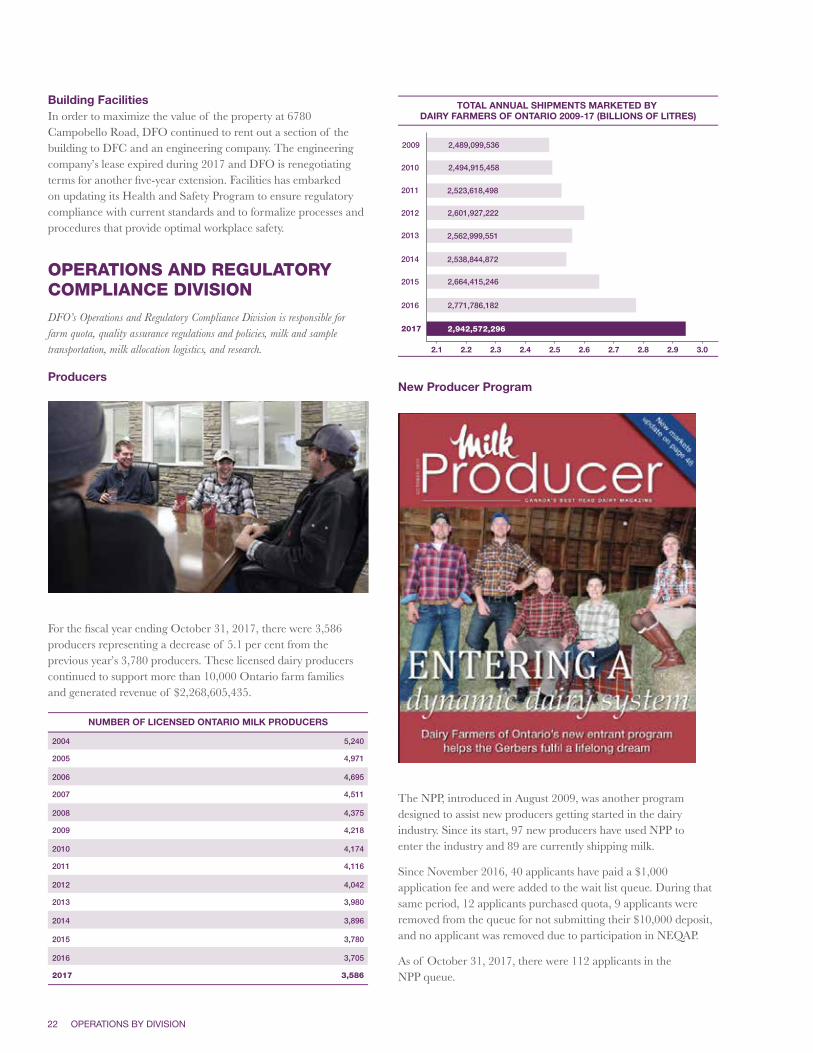
The NPP, introduced in August 2009, was another program designed to assist new producers getting started in the dairy industry. Since its start, 97 new producers have used NPP to enter the industry and 89 are currently shipping milk.
Since November 2016, 40 applicants have paid a $1,000 application fee and were added to the wait list queue. During that same period, 12 applicants purchased quota, 9 applicants were removed from the queue for not submitting their $10,000 deposit, and no applicant was removed due to participation in NEQAP.
As of October 31, 2017, there were 112 applicants in the NPP queue.
OPERATIONS BY DIVISION 23
Solids-Not-Fat to Butterfat RatioOntario finished the 2017 fiscal year with an SNF to BF production ratio of 2.2266, which is 2.5 per cent below the provincial target of 2.2840.
In the past fiscal year of the new policy, 1,427 Ontario producers have been over-ratio at least once. Under the P5 SNF Policy, $2.6 million was collected and paid out on BF to the 3,708 Ontario producers who were under-ratio in one or more months.
Raw Milk Quality PenaltiesAs shown in the table below, 97.4 per cent of milk samples collected were suitable and therefore tested.
# of milk pickups 715,223
# of samples tested 696,738
% of samples tested 97.4
SAMPLE SUITABILITY & TESTING
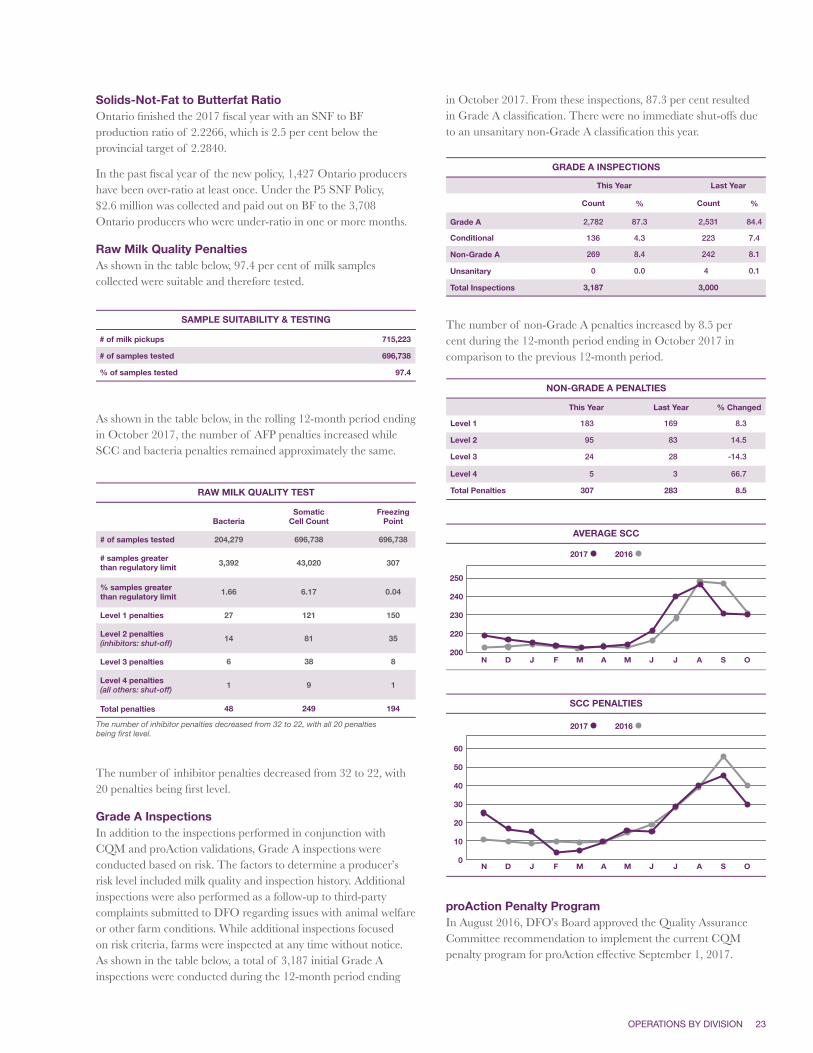
As shown in the table below, in the rolling 12-month period ending in October 2017, the number of AFP penalties increased while SCC and bacteria penalties remained approximately the same.
BacteriaFreezing
PointSomatic
Cell Count
204,279
3,392
1.66
27
14
6
1
48
696,738
307
0.04
150
35
8
1
194
696,738
43,020
6.17
121
81
38
9
249
# of samples tested
# samples greaterthan regulatory limit
% samples greaterthan regulatory limit
Level 1 penalties
Level 2 penalties(inhibitors: shut-off)
Level 3 penalties
Level 4 penalties(all others: shut-off)
Total penalties
The number of inhibitor penalties decreased from 32 to 22, with all 20 penaltiesbeing first level.
RAW MILK QUALITY TEST
The number of inhibitor penalties decreased from 32 to 22, with 20 penalties being first level.
Grade A Inspections In addition to the inspections performed in conjunction with CQM and proAction validations, Grade A inspections were conducted based on risk. The factors to determine a producer’s risk level included milk quality and inspection history. Additional inspections were also performed as a follow-up to third-party complaints submitted to DFO regarding issues with animal welfare or other farm conditions. While additional inspections focused on risk criteria, farms were inspected at any time without notice. As shown in the table below, a total of 3,187 initial Grade A inspections were conducted during the 12-month period ending
in October 2017. From these inspections, 87.3 per cent resulted in Grade A classification. There were no immediate shut-offs due to an unsanitary non-Grade A classification this year.
Grade A
Conditional
Non-Grade A
Unsanitary
Total Inspections
2,531
223
Count %
84.4
7.4
242 8.1
0.14
3,000
2,782
136
Count
This Year Last Year
%
87.3
4.3
269 8.4
0.00
3,187
GRADE A INSPECTIONS
The number of non-Grade A penalties increased by 8.5 per cent during the 12-month period ending in October 2017 in comparison to the previous 12-month period.
Level 1 183 169 8.3
Level 2 95 83 14.5
Level 3 24 28 -14.3
Level 4 5 3 66.7
Total Penalties 307 283 8.5
This Year Last Year % Changed
NON-GRADE A PENALTIES
250
240
230
220
200N D J F M A M J J A S O
2017 2016
AVERAGE SCC
N D J F M A M J J A S O
60
50
40
30
20
10
0
SCC PENALTIES
2017 2016
proAction Penalty ProgramIn August 2016, DFO’s Board approved the Quality Assurance Committee recommendation to implement the current CQM penalty program for proAction effective September 1, 2017.
24 OPERATIONS BY DIVISION
Effective September 1, 2017, the penalty structure associated with the CQM program, which became the proAction penalty program, was as follows:
• $2.00/hl each month for the first three months of non-compliance; • penalties increase by $2.00/hl after each three-month period of non-compliance; and,• penalties are capped at 10 per cent of the producer’s annual gross milk revenue in a 12-month rolling period.
In addition, with the introduction of animal assessments, the routine practice of tail docking without a valid medical reason discontinued effective September 1, 2017. Holstein Canada conducted animal assessments on approximately 1,100 Ontario herds by fiscal year end. A producer must have an animal assessment conducted prior to the on-farm validation.
proAction Program – Rollout StatusStarting September 1, 2017, DFO concluded 279 proAction validations with a total of 220 producers being registered under proAction as of October 31, 2017.
A total of two penalties have been assessed since the start of proAction validations in September 2017.
DFO has given consideration to implementing a shut-off for failure to meet CQM/proAction requirements. DFO’s current position is to add shut-off provisions at the end of the proAction rollout scheduled for the end of September 2023.
September 1, 2017 to October 31, 2017** 220
October 31, 2016 to August 31, 2017* 43
2015 to 2016 74
2014 to 2015 904
2013 to 2014 925
2012 to 2013 1,271
2011 to 2012 808
2010 to 2011 67
Period Ending October 31, 2010 13
PROACTION/CQM REGISTRATIONS ISSUED
*CQM Registrations**proAction Registrations
Rejected Loads Due to QualityThe number of loads rejected due to quality decreased from 23 to 18 during the 12-month period ending in October 2017 as compared to the previous 12-month period. The reason for rejection with highest incidence continued to be the presence of black specks (12 loads).
Iodine TestingTesting started with load samples. Bulk tank samples associated with loads exceeding a threshold of 300 micrograms per litre were then tested. The threshold for trace back was set at 300 micrograms per litre for load samples as a means of identifying
farms with iodine levels greater than 500 micrograms per litre in their milk.
As of October 31, 2017, a total of 491 load samples were tested. The majority, or 82.7 per cent, of these loads were in the normal range, while 14.7 per cent were in the elevated range (350 to 500 micrograms per litre), and 2.6 per cent in the high range (greater than 500 micrograms per litre). A total of 181 loads (36.9 per cent) were flagged for trace back testing, which resulted in 1,251 bulk tank samples being tested. Of these, 203 had iodine levels in the high range.
Load Samples (number of load samples tested: 491)
# Load Samples
(greater than300 µg/L)
# Normal (less than350 µg/L)
# Elevated (between 350 and 500 µg/L)
(36.9%)181
779 269 203
(82.7%)406
(14.7%)72
(2.6%)13
# High (greater than
500 µg/L)
# Samples in Normal Range
(less than 350 µg/L)
# Samples in Elevated Range (between 350
and 500 µg/L)
# Samples in High Range
(greater than 500 µg/L)
Bulk Tank Samples
RESULTS OF THE 2017 IODINE LOAD TESTING PROGRAM
MARKETING LOGISTICS
TransportationThe November 2016 to October 2017 transportation charge to producers increased by $0.06/hl compared to the prior year. The $0.06/hl increase comes from a $0.02/hl increase in the transportation costs and a decrease of $0.04/hl in revenues over the same timeframe as shown in the table below.
Fiscal Year-to-Date Transportation Transportation Charge to Cost $/hl Revenue $/hl Producer
November 2015 to October 2016 2.74 0.16 2.58
November 2016 to October 2017 2.76 0.12 2.64
Year-over-Year Variance 0.02 (0.04) 0.06
The $0.02/hl increase in transportation costs was a net result of the individual components shown below.
Transportation Expense YOY* Variance $/hl
Inflation1 0.02
Fuel2 0.03
Operations3 0.04
DHA Milk4 (0.05)
Rate Formula5 (0.02)
Net Increase6 0.02
* Year-over-year
1. Inflation: Rate formula increase, labour & equipment costs
2. Fuel: Increase in fuel prices
3. Operations: Increased kilometres traveled due to the imbalance in milk supply and demand between southeastern and southwestern Ontario
4. DHA Milk: Savings resulting from cancellation of the DHA milk program
5. Rate Formula: Savings resulting from the removal of the load size incentive from the Transporter Rate Formula
6. Net Increase: Overall net increase in transportation costs
OPERATIONS BY DIVISION 25
The $0.04/hl decrease in transportation revenues was a net result of the individual components shown below.
Transportation Revenue YOY* Variance $/hl
Everyday Pickup1 0.01
DHA Transportation2 0.03
P5 Pooling3 (0.02)
Net Decrease4 (0.04)
*Year-over-year1. Everyday Pickup: $280K increase in everyday pick-up transportation charges2. DHA Transportation: $700K decrease in DHA transportation revenue3. P5 Pool: $1.5M reduction in P5 pooling transfers4. Net Decrease: Overall net decrease in transportation revenues
Surplus Skim Milk DFO skimmed milk from a period beginning just prior to Christmas 2016 until April 2017. DFO and its P5 partners did not skim milk as of April 2017, with the exception of the Victoria Day
long weekend, as a result of new skim milk processing capacity.
DFO was unable to fill processor milk orders since the new processing capacity became effective; however, if producers fill the currently issued quota, DFO expects to be at processing capacity again until new processing infrastructure is introduced in early 2019.
During the last months of the fiscal year, DFO developed a plan for a Christmas 2017 fluid milk promotion that addresses fluid processing capacity during the period and reduces the processing pressure on industrial milk processing plants.
Period Skim Milk (l)
May 2015 - Oct 2015
Nov 2015 - Oct 2016
Nov 2016 - Oct 2017
Grand Total
24,421,866
80,237,450
35,665,119
140,324,435
Cost
$277,903
$1,005,019
$415,281
$1,698,202
Fee
$89,119
$239,146
$194,272
$522,537
Fee
$798,629
$3,375,223
$1,589,561
$5,763,413
(Animal Feed)
$43,530
$406,175
$234,726
$684,431
Cost
$1,122,121
$4,213,213
$1,964,387
$7,299,721
$/hl*Transportation Disposal Processing Revenue Total
$4.14
$4.73
$4.96
$4.69
*Based on whole milk volume
Research and Development
Market Growth Projects
DFO undertook a number of market growth projects to better understand the opportunities that exist to assist DFO in meeting its strategic priority of increasing quota issued to producers by a minimum of 2.0 per cent per year.
On behalf of the P5, DFO requested JRG Consulting Group to develop an improved forecasting methodology for determining market requirements for dairy products. The market opportunity analysis segment will, at its conclusion, provide DFO with the ability to have a production signal model that enables effective market forecasting.
DFO’s Dairy Incubator Projects included the BPDP and the Dairy Business and Product Development Boot Camp. The goal of the BPDP project was to design a business incubator program to support new and existing dairy processors in starting or scaling up dairy businesses. The vision for the program was that support be provided across all of the activities needed from an initial product idea to launch and distribution. The goal of the Boot Camp was designed to offer coaching and assistance to BPDP applicants not selected for the BPDP project, and any future applicants, with the development of their business and marketing plans. By the end of June 2017, DFO received 14 applications under the BPDP. Eight projects were selected for funding. Since the closing of the first application period, DFO received another nine applications.
Research Projects
The research and development focus shifted to include market development. DFO continued to contribute funding to several dairy-production projects. Current focuses included grass-fed milk for dairy products, and the degree that animal injuries heal with the improvement of the animal’s environment.
THE BOARD AND STAFF
Board ElectionsBart Rijke was elected to represent the producers in Region 1 for his first term on the Board.
Will Vanderhorst was acclaimed to represent the producers in Region 5 for his second term on the Board.
Paul Vis was acclaimed to represent the producers in Region 9 for his third term on the Board.
Immediately following the adjournment of DFO’s AGM on January 12, 2017, the four-year term of the newly elected Board Members commenced.
Board Executive CommitteeAt a Special Meeting of the Board held on January 12, 2017, Ralph Dietrich was re-elected as Chair, Murray Sherk was re-elected Vice-Chair, and Paul Vis was re-elected 2nd Vice-Chair.
Board SecretaryAt a Special Meeting of the Board held on January 12, 2017, Graham Lloyd was re-appointed Secretary to the Board.
26 OPERATIONS BY DIVISION
Board TreasurerAt a Special Meeting of the Board held on January 12, 2017, Patrick Hop Hing was re-appointed Treasurer to the Board. In August 2017, Sharon Hutchinson was appointed Interim Treasurer to the Board as a result of Patrick Hop Hing’s departure from the company.
Board Members’ MeetingsThe Board held regular meetings every month of the fiscal year. A Special Meeting was held in January 2017 to elect the Board’s Executive for 2017, and meetings were held in April and September 2017 for strategic planning and the fiscal 2018 budget.
Board business during 2017 included time spent at required Committee meetings, meetings of other industry organizations on which DFO has representation, working with local DPCs, and being involved in various activities on behalf of DFO’s Board.
Board Members actively participate on DFO Committees and regularly attend DFC meetings.
StaffingFive long-serving employees retired in 2017. At the end of fiscal 2017, DFO had 79 employees.
The Board extends its thanks and appreciation to the staff for their dedication and work during the year on behalf of dairy producers and in support of the dairy industry.
Producer and Industry Support AppreciatedIn closing, the Board would like to thank the DPCs for their valuable input in policy development and for their general support throughout the year.
The Board would also like to express its appreciation to all of DFO’s partners in the dairy industry for their advice, support, and cooperation.
Signed on behalf of the Board,
Ralph Dietrich Chair of the Board
Graham Lloyd General Manager and CEO
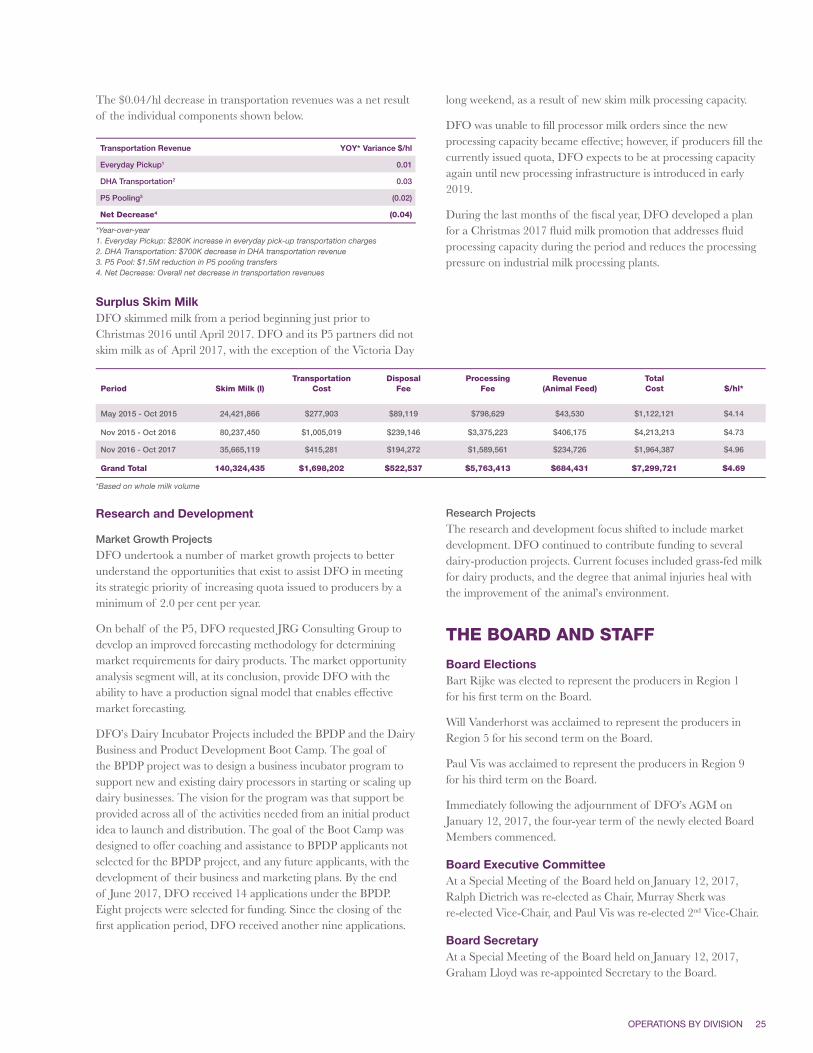
HIGHLIGHTS FROM 2016-17
National Ingredients ProgramThe National Ingredients Program was implemented effective February 1, 2017.
Quota Increases As a result of ongoing demand and new capacity due to new SMRP policies, a 10 per cent quota increase and added incentive days were issued to producers.
proActionThe Animal Care module and Livestock Traceability module of the proAction program were implemented effective September 1, 2017.
Market DevelopmentDFO undertook a number of market growth projects to better understand the opportunities that exist for increasing quota issued to producers, including the launch of the BPDP in which eight projects were selected for funding.
STRATEGIC PLAN
DFO’s Board approved the 2017-18 Strategic Plan at the September 26-27, 2017 Board Meeting. Four strategic priorities were identified that set the direction of DFO. The key priorities and approaches to achieving these priorities are outlined in the following related, measurable goals:
OPERATIONS BY DIVISION 27
1. To grow the market for Canadian milk and dairy components.
• To increase quota issued to producers by a minimum of 2% through market growth strategies. • To develop a strategy to explore and evaluate growth opportunities in export, food services, and contract caterer markets. • To assess the potential impacts of CETA on the Canadian cheese markets, and develop a plan to mitigate the impacts. • To implement a marketing plan for optimal use of marketing dollars based on an expert consultation group.
2. To have a domestic supply management system thateffectivelyaddressescurrentandfuture market conditions.
• To include market intelligence, retail and food services sales data, imports and social trends into the national forecasting model. • To facilitate the effective operationalization of the ingredient strategy nationally. • To assess the barriers and limitations to increasing production and how to mitigate them. • To examine current quota entitlement and identify ways to enhance meeting market requirements. • To develop a marketing and promotional program criteria for market growth requests. • To incorporate shared milk allocation interests into the P5 agreement.
3. To strengthen and develop organizational processes, resources, and tools for succession management.
• To launch the first phase of the IT application framework (aka MMS) and complete the development of the system to meet all identified functional requirements. • To implement DFO’s succession strategy to meet the changing needs of the organization. • To develop a plan to improve producer engagement activities through DPCs. • To create a process for DFO divisional coordination on communicating messages, with consideration to publication schedules, seasonality, frequency and industry avenues.
4. To strengthen national collaboration through the pursuit of common goals.
• To work on a national NAFTA lobbying strategy including national messaging. • To implement the proAction program. • To develop a national proAction consumer communications strategy. • To create a national committee of staff that will develop a “working better together” governance plan to be presented to provincial marketing boards and industry partners. • To effectively enforce current tariffs through border inspection and transparent reporting.
28 FINANCIAL REPORTS
FINANCIAL REPORTS
Ontario’s 3,586 dairy farms produced more than 2.9 Billion litres of milk in 2016-17, and donated 836,943 litres to Ontario’s food banks.
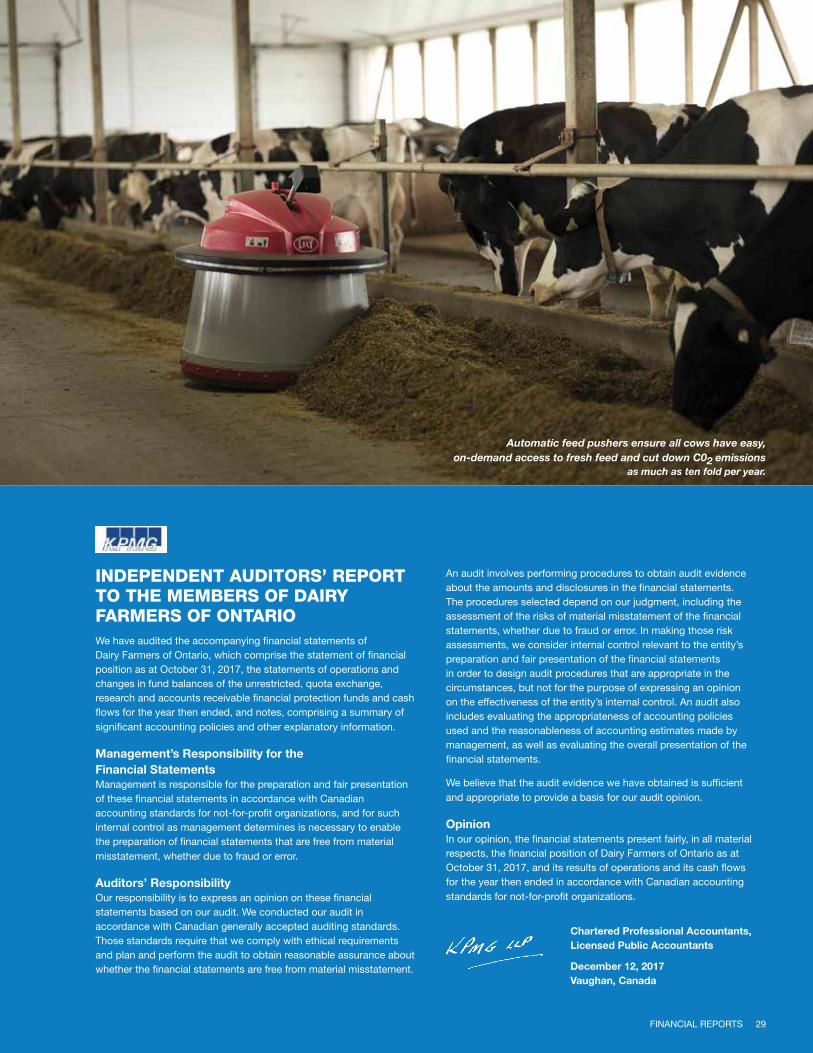
FINANCIAL REPORTS 29FINANCIAL REPORTS 29
INDEPENDENT AUDITORS’ REPORT TO THE MEMBERS OF DAIRY FARMERS OF ONTARIOWe have audited the accompanying financial statements of Dairy Farmers of Ontario, which comprise the statement of financial position as at October 31, 2017, the statements of operations and changes in fund balances of the unrestricted, quota exchange, research and accounts receivable financial protection funds and cash flows for the year then ended, and notes, comprising a summary of significant accounting policies and other explanatory information.
Management’s Responsibility for the Financial StatementsManagement is responsible for the preparation and fair presentation of these financial statements in accordance with Canadian accounting standards for not-for-profit organizations, and for such internal control as management determines is necessary to enable the preparation of financial statements that are free from material misstatement, whether due to fraud or error.
Auditors’ ResponsibilityOur responsibility is to express an opinion on these financial statements based on our audit. We conducted our audit in accordance with Canadian generally accepted auditing standards. Those standards require that we comply with ethical requirements and plan and perform the audit to obtain reasonable assurance about whether the financial statements are free from material misstatement.
An audit involves performing procedures to obtain audit evidence about the amounts and disclosures in the financial statements. The procedures selected depend on our judgment, including the assessment of the risks of material misstatement of the financial statements, whether due to fraud or error. In making those risk assessments, we consider internal control relevant to the entity’s preparation and fair presentation of the financial statements in order to design audit procedures that are appropriate in the circumstances, but not for the purpose of expressing an opinion on the effectiveness of the entity’s internal control. An audit also includes evaluating the appropriateness of accounting policies used and the reasonableness of accounting estimates made by management, as well as evaluating the overall presentation of the financial statements.
We believe that the audit evidence we have obtained is sufficient and appropriate to provide a basis for our audit opinion.
OpinionIn our opinion, the financial statements present fairly, in all material respects, the financial position of Dairy Farmers of Ontario as at October 31, 2017, and its results of operations and its cash flows for the year then ended in accordance with Canadian accounting standards for not-for-profit organizations.
Chartered Professional Accountants, Licensed Public Accountants
December 12, 2017Vaughan, Canada
Automatic feed pushers ensure all cows have easy, on-demand access to fresh feed and cut down C02 emissions
as much as ten fold per year.
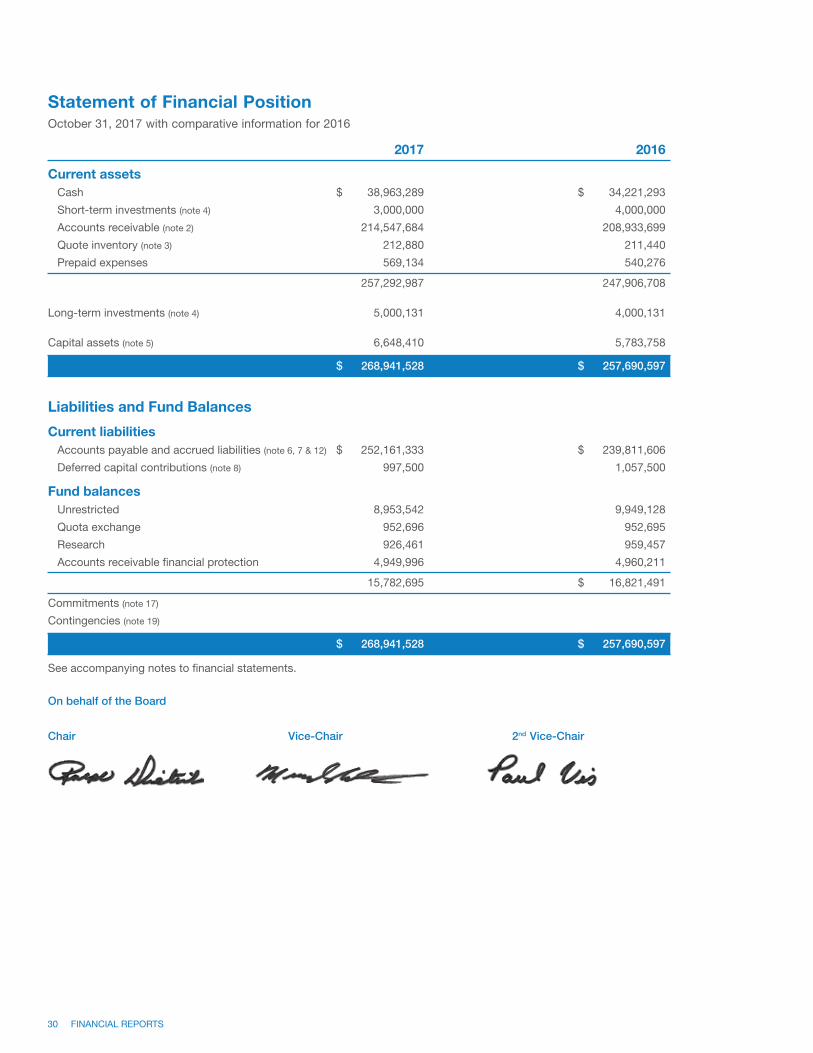
30 FINANCIAL REPORTS
2017 2016
Current assets Cash $ 38,963,289 $ 34,221,293
Short-term investments (note 4) 3,000,000 4,000,000
Accounts receivable (note 2) 214,547,684 208,933,699
Quote inventory (note 3) 212,880 211,440
Prepaid expenses 569,134 540,276
257,292,987 247,906,708
Long-term investments (note 4) 5,000,131 4,000,131
Capital assets (note 5) 6,648,410 5,783,758
$ 268,941,528 $ 257,690,597
Liabilities and Fund Balances
Current liabilities Accounts payable and accrued liabilities (note 6, 7 & 12) $ 252,161,333 $ 239,811,606
Deferred capital contributions (note 8) 997,500 1,057,500
Fund balances Unrestricted 8,953,542 9,949,128
Quota exchange 952,696 952,695
Research 926,461 959,457
Accounts receivable financial protection 4,949,996 4,960,211
15,782,695 $ 16,821,491
Commitments (note 17)
Contingencies (note 19)
$ 268,941,528 $ 257,690,597
See accompanying notes to financial statements.
Statement of Financial PositionOctober 31, 2017 with comparative information for 2016
On behalf of the Board
Chair Vice-Chair 2nd Vice-Chair
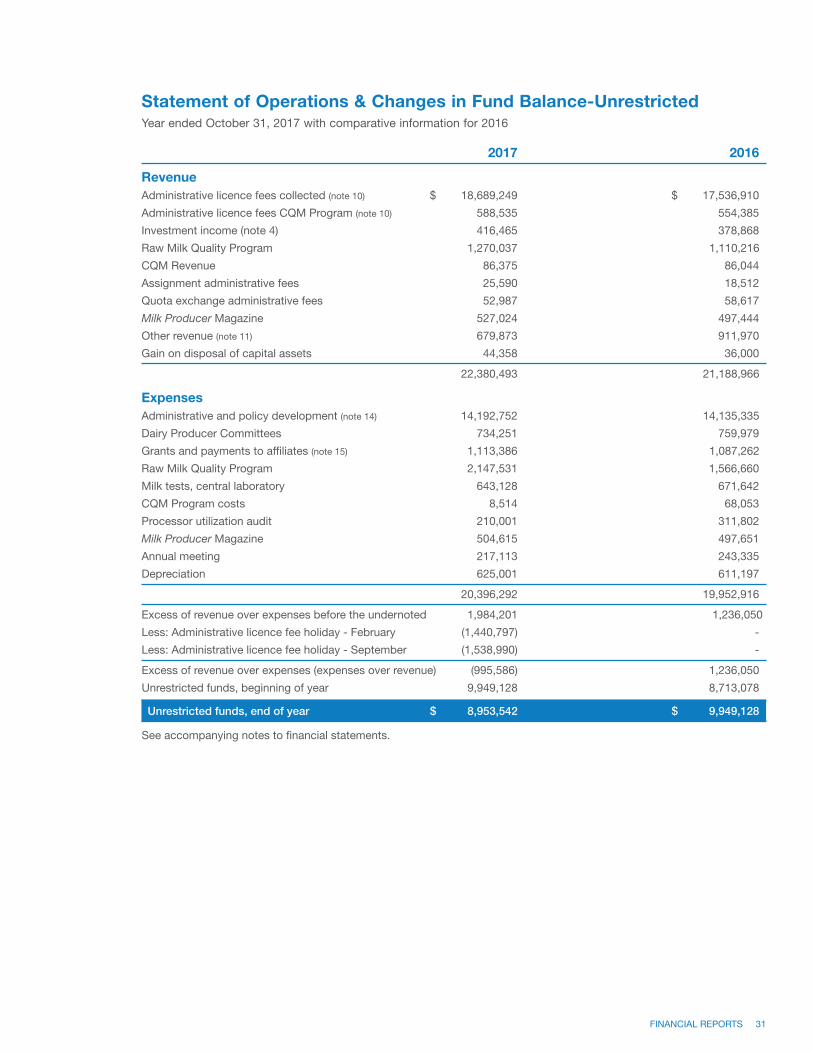
FINANCIAL REPORTS 31
2017 2016
RevenueAdministrative licence fees collected (note 10) $ 18,689,249 $ 17,536,910
Administrative licence fees CQM Program (note 10) 588,535 554,385
Investment income (note 4) 416,465 378,868
Raw Milk Quality Program 1,270,037 1,110,216
CQM Revenue 86,375 86,044
Assignment administrative fees 25,590 18,512
Quota exchange administrative fees 52,987 58,617
Milk Producer Magazine 527,024 497,444
Other revenue (note 11) 679,873 911,970
Gain on disposal of capital assets 44,358 36,000
22,380,493 21,188,966
ExpensesAdministrative and policy development (note 14) 14,192,752 14,135,335
Dairy Producer Committees 734,251 759,979
Grants and payments to affiliates (note 15) 1,113,386 1,087,262
Raw Milk Quality Program 2,147,531 1,566,660
Milk tests, central laboratory 643,128 671,642
CQM Program costs 8,514 68,053
Processor utilization audit 210,001 311,802
Milk Producer Magazine 504,615 497,651
Annual meeting 217,113 243,335
Depreciation 625,001 611,197
20,396,292 19,952,916
Excess of revenue over expenses before the undernoted 1,984,201 1,236,050
Less: Administrative licence fee holiday - February (1,440,797) -
Less: Administrative licence fee holiday - September (1,538,990) -
Excess of revenue over expenses (expenses over revenue) (995,586) 1,236,050
Unrestricted funds, beginning of year 9,949,128 8,713,078
Unrestricted funds, end of year $ 8,953,542 $ 9,949,128
See accompanying notes to financial statements.
Statement of Operations & Changes in Fund Balance-UnrestrictedYear ended October 31, 2017 with comparative information for 2016
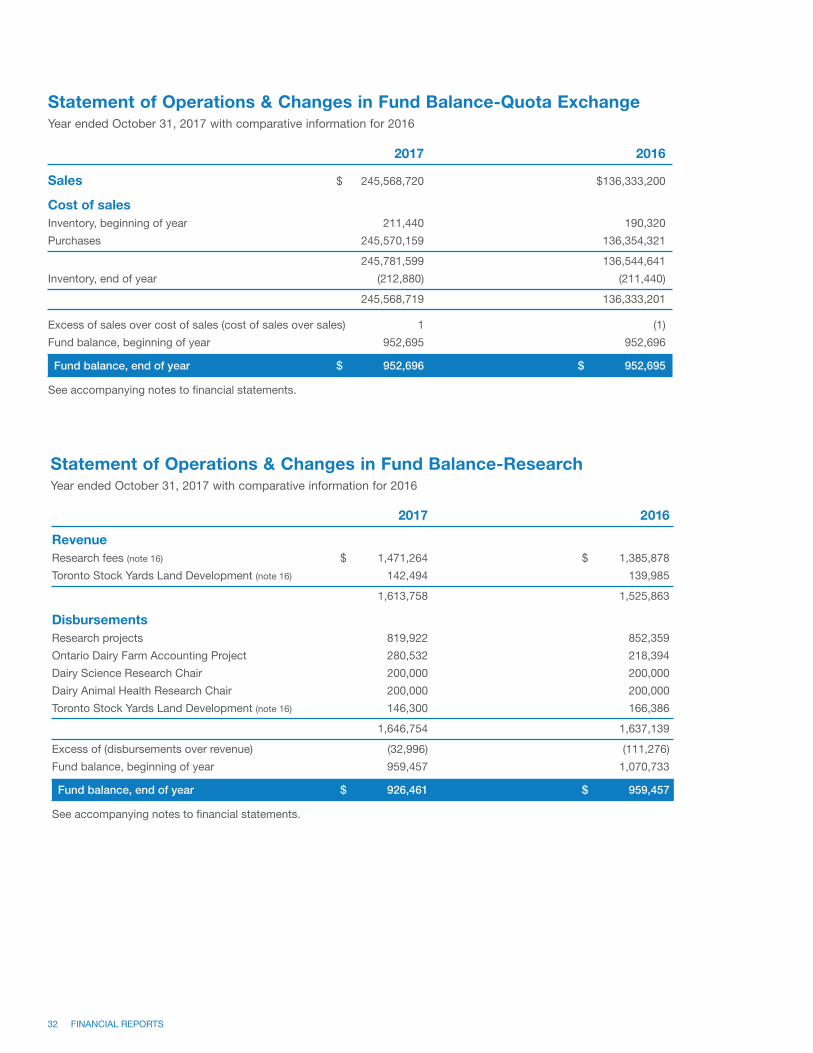
32 FINANCIAL REPORTS
Statement of Operations & Changes in Fund Balance-Quota ExchangeYear ended October 31, 2017 with comparative information for 2016
2017 2016
Sales $ 245,568,720 $136,333,200
Cost of salesInventory, beginning of year 211,440 190,320
Purchases 245,570,159 136,354,321
245,781,599 136,544,641
Inventory, end of year (212,880) (211,440)
245,568,719 136,333,201
Excess of sales over cost of sales (cost of sales over sales) 1 (1)
Fund balance, beginning of year 952,695 952,696
Fund balance, end of year $ 952,696 $ 952,695
See accompanying notes to financial statements.
Statement of Operations & Changes in Fund Balance-ResearchYear ended October 31, 2017 with comparative information for 2016
2017 2016
RevenueResearch fees (note 16) $ 1,471,264 $ 1,385,878
Toronto Stock Yards Land Development (note 16) 142,494 139,985
1,613,758 1,525,863
DisbursementsResearch projects 819,922 852,359
Ontario Dairy Farm Accounting Project 280,532 218,394
Dairy Science Research Chair 200,000 200,000
Dairy Animal Health Research Chair 200,000 200,000
Toronto Stock Yards Land Development (note 16) 146,300 166,386
1,646,754 1,637,139
Excess of (disbursements over revenue) (32,996) (111,276)
Fund balance, beginning of year 959,457 1,070,733
Fund balance, end of year $ 926,461 $ 959,457
See accompanying notes to financial statements.
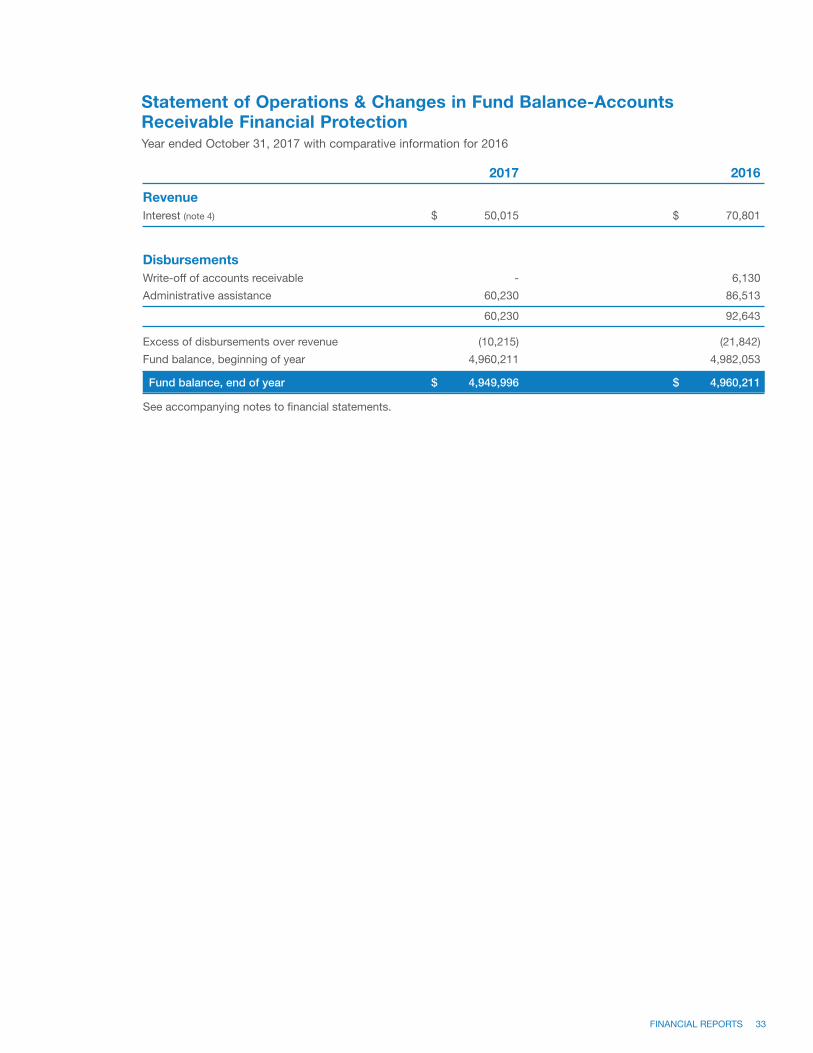
FINANCIAL REPORTS 33
Statement of Operations & Changes in Fund Balance-Accounts Receivable Financial ProtectionYear ended October 31, 2017 with comparative information for 2016
2017 2016
RevenueInterest (note 4) $ 50,015 $ 70,801
DisbursementsWrite-off of accounts receivable - 6,130
Administrative assistance 60,230 86,513
60,230 92,643
Excess of disbursements over revenue (10,215) (21,842)
Fund balance, beginning of year 4,960,211 4,982,053
Fund balance, end of year $ 4,949,996 $ 4,960,211
See accompanying notes to financial statements.
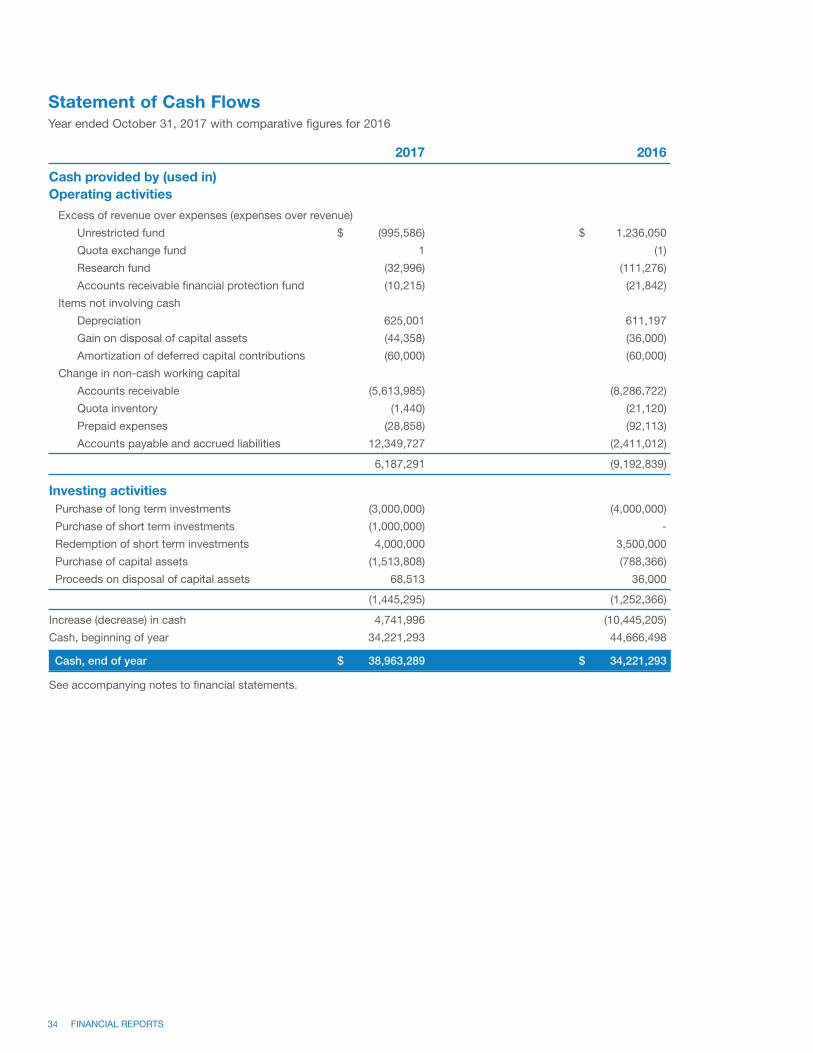
34 FINANCIAL REPORTS
Statement of Cash FlowsYear ended October 31, 2017 with comparative figures for 2016
2017 2016
Cash provided by (used in) Operating activities
Excess of revenue over expenses (expenses over revenue)
Unrestricted fund $ (995,586) $ 1,236,050
Quota exchange fund 1 (1)
Research fund (32,996) (111,276)
Accounts receivable financial protection fund (10,215) (21,842)
Items not involving cash
Depreciation 625,001 611,197
Gain on disposal of capital assets (44,358) (36,000)
Amortization of deferred capital contributions (60,000) (60,000)
Change in non-cash working capital
Accounts receivable (5,613,985) (8,286,722)
Quota inventory (1,440) (21,120)
Prepaid expenses (28,858) (92,113)
Accounts payable and accrued liabilities 12,349,727 (2,411,012)
6,187,291 (9,192,839)
Investing activities Purchase of long term investments (3,000,000) (4,000,000)
Purchase of short term investments (1,000,000) -
Redemption of short term investments 4,000,000 3,500,000
Purchase of capital assets (1,513,808) (788,366)
Proceeds on disposal of capital assets 68,513 36,000
(1,445,295) (1,252,366)
Increase (decrease) in cash 4,741,996 (10,445,205)
Cash, beginning of year 34,221,293 44,666,498
Cash, end of year $ 38,963,289 $ 34,221,293
See accompanying notes to financial statements.
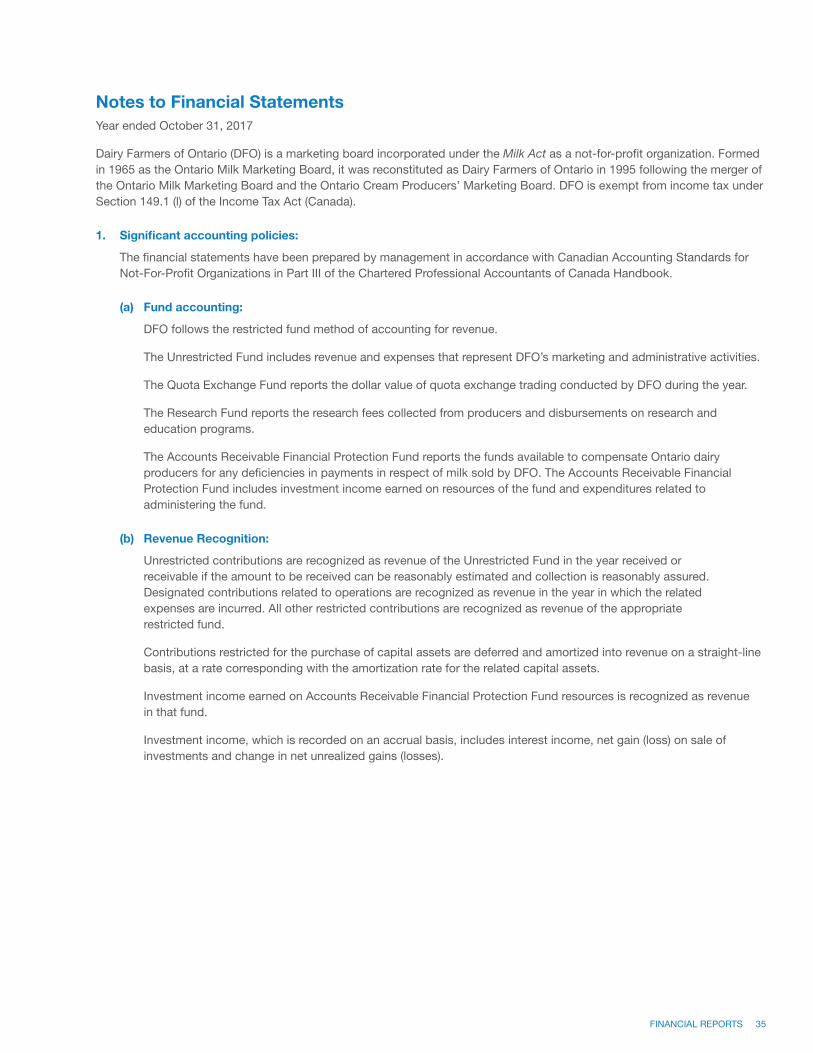
FINANCIAL REPORTS 35
Notes to Financial StatementsYear ended October 31, 2017
Dairy Farmers of Ontario (DFO) is a marketing board incorporated under the Milk Act as a not-for-profit organization. Formed in 1965 as the Ontario Milk Marketing Board, it was reconstituted as Dairy Farmers of Ontario in 1995 following the merger of the Ontario Milk Marketing Board and the Ontario Cream Producers’ Marketing Board. DFO is exempt from income tax under Section 149.1 (l) of the Income Tax Act (Canada).
1. Significant accounting policies:
The financial statements have been prepared by management in accordance with Canadian Accounting Standards for Not-For-Profit Organizations in Part III of the Chartered Professional Accountants of Canada Handbook.
(a) Fund accounting:
DFO follows the restricted fund method of accounting for revenue.
The Unrestricted Fund includes revenue and expenses that represent DFO’s marketing and administrative activities.
The Quota Exchange Fund reports the dollar value of quota exchange trading conducted by DFO during the year.
The Research Fund reports the research fees collected from producers and disbursements on research and education programs.
The Accounts Receivable Financial Protection Fund reports the funds available to compensate Ontario dairy producers for any deficiencies in payments in respect of milk sold by DFO. The Accounts Receivable Financial Protection Fund includes investment income earned on resources of the fund and expenditures related to administering the fund.
(b) Revenue Recognition:
Unrestricted contributions are recognized as revenue of the Unrestricted Fund in the year received or receivable if the amount to be received can be reasonably estimated and collection is reasonably assured. Designated contributions related to operations are recognized as revenue in the year in which the related expenses are incurred. All other restricted contributions are recognized as revenue of the appropriate restricted fund.
Contributions restricted for the purchase of capital assets are deferred and amortized into revenue on a straight-line basis, at a rate corresponding with the amortization rate for the related capital assets.
Investment income earned on Accounts Receivable Financial Protection Fund resources is recognized as revenue in that fund.
Investment income, which is recorded on an accrual basis, includes interest income, net gain (loss) on sale of investments and change in net unrealized gains (losses).
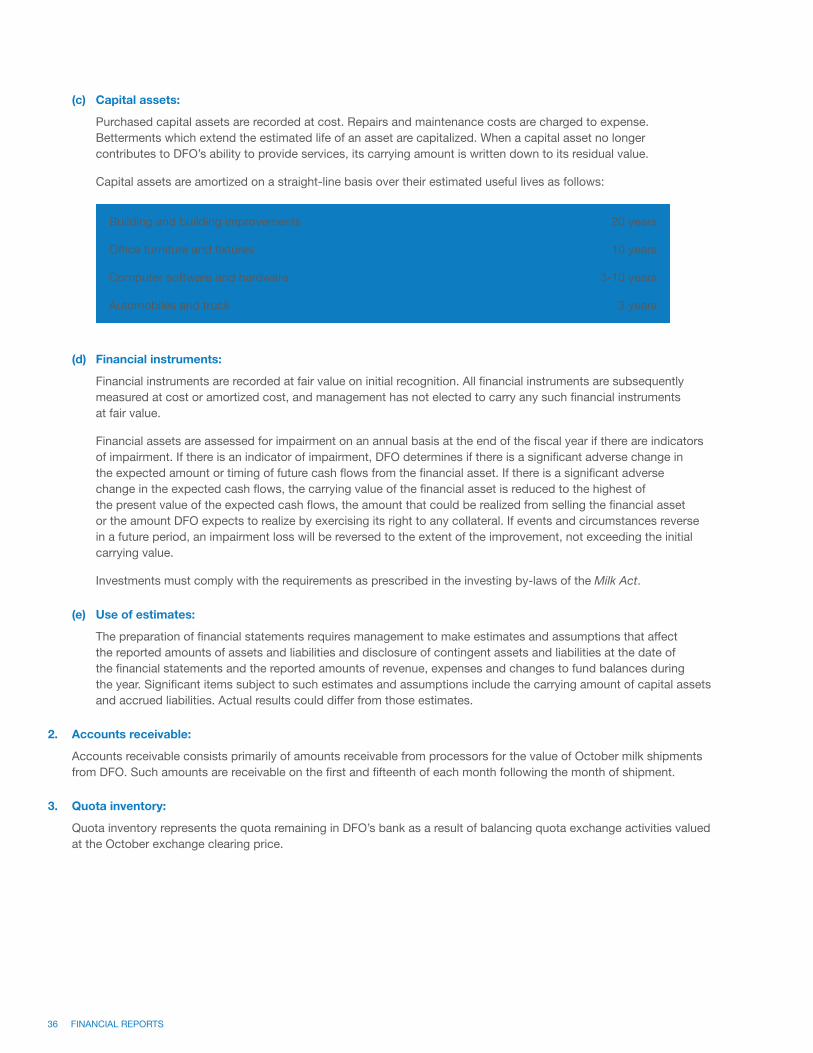
36 FINANCIAL REPORTS
(c) Capital assets:
Purchased capital assets are recorded at cost. Repairs and maintenance costs are charged to expense. Betterments which extend the estimated life of an asset are capitalized. When a capital asset no longer contributes to DFO’s ability to provide services, its carrying amount is written down to its residual value.
Capital assets are amortized on a straight-line basis over their estimated useful lives as follows:
(d) Financial instruments:
Financial instruments are recorded at fair value on initial recognition. All financial instruments are subsequently measured at cost or amortized cost, and management has not elected to carry any such financial instruments at fair value.
Financial assets are assessed for impairment on an annual basis at the end of the fiscal year if there are indicators of impairment. If there is an indicator of impairment, DFO determines if there is a significant adverse change in the expected amount or timing of future cash flows from the financial asset. If there is a significant adverse change in the expected cash flows, the carrying value of the financial asset is reduced to the highest of the present value of the expected cash flows, the amount that could be realized from selling the financial asset or the amount DFO expects to realize by exercising its right to any collateral. If events and circumstances reverse in a future period, an impairment loss will be reversed to the extent of the improvement, not exceeding the initial carrying value.
Investments must comply with the requirements as prescribed in the investing by-laws of the Milk Act.
(e) Use of estimates:
The preparation of financial statements requires management to make estimates and assumptions that affect the reported amounts of assets and liabilities and disclosure of contingent assets and liabilities at the date of the financial statements and the reported amounts of revenue, expenses and changes to fund balances during the year. Significant items subject to such estimates and assumptions include the carrying amount of capital assets and accrued liabilities. Actual results could differ from those estimates.
2. Accounts receivable:
Accounts receivable consists primarily of amounts receivable from processors for the value of October milk shipments from DFO. Such amounts are receivable on the first and fifteenth of each month following the month of shipment.
3. Quota inventory:
Quota inventory represents the quota remaining in DFO’s bank as a result of balancing quota exchange activities valued at the October exchange clearing price.
Building and building improvements
Of�ce furniture and �xtures
Computer software and hardware
Automobiles and truck
20 years
10 years
3-10 years
3 years
FINANCIAL REPORTS 37
4. Investments
(a) Short-term investments:
Short-term investments consist of fixed income securities earning interest at 2.0% and 1.66% (2016 – 1.76%) and maturing on November 24, 2017 and November 27, 2017 (2016 - November 24, 2016).
(b) Long-term investments:
Long-term investments are composed of two low volatility principal deposit notes with maturity dates on December 2, 2022 and December 2, 2023 (2016-November 24, 2017 and December 2, 2022) at interest rates of 0.5% (2016 - 0.5%).
An amount of $4,949,996 (2016 – $4,960,211) comprised of both – the short and long term investments, in aggregate is internally restricted for the purposes of the Accounts Receivable Protection Fund.
(c) Investment income:
Investment income in the Statement of Operations – Unrestricted is comprised of:
(d) Risk management:
Risk management relates to the understanding and active management of risks associated with all areas of the business and the associated operating environment. Investments are primarily exposed to interest rate and market risk. DFO has formal policies and procedures that establish target asset mix. DFO’s policies limit investments to bonds that are guaranteed by the Government of Canada and other investments as provided in the investing by-laws of the Milk Act. There has been no change to the risk exposure from 2016.
Interest rate risk arises from the possibility that changes in interest rates will affect the value of fixed income securities held by DFO.
Market risk arises as a result of trading in fixed income securities. Fluctuations in the market expose DFO to a risk of loss. DFO mitigates this risk through controls to monitor and limit concentration levels.
Credit risk refers to the risk that counterparty may default on its contractual obligations. This risk is mitigated by the Accounts Receivable Protection Fund.
2017 2016
Fixed income securities $ 5,000,000 $ 4,000,000
Shares of producer co-operative 131 131
$ 5,000,131 $ 4,000,131
2017 2016
Interest income $ 466,480 $ 449,669
Allocation to Accounts Receivable (50,015) (70,801)Financial Protection Fund
$ 416,465 $ 378,868
38 FINANCIAL REPORTS
5. Capital assets:
Included in computer software and hardware are assets under construction totaling $4,172,979 (2016 - $3,415,423) relating to the new business software.
6. Accounts payable and accrued liabilities:
Accounts payable and accrued liabilities include amounts payable to producers and transporters for the value of October milk shipments to DFO. Payments to producers are made on the first and fifteenth of each month following the month of shipment.
Included in accounts payable and accrued liabilities are government remittances payable of $82,764 (2016 – $91,226) relating to payroll taxes, health taxes and workers’ safety insurance.
2017 2016
Cost Accumulated Net book Net book amortization value value
Land $ 506,203 – $ 506,203 $ 506,203
Building and building 3,220,249 2,511,729 708,520 750,134improvements
Of�ce furniture 905,647 624,649 280,998 302,439and �xtures
Computer software 8,756,718 3,927,290 4,829,428 4,036,450and hardware
Automobiles and truck 858,853 535,592 323,261 188,532
$ 14,247,670 7,599,260 $ 6,648,410 $ 5,783,758
FINANCIAL REPORTS 39
2017 2016
Milk Value
Sales $ 2,268,605,435 $ 2,085,365,719
Purchases 2,268,628,152 2,085,355,838
(22,717) 9,881
Recoverable from producers, (33,129) (43,010) beginning of year
Recoverable from producers, (55,846) (33,129) end of year
Transportation
Recovered from producers 81,132,801 $ 76,012,948
Expenses 81,175,440 $ 75,888,695
(42,639) 124,253
Payable to (Recoverable from) producers, 17,506 (106,747) beginning of year
(Recoverable from) Payable to producers, (25,133) 17,506 end of year
Recoverable from producers, $ (80,979) $ (15,623) end of year
2017 2016
Balance, beginning of year $ 1,057,500 $ 1,117,500
Less amortization of deferred capital contributions (60,000) (60,000)
$ 997,500 1,057,500
7. Milk and Transportation Pool Operations:
Included in accounts payable and accrued liabilities is the net amount payable to or recoverable from producers in respect of pool operations.
8. Deferred capital contributions:
These contributions relate to funds received through the Traceability Foundations Initiative (TFI) Contribution Agreement. Under this Agreement, DFO partnered with a dairy processor and further processor to develop an electronic system that enables forward and backward traceability throughout the dairy sector. The Agreement provided DFO with $1,422,501, of which $1,237,500 of the contributions related to capital. These amounts are accounted for as deferred capital contributions and are amortized and recognized in income over a period of five to 10 years to match the useful life of the related transporter handheld devices and the new business software.
40 FINANCIAL REPORTS
9. Management of capital:
DFO defines its capital as the amounts included in its fund balances. DFO’s objective when managing its capital is to safeguard its ability to continue as a going concern so that it can continue to provide the appropriate level of benefits and services to the producers.
A portion of DFO’s capital is restricted in that DFO is required to meet certain requirements in order to utilize its externally restricted funds, as described in note 1. DFO has been in compliance with these restrictions throughout the year. DFO sets the amount of internally restricted funds in proportion to risk, manages the net asset structure and makes adjustments to it in light of changes in economic conditions and the risk characteristics of the underlying assets. During the year the Board approved two licence fee holidays.
10. Administrative licence fees:
Licence fees for administrative purposes remained at 63.5 cents per hectolitre on milk marketed by DFO. CQM licence fee remained unchanged at 2.0 cents per hectolitre.
11. Other revenue:
Other revenue includes property rental income, administrative service fees charged to other third parties and amortization of deferred capital contributions.
12. Promotion fees collected and paid to Dairy Farmers of Canada (“DFC”):
During the year, $44,139,897 (2016– $41,578,645) was collected from producers at a rate of $1.50 per hectolitre for promotion (2016-$1.50 per hectolitre). In prior years the Board approved the reduction in the flow through of these funds to DFC to a level sufficient to fund the approved DFC promotion budget. Included in accounts payable and accrued liabilities is $1,560,469 (2016 -$1,757,686) representing unspent funds withheld. The Board is currently reviewing its options for the use of these promotion funds.
13. CanWest DHI:
Levies collected for remittance to CanWest DHI remain unchanged at 6.0 cents per hectolitre on all milk shipments to DFO. During the year, $1,765,622 (2016– $1,663,168) was collected from producers and remitted to CanWest DHI.
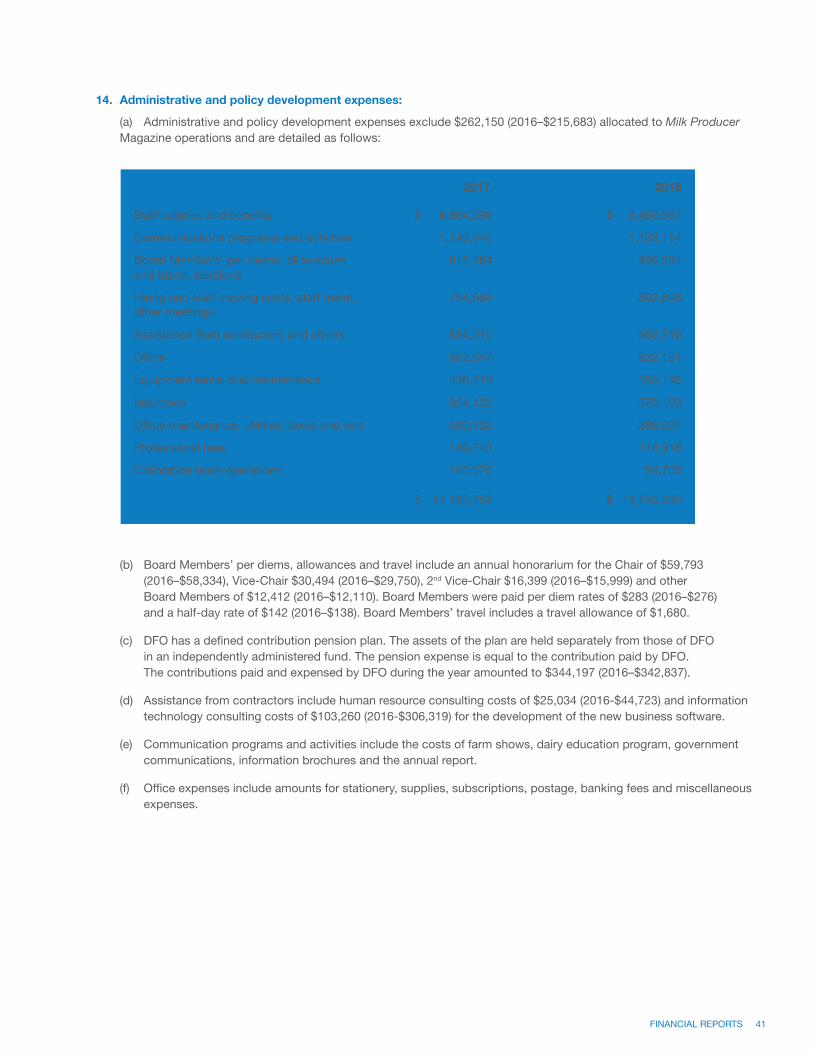
FINANCIAL REPORTS 41
2017 2016
Staff salaries and bene�ts $ 8,884,096 $ 8,460,987
Communications programs and activities 1,140,940 1,138,154
Board Members’ per diems, allowances 815,184 936,594and travel, elections
Hiring and staff moving costs, staff travel, 794,584 802,698other meetings
Assistance from contractors and others 584,015 683,716
Of�ce 582,647 632,191
Equipment rental and maintenance 436,713 555,145
Insurance 364,122 370,192
Of�ce maintenance, utilities, taxes and rent 340,132 386,037
Professional fees 149,743 114,916
Calibration truck operations 100,576 54,705
$ 14,192,752 $ 14,135,335
14. Administrative and policy development expenses:
(a) Administrative and policy development expenses exclude $262,150 (2016–$215,683) allocated to Milk Producer Magazine operations and are detailed as follows:
(b) Board Members’ per diems, allowances and travel include an annual honorarium for the Chair of $59,793 (2016–$58,334), Vice-Chair $30,494 (2016–$29,750), 2nd Vice-Chair $16,399 (2016–$15,999) and other Board Members of $12,412 (2016–$12,110). Board Members were paid per diem rates of $283 (2016–$276) and a half-day rate of $142 (2016–$138). Board Members’ travel includes a travel allowance of $1,680.
(c) DFO has a defined contribution pension plan. The assets of the plan are held separately from those of DFO in an independently administered fund. The pension expense is equal to the contribution paid by DFO. The contributions paid and expensed by DFO during the year amounted to $344,197 (2016–$342,837).
(d) Assistance from contractors include human resource consulting costs of $25,034 (2016-$44,723) and information technology consulting costs of $103,260 (2016-$306,319) for the development of the new business software.
(e) Communication programs and activities include the costs of farm shows, dairy education program, government communications, information brochures and the annual report.
(f) Office expenses include amounts for stationery, supplies, subscriptions, postage, banking fees and miscellaneous expenses.
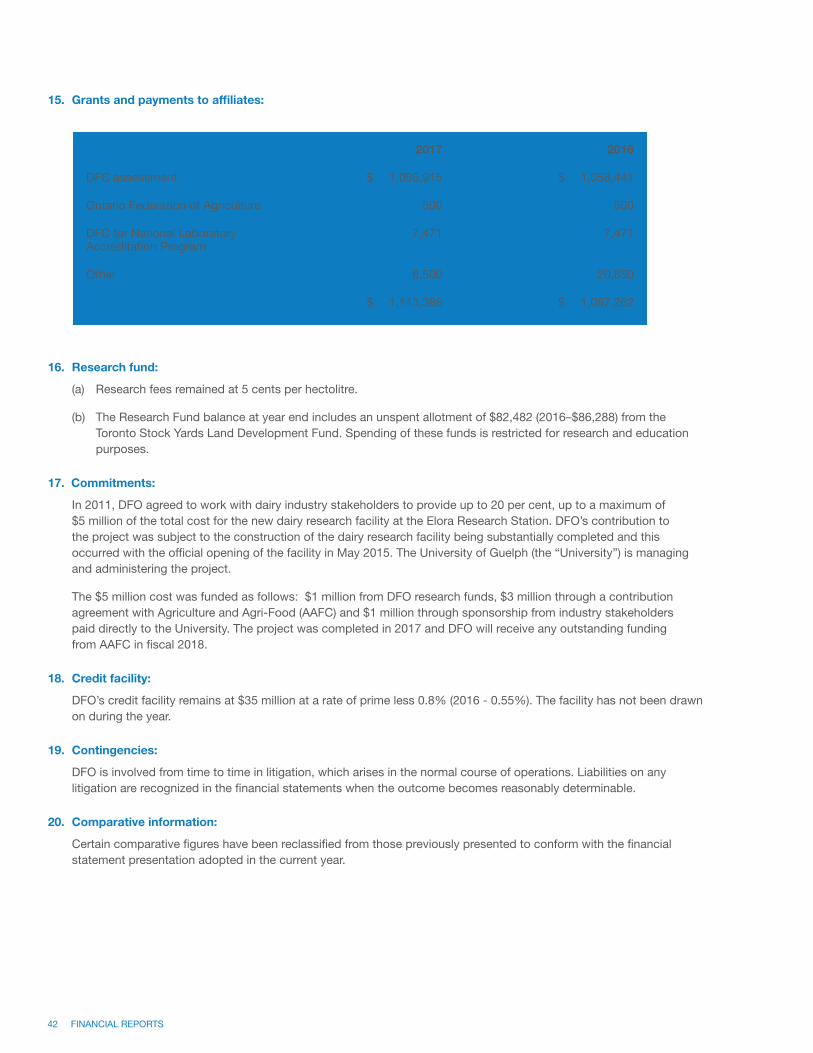
42 FINANCIAL REPORTS
15. Grants and payments to affiliates:
16. Research fund:
(a) Research fees remained at 5 cents per hectolitre.
(b) The Research Fund balance at year end includes an unspent allotment of $82,482 (2016–$86,288) from the Toronto Stock Yards Land Development Fund. Spending of these funds is restricted for research and education purposes.
17. Commitments:
In 2011, DFO agreed to work with dairy industry stakeholders to provide up to 20 per cent, up to a maximum of $5 million of the total cost for the new dairy research facility at the Elora Research Station. DFO’s contribution to the project was subject to the construction of the dairy research facility being substantially completed and this occurred with the official opening of the facility in May 2015. The University of Guelph (the “University”) is managing and administering the project.
The $5 million cost was funded as follows: $1 million from DFO research funds, $3 million through a contribution agreement with Agriculture and Agri-Food (AAFC) and $1 million through sponsorship from industry stakeholders paid directly to the University. The project was completed in 2017 and DFO will receive any outstanding funding from AAFC in fiscal 2018.
18. Credit facility:
DFO’s credit facility remains at $35 million at a rate of prime less 0.8% (2016 - 0.55%). The facility has not been drawn on during the year.
19. Contingencies:
DFO is involved from time to time in litigation, which arises in the normal course of operations. Liabilities on any litigation are recognized in the financial statements when the outcome becomes reasonably determinable.
20. Comparative information:
Certain comparative figures have been reclassified from those previously presented to conform with the financial statement presentation adopted in the current year.
2017 2016
DFC assessment $ 1,096,915 $ 1,058,441
Ontario Federation of Agriculture 500 500
DFC for National Laboratory 7,471 7,471Accreditation Program
Other 8,500 20,850
$ 1,113,386 $ 1,087,262
DFC PROGRAMS & ACTIVITIES 43
DFC ACTIVITIES& PROGRAMS
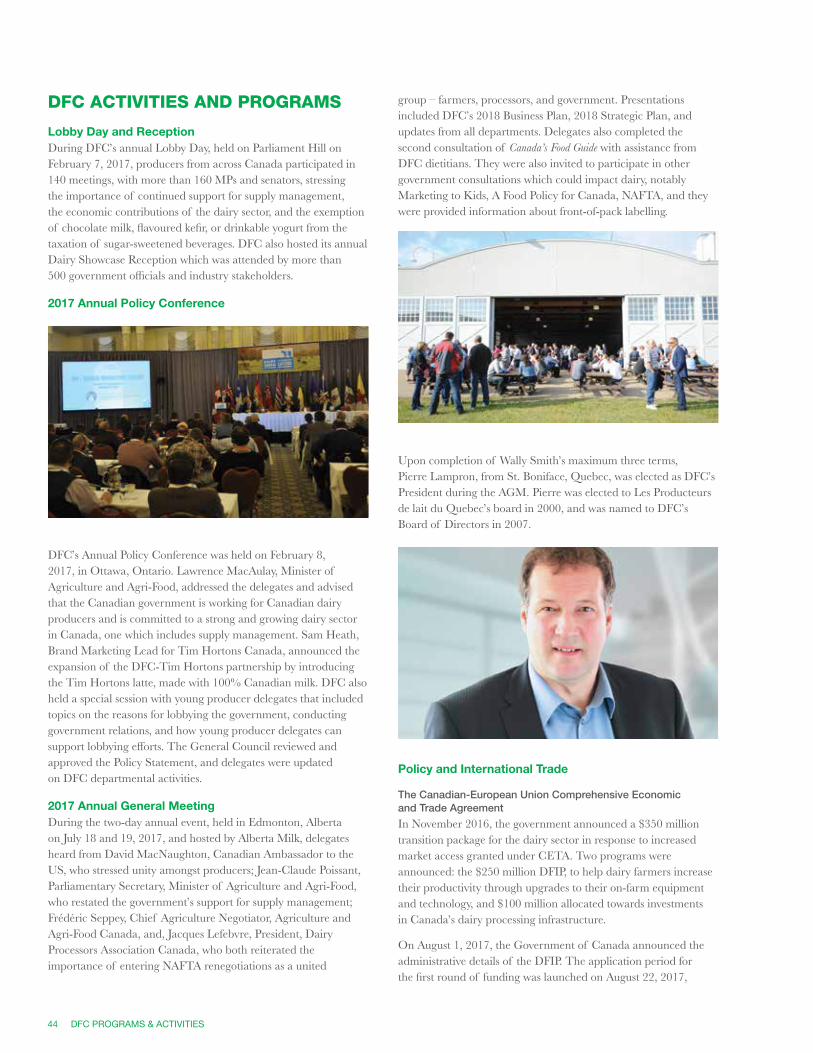
44 DFC PROGRAMS & ACTIVITIES
DFC ACTIVITIES AND PROGRAMS
Lobby Day and ReceptionDuring DFC’s annual Lobby Day, held on Parliament Hill on February 7, 2017, producers from across Canada participated in 140 meetings, with more than 160 MPs and senators, stressing the importance of continued support for supply management, the economic contributions of the dairy sector, and the exemption of chocolate milk, flavoured kefir, or drinkable yogurt from the taxation of sugar-sweetened beverages. DFC also hosted its annual Dairy Showcase Reception which was attended by more than 500 government officials and industry stakeholders.
2017 Annual Policy Conference
DFC’s Annual Policy Conference was held on February 8, 2017, in Ottawa, Ontario. Lawrence MacAulay, Minister of Agriculture and Agri-Food, addressed the delegates and advised that the Canadian government is working for Canadian dairy producers and is committed to a strong and growing dairy sector in Canada, one which includes supply management. Sam Heath, Brand Marketing Lead for Tim Hortons Canada, announced the expansion of the DFC-Tim Hortons partnership by introducing the Tim Hortons latte, made with 100% Canadian milk. DFC also held a special session with young producer delegates that included topics on the reasons for lobbying the government, conducting government relations, and how young producer delegates can support lobbying efforts. The General Council reviewed and approved the Policy Statement, and delegates were updated on DFC departmental activities.
2017 Annual General MeetingDuring the two-day annual event, held in Edmonton, Alberta on July 18 and 19, 2017, and hosted by Alberta Milk, delegates heard from David MacNaughton, Canadian Ambassador to the US, who stressed unity amongst producers; Jean-Claude Poissant, Parliamentary Secretary, Minister of Agriculture and Agri-Food, who restated the government’s support for supply management; Frédéric Seppey, Chief Agriculture Negotiator, Agriculture and Agri-Food Canada, and, Jacques Lefebvre, President, Dairy Processors Association Canada, who both reiterated the importance of entering NAFTA renegotiations as a united
group – farmers, processors, and government. Presentations included DFC’s 2018 Business Plan, 2018 Strategic Plan, and updates from all departments. Delegates also completed the second consultation of Canada’s Food Guide with assistance from DFC dietitians. They were also invited to participate in other government consultations which could impact dairy, notably Marketing to Kids, A Food Policy for Canada, NAFTA, and they were provided information about front-of-pack labelling.
Upon completion of Wally Smith’s maximum three terms, Pierre Lampron, from St. Boniface, Quebec, was elected as DFC’s President during the AGM. Pierre was elected to Les Producteurs de lait du Quebec’s board in 2000, and was named to DFC’s Board of Directors in 2007.
Policy and International Trade
The Canadian-European Union Comprehensive Economic and Trade Agreement
In November 2016, the government announced a $350 million transition package for the dairy sector in response to increased market access granted under CETA. Two programs were announced: the $250 million DFIP, to help dairy farmers increase their productivity through upgrades to their on-farm equipment and technology, and $100 million allocated towards investments in Canada’s dairy processing infrastructure.
On August 1, 2017, the Government of Canada announced the administrative details of the DFIP. The application period for the first round of funding was launched on August 22, 2017,
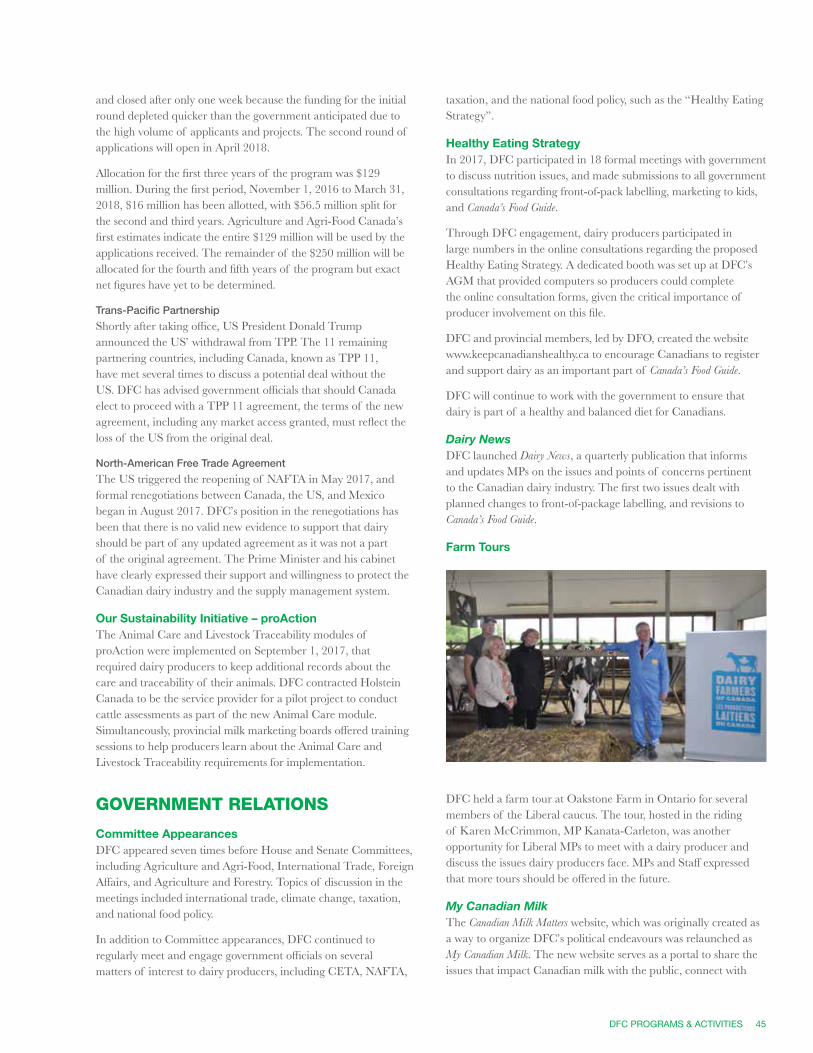
DFC PROGRAMS & ACTIVITIES 45
and closed after only one week because the funding for the initial round depleted quicker than the government anticipated due to the high volume of applicants and projects. The second round of applications will open in April 2018.
Allocation for the first three years of the program was $129 million. During the first period, November 1, 2016 to March 31, 2018, $16 million has been allotted, with $56.5 million split for the second and third years. Agriculture and Agri-Food Canada’s first estimates indicate the entire $129 million will be used by the applications received. The remainder of the $250 million will be allocated for the fourth and fifth years of the program but exact net figures have yet to be determined.
Trans-Pacific Partnership
Shortly after taking office, US President Donald Trump announced the US’ withdrawal from TPP. The 11 remaining partnering countries, including Canada, known as TPP 11, have met several times to discuss a potential deal without the US. DFC has advised government officials that should Canada elect to proceed with a TPP 11 agreement, the terms of the new agreement, including any market access granted, must reflect the loss of the US from the original deal.
North-American Free Trade Agreement
The US triggered the reopening of NAFTA in May 2017, and formal renegotiations between Canada, the US, and Mexico began in August 2017. DFC’s position in the renegotiations has been that there is no valid new evidence to support that dairy should be part of any updated agreement as it was not a part of the original agreement. The Prime Minister and his cabinet have clearly expressed their support and willingness to protect the Canadian dairy industry and the supply management system.
Our Sustainability Initiative – proActionThe Animal Care and Livestock Traceability modules of proAction were implemented on September 1, 2017, that required dairy producers to keep additional records about the care and traceability of their animals. DFC contracted Holstein Canada to be the service provider for a pilot project to conduct cattle assessments as part of the new Animal Care module. Simultaneously, provincial milk marketing boards offered training sessions to help producers learn about the Animal Care and Livestock Traceability requirements for implementation.
GOVERNMENT RELATIONS
Committee AppearancesDFC appeared seven times before House and Senate Committees, including Agriculture and Agri-Food, International Trade, Foreign Affairs, and Agriculture and Forestry. Topics of discussion in the meetings included international trade, climate change, taxation, and national food policy.
In addition to Committee appearances, DFC continued to regularly meet and engage government officials on several matters of interest to dairy producers, including CETA, NAFTA,
taxation, and the national food policy, such as the “Healthy Eating Strategy”.
Healthy Eating StrategyIn 2017, DFC participated in 18 formal meetings with government to discuss nutrition issues, and made submissions to all government consultations regarding front-of-pack labelling, marketing to kids, and Canada’s Food Guide.
Through DFC engagement, dairy producers participated in large numbers in the online consultations regarding the proposed Healthy Eating Strategy. A dedicated booth was set up at DFC’s AGM that provided computers so producers could complete the online consultation forms, given the critical importance of producer involvement on this file.
DFC and provincial members, led by DFO, created the website www.keepcanadianshealthy.ca to encourage Canadians to register and support dairy as an important part of Canada’s Food Guide.
DFC will continue to work with the government to ensure that dairy is part of a healthy and balanced diet for Canadians.
Dairy NewsDFC launched Dairy News, a quarterly publication that informs and updates MPs on the issues and points of concerns pertinent to the Canadian dairy industry. The first two issues dealt with planned changes to front-of-package labelling, and revisions to Canada’s Food Guide.
Farm Tours
DFC held a farm tour at Oakstone Farm in Ontario for several members of the Liberal caucus. The tour, hosted in the riding of Karen McCrimmon, MP Kanata-Carleton, was another opportunity for Liberal MPs to meet with a dairy producer and discuss the issues dairy producers face. MPs and Staff expressed that more tours should be offered in the future.
My Canadian MilkThe Canadian Milk Matters website, which was originally created as a way to organize DFC’s political endeavours was relaunched as My Canadian Milk. The new website serves as a portal to share the issues that impact Canadian milk with the public, connect with

46 DFC PROGRAMS & ACTIVITIES
like-minded advocates, and harness grassroots support for Canada’s food sovereignty. Visit www.mycanadianmilk.ca.
COMMUNICATIONS
Deeply Rooted for a Strong FutureTo commemorate Canada’s 150th anniversary, DFC published a book, Dairy Farmers: Deeply Rooted for a Strong Future, to celebrate the contributions Canadian dairy producers have made to the building and growth of our country. The book traces the emergence of dairy in each Canadian province by featuring a different farm family. In Ontario, the Wert family from Avonmore was profiled. Copies of the book, which were given to all provincial milk marketing organizations for distribution, were printed for every Canadian dairy producer. The book was also distributed to politicians as part of the Lobby Day packages, to targeted stakeholders, and as part of some of DFC’s sponsorship endeavours.
Canada Summer Games
The 2017 Canada Summer Games, hosted in Winnipeg, Manitoba, featured 16 sports, over 250 events, a major cultural festival, and welcomed over 4,000 athletes and coaches and more than 30,000 visitors, was sponsored by DFC. As the National Partner sponsor and presenting sponsor of Athletics, DFC’s brand was present through onsite activations, billboards and signage, print advertising, and commercial broadcasts on TSN throughout the Games.
Sponsorships and Participation in EventsFor the fifth year, DFC sponsored the Canadian Dairy XPO held in Stratford, Ontario. DFC also sponsored the Federation of Canadian Municipalities Annual Conference and Trade Show, and met with municipal leaders to promote supply management and Canadian dairy producers. DFC continued to support the Advancing Women Conference both in Western and Eastern Canada.Other sponsorships included Feed the City, Agriculture Day, Food Bloggers of Canada, the Canadian Farm Writers Forum, Canada’s Outstanding Young Farmers, Agriculture More than Ever, the Food and Drink Summit, and Food Day Canada.
MARKETING
Holiday Cheese CampaignTo build awareness of, and appreciation for, the diversity of Canadian cheeses, while increasing the volume of sales through the holiday season, a national month-long retail campaign was launched in December 2016. The campaign included mass media, retail, and onsite activities. A total of 47,050 samples were distributed during events in Toronto, Halifax, Calgary, and Vancouver.
If it’s made with Canadian Milk – It’s worth crying over
If it’s made with Canadian Milk – It’s worth crying over introduced the new certification mark of origin. A companion website, www.qualitymilk.ca, was launched simultaneously to put the spotlight on all the reasons why Canadian milk is one of the best in the world. The first phase of the campaign captured the public’s imagination through a short film, The Dinner Party, which aired in theatres, television, and online. This was followed by the summer campaign, Happy Campers.
Pour a Tall One The Pour a Tall One campaign presented milk as an adult beverage for male consumers. The winter ad featured a group of men playing hockey while the summer ad featured a group of men playing baseball. The summer ad was featured prominently at the Rogers Centre during Toronto Blue Jays games.
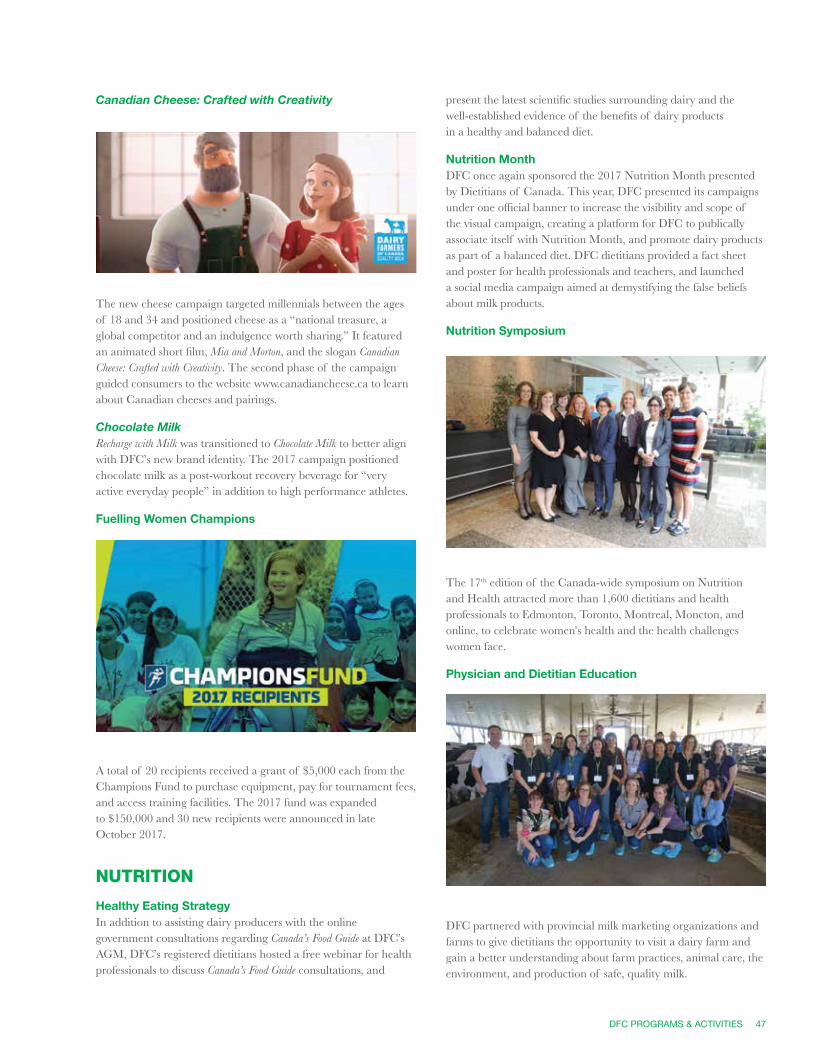
DFC PROGRAMS & ACTIVITIES 47
Canadian Cheese: Crafted with Creativity
The new cheese campaign targeted millennials between the ages of 18 and 34 and positioned cheese as a “national treasure, a global competitor and an indulgence worth sharing.” It featured an animated short film, Mia and Morton, and the slogan Canadian Cheese: Crafted with Creativity. The second phase of the campaign guided consumers to the website www.canadiancheese.ca to learn about Canadian cheeses and pairings.
Chocolate MilkRecharge with Milk was transitioned to Chocolate Milk to better align with DFC’s new brand identity. The 2017 campaign positioned chocolate milk as a post-workout recovery beverage for “very active everyday people” in addition to high performance athletes.
Fuelling Women Champions
A total of 20 recipients received a grant of $5,000 each from the Champions Fund to purchase equipment, pay for tournament fees, and access training facilities. The 2017 fund was expanded to $150,000 and 30 new recipients were announced in late October 2017.
NUTRITION
Healthy Eating StrategyIn addition to assisting dairy producers with the online government consultations regarding Canada’s Food Guide at DFC’s AGM, DFC’s registered dietitians hosted a free webinar for health professionals to discuss Canada’s Food Guide consultations, and
present the latest scientific studies surrounding dairy and the well-established evidence of the benefits of dairy products in a healthy and balanced diet.
Nutrition MonthDFC once again sponsored the 2017 Nutrition Month presented by Dietitians of Canada. This year, DFC presented its campaigns under one official banner to increase the visibility and scope of the visual campaign, creating a platform for DFC to publically associate itself with Nutrition Month, and promote dairy products as part of a balanced diet. DFC dietitians provided a fact sheet and poster for health professionals and teachers, and launched a social media campaign aimed at demystifying the false beliefs about milk products.
Nutrition Symposium
The 17th edition of the Canada-wide symposium on Nutrition and Health attracted more than 1,600 dietitians and health professionals to Edmonton, Toronto, Montreal, Moncton, and online, to celebrate women’s health and the health challenges women face.
Physician and Dietitian Education
DFC partnered with provincial milk marketing organizations and farms to give dietitians the opportunity to visit a dairy farm and gain a better understanding about farm practices, animal care, the environment, and production of safe, quality milk.
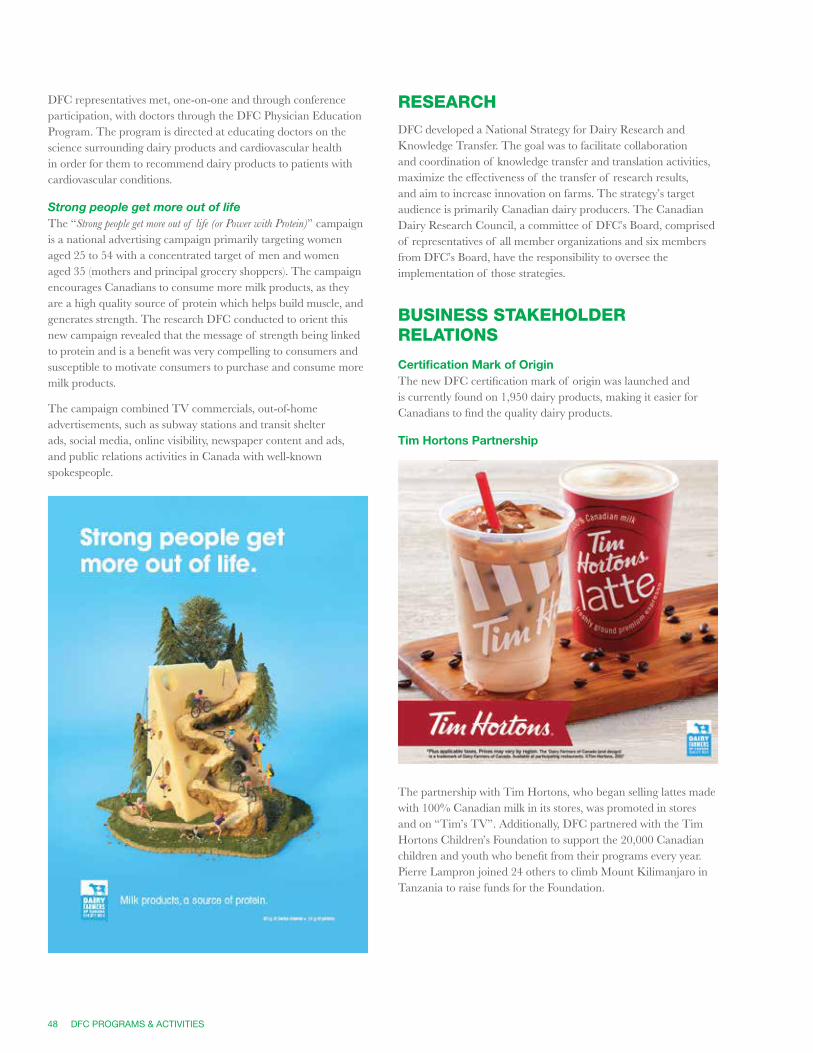
48 DFC PROGRAMS & ACTIVITIES
DFC representatives met, one-on-one and through conference participation, with doctors through the DFC Physician Education Program. The program is directed at educating doctors on the science surrounding dairy products and cardiovascular health in order for them to recommend dairy products to patients with cardiovascular conditions.
Strong people get more out of lifeThe “Strong people get more out of life (or Power with Protein)” campaign is a national advertising campaign primarily targeting women aged 25 to 54 with a concentrated target of men and women aged 35 (mothers and principal grocery shoppers). The campaign encourages Canadians to consume more milk products, as they are a high quality source of protein which helps build muscle, and generates strength. The research DFC conducted to orient this new campaign revealed that the message of strength being linked to protein and is a benefit was very compelling to consumers and susceptible to motivate consumers to purchase and consume more milk products.
The campaign combined TV commercials, out-of-home advertisements, such as subway stations and transit shelter ads, social media, online visibility, newspaper content and ads, and public relations activities in Canada with well-known spokespeople.
RESEARCHDFC developed a National Strategy for Dairy Research and Knowledge Transfer. The goal was to facilitate collaboration and coordination of knowledge transfer and translation activities, maximize the effectiveness of the transfer of research results, and aim to increase innovation on farms. The strategy’s target audience is primarily Canadian dairy producers. The Canadian Dairy Research Council, a committee of DFC’s Board, comprised of representatives of all member organizations and six members from DFC’s Board, have the responsibility to oversee the implementation of those strategies.
BUSINESS STAKEHOLDER RELATIONS
Certification Mark of OriginThe new DFC certification mark of origin was launched and is currently found on 1,950 dairy products, making it easier for Canadians to find the quality dairy products.
Tim Hortons Partnership
The partnership with Tim Hortons, who began selling lattes made with 100% Canadian milk in its stores, was promoted in stores and on “Tim’s TV”. Additionally, DFC partnered with the Tim Hortons Children’s Foundation to support the 20,000 Canadian children and youth who benefit from their programs every year. Pierre Lampron joined 24 others to climb Mount Kilimanjaro in Tanzania to raise funds for the Foundation.
Hard work ...In 2017, Ontario’s 3,586 dairy farms produced nearly 3 billion litres of fresh milk. Quality tested twice, the milk in your glass was transported to a local Ontario dairy processor, where it was pasteurized, packaged, and then delivered to grocery stores. All within about 72 hours.
These everyday acts supported approximately 74,000 jobs in Ontario and contributed nearly $6 billion to our GDP.
Commitment...Each year, Ontario dairy producers donate approximately one million litres of milk to the Ontario Association of Food Banks (OAFB). This year, to celebrate Canada 150, DFO’s Board, on behalf of Ontario’s dairy producers, gave a gift of $150,000 to the OAFB and Gay Lea Foods Co-operative Ltd. offered dairy products to food banks at reduced prices for the
next five years.
Making for some of the best milk in the world. Period.
@DairyOntario /OntarioDairy
Dairy Farmers of Ontario @dairy_farmersont
What goes into a glass of Ontario ?