Embed Size (px)
Citation preview

2016 ANNUAL REPORTWORKING TO STRENGTHEN EVERY COMMUNITY WE SERVE.

Refer to Marketing for copies: Central Bank & Trust Co., 300 West Vine Street, Lexington, KY 40507
OUR SENSE OF COMMUNITY IS AS STRONG INSIDE OUR BANK AS OUTSIDE OF IT.
MISSION STATEMENT
The mission of Central Bancshares is to become Kentucky’s leading, high-performing, community banking
company by empowering our staff to deliver consistently superior service and value to our customers,
shareholders and communities. We will be successful because Central Bankers are our greatest resource
and our most sustainable advantage.
CONTENTS
Financial Highlights 1
Community 2
Letter to our Shareholders, Customers and Communities 4
Management’s Discussion and Analysis 6
Independent Auditor’s Report 12
Consolidated Balance Sheets 13
Consolidated Statements of Income 14
Consolidated Statements of Cash Flows 15
Consolidated Statements of Changes
in Shareholders’ Equity 16
Consolidated Statements of Comprehensive Income 16
Notes to Consolidated Financial Statements 16
Boards of Directors 41
Officers 43
In 2017, the Kentucky Chamber of Commerce and the Kentucky Society for Human
Resource Management (KYSHRM) named Central Bank one of the Best Places to
Work in Kentucky – for the 10th time. The competition encourages and motivates
Kentucky-based companies to improve their workplace environments, resulting in
improved profitability and employee satisfaction.

1
F i n a n c i a l H i g H l i g H t s
As of and for the 12 months ended December 31 (in thousands except share data)
2016 2015 2014 2013 2012RESULTS OF OPERATIONS: Net income $ 17,006 $ 17,138 $ 15,950 $ 12,151 $ 12,881 Net income per share 48.88 49.26 45.84 34.92 37.02 Cash dividends per share 3.00 2.00 1.00 0.00 0.00 Book value per share at year end 683.17 637.37 590.45 554.11 518.24 AT DECEMBER 31: Assets $ 2,298,489 $ 2,192,412 $ 2,107,664 $ 2,092,494 $ 2,175,447 Earning assets 2,167,410 2,062,535 1,969,362 1,946,193 2,000,062 Loans, net 1,771,738 1,658,973 1,624,108 1,602,143 1,645,063 Deposits 1,915,781 1,834,873 1,765,510 1,754,833 1,876,715 Shareholders’ equity 237,689 221,755 205,430 192,788 180,308 AVERAGES: Assets $ 2,241,332 $ 2,144,248 $ 2,083,948 $ 2,108,671 $ 2,142,606 Earning assets 2,113,110 2,009,677 1,940,195 1,955,785 1,970,267 Loans, net 1,693,741 1,609,436 1,611,568 1,565,460 1,626,098 Deposits 1,861,980 1,798,520 1,749,203 1,781,992 1,852,678 Shareholders’ equity 231,295 214,419 200,720 186,890 174,441 PERFORMANCE RATIOS: Return on average assets 0.76% 0.80% 0.77% 0.58% 0.60% Return on average shareholders’ equity 7.35% 7.99% 7.95% 6.50% 7.38% Average shareholders’ equity to average assets 10.32% 10.00% 9.63% 8.86% 8.14% Dividend payout ratio 6.14% 4.06% 2.18% 0.00% 0.00% Net interest margin (tax equivalent) 3.71% 3.66% 3.85% 3.64% 3.74%
CAPITAL RATIOS: Total capital to risk-weighted assets 13.4% 13.8% 13.5% 13.4% 12.4% Tier I capital to risk-weighted assets 12.3% 12.6% 12.2% 12.1% 11.2% Common equity Tier I to risk-weighted assets 11.6% 11.5% N/A N/A N/A Tier I capital to average assets 10.6% 10.7% 10.2% 10.0% 9.3%
FINANCIAL HIGHLIGHTS
Net Income
$18
$17
$16
$15
$14
$13
$12
$11
$10
$9
$8
$7
$6
$5
$4
IN M
ILLI
ON
S
2012 2013 2014 2015 2016
Shareholders’ Equity
$240
$230
$220
$210
$200
$190
$180
$170
$160
$150
$140
IN M
ILLI
ON
S
2012 2013 2014 2015 2016

2
THE PEOPLE IN OUR COMMUNITIES MAKE US STRONGER. WE WORK TO RETURN THE FAVOR.
Central Bank made a leadership gift to Bluegrass Community
and Technical College supporting the school’s BuildSmart
Initiative. The gift was used to build a state-of-the-art classroom
and lab space focused on science education.
BLUEGRASS COMMUNITY AND TECHNICAL COLLEGE
All summer long, Central Bank Thursday Night Live provides
an eclectic blend of live music, local food and beverages
that attracts thousands to downtown Lexington.
THURSDAY NIGHT LIVE

3
Every year, Central Bank is a sponsor of the
Urban League banquet. We have also supported the
organization’s efforts and programs to promote equality
in our communities for over 35 years.
URBAN LEAGUE OF LEXINGTION
In addition to serving as a sponsor of this annual event,
Central Bank holds internal fundraisers – including employee
“Denim Day” – in which all proceeds go to the American
Heart Association.
AMERICAN HEART ASSOCIATION HEART BALL GALA
We hosted our first Financial Literacy Day at Bluegrass
Community and Technical College. This free public event
covered a wide range of financial topics including mortgages,
retirement planning, investments, online and mobile banking,
insurance and information security.
FINANCIAL LITERACY DAY

4
TO OUR SHAREHOLDERS, CUSTOMERS AND COMMUNITIES
Strengthened by more than 70 years of service to Central Kentucky and the Commonwealth, we have become one of the leading community banks in Kentucky. Throughout that time, the bank has been distinguished by its focus on exceptional service to both our customers and communities. The breadth of our financial products has produced new consumer and business relationships, as demonstrated by strong performance across all lines of business in 2016.
As the fourth-largest Kentucky-chartered community bank, we recognize our responsibility to support economic development and community prosperity in these areas we call home. Motivated by this responsibility, we expanded our commercial lending staff in 2016 to stimulate business growth in all our markets, with emphasis on our fastest growth markets, Jefferson County and Northern Kentucky.
Our commitment to the Commonwealth was also underscored by the extension of the Bank’s exclusive corporate partnership as the “Official Bank of UK Athletics” until 2030. In conjunction with our other commitments to the community, Gatton College of Business & Economics and UK Healthcare, we continue to make academics, healthcare and athletics priorities for support. We look forward to the opportunities all our commitments provide us to enrich the lives of a wide range of our community members.
We continue, as always, to focus our efforts on the rapidly developing needs of our customers. As those needs grow and change, we pledge to take an active role in enhancing our service both in person and online, where our customers increasingly go for their banking needs. We are dedicated to their success and will continue to work even harder to ensure we consistently outperform their expectations.
PERFORMANCEThese financial highlights for the Company include Central Bank & Trust Co. and its subsidiaries, Central Investment Center, Inc., and Central Insurance Services; and Central Bank of Jefferson County. We have provided a detailed discussion of our financial results in the Management’s Discussion and Analysis, beginning on page 6. • Net income stayed constant, at $17,006,000 or $48.88 per share. In 2015 earnings were $17,138,000 or $49.26 per share. • Deposits grew 4.41 percent, ending the year with $1.92 billion, a new record. • Net loans increased by 6.80 percent, ending the year at $1.77 billion, also a new record. • Shareholders’ equity grew to $237.69 million, which highlights our commitment to a solid future for our Company. • Service shops are conducted in our banking centers on a quarterly basis to ensure we are meeting and exceeding customer expectations. In 2016, we reached record levels for service shop performance.These results leave us poised for another successful year, where we will continue to strive for even better performance as our customers engage in opportunities presented by an improved economy.
PRODUCTSIn the last several years, our dedicated Operations staff has worked diligently to keep pace with continuously evolving online and mobile banking products for consumers and businesses. We can offer the latest technology and convenience to our customers as a direct result of their concentrated efforts. A primary step was the introduction of everyday, extended service for debit and credit cards.
As part of this digital growth, we continue to recognize the importance of maintaining the highest level of security for our customers and their information. In 2015, our commitment to security was evidenced by the introduction of chip-card technology for our debit and credit cards. In the last year, we continued to expand customer acceptance with the addition of secure payment alternatives, such as Apple Pay,™ and the release of customer-driven card-control and monitoring options, such as CardValet® and Visa® Purchase Alerts.
Another exciting development was the addition of uChoose Rewards® for Central debit-card customers. As part of the program, all Central Bank debit-card customers were enrolled to earn points for debit-card purchases, which allowed us to benefit a significant number of Central Bank customers.

5
Additional efforts to serve more of our customers’ growing needs continue to be led by our Mortgage, Wealth Management, Insurance and Investment staffs. Their success has served not only to strengthen our reputation as a leader in the banking industry, but also to solidify our position as a full-service financial institution. Through exceptional and consistent customer service, along with the latest technology and financial tools, we continue to surpass expectations across all our service lines.
LOOKING FORWARDYet again, Central Bank is in a strategically enviable position to continue growing in 2017. With customer service that remains unmatched by any of our competitors, continued advances within online and mobile banking, an expanding lending capacity and an unwavering focus on the communities we serve, we are positioned to deliver another successful year.
With this in mind, plans are underway for the expansion of the Bank’s social media presence, as we appreciate that this is a platform our customers increasingly visit for their information. Whether customers choose to deal with Central Bank in one of our banking centers, by phone or online, we will expand opportunities for service and communication at the times and places best suited to their needs.
RETIREESIn the last year, nine long-term employees completed their service to reach well-earned retirements. Jane Tucker (Loan Services, 36 years), Carolyn Bishop (Wealth Management, 28 years), Julie Moberly (Wealth Management, 23 years), Cindy Hutchinson (Central Insurance Services, 19 years), Denise Wilson (Louisville – Commercial Lending, 18 years), Michael Withers (Operations, 17 years), Judy Updike (Louisville – Private Banking, 13 years), Tom Porter (Nicholasville – Commercial Lending, 11 years) and Carol Helvey (Retail Banking, nine years) were dedicated Central Bankers who served our Bank and their customers with distinction. We honor their service and congratulate them on their achievements.
WITH APPRECIATIONThe continued support and guidance of our directors have been critical to our success. Their collective experience and expertise serve as an exceptional resource, offering a powerful insight and connection to our local markets. Without the leadership of our directors, we would not be successful.
As always, I am honored to be able to say that our Bank is in the hands of the most competent and caring staff. Our Central Bankers are the foundation of this Company, and I am so grateful to them for their commitment to service and to our customers. For that reason, we are honored to be recognized as a 2017 Best Place to Work in Kentucky.
Most important, I would like to thank our customers. Their loyalty and dedication make Central Bank the trusted community bank that is celebrated statewide. They never cease to recognize our tireless efforts to serve them, and for that we are eternally grateful. I am honored to serve an exceptional team of employees and wonderful customers as I look forward to the promising years to come.
Chairman, President & CEOMarch 15, 2017
Luther Deaton, Jr.
6
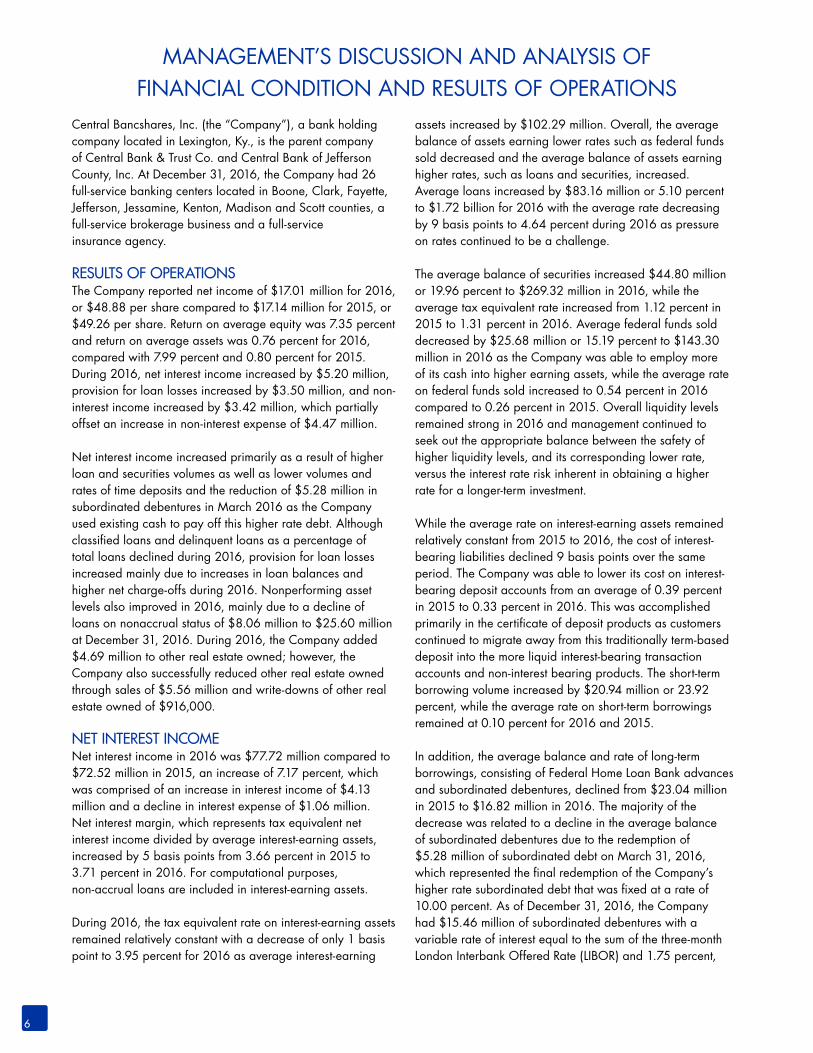
Central Bancshares, Inc. (the “Company”), a bank holding company located in Lexington, Ky., is the parent company of Central Bank & Trust Co. and Central Bank of Jefferson County, Inc. At December 31, 2016, the Company had 26 full-service banking centers located in Boone, Clark, Fayette, Jefferson, Jessamine, Kenton, Madison and Scott counties, a full-service brokerage business and a full-service insurance agency.
RESULTS OF OPERATIONSThe Company reported net income of $17.01 million for 2016, or $48.88 per share compared to $17.14 million for 2015, or $49.26 per share. Return on average equity was 7.35 percent and return on average assets was 0.76 percent for 2016, compared with 7.99 percent and 0.80 percent for 2015. During 2016, net interest income increased by $5.20 million, provision for loan losses increased by $3.50 million, and non-interest income increased by $3.42 million, which partially offset an increase in non-interest expense of $4.47 million.
Net interest income increased primarily as a result of higher loan and securities volumes as well as lower volumes and rates of time deposits and the reduction of $5.28 million in subordinated debentures in March 2016 as the Company used existing cash to pay off this higher rate debt. Although classified loans and delinquent loans as a percentage of total loans declined during 2016, provision for loan losses increased mainly due to increases in loan balances and higher net charge-offs during 2016. Nonperforming asset levels also improved in 2016, mainly due to a decline of loans on nonaccrual status of $8.06 million to $25.60 million at December 31, 2016. During 2016, the Company added $4.69 million to other real estate owned; however, the Company also successfully reduced other real estate owned through sales of $5.56 million and write-downs of other real estate owned of $916,000. NET INTEREST INCOMENet interest income in 2016 was $77.72 million compared to $72.52 million in 2015, an increase of 7.17 percent, which was comprised of an increase in interest income of $4.13 million and a decline in interest expense of $1.06 million. Net interest margin, which represents tax equivalent net interest income divided by average interest-earning assets, increased by 5 basis points from 3.66 percent in 2015 to 3.71 percent in 2016. For computational purposes, non-accrual loans are included in interest-earning assets.
During 2016, the tax equivalent rate on interest-earning assets remained relatively constant with a decrease of only 1 basis point to 3.95 percent for 2016 as average interest-earning
assets increased by $102.29 million. Overall, the average balance of assets earning lower rates such as federal funds sold decreased and the average balance of assets earning higher rates, such as loans and securities, increased. Average loans increased by $83.16 million or 5.10 percent to $1.72 billion for 2016 with the average rate decreasing by 9 basis points to 4.64 percent during 2016 as pressure on rates continued to be a challenge.
The average balance of securities increased $44.80 million or 19.96 percent to $269.32 million in 2016, while the average tax equivalent rate increased from 1.12 percent in 2015 to 1.31 percent in 2016. Average federal funds sold decreased by $25.68 million or 15.19 percent to $143.30 million in 2016 as the Company was able to employ more of its cash into higher earning assets, while the average rate on federal funds sold increased to 0.54 percent in 2016 compared to 0.26 percent in 2015. Overall liquidity levels remained strong in 2016 and management continued to seek out the appropriate balance between the safety of higher liquidity levels, and its corresponding lower rate, versus the interest rate risk inherent in obtaining a higher rate for a longer-term investment.
While the average rate on interest-earning assets remained relatively constant from 2015 to 2016, the cost of interest-bearing liabilities declined 9 basis points over the same period. The Company was able to lower its cost on interest-bearing deposit accounts from an average of 0.39 percent in 2015 to 0.33 percent in 2016. This was accomplished primarily in the certificate of deposit products as customers continued to migrate away from this traditionally term-based deposit into the more liquid interest-bearing transaction accounts and non-interest bearing products. The short-term borrowing volume increased by $20.94 million or 23.92 percent, while the average rate on short-term borrowings remained at 0.10 percent for 2016 and 2015.
In addition, the average balance and rate of long-term borrowings, consisting of Federal Home Loan Bank advances and subordinated debentures, declined from $23.04 million in 2015 to $16.82 million in 2016. The majority of the decrease was related to a decline in the average balance of subordinated debentures due to the redemption of $5.28 million of subordinated debt on March 31, 2016, which represented the final redemption of the Company’s higher rate subordinated debt that was fixed at a rate of 10.00 percent. As of December 31, 2016, the Company had $15.46 million of subordinated debentures with a variable rate of interest equal to the sum of the three-month London Interbank Offered Rate (LIBOR) and 1.75 percent,
MANAGEMENT’S DISCUSSION AND ANALYSIS OF FINANCIAL CONDITION AND RESULTS OF OPERATIONS
7
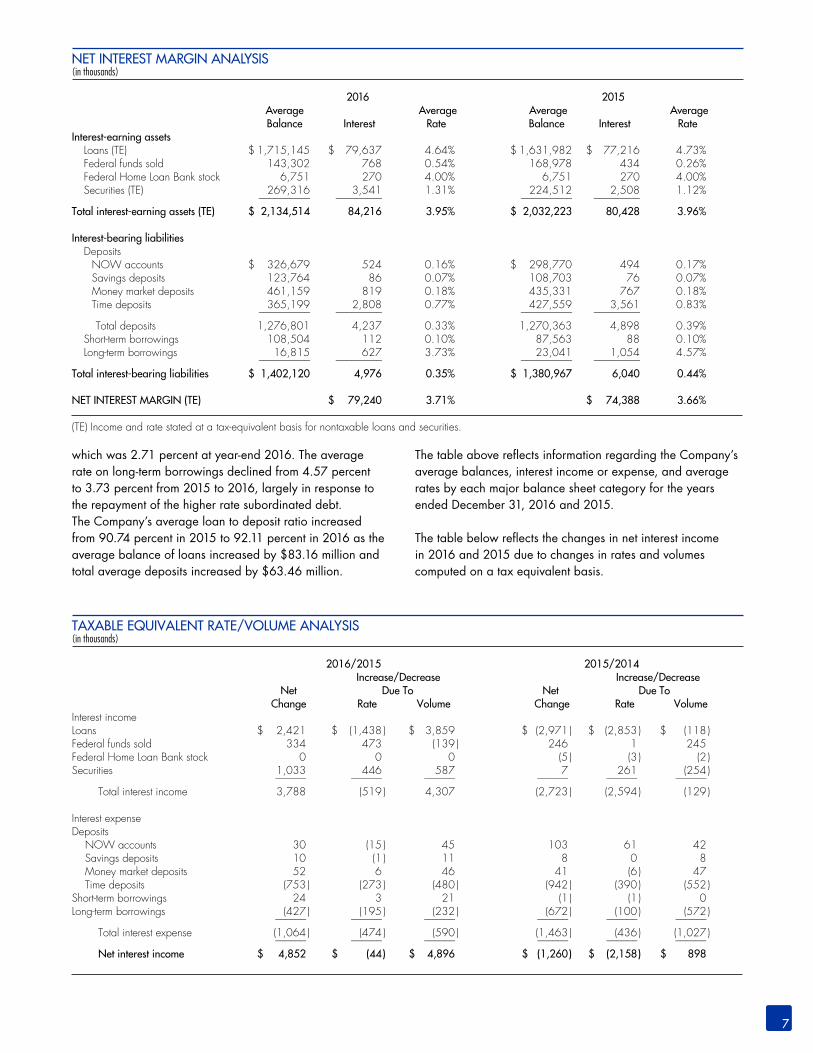
NET INTEREST MARGIN ANALYSIS (in thousands) 2016 2015 Average Average Average Average Balance Interest Rate Balance Interest Rate Interest-earning assets Loans (TE) $ 1,715,145 $ 79,637 4.64% $ 1,631,982 $ 77,216 4.73% Federal funds sold 143,302 768 0.54% 168,978 434 0.26% Federal Home Loan Bank stock 6,751 270 4.00% 6,751 270 4.00% Securities (TE) 269,316 3,541 1.31% 224,512 2,508 1.12% –––––––––– ––––––––– –––––––––– ––––––––– Total interest-earning assets (TE) $ 2,134,514 84,216 3.95% $ 2,032,223 80,428 3.96% Interest-bearing liabilities Deposits NOW accounts $ 326,679 524 0.16% $ 298,770 494 0.17% Savings deposits 123,764 86 0.07% 108,703 76 0.07% Money market deposits 461,159 819 0.18% 435,331 767 0.18% Time deposits 365,199 2,808 0.77% 427,559 3,561 0.83% –––––––––– ––––––––– –––––––––– ––––––––– Total deposits 1,276,801 4,237 0.33% 1,270,363 4,898 0.39% Short-term borrowings 108,504 112 0.10% 87,563 88 0.10% Long-term borrowings 16,815 627 3.73% 23,041 1,054 4.57% –––––––––– ––––––––– –––––––––– ––––––––– Total interest-bearing liabilities $ 1,402,120 4,976 0.35% $ 1,380,967 6,040 0.44% NET INTEREST MARGIN (TE) $ 79,240 3.71% $ 74,388 3.66%
(TE) Income and rate stated at a tax-equivalent basis for nontaxable loans and securities.
TAXABLE EQUIVALENT RATE/VOLUME ANALYSIS(in thousands) 2016/2015 2015/2014 Increase/Decrease Increase/Decrease Net Due To Net Due To Change Rate Volume Change Rate Volume Interest income Loans $ 2,421 $ (1,438 ) $ 3,859 $ (2,971 ) $ (2,853 ) $ (118 )Federal funds sold 334 473 (139 ) 246 1 245 Federal Home Loan Bank stock 0 0 0 (5 ) (3 ) (2 ) Securities 1,033 446 587 7 261 (254 ) –––––– –––––– –––––– –––––– –––––– –––––– Total interest income 3,788 (519 ) 4,307 (2,723 ) (2,594 ) (129 ) Interest expense Deposits NOW accounts 30 (15 ) 45 103 61 42 Savings deposits 10 (1 ) 11 8 0 8 Money market deposits 52 6 46 41 (6 ) 47 Time deposits (753 ) (273 ) (480 ) (942 ) (390 ) (552 ) Short-term borrowings 24 3 21 (1 ) (1 ) 0 Long-term borrowings (427 ) (195 ) (232 ) (672 ) (100 ) (572 ) –––––– –––––– –––––– –––––– –––––– –––––– Total interest expense (1,064 ) (474 ) (590 ) (1,463 ) (436 ) (1,027 ) –––––– –––––– –––––– –––––– –––––– –––––– Net interest income $ 4,852 $ (44 ) $ 4,896 $ (1,260 ) $ (2,158 ) $ 898
which was 2.71 percent at year-end 2016. The average rate on long-term borrowings declined from 4.57 percent to 3.73 percent from 2015 to 2016, largely in response to the repayment of the higher rate subordinated debt.The Company’s average loan to deposit ratio increased from 90.74 percent in 2015 to 92.11 percent in 2016 as the average balance of loans increased by $83.16 million and total average deposits increased by $63.46 million.
The table above reflects information regarding the Company’s average balances, interest income or expense, and average rates by each major balance sheet category for the years ended December 31, 2016 and 2015.
The table below reflects the changes in net interest income in 2016 and 2015 due to changes in rates and volumes computed on a tax equivalent basis.
8
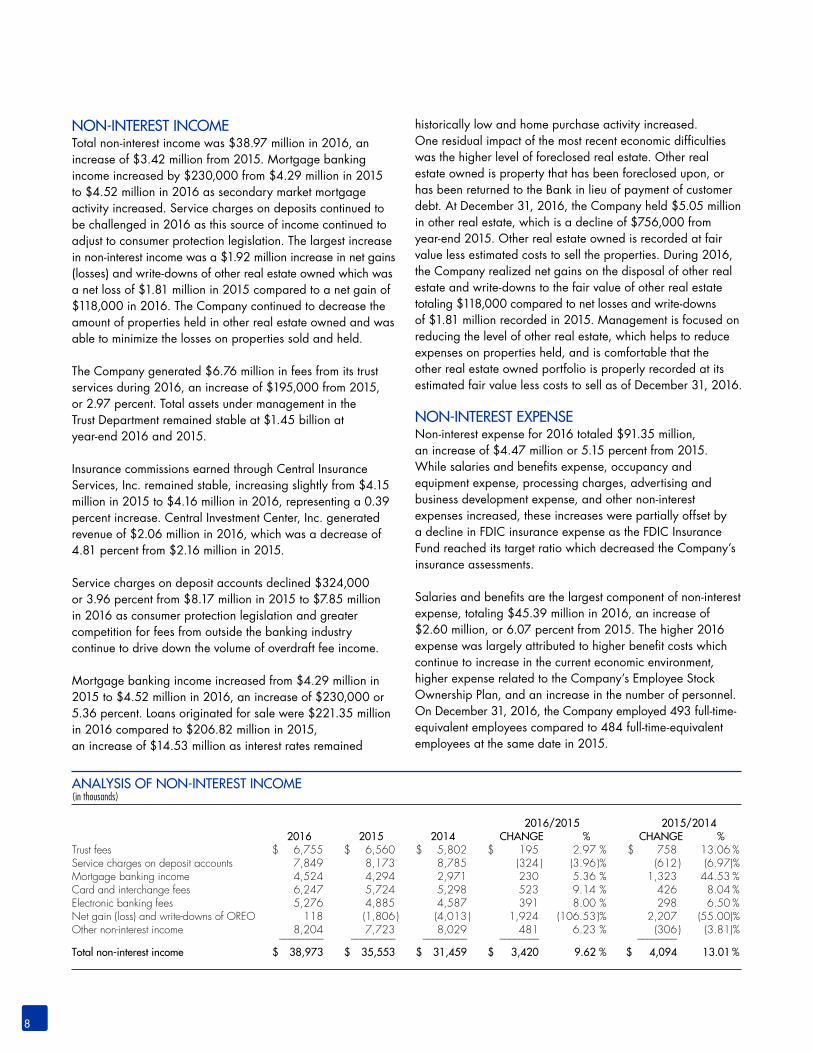
ANALYSIS OF NON-INTEREST INCOME (in thousands)
2016/2015 2015/2014 2016 2015 2014 CHANGE % CHANGE %Trust fees $ 6,755 $ 6,560 $ 5,802 $ 195 2.97 % $ 758 13.06 %Service charges on deposit accounts 7,849 8,173 8,785 (324 ) (3.96 )% (612 ) (6.97 )%Mortgage banking income 4,524 4,294 2,971 230 5.36 % 1,323 44.53 %Card and interchange fees 6,247 5,724 5,298 523 9.14 % 426 8.04 %Electronic banking fees 5,276 4,885 4,587 391 8.00 % 298 6.50 %Net gain (loss) and write-downs of OREO 118 (1,806 ) (4,013 ) 1,924 (106.53 )% 2,207 (55.00 )%Other non-interest income 8,204 7,723 8,029 481 6.23 % (306 ) (3.81 )% ––––––––– ––––––––– ––––––––– –––––––– ––––––––Total non-interest income $ 38,973 $ 35,553 $ 31,459 $ 3,420 9.62 % $ 4,094 13.01 %
NON-INTEREST INCOMETotal non-interest income was $38.97 million in 2016, an increase of $3.42 million from 2015. Mortgage banking income increased by $230,000 from $4.29 million in 2015 to $4.52 million in 2016 as secondary market mortgage activity increased. Service charges on deposits continued to be challenged in 2016 as this source of income continued to adjust to consumer protection legislation. The largest increase in non-interest income was a $1.92 million increase in net gains (losses) and write-downs of other real estate owned which was a net loss of $1.81 million in 2015 compared to a net gain of $118,000 in 2016. The Company continued to decrease the amount of properties held in other real estate owned and was able to minimize the losses on properties sold and held.
The Company generated $6.76 million in fees from its trust services during 2016, an increase of $195,000 from 2015, or 2.97 percent. Total assets under management in the Trust Department remained stable at $1.45 billion at year-end 2016 and 2015.
Insurance commissions earned through Central Insurance Services, Inc. remained stable, increasing slightly from $4.15 million in 2015 to $4.16 million in 2016, representing a 0.39 percent increase. Central Investment Center, Inc. generated revenue of $2.06 million in 2016, which was a decrease of 4.81 percent from $2.16 million in 2015. Service charges on deposit accounts declined $324,000 or 3.96 percent from $8.17 million in 2015 to $7.85 million in 2016 as consumer protection legislation and greater competition for fees from outside the banking industry continue to drive down the volume of overdraft fee income.
Mortgage banking income increased from $4.29 million in 2015 to $4.52 million in 2016, an increase of $230,000 or 5.36 percent. Loans originated for sale were $221.35 million in 2016 compared to $206.82 million in 2015, an increase of $14.53 million as interest rates remained
historically low and home purchase activity increased.One residual impact of the most recent economic difficulties was the higher level of foreclosed real estate. Other real estate owned is property that has been foreclosed upon, or has been returned to the Bank in lieu of payment of customer debt. At December 31, 2016, the Company held $5.05 million in other real estate, which is a decline of $756,000 from year-end 2015. Other real estate owned is recorded at fair value less estimated costs to sell the properties. During 2016, the Company realized net gains on the disposal of other real estate and write-downs to the fair value of other real estate totaling $118,000 compared to net losses and write-downs of $1.81 million recorded in 2015. Management is focused on reducing the level of other real estate, which helps to reduce expenses on properties held, and is comfortable that the other real estate owned portfolio is properly recorded at its estimated fair value less costs to sell as of December 31, 2016.
NON-INTEREST EXPENSENon-interest expense for 2016 totaled $91.35 million, an increase of $4.47 million or 5.15 percent from 2015. While salaries and benefits expense, occupancy and equipment expense, processing charges, advertising and business development expense, and other non-interest expenses increased, these increases were partially offset by a decline in FDIC insurance expense as the FDIC Insurance Fund reached its target ratio which decreased the Company’s insurance assessments.
Salaries and benefits are the largest component of non-interest expense, totaling $45.39 million in 2016, an increase of $2.60 million, or 6.07 percent from 2015. The higher 2016 expense was largely attributed to higher benefit costs which continue to increase in the current economic environment, higher expense related to the Company’s Employee Stock Ownership Plan, and an increase in the number of personnel. On December 31, 2016, the Company employed 493 full-time- equivalent employees compared to 484 full-time-equivalent employees at the same date in 2015.

9
ANALYSIS OF NON-INTEREST EXPENSE (in thousands)
2016/2015 2015/2014 2016 2015 2014 CHANGE % CHANGE %Salaries and benefits $ 45,394 $ 42,795 $ 39,968 $ 2,599 6.07 % $ 2,827 7.07 %Occupancy and equipment 17,950 17,626 17,190 324 1.84 % 436 2.54 %Processing charges 6,474 5,445 5,428 1,029 18.90 % 17 0.31 %Advertising and business development 5,646 5,473 4,544 173 3.16 % 929 20.44 %Professional services 2,283 2,167 2,360 116 5.35 % (193 ) (8.18 )%FDIC insurance expense 1,383 1,707 1,810 (324 ) (18.98 )% (103 ) (5.69 )%Other non-interest expense 12,224 11,668 12,441 556 4.77 % (773 ) (6.21 )% ––––––––– ––––––––– ––––––––– –––––––– ––––––––Total non-interest expense $ 91,354 $ 86,881 $ 83,741 $ 4,473 5.15 % $ 3,140 3.75 %
Processing charges increased by $1.03 million or 18.90 percent, mainly due to increases in Internet banking and ATM processing expenses. In addition, expenses related to credit and debit cards increased, mainly due to enhanced rewards programs offered for customers. As more customers utilize Internet and mobile banking, debit cards, credit cards, and other methods for their transactions besides the physical branch locations, expenses in these categories also increase.
INCOME TAXESThe Company recorded income tax expense of $3.87 million in 2016 compared to $3.10 million in 2015 representing effective tax rates of 18.54 percent for 2016 and 15.31 percent for 2015. The Company’s tax planning strategy includes the holding of municipal securities and the participation in Industrial Revenue Bond lending for nonprofit organizations to increase tax-exempt income. The Company is also a limited partner in 17 low-income housing projects and a historic renovation project for which it receives tax credits, and is an investor in a Community Development Entity for which it receives New Market Tax Credits. It is the culmination of these investing activities which lowers the overall effective tax rate to the levels experienced in 2016 and 2015. FINANCIAL CONDITIONAt December 31, 2016, total assets of the Company were $2.30 billion, an increase of $106.08 million, or 4.84 percent, compared to total assets at December 31, 2015. During 2016, the Company saw its highest loan growth in several years and was able to utilize on-balance sheet liquidity for asset deployment. Earning assets totaled $2.17 billion on December 31, 2016, or 94.30 percent of total assets. The Company’s net loans increased $112.77 million, or 6.80 percent, federal funds sold decreased by $40.10 million, or 28.04 percent, and the securities portfolio increased by $34.96 million, or 14.24 percent.
EARNING ASSETSGross loans outstanding totaled $1.79 billion at December 31, 2016, an increase of $112.01 million, or 6.66 percent. Loan demand in all segments of loans increased during 2016. In particular, the Company was able to increase its presence in the Northern Kentucky market, while continuing the focus of maintaining strong customer relationships in all markets.
The Company is mindful of the importance of managing exposure to credit risk. This is accomplished through diversification of the loan portfolio, not only by loan type, but by industry and customer. Diversification by industry and geographic region within the Company’s loan portfolio helps to maintain acceptable credit risk exposure. Concentrations of credit are monitored on a monthly basis for compliance with internal and external policies. As a result, management believes there is no undue concentration in any single sector.
On-balance sheet liquidity has been at all-time highs in recent years and remained strong in 2016, although the company was able to employ more of its existing cash into higher earning assets during 2016. Total deposits increased by $80.91 million from year-end 2015 to year-end 2016, and management deployed these funds as well as some of the Company’s federal funds sold into securities and loans.
DEPOSITSTotal deposits were $1.92 billion at year-end 2016, an increase of $80.91 million, or 4.41 percent from December 31, 2015. Interest bearing deposits increased by $24.08 million or 1.91 percent year over year, while non-interest bearing deposits increased by $56.83 million from year-end 2015 to year-end 2016, an increase of 9.85 percent.
Management concentrated its efforts on maintaining current customer relationships, while reducing the cost of funding particularly in certificates of deposit. As a result the Company continued to experience significant growth in demand deposit, NOW, money market, and savings balances. The Company

10
offers fixed-rate certificates of deposit with maturities ranging from seven days to five years; however, with the continuing low levels of market rates, demand for these products continues to be low.
SHORT-TERM BORROWINGSShort-term borrowing sources consist primarily of repurchase agreements and sweep accounts of commercial customers. The cash management services offered by the Company continue to be a valued service for our commercial deposit customers. The balance in commercial sweep accounts totaled $105.69 million at December 31, 2016, which was an increase of $11.80 million from $93.89 million at December 31, 2015. These accounts are overnight repurchase agreements requiring a direct pledge from the Company’s investment portfolio.
LONG-TERM BORROWINGSThe Company’s long-term borrowings consist of advances from the Federal Home Loan Bank and subordinated debentures. At December 31, 2016, the Company had $564,000 outstanding in advances from the Federal Home Loan Bank compared to $715,000 at December 31, 2015. The advances outstanding at December 31, 2016 mature between January 2022 and December 2027, and have a weighted average rate of 2.44 percent at December 31, 2016. Each advance is payable at its maturity, with a prepayment penalty. The advances are borrowed under a blanket lien agreement, and are collateralized by Federal Home Loan Bank stock and eligible first mortgage loans.
In March 2005, Central Bancshares KY Statutory Trust I, a trust formed by the Company, closed a pooled private offering of 15,000 trust preferred securities with a liquidation amount of $1,000 per security. The Company issued $15.5 million of subordinated debentures to the trust in exchange for ownership of all of the common security of the trust and the proceeds of the preferred securities sold by the trust. The subordinated debentures mature on June 15, 2035, and have a variable rate of interest equal to the sum of the three-month London Interbank Offered Rate (LIBOR) and 1.75 percent, which was 2.71 percent on December 31, 2016.
In March 2009, Central Bancshares KY Statutory Trust III, a trust formed by the Company, closed a private offering of 22,600 trust preferred securities with a liquidation amount of $1,000 per security. The Company issued $23.3 million of subordinated debentures to the trust in exchange for ownership of all of the common security of the trust and the proceeds of the preferred securities sold by the trust at a fixed rate of 10.00 percent. On March 31, 2014, the Company redeemed $13.2 million of the subordinated debentures,
on March 31, 2015, the Company redeemed $4.8 million, and on March 31, 2016, the Company redeemed the final $5.28 million.
The trust preferred securities are included in Tier 1 capital (with certain limitations applicable) under current regulatory guidelines and interpretations.
ALLOWANCE FOR LOAN LOSSESAt December 31, 2016, the allowance for loan losses was $20.58 million, or 1.15 percent of gross loans outstanding, compared with $21.84 million, or 1.30 percent at December 31, 2015. The provision for loan losses during 2016 was $4.46 million compared to $961,000 during 2015. Higher levels of net charge-offs as well as an increase in gross loans of $112.01 million contributed to the higher level of provision for loan losses in 2016.
The credit quality of the loan portfolio during 2016 demonstrated a marked improvement. Non-performing loans as a percentage of gross loans decreased from 2.13 percent at December 31, 2015 to 1.46 percent at December 31, 2016 and total delinquent loans as a percentage of gross loans decreased from 2.53 percent at December 31, 2015 to 1.92 percent at December 31, 2016. Loans delinquent 90 days or more increased from $22.82 million at December 31, 2015 to $24.99 million at December 31, 2016; however, non-accrual loans declined from $33.66 million at December 31, 2015 to $25.60 million at December 31, 2016. Although net charge-offs in 2016 were $5.72 million compared to $2.16 million in 2015, an increase of $3.56 million, $3.15 million of charge-offs during 2016 were related to one credit. As a result, net charge-offs as a percentage of average loans were 0.33 percent in 2016 compared to 0.13 percent in 2015.
Delinquency
5.00%
4.50%
4.00%
3.50%
3.00%
2.50%
2.00%
1.50%
1.00%
2012 2013 2014 2015 2016

11
In addition, there was improvement in the level of adversely classified loans and the level of impaired loans during 2016. A loan is considered to be impaired when it is probable that all principal and interest amounts will not be collected in accordance with the original loan terms. Loans deemed to be impaired declined from $75.06 million at December 31, 2015 to $72.48 million at December 31, 2016, a decrease of $2.59 million. The provision and allowance for loan losses are based on management’s ongoing review of the loan portfolio and other qualitative factors on a monthly basis and are subject to review by the Board of Directors and the periodic evaluation by various regulatory authorities. While management uses the best information available at the time of the evaluation and is comfortable with the overall adequacy of the allowance for loan losses at December 31, 2016, future adjustments may be necessary if economic conditions worsen or if assumptions in the evaluation differ substantially from actual results.
CAPITALCapital adequacy guidelines of the regulatory agencies, and additionally for banks, prompt corrective action regulations, involve quantitative measures of assets, liabilities, and certain off-balance-sheet items. As of January 1, 2015, new capital
guidelines from the Basel Committee on Banking Supervision (Basel III rules) became effective with all of the requirements being phased in over a multi-year schedule and fully phased in by January 1, 2019. Capital ratios remained strong during 2016, even with the implementation of the new Basel III rules and the redemption of the $5.28 million in subordinated debentures which were part of Tier 1 capital.
In order for a bank holding company to be considered “well capitalized,” a company must maintain a Total capital to risk-weighted assets ratio of 10.0 percent, a Tier I capital to risk-weighted assets ratio of 8.0 percent, a Common Tier 1 equity to risk-weighted assets ratio of 6.5 percent, and a Tier I capital to average assets ratio of 5.0 percent. On December 31, 2016, the Company had a Total capital to risk-weighted assets ratio of 13.4 percent, a Tier I capital to risk-weighted assets ratio of 12.3 percent, a Common Tier 1 equity to risk-weighted assets ratio of 11.6 percent, and a Tier I capital to average assets ratio of 10.6 percent.
ANALYSIS OF ALLOWANCE FOR LOAN LOSSES(in thousands)
2016 2015 2014 2013 2012
Allowance for loan losses Balance January 1 $ 21,840 $ 23,037 $ 23,913 $ 27,480 $ 28,783 Provision for loan losses 4,464 961 3,217 8,775 12,179 Allowance sold with sale of subsidiary - - - (640 ) - Net charge-offs (5,722 ) (2,158 ) (4,093 ) (11,702 ) (13,482 ) –––––––––––– –––––––––––– –––––––––––– –––––––––––– –––––––––––– Balance December 31 $ 20,582 $ 21,840 $ 23,037 $ 23,913 $ 27,480 Average loans, net of unearned income $ 1,715,145 $ 1,631,982 $ 1,635,738 $ 1,592,481 $ 1,656,284 Loans, net of unearned income, at year-end $ 1,792,320 $ 1,680,813 $ 1,647,145 $ 1,626,056 $ 1,672,543 Nonperforming loans at year-end $ 26,245 $ 35,754 $ 37,895 $ 38,389 $ 56,041 Other real estate owned at year-end $ 5,050 $ 5,806 $ 10,332 $ 13,151 $ 20,958 Ratios: Provision for loan losses to average loans 0.26 % 0.06 % 0.20 % 0.55 % 0.74 % Net charge-offs to average loans 0.33 % 0.13 % 0.25 % 0.73 % 0.81 % Allowance for loan losses to loans 1.15 % 1.30 % 1.40 % 1.47 % 1.64 % Allowance for loan losses to nonperforming loans 78.42 % 61.08 % 60.79 % 62.29 % 49.04 % Nonperforming loans to loans 1.46 % 2.13 % 2.30 % 2.36 % 3.35 % Nonperforming assets to total assets 1.43 % 1.90 % 2.29 % 2.46 % 3.54 % Nonperforming assets to shareholders’ equity and allowance for loan losses 12.91 % 17.06 % 21.11 % 23.78 % 37.06 % Total delinquent loans at year-end 1.92 % 2.53 % 2.89 % 2.93 % 4.37 %

12
INDEPENDENT AUDITOR’S REPORT
Board of Directors and ShareholdersCentral Bancshares, Inc.Lexington, Kentucky
REPORT ON THE FINANCIAL STATEMENTS
We have audited the accompanying consolidated financial statements of Central Bancshares, Inc., which comprise the consolidated balance sheets as of December 31, 2016 and 2015, and the related consolidated statements of income, comprehensive income, changes in shareholders’ equity, and cash flows for the years then ended, and the related notes to the consolidated financial statements.
MANAGEMENT’S RESPONSIBILITY FOR THE FINANCIAL STATEMENTS
Management is responsible for the preparation and fair presentation of these consolidated financial statements in accordance with accounting principles generally accepted in the United States of America; this includes the design, implementation, and maintenance of internal control relevant to the preparation and fair presentation of consolidated financial statements that are free from material misstatement, whether due to fraud or error.
AUDITOR’S RESPONSIBILITY
Our responsibility is to express an opinion on these consolidated financial statements based on our audits. We conducted our audits in accordance with auditing standards generally accepted in the United States of America. Those standards require that we plan and perform the audit to obtain reasonable assurance about whether the consolidated financial statements are free from material misstatement.
An audit involves performing procedures to obtain audit evidence about the amounts and disclosures in the consolidated financial statements. The procedures selected depend on the auditor’s judgment, including the assessment of the risks of material misstatement of the consolidated financial statements, whether due to fraud or error. In making those risk assessments, the auditor considers internal control relevant to the entity’s preparation and fair presentation of the consolidated financial statements in order to design audit procedures that are appropriate in the circumstances. An audit also includes evaluating the appropriateness of accounting policies used and the reasonableness of significant accounting estimates made by management, as well as evaluating the overall presentation of the consolidated financial statements.
We believe that the audit evidence we have obtained is sufficient and appropriate to provide a basis for our audit opinion.
OPINION
In our opinion, the consolidated financial statements referred to above present fairly, in all material respects, the financial position of Central Bancshares, Inc. as of December 31, 2016 and 2015, and the results of its operations and its cash flows for the years then ended in accordance with accounting principles generally accepted in the United States of America.
REPORT ON OTHER LEGAL AND REGULATORY REQUIREMENTS
We also have audited in accordance with auditing standards generally accepted in the United States of America, Central Bancshares, Inc.’s internal control over financial reporting as of December 31, 2016, based on criteria established in the Internal Control – Integrated Framework (2013) issued by the Committee of Sponsoring Organizations of the Treadway Commission (COSO) relevant to reporting objectives for the express purpose of meeting the regulatory requirements of Section 112 of the Federal Deposit Insurance Corporation Improvement Act (FDICIA), and our report dated March 3, 2017 expressed an unmodified opinion.
Crowe Horwath LLPLouisville, KentuckyMarch 3, 2017

13
CONSOLIDATED BALANCE SHEETS(in thousands except share data)
December 31 2016 2015
See accompanying notes.
ASSETSCash and due from financial institutions $ 48,514 $ 40,197 Federal funds sold 102,900 143,000 ––––––––––––––– ––––––––––––––– Total cash and cash equivalents 151,414 183,197 Available for sale securities 169,942 117,871 Held to maturity securities 110,604 127,712 ––––––––––––––– ––––––––––––––– Total securities 280,546 245,583 Loans held for sale 5,395 8,148 Loans, net of allowance of $20,582 and $21,840 1,771,738 1,658,973 Premises and equipment, net 33,966 36,925 Other real estate owned 5,050 5,806 Interest receivable 5,422 5,294 Federal Home Loan Bank stock, at cost 6,751 6,751 Goodwill 14,313 14,313 Other intangible assets - 80 Other assets 23,894 27,342 ––––––––––––––– –––––––––––––––Total assets $ 2,298,489 $ 2,192,412 LIABILITIES AND SHAREHOLDERS’ EQUITYDeposits Non-interest bearing $ 633,571 $ 576,745 Interest bearing 1,282,210 1,258,128 ––––––––––––––– ––––––––––––––– Total deposits 1,915,781 1,834,873 Federal funds purchased and repurchase agreements 106,191 94,395 Federal Home Loan Bank advances 564 715 Subordinated debentures 15,464 20,742 Interest payable 219 244 Other liabilities 22,581 19,688 ––––––––––––––– ––––––––––––––– Total liabilities 2,060,800 1,970,657 SHAREHOLDERS’ EQUITYCommon stock, $10 par value, 350,000 shares authorized, 347,922 shares issued 3,479 3,479 Additional paid-in capital 6,890 6,890 Retained earnings 233,557 217,595 Accumulated other comprehensive income (loss) (6,237) (6,209) ––––––––––––––– ––––––––––––––– Total shareholders’ equity 237,689 221,755 ––––––––––––––– –––––––––––––––Total liabilities and shareholders’ equity $ 2,298,489 $ 2,192,412
CONSOLIDATED FINANCIAL STATEMENTS FOR THE YEARSENDED DECEMBER 31, 2016 AND 2015

14
INTEREST AND DIVIDEND INCOMELoans, including fees $ 78,134 $ 75,364 Securities: Taxable 3,497 2,476 Tax-exempt 28 21Federal funds sold and other 1,039 703 ––––––––––––––– ––––––––––––––– 82,698 78,564 INTEREST EXPENSEDeposits 4,237 4,898 Subordinated debentures 491 893Other borrowings 248 249 ––––––––––––––– ––––––––––––––– 4,976 6,040 Net interest income 77,722 72,524 Provision for loan losses 4,464 961 ––––––––––––––– –––––––––––––––Net interest income after provision for loan losses 73,258 71,563 NON-INTEREST INCOMEService charges on deposit accounts 7,849 8,173 Mortgage banking income 4,524 4,294 Card and interchange fees 6,247 5,724 Trust fees 6,755 6,560 Electronic banking 5,276 4,885Net gain (loss) on sales and write-downs of other real estate owned 118 (1,806) Other fees and income 8,204 7,723 ––––––––––––––– ––––––––––––––– 38,973 35,553 NON-INTEREST EXPENSE Salaries and benefits 45,394 42,795 Occupancy and equipment 17,950 17,626 Processing charges 6,474 5,445Advertising and business development 5,646 5,473Card and interchange expenses 4,609 4,182 Professional services 2,283 2,167 FDIC assessment 1,383 1,707Other real estate owned, net 482 450 Other 7,133 7,036 ––––––––––––––– ––––––––––––––– 91,354 86,881 ––––––––––––––– –––––––––––––––Income before income taxes 20,877 20,235 Income taxes 3,871 3,097 ––––––––––––––– –––––––––––––––Net income $ 17,006 $ 17,138 Basic earnings per share $ 48.88 $ 49.26 Weighted average number of common shares outstanding 347,922 347,922
CONSOLIDATED STATEMENTS OF INCOME(in thousands except share data)
See accompanying notes.
Years Ended December 31 2016 2015

15
CONSOLIDATED STATEMENTS OF CASH FLOWS(in thousands except share data)
OPERATING ACTIVITIESNet income $ 17,006 $ 17,138 Adjustments to reconcile net income to net cash from operating activities: Provision for loan losses 4,464 961 Depreciation and amortization 6,784 7,287 Net loss (gain) on sales and write-downs of other real estate owned (118) 1,806 Net gain on sale of loans (4,324) (4,193) Net change in: Loans held for sale 7,077 2,651 Interest receivable (128) (98) Other assets 1,532 723 Interest payable (25) (56) Other liabilities 3,377 2,484 ––––––––––––––– ––––––––––––––– Net cash from operating activities 35,645 28,703
INVESTING ACTIVITIESAvailable for sale securities: Purchases (141,692) (30,155) Sales - 9,967 Maturities, calls and return of principal 88,759 21,728 Held to maturity securities: Purchases (45,000) (74,436) Maturities, calls and return of principal 61,976 36,606 Net change in loans (121,915) (37,657) Purchases of premises and equipment (1,347) (4,090) Proceeds from sale of other real estate owned 5,560 4,551 ––––––––––––––– ––––––––––––––– Net cash from investing activities (153,659) (73,486) FINANCING ACTIVITIESNet change in deposits 80,908 69,363 Net change in federal funds purchased and repurchase agreements 11,796 3,506Repayment of Federal Home Loan Bank advances (151) (2,074)Redemption of subordinated debentures (5,278) (4,800)Cash dividends paid (1,044) (696) ––––––––––––––– ––––––––––––––– Net cash from financing activities 86,231 65,299 ––––––––––––––– –––––––––––––––Net change in cash and cash equivalents (31,783) 20,516 Cash and cash equivalents, beginning of year 183,197 162,681 ––––––––––––––– –––––––––––––––Cash and cash equivalents, end of year $ 151,414 $ 183,197 ––––––––––––––– –––––––––––––––Supplemental cash flow information: Interest paid $ 5,001 $ 6,100 Income taxes paid 2,750 3,240Supplemental noncash disclosures: Transfers from loans to other real estate owned $ 4,686 $ 1,831
See accompanying notes.
Years Ended December 31 2016 2015
16
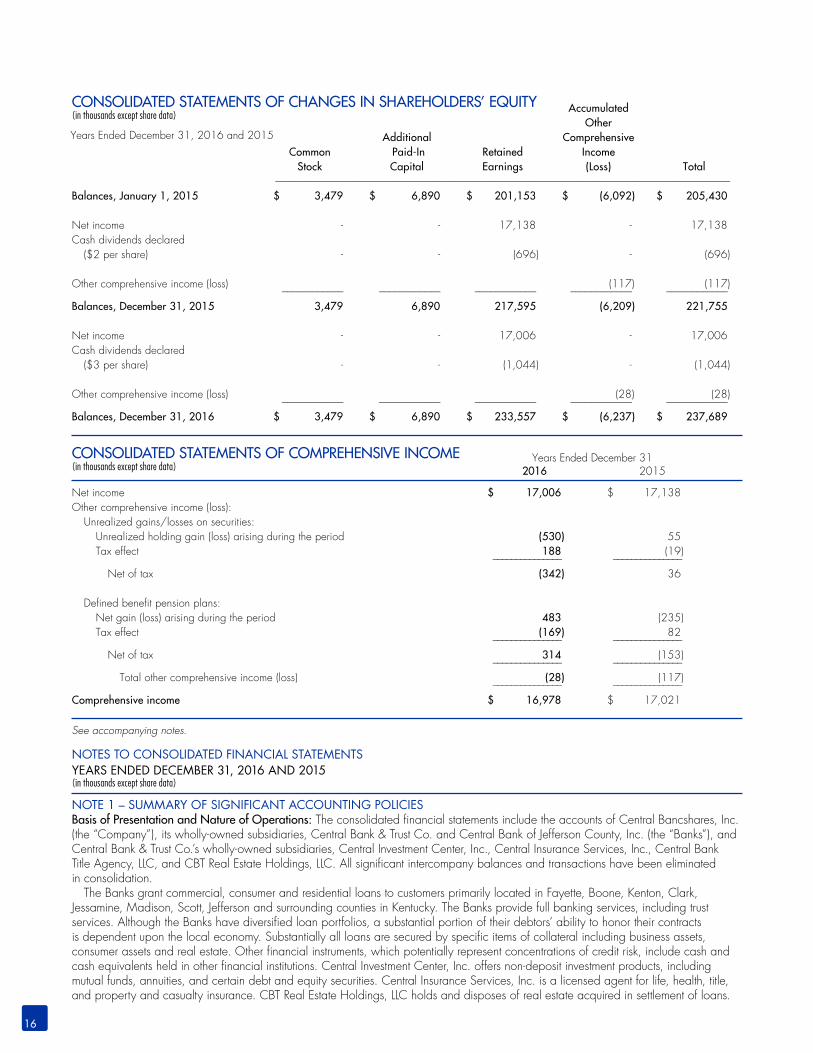
Accumulated Other Additional Comprehensive Common Paid-In Retained Income Stock Capital Earnings (Loss) Total –––––––––––––––––––––––––––––––––––––––––––––––––––––––––––––––––––––––––––––––––––––––––Balances, January 1, 2015 $ 3,479 $ 6,890 $ 201,153 $ (6,092) $ 205,430
Net income - - 17,138 - 17,138Cash dividends declared ($2 per share) - - (696) - (696)
Other comprehensive income (loss) (117) (117) –––––––––––– –––––––––––– –––––––––––– –––––––––––– –––––––––––– Balances, December 31, 2015 3,479 6,890 217,595 (6,209) 221,755
Net income - - 17,006 - 17,006Cash dividends declared ($3 per share) - - (1,044) - (1,044)
Other comprehensive income (loss) (28) (28) –––––––––––– –––––––––––– –––––––––––– –––––––––––– –––––––––––– Balances, December 31, 2016 $ 3,479 $ 6,890 $ 233,557 $ (6,237) $ 237,689
CONSOLIDATED STATEMENTS OF CHANGES IN SHAREHOLDERS’ EQUITY(in thousands except share data)
Years Ended December 31, 2016 and 2015
NOTE 1 – SUMMARY OF SIGNIFICANT ACCOUNTING POLICIESBasis of Presentation and Nature of Operations: The consolidated financial statements include the accounts of Central Bancshares, Inc. (the “Company”), its wholly-owned subsidiaries, Central Bank & Trust Co. and Central Bank of Jefferson County, Inc. (the “Banks”), and Central Bank & Trust Co.’s wholly-owned subsidiaries, Central Investment Center, Inc., Central Insurance Services, Inc., Central Bank Title Agency, LLC, and CBT Real Estate Holdings, LLC. All significant intercompany balances and transactions have been eliminated in consolidation. The Banks grant commercial, consumer and residential loans to customers primarily located in Fayette, Boone, Kenton, Clark, Jessamine, Madison, Scott, Jefferson and surrounding counties in Kentucky. The Banks provide full banking services, including trust services. Although the Banks have diversified loan portfolios, a substantial portion of their debtors’ ability to honor their contracts is dependent upon the local economy. Substantially all loans are secured by specific items of collateral including business assets, consumer assets and real estate. Other financial instruments, which potentially represent concentrations of credit risk, include cash and cash equivalents held in other financial institutions. Central Investment Center, Inc. offers non-deposit investment products, including mutual funds, annuities, and certain debt and equity securities. Central Insurance Services, Inc. is a licensed agent for life, health, title, and property and casualty insurance. CBT Real Estate Holdings, LLC holds and disposes of real estate acquired in settlement of loans.
See accompanying notes.
NOTES TO CONSOLIDATED FINANCIAL STATEMENTSYEARS ENDED DECEMBER 31, 2016 AND 2015 (in thousands except share data)
CONSOLIDATED STATEMENTS OF COMPREHENSIVE INCOME (in thousands except share data)
Net income $ 17,006 $ 17,138 Other comprehensive income (loss): Unrealized gains/losses on securities: Unrealized holding gain (loss) arising during the period (530) 55 Tax effect 188 (19) ––––––––––––––– ––––––––––––––– Net of tax (342) 36
Defined benefit pension plans: Net gain (loss) arising during the period 483 (235) Tax effect (169) 82 ––––––––––––––– ––––––––––––––– Net of tax 314 (153) ––––––––––––––– ––––––––––––––– Total other comprehensive income (loss) (28) (117) ––––––––––––––– –––––––––––––––Comprehensive income $ 16,978 $ 17,021
Years Ended December 31 2016 2015

17
Subsequent Events: The Company has evaluated subsequent events for recognition and disclosure through March 3, 2017, which is the date the financial statements were available to be issued.
Estimates in the Financial Statements: The preparation of financial statements in conformity with accounting principles generally accepted in the United States of America requires management to make estimates and assumptions that affect the reported amounts of assets and liabilities, disclosure of contingent assets and liabilities at the date of the financial statements and the reported amounts of revenues and expenses during the reporting period. Actual results could differ from those estimates.
Cash Flows: Cash and cash equivalents include cash, amounts due from financial institutions, and federal funds sold with maturities under 90 days. Net cash flows are reported for customer loan and deposit transactions, and federal funds purchased and repurchase agreements.
Securities: The Banks classify their security portfolios into two categories: available for sale and held to maturity. Securities are classified as available for sale when they might be sold before maturity. Securities are classified as held to maturity when management has the positive intent and ability to hold them to maturity. The Banks have no trading securities. Securities available for sale are carried at fair value, with unrealized holding gains and losses reported in other comprehensive income, net of tax. Securities held to maturity are stated at amortized cost. Interest income includes amortization of purchase premium or discount. Premiums and discounts on securities are amortized on the level-yield method without anticipating prepayments except for mortgage-backed securities where prepayments are anticipated. Gains and losses on dispositions are recorded on the trade date and based on the net proceeds and the adjusted carrying amount of the securities sold, using the specific identifica tion method. Management evaluates securities for other-than-temporary impairment (“OTTI”) at least on a quarterly basis, and more frequently when economic or market conditions warrant such an evaluation. For securities in an unrealized loss position, management considers the extent and duration of the unrealized loss, and the financial condition and near-term prospects of the issuer. Management also assesses whether it intends to sell, or it is more likely than not that it will be required to sell, a security in an unrealized loss position before recovery of its amortized cost basis. If either of the criteria regarding intent or requirement to sell is met, the entire difference between amortized cost and fair value is recognized as impairment through earnings. For debt securities that do not meet the aforementioned criteria, the amount of impairment is split into two components as follows: 1) OTTI related to credit loss, which must be recognized in the income statement and 2) OTTI related to other factors, which is recognized in other comprehensive income. The credit loss is defined as the difference between the present value of the cash flows expected to be collected and the amortized cost basis.
Loans: Loans that management has the intent and ability to hold for the foreseeable future or until maturity or payoff are reported at the principal balance outstanding, net of deferred loan fees and costs, and an allowance for loan losses. Loan origination fees, net of certain direct origination costs, are deferred and the net amount is amortized as a yield adjustment over the life of the related loans. Interest income is accrued on the principal balance. Classes of commercial and real estate loans are placed on nonaccrual, with interest income discontinued, at the time the loan is 90 days delinquent unless the loan is well-secured and in process of collection. Classes of consumer loans may be placed on nonaccrual if sufficient collateral exists, but are typically charged off no later than 120 days past due. All interest accrued but not received on loans placed on nonaccrual is reversed against interest income. Nonaccrual loans and loans past due 90 days still on accrual include both smaller balance homogeneous loans that are collectively evaluated for impairment and individually classified impaired loans. For all loan classes, payments received on nonaccrual loans are applied to principal only using the cost recovery method if the Company estimates that collection of all principal is not reasonably assured. If all principal is reasonably assured, payments on nonaccrual loans may be applied to interest income on the cash basis. Loans of all classes are returned to accrual status when all the principal and interest amounts contractually due are brought current and future payments are reasonably assured. For all loan classes, past due status is based on the contractual terms of the loan.
Allowance for Loan Losses: The allowance for loan losses is a valuation allowance for probable incurred credit losses. Loan losses are charged against the allowance when management believes the uncollectibility of a loan balance is confirmed. Subsequent recoveries, if any, are credited to the allowance. Management estimates the allowance balance required using past loan loss experience, the nature and volume of the portfolio, information about specific borrower situations and estimated collateral values, economic conditions, and other factors. Allocations of the allowance may be made for specific loans, but the entire allowance is available for any loan that, in management’s judgment, should be charged off. The allowance consists of specific and general components. The specific component relates to loans that are individually classified as impaired. Loans of all classes are considered impaired when, based on current information and events, it is probable that the Company will be unable to collect all amounts due according to the contractual terms of the loan agreement. Loans for which the terms have been modified resulting in a concession, and for which the borrower is experiencing financial difficulties, are considered troubled debt restructurings and classified as impaired. Factors considered by management in determining impairment include payment status, collateral value, and the probability of collecting scheduled principal and interest payments when due. Loans that experience insignificant payment delays and payment shortfalls generally are not classified as impaired. Management determines the significance of payment delays and payment shortfalls on a case-by-case basis, taking into consideration all of the circumstances surrounding the loan and the borrower, including the length of the delay, the reasons for the delay, the borrower’s prior payment record, and the amount of the shortfall in relation to the principal and interest owed.

18
Nonaccrual loans of certain classes are individually evaluated for impairment. If a loan is impaired, a portion of the allowance is allocated so that the loan is reported, net, at the present value of estimated future cash flows using the loan’s existing rate or at the fair value of collateral if repayment is expected solely from the collateral. Interest income on impaired loans is recognized on the cash basis unless the loan is a troubled debt restructured loan performing under its modified terms. Large groups of smaller balance homogeneous loans, such as consumer loans, are collectively evaluated for impairment, and accordingly, they are not separately identified for impairment disclosures. If such loans are part of a borrowing relationship in which other types of loans have been individually evaluated for impairment, they also are individually evaluated. Troubled debt restructurings are separately identified for impairment disclosures and are measured at the present value of estimated future cash flows using the loan’s effective rate at inception. If a troubled debt restructuring is considered to be a collateral dependent loan, the loan is reported, net, at the fair value of the collateral. For troubled debt restructurings that subsequently default, the Company determines the amount of reserve in accordance with the accounting policy for the allowance for loan losses. The general component of the allowance covers non-impaired loans and is based on historical loss experience adjusted for current factors. The historical loss experience is determined by portfolio segment and is based on the actual loss history experienced by the Company over the most recent five years. This actual loss experience is supplemented with other economic factors based on the risks present for each portfolio segment. These economic factors include consideration of the following: levels of and trends in delinquencies and impaired loans; levels of and trends in charge-offs and recoveries; trends in volume and terms of loans; aggregate indebtedness of significant borrowing relationships; effects of any changes in risk selection and underwriting standards; other changes in lending policies, procedures, and practices; experience, ability, and depth of lending management and other relevant staff; local economic trends and conditions; industry conditions; and effects of changes in credit concentrations. The following portfolio segments and their associated risks have been identified:
• Commercial loans are dependent on the strength of the industries of the related borrowers and the success of their businesses. Commercial loans are advanced for equipment purchases or to provide working capital or meet other financing needs of business enterprises. These loans may be secured by accounts receivable, inventory, equipment or other business assets. Financial information is obtained from the borrowers and guarantors to evaluate ability to repay the loans.
• Commercial real estate loans are dependent on the industries tied to these loans as well as the local commercial real estate market. Commercial real estate loans include completed projects as well as construction loans. The loans are secured by the real estate, and appraisals are obtained to support the loan amount. Financial information is obtained from the borrower(s) and guarantor(s) and/or an evaluation of the project’s cash flows is performed to evaluate the borrower’s ability to repay the loan.
• Residential real estate loans are affected by the local residential real estate market and the local economy. The Bank evaluates the borrower’s repayment ability through a review of financial information obtained from the borrower. Appraisals or evaluations are obtained to support the loan amount.
• Consumer loans, including installment loans and credit card receivables, are dependent on local economies. Consumer loans are generally secured by consumer assets, but may be unsecured. The Bank evaluates the borrower’s repayment ability through a review of financial information obtained from the borrower.
Mortgage Banking Activities: Mortgage loans originated and intended for sale in the secondary market are classified as held for sale and carried at the lower of aggregate cost or fair value as determined by outstanding commitments from investors. Gains on sales generated from mortgage banking activities are based on the difference between the selling price and the carrying value of the related loan sold. The Company enters into commitments to originate certain mortgage loans whereby the interest rate on the loans is determined prior to funding (rate lock commitments). Rate lock commitments on mortgage loans that are intended to be sold are considered to be derivatives. The period of time between issuance of a loan commitment, loan closing and the sale of the loan generally ranges from 30 to 90 days. The Company protects itself from changes in interest rates through the use of best efforts forward delivery contracts, whereby the Company commits to sell a loan at the time the borrower commits to an interest rate with the intent that the buyer has assumed interest rate risk on the loan. If the underlying loan does not close, there is no obligation on the Company’s part to deliver the loan to the investor. As a result, the Company is not exposed to losses nor will it realize significant gains related to its rate lock commitments due to changes in interest rates. The correlation between the rate lock commitments and the best efforts contracts is very high due to their similarity. Because of this high correlation, no gain or loss occurs on the rate lock commitments. The Company primarily sells loans servicing released. A small amount of loans are sold servicing retained; servicing rights are recognized as assets for the allocated value of retained servicing rights on loans sold. Servicing rights are initially recorded at fair value based on market prices for comparable mortgage servicing contracts. Servicing rights are expensed in proportion to, and over the period of, estimated net servicing revenues. Impairment is evaluated based on the fair value of the rights, using groupings of the underlying loans as to interest rates. Any impairment of a grouping is reported as a valuation allowance. Servicing fee income is recorded for fees earned for servicing loans. The fees are based on a contractual percentage of the outstanding principal or a fixed amount per loan and are recorded as income when earned. The amortization of mortgage servicing rights is netted against loan servicing fee income. Servicing fee income, gains on sales of mortgage loans held for sale and amortization of mortgage servicing rights are reported on the income statement as mortgage banking income.

19
Premises and Equipment: Land is carried at cost. Premises are stated at cost less accumulated depreciation computed on the straight-line method over the estimated useful lives of the assets. Furniture, fixtures and equipment are depreciated using an accelerated method. Leasehold improvements are amortized on the straight-line method over the shorter of the estimated useful lives of the improvements or the terms of the related leases.
Income Taxes: Deferred income tax assets and liabilities are computed annually for differences between the financial statement and tax bases of assets and liabilities that will result in taxable or deductible amounts in the future based on enacted tax laws and rates applicable to the periods in which the differences are expected to affect taxable income. A valuation allowance, if needed, reduces deferred tax assets to the amount expected to be realized. Income tax expense is the tax payable or refundable for the period plus or minus the change during the period in deferred tax assets and liabilities. The Company recognizes a tax benefit only if it is more likely than not that the tax position would be sustained in a tax examination, with a tax examination being presumed to occur. The amount recognized is the largest amount of tax benefit that is greater than 50 percent likely of being realized on examination. For tax positions not meeting the more-likely-than-not test, no tax benefit is recorded. The Company recognizes interest and/or penalties related to income tax matters in income tax expense.
Federal Home Loan Bank (FHLB) Stock: The Banks are members of the FHLB system. Members are required to own a certain amount of stock based on the level of borrowings and other factors, and may invest in additional amounts. FHLB stock is carried at cost, classified as a restricted security, and periodically evaluated for impairment based on ultimate recovery of par value. Both cash and stock dividends are reported as income.
Transfers of Financial Assets: Transfers of financial assets are accounted for as sales when control over the assets has been relinquished. Control over transferred assets is deemed to be surrendered when the assets have been isolated from the Company, the transferee obtains the right (free of conditions that constrain it from taking advantage of that right) to pledge or exchange the transferred assets, and the Company does not maintain effective control over the transferred assets through an agreement to repurchase them before their maturity.
Foreclosed Assets: Assets acquired through or instead of loan foreclosure are initially recorded at fair value, less selling costs, when acquired, establishing a new cost basis. If fair value declines subsequent to acquisition, a valuation allowance is recorded through expense. These assets are subsequently accounted for at lower of cost or fair value less estimated costs to sell. Operating costs incurred after acquisition are expensed.
Goodwill and Other Intangible Assets: Goodwill results from business acquisitions and represents the excess of the purchase price over the fair value of acquired tangible assets and liabilities and identifiable intangible assets. Goodwill and other intangible assets acquired in a purchase business combination and determined to have an indefinite useful life are not amortized, but tested for impairment at least annually or more frequently if events and circumstances exist that indicate a goodwill impairment test should be performed. The Company has selected December 31 as the date to perform the annual impairment test. Intangible assets with definite useful lives are amortized over their estimated useful lives to their estimated residual values. Goodwill is the only intangible asset with an indefinite life on the Company’s balance sheet. Other intangible assets consisting of customer relationship intangibles arising from acquisitions are amortized on the straight-line method over their estimated useful lives, which range from 8 to 10 years.
Loan Commitments and Related Financial Instruments: Financial instruments include off-balance-sheet credit instruments, such as commitments to make loans and commercial letters of credit, issued to meet customer financing needs. The face amount for these items represents the exposure to loss, before considering customer collateral or ability to repay. Such financial instruments are recorded when they are funded.
Trust Department: Revenues from trust department services are recorded on the cash basis, which approximates the accrual basis. Securities and other properties, except cash deposits, held by the trust department in a fiduciary or agency capacity are not included in the consolidated financial statements since such items are not assets of the Company.
Investment in Limited Partnerships: Central Bank & Trust Co. is a limited equity partner in 17 low-income housing projects and one historic renovation project. The investments are accounted for using the equity method and are included in other assets. The investments had a balance of $4,666 and $6,574 at year-end 2016 and 2015. At year-end 2016, remaining funding commitments were $1,743.
Benefit Plans: Pension expense is the net of interest cost, return on plan assets, and amortization of gains and losses not immediately recognized. Employee stock ownership and 401(k) plan expense is the amount contributed determined by Board decision. Deferred compensation plan expense is allocated over years of service. All ESOP shares are allocated to participants as of the end of each fiscal year. Compensation expense is based on the price paid for the shares acquired by the plan during the year. Since all ESOP shares are allocated to participants, all dividends reduce retained earnings.
Fair Value of Financial Instruments: Fair values of financial instruments, as more fully disclosed in Note 10, are estimated using relevant market information and other assumptions. Fair value estimates involve uncertainties and matters of significant judgment regarding interest rates, credit risk, prepayments, and other factors, especially in the absence of broad markets for particular items. Changes in
20
assumptions or in market conditions could significantly affect the estimates.
Earnings Per Share: Basic earnings per share is net income divided by the weighted average number of shares outstanding during the period. The Company has no shares outstanding which are potentially dilutive.
Comprehensive Income: Comprehensive income consists of net income and other comprehensive income (loss). Other comprehensive income (loss) includes unrealized gains and losses on securities available for sale, net of related income tax, and changes in the funded status of the defined benefit pension plans, net of related income tax. Accumulated other comprehensive income (loss) is recognized as a separate component of equity. The accumulated other comprehensive income (loss) at December 31, 2016 of $(6,237) was comprised of $(6,055) related to the defined benefit and non-qualified pension plans and $(182) related to unrealized gains and losses on available for sale securities. The accumulated other comprehensive income (loss) at December 31, 2015 of $(6,209) was comprised of $(6,359) related to the defined benefit and non-qualified pension plans and $150 related to unrealized gains and losses on available for sale securities.
Loss Contingencies: Loss contingencies, including claims and legal actions arising in the ordinary course of business, are recorded as liabilities when the likelihood of loss is probable and an amount or range of loss can be reasonably estimated. Management does not believe that there now are such matters that will have a material effect on the consolidated financial statements.
Dividend Restriction: Banking regulations require maintaining certain capital levels and may limit the dividends paid by the Banks to the holding company or by the holding company to shareholders.
Restrictions on Cash: Included in cash and due from financial institutions are certain deposits held at the Federal Reserve Bank or maintained in vault cash in accordance with average balance requirements specified by the Federal Reserve. The average balance requirement was $38,924 and $35,404 at December 31, 2016 and 2015. These funds earn interest at an interest rate determined by the Federal Reserve.
Reclassifications: Some items in the prior year financial statements were reclassified to conform to the current year presentation. Reclassifications had no effect on prior year net income or shareholders’ equity.
Adoption of New Accounting Standards: In January 2016, the FASB amended existing guidance by issuing ASU 2016-01, Financial Instruments – Overall (Subtopic 825-10): Recognition and Measurement of Financial Assets and Financial Liabilities. The guidance requires equity investments (except those accounted for under the equity method of accounting, or those that result in consolidation of the investee) to be measured at fair value with changes in fair value recognized in net income. It requires public business entities to use the exit price notion when measuring the fair value of financial instruments for disclosure purposes. It requires separate presentation of financial assets and financial liabilities by measurement category and form of financial asset, and it eliminates the requirement for public business entities to disclose the methods and significant assumptions used to estimate the fair value that is required to be disclosed for financial instruments measured at amortized cost. These amendments are effective for public business entities for fiscal years beginning after December 15, 2017, including interim periods within those fiscal years. The adoption of this standard is not expected to have a material effect on the Company’s operating results or financial condition; however, it is expected to have an impact on the Company’s fair value disclosures. In February 2016, the FASB amended existing guidance by issuing ASU 2016-02, Leases (Topic 842). The guidance requires lessees to recognize the following for all leases (with the exception of short-term leases) at the commencement date (1) A lease liability, which is a lessee’s obligation to make lease payments arising from a lease, measured on a discounted basis; and (2) A right-of-use asset, which is an asset that represents the lessee’s right to use, or control the use of, a specified asset for the lease term. Under the new guidance, lessor accounting is largely unchanged. These amendments are effective for public business entities for fiscal years beginning after December 15, 2018, including interim periods within those fiscal years. Lessees must apply a modified retrospective transition approach for leases existing at, or entered into after, the beginning of the earliest comparative period presented in the financial statements. The adoption of this standard is not expected to have a material effect on the Company’s operating results, but is expected to have a material impact on the Company’s consolidated balance sheets. In June 2016, FASB issued ASU 2016-13, Financial Instruments – Credit Losses (Topic 326). The guidance was issued to replace the incurred loss model with an expected loss model, which is referred to as the current expected credit loss (CECL) model. The CECL model is applicable to the measurement of credit losses on financial assets measured at amortized cost, including loans and securities held to maturity. It also applies to off-balance sheet credit exposures not accounted for as insurance such as loan commitments, standby letters of credit, financial guarantees, and other similar instruments. For debt securities with other-than-temporary impairment, the guidance will be applied prospectively. Existing purchased credit impaired assets will be grandfathered and classified as purchased credit deteriorated assets at the date of adoption. For all other assets within the scope of CECL, a cumulative-effect adjustment will be recognized in retained earnings as of the beginning of the first reporting period in which the guidance is effective. For public business entities that do not meet the definition of an SEC filer, the standard will be effective for fiscal years beginning after December 15, 2020, including interim periods within those fiscal years. The adoption of this standard is expected to have a material effect on the Company’s operating results and financial condition, but the impact has not yet been quantified.

21
NOTE 2 – SECURITIES The fair value of securities available for sale and the related gross unrealized gains and losses recognized in accumulated other comprehensive income (loss) were as follows: Gross Gross Amortized Unrealized Unrealized Fair Cost Gains Losses Value ––––––––––––––––––––––––––––––––––––––––––––––––––––––––––––––––––––2016 U.S. government sponsored entities and agencies $ 73,453 $ 140 $ (331) $ 73,262 Agency mortgage-backed securities: residential 81,418 386 (96) 81,708 Corporate bonds 15,356 - (384) 14,972 ––––––––––––––– ––––––––––––––– ––––––––––––––– ––––––––––––––– $ 170,227 $ 526 $ (811) $ 169,9422015 U.S. government sponsored entities and agencies $ 54,524 $ 139 $ (127) $ 54,536 Agency mortgage-backed securities: residential 47,880 394 (77) 48,197 Corporate bonds 15,222 - (84) 15,138 ––––––––––––––– ––––––––––––––– ––––––––––––––– ––––––––––––––– $ 117,626 $ 533 $ (288) $ 117,871
The carrying amount, unrecognized gains and losses, and fair value of securities held to maturity were as follows: Gross Gross Carrying Unrecognized Unrecognized Fair Amount Gains Losses Value ––––––––––––––––––––––––––––––––––––––––––––––––––––––––––––––––––––2016 U.S. government sponsored entities and agencies $ 60,500 $ - $ (603) $ 59,897 Agency mortgage-backed securities: residential 35,253 24 (464) 34,813 States and political subdivisions 14,851 49 (1) 14,899 ––––––––––––– ––––––––––––– ––––––––––––– –––––––––––––– $ 110,604 $ 73 $ (1,068) $ 109,609
2015 U.S. government sponsored entities and agencies $ 68,250 $ 8 $ (50) $ 68,208 Agency mortgage-backed securities: residential 42,446 158 (188) 42,416 States and political subdivisions 17,016 147 (40) 17,123 ––––––––––––– ––––––––––––– ––––––––––––– –––––––––––––– $ 127,712 $ 313 $ (278) $ 127,747
The amortized cost and fair value of debt securities at December 31, 2016 are shown by contractual maturity. Expected maturities may differ from contractual maturities if borrowers have the right to call or prepay obligations with or without penalties. Mortgage-backed securities not due at a single maturity date are shown separately.
Available for Sale Held to Maturity Amortized Fair Amortized Fair Cost Value Cost Value ––––––––––––––––––––––––––––––––––––––––––––––––––––––––––––––––––––Due in one year or less $ 7,886 $ 7,898 $ 11,501 $ 11,539Due from one to five years 25,323 25,126 63,850 63,2579Due from five to ten years 6,241 6,210 - -Due after ten years 49,359 49,000 - -Agency mortgage-backed securities: residential 81,418 81,708 35,253 34,813 ––––––––––––– ––––––––––––– ––––––––––––– ––––––––––––– Total $ 170,227 $ 169,942 $ 110,604 $ 109,609
Securities with a carrying amount of $177,942 and $148,935 at December 31, 2016 and 2015, were pledged to secure public deposits and repurchase agreements. At December 31, 2016 and 2015, there were no holdings of securities of any one issuer, other than the U.S. government and its agencies, in an amount greater than 10 percent of shareholders’ equity. There were no sales of securities in 2016. Proceeds from the sale of securities were $9,967 in 2015, and there were no gross gains or losses associated with sales.

22
Securities with unrealized losses at year-end 2016 and 2015, aggregated by investment category and length of time that individual securities have been in a continuous unrealized loss position, are shown below.
Less than 12 Months 12 Months or More Total Fair Unrealized Fair Unrealized Fair UnrealizedDescription of Securities Value Loss Value Loss Value Loss –––––––––––––––––––––––––––––––––––––––––––––––––––––––––––––––––––––––––––––––––––––––––––––––––2016Available for sale: U.S. government sponsored entities and agencies $ 25,329 $ (258) $ 13,727 $ (73) $ 39,056 $ (331) Agency mortgage-backed securities: residential 27,857 (42) 6,476 (54) 34,333 (96) Corporate bonds 10,017 (338) 4,954 (46) 14,971 (384) –––––––––––– –––––––––– ––––––––––– ––––––––––– ––––––––––– ––––––––––– Total available for sale $ 63,203 $ (638) $ 25,157 $ (173) $ 88,360 $ (811)
2015Available for sale: U.S. government sponsored entities and agencies $ 27,250 $ (106) $ 4,649 $ (21) $ 31,899 $ (127) Agency mortgage-backed securities: residential 7,629 (5) 8,954 (72) 16,583 (77) Corporate bonds 4,916 (84) - - 4,916 (84) –––––––––––– –––––––––– ––––––––––– ––––––––––– ––––––––––– ––––––––––– Total available for sale $ 39,795 $ (195) $ 13,603 $ (93) $ 53,398 $ (288)
Less than 12 Months 12 Months or More Total Fair Unrecognized Fair Unrecognized Fair UnrecognizedDescription of Securities Value Loss Value Loss Value Loss –––––––––––––––––––––––––––––––––––––––––––––––––––––––––––––––––––––––––––––––––––––––––––––––––2016Held to maturity: U.S. government sponsored entities and agencies $ 59,897 $ (603) $ - $ - $ 59,897 $ (603) Agency mortgage-backed securities: residential 34,099 (464) - - 34,099 (464) States and political subdivisions 1,502 (1) 718 - 2,220 (1) –––––––––––– –––––––––– ––––––––––– ––––––––––– ––––––––––– ––––––––––– Total held to maturity $ 95,498 $ (1,068) $ 718 $ - $ 96,216 $ (1,068)
2015Held to maturity: U.S. government sponsored entities and agencies $ 55,500 $ (50) $ - $ - $ 55,500 $ (50) Agency mortgage-backed securities: residential 28,511 (122) 1,844 (66) 30,355 (188) States and political subdivisions 6,329 (40) - - 6,329 (40) –––––––––––– –––––––––– ––––––––––– ––––––––––– ––––––––––– ––––––––––– Total held to maturity $ 90,340 $ (212) $ 1,844 $ (66) $ 92,184 $ (278)
Unrealized losses on debt securities have not been recognized into income because the issued bonds are of high credit quality (rated AA or higher) as of December 31, 2016 and at acquisition date, management does not intend to sell and it is likely that management will not be required to sell the securities prior to their anticipated recovery, and the decline in fair value is largely due to changes in interest rates and other market conditions. The fair value is expected to recover as the bonds approach maturity.

23
NOTE 3 – LOANS Loans at December 31 were as follows: 2016 2015 ––––––––––––––––––––––––––––––––––––––––––––– Commercial $ 366,499 $ 331,936 Commercial real estate 963,612 930,243 Residential real estate 377,050 346,073 Installment 74,017 61,602 Credit card receivables 12,821 12,138 ––––––––––––––––– ––––––––––––––––– 1,793,999 1,681,992 Deferred loan fees, net (1,679) (1,179) Allowance for loan losses (20,582) (21,840) ––––––––––––––––– ––––––––––––––––– Loans, net $ 1,771,738 $ 1,658,973
The following table presents the activity in the allowance for loan losses by segment of loans for the years ended December 31, 2016 and 2015:
Commercial Residential Real Real Credit Card Commercial Estate Estate Installment Receivables Unallocated Total ––––––––––––––––––––––––––––––––––––––––––––––––––––––––––––––––––––––––––––––––––––––––––––––––––––––––––––––––––––––––2016Allowance for loan losses: Beginning balance $ 5,001 $ 12,830 $ 2,164 $ 972 $ 220 $ 653 $ 21,840 Provision for loan losses (78) 3,090 287 814 271 80 4,464 Loans charged off (667) (5,325) (614) (1,289) (260) - (8,155) Recoveries 818 900 72 553 90 - 2,433 ––––––––––––––– ––––––––––––––– ––––––––––––––– ––––––––––––––– ––––––––––––––– ––––––––––––––– ––––––––––––––– Total ending allowance balance $ 5,074 $ 11,495 $ 1,909 $ 1,050 $ 321 $ 733 $ 20,582
2015Allowance for loan losses: Beginning balance $ 6,044 $ 11,056 $ 4,613 $ 985 $ 241 $ 98 $ 23,037 Provision for loan losses (308) 2,038 (2,084) 597 163 555 961 Loans charged off (1,589) (873) (420) (1,261) (313) - (4,456) Recoveries 854 609 55 651 129 - 2,298 ––––––––––––––– ––––––––––––––– ––––––––––––––– ––––––––––––––– ––––––––––––––– ––––––––––––––– ––––––––––––––– Total ending allowance balance $ 5,001 $ 12,830 $ 2,164 $ 972 $ 220 $ 653 $ 21,840
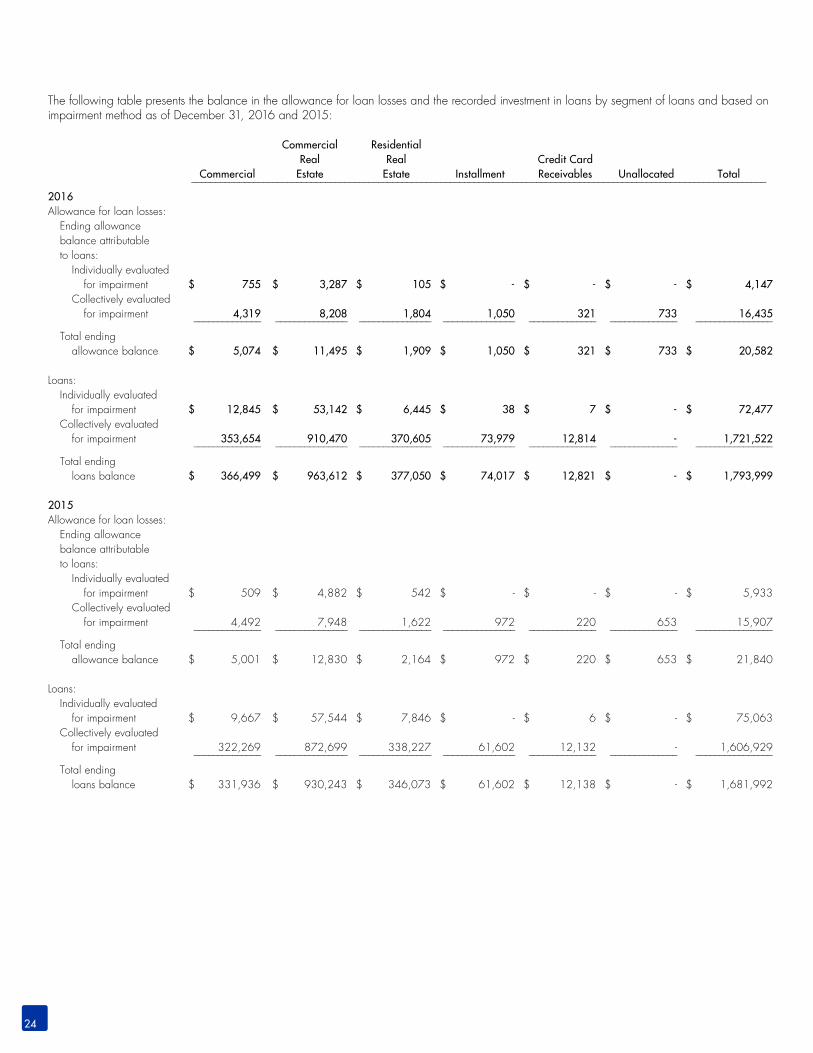
24
The following table presents the balance in the allowance for loan losses and the recorded investment in loans by segment of loans and based on impairment method as of December 31, 2016 and 2015:
Commercial Residential Real Real Credit Card Commercial Estate Estate Installment Receivables Unallocated Total ––––––––––––––––––––––––––––––––––––––––––––––––––––––––––––––––––––––––––––––––––––––––––––––––––––––––––––––––––––––––2016Allowance for loan losses: Ending allowance balance attributable to loans: Individually evaluated for impairment $ 755 $ 3,287 $ 105 $ - $ - $ - $ 4,147 Collectively evaluated for impairment 4,319 8,208 1,804 1,050 321 733 16,435 –––––––––––––– ––––––––––––––– ––––––––––––––– ––––––––––––––– –––––––––––––– –––––––––––––– –––––––––––––––– Total ending allowance balance $ 5,074 $ 11,495 $ 1,909 $ 1,050 $ 321 $ 733 $ 20,582
Loans: Individually evaluated for impairment $ 12,845 $ 53,142 $ 6,445 $ 38 $ 7 $ - $ 72,477 Collectively evaluated for impairment 353,654 910,470 370,605 73,979 12,814 - 1,721,522 –––––––––––––– ––––––––––––––– ––––––––––––––– ––––––––––––––– –––––––––––––– –––––––––––––– –––––––––––––––– Total ending loans balance $ 366,499 $ 963,612 $ 377,050 $ 74,017 $ 12,821 $ - $ 1,793,999 2015Allowance for loan losses: Ending allowance balance attributable to loans: Individually evaluated for impairment $ 509 $ 4,882 $ 542 $ - $ - $ - $ 5,933 Collectively evaluated for impairment 4,492 7,948 1,622 972 220 653 15,907 –––––––––––––– ––––––––––––––– ––––––––––––––– ––––––––––––––– –––––––––––––– –––––––––––––– –––––––––––––––– Total ending allowance balance $ 5,001 $ 12,830 $ 2,164 $ 972 $ 220 $ 653 $ 21,840
Loans: Individually evaluated for impairment $ 9,667 $ 57,544 $ 7,846 $ - $ 6 $ - $ 75,063 Collectively evaluated for impairment 322,269 872,699 338,227 61,602 12,132 - 1,606,929 –––––––––––––– ––––––––––––––– ––––––––––––––– ––––––––––––––– –––––––––––––– –––––––––––––– –––––––––––––––– Total ending loans balance $ 331,936 $ 930,243 $ 346,073 $ 61,602 $ 12,138 $ - $ 1,681,992

25
The following table presents information related to impaired loans by class of loans as of and for the year ended December 31, 2016:
Unpaid Allowance for Average Interest Cash Basis Principal Recorded Loan Losses Recorded Income Interest Balance Investment Allocated Investment Recognized Recognized ––––––––––––––––––––––––––––––––––––––––––––––––––––––––––––––––––––––––––––––––––––––––––––––––––––––December 31, 2016With no related allowance recorded: Commercial $ 12,096 $ 10,927 $ - $ 6,038 $ 351 $ 351 Commercial real estate 26,812 25,268 - 20,824 506 506 Residential real estate 3,483 3,407 - 2,093 26 26 Installment 99 38 - 43 - - Credit card receivables 7 7 - 5 - - –––––-––--––––––– –––––––––-––––– ––––––––––––– –––---–––––––––– ––––--––––––––– ––––––––––––– Subtotal 42,497 39,647 - 29,003 883 883
With an allowance recorded: Commercial $ 2,147 $ 1,918 $ 755 $ 4,389 $ 45 $ 45 Commercial real estate 28,773 27,874 3,287 32,360 748 748 Residential real estate 3,547 3,038 105 4,675 94 94 Installment - - - - - - Credit card receivables - - - 4 - - ––––––---–––––––– ––––––-–––––––– ––––––––––––– ––––---––––––––– ––––––--––––––– ––––––––––––– Subtotal 34,467 32,830 4,147 41,428 887 887 –––––---––––––––– –––––-––––––––– ––––––––––––– ––––---––––––––– ––––--––––––––– ––––––––––––– Total $ 76,964 $ 72,477 $ 4,147 $ 70,431 $ 1,770 $ 1,770
The recorded investment in loans excludes accrued interest receivable and loan origination fees, net due to immateriality. For purposes of this disclosure, the unpaid principal balance is not reduced for partial charge-offs.
The following table presents information related to impaired loans by class of loans as of and for the year ended December 31, 2015:
Unpaid Allowance for Average Interest Cash Basis Principal Recorded Loan Losses Recorded Income Interest Balance Investment Allocated Investment Recognized Recognized ––––––––––––––––––––––––––––––––––––––––––––––––––––––––––––––––––––––––––––––––––––––––––––––––––––––December 31, 2015With no related allowance recorded: Commercial $ 314 $ 267 $ - $ 3,104 $ 1 $ 1 Commercial real estate 11,220 10,355 - 14,325 242 242 Residential real estate 1,317 1,184 - 3,183 22 22 Installment - - - 83 - - Credit card receivables 6 6 - 7 1 1 ––––––-–––-––––– ––––––-–––––––– ––––––––––––– –––––---–––––––– ––––––--––––––– –––––––-–––––– Subtotal 12,857 11,812 - 20,702 266 266
With an allowance recorded: Commercial $ 10,753 $ 9,400 $ 509 $ 7,872 $ 350 $ 350 Commercial real estate 48,798 47,189 4,882 38,251 1,033 1,033 Residential real estate 7,129 6,662 542 6,536 186 186 Installment - - - 37 - - Credit card receivables - - - - - - ––––––--–––––––– –––––-––––––––– ––––––––––––– ––––--–-–––––––– ––––––--––––––– ––––––––––––– Subtotal 66,680 63,251 5,933 52,696 1,569 1,569 –––––––--––––––– –––––-––––––––– ––––––––––––– ––––---––––––––– ––––––--––––––– ––––––––––––– Total $ 79,537 $ 75,063 $ 5,933 $ 73,398 $ 1,835 $ 1,835
The recorded investment in loans excludes accrued interest receivable and loan origination fees, net due to immateriality. For purposes of this disclosure, the unpaid principal balance is not reduced for partial charge-offs.
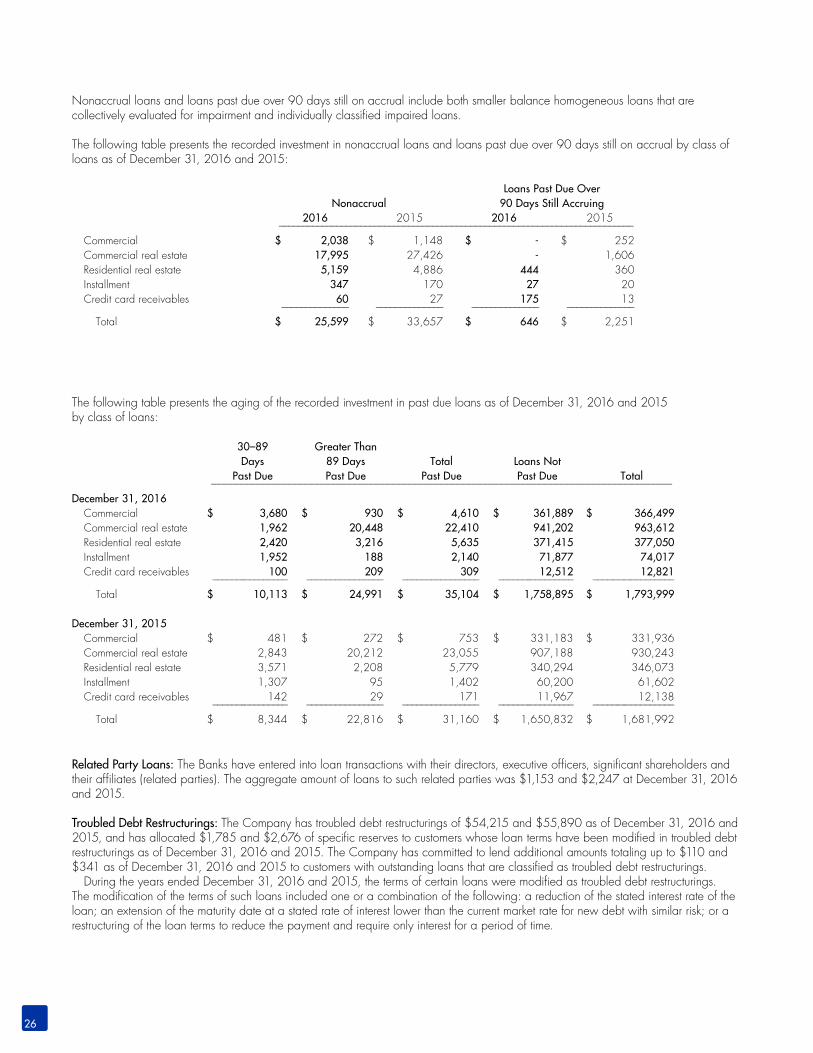
26
Nonaccrual loans and loans past due over 90 days still on accrual include both smaller balance homogeneous loans that are collectively evaluated for impairment and individually classified impaired loans.
The following table presents the recorded investment in nonaccrual loans and loans past due over 90 days still on accrual by class of loans as of December 31, 2016 and 2015:
Loans Past Due Over Nonaccrual 90 Days Still Accruing 2016 2015 2016 2015 –––––––––––––––––––––––––––––––––––––––––––––––––––––––––––––––––––––––––– Commercial $ 2,038 $ 1,148 $ - $ 252 Commercial real estate 17,995 27,426 - 1,606 Residential real estate 5,159 4,886 444 360 Installment 347 170 27 20 Credit card receivables 60 27 175 13 –––––––––––––– –––––––––––––– –––––––––––––– –––––––––––––– Total $ 25,599 $ 33,657 $ 646 $ 2,251
The following table presents the aging of the recorded investment in past due loans as of December 31, 2016 and 2015 by class of loans:
30–89 Greater Than Days 89 Days Total Loans Not Past Due Past Due Past Due Past Due Total –––––––––––––––––––––––––––––––––––––––––––––––––––––––––––––––––––––––––––––––––––––December 31, 2016 Commercial $ 3,680 $ 930 $ 4,610 $ 361,889 $ 366,499 Commercial real estate 1,962 20,448 22,410 941,202 963,612 Residential real estate 2,420 3,216 5,635 371,415 377,050 Installment 1,952 188 2,140 71,877 74,017 Credit card receivables 100 209 309 12,512 12,821 ––––––--––––––––– –––––––––––––––– –––––––––––––––– ––––––--––––––––– ––––-––-–-––––––––– Total $ 10,113 $ 24,991 $ 35,104 $ 1,758,895 $ 1,793,999
December 31, 2015 Commercial $ 481 $ 272 $ 753 $ 331,183 $ 331,936 Commercial real estate 2,843 20,212 23,055 907,188 930,243 Residential real estate 3,571 2,208 5,779 340,294 346,073 Installment 1,307 95 1,402 60,200 61,602 Credit card receivables 142 29 171 11,967 12,138 ––––––--––––––––– –––––––––––––––– –––––––––––––––– ––––––--––––––––– –––––-–--–––––––––– Total $ 8,344 $ 22,816 $ 31,160 $ 1,650,832 $ 1,681,992
Related Party Loans: The Banks have entered into loan transactions with their directors, executive officers, significant shareholders and their affiliates (related parties). The aggregate amount of loans to such related parties was $1,153 and $2,247 at December 31, 2016 and 2015.
Troubled Debt Restructurings: The Company has troubled debt restructurings of $54,215 and $55,890 as of December 31, 2016 and 2015, and has allocated $1,785 and $2,676 of specific reserves to customers whose loan terms have been modified in troubled debt restructurings as of December 31, 2016 and 2015. The Company has committed to lend additional amounts totaling up to $110 and $341 as of December 31, 2016 and 2015 to customers with outstanding loans that are classified as troubled debt restructurings. During the years ended December 31, 2016 and 2015, the terms of certain loans were modified as troubled debt restructurings. The modification of the terms of such loans included one or a combination of the following: a reduction of the stated interest rate of the loan; an extension of the maturity date at a stated rate of interest lower than the current market rate for new debt with similar risk; or a restructuring of the loan terms to reduce the payment and require only interest for a period of time.

27
The following table presents loans by segment modified as troubled debt restructurings that occurred during the years ended December 31, 2016 and 2015: Pre-Modification Post-Modification Number Outstanding Recorded Outstanding Recorded of Loans Investment Investment –––––––––––––––––––––––––––––––––––––––––––––––––––––––––––––––––– December 31, 2016: Troubled debt restructurings: Commercial 8 $ 1,747 $ 2,646 Commercial real estate 25 25,331 19,906 Residential real estate 8 897 897 ––––––––– ––––––––––––––– ––––––––––––––– Total 41 $ 27,975 $ 23,449 December 31, 2015: Troubled debt restructurings: Commercial 9 $ 1,725 $ 1,725 Commercial real estate 17 15,487 15,537 Residential real estate 10 1,778 1,778 ––––––––– ––––––––––––––– ––––––––––––––– Total 36 $ 18,990 $ 19,040
The troubled debt restructurings described above increased the allowance for loan losses by $3,286 and resulted in $3,156 of charge-offs during the year ended December 31, 2016. The troubled debt restructurings described above increased the allowance for loan losses by $183 and resulted in charge-offs of $331 during the year ended December 31, 2015. There was one residential real estate loan with a recorded investment of $53 for which there was a payment default within 12 months following the modification during the year ended December 31, 2016. There was one commercial loan with a recorded investment of $13 for which there was a payment default within 12 months following the modification during the year ended December 31, 2015. A loan is considered to be in payment default once it is 90 days contractually past due under the modified terms. The troubled debt restructuring that subsequently defaulted described above did not result in an increase in the allowance for loan losses or charge-offs during the year ended December 31, 2016. The troubled debt restructuring that subsequently defaulted described above resulted in an increase in the allowance for loan losses of $13 and resulted in charge-offs of $13 during the year ended December 31, 2015. In order to determine whether a borrower is experiencing financial difficulty, an evaluation is performed of the probability that the borrower will be in payment default on any of its debt in the foreseeable future without the modification. This evaluation is performed under the Company’s internal underwriting policy.
Credit Quality Indicators: The Company categorizes loans into risk categories based on relevant information about the ability of borrowers to service their debt such as: current financial information, historical payment experience, credit documentation, public information, and current economic trends, among other factors. The Company analyzes loans individually by classifying the loans as to credit risk. This analysis includes loans with an outstanding balance greater than $100 and non-homogeneous loans, such as commercial, commercial real estate and residential real estate loans, and homogeneous loans that are part of a borrowing relationship. This analysis is performed on a monthly basis. The Company uses the following definitions for risk ratings:
Special Mention. Loans classified as special mention have a potential weakness that deserves management’s close attention. If left uncorrected, these potential weaknesses may result in deterioration of the repayment prospects for the loan or of the institution’s credit position at some future date.
Substandard. Loans classified as substandard are inadequately protected by the current net worth and paying capacity of the obligor or of the collateral pledged, if any. Loans so classified have a well-defined weakness or weaknesses that jeopardize the liquidation of the debt. They are characterized by the distinct possibility that the institution will sustain some loss if the deficiencies are not corrected.
Doubtful. Loans classified as doubtful have all the weaknesses inherent in those classified as substandard, with the added characteristic that the weaknesses make collection or liquidation in full, on the basis of currently existing facts, conditions and values, highly questionable and improbable.
Loans not meeting the criteria above that are analyzed individually as part of the above described process are considered to be pass rated loans. Loans listed as not rated are included in groups of homogeneous loans, such as home equity lines of credit, installment loans and credit card receivables. Credit quality indicators similar to those described above, including delinquency and other performance indicators, are used for loans that are not rated.

28
Based on the most recent analysis performed, the risk category of loans by class of loans was as follows:
Special Pass Mention Substandard Doubtful Not Rated Total –––––––––––––––––––––––––––––––––––––––––––––––––––––––––––––––––––––––––––––––––––––––––––––––––––––––––––––––December 31, 2016Commercial $ 352,283 $ 1,757 $ 12,459 $ - $ - $ 366,499Commercial real estate 893,029 11,847 58,736 - - 963,612Residential real estate 250,959 1,454 7,148 - 117,489 377,050Installment - - 10 8 73,999 74,017Credit card receivables - 11 52 - 12,758 12,821 ––––––––––––––––– –––––––––––––– –––––––––––––– ––––––––––––– ––––––––––––––– –––––––––––––––– $ 1,496,271 $ 15,069 $ 78,405 $ 8 $ 204,246 $ 1,793,999
December 31, 2015Commercial $ 317,328 $ 558 $ 14,050 $ - $ - $ 331,936Commercial real estate 846,666 13,638 69,939 - - 930,243Residential real estate 230,458 2,831 6,576 - 106,208 346,073Installment - 4 34 - 61,564 61,602Credit card receivables - 17 53 - 12,068 12,138 ––––––––––––––––– –––––––––––––– –––––––––––––– ––––––––––––– ––––––––––––––– –––––––––––––––– $ 1,394,452 $ 17,048 $ 90,652 $ - $ 179,840 $ 1,681,992
NOTE 4 – MORTGAGE BANKING ACTIVITIESLoans originated for sale in the secondary market and subsequently sold totaled $224,104 and $206,819 during 2016 and 2015. The Company had commitments to originate $18,472 in loans at December 31, 2016, which it intends to sell after the loans are closed. Loans serviced for others, which are not reported as assets, totaled $49,369 and $44,653 at December 31, 2016 and 2015.
Activity for mortgage servicing rights included in other assets during 2016 and 2015 was as follows:
2016 2015 –––––––––––––––––––––––––––––––––––––––– Beginning of year $ 164 $ 188 Originated 93 36 Amortized to expense (56) (60) ––––––––––––––– ––––––––––––– End of year $ 201 $ 164 No valuation allowance for impaired servicing rights is considered necessary. The fair value of capitalized mortgage servicing rights was estimated to be $329 and $335 at year-end 2016 and 2015.

29
NOTE 5 – OTHER REAL ESTATE OWNEDActivity in other real estate owned was as follows: 2016 2015 –––––––––––––––––––––––––––––––––––––––– Other real estate owned, beginning of year $ 5,806 $ 10,332
Acquisition and improvement 4,686 1,831 Proceeds from sales (5,560) (4,551) Provision for valuation allowance (916) (1,935) Net gain (loss) on sales 1,034 129 ––––––––––––––– ––––––––––––– Other real estate owned, end of year $ 5,050 $ 5,806 Activity in the valuation allowance was as follows: 2016 2015 –––––––––––––––––––––––––––––––––––––––– Beginning of year $ 4,156 $ 4,996 Additions charged to expense 916 1,935 Reductions from sales (3,503) (2,775) ––––––––––––––– ––––––––––––– End of year $ 1,569 $ 4,156 Expenses related to other real estate owned include: 2016 2015 –––––––––––––––––––––––––––––––––––––––– Net loss (gain) on sales $ (1,034) $ (129) Provision for valuation allowance 916 1,935 Operating expenses, net 482 450 ––––––––––––––– ––––––––––––– $ 364 $ 2,256
NOTE 6 – PREMISES AND EQUIPMENTPremises and equipment at December 31 were as follows: 2016 2015 –––––––––––––––––––––––––––––––––––––––– Land $ 2,991 $ 2,991 Buildings and improvements 21,558 21,549 Leasehold improvements 30,193 29,869 Furniture, fixtures and equipment 39,125 37,575 Construction in progress 579 1,151 ––––––––––––––– ––––––––––––– 94,446 93,135 Accumulated depreciation (60,480) (56,210) ––––––––––––––– ––––––––––––– Total $ 33,966 $ 36,925
Depreciation and amortization expense amounted to $4,306 and $4,288 in 2016 and 2015.
Operating Leases: The Company leases its main office, 12 banking center locations and its mortgage and insurance center in addition to its land leases for three banking centers. The Company currently subleases a portion of its space to three tenants. Rent expense for the Company was $5,526 and $5,418 in 2016 and 2015. Rent commitments under noncancelable operating leases, before considering renewal options that generally are present, were as follows:
2017 $ 6,028 2018 6,007 2019 5,753 2020 5,725 2021 5,461 Thereafter 9,113 ––––––––––––––– $ 38,087

30
NOTE 7 – GOODWILL AND OTHER INTANGIBLE ASSETSGoodwill was $14,313 at December 31, 2016 and 2015. Impairment exists when a reporting unit’s carrying value of goodwill exceeds its fair value. At December 31, 2016, the Company’s reporting unit had positive equity and the Company performed a qualitative assessment to determine if it was more likely than not that the fair value of the reporting unit exceeded its carrying value, including goodwill. The qualitative assessment indicated that it was more likely than not that the fair value of the reporting unit exceeded its carrying value, resulting in no impairment. Management also quantitatively determined the fair value of the reporting unit and compared it to its carrying amount. The result of this assessment supported the qualitative analysis. There were no acquired intangible assets at December 31, 2016. Acquired intangible assets of $4,924 from prior years’ acquisitions were fully amortized during 2016 with amortization expense of $80 and $240 in 2016 and 2015.
NOTE 8 – DEPOSITSTime deposits that meet or exceed the FDIC insurance limit of $250 at year-end 2016 and 2015 were $106,964 and $117,780.
Scheduled maturities of time deposits for the next five years are as follows:
2017 $ 227,280 2018 57,169 2019 29,414 2020 14,972 2021 21,526 Thereafter 81 ––––––––––––––– $ 350,442
Deposits of directors and executive officers of the Banks and companies in which they have beneficial ownership were $11,112 and $23,565 at December 31, 2016 and 2015.
NOTE 9 – FEDERAL HOME LOAN BANK ADVANCES AND OTHER BORROWINGSAt December 31, advances from the Federal Home Loan Bank were as follows:
2016 2015 –––––––––––––––––––––––––––––––––––––––– Maturities January 2022 through December 2027, fixed rates ranging from 2.00% to 5.50%, averaging 2.44% at year-end 2016 and 2015. $ 564 $ 715 Each advance is payable at its maturity date, with a prepayment penalty for fixed rate advances that are paid off earlier than maturity. The advances are borrowed under a blanket lien agreement. The advances are collateralized by Federal Home Loan Bank stock and first mortgage loans with an aggregate unpaid principal balance of $327,641 and $303,477 at December 31, 2016 and 2015. Based on this collateral and the holding of Federal Home Loan Bank stock, the Banks are eligible to borrow up to a total of $152,113 at year-end 2016. In addition, the Federal Home Loan Bank issues letters of credit on behalf of a subsidiary bank of the Company as security for certain deposit relationships, as the need arises. Outstanding letters of credit at December 31, 2016 and 2015 were $84,965 and $84,378.
Subordinated Debentures: In March 2009, Central Bancshares KY Statutory Trust III, a trust formed by the Company, closed a private placement offering of 22,600 trust preferred securities with a liquidation amount of $1 per security. The Company issued $23,278 of subordinated debentures to the trust in exchange for ownership of all of the common security of the trust and the proceeds of the preferred securities sold by the trust. The Company had the right to redeem the subordinated debentures, in whole or in part, in a principal amount, with integral multiples of $1, on or after March 31, 2014 at 100% of the principal amount, plus accrued and unpaid interest.

31
The subordinated debentures were $0 and $5,278 at December 31, 2016 and 2015 and had a fixed rate of interest of 10.00%. On March 31, 2014, the Company exercised its right to redeem 13,200 of the trust preferred securities for $13,200 in cash. On March 31, 2015, the Company exercised its right to redeem 4,800 of the trust preferred securities for $4,800 in cash. On March 31, 2016, the Company redeemed the remainder of the subordinated debentures for net cash of $4,600, with $5,278 paid to the trust and the trust paying the Company for the $678 of the Company’s investment in the common stock of the trust. In March 2005, Central Bancshares KY Statutory Trust I, a trust formed by the Company, closed a pooled private offering of 15,000 trust preferred securities with a liquidation amount of $1 per security. The Company issued $15,464 of subordinated debentures to the trust in exchange for ownership of all of the common security of the trust and the proceeds of the preferred securities sold by the trust. The Company may redeem the subordinated debentures, in whole or in part, in a principal amount with integral multiples of $1, on or after June 15, 2010 at 100% of the principal amount, plus accrued and unpaid interest. The subordinated debentures mature on June 15, 2035. The subordinated debentures are redeemable, in whole or in part from time to time, upon the occurrence of specific events defined within the trust indenture. The Company has the option to defer interest payments on the subordinated debentures from time to time for a period not to exceed five consecutive years. The subordinated debentures have a variable rate of interest which was 2.71% at year-end 2016, equal to the sum of the three month London Interbank Offered Rate (“LIBOR”) and 1.75%. The Company’s investment in the common stock of the trust was $464 and is included in other assets. The subordinated debentures may be included in Tier I capital (with certain limitations applicable) under current regulatory guidelines and interpretations.
Line of Credit: The Company has an outstanding line of credit for $10,000 from a commercial bank for the purpose of securing additional funds for capital infusion to its subsidiaries or for debt service needs. As of December 31, 2016, the Company had not drawn upon this line. Terms of the line of credit include a variable interest rate equal to the sum of prime as published in The Wall Street Journal and 0.50% (4.25% as of December 31, 2016) with a floor of 4.75%, and monthly payments of interest only with the balance due at maturity on September 30, 2017. The line of credit is secured by 100% of the stock of Central Bank & Trust Co.
NOTE 10 – FAIR VALUE Fair value is the exchange price that would be received for an asset or paid to transfer a liability (exit price) in the principal or most advantageous market for the asset or liability in an orderly transaction between market participants on the measurement date. There are three levels of inputs that may be used to measure fair values:
Level 1: Quoted prices (unadjusted) for identical assets or liabilities in active markets that the entity has the ability to access as of the measurement date.
Level 2: Significant other observable inputs other than Level 1 prices such as quoted prices for similar assets or liabilities; quoted prices in markets that are not active; or other inputs that are observable or can be corroborated by observable market data.
Level 3: Significant unobservable inputs that reflect a reporting entity’s own assumptions about the assumptions that market participants would use in pricing an asset or liability.
The Company used the following methods and significant assumptions to estimate fair value:
Investment Securities: The fair values for investment securities are determined by obtaining quoted prices on nationally recognized securities exchanges (Level 1 inputs) or matrix pricing, which is a mathematical technique widely used in the industry to value debt securities without relying exclusively on quoted prices for the specific securities but rather by relying on the securities’ relationship to other benchmark quoted securities (Level 2 inputs). For securities where quoted prices or market prices of similar securities are not available, fair values are calculated using discounted cash flows or other market indicators (Level 3).
Impaired Loans: At the time a loan is considered impaired, it is valued at the lower of cost or fair value. Impaired loans carried at fair value generally receive specific allocations of the allowance for loan losses. For collateral dependent loans, fair value is commonly based on recent real estate appraisals. These appraisals may utilize a single valuation approach or a combination of approaches including comparable sales and the income approach. Adjustments are routinely made in the appraisal process by the independent appraisers to adjust for differences between the comparable sales and income data available. Such adjustments are usually significant and typically result in a Level 3 classification of the inputs for determining fair value. Non-real estate collateral may be valued using an appraisal, net book value per the borrower’s financial statements, or aging reports, adjusted or discounted based on management’s historical knowledge, changes in market conditions from the time of the valuation, and management’s expertise and knowledge of the client and the client’s business, resulting in a Level 3 fair value classification. Impaired loans are evaluated on a quarterly basis for additional impairment and adjusted accordingly.
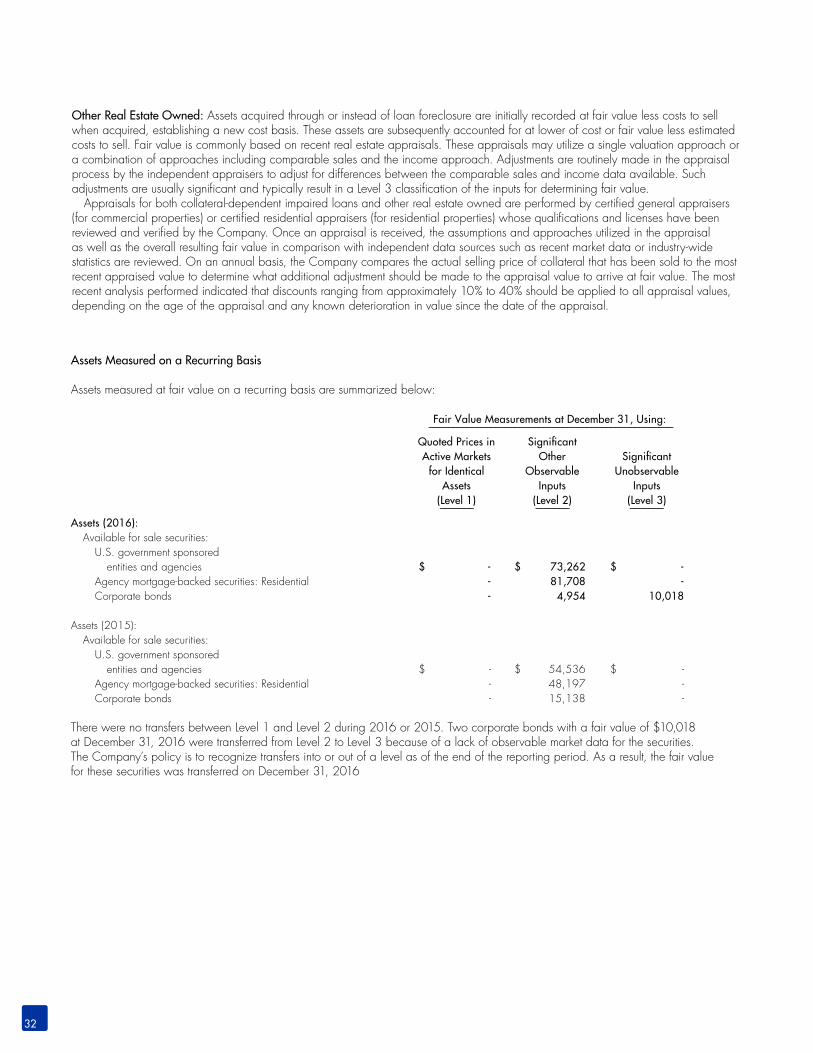
32
Assets Measured on a Recurring Basis
Assets measured at fair value on a recurring basis are summarized below:
Fair Value Measurements at December 31, Using: ––––––––––––––––––––––––––––––––––––––––––––––––––– Quoted Prices in Significant Active Markets Other Significant for Identical Observable Unobservable Assets Inputs Inputs (Level 1) (Level 2) (Level 3) ––––––– ––––––– –––––––Assets (2016): Available for sale securities: U.S. government sponsored entities and agencies $ - $ 73,262 $ - Agency mortgage-backed securities: Residential - 81,708 - Corporate bonds - 4,954 10,018
Assets (2015): Available for sale securities: U.S. government sponsored entities and agencies $ - $ 54,536 $ - Agency mortgage-backed securities: Residential - 48,197 - Corporate bonds - 15,138 -
There were no transfers between Level 1 and Level 2 during 2016 or 2015. Two corporate bonds with a fair value of $10,018 at December 31, 2016 were transferred from Level 2 to Level 3 because of a lack of observable market data for the securities. The Company’s policy is to recognize transfers into or out of a level as of the end of the reporting period. As a result, the fair value for these securities was transferred on December 31, 2016
Other Real Estate Owned: Assets acquired through or instead of loan foreclosure are initially recorded at fair value less costs to sell when acquired, establishing a new cost basis. These assets are subsequently accounted for at lower of cost or fair value less estimated costs to sell. Fair value is commonly based on recent real estate appraisals. These appraisals may utilize a single valuation approach or a combination of approaches including comparable sales and the income approach. Adjustments are routinely made in the appraisal process by the independent appraisers to adjust for differences between the comparable sales and income data available. Such adjustments are usually significant and typically result in a Level 3 classification of the inputs for determining fair value. Appraisals for both collateral-dependent impaired loans and other real estate owned are performed by certified general appraisers (for commercial properties) or certified residential appraisers (for residential properties) whose qualifications and licenses have been reviewed and verified by the Company. Once an appraisal is received, the assumptions and approaches utilized in the appraisal as well as the overall resulting fair value in comparison with independent data sources such as recent market data or industry-wide statistics are reviewed. On an annual basis, the Company compares the actual selling price of collateral that has been sold to the most recent appraised value to determine what additional adjustment should be made to the appraisal value to arrive at fair value. The most recent analysis performed indicated that discounts ranging from approximately 10% to 40% should be applied to all appraisal values, depending on the age of the appraisal and any known deterioration in value since the date of the appraisal.
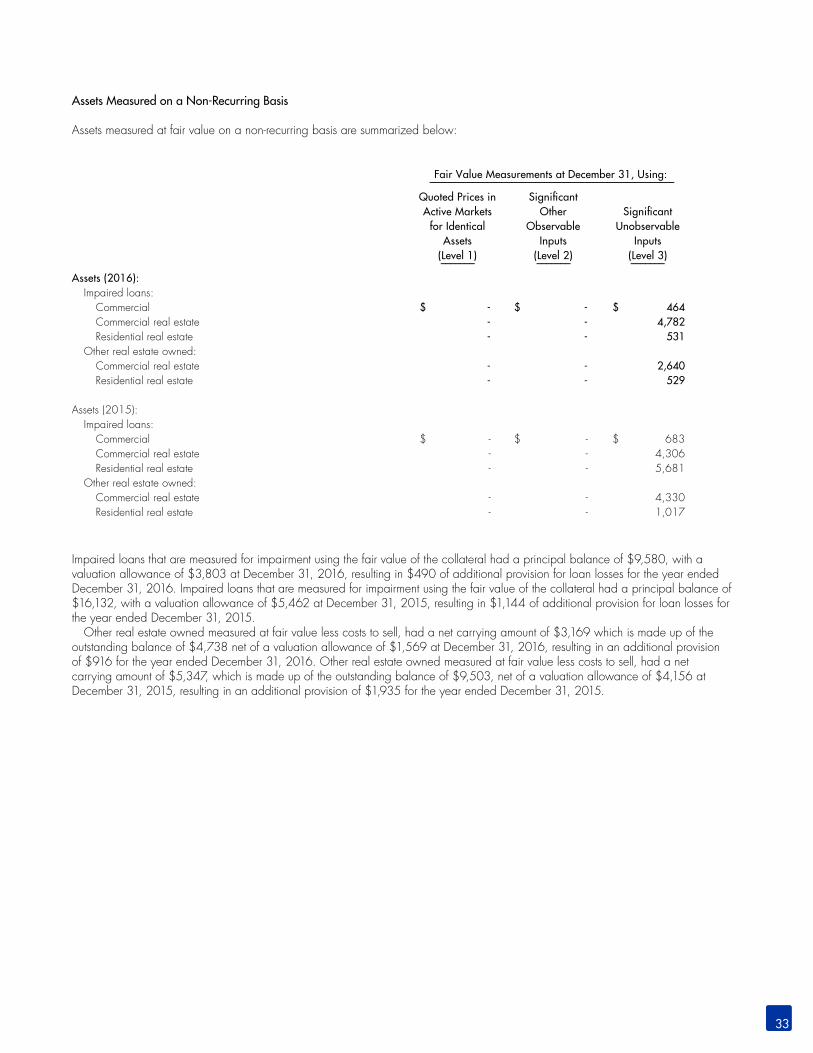
33
Assets Measured on a Non-Recurring Basis
Assets measured at fair value on a non-recurring basis are summarized below:
Fair Value Measurements at December 31, Using: ––––––––––––––––––––––––––––––––––––––––––––––––––– Quoted Prices in Significant Active Markets Other Significant for Identical Observable Unobservable Assets Inputs Inputs (Level 1) (Level 2) (Level 3) ––––––– ––––––– –––––––Assets (2016): Impaired loans: Commercial $ - $ - $ 464 Commercial real estate - - 4,782 Residential real estate - - 531 Other real estate owned: Commercial real estate - - 2,640 Residential real estate - - 529
Assets (2015): Impaired loans: Commercial $ - $ - $ 683 Commercial real estate - - 4,306 Residential real estate - - 5,681 Other real estate owned: Commercial real estate - - 4,330 Residential real estate - - 1,017
Impaired loans that are measured for impairment using the fair value of the collateral had a principal balance of $9,580, with a valuation allowance of $3,803 at December 31, 2016, resulting in $490 of additional provision for loan losses for the year ended December 31, 2016. Impaired loans that are measured for impairment using the fair value of the collateral had a principal balance of $16,132, with a valuation allowance of $5,462 at December 31, 2015, resulting in $1,144 of additional provision for loan losses for the year ended December 31, 2015. Other real estate owned measured at fair value less costs to sell, had a net carrying amount of $3,169 which is made up of the outstanding balance of $4,738 net of a valuation allowance of $1,569 at December 31, 2016, resulting in an additional provision of $916 for the year ended December 31, 2016. Other real estate owned measured at fair value less costs to sell, had a net carrying amount of $5,347, which is made up of the outstanding balance of $9,503, net of a valuation allowance of $4,156 at December 31, 2015, resulting in an additional provision of $1,935 for the year ended December 31, 2015.
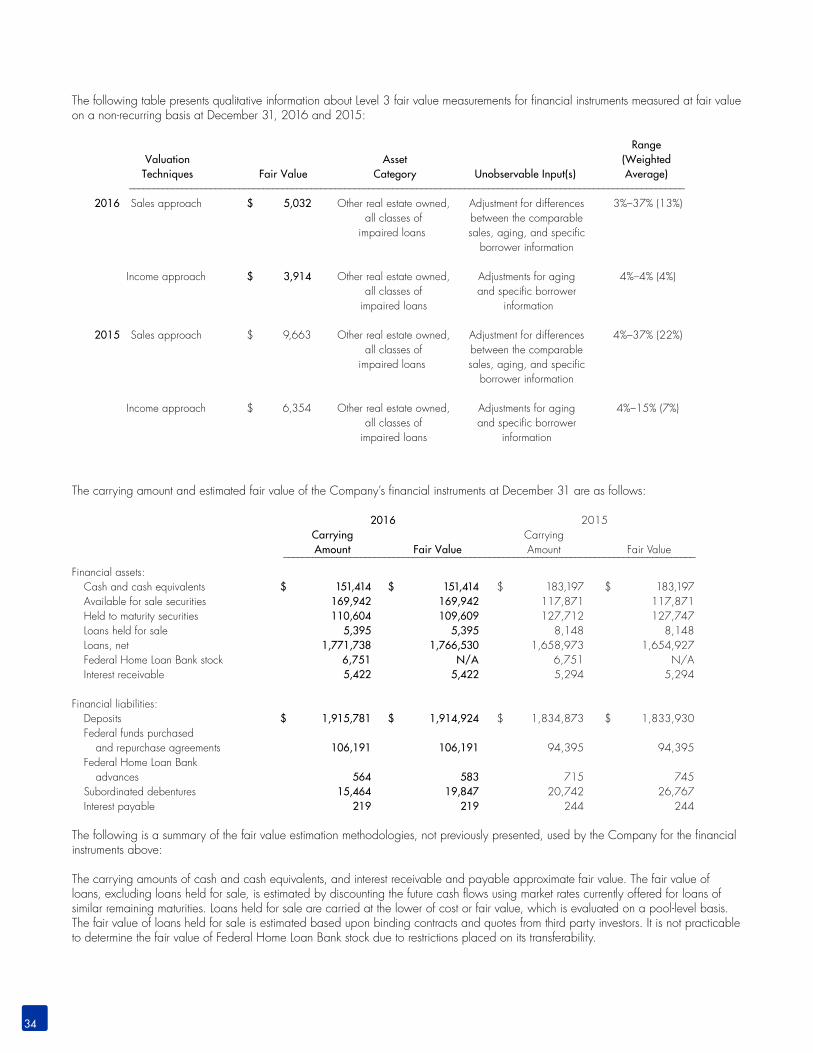
34
The following table presents qualitative information about Level 3 fair value measurements for financial instruments measured at fair value on a non-recurring basis at December 31, 2016 and 2015:
Range Valuation Asset (Weighted Techniques Fair Value Category Unobservable Input(s) Average) –––––––––––––––––––––––––––––––––––––––––––––––––––––––––––––––––––––––––––––––––––––––––––––––––––––––––––––––––––– 2016 Sales approach $ 5,032 Other real estate owned, Adjustment for differences 3%–37% (13%) all classes of between the comparable impaired loans sales, aging, and specific borrower information
Income approach $ 3,914 Other real estate owned, Adjustments for aging 4%–4% (4%) all classes of and specific borrower impaired loans information
2015 Sales approach $ 9,663 Other real estate owned, Adjustment for differences 4%–37% (22%) all classes of between the comparable impaired loans sales, aging, and specific borrower information
Income approach $ 6,354 Other real estate owned, Adjustments for aging 4%–15% (7%) all classes of and specific borrower impaired loans information
The carrying amount and estimated fair value of the Company’s financial instruments at December 31 are as follows:
2016 2015 Carrying Carrying Amount Fair Value Amount Fair Value ––––––––––––––––––––––––––––––––––––––––––––––––––––––––––––––––––––––––––––––––––––––Financial assets: Cash and cash equivalents $ 151,414 $ 151,414 $ 183,197 $ 183,197 Available for sale securities 169,942 169,942 117,871 117,871 Held to maturity securities 110,604 109,609 127,712 127,747 Loans held for sale 5,395 5,395 8,148 8,148 Loans, net 1,771,738 1,766,530 1,658,973 1,654,927 Federal Home Loan Bank stock 6,751 N/A 6,751 N/A Interest receivable 5,422 5,422 5,294 5,294 Financial liabilities: Deposits $ 1,915,781 $ 1,914,924 $ 1,834,873 $ 1,833,930 Federal funds purchased and repurchase agreements 106,191 106,191 94,395 94,395 Federal Home Loan Bank advances 564 583 715 745 Subordinated debentures 15,464 19,847 20,742 26,767 Interest payable 219 219 244 244
The following is a summary of the fair value estimation methodologies, not previously presented, used by the Company for the financial instruments above:
The carrying amounts of cash and cash equivalents, and interest receivable and payable approximate fair value. The fair value of loans, excluding loans held for sale, is estimated by discounting the future cash flows using market rates currently offered for loans of similar remaining maturities. Loans held for sale are carried at the lower of cost or fair value, which is evaluated on a pool-level basis. The fair value of loans held for sale is estimated based upon binding contracts and quotes from third party investors. It is not practicable to determine the fair value of Federal Home Loan Bank stock due to restrictions placed on its transferability.

35
The fair value of non-interest bearing deposits is the amount payable on demand. The fair value of interest bearing deposits is estimated using market rates currently offered for deposits of similar remaining maturities. The carrying amount is the estimated fair value for federal funds purchased and repurchase agreements that reprice frequently and fully. The fair value of Federal Home Loan Bank advances and the subordinated debentures is estimated based on rates currently available to the Company for borrowings with similar terms and remaining maturities. The estimated fair value of commitments to extend credit and standby letters of credit is estimated using fees currently charged for similar arrangements and is not material in relation to the consolidated financial statements.
NOTE 11 – INCOME TAXESThe provision for income taxes consists of the following:
2016 2015 –––––––––––––––––––––––––––––––––––––––– Current $ 2,597 $ 2,579 Deferred 1,274 518 –––––––––––––– ––––––––––––– $ 3,871 $ 3,097
The tax provision is less than that obtained by using the statutory federal income tax rates due to tax credits generated by Central Bank & Trust Co.’s limited partnership interest in 17 low-income housing projects, one New Market Tax Credit project, ownership of Qualified Zone Academy Bonds, and tax exempt interest income totaling $2,820 and $3,461 for 2016 and 2015. Deferred tax assets and liabilities relate principally to unrealized losses on securities available for sale, adjustment for pension obligations, premises and equipment, mortgage servicing rights, the allowance for loan losses, Federal Home Loan Bank stock dividends, fair value adjustments, prepaid pension benefits, other real estate owned losses, partnership investments, and net operating loss carryforwards generated by Central Bank of Jefferson County prior to the Company’s acquisition. At December 31, 2016, the Company had net operating loss carryforwards of $788 which expire in 2025. Deferred tax assets are recognized for net operating losses because the benefit is more likely than not to be realized. The utilization of the net operating loss carryforwards is limited annually under Internal Revenue Code Section 382.
The Company’s deferred tax assets and deferred tax liabilities at December 31 were as follows:
2016 2015 –––––––––––––––––––––––––––––––––––––––– Deferred tax assets $ 21,834 $ 23,402 Deferred tax liabilities (6,919) (7,230) –––––––––––––– ––––––––––––– $ 14,915 $ 16,172
Valuation allowances are established when necessary to reduce deferred tax assets to the amount expected to be realized. No valuation allowance for the realization of deferred tax assets is considered necessary. The Company has no unrecognized tax benefits as of December 31, 2016 and 2015. The Company does not expect the total amount of unrecognized tax benefits to significantly increase or decrease in the next 12 months. Should the accrual of any interest or penalties relative to unrecognized tax benefits be necessary, it is the Company’s policy to record such accruals in its income tax expense accounts; no such accruals existed as of December 31, 2016 and 2015. The Company and its subsidiaries file a consolidated U.S. Corporation federal income tax return and the Company and its non-bank subsidiaries file Kentucky Corporation income tax returns. The federal return is subject to examination by taxing authorities for all years after 2012 and the Kentucky returns are subject to examination by taxing authorities for all years after 2011. The Company has certain returns that are subject to examination for the 2004 tax year.

36
NOTE 12 – RETIREMENT PLANSThe Company has a funded noncontributory defined benefit pension plan covering substantially all employees with five or more years of service prior to December 31, 2009. The plan generally provides pension benefits that are based on compensation levels and years of service. Annual contribution to the plan is made according to established laws and regulations. Plan assets are primarily invested in equity securities, fixed income securities and cash equivalents. The plan provides defined benefits based on years of service and final average salary. The Company uses December 31 as the measurement date for its pension plans. The Company also maintains a non-qualified supplemental pension plan covering certain key executives, which provides for benefit payments that exceed the limit for deductibility imposed by income tax regulations. The benefit obligation related to this unfunded plan was $4,619 and $4,176 at December 31, 2016 and 2015. Amounts recognized in accumulated other comprehensive income (loss) related to this plan at December 31, 2016 and 2015 were $(933) and $(918) and were the result of a net actuarial loss in the plan. During 2009, the Company curtailed these defined benefit plans, fully vesting and freezing benefits for all employees. The Company expects to make no contributions to the plans in 2017.
Information about plan assets, obligations, contributions, and benefits paid follows:
December 31, 2016 2015 –––––––––––––––––––––––––––––––––––––– Benefit obligation $ (31,576) $ (32,131) Fair value of plan assets 27,994 28,821 –––––––––––––– –––––––––––––– Funded status $ (3,582) $ (3,310) 2016 2015 –––––––––––––––––––––––––––––––––––––– Employer contributions $ - $ - Benefits paid 1,865 865
The following benefit payments are expected:
2017 $ 828 2018 766 2019 834 2020 981 2021 1,165 2022–2026 7,892
Amounts recognized in accumulated other comprehensive income (loss) at December 31, 2016 and 2015 were $(8,383) and $(8,881) and were the result of a net actuarial loss in the plan.
The accumulated benefit obligation was $31,576 and $32,131 at year-end 2016 and 2015.

37
Components of net periodic pension cost and other amounts recognized in other comprehensive income (loss) for 2016 and 2015 for the Company’s defined benefit pension plans included the following
2016 2015 –––––––––––––––––––––––––––––––––––––––– Interest cost on projected benefit obligation $ 1,360 $ 1,340 Expected return on plan assets (1,220) (1,243) Amortization of net gain (loss) 630 600 ––––––––––––––– –––––––––––––– Net periodic pension cost 770 697 ––––––––––––––– ––––––––––––––
Net gain (loss) 132 923 Amortization of net gain (loss) (630) (600) ––––––––––––––– –––––––––––––– Total recognized in other comprehensive income (loss) (498) 323 ––––––––––––––– –––––––––––––– Total recognized in net periodic pension cost and other comprehensive income (loss) $ 272 $ 1,020
The estimated net loss for the defined benefit pension plan that will be amortized from accumulated other comprehensive income (loss) into net periodic pension cost over the next fiscal year was $581 and $630 as of December 31, 2016 and 2015. The weighted-average assumptions used to determine net periodic pension cost were a discount rate and expected return on plan assets of 4.25% for 2016 and 2015. The weighted-average assumptions used to determine pension benefit obligations were a discount rate and expected return on plan assets of 4.25% for year-end 2016 and 2015.
Plan Assets: The Company’s overall investment strategy is to achieve a mix of long-term growth and fixed income investments. The target allocations for plan assets for 2016 are to maintain an asset mix of approximately 40% equities and 60% fixed income debt securities. Equity securities primarily include investments in mutual funds and blue chip stocks. Fixed income debt securities include agency securities and municipal securities. The weighted-average expected long-term rate of return is estimated based on current trends in the plan assets as well as projected future rates of return on those assets. The long-term rate of return considers historical returns.
The Company’s pension plan asset allocation at year-end 2016 and 2015, and expected long-term rate of return by asset category are as follows: Weighted- Percentage of Plan Average Expected Assets at Year-End Long-Term RateAsset Class 2016 2015 of Return ––––––––– ––––––––– ––––––––– Equities: Common stock 25.85% 27.02% 6.00%–8.00% Mutual funds 16.73 13.80 6.00%–8.00% Real estate investment trust 0.74 2.01 6.00%–8.00% Fixed income: Cash and cash equivalents 2.26 1.02 0.00% Debt securities: U.S. government agency securities 0.00 0.00 4.00% Obligations of states and political subdivisions 54.42 56.15 4.00% ––––––––– ––––––––– 100.00% 100.00% Fair Value of Plan Assets: The Company used the following valuation methods and assumptions to estimate the fair value of assets held by the plan:
Equities: The fair values for equity securities, including common stock, mutual funds, and the real estate investment trust, are determined by quoted market prices (Level 1).
Fixed Income Debt Securities: The fair values for fixed income debt securities are determined by quoted market prices, if available (Level 1). For securities where quoted prices are not available, fair values are calculated based on market prices of similar securities (Level 2).

38
The fair value of the plan assets at December 31, 2016 and 2015, by asset category, is as follows:
Fair Value Measurements at December 31 Using: ––––––––––––––––––––––––––––––––––––––––––––––– Significant Quoted Prices in Other Significant Active Markets for Observable Unobservable Carrying Identical Assets Inputs Inputs Value (Level 1) (Level 2) (Level 3) –––––– –––––– –––––– ––––––2016Plan assets: Cash and cash equivalents $ 632 $ 632 $ - $ - Equities: Common stock 7,239 7,239 - - Mutual funds 4,683 4,683 - - Real estate investment trust 206 206 - - Fixed income debt securities: Obligations of states and political subdivisions 15,233 - 15,233 - –––––––––––––––––– –––––––––––––––––– ––––––––––––––––– –––––––––––––––––– Total plan assets $ 27,993 $ 12,760 $ 15,233 $ -
2015Plan assets: Cash and cash equivalents $ 294 $ 294 $ - $ - Equities: Common stock 7,786 7,786 - - Mutual funds 3,979 3,979 - - Real estate investment trust 579 579 - - Fixed income debt securities: U.S. government agency securities 1 - 1 - Obligations of states and political subdivisions 16,182 - 16,182 - –––––––––––––––––– –––––––––––––––––– ––––––––––––––––– –––––––––––––––––– Total plan assets $ 28,821 $ 12,638 $ 16,183 $ -
There were no transfers between Level 1 and Level 2 during 2016 or 2015.
Deferred Compensation Plans: The Company maintains deferred compensation plans covering selected directors and key employees. Net deferred compensation expense was $92 and $94 in 2016 and 2015. The accrued liability associated with these plans of $1,163 and $1,070 at December 31, 2016 and 2015 is included in other liabilities.
Employee Stock Ownership Plan: The Company maintains an employee stock ownership plan (the “ESOP”). Contributions are determined annually by the Board of Directors in amounts not to exceed 15 percent of the total compensation of all participants. ESOP expense was $1,181 and $693 in 2016 and 2015. As of December 31, 2016 and 2015, a total of 37,466 and 37,532 shares with a fair value of $25,964 and $23,833 were allocated to active participants as well as $112 and $75 in cash. There were no unallocated shares. Any participant who receives a distribution of Company stock under the ESOP has the option to require the Company to repurchase the shares at fair value during a defined period within each of the succeeding two years. The total “put” obligation at December 31, 2016 is the fair value of all ESOP shares distributed in 2016 and shares to be distributed in 2017 to participants who had terminated as of year-end 2016. The Company has a right of first refusal with respect to distributed ESOP shares, which requires former participants to offer to sell their shares to the Company before selling them to another purchaser.
401(k) Retirement Plan: The Company has a 401(k) retirement plan. The Company determines annually the rate at which employee contributions will be matched and the maximum amount of employee contributions which will be matched. The Company made matching contributions totaling $1,611 and $1,359 in 2016 and 2015.

39
NOTE 13 – REGULATORY MATTERSBanks and bank holding companies are subject to regulatory capital requirements administered by federal banking agencies. The Company is a bank holding company and is subject to regulation by the Federal Reserve. Central Bank & Trust Co. and Central Bank of Jefferson County, Inc. operate under state bank charters and are subject to regulation by the Kentucky Department of Financial Institutions and the Federal Deposit Insurance Corporation. Capital adequacy guidelines and, additionally for banks, prompt corrective action regulations, involve quantitative measures of assets, liabilities, and certain off-balance-sheet items calculated under regulatory accounting practices. Capital amounts and classifications are also subject to qualitative judgments by regulators. Failure to meet capital requirements can initiate regulatory action. The final rules implementing the Basel Committee on Banking Supervision’s capital guidelines for U.S. banks (Basel III rules) became effective for the Company on January 1, 2015 with full compliance with all of the requirements being phased in over a multi-year schedule and fully phased in by January 1, 2019. Under the Basel III rules, the Company must hold a capital conservation buffer above the adequately capitalized risk-based capital ratios. The capital conservation buffer is being phased in from 0.0% in 2015 to 2.50% by 2019. The capital conservation buffer for 2016 is 0.625%. The net unrealized gain or loss on available for sale securities is not included in computing regulatory capital. Management believes as of December 31, 2016, the Company and Banks meet all capital adequacy requirements to which they are subject. Prompt corrective action regulations provide five classifications: well capitalized, adequately capitalized, undercapitalized, significantly undercapitalized, and critically undercapitalized, although these terms are not used to represent overall financial condition. If adequately capitalized, regulatory approval is required to accept brokered deposits. If undercapitalized, capital distributions are limited, as are asset growth and expansion, and capital restoration plans are required. At year-end 2016 and 2015, the most recent regulatory notifications categorized the Banks as well capitalized under the regulatory framework for prompt corrective action. There are no conditions or events since that notification that management believes have changed the institutions’ category.
Actual and required capital amounts and ratios, exclusive of capital conservation buffers, are presented below:
To Be Well Capitalized For Capital Under Prompt Corrective Actual Adequacy Purposes Action Provisions Amount Ratio Amount Ratio Amount Ratio ––––––––––––––––––––––––––––––––––––––––––––––––––––––––––––––––––––––––––––––––––––– December 31, 2016Total Capital (to Risk-Weighted Assets): Consolidated $ 262,074 13.4% $ 156,770 8.0% N/A N/A Central Bank & Trust Co. 239,345 13.1 145,728 8.0 $ 182,161 10.0% Central Bank of Jefferson County, Inc. 20,938 14.7 11,383 8.0 14,228 10.0 Tier I Capital (to Risk-Weighted Assets): Consolidated $ 241,492 12.3% $ 117,577 6.0% N/A N/A Central Bank & Trust Co. 220,120 12.1 109,296 6.0 $ 145,728 8.0% Central Bank of Jefferson County, Inc. 19,581 13.8 8,537 6.0 11,383 8.0 Common Tier I (CET 1): Consolidated $ 226,246 11.6% $ 88,183 4.5% N/A N/A Central Bank & Trust Co. 220,120 12.1 81,972 4.5 $ 118,404 6.5% Central Bank of Jefferson County, Inc. 19,581 13.8 6,403 4.5 9,248 6.5 Tier I Capital (to Average Assets): Consolidated $ 241,246 10.6% $ 90,736 4.0% N/A N/A Central Bank & Trust Co. 220,120 10.4 84,354 4.0 $ 105,442 5.0% Central Bank of Jefferson County, Inc. 19,581 11.3 6,941 4.0 8,676 5.0
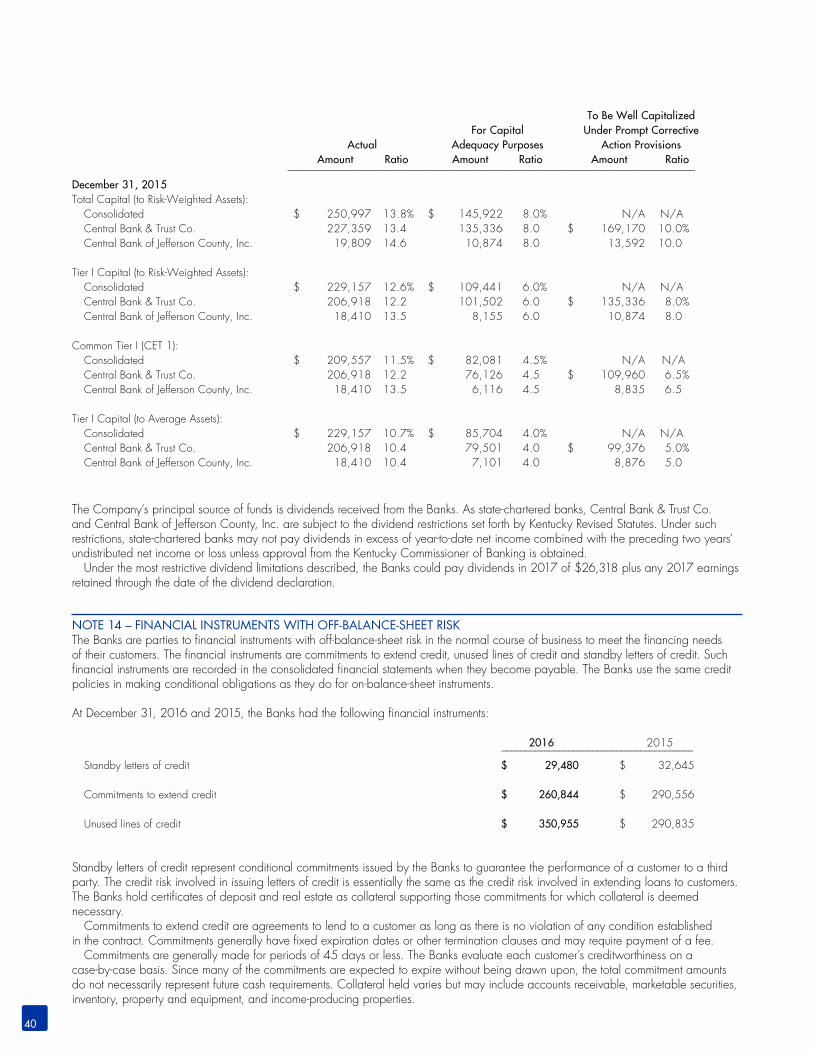
40
The Company’s principal source of funds is dividends received from the Banks. As state-chartered banks, Central Bank & Trust Co. and Central Bank of Jefferson County, Inc. are subject to the dividend restrictions set forth by Kentucky Revised Statutes. Under such restrictions, state-chartered banks may not pay dividends in excess of year-to-date net income combined with the preceding two years’ undistributed net income or loss unless approval from the Kentucky Commissioner of Banking is obtained. Under the most restrictive dividend limitations described, the Banks could pay dividends in 2017 of $26,318 plus any 2017 earnings retained through the date of the dividend declaration.
NOTE 14 – FINANCIAL INSTRUMENTS WITH OFF-BALANCE-SHEET RISKThe Banks are parties to financial instruments with off-balance-sheet risk in the normal course of business to meet the financing needs of their customers. The financial instruments are commitments to extend credit, unused lines of credit and standby letters of credit. Such financial instruments are recorded in the consolidated financial statements when they become payable. The Banks use the same credit policies in making conditional obligations as they do for on-balance-sheet instruments.
At December 31, 2016 and 2015, the Banks had the following financial instruments:
2016 2015 –––––––––––––––––––––––––––––––––––––––– Standby letters of credit $ 29,480 $ 32,645 Commitments to extend credit $ 260,844 $ 290,556 Unused lines of credit $ 350,955 $ 290,835
Standby letters of credit represent conditional commitments issued by the Banks to guarantee the performance of a customer to a third party. The credit risk involved in issuing letters of credit is essentially the same as the credit risk involved in extending loans to customers. The Banks hold certificates of deposit and real estate as collateral supporting those commitments for which collateral is deemed necessary. Commitments to extend credit are agreements to lend to a customer as long as there is no violation of any condition established in the contract. Commitments generally have fixed expiration dates or other termination clauses and may require payment of a fee. Commitments are generally made for periods of 45 days or less. The Banks evaluate each customer’s creditworthiness on a case-by-case basis. Since many of the commitments are expected to expire without being drawn upon, the total commitment amounts do not necessarily represent future cash requirements. Collateral held varies but may include accounts receivable, marketable securities, inventory, property and equipment, and income-producing properties.
To Be Well Capitalized For Capital Under Prompt Corrective Actual Adequacy Purposes Action Provisions Amount Ratio Amount Ratio Amount Ratio ––––––––––––––––––––––––––––––––––––––––––––––––––––––––––––––––––––––––––––––––––––– December 31, 2015Total Capital (to Risk-Weighted Assets): Consolidated $ 250,997 13.8% $ 145,922 8.0% N/A N/A Central Bank & Trust Co. 227,359 13.4 135,336 8.0 $ 169,170 10.0% Central Bank of Jefferson County, Inc. 19,809 14.6 10,874 8.0 13,592 10.0 Tier I Capital (to Risk-Weighted Assets): Consolidated $ 229,157 12.6% $ 109,441 6.0% N/A N/A Central Bank & Trust Co. 206,918 12.2 101,502 6.0 $ 135,336 8.0% Central Bank of Jefferson County, Inc. 18,410 13.5 8,155 6.0 10,874 8.0 Common Tier I (CET 1): Consolidated $ 209,557 11.5% $ 82,081 4.5% N/A N/A Central Bank & Trust Co. 206,918 12.2 76,126 4.5 $ 109,960 6.5% Central Bank of Jefferson County, Inc. 18,410 13.5 6,116 4.5 8,835 6.5 Tier I Capital (to Average Assets): Consolidated $ 229,157 10.7% $ 85,704 4.0% N/A N/A Central Bank & Trust Co. 206,918 10.4 79,501 4.0 $ 99,376 5.0% Central Bank of Jefferson County, Inc. 18,410 10.4 7,101 4.0 8,876 5.0

41
Central Bancshares, Inc. andCentral Bank & Trust Co.Board of Directors
Luther Deaton, Jr. Chairman, President & CEO Central Bancshares, Inc. andCentral Bank & Trust Co.
Joan D. Kincaid Vice Chairman of the BoardCentral Bancshares, Inc. and Central Bank & Trust Co.
Michael D. Foley Partner Ray, Foley, Hensley & Company, PLLCCertified Public Accountants
Wilbert W. James, Jr.President, Toyota Motor Manufacturing, Kentucky, Inc.
Wayne M. MartinVice President of Development, Retail Division, Booth Energy
Nick Nicholson Retired Keeneland Association, Inc.
G. Michael RitchieExecutive Vice President Quantum Spatial, Inc.
Paul E. Sullivan PartnerFrost Brown Todd, LLC
Central Bank, GeorgetownAdvisory Board of Directors
Dallas BlankenshipRetired SuperintendentScott County Board of Education
Mason “Butch” GlassCommunity Volunteer
William C. HaughCEO, Georgetown Community Hospital
George H. LusbyScott County Judge-Executive
Kimberly E. MarshallMarket President
Randy MasonOwner-Operator, McDonald’s
W. Thomas PratherChairman, Central Bank, Georgetown & Mayor of Georgetown
Central Bank, LexingtonAdvisory Board of Directors
Rick AvareMAP Entities
Jeremy BatesPresident, Bates Security
Anthany BeattyU.K. Campus Services & Public Safety
Jed BullardOwner, E.D. Bullard Company
Michael CoxPresident, Denham-Blythe Co., Inc.
Pat HaydenRetired, Rector Hayden Real Estate
Dr. John HobbsCentral Internal Medicine
Glenn HoskinsAttorney, Webb, Hoskins, Brown & Thompson, PSC
Dave HouchinPresident, Intech Contracting, LLC
Debbie LongOwner, Dudley’s on Short
Mark NabityPresident, Grayhawk, LLC
Bruce PierattOwner, Pieratt’s
Bill QuiggPresident, Richmond Baking Company
Ed QuinnPresident & CEO, R.J. Corman Railroad Company
Dr. Marcus RandallPresident, Kentucky Medical Services Foundation
Nick RowePresident, Kentucky American Water Co.
Kenny SchompPresident & Owner, Lexington Truck Sales, Inc.
Charlie ScrogginSenior Vice President, HDRQuest Engineers, Inc.
Linda SlagelPresident, High Bridge Spring Water
Dr. Russell TravisTravis Neurosurgical Consulting
Randy WalkerPresident, Randy Walker Electrical Contractors, Inc.
Greg White, DDSWhite, Greer and Maggard Orthodontists
Brian Wood Founder & CEOBC Wood Properties, Inc.
Central Bank, Madison County Advisory Board of Directors
Dianna Ackerman Broker/Owner, ERA Professional Hometown Services
Frankie C. Blevins, Jr.Attorney, Blevins Law, LLC
Robert R. BlytheEKU ProfessorPastor, First Baptist Church
James R. CarrBuilder and Developer
Shannon Combs Partner, Combs, Parsons and Collins Funeral Home
Jeff FultzMarket President
James Ernest HillardOwner, Middletown Industrial
Mike Rice Owner, Cars of Kentucky, Inc.
Rita H. SmartOwner, The Bennett House
Central Bank, NicholasvilleAdvisory Board of Directors
Joan D. KincaidVice Chairman of the BoardCentral Bancshares, Inc.
Sandra J. AdamsOwner, Zaxby’s
Michael D. Foley Partner Ray, Foley, Hensley & Company, PLLC Certified Public Accountants
Ben A. RainwaterTutt Construction
Paul E. Sullivan Partner, Frost Brown Todd, LLC
Benjamin G. TaylorTaylor Made Farm & Sales Agency, Inc.
Alan S. VanArsdallMarket President
Central Bank, Northern Kentucky Advisory Board of Directors Mark AyerManaging MemberReading Investments, LLC
Tonya Burns-GerakosTonya Burns Law
Chris CarleSenior Vice President, COOSt. Elizabeth Healthcare, Florence
Helen CarrollRetired, Community RelationsToyota Motor Manufacturing
David HeidrichCEO, Zalla Companies
Kim PattonCOO, SFA/PDT Architects
Doug RidenourPresident, Federal Equipment
Greg SchrandPresident, GSE, Inc.
Gregory ShumateMember, Frost Brown Todd, LLC
James Uebel Market President
John YeagerOwner, Ashley Development
BOARDS OF DIRECTORS

42
BOARDS OF DIRECTORS
Central Bank, WinchesterAdvisory Board of Directors
Gerald F. (Kelly) Healy IIIDirector of Operations McDonald’s
Glenn LeveridgeMarket President
Rex McCrary, D.M.D.Dentist
Jeff MonohanAssistant Vice President The Allen Company
Ralph J. PalmerPresident, Palmer Engineering Co.
Patricia M. SmithPresident, MD Consulting, Inc.
Robert Strode Retired
Mary Jane WarnerManager of Power Delivery, East Kentucky Power Cooperative, Inc.
Central Bank of Jefferson County Board of Directors
Jonathan S. BlueChairman, Blue Equity, LLC
Ronald L. CarmicleChairman, Central Bank of Jefferson County Partner, McCall Group
Marcia CassadyDirector, Capital Link Consultants
Luther Deaton, Jr. CEO, Central Bank of Jefferson County
Michael D. Foley Partner Ray, Foley, Hensley & Company, PLLC Certified Public Accountants
William P. MaloneRetired, Deming, Malone, Livesay & Ostroff
William E. Summers, IVRetired, Deputy Mayor, Louisville Metro Government
Jude ThompsonOwner & CEO, Transform Business Solutions, LLC
Mark Wheeler Market President

43
OFFICERS
Central Bancshares, Inc.
Luther Deaton, Jr. Chairman, President & CEO
Joan D. Kincaid Vice Chairman
Susan L. Simmons Vice President
Ranee LelandVice PresidentCorporate Secretary
Edward BarnesTreasurer
Central Bank, Lexington
ADMINISTRATION
Luther Deaton, Jr. Chairman, President & CEO
Ranee LelandVice PresidentCorporate Secretary
Auditing
Craig L. Daniels, CPA Executive Vice President
Lisa S. Grant, CRCMVice President & Compliance Officer
Donna J. Craven, CRCMVice President
Danny C. NolandVice President
John T. Miner, Jr.Auditing Officer
COMMERCIAL BANKING
Gregory A. Bibb Executive Vice President
Corporate Services
Karen Rowland, CTPSenior Vice President
Joan Patterson, CTPVice President
Lisa K. Vickers Vice President
Chris CampbellAssistant Vice President
Allison CarterAssistant Vice President
Matt RatliffAssistant Vice President
Credit Administration
Jason A. SmithVice President
Samuel CollinsCredit Analyst Officer
Adam RodgersCredit Analyst Officer
Loan Review
Marie A. YoungVice President
David ChrismanSenior Vice President
D. Keith PrestonVice President
Leigh M. CarrAssistant Vice President
LeeAnn LayneAssistant Vice President
Loan Processing
Donna M. TurnerVice President
Special Assets
Ellen Sharp Vice President
Steve HallVice President
Julie SzymanskiVice President
Becky MullinsSpecial Assets Officer
Commercial Lending
Mark KaufmannSenior Vice President
Mark R. Fox Vice President
David RossVice President
Jake SchirmerVice President
Shane AndersonAssistant Vice President
Stephen J. MalloryAssistant Vice President
Consumer Lending
Jerry F. Smalley Vice President
Mortgage Lending
Paul R. ThornsberrySenior Vice President
Megan BarlowVice President
Paul B. DrakeVice President
Jordan OwensAssistant Vice President
Small Business
Ernest W. DolihiteSenior Vice President
Richard D. Hartley Vice President
Jeff MurphyVice President
Terri A. Stein Vice President
Central Bank Mortgage
Ed WorkmanSenior Vice President
Susan BradleyVice President
Tom BreathittVice President
Brad FieldsVice President
Catherine HimesVice President
Lorraine KinleyVice President
Brian W. West Vice President
Lisa Hart Assistant Vice President
Vina Risner Assistant Vice President
Alicia Esenbock Secondary Mortgage Underwriter
HUMAN RESOURCES
Susan L. Simmons Executive Vice President
Amy ManningSenior Vice President
Shelia Plymale Senior Vice President
June CarpenterHuman Resources Officer
TECHNOLOGY SERVICES
Julie Bondra Executive Vice President
Anna ClaytonVice President
Kevin J. LippertVice President
E. Sean ProfittVice President
David HakeInformation Security Officer
Jason HollisInfrastructure Officer

44
OFFICERS
RETAIL BANKING
David L. Moore Executive Vice President
Michael GartnerSenior Vice President
Chris McGaugheyCRA Community Development Officer
Banking Centers
Gina EnsmingerAssistant Vice President
Angela M. FrieszAssistant Vice President
Karen Lackey Assistant Vice President
Philip RochesterAssistant Vice President
Lana AlexanderRetail Banking Officer
Jeffrey BentonRetail Banking Officer
Sharon BradleyRetail Banking Officer
Barbara JohnsonRetail Banking Officer
Pamela MatneyRetail Banking Officer
Laura M. OwensRetail Banking Officer
Ashley N. RodgersRetail Banking Officer
Alexandra E. TerryRetail Banking Officer
Client Services
Cathy K. Combs Senior Vice President
Diane Williams Client Services Officer
FINANCIAL PLANNING AND CONTROL
Edward BarnesExecutive Vice President & CFO
Robin OliverSenior Vice President
Lisa A. WilliamsonAssistant Vice President
Mark KendallFinancial Planning Officer
ENTERPRISE RISKMANAGEMENT
C. Gregory StacyExecutive Vice President
Beth Lakes RobinsonVice President
Funds Management
James R. NallAssistant Vice President
MARKETING
Stephen C. Kelly Executive Vice President
Lesley K. CatronMarketing Officer
Correspondent Banking
Doug Flynn Correspondent Banking Officer
OPERATIONS AND SUPPORT
Operations
Laura SchweitzerExecutive Vice President
Karen G. Crawley Senior Vice President
Robin Michul Senior Vice President
Harvey SwordVice President
Internet Banking
Brenda P. Oaks Assistant Vice President
Card Services
Beverly Smalley Assistant Vice President
Loan Services
Timothy R. AustinAssistant Vice President
Shawn PresnellVice President
Deposit Services
Lisa DurhamVice President
Bruce McHoneDeposit Services Officer
Bank Security
Shane EnsmingerVice President & Security Officer
Angela D. CampbellBSA/AML & Operations Officer
WEALTH MANAGEMENT
Trust
Barry HickeyExecutive Vice President
Business Development
Charles N. Rush, Jr.Vice President
Employee Benefits
Vicky L. Foster Vice President
Sheila C. Parks Vice President
Operations
Gayle DockeryAssistant Vice President
Personal Trust
Kathryn Wilson GibsonSenior Vice President
Elizabeth Johns Vice President
Eloise G. Penn Vice President
Anna HovekampAssistant Vice President
Lauren LovelyTrust Officer
Chris TaylorTrust Officer
Investment Management
Timothy D. FyffeSenior Vice President
Thomas CorrVice President
R. Scott KingVice President
Private Banking
Gregory M. ShewmakerExecutive Vice President
Rita L. BuggVice President
Leslie FanninVice President
Alicia JordanVice President
Mark RuddellVice President
Christopher ThomasonVice President
Matthew Frank, CFP®
Assistant Vice President
CENTRAL INSURANCE SERVICES
Ross BarnettePresident
Tom FrancisVice President
Rob WesselVice President
Justin WhippleVice President
Steven P. WrightVice President
Don YadenVice President
Beverly HicksCommercial Insurance Officer

CONNECTED TO THE PEOPLE WE SERVE
OFFICERS
CENTRAL INVESTMENT CENTER, INC.
Jeff GinnanExecutive Vice President & Senior Financial Advisor
Jeff Fields, CRPS®
Vice President & Financial Advisor
Tony BrownFinancial Advisor
Ballard “Cash” CassadyFinancial Advisor
Jim DeMossFinancial Advisor
Deborah FisherFinancial Advisor
Jacobus M. Ockers Financial Advisor
Thomas E. Roberts, CFP®
Financial Advisor
Jennifer Wilson Financial Advisor
CENTRAL BANK, GEORGETOWN
Kimberly E. MarshallMarket President
Jennifer J. RobertsVice President
Patricia Voigt Vice President
Jennifer BaldwinAssistant Vice President
Mortgage Lending
Ashley WeirVice President
CENTRAL BANK, MADISON COUNTY
Jeff FultzMarket President
Cameron AbneySenior Vice President &Senior Market Lender
Scott JohnsonVice President
Ken RileyVice President
Jeremy MeadowsRetail Banking Officer
Mortgage Lending
Donna HaneyVice President
CENTRAL BANK, NICHOLASVILLE
Alan S. VanArsdallMarket President
Cathy LoweVice President
Jill SloneAssistant Vice President
Kathy MooreRetail Banking Officer
Brandy OsborneCommercial Lending Officer
Mortgage Lending
Marcus P. HanksVice President
Monna Treadway Assistant Vice President
CENTRAL BANK, NORTHERN KENTUCKY
James UebelMarket President
Brett BlackwellSenior Vice President & Senior Market Lender
Donald BenzingerVice President
Matthew E. EilersVice President
Karen J. HomanVice President
Joshua LehmanAssistant Vice President
JB SchmidtCommercial Lending Officer
Mortgage Lending
Dennis BarnesVice President
Retail Banking
Troy FeddersVice President
Jeffrey WagnerVice President
Diana WebsterVice President & Retail Development Officer
Private Banking
John FinleySenior Vice President
Karen HartigVice President
Larry LuebbersVice President
CENTRAL BANK, WINCHESTER
Glenn LeveridgeMarket President
Tim M. DuncanSenior Vice President
Tammy M. CarrollVice President & Retail Development Officer
Lisa T. EarlywineVice President
Debbie BanksRetail Banking Officer
Erica ParksCommercial Lending Officer
Mortgage Lending
Lee ColemanVice President
Amy TurnerVice President
CENTRAL BANK,JEFFERSON COUNTY
Luther Deaton, Jr.CEO
Mark WheelerMarket President
Shane Ensminger Vice President & Security Officer
Lisa S. Grant, CRCMVice President &Compliance Officer
Commercial Banking
Amy SullivanSenior Vice President &Senior Market Lender
Joan StraferVice President
Cynthia CaldwellAssistant Vice President
Mortgage Lending
Jeanie GammonVice President
Retail Banking
David BondVice President & Retail Development Officer
Elaine FawbushAssistant Vice President
Tanner GreenwellRetail Banking Officer
Private Banking
Robert SliderSenior Vice President
Mary LittrellVice President
Jim MorrisVice President
Wealth Management
Bill KaiserVice President
45

Central Bank & Trust Co. and Central Bank of Jefferson County are subsidiaries of Central Bancshares, Inc.
centralbank.com(859) 253-6222 • (800) 637-6884
Member FDIC
Central Bank & Trust Co. • Central Bank of Jefferson County • Central Insurance Services • Central Investment Center, Inc.