Embed Size (px)
Citation preview
Meeting Materials for 21st Century School Facilities Commission
April 28, 2016
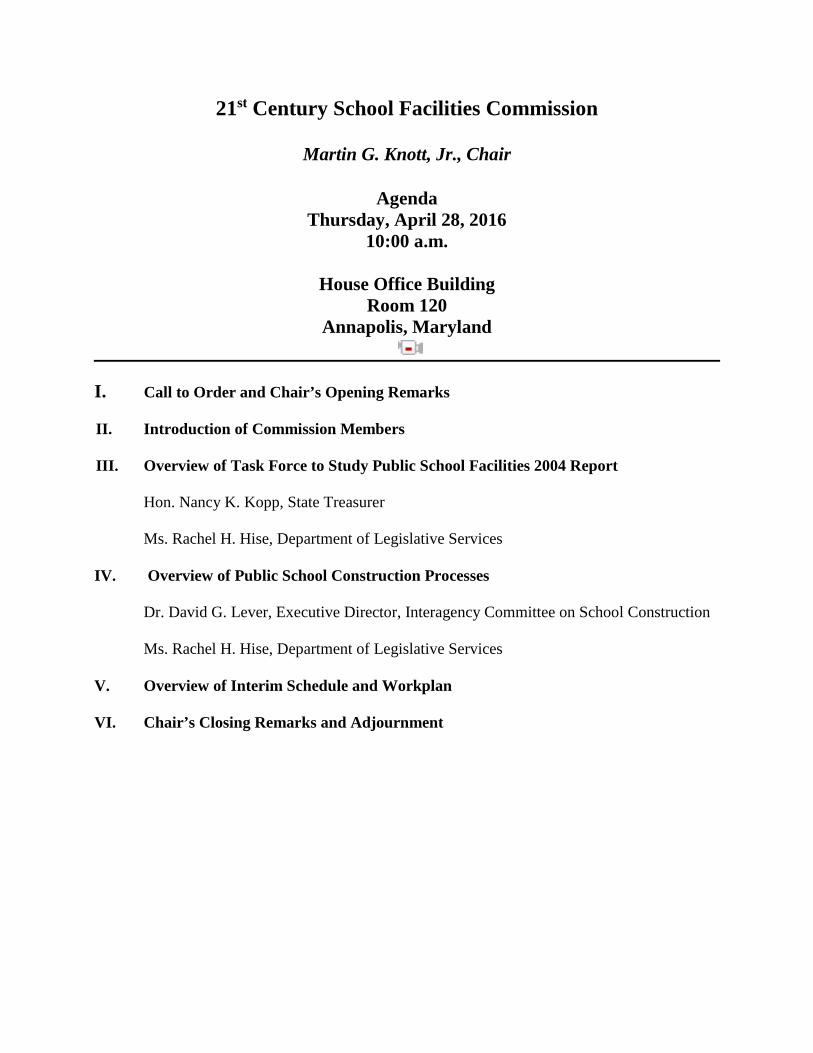
21st Century School Facilities Commission
Martin G. Knott, Jr., Chair
Agenda Thursday, April 28, 2016
10:00 a.m.
House Office Building Room 120
Annapolis, Maryland
I. Call to Order and Chair’s Opening Remarks
II. Introduction of Commission Members
III. Overview of Task Force to Study Public School Facilities 2004 Report
Hon. Nancy K. Kopp, State Treasurer
Ms. Rachel H. Hise, Department of Legislative Services
IV. Overview of Public School Construction Processes
Dr. David G. Lever, Executive Director, Interagency Committee on School Construction
Ms. Rachel H. Hise, Department of Legislative Services
V. Overview of Interim Schedule and Workplan
VI. Chair’s Closing Remarks and Adjournment
I. Commission Charge Handout to Accompany
Call to Order and Chair’s Opening Remarks
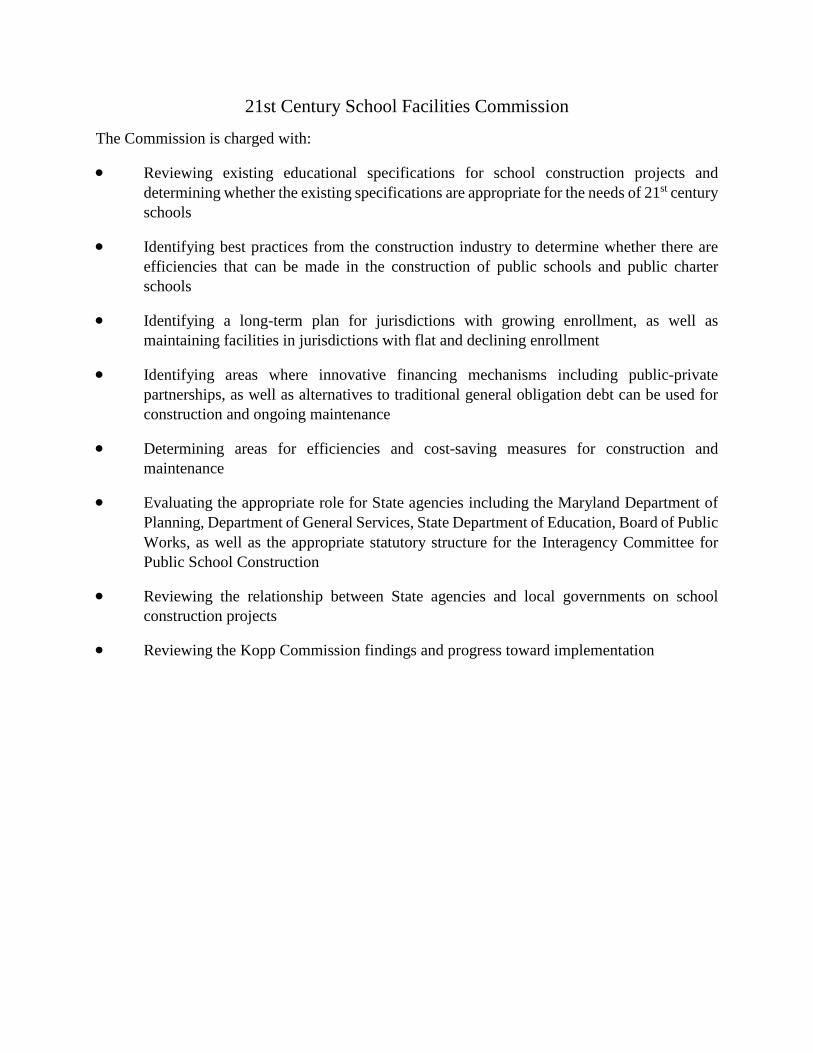
21st Century School Facilities Commission
The Commission is charged with:
• Reviewing existing educational specifications for school construction projects anddetermining whether the existing specifications are appropriate for the needs of 21st centuryschools
• Identifying best practices from the construction industry to determine whether there areefficiencies that can be made in the construction of public schools and public charterschools
• Identifying a long-term plan for jurisdictions with growing enrollment, as well asmaintaining facilities in jurisdictions with flat and declining enrollment
• Identifying areas where innovative financing mechanisms including public-privatepartnerships, as well as alternatives to traditional general obligation debt can be used forconstruction and ongoing maintenance
• Determining areas for efficiencies and cost-saving measures for construction andmaintenance
• Evaluating the appropriate role for State agencies including the Maryland Department ofPlanning, Department of General Services, State Department of Education, Board of PublicWorks, as well as the appropriate statutory structure for the Interagency Committee forPublic School Construction
• Reviewing the relationship between State agencies and local governments on schoolconstruction projects
• Reviewing the Kopp Commission findings and progress toward implementation
II. Membership Roster to AccompanyIntroduction of Commission Members
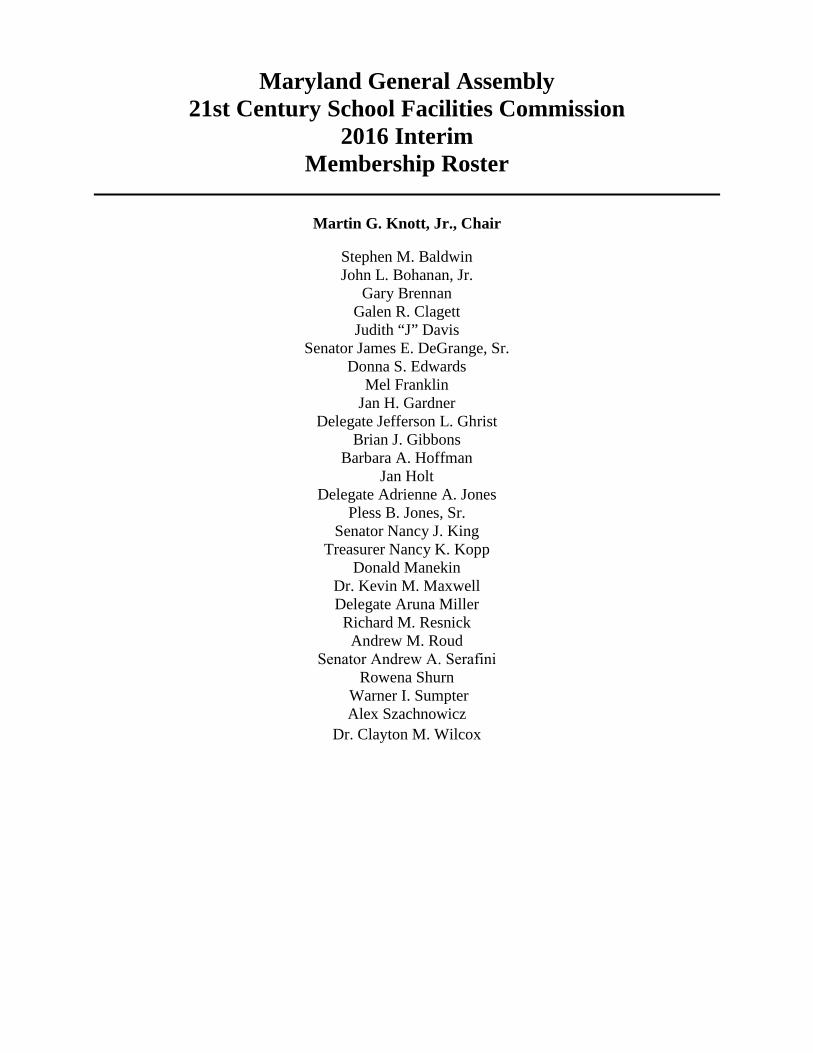
Maryland General Assembly 21st Century School Facilities Commission
2016 Interim Membership Roster
Martin G. Knott, Jr., Chair
Stephen M. Baldwin John L. Bohanan, Jr.
Gary Brennan Galen R. Clagett Judith “J” Davis
Senator James E. DeGrange, Sr. Donna S. Edwards
Mel Franklin Jan H. Gardner
Delegate Jefferson L. Ghrist Brian J. Gibbons
Barbara A. Hoffman Jan Holt
Delegate Adrienne A. Jones Pless B. Jones, Sr.
Senator Nancy J. King Treasurer Nancy K. Kopp
Donald Manekin Dr. Kevin M. Maxwell Delegate Aruna Miller
Richard M. Resnick Andrew M. Roud
Senator Andrew A. SerafiniRowena Shurn
Warner I. Sumpter Alex Szachnowicz
Dr. Clayton M. Wilcox

III. Powerpoint to Accompany Overview of
Task Force to Study Public School Facilities
2004 Report
Department of Legislative ServicesOffice of Policy Analysis
Annapolis, MarylandApril 28, 2016
Overview of Task Force and Public School Facilities Act of 2004
Presentation to the21st Century School Facilities Commission
Hon. Nancy K. Kopp, State TreasurerMs. Rachel H. Hise
Task Force to Study Public School Facilities
• Established by the Bridge to Excellence in PublicSchools Act of 2002 (also known as Thornton) toevaluate whether school facilities were adequate tosustain the programs and funding levels provided byThornton legislation
• Also examined equity of the Public SchoolConstruction Program and the State/local cost shareformula and alternative financing mechanisms amongmany topics
• Met over the course of nearly two years in 2002 and2003, and issued final report in February 2004
1

Facility Assessment Survey
• First comprehensive assessment of the condition of publicschools was conducted on behalf of the task force toidentify basic minimum facility needs critical to the healthand safety of students, to support projected enrollmentgrowth, and to accomplish basic required educationalprograms
• A survey based on 31 minimum facility standards wascompleted for every public school in the State by Stateand local school officials
• Survey found deficiencies in every school system at a totalcost of $3.85 billion (in 2003 dollars)
2
School Construction Funding Goal
• The task force recommended that the State and localgovernments provide a minimum of $3.85 billion forpublic school facilities over an eight-year period fromfiscal 2006 through 2013
• Of the total, $2.0 billion or $250.0 million annually foreight years was the State funding goal with theremainder to be provided by the counties
• Chapters 306 and 307 – Public School Facilities Actof 2004 – implemented the task force’s finalrecommendations including the funding goal
3
Funding Exceeds Goal
• The State exceeded the funding goal and provided$2.379 billion in new funds for school construction fromfiscal 2006 through 2013
• The State has continued to exceed the goal in fiscal 2014through 2017, and the State’s Capital Improvement Programprojects $250.0 million annually in fiscal 2018 through 2021
• County governments provided $1.974 billion for schoolconstruction from fiscal 2006 through 2012
• Chapters 306/307 also required the Maryland State Departmentof Education to adopt regulations to survey the condition ofpublic school facilities at least every four years, but thoseregulations have not been implemented
4
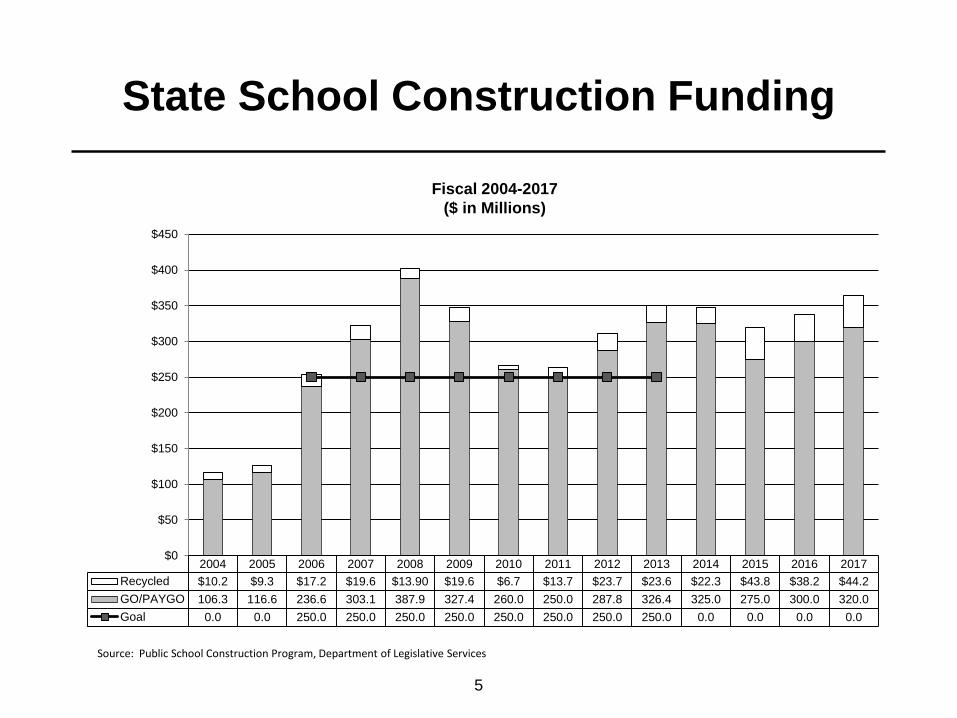
State School Construction Funding
5
Fiscal 2004-2017($ in Millions)
2004 2005 2006 2007 2008 2009 2010 2011 2012 2013 2014 2015 2016 2017Recycled $10.2 $9.3 $17.2 $19.6 $13.90 $19.6 $6.7 $13.7 $23.7 $23.6 $22.3 $43.8 $38.2 $44.2GO/PAYGO 106.3 116.6 236.6 303.1 387.9 327.4 260.0 250.0 287.8 326.4 325.0 275.0 300.0 320.0Goal 0.0 0.0 250.0 250.0 250.0 250.0 250.0 250.0 250.0 250.0 0.0 0.0 0.0 0.0
$0
$50
$100
$150
$200
$250
$300
$350
$400
$450
Source: Public School Construction Program, Department of Legislative Services
State/Local Cost Share Formula
• The task force recommended, and the 2004 Act implemented,updating the State and local share of eligible school constructioncosts to reflect more recent local wealth figures and toincorporate several new factors in the formula, including:
– Enrollment growth
– Percentage of students eligible for free and reduced pricemeals
– Status as a distressed “One Maryland” county
– Eligibility for the Guaranteed Tax Base Program
– Local school construction funding or “effort”
• Formula is updated every three years
6
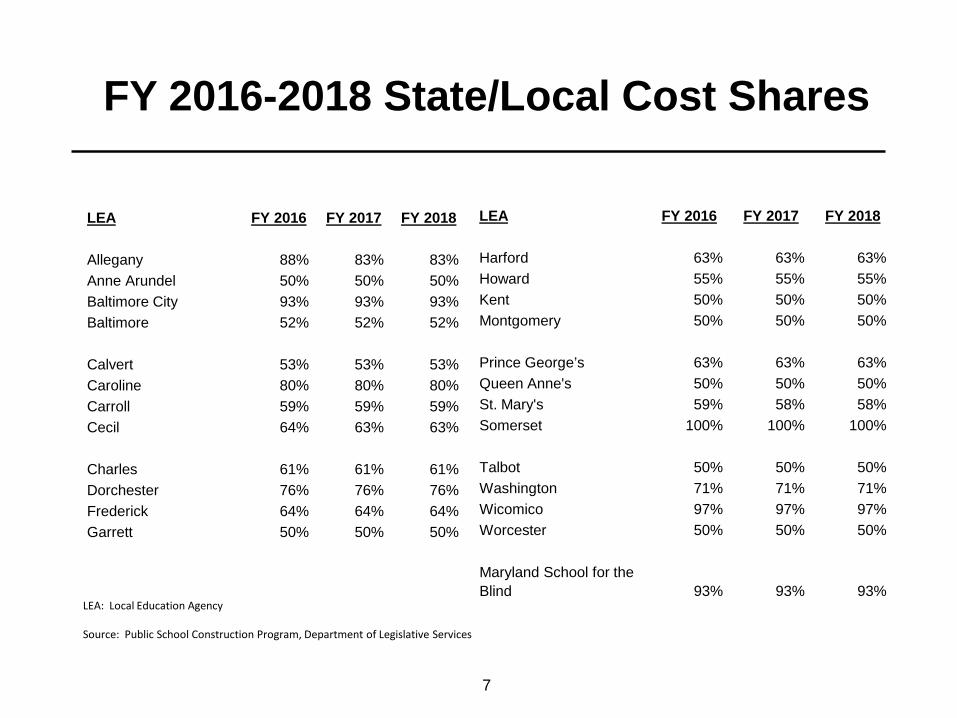
FY 2016-2018 State/Local Cost Shares
7
LEA FY 2016 FY 2017 FY 2018
Allegany 88% 83% 83%Anne Arundel 50% 50% 50%Baltimore City 93% 93% 93%Baltimore 52% 52% 52%
Calvert 53% 53% 53%Caroline 80% 80% 80%Carroll 59% 59% 59%Cecil 64% 63% 63%
Charles 61% 61% 61%Dorchester 76% 76% 76%Frederick 64% 64% 64%Garrett 50% 50% 50%
LEA FY 2016 FY 2017 FY 2018
Harford 63% 63% 63%Howard 55% 55% 55%Kent 50% 50% 50%Montgomery 50% 50% 50%
Prince George’s 63% 63% 63%Queen Anne's 50% 50% 50%St. Mary's 59% 58% 58%Somerset 100% 100% 100%
Talbot 50% 50% 50%Washington 71% 71% 71%Wicomico 97% 97% 97%Worcester 50% 50% 50%
Maryland School for the Blind 93% 93% 93%
LEA: Local Education Agency
Source: Public School Construction Program, Department of Legislative Services

Alternative Financing
• The task force made a number ofrecommendations that were codified byChapters 306/307 to authorize alternativefinancing and contracting methods, includinglease-leaseback, sale-leaseback, and otherpublic-private partnerships (P3) to meetimmediate school construction needs incounties.
• To date only a few school construction projectsin the State have utilized P3 methods
8
Aging Schools Program• The task force also recommended that the Aging School
Program be updated to reflect pre-1970 square footage ofschool buildings in each school system (rather than pre-1960)
• Chapters 306/307 implemented this recommendation, whichresulted in the loss of program funding for some school systems.Chapter 423 of 2004 (the capital budget bill) implemented holdharmless grants over a three-year period
• The General Assembly increased funding for the Aging SchoolsProgram statutorily in 2006, but that funding was subsequentlyreduced by budget reconciliation legislation
• The Aging Schools program is currently funded at $6.1 million ingeneral obligation bond funds for fiscal 2017, but theGeneral Assembly has provided additional funds in some years
9
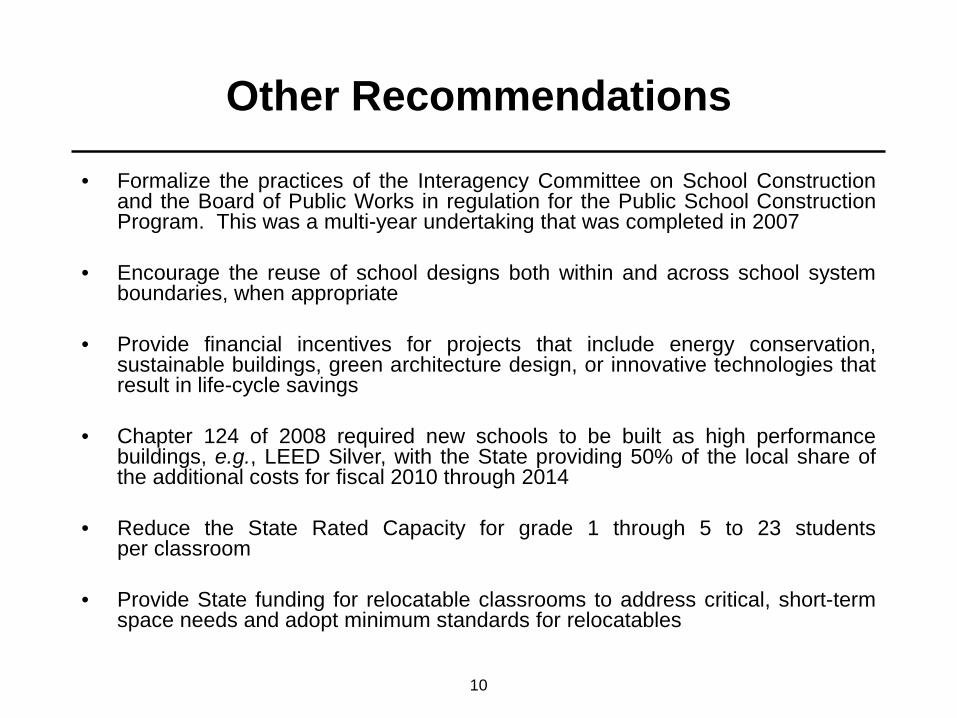
Other Recommendations
• Formalize the practices of the Interagency Committee on School Constructionand the Board of Public Works in regulation for the Public School ConstructionProgram. This was a multi-year undertaking that was completed in 2007
• Encourage the reuse of school designs both within and across school systemboundaries, when appropriate
• Provide financial incentives for projects that include energy conservation,sustainable buildings, green architecture design, or innovative technologies thatresult in life-cycle savings
• Chapter 124 of 2008 required new schools to be built as high performancebuildings, e.g., LEED Silver, with the State providing 50% of the local share ofthe additional costs for fiscal 2010 through 2014
• Reduce the State Rated Capacity for grade 1 through 5 to 23 studentsper classroom
• Provide State funding for relocatable classrooms to address critical, short-termspace needs and adopt minimum standards for relocatables
10
IV. Powerpoint to Accompany Overview of Public School Construction
Processes

PUBLIC SCHOOL CONSTRUCTION IN MARYLAND
Interagency Committee on School ConstructionApril 28, 2016
David LeverExecutive Director
Severna Park High School, Anne Arundel CountyIn construction
West Side Elementary School, Allegany CountyOriginal 1940, renovated 1977
21st Century School Commission

Interagency Committee on School ConstructionSCHOOL STATS
24 school systems: Geographically co-terminous with counties Do not have independent taxing authority Own, operate, and build their facilities under State and local regulations Capital funds: from State and local governments Operating funds: from local government, with State per-student assistance
848,000 students (Fall 2015; does not include PK): School systems range from 1,909 FTE to 152,038 FTE Vast differences in enrollment growth and decline, FARMS, ELL, demographic
profile Vast differences in staffing of facility departments
1,392 Public School Buildings, 138.5 million square feet: Average Age of square footage: 28 years 52% of total pre-dates 1990 36% of total was built in 1960s and 1970s Estimated capital need: over $20 billion (per LEA feasibility studies)
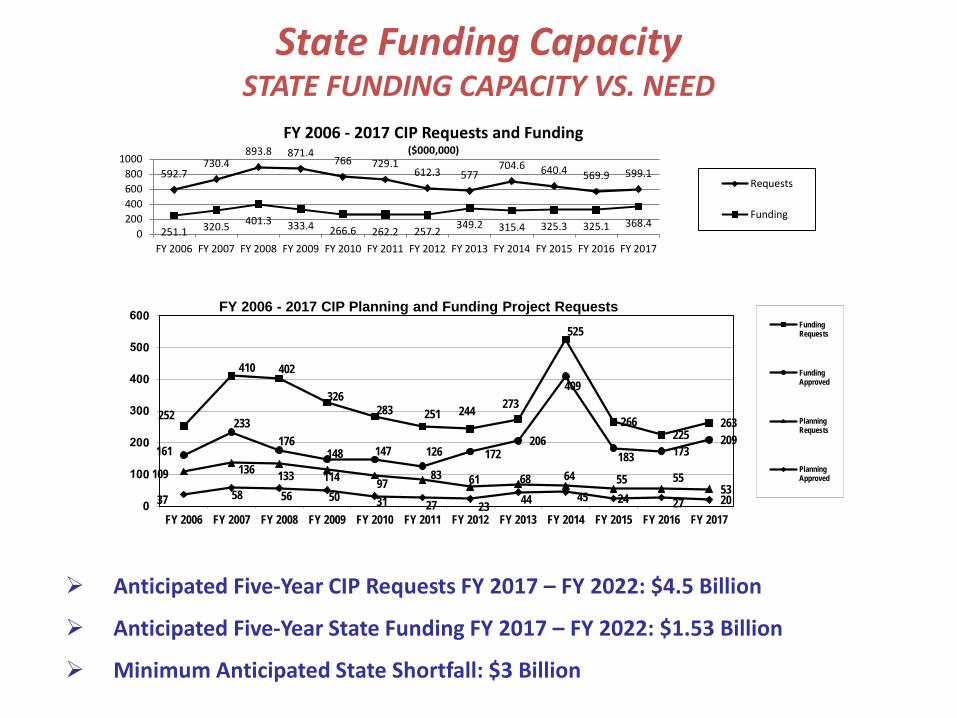
592.7730.4
893.8 871.4766 729.1
612.3 577704.6 640.4 569.9 599.1
251.1 320.5 401.3 333.4 266.6 262.2 257.2 349.2 315.4 325.3 325.1 368.40
200400600800
1000
FY 2006 FY 2007 FY 2008 FY 2009 FY 2010 FY 2011 FY 2012 FY 2013 FY 2014 FY 2015 FY 2016 FY 2017
FY 2006 - 2017 CIP Requests and Funding($000,000)
Requests
Funding
State Funding CapacitySTATE FUNDING CAPACITY VS. NEED
Anticipated Five-Year CIP Requests FY 2017 – FY 2022: $4.5 Billion
Anticipated Five-Year State Funding FY 2017 – FY 2022: $1.53 Billion
Minimum Anticipated State Shortfall: $3 Billion
252
410 402
326283 251 244 273
525
266225
263
161
233176
148 147 126 172206
409
183 173209
109 136 133 114 9783 61 68 64 55 55
5337 58 56 50 31 27 23 44 45 24 27 20
FY 2006 FY 2007 FY 2008 FY 2009 FY 2010 FY 2011 FY 2012 FY 2013 FY 2014 FY 2015 FY 2016 FY 2017
FY 2006 - 2017 CIP Planning and Funding Project RequestsFundingRequests
FundingApproved
PlanningRequests
PlanningApproved

Educational Programs: New educational initiatives: Full-day kindergarten, prekindergarten, STEM and
STEAM, magnet programs
Programs for children with special needs: Special education, English language learners, FARMS
Enrollment Growth and Decline: Montgomery County Public Schools: 11,100 new students, 2015 – 2025 Carroll County Public Schools: 1,861 fewer students, 2015 – 2025
Aging of the Building Plant: * Mechanical systems: 20 – 30 years Roofs : 20 – 25 years Windows: 20 - 40 years IT: Less than 10 years
Community Programs: School as community center
* Assumes typically used systems
Drivers of Educational Facility Needs

Cost of Construction Unanticipated 2015 Cost Increase:
Building cost: $233 / s.f. projected, actual $271 / s.f. Sitework: 12% projected, actual 19% minimum Considerable uncertainty about current situation
Drivers of the cost increases: Recovering Economy: Reduced competition Effects from Recession: Decreased plant capacity and labor force, recovery of contractor
margins Regulatory Environment - Direct Effects:
HVAC: energy and ventilation requirements Prevailing wage rates: 11% - 14% increase High performance school requirement (LEED Silver): 3% - 5% Stormwater management: New regulations from 2011
Regulatory Environment – Indirect Effects: Discourages contractors and subcontractors from participating
Baltimore City 21st Century Building Program will affect Baltimore-DC Metro area
$157.00 $190.00 $215.00 $215.00 $224.00 $200.00 $200.00 $207.00 $215.00 $224.00 $233.00 $282.00 $175.84
$212.80 $240.80 $240.80 $250.88 $224.00 $224.00 $231.84 $240.80 $250.88 $260.96 $335.58
$100.00
$200.00
$300.00
$400.00
FY 2006 FY 2007 FY 2008 FY 2009 FY 2010 FY 2011 FY 2012 FY 2013 FY 2014 FY 2015 FY 2016 FY 2017
FY 2006 - 2017 CIP Cost of Construction($ / square foot)
Building
Building andSite
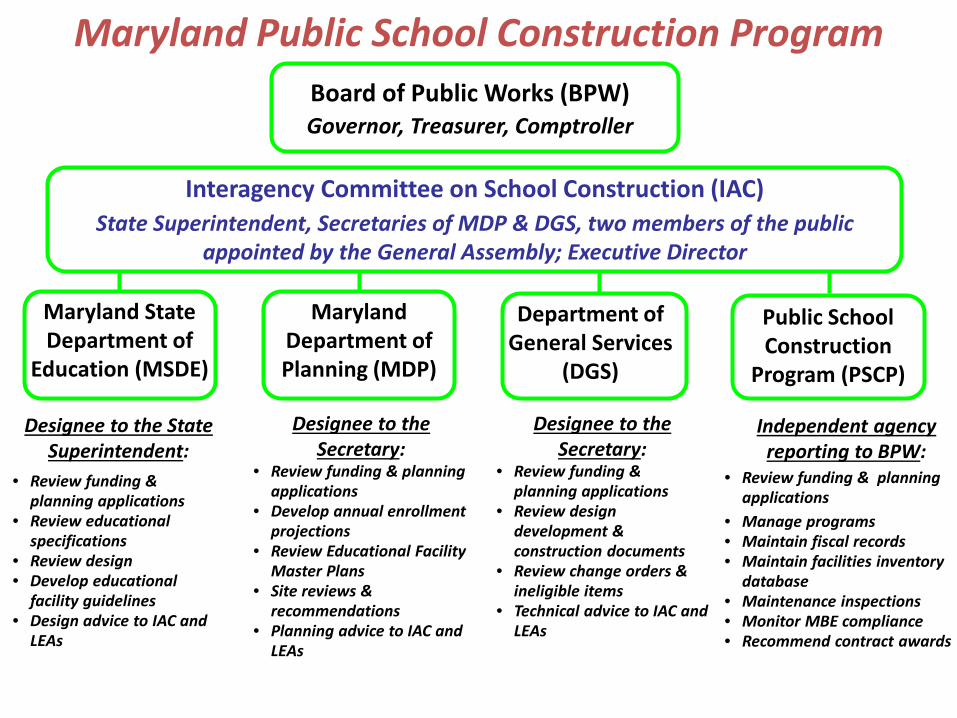
Maryland Public School Construction ProgramBoard of Public Works (BPW)Governor, Treasurer, Comptroller
Interagency Committee on School Construction (IAC)State Superintendent, Secretaries of MDP & DGS, two members of the public
appointed by the General Assembly; Executive Director
Maryland State Department of
Education (MSDE)
Maryland Department of Planning (MDP)
Department of General Services
(DGS)
Public School Construction
Program (PSCP)
Independent agency reporting to BPW:
• Review funding & planning applications
• Manage programs• Maintain fiscal records• Maintain facilities inventory
database• Maintenance inspections• Monitor MBE compliance• Recommend contract awards
Designee to the Secretary:
• Review funding & planning applications
• Review design development & construction documents
• Review change orders & ineligible items
• Technical advice to IAC and LEAs
Designee to the Secretary:
• Review funding & planning applications
• Develop annual enrollment projections
• Review Educational Facility Master Plans
• Site reviews & recommendations
• Planning advice to IAC and LEAs
Designee to the State Superintendent:
• Review funding & planning applications
• Review educational specifications
• Review design• Develop educational
facility guidelines • Design advice to IAC and
LEAs

The Capital Improvement Program
Funded at more than $3.4 billion, FY 2006 – FY 2017
Eligible project categories: Major projects, small renovations and additions, systemic renovations No repair or maintenance projects
State participates only in eligible costs: Fixed asset costs with 15 year life Eligible gross area allowance is determined by student enrollment
projections, allowable s.f./student
State funding for each project is determined by formula: Different formulas apply to different project types There is no formula for the total funding each LEA will receive annually
Local funding match is required: Covers local share, ineligible items and miscellaneous project expenses State-local cost share calculated every 3 years: local wealth and local
funding effort; enrollment growth; Free and Reduced Price Meal Plan student population
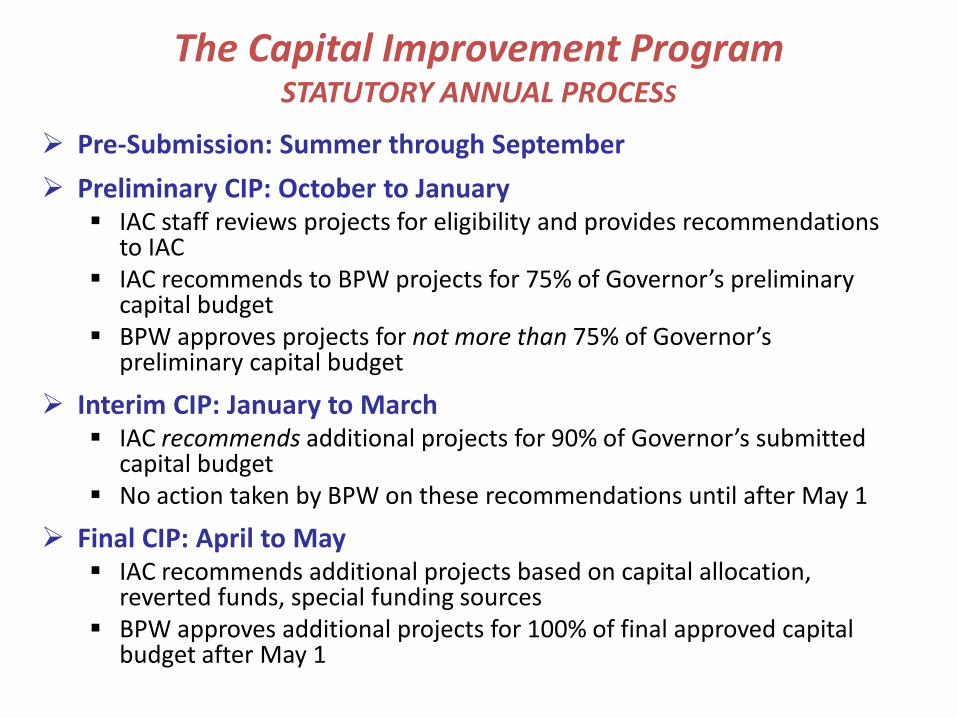
The Capital Improvement ProgramSTATUTORY ANNUAL PROCESS
Pre-Submission: Summer through September Preliminary CIP: October to January
IAC staff reviews projects for eligibility and provides recommendations to IAC
IAC recommends to BPW projects for 75% of Governor’s preliminary capital budget
BPW approves projects for not more than 75% of Governor’s preliminary capital budget
Interim CIP: January to March IAC recommends additional projects for 90% of Governor’s submitted
capital budget No action taken by BPW on these recommendations until after May 1
Final CIP: April to May IAC recommends additional projects based on capital allocation,
reverted funds, special funding sources BPW approves additional projects for 100% of final approved capital
budget after May 1
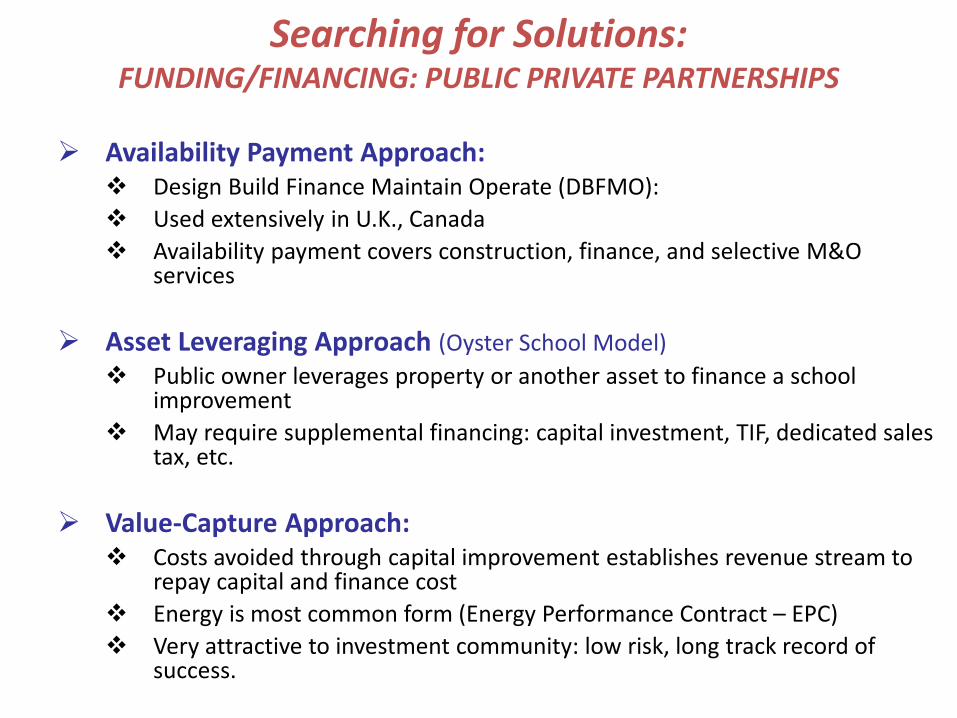
Availability Payment Approach: Design Build Finance Maintain Operate (DBFMO): Used extensively in U.K., Canada Availability payment covers construction, finance, and selective M&O
services
Asset Leveraging Approach (Oyster School Model) Public owner leverages property or another asset to finance a school
improvement May require supplemental financing: capital investment, TIF, dedicated sales
tax, etc.
Value-Capture Approach: Costs avoided through capital improvement establishes revenue stream to
repay capital and finance cost Energy is most common form (Energy Performance Contract – EPC) Very attractive to investment community: low risk, long track record of
success.
Searching for Solutions:FUNDING/FINANCING: PUBLIC PRIVATE PARTNERSHIPS
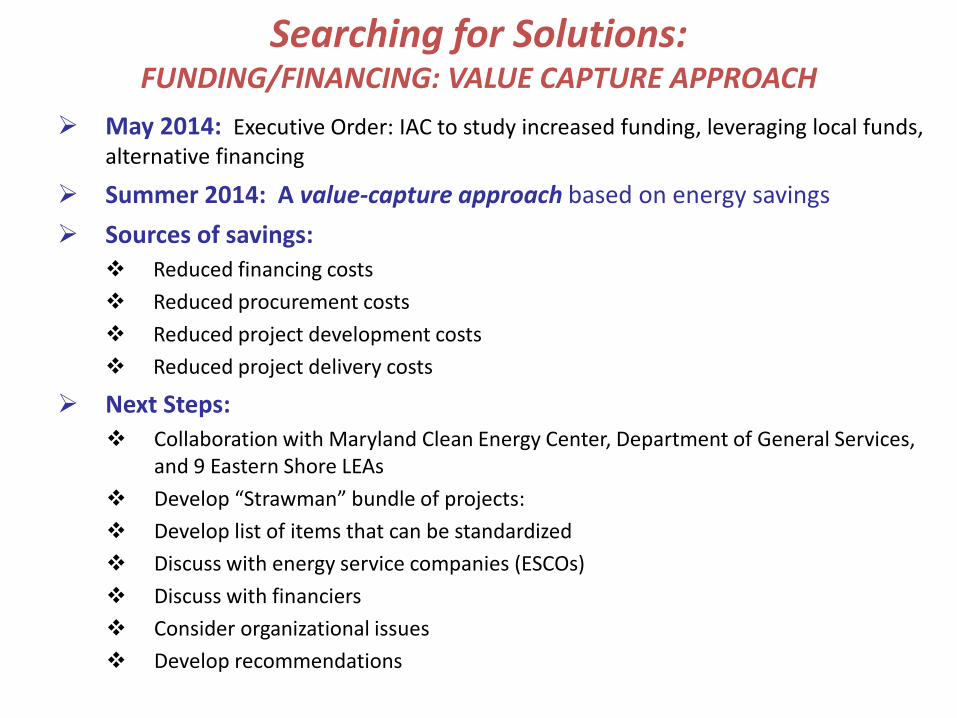
May 2014: Executive Order: IAC to study increased funding, leveraging local funds, alternative financing
Summer 2014: A value-capture approach based on energy savings Sources of savings:
Reduced financing costs Reduced procurement costs Reduced project development costs Reduced project delivery costs
Next Steps: Collaboration with Maryland Clean Energy Center, Department of General Services,
and 9 Eastern Shore LEAs Develop “Strawman” bundle of projects: Develop list of items that can be standardized Discuss with energy service companies (ESCOs) Discuss with financiers Consider organizational issues Develop recommendations
Searching for Solutions:FUNDING/FINANCING: VALUE CAPTURE APPROACH
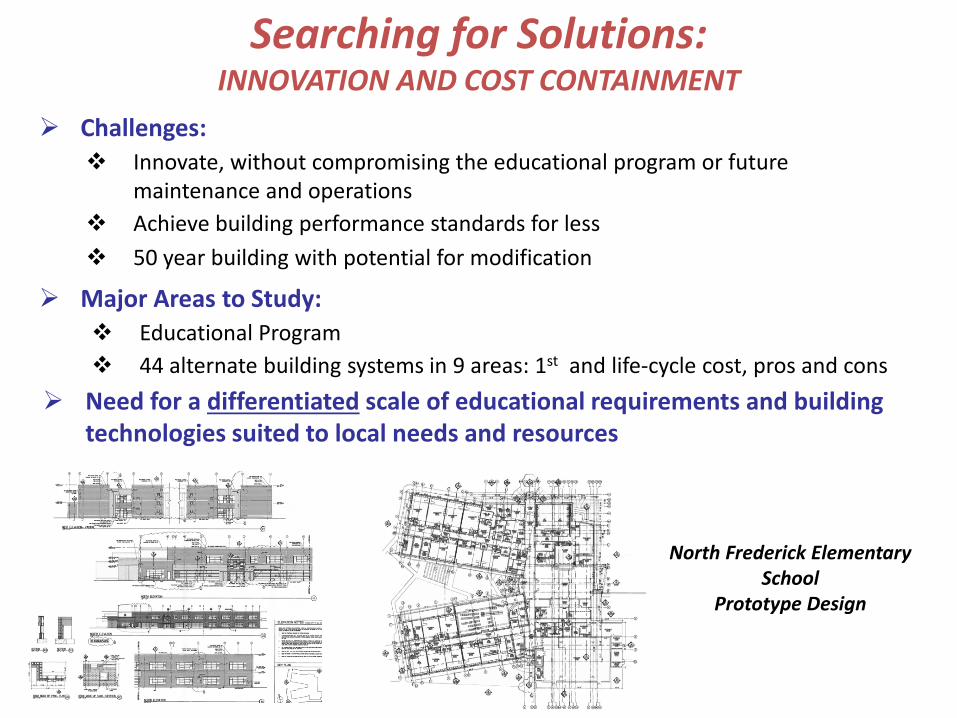
Challenges: Innovate, without compromising the educational program or future
maintenance and operations Achieve building performance standards for less 50 year building with potential for modification
Major Areas to Study: Educational Program 44 alternate building systems in 9 areas: 1st and life-cycle cost, pros and cons
Need for a differentiated scale of educational requirements and building technologies suited to local needs and resources
Searching for Solutions:INNOVATION AND COST CONTAINMENT
North Frederick Elementary School
Prototype Design
IV. Construction Costs Handout to Accompany Overview of
Public School Construction Processes
1
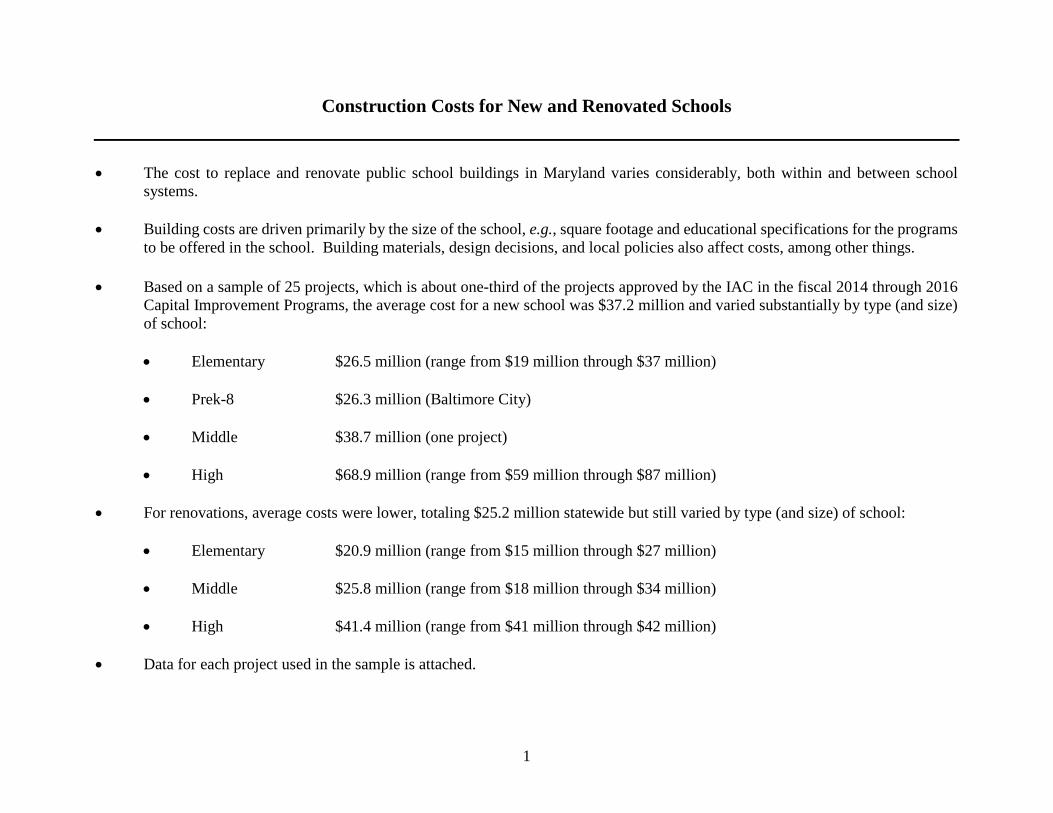
Construction Costs for New and Renovated Schools
• The cost to replace and renovate public school buildings in Maryland varies considerably, both within and between school systems.
• Building costs are driven primarily by the size of the school, e.g., square footage and educational specifications for the programs
to be offered in the school. Building materials, design decisions, and local policies also affect costs, among other things. • Based on a sample of 25 projects, which is about one-third of the projects approved by the IAC in the fiscal 2014 through 2016
Capital Improvement Programs, the average cost for a new school was $37.2 million and varied substantially by type (and size) of school: • Elementary $26.5 million (range from $19 million through $37 million)
• Prek-8 $26.3 million (Baltimore City)
• Middle $38.7 million (one project)
• High $68.9 million (range from $59 million through $87 million)
• For renovations, average costs were lower, totaling $25.2 million statewide but still varied by type (and size) of school: • Elementary $20.9 million (range from $15 million through $27 million)
• Middle $25.8 million (range from $18 million through $34 million)
• High $41.4 million (range from $41 million through $42 million)
• Data for each project used in the sample is attached.

2
Public School Construction Program Recent Approved Replacement Projects
LEA School Name Project Type
State Rated
Capacity Square Footage
Sq. Ft. per
Student Construction
Cost Cost per Student
Cost per
Sq. Ft. Allegany Allegany High Replacement 857 143,374 167 $58,935,346 $68,769 $411 Baltimore County Westowne Elementary Replacement 700 90,040 129 29,590,000 42,271 329 Calvert Northern High Replacement/Renovation 1500 286,664 191 60,558,000 40,372 211 Frederick Frederick High Replacement 1826 270,618 148 87,054,000 47,675 322 Frederick North Frederick Elementary Replacement 725 93,605 129 24,399,428 33,654 261 Harford Youth’s Benefit Elementary Replacement 1130 149,694 132 36,926,232 32,678 247 Montgomery Candlewood Elementary Replacement 359 61,804 172 21,365,000 59,513 346 Montgomery Brown Station Elementary* Replacement 658 107,448 163 31,912,000 48,498 297 Montgomery Wayside Elementary* Replacement 641 74,182 116 21,980,000 34,290 296 Montgomery William H. Farqujar Middle Replacement 796 135,626 170 38,712,000 48,633 285 Washington Bester Elementary Replacement 608 71,671 118 19,017,000 31,278 265
Baltimore City Graceland Park/O’Donnell Heights PK-8* Replacement 580 78,350 135 26,315,000 45,371 336
Baltimore City Holabird PK-8* Replacement 580 78,350 135 26,393,000 45,505 337
Average – Replacements 843 126,264 147 $37,165,924 $44,084 $294
Average – ES 689 92,635 137 $26,455,666 $38,413 $286 Average – PK-8 580 78,350 135 $26,354,000 $45,438 $336 Average – MS 796 135,626 170 $38,712,000 $48,633 $285 Average – HS 1,394 233,552 169 $68,849,115 $49,378 $295
LEA: Local Education Agency Note: Square footage includes the total amount of new, additional and renovated square footage. Construction cost includes the total estimated cost for site development and construction, including contingencies. *All projects bid in fiscal 2012-2015 except those marked with an asterisk, which will be bid in fiscal 2016. Source: Public School Construction Program, Department of Legislative Services
3
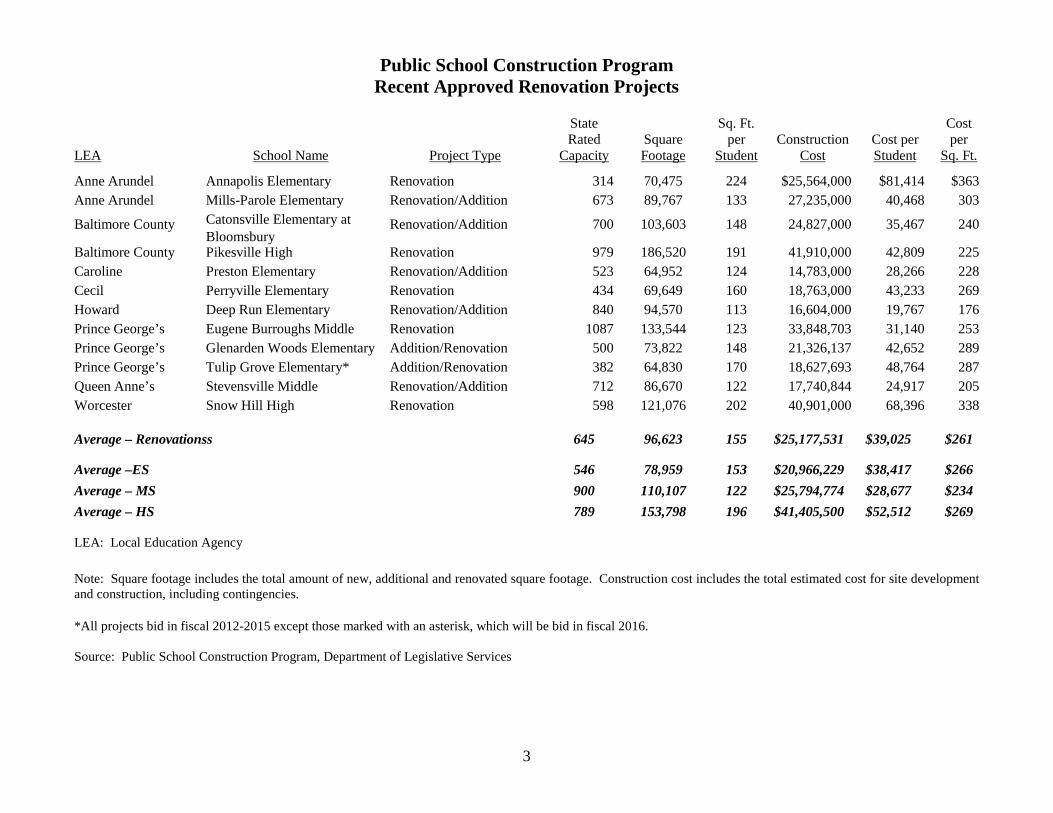
Public School Construction Program Recent Approved Renovation Projects
LEA School Name Project Type
State Rated
Capacity Square Footage
Sq. Ft. per
Student Construction
Cost Cost per Student
Cost per
Sq. Ft. Anne Arundel Annapolis Elementary Renovation 314 70,475 224 $25,564,000 $81,414 $363 Anne Arundel Mills-Parole Elementary Renovation/Addition 673 89,767 133 27,235,000 40,468 303
Baltimore County Catonsville Elementary at Bloomsbury
Renovation/Addition 700 103,603 148 24,827,000 35,467 240
Baltimore County Pikesville High Renovation 979 186,520 191 41,910,000 42,809 225 Caroline Preston Elementary Renovation/Addition 523 64,952 124 14,783,000 28,266 228 Cecil Perryville Elementary Renovation 434 69,649 160 18,763,000 43,233 269 Howard Deep Run Elementary Renovation/Addition 840 94,570 113 16,604,000 19,767 176 Prince George’s Eugene Burroughs Middle Renovation 1087 133,544 123 33,848,703 31,140 253 Prince George’s Glenarden Woods Elementary Addition/Renovation 500 73,822 148 21,326,137 42,652 289 Prince George’s Tulip Grove Elementary* Addition/Renovation 382 64,830 170 18,627,693 48,764 287 Queen Anne’s Stevensville Middle Renovation/Addition 712 86,670 122 17,740,844 24,917 205 Worcester Snow Hill High Renovation 598 121,076 202 40,901,000 68,396 338
Average – Renovationss 645 96,623 155 $25,177,531 $39,025 $261
Average –ES 546 78,959 153 $20,966,229 $38,417 $266 Average – MS 900 110,107 122 $25,794,774 $28,677 $234 Average – HS 789 153,798 196 $41,405,500 $52,512 $269
LEA: Local Education Agency Note: Square footage includes the total amount of new, additional and renovated square footage. Construction cost includes the total estimated cost for site development and construction, including contingencies. *All projects bid in fiscal 2012-2015 except those marked with an asterisk, which will be bid in fiscal 2016. Source: Public School Construction Program, Department of Legislative Services
V. Handout to Accompany Overview of Interim
Schedule and Workplan
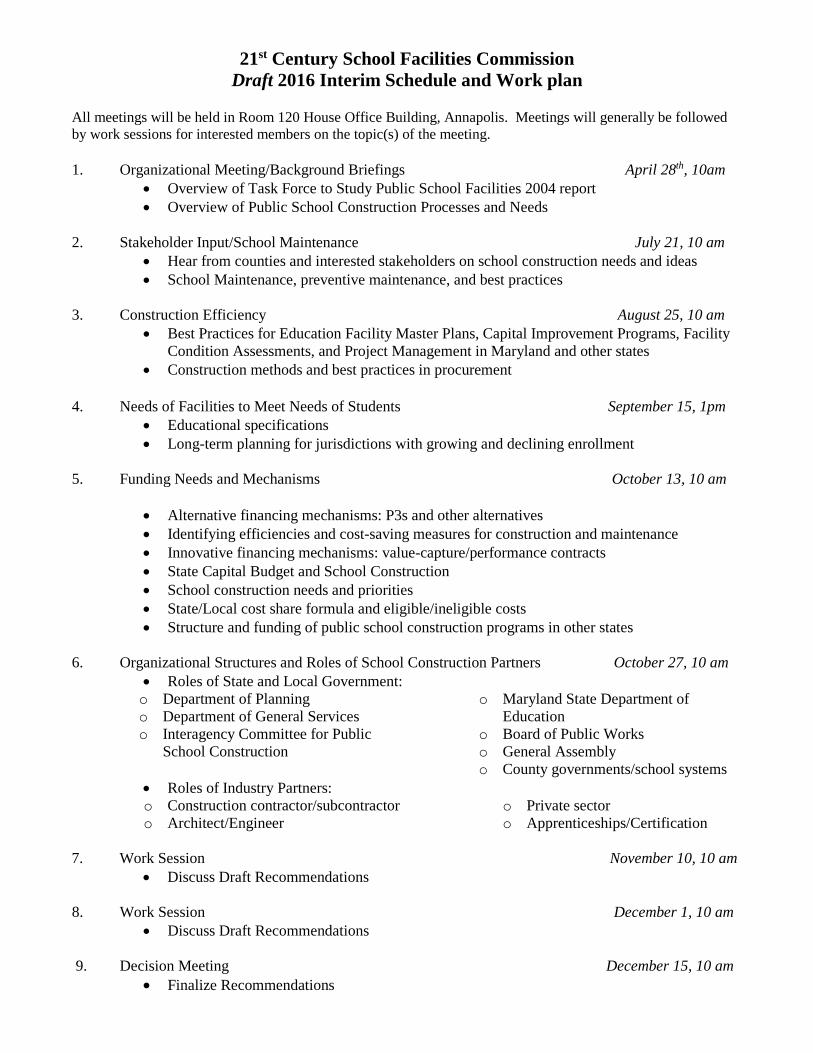
21st Century School Facilities Commission Draft 2016 Interim Schedule and Work plan
All meetings will be held in Room 120 House Office Building, Annapolis. Meetings will generally be followed by work sessions for interested members on the topic(s) of the meeting. 1. Organizational Meeting/Background Briefings April 28th, 10am
• Overview of Task Force to Study Public School Facilities 2004 report • Overview of Public School Construction Processes and Needs
2. Stakeholder Input/School Maintenance July 21, 10 am
• Hear from counties and interested stakeholders on school construction needs and ideas • School Maintenance, preventive maintenance, and best practices
3. Construction Efficiency August 25, 10 am
• Best Practices for Education Facility Master Plans, Capital Improvement Programs, Facility Condition Assessments, and Project Management in Maryland and other states
• Construction methods and best practices in procurement
4. Needs of Facilities to Meet Needs of Students September 15, 1pm • Educational specifications • Long-term planning for jurisdictions with growing and declining enrollment
5. Funding Needs and Mechanisms October 13, 10 am
• Alternative financing mechanisms: P3s and other alternatives • Identifying efficiencies and cost-saving measures for construction and maintenance • Innovative financing mechanisms: value-capture/performance contracts • State Capital Budget and School Construction • School construction needs and priorities • State/Local cost share formula and eligible/ineligible costs • Structure and funding of public school construction programs in other states
6. Organizational Structures and Roles of School Construction Partners October 27, 10 am
• Roles of State and Local Government: o Department of Planning o Department of General Services o Interagency Committee for Public
School Construction
o Maryland State Department of Education
o Board of Public Works o General Assembly o County governments/school systems
• Roles of Industry Partners: o Construction contractor/subcontractor o Architect/Engineer
o Private sector o Apprenticeships/Certification
7. Work Session November 10, 10 am
• Discuss Draft Recommendations 8. Work Session December 1, 10 am
• Discuss Draft Recommendations
9. Decision Meeting December 15, 10 am • Finalize Recommendations