Embed Size (px)
Citation preview

Budget 2016: Moving the City Forward CS-1
2016-2018 Proposed
Business Plan and Budget
Corporate Services
Budget Committee Presentation
December 2015

Budget 2016: Moving the City Forward CS-2
Organizational Structure
Department Overview: The mandate of the Office of Corporate
Services is to provide specific support and
services to Council, and all departments and
divisions of the corporation to aid, and
enable, effective and efficient municipal
administration, and provision of services,
city-wide.
Key service areas include: Business Services Office
Council & Admin Services
Enforcement & By-law Services
Finance
Human Resources
Information Technology
Legal Services Chief Corporate
Services Officer
Peter Simmons
Coord
Office of the CCSO
N. Iacobelli
Exec Dir/City Clk,
Coun & Admin
P. Fay
Exec Director
Fin/Treasurer
P. Honeyborne
Director, Enf &
By-law Servs
J. Avbar (A)
Exec Director
Human Res
D. Wilson
City Solicitor
R. Zuech (A)
Exec Director
IT / CIO
R. Rao
Senior Manager
Business Servs
P. Gunasekera
29 full-time20 full-time
4 contract
99 full-time
24 contract
54 full-time
5 contract
97 full-time
6 contract
63 full-time
6 contract81 full-time
2 full-time

Budget 2016: Moving the City Forward CS-3
Departmental Business Plan
Departmental Goals
• Practice proactive effective management of finances, policies and
service delivery (Good Government)
• Educate and engage citizens in open and accountable ways that
show value and promote the City (Good Government)
• Invest in a collaborative environment with supportive organizational
and governance practices and policies (Good Government)
Key Business Outcomes
• Credible leadership delivering trusted services making a positive
difference for citizens

Budget 2016: Moving the City Forward CS-4
Departmental Business Plan
Current and Future Situation
Respond to, accommodate and manage:
• Growth pressures
• Maintenance of acceptable service levels
• Inflationary and economic impacts
• Service Review
• Legislated and mandated services
• Innovation
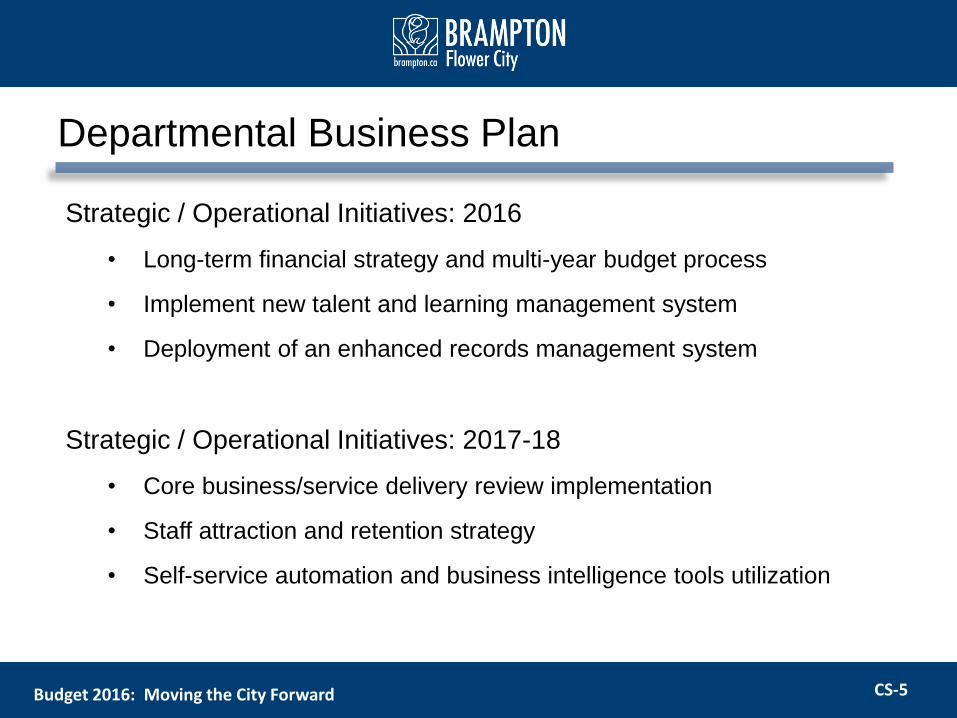
Budget 2016: Moving the City Forward CS-5
Departmental Business Plan
Strategic / Operational Initiatives: 2016
• Long-term financial strategy and multi-year budget process
• Implement new talent and learning management system
• Deployment of an enhanced records management system
Strategic / Operational Initiatives: 2017-18
• Core business/service delivery review implementation
• Staff attraction and retention strategy
• Self-service automation and business intelligence tools utilization

Budget 2016: Moving the City Forward CS-6
Efficiencies to be realized in 2016
• Cost-saving measures
• Reductions in operating costs to align with historical/current
expenditures:
• EAP Consulting (Employee Assistance Program)
• Advertising
• Utilizing provincial tenders of record to reduce operating costs in
Information Technology and Print environments
• Staffing related
• Consolidated 2 systems’ teams within Corporate Services allowing us
to repurpose a manager position
• Reduced one director position and repurposed part of it for an analyst
position
• Information Technology realignment
Follow Up From Preliminary Budget Review

Budget 2016: Moving the City Forward CS-7
Efficiencies to be realized in 2016 (continued)
• Revenues (increases and new)
• Marriage and Stationary Licences
• Civil Marriage Ceremonies (new)
• Provincial Offences Act (POA) revenues
• Development Agreements
• Ownership Change Fees
• Mortgage Agent Fees
Follow Up From Preliminary Budget Review

Budget 2016: Moving the City Forward CS-8
Corporate Services
2016-2018 Budget Overview

Budget 2016: Moving the City Forward CS-9
($000s)2015
BUDGET
2015
ACTUALS*
2016
BUDGET
2016 vs 2015
BUDGET
%
CHANGE
Labour Expenditures $43,702 $43,042 $45,975 $2,273 5.2%
Other Expenditures 17,144 17,007 17,127 (17) -0.1%
Total Expenditures 60,846 60,049 63,102 2,256 3.7%
Gross Revenues (8,700) (9,599) (9,392) (692) 8.0%
Net Expenditures $52,146 $50,450 $53,710 $1,564 3.0%
2016-2018 Operating Budget
Department: Corporate Services
* Forecast year-end actuals based on June 30, 2015 actual results
2016 2017 2018
Operating Adjustments ($293) $143 $237
New Facilities & Services 211 200 150
Support Staff 1,416 1,024 870
Negotiated Wages 536 27 -
Infrastructure Operation & Maintenance 201 853 535
Legislative Changes 150 - -
Efficiencies (245) - -
Revenue Increases (412) (77) (151)
COMBINED OPERATING BUDGET VARIANCE $1,564 $2,169 $1,641
CATEGORYBUDGET VARIANCES ($000s)

Budget 2016: Moving the City Forward CS-10
2016-2018 Operating Budget
Additional details provided in budget binder:
Appendix 1 - “Staff Request Descriptions”
DIVISIONS 2015STAFF
ADDS*2016
STAFF
ADDS2017
STAFF
ADDS2018
Business Services 20 1 21 1 22 1 23
City Clerk/Director, Council & Administrative
Services63 2 65 2 67 0 67
Enforcement & By-Law Services 81 2 83 2 85 2 87
Finance 97 3 100 3 103 2 105
Human Resources 54 2 56 2 58 1 59
Information Technology 99 6 105 1 106 2 108
Legal Services 29 0 29 0 29 0 29
Office of the Chief Corporate Services Officer 2 0 2 0 2 0 2
DEPARTMENTAL TOTAL 445 16 461 11 472 8 480
*Includes F/T and conversions to F/T
COMPLEMENT

Budget 2016: Moving the City Forward CS-11
2016-2018 Operating Budget
Division: Information Technology
* Forecast year-end actuals based on June 30, 2015 actual results
($000s)2015
BUDGET
2015
ACTUALS*
2016
BUDGET
2016 vs 2015
BUDGET
%
CHANGE
BREAKDOWN BY CATEGORY
Labour Expenditures $10,601 $10,791 $11,136 $535 5.0%
Other Expenditures 8,109 7,754 7,918 (191) -2.4%
Total Expenditures 18,710 18,544 19,054 343 1.8%
Gross Revenues 0 0 0 0 0.0%
Net Expenditures $18,710 $18,544 $19,054 $343 1.8%
2016 2017 2018
Operating Adjustments ($364) $0 $0
New Facilities & Services 200 200 150
Support Staff 577 209 237
Infrastructure Operation & Maintenance - 613 405
Efficiencies (70) - -
COMBINED OPERATING BUDGET VARIANCE $343 $1,022 $792
CATEGORYBUDGET VARIANCES ($000s)

Budget 2016: Moving the City Forward CS-12
2016-2018 Operating Budget
Division: Finance
* Forecast year-end actuals based on June 30, 2015 actual results
($000s)2015
BUDGET
2015
ACTUALS*
2016
BUDGET
2016 vs 2015
BUDGET
%
CHANGE
BREAKDOWN BY CATEGORY
Labour Expenditures $9,262 $9,159 $9,578 $317 3.4%
Other Expenditures 3,576 3,998 3,813 237 6.6%
Total Expenditures 12,837 13,157 13,391 554 4.3%
Gross Revenues (4,737) (5,427) (4,984) (247) 5.2%
Net Expenditures $8,101 $7,730 $8,407 $307 3.8%
2016 2017 2018
Operating Adjustments $34 $13 $13
Support Staff 232 180 189
Negotiated Wages 88 - -
Revenue Increases (47) - -
COMBINED OPERATING BUDGET VARIANCE $307 $193 $202
CATEGORYBUDGET VARIANCES ($000s)

Budget 2016: Moving the City Forward CS-13
2016-2018 Operating Budget
Division: Human Resources
* Forecast year-end actuals based on June 30, 2015 actual results
($000s)2015
BUDGET
2015
ACTUALS*
2016
BUDGET
2016 vs 2015
BUDGET
%
CHANGE
BREAKDOWN BY CATEGORY
Labour Expenditures $6,010 $5,883 $6,482 $472 7.8%
Other Expenditures 2,379 2,411 2,116 (263) -11.1%
Total Expenditures 8,389 8,295 8,598 209 2.5%
Gross Revenues (1,376) (1,509) (1,373) 3 -0.2%
Net Expenditures $7,013 $6,785 $7,224 $211 3.0%
2016 2017 2018
Operating Adjustments ($3) ($19) $46
Support Staff 206 195 134
Negotiated Wages 183 (5) -
Efficiencies (175) - -
COMBINED OPERATING BUDGET VARIANCE $211 $171 $180
CATEGORYBUDGET VARIANCES ($000s)

Budget 2016: Moving the City Forward CS-14
2016-2018 Operating Budget
Division: Enforcement and By-law Services
* Forecast year-end actuals based on June 30, 2015 actual results
($000s)2015
BUDGET
2015
ACTUALS*
2016
BUDGET
2016 vs 2015
BUDGET
%
CHANGE
BREAKDOWN BY CATEGORY
Labour Expenditures $7,758 $7,590 $8,143 $385 5.0%
Other Expenditures 439 391 455 16 3.7%
Total Expenditures 8,197 7,980 8,598 401 4.9%
Gross Revenues (744) (747) (826) (82) 11.1%
Net Expenditures $7,453 $7,233 $7,773 $319 4.3%
2016 2017 2018
Operating Adjustments $0 $60 $89
Support Staff - 102 191
Negotiated Wages 118 21 -
Infrastructure Operation & Maintenance 201 20 -
Revenue Increases - (12) (101)
COMBINED OPERATING BUDGET VARIANCE $319 $191 $179
CATEGORYBUDGET VARIANCES ($000s)

Budget 2016: Moving the City Forward CS-15
2016-2018 Operating Budget
Division: Council and Administrative Services
* Forecast year-end actuals based on June 30, 2015 actual results
($000s)2015
BUDGET
2015
ACTUALS*
2016
BUDGET
2016 vs 2015
BUDGET
%
CHANGE
BREAKDOWN BY CATEGORY
Labour Expenditures $4,211 $4,260 $4,599 $388 9.2%
Other Expenditures 1,432 1,423 1,566 135 9.4%
Total Expenditures 5,642 5,683 6,165 523 9.3%
Gross Revenues (1,665) (1,705) (2,008) (342) 20.6%
Net Expenditures $3,977 $3,978 $4,157 $180 4.5%
2016 2017 2018
Operating Adjustments $54 $0 ($1)
New Facilities & Services 11 - -
Support Staff 184 223 -
Negotiated Wages 124 11 -
Infrastructure Operation & Maintenance - 130 -
Legislative Changes 150 - -
Revenue Increases (342) (65) (50)
COMBINED OPERATING BUDGET VARIANCE $180 $300 ($51)
CATEGORYBUDGET VARIANCES ($000s)

Budget 2016: Moving the City Forward CS-16
2016-2018 Operating Budget
Division: Business Services
* Forecast year-end actuals based on June 30, 2015 actual results
($000s)2015
BUDGET
2015
ACTUALS*
2016
BUDGET
2016 vs 2015
BUDGET
%
CHANGE
BREAKDOWN BY CATEGORY
Labour Expenditures $2,562 $2,403 $2,618 $56 2.2%
Other Expenditures 711 543 751 40 5.6%
Total Expenditures 3,273 2,946 3,368 95 2.9%
Gross Revenues 0 0 0 0 0.0%
Net Expenditures $3,273 $2,946 $3,368 $95 2.9%
2016 2017 2018
Operating Adjustments ($19) $0 ($2)
Support Staff 151 114 120
Negotiated Wages (36) 0 -
Infrastructure Operation & Maintenance - 90 130
COMBINED OPERATING BUDGET VARIANCE $95 $204 $248
CATEGORYBUDGET VARIANCES ($000s)

Budget 2016: Moving the City Forward CS-17
2016-2018 Operating Budget
Division: Legal Services
* Forecast year-end actuals based on June 30, 2015 actual results
($000s)2015
BUDGET
2015
ACTUALS*
2016
BUDGET
2016 vs 2015
BUDGET
%
CHANGE
BREAKDOWN BY CATEGORY
Labour Expenditures $3,298 $2,958 $3,419 $121 3.7%
Other Expenditures 499 486 509 9 1.9%
Total Expenditures 3,797 3,444 3,927 130 3.4%
Gross Revenues (178) (210) (201) (23) 12.6%
Net Expenditures $3,619 $3,234 $3,727 $108 3.0%
2016 2017 2018
Operating Adjustments $6 $89 $92
Support Staff 65 - -
Negotiated Wages 58 (1) -
Revenue Increases (23) - -
COMBINED OPERATING BUDGET VARIANCE $108 $88 $92
CATEGORYBUDGET VARIANCES ($000s)

Budget 2016: Moving the City Forward CS-18
2016-2018 Capital Budget
Additional details provided in budget binder:
Appendix 2 - “Capital Funding Source Summary”
Appendix 3 - “Capital Budget Project Descriptions”
DIVISION ($000s) 2016 2017 2018 TOTAL
Business Services 198$ 115$ 1,825$ 2,138$
Council & Administrative Services 420 420 385 1,225
Enforcement & Bylaw Services 105 41 5 151
Finance 106 232 356 694
Human Resources (11) 14 14 17
Information Technology 4,359 5,800 5,389 15,548
Departmental Total 5,177$ 6,622$ 7,974$ 19,773$

Budget 2016: Moving the City Forward CS-19
2016-2018 Capital Budget
2016 20172018 &
Beyond
Grand
Total
Tax Bill
($)
Property
Tax %
Data Centre Management Business Continuity $55 $55
Technology Infrastructure Mgmt Program 200 250 450
Brampton Records & Info Mgmt System-BRIMS 205 205
Printer Fleet Management System 80 80
Mobile Licence Permit Automation 20 20
GIS Integration Planning 60 230 290
Office 365 / Exchange Implementation 200 200
Citrix Licensing (Growth) 65 65
$885 $480 $1,365 $7 0.35%
* Based on 2016 Average Residential Home Assessment of $398,000
Operating Impact of 2016 Capital Budget
Average Household
Impact *Operating Impact ($000s)
Project Description

Budget 2016: Moving the City Forward CS-20
2016-2018 Capital Budget
2017 20182019 &
Beyond
Grand
Total
Tax Bill
($)
Property
Tax %
GIS Integration Planning $60 $60
Mobile Device Management 10 30 40
IT Data Centre Management 25 75 100
E-Mail Services for Part-Time Staff 10 30 40
City Wide Telephone 25 75 100
$130 $210 $340 $2 0.08%
* Based on 2016 Average Residential Home Assessment of $398,000
Average Household
Impact *
Operating Impact of 2017 Capital Budget
Project Description
Operating Impact ($000s)

Budget 2016: Moving the City Forward CS-21
2016-2018 Capital Budget
2018 20192020 &
Beyond
Grand
Total
Tax Bill
($)
Property
Tax %
Technology Infrastructure Mgmt Program $100 $100
GIS Integration Planning 70 70
Citrix Licensing (Growth) 65 195 260
$100 $135 $195 $430 $2 0.10%
* Based on 2016 Average Residential Home Assessment of $398,000
Average Household
Impact *
Operating Impact of 2018 Capital Budget
Project Description
Operating Impact ($000s)

Budget 2016: Moving the City Forward CS-22
Questions?