Embed Size (px)
Citation preview

2016-2017 DATA SNAPSHOT
0
100
200
300
400
500
600
700
800
900
1000
281
388
647
815
936
Number of Classrooms
2013 2014 2015 2016 2017
Growth and Expansion

Alabama’s First Class
Pre-K Classrooms
Across the State in
Eight Regions

72%
1%
8%
1%
12%
3%
1%
2%
Diverse Delivery
Public School
Private School
Private Childcare
Military School
Head Start
Faith-Based Childcare
College/University
Community Organization
Program
Types
0
2,000
4,000
6,000
8,000
10,000
12,000
14,000
16,000
18,000
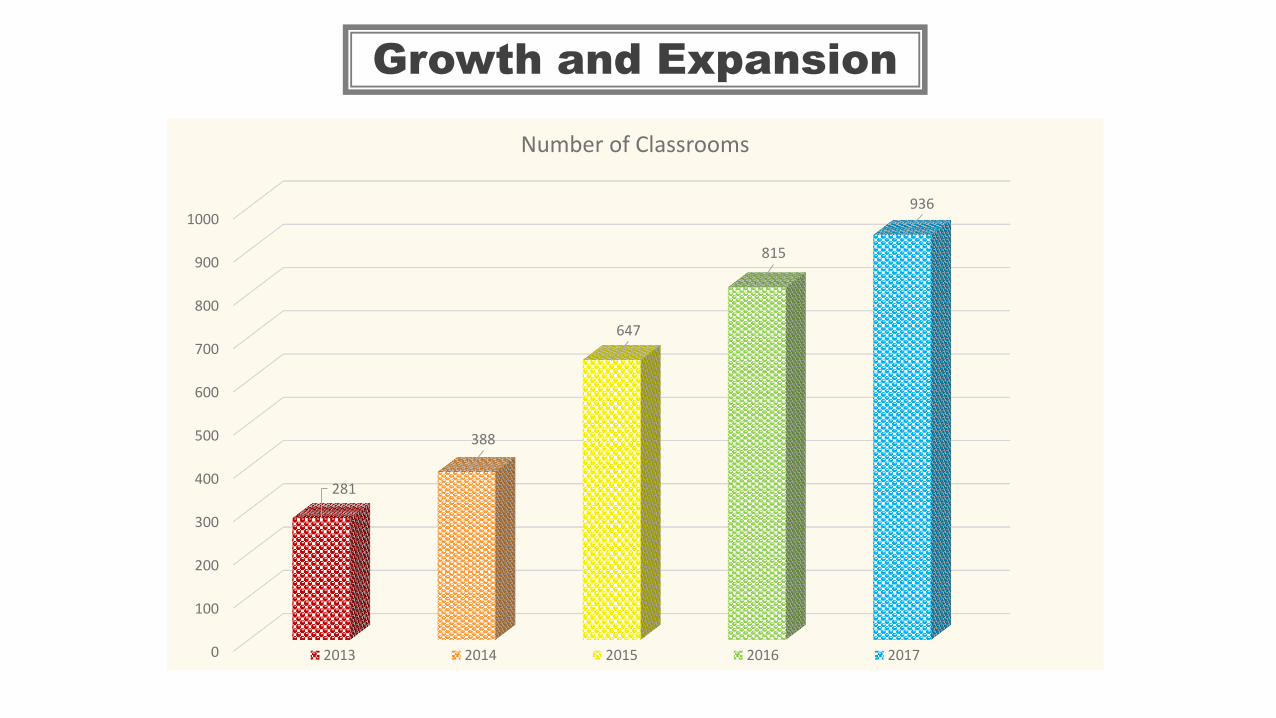
5,058
6,984
11,646
14,671
16,848
2013 2014 2015 2016 2017
Number of Children Being Served

2014
12%
2015
20%
2016
24%
2017
28%
Percentage of 4-year-olds in Alabama Being Served by First
Class Pre-KAccording to the
National Kids Count Data Book
Alabama’s 2018 PDG Goal = 26%

Children Served by Degree of Need
0
2,000
4,000
6,000
8,000
10,000
12,000
14,000
16,000
18,000
2014 2015 2016 2017
4,248
7,4709,576
11,3402,736
4,176
5,094
5,508
Highest Need Counties Other Counties
6,984
11,646
14,670
16,848
267% Increase
201% Increase
241% Increase
Data Compiled May, 2017

Children Served in 16-17 by Race
44%
44%
1%
1%
<1%
4%6%
Child Diversity Percentages Served by First Class Pre-K
Black/African American
White/Caucasian
Asian
American Indian/AlaskanNative
Native Hawaiian/PacificIslander
More than One Race
Latino/Hispanic
White: 58.4%
Black/African American: 29.9%
Asian: 1.4%
American Indian/Alaskan Native: .5%
More than One Race: 2.9%
Hispanic: 6.9%
Alabama Child Diversity Percentages Served by State Public Schools

❖ CLASS (Classroom Assessment Scoring System) • research-based instrument for assessing quality of teacher-child interactions • proven valid and reliable in studies conducted by researchers at the University of Virginia and
the Gates Foundation’s Measures of Effective Teaching Study❖ Alabama’s First Class Pre-K CLASS averages are above the national average
Standards of High Quality
6.05 6.0 5.79 5.7
3.32 2.9
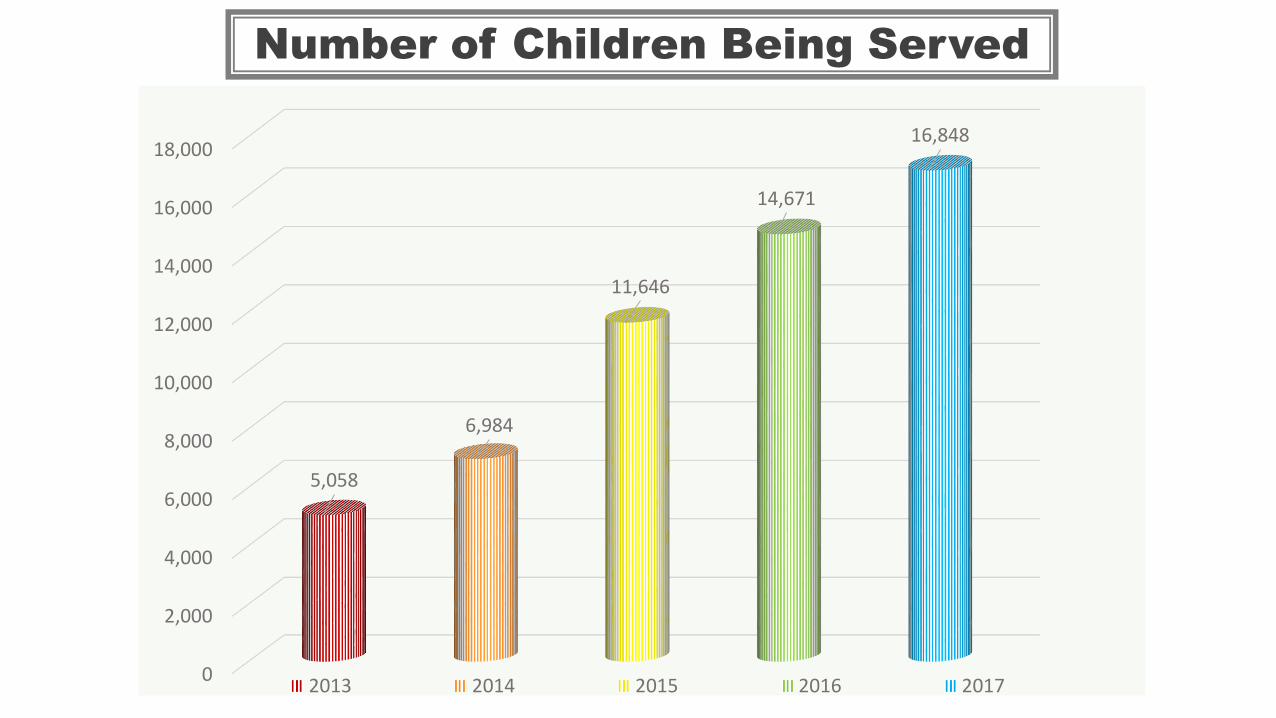
Quality Areas of Focus
Teacher Credential
Requirements
Low Student:Teacher
Ratios
Pay Parity
Job-EmbeddedProfessional
Development
Ongoing, Consistent
Coaching and Monitoring
Research-Based, Developmentally
Appropriate Assessment of Student
Growth and Development

Positive Impact
❖ GOLD (Teaching Strategies GOLD) research-based instrument for assessing children’s learning over time• Measurement tool proven valid and reliable in studies conducted by researchers at the American
Institute for Research (AIR) and The Center for Educational Measurement and Evaluation at the University of North Carolina at Charlotte.
❖ Nearly all children who attended Alabama’s First Class Pre-K finished the year meeting or exceeding widely-held expectations across all domains of school readiness for their age.
46.3
53.7
4.1
95.9
46.1
53.9
4.2
95.8
46.6
53.4
6.4
93.6
47.252.8
4.0
96.0
30.2
69.8
2.2
97.8
63.1
36.9
8.2
91.8
0.0
10.0
20.0
30.0
40.0
50.0
60.0
70.0
80.0
90.0
100.0
Below Meets or Exceeds Below Meets or Exceeds
Fall Spring
Pe
rce
nt
of
child
ren
te
ste
d
Social-emotional (n=11,722)
Physical (n=11,722)
Language (n=11,722)
Cognitive (n=11,722)
Literacy (n=11,722)
Math (n=11,722)

Developmental
Growth
Fall Spring
Social-emotional 53.7 95.9
Physical 53.9 95.8
Language 53.4 93.6
Cognitive 52.8 96
Literacy 69.8 97.8
Math 36.9 91.8
30
40
50
60
70
80
90
100
❖ Growth in developmental domains as shown by percent of children meeting or exceeding Widely-Held Expectations (WHE) in Fall compared to Spring (end of First Class Pre-K year)
❖ Area of greatest weakness = Math
❖ Area of greatest growth = Math
• In Fall, only 36.9% of children met or exceeded WHE for their age in Math. By Spring, 91.8% were meeting or exceeding WHE.
Difference
42.2
41.9
40.2
43.2
28
54.9