Embed Size (px)
Citation preview


2016-2017 Consolidated Budget
October 1, 2016 – September 30, 2017
DRAFT

HOUSING AUTHORITY OFFICIALS
BOARD OF COMMISSIONERS
Gregory Arnaudo, Chairperson Dale Cose, First Vice Chairperson
Martha Moore, Second Vice Chairperson Lester Patrick Rudolph Willey
EXECUTIVE DIRECTOR
Peter W. Ragsdale
GENERAL COUNSEL
Alan R. Coon
Prepared by: Melinda Hazard
Director of Finance
DRAFT
2
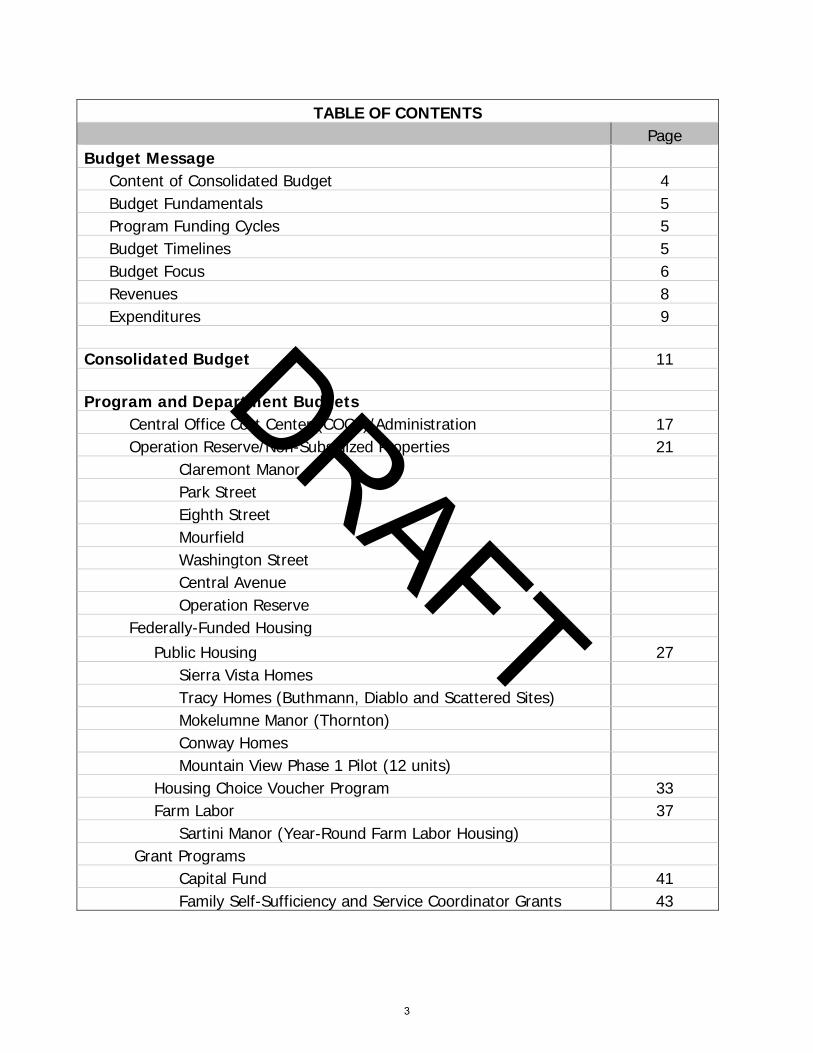
TABLE OF CONTENTS Page
Budget Message Content of Consolidated Budget 4 Budget Fundamentals 5 Program Funding Cycles 5 Budget Timelines 5 Budget Focus 6 Revenues 8 Expenditures 9 Consolidated Budget 11 Program and Department Budgets Central Office Cost Center (COCC)/Administration 17 Operation Reserve/Non-Subsidized Properties 21 Claremont Manor Park Street Eighth Street Mourfield Washington Street Central Avenue Operation Reserve Federally-Funded Housing Public Housing 27 Sierra Vista Homes Tracy Homes (Buthmann, Diablo and Scattered Sites) Mokelumne Manor (Thornton) Conway Homes Mountain View Phase 1 Pilot (12 units) Housing Choice Voucher Program 33 Farm Labor 37 Sartini Manor (Year-Round Farm Labor Housing) Grant Programs Capital Fund 41 Family Self-Sufficiency and Service Coordinator Grants 43
DRAFT
3

BUDGET MESSAGE
For the fiscal year beginning October 1, 2016
********
The proposed consolidated operating budget provides for the continuation of a financially sound operation for the Housing Authority of the County of San Joaquin (Authority) in the midst of many funding uncertainties. Specific information about the funding uncertainties is provided.
Content of the Consolidated Budget
This report contains annual budgets for the following properties and programs:
♦ Central Office Cost Center (COCC)/Administration
Revenues include management fees paid by other programs to pay for centralized administrative functions.
♦ Housing Authority-Owned Non-Subsidized Properties
Properties include: Claremont Manor, Park Street, Mourfield, Central Avenue, Washington Street, and Eighth Street.
♦ Public Housing
The five public housing developments total 1,075 units consisting of:
• 390 units at Sierra Vista Homes (36 units have been demolished pending development plan for reconstruction);
• 195 units at Tracy Homes; • 50 units at Mokelumne Manor; • 428 units at Conway Homes; and • 12 units in the Mountain View Phase 1.
Capital Fund Grant funding by the U.S. Department of Housing and Urban Development (HUD) also supports the public housing developments.
♦ Housing Choice Voucher Programs
Rent subsidies paid to private property owners on behalf of approximately 5,072 households. Programs include Housing Choice Vouchers (HCV) and Veterans Affairs Supportive Housing (HUD-VASH) vouchers funded by HUD.
DRAFT
4
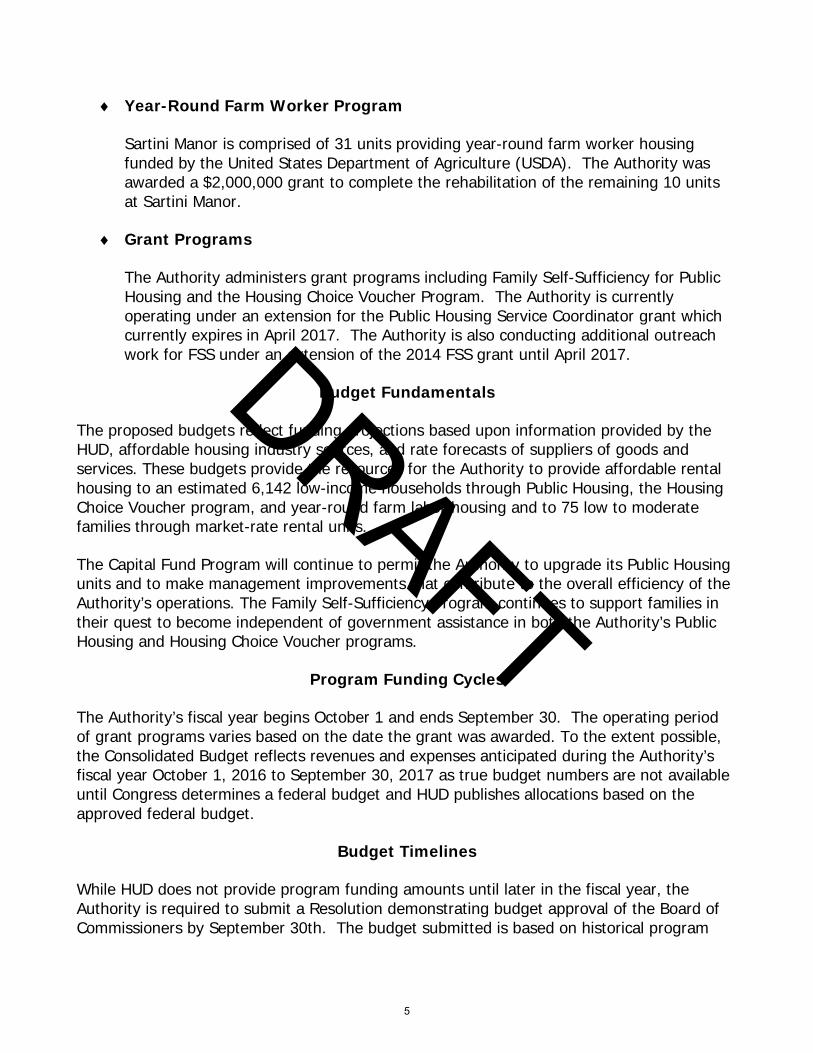
♦ Year-Round Farm Worker Program
Sartini Manor is comprised of 31 units providing year-round farm worker housing funded by the United States Department of Agriculture (USDA). The Authority was awarded a $2,000,000 grant to complete the rehabilitation of the remaining 10 units at Sartini Manor.
♦ Grant Programs
The Authority administers grant programs including Family Self-Sufficiency for Public Housing and the Housing Choice Voucher Program. The Authority is currently operating under an extension for the Public Housing Service Coordinator grant which currently expires in April 2017. The Authority is also conducting additional outreach work for FSS under an extension of the 2014 FSS grant until April 2017.
Budget Fundamentals
The proposed budgets reflect funding projections based upon information provided by the HUD, affordable housing industry sources, and rate forecasts of suppliers of goods and services. These budgets provide the resources for the Authority to provide affordable rental housing to an estimated 6,142 low-income households through Public Housing, the Housing Choice Voucher program, and year-round farm labor housing and to 75 low to moderate families through market-rate rental units.
The Capital Fund Program will continue to permit the Authority to upgrade its Public Housing units and to make management improvements that contribute to the overall efficiency of the Authority’s operations. The Family Self-Sufficiency Program continues to support families in their quest to become independent of government assistance in both the Authority’s Public Housing and Housing Choice Voucher programs.
Program Funding Cycles
The Authority’s fiscal year begins October 1 and ends September 30. The operating period of grant programs varies based on the date the grant was awarded. To the extent possible, the Consolidated Budget reflects revenues and expenses anticipated during the Authority’s fiscal year October 1, 2016 to September 30, 2017 as true budget numbers are not available until Congress determines a federal budget and HUD publishes allocations based on the approved federal budget.
Budget Timelines
While HUD does not provide program funding amounts until later in the fiscal year, the Authority is required to submit a Resolution demonstrating budget approval of the Board of Commissioners by September 30th. The budget submitted is based on historical program
DRAFT
5

expenditures and projections. The Capital Fund Program budget was approved by the Board of Commissioners on June 16, 2016 as part of the Public Housing Annual Plan.
Budget Focus for FY 2016-17
Financial Performance of Authority-Owned Non-Subsidized Properties
Collectively, the net cash flow of the Authority-owned non-subsidized properties continued to be negative for the last completed fiscal year. The Authority continues to evaluate the performance of each property to determine each property’s viability. Staff is currently evaluating the rents at each property and will be recommended implementing rent increases to help the performance of the properties. An application to receive project-based voucher assistance has been submitted for Claremont Manor and the budget has been developed to include this subsidy. These changes will greatly improve the cash flow of the Authority’s non-subsidized portfolio.
Public Housing Operating Subsidy
The amount of subsidy the Authority will receive for FY 2016-17 is uncertain at the time of budget adoption and will most likely remain uncertain through the end of the current fiscal year based upon prior years’ experience. The Authority remains highly reliant on Operating Subsidy in providing affordable rents to 1,039 Public Housing tenants. The subsidy is comprised of 55.3 percent of projected FY 2016-17 program income while tenant rents contribute 42.1 percent and miscellaneous sources provide the remaining 2.6 percent.
The Operating Subsidy is calculated by the Authority in accordance with HUD guidelines. HUD funds the Operating Subsidy for Public Housing on a calendar year (CY). The actual amount of subsidy allocated depends on the level of Congressional appropriation. In past years, housing authorities have received between 90 and 100 percent of subsidy “entitlement”. Beginning in 2013, funding has been prorated between 76 and 88 percent. Recent federal budgeting actions indicate that Operating Subsidies will be prorated again for 2017. Based on funding projections for FY 2016-2017, the Authority budgeted to receive 83.5 percent of subsidy entitlement.
Housing Choice Voucher (HCV) Housing Assistance Payments
The federal budget authority for Housing Assistance Payments (HAP) under the Housing Choice Voucher program is uncertain as of the start of the Authority’s 2016-17 fiscal year. HUD funds the HCV program on a calendar year. In the past, housing authorities were notified of their budget authority one to two months prior to the start of the calendar year, although for the past several years, agencies have not been notified until their fiscal years were well underway.
DRAFT
6

The Authority will need to monitor and adjust the number of voucher households participating in the HCV program during 2017 according to (1) HAP budget authority, (2) the average HAP expenditure per household per month, (3) the rate of lease-up, and (4) the rate of HAP terminations throughout the year. HUD began “short funding” the HAP needs of housing authorities in CY 2009 while requiring housing authorities to use up all or nearly all their HAP reserves, known as Net Restricted Position (NRP). The Authority’s HUD Held NRP balance as of June 30, 2016 was $4,868,477. HUD expects housing authorities to expend 97 to 100 percent of HAP budget authority during each program year. The Authority is currently working closing with HUD to monitor voucher utilization to maximize usage and spend down the Authority’s HAP reserves.
HCV Administrative Fees
The uncertainty of HAP budget authority described above also results in uncertainty in the level of HCV administrative fees to be earned by the Authority during the fiscal year. Housing authorities earn administrative fees under the HCV program at a HUD-published rate per unit month adjusted monthly by a floating proration factor. Historically, HUD finalizes each month’s administrative fee earned approximately six months after said month. This results in another level of uncertainty for funding administrative costs.
The Authority has budgeted HCV administrative fees based upon two factors: 1) the FY 2015-16 level of HAP budget authority; and 2) an average HAP per unit/month of $585. The Authority is budgeting for increased voucher utilization which in turn increases the administrative revenues for the program. Should the 2016-17 HAP budget authority be at or less than that of 2016 and/or should the average HAP per unit/month be greater than forecasted, the level to which the Authority can increase voucher utilization will be affected thus the Authority will earn less than the budgeted level of administrative fees. This would adversely impact the HCV program’s operations and the ability to pay COCC fees supporting agency operations. The Authority has budgeted administrative fees based upon 80 percent of the projected 2016 administrative fees earned for vouchers under lease. The HCV administrative fee reserves as of June 2016 are over $2.2 million.
DRAFT
7
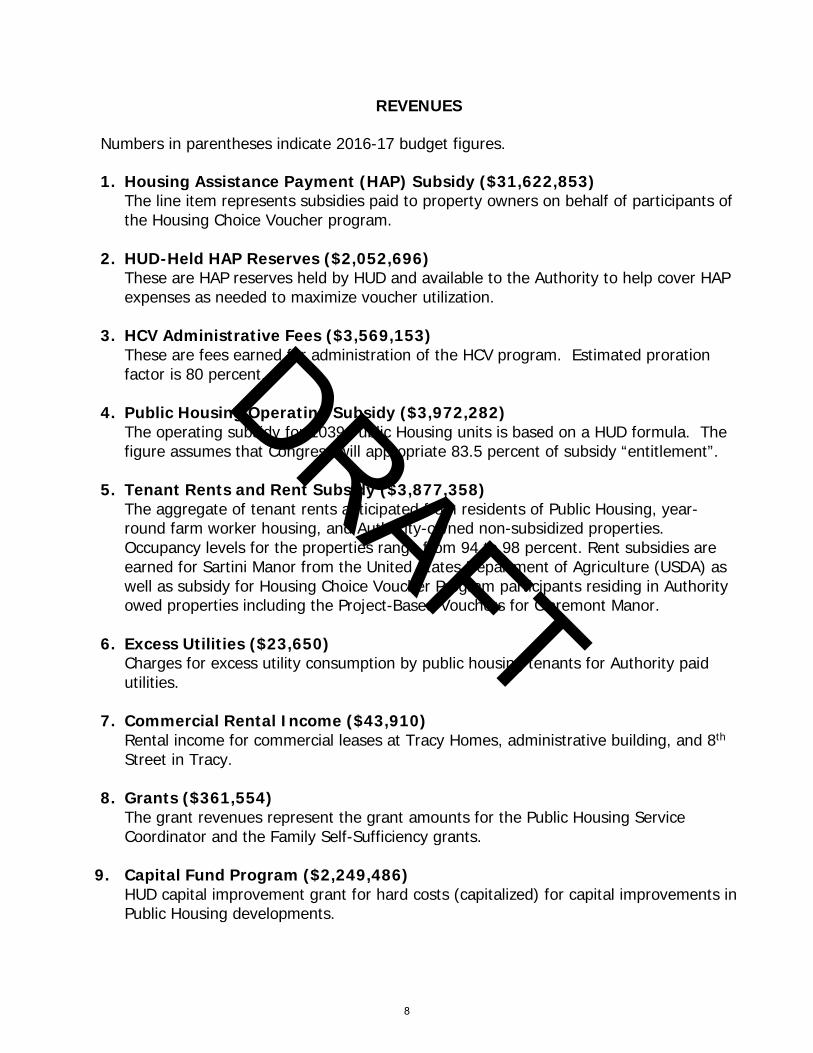
REVENUES
Numbers in parentheses indicate 2016-17 budget figures.
1. Housing Assistance Payment (HAP) Subsidy ($31,622,853) The line item represents subsidies paid to property owners on behalf of participants of the Housing Choice Voucher program.
2. HUD-Held HAP Reserves ($2,052,696) These are HAP reserves held by HUD and available to the Authority to help cover HAP expenses as needed to maximize voucher utilization.
3. HCV Administrative Fees ($3,569,153) These are fees earned for administration of the HCV program. Estimated proration factor is 80 percent.
4. Public Housing Operating Subsidy ($3,972,282)
The operating subsidy for 1039 Public Housing units is based on a HUD formula. The figure assumes that Congress will appropriate 83.5 percent of subsidy “entitlement”.
5. Tenant Rents and Rent Subsidy ($3,877,358) The aggregate of tenant rents anticipated from residents of Public Housing, year-round farm worker housing, and Authority-owned non-subsidized properties. Occupancy levels for the properties range from 94 to 98 percent. Rent subsidies are earned for Sartini Manor from the United States Department of Agriculture (USDA) as well as subsidy for Housing Choice Voucher Program participants residing in Authority owed properties including the Project-Based Vouchers for Claremont Manor.
6. Excess Utilities ($23,650) Charges for excess utility consumption by public housing tenants for Authority paid utilities.
7. Commercial Rental Income ($43,910) Rental income for commercial leases at Tracy Homes, administrative building, and 8th Street in Tracy.
8. Grants ($361,554)
The grant revenues represent the grant amounts for the Public Housing Service Coordinator and the Family Self-Sufficiency grants.
9. Capital Fund Program ($2,249,486)
HUD capital improvement grant for hard costs (capitalized) for capital improvements in Public Housing developments.
DRAFT
8

10. Management Fee Revenue ($2,631,682) Fees paid by all programs to support centralized administrative costs of the COCC. This also includes revenues received by COCC for fee-for-service of the General Counsel and Management Services Unit’s time billed to the programs/properties.
11. Repayment Agreements and Fraud Recovery ($76,948)
Payments from tenants and Housing Choice Voucher program for past due rents, security deposits, unreported income or other fraud recovery.
12. Interest Income ($39,177) Estimated interest income earned on reserve funds held in the Authority’s various programs.
13. Tenant Charges, Laundry and Other Income ($128,343) Revenues include tenant charges for repairs and late fees as well as laundry and other income.
Expenditures
1. HCV Housing Assistance Payments ($33,699,428) This cost category includes: rent subsidy paid to property owners on behalf of eligible participants for the HCV program.
2. Administrative Salaries and Benefits ($5,220,881) This cost category includes: salaries and fringe benefit costs associated with Administrative Authority employees.
3. Management and Administrative Fees ($2,449,580)
This cost category includes: fees paid by the HCV Program, Public Housing, Sartini Manor, Capital Fund, and Authority-owned properties to the COCC/Administration.
4. Other Administrative Costs ($1,320,291) This cost category includes all other administrative costs: third-party legal services, travel and training expenses, technical publications, dues, office supplies, office equipment maintenance, printing, postage, and telephone expenses.
5. Tenant Services ($25,225) This cost category includes: resident council stipends and other resident expenses as set by HUD.
6. Utilities ($1,218,629) This cost category includes: utility costs for all Authority paid utilities.
DRAFT
9

7. Maintenance and Repairs ($3,505,702)
This cost category includes: maintenance salaries, fringe benefits, materials and contracts required for preventative maintenance, unit turnover and work order maintenance of Public Housing, Sartini Manor, Authority-owned non-subsidized properties, and administrative offices.
8. Portability Fees – Outgoing ($12,914) This cost category includes: HCV administrative fees paid by the Authority to other housing authorities that administer a HCV participant from the Authority and choose to bill the Authority rather than issue their own agency’s voucher.
9. Other Operating/General Expenses ($1,222,824) This cost category includes: alarm and security services, insurance premiums, Public Housing Payment In Lieu of Taxes (PILOT), collection losses for unpaid rent and vacate charges, principle payments and interest expenses for mortgages held on Sartini Manor and the Authority’s non-subsidized properties, taxes and assessments, workers compensation and other general expenses.
10. Commissioner’s Expenses ($25,500) This cost category includes: per diems, travel expenses, strategic planning retreat, and other sundry costs.
DRAFT
10

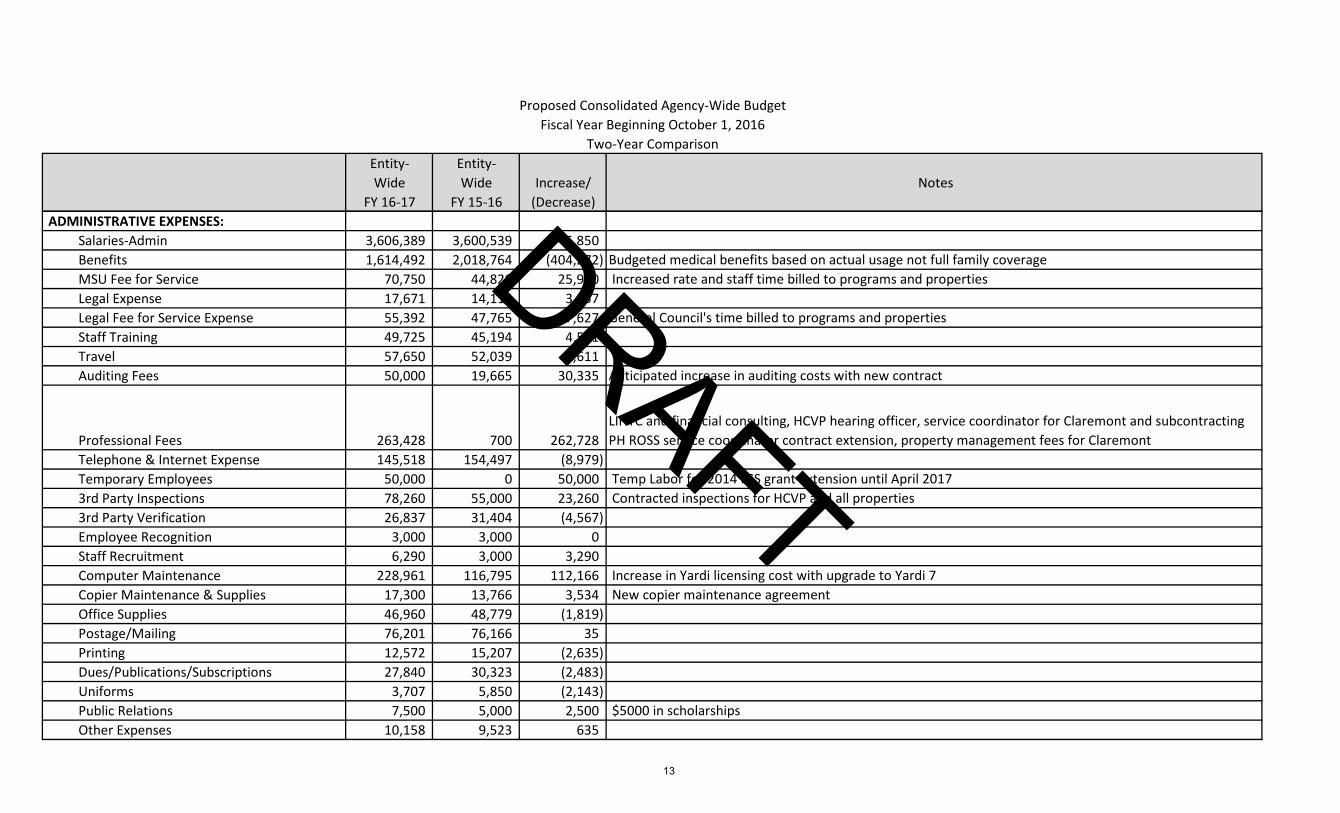
Consolidated Agency-Wide Proposed Budget
The spreadsheet on the following page is the fiscal year 2016-2017 agency-wide consolidated budget. The proposed budget provides a two-year comparison of proposed revenues and expenditures against the approved budget for fiscal year 2015-2016 with explanations of variances.
DRAFT
11

Entity- Entity-Wide Wide Increase/ Notes
FY 16-17 FY 15-16 (Decrease) INCOME
Operating Subsidy 6,221,768 6,100,347 121,421 Subsidy projection for 12 Pilot units and increased proration for public housing at 83.5% proration Annual Contribution Earned-Voucher 31,622,853 31,012,675 610,178 Increase in voucher utilization HUD Held HAP Reserves 2,052,696 0 2,052,696 HUD held HAP reserves (NRP) used to cover HAP expenses for HCVP Admin Fee-A C Earned-Vouchers 3,569,153 2,976,734 592,419 20% proration for 4775 vouchers
Dwelling Rent Income 3,492,610 3,326,647 165,963Increase based on public housing tenant's incomes in FY 15-16, rent increases at Claremont, Mourfield and Sartini
Repayment Agreement 26,090 0 26,090 Previously not used in budget development as potential income Subsidized Rent Income 384,749 0 384,749 Income from project based voucher assistance Late Charges 23,926 17,638 6,288 Enforcement of late fee charges Excess Utilities 23,650 17,263 6,387 Repair Income 94,362 75,822 18,540 Increase in rates and enforcement of tenant charges Commercial Rental Income 43,910 23,340 20,570 Space rent charged to HCVP Fraud Recovery-Admin Fees 50,858 0 50,858 Previously not used in budget development as potential income Grant Revenue 361,554 348,066 13,488 Extension to 2014 FSS grant, 2015 FSS grant and extension to ROSS Service Coordinator grant Management Fee Revenue 1,864,176 1,673,776 190,400 Increase in management fee rates and increased voucher utilization Asset Management Fee 124,920 121,172 3,748 Occupancy in 12 PILOT units Bookkeeping Fee Revenue 525,518 500,279 25,239 Increased voucher utilization Legal Fee for Service 52,572 47,765 4,807 MSU Fee for Service 64,496 44,820 19,676 Increased rate and staff time billed to programs and properties Interest Income 39,177 31,532 7,645 Other Income 6,258 2,705 3,553 Laundry Income 3,797 2,406 1,391TOTAL INCOME 50,649,093 46,322,987 4,326,106
EXPENSES
Proposed Consolidated Agency-Wide BudgetFiscal Year Beginning October 1, 2016
Two-Year Comparison
DRAFT
12
Entity- Entity-Wide Wide Increase/ Notes
FY 16-17 FY 15-16 (Decrease)
Proposed Consolidated Agency-Wide BudgetFiscal Year Beginning October 1, 2016
Two-Year Comparison
ADMINISTRATIVE EXPENSES: Salaries-Admin 3,606,389 3,600,539 5,850 Benefits 1,614,492 2,018,764 (404,272) Budgeted medical benefits based on actual usage not full family coverage MSU Fee for Service 70,750 44,820 25,930 Increased rate and staff time billed to programs and properties Legal Expense 17,671 14,114 3,557 Legal Fee for Service Expense 55,392 47,765 7,627 General Council's time billed to programs and properties Staff Training 49,725 45,194 4,531 Travel 57,650 52,039 5,611 Auditing Fees 50,000 19,665 30,335 Anticipated increase in auditing costs with new contract
Professional Fees 263,428 700 262,728LIHTC and financial consulting, HCVP hearing officer, service coordinator for Claremont and subcontracting PH ROSS service coordinator contract extension, property management fees for Claremont
Telephone & Internet Expense 145,518 154,497 (8,979) Temporary Employees 50,000 0 50,000 Temp Labor for 2014 FSS grant extension until April 2017 3rd Party Inspections 78,260 55,000 23,260 Contracted inspections for HCVP and all properties 3rd Party Verification 26,837 31,404 (4,567) Employee Recognition 3,000 3,000 0 Staff Recruitment 6,290 3,000 3,290 Computer Maintenance 228,961 116,795 112,166 Increase in Yardi licensing cost with upgrade to Yardi 7 Copier Maintenance & Supplies 17,300 13,766 3,534 New copier maintenance agreement Office Supplies 46,960 48,779 (1,819) Postage/Mailing 76,201 76,166 35 Printing 12,572 15,207 (2,635) Dues/Publications/Subscriptions 27,840 30,323 (2,483) Uniforms 3,707 5,850 (2,143) Public Relations 7,500 5,000 2,500 $5000 in scholarships Other Expenses 10,158 9,523 635
DRAFT
13

Entity- Entity-Wide Wide Increase/ Notes
FY 16-17 FY 15-16 (Decrease)
Proposed Consolidated Agency-Wide BudgetFiscal Year Beginning October 1, 2016
Two-Year Comparison
Office Space Rent 14,571 0 14,571 Space rent charged to HCVP Mgmt & Admin Fee Expense 1,799,142 1,675,560 123,582 Increase in management fee rates and increased voucher utilization Asset Management Fee Expense 124,920 121,172 3,748 Bookkeeping Fee Expense 525,518 499,153 26,365 Increase in voucher utilization TOTAL ADMINISTRATIVE EXP. 8,990,752 8,707,795 282,957
TENANT SERVICES: Resident Council/Stipends 5,125 5,125 0 Resident Council-Other Expenses 10,050 10,050 0 Resident Costs 10,050 10,050 0 TOTAL TENANT SERVICES: 25,225 25,225 0
UTILITIES: Water 442,820 407,273 35,547 Anticipated rate increase Electricity 99,926 90,140 9,786 Anticipated rate increase Gas 43,721 46,981 (3,260) Based on current usage and anticipated increases URP 48,927 45,940 2,987 Based on tenant's incomes in public housing Sewer 583,236 534,724 48,512 Based on current usage and anticipated rate increases TOTAL UTILITY EXPENSES 1,218,629 1,124,758 93,871
MAINTENANCE-WAGES/BENEFITS: Maintenance Labor 1,265,201 1,370,279 (105,078) Not filling previously budgeted positions Benefits-Maintenance 731,301 37,750 693,551 Not filling previously budgeted positions
Maintenance Fee for Service 84,539 812,928 (728,389)Maintenance Project Manager's time previously budgeted to PH now in COCC and billed through fee for service
Maintenance - Materials 414,190 482,422 (68,232)
DRAFT
14

Entity- Entity-Wide Wide Increase/ Notes
FY 16-17 FY 15-16 (Decrease)
Proposed Consolidated Agency-Wide BudgetFiscal Year Beginning October 1, 2016
Two-Year Comparison
Maintenance - Contract Work 1,010,471 692,689 317,782Contracted work for unit turn over, landscaping, increased extermination services and overall maintenance of the properties
TOTAL MAINTENANCE EXPENSES 3,505,702 3,396,768 108,934
GENERAL EXPENSE: Protective Service 189,579 269,522 (79,944) Portion of Police contract paid through operations Insurance 253,621 250,856 2,765 Workers Comp Ins/First Aid 246,323 256,301 (9,978) Payments in Lieu of Taxes (PILOT) 186,968 183,449 3,519 Taxes & Assessments 59,823 80,829 (21,006) Interest Expense 126,954 166,225 (39,271) Principle Payments 159,557 120,545 39,012 Admin Fees-Portable Voucher 12,914 32,000 (19,086) TOTAL GENERAL EXPENSE 1,235,738 1,359,737 (123,999)
COMMISSIONER EXPENSES: Commissioner Per Diem 6,500 10,000 (3,500) Commissioner Travel Expense 14,000 15,000 (1,000) Commissioner-Other Expenses 4,500 7,500 (3,000) TOTAL COMMISSIONER EXPENSE 25,000 32,500 (7,500)
TOTAL HOUSING ASSISTANCE PAYMENTS 33,699,478 31,012,675 2,686,803 Increased voucher utilization
OTHER USES OF FUNDS Capital Expenditures/Special Projects 1,948,486 2,119,647 (171,161)TOTAL OTHER USES OF FUNDS 1,948,486 2,119,647 (171,161)
DRAFT
15

Entity- Entity-Wide Wide Increase/ Notes
FY 16-17 FY 15-16 (Decrease)
Proposed Consolidated Agency-Wide BudgetFiscal Year Beginning October 1, 2016
Two-Year Comparison
TOTAL EXPENSES 50,649,010 47,779,105 2,869,905
SUBTOTAL NET REVENUES 83 (1,456,118) 1,456,201
FUNDS FROM (TO) RESERVES (83) 1,456,118 (1,456,201)DRAFT
16

Central Office Cost Center/Administration
The Central Office Cost Center (COCC) proposed budget represents the Authority’s centralized administrative functions. The COCC receives management fees from the Public Housing, Capital Fund, HCV, Sartini Manor, and Authority-Owned rental properties. The COCC was established to conform to HUD’s Public Housing program requirements. COCC expenses reflect indirect agency staffing and administrative costs such as the salaries for the Executive Director, Clerk of the Board, legal department, finance, business office including human resources and procurement, administration of capital projects, and information technology. The spreadsheet on the following page is the fiscal year 2016-2017 COCC budget. The proposed FY 16-17 budget provides a two-year comparison of proposed revenues and expenditures against the approved budget for fiscal year 2015-2016 with explanations of variances.
DRAFT
17

COCC COCC100 100 Increase/ Notes
FY 16-17 FY 15-16 (Decrease) INCOME
Management Fee Revenue 1,864,176 1,673,776 190,400Increase in management fees from increased voucher utilization, increased management fee rates for public housing and non-subsidized properties
Asset Management Fee 124,920 121,172 3,748 Bookkeeping Fee Revenue 525,518 500,279 25,239 Increase in voucher utilization Legal Fee for Service 52,572 47,765 4,807 General Counsel's time billed to properties/programs MSU Fee for Service 64,496 44,820 19,676 Administrative Analysts time billed to properties/programs Interest Income 102 241 (139) Other Income 500 791 (291)TOTAL INCOME 2,632,284 2,388,844 243,440
EXPENSES ADMINISTRATIVE EXPENSES:
Salaries-Admin 1,559,814 1,386,246 173,568Procurement Administrative Analyst moved to COCC from PH, increase in salaries and anticipated cost of living increases and Merit increases
Benefits 652,708 727,320 (74,612) Budgeted medical benefits based on actual usage not full family coverage Legal Expense 8,000 8,000 0 Staff Training 30,000 26,000 4,000 Travel 48,000 44,190 3,810 Auditing Fees 7,990 3,400 4,590 Anticipated increase in auditing costs Professional Fees 5,000 0 5,000 Consulting for LIHTC accounting and other financial management as needed Telephone & Internet Expense 50,140 63,587 (13,447) Employee Recognition 3,000 3,000 0 Staff Recruitment 5,000 2,000 3,000 Computer Maintenance 92,000 62,000 30,000 Increase in Yardi Licensing and IT infrastucture needs Copier Maintenance & Supplies 5,523 7,000 (1,477) Office Supplies 21,000 20,000 1,000 Postage/Mailing 10,750 10,626 124
Proposed Central Office Cost Center (COCC)/Administration BudgetFiscal Year Beginning October 1, 2016
Two-Year Comparison
DRAFT
18

COCC COCC100 100 Increase/ Notes
FY 16-17 FY 15-16 (Decrease)
Proposed Central Office Cost Center (COCC)/Administration BudgetFiscal Year Beginning October 1, 2016
Two-Year Comparison
Printing 950 949 1 Dues/Publications/Subscriptions 20,000 20,000 0 Uniforms 0 150 (150)
Public Relations 7,500 5,000 2,500 Scholarships and other other public relations events Other Expenses 5,000 5,000 0 TOTAL ADMINISTRATIVE EXP. 2,532,375 2,394,468 137,907
UTILITIES: Water 1,000 1,150 (150) Electricity 10,000 12,500 (2,500) Gas 2,000 2,500 (500) Sewer 1,200 1,200 0 TOTAL UTILITY EXPENSES 14,200 17,350 (3,150)
MAINTENANCE-WAGES/BENEFITS:
Maintenance Labor 83,661 43,756 39,905Maintenance Project Manager salary moved form PH and Capital Fund program to COCC. Time will be billed to properties through Maintenance Fee for Service
Benefits-Maintenance 39,810 27,484 12,326
Maintenance Fee for Service (140,000) (42,000) (98,000)Portion of Maintenance Project Manager and Director of Capital Project's time billed to properties and Capital Fund program
Maintenance - Materials 5,774 6,028 (254) Maintenance - Contract Work 19,682 25,498 (5,816) TOTAL MAINTENANCE EXPENSES 8,927 60,766 (51,839)
GENERAL EXPENSE: Protective Service 2,003 3,000 (997) Insurance 900 1,400 (500)
DRAFT
19

COCC COCC100 100 Increase/ Notes
FY 16-17 FY 15-16 (Decrease)
Proposed Central Office Cost Center (COCC)/Administration BudgetFiscal Year Beginning October 1, 2016
Two-Year Comparison
Workers Comp Ins/First Aid 39,407 43,368 (3,961) Taxes & Assessments 2,600 3,200 (600) TOTAL GENERAL EXPENSE 44,910 50,968 (6,058)
COMMISSIONER EXPENSES: Commissioner Per Diem 6,500 10,000 (3,500) Based on historical trends in expenses Commissioner Travel Expense 14,000 15,000 (1,000) Based on historical trends in expenses Commissioner-Other Expenses 4,500 7,500 (3,000) Based on historical trends in expenses TOTAL COMMISSIONER EXPENSE 25,000 32,500 (7,500)
OTHER USES OF FUNDS Capital Expenditures/Special Projects 0 22,000 (22,000)TOTAL OTHER USES OF FUNDS 0 22,000 (22,000)
TOTAL EXPENSES 2,625,412 2,578,052 47,360
SUBTOTAL NET REVENUES 6,872 (189,208) 196,080
FUNDS FROM (TO) RESERVES (6,872) 189,208 (196,080)
DRAFT
20

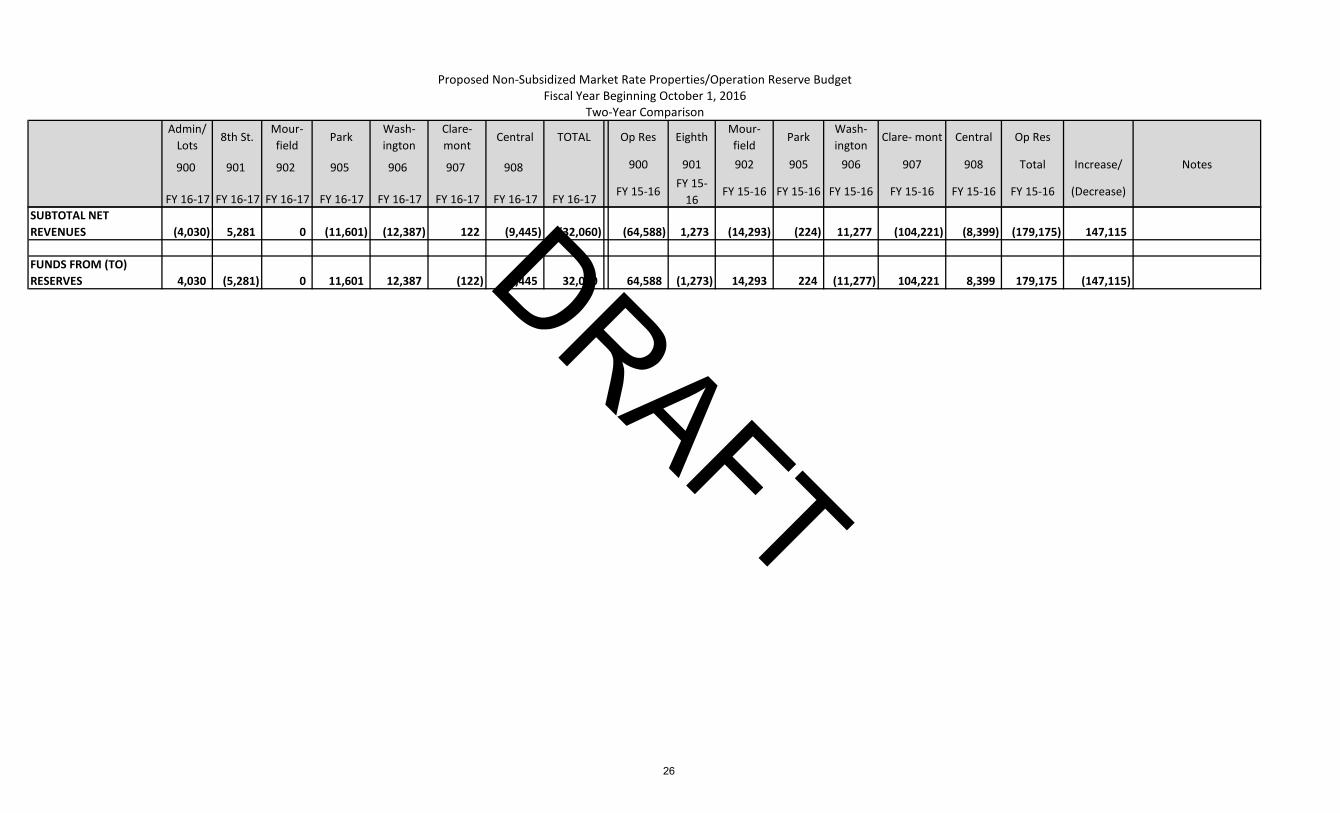
Authority-Owned Non-Subsidized Properties Eighth Street Eighth Street is a single-family home constructed in 1994 and purchased from the City of Stockton. The Authority does not carry any debt service on this property. Mourfield Located in Stockton, Mourfield was built in 1994 using San Joaquin County HOME Funds. This 4-unit complex serves low-income tenants. The loan for this property is carried by San Joaquin County and the debt service is reflected in the FY 16-17 budget. The Authority was recently awarded Community Block Grant (CDBG) funds to completing nearly $300,000 in capital improvements to the property including new roofs, new windows, fencing and sidewalk repairs. Park Street Apartments Constructed in 1930 and acquired by the Authority in 2000, the Park Street Apartments is a 12-unit complex in Stockton consisting of ten studio and two one-bedroom apartments. This property was refinanced in July 2011 and debt service payments are reflected in the FY 16-17 budget. Washington Street Constructed in 1986, the six-unit complex on Washington Street in Lodi was acquired in 2001 with a conventional loan. Washington was refinanced in February 2015 and the debt service payments are reflected in the FY 16-17 budget. Claremont Manor Apartments Constructed in 1979 and acquired by the Authority in 2003, Claremont Manor Apartments is a 52-unit senior complex in Stockton. In March 2015, a loan modification was completed to lower the interest rate without extending the terms of the loan. The debt service for the property is reflected in the FY 16-17 budget. The budget includes Project-Based Voucher assistance for the property to help subsidize the tenant’s rents. Central Avenue Duplex The Central Avenue Duplex is located in Lodi. It was constructed by the Authority in 2007 with a conventional loan. The property’s debt service is reflected in the FY 16-17 budget. The spreadsheet on the following page is the FY 16-17 proposed budget for the Authority owned non-subsidized properties. The proposed budget provides a two-year comparison of proposed revenues and expenditures against the approved budget for fiscal year 2015-2016 with explanations of variances.
DRAFT
21

Admin/ Lots
8th St.Mour- field
ParkWash- ington
Clare- mont
Central TOTAL Op Res EighthMour-field
ParkWash-ington
Clare- mont Central Op Res
900 901 902 905 906 907 908 900 901 902 905 906 907 908 Total Increase/ Notes
FY 16-17 FY 16-17 FY 16-17 FY 16-17 FY 16-17 FY 16-17 FY 16-17 FY 16-17 FY 15-16FY 15-
16FY 15-16 FY 15-16 FY 15-16 FY 15-16 FY 15-16 FY 15-16 (Decrease)
INCOME
Dwelling Rent Income 0 9,408 30,588 63,669 48,673 149,420 22,349 324,107 0 9,996 27,471 60,876 48,048 276,192 22,579 445,162 (121,055)
Reported HCVP subsidy for Claremont as subsidized rent income. Rent increase to be implemented after further analysis. Budget includes
Subsidized Rent Income 0 0 0 0 0 280,030 0 280,030 0 0 0 0 0 0 0 0 280,030
Income from project based voucher
Late Charges 0 90 175 585 315 1,400 180 2,745 0 0 0 0 0 0 0 0 2,745Enforcement of late fee charges
Repair Income 0 0 150 1,920 150 5,500 0 7,720 0 0 0 926 210 938 0 2,074 5,646
Increase in rates and enforcement of tenant charges
Commercial Rental Income 31,910 0 0 0 0 0 0 31,910 17,340 0 0 0 0 0 0 17,340 14,570
Space rent charged to HCVP
Interest Income 21,788 0 0 0 0 0 0 21,788 24,135 0 0 0 0 0 0 24,135 (2,347) Other Income 0 0 0 405 0 1,200 0 1,605 0 0 75 0 75 0 0 150 1,455
Laundry Income 0 0 0 962 645 1,350 0 2,957 0 0 0 352 384 1,192 0 1,928 1,029TOTAL INCOME 53,698 9,498 30,913 67,541 49,783 438,899 22,529 672,861 41,475 9,996 27,546 62,154 48,717 278,322 22,579 490,789 182,072
EXPENSES ADMINISTRATIVE EXPENSES:
Salaries-Admin 0 232 930 2,790 1,395 0 465 5,812 0 282 1,127 2,192 1,691 19,872 564 25,728 (19,916)
Redistribution of staff time and onsite manager at Claremont charged under professional fees as
Benefits 0 119 477 1,430 715 0 238 2,980 0 149 595 1,105 892 9,095 297 12,133 (9,153)
Proposed Non-Subsidized Market Rate Properties/Operation Reserve BudgetFiscal Year Beginning October 1, 2016
Two-Year Comparison
DRAFT
22

Admin/ Lots
8th St.Mour- field
ParkWash- ington
Clare- mont
Central TOTAL Op Res EighthMour-field
ParkWash-ington
Clare- mont Central Op Res
900 901 902 905 906 907 908 900 901 902 905 906 907 908 Total Increase/ Notes
FY 16-17 FY 16-17 FY 16-17 FY 16-17 FY 16-17 FY 16-17 FY 16-17 FY 16-17 FY 15-16FY 15-
16FY 15-16 FY 15-16 FY 15-16 FY 15-16 FY 15-16 FY 15-16 (Decrease)
Proposed Non-Subsidized Market Rate Properties/Operation Reserve BudgetFiscal Year Beginning October 1, 2016
Two-Year Comparison
Legal Expense 0 0 0 593 0 2,500 0 3,093 0 0 0 75 75 275 0 425 2,668Increase in evictions with lease enforcement
Legal Fee for Service Expense 0 100 192 2,850 250 5,000 200 8,592 0 0 29 0 150 1,400 143 1,722 6,870
Increase in evictions with lease enforcement
Staff Training 0 0 0 0 0 2 4 12 12 110 4 144 (144) Travel 0 0 0 0 0 0 0 0 0 1 2 5 8 50 2 68 (68)
Auditing Fees 0 32 78 166 156 4,000 43 4,475 0 10 75 165 60 600 30 940 3,535
Anticipated increase in auditing costs with new contract
Professional Fees 0 0 0 0 3,711 112,000 0 115,711 0 0 0 0 0 0 0 0 115,711
PME contract and community services at Claremont for PBV
Telephone & Internet Expense 0 40 190 250 200 0 75 755 0 40 190 292 205 6,200 73 7,000 (6,245) 3rd Party Inspections 0 20 80 240 120 1,020 40 1,520 0 0 0 0 0 0 0 0 1,520 3rd Party Verification 0 50 50 500 250 0 50 900 0 0 100 500 150 1,450 0 2,200 (1,300) Computer Maintenance 0 30 75 400 200 0 50 755 0 20 55 80 160 700 30 1,045 (290)
Copier Maintenance & Supplies 0 25 40 100 50 0 25 240 0 15 50 75 100 500 26 766 (526) Office Supplies 0 7 25 84 42 0 14 172 0 9 20 75 100 500 25 729 (557)
Postage/Mailing 0 3 9 21 12 0 6 51 0 4 15 40 23 250 8 340 (289) Printing 0 10 20 50 25 0 10 115 0 5 6 15 8 71 3 108 7 Dues/Publications/Subscriptions 0 500 10 100 400 200 2,500 25 500 10 100 400 200 2,500 25 3,735 (3,710) Uniforms 0 0 0 0 0 0 0 0 0 0 0 0 0 300 0 300 (300) Other Expenses 0 0 29 0 0 2,100 0 2,129 250 10 0 0 540 0 21 821 1,309
DRAFT
23

Admin/ Lots
8th St.Mour- field
ParkWash- ington
Clare- mont
Central TOTAL Op Res EighthMour-field
ParkWash-ington
Clare- mont Central Op Res
900 901 902 905 906 907 908 900 901 902 905 906 907 908 Total Increase/ Notes
FY 16-17 FY 16-17 FY 16-17 FY 16-17 FY 16-17 FY 16-17 FY 16-17 FY 16-17 FY 15-16FY 15-
16FY 15-16 FY 15-16 FY 15-16 FY 15-16 FY 15-16 FY 15-16 (Decrease)
Proposed Non-Subsidized Market Rate Properties/Operation Reserve BudgetFiscal Year Beginning October 1, 2016
Two-Year Comparison
Mgmt & Admin Fee Expense 0 300 1,188 3,069 1,692 9,000 594 15,843 0 186 742 2,226 1,113 8,327 371 12,965 2,878
Increase in management fee rate
Bookkeeping Fee Expense 0 90 356 921 508 2,000 178 4,053 0 90 360 1,080 540 4,039 180 6,289 (2,236)
TOTAL ADMINISTRATIVE EXP. 0 1,558 3,749 13,564 9,726 137,820 4,488 167,220 750 832 3,470 8,336 6,027 56,239 1,802 77,456 89,764
UTILITIES: Water 77 0 2,146 4,721 311 12,500 616 20,371 0 0 3,627 2,400 384 6,000 547 12,958 7,413 Anticipated rate Electricity 0 0 131 2,748 1,123 17,000 82 21,084 0 0 0 1,800 1,000 5,500 0 8,300 12,784 Anticipated rate
Gas 0 0 0 6,237 0 6,000 0 12,237 0 0 0 4,000 86 15,000 0 19,086 (6,849)Based on current usage and anticipated
Sewer 69 0 2,105 5,840 682 22,000 1,233 31,929 0 0 2,715 5,250 404 21,000 0 29,369 2,560Based on current usage and anticipated
TOTAL UTILITY EXPENSES 146 0 4,382 19,546 2,116 57,500 1,931 85,621 0 0 6,342 13,450 1,874 47,500 547 69,713 15,908
MAINTENANCE-WAGES/BENEFITS:
Maintenance Labor 0 0 0 0 0 0 0 0 0 568 2,273 6,319 3,410 29,550 1,137 43,256 (43,256)
Maintenance will be booked through fee for services from staff time
Benefits-Maintenance 0 0 0 0 0 0 0 0 0 389 1,558 4,473 2,336 20,249 779 29,784 (29,784)
Maintenance will be booked through fee for services from staff time
Maintenance Fee for Service 0 1,500 4,800 7,500 4,000 0 2,000 19,800 0 1,500 9,000 1,200 500 3,500 0 15,700 4,100
Maintenance will be booked through fee for services from staff time
Maintenance - Materials 1,053 0 121 2,585 5,131 0 171 9,061 13 1,531 2,021 3,312 1,930 22,358 210 31,375 (22,314)
DRAFT
24

Admin/ Lots
8th St.Mour- field
ParkWash- ington
Clare- mont
Central TOTAL Op Res EighthMour-field
ParkWash-ington
Clare- mont Central Op Res
900 901 902 905 906 907 908 900 901 902 905 906 907 908 Total Increase/ Notes
FY 16-17 FY 16-17 FY 16-17 FY 16-17 FY 16-17 FY 16-17 FY 16-17 FY 16-17 FY 15-16FY 15-
16FY 15-16 FY 15-16 FY 15-16 FY 15-16 FY 15-16 FY 15-16 (Decrease)
Proposed Non-Subsidized Market Rate Properties/Operation Reserve BudgetFiscal Year Beginning October 1, 2016
Two-Year Comparison
Maintenance - Contract Work 4,639 955 7,524 18,470 27,185 65,000 2,016 125,789 3,450 3,307 4,262 6,623 6,752 18,395 4,887 47,676 78,113
Increase in contract labor for repairs through PME contract
TOTAL MAINTENANCE EXPENSES 5,692 2,455 12,445 28,555 36,316 65,000 4,187 154,650 3,463 7,296 19,114 21,927 14,928 94,052 7,012 167,791 (13,141)
GENERAL EXPENSE:
Protective Service 0 0 0 0 0 750 0 750 0 0 0 0 0 350 0 350 400 Insurance 60 186 557 1,023 650 3,500 317 6,293 0 182 2,532 1,009 637 3,474 309 8,143 (1,850) Workers Comp Ins/First Aid 0 5 21 64 32 0 11 134 0 188 306 796 450 4,654 145 6,539 (6,405) Taxes & Assessments 23,500 12 12 471 24 425 14 24,458 23,500 200 150 465 24 450 13 24,802 (344)
Interest Expense 14,001 0 753 6,155 8,990 78,644 12,911 121,454 14,600 0 850 6,500 8,875 116,100 13,400 160,325 (38,871)
Principle Payments 14,330 0 8,994 9,765 4,317 95,138 8,115 140,657 13,750 0 8,950 9,445 4,450 57,750 7,700 102,045 38,612 TOTAL GENERAL EXPENSE 51,890 203 10,337 17,477 14,013 178,457 21,368 293,746 51,850 570 12,788 18,215 14,436 182,778 21,567 302,204 (8,458)
OTHER USES OF FUNDS Capital Expenditures/Special Projects 0 0 0 0 0 0 0 0 50,000 25 125 450 175 1,975 50 52,800 (52,800)TOTAL OTHER USES OF FUNDS 0 0 0 0 0 0 0 0 50,000 25 125 450 175 1,975 50 52,800 (52,800)
TOTAL EXPENSES 57,728 4,217 30,913 79,142 62,170 438,777 31,974 701,237 106,063 8,723 41,839 62,378 37,440 382,543 30,978 669,964 31,273
DRAFT
25
Admin/ Lots
8th St.Mour- field
ParkWash- ington
Clare- mont
Central TOTAL Op Res EighthMour-field
ParkWash-ington
Clare- mont Central Op Res
900 901 902 905 906 907 908 900 901 902 905 906 907 908 Total Increase/ Notes
FY 16-17 FY 16-17 FY 16-17 FY 16-17 FY 16-17 FY 16-17 FY 16-17 FY 16-17 FY 15-16FY 15-
16FY 15-16 FY 15-16 FY 15-16 FY 15-16 FY 15-16 FY 15-16 (Decrease)
Proposed Non-Subsidized Market Rate Properties/Operation Reserve BudgetFiscal Year Beginning October 1, 2016
Two-Year Comparison
SUBTOTAL NET REVENUES (4,030) 5,281 0 (11,601) (12,387) 122 (9,445) (32,060) (64,588) 1,273 (14,293) (224) 11,277 (104,221) (8,399) (179,175) 147,115
FUNDS FROM (TO) RESERVES 4,030 (5,281) 0 11,601 12,387 (122) 9,445 32,060 64,588 (1,273) 14,293 224 (11,277) 104,221 8,399 179,175 (147,115)DRAFT
26

Federally Funded Housing Programs
Public Housing The Authority currently owns and manages 1075 units of affordable HUD subsidized Public Housing located in Stockton, Thornton and Tracy. These projects are referred to as follows: Sierra Vista Homes 326 multi-family units constructed in 1952 and 64 additional units
constructed in 1957. 36 units were demolished in July 2016. The Authority will not receive an operating subsidy while these units are offline pending a HUD approved development proposal and approved Operating Fund Financing Program (OFFP) application.
Conway Homes 428 multi-family units constructed in 1962. Tracy Homes 175 multi-family and 20 senior units constructed in phases from
1952-1962. Mokelumne Manor 50 multi-family units constructed in 1952. Mountain View Phase 1 12 units previously: 4 units at Sierra Vista and 8 units at Conway
Homes. The units were occupied in May and June 2016 and the Authority is currently applying for operating subsidy for those units as is reflected in the budget.
Operating revenue for these units is provided by tenant rents and subsidy determined by HUD. Eligible applicants must have annual gross income that does not exceed established income limits based on area median income. The spreadsheet on the following page is the FY 16-17 proposed budget for the Public Housing program. The proposed budget provides a two-year comparison of proposed revenues and expenditures against the approved budget for fiscal year 2015-2016 with explanations of variances.
DRAFT
27

Sierra Vista TracyMokelum
neConway Pilot TOTAL Sierra Vista Tracy
Mokelumne
Conway Pilot TOTAL
241 242 243 244 245 241 242 243 244 245 Increase/ NotesFY 16-17 FY 16-17 FY 16-17 FY 16-17 FY 16-17 FY 16-17 FY 15-16 FY 15-16 FY 15-16 FY 15-16 FY 15-16 FY 15-16 (Decrease)
INCOME
Operating Subsidy 1,627,441 581,203 132,064 1,596,374 35,200 3,972,282 1,378,054 595,560 152,538 1,621,984 3,748,136 224,146
Subsidy projection for 12 Pilot units and increased proration for public housing at 83.5% proration
Dwelling Rent Income 939,602 656,677 183,396 1,212,800 29,075 3,021,550 842,195 579,108 167,733 1,129,227 2,718,263 303,287 Increase based on tenant's incomes in FY 15-16
Repayment Agreement 0 110 720 25,260 0 26,090 0 0 0 0 0 0 26,090 Previously not used in budget development as potential income
Late Charges 4,375 4,048 1,538 11,025 120 21,106 7,050 2,900 1,463 6,225 17,638 3,468 Excess Utilities 5,529 2,232 821 15,068 0 23,650 2,654 2,659 839 11,111 17,263 6,387
Repair Income 32,729 14,000 8,324 31,000 250 86,303 29,000 8,000 1,252 35,490 73,742 12,561 Increase in rates and enforcement of tenant charges
Commercial Rental Income 0 12,000 0 0 0 12,000 0 6,000 0 0 6,000 6,000
Increase in rental income for daycare in Tracy
Interest Income 6,110 3,014 783 6,743 0 16,650 400 700 700 4,500 6,300 10,350 Other Income 1,950 933 315 905 0 4,103 1,746 0 0 99 1,845 2,258 Laundry Income 0 840 0 0 0 840 0 862 0 0 862 (22)TOTAL INCOME 2,617,736 1,275,057 327,961 2,899,175 64,645 7,184,574 2,261,099 1,195,789 324,525 2,808,636 0 6,590,049 594,525
EXPENSES
ADMINISTRATIVE EXPENSES:
Salaries-Admin 193,100 115,296 29,422 209,346 0 547,165 225,288 187,857 38,917 259,128 750 711,940 (164,775)
Decrease in staffing and redistribution of staff time to properties
Benefits 95,028 48,749 12,500 102,228 0 258,504 145,436 106,237 18,500 153,906 400 424,479 (165,975)Budgeted medical benefits based on actual usage not full family coverage
MSU Fee for Service 12,000 5,500 1,250 12,000 0 30,750 10,200 6,120 1,000 10,000 500 27,820 2,930 Legal Expense 2,198 1,535 498 1,847 0 6,078 2,705 1,359 125 1,500 0 5,689 389 Legal Fee for Service Expense 20,000 6,500 2,500 15,000 300 44,300 14,593 7,500 2,500 17,000 950 42,543 1,757
Proposed Public Housing BudgetFiscal Year Beginning October 1, 2016
Two-Year Comparison
DRAFT
28

Sierra Vista TracyMokelum
neConway Pilot TOTAL Sierra Vista Tracy
Mokelumne
Conway Pilot TOTAL
241 242 243 244 245 241 242 243 244 245 Increase/ NotesFY 16-17 FY 16-17 FY 16-17 FY 16-17 FY 16-17 FY 16-17 FY 15-16 FY 15-16 FY 15-16 FY 15-16 FY 15-16 FY 15-16 (Decrease)
Proposed Public Housing BudgetFiscal Year Beginning October 1, 2016
Two-Year Comparison
Staff Training 4,500 800 150 5,000 0 10,450 4,500 800 150 5,000 0 10,450 0 Travel 2,700 650 100 1,400 0 4,850 2,644 610 75 1,352 0 4,681 169
Auditing Fees 8,567 4,192 1,069 9,500 0 23,328 3,000 1,550 425 3,000 0 7,975 15,353 Anticipated increase in auditing costs with new contract
Professional Fees 0 0 0 0 0 0 300 100 0 300 0 700 (700) Telephone & Internet Expense 22,288 20,437 9,160 22,288 300 74,473 22,006 15,565 8,700 20,439 350 67,060 7,413 3rd Party Inspections 7,880 3,900 1,000 8,720 240 21,740 0 0 0 0 0 0 21,740 Contracted inspections 3rd Party Verification 1,259 578 216 1,287 150 3,490 2,900 1,342 250 1,812 200 6,504 (3,014) Staff Recruitment 54 27 8 201 0 290 82 196 0 0 0 278 12
Computer Maintenance 14,387 4,786 1,263 10,782 250 31,468 10,000 4,500 1,000 10,000 250 25,750 5,718 Increase in Yardi licensing costs Copier Maintenance & Supplies 1,136 299 221 901 50 2,608 700 300 200 800 0 2,000 608 Increase in copier maintenance costs Office Supplies 2,500 1,500 438 2,750 100 7,288 2,500 1,000 4,000 2,500 50 10,050 (2,762) Postage/Mailing 4,000 1,800 400 4,000 50 10,250 4,000 1,800 350 4,000 50 10,200 50 Printing 416 435 56 450 0 1,357 750 400 100 900 0 2,150 (793) Dues/Publications/Subscriptions 1,566 787 208 1,754 0 4,315 1,400 838 350 1,500 0 4,088 227 Uniforms 1,073 814 0 1,320 0 3,207 2,000 750 150 1,750 0 4,650 (1,443) Other Expenses 759 248 76 1,296 0 2,379 922 200 250 702 0 2,074 305 Mgmt & Admin Fee Expense 278,507 155,731 39,931 341,810 9,583 825,562 227,290 124,499 31,923 273,258 7,661 664,631 160,931
Increase in management fee rate to $80.75 per unit month leased
Asset Management Fee Expense 42,720 23,400 6,000 51,360 1,440 124,920 41,438 22,698 5,820 49,819 1,397 121,172 3,748 Pilot units back online Bookkeeping Fee Expense 30,758 17,199 4,410 37,750 1,058 91,175 31,079 17,024 4,365 37,364 1,048 90,880 295 TOTAL ADMINISTRATIVE EXP. 747,396 415,164 110,876 842,990 13,521 2,129,947 755,733 503,245 119,150 856,030 13,606 2,247,764 (117,817)
TENANT SERVICES: Resident Council/Stipends 1,770 975 250 1,970 60 5,025 1,770 975 250 1,970 60 5,025 0
DRAFT
29

Sierra Vista TracyMokelum
neConway Pilot TOTAL Sierra Vista Tracy
Mokelumne
Conway Pilot TOTAL
241 242 243 244 245 241 242 243 244 245 Increase/ NotesFY 16-17 FY 16-17 FY 16-17 FY 16-17 FY 16-17 FY 16-17 FY 15-16 FY 15-16 FY 15-16 FY 15-16 FY 15-16 FY 15-16 (Decrease)
Proposed Public Housing BudgetFiscal Year Beginning October 1, 2016
Two-Year Comparison
Resident Council-Other Expenses 3,540 1,950 500 3,940 120 10,050 3,540 1,950 500 3,940 120 10,050 0 Resident Costs 3,540 1,950 500 3,940 120 10,050 3,540 1,950 500 3,940 120 10,050 0
TOTAL TENANT SERVICES: 8,850 4,875 1,250 9,850 300 25,125 8,850 4,875 1,250 9,850 300 25,125 0
UTILITIES: Water 164,181 74,441 10,567 160,080 4,680 413,949 156,000 60,000 9,200 155,715 5,000 385,915 28,034 Anticipated rate increase Electricity 19,762 9,152 3,938 11,000 490 44,342 11,000 14,000 5,000 10,000 340 40,340 4,002 Anticipated rate increase
Gas 11,614 4,366 2,120 5,513 271 23,884 7,500 6,000 1,050 5,095 250 19,895 3,989 Based on current usage and anticipated increases
URP 13,367 9,656 2,541 22,823 540 48,927 10,148 9,500 950 24,442 600 45,640 3,287 Based on tenant's incomes in public housing
Sewer 208,401 87,084 541 245,376 6,505 547,907 196,138 81,000 10 218,757 6,000 501,905 46,002 Based on current usage and anticipated rate increases
TOTAL UTILITY EXPENSES 417,325 184,699 19,707 444,792 12,485 1,079,008 380,786 170,500 16,210 414,009 12,190 993,695 85,313
MAINTENANCE-WAGES/BENEFITS:
Maintenance Labor 473,294 239,244 30,375 418,760 0 1,161,673 487,152 213,344 35,069 525,305 656 1,261,526 (99,853)Not filling previously budgeted positions
Benefits-Maintenance 292,848 115,136 19,514 253,394 0 680,892 293,745 135,179 20,808 294,554 351 744,637 (63,745)Not filling previously budgeted positions
Maintenance Fee for Service 68,942 5,000 32,864 27,000 5,000 138,806 50,000 2,500 1,500 10,000 0 64,000 74,806
Maintenance Project Manager's time previously budgeted to PH now in COCC and billed through fee for service
Maintenance - Materials 154,309 64,031 22,977 146,909 4,320 392,546 192,891 68,908 17,467 157,588 2,540 439,394 (46,848)
DRAFT
30

Sierra Vista TracyMokelum
neConway Pilot TOTAL Sierra Vista Tracy
Mokelumne
Conway Pilot TOTAL
241 242 243 244 245 241 242 243 244 245 Increase/ NotesFY 16-17 FY 16-17 FY 16-17 FY 16-17 FY 16-17 FY 16-17 FY 15-16 FY 15-16 FY 15-16 FY 15-16 FY 15-16 FY 15-16 (Decrease)
Proposed Public Housing BudgetFiscal Year Beginning October 1, 2016
Two-Year Comparison
Maintenance - Contract Work 386,894 150,486 35,045 253,517 4,000 829,942 238,640 157,233 32,092 157,975 5,000 590,940 239,002
Contracted work for unit turn over, landscaping, increased extermination services and overall maintenance of the properties
TOTAL MAINTENANCE EXPENSES 1,376,287 573,897 140,775 1,099,580 13,320 3,203,859 1,262,428 577,164 106,936 1,145,422 8,547 3,100,497 103,362
GENERAL EXPENSE:
Protective Service 78,459 3,672 1,100 81,010 5,085 169,326 116,565 2,025 1,080 129,002 0 248,672 (79,347)
Portion of Police contract paid through operations reducing amount paid through capital fund for operations
Insurance 48,514 23,811 71,171 55,247 2,232 200,975 47,436 23,282 70,654 54,021 500 195,893 5,082 Workers Comp Ins/First Aid 73,665 27,974 4,504 62,664 0 168,807 62,316 37,231 6,735 64,333 150 170,765 (1,958) Payments in Lieu of Taxes (PILOT) 56,541 40,749 14,769 72,845 2,064 186,968 51,919 40,882 15,095 75,553 0 183,449 3,519 Taxes & Assessments 846 174 18,924 566 50 20,560 850 164 16,000 21,408 2,200 40,622 (20,062)
TOTAL GENERAL EXPENSE 258,025 96,380 110,468 272,332 9,430 746,635 279,086 103,584 109,564 344,317 2,850 839,401 (92,766)
OTHER USES OF FUNDS
Capital Expenditures/Special Projects 0 0 0 0 0 0 15,260 8,353 2,161 18,468 300 44,542 (44,542)
TOTAL OTHER USES OF FUNDS 0 0 0 0 0 0 15,260 8,353 2,161 18,468 300 44,542 (44,542)
TOTAL EXPENSES 2,807,883 1,275,015 383,076 2,669,545 49,056 7,184,574 2,702,143 1,367,721 355,271 2,788,096 37,793 7,251,024 (66,450)
SUBTOTAL NET REVENUES (190,147) 42 (55,115) 229,630 15,589 0 (441,044) (171,932) (30,746) 20,540 (37,793) (660,975) 660,975
DRAFT
31

Sierra Vista TracyMokelum
neConway Pilot TOTAL Sierra Vista Tracy
Mokelumne
Conway Pilot TOTAL
241 242 243 244 245 241 242 243 244 245 Increase/ NotesFY 16-17 FY 16-17 FY 16-17 FY 16-17 FY 16-17 FY 16-17 FY 15-16 FY 15-16 FY 15-16 FY 15-16 FY 15-16 FY 15-16 (Decrease)
Proposed Public Housing BudgetFiscal Year Beginning October 1, 2016
Two-Year Comparison
FUNDS FROM (TO) RESERVES 190,147 (42) 55,115 (229,630) (15,589) 0 441,044 171,932 30,746 (20,540) 37,793 660,975 (660,975)DRAFT
32

Housing Choice Voucher Program The Housing Choice Voucher (HCV) program offers financial assistance to households receiving less than 50 percent of area median income. Under the HCV program, the Authority provides a subsidy that is the difference between the established payment standard for a given unit size and 30 percent of the participant’s adjusted income. The Authority is responsible to maintain a program waiting list, determine the applicant’s eligibility, inform the applicant of program requirements, ensure the rental unit selected by the participant meets housing quality standards, and enter into a housing assistance payment contract with the property owner. The Authority expects to serve approximately 4,775 households through the HCV program in the 2016-17 fiscal year. The spreadsheet on the following page is the FY 16-17 proposed budget for Housing Choice Voucher program. The proposed budget provides a two-year comparison of proposed revenues and expenditures against the approved budget for fiscal year 2015-2016 with explanations of variances.
DRAFT
33

HCVP HCVP Increase+/802 802 (Decrease) Notes
FY 16-17 FY 15-16 INCOME Annual Contribution Earned-Voucher 31,622,853 31,012,675 610,178 Increase in voucher utilization HUD Held HAP Reserves 2,052,696 0 2,052,696 Use of HUD Held HAP reserves to cover expenses Admin Fee-A C Earned-Vouchers 3,569,153 2,976,734 592,419 20% Proration for 4775 vouchers Fraud Recovery 50,858 0 50,858 Previously this was not included when developing the budget Interest Income 287 296 (9) Other Income 50 0 50TOTAL INCOME 37,295,897 33,989,705 3,306,192
EXPENSES ADMINISTRATIVE EXPENSES: Salaries-Admin 1,343,450 1,182,398 161,052 Increase in staffing Benefits 625,905 710,237 (84,332) Budgeted medical benefits based on actual usage not full family coverage MSU Fee for Service 40,000 17,000 23,000 Increase in MSU time with implementation of Yardi 7 Legal Fee for Service Expense 2,500 3,500 (1,000) Staff Training 8,875 7,500 1,375 Travel 4,000 2,000 2,000 Auditing Fees 10,957 4,500 6,457 Anticipated increase in auditing costs with new contract Professional Fees 22,500 0 22,500 Contracted Hearing Officer services Telephone & Internet Expense 15,000 10,600 4,400 3rd Party Inspections 55,000 55,000 0 3rd Party Verification 22,247 23,000 (753) Staff Recruitment 1,000 1,000 0 Computer Maintenance 104,238 28,000 76,238 Yardi Upgrade Copier Maintenance & Supplies 8,679 4,000 4,679 Office Supplies 18,000 18,000 0 Postage/Mailing 55,000 55,000 0 Printing 10,000 12,000 (2,000)
Proposed Housing Choice Voucher Program BudgetFiscal Year Beginning October 1, 2016
Two-Year Comparison
DRAFT
34

HCVP HCVP Increase+/802 802 (Decrease) Notes
FY 16-17 FY 15-16
Proposed Housing Choice Voucher Program BudgetFiscal Year Beginning October 1, 2016
Two-Year Comparison
Dues/Publications/Subscriptions 2,500 2,500 0 Advertising for project based RFPs and annual plan Uniforms 500 750 (250) Other Expenses 150 150 0 Office Space Rent 14,571 0 14,571 Mgmt & Admin Fee Expense 684,000 640,800 43,200 Increase in voucher utilization Bookkeeping Fee Expense 427,500 400,500 27,000 Increase in voucher utilization TOTAL ADMINISTRATIVE EXP. 3,476,572 3,178,435 298,137
TENANT SERVICES: Resident Council/Stipends 100 100 0 TOTAL TENANT SERVICES: 100 100 0
UTILITIES: Water 2,000 2,250 (250) Based on current usage Electricity 20,000 25,000 (5,000) Based on current usage Gas 4,500 5,000 (500) Based on current usage Sewer 2,200 2,250 (50) Based on current usage TOTAL UTILITY EXPENSES 28,700 34,500 (5,800)
MAINTENANCE-WAGES/BENEFITS: Maintenance Fee for Service 500 500 0 Maintenance - Materials 1,309 3,125 (1,816) Maintenance - Contract Work 11,008 13,775 (2,767) TOTAL MAINTENANCE EXPENSES 12,817 17,400 (4,583)
GENERAL EXPENSE: Protective Service 17,500 17,500 0 Insurance 15,978 16,500 (522)
DRAFT
35

HCVP HCVP Increase+/802 802 (Decrease) Notes
FY 16-17 FY 15-16
Proposed Housing Choice Voucher Program BudgetFiscal Year Beginning October 1, 2016
Two-Year Comparison
Workers Comp Ins/First Aid 29,182 25,000 4,182 Taxes & Assessments 1,800 1,800 0 Admin Fees-Portable Voucher 12,914 32,000 (19,086) Based on current expenses TOTAL GENERAL EXPENSE 77,374 92,800 (15,426)
TOTAL HOUSING ASSISTANCE PAYMENTS 33,699,478 31,012,675 2,686,803 Increased voucher utilization
OTHER USES OF FUNDS Capital Expenditures/Special Projects 0 95,000 (95,000)TOTAL OTHER USES OF FUNDS 0 95,000 (95,000)
TOTAL EXPENSES 37,295,041 34,430,910 2,864,131
SUBTOTAL NET REVENUES 856 (441,205) 442,061
FUNDS FROM (TO) RESERVES (856) 441,205 (442,061)
DRAFT
36
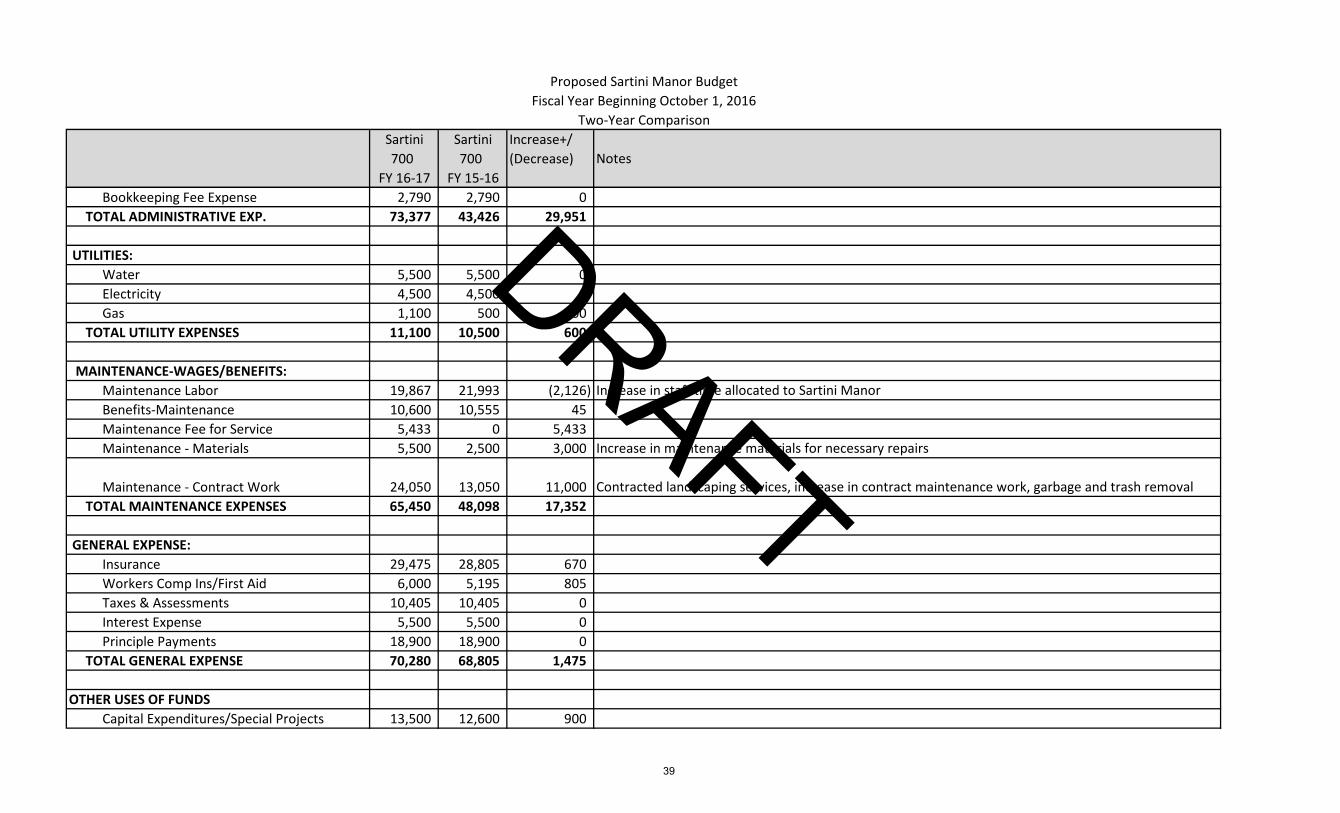
Sartini Manor Year-Round Farm Worker Housing Sartini Manor is a 31-unit development for year-round farm worker housing funded by the United States Department of Agriculture (USDA). The loans for the rehabilitation and modernization of the property are carried by USDA and the debt service is reflected in the FY 16-17 budget. The spreadsheet on the following page is the FY 16-17 proposed budget for Sartini Manor. The proposed budget provides a two-year comparison of proposed revenues and expenditures against the approved budget for fiscal year 2015-2016 with explanations of variances. The Authority was recently awarded $2,000,000 in grant funds to complete the rehabilitation of the remaining 10 units at Sartini Manor. The budget also reflects a rent increase which will increase the subsidy provided by USDA.
DRAFT
37

Sartini Sartini Increase+/700 700 (Decrease) Notes
FY 16-17 FY 15-16 INCOME Dwelling Rent Income 146,953 146,764 189
Subsidized Rent Income 104,719 54,283 50,436Proposed rent increase, increases need for rental assistance from USDA as tenants pay no more than 30% of their income in rent. *** Rent increase is pending USDA approval
Late Charges 75 40 35 Repair Income 339 249 90 Interest Income 350 560 (210)TOTAL INCOME 252,436 201,896 50,540
EXPENSES ADMINISTRATIVE EXPENSES: Salaries-Admin 25,600 17,669 7,931 Increase in staff time allocated to Sartini Manor Benefits 10,400 8,636 1,764 Increase in staff time allocated to Sartini Manor Legal Expense 500 0 500 Staff Training 400 400 0 Travel 800 600 200 Auditing Fees 750 350 400 Telephone & Internet Expense 5,150 5,150 0 3rd Party Verification 200 200 0 Computer Maintenance 500 500 0 Copier Maintenance & Supplies 250 250 0 Office Supplies 500 500 0 Postage/Mailing 150 150 0 Printing 150 150 0 Dues/Publications/Subscriptions 1,000 1,000 0 Other Expenses 500 500 0
Mgmt & Admin Fee Expense 23,737 4,581 19,156 Increase in per unit management fees charged to Sartini to equal those charged to public housing
Proposed Sartini Manor BudgetFiscal Year Beginning October 1, 2016
Two-Year Comparison
DRAFT
38
Sartini Sartini Increase+/700 700 (Decrease) Notes
FY 16-17 FY 15-16
Proposed Sartini Manor BudgetFiscal Year Beginning October 1, 2016
Two-Year Comparison
Bookkeeping Fee Expense 2,790 2,790 0 TOTAL ADMINISTRATIVE EXP. 73,377 43,426 29,951
UTILITIES: Water 5,500 5,500 0 Electricity 4,500 4,500 0 Gas 1,100 500 600 TOTAL UTILITY EXPENSES 11,100 10,500 600
MAINTENANCE-WAGES/BENEFITS: Maintenance Labor 19,867 21,993 (2,126) Increase in staff time allocated to Sartini Manor Benefits-Maintenance 10,600 10,555 45 Maintenance Fee for Service 5,433 0 5,433 Maintenance - Materials 5,500 2,500 3,000 Increase in maintenance materials for necessary repairs
Maintenance - Contract Work 24,050 13,050 11,000 Contracted landscaping services, increase in contract maintenance work, garbage and trash removal TOTAL MAINTENANCE EXPENSES 65,450 48,098 17,352
GENERAL EXPENSE: Insurance 29,475 28,805 670 Workers Comp Ins/First Aid 6,000 5,195 805 Taxes & Assessments 10,405 10,405 0 Interest Expense 5,500 5,500 0 Principle Payments 18,900 18,900 0 TOTAL GENERAL EXPENSE 70,280 68,805 1,475
OTHER USES OF FUNDS Capital Expenditures/Special Projects 13,500 12,600 900
DRAFT
39

Sartini Sartini Increase+/700 700 (Decrease) Notes
FY 16-17 FY 15-16
Proposed Sartini Manor BudgetFiscal Year Beginning October 1, 2016
Two-Year Comparison
TOTAL OTHER USES OF FUNDS 13,500 12,600 900
TOTAL EXPENSES 233,707 183,429 50,278
SUBTOTAL NET REVENUES 18,729 18,467 262
FUNDS FROM (TO) RESERVES (18,729) (18,467) (262) $16,500 is required reserve payments balance is net income
DRAFT
40
Grant Programs
Capital Fund Program (CFP) The Authority receives CFP annually under a formula grant from HUD that takes into account the number, type of units, and age of the Authority’s public housing stock. The funds may be used for major physical improvements to public housing, management improvements that enhance the Authority’s capability is operating public housing, pay the cost of services to public housing residents, and help meet some of the public housing operating costs. These CFP funds permit the Authority to make improvements that are beyond the scope of the operating budget. The CFP budget is part of the Public Housing Annual Plan adopted by the Board of Commissioners on June 16, 2016. This includes approval to use capital funds to support operations and pay the contract with the City of Stockton for the salaries of the community service officers for Conway Homes and Sierra Vista Homes. The spreadsheet on the following page is the FY 16-17 proposed budget for the CFP. The proposed budget provides a two-year comparison of proposed revenues and expenditures against the approved budget for fiscal year 2015-2016 with explanations of variances.
DRAFT
41

Cap Fund Cap FundTotal Total Increase/ NotesFY 16-17 FY 15-16 (Decrease)
INCOME Operating Subsidy 2,249,486 2,331,373 (81,887) Anticipated expenditures, actual based on Annual and 5 year planTOTAL INCOME 2,249,486 2,331,373 (81,887)
EXPENSES Salaries-Admin 0 45,487 (45,487) Salaries moved to COCC and offset by maintenance fee for service Benefits 0 23,131 (23,131) Salaries moved to COCC and offset by maintenance fee for service Auditing Fees 2,500 2,500 0 Telephone & Internet Expense 0 2,100 (2,100) Mgmt & Admin Fee Expense 250,000 350,000 (100,000) Maintenance Fee for Service 60,000 0 60,000 Workers Comp Ins/First Aid 0 2,850 (2,850) Capital Expenditures/Special Projects 1,936,986 1,905,305 31,681 Anticipated expenditures, actual based on Annual and 5 year plan TOTAL EXPENSES 2,249,486 2,331,373 (81,887)
SUBTOTAL NET REVENUES 0 0 0
FUNDS FROM (TO) RESERVES 0 0 0
Proposed Capital Fund Program Grant BudgetFiscal Year Beginning October 1, 2016
Two-Year Comparison
DRAFT
42
Family Self Sufficiency (FSS) Programs The Authority has a grant with HUD for 100 Housing Choice Voucher and 100 Public Housing FSS participants. These participating families voluntarily enroll in the program and establish a plan to achieve specific goals within five years. As families achieve an increase in income, the subsidy savings is placed into an escrow account for the family. When the family achieves program goals, the escrow account is released to the family and is frequently used for higher education or homeownership. Public Housing Service Coordinator (PHSC) Grant The PHSC grant program’s purpose is to promote the development of local strategies to coordinate the use of assistance under the Public Housing program with public and private resources for supportive services and resident empowerment activities. These services should enable participating families to increase earned income, reduce or eliminate the need for welfare assistance, make progress toward achieving economic independence and housing self-sufficiency or, in the case of elderly or disabled residents, help improve living conditions and enable residents to “age-in-place”. These funds were awarded to the Authority to cover the salaries and expenses associated with the grant. The grant was set to expire in February 2016; however HUD has approved grant extensions. At this time, the Authority is operating under a six month extension set to expire April 2017. The spreadsheet on the following page is the FY 16-17 proposed budget for the FSS program and Coordinator and Public Housing Service Coordinator grants. The proposed budget provides a two-year comparison of proposed revenues and expenditures against the approved budget for fiscal year 2015-2016 with explanations of variances.
DRAFT
43

ROSS Grants
ROSS Grants
Total FY 15-16 Increase/ NotesFY 16-17 Budget (Decrease)
INCOME Grant Revenue 361,554 348,066 13,488TOTAL INCOME 361,554 348,066 13,488
EXPENSES Salaries-Admin 124,549 231,072 (106,524) Subcontracting the services for remainder of ROSS Service Coordinator grant extension Benefits 63,995 113,295 (49,300) Subcontracting the services for remainder of ROSS Service Coordinator grant extension Professional Fees 120,217 0 120,217 Subcontracting the services for remainder of ROSS Service Coordinator grant extension Temporary Employees 50,000 0 50,000 Extension of 2014 ROSS FSS grant Workers Comp Ins/First Aid 2,793 3,699 (906) TOTAL EXPENSES 361,554 348,066 13,488
SUBTOTAL NET REVENUES 0 0 0
FUNDS FROM (TO) RESERVES 0 0 0
Proposed Grants BudgetFiscal Year Beginning October 1, 2016
Two-Year Comparison
DRAFT
44