Embed Size (px)
Citation preview
ACADEMIC RESOURCE CENTER 2017-2018 Annual Report
Tutoring, Advising, Disability Services, TRIO/Student Support Services, ESL services
1
TABLE OF CONTENTS: PAGE
Mission and 2017-2018 ARC Highlights 2
First generation and Retention data 3
Supplemental Instruction (SI) data 4
CAL, Disability and evening use 5
SEM I and SEM II data 6
ARC Courses/outcomes 7
TRIO (SSS) highlights; Coached and FG Panel data 8
TRIO objectives 9
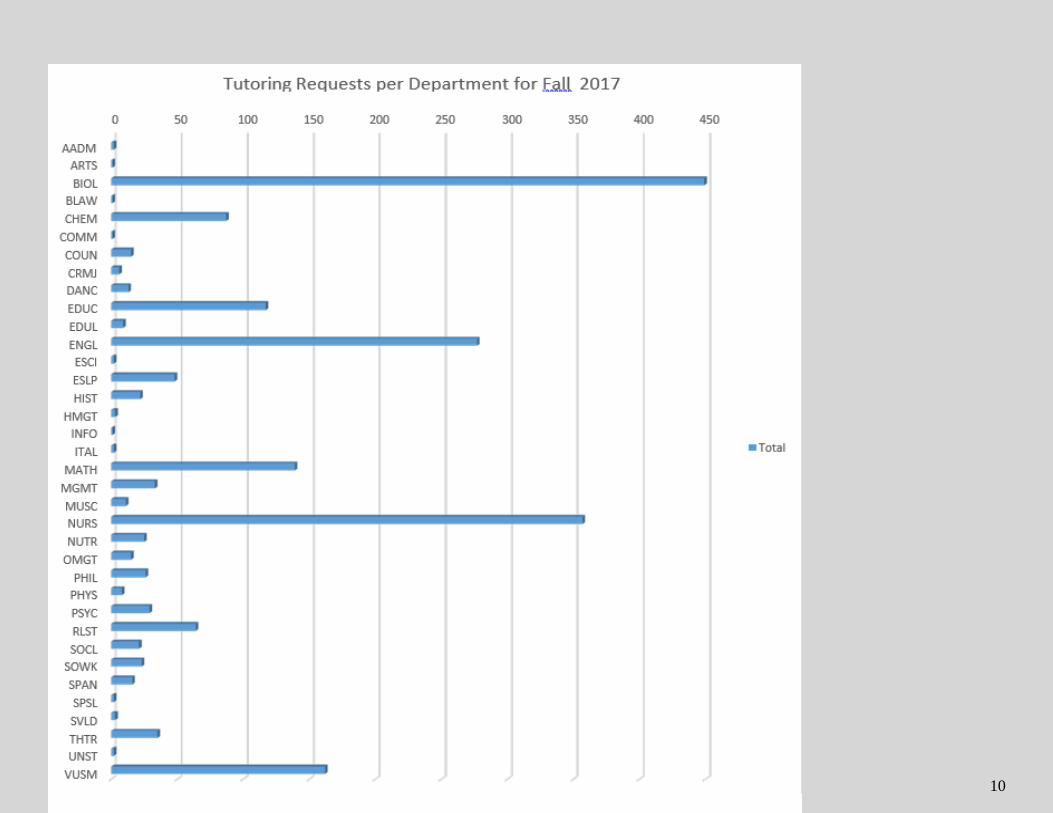
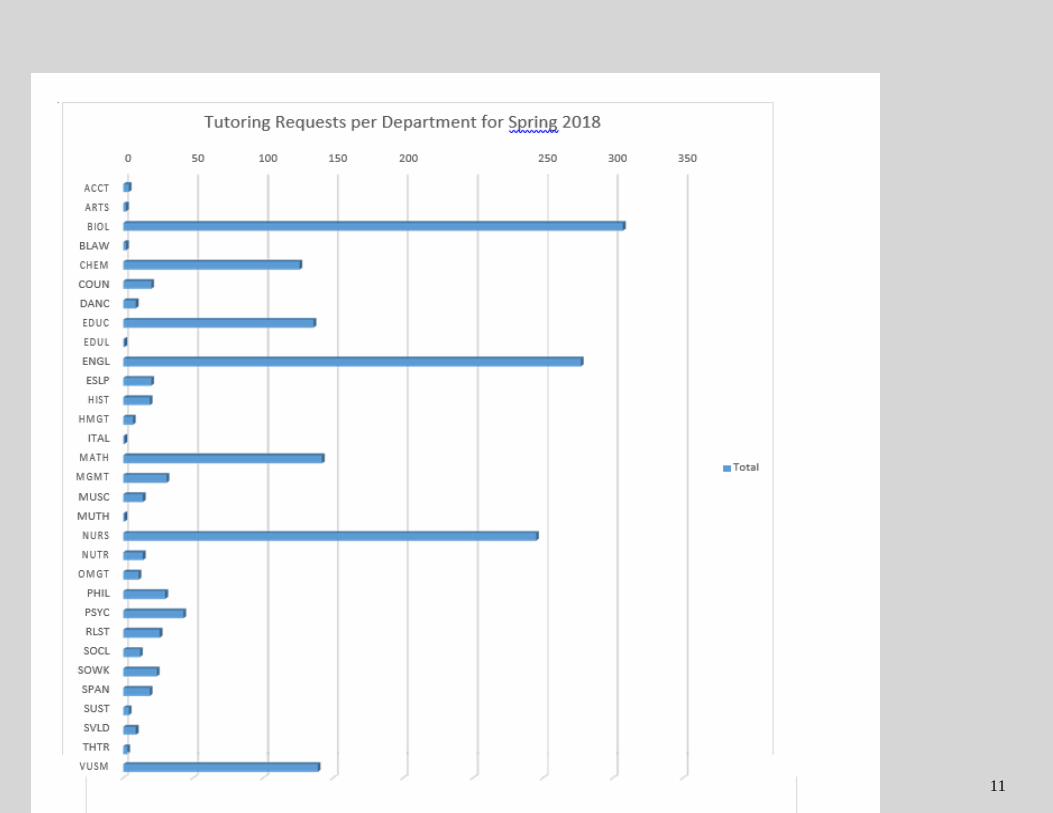
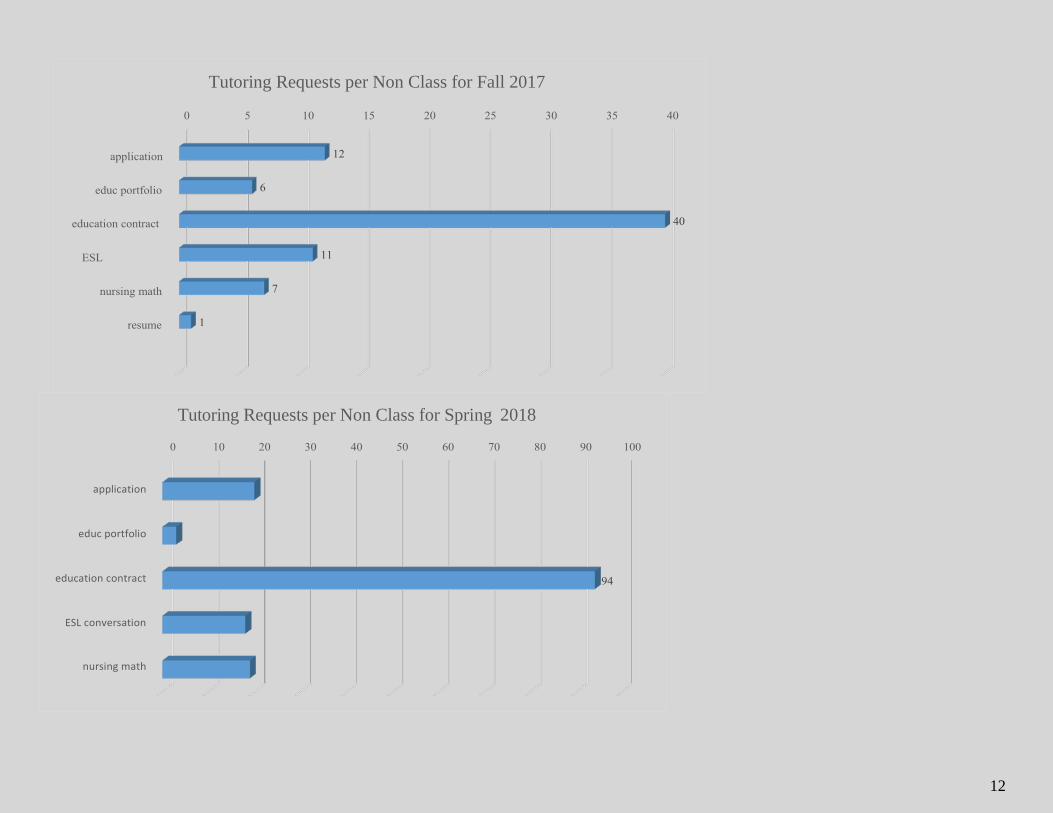
Tutoring in academic disciplines (graphs) 10-12
2
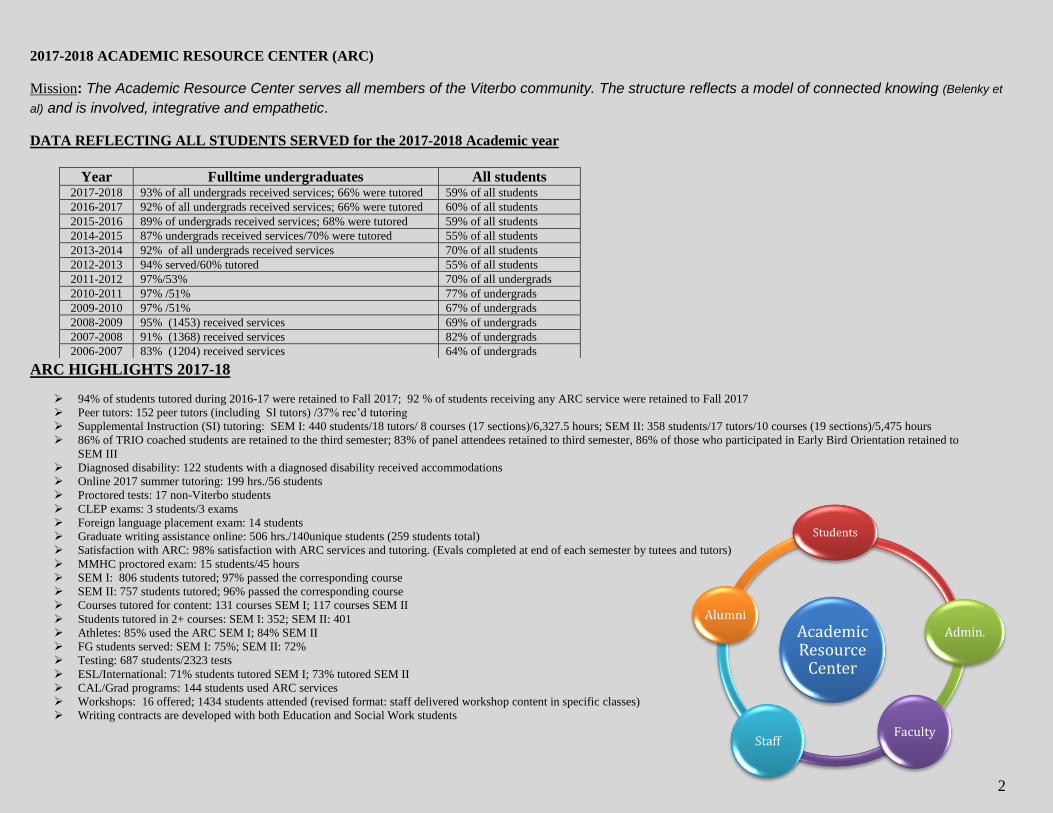
2017-2018 ACADEMIC RESOURCE CENTER (ARC)
Mission: The Academic Resource Center serves all members of the Viterbo community. The structure reflects a model of connected knowing (Belenky et
al) and is involved, integrative and empathetic.
DATA REFLECTING ALL STUDENTS SERVED for the 2017-2018 Academic year
ARC HIGHLIGHTS 2017-18
94% of students tutored during 2016-17 were retained to Fall 2017; 92 % of students receiving any ARC service were retained to Fall 2017
Peer tutors: 152 peer tutors (including SI tutors) /37% rec’d tutoring
Supplemental Instruction (SI) tutoring: SEM I: 440 students/18 tutors/ 8 courses (17 sections)/6,327.5 hours; SEM II: 358 students/17 tutors/10 courses (19 sections)/5,475 hours
86% of TRIO coached students are retained to the third semester; 83% of panel attendees retained to third semester, 86% of those who participated in Early Bird Orientation retained to
SEM III
Diagnosed disability: 122 students with a diagnosed disability received accommodations
Online 2017 summer tutoring: 199 hrs./56 students
Proctored tests: 17 non-Viterbo students
CLEP exams: 3 students/3 exams
Foreign language placement exam: 14 students
Graduate writing assistance online: 506 hrs./140unique students (259 students total)
Satisfaction with ARC: 98% satisfaction with ARC services and tutoring. (Evals completed at end of each semester by tutees and tutors)
MMHC proctored exam: 15 students/45 hours
SEM I: 806 students tutored; 97% passed the corresponding course
SEM II: 757 students tutored; 96% passed the corresponding course
Courses tutored for content: 131 courses SEM I; 117 courses SEM II
Students tutored in 2+ courses: SEM I: 352; SEM II: 401
Athletes: 85% used the ARC SEM I; 84% SEM II
FG students served: SEM I: 75%; SEM II: 72%
Testing: 687 students/2323 tests
ESL/International: 71% students tutored SEM I; 73% tutored SEM II
CAL/Grad programs: 144 students used ARC services
Workshops: 16 offered; 1434 students attended (revised format: staff delivered workshop content in specific classes)
Writing contracts are developed with both Education and Social Work students
Year Fulltime undergraduates All students 2017-2018 93% of all undergrads received services; 66% were tutored 59% of all students
2016-2017 92% of all undergrads received services; 66% were tutored 60% of all students
2015-2016 89% of undergrads received services; 68% were tutored 59% of all students
2014-2015 87% undergrads received services/70% were tutored 55% of all students
2013-2014 92% of all undergrads received services 70% of all students
2012-2013 94% served/60% tutored 55% of all students
2011-2012 97%/53% 70% of all undergrads
2010-2011 97% /51% 77% of undergrads
2009-2010 97% /51% 67% of undergrads
2008-2009 95% (1453) received services 69% of undergrads
2007-2008 91% (1368) received services 82% of undergrads
2006-2007 83% (1204) received services 64% of undergrads
Academic Resource
Center
Students
Admin.
FacultyStaff
Alumni
3
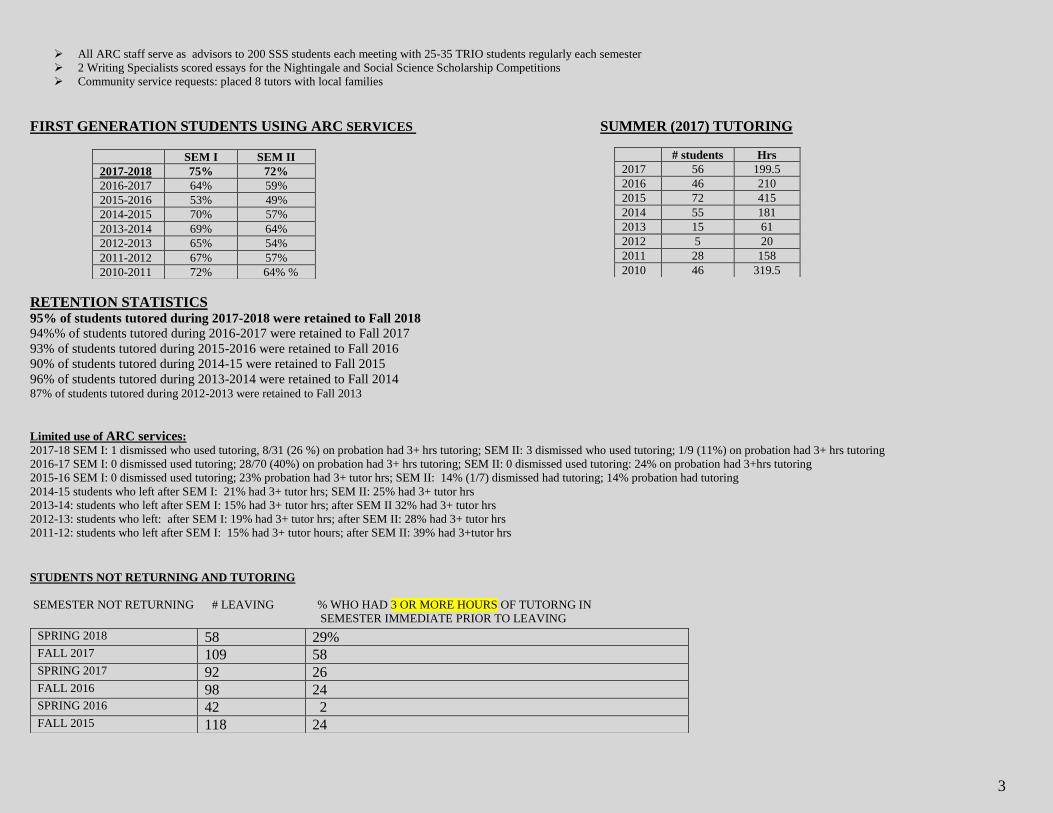
All ARC staff serve as advisors to 200 SSS students each meeting with 25-35 TRIO students regularly each semester
2 Writing Specialists scored essays for the Nightingale and Social Science Scholarship Competitions
Community service requests: placed 8 tutors with local families
FIRST GENERATION STUDENTS USING ARC SERVICES SUMMER (2017) TUTORING
RETENTION STATISTICS 95% of students tutored during 2017-2018 were retained to Fall 2018
94%% of students tutored during 2016-2017 were retained to Fall 2017
93% of students tutored during 2015-2016 were retained to Fall 2016
90% of students tutored during 2014-15 were retained to Fall 2015
96% of students tutored during 2013-2014 were retained to Fall 2014 87% of students tutored during 2012-2013 were retained to Fall 2013
Limited use of ARC services:
2017-18 SEM I: 1 dismissed who used tutoring, 8/31 (26 %) on probation had 3+ hrs tutoring; SEM II: 3 dismissed who used tutoring; 1/9 (11%) on probation had 3+ hrs tutoring
2016-17 SEM I: 0 dismissed used tutoring; 28/70 (40%) on probation had 3+ hrs tutoring; SEM II: 0 dismissed used tutoring: 24% on probation had 3+hrs tutoring 2015-16 SEM I: 0 dismissed used tutoring; 23% probation had 3+ tutor hrs; SEM II: 14% (1/7) dismissed had tutoring; 14% probation had tutoring
2014-15 students who left after SEM I: 21% had 3+ tutor hrs; SEM II: 25% had 3+ tutor hrs
2013-14: students who left after SEM I: 15% had 3+ tutor hrs; after SEM II 32% had 3+ tutor hrs
2012-13: students who left: after SEM I: 19% had 3+ tutor hrs; after SEM II: 28% had 3+ tutor hrs
2011-12: students who left after SEM I: 15% had 3+ tutor hours; after SEM II: 39% had 3+tutor hrs
STUDENTS NOT RETURNING AND TUTORING
SEMESTER NOT RETURNING # LEAVING % WHO HAD 3 OR MORE HOURS OF TUTORNG IN
SEMESTER IMMEDIATE PRIOR TO LEAVING
SEM I SEM II
2017-2018 75% 72%
2016-2017 64% 59%
2015-2016 53% 49%
2014-2015 70% 57%
2013-2014 69% 64%
2012-2013 65% 54%
2011-2012 67% 57%
2010-2011 72% 64% %
# students Hrs
2017 56 199.5
2016 46 210
2015 72 415
2014 55 181
2013 15 61
2012 5 20
2011 28 158
2010 46 319.5
SPRING 2018 58 29% FALL 2017 109 58 SPRING 2017 92 26 FALL 2016 98 24 SPRING 2016 42 2 FALL 2015 118 24
4
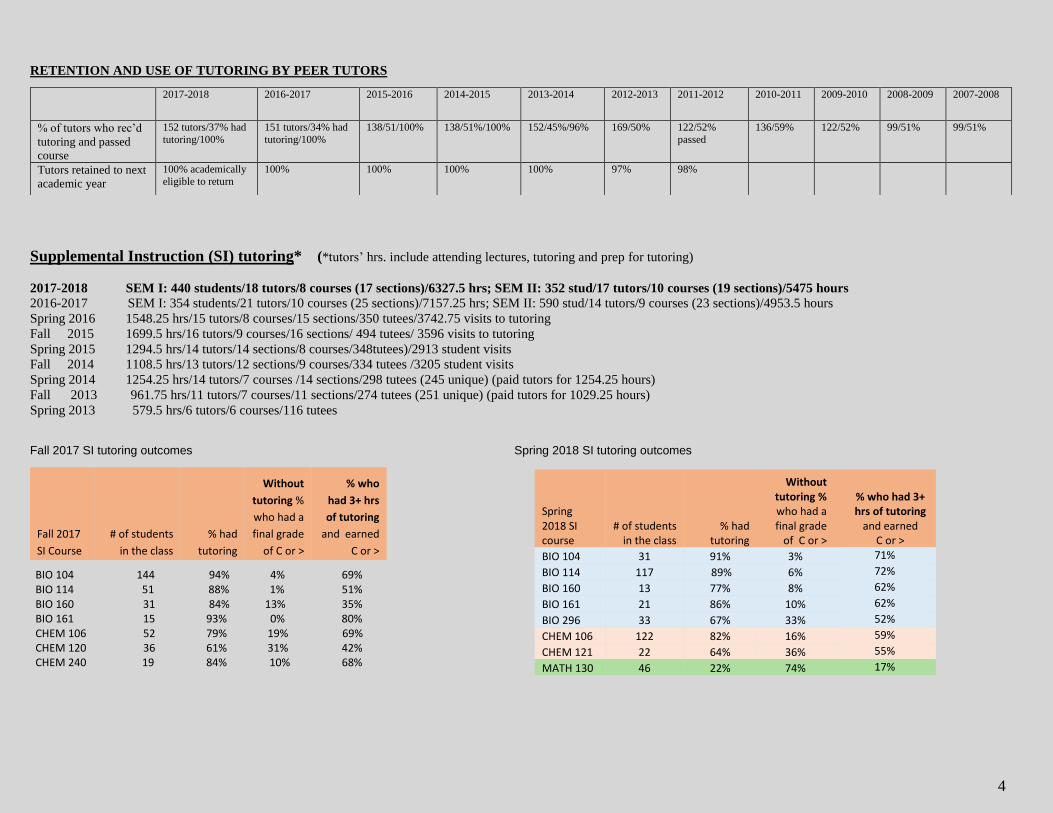
RETENTION AND USE OF TUTORING BY PEER TUTORS
Supplemental Instruction (SI) tutoring* (*tutors’ hrs. include attending lectures, tutoring and prep for tutoring)
2017-2018 SEM I: 440 students/18 tutors/8 courses (17 sections)/6327.5 hrs; SEM II: 352 stud/17 tutors/10 courses (19 sections)/5475 hours
2016-2017 SEM I: 354 students/21 tutors/10 courses (25 sections)/7157.25 hrs; SEM II: 590 stud/14 tutors/9 courses (23 sections)/4953.5 hours
Spring 2016 1548.25 hrs/15 tutors/8 courses/15 sections/350 tutees/3742.75 visits to tutoring
Fall 2015 1699.5 hrs/16 tutors/9 courses/16 sections/ 494 tutees/ 3596 visits to tutoring
Spring 2015 1294.5 hrs/14 tutors/14 sections/8 courses/348tutees)/2913 student visits
Fall 2014 1108.5 hrs/13 tutors/12 sections/9 courses/334 tutees /3205 student visits
Spring 2014 1254.25 hrs/14 tutors/7 courses /14 sections/298 tutees (245 unique) (paid tutors for 1254.25 hours)
Fall 2013 961.75 hrs/11 tutors/7 courses/11 sections/274 tutees (251 unique) (paid tutors for 1029.25 hours)
Spring 2013 579.5 hrs/6 tutors/6 courses/116 tutees
Fall 2017 SI tutoring outcomes Spring 2018 SI tutoring outcomes
BIO 104 144 94% 4% 69% BIO 114 51 88% 1% 51% BIO 160 31 84% 13% 35% BIO 161 15 93% 0% 80% CHEM 106 52 79% 19% 69% CHEM 120 36 61% 31% 42% CHEM 240 19 84% 10% 68%
2017-2018 2016-2017 2015-2016 2014-2015 2013-2014 2012-2013 2011-2012 2010-2011 2009-2010 2008-2009 2007-2008
% of tutors who rec’d
tutoring and passed
course
152 tutors/37% had
tutoring/100%
151 tutors/34% had
tutoring/100%
138/51/100% 138/51%/100% 152/45%/96% 169/50% 122/52%
passed
136/59% 122/52% 99/51% 99/51%
Tutors retained to next
academic year
100% academically
eligible to return
100% 100% 100% 100% 97% 98%
Spring 2018 SI course
# of students in the class
% had tutoring
Without tutoring % who had a final grade
of C or >
% who had 3+ hrs of tutoring
and earned C or >
BIO 104 31 91% 3% 71%
BIO 114 117 89% 6% 72%
BIO 160 13 77% 8% 62%
BIO 161 21 86% 10% 62%
BIO 296 33 67% 33% 52%
CHEM 106 122 82% 16% 59%
CHEM 121 22 64% 36% 55%
MATH 130 46 22% 74% 17%
Fall 2017
SI Course
# of students
in the class
% had
tutoring
Without
tutoring %
who had a
final grade
of C or >
% who
had 3+ hrs
of tutoring
and earned
C or >
5
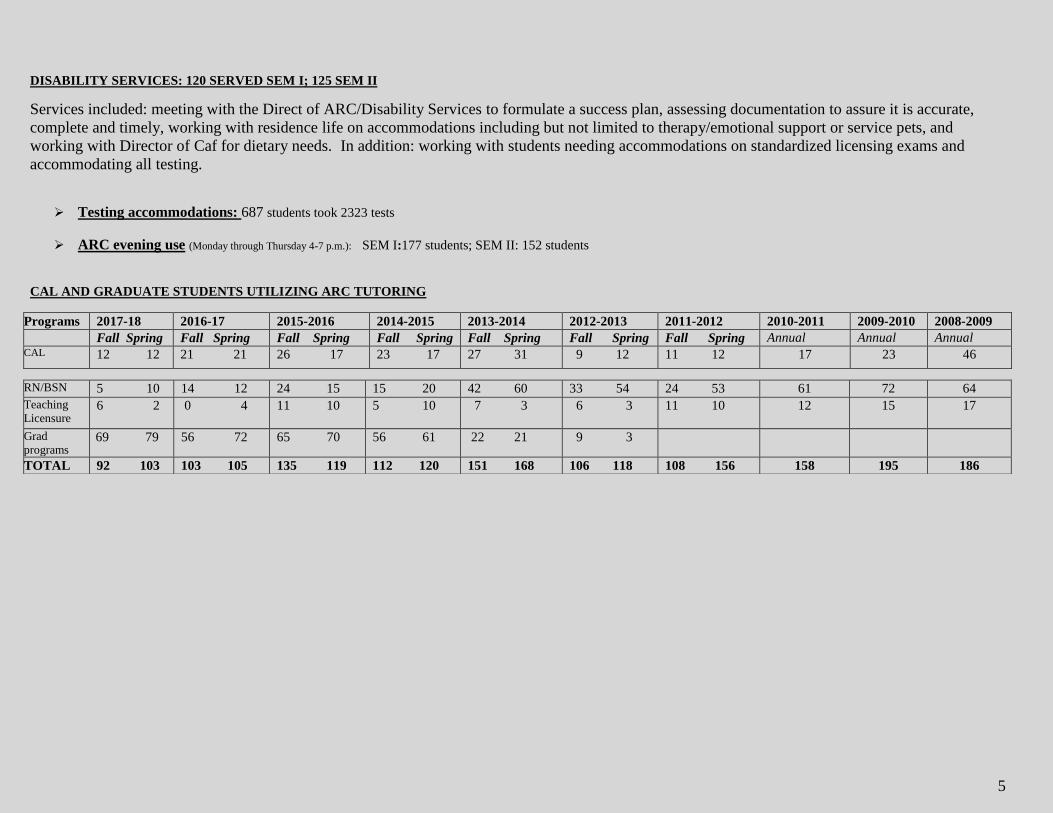
DISABILITY SERVICES: 120 SERVED SEM I; 125 SEM II
Services included: meeting with the Direct of ARC/Disability Services to formulate a success plan, assessing documentation to assure it is accurate,
complete and timely, working with residence life on accommodations including but not limited to therapy/emotional support or service pets, and
working with Director of Caf for dietary needs. In addition: working with students needing accommodations on standardized licensing exams and
accommodating all testing.
Testing accommodations: 687 students took 2323 tests
ARC evening use (Monday through Thursday 4-7 p.m.): SEM I:177 students; SEM II: 152 students
CAL AND GRADUATE STUDENTS UTILIZING ARC TUTORING
Programs 2017-18 2016-17 2015-2016 2014-2015 2013-2014 2012-2013 2011-2012 2010-2011 2009-2010 2008-2009
Fall Spring Fall Spring Fall Spring Fall Spring Fall Spring Fall Spring Fall Spring Annual Annual Annual CAL 12 12 21 21 26 17 23 17 27 31 9 12 11 12 17 23 46
RN/BSN 5 10 14 12 24 15 15 20 42 60 33 54 24 53 61 72 64
Teaching
Licensure 6 2 0 4 11 10 5 10 7 3 6 3 11 10 12 15 17
Grad
programs 69 79 56 72 65 70 56 61 22 21 9 3
TOTAL 92 103 103 105 135 119 112 120 151 168 106 118 108 156 158 195 186
6
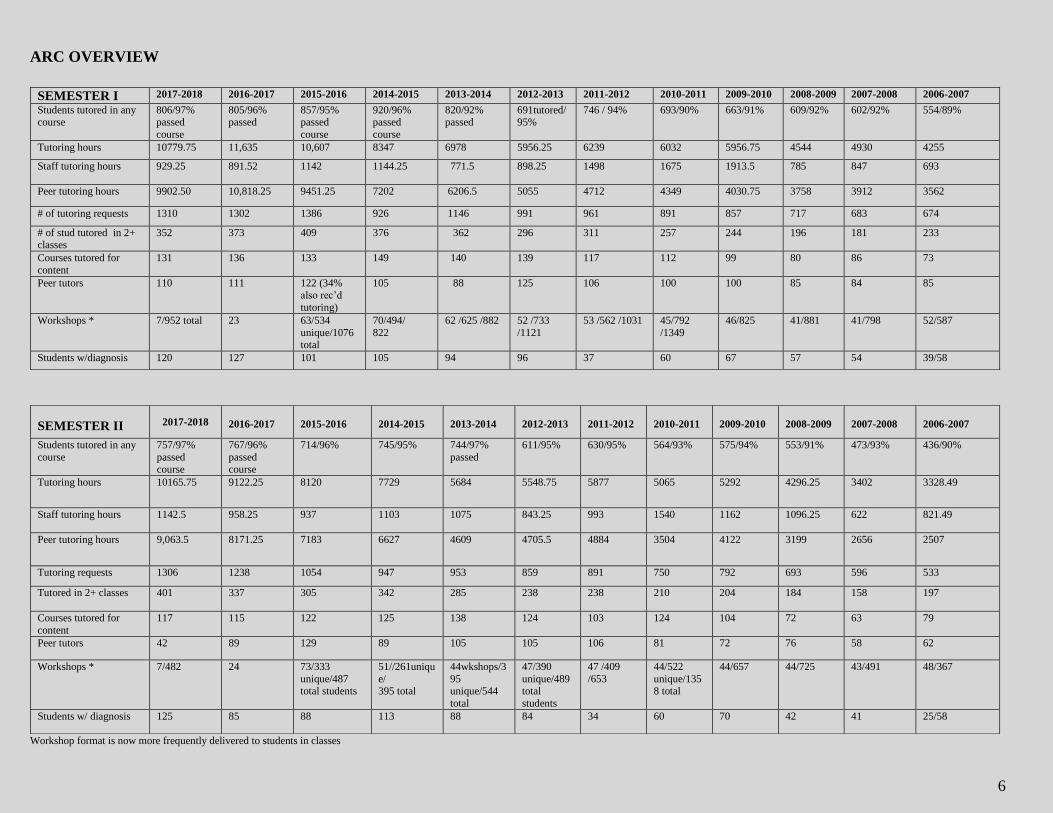
ARC OVERVIEW
Workshop format is now more frequently delivered to students in classes
SEMESTER I 2017-2018 2016-2017 2015-2016 2014-2015 2013-2014 2012-2013 2011-2012 2010-2011 2009-2010 2008-2009 2007-2008 2006-2007
Students tutored in any course
806/97% passed
course
805/96% passed
857/95% passed
course
920/96% passed
course
820/92% passed
691tutored/95%
746 / 94% 693/90% 663/91% 609/92% 602/92% 554/89%
Tutoring hours 10779.75 11,635 10,607 8347 6978 5956.25 6239 6032 5956.75 4544 4930 4255
Staff tutoring hours 929.25 891.52 1142 1144.25 771.5 898.25 1498 1675 1913.5 785 847 693
Peer tutoring hours 9902.50 10,818.25 9451.25 7202 6206.5 5055 4712 4349 4030.75 3758 3912 3562
# of tutoring requests 1310 1302 1386 926 1146 991 961 891 857 717 683 674
# of stud tutored in 2+ classes
352 373 409 376 362 296 311 257 244 196 181 233
Courses tutored for
content
131 136 133 149 140 139 117 112 99 80 86 73
Peer tutors 110 111 122 (34% also rec’d
tutoring)
105 88 125 106 100 100 85 84 85
Workshops * 7/952 total 23 63/534
unique/1076 total
70/494/
822
62 /625 /882 52 /733
/1121
53 /562 /1031 45/792
/1349
46/825 41/881 41/798 52/587
Students w/diagnosis 120 127 101 105 94 96 37 60 67 57 54 39/58
SEMESTER II 2017-2018
2016-2017
2015-2016
2014-2015
2013-2014
2012-2013
2011-2012
2010-2011
2009-2010
2008-2009
2007-2008
2006-2007
Students tutored in any
course
757/97%
passed course
767/96%
passed course
714/96% 745/95% 744/97%
passed
611/95% 630/95% 564/93% 575/94% 553/91% 473/93% 436/90%
Tutoring hours 10165.75 9122.25 8120 7729 5684 5548.75 5877 5065 5292 4296.25 3402 3328.49
Staff tutoring hours 1142.5
958.25 937 1103 1075 843.25 993 1540 1162 1096.25 622 821.49
Peer tutoring hours 9,063.5 8171.25 7183 6627 4609 4705.5 4884 3504 4122 3199 2656 2507
Tutoring requests 1306 1238 1054 947 953 859 891 750 792 693 596 533
Tutored in 2+ classes
401 337 305 342 285 238 238 210 204 184 158 197
Courses tutored for
content
117 115 122 125 138 124 103 124 104 72 63 79
Peer tutors 42 89 129 89 105 105 106 81 72 76 58 62
Workshops * 7/482 24 73/333
unique/487 total students
51//261uniqu
e/ 395 total
44wkshops/3
95 unique/544
total
47/390
unique/489 total
students
47 /409
/653
44/522
unique/1358 total
44/657 44/725 43/491 48/367
Students w/ diagnosis 125 85 88 113 88 84 34 60 70 42 41 25/58
7
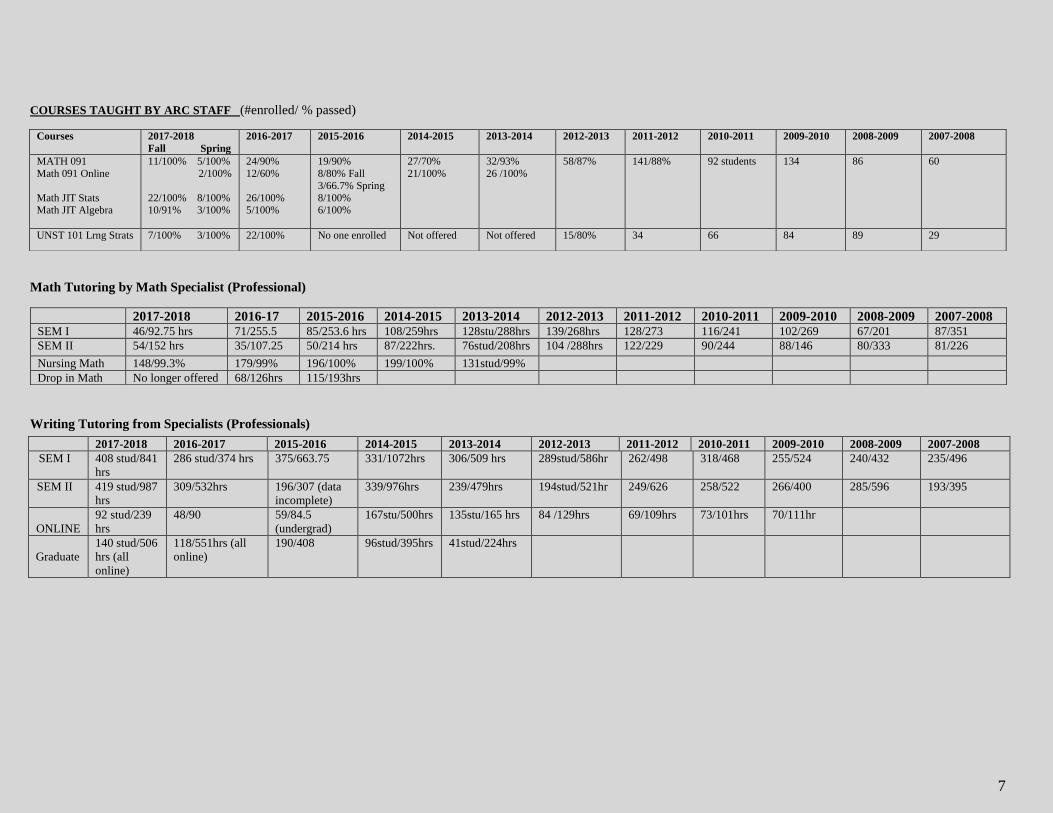
COURSES TAUGHT BY ARC STAFF (#enrolled/ % passed)
Math Tutoring by Math Specialist (Professional)
Writing Tutoring from Specialists (Professionals)
Courses 2017-2018
Fall Spring
2016-2017 2015-2016 2014-2015 2013-2014 2012-2013 2011-2012 2010-2011 2009-2010 2008-2009 2007-2008
MATH 091
Math 091 Online
Math JIT Stats Math JIT Algebra
11/100% 5/100%
2/100%
22/100% 8/100% 10/91% 3/100%
24/90%
12/60%
26/100% 5/100%
19/90%
8/80% Fall 3/66.7% Spring
8/100% 6/100%
27/70%
21/100%
32/93%
26 /100%
58/87% 141/88% 92 students 134 86 60
UNST 101 Lrng Strats 7/100% 3/100% 22/100% No one enrolled Not offered Not offered 15/80% 34 66 84 89 29
2017-2018 2016-17 2015-2016 2014-2015 2013-2014 2012-2013 2011-2012 2010-2011 2009-2010 2008-2009 2007-2008 SEM I 46/92.75 hrs 71/255.5 85/253.6 hrs 108/259hrs 128stu/288hrs 139/268hrs 128/273 116/241 102/269 67/201 87/351
SEM II 54/152 hrs 35/107.25 50/214 hrs 87/222hrs. 76stud/208hrs 104 /288hrs 122/229 90/244 88/146 80/333 81/226
Nursing Math 148/99.3% 179/99% 196/100% 199/100% 131stud/99%
Drop in Math No longer offered 68/126hrs 115/193hrs
2017-2018 2016-2017 2015-2016 2014-2015 2013-2014 2012-2013 2011-2012 2010-2011 2009-2010 2008-2009 2007-2008
SEM I 408 stud/841
hrs
286 stud/374 hrs 375/663.75 331/1072hrs 306/509 hrs 289stud/586hr 262/498 318/468 255/524 240/432 235/496
SEM II 419 stud/987
hrs
309/532hrs 196/307 (data
incomplete)
339/976hrs 239/479hrs 194stud/521hr 249/626 258/522 266/400 285/596 193/395
ONLINE
92 stud/239
hrs
48/90 59/84.5
(undergrad)
167stu/500hrs 135stu/165 hrs 84 /129hrs 69/109hrs
73/101hrs 70/111hr
Graduate
140 stud/506
hrs (all
online)
118/551hrs (all
online)
190/408 96stud/395hrs 41stud/224hrs
8
TRIO/STUDENT SUPPORT SERVICES (SSS) HIGHLIGHTS 2017-18:
The following data indicates when provided with support services, intrusive and timely advising, and academic coaching, at-risk students achieve at rates similar to all students.
The goal of SSS is to retain and graduate first generation (FG)/low-income (LI) students at rates reflective of all enrolled students. 206 students were in SSS
SSS on Probation: 4 SEM I compared to 38 for all undergrads; SEM II: 3 SSS compared to 17 for all undergrads
SSS suspended/dismissed: SEM I: 0 SSS compared to 3 all; SEM II: 0 compared to 12 all undergrads
206 (99%) SSS finished the year in good academic standing
91% of SSS students were retained from one academic year to the next
92% of SSS respondents indicate that SSS is supportive of their academic success
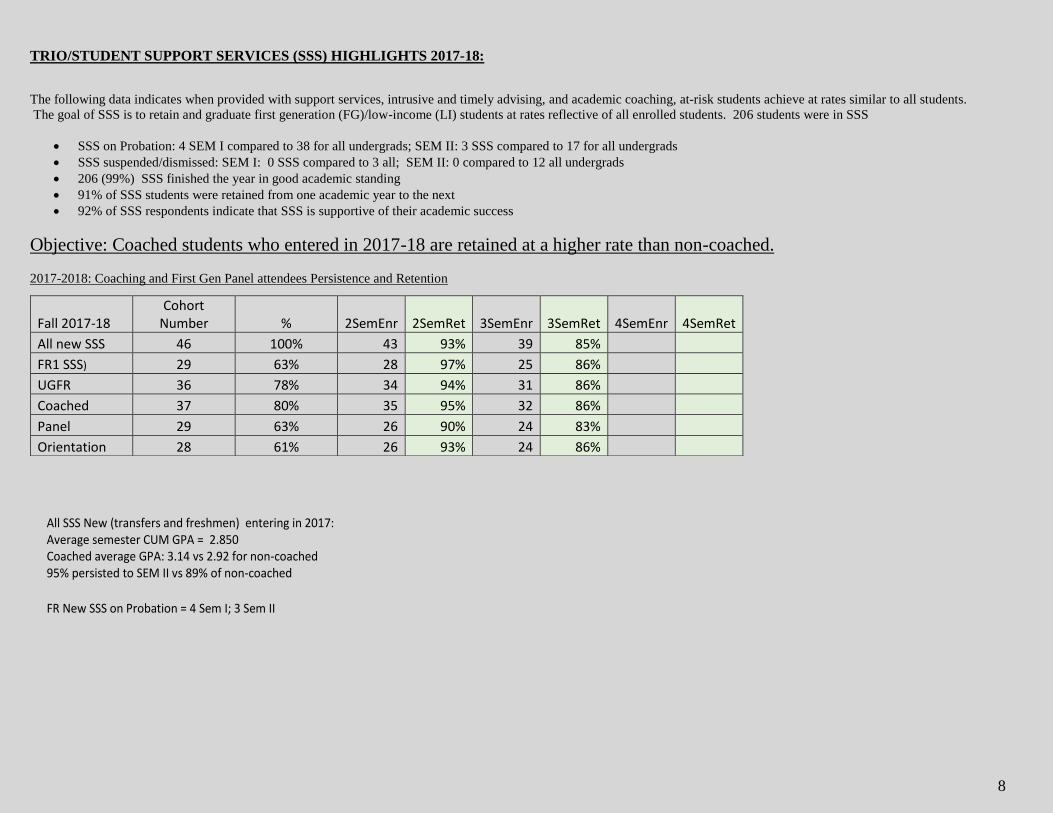
Objective: Coached students who entered in 2017-18 are retained at a higher rate than non-coached.
2017-2018: Coaching and First Gen Panel attendees Persistence and Retention
All SSS New (transfers and freshmen) entering in 2017: Average semester CUM GPA = 2.850 Coached average GPA: 3.14 vs 2.92 for non-coached 95% persisted to SEM II vs 89% of non-coached
FR New SSS on Probation = 4 Sem I; 3 Sem II
Fall 2017-18 Cohort
Number % 2SemEnr 2SemRet 3SemEnr 3SemRet 4SemEnr 4SemRet
All new SSS 46 100% 43 93% 39 85%
FR1 SSS) 29 63% 28 97% 25 86%
UGFR 36 78% 34 94% 31 86%
Coached 37 80% 35 95% 32 86%
Panel 29 63% 26 90% 24 83%
Orientation 28 61% 26 93% 24 86%
9
SSS/TRIO Federal Objectives 2017-2018
1. Participant Identification and Selection Objective: To identify, select and serve 200 Viterbo University SSS eligible students each year who are first generation, low income or have a disability.
206 students were served in 2017-2018. 2. Academic Achievement Objective: To assure that 80% of SSS students complete the academic year in good academic standing as defined by the university (GPA 2.0 or above).
99% completed the academic year with a cum GPA of 2.0 or above 70% were tutored 100% utilized counseling services (All ARC professional staff serve as academic counselors to SSS students) 100% came for services 3. Academic Skills Enhancement Objective: To assure that participating students increase reading and writing skills.
ARC classes 100% passed SEM I 100% passed SEM II Math assistance 97% passed SEM I 100% passed SEM II 4. Persistence Rate
Objective: 65% of all participants served by the SSS project will persist from one academic year to the beginning of the next academic year or graduate
92% persisted from one year to the next 61% graduated within 6 years 5. Campus Climate Objective: To provide a campus climate fostering students’ participation in campus events. 100% indicate that the program is supportive.
FAC event tickets are free to SSS students due to funding through the TRIO grant. 83 students attended a FAC performance. The student led TRIO Tribune is published 4 times/year with input from ARC staff but layout, design and publication are by TRIO student
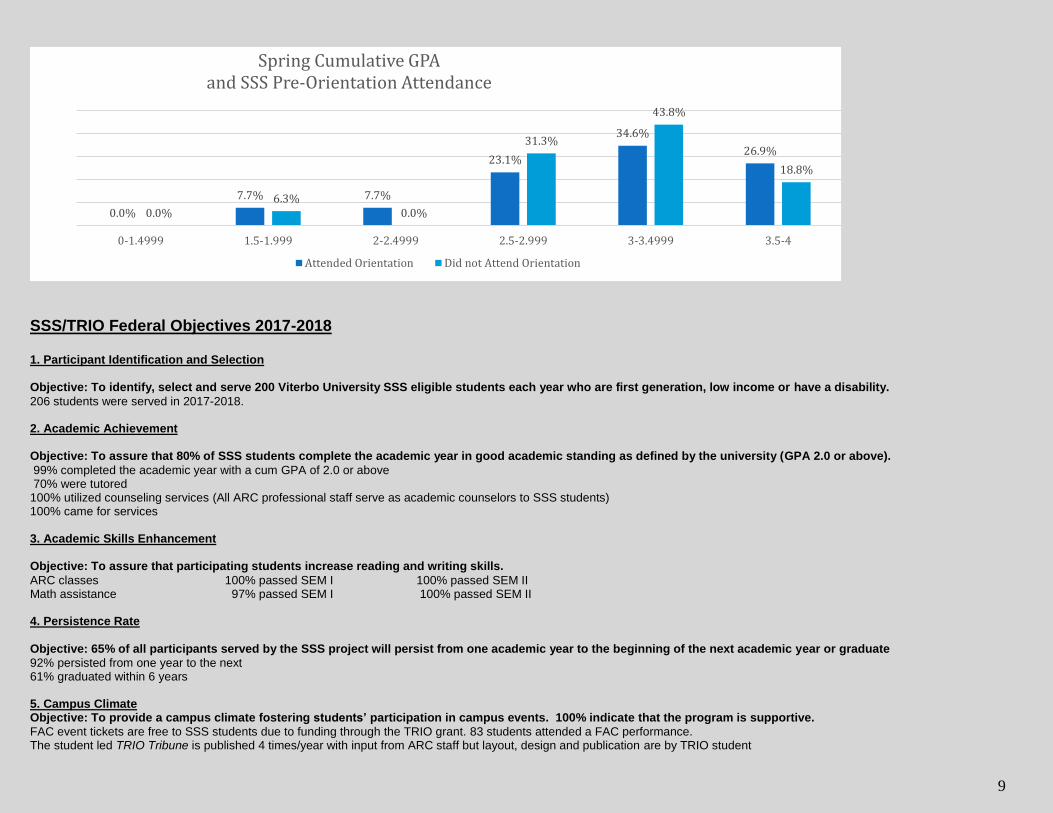
0.0%
7.7% 7.7%
23.1%
34.6%
26.9%
0.0%6.3%
0.0%
31.3%
43.8%
18.8%
0-1.4999 1.5-1.999 2-2.4999 2.5-2.999 3-3.4999 3.5-4
Spring Cumulative GPAand SSS Pre-Orientation Attendance
Attended Orientation Did not Attend Orientation
10
11
12
Tutoring Requests per Non Class for Spring 2018
application
educ portfolio
education contract
ESL conversation
nursing math
Tutoring Requests per Non Class for Fall 2017


![Glossary of Biosecurity Management - Springer978-94-007-1412-0/1.pdf · Agrosylvopastural systems (Agrosilvopastura) [Bio] Combination of woody plants component (forestry) with the](https://img.pdfslide.us/doc/110x75/5cade48a88c9933f078e0c9e/glossary-of-biosecurity-management-springer-978-94-007-1412-01pdf-agrosylvopastural.jpg)