Embed Size (px)
Citation preview
2016.08.26
2016 1H Interim Results
Fubon Financial Holdings
2
Disclaimer
This meeting may contain forward-looking statements with respect to the financial
condition, results of operations and business of the company. These forward-looking
statements represent the company’s expectations or beliefs concerning future events
and involve known and unknown risks and uncertainty that could cause actual
results, performance or events to differ materially from those expressed. Certain
statements, such as those that include the words “potential”, “estimated”, and similar
expressions or variations on such expressions may be considered “forward-looking
statements”. Financial numbers in this report may include preliminary unaudited
numbers or management accounts.
3
Performance review by subsidiary
• Fubon Life
• Fubon Securities
Performance highlights of Fubon Financial Holdings
• Fubon Insurance
Agenda
• Taipei Fubon Bank
• Overseas banking operation
• Fubon Bank (China)
4
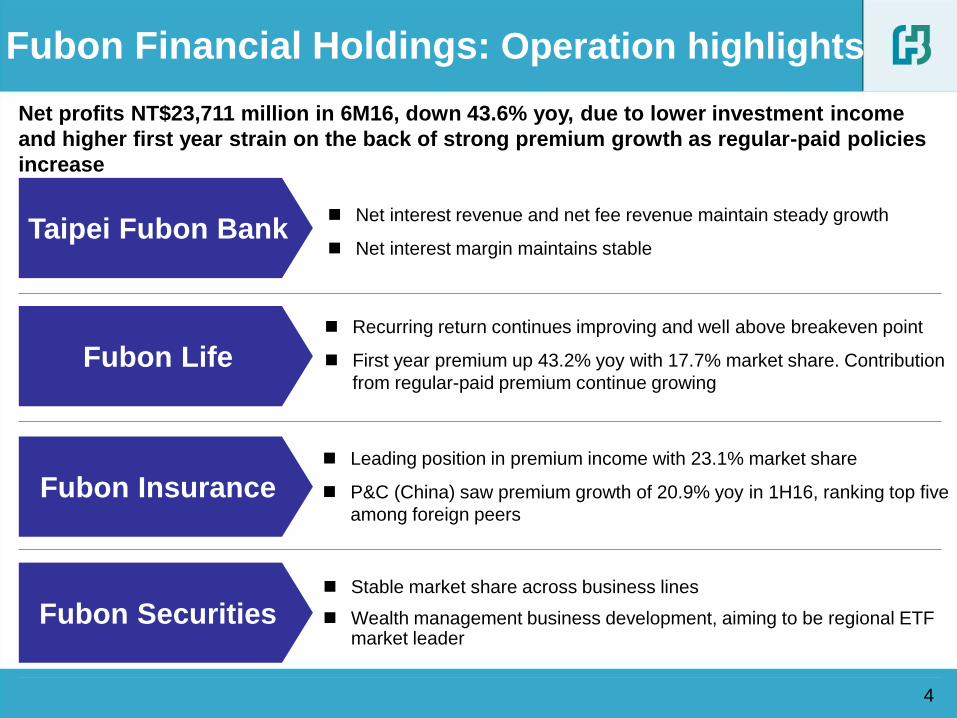
Fubon Financial Holdings: Operation highlights
Taipei Fubon Bank
Stable market share across business lines
Wealth management business development, aiming to be regional ETF market leader
Fubon Life
Fubon Insurance
Fubon Securities
Net profits NT$23,711 million in 6M16, down 43.6% yoy, due to lower investment income
and higher first year strain on the back of strong premium growth as regular-paid policies
increase
Recurring return continues improving and well above breakeven point
First year premium up 43.2% yoy with 17.7% market share. Contribution
from regular-paid premium continue growing
Net interest revenue and net fee revenue maintain steady growth
Net interest margin maintains stable
Leading position in premium income with 23.1% market share
P&C (China) saw premium growth of 20.9% yoy in 1H16, ranking top five
among foreign peers
5
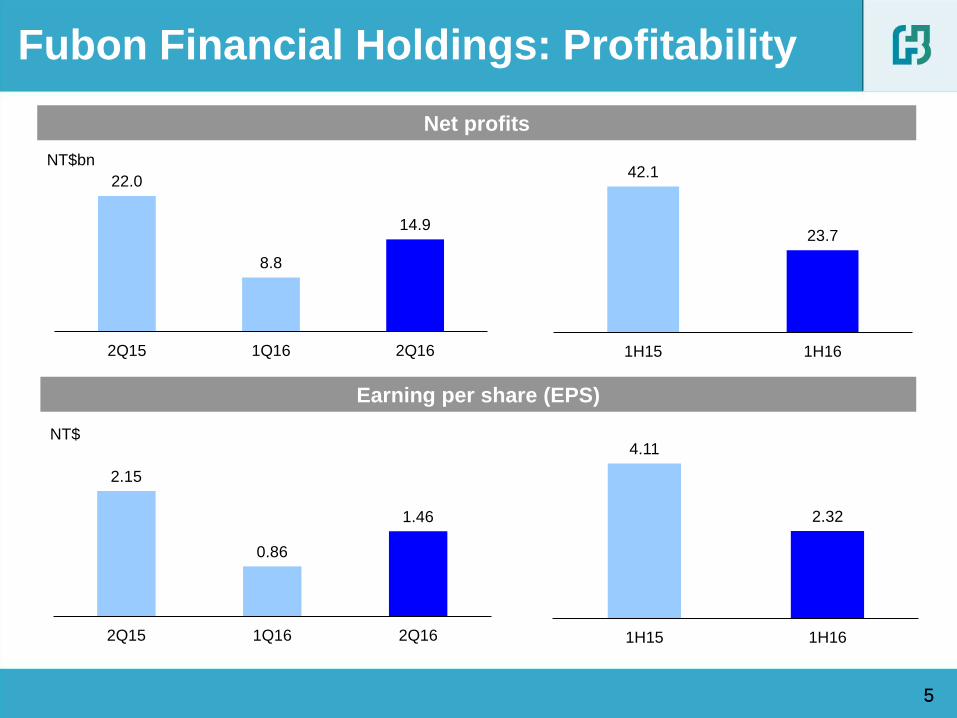
Net profits
Earning per share (EPS)
NT$
NT$bn
5
Fubon Financial Holdings: Profitability
22.0
8.8
14.9
2Q15 1Q16 2Q16
42.1
23.7
1H15 1H16
2.15
0.86
1.46
2Q15 1Q16 2Q16
4.11
2.32
1H15 1H16
6
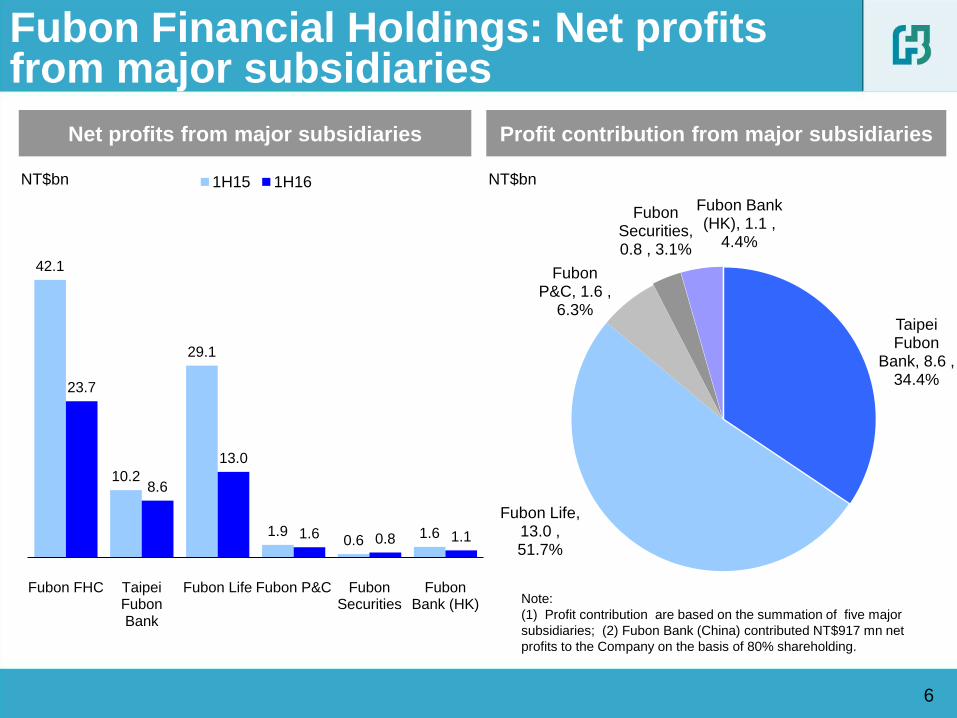
Fubon Financial Holdings: Net profits from major subsidiaries
Net profits from major subsidiaries Profit contribution from major subsidiaries
NT$bn NT$bn
Note:
(1) Profit contribution are based on the summation of five major
subsidiaries; (2) Fubon Bank (China) contributed NT$917 mn net
profits to the Company on the basis of 80% shareholding.
Taipei Fubon
Bank, 8.6 , 34.4%
Fubon Life, 13.0 , 51.7%
Fubon P&C, 1.6 ,
6.3%
Fubon Securities, 0.8 , 3.1%
Fubon Bank (HK), 1.1 ,
4.4%
42.1
10.2
29.1
1.9 0.6
1.6
23.7
8.6
13.0
1.6 0.8 1.1
Fubon FHC TaipeiFubonBank
Fubon Life Fubon P&C FubonSecurities
FubonBank (HK)
1H15 1H16
7 7
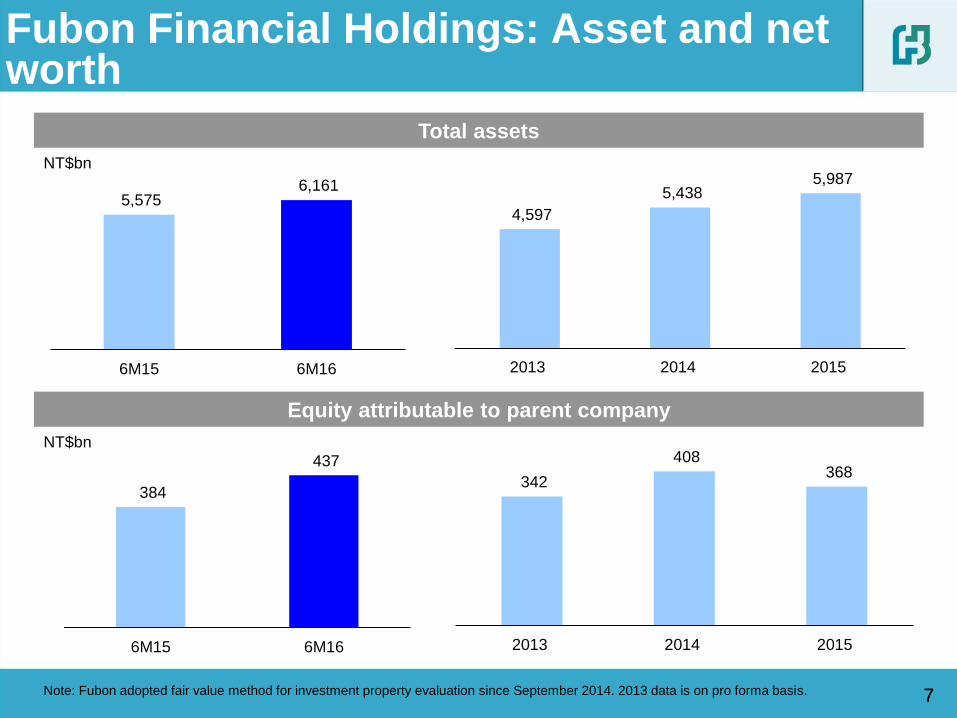
Total assets
Equity attributable to parent company
NT$bn
NT$bn
Fubon Financial Holdings: Asset and net worth
Note: Fubon adopted fair value method for investment property evaluation since September 2014. 2013 data is on pro forma basis.
4,597
5,438 5,987
2013 2014 2015
342
408 368
2013 2014 2015
384
437
6M15 6M16
5,575 6,161
6M15 6M16
8 8
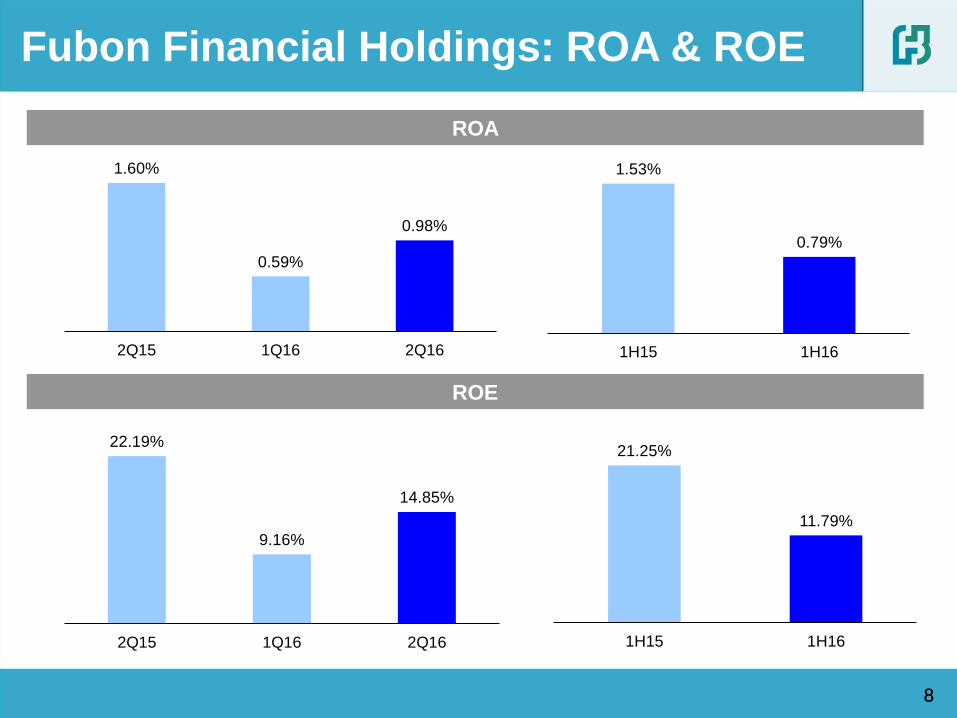
ROA
ROE
Fubon Financial Holdings: ROA & ROE
1.53%
0.79%
1H15 1H16
21.25%
11.79%
1H15 1H16
1.60%
0.59%
0.98%
2Q15 1Q16 2Q16
22.19%
9.16%
14.85%
2Q15 1Q16 2Q16
9
Performance review by subsidiary
• Fubon Life
• Fubon Securities
Performance highlights of Fubon Financial Holdings
• Fubon Insurance
Agenda
• Taipei Fubon Bank
• Overseas banking operation
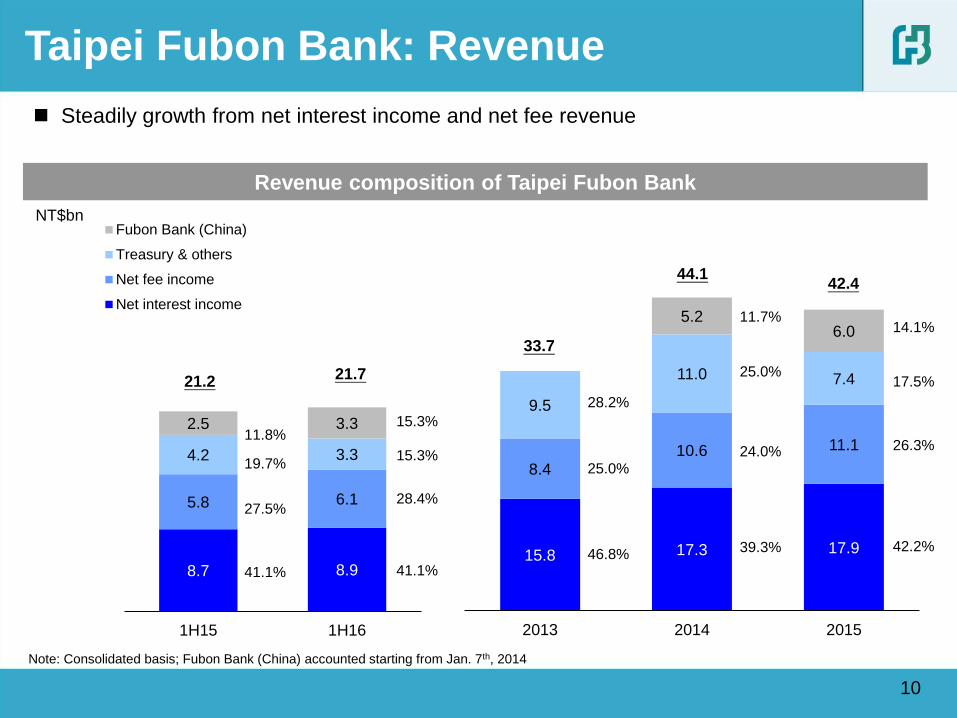
8.7 8.9
5.8 6.1
4.2 3.3
2.5 3.3
1H15 1H16
Fubon Bank (China)
Treasury & others
Net fee income
Net interest income
15.8 17.3 17.9
8.4 10.6 11.1
9.5
11.0 7.4
5.2 6.0
2013 2014 2015
10
Taipei Fubon Bank: Revenue
Revenue composition of Taipei Fubon Bank
NT$bn
Steadily growth from net interest income and net fee revenue
33.7
Note: Consolidated basis; Fubon Bank (China) accounted starting from Jan. 7th, 2014
44.1 42.4
21.2 21.7
41.1%
28.4%
41.1%
11.8%
19.7%
27.5%
15.3%
15.3%
28.2%
42.2% 39.3%
24.0%
25.0%
11.7%
46.8%
25.0%
14.1%
17.5%
26.3%

Sources of fee revenue(1)
47.3%
76.0%
1.7%
1.5%
37.8%
14.6% 13.2%
7.9%
1H15 1H16
structured andequity product
Mutual funds
Custodian andtrust
Insurancecommission
78.1% 79.7%
11.2% 10.3%
6.4% 5.4% 4.3% 4.6%
1H15 1H16
Others
Syndicationloan
Credit card
Wealthmanagement
11
Taipei Fubon Bank: Fee and wealth
management revenue
Wealth management fee(2)
NT$mn NT$mn
Note: (1) Fee income including Taipei Fubon Bank standalone and Taipei Fubon Bank Life Insurance Agency
(2) Wealth management revenue includes fee in the chart and other income (1H16: NT$169mn; 1H15: NT$228mn)
(3) Data are stand-alone basis in page 11-16
5,834 6,143 4,895
4,559
Wealth management business continues growing with bancasurrance contribution increase
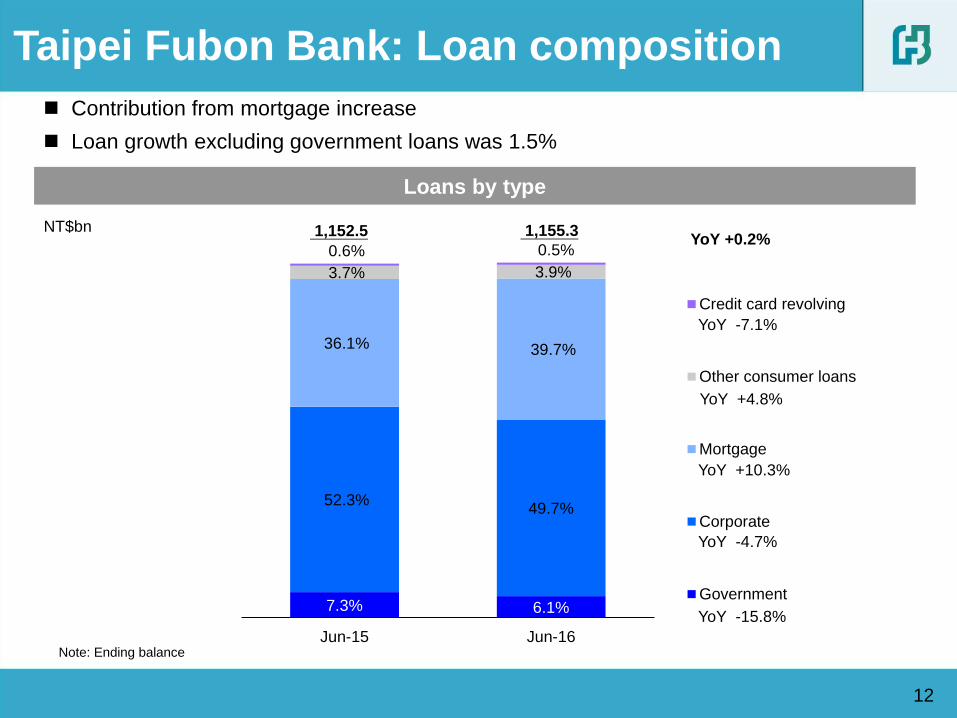
7.3% 6.1%
52.3% 49.7%
36.1% 39.7%
3.7% 3.9%
0.6% 0.5%
Jun-15 Jun-16
Credit card revolving
Other consumer loans
Mortgage
Corporate
Government
Loans by type
12
Taipei Fubon Bank: Loan composition
NT$bn 1,155.3 YoY +0.2%
YoY -7.1%
YoY +4.8%
YoY +10.3%
YoY -4.7%
YoY -15.8%
Contribution from mortgage increase
Loan growth excluding government loans was 1.5%
1,152.5
Note: Ending balance

340.3 346.4 353.9 346.8 357.4
262.5 255.9 247.1 230.7
217.1
2Q15 3Q15 4Q15 1Q16 2Q16
NTD Non-NTD
13
Taipei Fubon Bank: Corporate credit
Corporate loan by currency SME credit and as % of corporate credit
NT$bn
NT dollar denominated corporate loan delivered 5% YoY growth
SME credit accounts for 36.8% of corporate credit
NT$bn
Note: SME credit and corporate credit include loan and trade finance Note: Ending balance
209 211
207 211
218
31.7%
32.4% 33.5%
36.0% 36.8%
2Q15 3Q15 4Q15 1Q16 2Q16
SME SME as % of corporate credit
14
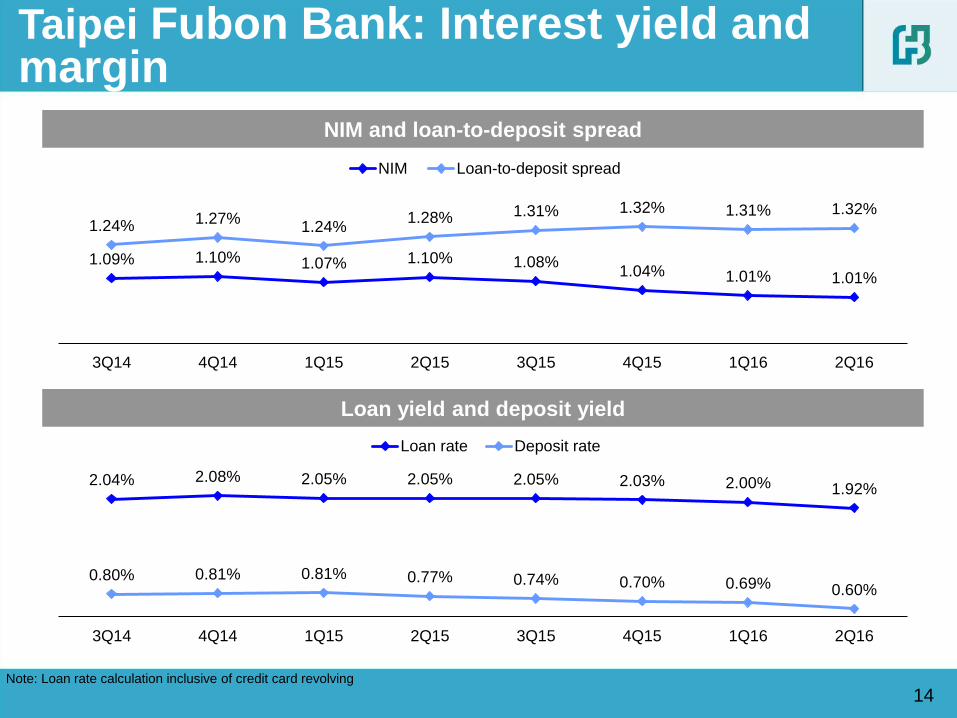
Taipei Fubon Bank: Interest yield and margin
NIM and loan-to-deposit spread
Loan yield and deposit yield
Note: Loan rate calculation inclusive of credit card revolving
1.09% 1.10% 1.07% 1.10% 1.08% 1.04% 1.01% 1.01%
1.24% 1.27% 1.24%
1.28% 1.31% 1.32% 1.31% 1.32%
3Q14 4Q14 1Q15 2Q15 3Q15 4Q15 1Q16 2Q16
NIM Loan-to-deposit spread
2.04% 2.08% 2.05% 2.05% 2.05% 2.03% 2.00% 1.92%
0.80% 0.81% 0.81% 0.77% 0.74% 0.70% 0.69% 0.60%
3Q14 4Q14 1Q15 2Q15 3Q15 4Q15 1Q16 2Q16
Loan rate Deposit rate
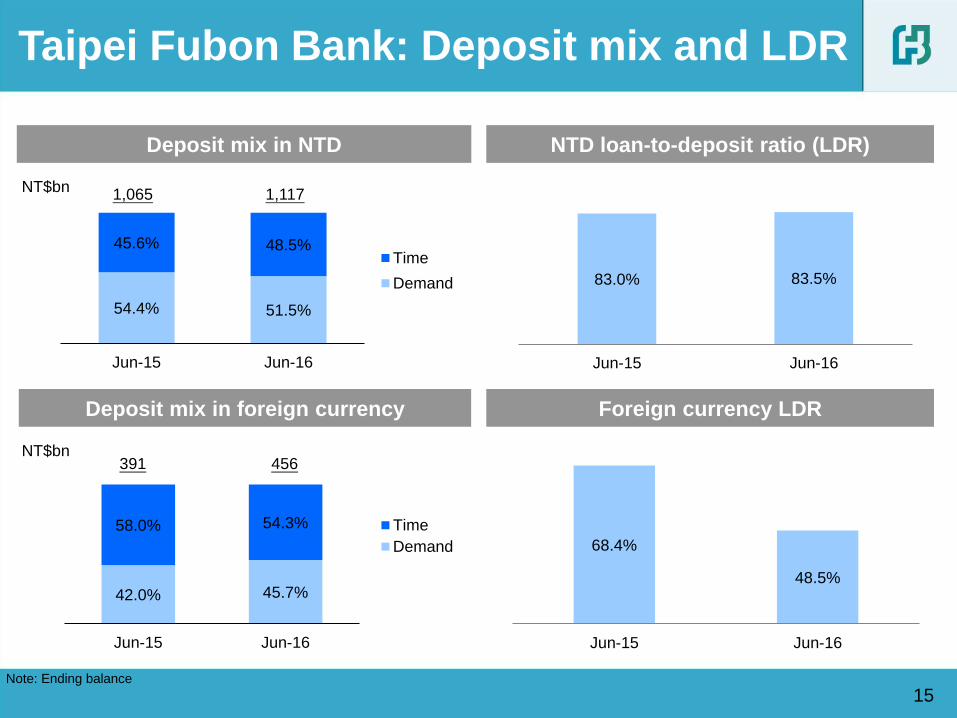
42.0% 45.7%
58.0% 54.3%
Jun-15 Jun-16
Time
Demand
54.4% 51.5%
45.6% 48.5%
Jun-15 Jun-16
Time
Demand
15
Taipei Fubon Bank: Deposit mix and LDR
NTD loan-to-deposit ratio (LDR) Deposit mix in NTD
Deposit mix in foreign currency
NT$bn
NT$bn
Foreign currency LDR
1,065 1,117
391 456
Note: Ending balance
83.0% 83.5%
Jun-15 Jun-16
68.4%
48.5%
Jun-15 Jun-16
0.0%
0.2%
0.4%
0.6%
0.8%
Jun-13 Jun-14 Jun-15 Jun-16
Corporate loan Mortgage loan
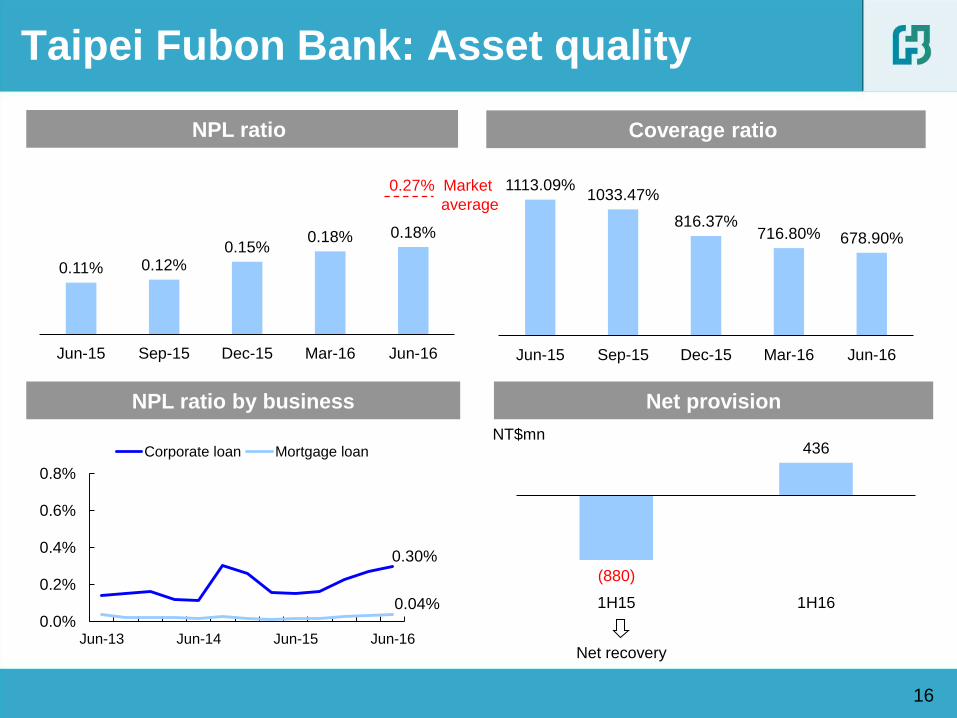
0.11% 0.12% 0.15%
0.18% 0.18%
Jun-15 Sep-15 Dec-15 Mar-16 Jun-16
(880)
436
1H15 1H16
16
Taipei Fubon Bank: Asset quality
NPL ratio
NPL ratio by business Net provision
Coverage ratio
0.30%
0.04%
NT$mn
Net recovery
0.27% Market
average
1113.09% 1033.47%
816.37% 716.80% 678.90%
Jun-15 Sep-15 Dec-15 Mar-16 Jun-16
17
Performance review by subsidiary
• Fubon Life
• Fubon Securities
Performance highlights of Fubon Financial Holdings
• Fubon Insurance
Agenda
• Taipei Fubon Bank
• Overseas banking operation
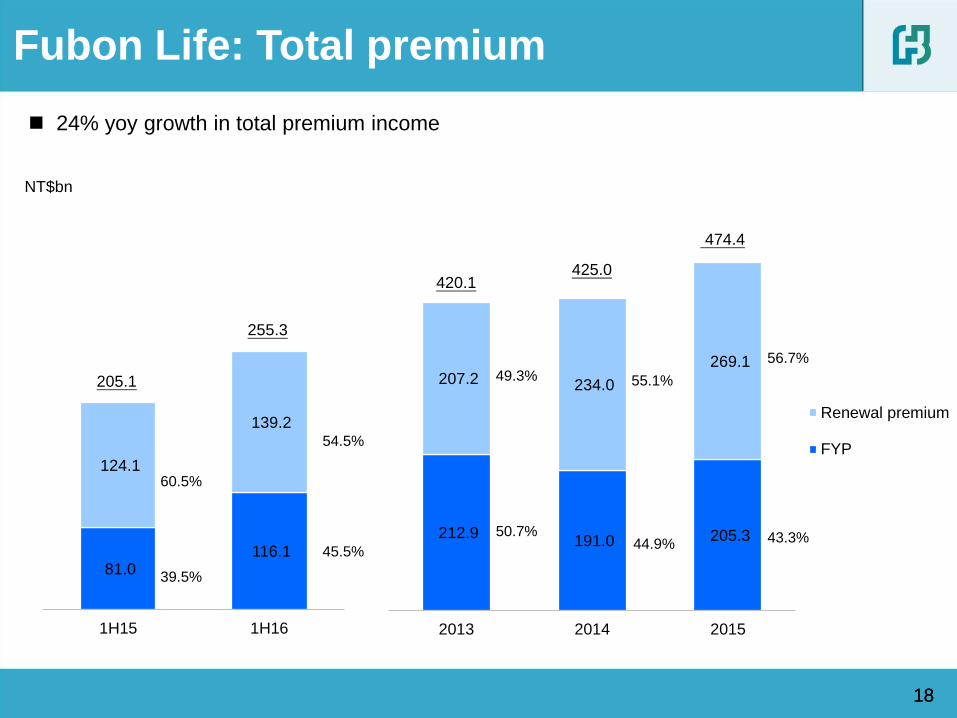
81.0 116.1
124.1
139.2
1H15 1H16
24% yoy growth in total premium income
18 18
NT$bn
Fubon Life: Total premium
420.1 425.0
474.4
56.7%
43.3%
55.1%
44.9%
49.3%
50.7%
205.1
255.3
54.5%
45.5%
60.5%
39.5%
212.9 191.0 205.3
207.2 234.0
269.1
2013 2014 2015
Renewal premium
FYP
FYP composition
19
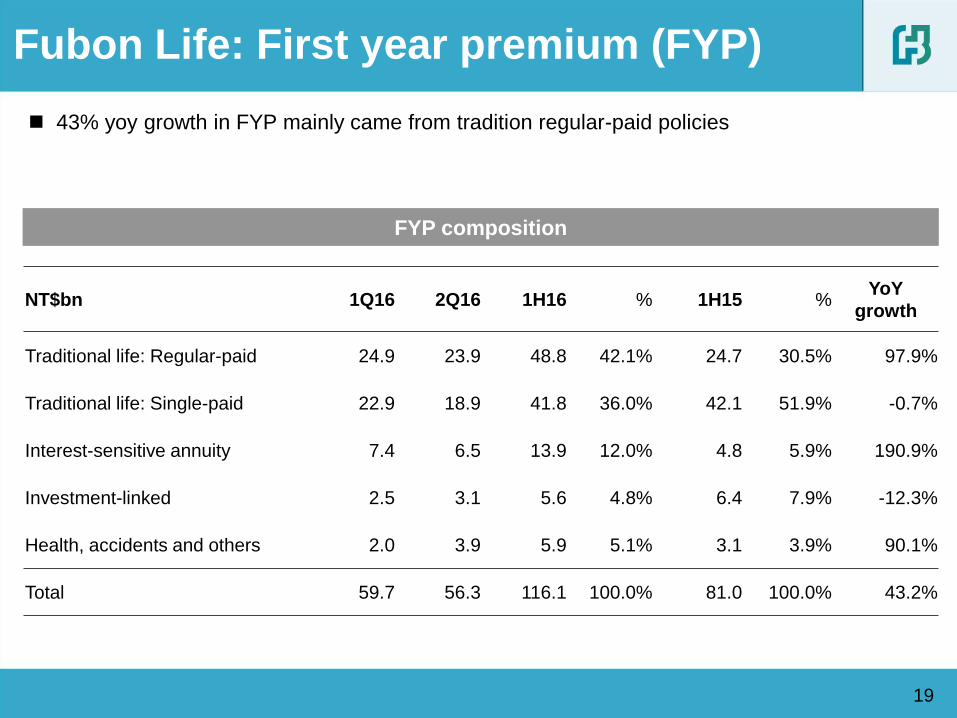
Fubon Life: First year premium (FYP)
43% yoy growth in FYP mainly came from tradition regular-paid policies
NT$bn 1Q16 2Q16 1H16 % 1H15 % YoY
growth
Traditional life: Regular-paid 24.9 23.9 48.8 42.1% 24.7 30.5% 97.9%
Traditional life: Single-paid 22.9 18.9 41.8 36.0% 42.1 51.9% -0.7%
Interest-sensitive annuity 7.4 6.5 13.9 12.0% 4.8 5.9% 190.9%
Investment-linked 2.5 3.1 5.6 4.8% 6.4 7.9% -12.3%
Health, accidents and others 2.0 3.9 5.9 5.1% 3.1 3.9% 90.1%
Total 59.7 56.3 116.1 100.0% 81.0 100.0% 43.2%
9.1% 10.1% 1.7% 2.4%
2.4% 1.0% 14.6%
7.1%
72.2%
79.4%
1H15 1H16
Traditional life:Regular-paid
Traditional life:Single-paid
Investment-linked
Interest-sensitiveannuity
Health, accidentsand others
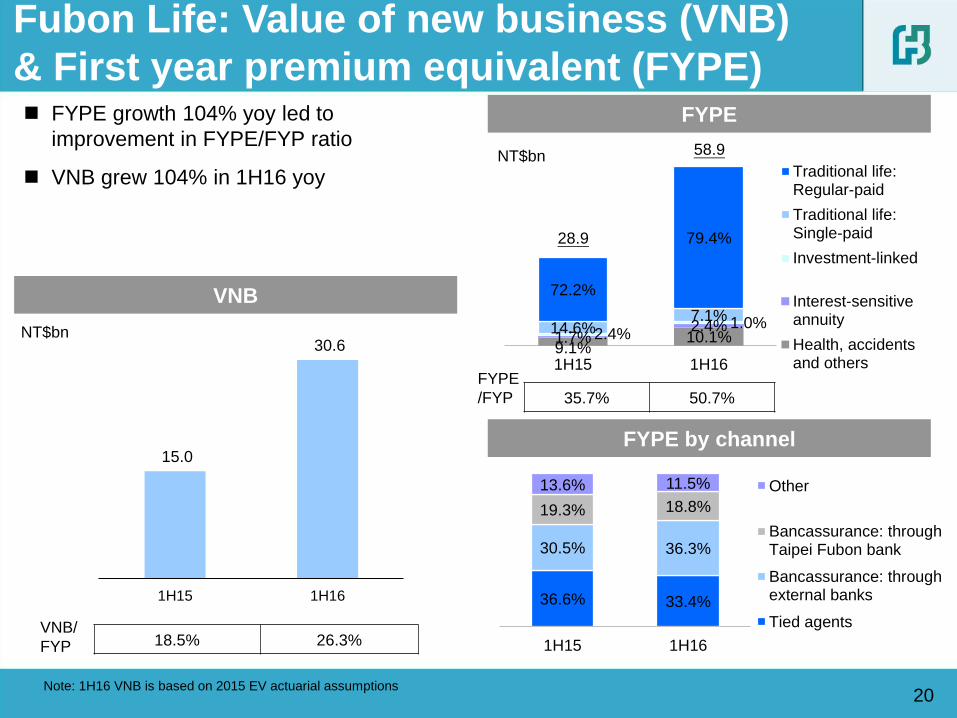
FYPE growth 104% yoy led to
improvement in FYPE/FYP ratio
VNB grew 104% in 1H16 yoy
20
Fubon Life: Value of new business (VNB)
& First year premium equivalent (FYPE)
FYPE
/FYP
NT$bn
28.9
58.9
35.7% 50.7%
VNB
FYPE
NT$bn
Note: 1H16 VNB is based on 2015 EV actuarial assumptions
FYPE by channel
VNB/
FYP 18.5% 26.3%
36.6% 33.4%
30.5% 36.3%
19.3% 18.8%
13.6% 11.5%
1H15 1H16
Other
Bancassurance: throughTaipei Fubon bank
Bancassurance: throughexternal banks
Tied agents
15.0
30.6
1H15 1H16
21 21
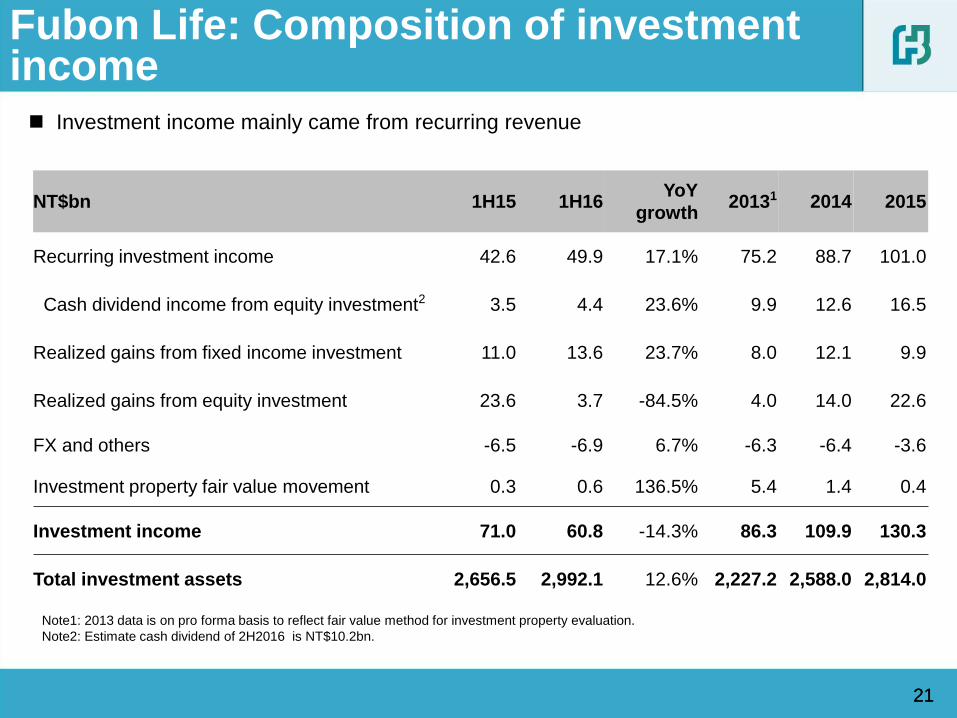
Investment income mainly came from recurring revenue
Fubon Life: Composition of investment income
Note1: 2013 data is on pro forma basis to reflect fair value method for investment property evaluation.
Note2: Estimate cash dividend of 2H2016 is NT$10.2bn.
NT$bn 1H15 1H16 YoY
growth 20131 2014 2015
Recurring investment income 42.6 49.9 17.1% 75.2 88.7 101.0
Cash dividend income from equity investment2 3.5 4.4 23.6% 9.9 12.6 16.5
Realized gains from fixed income investment 11.0 13.6 23.7% 8.0 12.1 9.9
Realized gains from equity investment 23.6 3.7 -84.5% 4.0 14.0 22.6
FX and others -6.5 -6.9 6.7% -6.3 -6.4 -3.6
Investment property fair value movement 0.3 0.6 136.5% 5.4 1.4 0.4
Investment income 71.0 60.8 -14.3% 86.3 109.9 130.3
Total investment assets 2,656.5 2,992.1 12.6% 2,227.2 2,588.0 2,814.0
22 22
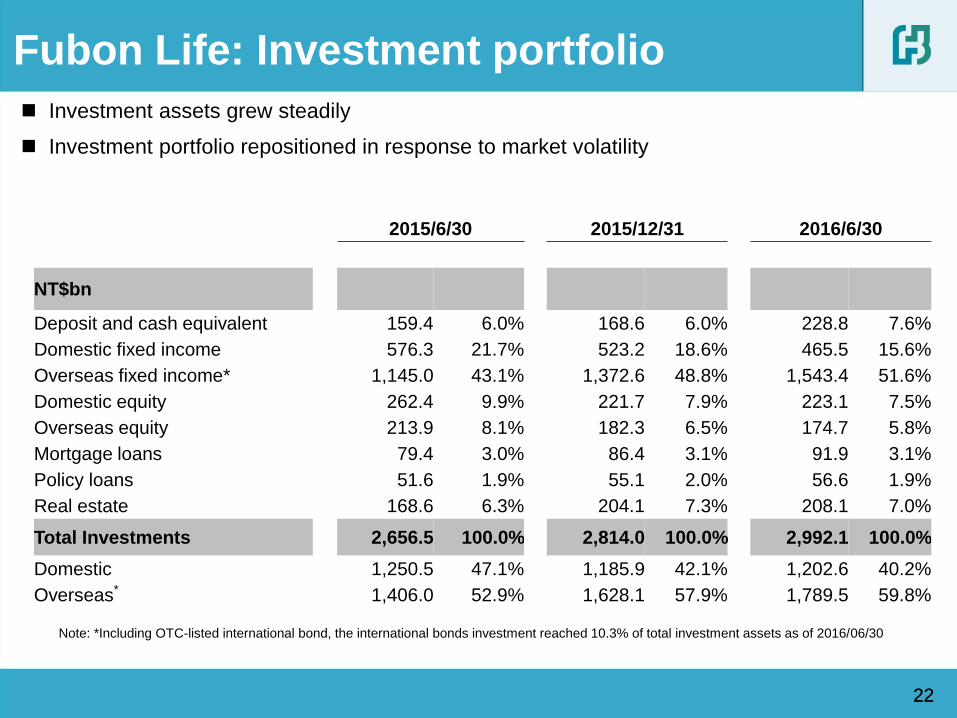
Investment assets grew steadily
Investment portfolio repositioned in response to market volatility
Fubon Life: Investment portfolio
Note: *Including OTC-listed international bond, the international bonds investment reached 10.3% of total investment assets as of 2016/06/30
2015/6/30 2015/12/31 2016/6/30
NT$bn
Deposit and cash equivalent 159.4 6.0% 168.6 6.0% 228.8 7.6%
Domestic fixed income 576.3 21.7% 523.2 18.6% 465.5 15.6%
Overseas fixed income* 1,145.0 43.1% 1,372.6 48.8% 1,543.4 51.6%
Domestic equity 262.4 9.9% 221.7 7.9% 223.1 7.5%
Overseas equity 213.9 8.1% 182.3 6.5% 174.7 5.8%
Mortgage loans 79.4 3.0% 86.4 3.1% 91.9 3.1%
Policy loans 51.6 1.9% 55.1 2.0% 56.6 1.9%
Real estate 168.6 6.3% 204.1 7.3% 208.1 7.0%
Total Investments 2,656.5 100.0% 2,814.0 100.0% 2,992.1 100.0%
Domestic 1,250.5 47.1% 1,185.9 42.1% 1,202.6 40.2%
Overseas* 1,406.0 52.9% 1,628.1 57.9% 1,789.5 59.8%
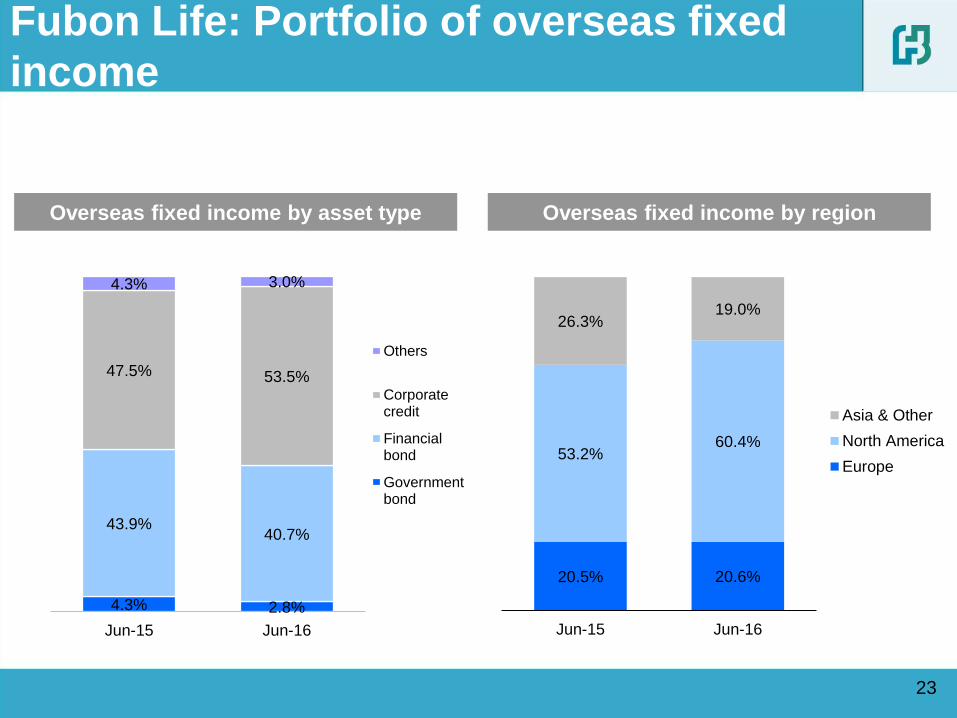
23
Fubon Life: Portfolio of overseas fixed
income
Overseas fixed income by region Overseas fixed income by asset type
4.3% 2.8%
43.9% 40.7%
47.5% 53.5%
4.3% 3.0%
Jun-15 Jun-16
Others
Corporatecredit
Financialbond
Governmentbond
20.5% 20.6%
53.2% 60.4%
26.3% 19.0%
Jun-15 Jun-16
Asia & Other
North America
Europe
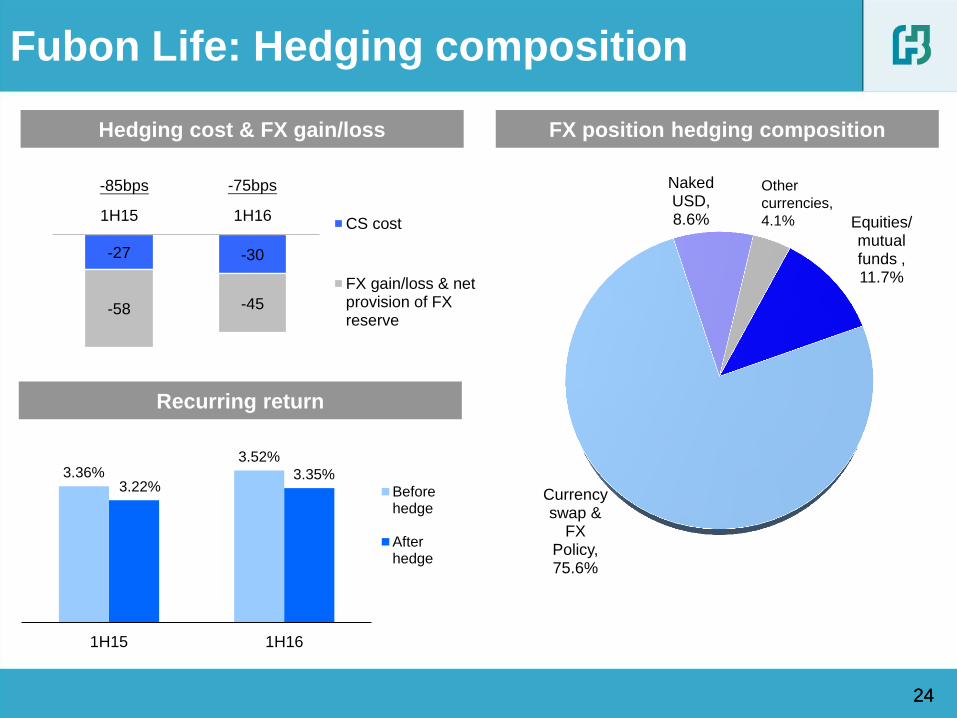
24 24
Hedging cost & FX gain/loss FX position hedging composition
Recurring return
Fubon Life: Hedging composition
-85bps -75bps
3.36% 3.52%
3.22% 3.35%
1H15 1H16
Beforehedge
Afterhedge
-27 -30
-58 -45
1H15 1H16CS cost
FX gain/loss & netprovision of FXreserve
Currency swap &
FX Policy, 75.6%
Naked USD, 8.6% Equities/
mutual funds , 11.7%
Other
currencies,
4.1%
25 25
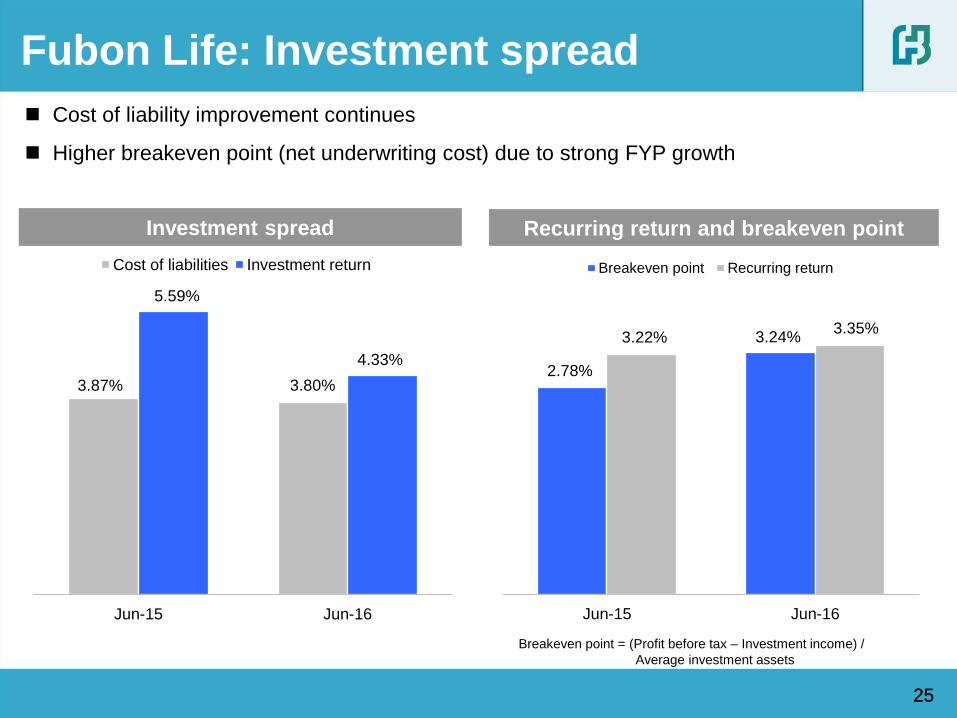
Fubon Life: Investment spread
Cost of liability improvement continues
Higher breakeven point (net underwriting cost) due to strong FYP growth
Breakeven point = (Profit before tax – Investment income) /
Average investment assets
Investment spread Recurring return and breakeven point
2.78%
3.24% 3.22% 3.35%
Jun-15 Jun-16
Breakeven point Recurring return
3.87% 3.80%
5.59%
4.33%
Jun-15 Jun-16
Cost of liabilities Investment return
7.4
16.9
17.8
8.3
Mar-16 Jun-16
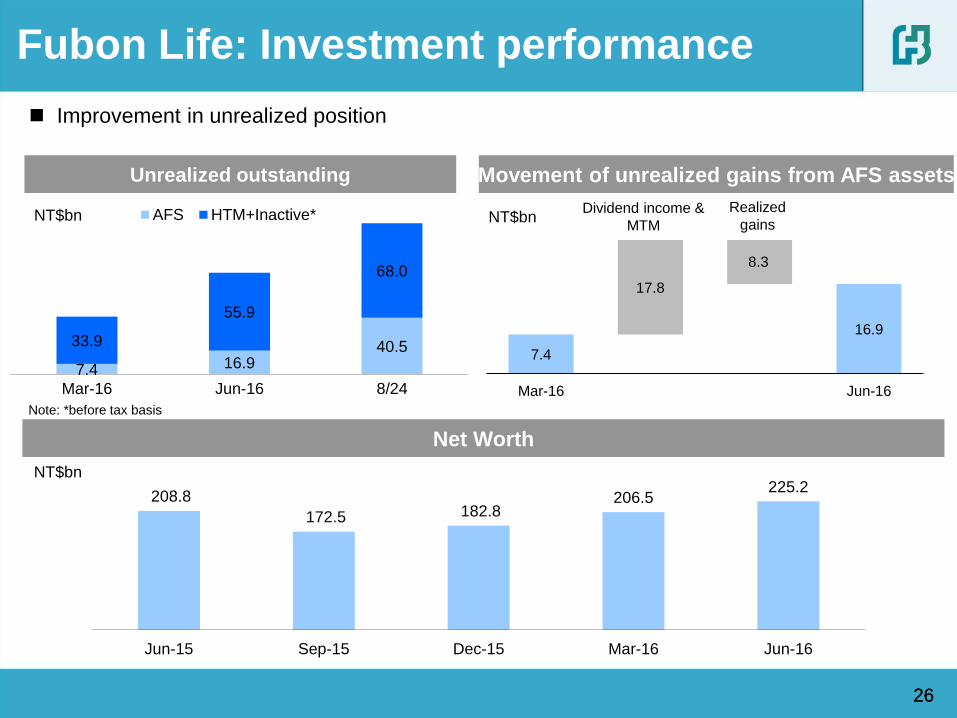
26 26
Net Worth
Unrealized outstanding
Fubon Life: Investment performance
Improvement in unrealized position
NT$bn NT$bn Realized
gains Dividend income &
MTM
Movement of unrealized gains from AFS assets
Note: *before tax basis
208.8
172.5 182.8 206.5
225.2
Jun-15 Sep-15 Dec-15 Mar-16 Jun-16
NT$bn
7.4 16.9 40.5 33.9
55.9
68.0
Mar-16 Jun-16 8/24
AFS HTM+Inactive*

27
Performance review by subsidiary
• Fubon Life
• Fubon Securities
Performance highlights of Fubon Financial Holdings
• Fubon Insurance
Agenda
• Taipei Fubon Bank
• Overseas banking operation
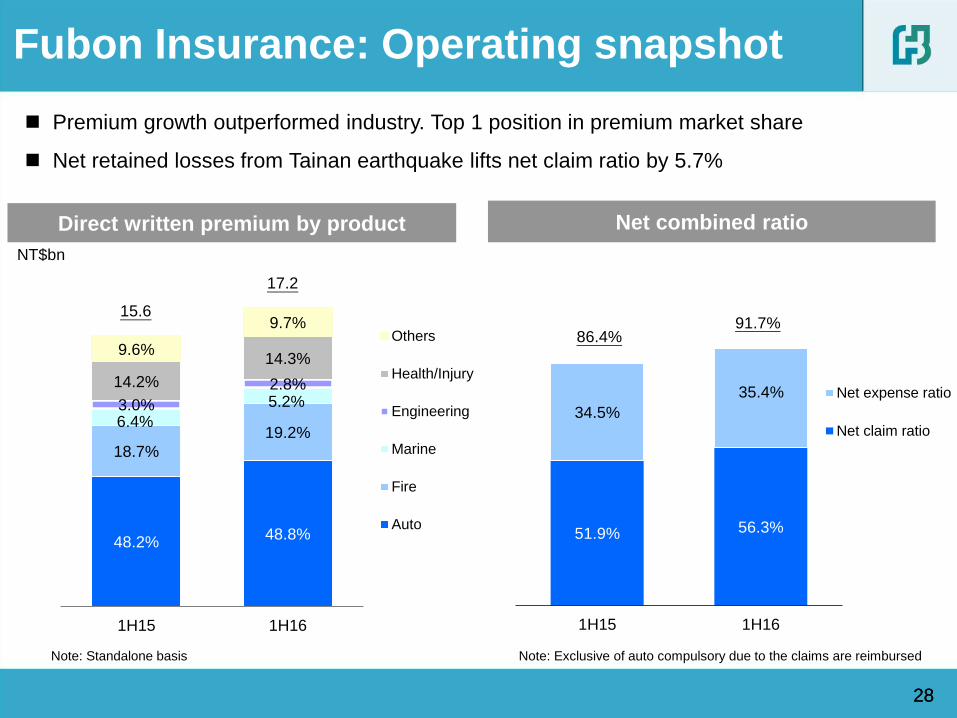
48.2% 48.8%
18.7%
19.2% 6.4%
5.2% 3.0%
2.8% 14.2%
14.3% 9.6%
9.7%
1H15 1H16
Others
Health/Injury
Engineering
Marine
Fire
Auto51.9% 56.3%
34.5%
35.4%
1H15 1H16
Net expense ratio
Net claim ratio
28
Net combined ratio
28
NT$bn
Premium growth outperformed industry. Top 1 position in premium market share
Net retained losses from Tainan earthquake lifts net claim ratio by 5.7%
Note: Standalone basis Note: Exclusive of auto compulsory due to the claims are reimbursed
Fubon Insurance: Operating snapshot
Direct written premium by product
15.6
17.2
91.7% 86.4%
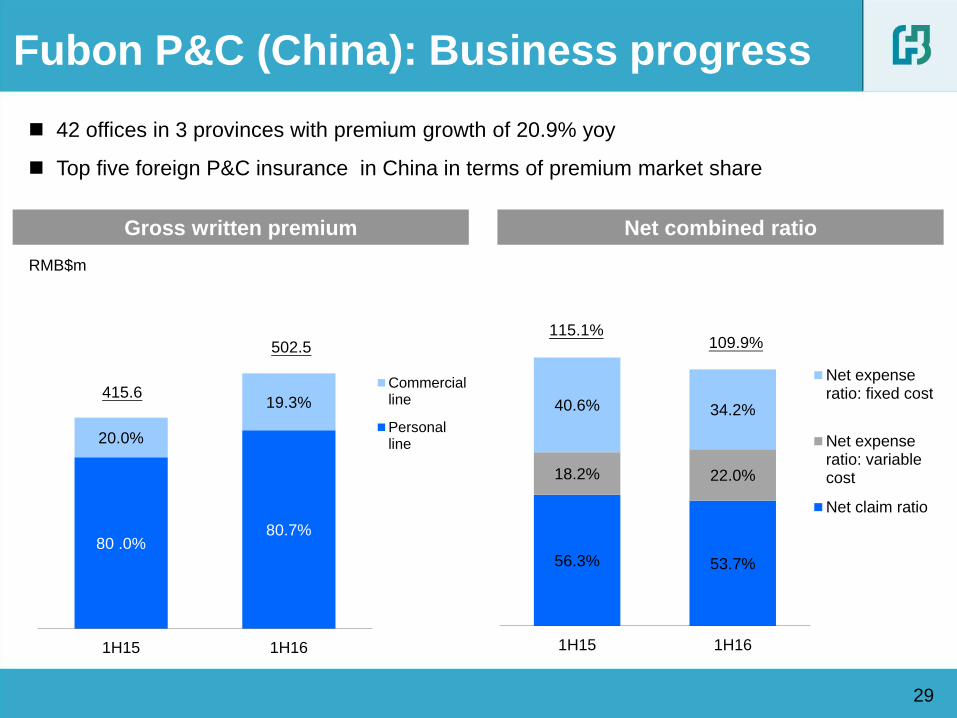
Fubon P&C (China): Business progress
Net combined ratio Gross written premium
29
42 offices in 3 provinces with premium growth of 20.9% yoy
Top five foreign P&C insurance in China in terms of premium market share
80 .0% 80.7%
20.0%
19.3%
1H15 1H16
RMB$m
Commercialline
Personalline
502.5
415.6
56.3% 53.7%
18.2% 22.0%
40.6% 34.2%
1H15 1H16
Net expenseratio: fixed cost
Net expenseratio: variablecost
Net claim ratio
109.9% 115.1%
30
Performance review by subsidiary
• Fubon Life
• Fubon Securities
Performance highlights of Fubon Financial Holdings
• Fubon Insurance
Agenda
• Taipei Fubon Bank
• Overseas banking operation
31
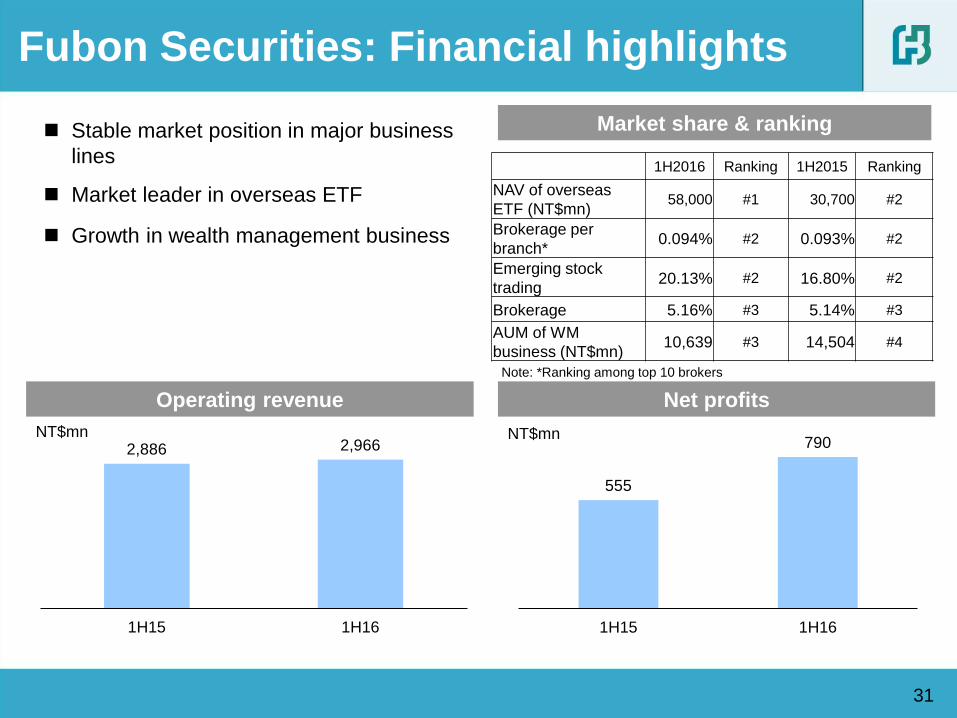
Fubon Securities: Financial highlights
Market share & ranking
Operating revenue
NT$mn
Stable market position in major business
lines
Market leader in overseas ETF
Growth in wealth management business
Net profits
NT$mn
1H2016 Ranking 1H2015 Ranking
NAV of overseas
ETF (NT$mn) 58,000 #1 30,700 #2
Brokerage per
branch* 0.094% #2 0.093% #2
Emerging stock
trading 20.13% #2 16.80% #2
Brokerage 5.16% #3 5.14% #3
AUM of WM
business (NT$mn) 10,639 #3 14,504 #4
Note: *Ranking among top 10 brokers
2,886 2,966
1H15 1H16
555
790
1H15 1H16
32
Performance review by subsidiary
• Fubon Life
• Fubon Securities
Performance highlights of Fubon Financial Holdings
• Fubon Insurance
Agenda
• Taipei Fubon Bank
• Overseas banking operation
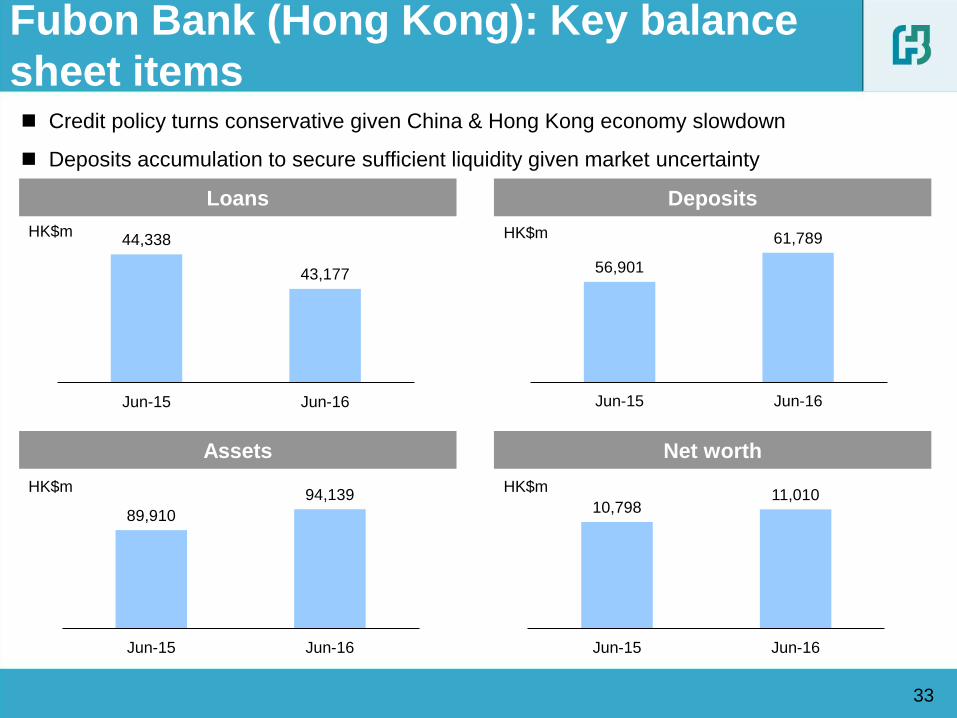
44,338
43,177
Jun-15 Jun-16
33
Fubon Bank (Hong Kong): Key balance
sheet items
Assets
Deposits Loans
Net worth
HK$m
Credit policy turns conservative given China & Hong Kong economy slowdown
Deposits accumulation to secure sufficient liquidity given market uncertainty
56,901
61,789
Jun-15 Jun-16
89,910
94,139
Jun-15 Jun-16
10,798 11,010
Jun-15 Jun-16
HK$m
HK$m
HK$m
34
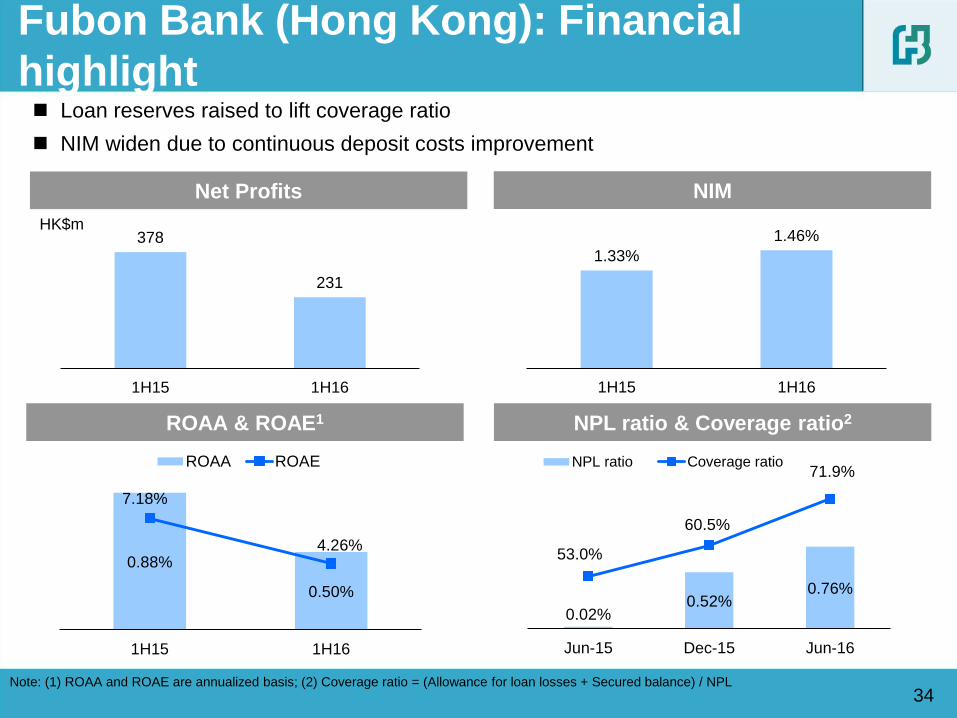
Fubon Bank (Hong Kong): Financial
highlight
ROAA & ROAE1
NIM Net Profits
NPL ratio & Coverage ratio2
HK$m
Loan reserves raised to lift coverage ratio
NIM widen due to continuous deposit costs improvement
Note: (1) ROAA and ROAE are annualized basis; (2) Coverage ratio = (Allowance for loan losses + Secured balance) / NPL
1.33%
1.46%
1H15 1H16
378
231
1H15 1H16
0.88%
0.50%
7.18%
4.26%
1H15 1H16
ROAA ROAE
0.02% 0.52%
0.76%
53.0%
60.5%
71.9%
Jun-15 Dec-15 Jun-16
NPL ratio Coverage ratio
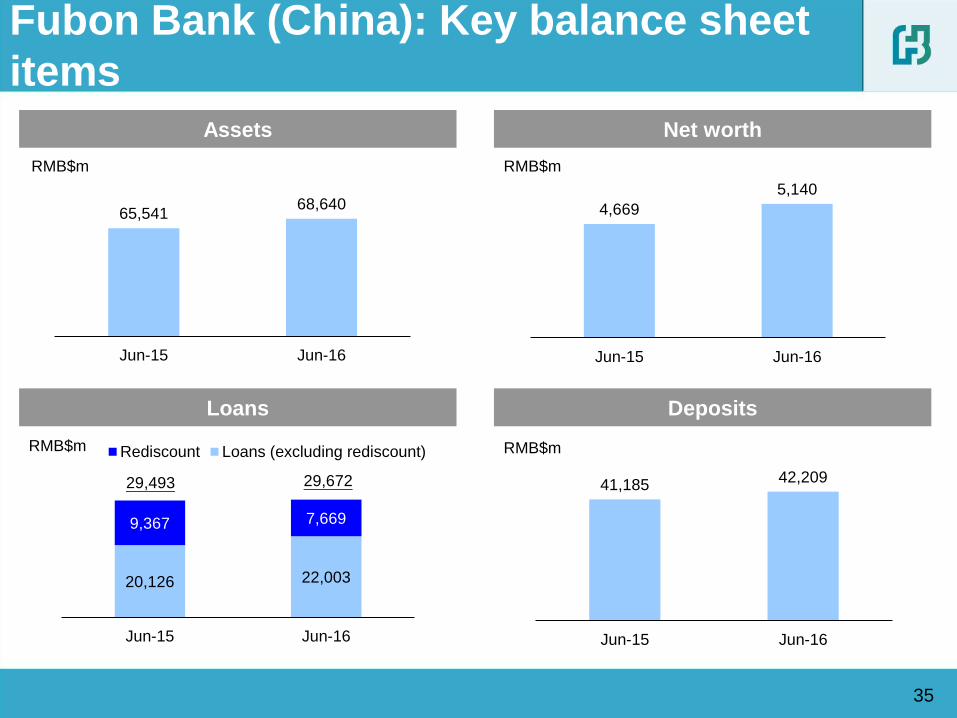
20,126 22,003
9,367 7,669
Jun-15 Jun-16
Rediscount Loans (excluding rediscount)
35
Fubon Bank (China): Key balance sheet
items
Assets Net worth
Deposits Loans
RMB$m
29,672 29,493
RMB$m RMB$m
RMB$m
41,185 42,209
Jun-15 Jun-16
4,669
5,140
Jun-15 Jun-16
65,541 68,640
Jun-15 Jun-16
36
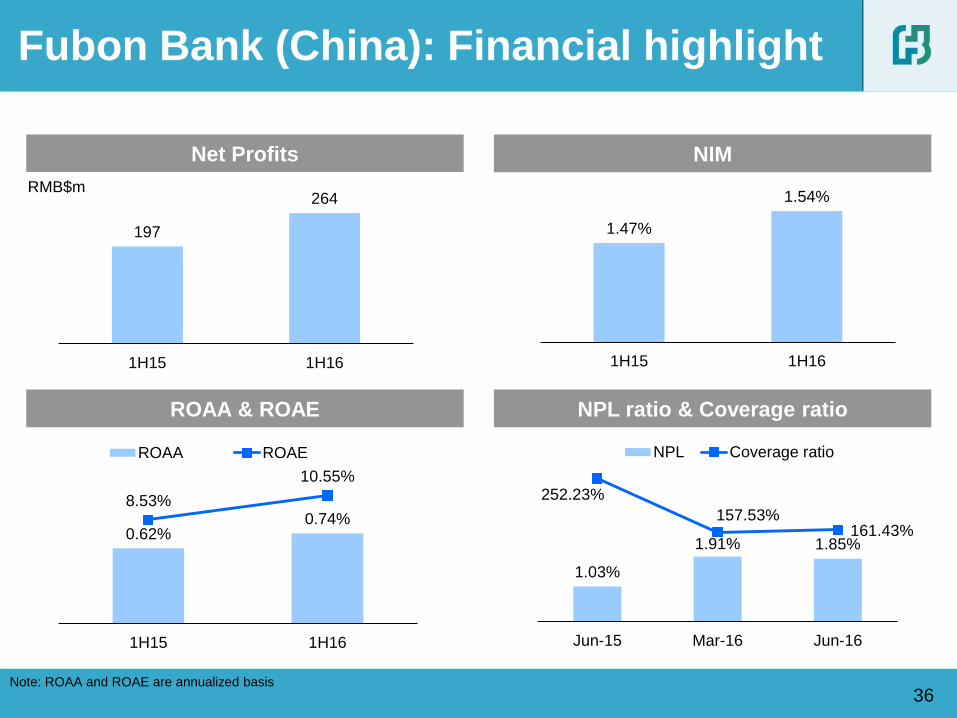
Fubon Bank (China): Financial highlight
ROAA & ROAE
NIM Net Profits
NPL ratio & Coverage ratio
RMB$m
197
264
1H15 1H16
1.47%
1.54%
1H15 1H16
0.62% 0.74%
8.53%
10.55%
1H15 1H16
ROAA ROAE
1.03%
1.91% 1.85%
252.23%
157.53% 161.43%
Jun-15 Mar-16 Jun-16
NPL Coverage ratio
Note: ROAA and ROAE are annualized basis

Thank you
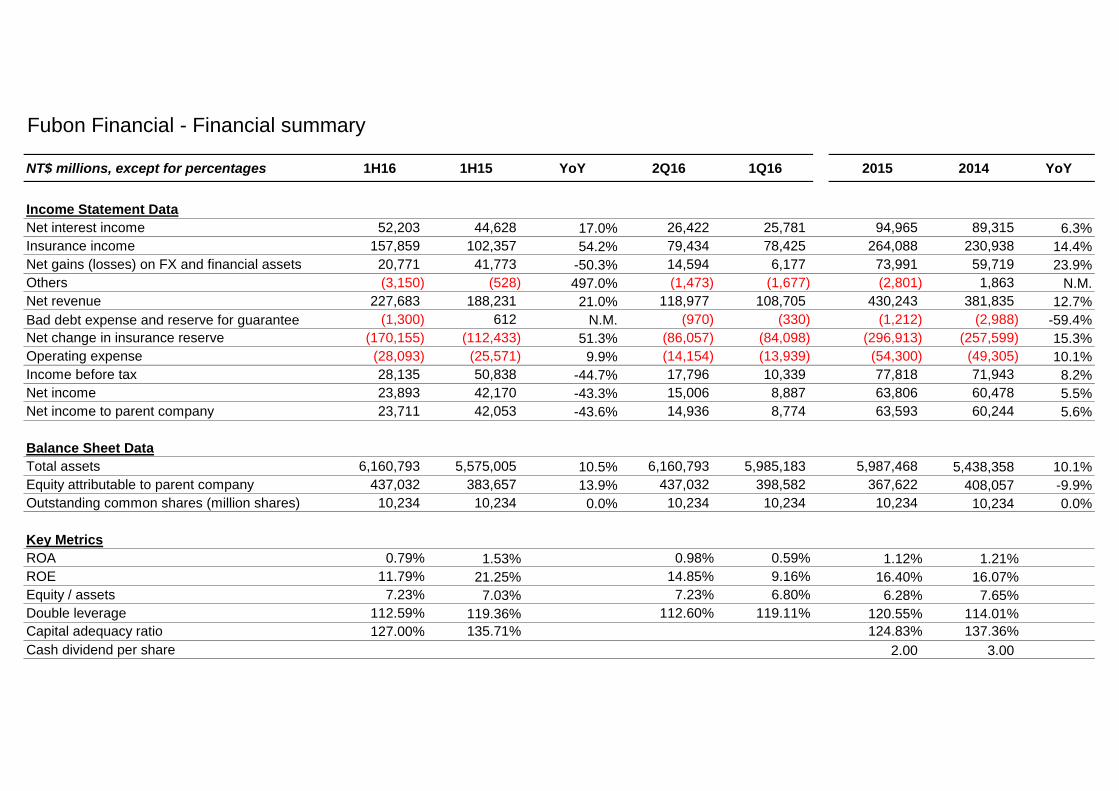
Fubon Financial - Financial summary
NT$ millions, except for percentages 1H16 1H15 YoY 2Q16 1Q16 2015 2014 YoY
Income Statement Data
Net interest income 52,203 44,628 17.0% 26,422 25,781 94,965 89,315 6.3%
Insurance income 157,859 102,357 54.2% 79,434 78,425 264,088 230,938 14.4%
Net gains (losses) on FX and financial assets 20,771 41,773 -50.3% 14,594 6,177 73,991 59,719 23.9%
Others (3,150) (528) 497.0% (1,473) (1,677) (2,801) 1,863 N.M.
Net revenue 227,683 188,231 21.0% 118,977 108,705 430,243 381,835 12.7%
Bad debt expense and reserve for guarantee (1,300) 612 N.M. (970) (330) (1,212) (2,988) -59.4%
Net change in insurance reserve (170,155) (112,433) 51.3% (86,057) (84,098) (296,913) (257,599) 15.3%
Operating expense (28,093) (25,571) 9.9% (14,154) (13,939) (54,300) (49,305) 10.1%
Income before tax 28,135 50,838 -44.7% 17,796 10,339 77,818 71,943 8.2%
Net income 23,893 42,170 -43.3% 15,006 8,887 63,806 60,478 5.5%
Net income to parent company 23,711 42,053 -43.6% 14,936 8,774 63,593 60,244 5.6%
Balance Sheet Data
Total assets 6,160,793 5,575,005 10.5% 6,160,793 5,985,183 5,987,468 5,438,358 10.1%
Equity attributable to parent company 437,032 383,657 13.9% 437,032 398,582 367,622 408,057 -9.9%
Outstanding common shares (million shares) 10,234 10,234 0.0% 10,234 10,234 10,234 10,234 0.0%
Key Metrics
ROA 0.79% 1.53% 0.98% 0.59% 1.12% 1.21%
ROE 11.79% 21.25% 14.85% 9.16% 16.40% 16.07%
Equity / assets 7.23% 7.03% 7.23% 6.80% 6.28% 7.65%
Double leverage 112.59% 119.36% 112.60% 119.11% 120.55% 114.01%
Capital adequacy ratio 127.00% 135.71% 124.83% 137.36%
Cash dividend per share 2.00 3.00
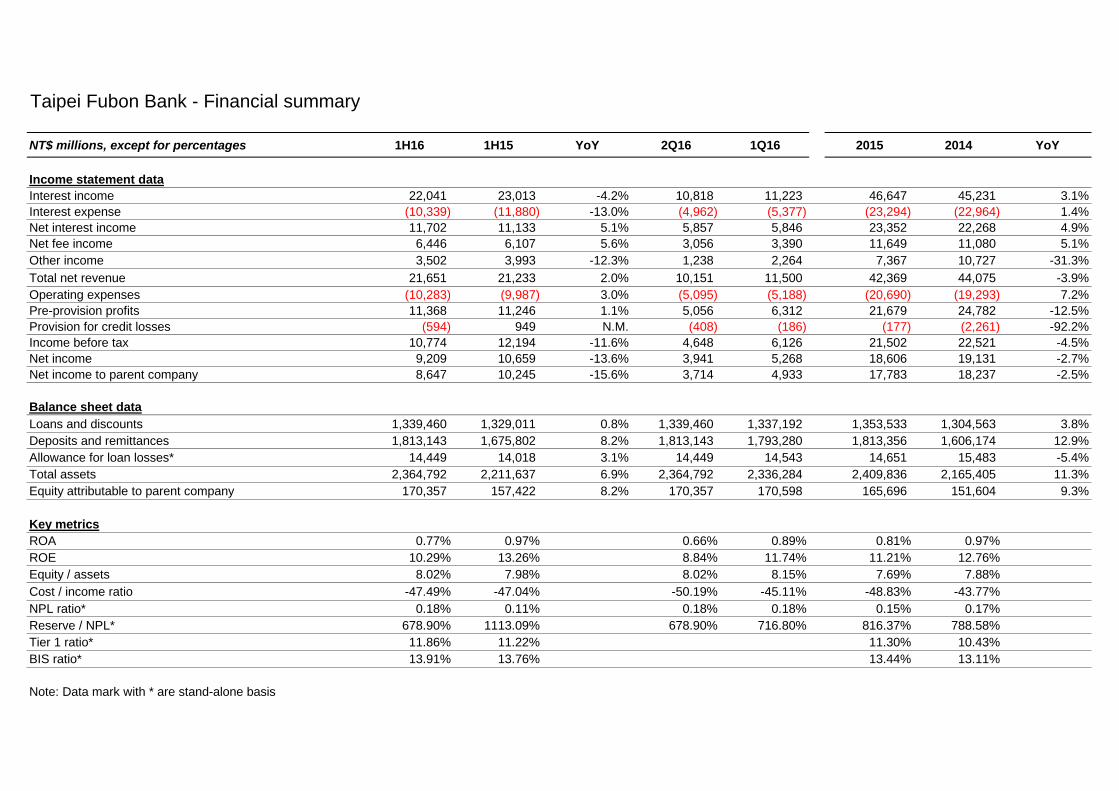
Taipei Fubon Bank - Financial summary
NT$ millions, except for percentages 1H16 1H15 YoY 2Q16 1Q16 2015 2014 YoY
Income statement data
Interest income 22,041 23,013 -4.2% 10,818 11,223 46,647 45,231 3.1%
Interest expense (10,339) (11,880) -13.0% (4,962) (5,377) (23,294) (22,964) 1.4%
Net interest income 11,702 11,133 5.1% 5,857 5,846 23,352 22,268 4.9%
Net fee income 6,446 6,107 5.6% 3,056 3,390 11,649 11,080 5.1%
Other income 3,502 3,993 -12.3% 1,238 2,264 7,367 10,727 -31.3%
Total net revenue 21,651 21,233 2.0% 10,151 11,500 42,369 44,075 -3.9%
Operating expenses (10,283) (9,987) 3.0% (5,095) (5,188) (20,690) (19,293) 7.2%
Pre-provision profits 11,368 11,246 1.1% 5,056 6,312 21,679 24,782 -12.5%
Provision for credit losses (594) 949 N.M. (408) (186) (177) (2,261) -92.2%
Income before tax 10,774 12,194 -11.6% 4,648 6,126 21,502 22,521 -4.5%
Net income 9,209 10,659 -13.6% 3,941 5,268 18,606 19,131 -2.7%
Net income to parent company 8,647 10,245 -15.6% 3,714 4,933 17,783 18,237 -2.5%
Balance sheet data
Loans and discounts 1,339,460 1,329,011 0.8% 1,339,460 1,337,192 1,353,533 1,304,563 3.8%
Deposits and remittances 1,813,143 1,675,802 8.2% 1,813,143 1,793,280 1,813,356 1,606,174 12.9%
Allowance for loan losses* 14,449 14,018 3.1% 14,449 14,543 14,651 15,483 -5.4%
Total assets 2,364,792 2,211,637 6.9% 2,364,792 2,336,284 2,409,836 2,165,405 11.3%
Equity attributable to parent company 170,357 157,422 8.2% 170,357 170,598 165,696 151,604 9.3%
Key metrics
ROA 0.77% 0.97% 0.66% 0.89% 0.81% 0.97%
ROE 10.29% 13.26% 8.84% 11.74% 11.21% 12.76%
Equity / assets 8.02% 7.98% 8.02% 8.15% 7.69% 7.88%
Cost / income ratio -47.49% -47.04% -50.19% -45.11% -48.83% -43.77%
NPL ratio* 0.18% 0.11% 0.18% 0.18% 0.15% 0.17%
Reserve / NPL* 678.90% 1113.09% 678.90% 716.80% 816.37% 788.58%
Tier 1 ratio* 11.86% 11.22% 11.30% 10.43%
BIS ratio* 13.91% 13.76% 13.44% 13.11%
Note: Data mark with * are stand-alone basis
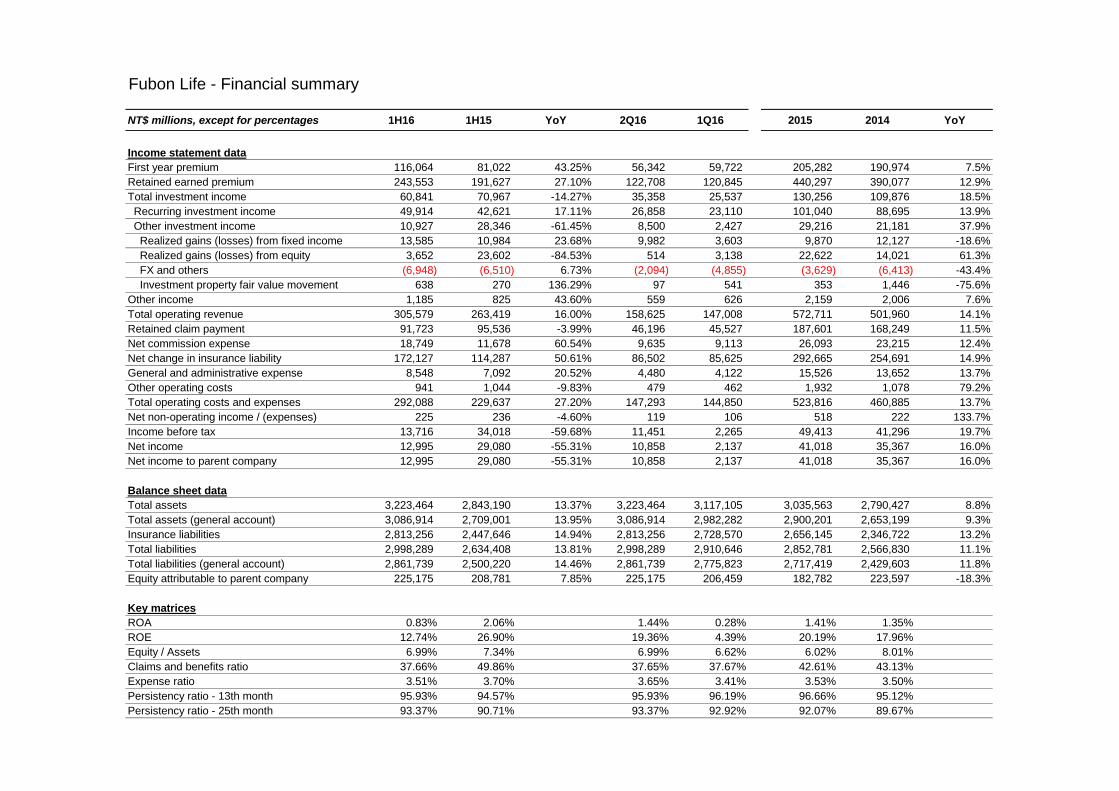
Fubon Life - Financial summary
NT$ millions, except for percentages 1H16 1H15 YoY 2Q16 1Q16 2015 2014 YoY
Income statement data
First year premium 116,064 81,022 43.25% 56,342 59,722 205,282 190,974 7.5%
Retained earned premium 243,553 191,627 27.10% 122,708 120,845 440,297 390,077 12.9%
Total investment income 60,841 70,967 -14.27% 35,358 25,537 130,256 109,876 18.5%
Recurring investment income 49,914 42,621 17.11% 26,858 23,110 101,040 88,695 13.9%
Other investment income 10,927 28,346 -61.45% 8,500 2,427 29,216 21,181 37.9%
Realized gains (losses) from fixed income 13,585 10,984 23.68% 9,982 3,603 9,870 12,127 -18.6%
Realized gains (losses) from equity 3,652 23,602 -84.53% 514 3,138 22,622 14,021 61.3%
FX and others (6,948) (6,510) 6.73% (2,094) (4,855) (3,629) (6,413) -43.4%
Investment property fair value movement 638 270 136.29% 97 541 353 1,446 -75.6%
Other income 1,185 825 43.60% 559 626 2,159 2,006 7.6%
Total operating revenue 305,579 263,419 16.00% 158,625 147,008 572,711 501,960 14.1%
Retained claim payment 91,723 95,536 -3.99% 46,196 45,527 187,601 168,249 11.5%
Net commission expense 18,749 11,678 60.54% 9,635 9,113 26,093 23,215 12.4%
Net change in insurance liability 172,127 114,287 50.61% 86,502 85,625 292,665 254,691 14.9%
General and administrative expense 8,548 7,092 20.52% 4,480 4,122 15,526 13,652 13.7%
Other operating costs 941 1,044 -9.83% 479 462 1,932 1,078 79.2%
Total operating costs and expenses 292,088 229,637 27.20% 147,293 144,850 523,816 460,885 13.7%
Net non-operating income / (expenses) 225 236 -4.60% 119 106 518 222 133.7%
Income before tax 13,716 34,018 -59.68% 11,451 2,265 49,413 41,296 19.7%
Net income 12,995 29,080 -55.31% 10,858 2,137 41,018 35,367 16.0%
Net income to parent company 12,995 29,080 -55.31% 10,858 2,137 41,018 35,367 16.0%
Balance sheet data
Total assets 3,223,464 2,843,190 13.37% 3,223,464 3,117,105 3,035,563 2,790,427 8.8%
Total assets (general account) 3,086,914 2,709,001 13.95% 3,086,914 2,982,282 2,900,201 2,653,199 9.3%
Insurance liabilities 2,813,256 2,447,646 14.94% 2,813,256 2,728,570 2,656,145 2,346,722 13.2%
Total liabilities 2,998,289 2,634,408 13.81% 2,998,289 2,910,646 2,852,781 2,566,830 11.1%
Total liabilities (general account) 2,861,739 2,500,220 14.46% 2,861,739 2,775,823 2,717,419 2,429,603 11.8%
Equity attributable to parent company 225,175 208,781 7.85% 225,175 206,459 182,782 223,597 -18.3%
Key matrices
ROA 0.83% 2.06% 1.44% 0.28% 1.41% 1.35%
ROE 12.74% 26.90% 19.36% 4.39% 20.19% 17.96%
Equity / Assets 6.99% 7.34% 6.99% 6.62% 6.02% 8.01%
Claims and benefits ratio 37.66% 49.86% 37.65% 37.67% 42.61% 43.13%
Expense ratio 3.51% 3.70% 3.65% 3.41% 3.53% 3.50%
Persistency ratio - 13th month 95.93% 94.57% 95.93% 96.19% 96.66% 95.12%
Persistency ratio - 25th month 93.37% 90.71% 93.37% 92.92% 92.07% 89.67%

Fubon Insurance - Financial summary
NT$ millions, except for percentages 1H16 1H15 YoY 2Q16 1Q16 2015 2014 YoY
Income statement data
Direct written premiums 19,627 17,690 10.9% 10,330 9,297 35,016 32,718 7.0%
Retention of earned premiums 14,516 13,283 9.3% 7,286 7,230 27,139 24,653 10.1%
Net income from investment 1,319 1,587 -16.9% 822 497 2,811 2,498 12.5%
Other operating revenue 734 601 22.1% 390 345 1,295 1,082 19.7%
Retained insurance payments 7,896 6,567 20.2% 4,063 3,833 14,250 13,128 8.5%
Net change in liability reserve 71 607 -88.2% (287) 358 656 626 4.7%
Commission and operating expenses 6,776 6,088 11.3% 3,470 3,306 12,772 11,363 12.4%
Non-Operating Income (54) (51) 5.9% (32) (22) (96) (109) -12.2%
Income before tax 1,772 2,158 -17.9% 1,219 553 3,472 3,007 15.5%
Net income 1,451 1,788 -18.8% 1,007 444 2,839 2,420 17.3%
Net income to parent company 1,594 1,945 -18.1% 1,077 516 3,213 2,816 14.1%
Balance sheet data
Total assets 97,868 87,732 11.6% 97,868 94,323 89,213 83,349 7.0%
Investment assets 64,343 61,978 3.8% 64,343 65,752 64,689 60,362 7.2%
Policy reserve 54,299 47,350 14.7% 54,299 51,580 47,470 44,930 5.7%
Equity attributable to parent company 29,542 28,829 2.5% 29,542 30,281 28,677 27,665 3.7%
Summary ratios
ROA 3.10% 4.18% 4.30% 1.94% 3.29% 2.99%
ROE 10.95% 13.77% 14.81% 7.00% 11.41% 10.06%
Total investment return 4.09% 5.19% 5.10% 3.05% 4.50% 4.21%
Solvency margin (NWP/equity) 104.62% 97.91% 107.27% 99.48% 97.95% 94.11%
Retention ratio 73.05% 75.30% 71.12% 75.19% 75.30% 76.11%
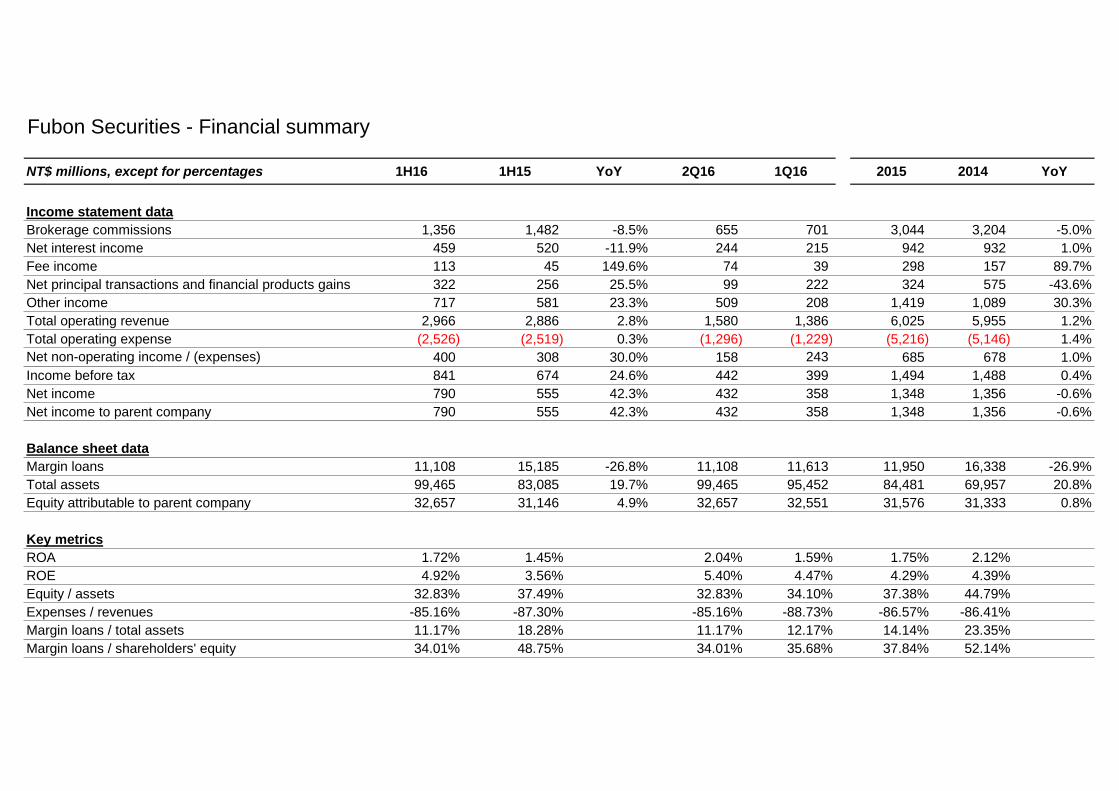
Fubon Securities - Financial summary
NT$ millions, except for percentages 1H16 1H15 YoY 2Q16 1Q16 2015 2014 YoY
Income statement data
Brokerage commissions 1,356 1,482 -8.5% 655 701 3,044 3,204 -5.0%
Net interest income 459 520 -11.9% 244 215 942 932 1.0%
Fee income 113 45 149.6% 74 39 298 157 89.7%
Net principal transactions and financial products gains 322 256 25.5% 99 222 324 575 -43.6%
Other income 717 581 23.3% 509 208 1,419 1,089 30.3%
Total operating revenue 2,966 2,886 2.8% 1,580 1,386 6,025 5,955 1.2%
Total operating expense (2,526) (2,519) 0.3% (1,296) (1,229) (5,216) (5,146) 1.4%
Net non-operating income / (expenses) 400 308 30.0% 158 243 685 678 1.0%
Income before tax 841 674 24.6% 442 399 1,494 1,488 0.4%
Net income 790 555 42.3% 432 358 1,348 1,356 -0.6%
Net income to parent company 790 555 42.3% 432 358 1,348 1,356 -0.6%
Balance sheet data
Margin loans 11,108 15,185 -26.8% 11,108 11,613 11,950 16,338 -26.9%
Total assets 99,465 83,085 19.7% 99,465 95,452 84,481 69,957 20.8%
Equity attributable to parent company 32,657 31,146 4.9% 32,657 32,551 31,576 31,333 0.8%
Key metrics
ROA 1.72% 1.45% 2.04% 1.59% 1.75% 2.12%
ROE 4.92% 3.56% 5.40% 4.47% 4.29% 4.39%
Equity / assets 32.83% 37.49% 32.83% 34.10% 37.38% 44.79%
Expenses / revenues -85.16% -87.30% -85.16% -88.73% -86.57% -86.41%
Margin loans / total assets 11.17% 18.28% 11.17% 12.17% 14.14% 23.35%
Margin loans / shareholders' equity 34.01% 48.75% 34.01% 35.68% 37.84% 52.14%

Fubon Bank (Hong Kong) - Financial Summary
HK$ millions, except for percentages 1H16 1H15 YoY 2015 2014 YoY
Income Statement Data
Interest income 936 881 6.3% 1,809 1,677 7.9%
Interest expense (370) (381) -2.9% (736) (835) -11.8%
Net interest income 566 499 13.3% 1,073 842 27.5%
Net fee income 184 198 -7.4% 353 317 11.2%
Other income 13 115 -88.4% 78 147 -47.2%
Total revenue 763 813 -6.1% 1,504 1,306 15.1%
Operating expenses (472) (455) 3.6% (1,027) (897) 14.4%
Provision for loan losses/ write-back (147) (10) 1431.2% (58) (16) 270.9%
Net non-operating income 129 101 27.3% 194 161 20.5%
Income before tax 273 449 -39.2% 613 555 10.6%
Net income 231 378 -38.8% 522 481 8.4%
Balance Sheet Data
Gross loans 43,177 44,338 -2.6% 42,570 40,368 5.5%
Customers Deposits 61,789 56,901 8.6% 58,385 52,664 10.9%
Allowance for loan losses 202 46 341.2% 75 46 63.4%
Total assets 94,139 89,910 4.7% 90,993 83,860 8.5%
Shareholders' equity 11,010 10,798 2.0% 10,806 10,416 3.7%
Key metrics
Return on average assets 0.50% 0.88% 0.60% 0.62%
Return on average equity 4.26% 7.18% 4.92% 5.18%
Equity / assets 11.69% 12.01% 11.88% 12.42%
Net fee income / total revenue 24.06% 24.39% 23.47% 24.30%
Cost / income ratio -61.84% -56.04% -68.29% -68.70%
NPL ratio 0.76% 0.02% 0.52% 0.02%
Reserve / NPL 61.76% 497.23% 33.95% 526.05%
Gross Loans/Customers Deposits ratio 69.88% 77.92% 72.91% 76.65%
Tier 1 ratio 11.92% 11.81% 11.81% 12.65%
BIS ratio 16.33% 16.58% 16.62% 17.96%
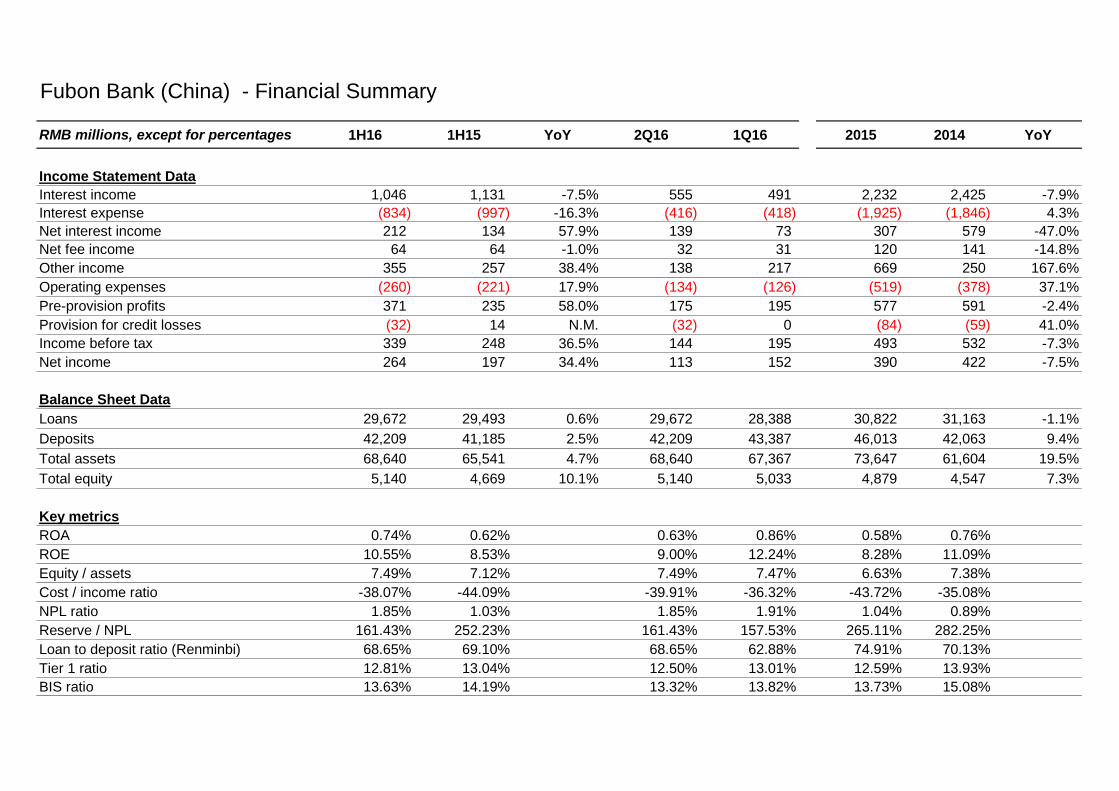
Fubon Bank (China) - Financial Summary
RMB millions, except for percentages 1H16 1H15 YoY 2Q16 1Q16 2015 2014 YoY
Income Statement Data
Interest income 1,046 1,131 -7.5% 555 491 2,232 2,425 -7.9%
Interest expense (834) (997) -16.3% (416) (418) (1,925) (1,846) 4.3%
Net interest income 212 134 57.9% 139 73 307 579 -47.0%
Net fee income 64 64 -1.0% 32 31 120 141 -14.8%
Other income 355 257 38.4% 138 217 669 250 167.6%
Operating expenses (260) (221) 17.9% (134) (126) (519) (378) 37.1%
Pre-provision profits 371 235 58.0% 175 195 577 591 -2.4%
Provision for credit losses (32) 14 N.M. (32) 0 (84) (59) 41.0%
Income before tax 339 248 36.5% 144 195 493 532 -7.3%
Net income 264 197 34.4% 113 152 390 422 -7.5%
Balance Sheet Data
Loans 29,672 29,493 0.6% 29,672 28,388 30,822 31,163 -1.1%
Deposits 42,209 41,185 2.5% 42,209 43,387 46,013 42,063 9.4%
Total assets 68,640 65,541 4.7% 68,640 67,367 73,647 61,604 19.5%
Total equity 5,140 4,669 10.1% 5,140 5,033 4,879 4,547 7.3%
Key metrics
ROA 0.74% 0.62% 0.63% 0.86% 0.58% 0.76%
ROE 10.55% 8.53% 9.00% 12.24% 8.28% 11.09%
Equity / assets 7.49% 7.12% 7.49% 7.47% 6.63% 7.38%
Cost / income ratio -38.07% -44.09% -39.91% -36.32% -43.72% -35.08%
NPL ratio 1.85% 1.03% 1.85% 1.91% 1.04% 0.89%
Reserve / NPL 161.43% 252.23% 161.43% 157.53% 265.11% 282.25%
Loan to deposit ratio (Renminbi) 68.65% 69.10% 68.65% 62.88% 74.91% 70.13%
Tier 1 ratio 12.81% 13.04% 12.50% 13.01% 12.59% 13.93%
BIS ratio 13.63% 14.19% 13.32% 13.82% 13.73% 15.08%