Embed Size (px)
Citation preview
Reactivity of the nitrogen-centered tryptophanyl radical in the catalysis of the
radical SAM enzyme NosL
Haocheng Qianzhu, Wenjuan Ji, Xinjian Ji, Leixia Chu, Chuchu Guo, Wei Ding, Jiangtao Gao,*
and Qi Zhang*
Instrumentation
High-performance liquid chromatography (HPLC) was performed using a Thermo Scientific
Dionex Ultimate 3000 system with a diode array detector equipped with a C18 column
(AccucoreXL C18, Thermo Scientific, 4.6 x 260 mm,1.8 um particle size). High resolution mass
spectrometry (HR-MS) analysis was performed using a Q-ExactiveTM Focus Hybrid Quadrupole-
Orbitrap MassSpectrometer (Thermo Fisher) equipped with a Dionex Ultimate 3000 HPLC
system (Thermo Fisher). NMR spectra were recorded using Bruker 400 MHz NMR spectrometer
at the Nuclear Magnetic Resonance Facility at Fudan University. PCR was performed on a Bio-
Rad T100TM Thermal Cycler using PrimeSTAR® HS DNA Polymerase (Takara Biotechnology Co.
Ltd, China) or Phanta Max Super-Fidelity DNA Polymerase (Vazyme Biotech Co. Ltd, China).
Chemicals and Biochemicals
All chemical reagents and anhydrous solvents were purchased from commercial sources and used
without further purification unless otherwise specified. S-adenosyl-L-methionine (SAM) were
purchased from Sangon Biotech Co. Ltd (Shanghai, China). Deuterium oxide (99.9%), L-
tryptophan methyl ester, 3-indoleethanol, 5′-chloro-5′-deoxyadenosine, and p-nitrothiophenol
were from Sigma-Aldrich Co. Ltd (USA). L-Trp, sodium dithionite, Fe(NH4)2(SO4)2•6H2O and
Na2S were from Adamas Reagent Co. Ltd (Shanghai, China). Sulfuryl chloride was from Energy
Chemical Co. Ltd (Shanghai, China).
Construction of NosL-Y90F expression plasmid
The NosL Y90F mutant was constructed using the one-step site-directed mutagenesis method.
PCR was performed by using a primer pair (5’-CCT TCG TGC CGC TCTTCA CCA CCA ACT
Electronic Supplementary Material (ESI) for ChemComm.This journal is © The Royal Society of Chemistry 2016

ACT GCG ACT CC-3’ and 5’-GTT GGT GGT GAA GAG CGG CAC GAA GGT GTG CAG
CCG GG-3’, mutation sites are underlined), and plasmid NosL-pET28a constructed previously1 as
the PCR template. PCR was performed for 30 cycles with denaturation, annealing, and extension
at 98 oC, 65 oC, and 72 oC, respectively. The PCR product (from 50 μL reaction mixture) was
purified by agarose gel, redissolved in 20μL dd H2O, and treated with 1 μL DpnI (NEB, 20,000
units/ml) at 37oC for 1 hr to digest the template DNA. 5 μL of the resulting mixture was used to
transform chemically competent E. coli DH5α cells. The cells were plated on LB-agar containing
kanamycin sulfate (50 μg/mL) for positive clones, which were confirmed by DNA sequencing.
Expression of NosL wild type and mutant enzymes
E. coli BL21 (DE3) cells were transformed via electroporation with each plasmid for protein
expression. A single colony transformant was used to inoculate a 5 mL LB culture supplemented
with 50 μg/mL kanamycin sulfate. The culture was grown at 37 °C (180 rpm) for 12 h and was
used to inoculate 1 L of LB medium containing 50 μg/mL kanamycin sulfate. Cells were grown at
37 °C and 180 rpm to an OD600 0.6-0.8, and IPTG was then added to a final concentration of 0.2
mM, and sterilized Fe(NH4)2(SO4)2 was added to a final concentration of 100 μM. After additional
18 h of incubation at 20 °C and 180 rpm, the cells were harvested by centrifugation at 5000 x g for
15 min at 4 °C. The pellet was used directly for protein purification or stored at −80 °C upon
further use.
Preparation of the reconstituted NosL and mutant enzymes
Protein purification and [4Fe-4S] reconstitution were performed in an anaerobic glove box (Coy
Laboratory Product Inc., USA) with less than 2 ppm of O2. The cell pellet was resuspended in
20ml of the lysis buffer (50 mM MOPS, 200 mM NaCl, and 10% (v/v) glycerol, pH adjusted to
8.0 by 2M NaOH), and was lysed by sonication on ice. Cell debris was removed via centrifugation
at 18, 000 x g for 30 min at 4 °C. The supernatant was incubated with 4 ml Ni-NTA resin pre-
equilibrated with the lysis buffer, and then subjected to affinity purification on a column. The
desired fractions were combined and concentrated using an Amicon Ultra-15 Centrifugal Filter

Unit and analyzed by SDS-PAGE (12%Tris-glycine gel). Protein concentration was determined
using a Bradford Assay Kit (Bio Rad) using bovine serum albumin (BSA) as a standard.
For reconstitution of the [4Fe-4S] cluster, freshly prepared dithiothreitol (DTT) was added to the
purified protein fraction to a final concentration of 5 mM. Fe(NH4)2(SO4)2 solution (50 mM) was
then added carefully to a final concentration of 500 μM. After 10 min of incubation at the room
temperature, Na2S solution (50 mM) was added in the same way to a final concentration of 500
μM. After further incubation on ice for 5-7 h, the resulting blackish solution was subjected to
desalting on a PD-10 column (GE Healthcare) pre-equilibrated with the elution buffer I (50 mM
MOPS, 25 mM NaCl, 10 mM DTT and 10% (v/v) glycerol, pH 8.0) or elution buffer II (50 mM
Tris, 25 mM NaCl, 1 mM DTT, ~1.5%(v/v) glycerol, pD~8.0, ~98% D2O). The protein
fraction was collected and concentrated, and was used directly for in vitro assay or stored at −80
°C upon further use.
Enzyme assays in highly enriched D2O
The D2O buffer (elution buffer II, 50 mM Tris, 250 mM NaCl, 10 mM DTT, ~1.5%(v/v)
glycerol, pD~8) was prepared by dissolve 60 mg (5 mM) Tris base, 15 mg (2.5 mM) NaCl, 1.5
mg (0.1 mM) DTT, and 100~200 μL glycerol in 10 ml deuterium oxide (99.9%). This buffer was
used for protein desalting with a PD-10 column (GE Healthcare). After desalting, the target
protein was concentrated, and mixed with an equal volume of elution buffer II. The resulting
protein solution was further concentrated to a protein concentration of 80~100 μM and was used
directly in biochemical analysis. By comparing with the hydroxylmethyl signal (δ = 3.38) of Tris,
the H2O concentration was estimated to be less than 2% in the resulting protein solution. A typical
assay was carried out by sequential addition of 2 μL L-Trp solution (20 mM in D2O), 2 μL SAM
solution (50 mM in D2O), 2 μL sodium dithionite solution (0.1 M in D2O) into 150 μL protein
solution. Reactions were maintained at room temperature (~25oC) for different time intervals and
were quenched by addition of trichloroacetic acid (TCA) to a final concentration of 5% (v/v).
After removal of the protein precipitates by centrifugation, the supernatant was subjected to LC-
HRMS analysis.

HPLC analysis
HPLC analysis was performed using a C18 analytic column (Accucore XL C18, Thermo
Scientific, 4.6 x 250 mm). The column was equilibrated with 85% solvent A (H2O, 0.1% TFA)
and 15% solvent B (CH3CN, 0.1% TFA), and developed at a flow rate of 1 ml/min and UV
detection at 254 nm and 280 nm: 0-3 min, constant 40% A / 50% B; 3-20 min, a linear gradient to
2% A / 98% B; 20-25min, constant 2% A / 98% B; 25-30min, a linear gradient to 40% A / 50% B.
LC-MS analysis was performed using a similar elution program.
Density functional theory (DFT) and statistical mechanics calculations
DFT calculations2, 3 were performed with the Gaussian 09 program.4 The NosL reaction
intermediates and transition states were calculated by using the unrestricted B3LYP5, 6 and M067
hybrid functionals in parallel. Structure optimization was performed using the 6-31+G(d,p) basis
set, and energies were calculated using the 6-311+G(2d,p) basis set. The optimized structures were
checked with harmonic vibration frequency calculations. The solvent effect was estimated with
IEFPCM calculation8, 9 with radii and non-electrostatic terms for SMD solvation model10 in water
(ε = 78.4) and in ethanol (ε = 24.5). All the transition states have been validated by intrinsic
reaction coordinate (IRC) calculation in both forward and reverse directions. Canonical orbitals
were calculated using isosurface values of 0.04.
To investigate the dAdo radical-mediated hydrogen abstraction reactions, the dAdo radical is
modeled as an ethyl radical and L-Trp is modeled as methylamine, in a way similar to a recent
study on the radical SAM enzyme HydE.11 Both geometry optimization and energy calculation
were performed at the M06/6-311+G(2d,p)/SMD(water) level of theory. Statistical mechanics
analysis were performed using the canonical transition-state theory (TST)12 with Wigner tunneling
correction (TSTW)13 embedded in the KiSThelP software package.14 The temperature was set to
298.00K and the atmospheric pressure to 1.0 bar without any artificial adjustment.
Molecular Mechanical Calculations
All protein models were prepared in Schrodinger suite software under the OPLS_2005 force
field.15 Hydrogen atoms were added to the repaired crystal structures at physiological pH (7.4)
with the PROPKA16 tool to optimize the hydrogen bond network provided by the Protein
Preparation tool in Schrodinger software. Constrained energy minimizations were conducted on
the full-atomic models, with heavy atom coverage to 0.4 Å.
Chemical model reaction
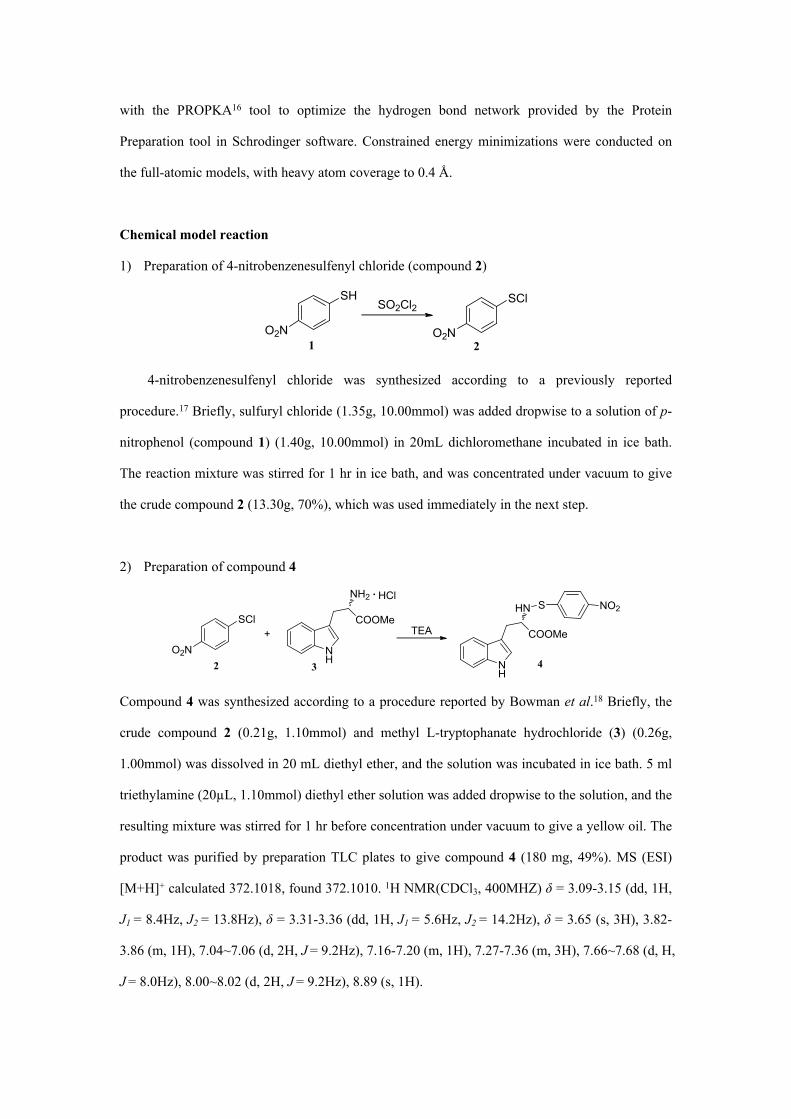
1) Preparation of 4-nitrobenzenesulfenyl chloride (compound 2)
SH
O2N
SCl
O2N
SO2Cl2
1 2
4-nitrobenzenesulfenyl chloride was synthesized according to a previously reported
procedure.17 Briefly, sulfuryl chloride (1.35g, 10.00mmol) was added dropwise to a solution of p-
nitrophenol (compound 1) (1.40g, 10.00mmol) in 20mL dichloromethane incubated in ice bath.
The reaction mixture was stirred for 1 hr in ice bath, and was concentrated under vacuum to give
the crude compound 2 (13.30g, 70%), which was used immediately in the next step.
2) Preparation of compound 4
SCl
O2N2
+NH
NH2
COOMe
HCl
TEA
NH
HN
COOMe
S NO2
3 4
Compound 4 was synthesized according to a procedure reported by Bowman et al.18 Briefly, the
crude compound 2 (0.21g, 1.10mmol) and methyl L-tryptophanate hydrochloride (3) (0.26g,
1.00mmol) was dissolved in 20 mL diethyl ether, and the solution was incubated in ice bath. 5 ml
triethylamine (20µL, 1.10mmol) diethyl ether solution was added dropwise to the solution, and the
resulting mixture was stirred for 1 hr before concentration under vacuum to give a yellow oil. The
product was purified by preparation TLC plates to give compound 4 (180 mg, 49%). MS (ESI)
[M+H]+ calculated 372.1018, found 372.1010. 1H NMR(CDCl3, 400MHZ) δ = 3.09-3.15 (dd, 1H,
J1 = 8.4Hz, J2 = 13.8Hz), δ = 3.31-3.36 (dd, 1H, J1 = 5.6Hz, J2 = 14.2Hz), δ = 3.65 (s, 3H), 3.82-
3.86 (m, 1H), 7.04~7.06 (d, 2H, J = 9.2Hz), 7.16-7.20 (m, 1H), 7.27-7.36 (m, 3H), 7.66~7.68 (d, H,
J = 8.0Hz), 8.00~8.02 (d, 2H, J = 9.2Hz), 8.89 (s, 1H).

3) Photoreaction of 4
Compound 4 (18 mg, 0.049 mmol) was dissolved in 10 mL acetonitrile and the solution was
transferred to a small quartz tube reactor, which was irradiated for 1 hr under 254nm UV light.
The resulting reaction mixture was directly analyzed by HPLC and was diluted 100-fold with
acetonitrile before LC-HRMS analysis.

Fig. S1 DFT-calculated potential energy profile for the model study discussed in the main text.
Energies were calculated at the B3LYP/6-311+G(2d,p)/SMD(water) level of theory with geometry
optimized at the B3LYP/6-31+G(d,p)/SMD(water) level. This analysis shows that the energy
profile for the fragmentation of tryptophan methyl ester is similar to that of tryptophan, thereby
validating the chemical model study discussed in the main text (also see Fig. 3 in the main text
and Fig S8, ESI† for comparison). All the transition states (shown in brackets) have been
validated by intrinsic reaction coordinate (IRC) calculation in both forward and reverse directions.
ΔGsol, free energy of activation; ΔHsol, enthalpy of activation.

Fig. S2 UV spectra of X1 (a) and X2 (b), which are very similar to that of compound 4 (c).
a
b
c

Fig. S3. Structural analysis of X1 and X2 by HR-MSMS, showing (a) the theoretical MS/MS
fragmentation of X1 and X2, (b) the HRMS and HR-MS/MS spectra of X1, and (c) the HRMS
and HR-MS/MS spectra of X2. The fragment ions that are also observed in the HR-MSMS
spectrum of 4 are shown in blue. The characteristic ions (m/z = 283.05) of X1 and X2 are shown
in red.
a
NH
NH
COOMe
S
O2N
NH
+
283.0541
S
O2N
NH
NH
COOMe
201.0790
+
S NO2+
153.9957
NH
NH2
COOMe
+
217.0971
NH
+
130.0651
[M+H]+ = 501.1600 NH
COOMe
202.0863
+
+
+
+
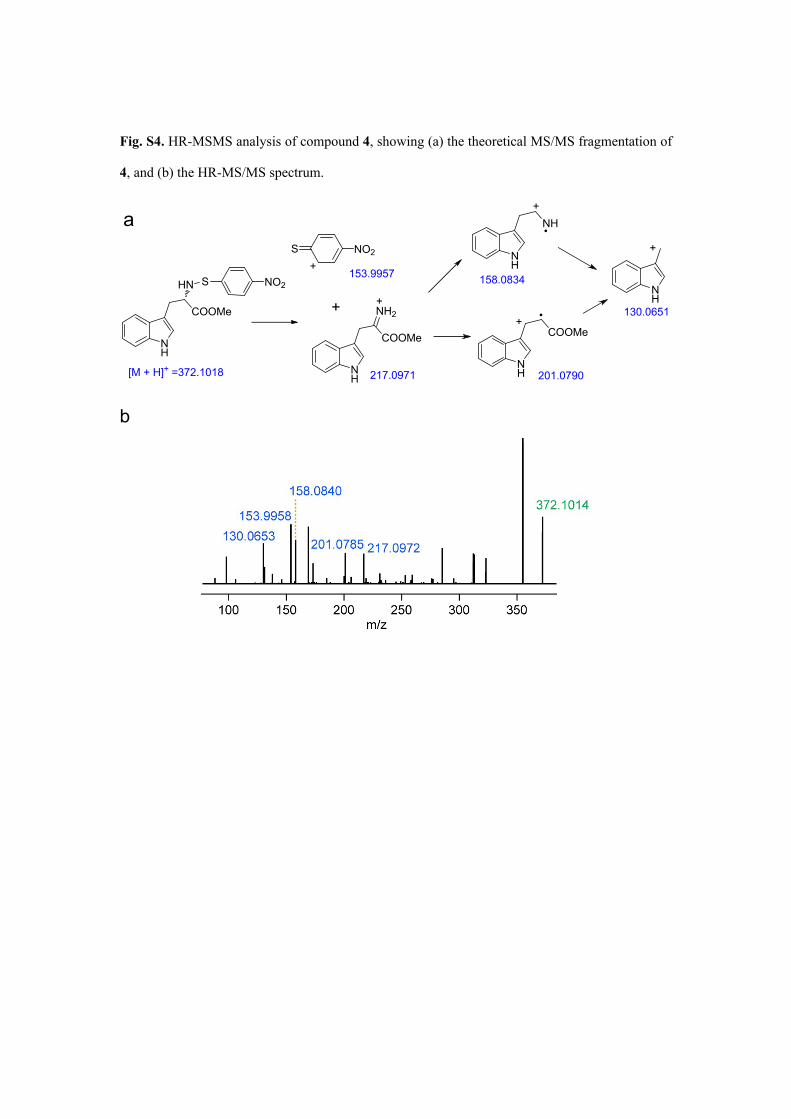
Fig. S4. HR-MSMS analysis of compound 4, showing (a) the theoretical MS/MS fragmentation of
4, and (b) the HR-MS/MS spectrum.
NH
HN
COOMe
S NO2
[M + H]+ =372.1018NH
COOMe
201.0790
+
S NO2+
153.9957
NH
NH2
COOMe
+
217.0971
NH
+
130.0651
NH
NH
158.0834
+
a+
b

Fig. S5. Orbital analysis and regioselectivity prediction of the radical addition of 3 to 4. The
energy difference between HOMO of 3 and LUMO of 4 (0.06085 Hartree) is smaller than that
between HOMO of 4 and LUMO of 3 (0.15019 Hartree), suggesting that 3 should specifically
attack the nitrophenyl moiety of 4 (where the LUMO electrons locate). Because in the LUMO of 4
the electrons locate on the nitro para-positions, not the meta-positions, addition of 3 to 4 should
mainly occur on the nitro para-positions. Canonical orbitals were calculated using isosurface
values of 0.04.
Compound 4: HOMO (-0.21706 Hartree) LUMO (-0.09964 Hartree)
Radical 3: HOMO (-0.16049 Hartree) LUMO (-0.06687 Hartree)
NH
NH
COOMe
S
O2N
major product
NH
NH
NH
COOMe
S
O2N
NH
NH
NH
COOMe
S
NO2
NH
+
minor product
3
4 H
H
X1NH
NH
COOMe
S
O2N
NH
NH
NH
COOMe
S
NO2
NH
+
X2
- e, - H+
- e, - H+

Fig. S6. Orbital analysis and regioselectivity prediction of the radical addition of 6 to 4. The
energy difference between HOMO of 4 and LUMO of 6 (0.01638 Hartree) is smaller than that
between HOMO of 4 and LUMO of 3 (0.16195 Hartree), suggesting that 6 should specifically
attack the indolyl moiety of 4 (where the HOMO electrons locate). Because in the HOMO of 4 the
electrons equally locate on several atoms of the indole ring, a series of adduct isomers Y are
expected, which is consistent with our LC-HRMS analysis (Y1, Y2, Y3 in the main text).
Canonical orbitals were calculated using isosurface values of 0.04.
Compound 4: HOMO (-0.21706 Hartree) LUMO (-0.09964 Hartree)
Radical 6: HOMO (-0.26159 Hartree) LUMO (-0.20068 Hartree)
NH
NH
COOMe
S
O2N
+
S
NO2
NH
NH
COOMe
S
O2N
+
S
NO2
Y6 4

Fig. S7. Structural analysis of Y1, Y2, and Y3 by HR-MSMS, showing (a) the theoretical MS/MS
fragmentation of Y1, Y2, and Y3, (b) the HR-MS/MS spectrum of Y1, (c) the HR-MS/MS
spectrum of Y2, and (d) the HR-MS/MS spectrum of Y3. The fragment ions that are also observed
in the HR-MSMS spectrum of 4 are shown in blue. The characteristic ions (m/z = 370.09 and
283.05) are shown in red.
a
NH
NH
COOMe
S
O2N
S
NO2
Y NH
NH
COOMeS
NO2
370.0861
S NO2+153.9957
+
NH
S
NO2
283.05412
+
NH
NH
COOMe
+
217.0971NH
+
130.0651NH
NH
O+
185.0715
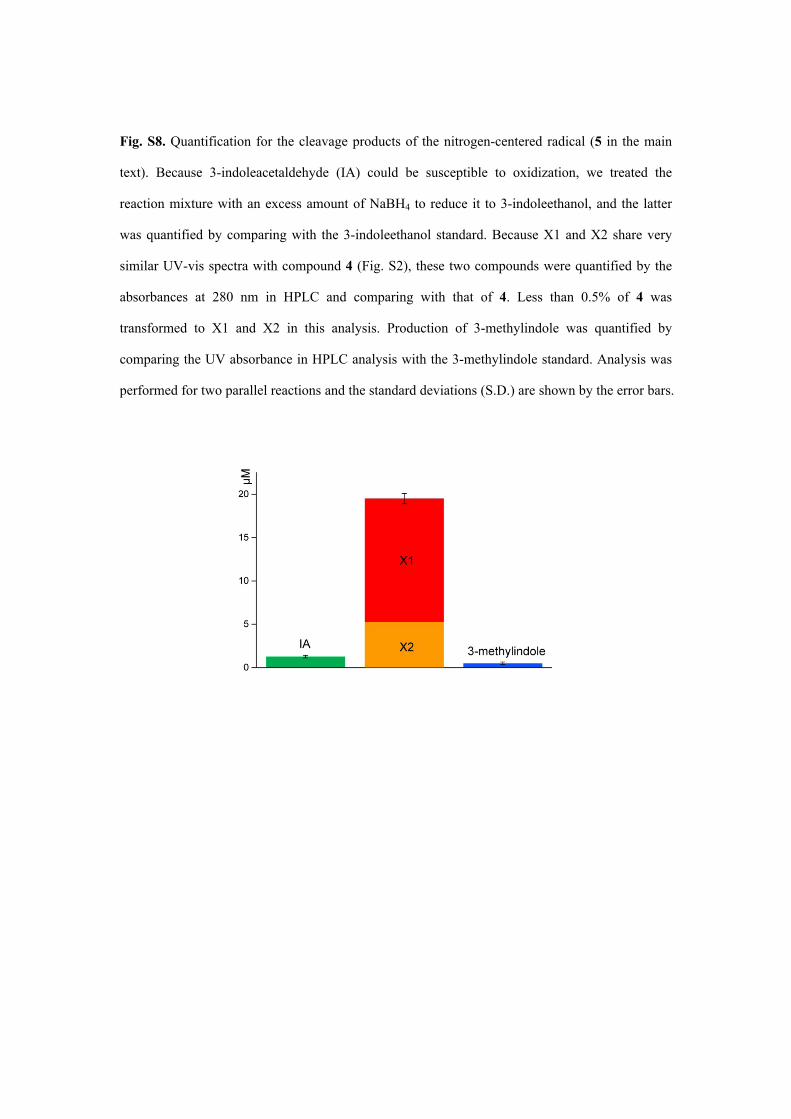
Fig. S8. Quantification for the cleavage products of the nitrogen-centered radical (5 in the main
text). Because 3-indoleacetaldehyde (IA) could be susceptible to oxidization, we treated the
reaction mixture with an excess amount of NaBH4 to reduce it to 3-indoleethanol, and the latter
was quantified by comparing with the 3-indoleethanol standard. Because X1 and X2 share very
similar UV-vis spectra with compound 4 (Fig. S2), these two compounds were quantified by the
absorbances at 280 nm in HPLC and comparing with that of 4. Less than 0.5% of 4 was
transformed to X1 and X2 in this analysis. Production of 3-methylindole was quantified by
comparing the UV absorbance in HPLC analysis with the 3-methylindole standard. Analysis was
performed for two parallel reactions and the standard deviations (S.D.) are shown by the error bars.

Fig. S9. DFT-calculated potential energy profiles in NosL catalysis. Energies were calculated at
the levels of B3LYP/6-311+G(2d,p)/SMD(water), B3LYP/6-311+G(2d,p)/SMD(ethanol), and
M06/6-311+G(2d,p)/SMD(water), respectively, with geometry optimized at the levels of
B3LYP/6-31+G(d,p)/SMD(water), B3LYP/6-31+G(d,p)/SMD(ethanol), and M06/6-
31+G(d,p)/SMD(water), respectively. These parallel calculations show similar trends of reaction
energy. All the transition states have been validated by intrinsic reaction coordinate (IRC)
calculation in both forward and reverse directions.

Fig. S10. Intrinsic reaction coordinate (IRC) calculation for the transition state structures in Fig. 3
(main text) and in Fig. S9, showing that all the transition states connect the expected reactants and
products along the IRC pathways. All stationary points were optimized at the B3LYP/6-31+G(d,p)
level of theory.

Fig. S11. A detailed kinetic model for the NosL-catalyzed reaction in D2O. In the catalysis, the
dAdo radical resulting from SAM cleavage abstracts a deuterium from the amino group with a rate
constant of kB to produce an amino-center radical (RND•), which proceeds via a β fragmentation
(either Cα-Cβ or Cα-C scission) to produce corresponding products; this rate can be described by
an apparent net rate constant kfrag. Alternatively, instead of β fragmentation, RND• can abstract a
hydrogen back from the singly deuterated dAdoH that contain one deuterium and two protium
atoms. As revealed by our DFT and statistical mechanics analysis (see Fig. S12 and Table S1),
protium abstraction by RND• (k-c) is much faster that the reverse deuterium rebound process (k-B),
and the former results in a singly deuterated amino group (RNDH), which can be converted to the
doubly deuterated amino group (RND2) by a rapid solvent exchange process (ksol) for the next
round of dAdo radical-mediated hydrogen abstraction. dAdo radical can also be reduced by a
hydrogen equivalent that can be described by an apparent rate constant kquen. The hydrogen
equivalent that quenches the dAdo radical could come from either a solvent-nonexchangeable or
solvent-exchangeable site with a ratio of χ/(1-χ).
AdoCH2 + RND2kB
k-BAdoCDH2 + RND
kC
k-CAdoCHD + RNDH
AdoCH3 +(1-)AdoCDH2
kquen
products
kfrag
AdoCHD + RND2kF
k-FAdoCHD2 + RND
kD
k-DAdoCD2 + RNDH
AdoCD2 + RND2kE
AdoCD3 + RND
AdoCHD2 +(1-)AdoCD3
kfragkquen
kquen
ksol
ksol
AdoCD3 + products
AdoCDH2 +
products
kfrag
+AdoCHD2
AdoCDH2 +(1-)AdoCHD2
k-E
According to our calculations (Fig. S12 and Table S1), the rate constants for the dAdo
radical-based protium transfer is generally 10~12 folds higher than those of deuterium transfer,
and the secondary deuterium kinetic isotope effect is small, meaning that k-C ≈ k-D >> k-B ≈ k-F ≈ k-
E, and kB ≈ kF ≈ kE. To simplify our analysis, we define kp = kC ≈ kD (p represents protium
abstraction), krp = k-C ≈ k-D (rp represents reverse protium abstraction, krp equals to k2 in Fig. 4b
in the main text), kd = kB ≈ kF ≈ kE (d represents deuterium abstraction, kd equals to k1 in Fig. 4b

in the main text), krd = k-B ≈ k-F ≈ k-E (rd represents reverse deuterium abstraction). The
observation that dAdoH is mainly tri-deuterated in the rapid quench experiment (Fig. 4a in the
main text) suggests that i) the rates for deuterium transfer is much larger than kquen and kfrag, and ii)
the Tyr90-mediated solvent exchange process should be very fast (i.e. ksol >> kp). Together, the
rate constants in NosL reaction in D2O can be ranked as follows.
ksol >> kp > krp (k2 in Fig. 4b) >> kd (k1 in Fig. 4b) > krd >> kquen, kfrag
We define Di (i = 0, 1, 2, 3) as the ratio of the yield of the dAdoH containing i deuterium
atom(s) to the total yield of dAdoH (i.e. ). According to the analysis above, the ratio of ∑𝐷𝑖 = 1
mono-deuterated dAdoH (D1) can be roughly estimated as follows.
𝐷1 ≈𝑘𝑞𝑢𝑒𝑛
𝑘𝑞𝑢𝑒𝑛 + 𝑘𝑑× (1 ‒ 𝜒) +
𝑘𝑑
𝑘𝑞𝑢𝑒𝑛 + 𝑘𝑞𝑢𝑒𝑛×
𝑘𝑞𝑢𝑒𝑛
𝑘𝑞𝑢𝑒𝑛 + 𝑘𝑑× 𝜒
When we performed the assay in 98% D2O with all the required reaction components except
L-Trp, the results showed that the resulting dAdoH consists of ~60% of unlabeled species and
~40% of mono-deuteriated product, and this ratio remains roughly constant at different time
points, suggesting that only part of the dAdo radical was quenched by solvent-exchangeable
hydrogen, and we here roughly estimate that χ is ~0.6. Together with the results discussed in
the main text showing that D1 ≈ 0.1 (Fig. 4a in the main text), these analyses allow us to estimate
that kquen : kd ≈ 1 : 9. Because krp (k-D) is far larger than kfrag, most of the di-deuterated dAdoH
should come from AdoCD2•, therefore we can estimate the ratio of D2 to D3 as follows.
𝐷2 𝐷3 ≈𝑘𝑞𝑢𝑒𝑛 × 𝜒
𝑘𝑞𝑢𝑒𝑛 × (1 ‒ 𝜒) +𝑘𝐸
𝑘 ‒ 𝐸𝑘𝑓𝑟𝑎𝑔
Based on the calculation that kE/k-E is 2.6 (Table S1), χ is ~0.6, and D2/D3 is ~0.8 (Fig. 4a
in the main text), we can know that kfrag : kquen : kd ≈ 1 : 7.5 : 67. Because kd is around 5~7 s-1
(Table S1), the rate constant for the cleavage of the tryptophanyl radical 1 in NosL catalysis (kfrag)
can be estimated to be ~ 0.1 s-1. It should be noted that because of the inevitable error in DFT
calculations, the rate constants inferred here are only rough estimations and should be
treated cautiously;19 yet they do provide a general view into the complicate process of NosL-
catalyzed reaction.

Fig. S12. Model hydrogen transfer reactions, which are relevant to NosL catalysis discussed in
Fig. S11 (e.g. kBˊ and k-Bˊ are consistent with kB and k-B in Fig. S11). These reactions serve as
models for our DFT and statistical mechanics calculations, and the resulting rate constants and
thermodynamic parameters are listed in Table S1.
kA'
k-A'CH3NH2 + CH2CH3 CH3NH + CH3CH3A)
kB'
k-B'CH3ND2 + CH2CH3 CH3ND + CH2DCH3B)
kC'
k-C'CH3NHD + CHDCH3 CH3ND + CH2DCH3C)
kD'
k-D'CH3NHD + CD2CH3 CH3ND + CHD2CH3D)
kE'
k-E'CH3ND2 + CD2CH3 CH3ND + CD3CH3E)
kF'
k-F'CH3ND2 + CHDCH3 CH3ND + CHD2CH3F)

Fig. S13. Active site of NosL. The L-Trp amino group is shown by a red arrow. Hydrogen atoms
were added to the repaired crystal structures at physiological pH (7.4) with the PROPKA16 tool to
optimize the hydrogen bond network provided by the Protein Preparation tool in Schrodinger
software.

Fig. S14. Kinetic analysis of NosL wild type enzyme and the Y90F mutant for dAdoH production.
The assays were performed with (a) 11 μM and (b) 33 μM enzyme in 50 mM MOPS buffer (pH
8.0) with 10 mM DTT, 200 μM L-Trp, and 2 mM sodium dithionite. The reactions were initiated
by addition of SAM to the final concentration of 50 μM, 200 μM or 1mM. The reactions were
quenched at 2 min by addition of trichloroacetic acid (TCA) to a final concentration of 5% (v/v).
Production of dAdoH were quantified by HPLC using 5′-chloro-5′-deoxyadenosine as an internal
standard, and the reactions were performed in duplicate. According to this analysis, the Km values
of SAM are far smaller than 50 μM and were not measured. The result shows that the catalytic
efficiency of the Y90F mutant is about 2-fold lower than the wild type enzyme; similar
observations were also made by Begley and coworkers.20
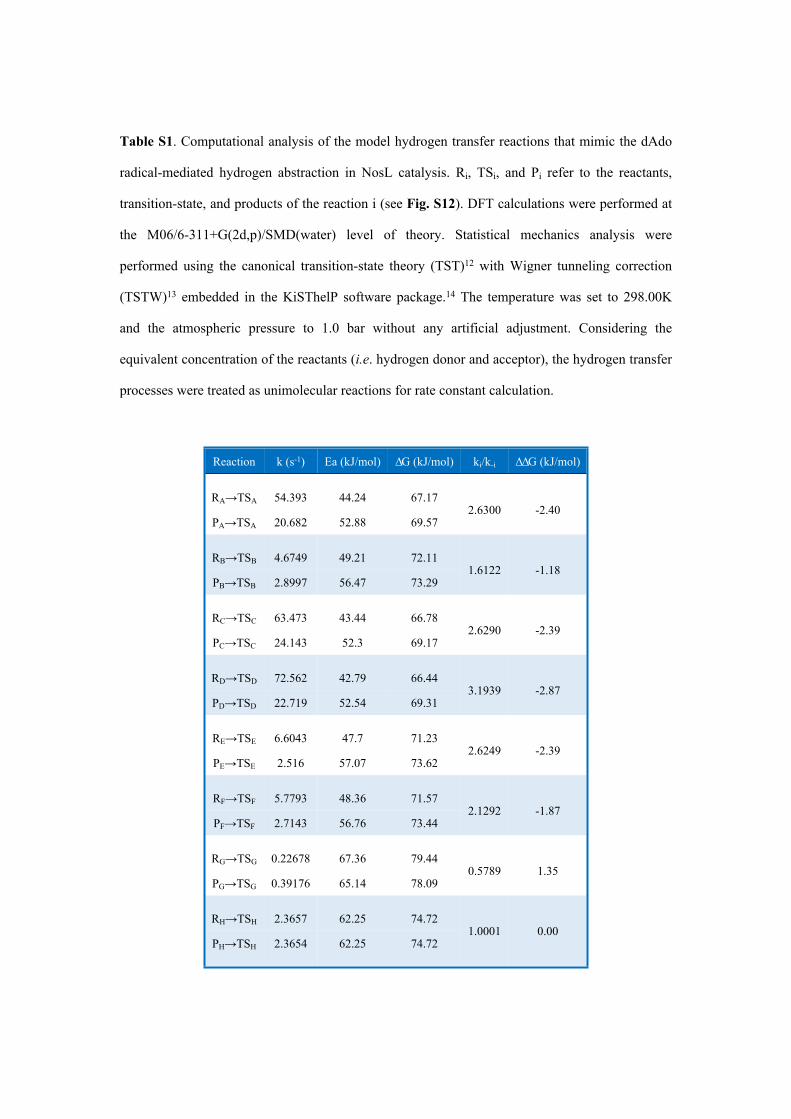
Table S1. Computational analysis of the model hydrogen transfer reactions that mimic the dAdo
radical-mediated hydrogen abstraction in NosL catalysis. Ri, TSi, and Pi refer to the reactants,
transition-state, and products of the reaction i (see Fig. S12). DFT calculations were performed at
the M06/6-311+G(2d,p)/SMD(water) level of theory. Statistical mechanics analysis were
performed using the canonical transition-state theory (TST)12 with Wigner tunneling correction
(TSTW)13 embedded in the KiSThelP software package.14 The temperature was set to 298.00K
and the atmospheric pressure to 1.0 bar without any artificial adjustment. Considering the
equivalent concentration of the reactants (i.e. hydrogen donor and acceptor), the hydrogen transfer
processes were treated as unimolecular reactions for rate constant calculation.
Reaction k (s-1) Ea (kJ/mol) ΔG (kJ/mol) ki/k-i ΔΔG (kJ/mol)
RA→TSA 54.393 44.24 67.17
PA→TSA 20.682 52.88 69.572.6300 -2.40
RB→TSB 4.6749 49.21 72.11
PB→TSB 2.8997 56.47 73.291.6122 -1.18
RC→TSC 63.473 43.44 66.78
PC→TSC 24.143 52.3 69.172.6290 -2.39
RD→TSD 72.562 42.79 66.44
PD→TSD 22.719 52.54 69.313.1939 -2.87
RE→TSE 6.6043 47.7 71.23
PE→TSE 2.516 57.07 73.622.6249 -2.39
RF→TSF 5.7793 48.36 71.57
PF→TSF 2.7143 56.76 73.442.1292 -1.87
RG→TSG 0.22678 67.36 79.44
PG→TSG 0.39176 65.14 78.090.5789 1.35
RH→TSH 2.3657 62.25 74.72
PH→TSH 2.3654 62.25 74.721.0001 0.00

References
1. X. Ji, Y. Li, W. Ding and Q. Zhang, Angew Chem Int Ed Engl, 2015, 54, 9021-9024.2. H. P. and W. Kohn, Phys. Rev., 1964, 136, B864.3. W. Kohn and L. J. Sham, Phys. Rev., 1965, 140, A1133.4. M. J. Frisch, G. W. Trucks, H. B. Schlegel, G. E. Scuseria, M. A. Robb, J. R. Cheeseman, G.
Scalmani, V. Barone, B. Mennucci, G. A. Petersson and M. C. H. Nakatsuji, X. Li, H. P. Hratchian, A. F. Izmaylov, J. Bloino, G. Zheng, J. L. Sonnenberg, M. H, ada, M. Ehara, K. Toyota, R. Fukuda, J. Hasegawa, M. Ishida, T. Nakajima, Y. Honda, O. Kitao, H. Nakai, T. Vreven, J. A. Montgomery, Jr., J. E. Peralta, F. Ogliaro, M. Bearpark, J. J. Heyd, E. Brothers, K. N. Kudin, V. N. Staroverov, R. Kobayashi, J. Normand, K. Raghavachari, A. Rendell, J. C. Burant, S. S. Iyengar, J. Tomasi, M. Cossi, N. Rega, J. M. Millam, M. Klene, J. E. Knox, J. B. Cross, V. Bakken, C. Adamo, J. Jaramillo, R. Gomperts, R. E. Stratmann, O. Yazyev, A. J. Austin, R. Cammi, C. Pomelli, J. W. Ochterski, R. L. Martin, K. Morokuma, V. G. Zakrzewski, G. A. Voth, P. Salvador, J. J. Dannenberg, S. Dapprich, A. D. Daniels, Ö. Farkas, J. B. Foresman, J. V. Ortiz, J. Cioslowski, and D. J. Fox, Gaussian 09, Revision E.01, Gaussian, Inc., Wallingford CT, 2009., 2009.
5. C. Lee, W. Yang and R. G. Parr, Phys. Rev., 1988, B37, 785.6. A. D. Becke, J. Chem. Phys., 1993, 98, 5648-5652.7. Y. Zhao and D. G. Truhlar, Theor Chem Acc, 2008, 120, 215-241.8. M. T. Cances, B. Mennucci and J. Tomasi, J. Chem. Phys., 1997, 107, 3032.9. M. Cossi, V. Barone, B. Mennucci and J. Tomasi, Chem. Phys. Lett. , 1998, 286, 253.10. A. V. Marenich, C. J. Cramer and D. G. Truhlar, J Phys Chem B, 2009, 113, 6378-6396.11. R. Rohac, P. Amara, A. Benjdia, L. Martin, P. Ruffie, A. Favier, O. Berteau, J. M. Mouesca, J.
C. Fontecilla-Camps and Y. Nicolet, Nat Chem, 2016, 8, 491-500.12. H. Eyring, J Chem Phys, 1935, 3, 107-115.13. D. G. Truhlar and R. E. Wyatt, Annu Rev Phys Chem, 1976, 27, 1-43.14. S. Canneaux, F. Bohr and E. Henon, J Comput Chem, 2014, 35, 82-93.15. D. Shivakumar, J. Williams, Y. J. Wu, W. Damm, J. Shelley and W. Sherman, J Chem Theory
Comput, 2010, 6, 1509-1519.16. C. R. Sondergaard, M. H. M. Olsson, M. Rostkowski and J. H. Jensen, J Chem Theory
Comput, 2011, 7, 2284-2295.17. Z. S. Li, W. M. Wang, W. Lu, C. W. Niu, Y. H. Li, Z. M. Li and J. G. Wang, Bioorg Med
Chem Lett, 2013, 23, 3723-3727.18. W. R. Bowman, M. J. Broadhurst, D. R. Coghlan and K. A. Lewis, Tetrahedron Lett, 1997, 38,
6301-6304.19. F. Himo, Biochim Biophys Acta , 2005, 1707, 24-33.20. D. M. Bhandari, H. Xu, Y. Nicolet, J. C. Fontecilla-Camps and T. P. Begley, Biochemistry,
2015, 54, 4767-4769.