Embed Size (px)
Citation preview
UEFAROUTE DE GENÈVE 46CH-1260 NYON 2 SWITZERLANDTELEPHONE: +41 848 00 27 27TELEFAX: +41 848 01 27 27
Financial Report2015/16
41st Ordinary UEFA CongressHelsinki, 5 April 2017
Setting: LargeNetwork, Geneva. Printing: Artgraphic Cavin, Grandson, Switzerland
TABLE OF CONTENTS
Facts and figures
Introduction Financial strategy Income statement Distribution Solidarity The flow of UEFA solidarity payments Balance sheet Own resources Result by competition and activity Source of income Use of income Governing expenses The four-year cycle EURO 2016 HatTrick European Qualifiers Club competitions UEFA Champions League UEFA Europa League
Annex
Financial statements as at 30 June 2016 Reports of the statutory auditors
I.
14689
1012141617182022233032343842
II.
Co
ver :
Get
ty Im
ages
INTRODUCTION
It is with great satisfaction that UEFA presents its Financial Report for
2015/16 – a financial year marked by a number of highlights and major events, notably EURO 2016. This year’s report includes some changes, such as in the way the club competition figures are presented, as well as more information on the use of income and a breakdown of UEFA’s institutional costs. In addition, changes to the Swiss Code of Obligations required some small adjustments in the statutory accounts. The structure of the report has not, however, changed. It is divided into a straight forward descriptive part and an annex providing detailed financial statements and the auditor’s reports.
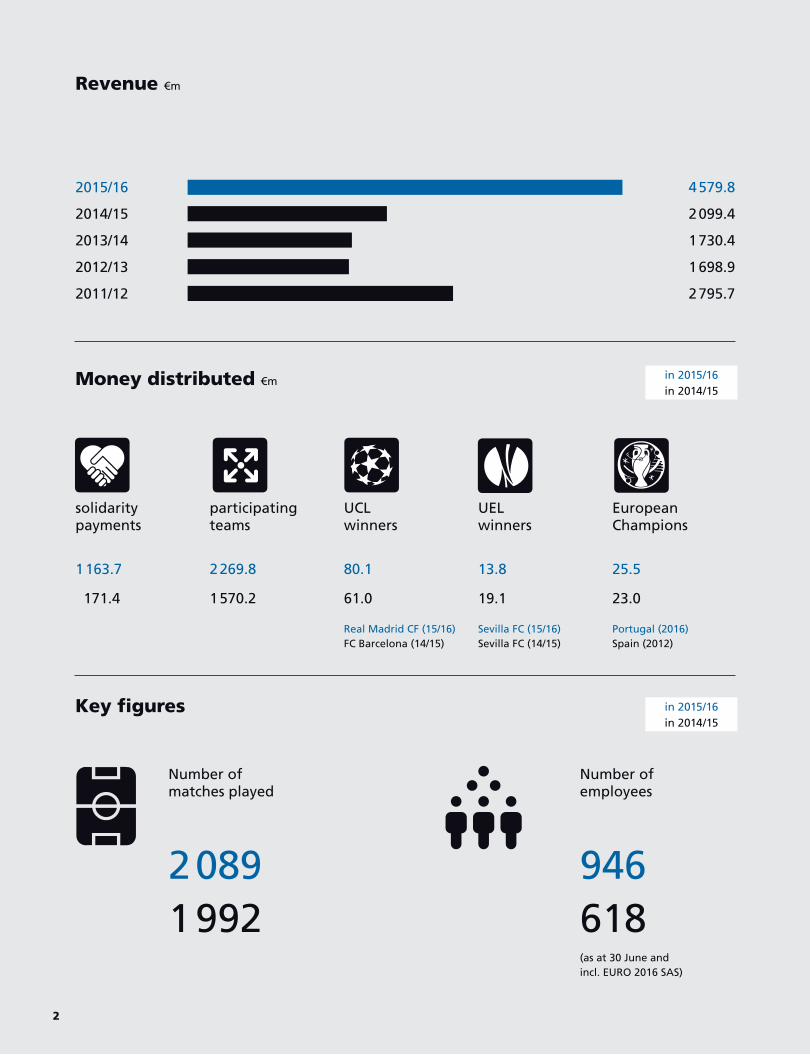
Every 12 years, the start of a new club competition cycle coincides with a year with a European Football Championship final tournament, as was the case in 2015/16. Having our biggest tournament and the start of a new club competition cycle in the same financial year has a major impact on UEFA’s annual accounts, as reflected first and foremost in the total revenue of €4.58 billion, double that of the season before.
The increase from 16 to 24 participating teams for EURO 2016 meant more matches and more excitement for more fans and, at the same time, it had a positive impact on revenue, which, compared with EURO 2012, increased by over €500 million to €1.92 billion. Apart from being a great success in terms of sporting balance, giving new countries and their supporters the chance to participate in a final round, EURO 2016 was also a financial success, producing a net result of €847.3 million, a positive outcome which secures the financing for the fourth HatTrick cycle.
Leading up to the final tournament, the European Qualifiers also proved to be a resounding success, in particular the new Week of Football concept. More fans than ever watched a competition where unfancied teams produced some remarkable results against supposedly stronger opposition. The spreading of matches over six days heralded an invigorating new approach and underlined UEFA’s determination to enhance the appeal of the European national-team game.
The sales process for the 2015–18 club competition cycle also ended more than satisfactorily, with revenue increasing by 38% compared with the previous cycle. As a result, the amounts available to participating clubs and for solidarity payments are considerably higher than for the 2012–15 cycle, with all revenues from the UEFA Champions League and UEFA Europa League now centralised into one single pot for the purposes of a new, simplified distribution system. For 2015/16, an amount of €1.36 billion (+31%) was available for UEFA Champions League clubs, while the amount available for clubs taking part in the UEFA Europa League came to €411.2 million – a substantial increase of 72%.
Futsal’s flourishing popularity was highlighted by an outstanding UEFA Futsal EURO 2016 in Belgrade in February 2016. And the UEFA Youth League became a permanent UEFA competition following a two-year pilot phase. The expanded competition comprised 64 teams, with 32 domestic champion clubs lining up alongside the youth teams of the clubs taking part in the UEFA Champions League group stage. This expansion increased the competition’s quality, with a wider country representation resulting in
higher broadcasting revenue and a lower competition deficit.
Despite being much occupied in organising its flagship events, UEFA delivered various other events and programmes, investing €33.4 million in football projects such as development tournaments and education. The solidarity and development programmes provide constant reminders that UEFA’s prime mission is to put football first and to defend and promote the game with a view to achieving the best possible marriage with business practices.
Operating expenses remained at budget level or, in certain areas, lower than initially planned. However, financial items such as interests and foreign exchange stayed very much behind budget despite higher financial assets being available.
Even so, the overall result of the 2015/16 financial year is satisfactory, and the net result of €102.1 million will be used to part-finance the three coming years until the next EURO. As a not-for-profit organisation, UEFA’s duty is to redistribute income in a way that allows and encourages its 55 member associations to take care of the players, coaches, match officials and supporters who bring the game to life and promote the important social values showcased by the world’s most popular team sport. UEFA’s financial performance is, in consequence, a hinge that opens the door to important benefits right across the continent.
1FINANCIAL REPORT 2015/16
Number of employees
946 618 (as at 30 June and incl. EURO 2016 SAS)
Money distributed €m
Number of matches played
2 0891 992
in 2015/16in 2014/15
Revenue €m
2015/16
2014/15
2013/14
2012/13
2011/12
4 579.8
2 099.4
1 730.4
1 698.9
2 795.7
solidarity payments
1 163.7
171.4
participating teams
2 269.8
1 570.2
UCL winners
80.1
61.0
Real Madrid CF (15/16) FC Barcelona (14/15)
UEL winners
13.8
19.1
Sevilla FC (15/16) Sevilla FC (14/15)
European Champions
25.5
23.0
Portugal (2016) Spain (2012)
in 2015/16in 2014/15
Key figures
2
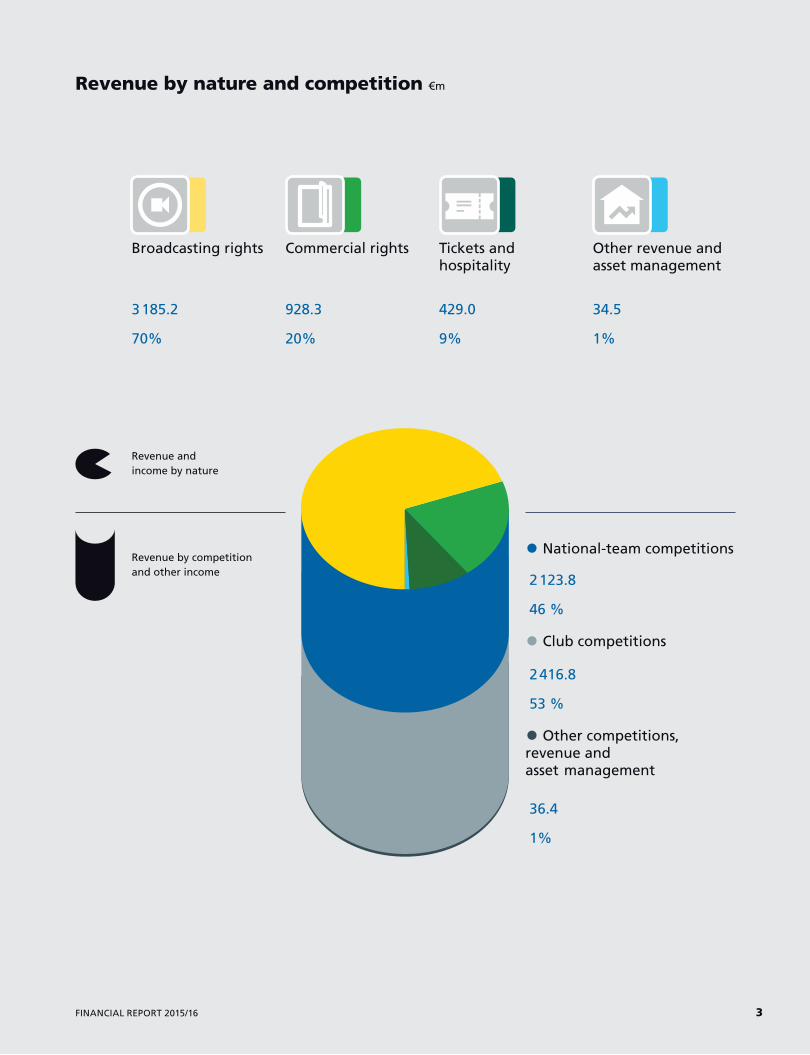
Revenue by nature and competition €m
Revenue by competition and other income
Revenue and income by nature
• National-team competitions
2 123.8 46 %
• Club competitions
2 416.8 53 %
• Other competitions, revenue and asset management
36.4 1%
Broadcasting rights
3 185.2
70%
Commercial rights
928.3
20%
Tickets and hospitality
429.0
9%
Other revenue and asset management
34.5
1%
3FINANCIAL REPORT 2015/16
“Every business has at its heart the delivery of a product to the
customer. In football, that product is on the pitch. What happens there drives the three basic revenue streams of the business: matchday ticket sales, commercial sales and sponsorship, and broadcasting, which dominates the turnover of most of the elite European football leagues. So, ultimately, despite the importance of everything else to the business, I will be judged on the game and delivering success.”
The words are borrowed from a book by Carlo Ancelotti, five-time winner of the UEFA Champions League (twice as player, thrice as coach) during a success-filled career. We trust that Carlo, a regular participant at our annual Elite Club Coaches Forum, will not mind being quoted. As it happens, the title of his book, Quiet Leadership: Winning Hearts, Minds and Matches is also a concept that UEFA, as an organisation, can readily take on board when reflecting on its role in the European game.
Carlo’s comments are easy to translate into a mission statement. UEFA does not – and must not – ever lose sight of the fact that the core of its business is on the pitch. However, unlike the coach, UEFA needs to stand the game in its business context – to position football firmly in the spotlight yet without obscuring the game’s richly coloured global backdrop.
UEFA’s support for the game and for its member associations requires solid foundations of financial strength and stability which allow ‘loss-making’ sectors of the ‘business’ to be not only sustained but also nurtured. It means that revenue can be channelled directly back onto the pitch at grassroots levels and at all the
development levels of the men’s and women’s games. Year after year, our Financial Report reiterates UEFA’s core principles – and the repetition is not accidental. To omit them would be to hint that they have been forgotten. To repeat them is an invitation to reflect on whether these principles have, once again, been respected and whether, as Carlo Ancelotti says, we have ‘delivered success’.
UEFA is committed to encouraging its member associations to work together in putting football first and to constantly pursue the betterment of football, right from the grassroots levels to the role-model pinnacles of the professional game. UEFA is committed to strengthening solidarity, to protecting the future of the game and to maximising UEFA’s finances in a way that reflects and highlights the concept of solidarity.
UEFA is committed to good governance and to the promotion of good governance throughout its member associations. Leadership in this sphere implies responsibilities and duties. UEFA’s finances must therefore aim to demonstrate that good governance begins at home.
UEFA is committed to maintaining and enhancing the balance between national team and club football as complementary elements within the game. The distribution of financial resources therefore needs to achieve an equitable balance between the two.
UEFA is committed to safeguarding sporting integrity and preserving the true spirit of the game while running its competitions in an efficient way and to optimising revenues from commercial contracts to benefit and develop European football. The
financial results offer an indication as to whether sporting and business criteria have been successfully married and whether these objectives have been achieved.
UEFA is committed to promoting fair play on and off the pitch. Financial fair play is high on the agenda and, if UEFA is to lead European football in the right direction and provide top-class administrative support, UEFA’s economic status must be an illustration of financial fair play in terms of responsibility, fairness and transparency. These principles need to be attached to all existing and future projects.
The last word could be offered to another ex-player who thinks deeply about the game, Jorge Valdano: “It’s about the search for perfection. We know it doesn’t exist but it’s our obligation to football and, maybe, humanity to strive towards it.”
FINANCIAL STRATEGY
This financial report aims to provide the reader with trans parent indications about where income has come from and how it is being used for the benefit of the game
4
UEF
A
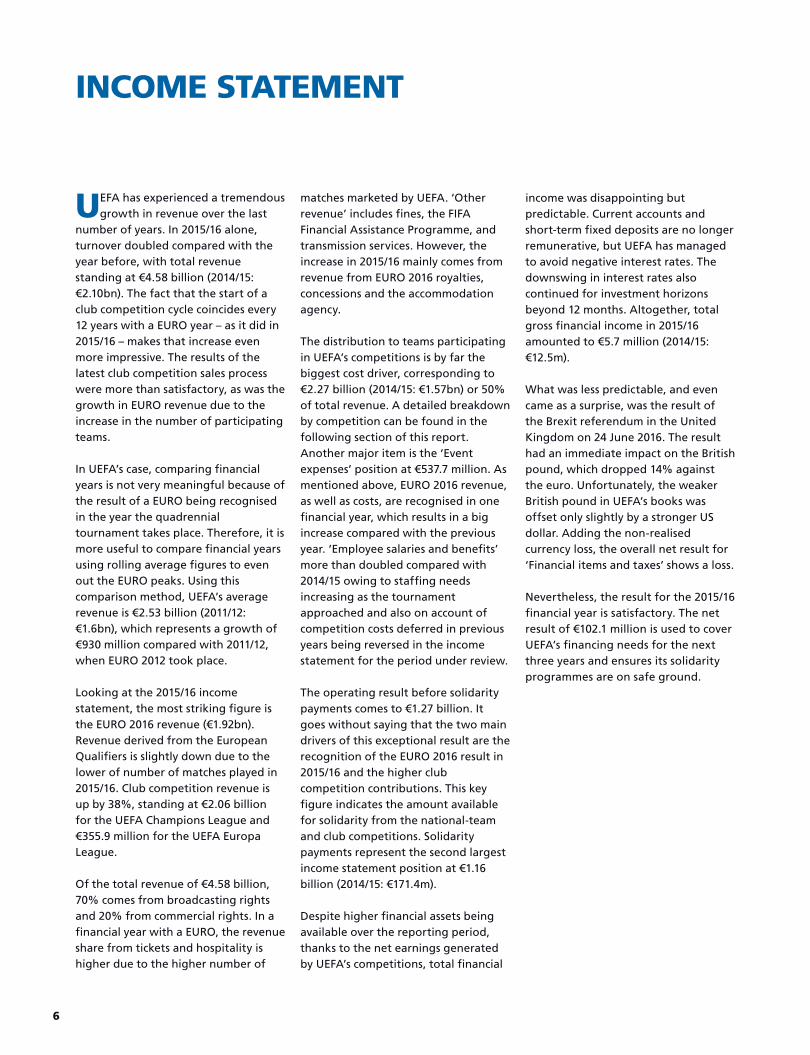
UEFA has experienced a tremendous growth in revenue over the last
number of years. In 2015/16 alone, turnover doubled compared with the year before, with total revenue standing at €4.58 billion (2014/15: €2.10bn). The fact that the start of a club competition cycle coincides every 12 years with a EURO year – as it did in 2015/16 – makes that increase even more impressive. The results of the latest club competition sales process were more than satisfactory, as was the growth in EURO revenue due to the increase in the number of participating teams.
In UEFA’s case, comparing financial years is not very meaningful because of the result of a EURO being recognised in the year the quadrennial tournament takes place. Therefore, it is more useful to compare financial years using rolling average figures to even out the EURO peaks. Using this comparison method, UEFA’s average revenue is €2.53 billion (2011/12: €1.6bn), which represents a growth of €930 million compared with 2011/12, when EURO 2012 took place.
Looking at the 2015/16 income statement, the most striking figure is the EURO 2016 revenue (€1.92bn). Revenue derived from the European Qualifiers is slightly down due to the lower of number of matches played in 2015/16. Club competition revenue is up by 38%, standing at €2.06 billion for the UEFA Champions League and €355.9 million for the UEFA Europa League.
Of the total revenue of €4.58 billion, 70% comes from broadcasting rights and 20% from commercial rights. In a financial year with a EURO, the revenue share from tickets and hospitality is higher due to the higher number of
matches marketed by UEFA. ‘Other revenue’ includes fines, the FIFA Financial Assistance Programme, and transmission services. However, the increase in 2015/16 mainly comes from revenue from EURO 2016 royalties, concessions and the accommodation agency.
The distribution to teams participating in UEFA’s competitions is by far the biggest cost driver, corresponding to €2.27 billion (2014/15: €1.57bn) or 50% of total revenue. A detailed breakdown by competition can be found in the following section of this report. Another major item is the ‘Event expenses’ position at €537.7 million. As mentioned above, EURO 2016 revenue, as well as costs, are recognised in one financial year, which results in a big increase compared with the previous year. ‘Employee salaries and benefits’ more than doubled compared with 2014/15 owing to staffing needs increasing as the tournament approached and also on account of competition costs deferred in previous years being reversed in the income statement for the period under review.
The operating result before solidarity payments comes to €1.27 billion. It goes without saying that the two main drivers of this exceptional result are the recognition of the EURO 2016 result in 2015/16 and the higher club competition contributions. This key figure indicates the amount available for solidarity from the national-team and club competitions. Solidarity payments represent the second largest income statement position at €1.16 billion (2014/15: €171.4m).
Despite higher financial assets being available over the reporting period, thanks to the net earnings generated by UEFA’s competitions, total financial
income was disappointing but predictable. Current accounts and short-term fixed deposits are no longer remunerative, but UEFA has managed to avoid negative interest rates. The downswing in interest rates also continued for investment horizons beyond 12 months. Altogether, total gross financial income in 2015/16 amounted to €5.7 million (2014/15: €12.5m).
What was less predictable, and even came as a surprise, was the result of the Brexit referendum in the United Kingdom on 24 June 2016. The result had an immediate impact on the British pound, which dropped 14% against the euro. Unfortunately, the weaker British pound in UEFA’s books was offset only slightly by a stronger US dollar. Adding the non-realised currency loss, the overall net result for ‘Financial items and taxes’ shows a loss.
Nevertheless, the result for the 2015/16 financial year is satisfactory. The net result of €102.1 million is used to cover UEFA’s financing needs for the next three years and ensures its solidarity programmes are on safe ground.
INCOME STATEMENT
6
Consolidated income statement
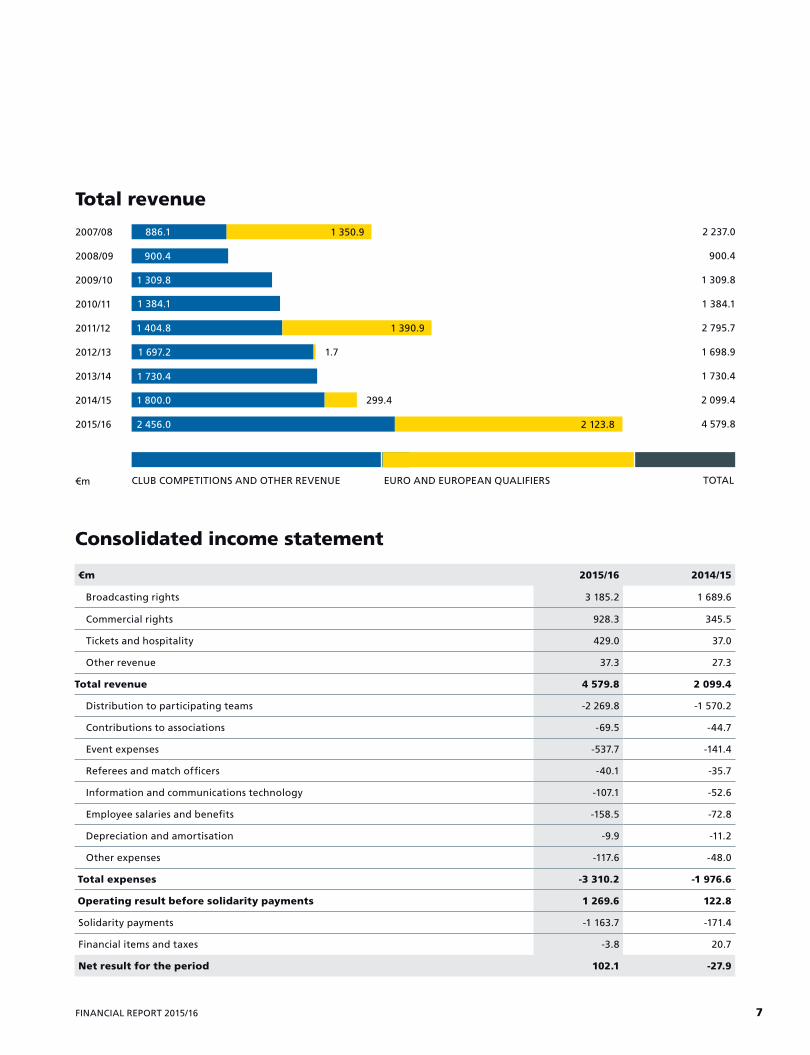
Total revenue
€m 2015/16 2014/15
Broadcasting rights 3 185.2 1 689.6
Commercial rights 928.3 345.5
Tickets and hospitality 429.0 37.0
Other revenue 37.3 27.3
Total revenue 4 579.8 2 099.4
Distribution to participating teams -2 269.8 -1 570.2
Contributions to associations -69.5 -44.7
Event expenses -537.7 -141.4
Referees and match officers -40.1 -35.7
Information and communications technology -107.1 -52.6
Employee salaries and benefits -158.5 -72.8
Depreciation and amortisation -9.9 -11.2
Other expenses -117.6 -48.0
Total expenses -3 310.2 -1 976.6
Operating result before solidarity payments 1 269.6 122.8
Solidarity payments -1 163.7 -171.4
Financial items and taxes -3.8 20.7
Net result for the period 102.1 -27.9
CLUB COMPETITIONS AND OTHER REVENUE EURO AND EUROPEAN QUALIFIERS
2007/08
2008/09
2009/10
2010/11
2011/12
2012/13
2013/14
2014/15
2015/16
886.1
900.4
1 384.1
1 404.8
1 697.2
1 730.4
1 800.0
2 456.0
1 350.9
1 390.9
2 123.8
299.4
1.7
2 237.0
900.4
1 309.8
1 384.1
2 795.7
1 698.9
1 730.4
2 099.4
4 579.8
TOTAL€m
1 309.8
7FINANCIAL REPORT 2015/16
DISTRIBUTION
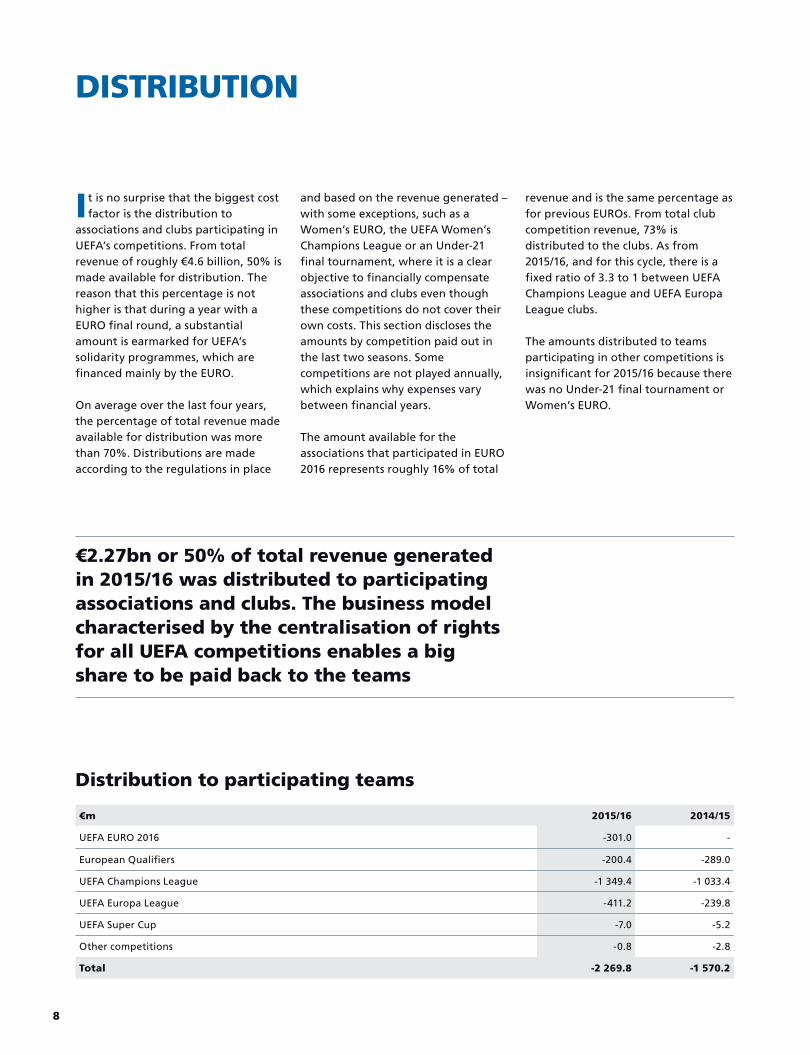
€m 2015/16 2014/15
UEFA EURO 2016 -301.0 -
European Qualifiers -200.4 -289.0
UEFA Champions League -1 349.4 -1 033.4
UEFA Europa League -411.2 -239.8
UEFA Super Cup -7.0 -5.2
Other competitions -0.8 -2.8
Total -2 269.8 -1 570.2
It is no surprise that the biggest cost factor is the distribution to
associations and clubs participating in UEFA’s competitions. From total revenue of roughly €4.6 billion, 50% is made available for distribution. The reason that this percentage is not higher is that during a year with a EURO final round, a substantial amount is earmarked for UEFA’s solidarity programmes, which are financed mainly by the EURO.
On average over the last four years, the percentage of total revenue made available for distribution was more than 70%. Distributions are made according to the regulations in place
and based on the revenue generated – with some exceptions, such as a Women’s EURO, the UEFA Women’s Champions League or an Under-21 final tournament, where it is a clear objective to financially compensate associations and clubs even though these competitions do not cover their own costs. This section discloses the amounts by competition paid out in the last two seasons. Some competitions are not played annually, which explains why expenses vary between financial years.
The amount available for the associations that participated in EURO 2016 represents roughly 16% of total
revenue and is the same percentage as for previous EUROs. From total club competition revenue, 73% is distributed to the clubs. As from 2015/16, and for this cycle, there is a fixed ratio of 3.3 to 1 between UEFA Champions League and UEFA Europa League clubs.
The amounts distributed to teams participating in other competitions is insignificant for 2015/16 because there was no Under-21 final tournament or Women’s EURO.
Distribution to participating teams
€2.27bn or 50% of total revenue generated in 2015/16 was distributed to participating associations and clubs. The business model characterised by the centralisation of rights for all UEFA competitions enables a big share to be paid back to the teams
8
SOLIDARITY
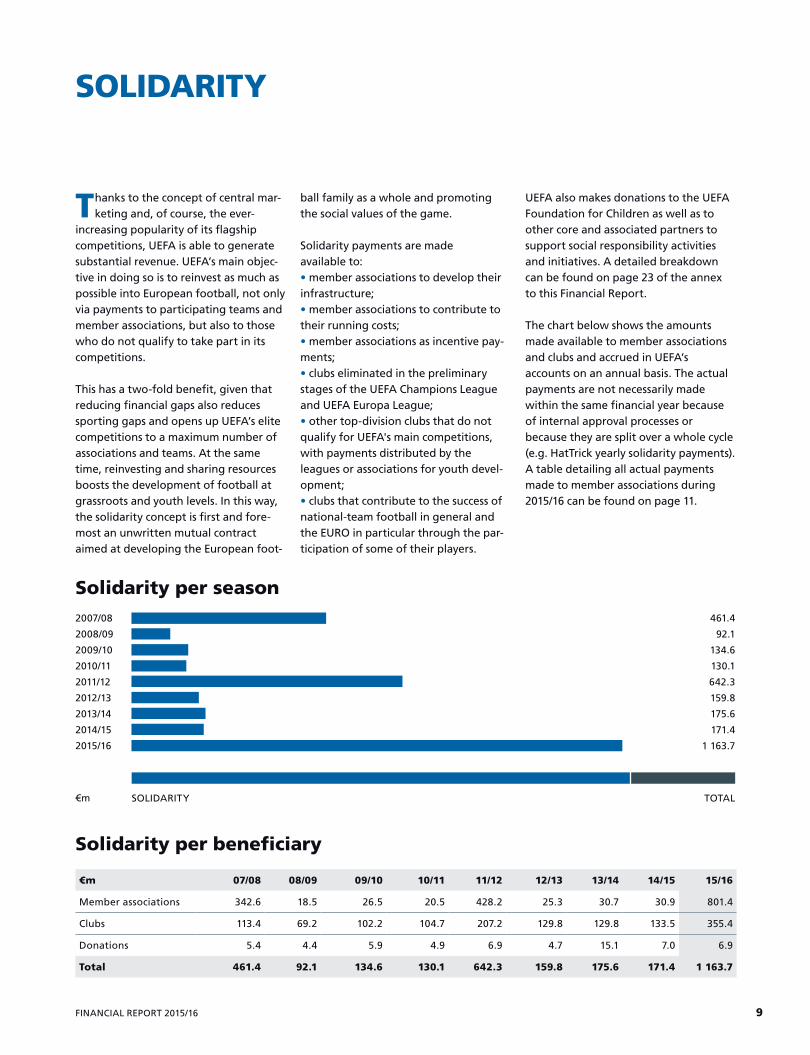
€m 07/08 08/09 09/10 10/11 11/12 12/13 13/14 14/15 15/16
Member associations 342.6 18.5 26.5 20.5 428.2 25.3 30.7 30.9 801.4
Clubs 113.4 69.2 102.2 104.7 207.2 129.8 129.8 133.5 355.4
Donations 5.4 4.4 5.9 4.9 6.9 4.7 15.1 7.0 6.9
Total 461.4 92.1 134.6 130.1 642.3 159.8 175.6 171.4 1 163.7
Thanks to the concept of central mar-keting and, of course, the ever-
increasing popularity of its flagship competitions, UEFA is able to generate substantial revenue. UEFA’s main objec-tive in doing so is to reinvest as much as possible into European football, not only via payments to participating teams and member associations, but also to those who do not qualify to take part in its competitions.
This has a two-fold benefit, given that reducing financial gaps also reduces sporting gaps and opens up UEFA’s elite competitions to a maximum number of associations and teams. At the same time, reinvesting and sharing resources boosts the development of football at grassroots and youth levels. In this way, the solidarity concept is first and fore-most an unwritten mutual contract aimed at developing the European foot-
ball family as a whole and promoting the social values of the game.
Solidarity payments are made available to:• member associations to develop their infrastructure;• member associations to contribute to their running costs;• member associations as incentive pay-ments;• clubs eliminated in the preliminary stages of the UEFA Champions League and UEFA Europa League;• other top-division clubs that do not qualify for UEFA's main competitions, with payments distributed by the leagues or associations for youth devel-opment;• clubs that contribute to the success of national-team football in general and the EURO in particular through the par-ticipation of some of their players.
UEFA also makes donations to the UEFA Foundation for Children as well as to other core and associated partners to support social responsibility activities and initiatives. A detailed breakdown can be found on page 23 of the annex to this Financial Report.
The chart below shows the amounts made available to member associations and clubs and accrued in UEFA’s accounts on an annual basis. The actual payments are not necessarily made within the same financial year because of internal approval processes or because they are split over a whole cycle (e.g. HatTrick yearly solidarity payments). A table detailing all actual payments made to member associations during 2015/16 can be found on page 11.
Solidarity per beneficiary
Solidarity per season
SOLIDARITY
2007/08
2008/09
2009/10
2010/11
2011/12
2012/13
2013/14
2014/15
2015/16
461.4
92.1
134.6
130.1
642.3
159.8
175.6
171.4
1 163.7
TOTAL€m
9FINANCIAL REPORT 2015/16
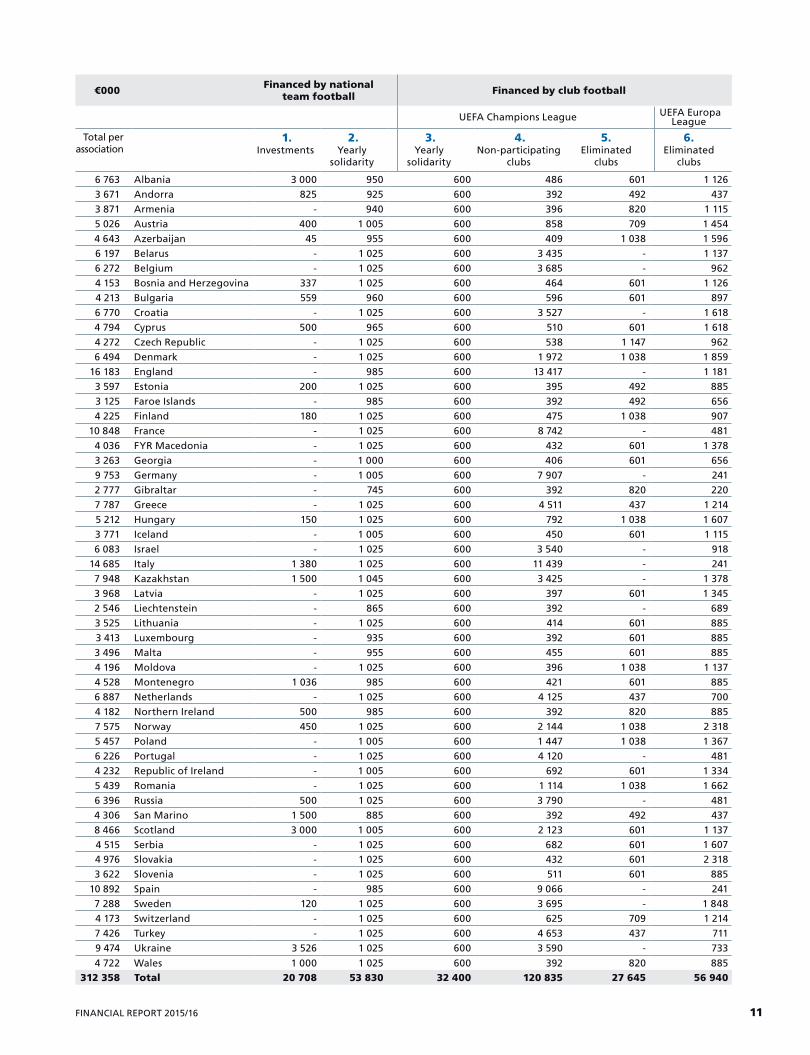
The flow of solidarity payments is an important part of the UEFA
Financial Report and provides a transparent overview of all solidarity payments to member associations as well as to clubs. The various beneficiaries are disclosed by country in the table on the opposite page.
When interpreting this information, account needs to be taken of the fact that a portion of solidarity payments stem from revenue generated by club competitions and that this part there-fore mainly benefits club football. The other part, financed by national-team football and derived from EUROs, is, to a large extent, made available to member associations within the frame-work of the HatTrick programme. However, the football family is not divided into two separate parts but is an integrated, interrelated whole. Solidarity within European football is based on mutual values, which means that earnings are channelled into club and national team football. These interrelationships can be illustrated by the fact that when a EURO takes place every four years, a significant portion of the revenue goes to the clubs which participate in the success of the tour-nament and national-team football in general. Likewise, as the table on the following page shows, a proportion of the annual income generated by club football benefits member associations.
Solidarity payments: national-team football
1. The HatTrick III programme for the 2012/13 to 2015/16 four-year cycle provided for a one-off € 3 million soli-darity payment to each UEFA member association to be used for investments in football infrastructure. The amounts distributed during the 2015/16 finan-cial year are disclosed in this section. In some cases, these might include pay-ments from previous HatTrick cycles.
2. The HatTrick programme also pro-vides for yearly solidarity payments in favour of member associations, con-sisting of the following elements:
• € 600,000 as a solidarity payment to contribute to current running costs• € 1,025,000 as a maximum incentive payment, divided up as follows:– € 250,000 max. for participating in UEFA youth, women’s and futsal com-petitions– € 250,000 max. for implementing and applying the UEFA club licensing system– € 100,000 max. for implementing and applying the UEFA Coaching Conven-tion– € 100,000 max. for implementing and applying the UEFA Grassroots Charter– € 100,000 max. for implementing and applying the UEFA Referee Convention– € 100,000 max. for implementing the UEFA Women’s Football Development Programme– € 100,000 max. for implementing the UEFA Good Governance Programme– € 25,000 max. for appointing an integrity officer
The maximum amount per association financed from national-team football is €1.025 million.
Solidarity payments: club football
3. € 32.4 million was channelled from the UEFA Champions League to mem-ber associations to contribute to the HatTrick yearly solidarity payments listed under point 2.
The total solidarity payment for 2015/16 in favour of a member associa-tion is therefore the sum of columns 2 and 3. The maximum amount available was € 1.625 million.
4. A substantial amount was made available for youth development to clubs not involved in either of the two main UEFA club competitions. As decided by the relevant leagues and/or member associations, clubs in the do-mestic top division and, in some cases, the next division down were included in this scheme.
5. A lump sum, depending on the number of matches played, was paid to clubs which were in the qualifiers but failed to reach the group stage of the UEFA Champions League, with an additional € 250,000 for a domestic champion. No payments were made to clubs involved in UEFA Champions League qualifying rounds which suc-ceeded in reaching the group stage.
6. The formula described in point 5 above was also applied to the UEFA Europa League.
THE FLOW OF UEFA SOLIDARITY PAYMENTS
10
€000 Financed by national team football Financed by club football
UEFA Champions League UEFA Europa League
Total per association
1. Investments
2. Yearly
solidarity
3. Yearly
solidarity
4. Non-parti cipating
clubs
5. Eliminated
clubs
6. Eliminated
clubs
6 763 Albania 3 000 950 600 486 601 1 126
3 671 Andorra 825 925 600 392 492 437
3 871 Armenia - 940 600 396 820 1 115
5 026 Austria 400 1 005 600 858 709 1 454
4 643 Azerbaijan 45 955 600 409 1 038 1 596
6 197 Belarus - 1 025 600 3 435 - 1 137
6 272 Belgium - 1 025 600 3 685 - 962
4 153 Bosnia and Herzegovina 337 1 025 600 464 601 1 126
4 213 Bulgaria 559 960 600 596 601 897
6 770 Croatia - 1 025 600 3 527 - 1 618
4 794 Cyprus 500 965 600 510 601 1 618
4 272 Czech Republic - 1 025 600 538 1 147 962
6 494 Denmark - 1 025 600 1 972 1 038 1 859
16 183 England - 985 600 13 417 - 1 181
3 597 Estonia 200 1 025 600 395 492 885
3 125 Faroe Islands - 985 600 392 492 656
4 225 Finland 180 1 025 600 475 1 038 907
10 848 France - 1 025 600 8 742 - 481
4 036 FYR Macedonia - 1 025 600 432 601 1 378
3 263 Georgia - 1 000 600 406 601 656
9 753 Germany - 1 005 600 7 907 - 241
2 777 Gibraltar - 745 600 392 820 220
7 787 Greece - 1 025 600 4 511 437 1 214
5 212 Hungary 150 1 025 600 792 1 038 1 607
3 771 Iceland - 1 005 600 450 601 1 115
6 083 Israel - 1 025 600 3 540 - 918
14 685 Italy 1 380 1 025 600 11 439 - 241
7 948 Kazakhstan 1 500 1 045 600 3 425 - 1 378
3 968 Latvia - 1 025 600 397 601 1 345
2 546 Liechtenstein - 865 600 392 - 689
3 525 Lithuania - 1 025 600 414 601 885
3 413 Luxembourg - 935 600 392 601 885
3 496 Malta - 955 600 455 601 885
4 196 Moldova - 1 025 600 396 1 038 1 137
4 528 Montenegro 1 036 985 600 421 601 885
6 887 Netherlands - 1 025 600 4 125 437 700
4 182 Northern Ireland 500 985 600 392 820 885
7 575 Norway 450 1 025 600 2 144 1 038 2 318
5 457 Poland - 1 005 600 1 447 1 038 1 367
6 226 Portugal - 1 025 600 4 120 - 481
4 232 Republic of Ireland - 1 005 600 692 601 1 334
5 439 Romania - 1 025 600 1 114 1 038 1 662
6 396 Russia 500 1 025 600 3 790 - 481
4 306 San Marino 1 500 885 600 392 492 437
8 466 Scotland 3 000 1 005 600 2 123 601 1 137
4 515 Serbia - 1 025 600 682 601 1 607
4 976 Slovakia - 1 025 600 432 601 2 318
3 622 Slovenia - 1 025 600 511 601 885
10 892 Spain - 985 600 9 066 - 241
7 288 Sweden 120 1 025 600 3 695 - 1 848
4 173 Switzerland - 1 025 600 625 709 1 214
7 426 Turkey - 1 025 600 4 653 437 711
9 474 Ukraine 3 526 1 025 600 3 590 - 733
4 722 Wales 1 000 1 025 600 392 820 885 312 358 Total 20 708 53 830 32 400 120 835 27 645 56 940
11FINANCIAL REPORT 2015/16
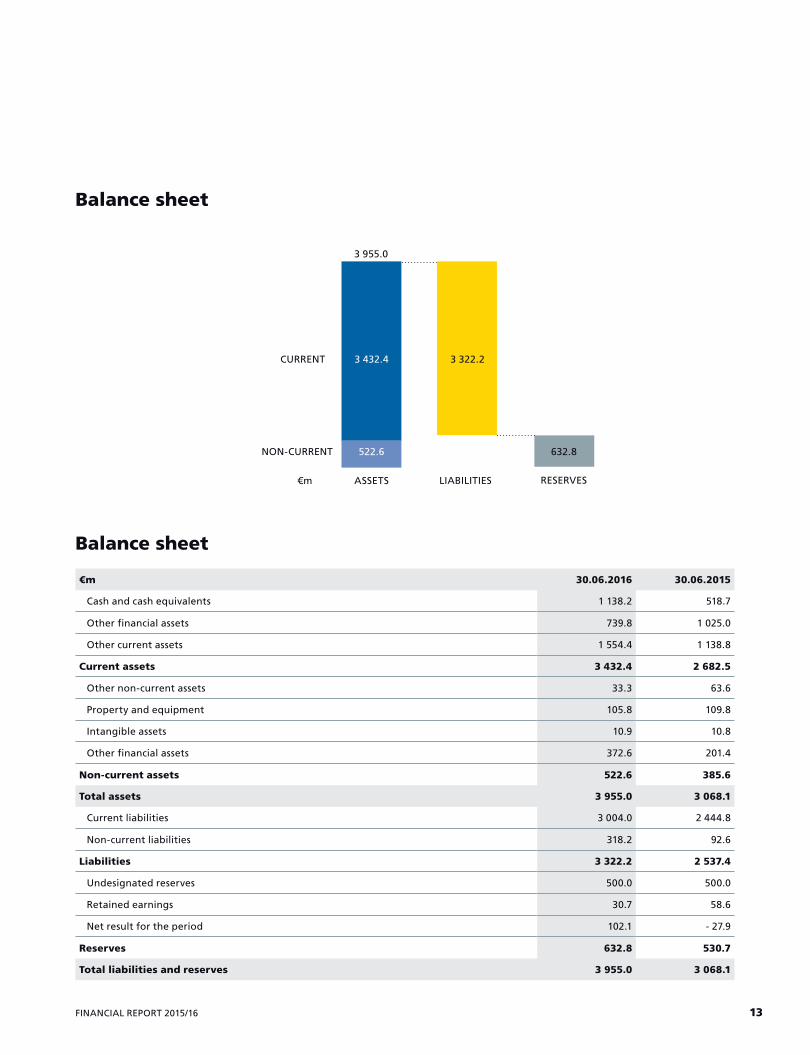
UEFA’s balance sheet total increased by €887 million or 29%
compared with the previous year-end, to just below €4 billion. This increase is natural, with there being a much higher cash inflow from partners right at the end of EURO 2016, while solidarity payments to member associations and clubs, for instance, will not be made until after the balance sheet date. At the same time, retained earnings increased to part-finance UEFA’s activities over the next three years.
As at balance sheet date, cash and cash equivalents and other financial assets stood at €2.25 billion, up from €1.75 billion at the end of the previous year. This position is substantial, representing alone 57% of total assets. Almost two-thirds of UEFA’s total financial assets are invested short-term to cover all commitments related to the HatTrick solidarity programme and the UEFA club competitions. The remainder is invested in long-term capital-protected securities and, to a lesser extent, to provide loans. UEFA is aware of the exposure of its financial assets. Risk management is therefore of paramount importance, and security aspects and a conservative investment approach are top priorities.
The increase in ‘Other current assets’ is mainly due to higher receivables, which are up by €543 million. This
is an exceptional situation related to invoices payable by EURO 2016 partners. Deferred EURO 2016 competition costs were recognised in the period under review and decreased as a consequence.
In 2015/16 there was no capital expenditure in property and only smaller investments in equipment and intangible assets with an overall acquisition value of €5.9 million (2014/15: €11.1m). Depreciation and amortisation for the period was some 12% lower compared with the previous season. In total, this led to a further reduction in the net book value of fixed assets compared with the previous year-end.
Current liabilities increased by €559 million. A major tournament such as EURO 2016, with some matches played after the balance sheet closing date, entails some special closing transactions. EURO accounts are recognised in the period when the vast majority of the matches are played (i.e. in 2015/16 in the case of EURO 2016). Consequently, a higher number of supplier invoices will have to be paid in the following financial year. Payables (i.e. supplier invoices received before the balance sheet closing date) therefore increased and also include payables to member associations and clubs. Under current liabilities, by far the largest portion relates to ‘Accrued
expenses and deferred income’, amounting to €1.61 billion as at 30 June 2016 (€1.72 billion as at 30 June 2015) and corresponding to income deferred for coming seasons. As at the end of June 2016, non-current liabilities came to €318.2 million (€92.6 million as at 30 June 2015). This increase corresponds to the creation of a HatTrick IV yearly solidarity provision for 2017/18 and onwards.
UEFA’s cash base remains strong and its financial position is sound, with a surplus of current assets over current liabilities of roughly €428 million, giving a coverage ratio of 114% (110% as at 30 June 2015). This comfortable cushion is needed to finance HatTrick IV solidarity payments, which are reported under non-current liabilities. As a result of the further increase in liabilities, UEFA’s reserves as a percentage of the total balance sheet decreased to 16% (17% as at 30 June 2015). This decrease was offset slightly by the positive result for the period. More details on UEFA’s reserves and their use can be found on page 14, under 'Own resources'.
BALANCE SHEET
Cash and cash equivalents and other financial assets stood at €2.25 billion, representing alone 57% of total assets. UEFA is aware of the exposure and risk management is therefore taken very seriously, with security aspects and a conservative investment approach top priorities
12
Balance sheet
Balance sheet
3 955.0
3 432.4 3 322.2
632.8522.6
€m 30.06.2016 30.06.2015
Cash and cash equivalents 1 138.2 518.7
Other financial assets 739.8 1 025.0
Other current assets 1 554.4 1 138.8
Current assets 3 432.4 2 682.5
Other non-current assets 33.3 63.6
Property and equipment 105.8 109.8
Intangible assets 10.9 10.8
Other financial assets 372.6 201.4
Non-current assets 522.6 385.6
Total assets 3 955.0 3 068.1
Current liabilities 3 004.0 2 444.8
Non-current liabilities 318.2 92.6
Liabilities 3 322.2 2 537.4
Undesignated reserves 500.0 500.0
Retained earnings 30.7 58.6
Net result for the period 102.1 - 27.9
Reserves 632.8 530.7
Total liabilities and reserves 3 955.0 3 068.1
NON-CURRENT
ASSETS€m LIABILITIES RESERVES
CURRENT
13FINANCIAL REPORT 2015/16
OWN RESOURCES
UEFA’s own resources are referred to as reserves and include the
following items:
• undesignated reserves• retained earnings• net result for the period
The 2012 UEFA Congress in Istanbul agreed that undesignated reserves be fixed at €500 million. This decision was based on the assumption that undesignated reserves correspond to the reserves UEFA needs to be covered against any business risk. At the moment, undesignated reserves reflect its actual risk exposure as at the end of
this reporting period. However, given the continued increase in revenue as a result of, for instance, the centralisation of the European Qualifiers and the creation of the UEFA Nations League, the requirements may need to be reconsidered. For this reason, the risk situation is always monitored. If needed, the Executive Committee could propose to the UEFA Congress that special designated reserves be created to allow funds to be put aside to finance specific long-term projects. For transparency reasons, those designated reserves would be separate from the undesignated reserves.
Retained earnings constitute part of the amount UEFA needs to cover its running expenses in years when there is no EURO. Retained earnings move close to zero before the end of a EURO cycle (i.e. 2018/19), reflecting the not-for-profit status of the organisation.
The net result for the period shows the financial outcome for the year under review.
UEFA’s total reserves increased as a consequence of the positive net result generated in 2015/16 and now stand at €632.8 million.
Get
ty Im
ages
14
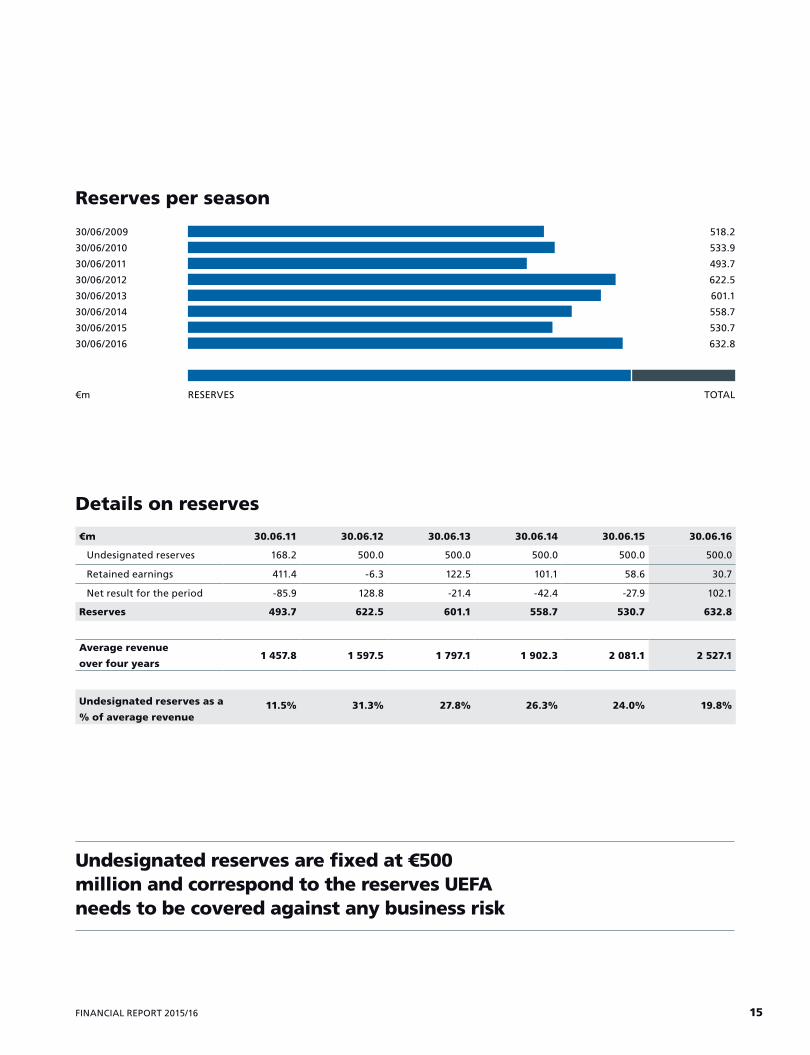
€m 30.06.11 30.06.12 30.06.13 30.06.14 30.06.15 30.06.16
Undesignated reserves 168.2 500.0 500.0 500.0 500.0 500.0
Retained earnings 411.4 -6.3 122.5 101.1 58.6 30.7
Net result for the period -85.9 128.8 -21.4 -42.4 -27.9 102.1
Reserves 493.7 622.5 601.1 558.7 530.7 632.8
Average revenue
over four years1 457.8 1 597.5 1 797.1 1 902.3 2 081.1 2 527.1
Undesignated reserves as a
% of average revenue11.5% 31.3% 27.8% 26.3% 24.0% 19.8%
Reserves per season
Details on reserves
Undesignated reserves are fixed at €500 million and correspond to the reserves UEFA needs to be covered against any business risk
30/06/2009
30/06/2010
30/06/2011
30/06/2012
30/06/2013
30/06/2014
30/06/2015
30/06/2016
518.2
533.9
493.7
622.5
601.1
558.7
530.7
632.8
RESERVES€m TOTAL
15FINANCIAL REPORT 2015/16
RESULT BY COMPETITION AND ACTIVITY
UEFA’s cost accounting is set up in such a way that the result can be
analysed from different angles. The financial statements are classified by nature and checked by our external auditors, as published in the annex to this Financial Report as well as on page 7.
But it is also important to disclose sup-plementary information on the source and the use of income. Therefore, in parallel and as complementary infor-mation, UEFA breaks down its result by competition and activity.
The source of net income (revenue minus expenses) reflects the net result from:
• Main competitions: this shows the net result of national-team and club competitions. The income from a EURO
is recognised in the year the tourna-ment takes place, i.e. in 2015/16 in the case of EURO 2016. 2015/16 also marks the second year of the European Quali-fiers.
• Other revenue and asset mana-gement: other revenue represents income from fines, contributions from FIFA and other non-football related matters. Asset management reflects in-come from financial investments net of any fees, as well as currency exchange differences.
The use of net income is divided into four sections, with more details published on page 19 under ‘Use of income’:
• HatTrick programme and social responsibility: this is the sum of accruals made for HatTrick solidarity
programme and the HatTrick admin-istrative costs as well as football and social responsibility activities.
• Other competitions: these are net investments in women’s, youth and amateur, as well as futsal competitions.
• Other football activities: this relates to development, education and conferences, and includes a range of initiatives that UEFA undertakes to further improve football in areas such as knowledge exchange between asso-ciations, refereeing, coaching, stadium and security, grassroots, as well as dop-ing and medical matters.
• Governing expenses: this groups administrative overheads and institu-tional costs, as explained on page 20.
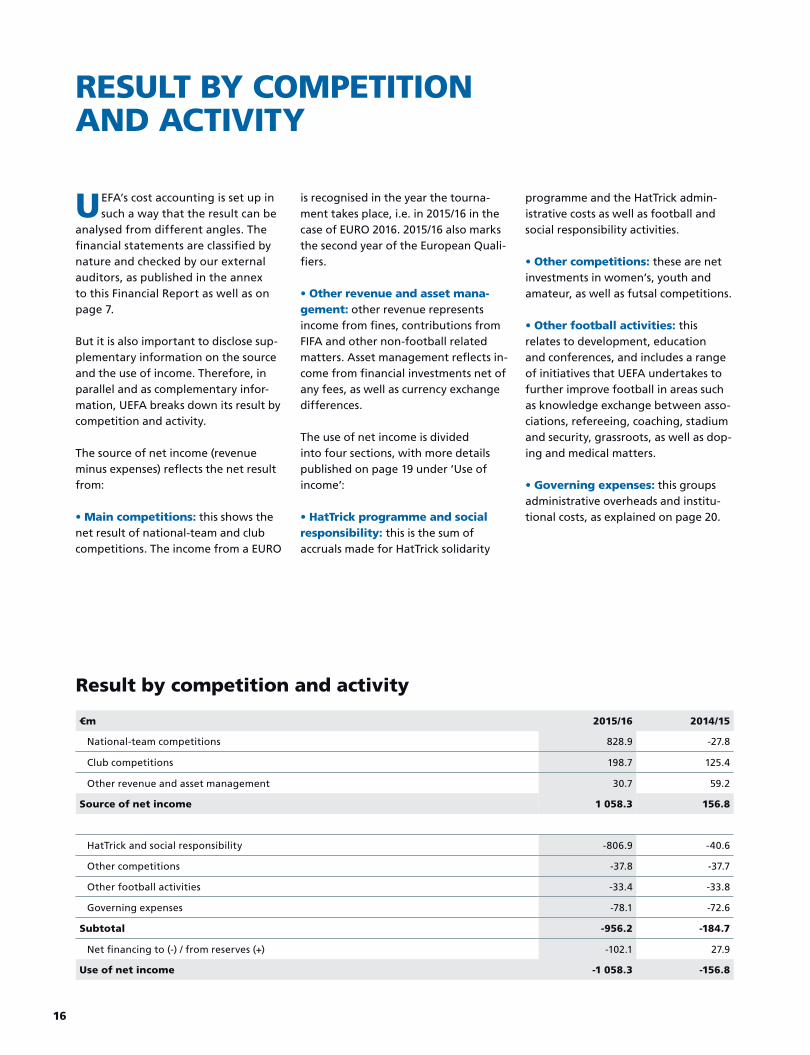
Result by competition and activity
€m 2015/16 2014/15
National-team competitions 828.9 -27.8
Club competitions 198.7 125.4
Other revenue and asset management 30.7 59.2
Source of net income 1 058.3 156.8
HatTrick and social responsibility -806.9 -40.6
Other competitions -37.8 -37.7
Other football activities -33.4 -33.8
Governing expenses -78.1 -72.6
Subtotal -956.2 -184.7
Net financing to (-) / from reserves (+) -102.1 27.9
Use of net income -1 058.3 -156.8
16
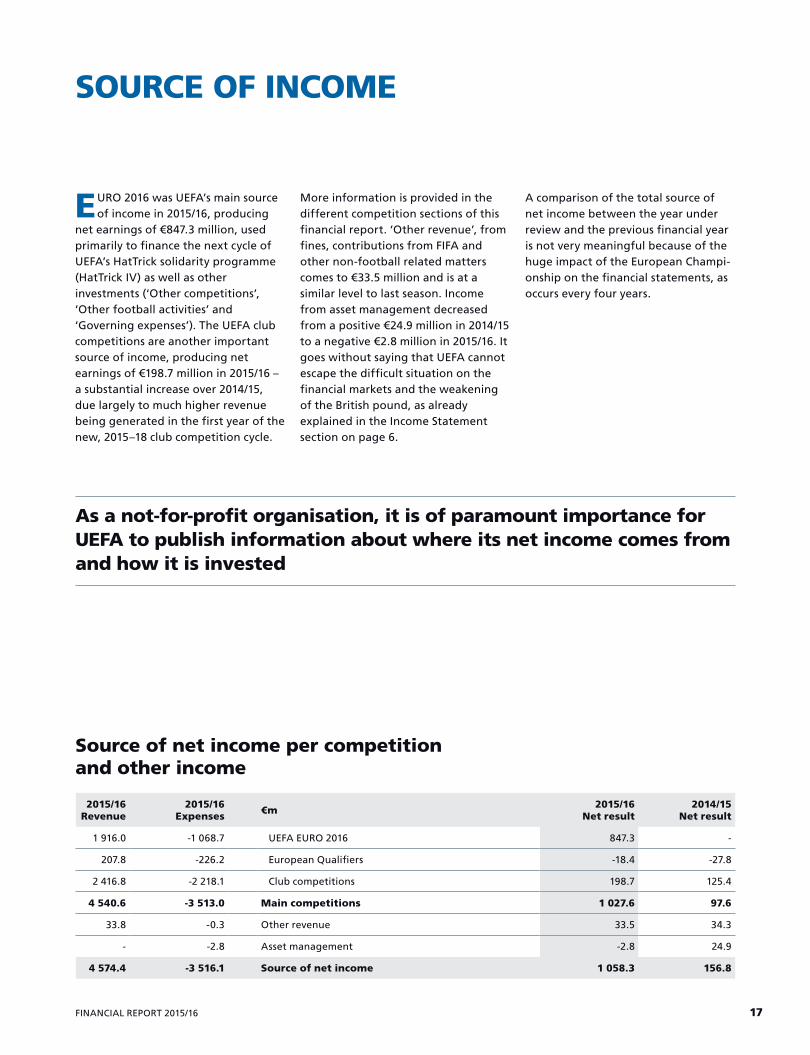
EURO 2016 was UEFA’s main source of income in 2015/16, producing
net earnings of €847.3 million, used primarily to finance the next cycle of UEFA’s HatTrick solidarity programme (HatTrick IV) as well as other investments (‘Other competitions’, ‘Other football activities’ and ‘Governing expenses’). The UEFA club competitions are another important source of income, producing net earnings of €198.7 million in 2015/16 – a substantial increase over 2014/15, due largely to much higher revenue being generated in the first year of the new, 2015–18 club competition cycle.
More information is provided in the different competition sections of this financial report. ‘Other revenue’, from fines, contributions from FIFA and other non-football related matters comes to €33.5 million and is at a similar level to last season. Income from asset management decreased from a positive €24.9 million in 2014/15 to a negative €2.8 million in 2015/16. It goes without saying that UEFA cannot escape the difficult situation on the financial markets and the weakening of the British pound, as already explained in the Income Statement section on page 6.
A comparison of the total source of net income between the year under review and the previous financial year is not very meaningful because of the huge impact of the European Champi-onship on the financial statements, as occurs every four years.
SOURCE OF INCOME
2015/16Revenue
2015/16Expenses €m 2015/16
Net result2014/15
Net result
1 916.0 -1 068.7 UEFA EURO 2016 847.3 -
207.8 -226.2 European Qualifiers -18.4 -27.8
2 416.8 -2 218.1 Club competitions 198.7 125.4
4 540.6 -3 513.0 Main competitions 1 027.6 97.6
33.8 -0.3 Other revenue 33.5 34.3
- -2.8 Asset management -2.8 24.9
4 574.4 -3 516.1 Source of net income 1 058.3 156.8
Source of net income per competition and other income
As a not-for-profit organisation, it is of paramount importance for UEFA to publish information about where its net income comes from and how it is invested
17FINANCIAL REPORT 2015/16
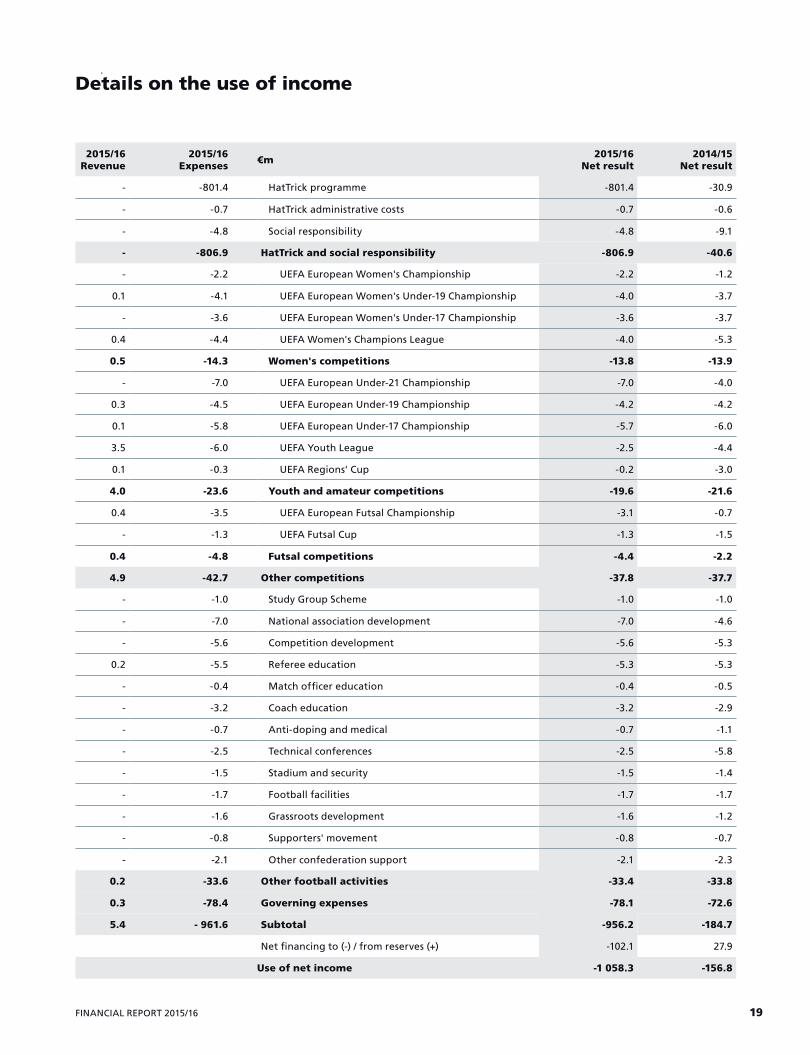
The table on the opposite page details investments made in the
HatTrick programme, social responsibility, ‘Other competitions’ and ‘Other football activities’.
Clearly, accruals for the HatTrick IV solidarity programme (€509.4m) account for the largest part of these investments. Roughly 85% was accrued in 2015/16 and the remaining 15% will be recognised in the following three financial years. HatTrick payments to UEFA member associations are recorded in the balance sheet. In addition, €292 million is put aside and earmarked for additional solidarity payments or as a provision to finance commitments and guarantees related to future European Qualifiers cycles and the UEFA Nations League.
UEFA invests, on average, around €40 million in staging women’s, age-limit
and futsal competitions, and the UEFA Regions’ Cup. In the year under review, the only major final tournament to take place was the UEFA Futsal EURO in Serbia, with a net investment of €3.1 million. The second season of the UEFA Youth League represented an investment of approximately €2.5 million – €1.9 million less than the previous year, thanks to higher broadcasting and media rights sales. Altogether, total investment in ‘Other competitions’ came to €37.8 million (2014/15: €37.7m).
An important statutory duty of UEFA is to promote and monitor the development of every type of football in Europe. The different activities that come under the heading of ‘Other football activities’ are described in the UEFA administrative report, but it is still important to disclose here how much has been invested in these types
of activity. On average, over €33 million is invested in football development, conferences and education. The table on the opposite page shows the amounts invested in each activity.
UEFA’s governing expenses amounted to €78.1 million in 2015/16 (2014/15: €72.6m). These refer to all expenses not attributed to a competition or a project, and are grouped as administrative overheads and institutional expenses. Further details are published under ‘Governing expenses’ on page 21.
Finally, the net result for the period stands at €102.1 million (2014/15: €-27.9m) and will part-finance UEFA during the coming three seasons without a EURO.
USE OF INCOME
EURO 2016 put HatTrick IV and further solidarity programmes on safe ground
UEF
A
2015/16Revenue
2015/16Expenses €m 2015/16
Net result2014/15
Net result
- -801.4 HatTrick programme -801.4 -30.9
- -0.7 HatTrick administrative costs -0.7 -0.6
- -4.8 Social responsibility -4.8 -9.1
- -806.9 HatTrick and social responsibility -806.9 -40.6
- -2.2 UEFA European Women's Championship -2.2 -1.2
0.1 -4.1 UEFA European Women's Under-19 Championship -4.0 -3.7
- -3.6 UEFA European Women's Under-17 Championship -3.6 -3.7
0.4 -4.4 UEFA Women's Champions League -4.0 -5.3
0.5 -14.3 Women's competitions -13.8 -13.9
- -7.0 UEFA European Under-21 Championship -7.0 -4.0
0.3 -4.5 UEFA European Under-19 Championship -4.2 -4.2
0.1 -5.8 UEFA European Under-17 Championship -5.7 -6.0
3.5 -6.0 UEFA Youth League -2.5 -4.4
0.1 -0.3 UEFA Regions' Cup -0.2 -3.0
4.0 -23.6 Youth and amateur competitions -19.6 -21.6
0.4 -3.5 UEFA European Futsal Championship -3.1 -0.7
- -1.3 UEFA Futsal Cup -1.3 -1.5
0.4 -4.8 Futsal competitions -4.4 -2.2
4.9 -42.7 Other competitions -37.8 -37.7
- -1.0 Study Group Scheme -1.0 -1.0
- -7.0 National association development -7.0 -4.6
- -5.6 Competition development -5.6 -5.3
0.2 -5.5 Referee education -5.3 -5.3
- -0.4 Match officer education -0.4 -0.5
- -3.2 Coach education -3.2 -2.9
- -0.7 Anti-doping and medical -0.7 -1.1
- -2.5 Technical conferences -2.5 -5.8
- -1.5 Stadium and security -1.5 -1.4
- -1.7 Football facilities -1.7 -1.7
- -1.6 Grassroots development -1.6 -1.2
- -0.8 Supporters' movement -0.8 -0.7
- -2.1 Other confederation support -2.1 -2.3
0.2 -33.6 Other football activities -33.4 -33.8
0.3 -78.4 Governing expenses -78.1 -72.6
5.4 - 961.6 Subtotal -956.2 -184.7
Net financing to (-) / from reserves (+) -102.1 27.9
Use of net income -1 058.3 -156.8
Details on the use of income
19FINANCIAL REPORT 2015/16
GOVERNING EXPENSES
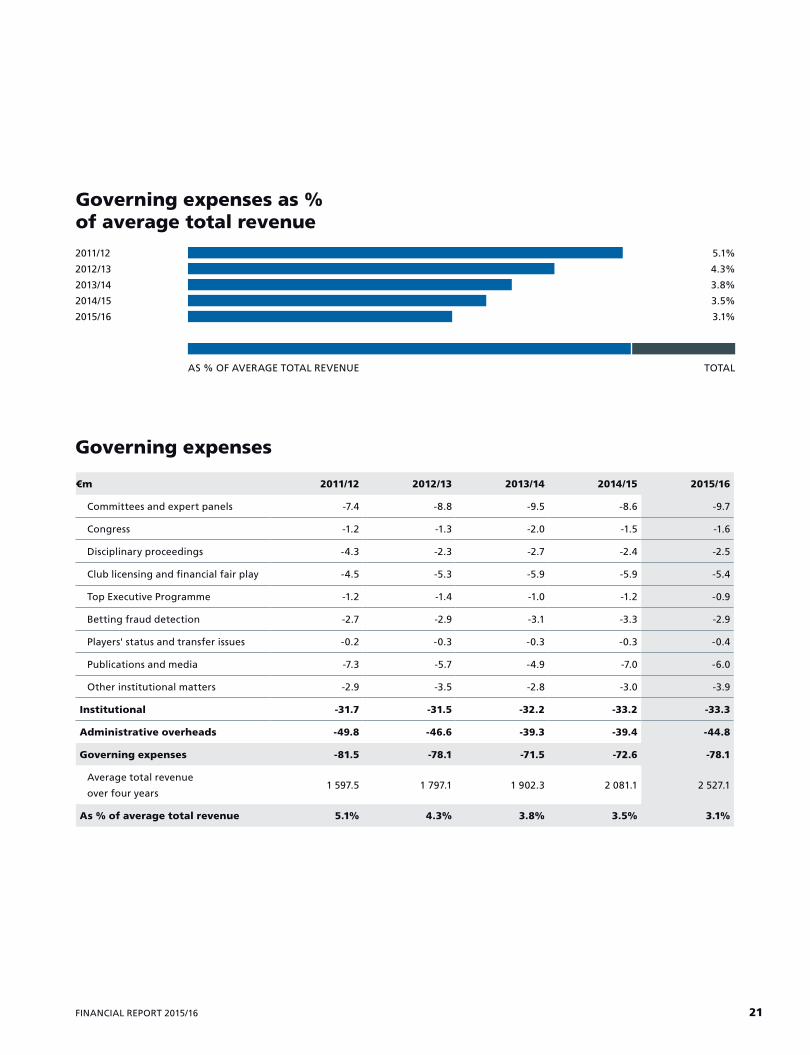
Expenses related to the running of UEFA as a governing body are
classified under two headings:
• Institutional: this relates to costs to run UEFA as a political and govern-ing institution, which includes the congress, committees and disciplinary proceedings, among others.
• Administrative overheads: these comprise personnel and other gen-eral administrative costs such as travel and office running costs which are not allocated to a competition or an activity. Essentially, these costs are for the ‘division management’ of all
UEFA divisions as well as unit costs for legal, finance, language services and human resources. Total administrative overheads went up mainly due to non-allocated accruals for holidays not yet taken and for EURO 2016 bonuses. And as staff are paid in local currency, the stronger Swiss franc against the euro continued to have a negative impact on total costs.
Nevertheless, UEFA remains committed to keeping governing expenses as low as possible in order to allow maximum resources to be allocated to solidarity, football development and to teams participating in its competitions. The
percentage of governing expenses in relation to total average revenue is a key indicator for UEFA and closely monitored. This percentage has come down in the last years, reaching about 3% in 2015/16.
The table opposite shows details of net governing expenses for the last five seasons, with annual total expenses and average total revenue over four years set against each other. This offers the best basis for comparison, bearing in mind that such comparisons would otherwise be distorted by a EURO every fourth year.
UEF
A
€m 2011/12 2012/13 2013/14 2014/15 2015/16
Committees and expert panels -7.4 -8.8 -9.5 -8.6 -9.7
Congress -1.2 -1.3 -2.0 -1.5 -1.6
Disciplinary proceedings -4.3 -2.3 -2.7 -2.4 -2.5
Club licensing and financial fair play -4.5 -5.3 -5.9 -5.9 -5.4
Top Executive Programme -1.2 -1.4 -1.0 -1.2 -0.9
Betting fraud detection -2.7 -2.9 -3.1 -3.3 -2.9
Players' status and transfer issues -0.2 -0.3 -0.3 -0.3 -0.4
Publications and media -7.3 -5.7 -4.9 -7.0 -6.0
Other institutional matters -2.9 -3.5 -2.8 -3.0 -3.9
Institutional -31.7 -31.5 -32.2 -33.2 -33.3
Administrative overheads -49.8 -46.6 -39.3 -39.4 -44.8
Governing expenses -81.5 -78.1 -71.5 -72.6 -78.1
Average total revenue
over four years 1 597.5 1 797.1 1 902.3 2 081.1 2 527.1
As % of average total revenue 5.1% 4.3% 3.8% 3.5% 3.1%
Governing expenses as % of average total revenue
Governing expenses
2011/12
2012/13
2013/14
2014/15
2015/16
5.1%
4.3%
3.8%
3.5%
3.1%
AS % OF AVERAGE TOTAL REVENUE TOTAL
21FINANCIAL REPORT 2015/16
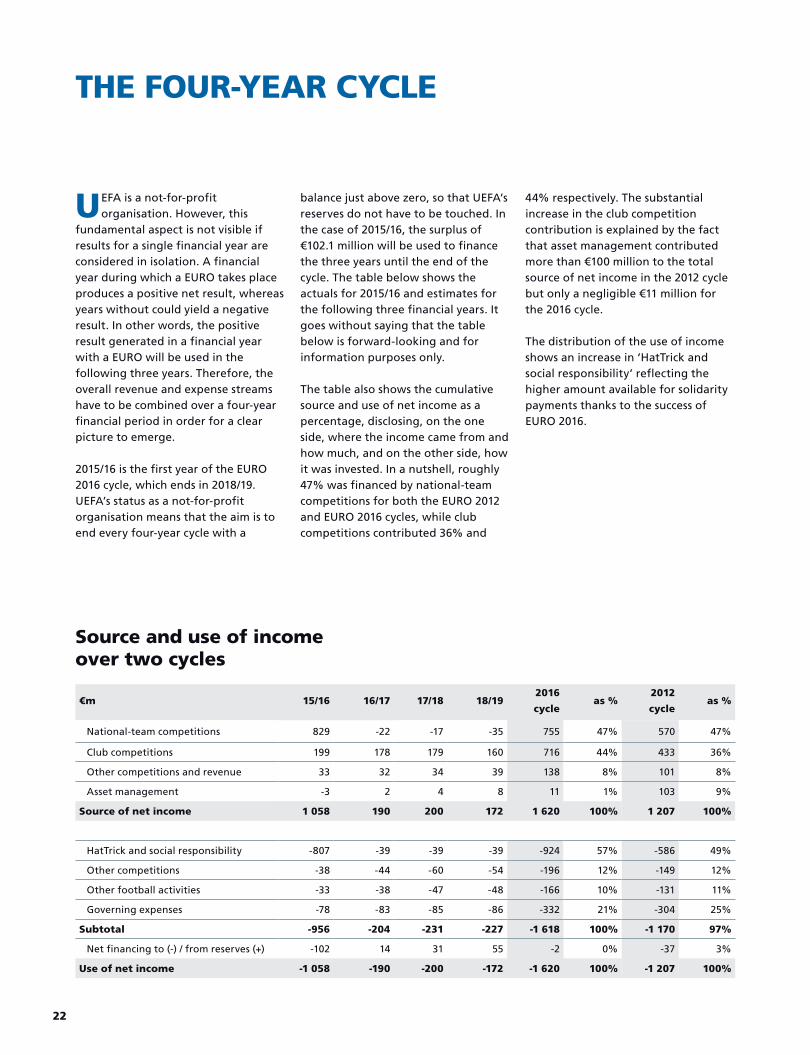
UEFA is a not-for-profit organisation. However, this
fundamental aspect is not visible if results for a single financial year are considered in isolation. A financial year during which a EURO takes place produces a positive net result, whereas years without could yield a negative result. In other words, the positive result generated in a financial year with a EURO will be used in the following three years. Therefore, the overall revenue and expense streams have to be combined over a four-year financial period in order for a clear picture to emerge.
2015/16 is the first year of the EURO 2016 cycle, which ends in 2018/19. UEFA’s status as a not-for-profit organisation means that the aim is to end every four-year cycle with a
balance just above zero, so that UEFA’s reserves do not have to be touched. In the case of 2015/16, the surplus of €102.1 million will be used to finance the three years until the end of the cycle. The table below shows the actuals for 2015/16 and estimates for the following three financial years. It goes without saying that the table below is forward-looking and for information purposes only.
The table also shows the cumulative source and use of net income as a percentage, disclosing, on the one side, where the income came from and how much, and on the other side, how it was invested. In a nutshell, roughly 47% was financed by national-team competitions for both the EURO 2012 and EURO 2016 cycles, while club competitions contributed 36% and
44% respectively. The substantial increase in the club competition contribution is explained by the fact that asset management contributed more than €100 million to the total source of net income in the 2012 cycle but only a negligible €11 million for the 2016 cycle. The distribution of the use of income shows an increase in ‘HatTrick and social responsibility’ reflecting the higher amount available for solidarity payments thanks to the success of EURO 2016.
Source and use of income over two cycles
THE FOUR-YEAR CYCLE
€m 15/16 16/17 17/18 18/192016
cycleas %
2012
cycleas %
National-team competitions 829 -22 -17 -35 755 47% 570 47%
Club competitions 199 178 179 160 716 44% 433 36%
Other competitions and revenue 33 32 34 39 138 8% 101 8%
Asset management -3 2 4 8 11 1% 103 9%
Source of net income 1 058 190 200 172 1 620 100% 1 207 100%
HatTrick and social responsibility -807 -39 -39 -39 -924 57% -586 49%
Other competitions -38 -44 -60 -54 -196 12% -149 12%
Other football activities -33 -38 -47 -48 -166 10% -131 11%
Governing expenses -78 -83 -85 -86 -332 21% -304 25%
Subtotal -956 -204 -231 -227 -1 618 100% -1 170 97%
Net financing to (-) / from reserves (+) -102 14 31 55 -2 0% -37 3%
Use of net income -1 058 -190 -200 -172 -1 620 100% -1 207 100%
22
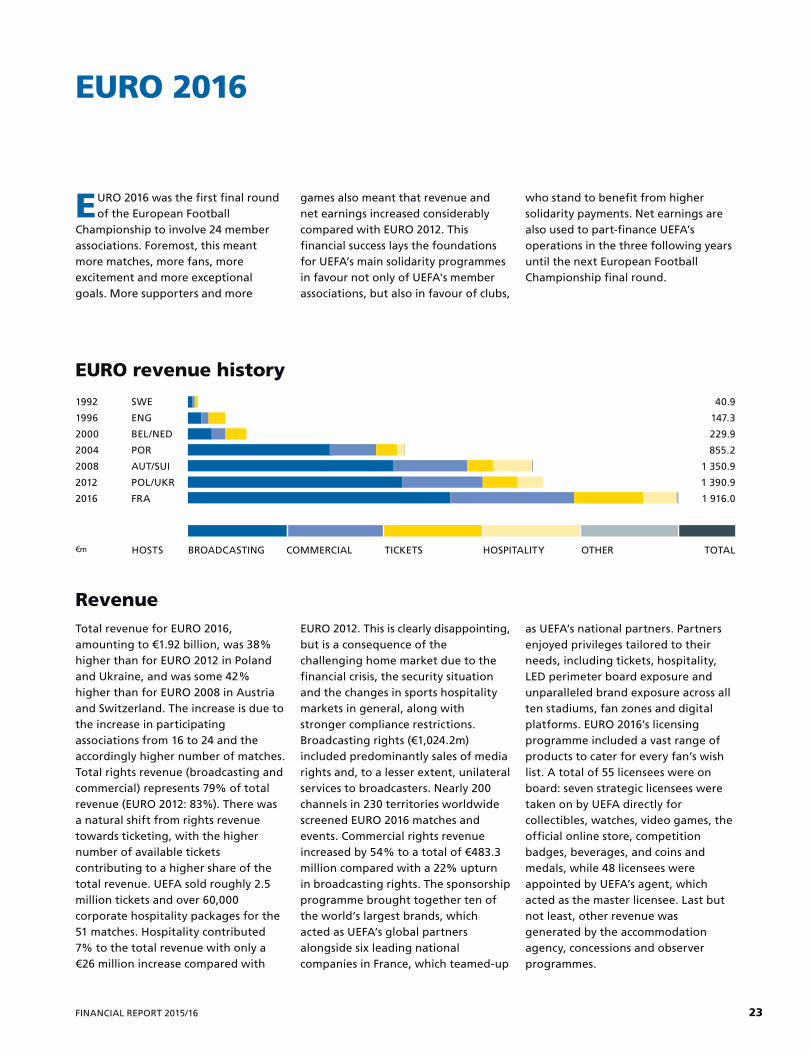
EURO 2016 was the first final round of the European Football
Championship to involve 24 member associations. Foremost, this meant more matches, more fans, more excitement and more exceptional goals. More supporters and more
games also meant that revenue and net earnings increased considerably compared with EURO 2012. This financial success lays the foundations for UEFA’s main solidarity programmes in favour not only of UEFA's member associations, but also in favour of clubs,
who stand to benefit from higher solidarity payments. Net earnings are also used to part-finance UEFA’s operations in the three following years until the next European Football Championship final round.
EURO 2016
Total revenue for EURO 2016, amounting to €1.92 billion, was 38 % higher than for EURO 2012 in Poland and Ukraine, and was some 42 % higher than for EURO 2008 in Austria and Switzerland. The increase is due to the increase in participating associations from 16 to 24 and the accordingly higher number of matches. Total rights revenue (broadcasting and commercial) represents 79% of total revenue (EURO 2012: 83%). There was a natural shift from rights revenue towards ticketing, with the higher number of available tickets contributing to a higher share of the total revenue. UEFA sold roughly 2.5 million tickets and over 60,000 corporate hospitality packages for the 51 matches. Hospitality contributed 7% to the total revenue with only a €26 million increase compared with
EURO 2012. This is clearly disappointing, but is a consequence of the challenging home market due to the financial crisis, the security situation and the changes in sports hospitality markets in general, along with stronger compliance restrictions. Broadcasting rights (€1,024.2m) included predominantly sales of media rights and, to a lesser extent, unilateral services to broadcasters. Nearly 200 channels in 230 territories worldwide screened EURO 2016 matches and events. Commercial rights revenue increased by 54 % to a total of €483.3 million compared with a 22% upturn in broadcasting rights. The sponsorship programme brought together ten of the world’s largest brands, which acted as UEFA’s global partners alongside six leading national companies in France, which teamed-up
as UEFA’s national partners. Partners enjoyed privileges tailored to their needs, including tickets, hospitality, LED perimeter board exposure and unparalleled brand exposure across all ten stadiums, fan zones and digital platforms. EURO 2016’s licensing programme included a vast range of products to cater for every fan’s wish list. A total of 55 licensees were on board: seven strategic licensees were taken on by UEFA directly for collectibles, watches, video games, the official online store, competition badges, beverages, and coins and medals, while 48 licensees were appointed by UEFA’s agent, which acted as the master licensee. Last but not least, other revenue was generated by the accommodation agency, concessions and observer programmes.
EURO revenue history
1992
1996
2000
2004
2008
2012
2016
40.9
147.3
229.9
855.2
1 350.9
1 390.9
1 916.0
SWE
ENG
BEL/NED
POR
AUT/SUI
POL/UKR
FRA
€m HOSTS TOTALBROADCASTING COMMERCIAL TICKETS HOSPITALITY OTHER
Revenue
23FINANCIAL REPORT 2015/16
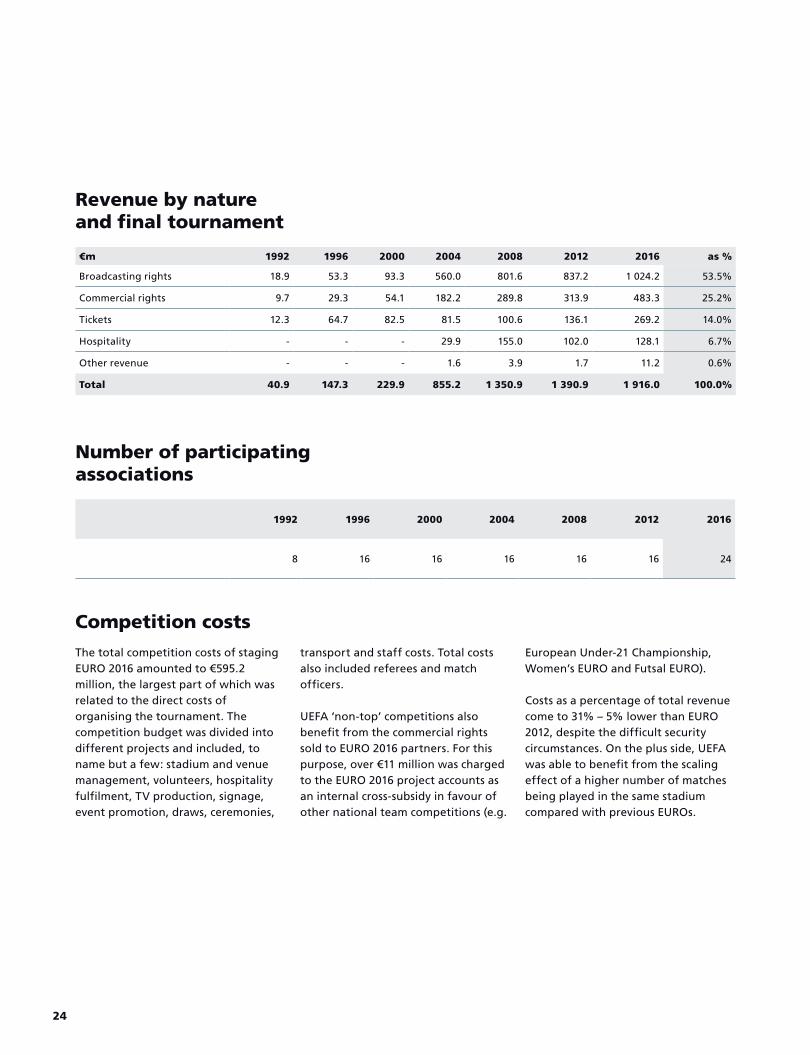
The total competition costs of staging EURO 2016 amounted to €595.2 million, the largest part of which was related to the direct costs of organising the tournament. The competition budget was divided into different projects and included, to name but a few : stadium and venue management, volunteers, hospitality fulfilment, TV production, signage, event promotion, draws, ceremonies,
transport and staff costs. Total costs also included referees and match officers.
UEFA ‘non-top’ competitions also benefit from the commercial rights sold to EURO 2016 partners. For this purpose, over €11 million was charged to the EURO 2016 project accounts as an internal cross-subsidy in favour of other national team competitions (e.g.
European Under-21 Championship, Women’s EURO and Futsal EURO).
Costs as a percentage of total revenue come to 31% – 5% lower than EURO 2012, despite the difficult security circumstances. On the plus side, UEFA was able to benefit from the scaling effect of a higher number of matches being played in the same stadium compared with previous EUROs.
Competition costs
€m 1992 1996 2000 2004 2008 2012 2016 as %
Broadcasting rights 18.9 53.3 93.3 560.0 801.6 837.2 1 024.2 53.5%
Commercial rights 9.7 29.3 54.1 182.2 289.8 313.9 483.3 25.2%
Tickets 12.3 64.7 82.5 81.5 100.6 136.1 269.2 14.0%
Hospitality - - - 29.9 155.0 102.0 128.1 6.7%
Other revenue - - - 1.6 3.9 1.7 11.2 0.6%
Total 40.9 147.3 229.9 855.2 1 350.9 1 390.9 1 916.0 100.0%
Revenue by nature and final tournament
1992 1996 2000 2004 2008 2012 2016
8 16 16 16 16 16 24
Number of participating associations
24
Get
ty Im
ages
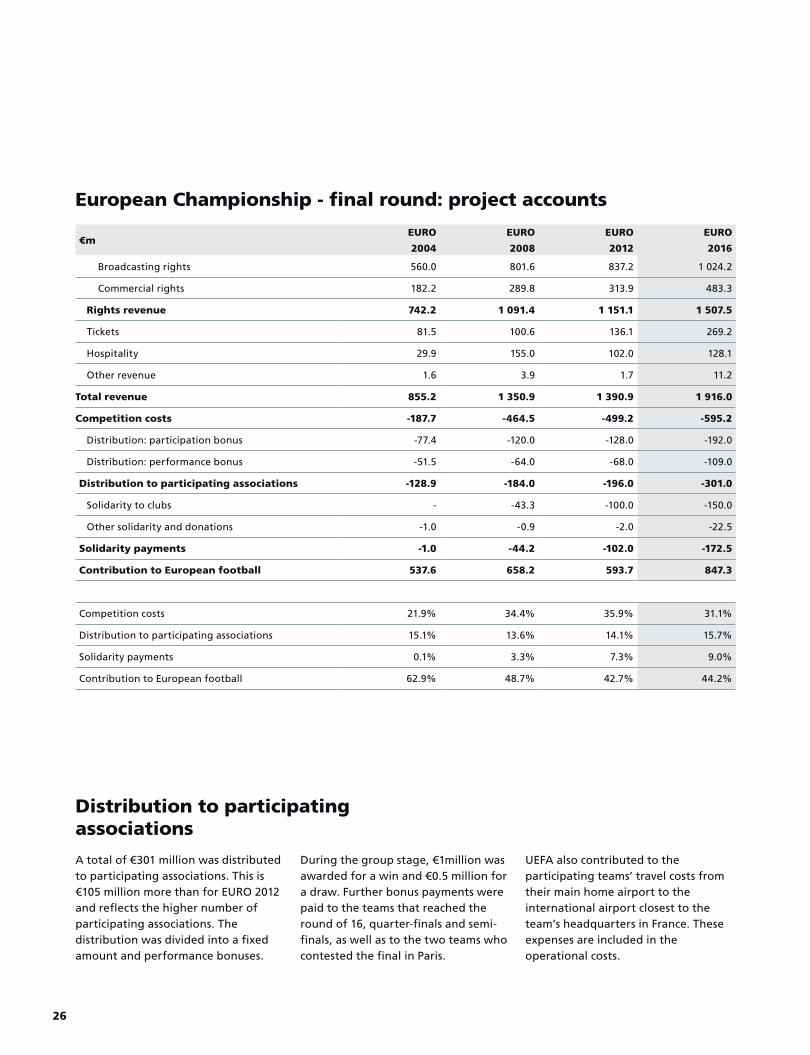
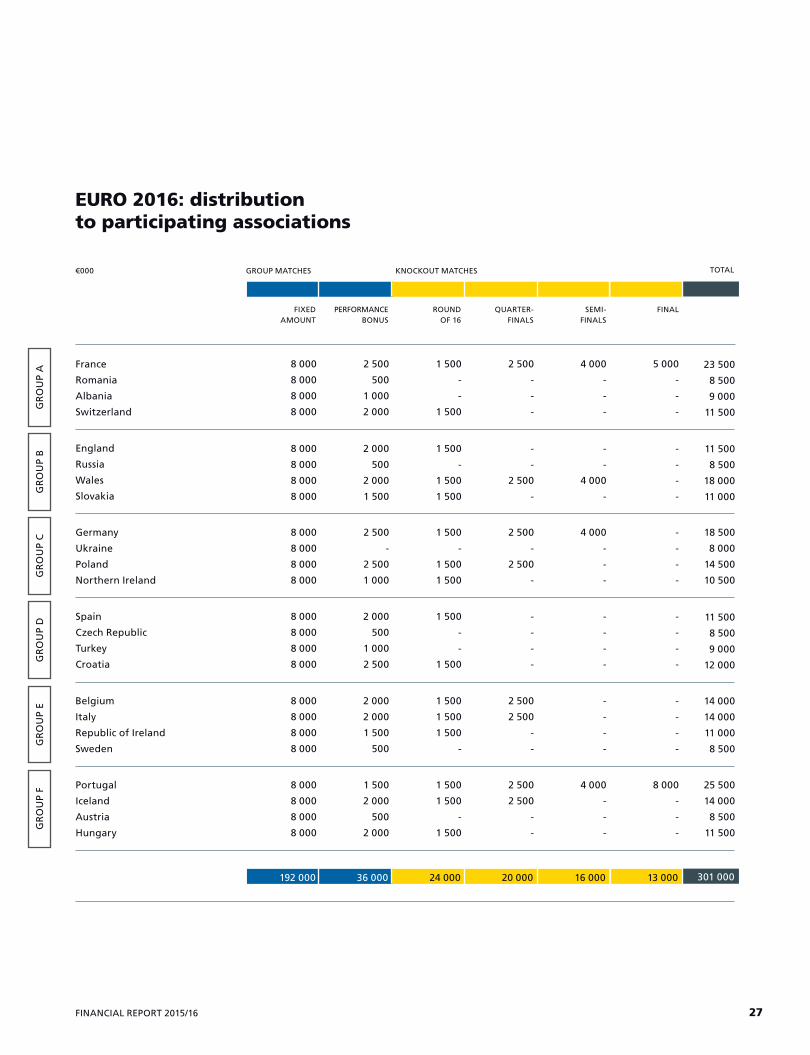
A total of €301 million was distributed to participating associations. This is €105 million more than for EURO 2012 and reflects the higher number of participating associations. The distribution was divided into a fixed amount and performance bonuses.
During the group stage, €1million was awarded for a win and €0.5 million for a draw. Further bonus payments were paid to the teams that reached the round of 16, quarter-finals and semi-finals, as well as to the two teams who contested the final in Paris.
UEFA also contributed to the participating teams’ travel costs from their main home airport to the international airport closest to the team’s headquarters in France. These expenses are included in the operational costs.
Distribution to participating associations
€mEURO
2004
EURO
2008
EURO
2012
EURO
2016
Broadcasting rights 560.0 801.6 837.2 1 024.2
Commercial rights 182.2 289.8 313.9 483.3
Rights revenue 742.2 1 091.4 1 151.1 1 507.5
Tickets 81.5 100.6 136.1 269.2
Hospitality 29.9 155.0 102.0 128.1
Other revenue 1.6 3.9 1.7 11.2
Total revenue 855.2 1 350.9 1 390.9 1 916.0
Competition costs -187.7 -464.5 -499.2 -595.2
Distribution: participation bonus -77.4 -120.0 -128.0 -192.0
Distribution: performance bonus -51.5 -64.0 -68.0 -109.0
Distribution to participating associations -128.9 -184.0 -196.0 -301.0
Solidarity to clubs - -43.3 -100.0 -150.0
Other solidarity and donations -1.0 -0.9 -2.0 -22.5
Solidarity payments -1.0 -44.2 -102.0 -172.5
Contribution to European football 537.6 658.2 593.7 847.3
Competition costs 21.9% 34.4% 35.9% 31.1%
Distribution to participating associations 15.1% 13.6% 14.1% 15.7%
Solidarity payments 0.1% 3.3% 7.3% 9.0%
Contribution to European football 62.9% 48.7% 42.7% 44.2%
European Championship - final round: project accounts
26
EURO 2016: distribution to participating associations
France
Romania
Albania
SwitzerlandGR
OU
P A
GR
OU
P B
GR
OU
P C
GR
OU
P D
GR
OU
P E
GR
OU
P F
England
Russia
Wales
Slovakia
Germany
Ukraine
Poland
Northern Ireland
Spain
Czech Republic
Turkey
Croatia
Belgium
Italy
Republic of Ireland
Sweden
Portugal
Iceland
Austria
Hungary
301 000192 000 36 000 24 000 20 000 16 000 13 000
GROUP MATCHES KNOCKOUT MATCHES TOTAL
FIXED AMOUNT
PERFORMANCE BONUS
ROUND OF 16
QUARTER-FINALS
SEMI-FINALS
FINAL
€000
23 500
8 500
9 000
11 500
11 500
8 500
18 000
11 000
18 500
8 000
14 500
10 500
11 500
8 500
9 000
12 000
14 000
14 000
11 000
8 500
25 500
14 000
8 500
11 500
8 000
8 000
8 000
8 000
2 500
500
1 000
2 000
1 500
-
-
1 500
2 500
-
-
-
4 000
-
-
-
5 000
-
-
-
8 000
8 000
8 000
8 000
2 000
500
2 000
1 500
1 500
-
1 500
1 500
-
-
2 500
-
-
-
4 000
-
-
-
-
-
8 000
8 000
8 000
8 000
2 500
-
2 500
1 000
1 500
-
1 500
1 500
2 500
-
2 500
-
4 000
-
-
-
-
-
-
-
8 000
8 000
8 000
8 000
2 000
500
1 000
2 500
1 500
-
-
1 500
-
-
-
-
-
-
-
-
-
-
-
-
8 000
8 000
8 000
8 000
2 000
2 000
1 500
500
1 500
1 500
1 500
-
2 500
2 500
-
-
-
-
-
-
-
-
-
-
8 000
8 000
8 000
8 000
1 500
2 000
500
2 000
1 500
1 500
-
1 500
2 500
2 500
-
-
4 000
-
-
-
8 000
-
-
-
27FINANCIAL REPORT 2015/16
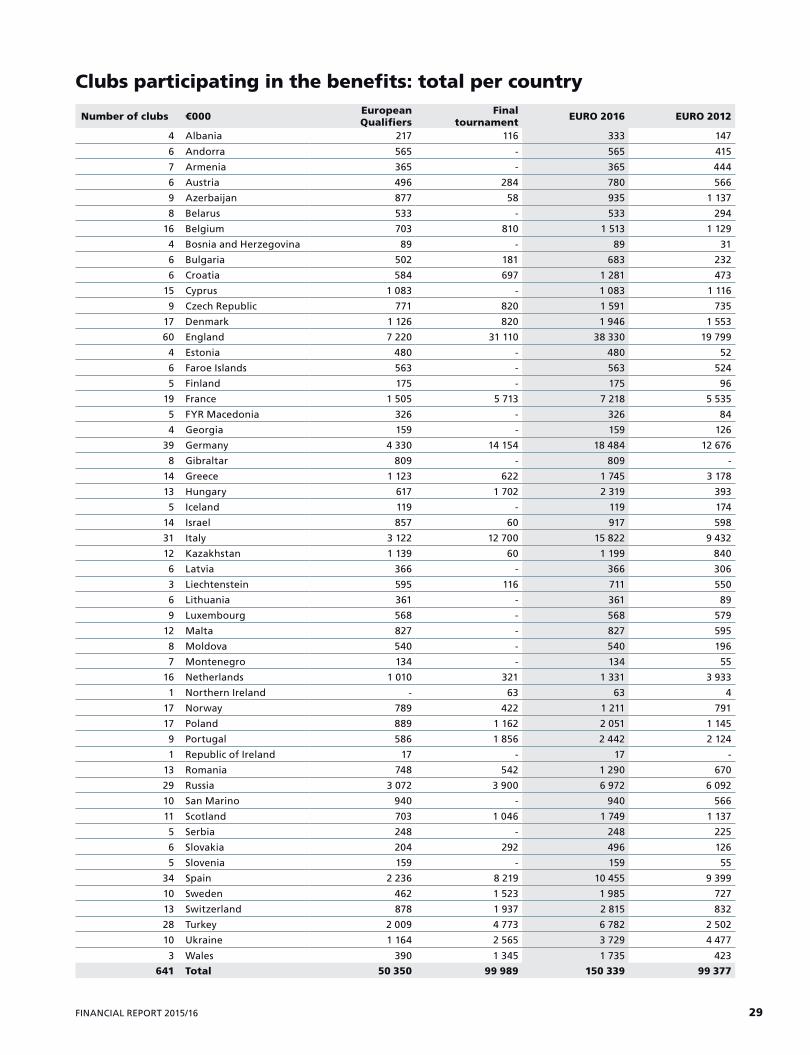
As the table on the opposite page reveals, clubs across UEFA’s territory benefited from EURO 2016 to the tune of €150 million, a €50 million increase on 2012. The amount available for distribution included a balance from EURO 2012 and was also distributed in autumn 2016 via the member associations to 641 clubs (EURO 2012: 575 clubs). €50.4 million was paid to those clubs who released players during the qualifying phase, irrespective of whether the national team in question qualified for the final tournament or not, and the remaining €100 million was distributed to those that released players for the final tournament. For the qualifiers, including the friendlies involving France, an average amount per player and per game of €4,193 was distributed on the basis of the match
sheet. And for the final tournament, the distribution was calculated on a per player per day basis, with the associations grouped according to the FIFA Club Categorisation for Training Compensation, amounting to an average of €5,955 per player per day. In contrast to the HatTrick programme accrual, solidarity payments to clubs were charged directly to the EURO 2016 project accounts.
Once again, it is no surprise that the ten clubs receiving the highest solidarity payments have been among the most successful in recent editions of the UEFA Champions League. These top ten clubs include five from England, two from Germany, two from Spain and one from Italy. The highest payment – roughly €3.5 million – went to Juventus Football Club. But it goes
without saying that all member associations benefited, including very small ones such as Gibraltar.
Besides the solidarity to clubs, UEFA invested a share (€2.5m) of its revenue to ensure that EURO 2016 was organised in the most socially responsible and sustainable manner possible. Under the Respect banner, UEFA worked with its social responsibility partners to seek to make sure that all fans felt welcome at the tournament with, for instance, stadiums tobacco-free and fully accessible to disabled people. Furthermore, the ten host cities each received €2 million as a contribution from UEFA to invest in a legacy project to build grassroots sports facilities and to provide equipment, thus leaving a real EURO 2016 footprint in France.
Solidarity to clubs and donations
Despite the €50 million in additional solidarity payments to clubs, the competition result (€847.3m) is significantly higher than in 2012 (€593.7m). The higher number of participating associations and the lower costs as a percentage produced an increase of over 40%. On the other hand, UEFA has to be self-critical and
accept that hospitality sales were below expectations, as already mentioned.
It is important to underline that these earnings will not remain with UEFA, but will be invested straight back into the game – primarily into solidarity programmes such as HatTrick. For the
sake of transparency, those investments are not charged to the EURO 2016 project accounts, so as not to dilute the net result. More information about UEFA’s investment programmes is provided under ‘Use of income’ and ‘HatTrick’.
Contribution to European football
The increase in the number of teams meant more matches and more fans, which had a tremendous impact on revenue and net earnings
28
Clubs participating in the benefits: total per country
Number of clubs €000 European Qualifiers
Final tournament EURO 2016 EURO 2012
4 Albania 217 116 333 147
6 Andorra 565 - 565 415
7 Armenia 365 - 365 444
6 Austria 496 284 780 566
9 Azerbaijan 877 58 935 1 137
8 Belarus 533 - 533 294
16 Belgium 703 810 1 513 1 129
4 Bosnia and Herzegovina 89 - 89 31
6 Bulgaria 502 181 683 232
6 Croatia 584 697 1 281 473
15 Cyprus 1 083 - 1 083 1 116
9 Czech Republic 771 820 1 591 735
17 Denmark 1 126 820 1 946 1 553
60 England 7 220 31 110 38 330 19 799
4 Estonia 480 - 480 52
6 Faroe Islands 563 - 563 524
5 Finland 175 - 175 96
19 France 1 505 5 713 7 218 5 535
5 FYR Macedonia 326 - 326 84
4 Georgia 159 - 159 126
39 Germany 4 330 14 154 18 484 12 676
8 Gibraltar 809 - 809 -
14 Greece 1 123 622 1 745 3 178
13 Hungary 617 1 702 2 319 393
5 Iceland 119 - 119 174
14 Israel 857 60 917 598
31 Italy 3 122 12 700 15 822 9 432
12 Kazakhstan 1 139 60 1 199 840
6 Latvia 366 - 366 306
3 Liechtenstein 595 116 711 550
6 Lithuania 361 - 361 89
9 Luxembourg 568 - 568 579
12 Malta 827 - 827 595
8 Moldova 540 - 540 196
7 Montenegro 134 - 134 55
16 Netherlands 1 010 321 1 331 3 933
1 Northern Ireland - 63 63 4
17 Norway 789 422 1 211 791
17 Poland 889 1 162 2 051 1 145
9 Portugal 586 1 856 2 442 2 124
1 Republic of Ireland 17 - 17 -
13 Romania 748 542 1 290 670
29 Russia 3 072 3 900 6 972 6 092
10 San Marino 940 - 940 566
11 Scotland 703 1 046 1 749 1 137
5 Serbia 248 - 248 225
6 Slovakia 204 292 496 126
5 Slovenia 159 - 159 55
34 Spain 2 236 8 219 10 455 9 399
10 Sweden 462 1 523 1 985 727
13 Switzerland 878 1 937 2 815 832
28 Turkey 2 009 4 773 6 782 2 502
10 Ukraine 1 164 2 565 3 729 4 477
3 Wales 390 1 345 1 735 423
641 Total 50 350 99 989 150 339 99 377
29FINANCIAL REPORT 2015/16
The fourth edition of the HatTrick programme (2016/17–2019/20) is
now under way. As the name suggests, the programme is built on three pillars: investment funding, knowledge-sharing and sports education. Launched to coincide with UEFA’s 50th anniversary, HatTrick, started to gain momentum after the successful EURO 2004 in Portugal.
Financed mainly by the EURO, the aim of the HatTrick programme is to provide financial support to all 55 UEFA member associations for projects designed to develop and foster football at all levels. For more than a decade now, HatTrick has had a positive impact on the development of European football, helping to strengthen the roots of the game across the continent.
The UEFA HatTrick Regulations define the financial contributions available, as well as the types of project, investment and initiative eligible for support, and the administrative tasks that have to be fulfilled in order to receive HatTrick funding.
EURO 2016 created substantial earnings which allowed an even bigger solidarity scheme to be put in place, from which, as always, all member associations benefit, and not just those who took part in the final tournament.
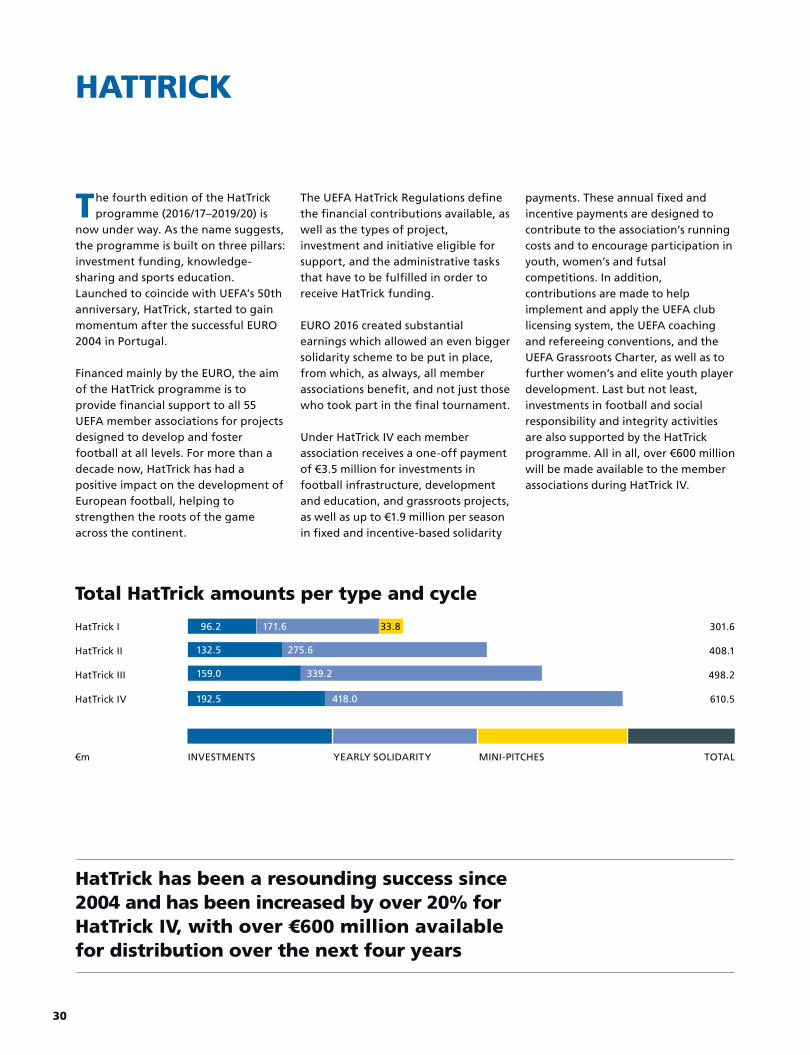
Under HatTrick IV each member association receives a one-off payment of €3.5 million for investments in football infrastructure, development and education, and grassroots projects, as well as up to €1.9 million per season in fixed and incentive-based solidarity
payments. These annual fixed and incentive payments are designed to contribute to the association’s running costs and to encourage participation in youth, women’s and futsal competitions. In addition, contributions are made to help implement and apply the UEFA club licensing system, the UEFA coaching and refereeing conventions, and the UEFA Grassroots Charter, as well as to further women’s and elite youth player development. Last but not least, investments in football and social responsibility and integrity activities are also supported by the HatTrick programme. All in all, over €600 million will be made available to the member associations during HatTrick IV.
HATTRICK
HatTrick has been a resounding success since 2004 and has been increased by over 20% for HatTrick IV, with over €600 million available for distribution over the next four years
Total HatTrick amounts per type and cycle
301.6
408.1
498.2
610.5
96.2 171.6
132.5 275.6
159.0
192.5
339.2
418.0
33.8
€m
HatTrick I
HatTrick II
HatTrick III
HatTrick IV
INVESTMENTS YEARLY SOLIDARITY MINI-PITCHES TOTAL
30
FPF
The European Qualifiers for UEFA EURO 2016 were played from
September 2014 to November 2015 to determine the 23 national teams that would join the hosts, France, in the final tournament. A total of 53 national teams participated in the qualifying competition, with Gibraltar taking part for the first time. The qualifying draw took place at the Palais des Congrès Acropolis in Nice on 23 February 2014, where the associations were drawn into eight groups of six and one group of five associations, giving each team five home matches, or four in the case of the group of five. France were put in this group of five so that the tournament hosts, who qualified automatically, could play friendlies against the other teams in the group on their ‘spare’ dates. Following the group matches, eight play-offs were played to complete the line-up for the final round. In all, 288 qualifying
matches and centralised friendlies were played.
The newly introduced Week of Football, featuring qualifying matches across six days from Thursday to Tuesday every match week, transformed the whole qualifying landscape, put national teams in a prime position and gave them greater visibility, while at the same time giving fans more excitement and more matches to follow. Each of the UEFA member associations had mandated UEFA to centralise all the qualifying matches as well as some friendlies as regards the marketing of media rights and certain sponsor inventories under the European Qualifiers umbrella for two qualifying competitions – for EURO 2016 in France and for the 2018 FIFA World Cup in Russia.
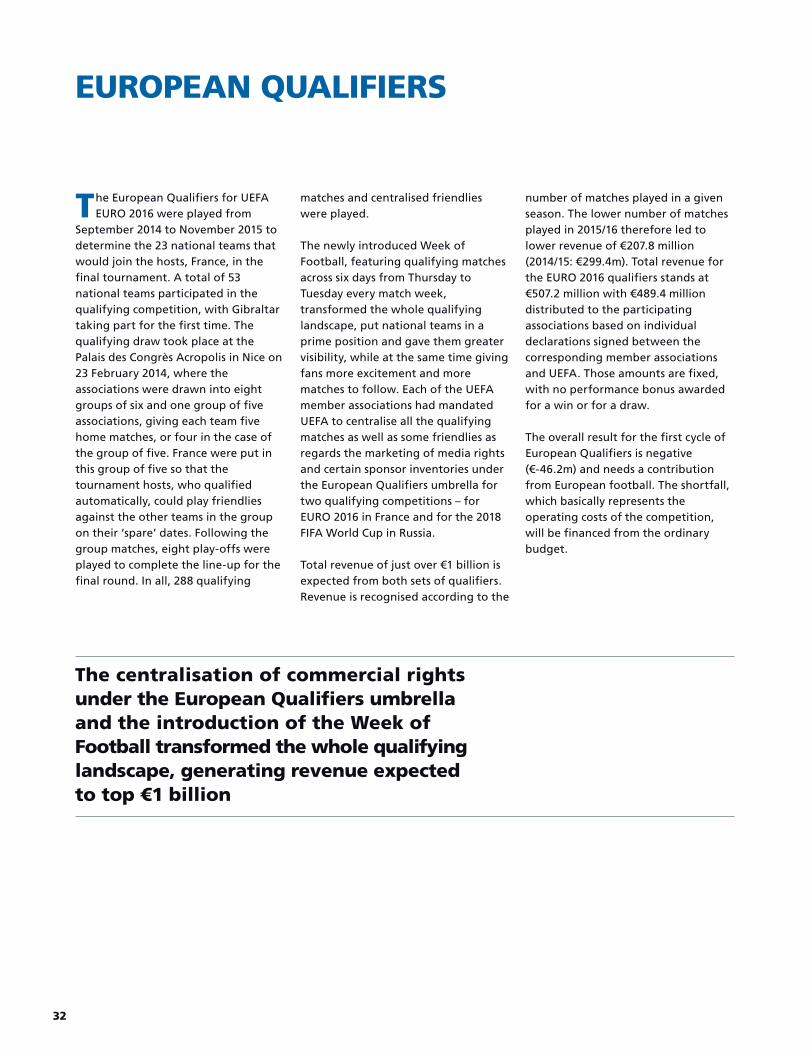
Total revenue of just over €1 billion is expected from both sets of qualifiers. Revenue is recognised according to the
number of matches played in a given season. The lower number of matches played in 2015/16 therefore led to lower revenue of €207.8 million (2014/15: €299.4m). Total revenue for the EURO 2016 qualifiers stands at €507.2 million with €489.4 million distributed to the participating associations based on individual declarations signed between the corresponding member associations and UEFA. Those amounts are fixed, with no performance bonus awarded for a win or for a draw.
The overall result for the first cycle of European Qualifiers is negative (€-46.2m) and needs a contribution from European football. The shortfall, which basically represents the operating costs of the competition, will be financed from the ordinary budget.
EUROPEAN QUALIFIERS
The centralisation of commercial rights under the European Qualifiers umbrella and the introduction of the Week of Football transformed the whole qualifying landscape, generating revenue expected to top €1 billion
32
European Qualifiers: project accounts
€m 2015/16 2014/15 Total
Broadcasting rights 197.9 284.2 482.1
Commercial rights 9.9 15.2 25.1
Rights revenue 207.8 299.4 507.2
Other revenue - - -
Total revenue 207.8 299.4 507.2
Competition costs -25.8 -38.2 -64.0
Distribution to participating associations -200.4 -289.0 -489.4
Contribution from European football -18.4 -27.8 -46.2
Competition costs 12.6%
Distribution to participating associations 96.5%
Contribution from European football -9.1%
European Qualifiers: total expected revenue
UEFA EURO 2016 qualifiers
FIFA 2018 World Cup qualifiers
Total revenue
BROADCASTING COMMERCIAL€m
507.2
522.8
1 030.0
TOTAL
55.0975.0
33FINANCIAL REPORT 2015/16
CLUB COMPETITIONS
A major increase of 38% in total revenue compared with the previous season reconfirms the success of our club competitions. In addition, a new, simplified distribution model is in place for the 2015–18 cycle
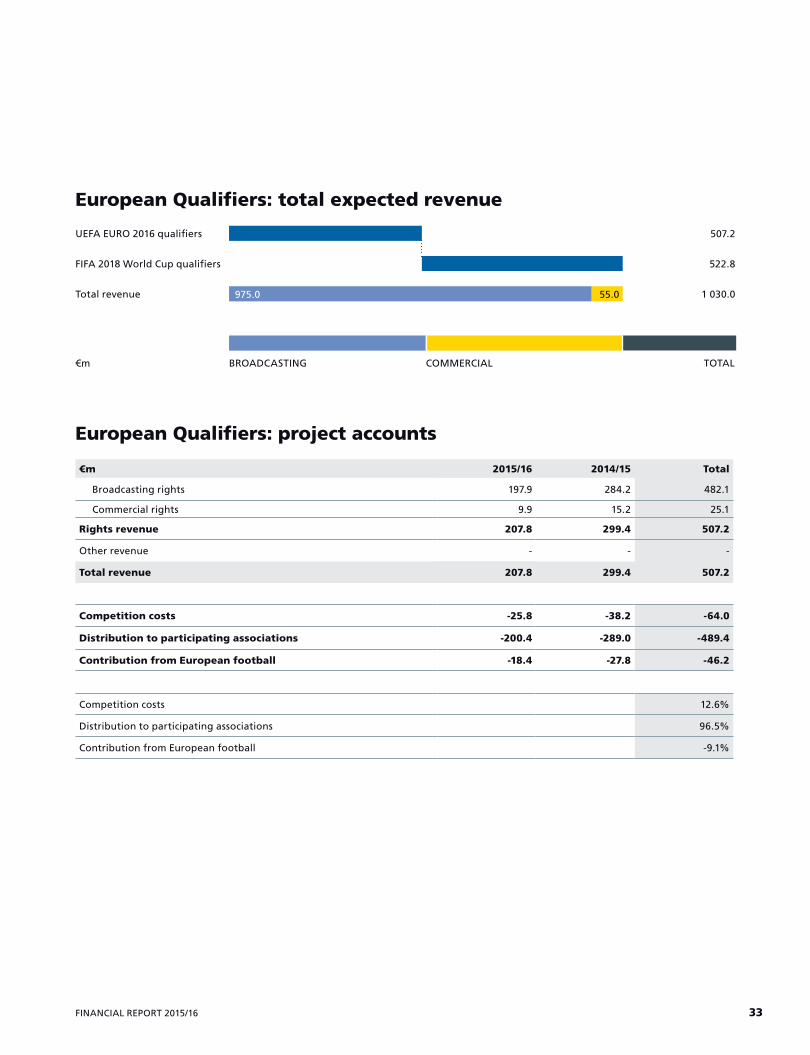
Rights revenue per cycle
2 203.6
1 823.3
2 606.3
4 032.4
5 004.2
7 200.0
1 852.5
599.8
3 214.8
4 053.3
1 300.0
950.9
817.6
1 449.4 373.9
351.1
2 006.5
UEFA has begun a new three-year club competition cycle (2015/16–2017/18). The centralised marketing of sales of broadcasting and commercial rights comprises the main club competitions, the UEFA Champions League (including the UEFA Super Cup), and a separate sales process for the UEFA Europa League. Total rights revenue for 2015/16 increased by 39% to reach €2.39 billion (2014/15: €1.72bn). Broadcasting rights increased by as much as 40% thanks to general increases in each market, in particular
in Latin America and among the top five in Europe. The commercial rights inventory for the Europa League included, for the first time, full centralisation and pitchside LED boards as from the knockout stage. New sponsors such as Nissan and Pepsico for the Champions League, and FedEx, Enterprise Rent-A-Car and Amstel for the Europa League were welcomed. In addition to rights revenue, UEFA continued to manage ticket and hospitality sales for both the Champions League (Milan) and Europa
League (Basel) finals as well as for the Super Cup (Tbilisi), with this revenue being largely dependent on the stadium seating capacity, the teams playing and the venue. Total ticket and hospitality revenue for all three games stood at €31.6 million, which is roughly €5 million down on 2014/15. However, total gross revenue was 38% up on the previous season, with exactly the same percentage increases in both the Champions League and the Europa League.
Revenue
5 900.0
€m TOTAL
2000-03
2003-06
2006-09
2009-12
2012-15
2015-18
BROADCASTING COMMERCIAL
34
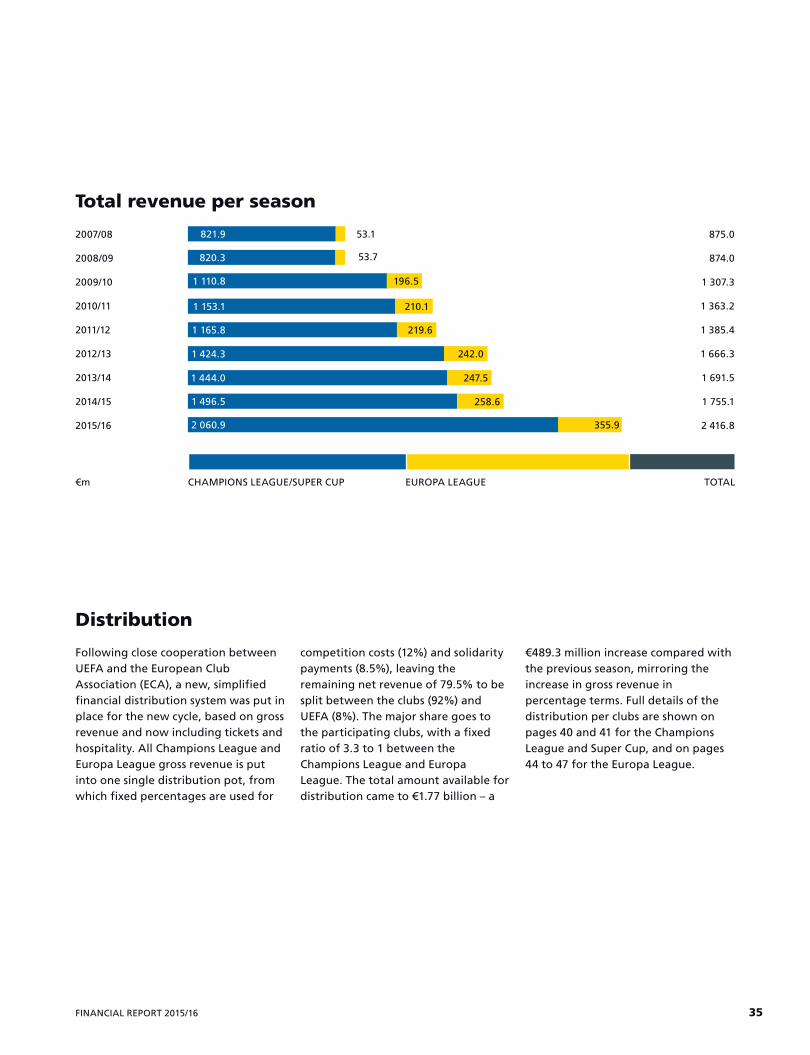
Following close cooperation between UEFA and the European Club Association (ECA), a new, simplified financial distribution system was put in place for the new cycle, based on gross revenue and now including tickets and hospitality. All Champions League and Europa League gross revenue is put into one single distribution pot, from which fixed percentages are used for
competition costs (12%) and solidarity payments (8.5%), leaving the remaining net revenue of 79.5% to be split between the clubs (92%) and UEFA (8%). The major share goes to the participating clubs, with a fixed ratio of 3.3 to 1 between the Champions League and Europa League. The total amount available for distribution came to €1.77 billion – a
€489.3 million increase compared with the previous season, mirroring the increase in gross revenue in percentage terms. Full details of the distribution per clubs are shown on pages 40 and 41 for the Champions League and Super Cup, and on pages 44 to 47 for the Europa League.
Distribution
Total revenue per season
2007/08
2008/09
2009/10
2010/11
2011/12
2012/13
2013/14
2014/15
2015/16
875.0
874.0
1 307.3
1 363.2
1 385.4
1 666.3
1 691.5
1 755.1
2 416.8
1 110.8
1 153.1
1 165.8
1 424.3
1 444.0
1 496.5
2 060.9
821.9
820.3
53.1
53.7
355.9
258.6
247.5
242.0
219.6
210.1
196.5
€m TOTALCHAMPIONS LEAGUE/SUPER CUP EUROPA LEAGUE
35FINANCIAL REPORT 2015/16
Club competitions: project accounts
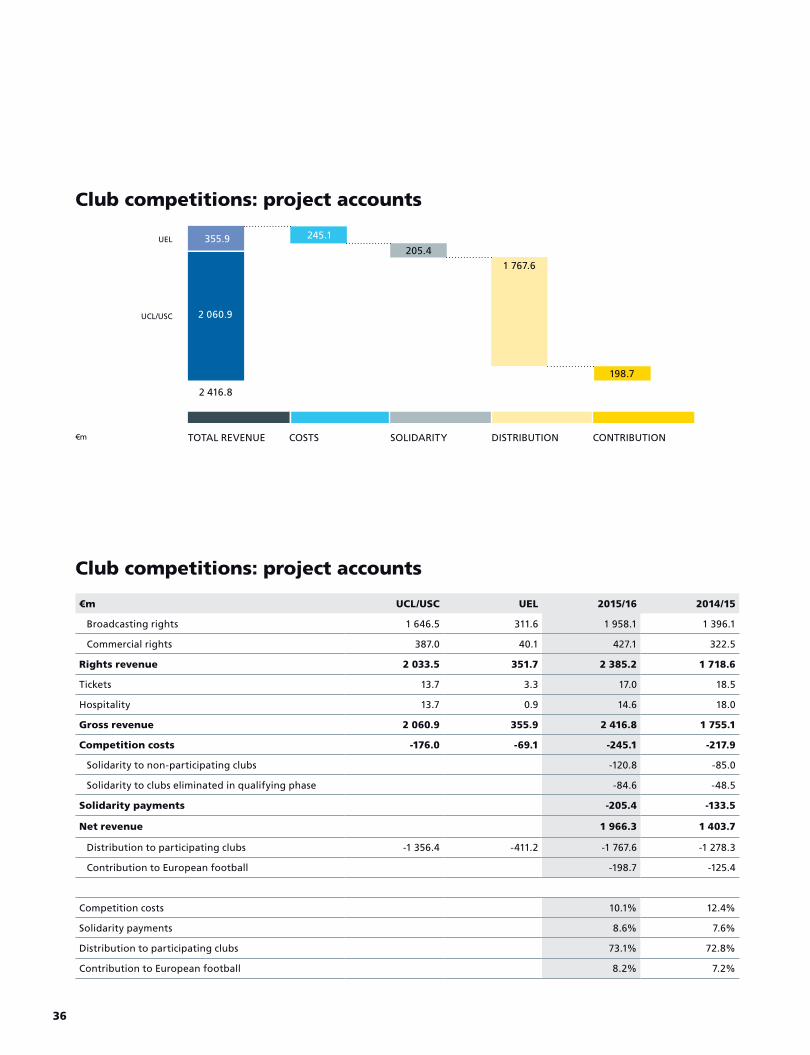
€m UCL/USC UEL 2015/16 2014/15
Broadcasting rights 1 646.5 311.6 1 958.1 1 396.1
Commercial rights 387.0 40.1 427.1 322.5
Rights revenue 2 033.5 351.7 2 385.2 1 718.6
Tickets 13.7 3.3 17.0 18.5
Hospitality 13.7 0.9 14.6 18.0
Gross revenue 2 060.9 355.9 2 416.8 1 755.1
Competition costs -176.0 -69.1 -245.1 -217.9
Solidarity to non-participating clubs -120.8 -85.0
Solidarity to clubs eliminated in qualifying phase -84.6 -48.5
Solidarity payments -205.4 -133.5
Net revenue 1 966.3 1 403.7
Distribution to participating clubs -1 356.4 -411.2 -1 767.6 -1 278.3
Contribution to European football -198.7 -125.4
Competition costs 10.1% 12.4%
Solidarity payments 8.6% 7.6%
Distribution to participating clubs 73.1% 72.8%
Contribution to European football 8.2% 7.2%
Club competitions: project accounts
2 416.8
2 060.9
245.1
205.4355.9
1 767.6
198.7
UEL
UCL/USC
€m TOTAL REVENUE COSTS SOLIDARITY DISTRIBUTION CONTRIBUTION
36
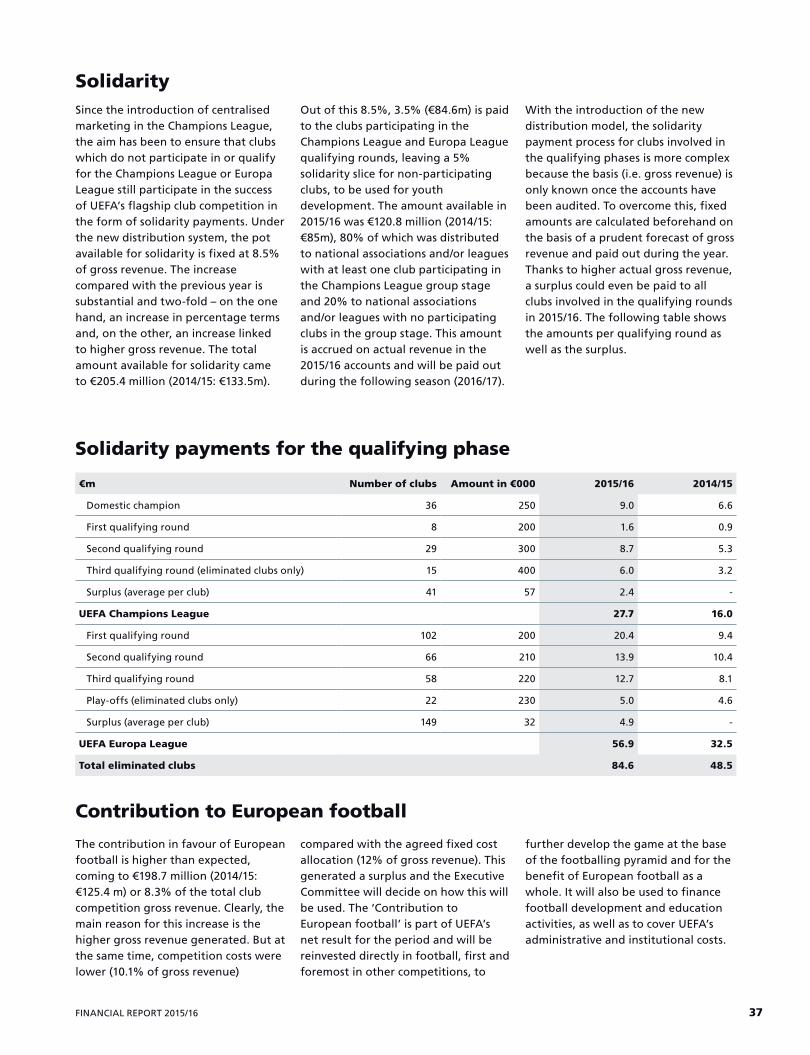
Since the introduction of centralised marketing in the Champions League, the aim has been to ensure that clubs which do not participate in or qualify for the Champions League or Europa League still participate in the success of UEFA’s flagship club competition in the form of solidarity payments. Under the new distribution system, the pot available for solidarity is fixed at 8.5% of gross revenue. The increase compared with the previous year is substantial and two-fold – on the one hand, an increase in percentage terms and, on the other, an increase linked to higher gross revenue. The total amount available for solidarity came to €205.4 million (2014/15: €133.5m).
Out of this 8.5%, 3.5% (€84.6m) is paid to the clubs participating in the Champions League and Europa League qualifying rounds, leaving a 5% solidarity slice for non-participating clubs, to be used for youth development. The amount available in 2015/16 was €120.8 million (2014/15: €85m), 80% of which was distributed to national associations and/or leagues with at least one club participating in the Champions League group stage and 20% to national associations and/or leagues with no participating clubs in the group stage. This amount is accrued on actual revenue in the 2015/16 accounts and will be paid out during the following season (2016/17).
With the introduction of the new distribution model, the solidarity payment process for clubs involved in the qualifying phases is more complex because the basis (i.e. gross revenue) is only known once the accounts have been audited. To overcome this, fixed amounts are calculated beforehand on the basis of a prudent forecast of gross revenue and paid out during the year. Thanks to higher actual gross revenue, a surplus could even be paid to all clubs involved in the qualifying rounds in 2015/16. The following table shows the amounts per qualifying round as well as the surplus.
Solidarity
The contribution in favour of European football is higher than expected, coming to €198.7 million (2014/15: €125.4 m) or 8.3% of the total club competition gross revenue. Clearly, the main reason for this increase is the higher gross revenue generated. But at the same time, competition costs were lower (10.1% of gross revenue)
compared with the agreed fixed cost allocation (12% of gross revenue). This generated a surplus and the Executive Committee will decide on how this will be used. The ‘Contribution to European football’ is part of UEFA’s net result for the period and will be reinvested directly in football, first and foremost in other competitions, to
further develop the game at the base of the footballing pyramid and for the benefit of European football as a whole. It will also be used to finance football development and education activities, as well as to cover UEFA’s administrative and institutional costs.
Contribution to European football
€m Number of clubs Amount in €000 2015/16 2014/15
Domestic champion 36 250 9.0 6.6
First qualifying round 8 200 1.6 0.9
Second qualifying round 29 300 8.7 5.3
Third qualifying round (eliminated clubs only) 15 400 6.0 3.2
Surplus (average per club) 41 57 2.4 -
UEFA Champions League 27.7 16.0
First qualifying round 102 200 20.4 9.4
Second qualifying round 66 210 13.9 10.4
Third qualifying round 58 220 12.7 8.1
Play-offs (eliminated clubs only) 22 230 5.0 4.6
Surplus (average per club) 149 32 4.9 -
UEFA Europa League 56.9 32.5
Total eliminated clubs 84.6 48.5
Solidarity payments for the qualifying phase
37FINANCIAL REPORT 2015/16
UEFA CHAMPIONS LEAGUE
The format of the UEFA Champions League remained unchanged and
started with 20 play-off matches to finalise the list of 32 group stage participants. These play-offs, from which the ten losing teams move into the group stage of the UEFA Europa League, are included in the Champions League contracts, bringing the total number of Champions League matches to 145. The UEFA Super Cup match is also part of the Champions League package.
The principles governing the distribution of revenue among the 32 Champions League group stage clubs also remained the same, with a fixed amount, a performance bonus and an important part of the financial benefits distributed through the market pool concept. Market pool shares in favour of Champions League
clubs are in proportion to the value of the broadcasting rights revenue within the territory of their respective national associations. Being directly linked to the increase in gross revenue, the amounts distributed to clubs followed the same upward trend. Obviously, this type of distribution system with variable parameters has a significant impact on the individual amounts received by the clubs, even among clubs that achieve similar results in the competition. Consequently, it is not necessarily the club which lifts the trophy that receives the biggest financial reward. UEFA is aware of this trend and measures to improve the distribution model have been agreed with the European Club Association (ECA) to correct this for the next cycle. Given that the final total of club competition net revenue was higher than had been
anticipated when the amounts for distribution in 2015/16 were fixed, a surplus of €94.9 million was available at the end of the season. This surplus was shared among the 32 clubs in proportion to the total of the fixed amounts and market pool shares already received by each club during the season. The surplus amounts per club are included in the market pool column on page 41. The two clubs involved in the Super Cup were also rewarded with a fixed amount of €4 million for the winner, FC Barcelona, and €3 million for Sevilla FC. It should also be noted that for all the matches played, the home club kept all gate receipts – the exception being the final in Milan's San Siro, for which the ticketing share for the two finalists is included in the performance bonus.
38
Get
ty Im
ages
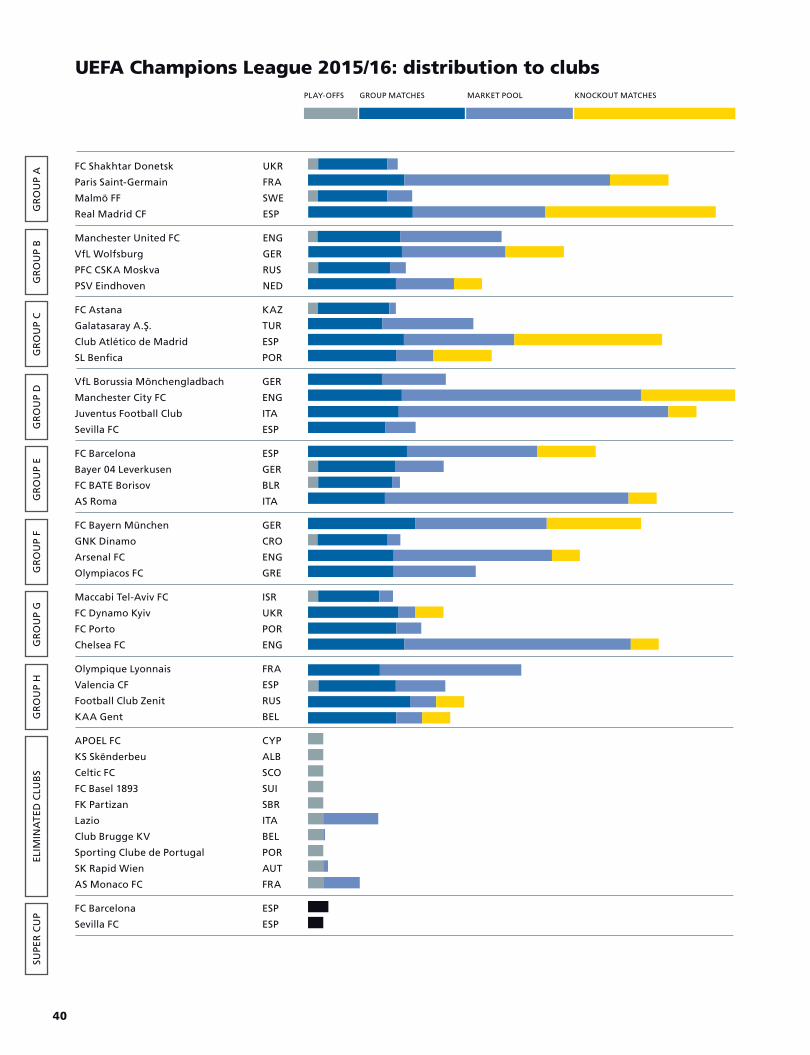
GR
OU
P A
GR
OU
P B
GR
OU
P C
GR
OU
P D
GR
OU
P E
GR
OU
P F
GR
OU
P G
GR
OU
P H
ELIM
INA
TED
CLU
BS
UEFA Champions League 2015/16: distribution to clubs
UKR
FRA
SWE
ESP
ENG
GER
RUS
NED
KAZ
TUR
ESP
POR
GER
ENG
ITA
ESP
ESP
GER
BLR
ITA
GER
CRO
ENG
GRE
ISR
UKR
POR
ENG
FRA
ESP
RUS
BEL
CYP
ALB
SCO
SUI
SBR
ITA
BEL
POR
AUT
FRA
GROUP MATCHES MARKET POOL KNOCKOUT MATCHESPLAY-OFFS
FC Shakhtar Donetsk
Paris Saint-Germain
Malmö FF
Real Madrid CF
Manchester United FC
VfL Wolfsburg
PFC CSKA Moskva
PSV Eindhoven
FC Astana
Galatasaray A.Ş.
Club Atlético de Madrid
SL Benfica
VfL Borussia Mönchengladbach
Manchester City FC
Juventus Football Club
Sevilla FC
FC Barcelona
Bayer 04 Leverkusen
FC BATE Borisov
AS Roma
FC Bayern München
GNK Dinamo
Arsenal FC
Olympiacos FC
Maccabi Tel-Aviv FC
FC Dynamo Kyiv
FC Porto
Chelsea FC
Olympique Lyonnais
Valencia CF
Football Club Zenit
KAA Gent
APOEL FC
KS Skënderbeu
Celtic FC
FC Basel 1893
FK Partizan
Lazio
Club Brugge KV
Sporting Clube de Portugal
SK Rapid Wien
AS Monaco FC
FC Barcelona
Sevilla FC
ESP
ESP
SUPE
R C
UP
40
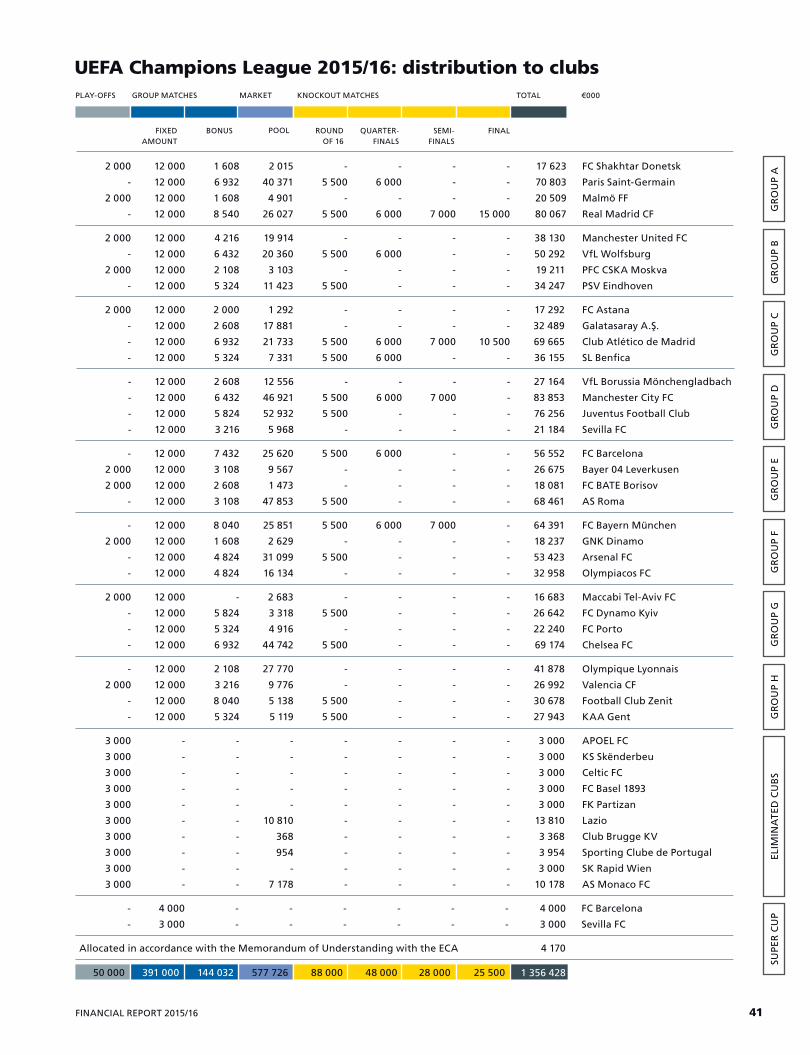
17 623
70 803
20 509
80 067
38 130
50 292
19 211
34 247
17 292
32 489
69 665
36 155
27 164
83 853
76 256
21 184
56 552
26 675
18 081
68 461
64 391
18 237
53 423
32 958
16 683
26 642
22 240
69 174
41 878
26 992
30 678
27 943
3 000
3 000
3 000
3 000
3 000
13 810
3 368
3 954
3 000
10 178
2 000
-
2 000
-
12 000
12 000
12 000
12 000
1 608
6 932
1 608
8 540
2 015
40 371
4 901
26 027
-
5 500
-
5 500
-
6 000
-
6 000
-
-
-
7 000
-
-
-
15 000
2 000
-
-
-
12 000
12 000
12 000
12 000
2 000
2 608
6 932
5 324
1 292
17 881
21 733
7 331
-
-
5 500
5 500
-
-
6 000
6 000
-
-
7 000
-
-
-
10 500
-
-
-
-
-
12 000
12 000
12 000
12 000
2 608
6 432
5 824
3 216
12 556
46 921
52 932
5 968
-
5 500
5 500
-
-
6 000
-
-
-
7 000
-
-
-
-
-
-
-
2 000
2 000
-
12 000
12 000
12 000
12 000
7 432
3 108
2 608
3 108
25 620
9 567
1 473
47 853
5 500
-
-
5 500
6 000
-
-
-
-
-
-
-
-
-
-
-
-
2 000
-
-
12 000
12 000
12 000
12 000
8 040
1 608
4 824
4 824
25 851
2 629
31 099
16 134
5 500
-
5 500
-
6 000
-
-
-
7 000
-
-
-
-
-
-
-
2 000
-
-
-
12 000
12 000
12 000
12 000
-
5 824
5 324
6 932
2 683
3 318
4 916
44 742
-
5 500
-
5 500
-
-
-
-
-
-
-
-
-
-
-
-
-
2 000
-
-
12 000
12 000
12 000
12 000
2 108
3 216
8 040
5 324
27 770
9 776
5 138
5 119
-
-
5 500
5 500
-
-
-
-
-
-
-
-
-
-
-
-
3 000
3 000
3 000
3 000
3 000
3 000
3 000
3 000
3 000
3 000
-
-
-
-
-
-
-
-
-
-
-
-
-
-
-
-
-
-
-
-
-
-
-
-
-
10 810
368
954
-
7 178
-
-
-
-
-
-
-
-
-
-
-
-
-
-
-
-
-
-
-
-
-
-
-
-
-
-
-
-
-
-
-
-
-
-
-
-
-
-
-
-
GROUP MATCHES MARKET
FIXED AMOUNT
BONUS ROUND OF 16
QUARTER-FINALS
SEMI-FINALS
FINAL
KNOCKOUT MATCHES TOTALPLAY-OFFS
UEFA Champions League 2015/16: distribution to clubs
FC Shakhtar Donetsk
Paris Saint-Germain
Malmö FF
Real Madrid CF
Manchester United FC
VfL Wolfsburg
PFC CSKA Moskva
PSV Eindhoven
FC Astana
Galatasaray A.Ş.
Club Atlético de Madrid
SL Benfica
VfL Borussia Mönchengladbach
Manchester City FC
Juventus Football Club
Sevilla FC
FC Barcelona
Bayer 04 Leverkusen
FC BATE Borisov
AS Roma
FC Bayern München
GNK Dinamo
Arsenal FC
Olympiacos FC
Maccabi Tel-Aviv FC
FC Dynamo Kyiv
FC Porto
Chelsea FC
Olympique Lyonnais
Valencia CF
Football Club Zenit
KAA Gent
APOEL FC
KS Skënderbeu
Celtic FC
FC Basel 1893
FK Partizan
Lazio
Club Brugge KV
Sporting Clube de Portugal
SK Rapid Wien
AS Monaco FC
FC Barcelona
Sevilla FC
-
-
4 000
3 000
-
-
-
-
-
-
-
-
-
-
-
-
4 000
3 000
50 000 391 000 144 032 577 726 88 000 48 000 28 000 25 500
Allocated in accordance with the Memorandum of Understanding with the ECA 4 170
1 356 428
2 000
-
2 000
-
12 000
12 000
12 000
12 000
4 216
6 432
2 108
5 324
19 914
20 360
3 103
11 423
-
5 500
-
5 500
-
6 000
-
-
-
-
-
-
-
-
-
-
GR
OU
P A
GR
OU
P B
GR
OU
P C
GR
OU
P D
GR
OU
P E
GR
OU
P F
GR
OU
P G
GR
OU
P H
ELIM
INA
TED
CU
BS
SUPE
R C
UP
€000
POOL
41FINANCIAL REPORT 2015/16
UEFA EUROPA LEAGUE
The 48 teams which qualify for the group stage of the UEFA Europa
League are drawn into 12 groups, meaning that every team plays a minimum of three home matches. The winner and runner-up from each of the 12 groups are joined in the round of 32 by the eight teams which earn the right to continue their European campaign by finishing third in their UEFA Champions League group. In all, 205 UEFA Europa League matches – including the final at the St. Jakob-Park in Basel – were staged all over Europe in 2015/16.
As mentioned in this report, 92% of net revenue is distributed to Champions League and Europa League
clubs, at an agreed fixed ratio of 3.3 to 1. For 2015/16, this allowed a total of €411.2 million (2014/15: €239.7m) to be distributed to the participating teams – over 72% more than in the previous season. Against the 38% increase in gross revenue, this 72% increase confirms the commitment of the Champions League clubs towards the Europa League to boosting interest in playing in the Europa League. The Champions League distribution model also applies to the Europa League, where the participating clubs are also entitled to a fixed amount, a performance bonus and a share of the market pool based on the commercial value of their domestic media rights markets. Given
that the final total gross revenue for club competitions was higher than had been anticipated when the amounts for distribution in 2015/16 were set, a surplus of €30.1 million was available at the end of the season. This surplus was split among the clubs in proportion to the total of the fixed amount and market pool shares already received by each club during the season. These surplus amounts are included in the market pool column on pages 45 to 47. Ticket revenue is treated in the same way as in the Champions League, with the home club retaining all gate receipts, except for the final, for which the ticketing share for the two finalists is included in the performance bonus.
42
UEF
A
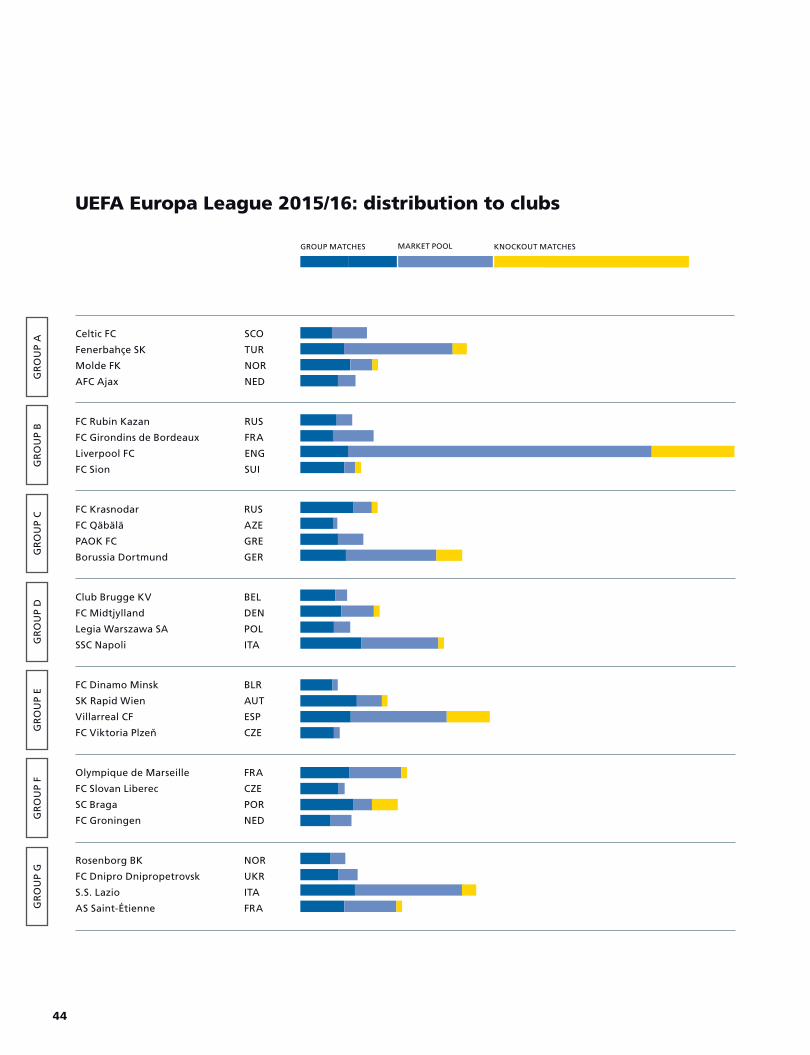
GR
OU
P A
GR
OU
P B
GR
OU
P C
GR
OU
P D
GR
OU
P E
GR
OU
P F
GR
OU
P G
SCO
TUR
NOR
NED
RUS
FRA
ENG
SUI
RUS
AZE
GRE
GER
BEL
DEN
POL
ITA
BLR
AUT
ESP
CZE
FRA
CZE
POR
NED
NOR
UKR
ITA
FRA
UEFA Europa League 2015/16: distribution to clubs
Celtic FC
Fenerbahçe SK
Molde FK
AFC Ajax
FC Rubin Kazan
FC Girondins de Bordeaux
Liverpool FC
FC Sion
FC Krasnodar
FC Qäbälä
PAOK FC
Borussia Dortmund
Club Brugge KV
FC Midtjylland
Legia Warszawa SA
SSC Napoli
FC Dinamo Minsk
SK Rapid Wien
Villarreal CF
FC Viktoria Plzeň
Olympique de Marseille
FC Slovan Liberec
SC Braga
FC Groningen
Rosenborg BK
FC Dnipro Dnipropetrovsk
S.S. Lazio
AS Saint-Étienne
MARKET POOLGROUP MATCHES KNOCKOUT MATCHES
44
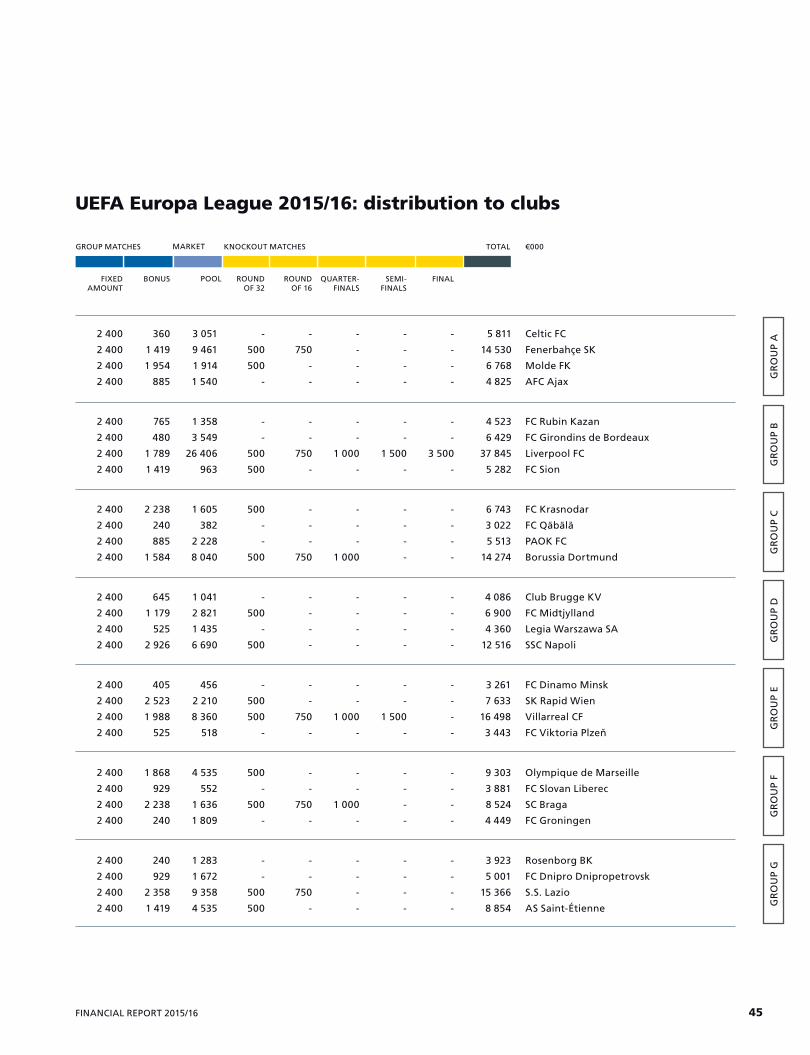
5 811
14 530
6 768
4 825
4 523
6 429
37 845
5 282
6 743
3 022
5 513
14 274
4 086
6 900
4 360
12 516
3 261
7 633
16 498
3 443
9 303
3 881
8 524
4 449
3 923
5 001
15 366
8 854
2 400
2 400
2 400
2 400
360
1 419
1 954
885
3 051
9 461
1 914
1 540
-
500
500
-
-
750
-
-
-
-
-
-
-
-
-
-
-
-
-
-
2 400
2 400
2 400
2 400
765
480
1 789
1 419
1 358
3 549
26 406
963
-
-
500
500
-
-
750
-
-
-
1 000
-
-
-
1 500
-
-
-
3 500
-
2 400
2 400
2 400
2 400
2 238
240
885
1 584
1 605
382
2 228
8 040
500
-
-
500
-
-
-
750
-
-
-
1 000
-
-
-
-
-
-
-
-
2 400
2 400
2 400
2 400
645
1 179
525
2 926
1 041
2 821
1 435
6 690
-
500
-
500
-
-
-
-
-
-
-
-
-
-
-
-
-
-
-
-
2 400
2 400
2 400
2 400
405
2 523
1 988
525
456
2 210
8 360
518
-
500
500
-
-
-
750
-
-
-
1 000
-
-
-
1 500
-
-
-
-
-
2 400
2 400
2 400
2 400
1 868
929
2 238
240
4 535
552
1 636
1 809
500
-
500
-
-
-
750
-
-
-
1 000
-
-
-
-
-
-
-
-
-
2 400
2 400
2 400
2 400
240
929
2 358
1 419
1 283
1 672
9 358
4 535
-
-
500
500
-
-
750
-
-
-
-
-
-
-
-
-
-
-
-
-
Celtic FC
Fenerbahçe SK
Molde FK
AFC Ajax
FC Rubin Kazan
FC Girondins de Bordeaux
Liverpool FC
FC Sion
FC Krasnodar
FC Qäbälä
PAOK FC
Borussia Dortmund
Club Brugge KV
FC Midtjylland
Legia Warszawa SA
SSC Napoli
FC Dinamo Minsk
SK Rapid Wien
Villarreal CF
FC Viktoria Plzeň
Olympique de Marseille
FC Slovan Liberec
SC Braga
FC Groningen
Rosenborg BK
FC Dnipro Dnipropetrovsk
S.S. Lazio
AS Saint-Étienne
GR
OU
P A
GR
OU
P B
GR
OU
P C
GR
OU
P D
GR
OU
P E
GR
OU
P F
GR
OU
P G
UEFA Europa League 2015/16: distribution to clubs
GROUP MATCHES
FIXED AMOUNT
BONUS ROUND OF 32
ROUND OF 16
QUARTER-FINALS
SEMI-FINALS
FINAL
TOTAL €000KNOCKOUT MATCHESMARKET
POOL
45FINANCIAL REPORT 2015/16
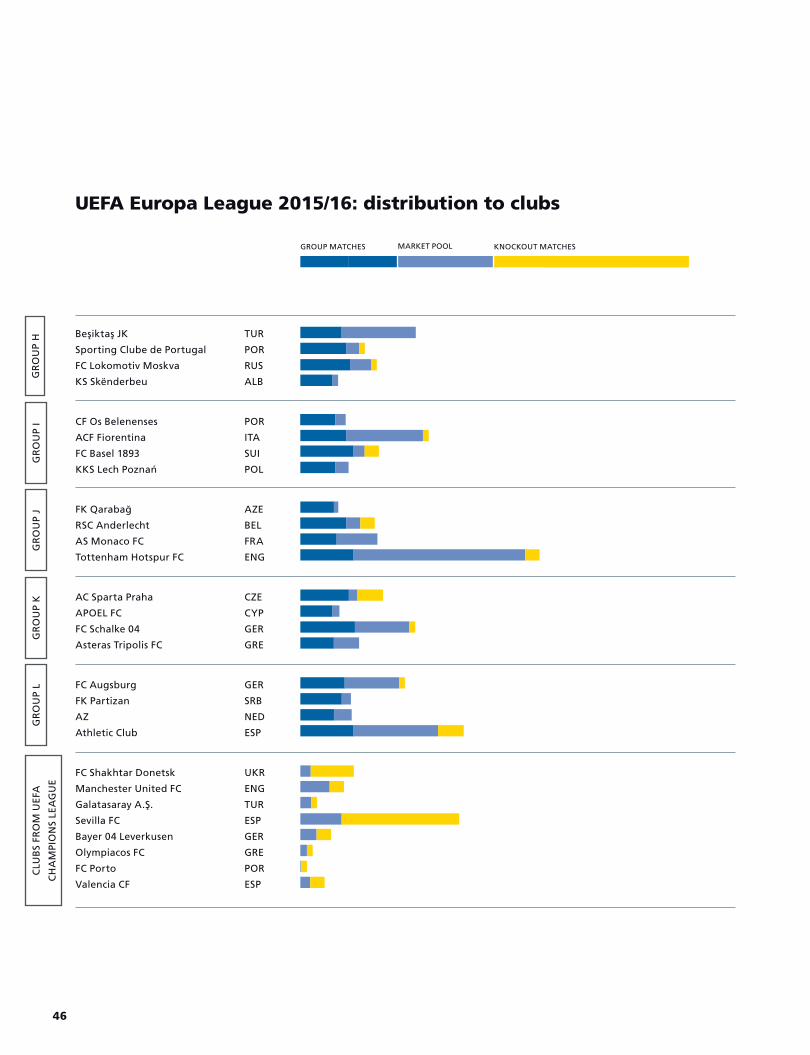
GR
OU
P I
GR
OU
P J
GR
OU
P K
GR
OU
P L
CLU
BS
FRO
M U
EFA
CH
AM
PIO
NS
LEA
GU
E
POR
ITA
SUI
POL
AZE
BEL
FRA
ENG
CZE
CYP
GER
GRE
GER
SRB
NED
ESP
UKR
ENG
TUR
ESP
GER
GRE
POR
ESP
FK Qarabağ
RSC Anderlecht
AS Monaco FC
Tottenham Hotspur FC
CF Os Belenenses
ACF Fiorentina
FC Basel 1893
KKS Lech Poznań
AC Sparta Praha
APOEL FC
FC Schalke 04
Asteras Tripolis FC
FC Augsburg
FK Partizan
AZ
Athletic Club
FC Shakhtar Donetsk
Manchester United FC
Galatasaray A.Ş.
Sevilla FC
Bayer 04 Leverkusen
Olympiacos FC
FC Porto
Valencia CF
UEFA Europa League 2015/16: distribution to clubs
GR
OU
P H TUR
POR
RUS
ALB
Beşiktaş JK
Sporting Clube de Portugal
FC Lokomotiv Moskva
KS Skënderbeu
MARKET POOLGROUP MATCHES KNOCKOUT MATCHES
46
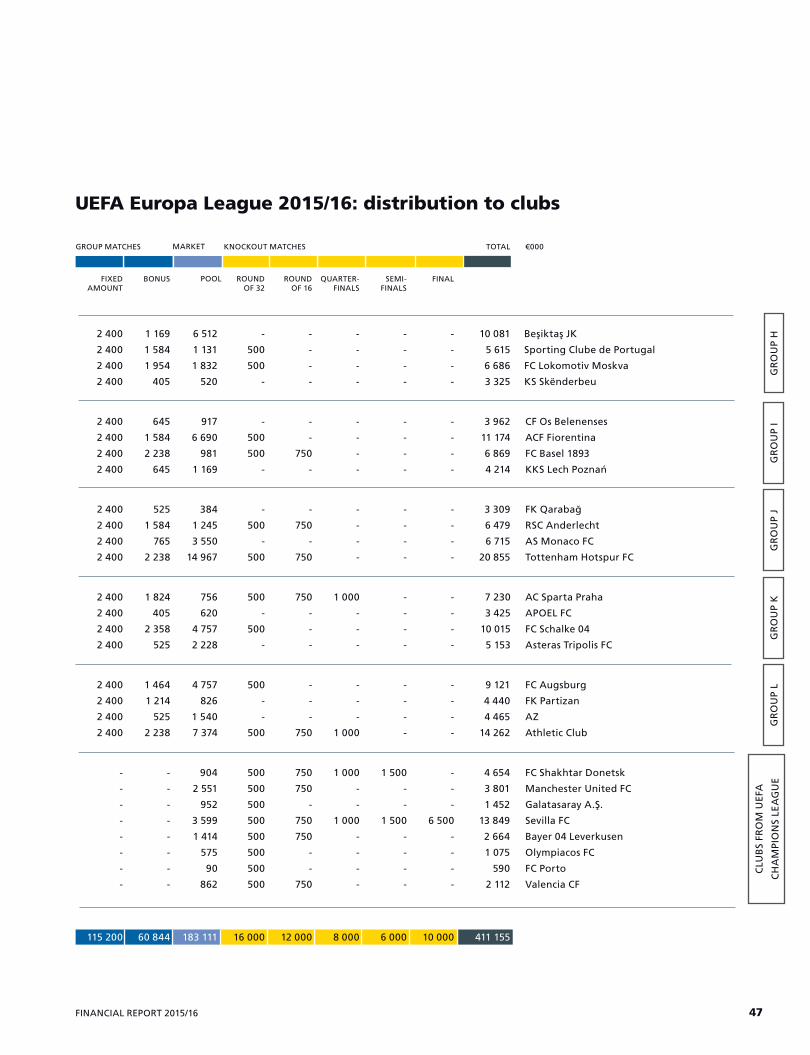
3 309
6 479
6 715
20 855
7 230
3 425
10 015
5 153
9 121
4 440
4 465
14 262
4 654
3 801
1 452
13 849
2 664
1 075
590
2 112
2 400
2 400
2 400
2 400
525
1 584
765
2 238
384
1 245
3 550
14 967
-
500
-
500
-
750
-
750
-
-
-
-
-
-
-
-
-
-
-
-
2 400
2 400
2 400
2 400
1 824
405
2 358
525
756
620
4 757
2 228
500
-
500
-
750
-
-
-
1 000
-
-
-
-
-
-
-
-
-
-
-
2 400
2 400
2 400
2 400
1 464
1 214
525
2 238
4 757
826
1 540
7 374
500
-
-
500
-
-
-
750
-
-
-
1 000
-
-
-
-
-
-
-
-
-
-
-
-
-
-
-
-
-
-
-
-
-
-
-
-
904
2 551
952
3 599
1 414
575
90
862
500
500
500
500
500
500
500
500
750
750
-
750
750
-
-
750
1 000
-
-
1 000
-
-
-
-
1 500
-
-
1 500
-
-
-
-
-
-
-
6 500
-
-
-
-
3 962
11 174
6 869
4 214
2 400
2 400
2 400
2 400
645
1 584
2 238
645
917
6 690
981
1 169
-
500
500
-
-
-
750
-
-
-
-
-
-
-
-
-
-
-
-
-
115 200 60 844 183 111 16 000 12 000 8 000 6 000 10 000 411 155
FK Qarabağ
RSC Anderlecht
AS Monaco FC
Tottenham Hotspur FC
CF Os Belenenses
ACF Fiorentina
FC Basel 1893
KKS Lech Poznań
AC Sparta Praha
APOEL FC
FC Schalke 04
Asteras Tripolis FC
FC Augsburg
FK Partizan
AZ
Athletic Club
FC Shakhtar Donetsk
Manchester United FC
Galatasaray A.Ş.
Sevilla FC
Bayer 04 Leverkusen
Olympiacos FC
FC Porto
Valencia CF
GR
OU
P I
GR
OU
P J
GR
OU
P K
GR
OU
P L
CLU
BS
FRO
M U
EFA
CH
AM
PIO
NS
LEA
GU
E
UEFA Europa League 2015/16: distribution to clubs
10 081
5 615
6 686
3 325
2 400
2 400
2 400
2 400
1 169
1 584
1 954
405
6 512
1 131
1 832
520
-
500
500
-
-
-
-
-
-
-
-
-
-
-
-
-
-
-
-
-
Beşiktaş JK
Sporting Clube de Portugal
FC Lokomotiv Moskva
KS Skënderbeu
GR
OU
P H
GROUP MATCHES
FIXED AMOUNT
BONUS ROUND OF 32
ROUND OF 16
QUARTER-FINALS
SEMI-FINALS
FINAL
TOTAL €000KNOCKOUT MATCHESMARKET
POOL
47FINANCIAL REPORT 2015/16
Get
ty Im
ages
This document is published in English, French and German. The English version is authoritative, in accordance with Article 4.3 of the UEFA Statutes.

TABLE OF CONTENTS
Facts and figures
Introduction Financial strategy Income statement Distribution Solidarity The flow of UEFA solidarity payments Balance sheet Own resources Result by competition and activity Source of income Use of income Governing expenses The four-year cycle EURO 2016 HatTrick European Qualifiers Club competitions UEFA Champions League UEFA Europa League
Annex
Financial statements as at 30 June 2016 Reports of the statutory auditors
I.
14689
1012141617182022233032343842
II.
Co
ver :
Get
ty Im
ages

UEFAROUTE DE GENÈVE 46CH-1260 NYON 2 SWITZERLANDTELEPHONE: +41 848 00 27 27TELEFAX: +41 848 01 27 27
Financial Report2015/16
41st Ordinary UEFA CongressHelsinki, 5 April 2017
Setting: LargeNetwork, Geneva. Printing: Artgraphic Cavin, Grandson, Switzerland