Embed Size (px)
Citation preview
2015 Urban Water Management Plan Update
Prepared for
Otay Water District
2554 Sweetwater Springs Boulevard Spring Valley, California 91978
Public Review Draft MAY 2016
CH2M HILL Engineers, Inc 402 W. Broadway Suite 1450 San Diego, CA 92101


CH2M HILL ENGINEERS, INC III
Contents Section Page
Acronyms and Abbreviations .............................................................................................................. vii
Introduction ..................................................................................................................................... 1‐1 1.1 Changes to the California Urban Water Management Planning Act ............................... 1‐1 1.2 Senate Bills 610 and 221 .................................................................................................. 1‐2 1.3 Senate Bill 7 of the Seventh Extraordinary Session of 2009 ............................................ 1‐2 1.4 Resource Maximization ................................................................................................... 1‐3
Plan Preparation .............................................................................................................................. 2‐1 2.1 Basis and Approach for Preparing the UWMP ................................................................. 2‐1 2.2 Level of Planning and Compliance ................................................................................... 2‐1 2.3 Agency Coordination and Outreach ................................................................................ 2‐3
2.3.1 Wholesale and Retail Coordination .................................................................... 2‐3 2.3.2 Coordination with Other Agencies and the Community .................................... 2‐3
Service Area ..................................................................................................................................... 3‐1 3.1 Service Area Description .................................................................................................. 3‐1 3.2 Service Area Population ................................................................................................... 3‐3
3.2.1 Other Demographic Factors ................................................................................ 3‐3 3.3 Climate Data .................................................................................................................... 3‐3
Water Use ........................................................................................................................................ 4‐1 4.1 Existing Water Use by Customer Class ............................................................................ 4‐1 4.2 Projected Future Water Use ............................................................................................ 4‐2
4.2.1 Approach / Methodology ................................................................................... 4‐2 4.2.2 Projected Potable Demands ............................................................................... 4‐3 4.2.3 Projected Recycled Demands ............................................................................. 4‐5 4.2.4 Projected Total Demands ................................................................................... 4‐5
4.3 Service Area Sales and System Losses ............................................................................. 4‐6 4.4 Estimating Future Water Savings ..................................................................................... 4‐6 4.5 Lower Income Water Demand Projections ...................................................................... 4‐7 4.6 Climate Change ................................................................................................................ 4‐7
4.6.1 Potential Impacts ................................................................................................ 4‐8 4.6.2 Water Authority Adaption and Mitigation ......................................................... 4‐8
SB X7‐7 Baselines and Targets .......................................................................................................... 5‐1 5.1 Baselines and Targets ...................................................................................................... 5‐1
Service Area Supplies ....................................................................................................................... 6‐1 6.1 Water Resources .............................................................................................................. 6‐1
6.1.1 Potable Water ..................................................................................................... 6‐1 6.1.2 San Diego County Water Authority .................................................................... 6‐1 6.1.3 City of San Diego ................................................................................................. 6‐1 6.1.4 Emergency Supplies ............................................................................................ 6‐2
6.2 Groundwater .................................................................................................................... 6‐2 6.3 Surface Water .................................................................................................................. 6‐2 6.4 Stormwater ...................................................................................................................... 6‐2 6.5 Wastewater and Recycled Water .................................................................................... 6‐3

CONTENTS
Section Page
IV CH2M HILL ENGINEERS, INC
6.5.1 Recycled Water Coordination ............................................................................. 6‐3 6.5.2 Wastewater Collection & Treatment .................................................................. 6‐3 6.5.3 Recycled Water System ...................................................................................... 6‐4 6.5.4 Recycled Water Beneficial Uses .......................................................................... 6‐4 6.5.5 Proposed Actions to Encourage Use of Recycled Water .................................... 6‐5
6.6 Desalinated Water Opportunities .................................................................................... 6‐6 6.6.1 Water Purchase Agreement ‐‐ Rosarito Desalination Plant ............................... 6‐6
6.7 Exchanges or Transfers .................................................................................................... 6‐6 6.7.1 Cadiz Valley Water Conservation, Recovery, and Storage Project ..................... 6‐6
6.8 Future Water Supplies ..................................................................................................... 6‐7 6.8.1 Rancho del Rey Groundwater Well ..................................................................... 6‐8 6.8.2 Middle Sweetwater River Basin Groundwater Well Project ............................... 6‐9 6.8.3 Otay Mesa Lot 7 Groundwater Well ................................................................. 6‐10 6.8.4 North District Recycled Water Concept Project ............................................... 6‐11
6.9 Summary of Existing and Planned Sources of Water ..................................................... 6‐11
Water Service Reliability .................................................................................................................. 7‐1 7.1 Reliability of Supply .......................................................................................................... 7‐1 7.2 Projected Normal Year Supply and Demand ................................................................... 7‐3 7.3 Projected Single Dry Year Supply and Demand Comparison ........................................... 7‐4 7.4 Projected Multiple Dry Year Supply and Demand Comparison ....................................... 7‐5
Water Shortage Contingency Planning ............................................................................................. 8‐1 8.1 Stages of Action ............................................................................................................... 8‐1 8.2 Prohibitions on End Uses ................................................................................................. 8‐2 8.3 Penalties, Charges, Other Enforcement of Prohibitions .................................................. 8‐5 8.4 Consumption Reduction Methods ................................................................................... 8‐5 8.5 Determining Water Shortage Reductions ........................................................................ 8‐6 8.6 Revenue and Expenditure Impacts .................................................................................. 8‐6 8.7 Resolution or Ordinance .................................................................................................. 8‐7 8.8 Catastrophic Supply Interruption .................................................................................... 8‐7 8.9 Estimate of Minimum Supply for the Next Three Years .................................................. 8‐8
Demand Management Measures ..................................................................................................... 9‐1 9.1 Water Conservation Programs and Water Efficiency Practices ....................................... 9‐1 9.2 Determination of DMM Implementation ........................................................................ 9‐2
Plan Adoption, Submittal and Implementation .............................................................................. 10‐1 10.1 Notice of Public Hearing ................................................................................................ 10‐1 10.2 Plan Submittal ................................................................................................................ 10‐2
Appendices
Appendix A Urban Water Management Plan Act Text
Appendix B Adoption Resolution and Related Documentation
Appendix C AWWA Water Loss Worksheet
Appendix D SBX7‐7 Detailed Calculations
CONTENTS
Section Page
CH2M HILL ENGINEERS, INC V
Appendix E City of San Diego Agreement for Otay WTP
Appendix F City of San Diego Agreement for SBWRP
Appendix G District Code of Ordinance Section 26 Water Recycling Plan and Implementation Procedures
Appendix H Water Authority Documentation of Supply Reliability
Appendix I District Code of Ordinance Section 39 Water Shortage Response Plan
Appendix J District Code of Ordinance Section 72 Penalties and Damages
Appendix K BMP Reports 2011‐2014
Table(s)
Table 2‐1 Public Water Systems ................................................................................................................. 2‐1
Table 2‐2: Plan Identification ...................................................................................................................... 2‐2
Table 2‐3: Agency Identification ................................................................................................................. 2‐2
Table 2‐4: Water Supplier Information Exchange....................................................................................... 2‐3
Table 2‐5. Coordination with Appropriate Agencies .................................................................................. 2‐4
Table 3‐1. Population ‐ Current and Projected ........................................................................................... 3‐3
Table 3‐2. Climate Data .............................................................................................................................. 3‐4
Table 4‐1. Demands for Potable Water ‐ Actual ......................................................................................... 4‐1
Table 4‐S1: Summary of Unit Use Adjustment Factors .............................................................................. 4‐3
Table 4‐S2. District Anticipated Near‐Term Annexations .......................................................................... 4‐4
Table 4‐2. Demands for Potable Water ‐ Projected .................................................................................... 4‐5
Table 4‐3: Total Water Demands ................................................................................................................ 4‐5
Table 4‐4: Water Loss Summary Most Recent 12 Month Period Available ............................................... 4‐6
Table 4‐5: Inclusion in Water Use Projections ........................................................................................... 4‐6
Table 4‐6: Projected Future Conservation Savings ‐ District ...................................................................... 4‐7
Table 5‐1 Baselines and Targets Summary ................................................................................................. 5‐2
Table 5‐2: 2015 Compliance ....................................................................................................................... 5‐2
Table 5‐3: 2010 Census Population and Water Use for Baseline Demand Calculations ............................. 5‐3
Table 6‐1: Groundwater Volume Pumped .................................................................................................. 6‐2
Table 6‐2: Wastewater Collected Within Service Area in 2015 ................................................................. 6‐3
Table 6‐3 Wastewater Treatment and Discharge within Service Area in 2015 .......................................... 6‐4
Table 6‐4. Current and Projected Recycled Water Use within Service Area ............................................... 6‐5

CONTENTS
Section Page
VI CH2M HILL ENGINEERS, INC
Table 6‐5. 2010 UWMP Recycled Water Use Projection Compared to 2015 Actual .................................. 6‐5
Table 6‐6 Retail: Methods to Expand Future Recycled Water Use ............................................................. 6‐5
Table 6‐7: Expected Future Water Supply Projects or Programs................................................................ 6‐8
Table 6‐8: Water Supplies — Actual 2015 ................................................................................................ 6‐11
Table 6‐9: Water Supplies — Projected .................................................................................................... 6‐12
Table 7‐1: Basis of Water Year Data ........................................................................................................... 7‐3
Table 7‐2: Normal Year Supply and Demand Comparison .......................................................................... 7‐3
Table 7‐3: Single Dry Year Supply and Demand Comparison ...................................................................... 7‐4
Table 7‐4: Multiple Dry Years Supply and Demand Comparison ................................................................ 7‐6
Table 8‐1: Stages of Water Shortage Contingency Plan ............................................................................. 8‐2
Table 8‐2 Restrictions and Prohibitions on End Uses ................................................................................. 8‐3
Table 8‐3: Stages of WSCP ‐ Consumption Reduction Methods ................................................................. 8‐5
Table 8‐4 Retail: Minimum Supply Next Three Years ................................................................................. 8‐8
Table 10‐1: Notification to Cities and Counties ........................................................................................ 10‐1
Figure(s)
Figure 3‐1. Water Service Area .................................................................................................................. 3‐2
Figure 3‐2. Temperature and Precipitation Distribution ........................................................................... 3‐5

CH2M HILL ENGINEERS, INC VII
Acronyms and Abbreviations 20x2020 20 percent reduction goal
Act Urban Water Management Act
ADWF average dry weather flow
AF acre‐feet
AFG accelerated forecasted growth
AFY acre‐feet per year
AWE Alliance for Water Efficiency
AWWA American Water Works Association
BMPs Best Management Practices
CII Commercial, Industrial, and Institutional
CIMIS California Irrigation Management Information System
CNAP California Nevada Applications Program
CUWCC California Urban Water Conservation Council
District Otay Water District
DMP Drought Management Plan
DWR Department of Water Resources
EIR Environmental Impact Report
EIS Environmental Impact Statement
ERP Emergency Response Plan
ESP Emergency Storage Project
ETo Evapotranspiration
FY Fiscal Year
GDP General Development Plan
GHG greenhouse gas
GIS geographical information system
gpcd gallons per capita per day
gpd gallons per day
gpf gallons per flush
gpm gallons per minute
Guidebook Guidebook to Assist Urban Water Suppliers to Prepare a 2015 Urban Water Management Plan
IID Imperial Irrigation District
IRP Integrated Water Resources Plan
LMSE La Mesa‐Sweetwater Extension
LOPS Lower Otay Pump Station
Master Plan District 2015 Water Facilities Master Plan
Metropolitan Metropolitan Water District of Southern California
MFR Multi‐Family Residential
mgd million gallons per day
MOU Memorandum of Understanding
MWWD City of San Diego Metropolitan Wastewater Department
NOAA National Oceanic and Atmospheric Administration
OMCDSP Otay Mesa Conveyance and Disinfection System Project
Pipeline No. 4 Water Authority Pipeline Number 4

ACRONYMS AND ABBREVIATIONS
VIII CH2M HILL ENGINEERS, INC
PS Pump Station
RISA Regional Integrated Science and Assessments
RWCWRF Ralph W. Chapman Water Recycling Facility
SANDAG San Diego Association of Governments
SBWRP South Bay Water Reclamation Plant
SBX7‐7 Senate Bill 7 as part of the Seventh Extraordinary Session
SCADA Supervisory Control and Data Acquisition
Second Aqueduct Second San Diego Aqueduct
Series 13 SANDAG Series 13: 2050 Regional Growth Forecast
SFR Single Familty Residential
SVSD County of San Diego Spring Valley Sanitation District
UWMP or Plan Urban Water Management Plan
Water Authority San Diego County Water Authority
Water Code California Water Code
WD Water District
WSCP Water Shortage Contingency Planning
WSRP Water Shortage Response Plan
WTP Water Treatment Plant
WUCA Water Utility Climate Alliance
WWTP wastewater treatment plant
SECTION 1
CH2M HILL ENGINEERS, INC 1‐1
Introduction Since 1984, California’s Urban Water Management Planning Act (Act) has required each urban water supplier in the state to prepare an urban water management plan (UWMP). The requirement applies to each urban water supplier that provides water for municipal purposes either directly or indirectly to more than 3,000 customers or supplies more than 3,000 acre‐feet (AF) of water annually. These agencies must update their UWMP at least once every five years on or before December 31, in years ending in five and zero. The deadline for submittal of the 2015 UWMP for retail water purveyors is July 1, 2016 as a result of recent legislation. Sections 10610 through 10657 of the California Water Code (Water Code) detail the information that must be included in these plans. In accordance with the Act, the Otay Water District (District) is required to update and adopt its plan for submittal to the California Department of Water Resources (DWR) by July 1, 2016. Appendix A contains the text of the Act.
1.1 Changes to the California Urban Water Management Planning Act
Major amendments made to the Act since preparation of the District’s 2010 UWMP Plan include the following:
Water Code Section 10631 (f) (1) and (2), Assembly Bill 2067 (2014) ‐ Requires water suppliers to provide narratives describing their water demand management measures, as provided. Retail water suppliers are required to address the nature and extent of each water demand management measure implemented over the past 5 years and describe the water demand management measures that the supplier plans to implement to achieve its water use targets.
Water Code Section 10621 (d), Assembly Bill 2067 (2014) – Extended the submittal deadline and requires each urban water supplier to submit its 2015 UWMP to DWR by July 1, 2016.
Water Code Section 10644 (a) (2), Senate Bill 1420 (2014) ‐ Requires the plan, or amendments to the plan, to be submitted electronically to DWR.
Water Code Section 10644 (a) (2), Senate Bill 1420 (2014) ‐ Requires the plan, or amendments to the plan, to include any standardized forms, tables, or displays specified by DWR.
Water Code Section 10631 (e) (1) (J) and (e) (3) (A) and (B), Senate Bill 1420 (2014) ‐ Requires the UWMP to quantify and report on distribution system water loss.
Water Code Section 10631 (e) (4), Senate Bill 1420 (2014) ‐ Provides for water use projections to display and account for the water savings estimated to result from adopted codes, standards, ordinances, or transportation and land use plans, when that information is available and applicable to an urban water supplier.
Water Code Section 10631.2 (a) and (b), Senate Bill 1036 (2014) ‐ Provides for an urban water supplier to include certain energy‐related information, including, but not limited to, an estimate of the amount of energy used to extract or divert water supplies.
Water Code Section 10632 (b), Assembly Bill 2409 (2010) ‐ Requires urban water suppliers to analyze and define water features that are artificially supplied with water, including ponds, lakes, waterfalls, and fountains, separately from swimming pools and spas.

SECTION 1 – INTRODUCTION
1‐2 CH2M HILL ENGINEERS, INC
1.2 Senate Bills 610 and 221 Senate Bills (SB) 610 and 221 are the common names for Water Code Sections 10910 through 10914 and Government Code Sections 65867.5, 66455.3, and 66473.7. These bills amended state law to improve the link between water supply planning and land use decisions made by cities and counties. SB 610 requires that the water purveyor of the public water system prepare a water supply assessment to be included in the environmental documentation of certain large proposed projects. SB 221 requires a written verification from the water purveyor that sufficient water supplies are available for certain large residential subdivisions prior to approval of a tentative map. The District’s UWMP provides information that will be used in future assessments and verifications prepared to meet the requirements of these bills.
1.3 Senate Bill 7 of the Seventh Extraordinary Session of 2009 In addition to changes in the Act listed above, the state Legislature passed Senate Bill 7 as part of the Seventh Extraordinary Session (SBX7‐7) on November 10, 2009, which became effective February 3, 2010. This new law was the water conservation component to the Delta legislation package, and seeks to achieve a 20 percent statewide reduction in urban per capita water use in California by December 31, 2020. Specifically, SBX 7‐7 from this Extraordinary Session requires each urban retail water supplier to develop urban water use targets to help meet the 20 percent reduction goal by 2020 (20x2020), and an interim water reduction target by 2015.
The SBX 7‐7 target setting process includes the following: (1) baseline daily per capita water use; (2) urban water use target; (3) interim water use target; (4) compliance daily per capita water use, including technical bases and supporting data for those determinations. In order for an agency to meet its 2020 water use target, each agency can increase its use of recycled water to offset potable water use and also step up its water conservation measures. The required water use targets for 2020 and an interim target for 2015 are determined using one of four “Target” methods – each method has numerous methodologies. The 2020 urban water use target may be updated in a supplier’s 2015 UWMP. Appendix A also contains the text of SBX 7‐7.
Four methods are stipulated for calculating the water use target. Three of the methods are listed in Water Code Section 10608.20(a)(1). The fourth method was developed by DWR at the end of 2010. The four methods are:
Method 1 – Eighty percent of the water supplier’s baseline per capita potable water use
Method 2 – Per capita daily water use estimated using the sum of performance standards applied to indoor residential use, landscape area water use, and commercial, industrial, and institutional uses
Method 3 – Ninety‐five percent of the applicable state hydrologic region target as stated in the state’s 20x2020 Water Conservation Plan.
Method 4 – An approach developed by DWR and reported to the Legislature in February 2011
The District’s 2010 UWMP presented the 2015 and 2020 water use targets using Method 1. In the 2015 UWMP, the District is required to report interim compliance followed by actual compliance in 2020. Baseline, target, and compliance‐year water use estimates are required to be reported in gallons per capita per day (gpcd). For consistent application of the Act, DWR produced Methodologies for Calculating Baseline and Compliance Urban Water Per Capita Use in October 2010. Discussion on the District’s baseline and target 2020 demands are discussed in more detail in Section 5.
SECTION 1 – INTRODUCTION
CH2M HILL ENGINEERS, INC 1‐3
Failure to meet adopted targets will result in the ineligibility of a water supplier to receive grants or loans administered by the State unless one (1) of two (2) exceptions is met. Exception one (1) states a water supplier may be eligible if they have submitted a schedule, financing plan, and budget to DWR for approval to achieve the per capita water use reductions. Exception two (2) states a water supplier may be eligible if an entire water service area qualifies as a disadvantaged community.
1.4 Resource Maximization The District’s commitment to maximizing resources is reflected in its mission statement, which is,
“…to provide safe, reliable water and wastewater services to our community with innovation, in a cost‐efficient, water‐wise and environmentally responsible manner.”
For many years, the District has worked to reduce its reliance on imported water, and in particular treated imported water. On August 3, 1994, the District’s Board of Directors established a goal of being able to meet 40 percent of annual demands from local water sources when water is unavailable from the San Diego County Water Authority (Water Authority). The District and the Water Authority entered into an agreement in 2006 to provide the District with treated water from the Helix Water District (Helix WD) in addition to the District’s normal treated water supply from the Water Authority. A similar arrangement made with the City of San Diego in 1999 provides the District access to treated water from the City of San Diego’s Otay Water Treatment Plant (WTP). The District has also aggressively developed its recycled water distribution system and has entered into an agreement to purchase recycled water from the City of San Diego. These water sources are further discussed in Section 6.0.
Water conservation is an important component of the District’s commitment to reducing reliance on imported water. In partnership with the Water Authority, the City of Chula Vista, and residential and commercial developers, the District’s water use efficiencies and conservation efforts are expected to grow and expand. The District is also committed to continuing investigations of local groundwater, additional recycled water, desalination, and other potential water resources that could further reduce the District’s reliance on imported water.

SECTION 2
CH2M HILL ENGINEERS, INC 2‐1
Plan Preparation This section provides the basis and approach that the District used to update its UWMP. It also includes the data reporting period (calendar vs. fiscal year) and units of measure used by the District to report water volumes. This section also includes the details of the coordination and outreach activities conducted by the District during the preparation of this UWMP.
2.1 Basis and Approach for Preparing the UWMP The District submitted its first UWMP in 2000 in compliance with the Act. The District has submitted the last update to the UWMP in 2010. The normal cycle requires that the UWMP be submitted in December of years ending in five and zero. Recent changes in the Plan requirements have necessitated the need for State law to extend the 2015 deadline to July 1, 2016. However, this UWMP is referred to as the 2015 Plan to retain consistency with the five‐year submittal cycle.
In accordance with CWC, urban water suppliers with 3,000 or more service connections or supplying 3,000 or more AF of water per year are required to prepare an UWMP every five years. As an urban water supplier, the District is required to update and submit its 2015 plan to the department by July 1, 2016. The District has served 48,651 municipal connections and supplied volume of 30,298 AF in 2015 (Table 2‐1).
The District utilized DWR’s “Guidebook to Assist Urban Water Suppliers to Prepare a 2015 Urban Water Management Plan” (Guidebook) and SBX 7‐7 to prepare this plan. SBX 7‐7 was passed in November 2009 with the goal of reducing California’s urban per capita water use by 20 percent by December 31, 2020 with an incremental goal of reducing per capita water use by 10 percent by December 31, 2015. Each urban water supplier is also required to meet SBX 7‐7 goals, which are discussed later in this report. This report includes projections of the District’s future demands and supplies, based on estimates of future growth in the District’s service area. It also discusses the steps the District has taken to promote water conservation and ensure water is being used wisely. The strategies outlined in this report are intended to allow the District to continue to provide a safe and reliable water supply to its customers.
The District prepared this UWMP with the assistance of its consultant, CH2M, as permitted by Section 10620 (e) of the Act.
Table 2‐1 Public Water Systems
Public Water System Number
Public Water System Name
Number of Municipal
Connections 2015
Volume of Water Supplied
2015
CA 3710034 Otay Water District 48,651 30,299
Source: District CWA Data Report for FY15
2.2 Level of Planning and Compliance The District joined the Water Authority as a member agency in 1956. The Water Authority is responsible for the supply of imported water into the San Diego County through its membership in Metropolitan

SECTION 2 – PLAN PREPARATION
2‐2 CH2M HILL ENGINEERS, INC
Water District of Southern California (Metropolitan). The District receives imported potable water from the aqueduct systems owned and operated by the Water Authority and Metropolitan. Together these agencies work to ensure a diverse and reliable supply for the San Diego region.
Effective water planning for the Water Authority and its member agencies requires consistent projections of supply and demand. The Water Authority facilitated an Urban Water Management Plan Working Group made up of staff from the Water Authority and its member agencies. This group provided a forum for exchanging demand and supply information. In addition, DWR and the Water Authority hosted a special workshop to review the requirements of the Act. The District participated in several workshops and meetings, providing water supply and demand information as well as recycled water opportunities.
The District’s potable demands are currently met with imported water provided through the Water Authority and Metropolitan. Much of the supply discussion in this report is based on the supply planning performed by these regional agencies. The District is engaged in regional water supply planning and coordinates with regional partners. However, this is an individual UWMP that reports on water demands and supplies in the District's service area (as noted in Table 2‐2).
The District maintains its records of water use on a fiscal year (FY) that runs from July 1 through June 30 (Table 2‐3). For example, FY 2015 runs from July 1, 2014 through June 30, 2015. In this document, projections of water demand over the course of a year are reported on a fiscal year basis. For estimates that are based on an instantaneous value and not a year‐long accumulation (for example, the service area population), values are assumed to be valid on January 1 of the corresponding year.
Table 2‐2: Plan Identification
X Individual UWMP
Regional UWMP (RUWMP)
NOTES:
Table 2‐3: Agency Identification
Type of Agency
Agency is a wholesaler
X Agency is a retailer
Fiscal or Calendar Year
UWMP Tables Are in Calendar Years
X UWMP Tables Are in Fiscal Years
If Using Fiscal Years Provide Month and Day that the Fiscal Year Begins
1 July
Units of Measure Used in UWMP
X Acre Feet (AF)
Million Gallons (MG)
Hundred Cubic Feet (CCF)
NOTES:

SECTION 2 – PLAN PREPARATION
CH2M HILL ENGINEERS, INC 2‐3
2.3 Agency Coordination and Outreach
2.3.1 Wholesale and Retail Coordination The District has coordinated the preparation of its plan with other appropriate agencies in the area, including its wholesaler, i.e., the Water Authority (Table 2‐4). Since the District relies upon the water supply from the Water Authority, the District has worked with the Water Authority and shared information for water supply and demand projections.
Table 2‐4: Water Supplier Information Exchange
The retail supplier has informed the following wholesale supplier(s) of projected water use in accordance with CWC 10631.
Wholesale Water Supplier Name
San Diego County Water Authority
NOTES:
2.3.2 Coordination with Other Agencies and the Community The District has coordinated the preparation of its plan with other appropriate agencies in the area, including other water suppliers that share a common source, water management agencies, and public agencies (Table 2‐5). In accordance with the Act, the District provided a 60‐day notice to the Water Authority (its wholesale water supplier) and the San Diego Association of Governments (SANDAG), the City of San Diego, City of Chula Vista, and County of San Diego that they were reviewing and considering amendments or changes to the UWMP and that they would be holding a public hearing prior to the adoption of the UWMP. A copy of the 60‐day notice is included in Appendix B.
Also, in accordance with the Act, the District notified the land use jurisdictions (City of Chula Vista, City of San Diego and County of San Diego) within its service area that it was preparing the 2015 UWMP.
Prior to adoption, the District will make its Draft 2015 UWMP available to stakeholders including the Water Authority, the City of Chula Vista, the County of San Diego, and the City of San Diego.
The notice and instructions for downloading the Draft 2015 UWMP from the District’s website was also made available to interested parties as listed in Table 2‐5. The Draft 2015 UWMP was first presented at a Water Resources Committee Meeting of the District’s Board of Directors. A Public Hearing regarding the 2015 UWMP will held on June 1, 2016. Notices of the Public Hearing will be published in the San Diego Union‐Tribune (xx, 2016), The Star News (xx, 2016), The East County Californian (xx, 2016), and The Alpine Sun (xx, 2016). These coordination efforts are summarized in Table 2‐5 and copies of the public notices are included in Appendix B.

SECTION 2 – PLAN PREPARATION
2‐4 CH2M HILL ENGINEERS, INC
Table 2‐5. Coordination with Appropriate Agencies
Agency Sent Notification
Letter
Participated in UWMP
Development
Commented on Draft UWMP
Attended Public
Meetings
Received copy of Draft of Notice of Availability
Sent Notice of Intention to Adopt UWMP
Wholesale Water Supplier
San Diego County Water Authority
Other Coordination
City of San Diego
City of Chula Vista
Helix Water District
County of San Diego
Chula Vista Planning Commission
San Diego Association of Governments (SANDAG)
San Diego LAFCO
Sweetwater Authority
Crest/Dehesa Planning Group
Jamul/Dulzura Planning Group
Otay Mesa Planning Group
Spring Valley Community Planning Group
Sweetwater Planning Group
Valley de Oro Planning Group
Constituents of the District
Local Libraries
Notes:

SECTION 3
CH2M HILL ENGINEERS, INC 3‐1
Service Area This section of the report provides an overview of the District’s service area, its current water supply, an analysis of available demographics, population growth projections, and climate data to provide a basis for estimating future water requirements.
The District’s service area has experienced some growth in the past five years, and the service area population is expected to be approximately 285,340 people by 2040.
3.1 Service Area Description The District is located in the southern half of San Diego County and was created in 1956 by a small group of private citizens, ranchers and landowners who were concerned about the declining quality and quantity of water from their rural wells. The District joined the Water Authority as a member agency in the same year. The Water Authority is the agency responsible for the supply of imported water into the San Diego County through its membership in Metropolitan.
The District is a California special district authorized under the provisions of the Municipal Water District Law of 1911 and is revenue neutral, i.e., each end user pays their fair share of costs for capital improvements, water acquisition, and the operation and maintenance of facilities. Its elected Board of Directors sets the District ordinances, policies, taxes, and rates for providing wastewater, potable water, and recycled water services.
The District’s water service area is generally located within the south central portion of San Diego County and includes approximately 126 square miles. The topography of the service area is diverse, consisting of a variety of valleys, hills, mountains, mesas, lakes and rivers. The service area includes both urban and rural development. The major transportation arteries serving the area include State Highway 94 in the north, Interstate 805 in the southwest and the newly constructed State Route 125 to the east. Interstate 905 and State Highway 11 are in the process of being constructed in the Otay Mesa area.
The District serves a wide spectrum of communities including southern El Cajon, La Mesa, Rancho San Diego, Jamul, Spring Valley, Bonita, eastern City of Chula Vista, East Lake, Otay Ranch and Otay Mesa areas. The water purveyors that border the District include Padre Dam Municipal Water District (Padre Dam MWD) on the north, Helix WD on the northwest, and the Sweetwater Authority, and the City of San Diego on the west. The southern boundary of the District is the international border with Mexico.
A map showing the regional jurisdictional boundaries within the District is shown on Figure 3‐1.
There is currently no adjacent water purveyor located to the east of the District, which provides an opportunity for service for future land uses, such as the Otay Ranch General Development Plan (GDP) Area of Influence.

SECTION 3 – SERVICE AREA
3‐2 CH2M HILL ENGINEERS, INC
Source: District Draft 2015 Water Facilities Master Plan, Figure 6‐1 Water Service Area
Figure 3‐1. Water Service Area

SECTION 3 – SERVICE AREA
CH2M HILL ENGINEERS, INC 3‐3
3.2 Service Area Population The District’s service area population has grown from approximately 48,300 in 1980 to a 2015 population of 217,339. Data on the future rate of growth within the District were obtained from the SANDAG Series 13: 2050 Regional Growth Forecast (Series 13) adopted by SANDAG’s Board of Directors in October 2013. The Series 13 forecast integrates 2010 Census counts and an economic outlook on regional growth and lower water demands over the long‐term planning horizon. SANDAG serves as the regional, intergovernmental planning agency and provides estimates of population and housing up to the year 2050.
SANDAG has prepared forecasts of population, housing and employment in each census tract in 5‐year increments between 2010 and 2040. For this analysis, the District assumed that the population within each census tract was uniformly distributed around the tract. The census tract data were intersected with the District’s service area boundary using geographical information system (GIS) software. The estimated service area population is shown in Table 3‐1.
Table 3‐1. Population ‐ Current and Projected
Population Served
2015 2020 2025 2030 2035 2040
217,339 243,845 255,040 257,278 277,429 285,340
Source: District 2015 Water Facilities Master Plan Update, Appendix C and SANDAG Series 13 forecast
3.2.1 Other Demographic Factors The District’s long‐term historic growth rate has averaged around 4 percent. In recent years, growth has occurred at a reduced rate due to a slowdown in economic conditions. The SANDAG forecast shows an average annual growth rate of 6 percent through 2040. The growth rate is expected to slow as the inventory of developable land is diminished.
The water service planning area comprises three distinct land use planning agencies: the City of San Diego, the City of Chula Vista, and the County of San Diego. Documents that govern land use planning in these jurisdictions consist of the City of San Diego General Plan, the City of Chula Vista General Plan, and the County of San Diego’s General Plan. All three include various sub‐regional and community level plans within the District.
Approximately 90 percent of the District’s customers are single‐family residences. Much of the anticipated development in the District’s service area is also single‐family residential. The relative composition of the District’s customers is expected to remain consistent. The other customer sectors, such as commercial, industrial, and institutional are expected to grow at the same rate to support the residential development.
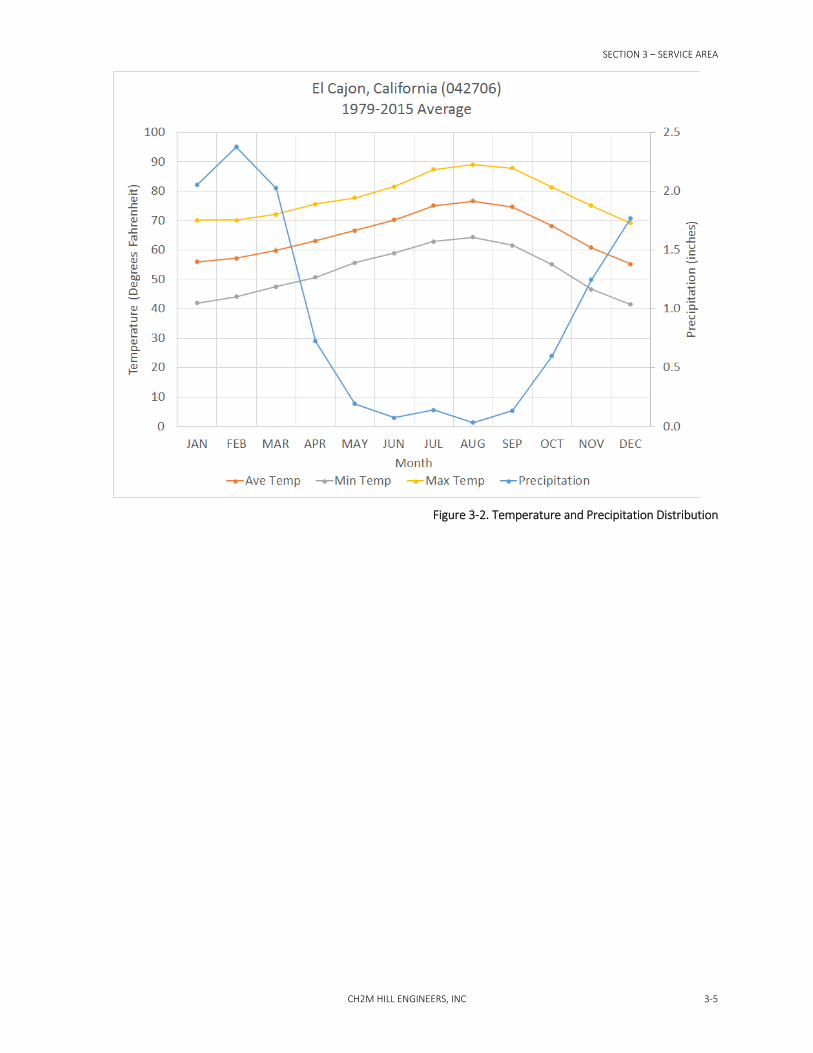
3.3 Climate Data Climatic conditions within the service area are characteristically Mediterranean near the coast, with mild temperatures year round. Inland areas are both hotter in summer and cooler in winter, with summer temperatures often exceeding 90 degrees and winter temperatures occasionally dipping to below freezing. Most of the region’s rainfall occurs December through March. Total average annual rainfall is approximately 10.08 inches per year.
Historic climate data were obtained from the Western Regional Climate Center for Station 042706 (El Cajon) for fiscal years 2011 through 2015. This station was selected because its annual temperature

SECTION 3 – SERVICE AREA
3‐4 CH2M HILL ENGINEERS, INC
variation is representative of most of the District’s service area. While there is a station in Chula Vista, the temperature variation at the Chula Vista station is more typical of a coastal environment than the conditions in most of the District’s service area.
Evapotranspiration data were obtained from the California Irrigation Management Information System (CIMIS) for fiscal years 2011 through 2015. Because conditions in the service area vary from coastal areas to inland areas, evapotranspiration (ETo) data are reported for two stations: 147 (Otay Lakes), and 153 (Escondido SPV). The evapotranspiration data are based on historical data since 1999 and the long‐term averages provided by CIMIS. Climate and evapotranspiration data are summarized in Table 3‐2. The typical annual distribution for temperature and precipitation are shown in Figure 3‐2.
Table 3‐2. Climate Data
Month
Monthly Average Evapotranspiration (inches) El Cajon (042706)
Otay Lakes No. 147 Escondido SPV No. 153
Average Monthly Total Rainfall (inches)
Average Temperature (Fahrenheit)
January 2.46 2.59 0.75 57.00
February 2.79 2.73 1.59 57.29
March 4.16 4.20 1.48 61.10
April 4.91 5.18 0.57 63.30
May 5.69 6.00 0.46 66.47
June 6.17 6.80 0.05 70.05
July 6.05 6.79 0.00 74.14
August 6.09 6.72 0.06 76.19
September 5.04 5.29 0.08 75.57
October 3.70 3.71 0.84 68.02
November 2.74 2.69 1.21 60.90
December 2.02 1.87 2.99 55.70
Annual Total 51.82 54.58 10.08 65.48
Source: CIMIS for Stations 147 (Otay Lakes), and 153 (Escondido SPV) and Western Regional Climate Center for Station 042706 (El Cajon).
SECTION 3 – SERVICE AREA
CH2M HILL ENGINEERS, INC 3‐5
Figure 3‐2. Temperature and Precipitation Distribution
SECTION 4
CH2M HILL ENGINEERS, INC 4‐1
Water Use As part of the UWMP, California regulation requires water suppliers to quantify past and current water use and to project the total water demand for the water system, including calculations of its baseline (base daily per capita) water use and interim and urban water use targets. Projections of future water demand allow a water supplier to analyze if future water supplies are adequate, as well as help the agency when sizing and staging future water facilities to meet water use targets. Projected water use, combined with population projections, provide the basis for estimating future water requirements.
This chapter provides the District’s current water use and water use projections through the year 2040. In this chapter, the term “water use” and “water demand” has been used interchangeably. Recycled water is addressed comprehensively in Chapter 6, but a summary of recycled water demand is included in this section (in Table 4‐3) as well.
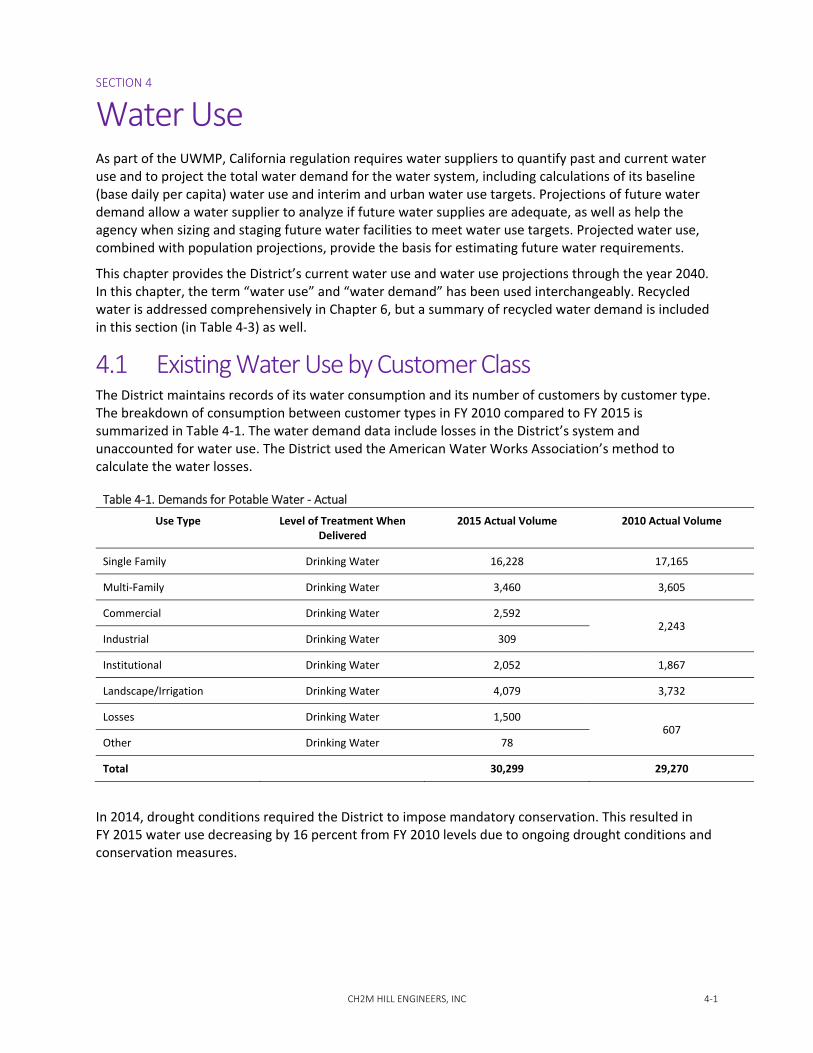
4.1 Existing Water Use by Customer Class The District maintains records of its water consumption and its number of customers by customer type. The breakdown of consumption between customer types in FY 2010 compared to FY 2015 is summarized in Table 4‐1. The water demand data include losses in the District’s system and unaccounted for water use. The District used the American Water Works Association’s method to calculate the water losses.
Table 4‐1. Demands for Potable Water ‐ Actual
Use Type Level of Treatment When Delivered
2015 Actual Volume 2010 Actual Volume
Single Family Drinking Water 16,228 17,165
Multi‐Family Drinking Water 3,460 3,605
Commercial Drinking Water 2,592 2,243
Industrial Drinking Water 309
Institutional Drinking Water 2,052 1,867
Landscape/Irrigation Drinking Water 4,079 3,732
Losses Drinking Water 1,500 607
Other Drinking Water 78
Total 30,299 29,270
In 2014, drought conditions required the District to impose mandatory conservation. This resulted in FY 2015 water use decreasing by 16 percent from FY 2010 levels due to ongoing drought conditions and conservation measures.

SECTION 4 – WATER USE
4‐2 CH2M HILL ENGINEERS, INC
4.2 Projected Future Water Use
4.2.1 Approach / Methodology The District projected future water demands as part of its 2015 Water Facilities Master Plan (Master Plan) update. The Master Plan forecasts future water demands using existing demands as a base, and scales these based on the net effects of growth, conservation, and other factors. The forecast methodology is outlined below.
a) Existing baseline unit demands. The Master Plan uses actual unit use factors for calendar year 2013 as the baseline normal condition demands for the forecast period. 2013 demands are sufficiently distant from the Water Use Alert conditions in effect in most of the County during 2009‐10. 2013 was moderately dryer than normal, which would tend to increase use, but this increase is offset by below‐normal economic activity as the economy continued to recover from the Great Recession.
b) New development. New development demands are generated using the baseline unit use factors, and the SANDAG Draft Series 13 projections for the District at the pressure zone level of spatial resolution.
Residential: Single Family Residential (SFR) and Multi‐Family Residential) MFR usage is scaled upwards proportionate to housing unit counts for each category, and adjusted for projected changes in Persons Per Household rates.
Public / Commercial: Commercial, industrial, and governmental usage is scaled upwards from existing use proportionate to employment projections.
Irrigation: Usage is scaled upward as a weighted average of the change in SFR, MFR, and commercial usage.
Temporary Meters: TEMP account usage is custom entered to reflect levels consistent with the building activity reflected in the Series 13 forecasts, based on past TEMP account usage from 2000 to 2007.
c) Reduced demands due to additional conservation efficiencies and other factors. The Master Plan projects unit use rates will continue to decline over time in response to increased water rates, conservation education, and shifting landscape preferences. These factors are summarized in Table 4‐S1.
Forecast Methodology Summary
a) Existing Baseline Demands
+
b) New Development Demands
‐
c) Reductions Due to Additional Conservation Efficiencies
=
FUTURE DEMANDS
Demand forecast components. The forecast methodology starts with existing baseline demands, and adjusts for growth from new development, and for changes in per account usage due to conservation efficiencies and other effects.
SECTION 4 – WATER USE
CH2M HILL ENGINEERS, INC 4‐3
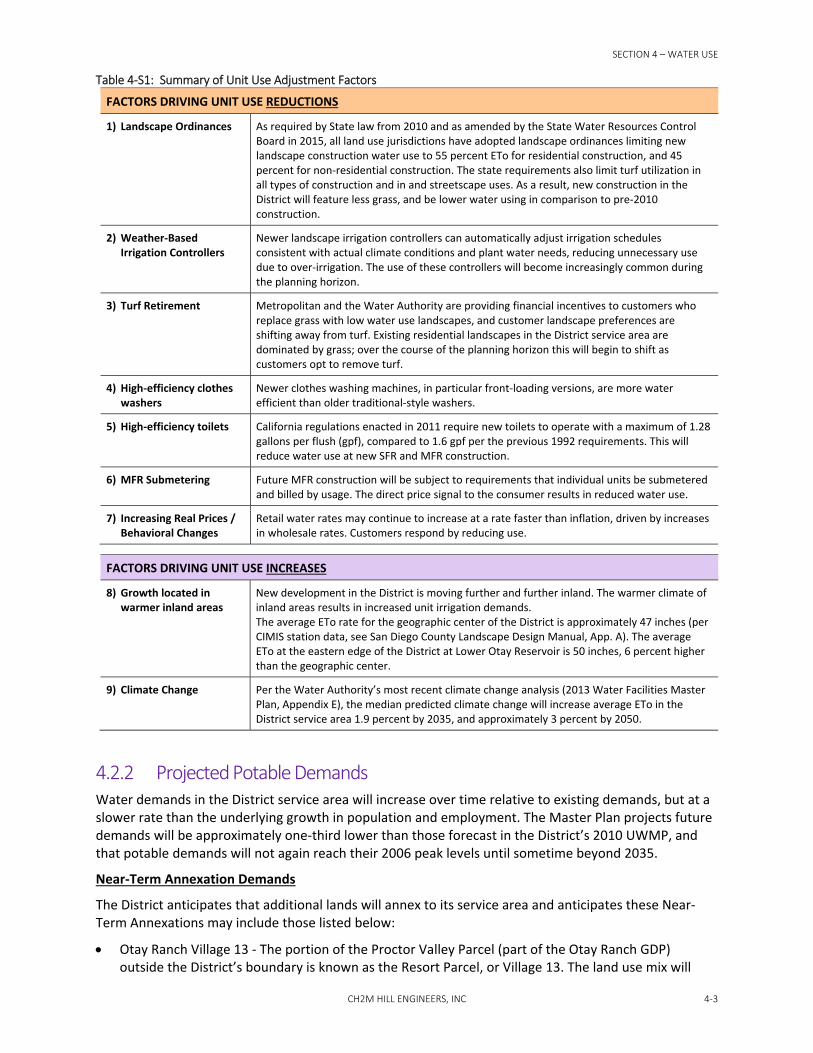
Table 4‐S1: Summary of Unit Use Adjustment Factors
FACTORS DRIVING UNIT USE REDUCTIONS
1) Landscape Ordinances As required by State law from 2010 and as amended by the State Water Resources Control Board in 2015, all land use jurisdictions have adopted landscape ordinances limiting new landscape construction water use to 55 percent ETo for residential construction, and 45 percent for non‐residential construction. The state requirements also limit turf utilization in all types of construction and in and streetscape uses. As a result, new construction in the District will feature less grass, and be lower water using in comparison to pre‐2010 construction.
2) Weather‐Based Irrigation Controllers
Newer landscape irrigation controllers can automatically adjust irrigation schedules consistent with actual climate conditions and plant water needs, reducing unnecessary use due to over‐irrigation. The use of these controllers will become increasingly common during the planning horizon.
3) Turf Retirement Metropolitan and the Water Authority are providing financial incentives to customers who replace grass with low water use landscapes, and customer landscape preferences are shifting away from turf. Existing residential landscapes in the District service area are dominated by grass; over the course of the planning horizon this will begin to shift as customers opt to remove turf.
4) High‐efficiency clothes washers
Newer clothes washing machines, in particular front‐loading versions, are more water efficient than older traditional‐style washers.
5) High‐efficiency toilets California regulations enacted in 2011 require new toilets to operate with a maximum of 1.28 gallons per flush (gpf), compared to 1.6 gpf per the previous 1992 requirements. This will reduce water use at new SFR and MFR construction.
6) MFR Submetering Future MFR construction will be subject to requirements that individual units be submetered and billed by usage. The direct price signal to the consumer results in reduced water use.
7) Increasing Real Prices / Behavioral Changes
Retail water rates may continue to increase at a rate faster than inflation, driven by increases in wholesale rates. Customers respond by reducing use.
FACTORS DRIVING UNIT USE INCREASES
8) Growth located in warmer inland areas
New development in the District is moving further and further inland. The warmer climate of inland areas results in increased unit irrigation demands. The average ETo rate for the geographic center of the District is approximately 47 inches (per CIMIS station data, see San Diego County Landscape Design Manual, App. A). The average ETo at the eastern edge of the District at Lower Otay Reservoir is 50 inches, 6 percent higher than the geographic center.
9) Climate Change Per the Water Authority’s most recent climate change analysis (2013 Water Facilities Master Plan, Appendix E), the median predicted climate change will increase average ETo in the District service area 1.9 percent by 2035, and approximately 3 percent by 2050.
4.2.2 Projected Potable Demands Water demands in the District service area will increase over time relative to existing demands, but at a slower rate than the underlying growth in population and employment. The Master Plan projects future demands will be approximately one‐third lower than those forecast in the District’s 2010 UWMP, and that potable demands will not again reach their 2006 peak levels until sometime beyond 2035.
Near‐Term Annexation Demands
The District anticipates that additional lands will annex to its service area and anticipates these Near‐Term Annexations may include those listed below:
Otay Ranch Village 13 ‐ The portion of the Proctor Valley Parcel (part of the Otay Ranch GDP) outside the District’s boundary is known as the Resort Parcel, or Village 13. The land use mix will

SECTION 4 – WATER USE
4‐4 CH2M HILL ENGINEERS, INC
include approximately 1,738 SFR dwelling units, 200 MFR dwelling units, 29.3 acres of commercial, 26.0 acres of parks, and a 10.1‐acre school site. Village 13 is anticipated to be annexed into the District to receive water service.
Sycuan Reservation ‐ Demand of 400 AF consisting of existing uses for homes, office buildings, medical center and casino, and future demands to include expansion of a casino, medical center, and hotel.
Peaceful Valley Ranch ‐ 152.4 acres for a proposed estate residential development proposed to develop 52 estate residential units, and equestrian uses and amenities.
Stoddard Parcel ‐ 8‐acre lot with existing home, adjacent to the District boundary and the proposed Peaceful Valley Ranch annexation.
San Ysidro Mountains Parcel, Planning Area 17 ‐ The land areas included within the 5,555‐acre San Ysidro Mountains Parcel, also part of the Otay Ranch GDP, includes Village 15 and Planning Area 17. Since the 2002 Water Resources Master Plan, Village 15 has been recorded as open space preserve. According to the District, a conservatory now owns the land with the intent to remain open space. Planning Area 17 is planned to include 296 single‐family units over 800 acres. Over 85 percent of the parcel is designated as open space. The entire parcel lies outside of the District boundary, but within the Area of Influence.
Annexations East of Village 13 ‐ The current land use will change slightly with the new San Diego County 2020 Update. It will be Semi Rural based on the average slope of the property (1 dwelling unit for every 2, 4, or 8 Acres). The density on the 1,776 acres available will generate 468 units at 320 gallons per unit or 150,000 gallons per day (gpd). Since this is rural land, some irrigation is included. This brings the total to 151,800 gpd. Most of the remaining area is assumed to be non‐irrigated open space.
The District projects water demands for these project will be as summarized in Table 4‐S2:
Table 4‐S2. District Anticipated Near‐Term Annexations
Potential Annexation Estimated Annual Demands (AFY)
2020 2020 ‐ 2040
Otay Ranch Village 13 1,961 1,961
Sycuan Reservation 392 392
Peaceful Valley Ranch 70 70
Stoddard Parcel 2 2
San Ysidro Mt. Parcel Village 17 (296 SFR units) 148 148
Annexations East Of Village 13 400 400
Total 2,973 2,973
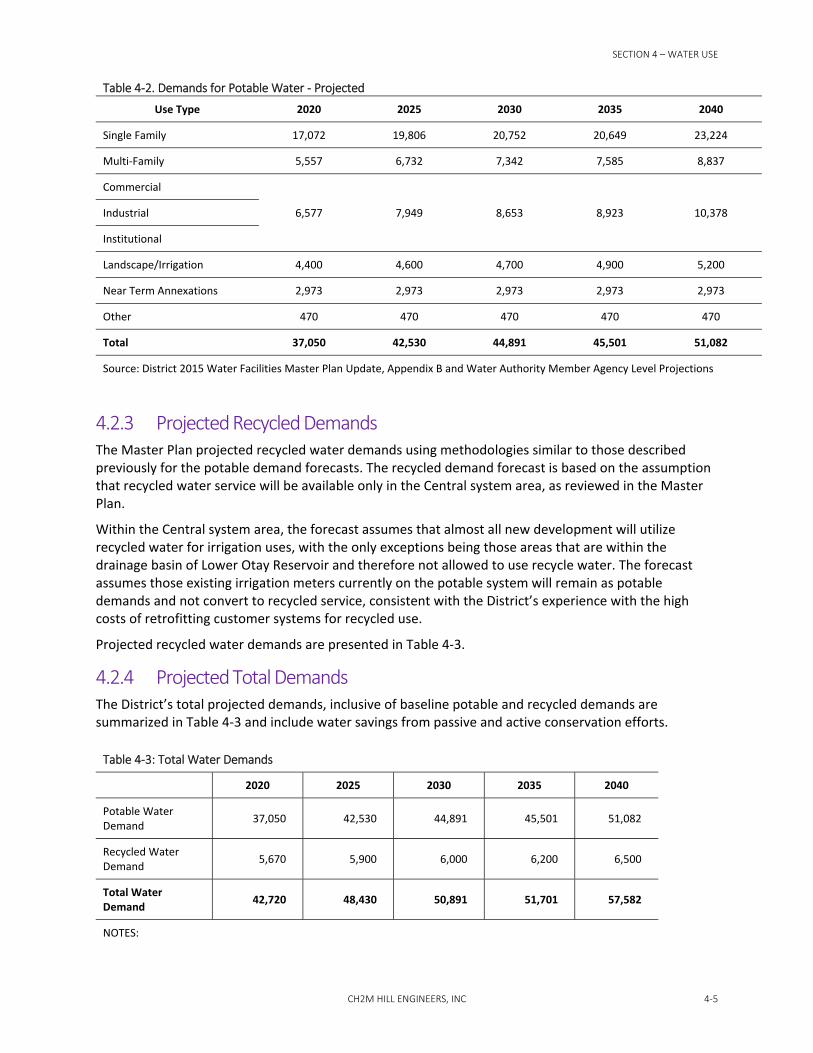
The District’s projected potable water demands, including near term annexations, are summarized in Table 4‐2.
SECTION 4 – WATER USE
CH2M HILL ENGINEERS, INC 4‐5
Table 4‐2. Demands for Potable Water ‐ Projected
Use Type 2020 2025 2030 2035 2040
Single Family 17,072 19,806 20,752 20,649 23,224
Multi‐Family 5,557 6,732 7,342 7,585 8,837
Commercial
6,577 7,949 8,653 8,923 10,378 Industrial
Institutional
Landscape/Irrigation 4,400 4,600 4,700 4,900 5,200
Near Term Annexations 2,973 2,973 2,973 2,973 2,973
Other 470 470 470 470 470
Total 37,050 42,530 44,891 45,501 51,082
Source: District 2015 Water Facilities Master Plan Update, Appendix B and Water Authority Member Agency Level Projections
4.2.3 Projected Recycled Demands The Master Plan projected recycled water demands using methodologies similar to those described previously for the potable demand forecasts. The recycled demand forecast is based on the assumption that recycled water service will be available only in the Central system area, as reviewed in the Master Plan.
Within the Central system area, the forecast assumes that almost all new development will utilize recycled water for irrigation uses, with the only exceptions being those areas that are within the drainage basin of Lower Otay Reservoir and therefore not allowed to use recycle water. The forecast assumes those existing irrigation meters currently on the potable system will remain as potable demands and not convert to recycled service, consistent with the District’s experience with the high costs of retrofitting customer systems for recycled use.
Projected recycled water demands are presented in Table 4‐3.
4.2.4 Projected Total Demands The District’s total projected demands, inclusive of baseline potable and recycled demands are summarized in Table 4‐3 and include water savings from passive and active conservation efforts.
Table 4‐3: Total Water Demands
2020 2025 2030 2035 2040
Potable Water Demand
37,050 42,530 44,891 45,501 51,082
Recycled Water Demand
5,670 5,900 6,000 6,200 6,500
Total Water Demand
42,720 48,430 50,891 51,701 57,582
NOTES:

SECTION 4 – WATER USE
4‐6 CH2M HILL ENGINEERS, INC
Accelerated Forecasted Growth Demand
The Water Authority’s 2015 UWMP long‐range water demand forecast incorporates a small demand increment associated with potential accelerated forecasted growth (AFG). This demand increment is intended to account for land‐use development included in SANDAG’s growth forecast and projected to occur beyond year 2040, but not yet accounted for in local jurisdictions’ general land use plans.
The AFG demand increment was included in the Water Authority’s 2015 UWMP to assist member agencies with general plan amendments that rely on the Water Authority’s demand forecast to comply with laws linking water availability and land‐use approvals, and intended to ensure the Water Authority is adequately planning supplies for potential growth within the service area during the 2015 UWMP planning horizon. As a member agency of the Water Authority, the District has access to the Water Authority’s regional supply associated with AFG ,in conjunction with supplies identified in the District’s 2015 UWMP, to document the availability of water supplies to serve proposed projects when preparing a Water Supply Assessment (Water Code Section 10912 (a)). Additionally, the Water Authority will track demands associated with member agency projects requesting a portion of the AFG demand increment, to demonstrate that adequate supplies exist for each new development.
4.3 Service Area Sales and System Losses The District does not sell any water to other agencies.
Distribution system water losses (also known as “real losses”) are the physical water losses from the water distribution system and storage facilities, up to the point of customer delivery. The District used the American Water Works Association (AWWA) Method and Guidebook (Appendix L) worksheet to report and calculate system losses. For FY 2015, the District’s reported losses were 265 acre‐feet per year (AFY). The worksheet is provided as Appendix C and will be submitted electronically to DWR.
Table 4‐4: Water Loss Summary Most Recent 12 Month Period Available
Reporting Period Start Date (Month/Year)
Loss
July/2014 265
NOTES:
4.4 Estimating Future Water Savings The potable water demand projections presented in this UWMP include active and passive water conservation savings. Future water conservation was estimated by the Water Authority for its member agencies, using the Alliance for Water Efficiency (AWE) conservation tracking tool listed in DWR’s 2015 UWMP Guidebook as an application to assist water purveyors in developing savings estimates. The projected active conservation savings are based on the continuation of conservation incentives and rebate programs.
Table 4‐5: Inclusion in Water Use Projections
Future Water Savings Included Yes
If "Yes" to above, state the section or page number where citations of the codes, ordinances, etc utilized in demand projections are found.
Location in UWMP: Section 4.4, Water Authority UWMP Section 2.4.2
Lower Income Residential Demands Included Yes
NOTES:

SECTION 4 – WATER USE
CH2M HILL ENGINEERS, INC 4‐7
Table 4‐6: Projected Future Conservation Savings ‐ District 2020 2025 2030 2035 2040
Active Conservation 2,111 1,844 1,585 1,538 1,587
Passive Conservation 2,497 4,497 5,489 6,040 6,744
Total 4,608 6,341 7,074 7,578 8,331
4.5 Lower Income Water Demand Projections The requirements for the 2015 UWMP call for projections of water demands for low‐income customers. The District reviewed the Housing elements from the City of Chula Vista, City of San Diego, and County of San Diego’s General Plans, which forecast projections to 2030. Demands for the projected low‐income housing projects were estimated using the District’s planning demand criteria in its 2015 Master Plan for high density multi‐family residential units. Projected water demands were then distributed equally throughout 2015 and 2040. These demands have been assumed as part of the general growth within the District and have been included in the District’s potable water demand projections.
4.6 Climate Change Climate change adds its own new uncertainties to the challenges of planning. Changes in weather significantly affect water supply planning, irrespective of the debate associated with the sources and cause of increasing concentrations of greenhouse gasses. Typically, water supplies that are dependent on natural hydrology are vulnerable to climate change, especially if the water source originates from mountain snow pack. The most vulnerable water sources subject to climate change impacts are the District’s imported water supplies from the Water Authority. In addition to water supply impacts, changes in local temperature and precipitation are expected to alter water demand patterns. The District is committed to performing its due diligence with respect to climate change.
The vulnerability of the water resources in California to climate change stems from a modified hydrology that affects the frequency, intensity, and duration of extreme events, which, in turn, affect water quantity, quality, and infrastructure. The California Climate Science and Data for Water Resources Management (DWR, June 2015) report summarizes the latest climate change indicators, implications and strategies for water managers in California under key climate‐induced factors.
As the climate change continues to impact the State’s water resources, the District is continuously reviewing and updating new strategies and reevaluating existing policies, regulations, facilities, and funding priorities to mitigate effects of climate on water resources. Some of the considerations of mitigation and adaptation strategies include:
■ Exploring the use of local groundwater supplies.
■ Promoting recycled water use.
■ Developing long‐term plans that utilize climate change adaptation components.
■ Promoting water use efficiency for urban, agricultural, commercial, and industrial water users.
■ Increasing investments in infrastructure that promote adaptation strategies and mitigate the loss of existing supplies that are susceptible to climate change impacts.
The summer of 2015 was recently highlighted as having a record‐breaking heat wave in nearly 40 years, but this influence on water demand is not currently known. Currently, the California Urban Water Conservation Council (CUWCC) is working on a weather normalization model (weather model) to use
SECTION 4 – WATER USE
4‐8 CH2M HILL ENGINEERS, INC
and share with DWR. Once complete, the District will run its water usage figures through the weather model and at that point, the District can determine the full impacts of weather patterns on District‐wide water use.
4.6.1 Potential Impacts While uncertainties remain regarding the exact timing, magnitude, and regional impacts of these temperature and precipitation changes, researchers have identified several areas of concern for California water planners. These include:
■ Reduction in Sierra Nevada snowpack;
■ Increased intensity and frequency of extreme weather events; and
■ Rising sea levels resulting in increased risk of damage from storms, high‐tide events, and the erosion of levees.
Other important issues of concern due to global climate change include:
■ Effects on local supplies such as groundwater;
■ Changes in urban and agricultural demand levels and patterns;
■ Impacts to human health from waterborne pathogens and water quality degradation;
■ Declines in ecosystem health and function; and
■ Alterations to power generation and pumping regimes.
Typically, water supplies that are dependent on natural hydrology are vulnerable to climate change, especially if the water source originates from mountain snow pack. The most vulnerable water sources subject to climate change impacts are the District’s imported water supplies from the Water Authority.
4.6.2 Water Authority Adaption and Mitigation The Water Authority is an active and founding member of the Water Utility Climate Alliance (WUCA). WUCA consists of ten of the nation’s largest water providers collaborating on climate change adaptation and greenhouse gas (GHG) mitigation issues. As part of this effort, WUCA pursues a variety of activities on multiple fronts. WUCA monitors development of climate change‐related research, technology, programs, and federal legislation. Activities to date include such things as:
■ Letter of support for the California Nevada Applications Program (CNAP) branch of the Regional Integrated Science and Assessments (RISA) team under the National Oceanic and Atmospheric Administration (NOAA)
■ Provided comments on U.S. Global Change Research Program, National Global Change Research Plan
■ Regular communication and consultations with federal agencies on the U.S. Environmental Protection Agency’s Climate Ready Water Utility Working Group
■ Participation in the International Water and Climate Forum, December 2015
The Water Authority has made great strides in implementing GHG mitigation programs and policies for its facilities and operations. To date, these programs and policies have focused on the following:
■ Pursuing water supply/energy relationships and opportunities to increase efficiencies to lower GHG emissions; including the 40‐megawatt Lake Hodges Pumped Storage project in operation and a potential 500‐megawatt San Vicente Pumped Storage project

SECTION 4 – WATER USE
CH2M HILL ENGINEERS, INC 4‐9
■ Participating in the Climate Registry; the Water Authority developed its initial baseline GHG inventory from calendar year 2009 and refined its inventory calculation in an update conducted in 2014.
■ Reducing the number of vehicles in the fleet and replacing vehicles with hybrids when possible
■ Generating solar power at three Water Authority sites, including the Twin Oaks Valley WTP, the Escondido Operations Center, and the San Diego Headquarters; cumulatively generating an estimated 2.9 million kilowatt‐hours each year
SECTION 5
CH2M HILL ENGINEERS, INC 5‐1
SB X7‐7 Baselines and Targets The state Legislature passed Senate Bill 7 as part of the Seventh Extraordinary Session, referred to as SBX7‐7, on November 10, 2009, which became effective February 3, 2010. This law was the water conservation component to the Delta legislation package, and seeks to achieve a 20 percent statewide reduction in urban per capita water use in California by December 31, 2020. The law requires each urban retail water supplier to develop urban water use targets to help meet the 20 percent goal by 2020, and an interim water reduction target by 2015.
For the 2015 UWMP, the District is required to adjust the baseline and target per capita water use, and compare 2015 per capita water use with set targets. Detailed calculations in compliance with DWR requirements are provided in Appendix D. Water use is typically discussed based on per capita use and is presented in gallons per capita daily (gpcd)
The 2010 UWMP described how the District calculated its baseline and targets, following the technical methods and methodologies described in DWR’s Methodologies for Calculating Baseline and Compliance Urban Per Capita Water Use For the Consistent Implementation of the Water Conservation Bill of 2009. Background information and the approach used to develop baselines and targets were also to be included. A description of each of these elements follows:
■ Baseline daily per capita water use — how much water is used within an urban water supplier’s distribution system area on a per capita basis. It is determined using water use and population estimates from a defined range of years.
■ Urban water use target — how much water is planned to be delivered in 2020 to each resident within an urban water supplier’s distribution system area, taking into account water conservation practices that currently are and plan to be implemented.
■ Interim urban water use target — the planned daily per capita water use in 2015, a value halfway between the baseline daily per capita water use and the urban water use target.
5.1 Baselines and Targets In the 2010 UWMP, the District was required to develop a baseline per capita water use. Per DWR requirements, the District estimated a 10‐year (1999 to 2008) and a 5‐year (2004 to 2008) baseline per capita water use.
Table 5‐1 presents the adjusted baseline per capita water using the adjusted 2010 Census population data. The District targets are based on Method 1. Since the District’s recycled water use is greater than 10 percent of 2008 retail water delivery, a 10 to 15‐year baseline period that ends no earlier than December 31, 2004 was used. A 10‐year period from 1999 to 2008 provided a baseline of 191 gallons per capita per day (gpcd) and a 2020 target of 153 gpcd as shown in Table 5‐1. No adjustment was required since the 10‐year baseline target is less than 95 percent of the 5‐year baseline.
For reference purposes, the 2010 UWMP presented the 10‐year and 5‐year baseline per capita water use as 190 gpcd and 191 gpcd, respectively.

SECTION 5 – SB X7‐7 BASELINES AND TARGETS
5‐2 CH2M HILL ENGINEERS, INC
Table 5‐1 Baselines and Targets Summary
Baseline Period
Start Year End Year Average GPCD
2015 Interim Target
Confirmed 2020 Target
10 year 1999 2008 191 174 153
5 Year 2004 2008 192 ‐‐ ‐‐
Notes:
The District’s recent per capita water use has been declining to the point where current water use already meets the 2020 target for Method 1. In 2015, water use within the District was 124 gpcd. This recent decline in per capita water use is largely due to water use restrictions, increased water costs, and poor economic conditions. However, the District’s effective water use awareness campaign and enhanced conservation mentality of its customers will likely result in some long‐term carryover of these reduced consumption rates beyond the current drought period. Table 5‐2 shows the District’s compliance with the 2015 interim target.
Table 5‐2: 2015 Compliance
2015 Actual GPCD
2015 Interim Target GPCD
Did Supplier Achieve Targeted Reduction
for 2015
124 172 Yes
Notes:
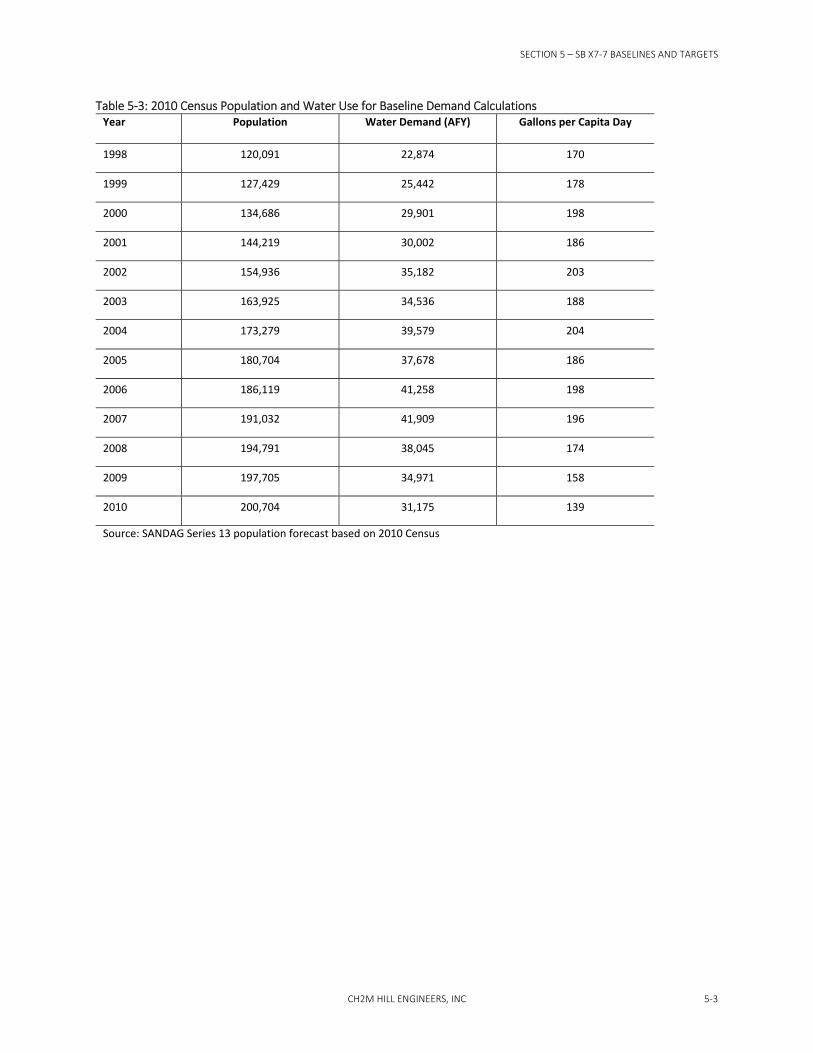
The baseline per capita water use estimates in the 2010 UWMP were based on preliminary 2010 Census population data. For the 2015 UWMP, DWR requires that the baseline estimates be recalculated with the formal 2010 Census population data. SANDAG Series 13 forecast data incorporates the final 2010 Census data into its analysis. DWR approved the use of Series 13 population data for the 2015 UWMP calculations, finding that their population estimates and projections were thorough and addressed the requirements of the Water Code. Population and water use data used to recalculate the baseline are shown in Table 5‐3. Additional SBX7‐7 calculation tables are included as Appendix D, including the SANDAG population estimates and the persons per connection calculations from DWR’s Population tool as a reference.
SECTION 5 – SB X7‐7 BASELINES AND TARGETS
CH2M HILL ENGINEERS, INC 5‐3
Table 5‐3: 2010 Census Population and Water Use for Baseline Demand Calculations Year Population Water Demand (AFY) Gallons per Capita Day
1998 120,091 22,874 170
1999 127,429 25,442 178
2000 134,686 29,901 198
2001 144,219 30,002 186
2002 154,936 35,182 203
2003 163,925 34,536 188
2004 173,279 39,579 204
2005 180,704 37,678 186
2006 186,119 41,258 198
2007 191,032 41,909 196
2008 194,791 38,045 174
2009 197,705 34,971 158
2010 200,704 31,175 139
Source: SANDAG Series 13 population forecast based on 2010 Census
SECTION 6
CH2M HILL ENGINEERS, INC 6‐1
Service Area Supplies
6.1 Water Resources This section discusses the water sources available to the District.
6.1.1 Potable Water The District currently meets all its potable demands with imported treated water from the Water Authority. The Water Authority, as a wholesale agency, imports both raw water and treated water for delivery to its member agencies in San Diego County. The Water Authority’s current and future supply portfolio is discussed in more detail in its draft 2015 UWMP.
Existing potable water supply sources available to the District include purchases from the Water Authority, and back‐up purchases from the City of San Diego’s Otay WTP on an as‐needed and as‐available basis. The supplies are further described below.
6.1.2 San Diego County Water Authority The District receives potable water from the Water Authority via Pipeline Number 4 (Pipeline No. 4) of the Second San Diego Aqueduct (Second Aqueduct), and from the 36‐inch Jamacha Pipeline. The latter pipeline was placed in to operation in 2010, replacing the former La Mesa‐Sweetwater Extension (LMSE) supply pipeline. Both of these conveyance facilities are owned and operated by the Water Authority.
Pipeline No. 4 delivers potable water treated at one of three facilities: the Metropolitan Skinner WTP located in Riverside County, the Water Authority’s Twin Oaks Valley WTP in San Marcos, and the Water Authority’s Carlsbad Seawater Desalination Facility. The Jamacha Pipeline delivers water treated at the Helix WD’s Levy Filtration Plant.
The Water Authority does not have contractual agreements with its member agencies to guarantee flow rates or hydraulic gradients at its various flow control facility connections. Generally, if the Water Authority cannot obtain sufficient treated and/or raw water, or has delivery limitations for the water requests of its 24 member agencies, the Water Authority will attempt to allocate the water delivery shortfall to its member agencies on a proportional basis.
6.1.3 City of San Diego Through a 1999 agreement with the City of San Diego, the District may obtain up to 10 million gallons per day (mgd) of supply from the City’s Otay WTP. The Otay WTP was originally constructed in 1940, and has a current rated capacity of 34.4 mgd. The City of San Diego’s typical demand for treated water from the Otay WTP is less than 20 mgd. Under the terms of the agreement, the City’s obligation to supply treated water to the District is contingent upon it having surplus capacity available, beyond what the City needs for its own area system.
The agreement also provides the District with the option of funding an expansion of the Otay WTP in return for additional capacity rights. Although in the past the City has planned for expansion of the plant to a capacity of 60 mgd, the City currently has no committed plans or budget for expansion of the plant.
The District does not currently have permanent facilities in place to take delivery of water from the Otay WTP; instead a temporary “Lower Otay Pump Station (PS)” conveys flows to an Otay WD Interconnect. The District has completed the design of a permanent Lower Otay PS (LOPS), but has deferred construction of the facility.
SECTION 6 – SERVICE AREA SUPPLIES
6‐2 CH2M HILL ENGINEERS, INC
The District considers the supply of water from the Otay WTP to be an alternative source for use in the South District area system when the Water Authority Pipeline No. 4 is out of service.
The agreement with the City of San Diego for potable water from the Otay WTP is included in Appendix E.
6.1.4 Emergency Supplies The District has established a goal to sustain a 10‐day outage of supply from the Water Authority Pipeline No. 4 at any time of the year without a reduction in service level. The District seeks to obtain this level of supply reliability through the development of alternative water supplies, through agreements with neighboring water districts, and through treated water storage.
For emergency events longer than the 10‐day aqueduct shutdowns noted previously, the District will utilize emergency supplies developed by the Water Authority’s Emergency Storage Project (ESP). The ESP is designed to provide treated water service to all Water Authority member agencies during a two‐month interruption in service of imported water deliveries into San Diego County. The ESP is sized to deliver up to 75 percent of each agency’s peak two‐month summer demand. The key facilities of the ESP include the Olivenhain Dam and Conveyance System, the Lake Hodges Interconnect, the San Vicente‐Miramar Pipeline, and the expansion of San Vicente Reservoir.
6.2 Groundwater The District currently does not obtain any of it supply from groundwater. The District has studied possible local groundwater development projects, but none to date have advanced to development.
Both the geology and the semi‐arid hydrologic conditions of the region limit groundwater supplies within the service area. Narrow river valleys with shallow alluvial deposits are characteristic of some of the more productive groundwater basins. Additionally, irrigation with imported water and over‐pumping has led to excessive salinity in many of the most promising basins. Outside of these alluvial basins, much of the geology consists of fractured crystalline bedrock and fine‐grained sedimentary deposits that are generally capable of yielding only small amounts of groundwater to domestic wells.
The District is continuing to investigate local groundwater opportunities as a means of reducing its dependence on imported water. Possible concept‐level future groundwater projects are discussed in more detail in Section 6.8 (Future Water Supplies).
Table 6‐1: Groundwater Volume Pumped
X None
6.3 Surface Water The District does not have any local surface supplies of its own.
6.4 Stormwater The District does not currently utilize stormwater to augment its water supply.
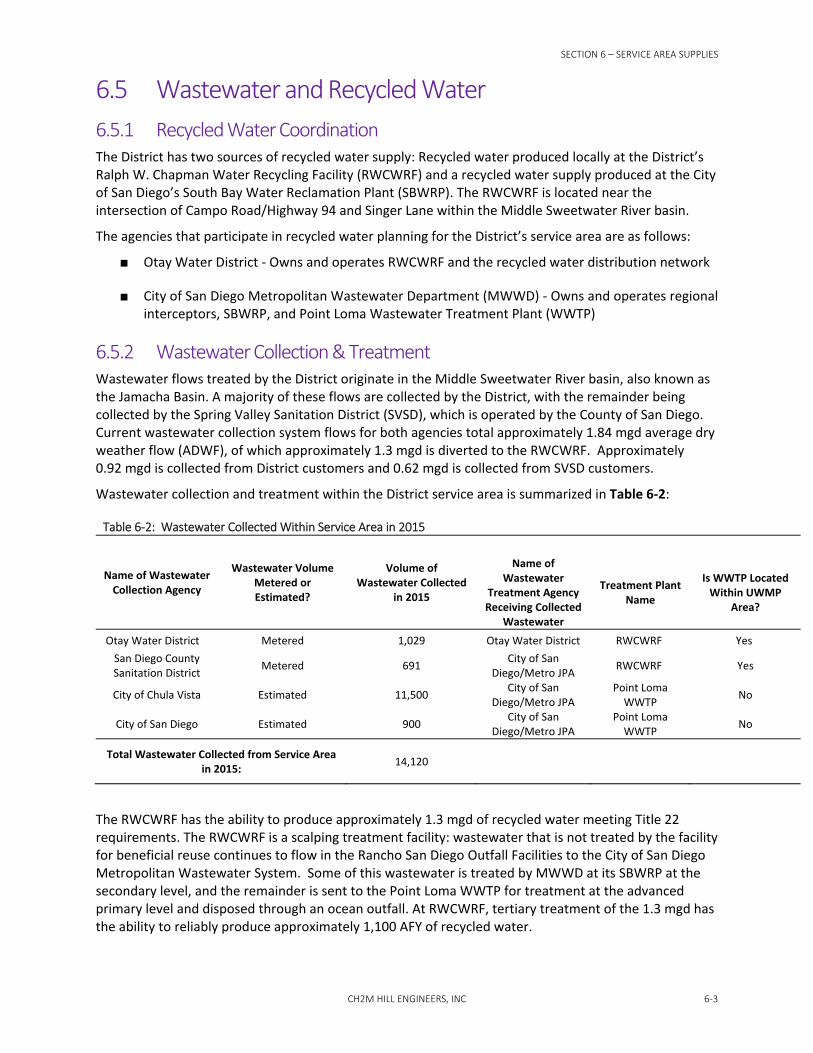
SECTION 6 – SERVICE AREA SUPPLIES
CH2M HILL ENGINEERS, INC 6‐3
6.5 Wastewater and Recycled Water
6.5.1 Recycled Water Coordination The District has two sources of recycled water supply: Recycled water produced locally at the District’s Ralph W. Chapman Water Recycling Facility (RWCWRF) and a recycled water supply produced at the City of San Diego’s South Bay Water Reclamation Plant (SBWRP). The RWCWRF is located near the intersection of Campo Road/Highway 94 and Singer Lane within the Middle Sweetwater River basin.
The agencies that participate in recycled water planning for the District’s service area are as follows:
■ Otay Water District ‐ Owns and operates RWCWRF and the recycled water distribution network
■ City of San Diego Metropolitan Wastewater Department (MWWD) ‐ Owns and operates regional interceptors, SBWRP, and Point Loma Wastewater Treatment Plant (WWTP)
6.5.2 Wastewater Collection & Treatment Wastewater flows treated by the District originate in the Middle Sweetwater River basin, also known as the Jamacha Basin. A majority of these flows are collected by the District, with the remainder being collected by the Spring Valley Sanitation District (SVSD), which is operated by the County of San Diego. Current wastewater collection system flows for both agencies total approximately 1.84 mgd average dry weather flow (ADWF), of which approximately 1.3 mgd is diverted to the RWCWRF. Approximately 0.92 mgd is collected from District customers and 0.62 mgd is collected from SVSD customers.
Wastewater collection and treatment within the District service area is summarized in Table 6‐2:
Table 6‐2: Wastewater Collected Within Service Area in 2015
Name of Wastewater Collection Agency
Wastewater Volume Metered or Estimated?
Volume of Wastewater Collected
in 2015
Name of Wastewater
Treatment Agency Receiving Collected
Wastewater
Treatment Plant Name
Is WWTP Located Within UWMP
Area?
Otay Water District Metered 1,029 Otay Water District RWCWRF Yes
San Diego County Sanitation District
Metered 691 City of San
Diego/Metro JPA RWCWRF Yes
City of Chula Vista Estimated 11,500 City of San
Diego/Metro JPA Point Loma WWTP
No
City of San Diego Estimated 900 City of San
Diego/Metro JPA Point Loma WWTP
No
Total Wastewater Collected from Service Area in 2015:
14,120
The RWCWRF has the ability to produce approximately 1.3 mgd of recycled water meeting Title 22 requirements. The RWCWRF is a scalping treatment facility: wastewater that is not treated by the facility for beneficial reuse continues to flow in the Rancho San Diego Outfall Facilities to the City of San Diego Metropolitan Wastewater System. Some of this wastewater is treated by MWWD at its SBWRP at the secondary level, and the remainder is sent to the Point Loma WWTP for treatment at the advanced primary level and disposed through an ocean outfall. At RWCWRF, tertiary treatment of the 1.3 mgd has the ability to reliably produce approximately 1,100 AFY of recycled water.

SECTION 6 – SERVICE AREA SUPPLIES
6‐4 CH2M HILL ENGINEERS, INC
The RWCWRF provides tertiary treatment that meets the State of California’s Title 22 requirements for reuse. Effluent from the plant is pumped to lined and covered reservoirs in the District’s property located north of Proctor Valley Road adjacent to the Rolling Hills Ranch Development project.
The estimated annual treated flow is shown in Table 6‐3.
Table 6‐3 Wastewater Treatment and Discharge within Service Area in 2015
Wastewater Treatment Plant
Treatment Level Volume Treated Volume Discharged Volume Recycled Water Served
RWCWRF Tertiary 1,167 138 1,029
Table Notes
6.5.3 Recycled Water System The District operates and maintains over 93 miles of recycled water transmission and distribution pipelines, pump stations and reservoirs, making it one of the largest recycled water systems in San Diego County. The District’s mandatory reuse ordinance, land development conditions, and public outreach has resulted in a stakeholder acceptance of recycled water as a viable local water supply for irrigation, especially during these recent drought conditions. The District continues to successfully serve recycled water to customers within its central service area, south of the Sweetwater Reservoir and west of the Otay Lakes Reservoirs. The majority of the area represents the Otay Ranch GPD area within the City of Chula Vista.
In order to serve the District’s existing demand for recycled water, the District entered into an agreement to purchase recycled water from the City of San Diego’s SBWRP. The SBWRP has a rated capacity of 15 mgd and is located at Monument and Dairy Mart Roads near the international border, adjacent to the Tijuana River. The SBWRP receives wastewater flow from the Grove Avenue Pump Station that scalps flow from the existing interceptor system that conveys flow northward to the Point Loma Treatment Plant for treatment and ocean outfall disposal. The existing interceptor system flows are thereby reduced, freeing up additional capacity for future growth in the South Bay region. The SBWRP in essence is a scalping plant and is designed for a relatively constant flow rate depending upon recycled water demands and interceptor capacity limitations.
The agreement between the District and the City of San Diego for purchase of recycled water from the SBWRP was finalized on October 20, 2003. In accordance with the agreement, the City of San Diego will provide an annual amount of at least 6 mgd of recycled water to District. The term of the agreement is 20 years from January 1, 2007. The agreement with the City of San Diego for water from the SBWRP is included in Appendix F. The City of San Diego has agreed to meet all applicable federal, state and local health and water quality requirements for recycled water produced at the SBWRP to the point of delivery. The point of delivery is located at the intersection of Dairy Mart Road and Camino de la Plaza. As part of the agreement, the District has constructed a 30‐inch transmission main to deliver the recycled water from the point of delivery to the District. The City of San Diego has retained 1 mgd of capacity in this transmission pipeline that runs through the City of San Diego’s system.
6.5.4 Recycled Water Beneficial Uses The District’s service area is still experiencing growth and development in the geographic area where recycled water is approved for use. Expansion of the District’s recycled water system is critical to reducing demands on imported water. The area with the greatest potential for expansion is the existing Central service area. The District anticipates maximizing the use of recycled water by continuing to require new developments within the District to use recycled water, wherever feasible.

SECTION 6 – SERVICE AREA SUPPLIES
CH2M HILL ENGINEERS, INC 6‐5
The District’s 2015 Master Plan Update included an assessment of current and future demand for recycled water based on approved Subarea Master Plans or water studies. For areas without development plans, the projected water demand for the District at ultimate development was determined by applying irrigated area percentages and recycled water irrigation duty factors. Most of the currently identified uses are for outdoor irrigation.
The District currently serves recycled water to approximately 700 customers. In 2015, approximately 4,225 AF of recycled water was supplied to recycled water users. Current uses consist primarily of commercial landscape irrigation, golf course irrigation, and irrigation of public places like parks, streetscapes, schools, highway medians, and open space areas. The Olympic Training Center facility in Chula Vista also uses recycled water to irrigate practice fields and landscape common areas.
The District’s 2015 recycled water use and future projections are presented in Table 6‐4.
Table 6‐4. Current and Projected Recycled Water Use within Service Area
Beneficial Use Type 2015 2020 2025 2030 2035 2040
Landscape irrigation (excluding golf courses) 4,070 5,385 5,600 5,685 5,870 6,155
Golf course irrigation 270 285 300 315 330 345
Total 4,340 5,670 5,900 6,000 6,200 6,500
Notes
Recycled water use in FY2015 compared to the projections presented in the 2010 UWMP is shown in Table 6‐5.
Table 6‐5. 2010 UWMP Recycled Water Use Projection Compared to 2015 Actual
Use Type 2010 Projection for 2015
2015 Actual Use
Irrigation 4,400 4,340
6.5.5 Proposed Actions to Encourage Use of Recycled Water The District made the commitment and commenced its wastewater recycling efforts over 15 years ago. A major component of the commitment to recycle was to enact an ordinance that requires recycled water be used for any and all appropriate and approved non‐potable uses. The requirement continues today, with all new applications for water service being reviewed for opportunities to use recycled water. The District’s Code of Ordinance Section 26 (Appendix G) details the requirements for the use of recycled water whenever feasible.
Table 6‐6 Retail: Methods to Expand Future Recycled Water Use
Name of Action Planned Implementation
Year Expected Increase in Recycled Water Use
Park and greenbelt irrigation
2020‐2040 400
Multi‐family common area landscape and streetscape irrigation
2020‐2040 400
Total 800
SECTION 6 – SERVICE AREA SUPPLIES
6‐6 CH2M HILL ENGINEERS, INC
6.6 Desalinated Water Opportunities A portion of the District’s existing potable supply from the Water Authority originates at the Water Authority’s Carlsbad Seawater Desalination Facility. During winter periods, supply from the facility may constitute more than 50 percent of the District’s supply.
In addition, the District is also evaluating an option to enter into a water purchase agreement for supply from a proposed seawater desalination facility in Rosarito, Mexico, as described further below.
6.6.1 Water Purchase Agreement ‐‐ Rosarito Desalination Plant The District is currently investigating the feasibility of purchasing water from a seawater desalination plant that is planned to be located in Rosarito Beach, Baja California, Mexico. The District’s CIP (P2451) is known as the Otay Mesa Conveyance and Disinfection System Project (OMCDSP).
The treatment facility will be designed, constructed, and operated in Mexico through a public‐private partnership agreement between the state of Baja, California and a private company. The District would purchase the desalinated water under the terms of a water purchase agreement. The plant and conveyance system are primarily intended to supply the Tijuana regional area and if an agreement can be negotiated, the conveyance would be extended to the International Border to serve the District. The current plan is to build a 100 mgd plant. Based upon the most recent demand forecasts in this master plan, the District would purchase up to an average of approximately 20 mgd ultimately.
The District has completed a draft of the preliminary design report for the pipeline from the Border to Roll Reservoir. The need for a pump station has not yet been determined and the disinfection requirements have not been finalized and therefore the preliminary design for these facilities has not been started. The District is preparing a combined Environmental Impact Report (EIR)/ Environmental Impact Statement (EIS) with the Department of State serving as the lead federal agency. A first draft of the EIR/EIS is expected in May 2016. The cost of the OMCDSP facilities in the United States is estimated at $30 million.
The project remains subject to various uncertainties, and is not sufficiently advanced in its planning for the District to characterize the project as a verifiable future supply. Nevertheless the District intends to continue project planning efforts with the goal of making this supply a reality at a future date.
6.7 Exchanges or Transfers At the wholesale level, the Water Authority has engaged in a transfer with the Imperial Irrigation District (IID), and a portion of the District’s supply from the Water Authority derives from this transfer arrangement. Under this agreement, water conserved by IID will be transported by Metropolitan through the Colorado River Aqueduct and delivered to the Water Authority. Further information about this agreement can be found in the Water Authority’s 2015 UWMP.
At the retail level, the District does not have any transfer or exchange supplies of its own; however, the District is evaluating an option to transfer stored water from the Cadiz Valley aquifer project, as described further below.
6.7.1 Cadiz Valley Water Conservation, Recovery, and Storage Project The Cadiz Valley Water Conservation, Recovery and Storage Project is a two part project wherein Cadiz Inc. would construct a wellfield on the Cadiz Valley property in the Mojave Desert. Recovered groundwater would be conveyed to participating water providers from the wellfield via a 43 mile pipeline to the Colorado River Aqueduct. Participating water providers will also have the ability to

SECTION 6 – SERVICE AREA SUPPLIES
CH2M HILL ENGINEERS, INC 6‐7
decrease or forego their water delivery in certain years, such as wet years, and carry it over to future years when it may be needed. This carry‐over water would be stored in the aquifer system at Cadiz Valley. Ultimately, Cadiz Inc. projects 50,000 AFY to be made available for purchase. At this time, the District conceptually anticipates purchasing 5,000 AFY.
6.8 Future Water Supplies In 2015, the District started the update of their Integrated Water Resources Plan (IRP) which examines potential, future supply options and its performance with regard to long‐term, comprehensive water resource objectives. The 2015 IRP provides a comprehensive and defensible implementation strategy to meet the District’s water supply objectives, while allowing flexibility in adapting to anticipated changes in the water industry, market and regulatory conditions. The IRP proposes a phased implementation of projects from now to 2030 to meet growing future water demands, while making adjustments as necessary to respond to changing technology, supply levels, regulations, market conditions, costs, and partnership opportunities.
The overall implementation strategy developed in the IRP is intended to assist the District in addressing uncertainties surrounding future water supply by reducing dependence on imported sources. The IRP concludes that implementation of the plan will support the District in attaining its multiple objectives of achieving reliability, maintaining affordability, increasing flexibility, increasing diversity, and addressing environmental and institutional constraints.
The IRP identified six (6) supply options, including water conservation, groundwater development, additional imported water alternatives, ocean desalination, recycled water, and the expansion of treatment agreements with local agencies. Within these six (6) source categories, the IRP assessed 13 individual water supply project options in terms of costs and non‐monetary factors. The District selected these options for an implementation path or roadmap to keep the District on track in accomplishing long‐term goals, while strategically making investments only if and when necessary.
In evaluating the availability of sufficient water supply, new development project proponents who anticipate a water demand that exceeds what was planned for that area are required to acquire a water supply source and/or participate in the development of alternative water supply projects to offset the anticipated additional demand. These new water supply projects are in response to the regional water supply issues related to the Sacramento‐San Joaquin Delta and the current ongoing western states drought conditions. They are in various states of the planning process and are intended to increase water supplies to serve new development project water supply needs. It is anticipated that future Water Management Plans prepared by the District, the Water Authority, and Metropolitan will include any increases in water demand associated with adopted changes in land use, as well as any new local water supply resources, and will provide the planning tools necessary to ensure a water supply plan to meet the needs of future planned development. However, until those plans are adopted, it is necessary to address the current regional water supply shortage by offsetting projected increases in water demands with local water supply offset projects. The following future water supply projects summarized in Table 6‐7 have been proposed and the current status of each is described in the paragraphs below.

SECTION 6 – SERVICE AREA SUPPLIES
6‐8 CH2M HILL ENGINEERS, INC
Table 6‐7: Expected Future Water Supply Projects or Programs
Name of Future Projects or Programs
Description Status Planned
Implementation Year
Expected Increase in Water Supply to
Agency
Rosarito Desalination Plant Seawater Desalination Planned 2025 15,100
Rancho del Rey GW Well Brackish Groundwater Planned 2030 500
Middle Sweetwater River Basin GW Well
Groundwater Recovery Conceptual 2030 1,000
Otay Mesa Lot 7 GW Well Groundwater Recovery Conceptual 2030 400
North District Recycled System
Tertiary Conceptual 2030 800
NOTES:
6.8.1 Rancho del Rey Groundwater Well
In 1991, the McMillin Development Company drilled the Rancho del Rey Groundwater Well to augment grading water supplies for its Rancho del Rey development projects. Although the well was considered a “good producer,” little was known regarding its water quality and sustainable yield because the water was used solely for earthwork (i.e. dust control and soil compaction). The well was drilled to 865 feet, with a finished depth of 830 feet and produced approximately 400 AFY of low quality water for four years until its use was discontinued in April 1995 when the well was no longer needed. McMillin notified the District of its intent to sell off the groundwater well asset.
In 1997, the District purchased an existing 7‐inch well and the surrounding property on Rancho del Rey Parkway from the McMillin Company with the intent to develop it as a source of potable water. Treatment was required to remove salts and boron, among other constituents, using reverse osmosis membranes and ion exchange.
In 2000, having received proposals for the design and construction of a reverse osmosis treatment facility that far exceeded the allocated budget, the Board of Directors instructed staff to suspend the project until such time as it became economically viable.
In January 2010, citing the rising cost of imported water and the District's interest in securing its own water source for long‐term supply reliability, the Board authorized Phase 1 for drilling and development of the Rancho del Rey Well.
In September 2010, a new 12‐inch production well was drilled to 900 feet through the groundwater formation and into fractured bedrock. Testing showed the long‐term yield of the new well to be 450 gallons per minute (gpm), higher than previous studies had estimated. Separation Processes, Inc., a highly qualified membrane treatment firm, was hired to conduct a detailed economic feasibility study to confirm that the annualized unit cost of the new water source was economically competitive with other sources. The economic study estimated the unit cost of water to be $1,510 per AF for an alternative that utilizes a seawater membrane for treating both salts and boron. When compared with the current imported treated water rate from the Water Authority, and with the knowledge that this rate will
SECTION 6 – SERVICE AREA SUPPLIES
CH2M HILL ENGINEERS, INC 6‐9
continually increase as Metropolitan and the Water Authority raise its rates, the Rancho del Rey Well project appears to be economically viable.
The District is continuing to pursue the Rancho del Rey groundwater well opportunity with due consideration of the recommendations of the existing reports and plans to develop a groundwater well production facility to extract approximately 500 AFY. For water planning purposes, production of groundwater from the Rancho del Rey well is considered “additional planned” for local supplies. The District contracted for the design of the wellhead treatment facilities and has prepared the project environmental analysis. At the present time, the project is on hold until the economics are more favorable.
6.8.1.1 San Diego Groundwater Basin Description
The Rancho Del Rey well is located within the Lower Sweetwater Hydrologic Area (HA 909.10), and develops supply from what is believed to be the eastern edge of the San Diego Formation. The San Diego Formation is comprised of thick semi‐consolidated and unconsolidated older sediments that underlie a large portion of San Diego, National City, and Chula Vista. The Formation extends to depths of 1000 feet or more, and is characterized by complex geology with extreme vertical and horizontal non‐uniformity. The San Diego Formation extends eastward to the Rose Canyon and La Naçion faults, but the western, northern, and southern boundaries of the aquifer are less well documented.
Little is known about the recharge sources of the San Diego Formation, and overdraft and seawater intrusion implications are yet to be assessed. In 2001, the U.S. Geological Survey, City of San Diego, the District, Sweetwater Authority, and San Diego County Water Authority engaged in a long‐term, multi‐phase study of the San Diego Formation aimed at: (1) achieving better understanding of the San Diego Formation hydrogeology; and, (2) assessing the potential for additional groundwater extraction and recharge.
Both the Sweetwater Hydrologic Area and the San Diego Formation are unadjudicated and neither has an adopted groundwater management plan. Sweetwater Authority in 2001, however, adopted an interim groundwater management plan for the San Diego Formation that limits groundwater production to prevent seawater intrusion and land subsidence.
6.8.2 Middle Sweetwater River Basin Groundwater Well Project
The Middle Sweetwater River Basin Groundwater Well is an additional water supply project that was thoroughly studied and documented in the 1990s. The Middle Sweetwater River Basin is located within the Sweetwater River watershed and that reach of the river extends from Sweetwater Reservoir to the upstream Loveland Reservoir. The next step in development of the Middle Sweetwater River Basin Groundwater Well is the implementation of a pilot well project. The ultimate objective of the District is to develop a groundwater well production system within the Middle Sweetwater River Basin capable of producing a sustainable yield of potable water as a local supply.
The purpose of the Middle Sweetwater River Basin Groundwater Well Pilot project is to identify the feasibility of developing a groundwater resource production system and then determine and assess any limitations or constraints that may arise. The Middle Sweetwater River Basin Groundwater Well Pilot Project will accomplish six primary goals:
■ Update project setting
■ Update applicable project alternatives analysis
■ Prepare groundwater well pilot project implementation plan
■ Construct and test pilot monitoring and extraction wells
SECTION 6 – SERVICE AREA SUPPLIES
6‐10 CH2M HILL ENGINEERS, INC
■ Provide recommendations regarding costs and feasibility to develop a groundwater well production system within the Middle Sweetwater River Basin capable of producing a sustainable yield of potable water
■ Prepare groundwater well production project implementation plan and scope of work
The groundwater conjunctive use concept is described as the extraction of the quantity of water from the groundwater basin that was placed there by customers of the District, Helix WD, and Padre Dam Municipal Water District by means of its use of imported treated water that contributed to the overall volume of groundwater within the basin. An estimated quantity was developed to be approximately 12.5 percent of the total consumption of the District customers within that basin, as measured by water meters. In the 1994‐1995 period, the quantity of water that was returned to the groundwater basin by District customers was estimated to be 810 AFY. Currently, that 12.5 percent quantity could be on the order of 1,000 AFY. A scope of work addresses this concept while further development of the groundwater basin as an additional supply resource is appropriately considered. If it is deemed that a Middle Sweetwater River Basin Groundwater Well Production Project is viable then the consultant will develop and provide a groundwater well production project implementation plan, cost estimate, and related scope of work.
Further development of the groundwater basin to enhance the total groundwater production could be accomplished by the District by means of additional extraction of water from the basin that is placed there by means of either injection and/or spreading basins using imported untreated water as the resource supply. The existing LMSE Pipeline, owned by the Water Authority, once converted to an untreated water delivery system, could be the conveyance system to transport untreated water for groundwater recharge in support of this conjunctive use concept. These two distinct water resource supply conjunctive use concepts will be addressed so they may coexist and to allow development in separate phases.
6.8.3 Otay Mesa Lot 7 Groundwater Well
In early 2001 the District was approached by a landowner representative about possible interest in purchasing an existing well or alternatively, acquiring groundwater supplied from the well located on Otay Mesa. The then‐landowner, National Enterprises, Inc., reportedly stated that the well could produce 3,200 AFY with little or no treatment required prior to introducing the water into the District potable water system or alternatively, the recycled water system. In March 2001 authorization to proceed with testing of the Otay Mesa Lot 7 Groundwater Well was obtained and the District proceeded with the investigation of this potential groundwater supply opportunity.
In May 2001 an investigation was conducted to assess the Otay Mesa Lot 7 Well. The scope of work included a geohydrologic evaluation of the well, analyses of the water quality samples, management and review of the well video log, and documentation of well pump testing. The primary findings, as documented in the “Otay Mesa Lot 7 Well Investigation” report, formed the basis of the following recommendations:
■ For the existing well to be used as a potable water supply resource, a sanitary seal must be installed in accordance with the California Department of Health guidelines.
■ Drawdown in the well must be limited to avoid the possibility of collapsing the casing.
■ Recovery from pumping drawdown is slow and extraction would need to be terminated for up to 2 days to allow for groundwater level recovery.
■ The well water would need to be treated and/or blended with potable water prior to introduction into the potable water distribution system.

SECTION 6 – SERVICE AREA SUPPLIES
CH2M HILL ENGINEERS, INC 6‐11
The existing Otay Mesa Lot 7 Well, based upon the above findings was determined not to be a reliable municipal supply of potable water and that better water quality and quantity could be discovered deeper or at an alternative location within the San Diego Formation.
The District may still continue to pursue the Otay Mesa groundwater well opportunity with due consideration of the recommendations of the existing report. Based on the recommendations of the investigation report, a groundwater well production facility at Otay Mesa Lot 7 could realistically extract approximately 400 AFY.
6.8.4 North District Recycled Water Concept Project
Under this project, the District would serve up to 1.3 mgd of recycled water demands in the North System via the RWCWRF. Effluent from the RWCWRF is currently pumped by the District to irrigate golf courses, parks, and open space in Eastern Chula Vista, which is in the Central Area System and at a higher elevation than the North System. This project would reduce the conveyance costs that are currently incurred in pumping recycled water from the RWCWRF to Eastern Chula Vista. Existing recycled water users in Chula Vista would have to be provided with an alternate supply.
Infrastructure required for this project includes conveyance to the North System as well as retrofits to the RWCWRF chlorine contact basin, effluent pump station, and data collection and logging systems, per the North District Recycled Water System Phase I Concept Study.
Inter‐agency coordination will be required for this project with the Regional Water Quality Control Board and Sweetwater Authority. Additionally, coordination with the City of Chula Vista would be required.
6.9 Summary of Existing and Planned Sources of Water The District’s total current and planned supplies are shown in Table 6‐8 and Table 6‐9. Actual 2015 supplies are based on Water Authority sales and recycled water sales. Projected supplies are based on growth projections (with near‐term annexations) in the District’s service area as forecasted by SANDAG Series 13.
Table 6‐8: Water Supplies — Actual 2015
Water Supply
2015
Actual Volume
Water Quality
Purchased or Imported Water 30,299 Drinking
Recycled Water 4,340 Recycled
Total 34,629
NOTES:

SECTION 6
CH2M HILL ENGINEERS, INC 6‐12
Table 6‐9: Water Supplies — Projected
Water Supply Additional Detail on
Water Supply
Projected Water Supply
2020 2025 2030 2035 2040
Reasonably Available Volume
Reasonably Available Volume
Reasonably Available Volume
Reasonably Available Volume
Reasonably Available Volume
Purchased or Imported Water 1
37,050 42,530 44,891 45,501 51,082
Recycled Water 1 5,670 5,900 6,000 6,200 6,500
Total Verifiable Water Supplies 2 42,720 48,430 50,891 51,701 57,582
City of San Diego Otay WTP 3
Backup potable supply 10,000 10,000 10,000 10,000 10,000
Total Verifiable and Available Water Supplies 52,720 58,430 60,891 61,701 67,582
Rosarito Desalination Plant
Planned 15,100 15,600 16,100 16,800
Rancho Del Rey GW Well
Planned 500 500 500
Middle Sweetwater River Basin GW Well
Conceptual 1,000 1,000 1,000
Otay Mesa Lot 7 GW Well
Conceptual 400 400 400
North District Recycled System
Conceptual 800 800 800
Total Planned and Conceptual Water Supplies 15,100 18,300 18,800 19,500
Total Water Supplies 52,720 73,530 79,191 80,501 87,082
NOTES:
1. Amounts for Purchased/Imported and Recycled are those the District anticipates using to meet projected demands. Additional supply capacity may exist.
2. Total supplies includes water savings from active and passive conservation efforts.
3. Otay WTP availability is a District estimate, subject to the terms of the District’s agreement with the City of San Diego.

SECTION 7
CH2M HILL ENGINEERS, INC 7‐1
Water Service Reliability
7.1 Reliability of Supply The Act states that every urban water supplier shall include, as part of its plan, an assessment of the reliability of its water supplies. The water supply and demand assessment must compare the total projected water use with the expected water supply over the next 25 years in 5‐year increments. This reliability assessment is required for normal, single dry‐year and multiple dry water years.
The District currently obtains 100 percent of its potable water supply as imported water from the Water Authority. Historically, the Water Authority has relied on imported water supplies purchased from Metropolitan to meet the needs of its member agencies. Metropolitan’s supplies come from two primary sources, the State Water Project (SWP) and the Colorado River. However, after experiencing severe shortages from Metropolitan during the 1987–1992 drought, the Water Authority began aggressively pursuing actions to diversify the region’s supply sources and has been able to do so through comprehensive supply and facility planning. The reliability of the District’s potable supply is dependent on these wholesale agencies. The District is committed to investing in alternative water sources, such as groundwater or desalination that would reduce its dependence on imported water.
Metropolitan’s 2015 UWMP includes a discussion of supply reliability. Metropolitan used a computer model to evaluate 70 years of historic hydrology and develop estimates of water surplus or shortage. The driest year on record was 1977, and the driest three‐year period was 1990‐92. The analysis determined that Metropolitan could maintain reliable supplies during normal or dry‐year conditions during the period 2015 through 2040, even through multiple dry year periods.
The Water Authority’s 2015 UWMP also includes a discussion of supply reliability. While, the Water Authority will continue to rely on Metropolitan to help meet water demands, additional planned resources by the Water Authority and its member agencies have also been identified. Additional planned projects can further reduce the region’s reliance on sources of supply from Metropolitan, such as the Bay‐Delta. The Water Authority prepared an assessment of its supply reliability during a normal year hydrology, a single dry year hydrology (2015 based on the present drought beginning in 2012), and multiple dry years scenarios (2013‐2015). Results from the Water Authority’s reliability assessment demonstrate that the region’s existing and projected water resource mix is drought‐resilient, with only minor shortages during multiple dry periods occurring 15 to 20 years in the future.
The District continues to work closely with the Water Authority and Metropolitan for future water supply planning. These wholesale agencies [Water Authority and Metropolitan] have determined that they will be able to meet its projected demands through 2040, which include potable water demands for the District. The District has concluded that these wholesale agencies will be able to provide water to meet the District’s projected demands. Based on the information provided by Metropolitan and the Water Authority, the water supply available to the District is considered to be reliable and drought‐resilient. Individual components of the supply, such as the Colorado River and State Water Project, may experience dry years or extended droughts; however, this is a natural hydrological occurrence in California. The diversified improvements put in place by Metropolitan and the Water Authority have led these agencies to state that they will be able to meet demands of their respective member agencies for the next 25 years. The Water Authority has provided the District documentation of this supply. The documentation is included in Appendix H.

SECTION 7 – WATER SERVICE RELIABILITY
7‐2 CH2M HILL ENGINEERS, INC
The District currently relies on the Water Authority for its potable supply and has worked with the Water Authority to prepare consistent demand projections for the District’s service area. To maintain consistency in planning efforts, the District has shown future supplies meeting future demands. If the District’s future demands are slightly more or less than currently projected, it is anticipated that the supply portfolio maintained by the Water Authority and Metropolitan will be flexible enough to continue to meet the District’s demands.
Recycled water demands are to be met with recycled water from the District’s RWCWRF and the City of San Diego’s SBWRP. During dry periods, many conservation measures are focused on reducing outdoor water use, which does not contribute to wastewater flow. In addition, because both of these recycled water facilities are scalping plants, the recycled water output is limited by the treatment capacity and not by the supply of raw wastewater. Therefore, the District’s recycled supply is not expected to be subject to reduction during dry periods.
Throughout this section, projected supplies are shown to match projected demands. This level of reliability is based on the documentation in the UWMPs prepared by Metropolitan and the Water Authority, as listed in Appendix H. These agencies have determined that they will be able to meet the District’s potable demands, during normal, single dry and multiple dry year conditions through 2040 with the exception of rare protracted dry year conditions, as noted in the Water Authority’s 2015 UWMP. As shown in Tables 9‐3 through 9‐6 of the Water Authority’s 2015 UWMP under multiple dry year conditions, these tables present potential water supply shortages of varying degrees over the 25‐year planning horizon. These shortages can be mitigated through extraordinary water conservation actions and if necessary, dry‐year transfers. Section 9.5 of the Water Authority’s 2015 UWMP describes its additional planned supply projects that could be utilized to meet potential water shortages during dry year scenarios. Because the Water Authority has determined that they will be able to meet the District’s potable demands, during normal, single dry and multiple dry year conditions through 2040, this 2015 UWMP assumes potable supplies will remain unchanged under all hydrologic conditions (except where noted in the following tables)
Water supply reliability based on an average water year is summarized in Table 7‐1. The Water Authority uses a computer model known as CWA‐MAIN to estimate water demands. CWA‐MAIN uses demographic and economic data, as well as weather data, to estimate water demands. Using CWA‐MAIN, the Water Authority estimated dry‐year demands for five‐year increments from 2020 through 2040. According to models used during preparation of the Water Authority’s 2015 UWMP, water demand is expected to increase in the dry years. In fact, dry year demand was, on average, 7.5 percent higher than the normal demands over the period of record used in the CWA‐MAIN model. Recycled water supply is also expected to increase in 5‐year increments as demand for recycled increases relative to increasing irrigation demand.

SECTION 7 – WATER SERVICE RELIABILITY
CH2M HILL ENGINEERS, INC 7‐3
Table 7‐1: Basis of Water Year Data
Year Type Base Year Available supplies if year type repeats (% of avg supply)
Average Year 1960‐2013 100%
Single‐Dry Year 2015 107%
Multiple‐Dry Years 1st Year 2013 108%
Multiple‐Dry Years 2nd Year 2014 114%
Multiple‐Dry Years 3rd Year 2015 121%
NOTES:
7.2 Projected Normal Year Supply and Demand The District’s potable water supply is expected to continue to be supplied by the Water Authority during normal year scenarios. As stated previously, the Water Authority has determined that it will be able to meet the District’s potable demands, during normal year conditions through 2040.
The projected supply and demand comparison under normal conditions is shown in Table 7‐2. The District has implemented water conservation measures and currently maintains a per capita demand of 118 gpcd. In order to meet its projected conservation targets, the District will continue to encourage water conservation and implement the measures outlined in its Water Shortage Response Program (District Code of Ordinance Section 39), which is included as Appendix I of this UWMP.
Table 7‐2: Normal Year Supply and Demand Comparison
2020 2025 2030 2035 2040
Supply totals 1 45,748 51,883 54,540 55,455 62,792
Demand totals 2 45,748 51,883 54,540 55,455 62,792
Difference 0 0 0 0 0
NOTES: 1 Water Authority UWMP analysis shows 100 percent supply reliability for these conditions so total supplies are set equal to District projected demands
2 District demand totals with additional conservation

SECTION 7 – WATER SERVICE RELIABILITY
7‐4 CH2M HILL ENGINEERS, INC
7.3 Projected Single Dry Year Supply and Demand Comparison
Changes in weather can lead to changes in water use. During dry years, water demands can be expected to increase. The Water Authority uses a computer model known as CWA‐MAIN to estimate water demands. CWA‐MAIN uses demographic and economic data, as well as weather data, to estimate water demands. Using CWA‐MAIN, the Water Authority estimated dry‐year demands for five‐year increments from 2015 through 2040. Notably, the District’s recycled water was assumed to be “drought‐resistant” and not subject to reduction during dry periods. The dry‐year demand analysis from the Water Authority reflects long‐term water use efficiency, but does not incorporate potential savings due to extraordinary conservation occurring during droughts. This approach allows for a more comprehensive shortage analysis and drought response planning.
The District’s potable water supply is expected to continue to be supplied by the Water Authority during single dry year scenarios. The Water Authority has determined that it will be able to meet the District’s potable demands, during single dry year conditions through 2040 with the exception of rare protracted dry year conditions, as noted in the Water Authority’s 2015 UWMP. The supplies available from Water Authority member agency projected recycling, potable reuse, and groundwater recovery projects are assumed to experience little, if any, reduction in a dry year. The Water Authority’s existing and planned conserved supplies from the IID transfer, canal lining projects, and Carlsbad Desalination Plant are also considered “drought‐resilient” supplies as discussed in the Water Authority’s 2015 UWMP. For this single dry‐year assessment, it was assumed that Metropolitan would have adequate supplies in storage and would not be allocating supplies to the Water Authority. With the previous years leading up to the single dry‐year being wet or average hydrologic conditions, Metropolitan should have adequate supplies in storage to cover potential shortfalls in core supplies and would not need to allocate supplies. Because the Water Authority has determined that it will be able to meet the District’s potable demands, during normal, single dry and multiple dry year conditions through 2040, this UWMP assumes potable supplies will be sufficient under this single year hydrologic condition and extend over the planning horizon. Recycled water supply is also expected to increase in 5‐year increments as demand for recycled water increases relative to increasing irrigation demand.
The projected single dry‐year supplies and demands are compared in Table 7‐3.
Table 7‐3: Single Dry Year Supply and Demand Comparison
2020 2025 2030 2035 2040
Supply totals 1 45,748 56,213 61,125 63,932 75,087
Demand totals 2 45,748 56,213 61,125 63,932 75,087
Difference 0 0 0 0 0
NOTES: 1 Water Authority UWMP analysis shows 100 percent supply reliability for these conditions so total supplies are set equal to District projected demands
2 District demand totals with additional conservation and proportional adjustment for dry year demands per Water Authority CWA‐MAIN model during period of record

SECTION 7 – WATER SERVICE RELIABILITY
CH2M HILL ENGINEERS, INC 7‐5
7.4 Projected Multiple Dry Year Supply and Demand Comparison
The Act requires water agencies to project demands and supplies during multiple dry years. Projections were prepared for five time frames: five‐year periods ending in 2020, 2025, 2030, 2035 and 2040. Changes in weather can lead to changes in water use. During dry years, water demands can be expected to increase. Using CWA‐MAIN, the Water Authority estimated dry‐year demands for five‐year increments from 2020 through 2040. According to models used during preparation of the Water Authority’s 2015 UWMP, water demand is expected to increase in the dry years. Notably, the District’s recycled water supply was assumed to be “drought‐resistant” and not subject to reduction during dry periods.
For the multi dry‐year reliability analysis, the conservative planning assumption is that Metropolitan will be allocating supplies to its member agencies, including the Water Authority. By assuming allocations in this reliability assessment, it allows the Water Authority to analyze how storage supplies could potentially be utilized and the likelihood of shortages. Currently, Metropolitan allocates supplies through its Water Supply Allocation Plan. Because it is uncertain in the future how Metropolitan will allocate supplies to its member agencies, the analysis in the tables assumes they are allocated based on preferential right to Metropolitan supplies. (Refer to the Water Authority’s 2015 UWMP Appendix G for a complete discussion). The Water Authority has invested in carryover storage supply capacity, which it can utilize in dry years to improve reliability of supply. In years where shortages may still occur, after utilization of carryover storage, additional regional shortage management measures, consistent with the Water Authority’s Water Shortage and Drought Response Plan, will be taken to fill the supply shortfall. These measures could include extraordinary conservation, achieved through voluntary or mandatory water‐use restrictions. The District will also implement additional water conservation measures, as determined in their Water Shortage Response Plan.
Because the Water Authority has determined that it will be able to meet the District’s potable demands, during multiple dry year conditions through 2040, this UWMP assumes potable supplies will increase under this multiple dry year hydrologic conditions and extend over the planning horizon. Recycled water supply is also expected to increase in as demand for recycled water increases relative to increasing irrigation demand. Recycled water will provide additional supply for irrigation purposes.
The estimated supply and demand for multiple dry years beginning after 2020 and extending over the planning horizon to 2035 are summarized in Table 7‐4.

SECTION 7 – WATER SERVICE RELIABILITY
7‐6 CH2M HILL ENGINEERS, INC
Table 7‐4: Multiple Dry Years Supply and Demand Comparison
2020 2025 2030 2035
First year
Supply totals 1 46,346 52,239 54,832 56,138
Demand totals 2 46,346 52,239 54,832 56,138
Surplus/(Shortage) 3 0 0 0 0
Second year
Supply totals 1 48,769 54,469 57,290 58,714
Demand totals 2 48,769 54,469 57,290 58,714
Surplus/(Shortage) 3 0 0 0 0
Third year
Supply totals 1 51,823 57,467 58,024 57,153
Demand totals 2 51,823 57,467 60,142 62,086
Surplus/(Shortage) 3 0 0 (2,118) (4,933)
NOTES: 1 Water Authority UWMP analysis shows 100 percent supply reliability for these conditions so total supplies are set equal to District projected demands
2 District demand totals with additional conservation and proportional adjustment for dry year demands per Water Authority CWA‐MAIN model during period of record
3 Third dry year supply shortages will be addressed through drought management actions.

SECTION 8
CH2M HILL ENGINEERS, INC 8‐1
Water Shortage Contingency Planning This section documents the District’s Water Shortage Contingency Planning (WSCP) efforts per requirements of Section 10632 of the Act. The purpose of the Water Shortage Response Plan (WSRP) is to provide a plan of action to be followed during the various stages of a water shortage. This section includes the following elements: action stages, prohibitions, penalties and consumption reduction methods, revenue impacts of reduced sales, draft water shortage contingency resolution/ordinance, actions to be implemented during a catastrophic interruption of water supplies, and estimate of minimum supply available.
Specific guidance provided in the following DWR documents were used as a resource in preparing this UWMP:
DWR Urban Drought Guidebook (2008 Edition) – This publication provides extensive guidance on water shortage contingency planning for urban water suppliers. http://www.water.ca.gov/pubs/planning/urban_drought_guidebook/urban_drought_guidebook_2008.pdf
DWR California Drought Contingency Plan (2010) http://www.water.ca.gov/waterconditions/docs/Final_CA_Drought_Contingency_Plan‐11‐18‐2010a.pdf
California’s Most Significant Droughts: Comparing Historical and Recent Conditions, DWR 2015 http://www.water.ca.gov/waterconditions/docs/California_Signficant_Droughts_2015_small.pdf
The District’s WSRP was last amended and approved by the Board of Directors via Ordinance 546 in August 2014. The approved WSRP was used to develop this section. The WSRP is included in Appendix I.
8.1 Stages of Action The Act requires documentation of actions to be undertaken during a water shortage. A water shortage occurs when water supplies available to the District are insufficient to meet water demands. Water supply shortages can occur for a variety of reasons including droughts, loss in ability to divert or store, or supply water, and/or facility outages. This section describes the five‐stage approach and level of actions for dealing with water shortages, with increasing restrictions on water use in response to worsening water shortage conditions and decreasing available supplies. The District has developed actions to be undertaken in response to water supply shortages, including up to a 50 percent reduction in water supply.
As a member agency of the Water Authority, the District is a participant in the Water Authority’s shortage contingency analysis, which addresses a catastrophic shortage situation and the District’s water shortage management measures and its responses to the Water Authority’s Drought Management Plan (DMP) are shown in Table 8‐1. Essentially, the District’s Code of Ordinance Section 39 establishes water management requirements necessary to conserve water, enable effective water supply planning, assure reasonable and beneficial use of water, prevent waste of water, prevent unreasonable use of water, prevent unreasonable methods of water use within the District in order to assure adequate supplies of water to meet the needs of the public, and further the public health, safety, and welfare, recognizing that water is a scarce natural resource that requires careful management not only in times of a water shortage, but at all times.1
1 Otay Water District, Code of Ordinance Section 39. Water Shortage Response Program

SECTION 8 – WATER SHORTAGE CONTINGENCY PLANNING
8‐2 CH2M HILL ENGINEERS, INC
This Section discusses the actions that might be taken depending on the severity of the shortage. Table 8‐1 describes the water supply shortage stages and conditions. The stages will be implemented during water supply shortages according to shortage level, ranging from 10 percent shortage in Stage 1 to greater than 50 percent shortage in Stage 4. The stage determination and declaration during a water supply shortage will be made by the District.
Table 8‐1: Stages of Water Shortage Contingency Plan
Stage No. Percent Supply Reduction Water Supply Condition
1 10 A temporary general water supply shortage due to increased demand or limited supplies
2 20 Up to 20 percent water supply shortage due to increased demand or limited supplies Shortage could be declared by wholesale water agency due to problems with disruption,
treatment, or storage facilities.
3 40 40 percent shortage declared by wholesale water agency or a long‐term scheduled or unscheduled shutdown, major system
disruption. Signs of multi‐year drought.
4 50 Greater than 50 percent shortage declared by wholesale water agency. Typically meant for immediate crisis such as major
infrastructure failure, unscheduled shutdown or disruption to water supply and distribution systems. Water supply reserved
for health and safety needs.
Notes:
In addition to the water shortage conditions specified by various stages of water supply scenarios, the District has implemented a list of conservation actions in the District’s WSRP that are in force at all times to prohibit water waste. Those conservation actions are summarized below:
■ Prevent water waste resulting from inefficient irrigation, such as runoff or overspray. Similarly, stop water flows onto non‐targeted areas, such as adjacent property, non‐irrigated areas, hardscapes, roadways, or structures.
■ Serve and refill water in restaurants and other food service establishments only upon request.
■ Offer guests in hotels, motels, and other commercial lodging establishments the option of not laundering towels and linens daily.
■ Repair all water leaks within forty‐eight hours (48) of notification by the District unless other arrangements are made with the General Manager or designee.
8.2 Prohibitions on End Uses The District has established prohibitions that become effective during different stages of water shortage. The prohibitions on water use are shown in Table 8‐2. For the complete Otay Code of Ordinance, Section 39, see Appendix I and the Code of Ordinance or at http://www.otaywater.gov/code‐of‐ordinances/
The District will enforce mandatory reduction programs as necessary to decrease consumption during a water shortage. The District currently has limits on consumption to discourage and/or prevent excessive use during times of supply shortage, as specified in Stage 1 actions. However, during a time

SECTION 8 – WATER SHORTAGE CONTINGENCY PLANNING
CH2M HILL ENGINEERS, INC 8‐3
of water shortage, the District will evaluate the need for any consumption limits, and the District may adopt additional consumption limits as deemed appropriate.
Table 8‐2 Restrictions and Prohibitions on End Uses
Stage Restrictions and Prohibitions on
End Users Additional Explanation or Reference
Penalty, Charge, or Other
Enforcement?
1 Landscape ‐ Restrict or prohibit runoff from landscape irrigation
Prevent water waste resulting from inefficient irrigation, such as runoff or overspray. Similarly, stop water flows onto non‐targeted areas, such as adjacent property, non‐irrigated areas, hardscapes, roadways, or structures. No
1 CII ‐ Restaurants may only serve water upon request
Serve and refill water in restaurants and other food service establishments only upon request. No
1 CII ‐ Lodging establishment must offer opt out of linen service
Offer guests in hotels, motels, and other commercial lodging establishments the option of not laundering towels and linens daily. No
1 Other ‐ Customers must repair leaks, breaks, and malfunctions in a timely manner
Repair all water leaks within forty‐eight hours (48) of notification by the District unless other arrangements are made with the General Manager or designee. No
1, 2 Landscape ‐ Limit landscape irrigation to specific times
Irrigate residential and commercial landscape before 10 a.m. and after 6 p.m. only. Suggest that customers water no more than three days per week, using the watering schedule found on the District’s web page. New plantings and newly seeded areas are exempt for 30 days. No
1, 2 Landscape ‐ Restrict or prohibit runoff from landscape irrigation
Use a hand‐held hose equipped with a positive shut‐off nozzle or bucket to water landscaped areas, including trees and shrubs located on residential and commercial properties that are not irrigated by a landscape irrigation system. No
1, 2 Other
Irrigate nursery and commercial grower’s products before 10 a.m. and after 6 p.m. only. Watering is permitted at any time with a hand‐held hose equipped with a positive shut‐off nozzle, a bucket, or when a drip/micro‐irrigation system/equipment is used. Irrigation of nursery propagation beds is permitted at any time. Watering of livestock is permitted at any time. No
1 Water Features ‐ Restrict water use for decorative water features, such as fountains Use re‐circulated water to operate ornamental fountains. No
1 Other ‐ Prohibit vehicle washing except at facilities using recycled or recirculating water
Wash vehicles, including but not limited to motorcycles, farm equipment, trailers, boats and boat engines and motorhomes using a bucket and a hand‐held hose with positive shut‐off nozzle, mobile high pressure/low volume wash system, or at a commercial site that re‐circulates (reclaims) water on‐site. Vehicle washing is limited to once per week. No
1 Other ‐ Prohibit use of potable water for construction and dust control
Use recycled or non‐potable water for construction purposes when available. No
2 Landscape ‐ Limit landscape irrigation to specific times
Limit residential and commercial landscape irrigation to no more than three days per week This section shall not apply to homeowner’s vegetable gardens, fruit trees, commercial growers, or nurseries. No
2 Landscape ‐ Other landscape restriction or prohibition
Limit lawn watering and landscape irrigation using sprinklers to no more than fifteen (15) minutes per No
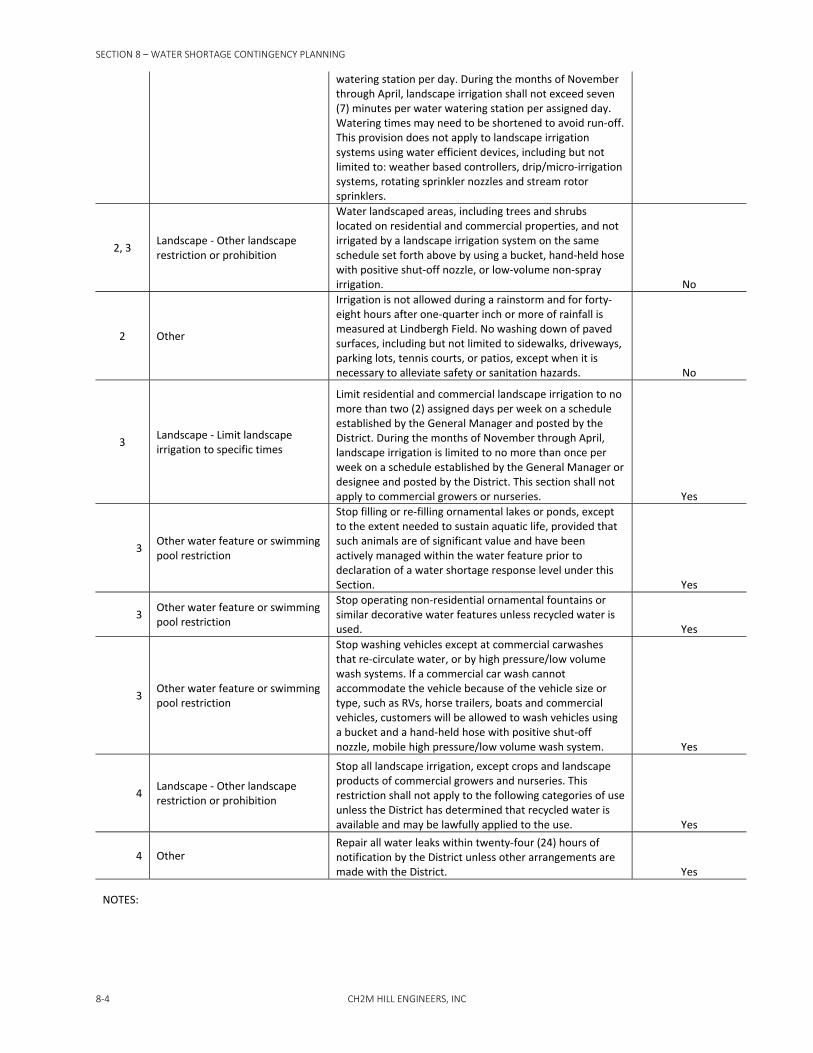
SECTION 8 – WATER SHORTAGE CONTINGENCY PLANNING
8‐4 CH2M HILL ENGINEERS, INC
watering station per day. During the months of November through April, landscape irrigation shall not exceed seven (7) minutes per water watering station per assigned day. Watering times may need to be shortened to avoid run‐off. This provision does not apply to landscape irrigation systems using water efficient devices, including but not limited to: weather based controllers, drip/micro‐irrigation systems, rotating sprinkler nozzles and stream rotor sprinklers.
2, 3 Landscape ‐ Other landscape restriction or prohibition
Water landscaped areas, including trees and shrubs located on residential and commercial properties, and not irrigated by a landscape irrigation system on the same schedule set forth above by using a bucket, hand‐held hose with positive shut‐off nozzle, or low‐volume non‐spray irrigation. No
2 Other
Irrigation is not allowed during a rainstorm and for forty‐eight hours after one‐quarter inch or more of rainfall is measured at Lindbergh Field. No washing down of paved surfaces, including but not limited to sidewalks, driveways, parking lots, tennis courts, or patios, except when it is necessary to alleviate safety or sanitation hazards. No
3 Landscape ‐ Limit landscape irrigation to specific times
Limit residential and commercial landscape irrigation to no more than two (2) assigned days per week on a schedule established by the General Manager and posted by the District. During the months of November through April, landscape irrigation is limited to no more than once per week on a schedule established by the General Manager or designee and posted by the District. This section shall not apply to commercial growers or nurseries. Yes
3 Other water feature or swimming pool restriction
Stop filling or re‐filling ornamental lakes or ponds, except to the extent needed to sustain aquatic life, provided that such animals are of significant value and have been actively managed within the water feature prior to declaration of a water shortage response level under this Section. Yes
3 Other water feature or swimming pool restriction
Stop operating non‐residential ornamental fountains or similar decorative water features unless recycled water is used. Yes
3 Other water feature or swimming pool restriction
Stop washing vehicles except at commercial carwashes that re‐circulate water, or by high pressure/low volume wash systems. If a commercial car wash cannot accommodate the vehicle because of the vehicle size or type, such as RVs, horse trailers, boats and commercial vehicles, customers will be allowed to wash vehicles using a bucket and a hand‐held hose with positive shut‐off nozzle, mobile high pressure/low volume wash system. Yes
4 Landscape ‐ Other landscape restriction or prohibition
Stop all landscape irrigation, except crops and landscape products of commercial growers and nurseries. This restriction shall not apply to the following categories of use unless the District has determined that recycled water is available and may be lawfully applied to the use. Yes
4 Other Repair all water leaks within twenty‐four (24) hours of notification by the District unless other arrangements are made with the District. Yes
NOTES:

SECTION 8 – WATER SHORTAGE CONTINGENCY PLANNING
CH2M HILL ENGINEERS, INC 8‐5
8.3 Penalties, Charges, Other Enforcement of Prohibitions The District has established prohibitions that become effective during different stages of water shortage. For the complete Otay Code of Ordinance, Section 72, see Appendix J for Section 39 of the Code of Ordinance or at http://www.otaywater.gov/code‐of‐ordinances/
The District will enforce mandatory reduction programs as necessary to decrease consumption during a water shortage. The District currently has no set charge for penalties or fees for exceeding consumption limits to be set during times of supply shortage (as described above). However, during a time of water shortage of Stages 3 and 4, the District may establish water allocations and any person that uses water in excess of the allocation shall be subject to a penalty.
Below is a summary of penalties and charges and the stage during which they take effect. The penalties may consist of a surcharge for the violation.
All stages ‐ Termination of Supplies through code enforcement process
Stage 3 ‐ Flow restriction orifices for customers not meeting Stage 3 allocations
Stage 4 ‐ Flow restriction orifices for customers not meeting Stage 4 allocations
8.4 Consumption Reduction Methods Consumption reduction methods are actions that are taken by the District to reduce water demand with its service area, whereas prohibitions addressed in section 8.3 limit specific uses of water. Based on the requirements of the Act, Table 8‐3 summarizes the methods that can be used by the District to enforce a reduction in consumption, where necessary. As mentioned earlier, various water conservation programs have been initiated by the District to reduce water demand. Additional measures can be phased in to provide additional demand reductions and increase public awareness of the need to conserve water. Conservation is a permanent and long‐term application used within the District at all times.
Table 8‐3: Stages of WSCP ‐ Consumption Reduction Methods
Stage Consumption Reduction Methods by Water
Supplier Additional Explanation or Reference
1 Expand Public Information Campaign
The District will increase its public education and outreach efforts to emphasize increased public awareness of the need to implement the water conservation practices.
1 Offer Water Use Surveys
Residential survey program
1 Provide Rebates on Plumbing Fixtures and Devices
Showerhead distribution; Residential voucher program; Residential high‐efficiency clothes washers program
1 Provide Rebates for Landscape Irrigation Efficiency Various programs related to landscape irrigation
1 Provide Rebates for Turf Replacement
3 Moratorium or Net Zero Demand Increase on New Connections
NOTE:
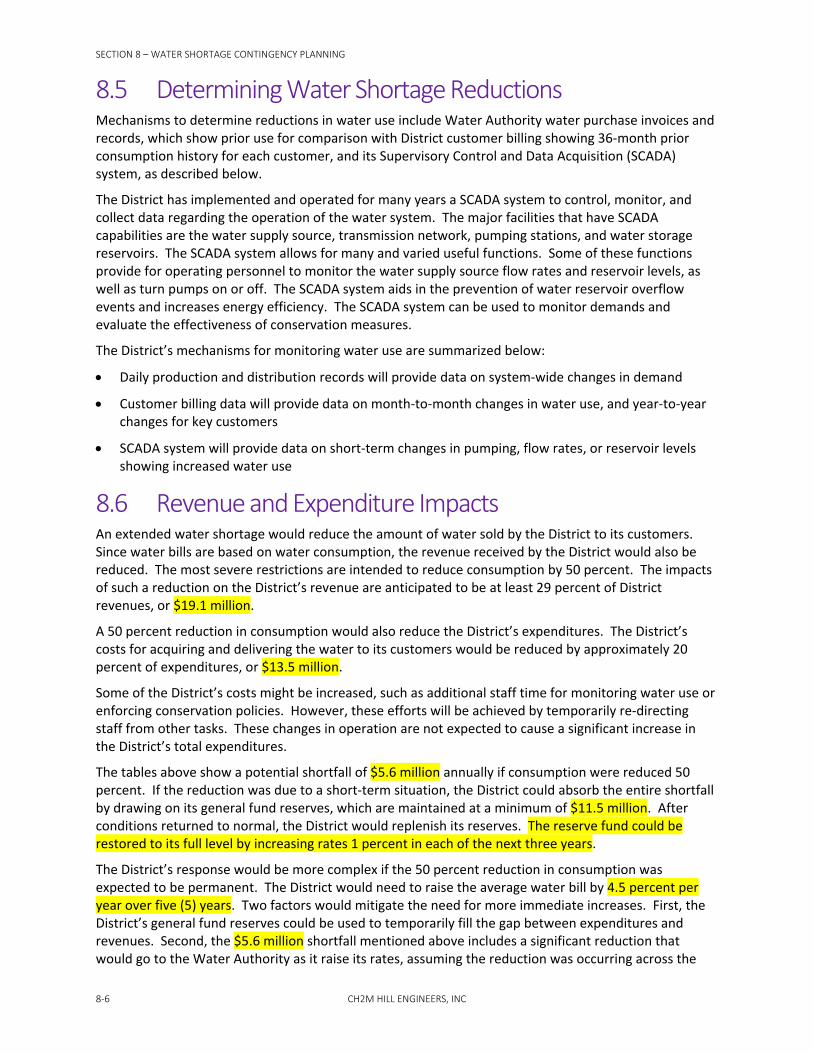
SECTION 8 – WATER SHORTAGE CONTINGENCY PLANNING
8‐6 CH2M HILL ENGINEERS, INC
8.5 Determining Water Shortage Reductions Mechanisms to determine reductions in water use include Water Authority water purchase invoices and records, which show prior use for comparison with District customer billing showing 36‐month prior consumption history for each customer, and its Supervisory Control and Data Acquisition (SCADA) system, as described below.
The District has implemented and operated for many years a SCADA system to control, monitor, and collect data regarding the operation of the water system. The major facilities that have SCADA capabilities are the water supply source, transmission network, pumping stations, and water storage reservoirs. The SCADA system allows for many and varied useful functions. Some of these functions provide for operating personnel to monitor the water supply source flow rates and reservoir levels, as well as turn pumps on or off. The SCADA system aids in the prevention of water reservoir overflow events and increases energy efficiency. The SCADA system can be used to monitor demands and evaluate the effectiveness of conservation measures.
The District’s mechanisms for monitoring water use are summarized below:
Daily production and distribution records will provide data on system‐wide changes in demand
Customer billing data will provide data on month‐to‐month changes in water use, and year‐to‐year changes for key customers
SCADA system will provide data on short‐term changes in pumping, flow rates, or reservoir levels showing increased water use
8.6 Revenue and Expenditure Impacts An extended water shortage would reduce the amount of water sold by the District to its customers. Since water bills are based on water consumption, the revenue received by the District would also be reduced. The most severe restrictions are intended to reduce consumption by 50 percent. The impacts of such a reduction on the District’s revenue are anticipated to be at least 29 percent of District revenues, or $19.1 million.
A 50 percent reduction in consumption would also reduce the District’s expenditures. The District’s costs for acquiring and delivering the water to its customers would be reduced by approximately 20 percent of expenditures, or $13.5 million.
Some of the District’s costs might be increased, such as additional staff time for monitoring water use or enforcing conservation policies. However, these efforts will be achieved by temporarily re‐directing staff from other tasks. These changes in operation are not expected to cause a significant increase in the District’s total expenditures.
The tables above show a potential shortfall of $5.6 million annually if consumption were reduced 50 percent. If the reduction was due to a short‐term situation, the District could absorb the entire shortfall by drawing on its general fund reserves, which are maintained at a minimum of $11.5 million. After conditions returned to normal, the District would replenish its reserves. The reserve fund could be restored to its full level by increasing rates 1 percent in each of the next three years.
The District’s response would be more complex if the 50 percent reduction in consumption was expected to be permanent. The District would need to raise the average water bill by 4.5 percent per year over five (5) years. Two factors would mitigate the need for more immediate increases. First, the District’s general fund reserves could be used to temporarily fill the gap between expenditures and revenues. Second, the $5.6 million shortfall mentioned above includes a significant reduction that would go to the Water Authority as it raise its rates, assuming the reduction was occurring across the

SECTION 8 – WATER SHORTAGE CONTINGENCY PLANNING
CH2M HILL ENGINEERS, INC 8‐7
region. The Water Authority would likely spread its rate increases over several years, allowing the District to do the same.
In order to overcome revenue impacts, the District has the option for the following measures:
Adjust rates at a 5 percent annual increase for four years up to a 20 percent increase in average water bill
Develop additional reserves – reserves are currently maintained at a minimum of $12 million. With the rate adjustment, the District would replenish any draw‐down of reserves that occurred
A permanent 50 percent reduction in water consumption might allow the District to achieve cost savings in some areas. The need for additional pumping, storage, and pipeline capaDistrict might be reduced. The District might not require as much equipment or staff to maintain its infrastructure. However, the District might see higher expenditures in other areas, such as water use monitoring or answering questions from customers. Overall, these changes are not expected to have a significant impact on District expenditures.
8.7 Resolution or Ordinance The District’s Code of Ordinance Section 39 contains specific information on handling water shortages and is included as Appendix I.
8.8 Catastrophic Supply Interruption Catastrophic events such as earthquakes or regional power outages can impact water supply. As a member agency of the Water Authority, the District is a participant in the Water Authority’s Emergency Response Plan (ERP) and ESP. The ERP provides information to allow staff to respond to an emergency that impedes the Water Authority’s ability to provide reliable water service to the District. The ERP includes:
■ Authorities, policies, and procedures associated with emergency response activities;
■ Emergency Operations Center activities, including activation and deactivation guidelines;
■ Multi‐agency and multi‐jurisdictional coordination, particularly between the Water Authority, its member agencies (including the District), and Metropolitan;
■ Emergency staff, management, and organization required to assist in mitigating any significant emergency or disaster;
■ Mutual Aid agreements and covenants that outline the terms and conditions under which mutual aid assistance will be provided; and
■ Pre‐emergency planning and emergency operations procedures.
The ESP is a system of reservoirs, pipelines, and other facilities that will work together to store and move water around the county in the event of a natural disaster. The entire project is expected to be completed by 2017. When completed, the ESP will provide 90,100 AF of storage water for emergency purposes in the Water Authority’s service area. This amount is anticipated to meet the Water Authority’s emergency water needs through at least 2030.
The District has constructed storage reservoirs to provide water during an interruption in the Water Authority’s supply to the District. These reservoirs provide approximately 190 million gallons of storage, equal to approximately five days of average demand. The District has also established emergency
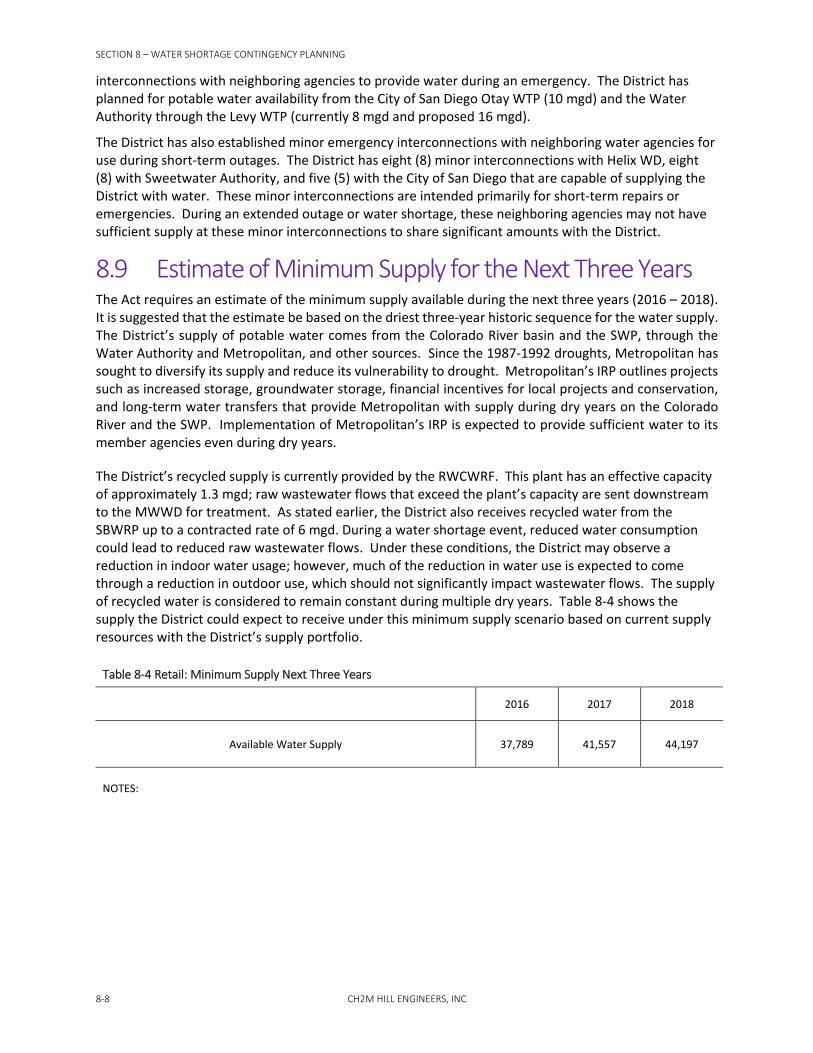
SECTION 8 – WATER SHORTAGE CONTINGENCY PLANNING
8‐8 CH2M HILL ENGINEERS, INC
interconnections with neighboring agencies to provide water during an emergency. The District has planned for potable water availability from the City of San Diego Otay WTP (10 mgd) and the Water Authority through the Levy WTP (currently 8 mgd and proposed 16 mgd).
The District has also established minor emergency interconnections with neighboring water agencies for use during short‐term outages. The District has eight (8) minor interconnections with Helix WD, eight (8) with Sweetwater Authority, and five (5) with the City of San Diego that are capable of supplying the District with water. These minor interconnections are intended primarily for short‐term repairs or emergencies. During an extended outage or water shortage, these neighboring agencies may not have sufficient supply at these minor interconnections to share significant amounts with the District.
8.9 Estimate of Minimum Supply for the Next Three Years The Act requires an estimate of the minimum supply available during the next three years (2016 – 2018). It is suggested that the estimate be based on the driest three‐year historic sequence for the water supply. The District’s supply of potable water comes from the Colorado River basin and the SWP, through the Water Authority and Metropolitan, and other sources. Since the 1987‐1992 droughts, Metropolitan has sought to diversify its supply and reduce its vulnerability to drought. Metropolitan’s IRP outlines projects such as increased storage, groundwater storage, financial incentives for local projects and conservation, and long‐term water transfers that provide Metropolitan with supply during dry years on the Colorado River and the SWP. Implementation of Metropolitan’s IRP is expected to provide sufficient water to its member agencies even during dry years.
The District’s recycled supply is currently provided by the RWCWRF. This plant has an effective capacity of approximately 1.3 mgd; raw wastewater flows that exceed the plant’s capacity are sent downstream to the MWWD for treatment. As stated earlier, the District also receives recycled water from the SBWRP up to a contracted rate of 6 mgd. During a water shortage event, reduced water consumption could lead to reduced raw wastewater flows. Under these conditions, the District may observe a reduction in indoor water usage; however, much of the reduction in water use is expected to come through a reduction in outdoor use, which should not significantly impact wastewater flows. The supply of recycled water is considered to remain constant during multiple dry years. Table 8‐4 shows the supply the District could expect to receive under this minimum supply scenario based on current supply resources with the District’s supply portfolio.
Table 8‐4 Retail: Minimum Supply Next Three Years
2016 2017 2018
Available Water Supply 37,789 41,557 44,197
NOTES:

SECTION 9
CH2M HILL ENGINEERS, INC 9‐1
Demand Management Measures Water conservation is a critical part of the District’s 2015 UWMP and its long‐term strategy for meeting the water needs of the District. The goals of the District’s water conservation program are to:
■ reduce the demand for more expensive, imported water ■ demonstrate continued commitment to the Best Management Practices (BMPs) ■ ensure a reliable water supply
The District is a signatory to the Memorandum of Understanding (MOU) Regarding Urban Water Conservation in California, which created the CUWCC in 1991. As a signatory, the District is required to submit biannual reports that detail the implementation of current water conservation practices. The District voluntarily agreed to implement the fourteen water conservation BMPs beginning in 1992. The District submits its annual report to the CUWCC every two years. The District’s BMP Reports for 2011 to 2015, as well as the BMP Coverage Reports for 2011, 2012, 2013, and 2014 are included in Appendix K.
Water utilities throughout California are implementing water conservation programs and providing services to their customers to promote water use efficiencies and water savings. As a water retailer and signatory of the MOU, the District submits biennial reports on its compliance with the BMPs as applicable through the GPCD Option. In addition to the BMPs, the District also reports on the number of accounts by customer class and details its supply sources.
According to the BMP Reports (for years 2010 ‐ 2014) submitted by the District, the District conservation programs meet the requirements as a signatory to the MOU. By choosing the GPCD Option and its reporting mechanism and achieving per capita reductions, the District can demonstrate its successes in water use reductions, efficiencies and conservation savings.
9.1 Water Conservation Programs and Water Efficiency Practices
The District has long been a leader in the field of water conservation. Since the early 1990’s, water conservation programs have been developed and conducted on the premise that water conservation increases the water supply by reducing the demand on available supply, which is vital to the optimal operation of the District. Education is an important component to all of these programs. As a member agency of the Water Authority, the District also participates in many water conservation programs designed and conducted as a shared‐cost participation program among the member agencies, the Water Authority and Metropolitan.
The District continues to promote water conservation at a variety of events, including those involving developers in its service area. In addition, the District developed and manages a number of its own programs such as the Cash for WaterSmart Plants retrofit program, the Water Smart Irrigation Upgrade Program, and the Commercial Process Improvement Program.
The District is currently engaged in a number of conservation and water use efficiency activities.
The District participates in a Joint Powers Authority with the Helix WD, Grossmont‐Cuyamaca Community College District, the Water Authority, the City of San Diego, and the Padre Dam Municipal Water District to operate the nearly five‐acre Water Conservation Demonstration Garden. The Garden’s mission is to, “promote water conservation in the southern California landscape through excellent exhibits and programs that educate and inspire the public.” The Garden educates customers about reducing landscape water use through the use of water‐efficient landscapes.
SECTION 9 – DEMAND MANAGEMENT MEASURES
9‐2 CH2M HILL ENGINEERS, INC
9.2 Determination of DMM Implementation The District is a member of the CUWCC and a signatory to the MOU. The District’s 2010 to 2014 Annual Reports and the District’s Annual BMP Coverage Reports are included in Appendix K. The 2014 BMP Report indicates that the District is on track for foundational BMPs for urban water efficiency. The District’s filing of the 2014 BMP Report meets the requirements set forth by the DWR and is in full compliance with the CUWCC’s MOU regarding Urban Water Conservation in California.
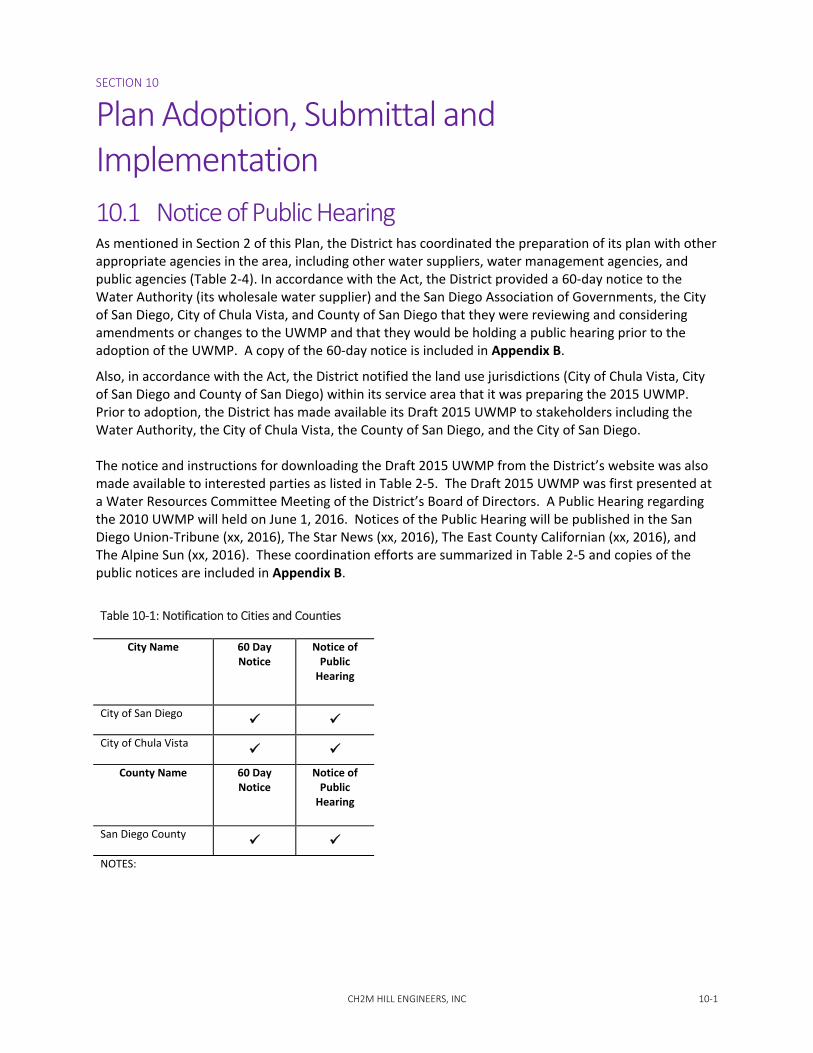
SECTION 10
CH2M HILL ENGINEERS, INC 10‐1
Plan Adoption, Submittal and Implementation
10.1 Notice of Public Hearing As mentioned in Section 2 of this Plan, the District has coordinated the preparation of its plan with other appropriate agencies in the area, including other water suppliers, water management agencies, and public agencies (Table 2‐4). In accordance with the Act, the District provided a 60‐day notice to the Water Authority (its wholesale water supplier) and the San Diego Association of Governments, the City of San Diego, City of Chula Vista, and County of San Diego that they were reviewing and considering amendments or changes to the UWMP and that they would be holding a public hearing prior to the adoption of the UWMP. A copy of the 60‐day notice is included in Appendix B.
Also, in accordance with the Act, the District notified the land use jurisdictions (City of Chula Vista, City of San Diego and County of San Diego) within its service area that it was preparing the 2015 UWMP. Prior to adoption, the District has made available its Draft 2015 UWMP to stakeholders including the Water Authority, the City of Chula Vista, the County of San Diego, and the City of San Diego. The notice and instructions for downloading the Draft 2015 UWMP from the District’s website was also made available to interested parties as listed in Table 2‐5. The Draft 2015 UWMP was first presented at a Water Resources Committee Meeting of the District’s Board of Directors. A Public Hearing regarding the 2010 UWMP will held on June 1, 2016. Notices of the Public Hearing will be published in the San Diego Union‐Tribune (xx, 2016), The Star News (xx, 2016), The East County Californian (xx, 2016), and The Alpine Sun (xx, 2016). These coordination efforts are summarized in Table 2‐5 and copies of the public notices are included in Appendix B.
Table 10‐1: Notification to Cities and Counties
City Name 60 Day Notice
Notice of Public Hearing
City of San Diego
City of Chula Vista
County Name 60 Day Notice
Notice of Public Hearing
San Diego County
NOTES:
SECTION 10 – PLAN ADOPTION, SUBMITTAL AND IMPLEMENTATION
10‐2 CH2M HILL ENGINEERS, INC
10.2 Plan Submittal The District’s 2015 UWMP will be submitted to DWR within 30 days of adoption and by July 1, 2016. The UWMP submittal will also be completed electronically through DWR’s online submittal tool, WUEdata.

Appendix A Urban Water Management Plan Act
Text
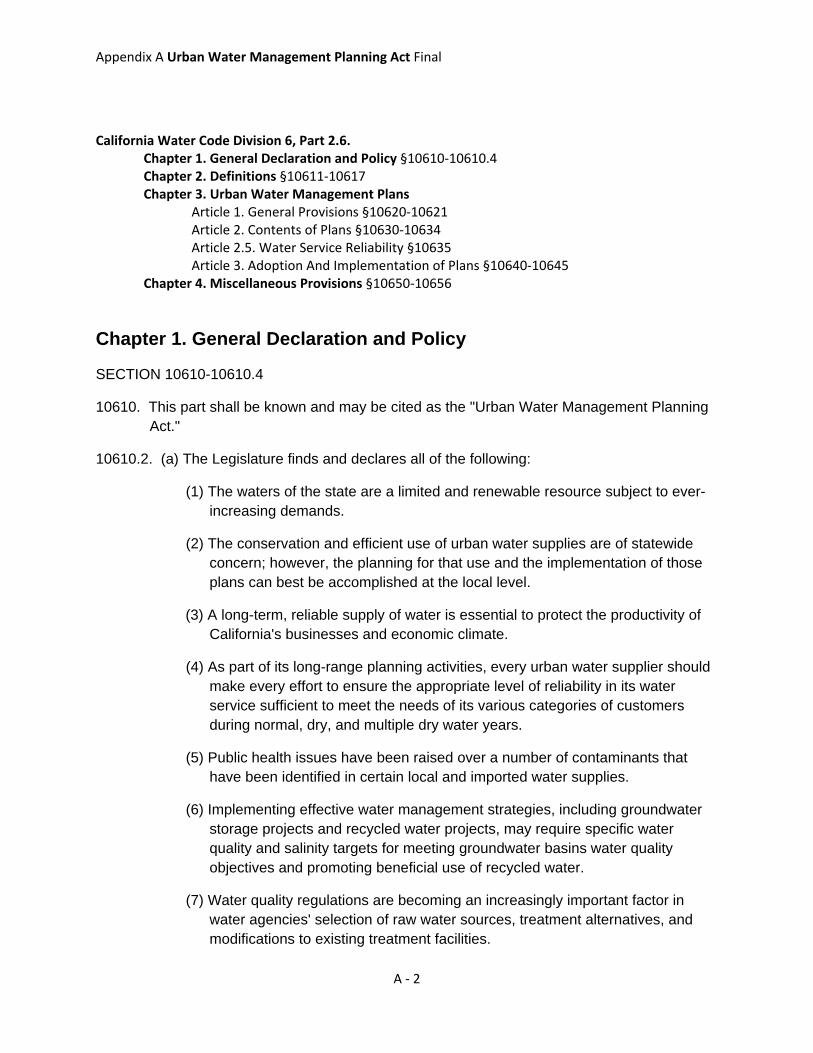
Appendix A Urban Water Management Planning Act Final
A ‐ 2
California Water Code Division 6, Part 2.6.
Chapter 1. General Declaration and Policy §10610‐10610.4 Chapter 2. Definitions §10611‐10617 Chapter 3. Urban Water Management Plans
Article 1. General Provisions §10620‐10621 Article 2. Contents of Plans §10630‐10634 Article 2.5. Water Service Reliability §10635 Article 3. Adoption And Implementation of Plans §10640‐10645
Chapter 4. Miscellaneous Provisions §10650‐10656
Chapter 1. General Declaration and Policy
SECTION 10610-10610.4
10610. This part shall be known and may be cited as the "Urban Water Management Planning Act."
10610.2. (a) The Legislature finds and declares all of the following:
(1) The waters of the state are a limited and renewable resource subject to ever-increasing demands.
(2) The conservation and efficient use of urban water supplies are of statewide concern; however, the planning for that use and the implementation of those plans can best be accomplished at the local level.
(3) A long-term, reliable supply of water is essential to protect the productivity of California's businesses and economic climate.
(4) As part of its long-range planning activities, every urban water supplier should make every effort to ensure the appropriate level of reliability in its water service sufficient to meet the needs of its various categories of customers during normal, dry, and multiple dry water years.
(5) Public health issues have been raised over a number of contaminants that have been identified in certain local and imported water supplies.
(6) Implementing effective water management strategies, including groundwater storage projects and recycled water projects, may require specific water quality and salinity targets for meeting groundwater basins water quality objectives and promoting beneficial use of recycled water.
(7) Water quality regulations are becoming an increasingly important factor in water agencies' selection of raw water sources, treatment alternatives, and modifications to existing treatment facilities.

Appendix A Urban Water Management Planning Act Final
A ‐ 3
(8) Changes in drinking water quality standards may also impact the usefulness of water supplies and may ultimately impact supply reliability.
(9) The quality of source supplies can have a significant impact on water management strategies and supply reliability.
(b) This part is intended to provide assistance to water agencies in carrying out their long-term resource planning responsibilities to ensure adequate water supplies to meet existing and future demands for water.
10610.4. The Legislature finds and declares that it is the policy of the state as follows:
(a) The management of urban water demands and efficient use of water shall be actively pursued to protect both the people of the state and their water resources.
(b) The management of urban water demands and efficient use of urban water supplies shall be a guiding criterion in public decisions.
(c) Urban water suppliers shall be required to develop water management plans to actively pursue the efficient use of available supplies.
Chapter 2. Definitions
SECTION 10611-10617
10611. Unless the context otherwise requires, the definitions of this chapter govern the construction of this part.
10611.5. “Demand management" means those water conservation measures, programs, and incentives that prevent the waste of water and promote the reasonable and efficient use and reuse of available supplies.
10612. "Customer" means a purchaser of water from a water supplier who uses the water for municipal purposes, including residential, commercial, governmental, and industrial uses.
10613. "Efficient use" means those management measures that result in the most effective use of water so as to prevent its waste or unreasonable use or unreasonable method of use.
10614. "Person" means any individual, firm, association, organization, partnership, business, trust, corporation, company, public agency, or any agency of such an entity.
10615. "Plan" means an urban water management plan prepared pursuant to this part. A plan shall describe and evaluate sources of supply, reasonable and practical efficient uses,

Appendix A Urban Water Management Planning Act Final
A ‐ 4
reclamation and demand management activities. The components of the plan may vary according to an individual community or area's characteristics and its capabilities to efficiently use and conserve water. The plan shall address measures for residential, commercial, governmental, and industrial water demand management as set forth in Article 2 (commencing with Section 10630) of Chapter 3. In addition, a strategy and time schedule for implementation shall be included in the plan.
10616. "Public agency" means any board, commission, county, city and county, city, regional agency, district, or other public entity.
10616.5. "Recycled water" means the reclamation and reuse of wastewater for beneficial use.
10617. "Urban water supplier" means a supplier, either publicly or privately owned, providing water for municipal purposes either directly or indirectly to more than 3,000 customers or supplying more than 3,000 acre-feet of water annually. An urban water supplier includes a supplier or contractor for water, regardless of the basis of right, which distributes or sells for ultimate resale to customers. This part applies only to water supplied from public water systems subject to Chapter 4 (commencing with Section 116275) of Part 12 of Division 104 of the Health and Safety Code.
Chapter 3. Urban Water Management Plans
Article 1. General Provisions SECTION 10620-10621
10620. (a) Every urban water supplier shall prepare and adopt an urban water management plan in the manner set forth in Article 3 (commencing with Section 10640).
(b) Every person that becomes an urban water supplier shall adopt an urban water management plan within one year after it has become an urban water supplier.
(c) An urban water supplier indirectly providing water shall not include planning elements in its water management plan as provided in Article 2 (commencing with Section 10630) that would be applicable to urban water suppliers or public agencies directly providing water, or to their customers, without the consent of those suppliers or public agencies.
(d) (1) An urban water supplier may satisfy the requirements of this part by participation in areawide, regional, watershed, or basinwide urban water management planning where those plans will reduce preparation costs and contribute to the achievement of conservation and efficient water use.
(2) Each urban water supplier shall coordinate the preparation of its plan with other appropriate agencies in the area, including other water suppliers that

Appendix A Urban Water Management Planning Act Final
A ‐ 5
share a common source, water management agencies, and relevant public agencies, to the extent practicable.
(e) The urban water supplier may prepare the plan with its own staff, by contract, or in cooperation with other governmental agencies.
(f) An urban water supplier shall describe in the plan water management tools and options used by that entity that will maximize resources and minimize the need to import water from other regions.
10621. (a) Each urban water supplier shall update its plan at least once every five years on or before December 31, in years ending in five and zero, except as provided in subdivision (d).
(b) Every urban water supplier required to prepare a plan pursuant to this part shall, at least 60 days before the public hearing on the plan required by Section 10642, notify any city or county within which the supplier provides water supplies that the urban water supplier will be reviewing the plan and considering amendments or changes to the plan. The urban water supplier may consult with, and obtain comments from, any city or county that receives notice pursuant to this subdivision.
(c) The amendments to, or changes in, the plan shall be adopted and filed in the manner set forth in Article 3 (commencing with Section 10640).
(d) Each urban water supplier shall update and submit its 2015 plan to the department by July 1, 2016.
Article 2. Contents of Plan SECTION 10630-10634
10630. It is the intention of the Legislature, in enacting this part, to permit levels of water management planning commensurate with the numbers of customers served and the volume of water supplied.
10631. A plan shall be adopted in accordance with this chapter that shall do all of the following:
(a) Describe the service area of the supplier, including current and projected population, climate, and other demographic factors affecting the supplier's water management planning. The projected population estimates shall be based upon data from the state, regional, or local service agency population projections within the service area of the urban water supplier and shall be in five-year increments to 20 years or as far as data is available.
(b) Identify and quantify, to the extent practicable, the existing and planned sources of water available to the supplier over the same five-year increments described in subdivision (a). If groundwater is identified as an existing or planned source of

Appendix A Urban Water Management Planning Act Final
A ‐ 6
water available to the supplier, all of the following information shall be included in the plan:
(1) A copy of any groundwater management plan adopted by the urban water supplier, including plans adopted pursuant to Part 2.75 (commencing with Section 10750), or any other specific authorization for groundwater management.
(2) A description of any groundwater basin or basins from which the urban water supplier pumps groundwater. For basins that a court or the board has adjudicated the rights to pump groundwater, a copy of the order or decree adopted by the court or the board and a description of the amount of groundwater the urban water supplier has the legal right to pump under the order or decree. For basins that have not been adjudicated, information as to whether the department has identified the basin or basins as overdrafted or has projected that the basin will become overdrafted if present management conditions continue, in the most current official departmental bulletin that characterizes the condition of the groundwater basin, and a detailed description of the efforts being undertaken by the urban water supplier to eliminate the long-term overdraft condition.
(3) A detailed description and analysis of the location, amount, and sufficiency of groundwater pumped by the urban water supplier for the past five years. The description and analysis shall be based on information that is reasonably available, including, but not limited to, historic use records.
(4) A detailed description and analysis of the amount and location of groundwater that is projected to be pumped by the urban water supplier. The description and analysis shall be based on information that is reasonably available, including, but not limited to, historic use records.
(c) (1) Describe the reliability of the water supply and vulnerability to seasonal or climatic shortage, to the extent practicable, and provide data for each of the following:
(A) An average water year.
(B) A single-dry water year.
(C) Multiple-dry water years.
(2) For any water source that may not be available at a consistent level of use, given specific legal, environmental, water quality, or climatic factors, describe plans to supplement or replace that source with alternative sources or water demand management measures, to the extent practicable.

Appendix A Urban Water Management Planning Act Final
A ‐ 7
(d) Describe the opportunities for exchanges or transfers of water on a short-term or long-term basis.
(e) (1) Quantify, to the extent records are available, past and current water use, over the same five-year increments described in subdivision (a), and projected water use, identifying the uses among water use sectors, including, but not necessarily limited to, all of the following uses:
(A) Single-family residential.
(B) Multifamily.
(C) Commercial.
(D) Industrial.
(E) Institutional and governmental.
(F) Landscape.
(G) Sales to other agencies.
(H) Saline water intrusion barriers, groundwater recharge, or conjunctive use, or any combination thereof.
(I) Agricultural.
(J) Distribution system water loss.
(2) The water use projections shall be in the same five-year increments described in subdivision (a).
(3) (A) For the 2015 urban water management plan update, the distribution system water loss shall be quantified for the most recent 12-month period available. For all subsequent updates, the distribution system water loss shall be quantified for each of the five years preceding the plan update.
(B) The distribution system water loss quantification shall be reported in accordance with a worksheet approved or developed by the department through a public process. The water loss quantification worksheet shall be based on the water system balance methodology developed by the American Water Works Association.
(4) (A) If available and applicable to an urban water supplier, water use projections may display and account for the water savings estimated to result from adopted codes, standards, ordinances, or transportation and land use plans identified by the urban water supplier, as applicable to the service area.

Appendix A Urban Water Management Planning Act Final
A ‐ 8
(B) To the extent that an urban water supplier reports the information described in subparagraph (A), an urban water supplier shall do both of the following:
(i) Provide citations of the various codes, standards, ordinances, or transportation and land use plans utilized in making the projections.
(ii) Indicate the extent that the water use projections consider savings from codes, standards, ordinances, or transportation and land use plans. Water use projections that do not account for these water savings shall be noted of that fact.
(f) Provide a description of the supplier's water demand management measures. This description shall include all of the following:
(1) (A) For an urban retail water supplier, as defined in Section 10608.12, a narrative description that addresses the nature and extent of each water demand management measure implemented over the past five years. The narrative shall describe the water demand management measures that the supplier plans to implement to achieve its water use targets pursuant to Section 10608.20.
(B) The narrative pursuant to this paragraph shall include descriptions of the following water demand management measures:
(i) Water waste prevention ordinances.
(ii) Metering.
(iii) Conservation pricing.
(iv) Public education and outreach.
(v) Programs to assess and manage distribution system real loss.
(vi) Water conservation program coordination and staffing support.
(vii) Other demand management measures that have a significant impact on water use as measured in gallons per capita per day, including innovative measures, if implemented.
(2) For an urban wholesale water supplier, as defined in Section 10608.12, a narrative description of the items in clauses (ii), (iv), (vi), and (vii) of subparagraph (B) of paragraph (1), and a narrative description of its distribution system asset management and wholesale supplier assistance programs.
(g) Include a description of all water supply projects and water supply programs that may be undertaken by the urban water supplier to meet the total projected water

Appendix A Urban Water Management Planning Act Final
A ‐ 9
use, as established pursuant to subdivision (a) of Section 10635. The urban water supplier shall include a detailed description of expected future projects and programs that the urban water supplier may implement to increase the amount of the water supply available to the urban water supplier in average, single-dry, and multiple-dry water years. The description shall identify specific projects and include a description of the increase in water supply that is expected to be available from each project. The description shall include an estimate with regard to the implementation timeline for each project or program.
(h) Describe the opportunities for development of desalinated water, including, but not limited to, ocean water, brackish water, and groundwater, as a long-term supply.
(i) For purposes of this part, urban water suppliers that are members of the California Urban Water Conservation Council shall be deemed in compliance with the requirements of subdivision (f) by complying with all the provisions of the "Memorandum of Understanding Regarding Urban Water Conservation in California," dated December 10, 2008, as it may be amended, and by submitting the annual reports required by Section 6.2 of that memorandum.
(j) An urban water supplier that relies upon a wholesale agency for a source of water shall provide the wholesale agency with water use projections from that agency for that source of water in five-year increments to 20 years or as far as data is available. The wholesale agency shall provide information to the urban water supplier for inclusion in the urban water supplier's plan that identifies and quantifies, to the extent practicable, the existing and planned sources of water as required by subdivision (b), available from the wholesale agency to the urban water supplier over the same five-year increments, and during various water-year types in accordance with subdivision (c). An urban water supplier may rely upon water supply information provided by the wholesale agency in fulfilling the plan informational requirements of subdivisions (b) and (c).
10631.1. (a) The water use projections required by Section 10631 shall include projected water use for single-family and multifamily residential housing needed for lower income households, as defined in Section 50079.5 of the Health and Safety Code, as identified in the housing element of any city, county, or city and county in the service area of the supplier.
(b) It is the intent of the Legislature that the identification of projected water use for single-family and multifamily residential housing for lower income households will assist a supplier in complying with the requirement under Section 65589.7 of the Government Code to grant a priority for the provision of service to housing units affordable to lower income households.
Appendix A Urban Water Management Planning Act Final
A ‐ 10
10631.2. (a) In addition to the requirements of Section 10631, an urban water management plan may, but is not required to, include any of the following information:
(1) An estimate of the amount of energy used to extract or divert water supplies.
(2) An estimate of the amount of energy used to convey water supplies to the water treatment plants or distribution systems.
(3) An estimate of the amount of energy used to treat water supplies.
(4) An estimate of the amount of energy used to distribute water supplies through its distribution systems.
(5) An estimate of the amount of energy used for treated water supplies in comparison to the amount used for nontreated water supplies.
(6) An estimate of the amount of energy used to place water into or withdraw from storage.
(7) Any other energy-related information the urban water supplier deems appropriate.
(b) The department shall include in its guidance for the preparation of urban water management plans a methodology for the voluntary calculation or estimation of the energy intensity of urban water systems. The department may consider studies and calculations conducted by the Public Utilities Commission in developing the methodology.
10631.5. (a) (1) Beginning January 1, 2009, the terms of, and eligibility for, a water management grant or loan made to an urban water supplier and awarded or administered by the department, state board, or California Bay-Delta Authority or its successor agency shall be conditioned on the implementation of the water demand management measures described in Section 10631, as determined by the department pursuant to subdivision (b).
(2) For the purposes of this section, water management grants and loans include funding for programs and projects for surface water or groundwater storage, recycling, desalination, water conservation, water supply reliability, and water supply augmentation. This section does not apply to water management projects funded by the federal American Recovery and Reinvestment Act of 2009 (Public Law 111-5).
(3) Notwithstanding paragraph (1), the department shall determine that an urban water supplier is eligible for a water management grant or loan even though the supplier is not implementing all of the water demand management measures described in Section 10631, if the urban water supplier has

Appendix A Urban Water Management Planning Act Final
A ‐ 11
submitted to the department for approval a schedule, financing plan, and budget, to be included in the grant or loan agreement, for implementation of the water demand management measures. The supplier may request grant or loan funds to implement the water demand management measures to the extent the request is consistent with the eligibility requirements applicable to the water management funds.
(4) (A) Notwithstanding paragraph (1), the department shall determine that an urban water supplier is eligible for a water management grant or loan even though the supplier is not implementing all of the water demand management measures described in Section 10631, if an urban water supplier submits to the department for approval documentation demonstrating that a water demand management measure is not locally cost effective. If the department determines that the documentation submitted by the urban water supplier fails to demonstrate that a water demand management measure is not locally cost effective, the department shall notify the urban water supplier and the agency administering the grant or loan program within 120 days that the documentation does not satisfy the requirements for an exemption, and include in that notification a detailed statement to support the determination.
(B) For purposes of this paragraph, "not locally cost effective" means that the present value of the local benefits of implementing a water demand management measure is less than the present value of the local costs of implementing that measure.
(b) (1) The department, in consultation with the state board and the California Bay-Delta Authority or its successor agency, and after soliciting public comment regarding eligibility requirements, shall develop eligibility requirements to implement the requirement of paragraph (1) of subdivision (a). In establishing these eligibility requirements, the department shall do both of the following:
(A) Consider the conservation measures described in the Memorandum of Understanding Regarding Urban Water Conservation in California, and alternative conservation approaches that provide equal or greater water savings.
(B) Recognize the different legal, technical, fiscal, and practical roles and responsibilities of wholesale water suppliers and retail water suppliers.
(2) (A) For the purposes of this section, the department shall determine whether an urban water supplier is implementing all of the water demand management measures described in Section 10631 based on either, or a combination, of the following:
Appendix A Urban Water Management Planning Act Final
A ‐ 12
(i) Compliance on an individual basis.
(ii) Compliance on a regional basis. Regional compliance shall require participation in a regional conservation program consisting of two or more urban water suppliers that achieves the level of conservation or water efficiency savings equivalent to the amount of conservation or savings achieved if each of the participating urban water suppliers implemented the water demand management measures. The urban water supplier administering the regional program shall provide participating urban water suppliers and the department with data to demonstrate that the regional program is consistent with this clause. The department shall review the data to determine whether the urban water suppliers in the regional program are meeting the eligibility requirements.
(B) The department may require additional information for any determination pursuant to this section.
(3) The department shall not deny eligibility to an urban water supplier in compliance with the requirements of this section that is participating in a multiagency water project, or an integrated regional water management plan, developed pursuant to Section 75026 of the Public Resources Code, solely on the basis that one or more of the agencies participating in the project or plan is not implementing all of the water demand management measures described in Section 10631.
(c) In establishing guidelines pursuant to the specific funding authorization for any water management grant or loan program subject to this section, the agency administering the grant or loan program shall include in the guidelines the eligibility requirements developed by the department pursuant to subdivision (b).
(d) Upon receipt of a water management grant or loan application by an agency administering a grant and loan program subject to this section, the agency shall request an eligibility determination from the department with respect to the requirements of this section. The department shall respond to the request within 60 days of the request.
(e) The urban water supplier may submit to the department copies of its annual reports and other relevant documents to assist the department in determining whether the urban water supplier is implementing or scheduling the implementation of water demand management activities. In addition, for urban water suppliers that are signatories to the Memorandum of Understanding Regarding Urban Water Conservation in California and submit biennial reports to the California Urban Water Conservation Council in accordance with the memorandum, the department may use these reports to assist in tracking the implementation of water demand management measures.
Appendix A Urban Water Management Planning Act Final
A ‐ 13
(f) This section shall remain in effect only until July 1, 2016, and as of that date is repealed, unless a later enacted statute, that is enacted before July 1, 2016, deletes or extends that date.
10631.7. The department, in consultation with the California Urban Water Conservation Council, shall convene an independent technical panel to provide information and recommendations to the department and the Legislature on new demand management measures, technologies, and approaches. The panel shall consist of no more than seven members, who shall be selected by the department to reflect a balanced representation of experts. The panel shall have at least one, but no more than two, representatives from each of the following: retail water suppliers, environmental organizations, the business community, wholesale water suppliers, and academia. The panel shall be convened by January 1, 2009, and shall report to the Legislature no later than January 1, 2010, and every five years thereafter. The department shall review the panel report and include in the final report to the Legislature the department's recommendations and comments regarding the panel process and the panel's recommendations.
10632. (a) The plan shall provide an urban water shortage contingency analysis that includes each of the following elements that are within the authority of the urban water supplier:
(1) Stages of action to be undertaken by the urban water supplier in response to water supply shortages, including up to a 50 percent reduction in water supply, and an outline of specific water supply conditions that are applicable to each stage.
(2) An estimate of the minimum water supply available during each of the next three water years based on the driest three-year historic sequence for the agency's water supply.
(3) Actions to be undertaken by the urban water supplier to prepare for, and implement during, a catastrophic interruption of water supplies including, but not limited to, a regional power outage, an earthquake, or other disaster.
(4) Additional, mandatory prohibitions against specific water use practices during water shortages, including, but not limited to, prohibiting the use of potable water for street cleaning.
(5) Consumption reduction methods in the most restrictive stages. Each urban water supplier may use any type of consumption reduction methods in its water shortage contingency analysis that would reduce water use, are

Appendix A Urban Water Management Planning Act Final
A ‐ 14
appropriate for its area, and have the ability to achieve a water use reduction consistent with up to a 50 percent reduction in water supply.
(6) Penalties or charges for excessive use, where applicable.
(7) An analysis of the impacts of each of the actions and conditions described in paragraphs (1) to (6), inclusive, on the revenues and expenditures of the urban water supplier, and proposed measures to overcome those impacts, such as the development of reserves and rate adjustments.
(8) A draft water shortage contingency resolution or ordinance.
(9) A mechanism for determining actual reductions in water use pursuant to the urban water shortage contingency analysis.
(b) Commencing with the urban water management plan update due July 1, 2016, for purposes of developing the water shortage contingency analysis pursuant to subdivision (a), the urban water supplier shall analyze and define water features that are artificially supplied with water, including ponds, lakes, waterfalls, and fountains, separately from swimming pools and spas, as defined in subdivision (a) of Section 115921 of the Health and Safety Code.
10633. The plan shall provide, to the extent available, information on recycled water and its potential for use as a water source in the service area of the urban water supplier. The preparation of the plan shall be coordinated with local water, wastewater, groundwater, and planning agencies that operate within the supplier's service area, and shall include all of the following:
(a) A description of the wastewater collection and treatment systems in the supplier's service area, including a quantification of the amount of wastewater collected and treated and the methods of wastewater disposal.
(b) A description of the quantity of treated wastewater that meets recycled water standards, is being discharged, and is otherwise available for use in a recycled water project.
(c) A description of the recycled water currently being used in the supplier's service area, including, but not limited to, the type, place, and quantity of use.
(d) A description and quantification of the potential uses of recycled water, including, but not limited to, agricultural irrigation, landscape irrigation, wildlife habitat enhancement, wetlands, industrial reuse, groundwater recharge, indirect potable reuse, and other appropriate uses, and a determination with regard to the technical and economic feasibility of serving those uses.

Appendix A Urban Water Management Planning Act Final
A ‐ 15
(e) The projected use of recycled water within the supplier's service area at the end of 5, 10, 15, and 20 years, and a description of the actual use of recycled water in comparison to uses previously projected pursuant to this subdivision.
(f) A description of actions, including financial incentives, which may be taken to encourage the use of recycled water, and the projected results of these actions in terms of acre-feet of recycled water used per year.
(g) A plan for optimizing the use of recycled water in the supplier's service area, including actions to facilitate the installation of dual distribution systems, to promote recirculating uses, to facilitate the increased use of treated wastewater that meets recycled water standards, and to overcome any obstacles to achieving that increased use.
10634. The plan shall include information, to the extent practicable, relating to the quality of existing sources of water available to the supplier over the same five-year increments as described in subdivision (a) of Section 10631, and the manner in which water quality affects water management strategies and supply reliability.
Article 2.5. Water Service Reliability SECTION 10635
10635. (a) Every urban water supplier shall include, as part of its urban water management plan, an assessment of the reliability of its water service to its customers during normal, dry, and multiple dry water years. This water supply and demand assessment shall compare the total water supply sources available to the water supplier with the total projected water use over the next 20 years, in five-year increments, for a normal water year, a single dry water year, and multiple dry water years. The water service reliability assessment shall be based upon the information compiled pursuant to Section 10631, including available data from state, regional, or local agency population projections within the service area of the urban water supplier.
(b) The urban water supplier shall provide that portion of its urban water management plan prepared pursuant to this article to any city or county within which it provides water supplies no later than 60 days after the submission of its urban water management plan.
(c) Nothing in this article is intended to create a right or entitlement to water service or any specific level of water service.

Appendix A Urban Water Management Planning Act Final
A ‐ 16
(d) Nothing in this article is intended to change existing law concerning an urban water supplier's obligation to provide water service to its existing customers or to any potential future customers.
Article 3. Adoption and Implementation of Plans SECTION 10640-10645
10640. Every urban water supplier required to prepare a plan pursuant to this part shall prepare its plan pursuant to Article 2 (commencing with Section 10630). The supplier shall likewise periodically review the plan as required by Section 10621, and any amendments or changes required as a result of that review shall be adopted pursuant to this article.
10641. An urban water supplier required to prepare a plan may consult with, and obtain comments from, any public agency or state agency or any person who has special expertise with respect to water demand management methods and techniques.
10642. Each urban water supplier shall encourage the active involvement of diverse social, cultural, and economic elements of the population within the service area prior to and during the preparation of the plan. Prior to adopting a plan, the urban water supplier shall make the plan available for public inspection and shall hold a public hearing thereon. Prior to the hearing, notice of the time and place of hearing shall be published within the jurisdiction of the publicly owned water supplier pursuant to Section 6066 of the Government Code. The urban water supplier shall provide notice of the time and place of hearing to any city or county within which the supplier provides water supplies. A privately owned water supplier shall provide an equivalent notice within its service area.
After the hearing, the plan shall be adopted as prepared or as modified after the hearing.
10643. An urban water supplier shall implement its plan adopted pursuant to this chapter in accordance with the schedule set forth in its plan.
10644. (a) (1) An urban water supplier shall submit to the department, the California State Library, and any city or county within which the supplier provides water supplies a copy of its plan no later than 30 days after adoption. Copies of amendments or changes to the plans shall be submitted to the department, the California State Library, and any city or county within which the supplier provides water supplies within 30 days after adoption.
(2) The plan, or amendments to the plan, submitted to the department pursuant to paragraph (1) shall be submitted electronically and shall include any standardized forms, tables, or displays specified by the department.

Appendix A Urban Water Management Planning Act Final
A ‐ 17
(b) (1) Notwithstanding Section 10231.5 of the Government Code, the department shall prepare and submit to the Legislature, on or before December 31, in the years ending in six and one, a report summarizing the status of the plans adopted pursuant to this part.
The report prepared by the department shall identify the exemplary elements of the individual plans. The department shall provide a copy of the report to each urban water supplier that has submitted its plan to the department. The department shall also prepare reports and provide data for any legislative hearings designed to consider the effectiveness of plans submitted pursuant to this part.
(2) A report to be submitted pursuant to paragraph (1) shall be submitted in compliance with Section 9795 of the Government Code.
(c) (1) For the purpose of identifying the exemplary elements of the individual plans, the department shall identify in the report water demand management measures adopted and implemented by specific urban water suppliers, and identified pursuant to Section 10631, that achieve water savings significantly above the levels established by the department to meet the requirements of Section 10631.5.
(2) The department shall distribute to the panel convened pursuant to Section 10631.7 the results achieved by the implementation of those water demand management measures described in paragraph (1).
(3) The department shall make available to the public the standard the department will use to identify exemplary water demand management measures.
10645. Not later than 30 days after filing a copy of its plan with the department, the urban water supplier and the department shall make the plan available for public review during normal business hours.
Chapter 4. Miscellaneous Provisions
SECTION 10650-10656
10650. Any actions or proceedings to attack, review, set aside, void, or annul the acts or decisions of an urban water supplier on the grounds of noncompliance with this part shall be commenced as follows:
(a) An action or proceeding alleging failure to adopt a plan shall be commenced within 18 months after that adoption is required by this part.

Appendix A Urban Water Management Planning Act Final
A ‐ 18
(b) Any action or proceeding alleging that a plan, or action taken pursuant to the plan, does not comply with this part shall be commenced within 90 days after filing of the plan or amendment thereto pursuant to Section 10644 or the taking of that action.
10651. In any action or proceeding to attack, review, set aside, void, or annul a plan, or an action taken pursuant to the plan by an urban water supplier on the grounds of noncompliance with this part, the inquiry shall extend only to whether there was a prejudicial abuse of discretion. Abuse of discretion is established if the supplier has not proceeded in a manner required by law or if the action by the water supplier is not supported by substantial evidence.
10652. The California Environmental Quality Act (Division 13 (commencing with Section 21000) of the Public Resources Code) does not apply to the preparation and adoption of plans pursuant to this part or to the implementation of actions taken pursuant to Section 10632. Nothing in this part shall be interpreted as exempting from the California Environmental Quality Act any project that would significantly affect water supplies for fish and wildlife, or any project for implementation of the plan, other than projects implementing Section 10632, or any project for expanded or additional water supplies.
10653. The adoption of a plan shall satisfy any requirements of state law, regulation, or order, including those of the State Water Resources Control Board and the Public Utilities Commission, for the preparation of water management plans or conservation plans; provided, that if the State Water Resources Control Board or the Public Utilities Commission requires additional information concerning water conservation to implement its existing authority, nothing in this part shall be deemed to limit the board or the commission in obtaining that information. The requirements of this part shall be satisfied by any urban water demand management plan prepared to meet federal laws or regulations after the effective date of this part, and which substantially meets the requirements of this part, or by any existing urban water management plan which includes the contents of a plan required under this part.
10654. An urban water supplier may recover in its rates the costs incurred in preparing its plan and implementing the reasonable water conservation measures included in the plan. Any best water management practice that is included in the plan that is identified in the "Memorandum of Understanding Regarding Urban Water Conservation in California" is deemed to be reasonable for the purposes of this section.
10655. If any provision of this part or the application thereof to any person or circumstances is held invalid, that invalidity shall not affect other provisions or applications of this part which can be given effect without the invalid provision or application thereof, and to this end the provisions of this part are severable.
10656. An urban water supplier that does not prepare, adopt, and submit its urban water management plan to the department in accordance with this part, is ineligible to receive funding pursuant to Division 24 (commencing with Section 78500) or Division 26

Appendix A Urban Water Management Planning Act Final
A ‐ 19
(commencing with Section 79000), or receive drought assistance from the state until the urban water management plan is submitted pursuant to this article.

Appendix B Adoption Resolution and Related
Documentation
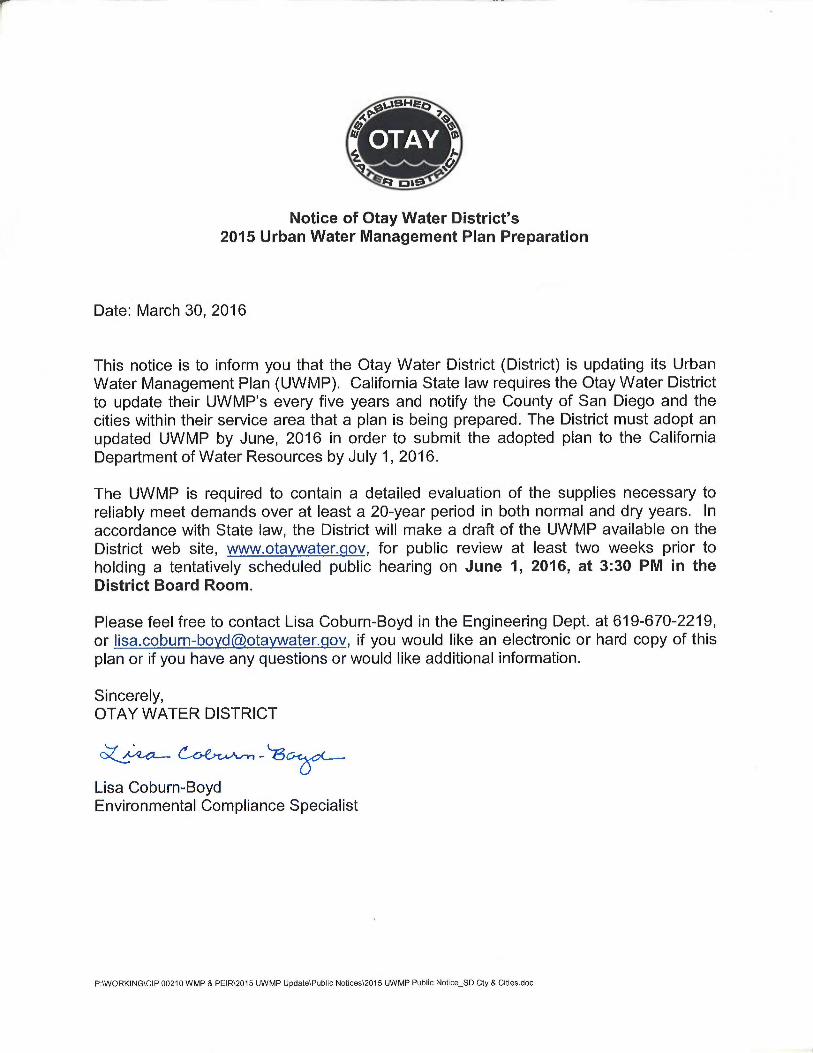
Notice of Otay Water District's2015 Urban Water Management Plan Preparation
Date: March 30, 2016
This notice is to inform you that the Otay Water District (District) is updating its UrbanWater Management Plan (UWMP). California State law requires the Otay Water Districtto update their UWMP's every five years and notify the County of San Diego and thecities within their service area that a plan is being prepared. The District must adopt anupdated UWMP by June, 2016 in order to submit the adopted plan to the CaliforniaDepartment of Water Resources by July 1, 2016.
The UWMP is required to contain a detailed evaluation of the supplies necessary toreliably meet demands over at least a 20-year period in both normal and dry years. Inaccordance with State law, the District will make a draft of the UWMP available on theDistrict web site, www.otaywater.gov, for public review at least two weeks prior toholding a tentatively scheduled public hearing on June 1, 2016, at 3:30 PM in theDistrict Board Room.
Please feel free to contact Lisa Coburn-Boyd in the Engineering Dept. at 619-670-2219,or lisa.coburn-boyd(a~otavwater.gov, if you would like an electronic or hard copy of thisplan or if you have any questions or would like additional information.
Sincerely,OTAY WATER DISTRICT
°~•"~a_-. ~~-ems,,, _ ̀ g ~~-
Lisa Coburn-BoydEnvironmental Compliance Specialist
P:\WORKING\CIP 00210 WMP & PEIR\2015 UWMP Update\Public Notices\2015 UWMP Public Notice_SD Cty & Cities.doc

Lisa Coburn-Boyd
From: Lisa Coburn-BoydSent: Wednesday, March 30, 2016 3:12 PMTo: Lardy, EricSubject: Otay Water District 2015 UWMP Update NoticeAttachments: 2015 UWMP Public Notice_SD Cty & Cities.pdf
Mr. Lardy,Please see the attached notification that the Otay Water District is reviewing its UWMP and will be releasing its draft
2015 UWMP Update for public review in mid-May, 2016. A copy of this notice has also been sent to you via U.S. Mail.
Thank you,
Lisd Coburn-BoydEnvironmental Compliance SpecialistOtay Water District619.670.2219
Lisa Coburn-Boyd
From: Lisa Coburn-BoydSent: Wednesday, March 30, 2016 3:10 PMTo: 'Fogg, Mindy'Subject: Otay Water District 2015 UWMP Update NoticeAttachments: 2015 UWMP Public Notice_SD Cty & Cities.pdf
Ms. Fogg,Please see the attached notification that the Otay Water District is reviewing its UWMP and will be releasing its draft
2015 UWMP Update for public review in mid-May, 2016. A copy of this notice has also been sent to you via U.S. Mail.
Thank you,
Lisa Coburn-Boys{Environmental Compliance Specialist
Otay Water District
619.670.2219

Lisa Coburn-Boyd
From: Lisa Coburn-BoydSent: Wednesday, March 30, 2016 3:05 PMTo: '[email protected]'Subject: Otay Water District 2015 UWMP Update NoticeAttachments: 2015 UWMP Public Notice_SD Cty & Cities.pdf
Dear Mr. Batchelder,
Please see the attached notification that the Otay Water District is reviewing its UWMP and will be releasing its draft
2015 UWMP Update for public review in mid-May, 2016. A copy of this notice has also been sent to you via U.S. Mail.
Thank you,
Lisa
Coburn-BoydEnvironmental Compliance Specialist
Otay Water District619.670.2219
Lisa Coburn-Boyd
From: Lisa Coburn-BoydSent: Wednesday, March 30, 2016 3:06 PMTo: '[email protected]'Subject: Otay Water District 2015 UWMP Update NoticeAttachments: 2015 UWMP Public Notice_SD Cty & Cities.pdf
Ms. Broughton,
Please see the attached notification that the Otay Water District is reviewing its UWMP and will be releasing its draft2015 UWMP Update for public review in mid-May, 2016. A copy of this notice has also been sent to you via U.S. Mail.
Thank you,
Lisa
Coburn-BoydEnvironmental Compliance SpecialistOtay Water District619.670.2219
lisa.coburn-boyd @otaywater.gov

Lisa Coburn-Boyd
From: Lisa Coburn-BoydSent: Wednesday, March 30, 2016 3:05 PMTo: '[email protected]'Subject: Otay Water District 2015 UWMP Update NoticeAttachments: 2015 UWMP Public Notice_SD Cty & Cities.pdf
Mr. Stoll,Please see the attached notification that the Otay Water District is reviewing its UWMP and will be releasing its draft2015 UWMP Update for public review in mid-May, 2016. A copy of this notice has also been sent to you via U.S. Mail.
Thank you,
Lisa Coburn-Boyc}Environmental Compliance SpecialistOtay Water District619.670.2219
lisa.coburn-boyd @otaywater.gov
Lisa Coburn-Boyd
From: Lisa Coburn-BoydSent: Wednesday, March 30, 2016 3:05 PMTo: '[email protected]'Subject: Otay Water District 2015 UWMP Update NoticeAttachments: 2015 UWMP Public Notice_SD Cty & Cities.pdf
Dear Mr. Murphy,Please see the attached notification that the Otay Water District is reviewing its UWMP and will be releasing its draft2015 UWMP Update for public review in mid-May, 2016. A copy of this notice has also been sent to you via U.S. Mail.
Thank you,
Lisa Coburn-Boys{Environmental Compliance SpecialistOtay Water District619.670.2219
Lisa Coburn-Boyd
From: Lisa Coburn-BoydSent: Wednesday, March 30, 2016 3:05 PMTo: Dana FriehaufSubject: Otay Water District 2015 UWMP Update NoticeAttachments: 2015 UWMP Public Notice_SD Cty & Cities.pdf
Ms. Friehauf,Please see the attached notification that the Otay Water District is reviewing its UWMP and will be releasing its draft
2015 UWMP Update for public review in mid-May, 2016. A copy of this notice has also been sent to you via U.S. Mail.
Thank you,
Lisa Coburn-Boys}Environmental Compliance Specialist
Otay Water District

Appendix C AWWA Water Loss Worksheet

THE FOLLOWING KEY APPLIES THROUGHOUT: Value can be entered by user
Value calculated based on input data
These cells contain recommended default values
Please begin by providing the following information, then proceed through each sheet in the workbook:
NAME OF CITY OR UTILITY: COUNTRY:
REPORTING YEAR: 2015 START DATE(MM/YYYY): 07/2014 END DATE(MM/YYYY): 06/2015
NAME OF CONTACT PERSON: E-MAIL:Ext.
PLEASE SELECT PREFERRED REPORTING UNITS FOR WATER VOLUME:
Click to advance to sheet… Click here: for help about units and conversions
Comments:
If you have questions or comments regarding the software please contact us at: [email protected]
Otay Water District
AWWA Water Loss Control Committee (WLCC) Free Water Audit Software v4.1
USE: The spreadsheet contains several separate worksheets. Sheets can be accessed using the tabs towards the bottom of thescreen, or by clicking the buttons on the left below. Descriptions of each sheet are also given below.
PURPOSE: This spreadsheet-based water audit tool is designed to help quantify and track water losses associated with water distribution systems and identify areas for improved efficiency and cost recovery. It provides a "top-down" summary water audit
format, and is not meant to take the place of a full-scale, comprehensive water audit format.
United States of America
The values entered in the Reporting Worksheet are used to populate the water balance
619-670-2219TELEPHONE:
Acre-feet
Enter the required data on this worksheet to calculate the water balance
Lisa Coburn-Boyd [email protected]
The current sheet
Depending on the confidence of audit inputs, a grading is assigned to the audit score
Use this sheet to understand terms used in the audit process
Use this sheet to interpret the results of the audit validity score and performance indicators
Diagrams depicting possible customer service connection configurations
Instructions
Reporting Worksheet
Loss Control Planning
Water Balance
Definitions
Copyright © 2010, American Water Works Association. All Rights Reserved. WAS v4.1
?
Grading Matrix
Add comments here to track additional
supporting information, sources or names of
participants
Service Connections
AWWA Water Loss Control Committee Instructions 1

Water Audit Report for: Otay Water DistrictReporting Year:
All volumes to be entered as: ACRE-FEET PER YEAR
WATER SUPPLIEDVolume from own sources: acre-ft/yr
Master meter error adjustment (enter positive value):Water imported: 8 30,298.900 acre-ft/yrWater exported: acre-ft/yr
WATER SUPPLIED: 30,298.900 acre-ft/yr.
AUTHORIZED CONSUMPTIONBilled metered: 8 29,529.400 acre-ft/yr
Billed unmetered: acre-ft/yrUnbilled metered: 7 126.300 acre-ft/yr Pcnt: Value:
Unbilled unmetered: 7 378.736 acre-ft/yr 1.25%
AUTHORIZED CONSUMPTION: 30,034.436 acre-ft/yr
WATER LOSSES (Water Supplied - Authorized Consumption) 264.464 acre-ft/yr
Apparent Losses Pcnt: Value:Unauthorized consumption: 75.747 acre-ft/yr 0.25%
Customer metering inaccuracies: 7 0.000 acre-ft/yr 2.50%Systematic data handling errors: 8 1.000 acre-ft/yr
Apparent Losses: 76.747
Real Losses (Current Annual Real Losses or CARL)Real Losses = Water Losses - Apparent Losses: 187.717 acre-ft/yr
WATER LOSSES: 264.464 acre-ft/yr
NON-REVENUE WATERNON-REVENUE WATER: 769.500 acre-ft/yr
= Total Water Loss + Unbilled Metered + Unbilled Unmetered
SYSTEM DATA
Length of mains: 10 727.0 milesNumber of active AND inactive service connections: 9 50,013
Connection density: 69 conn./mile mainAverage length of customer service line: 8 25.0 ft
Average operating pressure: 9 150.0 psi
COST DATA
Total annual cost of operating water system: 8 $49,527,220 $/YearCustomer retail unit cost (applied to Apparent Losses): 8 $5.44
Variable production cost (applied to Real Losses): 8 $1,143.00 $/acre-ft/yr
PERFORMANCE INDICATORS
Financial IndicatorsNon-revenue water as percent by volume of Water Supplied: 2.5%Non-revenue water as percent by cost of operating system: 2.0%
Annual cost of Apparent Losses: $181,865Annual cost of Real Losses: $214,560
Operational Efficiency Indicators
Apparent Losses per service connection per day: 1.37 gallons/connection/day
Real Losses per service connection per day*: 3.35 gallons/connection/day
Real Losses per length of main per day*: N/A
Real Losses per service connection per day per psi pressure: 0.02 gallons/connection/day/psi
Unavoidable Annual Real Losses (UARL): 723.30 million gallons/year
From Above, Real Losses = Current Annual Real Losses (CARL): 187.72 million gallons/year
0.08
* only the most applicable of these two indicators will be calculated
WATER AUDIT DATA VALIDITY SCORE:
PRIORITY AREAS FOR ATTENTION:
1: Water imported
2: Unauthorized consumption
3: Unbilled metered
$/100 cubic feet (ccf)
378.736
AWWA WLCC Free Water Audit Software: Reporting Worksheet
2015 7/2014 - 6/2015
<< Enter grading in column 'E'
acre-ft/yr
Based on the information provided, audit accuracy can be improved by addressing the following components:
*** YOUR SCORE IS: 77 out of 100 ***
Infrastructure Leakage Index (ILI) [CARL/UARL]:
Default option selected for unauthorized consumption - a grading of 5 is applied but not displayed
A weighted scale for the components of consumption and water loss is included in the calculation of the Water Audit Data Validity Score
Choose this option to enter a percentage of
billed metered consumption. This is NOT a default value
?
?
?
?
?
? Click to access definition
?
?
?
?
?
?
Back to Instructions
Please enter data in the white cells below. Where available, metered values should be used; if metered values are unavailable please estimate a value. Indicate your confidence in the accuracy of the
?
?
?
?
?
?
?
?
?
(pipe length between curbstop and customer meter or property boundary)
Use buttons to selectpercentage of water supplied
ORvalue
?Click here: for help using option buttons below
For more information, click here to see the Grading Matrix worksheet
?
Copyright © 2010, American Water Works Association. All Rights Reserved.
?
?
?
?
WAS v4.1
AWWA Water Loss Control Committee Reporting Worksheet 2

Water Audit Report For: Report Yr:
Otay Water District 2015
Water Exported
0.000Billed Metered Consumption (inc. water exported)
Revenue Water
29,529.400Own Sources
Authorized Consumption 29,529.400 Billed Unmetered Consumption 29,529.400
0.00030,034.436 Unbilled Metered Consumption
126.300
0.000 505.036 Unbilled Unmetered Consumption
378.736Water Supplied Unauthorized Consumption 769.500
Apparent Losses 75.74730,298.900 76.747 Customer Metering Inaccuracies
0.000Systematic Data Handling Errors
Water Losses 1.000
Water Imported 264.464 Leakage on Transmission and/or Distribution Mains
Real Losses Not broken down
30,298.900 187.717 Leakage and Overflows at Utility's Storage Tanks
Not broken downLeakage on Service Connections
Not broken down
Non-Revenue Water (NRW)
AWWA WLCC Free Water Audit Software: Water Balance
Billed Authorized Consumption
Unbilled Authorized Consumption
(Adjusted for known errors)
Billed Water Exported
Copyright © 2010, American Water Works Association. All Rights Reserved. WAS v4.1
AWWA Water Loss Control Committee Water Balance 3

n/a 1 2 3 4 5 6 7 8 9 10
Volume from own sources:
Select this grading only if the water
utility purchases/imports
all of its water resources (i.e. has no sources of its
own)
Less than 25% of water production sources are
metered, remaining sources are estimated. No regular
meter accuracy testing.
25% - 50% of treated water production sources are metered;
other sources estimated. No regular meter accuracy testing.
Conditions between 2 and 4
50% - 75% of treated water production sources are metered,
other sources estimated. Occasional meter accuracy testing
Conditions between 4 and 6
At least 75% of treated water production sources are metered, or at least 90% of the source flow is derived from metered sources.
Meter accuracy testing and/or electronic calibration conducted
annually. Less than 25% of tested meters are found outside of +/-
6% accuracy.
Conditions between 6 and 8
100% of treated water production sources are metered, meter
accuracy testing and electronic calibration conducted annually,
less than 10% of meters are found outside of +/- 6% accuracy
Conditions between 8 and 10
100% of treated water production sources are metered, meter
accuracy testing and electronic calibration conducted semi-annually, with less than 10%
found outside of +/- 3% accuracy.
Improvements to attain higher data grading for "Volume from
own Sources" component:
to qualify for 2:Organize efforts to begin to collect data for determining volume from own sources
to maintain 10:Standardize meter accuracy test
frequency to semi-annual, or more frequent, for all meters. Repair or replace meters outside of +/- 3%
accuracy. Continually investigate/pilot improving
metering technology.
Master meter error adjustment:
Select n/a only if the water utility fails to have meters on
its sources of supply, either its
own source, and/or imported
(purchased) water sources
Inventory information on meters and paper records of measured volumes in crude
condition; data error cannot be determined
No automatic datalogging of production volumes; daily
readings are scribed on paper records. Tank/storage elevation
changes are not employed in calculating "Volume from own sources" component. Data is adjusted only when grossly evident data error occurs.
Conditions between 2 and 4
Production meter data is logged automatically in electronic format
and reviewed at least on a monthly basis. "Volume from own
sources" tabulations include estimate of daily changes in
tanks/storage facilities. Meter data is adjusted when gross data errors occur, or occasional meter
testing deems this necessary.
Conditions between 4 and 6
Hourly production meter data logged automatically & reviewed on at least a weekly basis. Data adjusted to correct gross error
from equipment malfunction and error confirmed by meter accuracy
testing. Tank/storage facility elevation changes are
automatically used in calculating a balanced "Volume from own
sources" component.
Conditions between 6 and 8
Continuous production meter data logged automatically & reviewed daily. Data adjusted to correct
gross error from equipment malfunction & results of meter
accuracy testing. Tank/storage facility elevation changes are automatically used in "Volume from own sources" tabulations.
Conditions between 8 and 10
Computerized system (SCADA or similar) automatically balances
flows from all sources and storages; results reviewed daily.
Mass balance technique compares production meter data
to raw (untreated) water and treatment volumes to detect
anomalies. Regular calibrations between SCADA and sources meters ensures minimal data
transfer error.
Improvements to attain higher data grading for "Master meter error adjustment" component:
to qualify for 2:Develop plan to restructure
recordkeeping system to capture all flow data; set
procedure to review data daily to detect input errors
to maintain 10:Monitor meter innovations for
development of more accurate and less expensive flowmeters.
Continue to replace or repair meters as they perform outside of
desired accuracy limits.
Water Imported:
Select n/a if the water utility's supply is exclusively from
its own water resources (no bulk
purchased/ imported water)
Less than 25% of imported water sources are metered,
remaining sources are estimated. No regular meter
accuracy testing.
25% - 50% of imported water sources are metered; other
sources estimated. No regular meter accuracy testing.
Conditions between 2 and 4
50% - 75% of imported water sources are metered, other
sources estimated. Occasional meter accuracy testing
Conditions between 4 and 6
At least 75% of imported water sources are metered, meter
accuracy testing and/or electronic calibration conducted annually. Less than 25% of tested meters
are found outside of +/- 6% accuracy.
Conditions between 6 and 8
100% of imported water sources are metered, meter accuracy
testing and/or electronic calibration conducted annually,
less than 10% of meters are found outside of +/- 6% accuracy
Conditions between 8 and 10
100% of imported water sources are metered, meter accuracy
testing and/or electronic calibration conducted semi-annually, with less than 10%
found outside of +/- 3% accuracy.
Improvements to attain higher data grading for "Water
Imported Volume" component:
to qualify for 2:Review bulk water purchase
agreements with partner suppliers; confirm
requirements for use and maintenance of accurate
metering. Identify needs for new or replacement meters
with goal to meter all imported water sources.
to maintain 10:Standardize meter accuracy test
frequency to semi-annual, or more frequent, for all meters. Repair or replace meters outside of +/- 3%
accuracy. Continually investigate/pilot improving
metering technology.
to qualify for 10:Maintain annual meter accuracy testing for all
meters. Repair or replace meters outside of +/- 6% accuracy. Investigate new meter
technology; pilot one or more replacements with innovative meters in attempt to improve
meter accuracy.
to qualify for 4:Locate all water production sources on maps and in field, launch meter accuracy testing for
existing meters, begin to install meters on unmetered water production sources and
replace any obsolete/defective meters
to qualify for 6:Formalize annual meter accuracy testing for all source meters. Complete installation of meters
on unmetered water production sources and complete replacement of all obsolete/defective
meters.
to qualify for 8:Conduct annual meter accuracy testing on all meters. Complete project to install new, or
replace defective existing, meters so that entire production meter population is metered. Repair or replace meters outside of +/- 6% accuracy.
to qualify for 10:Link all production and tank/storage facility
elevation change data to a Supervisory Control & Data Acquisition (SCADA) System, or similar computerized monitoring/control system, and establish automatic flow balancing algorithm and regularly calibrate between SCADA and
source meters.
to qualify for 4:Install automatic datalogging equipment on production meters. Identify tanks/storage
facilities and include estimated daily volume of water added to, or subtracted from, "Water Supplied" volume based upon changes in
storage
AWWA WLCC Free Water Audit Software: Grading Matrix
In the Reporting Worksheet, grades were assigned to each component of the audit to describe the confidence and accuracy of the input data. The grading assigned to each audit component and the corresponding recommended improvements and actions are highlighted in yellow. Audit accuracy is likely to be improved by prioritizing those items shown in red
Grading
to qualify for 6:Review hourly production meter data for gross
error on, at least, a weekly basis. Begin to install instrumentation on tanks/storage facilities
to record elevation changes. Use daily net storage change to balance flows in calculating
"Water Supplied" volume.
to qualify for 8:Complete installation of elevation
instrumentation on all tanks/storage facilities. Continue to use daily net storage change in
calculating balanced "Volume from own sources" component. Adjust production meter data for gross error and inaccuracy confirmed
by testing.
to qualify for 10:Maintain annual meter accuracy testing for all
meters. Repair or replace meters outside of +/- 6% accuracy. Investigate new meter
technology; pilot one or more replacements with innovative meters in attempt to improve
meter accuracy.
To qualify for 4:Locate all imported water sources on maps and
in field, launch meter accuracy testing for existing meters, begin to install meters on
unmetered imported water interconnections and replace obsolete/defective meters
to qualify for 6:Formalize annual meter accuracy testing for all imported water meters. Continue installation of
meters on unmetered exported water interconnections and replacement of
obsolete/defective meters.
to qualify for 8:Complete project to install new, or replace
defective, meters on all imported water interconnections. Maintain annual meter
accuracy testing for all imported water meters. Repair or replace meters outside of +/- 6%
accuracy.
Back to InstructionsCopyright © 2010, American Water Works Association. All Rights Reserved. WASv 4.1
Back to Instructions
AWWA Water Loss Control Committee Grading Matrix 4
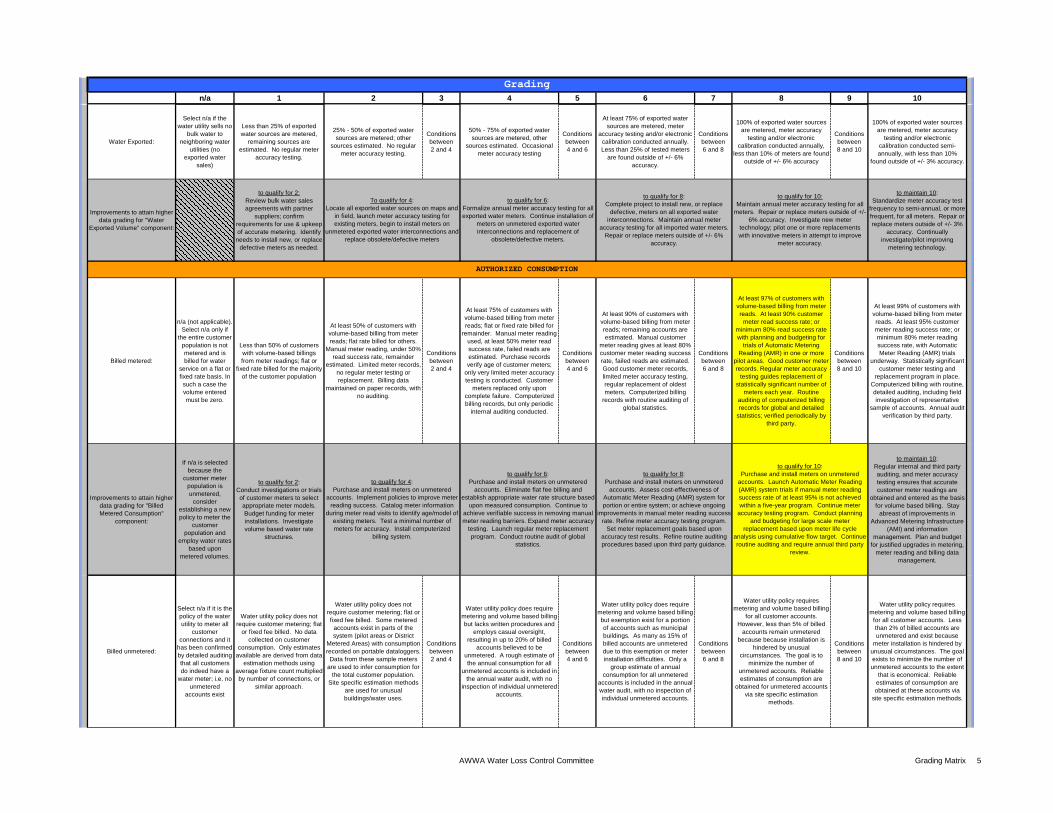
n/a 1 2 3 4 5 6 7 8 9 10
Grading
Water Exported:
Select n/a if the water utility sells no
bulk water to neighboring water
utilities (no exported water
sales)
Less than 25% of exported water sources are metered,
remaining sources are estimated. No regular meter
accuracy testing.
25% - 50% of exported water sources are metered; other
sources estimated. No regular meter accuracy testing.
Conditions between 2 and 4
50% - 75% of exported water sources are metered, other
sources estimated. Occasional meter accuracy testing
Conditions between 4 and 6
At least 75% of exported water sources are metered, meter
accuracy testing and/or electronic calibration conducted annually. Less than 25% of tested meters
are found outside of +/- 6% accuracy.
Conditions between 6 and 8
100% of exported water sources are metered, meter accuracy
testing and/or electronic calibration conducted annually,
less than 10% of meters are found outside of +/- 6% accuracy
Conditions between 8 and 10
100% of exported water sources are metered, meter accuracy
testing and/or electronic calibration conducted semi-annually, with less than 10%
found outside of +/- 3% accuracy.
Improvements to attain higher data grading for "Water
Exported Volume" component:
to qualify for 2:Review bulk water sales agreements with partner
suppliers; confirm requirements for use & upkeep of accurate metering. Identify
needs to install new, or replace defective meters as needed.
to maintain 10:Standardize meter accuracy test
frequency to semi-annual, or more frequent, for all meters. Repair or replace meters outside of +/- 3%
accuracy. Continually investigate/pilot improving
metering technology.
Billed metered:
n/a (not applicable). Select n/a only if
the entire customer population is not metered and is billed for water
service on a flat or fixed rate basis. In such a case the volume entered must be zero.
Less than 50% of customers with volume-based billings from meter readings; flat or
fixed rate billed for the majority of the customer population
At least 50% of customers with volume-based billing from meter reads; flat rate billed for others.
Manual meter reading, under 50% read success rate, remainder
estimated. Limited meter records, no regular meter testing or replacement. Billing data
maintained on paper records, with no auditing.
Conditions between 2 and 4
At least 75% of customers with volume-based billing from meter reads; flat or fixed rate billed for
remainder. Manual meter reading used, at least 50% meter read success rate, failed reads are estimated. Purchase records verify age of customer meters;
only very limited meter accuracy testing is conducted. Customer
meters replaced only upon complete failure. Computerized billing records, but only periodic
internal auditing conducted.
Conditions between 4 and 6
At least 90% of customers with volume-based billing from meter reads; remaining accounts are estimated. Manual customer
meter reading gives at least 80% customer meter reading success rate, failed reads are estimated. Good customer meter records, limited meter accuracy testing, regular replacement of oldest meters. Computerized billing
records with routine auditing of global statistics.
Conditions between 6 and 8
At least 97% of customers with volume-based billing from meter reads. At least 90% customer
meter read success rate; or minimum 80% read success rate with planning and budgeting for
trials of Automatic Metering Reading (AMR) in one or more
pilot areas. Good customer meter records. Regular meter accuracy
testing guides replacement of statistically significant number of
meters each year. Routine auditing of computerized billing records for global and detailed
statistics; verified periodically by third party.
Conditions between 8 and 10
At least 99% of customers with volume-based billing from meter reads. At least 95% customer meter reading success rate; or minimum 80% meter reading success rate, with Automatic Meter Reading (AMR) trials
underway. Statistically significant customer meter testing and
replacement program in place. Computerized billing with routine, detailed auditing, including field investigation of representative
sample of accounts. Annual audit verification by third party.
Improvements to attain higher data grading for "Billed Metered Consumption"
component:
If n/a is selected because the
customer meter population is unmetered,
consider establishing a new policy to meter the
customer population and
employ water rates based upon
metered volumes.
to qualify for 2:Conduct investigations or trials of customer meters to select appropriate meter models. Budget funding for meter installations. Investigate volume based water rate
structures.
to maintain 10:Regular internal and third party auditing, and meter accuracy testing ensures that accurate customer meter readings are
obtained and entered as the basis for volume based billing. Stay
abreast of improvements in Advanced Metering Infrastructure
(AMI) and information management. Plan and budget
for justified upgrades in metering, meter reading and billing data
management.
Billed unmetered:
Select n/a if it is the policy of the water utility to meter all
customer connections and it
has been confirmed by detailed auditing that all customers do indeed have a
water meter; i.e. no unmetered
accounts exist
Water utility policy does not require customer metering; flat
or fixed fee billed. No data collected on customer
consumption. Only estimates available are derived from data
estimation methods using average fixture count multiplied by number of connections, or
similar approach.
Water utility policy does not require customer metering; flat or fixed fee billed. Some metered
accounts exist in parts of the system (pilot areas or District
Metered Areas) with consumption recorded on portable dataloggers.
Data from these sample meters are used to infer consumption for
the total customer population. Site specific estimation methods
are used for unusual buildings/water uses.
Conditions between 2 and 4
Water utility policy does require metering and volume based billing but lacks written procedures and
employs casual oversight, resulting in up to 20% of billed
accounts believed to be unmetered. A rough estimate of the annual consumption for all
unmetered accounts is included in the annual water audit, with no
inspection of individual unmetered accounts.
Conditions between 4 and 6
Water utility policy does require metering and volume based billing but exemption exist for a portion of accounts such as municipal buildings. As many as 15% of billed accounts are unmetered due to this exemption or meter installation difficulties. Only a
group estimate of annual consumption for all unmetered
accounts is included in the annual water audit, with no inspection of individual unmetered accounts.
Conditions between 6 and 8
Water utility policy requires metering and volume based billing
for all customer accounts. However, less than 5% of billed
accounts remain unmetered because because installation is
hindered by unusual circumstances. The goal is to
minimize the number of unmetered accounts. Reliable estimates of consumption are
obtained for unmetered accounts via site specific estimation
methods.
Conditions between 8 and 10
Water utility policy requires metering and volume based billing
for all customer accounts. Less than 2% of billed accounts are unmetered and exist because
meter installation is hindered by unusual circumstances. The goal exists to minimize the number of unmetered accounts to the extent
that is economical. Reliable estimates of consumption are obtained at these accounts via
site specific estimation methods.
to qualify for 4:Purchase and install meters on unmetered
accounts. Implement policies to improve meter reading success. Catalog meter information
during meter read visits to identify age/model of existing meters. Test a minimal number of meters for accuracy. Install computerized
billing system.
to qualify for 6:Purchase and install meters on unmetered
accounts. Eliminate flat fee billing and establish appropriate water rate structure based
upon measured consumption. Continue to achieve verifiable success in removing manual meter reading barriers. Expand meter accuracy
testing. Launch regular meter replacement program. Conduct routine audit of global
statistics.
to qualify for 8:Purchase and install meters on unmetered
accounts. Assess cost-effectiveness of Automatic Meter Reading (AMR) system for portion or entire system; or achieve ongoing
improvements in manual meter reading success rate. Refine meter accuracy testing program.
Set meter replacement goals based upon accuracy test results. Refine routine auditing procedures based upon third party guidance.
to qualify for 10:Purchase and install meters on unmetered
accounts. Launch Automatic Meter Reading (AMR) system trials if manual meter reading success rate of at least 95% is not achieved within a five-year program. Continue meter
accuracy testing program. Conduct planning and budgeting for large scale meter
replacement based upon meter life cycle analysis using cumulative flow target. Continue routine auditing and require annual third party
review.
To qualify for 4:Locate all exported water sources on maps and
in field, launch meter accuracy testing for existing meters, begin to install meters on
unmetered exported water interconnections and replace obsolete/defective meters
to qualify for 6:Formalize annual meter accuracy testing for all exported water meters. Continue installation of
meters on unmetered exported water interconnections and replacement of
obsolete/defective meters.
to qualify for 8:Complete project to install new, or replace
defective, meters on all exported water interconnections. Maintain annual meter
accuracy testing for all imported water meters. Repair or replace meters outside of +/- 6%
accuracy.
to qualify for 10:Maintain annual meter accuracy testing for all
meters. Repair or replace meters outside of +/- 6% accuracy. Investigate new meter
technology; pilot one or more replacements with innovative meters in attempt to improve
meter accuracy.
AUTHORIZED CONSUMPTION
AWWA Water Loss Control Committee Grading Matrix 5

n/a 1 2 3 4 5 6 7 8 9 10
Grading
Improvements to attain higher data grading for "Billed
Unmetered Consumption" component:
to qualify for 2: Investigate a new water utility policy to require metering of
the customer population, and a reduction of unmetered accounts. Conduct pilot
metering project by installing water meters in small sample
of customer accounts and datalogging the water
consumption.
to maintain 10: Continue to refine estimation
methods for unmetered consumption and explore means
to establish metering, for as many billed unmetered accounts as is
economically feasible.
Unbilled metered:
select n/a if all billing-exempt consumption is
unmetered.
Billing practices exempt certain accounts, such as municipal buildings, but written policies
do not exist; and a reliable count of unbilled metered
accounts is unavailable. Meter upkeep and meter reading on these accounts is rare and not considered a priority. Due to
poor recordkeeping and lack of auditing, water consumption
for all such accounts is purely guesstimated.
Billing practices exempt certain accounts, such as municipal buildings, but only scattered,
dated written directives exist to justify this practice. A reliable
count of unbilled metered accounts is unavailable. Sporadic
meter replacement and meter reading occurs on an as-needed
basis. The total annual water consumption for all unbilled,
metered accounts is estimated based upon approximating the
number of accounts and assigning consumption from actively billed
accounts of same meter size.
Conditions between 2 and 4
Dated written procedures permit billing exemption for specific accounts, such as municipal properties, but are unclear
regarding certain other types of accounts. Meter reading is given
low priority and is sporadic. Consumption is quantified from meter readings where available.
The total number of unbilled, unmetered accounts must be
estimated along with consumption volumes.
Conditions between 4 and 6
Written policies regarding billing exemptions exist but adherence in practice is questionable. Metering and meter reading for municipal buildings is reliable but sporadic
for other unbilled metered accounts. Periodic auditing of such accounts is conducted.
Water consumption is quantified directly from meter readings
where available, but the majority of the consumption is estimated.
Conditions between 6 and 8
Written policy identifies the types of accounts granted a billing exemption. Customer meter
management and meter reading are considered secondary
priorities, but meter reading is conducted at least annually to
obtain consumption volumes for the annual water audit. High level auditing of billing records ensures
that a reliable census of such accounts exists.
Conditions between 8 and 10
Clearly written policy identifies the types of accounts given a billing
exemption, with emphasis on keeping such accounts to a minimum. Customer meter
management and meter reading for these accounts is given proper priority and is reliably conducted. Regular auditing confirms this.
Total water consumption for these accounts is taken from reliable readings from accurate meters.
Improvements to attain higher data grading for "Unbilled
metered Consumption" component:
to qualify for 2:Reassess the water utility's
policy allowing certain accounts to be granted a billing exemption. Draft an outline of a new written policy for billing
exemptions, with clear justification as to why any
accounts should be exempt from billing, and with the
intention to keep the number of such accounts to a minimum.
to maintain 10:Reassess philosophy in allowing
any water uses to go "unbilled". It is possible to meter and bill all
accounts, even if the fee charged for water consumption is
discounted or waived. Metering and billing all accounts ensures
that water consumption is tracked and water waste from plumbing leaks is detected and minimized.
Unbilled unmetered:
Extent of unbilled, unmetered consumption is unknown due to unclear policies and poor
recordkeeping. Total consumption is quantified
based upon a purely subjective estimate.
Clear extent of unbilled, unmetered consumption is
unknown, but a number of events are randomly documented each
year, confirming existence of such consumption, but without
sufficient documentation to quantify an accurate estimate of the annual volume consumed.
Conditions between 2 and 4
Extent of unbilled, unmetered consumption is partially known,
and procedures exist to document certain events such as
miscellaneous fire hydrant uses. Formulae is used to quantify the consumption from such events
(time running x typical flowrate x number of events).
Default value of 1.25% of system input
volume is employed
Coherent policies exist for some forms of unbilled, unmetered consumption but others await closer evaluation. Reasonable
recordkeeping for the managed uses exists and allows for annual
volumes to be quantified by inference, but unsupervised uses
are guesstimated.
Conditions between 6 and 8
Clear policies and good recordkeeping exist for some uses
(ex: unmetered fire connections registering consumption), but other uses (ex: miscellaneous
uses of fire hydrants) have limited oversight. Total consumption is a mix of well quantified use such as from formulae (time x typical flow)
or temporary meters, and relatively subjective estimates of
less regulated use.
Conditions between 8 and 10
Clear policies exist to identify permitted use of water in unbilled,
unmetered fashion, with the intention of minimizing this type of
consumption. Good records document each occurrence and
consumption is quantified via formulae (time x typical flow) or
use of temporary meters.
Improvements to attain higher data grading for "Unbilled Unmetered Consumption"
component:
to qualify for 5:Utilize accepted default value
of 1.25% of system input volume as an expedient means
to gain a reasonable quantification of this use.
to qualify for 2:Establish a policy regarding what water uses should be
allowed as unbilled and unmetered. Consider tracking
a small sample of one such use (ex: fire hydrant flushings).
to qualify for 5:Utilize accepted default value of 1.25% of system input volume as
expedient means to gain a reasonable quantification of all such use. This is particularly
appropriate for water utilities who are in the early stages of the
water auditing process.
to qualify for 6 or greater:
Finalize policy and
do field checks.
Proceed if top-down
audit exists and/or a
great volume of
such use is suspected.
to maintain 10:Continue to refine policy and procedures with intention of
reducing the number of allowable uses of water in unbilled and
unmetered fashion. Any uses that can feasibly become billed and metered should be converted
eventually.
to qualify for 4: Implement a new water utility policy requiring
customer metering. Expand pilot metering study to include several different meter types,
which will provide data for economic assessment of full scale metering options.
Assess sites with access difficulties to devise means to obtain water consumption volumes.
to qualify for 6:Budget for staff resources to review billing records to identify unmetered properties.
Specify metering needs and funding requirements to install sufficient meters to
significant reduce the number of unmetered accounts
to qualify for 8:Install customer meters on a full scale basis.
Refine metering policy and procedures to ensure that all accounts, including municipal
properties, are designated for meters. Implement procedures to obtain reliable
consumption estimate for unmetered accounts awaiting meter installation.
to qualify for 10:Continue customer meter installation
throughout the service area, with a goal to minimize unmetered accounts. Sustain the effort to investigate accounts with access difficulties to devise means to install water
meters or otherwise measure water consumption.
to qualify for 4:Review historic written directives and policy documents allowing certain accounts to be billing-exempt. Draft an outline of a written policy for billing exemptions, identify criteria
that grants an exemption, with a goal of keeping this number of accounts to a minimum.
to qualify for 6:Draft a new written policy regarding billing exemptions based upon consensus criteria
allowing this occurrence. Assign resources to audit meter records and billing records to obtain
census of unbilled metered accounts.
to qualify for 8:Communicate billing exemption policy
throughout the organization and implement procedures that ensure proper account
management. Conduct inspections of accounts confirmed in unbilled metered status and verify that accurate meters exist and are scheduled
for routine meter readings.
to qualify for 10:Ensure that meter management (meter
accuracy testing, meter replacement) and meter reading activities are accorded the same priority as billed accounts. Establish ongoing annual auditing process to ensure that water
consumption is reliably collected and provided to the annual water audit process.
APPARENT LOSSES
to qualify for 5:Utilize accepted default value of 1.25% of
system input volume as an expedient means to gain a reasonable quantification of this use.
to qualify for 4:Evaluate the documentation of events that have been observed. Meet with user groups (ex: for fire hydrants - fire departments, contractors to
ascertain their need for water from fire hydrants).
to qualify for 8:Assess water utility policy and procedures to
ensure that fire hydrant permits are issued for use by persons outside of the utility. Create
written procedures for use and documentation of fire hydrants by water utility personnel.
to qualify for 10:Refine written procedures to ensure that all
uses of unbilled, unmetered water are overseen by a structured permitting process managed by
water utility personnel. Reassess policy to determine if some of these uses have value in
being converted to billed and/or metered status.
AWWA Water Loss Control Committee Grading Matrix 6
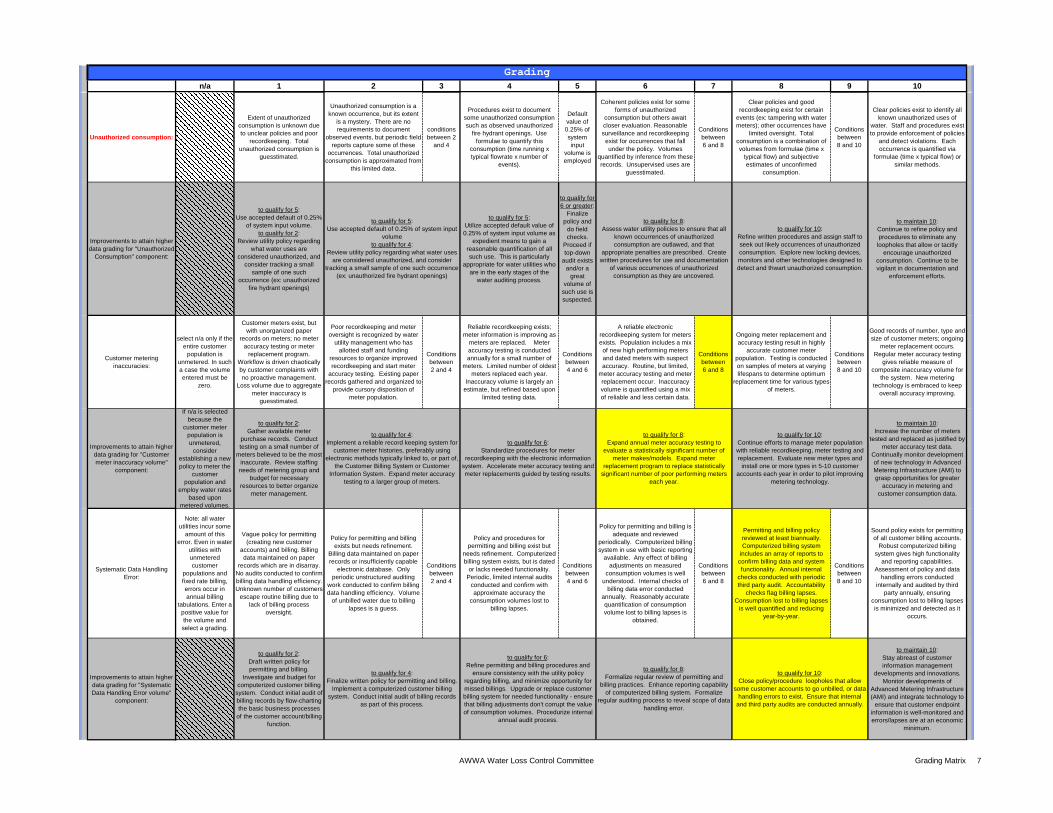
n/a 1 2 3 4 5 6 7 8 9 10
Grading
Unauthorized consumption:
Extent of unauthorized consumption is unknown due to unclear policies and poor
recordkeeping. Total unauthorized consumption is
guesstimated.
Unauthorized consumption is a known occurrence, but its extent
is a mystery. There are no requirements to document
observed events, but periodic field reports capture some of these
occurrences. Total unauthorized consumption is approximated from
this limited data.
conditions between 2
and 4
Procedures exist to document some unauthorized consumption such as observed unauthorized
fire hydrant openings. Use formulae to quantify this
consumption (time running x typical flowrate x number of
events).
Default value of 0.25% of system input
volume is employed
Coherent policies exist for some forms of unauthorized
consumption but others await closer evaluation. Reasonable surveillance and recordkeeping
exist for occurrences that fall under the policy. Volumes
quantified by inference from these records. Unsupervised uses are
guesstimated.
Conditions between 6 and 8
Clear policies and good recordkeeping exist for certain
events (ex: tampering with water meters); other occurrences have
limited oversight. Total consumption is a combination of volumes from formulae (time x
typical flow) and subjective estimates of unconfirmed
consumption.
Conditions between 8 and 10
Clear policies exist to identify all known unauthorized uses of
water. Staff and procedures exist to provide enforcement of policies
and detect violations. Each occurrence is quantified via
formulae (time x typical flow) or similar methods.
Improvements to attain higher data grading for "Unauthorized
Consumption" component:
to qualify for 5:Use accepted default of 0.25%
of system input volume.to qualify for 2:
Review utility policy regarding what water uses are
considered unauthorized, and consider tracking a small
sample of one such occurrence (ex: unauthorized
fire hydrant openings)
to qualify for 5:Utilize accepted default value of 0.25% of system input volume as
expedient means to gain a reasonable quantification of all such use. This is particularly
appropriate for water utilities who are in the early stages of the
water auditing process.
to qualify for 6 or greater:
Finalize policy and
do field checks.
Proceed if top-down
audit exists and/or a
great volume of
such use is suspected.
to maintain 10:Continue to refine policy and procedures to eliminate any
loopholes that allow or tacitly encourage unauthorized
consumption. Continue to be vigilant in documentation and
enforcement efforts.
Customer metering inaccuracies:
select n/a only if the entire customer
population is unmetered. In such a case the volume entered must be
zero.
Customer meters exist, but with unorganized paper
records on meters; no meter accuracy testing or meter
replacement program. Workflow is driven chaotically by customer complaints with no proactive management.
Loss volume due to aggregate meter inaccuracy is
guesstimated.
Poor recordkeeping and meter oversight is recognized by water
utility management who has allotted staff and funding
resources to organize improved recordkeeping and start meter
accuracy testing. Existing paper records gathered and organized to
provide cursory disposition of meter population.
Conditions between 2 and 4
Reliable recordkeeping exists; meter information is improving as
meters are replaced. Meter accuracy testing is conducted annually for a small number of
meters. Limited number of oldest meters replaced each year.
Inaccuracy volume is largely an estimate, but refined based upon
limited testing data.
Conditions between 4 and 6
A reliable electronic recordkeeping system for meters exists. Population includes a mix of new high performing meters and dated meters with suspect accuracy. Routine, but limited,
meter accuracy testing and meter replacement occur. Inaccuracy volume is quantified using a mix of reliable and less certain data.
Conditions between 6 and 8
Ongoing meter replacement and accuracy testing result in highly
accurate customer meter population. Testing is conducted on samples of meters at varying lifespans to determine optimum
replacement time for various types of meters.
Conditions between 8 and 10
Good records of number, type and size of customer meters; ongoing
meter replacement occurs. Regular meter accuracy testing
gives reliable measure of composite inaccuracy volume for
the system. New metering technology is embraced to keep
overall accuracy improving.
Improvements to attain higher data grading for "Customer meter inaccuracy volume"
component:
If n/a is selected because the
customer meter population is unmetered,
consider establishing a new policy to meter the
customer population and
employ water rates based upon
metered volumes.
to qualify for 2:Gather available meter
purchase records. Conduct testing on a small number of
meters believed to be the most inaccurate. Review staffing needs of metering group and
budget for necessary resources to better organize
meter management.
to maintain 10:Increase the number of meters
tested and replaced as justified by meter accuracy test data.
Continually monitor development of new technology in Advanced Metering Infrastructure (AMI) to grasp opportunities for greater
accuracy in metering and customer consumption data.
Systematic Data Handling Error:
Note: all water utilities incur some
amount of this error. Even in water
utilities with unmetered customer
populations and fixed rate billing, errors occur in annual billing
tabulations. Enter a positive value for the volume and select a grading.
Vague policy for permitting (creating new customer
accounts) and billing. Billing data maintained on paper
records which are in disarray. No audits conducted to confirm billing data handling efficiency. Unknown number of customers
escape routine billing due to lack of billing process
oversight.
Policy for permitting and billing exists but needs refinement.
Billing data maintained on paper records or insufficiently capable
electronic database. Only periodic unstructured auditing
work conducted to confirm billing data handling efficiency. Volume
of unbilled water due to billing lapses is a guess.
Conditions between 2 and 4
Policy and procedures for permitting and billing exist but
needs refinement. Computerized billing system exists, but is dated
or lacks needed functionality. Periodic, limited internal audits
conducted and confirm with approximate accuracy the
consumption volumes lost to billing lapses.
Conditions between 4 and 6
Policy for permitting and billing is adequate and reviewed
periodically. Computerized billing system in use with basic reporting
available. Any effect of billing adjustments on measured
consumption volumes is well understood. Internal checks of
billing data error conducted annually. Reasonably accurate quantification of consumption volume lost to billing lapses is
obtained.
Conditions between 6 and 8
Permitting and billing policy reviewed at least biannually. Computerized billing system
includes an array of reports to confirm billing data and system functionality. Annual internal
checks conducted with periodic third party audit. Accountability
checks flag billing lapses. Consumption lost to billing lapses
is well quantified and reducing year-by-year.
Conditions between 8 and 10
Sound policy exists for permitting of all customer billing accounts.
Robust computerized billing system gives high functionality
and reporting capabilities. Assessment of policy and data
handling errors conducted internally and audited by third
party annually, ensuring consumption lost to billing lapses is minimized and detected as it
occurs.
Improvements to attain higher data grading for "Systematic Data Handling Error volume"
component:
to qualify for 2:Draft written policy for permitting and billing.
Investigate and budget for computerized customer billing
system. Conduct initial audit of billing records by flow-charting the basic business processes
of the customer account/billing function.
to maintain 10:Stay abreast of customer information management
developments and innovations. Monitor developments of
Advanced Metering Infrastructure (AMI) and integrate technology to
ensure that customer endpoint information is well-monitored and errors/lapses are at an economic
minimum.
to qualify for 8:Formalize regular review of permitting and
billing practices. Enhance reporting capability of computerized billing system. Formalize
regular auditing process to reveal scope of data handling error.
to qualify for 10:Close policy/procedure loopholes that allow
some customer accounts to go unbilled, or data handling errors to exist. Ensure that internal
and third party audits are conducted annually.
to qualify for 4:Implement a reliable record keeping system for
customer meter histories, preferably using electronic methods typically linked to, or part of,
the Customer Billing System or Customer Information System. Expand meter accuracy
testing to a larger group of meters.
to qualify for 6:Standardize procedures for meter
recordkeeping with the electronic information system. Accelerate meter accuracy testing and meter replacements guided by testing results.
to qualify for 8:Expand annual meter accuracy testing to
evaluate a statistically significant number of meter makes/models. Expand meter
replacement program to replace statistically significant number of poor performing meters
each year.
to qualify for 10:Continue efforts to manage meter population with reliable recordkeeping, meter testing and replacement. Evaluate new meter types and
install one or more types in 5-10 customer accounts each year in order to pilot improving
metering technology.
to qualify for 4:Finalize written policy for permitting and billing.
Implement a computerized customer billing system. Conduct initial audit of billing records
as part of this process.
to qualify for 6:Refine permitting and billing procedures and
ensure consistency with the utility policy regarding billing, and minimize opportunity for missed billings. Upgrade or replace customer billing system for needed functionality - ensure that billing adjustments don't corrupt the value of consumption volumes. Procedurize internal
annual audit process.
to qualify for 5:Use accepted default of 0.25% of system input
volumeto qualify for 4:
Review utility policy regarding what water uses are considered unauthorized, and consider
tracking a small sample of one such occurrence (ex: unauthorized fire hydrant openings)
to quality for 8:Assess water utility policies to ensure that all
known occurrences of unauthorized consumption are outlawed, and that
appropriate penalties are prescribed. Create written procedures for use and documentation
of various occurrences of unauthorized consumption as they are uncovered.
to qualify for 10:Refine written procedures and assign staff to seek out likely occurrences of unauthorized consumption. Explore new locking devices, monitors and other technologies designed to detect and thwart unauthorized consumption.
AWWA Water Loss Control Committee Grading Matrix 7
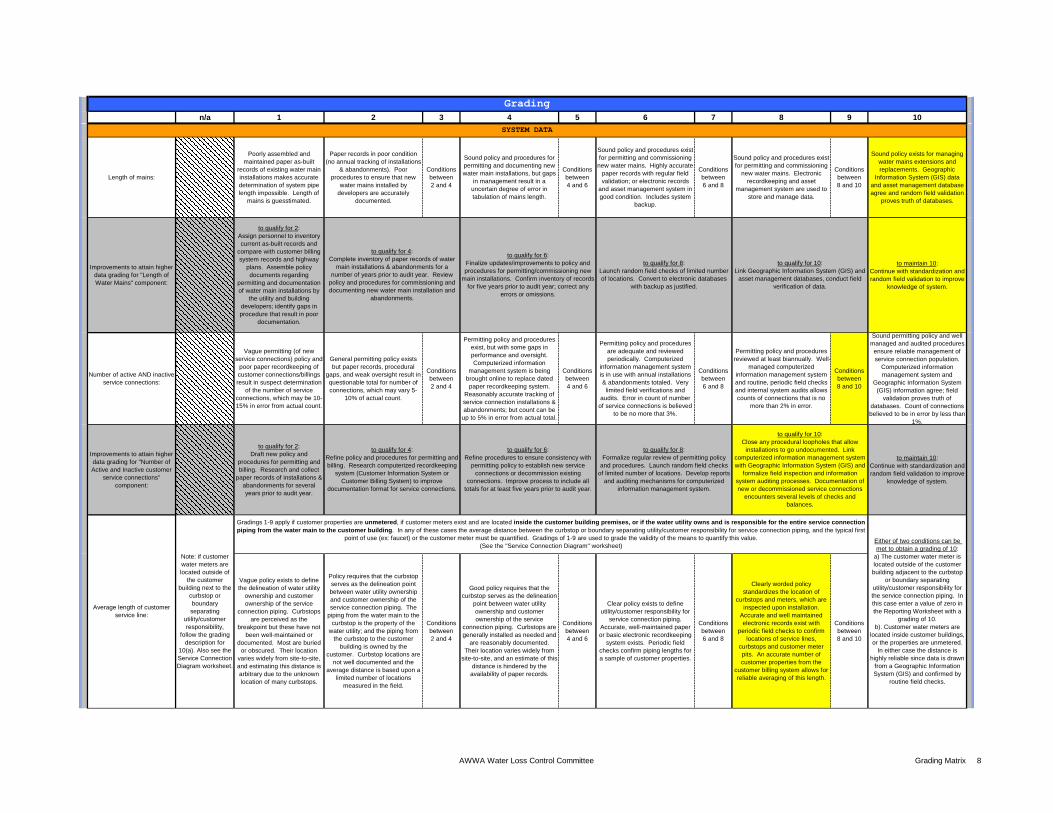
n/a 1 2 3 4 5 6 7 8 9 10
Grading
Length of mains:
Poorly assembled and maintained paper as-built
records of existing water main installations makes accurate determination of system pipe length impossible. Length of
mains is guesstimated.
Paper records in poor condition (no annual tracking of installations
& abandonments). Poor procedures to ensure that new
water mains installed by developers are accurately
documented.
Conditions between 2 and 4
Sound policy and procedures for permitting and documenting new water main installations, but gaps
in management result in a uncertain degree of error in tabulation of mains length.
Conditions between 4 and 6
Sound policy and procedures exist for permitting and commissioning
new water mains. Highly accurate paper records with regular field validation; or electronic records
and asset management system in good condition. Includes system
backup.
Conditions between 6 and 8
Sound policy and procedures exist for permitting and commissioning
new water mains. Electronic recordkeeping and asset
management system are used to store and manage data.
Conditions between 8 and 10
Sound policy exists for managing water mains extensions and replacements. Geographic
Information System (GIS) data and asset management database agree and random field validation
proves truth of databases.
Improvements to attain higher data grading for "Length of Water Mains" component:
to qualify for 2:Assign personnel to inventory current as-built records and
compare with customer billing system records and highway
plans. Assemble policy documents regarding
permitting and documentation of water main installations by
the utility and building developers; identify gaps in procedure that result in poor
documentation.
to maintain 10:Continue with standardization and random field validation to improve
knowledge of system.
Number of active AND inactive service connections:
Vague permitting (of new service connections) policy and
poor paper recordkeeping of customer connections/billings result in suspect determination
of the number of service connections, which may be 10-15% in error from actual count.
General permitting policy exists but paper records, procedural
gaps, and weak oversight result in questionable total for number of connections, which may vary 5-
10% of actual count.
Conditions between 2 and 4
Permitting policy and procedures exist, but with some gaps in performance and oversight. Computerized information
management system is being brought online to replace dated paper recordkeeping system.
Reasonably accurate tracking of service connection installations & abandonments; but count can be
up to 5% in error from actual total.
Conditions between 4 and 6
Permitting policy and procedures are adequate and reviewed periodically. Computerized
information management system is in use with annual installations & abandonments totaled. Very
limited field verifications and audits. Error in count of number
of service connections is believed to be no more that 3%.
Conditions between 6 and 8
Permitting policy and procedures reviewed at least biannually. Well-
managed computerized information management system and routine, periodic field checks and internal system audits allows counts of connections that is no
more than 2% in error.
Conditions between 8 and 10
Sound permitting policy and well managed and audited procedures
ensure reliable management of service connection population.
Computerized information management system and
Geographic Information System (GIS) information agree; field
validation proves truth of databases. Count of connections believed to be in error by less than
1%.
Improvements to attain higher data grading for "Number of Active and Inactive customer
service connections" component:
to qualify for 2:Draft new policy and
procedures for permitting and billing. Research and collect
paper records of installations & abandonments for several years prior to audit year.
to maintain 10:Continue with standardization and random field validation to improve
knowledge of system.
Vague policy exists to define the delineation of water utility
ownership and customer ownership of the service
connection piping. Curbstops are perceived as the
breakpoint but these have not been well-maintained or
documented. Most are buried or obscured. Their location
varies widely from site-to-site, and estimating this distance is arbitrary due to the unknown location of many curbstops.
Policy requires that the curbstop serves as the delineation point between water utility ownership and customer ownership of the service connection piping. The
piping from the water main to the curbstop is the property of the
water utility; and the piping from the curbstop to the customer
building is owned by the customer. Curbstop locations are
not well documented and the average distance is based upon a
limited number of locations measured in the field.
Conditions between 2 and 4
Good policy requires that the curbstop serves as the delineation
point between water utility ownership and customer ownership of the service
connection piping. Curbstops are generally installed as needed and
are reasonably documented. Their location varies widely from
site-to-site, and an estimate of this distance is hindered by the
availability of paper records.
Conditions between 4 and 6
Clear policy exists to define utility/customer responsibility for
service connection piping. Accurate, well-maintained paper or basic electronic recordkeeping
system exists. Periodic field checks confirm piping lengths for a sample of customer properties.
Conditions between 6 and 8
Clearly worded policy standardizes the location of
curbstops and meters, which are inspected upon installation.
Accurate and well maintained electronic records exist with
periodic field checks to confirm locations of service lines,
curbstops and customer meter pits. An accurate number of customer properties from the
customer billing system allows for reliable averaging of this length.
Conditions between 8 and 10
Average length of customer service line:
Note: if customer water meters are located outside of
the customer building next to the
curbstop or boundary separating
utility/customer responsibility,
follow the grading description for
10(a). Also see the Service Connection Diagram worksheet.
Either of two conditions can be met to obtain a grading of 10:
a) The customer water meter is located outside of the customer building adjacent to the curbstop
or boundary separating utility/customer responsibility for the service connection piping. In this case enter a value of zero in the Reporting Worksheet with a
grading of 10.b). Customer water meters are
located inside customer buildings, or the properties are unmetered.
In either case the distance is highly reliable since data is drawn
from a Geographic Information System (GIS) and confirmed by
routine field checks.
Gradings 1-9 apply if customer properties are unmetered, if customer meters exist and are located inside the customer building premises, or if the water utility owns and is responsible for the entire service connection piping from the water main to the customer building. In any of these cases the average distance between the curbstop or boundary separating utility/customer responsibility for service connection piping, and the typical first
point of use (ex: faucet) or the customer meter must be quantified. Gradings of 1-9 are used to grade the validity of the means to quantify this value.(See the "Service Connection Diagram" worksheet)
to qualify for 4:Refine policy and procedures for permitting and billing. Research computerized recordkeeping
system (Customer Information System or Customer Billing System) to improve
documentation format for service connections.
to qualify for 6:Refine procedures to ensure consistency with
permitting policy to establish new service connections or decommission existing
connections. Improve process to include all totals for at least five years prior to audit year.
to qualify for 8:Formalize regular review of permitting policy
and procedures. Launch random field checks of limited number of locations. Develop reports
and auditing mechanisms for computerized information management system.
to qualify for 10:Close any procedural loopholes that allow
installations to go undocumented. Link computerized information management system with Geographic Information System (GIS) and
formalize field inspection and information system auditing processes. Documentation of new or decommissioned service connections
encounters several levels of checks and balances.
SYSTEM DATA
to qualify for 4:Complete inventory of paper records of water
main installations & abandonments for a number of years prior to audit year. Review
policy and procedures for commissioning and documenting new water main installation and
abandonments.
to qualify for 6:Finalize updates/improvements to policy and procedures for permitting/commissioning new
main installations. Confirm inventory of records for five years prior to audit year; correct any
errors or omissions.
to qualify for 8:Launch random field checks of limited number of locations. Convert to electronic databases
with backup as justified.
to qualify for 10:Link Geographic Information System (GIS) and
asset management databases, conduct field verification of data.
AWWA Water Loss Control Committee Grading Matrix 8
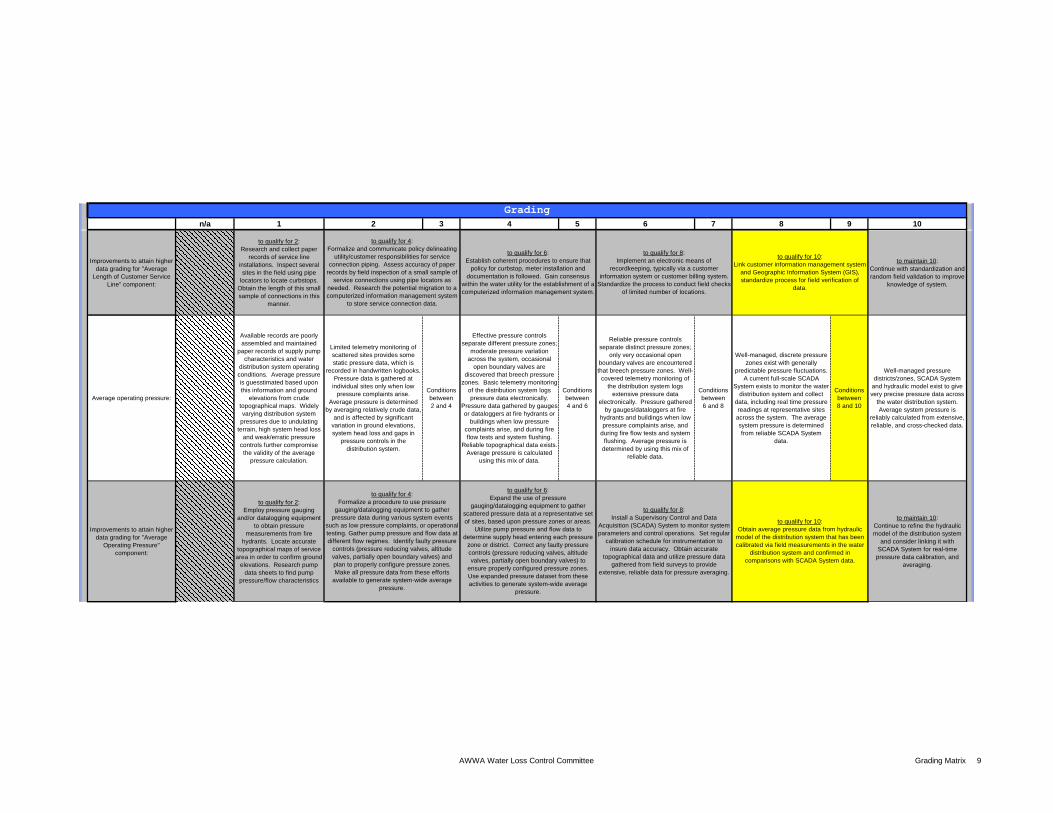
n/a 1 2 3 4 5 6 7 8 9 10
Grading
Improvements to attain higher data grading for "Average
Length of Customer Service Line" component:
to qualify for 2:Research and collect paper
records of service line installations. Inspect several sites in the field using pipe
locators to locate curbstops. Obtain the length of this small sample of connections in this
manner.
to maintain 10:Continue with standardization and random field validation to improve
knowledge of system.
Average operating pressure:
Available records are poorly assembled and maintained
paper records of supply pump characteristics and water
distribution system operating conditions. Average pressure is guesstimated based upon this information and ground
elevations from crude topographical maps. Widely varying distribution system
pressures due to undulating terrain, high system head loss
and weak/erratic pressure controls further compromise the validity of the average
pressure calculation.
Limited telemetry monitoring of scattered sites provides some static pressure data, which is
recorded in handwritten logbooks. Pressure data is gathered at
individual sites only when low pressure complaints arise.
Average pressure is determined by averaging relatively crude data,
and is affected by significant variation in ground elevations, system head loss and gaps in
pressure controls in the distribution system.
Conditions between 2 and 4
Effective pressure controls separate different pressure zones;
moderate pressure variation across the system, occasional
open boundary valves are discovered that breech pressure
zones. Basic telemetry monitoring of the distribution system logs pressure data electronically.
Pressure data gathered by gauges or dataloggers at fire hydrants or
buildings when low pressure complaints arise, and during fire flow tests and system flushing.
Reliable topographical data exists. Average pressure is calculated
using this mix of data.
Conditions between 4 and 6
Reliable pressure controls separate distinct pressure zones;
only very occasional open boundary valves are encountered that breech pressure zones. Well-
covered telemetry monitoring of the distribution system logs
extensive pressure data electronically. Pressure gathered
by gauges/dataloggers at fire hydrants and buildings when low pressure complaints arise, and
during fire flow tests and system flushing. Average pressure is
determined by using this mix of reliable data.
Conditions between 6 and 8
Well-managed, discrete pressure zones exist with generally
predictable pressure fluctuations. A current full-scale SCADA
System exists to monitor the water distribution system and collect
data, including real time pressure readings at representative sites
across the system. The average system pressure is determined from reliable SCADA System
data.
Conditions between 8 and 10
Well-managed pressure districts/zones, SCADA System
and hydraulic model exist to give very precise pressure data across
the water distribution system. Average system pressure is
reliably calculated from extensive, reliable, and cross-checked data.
Improvements to attain higher data grading for "Average
Operating Pressure" component:
to qualify for 2:Employ pressure gauging
and/or datalogging equipment to obtain pressure
measurements from fire hydrants. Locate accurate
topographical maps of service area in order to confirm ground
elevations. Research pump data sheets to find pump
pressure/flow characteristics
to maintain 10: Continue to refine the hydraulic model of the distribution system
and consider linking it with SCADA System for real-time
pressure data calibration, and averaging.
to qualify for 4:Formalize and communicate policy delineating
utility/customer responsibilities for service connection piping. Assess accuracy of paper
records by field inspection of a small sample of service connections using pipe locators as
needed. Research the potential migration to a computerized information management system
to store service connection data.
to qualify for 6:Establish coherent procedures to ensure that
policy for curbstop, meter installation and documentation is followed. Gain consensus
within the water utility for the establishment of a computerized information management system.
to qualify for 8:Implement an electronic means of
recordkeeping, typically via a customer information system or customer billing system.
Standardize the process to conduct field checks of limited number of locations.
to qualify for 4: Formalize a procedure to use pressure
gauging/datalogging equipment to gather pressure data during various system events
such as low pressure complaints, or operational testing. Gather pump pressure and flow data at different flow regimes. Identify faulty pressure
controls (pressure reducing valves, altitude valves, partially open boundary valves) and plan to properly configure pressure zones. Make all pressure data from these efforts
available to generate system-wide average pressure.
to qualify for 6: Expand the use of pressure
gauging/datalogging equipment to gather scattered pressure data at a representative set of sites, based upon pressure zones or areas.
Utilize pump pressure and flow data to determine supply head entering each pressure
zone or district. Correct any faulty pressure controls (pressure reducing valves, altitude valves, partially open boundary valves) to
ensure properly configured pressure zones. Use expanded pressure dataset from these activities to generate system-wide average
pressure.
to qualify for 8: Install a Supervisory Control and Data
Acquisition (SCADA) System to monitor system parameters and control operations. Set regular
calibration schedule for instrumentation to insure data accuracy. Obtain accurate
topographical data and utilize pressure data gathered from field surveys to provide
extensive, reliable data for pressure averaging.
to qualify for 10: Obtain average pressure data from hydraulic
model of the distribution system that has been calibrated via field measurements in the water
distribution system and confirmed in comparisons with SCADA System data.
to qualify for 10:Link customer information management system
and Geographic Information System (GIS), standardize process for field verification of
data.
AWWA Water Loss Control Committee Grading Matrix 9
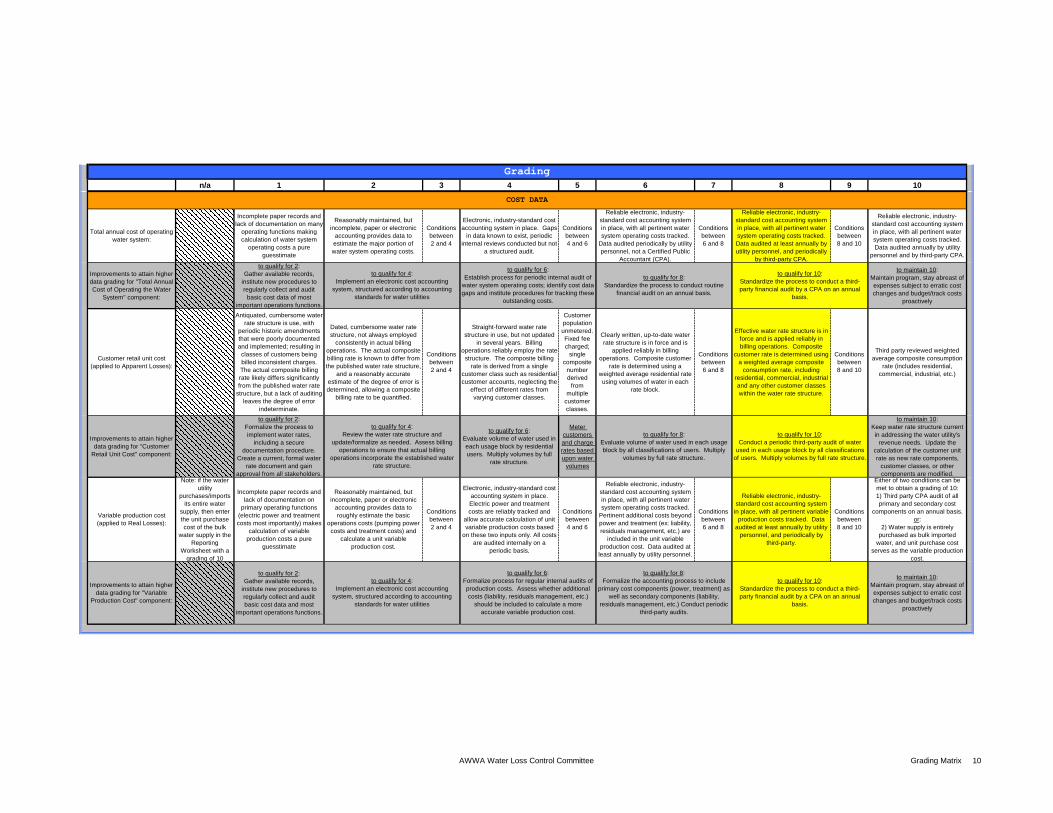
n/a 1 2 3 4 5 6 7 8 9 10
Grading
Total annual cost of operating water system:
Incomplete paper records and lack of documentation on many
operating functions making calculation of water system
operating costs a pure guesstimate
Reasonably maintained, but incomplete, paper or electronic
accounting provides data to estimate the major portion of water system operating costs.
Conditions between 2 and 4
Electronic, industry-standard cost accounting system in place. Gaps
in data known to exist, periodic internal reviews conducted but not
a structured audit.
Conditions between 4 and 6
Reliable electronic, industry-standard cost accounting system in place, with all pertinent water system operating costs tracked.
Data audited periodically by utility personnel, not a Certified Public
Accountant (CPA).
Conditions between 6 and 8
Reliable electronic, industry-standard cost accounting system in place, with all pertinent water system operating costs tracked. Data audited at least annually by utility personnel, and periodically
by third-party CPA.
Conditions between 8 and 10
Reliable electronic, industry-standard cost accounting system in place, with all pertinent water system operating costs tracked. Data audited annually by utility
personnel and by third-party CPA.
Improvements to attain higher data grading for "Total Annual Cost of Operating the Water
System" component:
to qualify for 2:Gather available records,
institute new procedures to regularly collect and audit
basic cost data of most important operations functions.
to maintain 10:Maintain program, stay abreast of expenses subject to erratic cost changes and budget/track costs
proactively
Customer retail unit cost (applied to Apparent Losses):
Antiquated, cumbersome water rate structure is use, with
periodic historic amendments that were poorly documented and implemented; resulting in classes of customers being billed inconsistent charges. The actual composite billing rate likely differs significantly from the published water rate
structure, but a lack of auditing leaves the degree of error
indeterminate.
Dated, cumbersome water rate structure, not always employed
consistently in actual billing operations. The actual composite billing rate is known to differ from the published water rate structure,
and a reasonably accurate estimate of the degree of error is determined, allowing a composite
billing rate to be quantified.
Conditions between 2 and 4
Straight-forward water rate structure in use, but not updated
in several years. Billing operations reliably employ the rate
structure. The composite billing rate is derived from a single
customer class such as residential customer accounts, neglecting the
effect of different rates from varying customer classes.
Customer population unmetered. Fixed fee charged;
single composite
number derived
from multiple
customer classes.
Clearly written, up-to-date water rate structure is in force and is
applied reliably in billing operations. Composite customer
rate is determined using a weighted average residential rate using volumes of water in each
rate block.
Conditions between 6 and 8
Effective water rate structure is in force and is applied reliably in billing operations. Composite
customer rate is determined using a weighted average composite
consumption rate, including residential, commercial, industrial and any other customer classes within the water rate structure.
Conditions between 8 and 10
Third party reviewed weighted average composite consumption
rate (includes residential, commercial, industrial, etc.)
Improvements to attain higher data grading for "Customer
Retail Unit Cost" component:
to qualify for 2:Formalize the process to implement water rates,
including a secure documentation procedure.
Create a current, formal water rate document and gain
approval from all stakeholders.
to qualify for 6:Evaluate volume of water used in each usage block by residential users. Multiply volumes by full
rate structure.
Meter customers and charge rates based upon water
volumes
to maintain 10:Keep water rate structure current in addressing the water utility's
revenue needs. Update the calculation of the customer unit rate as new rate components,
customer classes, or other components are modified.
Variable production cost (applied to Real Losses):
Note: if the water utility
purchases/imports its entire water
supply, then enter the unit purchase cost of the bulk
water supply in the Reporting
Worksheet with a grading of 10
Incomplete paper records and lack of documentation on
primary operating functions (electric power and treatment costs most importantly) makes
calculation of variable production costs a pure
guesstimate
Reasonably maintained, but incomplete, paper or electronic
accounting provides data to roughly estimate the basic
operations costs (pumping power costs and treatment costs) and
calculate a unit variable production cost.
Conditions between 2 and 4
Electronic, industry-standard cost accounting system in place. Electric power and treatment costs are reliably tracked and
allow accurate calculation of unit variable production costs based
on these two inputs only. All costs are audited internally on a
periodic basis.
Conditions between 4 and 6
Reliable electronic, industry-standard cost accounting system in place, with all pertinent water system operating costs tracked.
Pertinent additional costs beyond power and treatment (ex: liability, residuals management, etc.) are
included in the unit variable production cost. Data audited at least annually by utility personnel.
Conditions between 6 and 8
Reliable electronic, industry-standard cost accounting system
in place, with all pertinent variable production costs tracked. Data
audited at least annually by utility personnel, and periodically by
third-party.
Conditions between 8 and 10
Either of two conditions can be met to obtain a grading of 10:1) Third party CPA audit of all primary and secondary cost
components on an annual basis.or:
2) Water supply is entirely purchased as bulk imported
water, and unit purchase cost serves as the variable production
cost.
Improvements to attain higher data grading for "Variable
Production Cost" component:
to qualify for 2:Gather available records,
institute new procedures to regularly collect and audit basic cost data and most
important operations functions.
to maintain 10:Maintain program, stay abreast of expenses subject to erratic cost changes and budget/track costs
proactively
COST DATA
to qualify for 4:Implement an electronic cost accounting
system, structured according to accounting standards for water utilities
to qualify for 6:Establish process for periodic internal audit of
water system operating costs; identify cost data gaps and institute procedures for tracking these
outstanding costs.
to qualify for 8:Standardize the process to conduct routine
financial audit on an annual basis.
to qualify for 10:Standardize the process to conduct a third-party financial audit by a CPA on an annual
basis.
to qualify for 4:Implement an electronic cost accounting
system, structured according to accounting standards for water utilities
to qualify for 6:Formalize process for regular internal audits of production costs. Assess whether additional costs (liability, residuals management, etc.)
should be included to calculate a more accurate variable production cost.
to qualify for 8:Formalize the accounting process to include
primary cost components (power, treatment) as well as secondary components (liability,
residuals management, etc.) Conduct periodic third-party audits.
to qualify for 10:Standardize the process to conduct a third-party financial audit by a CPA on an annual
basis.
to qualify for 4:Review the water rate structure and
update/formalize as needed. Assess billing operations to ensure that actual billing
operations incorporate the established water rate structure.
to qualify for 8:Evaluate volume of water used in each usage block by all classifications of users. Multiply
volumes by full rate structure.
to qualify for 10:Conduct a periodic third-party audit of water
used in each usage block by all classifications of users. Multiply volumes by full rate structure.
AWWA Water Loss Control Committee Grading Matrix 10

AWWA WLCC Free Water Audit Software: Customer Service Line Diagrams
Copyright © 2010, American Water Works Association. All Rights Reserved. WAS v4.1Back to Instructions
Average Length of Customer Service Line
The three figures shown on this worksheet display the assignment of the Average Length of Customer Service Line, Lp, for the three most common piping configurations.
Figure 1 shows the configuration of the water meter outside of the customer building next to the curbstop valve. In this configuration Lp = 0 since the distance between the curbstop and the customer metering point is essentially zero.
Figure 2 shows the configuration of the customer water meter located inside the customer building, where Lp is the distance from the curbstop to the water meter.
Figure 3 shows the configuration of an unmetered customer building , where Lp is the distance from the curbstop to the first point of customer water consumption, or, more simply, the building line.
In any water system the Lp will vary notably in a community of different structures, therefore the average Lp value is used and this should be approximated or calculated if a sample of service line measurements has been gathered.
Return to Reporting Worksheet
Figure 1
Figure 2
Figure 3
Click for more information
AWWA Water Loss Control Committee Service Connection Diagram 11

Item Name
Apparent Losses
AUTHORIZED CONSUMPTION
Average length of customer service line
Average operating pressure
Billed Authorized Consumption
Billed metered consumption
Billed unmetered consumption
Connection density
AWWA WLCC Free Water Audit Software: Definitions
Description
= unauthorized consumption + meter under-registration + data handling errors
Includes all types of inaccuracies associated with customer metering as well as data handling errors (meter reading and billing), plus unauthorized consumption (theft or illegal use).NOTE: Over-registration of customer meters, leads to under-estimation of Real Losses. Under-registration of customer meters, leads to over-estimation of Real Losses.
All consumption that is billed and authorized by the utility. This may include both metered and unmetered consumption. See "Authorized Consumption" for more information.
= billed metered + billed unmetered + unbilled metered + unbilled unmetered
The volume of metered and/or unmetered water taken by registered customers, the water supplier and others who are implicitly or explicitly authorized to do so by the water supplier, for residential, commercial and industrial purposes. This does NOT include water sold to neighboring utilities (water exported).Authorized consumption may include items such as fire fighting and training, flushing of mains and sewers, street cleaning, watering of municipal gardens, public fountains, frost protection, building water, etc. These may be billed or unbilled, metered or unmetered.
All billed consumption which is calculated based on estimates or norms but is not metered. This might be a very small component in fully metered systems (for example billing based on estimates for the period a customer meter is out of order) but can be the key consumption component in systems without universal metering. It does NOT include water sold to neighboring utilities (water exported) which is unmetered but billed.
All metered consumption which is billed. This includes all groups of customers such as domestic, commercial, industrial or institutional. It does NOT include water sold to neighboring utilities (water exported) which is metered and billed. The metered consumption data can be taken directly from billing records for the water audit period. The accuracy of yearly metered consumption data can be refined by including an adjustment to account for customer meter reading lagtime, however additional analysis is necessary to determine the adjustment value, which may or may not be significant.
=number of connections / length of mains
The average pressure may be approximated when compiling the preliminary water audit. Once routine water auditing has been established, a more accurate assessment of average pressure should be pursued. If the water utility infrastructure is recorded in a Geographical Information System (GIS) the average pressure at many locations in the distribution system can be readily obtained. If a GIS does not exist, a weighted average of pressure data can be calculated from water pressure measured at various fire hydrants scattered across the water distribution system.
Find
Back to InstructionsCopyright © 2010, American Water Works Association. All Rights Reserved. WAS v4.1
Find
Find
Find
Find
Find
Click to see Service Connection Diagram
This is entered for unmetered services and in cold or other areas where meters are installed inside homes and buildings. It is the length of customer service line either between the utility's service connection (often at the curbstop) and the meter, or to the building line (first point of customer consumption) if customers are unmetered. Note that the length of service connection between the main and customer service line is owned by the utility and its length and potential leakage is accounted for in the UARL formula by the number of service connections.
What role does the "Average Length of Customer Service Line" parameter serve in the Water Audit?In many water distribution systems the water utility has maintenance responsibility for a portion of the customer service piping from its connection point at the water main to the curbstop valve located midway to the customer building. The customer is responsible to maintain the customer service piping from the curbstop to the building premises. When leaks arise on customer service piping, water utilities respond faster to repair leaks than customers when the leak is on piping under their responsibility. Leak durations are longer on the customer-maintained piping than the utility-maintained piping. The total length of pipe maintained by customers is one of the components of the Unavoidable Annual Real Loss (UARL) equation and is determined by multiplying the average length of customer maintained pipe, Lp by the number of customer service connections. Therefore this parameter is important to the calculation of the UARL and the Infrastructure leakage Index (ILI).
AWWA Water Loss Control Committee Definitions 12

Item Name Description
Customer metering inaccuracies
Customer retail unit cost
Infrastructure Leakage Index (ILI)
Length of mains
Master meter error adjustment
NON-REVENUE WATER
Number of active AND inactive service connections
Real Losses
Revenue Water
Systematic data handling errors
Total annual cost of operating the water system
The ratio of the Current Annual Real Losses (Real Losses) to the Unavoidable Annual Real Losses (UARL). The ILI is a highly effective performance indicator for comparing (benchmarking) the performance of utilities in operational management of real losses.
Number of service connections, main to curb stop. Please note that this includes the actual number of distinct piping connections including fire connections whether active or inactive. This may differ substantially from the number of Customers (or number of accounts)
= Apparent Losses + Real Losses + Unbilled Metered + Unbilled UnmeteredWater which does not provide any revenue to the utility
Physical water losses from the pressurized system and the utility’s storage tanks, up to the point of customer consumption. In metered systems this is the customer meter, in unmetered situations this is the first point of consumption (stop tap/tap) within the property.The annual volume lost through all types of leaks, breaks and overflows depends on frequencies, flow rates, and average duration of individual leaks, breaks and overflows.
Water which is charged to customers to provide revenue to the utility.
Apparent water losses caused by the collective under-registration of customer water meters. Many customer water meters will wear as large cumulative volumes of water are passed through them over time. This causes the meters to under-register. The auditor has two options for entering data for this component of the audit. The auditor can enter a percentage under-registration (typically an estimated value), this will apply the selected percentage to the two categories of metered consumption to determine the volume of water not recorded due to customer meter inaccuracy. Alternatively, if the auditor has substantial data from meter testing to arrive at their own volumes of such losses, this volume may be entered directly. Note that a value of zero will be accepted but an alert will appear asking if the customer population is unmetered. Since all metered systems have some degree of inaccuracy, then a positive value should be entered. A value of zero in this component is valid only if the water utility does not meter its customer population.
The Customer Retail Unit Cost represents the charge that customers pay for water service. This unit cost is applied to the components of apparent loss, since these losses represent water reaching customers but not (fully) paid for. It is important to compile these costs per the same unit cost basis as the volume measure included in the water audit. For example, if all water volumes are measured in million gallons, then the unit cost should be dollars per million gallon ($/mil gal). The software allows the user to select the units that are charged to customers (either $/1,000 gallons, $/hundred cubic feet or $/1,000 litres) and automatically converts these units to the units that appear in the "WATER SUPPLIED" box. Since most water utilities have a rate structure that includes a variety of different costs based upon class of customer, a weighted average of individual costs and number of customer accounts in each class can be calculated to determine a single composite cost that should be entered into this cell. Finally, the weighted average cost should also include additional charges for sewer, stormwater or biosolids processing, if these charges are based upon the volume of potable water consumed.
An estimate or measure of the degree of any inaccuracy that exists in the master meters measuring the Volume from own sources. Please also indicate if this adjustment is because the master meters under-registered (did not capture all the flow) or over-registered (overstated the actual flow). All systems encounter some degree of error in their Master Meter data. Please enter a positive value.
These costs include those for operations, maintenance and any annually incurred costs for long-term upkeep of the system, such as repayment of capital bonds for infrastructure expansion or improvement. Typical costs include employee salaries and benefits, materials, equipment, insurance, fees, administrative costs and all other costs that exist to sustain the drinking water supply. These costs should not include any costs to operate wastewater, biosolids or other systems outside of drinking water.
Apparent water losses caused by systematic data handling errors in the meter reading and billing system.
Length of all pipelines (except service connections) in the system starting from the point of system input metering (for example at the outlet of the treatment plant). It is also recommended to include in this measure the total length of fire hydrant lead pipe. Hydrant lead pipe is the pipe branching from the water main to the fire hydrant. Fire hydrant leads are typically of a sufficiently large size that is more representative of a pipeline than a service connection. The average length of hydrant leads across the entire system can be assumed if not known, and multiplied by the number of fire hydrants in the system, which can also be assumed if not known. This value can then be added to the total pipeline length. Total length of mains can therefore be calculated as:
Length of Mains, miles = (total pipeline length, miles) + [ {(average fire hydrant lead length, ft) x (number of fire hydrants)} / 5,280 ft/mile ] orLength of Mains, kilometres = (total pipeline length, kilometres) + [ {(average fire hydrant lead length, metres) x (number of fire hydrants)} / 1,000 metres/kilometre ]
Find
Find
Find
Find
Find
Find
Find
Find
Find
Find
AWWA Water Loss Control Committee Definitions 13

Item Name Description
Unauthorized consumption
Unbilled Authorized Consumption
Unbilled metered consumption
Unbilled unmetered consumption
Convert From…
Million Gallons (US) = 1 Million Gallons (US)
Any kind of Authorized Consumption which is neither billed nor metered. This component typically includes items such as fire fighting, flushing of mains and sewers, street cleaning, frost protection, etc. In most water utilities it is a small component which is very often substantially overestimated. It does NOT include water sold to neighboring utilities (water exported) which is unmetered and unbilled – an unlikely case. This component has many sub-components of water use which are often tedious to identify and quantify. Because of this, and the fact that it is usually a small portion of the water supplied, it is recommended that the auditor apply the default value of 1.25% of the volume from own sources. Select the default percentage to enter this value. If the water utility already has well validated data that gives a value substantially higher or lower than the default volume, then the auditor should enter their own volume. However the default approach is recommended for most water utilities. Note that a value of zero is not permitted, since all water utilities have some volume of water in this component occurring in their system.
Enter Units:
The user may develop an audit based on one of three unit selections: 1) Million Gallons (US)2) Megalitres (Thousand Cubic Metres)3) Acre-feetOnce this selection has been made in the instructions sheet, all calculations are made on the basis of the chosen units. Should the user wish to make additional conversions, a unit converter is provided below (use drop down menus to select units from the yellow unit boxes):
(conversion factor = 1)
Metered Consumption which is for any reason unbilled. This might for example include metered consumption of the utility itself or water provided to institutions free of charge. It does NOT include water sold to neighboring utilities (water exported) which is metered but unbilled.
Units and Conversions
Converts to…..
1
All consumption that is unbilled, but still authorized by the utility. See "Authorized Consumption" for more information.
Unavoidable Annual Real Losses (UARL)
The UARL is a theoretical reference value representing the technical low limit of leakage that could be achieved if all of today's best technology could be successfully applied. It is a key variable in the calculation of the Infrastructure Leakage Index (ILI). It is not necessary that water utilities set this level as the target level of leakage, unless water is unusually expensive, scarce or both.
NOTE: The UARL calculation has not yet been fully proven as effective for very small, or low pressure water distribution systems. If,in gallons per day:(Lm x 32) + Nc < 3000 orP <35psiin litres per day:(Lm x 20) + Nc < 3000 orP < 25mthen the calculated UARL value may not be valid. The software does not display a value of UARL or ILI if either of these conditions is true.
UARL (gallons/day)=(5.41Lm + 0.15Nc + 7.5Lc) xP, orUARL (litres/day)=(18.0Lm + 0.8Nc + 25.0Lc) xP
where:Lm = length of mains (miles or kilometres) Nc = number of service connections Lc = total length of customer service lines (miles or km) = Nc multiplied by the average distance of customer service line, Lp (miles or km)P = Pressure (psi or metres)
Includes water illegally withdrawn from hydrants, illegal connections, bypasses to consumption meter or meter reading equipment tampering. While this component has a direct impact on revenue, in most water utilities the volume is low and it is recommended that the auditor apply a default value of 0.25% of the volume from own sources. If the auditor has well validated data that indicates the volume from unauthorized consumption is substantially higher or lower than that generated by the default value then this value can be entered. However, for most water utilities it is recommended to apply the default value. Note that a value of zero will not be accepted since all water utilities have some volume of unauthorized consumption occurring in their system.
Find
Find
Find
Find
Find
Click to see Service Connection Diagram
AWWA Water Loss Control Committee Definitions 14

Item Name Description
Use of Option Buttons
Variable production cost (applied to Real Losses)
Volume from own sources
Water exported
Water imported
WATER LOSSES
= apparent losses + real losses
The difference between System Input and Authorized Consumption. Water losses can be considered as a total volume for the whole system, or for partial systems such as transmission or distribution systems, or individual zones. Water Losses consist of Real Losses and Apparent Losses.
Bulk water sold and conveyed out of the water distribution system. Typically this is water sold to a neighboring water utility. Be sure to account for any export meter inaccuracy in reporting this volume
The volume of treated water input to system from own production facilities
The cost to produce and supply the next unit of water. (E.g., $/million gallons) This cost is determined by calculating the summed unit costs for ground and surface water treatment and all power used for pumping from the source to the customer. It should also include the unit cost of bulk water purchased as an import if applicable.
Bulk water purchased to become part of the water supplied. Typically this is water purchased from a neighboring water utility or regional water authority. Be sure to account for any import meter inaccuracy in reporting this volume
Find
Find
Find
Find
Find
To use the percent value choose this button
To enter a value choose this button and enter the value in the cell to the right
NOTE: For unbilled unmetered consumption and unauthorized consumption, a recommended default value can be applied by selecting the Percent option. The default values are based on fixed percentages of water supplied and are recommended for use in this audit unless the auditor has well validated data for their system. Default values are shown by purple cells, as shown in the example above.
If a default value is selected, the user does not need to grade the item; a grading value of 3 is automatically applied (however, this grade will not be displayed).
Find
AWWA Water Loss Control Committee Definitions 15
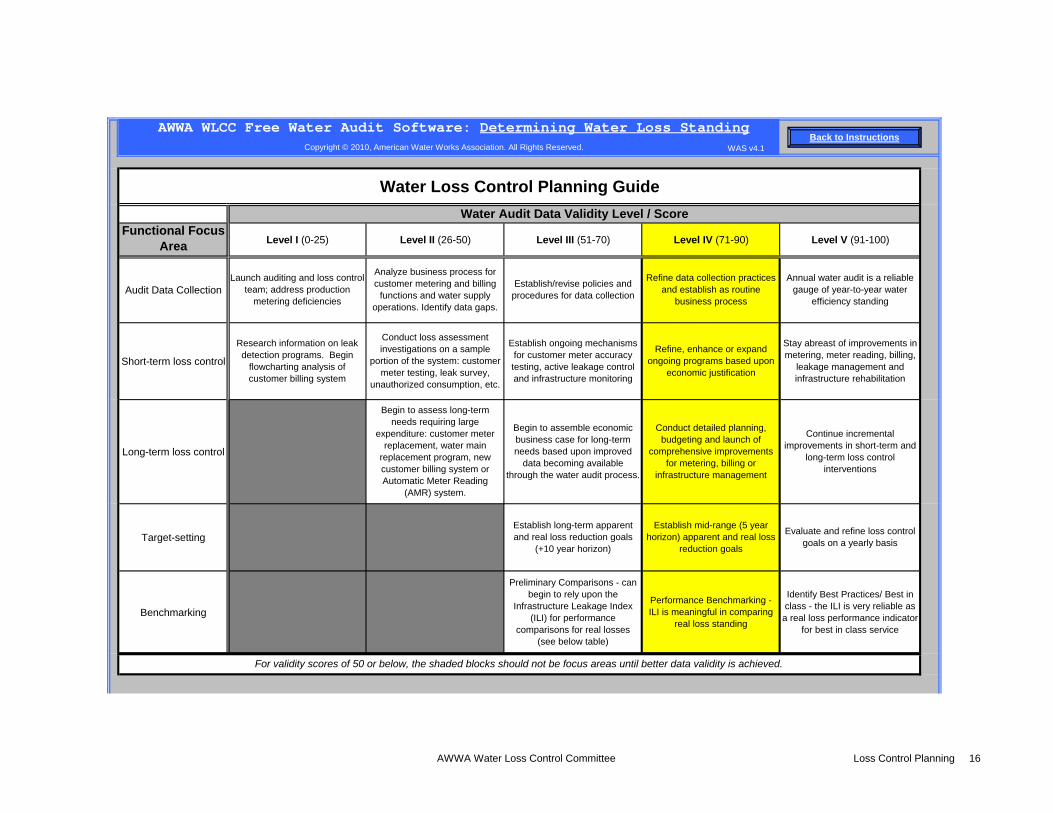
Functional Focus Area
Audit Data Collection
Short-term loss control
Long-term loss control
Target-setting
Benchmarking
Preliminary Comparisons - can begin to rely upon the
Infrastructure Leakage Index (ILI) for performance
comparisons for real losses (see below table)
Performance Benchmarking - ILI is meaningful in comparing
real loss standing
Identify Best Practices/ Best in class - the ILI is very reliable as
a real loss performance indicator for best in class service
For validity scores of 50 or below, the shaded blocks should not be focus areas until better data validity is achieved.
AWWA WLCC Free Water Audit Software: Determining Water Loss Standing
Conduct loss assessment investigations on a sample
portion of the system: customer meter testing, leak survey,
unauthorized consumption, etc.
Establish ongoing mechanisms for customer meter accuracy testing, active leakage control and infrastructure monitoring
Refine, enhance or expand ongoing programs based upon
economic justification
Water Loss Control Planning Guide
Establish/revise policies and procedures for data collection
Refine data collection practices and establish as routine
business process
Annual water audit is a reliable gauge of year-to-year water
efficiency standing
Level III (51-70) Level IV (71-90)
Water Audit Data Validity Level / Score
Level I (0-25)
Analyze business process for customer metering and billing
functions and water supply operations. Identify data gaps.
Stay abreast of improvements in metering, meter reading, billing,
leakage management and infrastructure rehabilitation
Launch auditing and loss control team; address production
metering deficiencies
Research information on leak detection programs. Begin
flowcharting analysis of customer billing system
Level II (26-50) Level V (91-100)
Establish long-term apparent and real loss reduction goals
(+10 year horizon)
Establish mid-range (5 year horizon) apparent and real loss
reduction goals
Evaluate and refine loss control goals on a yearly basis
Begin to assess long-term needs requiring large
expenditure: customer meter replacement, water main
replacement program, new customer billing system or Automatic Meter Reading
(AMR) system.
Begin to assemble economic business case for long-term needs based upon improved
data becoming available through the water audit process.
Conduct detailed planning, budgeting and launch of
comprehensive improvements for metering, billing or
infrastructure management
Continue incremental improvements in short-term and
long-term loss control interventions
Back to InstructionsCopyright © 2010, American Water Works Association. All Rights Reserved. WAS v4.1
AWWA Water Loss Control Committee Loss Control Planning 16

Target ILI Range
1.0 - 3.0
0
>3.0 -5.0
0
>5.0 - 8.0
0
Greater than 8.0
0
Less than 1.0
1
Water resources are believed to be sufficient to meet long-term needs, but demand management interventions (leakage management, water conservation) are included in the long-term planning.
Water resources are plentiful, reliable, and easily extracted.
Although operational and financial considerations may allow a long-term ILI greater than 8.0, such a level of leakage is not an effective utilization of water as a resource. Setting a target level greater than 8.0 - other than as an incremental goal to a smaller long-term target - is discouraged.
If the calculated Infrastructure Leakage Index (ILI) value for your system is 1.0 or less, two possibilities exist. a) you are maintaining your leakage at low levels in a class with the top worldwide performers in leakage control. b) A portion of your data may be flawed, causing your losses to be greatly understated. This is likely if you calculate a low ILI value but do not employ extensive leakage control practices in your operations. In such cases it is beneficial to validate the data by performing field measurements to confirm the accuracy of production and customer meters, or to identify any other potential sources of error in the data.
Water resources can be developed or purchased at reasonable expense; periodic water rate increases can be feasibly imposed and are tolerated by the customer population.
Cost to purchase or obtain/treat water is low, as are rates charged to customers.
Existing water supply infrastructure capability is sufficient to meet long-term demand as long as reasonable leakage management controls are in place.
Superior reliability, capacity and integrity of the water supply infrastructure make it relatively immune to supply shortages.
Financial Considerations
Water resources are costly to develop or purchase; ability to increase revenues via water rates is greatly limited because of regulation or low ratepayer affordability.
Water Resources Considerations
Available resources are greatly limited and are very difficult and/or environmentally unsound to develop.
Operational Considerations
Operating with system leakage above this level would require expansion of existing infrastructure and/or additional water resources to meet the demand.
General Guidelines for Setting a Target ILI (without doing a full economic analysis of leakage control options)
Once data has been entered into the Reporting Worksheet, the performance indicators are automatically calculated. How does a water utility operator know how well his or her system is performing? The AWWA Water Loss Control Committee provided the following table to assist water utilities is gauging an approximate Infrastructure Leakage Index (ILI) that is appropriate for their water system and local conditions. The lower the amount of leakage and real losses that exist in the system, then the lower the ILI value will be. Note: this table offers an approximate guideline for leakage reduction target-setting. The best means of setting such targets include performing an economic assessment of various loss control methods. However, this table is useful if such an assessment is not possible.
AWWA Water Loss Control Committee Loss Control Planning 17

DEVELOPED BY: ANDREW CHASTAIN-HOWLEY, Miya WaterDAVID GOFF, P.E. Goff Water Audits & EngineeringGEORGE KUNKEL, P.E. Philadelphia Water DepartmentALAIN LALONDE, Veritec ConsultingDAVID SAYERS, Delaware River Basin Commission
REFERENCES: - Alegre, H., Hirner, W., Baptista, J. and Parena, R. Performance Indicators for Water Supply Services. IWA Publishing ‘Manual of Best Practice’ Series, 2000. ISBN 1 900222 272
- Kunkel, G. et al, 2003. Water Loss Control Committee Report: Applying Worldwide Best Management Practices in Water Loss Control. Journal AWWA, 95:8:65- AWWA Water Audits and Loss Control Programs, M36 Publication, 3 rd Edition, 2009- Service Connection Diagrams courtesy of Ronnie McKenzie, WRP Pty Ltd.
AWWA WLCC Free Water Audit Software: Acknowledgements
AWWA Water Audit Software Version 4.1 Developed by the Water Loss Control Committee of the American Water Works Association January 2010
This software is intended to serve as a basic tool to compile a preliminary, or “top-down”, water audit. It is recommended that users also refer to the 3rd Edition AWWA M36
Publication, Water Audits and Loss Control Programs, for detailed guidance on compiling a comprehensive, or “bottom-up”, water audit using the same water audit methodology.
Back to InstructionsCopyright © 2010, American Water Works Association. All Rights Reserved. WAS v4.1
AWWA Water Loss Control Committee Acknowledgements 20

Appendix D SBX7‐7 Detailed Calculations

SB X7-7 Table 0: Units of Measure Used in UWMP* (select one from the drop down list)
Acre Feet
*The unit of measure must be consistent with Table 2-3 NOTES:
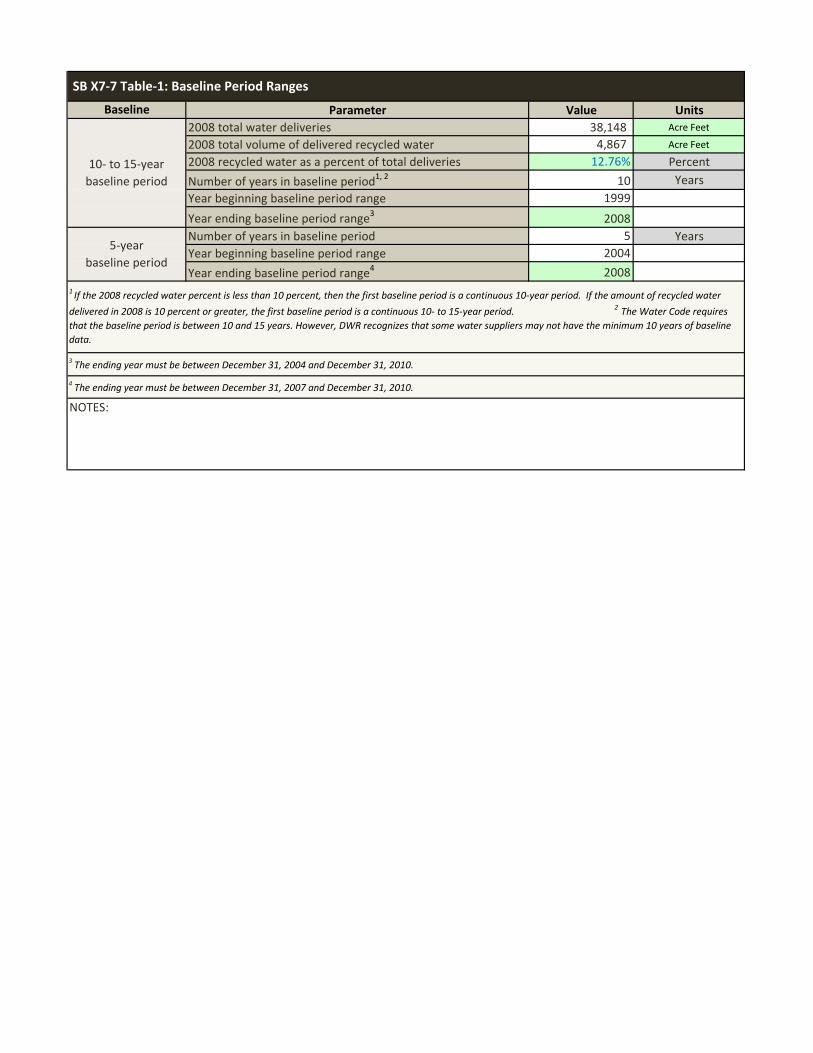
Parameter Value Units2008 total water deliveries 38,148 Acre Feet
2008 total volume of delivered recycled water 4,867 Acre Feet
2008 recycled water as a percent of total deliveries 12.76% PercentNumber of years in baseline period1, 2 10 YearsYear beginning baseline period range 1999Year ending baseline period range3 2008Number of years in baseline period 5 YearsYear beginning baseline period range 2004Year ending baseline period range4 2008
SB X7-7 Table-1: Baseline Period Ranges
1 If the 2008 recycled water percent is less than 10 percent, then the first baseline period is a continuous 10-year period. If the amount of recycled water delivered in 2008 is 10 percent or greater, the first baseline period is a continuous 10- to 15-year period. 2 The Water Code requires that the baseline period is between 10 and 15 years. However, DWR recognizes that some water suppliers may not have the minimum 10 years of baseline data.
3 The ending year must be between December 31, 2004 and December 31, 2010.
4 The ending year must be between December 31, 2007 and December 31, 2010.
5-year baseline period
Baseline
10- to 15-year baseline period
NOTES:

NOTES: SANDAG Series 13 population estimates used to calculate baseline
SB X7-7 Table 2: Method for Population Estimates
Method Used to Determine Population(may check more than one)
1. Department of Finance (DOF)DOF Table E-8 (1990 - 2000) and (2000-2010) andDOF Table E-5 (2011 - 2015) when available
3. DWR Population Tool
4. OtherDWR recommends pre-review
2. Persons-per-Connection Method

Population
Year 1 1999 127,429 Year 2 2000 134,686 Year 3 2001 144,219 Year 4 2002 154,936 Year 5 2003 163,925 Year 6 2004 173,279 Year 7 2005 180,704 Year 8 2006 186,119 Year 9 2007 191,032 Year 10 2008 194,791 Year 11Year 12Year 13Year 14Year 15
Year 1 2004 173,279 Year 2 2005 180,704 Year 3 2006 186,119 Year 4 2007 191,032 Year 5 2008 194,791
217,339
Year
2015
SB X7-7 Table 3: Service Area Population
10 to 15 Year Baseline Population
5 Year Baseline Population
2015 Compliance Year Population
NOTES:

Exported Water
Change in Dist. System
Storage(+/-)
Indirect Recycled
WaterThis column will
remain blank until SB X7-7 Table 4-B is completed.
Water Delivered for Agricultural
Use
Process WaterThis column will
remain blank until SB X7-7 Table 4-D is completed.
Year 1 1999 25,442 - - 25,442 Year 2 2000 29,901 - - 29,901 Year 3 2001 30,002 - - 30,002 Year 4 2002 35,182 - - 35,182 Year 5 2003 34,536 - - 34,536 Year 6 2004 39,579 - - 39,579 Year 7 2005 37,678 - - 37,678 Year 8 2006 41,258 - - 41,258 Year 9 2007 41,909 - - 41,909 Year 10 2008 38,045 - - 38,045 Year 11 0 - - - - Year 12 0 - - - - Year 13 0 - - - - Year 14 0 - - - - Year 15 0 - - - -
35,353
Year 1 2004 39,579 - - 39,579 Year 2 2005 37,678 - - 37,678 Year 3 2006 41,258 - - 41,258 Year 4 2007 41,909 - - 41,909 Year 5 2008 38,045 - - 38,045
39,694
30,299 - - - 30,299
* NOTE that the units of measure must remain consistent throughout the UWMP, as reported in Table 2-3
NOTES:
SB X7-7 Table 4: Annual Gross Water Use *
2015
10 to 15 Year Baseline - Gross Water Use
10 - 15 year baseline average gross water use 5 Year Baseline - Gross Water Use
5 year baseline average gross water use2015 Compliance Year - Gross Water Use
Baseline YearFm SB X7-7 Table 3
Volume Into Distribution
SystemThis column will
remain blank until SB X7-7 Table 4-A is completed.
Annual Gross
Water Use
Deductions

Volume
Entering
Distribution
System
Meter Error
Adjustment*
Optional
(+/‐)
Corrected
Volume
Entering
Distribution
System
Year 1 1999 25442 ‐
Year 2 2000 29901 ‐
Year 3 2001 30002 ‐
Year 4 2002 35182 ‐
Year 5 2003 34536 ‐
Year 6 2004 39579 ‐
Year 7 2005 37678 ‐
Year 8 2006 41258 ‐
Year 9 2007 41909 ‐
Year 10 2008 38045 ‐
Year 11 0 ‐
Year 12 0 ‐
Year 13 0 ‐
Year 14 0 ‐
Year 15 0 ‐
Year 1 2004 39579 ‐
Year 2 2005 37678 ‐
Year 3 2006 41258 ‐
Year 4 2007 41909 ‐
Year 5 2008 38045 ‐
30,299 ‐
SB X7‐7 Table 4‐A: Volume Entering the Distribution
System(s)Complete one table for each source.
10 to 15 Year Baseline ‐ Water into Distribution System
5 Year Baseline ‐ Water into Distribution System
2015 Compliance Year ‐ Water into Distribution System
Name of Source
Baseline YearFm SB X7‐7 Table 3
* Meter Error Adjustment ‐ See guidance in Methodology 1, Step 3 of
Methodologies Document
NOTES:
This water source is:
The supplier's own water source
A purchased or imported source
2015
San Diego County Water Authority

Service Area PopulationFm SB X7-7
Table 3
Annual Gross Water UseFm SB X7-7
Table 4
Daily Per Capita Water Use (GPCD)
Year 1 1999 127,429 25,442 178 Year 2 2000 134,686 29,901 198 Year 3 2001 144,219 30,002 186 Year 4 2002 154,936 35,182 203 Year 5 2003 163,925 34,536 188 Year 6 2004 173,279 39,579 204 Year 7 2005 180,704 37,678 186 Year 8 2006 186,119 41,258 198 Year 9 2007 191,032 41,909 196 Year 10 2008 194,791 38,045 174 Year 11 0 - - Year 12 0 - - Year 13 0 - - Year 14 0 - - Year 15 0 - -
191
Service Area PopulationFm SB X7-7
Table 3
Gross Water UseFm SB X7-7
Table 4
Daily Per Capita Water
Use
Year 1 2004 173,279 39,579 204 Year 2 2005 180,704 37,678 186 Year 3 2006 186,119 41,258 198 Year 4 2007 191,032 41,909 196 Year 5 2008 194,791 38,045 174
192
217,339 30,299 124 NOTES:
5 Year Average Baseline GPCD 2015 Compliance Year GPCD
2015
Baseline YearFm SB X7-7 Table 3
SB X7-7 Table 5: Gallons Per Capita Per Day (GPCD)
Baseline YearFm SB X7-7 Table 3
10 to 15 Year Baseline GPCD
10-15 Year Average Baseline GPCD 5 Year Baseline GPCD
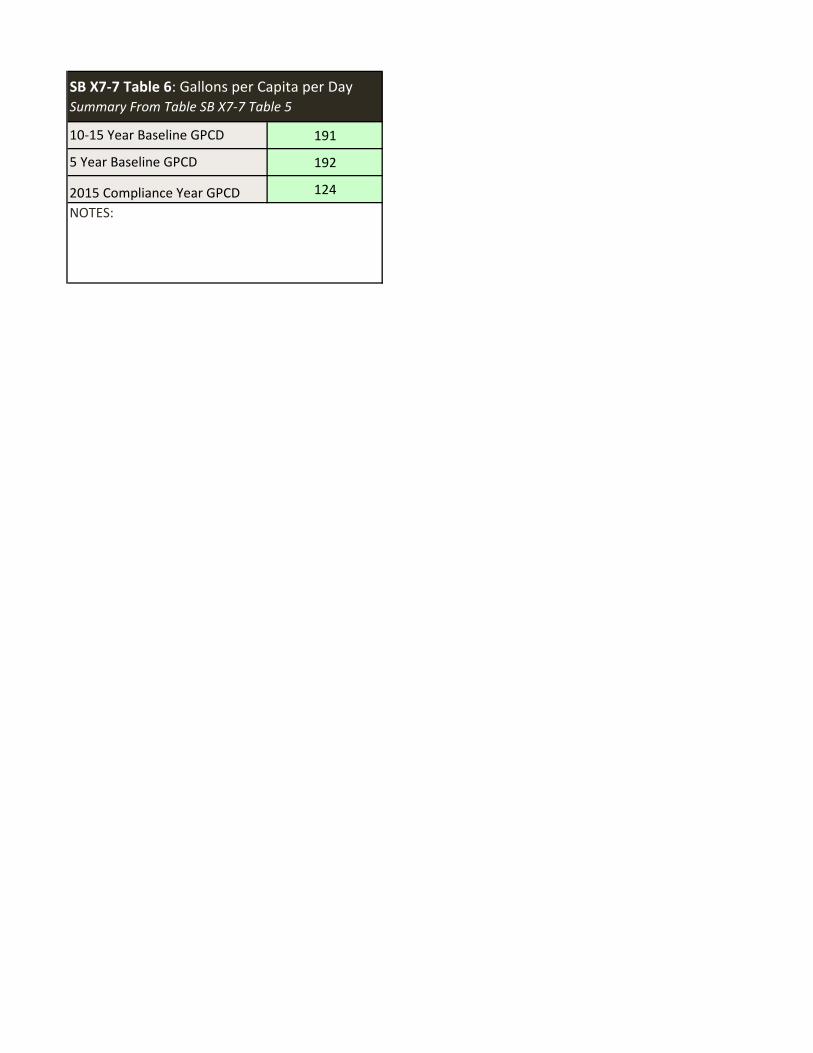
191
192
2015 Compliance Year GPCD 124
SB X7-7 Table 6: Gallons per Capita per Day Summary From Table SB X7-7 Table 5
10-15 Year Baseline GPCD
5 Year Baseline GPCD
NOTES:
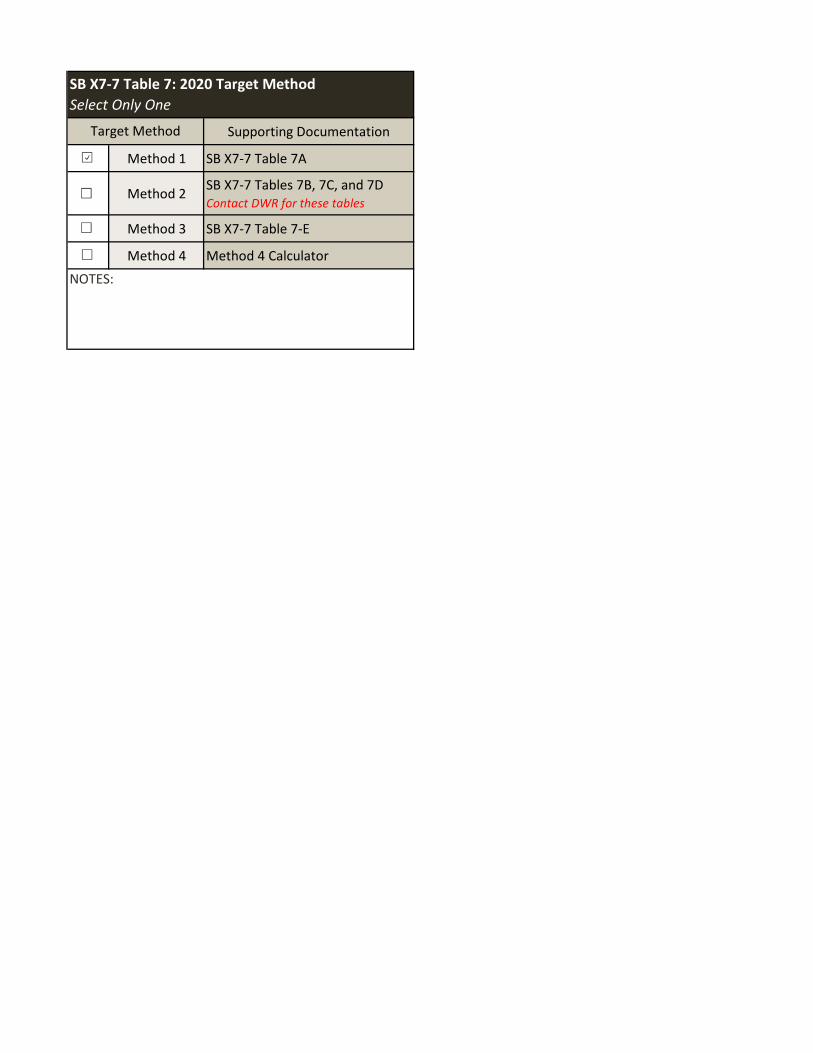
Supporting Documentation
Method 1 SB X7-7 Table 7A
Method 2 SB X7-7 Tables 7B, 7C, and 7D Contact DWR for these tables
Method 3 SB X7-7 Table 7-E
Method 4 Method 4 Calculator
SB X7-7 Table 7: 2020 Target MethodSelect Only One
Target Method
NOTES:

10-15 Year Baseline GPCD
2020 Target GPCD
191 153
SB X7-7 Table 7-A: Target Method 120% Reduction
NOTES:

5 YearBaseline GPCDFrom SB X7-7
Table 5
Maximum 2020 Target1
Calculated2020 Target2
Confirmed 2020 Target
192 182 154 154
SB X7-7 Table 7-F: Confirm Minimum Reduction for 2020 Target
1 Maximum 2020 Target is 95% of the 5 Year Baseline GPCD 2 2020 Target is calculated based on the selected Target Method, see SB X7-7 Table 7 and corresponding tables for agency's calculated target.
NOTES:

Confirmed2020 TargetFm SB X7-7Table 7-F
10-15 year Baseline GPCD
Fm SB X7-7Table 5
2015 Interim Target GPCD
154 191 173
SB X7-7 Table 8: 2015 Interim Target GPCD
NOTES:

Extraordinary Events
Weather Normalization
Economic Adjustment
124 173 From
Methodology 8 (Optional)
From Methodology 8
(Optional)
From Methodology 8
(Optional) - 124 124 YES
Optional Adjustments (in GPCD)
NOTES:
SB X7-7 Table 9: 2015 Compliance
Did Supplier Achieve Targeted
Reduction for 2015?
Actual 2015 GPCD
2015 Interim Target GPCD
2015 GPCD (Adjusted if applicable)
TOTAL Adjustments
Adjusted 2015 GPCD
Enter "0" if Adjustment Not Used

DISTRICT year series pop hhp gq hs hh
OTAY WATER DISTRICT 1995 9 116,702 111,722 4,980 35,801 34,217
OTAY WATER DISTRICT 1998 9 120,091 121,191 121,191 121,191 121,191
OTAY WATER DISTRICT 1999 9 127,429 124,348 124,348 124,348 124,348
OTAY WATER DISTRICT 2000 10 134,686 127,504 7,182 41,171 39,920
OTAY WATER DISTRICT 2001 12 144,219 138,906 5,313 45,395 44,079
OTAY WATER DISTRICT 2002 12 154,936 149,525 5,411 49,123 47,644
OTAY WATER DISTRICT 2003 12 163,925 158,956 4,969 51,935 50,313
OTAY WATER DISTRICT 2004 12 173,279 168,273 5,006 54,553 52,811
OTAY WATER DISTRICT 2005 12 180,704 175,260 5,444 57,261 55,403
OTAY WATER DISTRICT 2006 12 186,119 180,685 5,434 59,035 56,972
OTAY WATER DISTRICT 2007 12 191,032 185,832 5,200 60,776 58,469
OTAY WATER DISTRICT 2008 12 194,791 189,154 5,637 61,503 59,076
OTAY WATER DISTRICT 2009 12 197,705 191,962 5,743 61,791 59,290
OTAY WATER DISTRICT 2010 13 200,704 195,094 5,610 61,981 59,693
OTAY WATER DISTRICT 2011 13 204,276 197,041 7,235 62,175 59,713
OTAY WATER DISTRICT 2012 13 208,541 201,492 7,049 62,818 60,652
OTAY WATER DISTRICT 2013 13 210,564 203,838 6,726 63,766 61,067
OTAY WATER DISTRICT 2014 13 214,355 207,831 6,524 64,824 62,181
OTAY WATER DISTRICT 2015 13 217,339 210,768 6,571 65,301 62,766
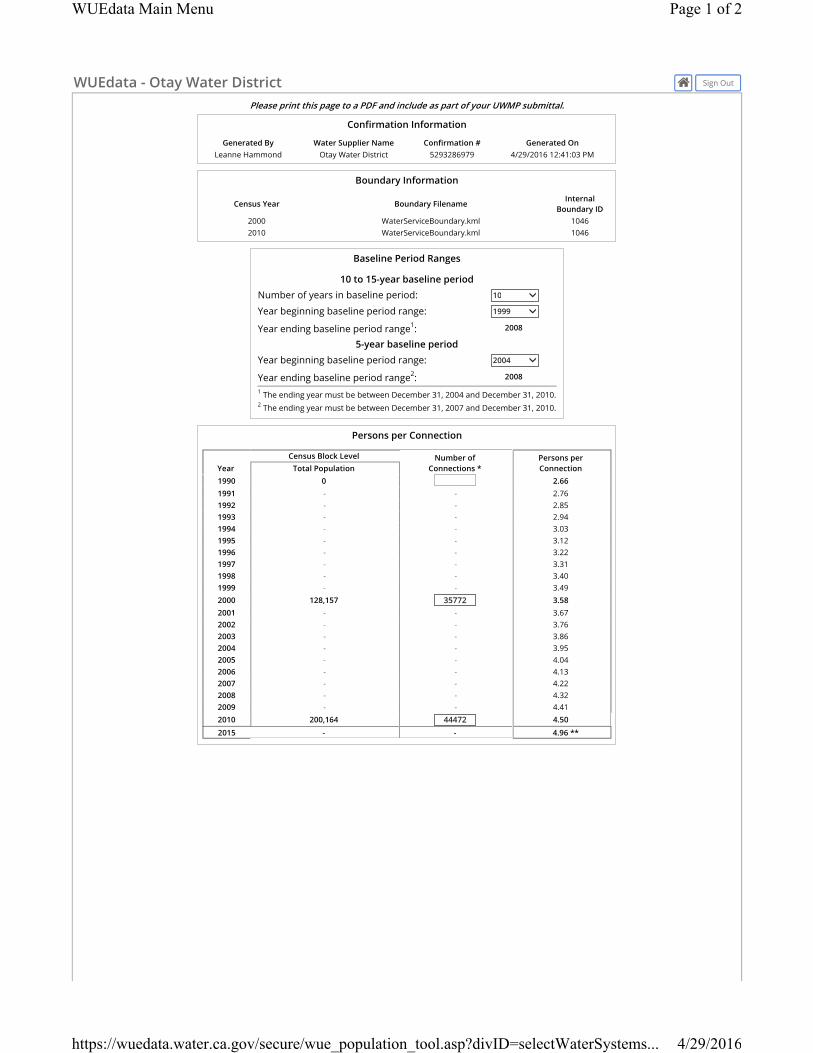
Sign OutWUEdata - Otay Water DistrictPlease print this page to a PDF and include as part of your UWMP submittal.
Confirmation Information
Generated By Water Supplier Name Confirmation # Generated OnLeanne Hammond Otay Water District 5293286979 4/29/2016 12:41:03 PM
Boundary Information
Census Year Boundary FilenameInternal
Boundary ID2000 WaterServiceBoundary.kml 10462010 WaterServiceBoundary.kml 1046
Baseline Period Ranges
10 to 15-year baseline periodNumber of years in baseline period: 10 Year beginning baseline period range: 1999
Year ending baseline period range1: 2008
5-year baseline periodYear beginning baseline period range: 2004
Year ending baseline period range2: 2008
1 The ending year must be between December 31, 2004 and December 31, 2010.2 The ending year must be between December 31, 2007 and December 31, 2010.
Persons per Connection
YearCensus Block Level Number of
Connections *Persons perConnectionTotal Population
1990 0 2.661991 - - 2.761992 - - 2.851993 - - 2.941994 - - 3.031995 - - 3.121996 - - 3.221997 - - 3.311998 - - 3.401999 - - 3.492000 128,157 35772 3.582001 - - 3.672002 - - 3.762003 - - 3.862004 - - 3.952005 - - 4.042006 - - 4.132007 - - 4.222008 - - 4.322009 - - 4.412010 200,164 44472 4.50
2015 - - 4.96 **
Page 1 of 2WUEdata Main Menu
4/29/2016https://wuedata.water.ca.gov/secure/wue_population_tool.asp?divID=selectWaterSystems...

QUESTIONS / ISSUES? CONTACT THE WUEDATA HELP DESK
Population Using Persons-Per-Connection
YearNumber of
Connections *Persons perConnection
TotalPopulation
10 to 15 Year Baseline Population CalculationsYear 1 1999 33446 3.49 116,753Year 2 2000 35772 3.58 128,157Year 3 2001 38194 3.67 140,248Year 4 2002 40309 3.76 151,723Year 5 2003 42437 3.86 163,637Year 6 2004 44520 3.95 175,765Year 7 2005 46042 4.04 186,010Year 8 2006 46851 4.13 193,588Year 9 2007 44070 4.22 186,152
Year 10 2008 44137 4.32 190,4955 Year Baseline Population Calculations
Year 1 2004 44520 3.95 175,765Year 2 2005 46042 4.04 186,010Year 3 2006 46851 4.13 193,588Year 4 2007 44070 4.22 186,152Year 5 2008 44137 4.32 190,495
2015 Compliance Year Population Calculations2015 43803 4.96 ** 217,342
Hide Print Confirmation
Page 2 of 2WUEdata Main Menu
4/29/2016https://wuedata.water.ca.gov/secure/wue_population_tool.asp?divID=selectWaterSystems...

March 18, 2016
2020
(A) (B) (C) (D) (E) (F=A+B+C‐D‐E) (G) (H=F‐G)
Agency
Municipal and
Industrial Agricultural
Near‐Term
AnnexationsActive 5 Passive
Long‐Range
Demand Forecast
Verifiable Local
Supplies 6Demand on the
Water Authority
Carlsbad M.W.D. 23,548 317 ‐ 1,592 1,288 20,985 8,074 12,911
Del Mar, City of 1,365 ‐ ‐ 126 131 1,108 100 1,008
Escondido, City of 23,686 2,960 366 1,458 1,954 23,600 12,640 10,960
Fallbrook P.U.D. 8,551 4,427 ‐ 469 475 12,034 543 11,491
Helix W.D. 37,311 ‐ ‐ 2,513 3,524 31,274 3,388 27,886
Lakeside W.D. 4,988 ‐ 5 264 619 4,110 700 3,410
Oceanside, City of 29,435 1,359 ‐ 2,156 2,043 26,595 12,085 14,510
Olivenhain M.W.D. 20,896 1,428 ‐ 1,317 878 20,129 3,150 16,979
Otay W.D. 44,314 41 2,973 2,111 2,497 42,720 5,670 37,050
Padre Dam M.W.D. 14,603 608 2,000 1,450 1,590 14,171 2,016 12,155
Camp Pendleton M. R. 8,720 ‐ ‐ ‐ ‐ 8,720 8,500 220
Poway, City of 15,424 30 ‐ 825 628 14,001 645 13,356
Rainbow M.W.D. 9,131 11,305 519 561 469 19,925 ‐ 19,925
Ramona M.W.D. 7,327 1,814 ‐ 429 654 8,058 730 7,328
Rincon Del Diablo M.W.D. 10,234 270 ‐ 418 382 9,704 4,000 5,704
San Diego, City of 241,668 ‐ ‐ 13,047 15,943 212,678 39,000 173,678
San Dieguito W.D. 7,760 121 ‐ 580 769 6,532 3,232 3,300
Santa Fe I.D. 12,152 63 ‐ 873 364 10,978 3,768 7,210
Sweetwater Auth. 21,197 18 ‐ 1,089 1,936 18,190 15,700 2,490
Vallecitos W.D. 20,874 955 ‐ 1,227 1,206 19,396 3,500 15,896
Valley Center M.W.D. 10,143 15,946 ‐ 513 482 25,094 137 24,957
Vista I.D. 21,850 994 ‐ 1,536 1,564 19,744 5,062 14,682
Yuima M.W.D. 524 10,305 166 99 92 10,804 7,000 3,804
Total 595,701 52,961 6,029 34,653 39,488 580,550 139,640 440,910
Grand Total 648,662 604362 74141
2025
(A) (B) (C) (D) (E) (F=A+B+C‐D‐E) (G) (H=F‐G)
Agency
Municipal and
Industrial Agricultural
Near‐Term
AnnexationsActive 5 Passive
Long‐Range
Demand Forecast
Verifiable Local
Supplies 6Demand on the
Water Authority
Carlsbad M.W.D. 25,123 300 ‐ 1,278 1,990 22,155 8,074 14,081
Del Mar, City of 1,425 ‐ ‐ 104 182 1,139 125 1,014
Escondido, City of 25,369 2,870 694 1,240 2,674 25,019 12,640 12,379
Fallbrook P.U.D. 10,590 4,289 ‐ 442 853 13,584 543 13,041
Helix W.D. 40,134 ‐ ‐ 2,127 5,553 32,454 3,388 29,066
Lakeside W.D. 5,737 ‐ 5 246 911 4,585 700 3,885
Oceanside, City of 31,899 1,318 ‐ 1,737 3,202 28,278 14,725 13,553
Olivenhain M.W.D. 22,976 1,378 ‐ 1,051 1,505 21,798 3,150 18,648
Otay W.D. 51,771 27 2,973 1,844 4,497 48,430 5,900 42,530
Padre Dam M.W.D. 16,524 540 2,000 1,159 2,608 15,297 2,016 13,281
Camp Pendleton M. R. 9,920 ‐ ‐ ‐ ‐ 9,920 9,690 230
Poway, City of 16,649 29 ‐ 664 1,063 14,951 645 14,306
Rainbow M.W.D. 10,731 10,985 519 522 796 20,917 ‐ 20,917
Ramona M.W.D. 8,114 1,760 ‐ 379 1,024 8,471 755 7,716
Rincon Del Diablo M.W.D. 11,884 242 417 368 672 11,503 4,000 7,503
San Diego, City of 263,163 ‐ ‐ 10,029 23,577 229,557 38,900 190,657
San Dieguito W.D. 8,299 107 ‐ 479 1,066 6,861 3,232 3,629
Santa Fe I.D. 12,544 62 ‐ 665 613 11,328 3,768 7,560
Sweetwater Auth. 23,408 16 ‐ 968 2,683 19,773 15,700 4,073
Vallecitos W.D. 24,813 915 ‐ 1,075 1,926 22,727 3,500 19,227
Valley Center M.W.D. 12,045 15,471 ‐ 456 851 26,209 222 25,987
Vista I.D. 24,167 934 ‐ 1,272 2,509 21,320 5,062 16,258
Yuima M.W.D. 719 10,136 166 79 171 10,771 7,000 3,771
Total 658,004 51,379 6,774 28,184 60,927 627,046 143,735 483,311
Grand Total 709,383 89110.60461 (60,927)
Draft Normal‐Year Water Reliability Assessment Data
Baseline Demand Forecast 2,3,4 Conservation Savings
Baseline Demand Forecast 2,3,4
Conservation Savings
(Preliminary Water Authority Baseline Demand Forecast, Conservation Savings Projections and
Long‐Range Demand Forecast by Member Agency 1)
1
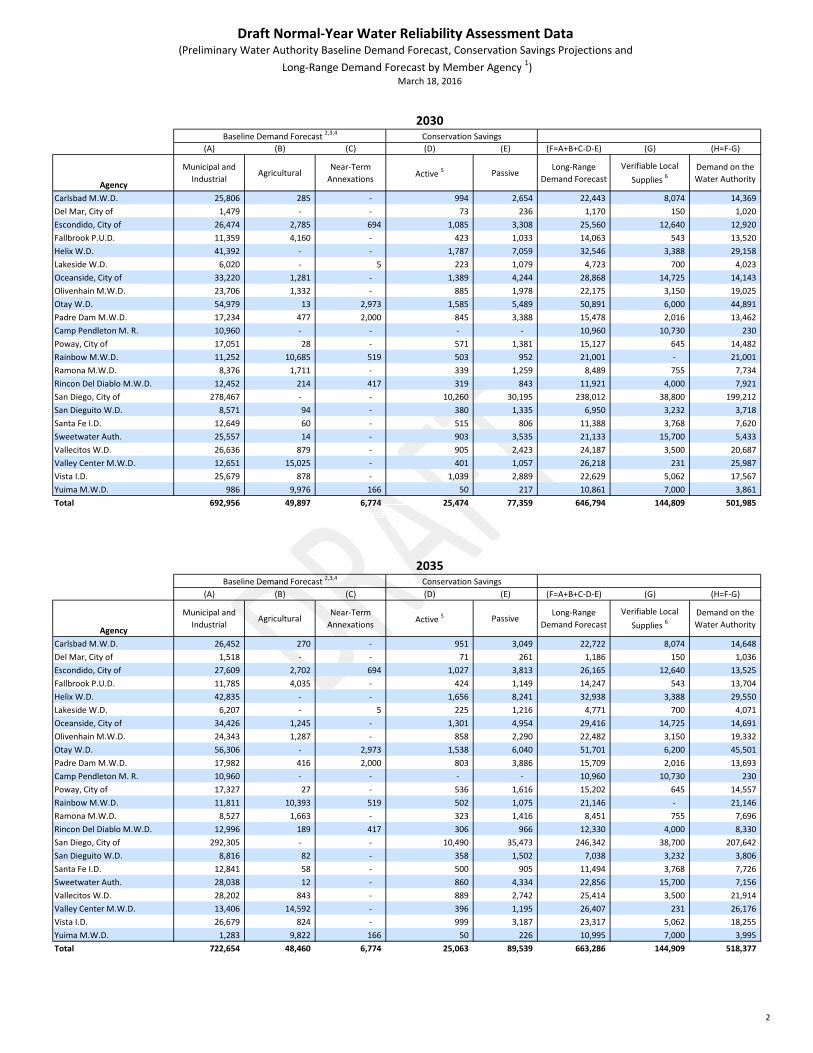
March 18, 2016
Draft Normal‐Year Water Reliability Assessment Data (Preliminary Water Authority Baseline Demand Forecast, Conservation Savings Projections and
Long‐Range Demand Forecast by Member Agency 1)
2030
(A) (B) (C) (D) (E) (F=A+B+C‐D‐E) (G) (H=F‐G)
Agency
Municipal and
Industrial Agricultural
Near‐Term
AnnexationsActive 5 Passive
Long‐Range
Demand Forecast
Verifiable Local
Supplies 6Demand on the
Water Authority
Carlsbad M.W.D. 25,806 285 ‐ 994 2,654 22,443 8,074 14,369
Del Mar, City of 1,479 ‐ ‐ 73 236 1,170 150 1,020
Escondido, City of 26,474 2,785 694 1,085 3,308 25,560 12,640 12,920
Fallbrook P.U.D. 11,359 4,160 ‐ 423 1,033 14,063 543 13,520
Helix W.D. 41,392 ‐ ‐ 1,787 7,059 32,546 3,388 29,158
Lakeside W.D. 6,020 ‐ 5 223 1,079 4,723 700 4,023
Oceanside, City of 33,220 1,281 ‐ 1,389 4,244 28,868 14,725 14,143
Olivenhain M.W.D. 23,706 1,332 ‐ 885 1,978 22,175 3,150 19,025
Otay W.D. 54,979 13 2,973 1,585 5,489 50,891 6,000 44,891
Padre Dam M.W.D. 17,234 477 2,000 845 3,388 15,478 2,016 13,462
Camp Pendleton M. R. 10,960 ‐ ‐ ‐ ‐ 10,960 10,730 230
Poway, City of 17,051 28 ‐ 571 1,381 15,127 645 14,482
Rainbow M.W.D. 11,252 10,685 519 503 952 21,001 ‐ 21,001
Ramona M.W.D. 8,376 1,711 ‐ 339 1,259 8,489 755 7,734
Rincon Del Diablo M.W.D. 12,452 214 417 319 843 11,921 4,000 7,921
San Diego, City of 278,467 ‐ ‐ 10,260 30,195 238,012 38,800 199,212
San Dieguito W.D. 8,571 94 ‐ 380 1,335 6,950 3,232 3,718
Santa Fe I.D. 12,649 60 ‐ 515 806 11,388 3,768 7,620
Sweetwater Auth. 25,557 14 ‐ 903 3,535 21,133 15,700 5,433
Vallecitos W.D. 26,636 879 ‐ 905 2,423 24,187 3,500 20,687
Valley Center M.W.D. 12,651 15,025 ‐ 401 1,057 26,218 231 25,987
Vista I.D. 25,679 878 ‐ 1,039 2,889 22,629 5,062 17,567
Yuima M.W.D. 986 9,976 166 50 217 10,861 7,000 3,861
Total 692,956 49,897 6,774 25,474 77,359 646,794 144,809 501,985
Grand Total 742,853 756433 102832.7672 679,074
2035
(A) (B) (C) (D) (E) (F=A+B+C‐D‐E) (G) (H=F‐G)
Agency
Municipal and
Industrial Agricultural
Near‐Term
AnnexationsActive 5 Passive
Long‐Range
Demand Forecast
Verifiable Local
Supplies 6Demand on the
Water Authority
Carlsbad M.W.D. 26,452 270 ‐ 951 3,049 22,722 8,074 14,648
Del Mar, City of 1,518 ‐ ‐ 71 261 1,186 150 1,036
Escondido, City of 27,609 2,702 694 1,027 3,813 26,165 12,640 13,525
Fallbrook P.U.D. 11,785 4,035 ‐ 424 1,149 14,247 543 13,704
Helix W.D. 42,835 ‐ ‐ 1,656 8,241 32,938 3,388 29,550
Lakeside W.D. 6,207 ‐ 5 225 1,216 4,771 700 4,071
Oceanside, City of 34,426 1,245 ‐ 1,301 4,954 29,416 14,725 14,691
Olivenhain M.W.D. 24,343 1,287 ‐ 858 2,290 22,482 3,150 19,332
Otay W.D. 56,306 ‐ 2,973 1,538 6,040 51,701 6,200 45,501
Padre Dam M.W.D. 17,982 416 2,000 803 3,886 15,709 2,016 13,693
Camp Pendleton M. R. 10,960 ‐ ‐ ‐ ‐ 10,960 10,730 230
Poway, City of 17,327 27 ‐ 536 1,616 15,202 645 14,557
Rainbow M.W.D. 11,811 10,393 519 502 1,075 21,146 ‐ 21,146
Ramona M.W.D. 8,527 1,663 ‐ 323 1,416 8,451 755 7,696
Rincon Del Diablo M.W.D. 12,996 189 417 306 966 12,330 4,000 8,330
San Diego, City of 292,305 ‐ ‐ 10,490 35,473 246,342 38,700 207,642
San Dieguito W.D. 8,816 82 ‐ 358 1,502 7,038 3,232 3,806
Santa Fe I.D. 12,841 58 ‐ 500 905 11,494 3,768 7,726
Sweetwater Auth. 28,038 12 ‐ 860 4,334 22,856 15,700 7,156
Vallecitos W.D. 28,202 843 ‐ 889 2,742 25,414 3,500 21,914
Valley Center M.W.D. 13,406 14,592 ‐ 396 1,195 26,407 231 26,176
Vista I.D. 26,679 824 ‐ 999 3,187 23,317 5,062 18,255
Yuima M.W.D. 1,283 9,822 166 50 226 10,995 7,000 3,995
Total 722,654 48,460 6,774 25,063 89,539 663,286 144,909 518,377
Grand Total 771,114 777888 114601.584
Baseline Demand Forecast 2,3,4 Conservation Savings
Baseline Demand Forecast 2,3,4 Conservation Savings
2

March 18, 2016
Draft Normal‐Year Water Reliability Assessment Data (Preliminary Water Authority Baseline Demand Forecast, Conservation Savings Projections and
Long‐Range Demand Forecast by Member Agency 1)
2040
(A) (B) (C) (D) (E) (F=A+B+C‐D‐E) (G) (H=F‐G)
Agency
Municipal and
Industrial Agricultural
Near‐Term
AnnexationsActive 5 Passive
Long‐Range
Demand Forecast
Verifiable Local
Supplies 6Demand on the
Water Authority
Carlsbad M.W.D. 26,880 256 ‐ 962 3,428 22,746 8,074 14,672
Del Mar, City of 1,547 ‐ ‐ 72 285 1,190 150 1,040
Escondido, City of 28,892 2,630 694 1,047 4,299 26,870 12,640 14,230
Fallbrook P.U.D. 12,175 3,907 ‐ 437 1,297 14,348 543 13,805
Helix W.D. 44,357 ‐ ‐ 1,675 9,366 33,316 3,388 29,928
Lakeside W.D. 6,438 ‐ 5 229 1,345 4,869 700 4,169
Oceanside, City of 36,136 1,213 ‐ 1,327 5,656 30,366 14,725 15,641
Olivenhain M.W.D. 25,402 1,250 ‐ 873 2,587 23,192 3,150 20,042
Otay W.D. 62,936 4 2,973 1,587 6,744 57,582 6,500 51,082
Padre Dam M.W.D. 18,796 435 2,000 817 4,350 16,064 2,016 14,048
Camp Pendleton M. R. 10,960 ‐ ‐ ‐ ‐ 10,960 10,730 230
Poway, City of 18,042 27 ‐ 542 1,849 15,678 645 15,033
Rainbow M.W.D. 12,518 10,124 519 510 1,185 21,466 ‐ 21,466
Ramona M.W.D. 8,813 1,620 ‐ 327 1,604 8,502 755 7,747
Rincon Del Diablo M.W.D. 13,977 183 417 314 1,085 13,178 4,000 9,178
San Diego, City of 304,593 ‐ ‐ 10,721 41,726 252,145 38,600 213,545
San Dieguito W.D. 9,571 68 ‐ 363 1,680 7,596 3,232 4,363
Santa Fe I.D. 13,475 57 ‐ 503 1,002 12,027 3,768 8,259
Sweetwater Auth. 29,340 11 ‐ 896 5,066 23,389 15,700 7,689
Vallecitos W.D. 32,369 821 ‐ 926 3,063 29,201 3,500 25,701
Valley Center M.W.D. 14,224 14,102 ‐ 408 1,333 26,585 231 26,354
Vista I.D. 27,794 796 ‐ 1,033 3,410 24,147 5,062 19,085
Yuima M.W.D. 1,447 9,710 166 51 242 11,030 7,000 4,030
Total 760,682 47,214 6,774 25,620 102,601 686,449 145,109 541,340
Grand Total 807,896 814669.7821 128221.2671
Footnotes
1) Excludes small increment of demand associated with Accelerated Forecasted Growth (demand not broken out by member agency)
2) Wholesale water rate ramp assumption: 2 percent real increase 2016‐2020, 1 percent real increase 2021‐2025, and rate of inflation thereafter (3% percent)
3) Includes impact of historic conservation savings
4) MCB Camp Pendleton demands based on projections provided by MCBCP staff and are net of conservation savings
5) Future Active savings assumed to be implemented at 2015 activity level (except for large scale turf replacement)
6) Provided by member agencies, Verifiable supplies include: surface water, groundwater, recycled water, seawater desalination (CDP contract supplies), and potable reuse
Baseline Demand Forecast 2,3,4
Conservation Savings
3
Appendix E City of San Diego Agreement for Otay
WTP

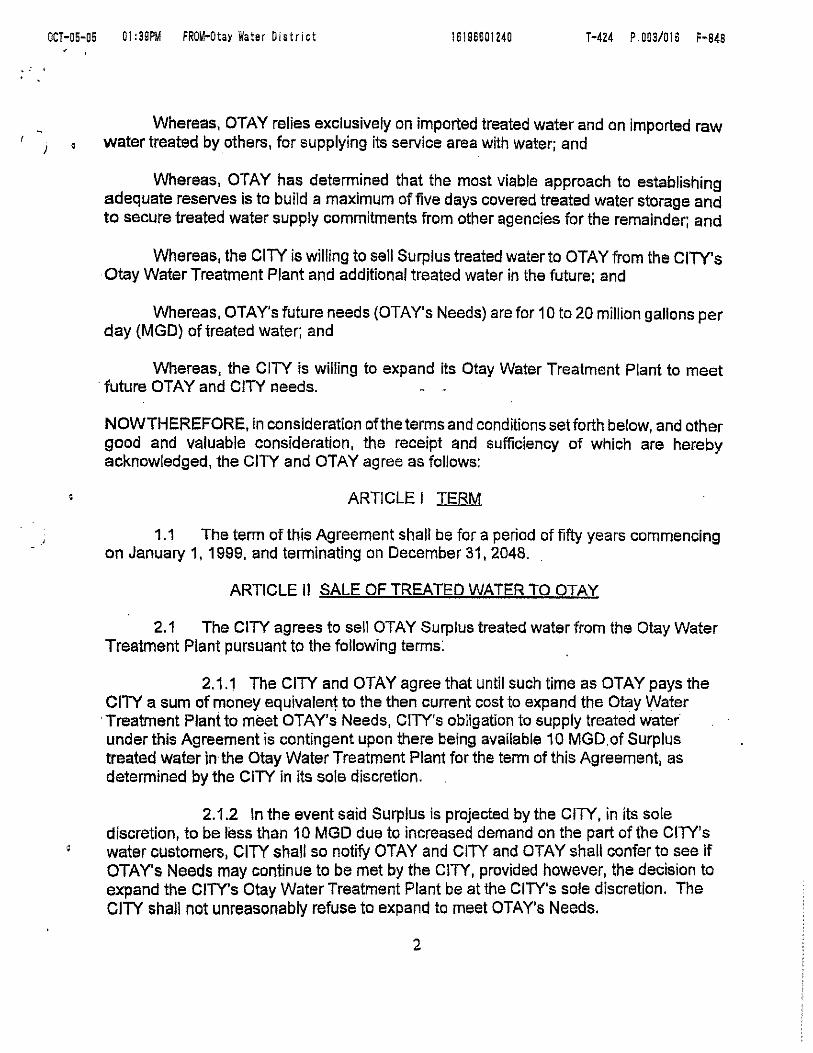


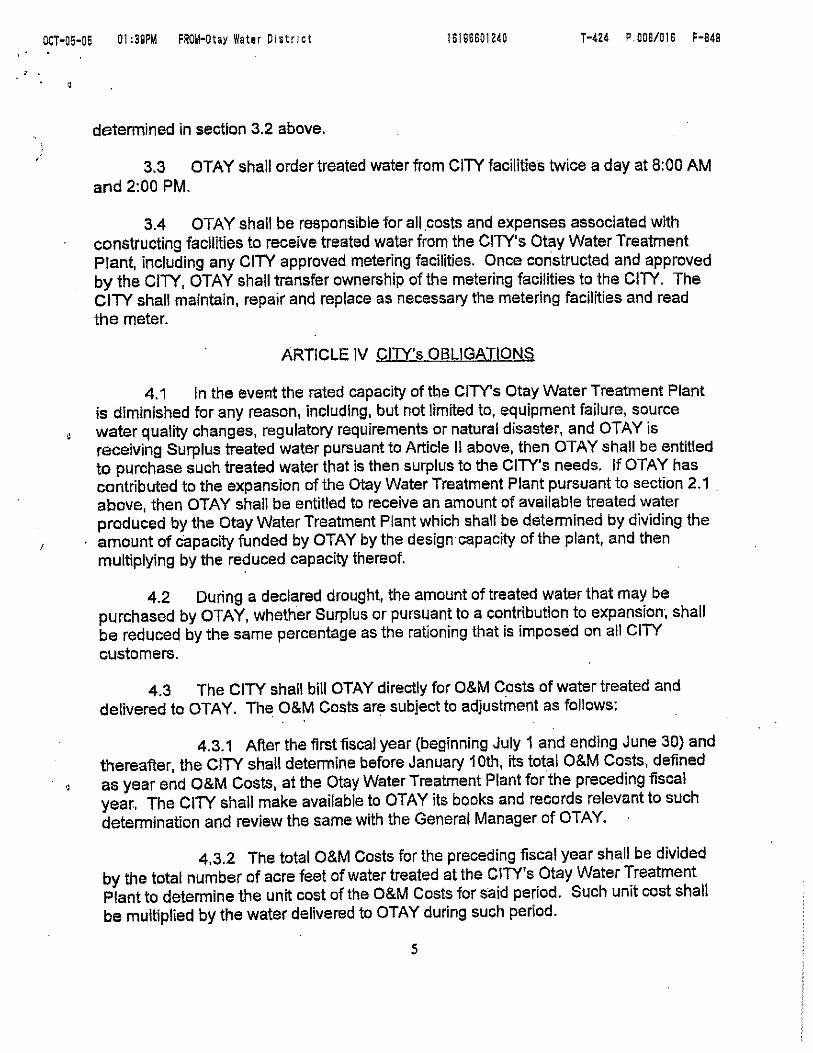
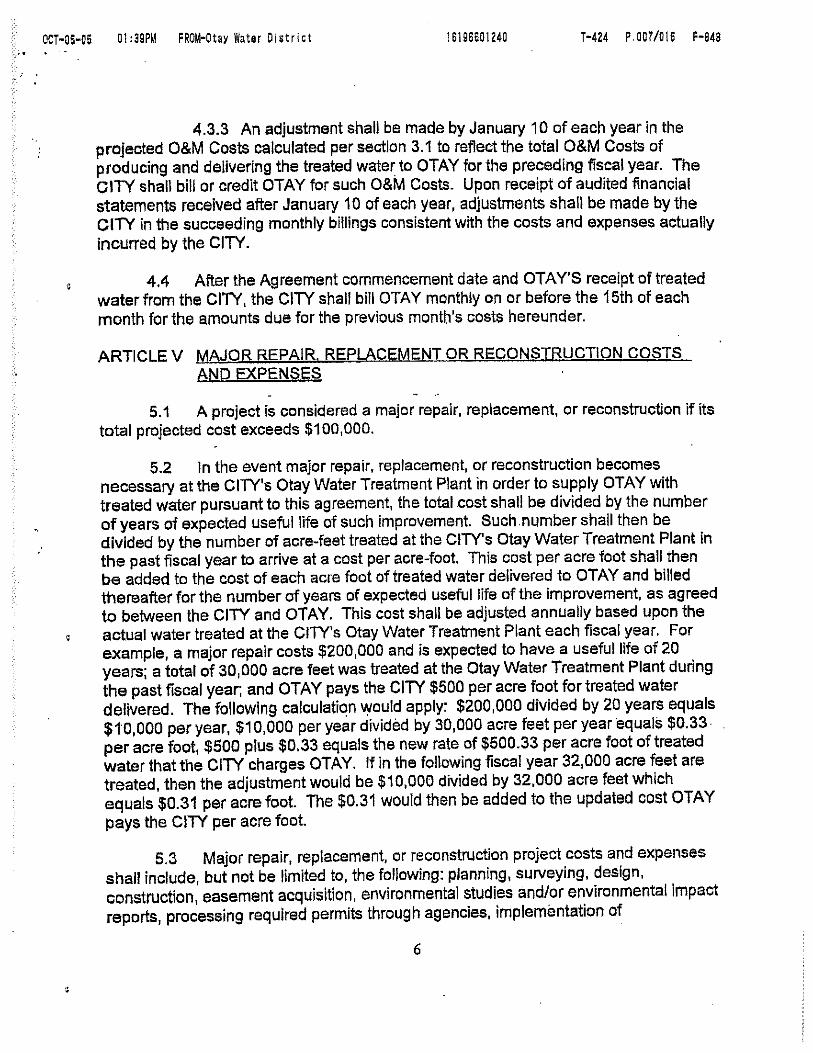

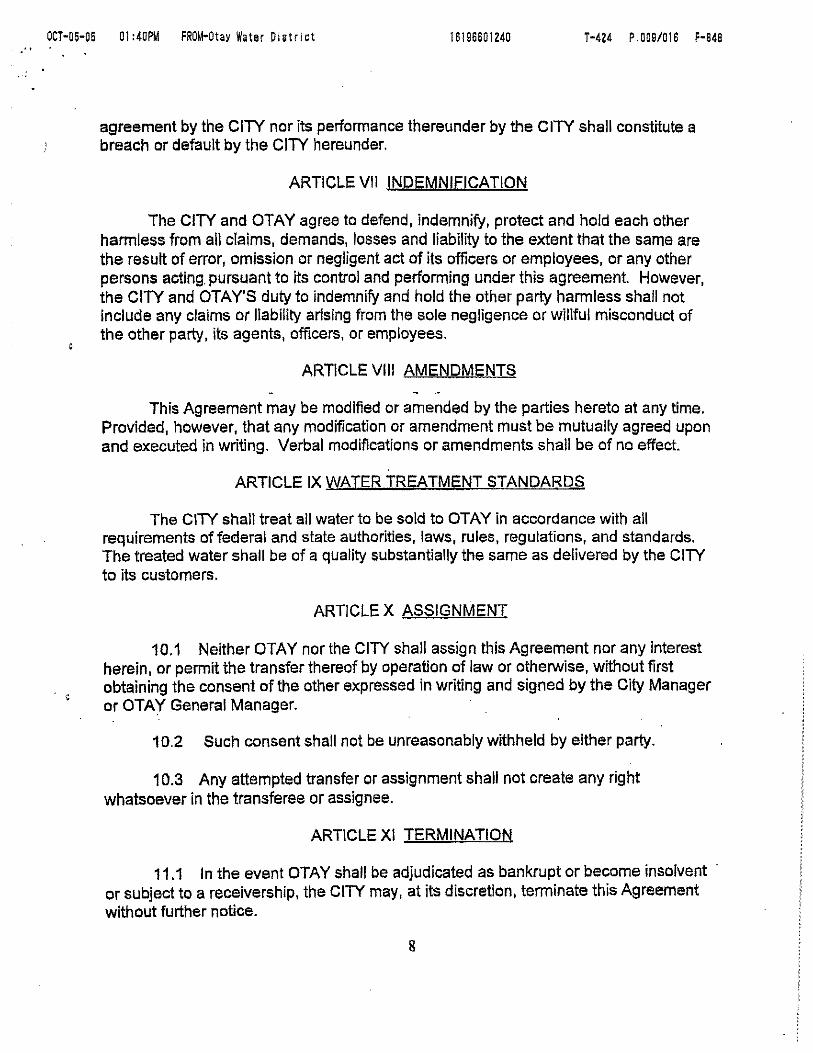


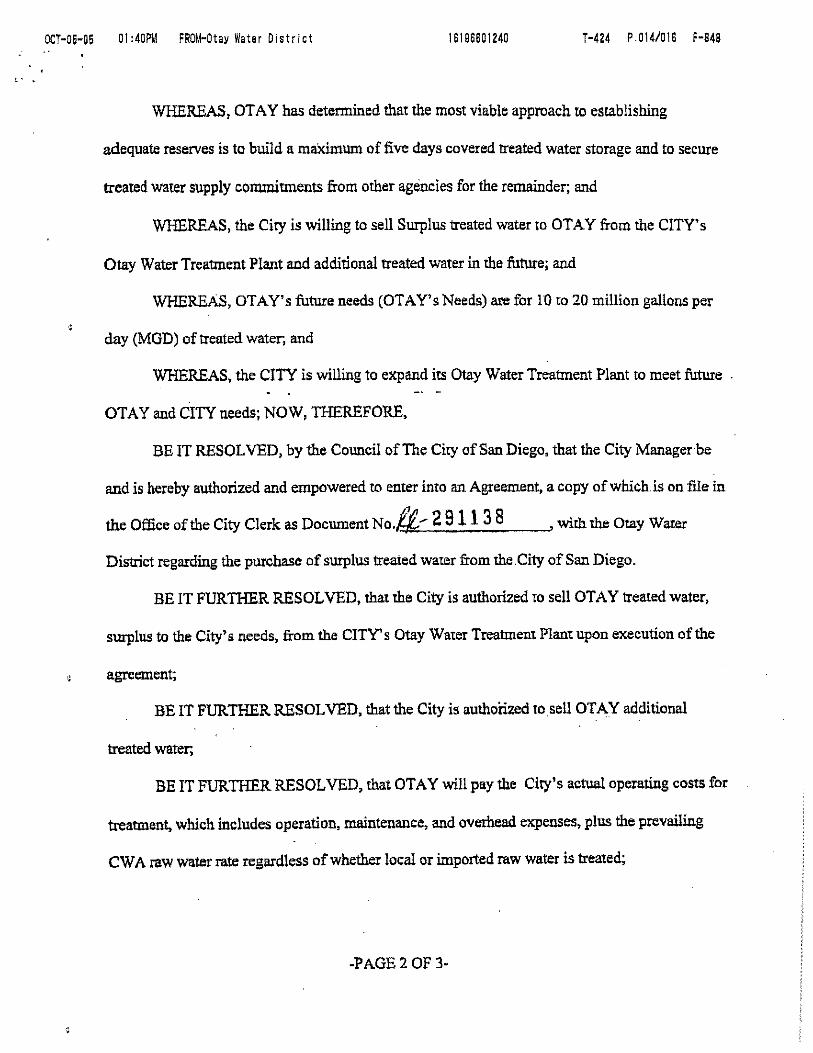


Appendix F City of San Diego Agreement for
SBWRP


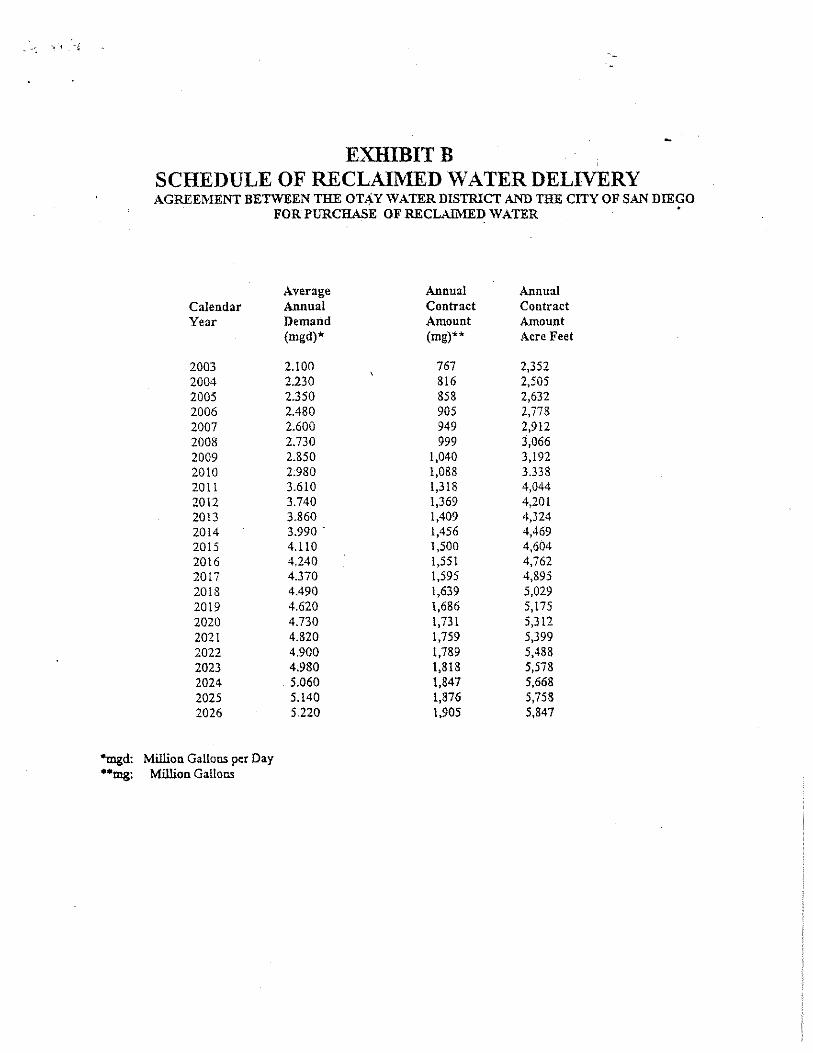
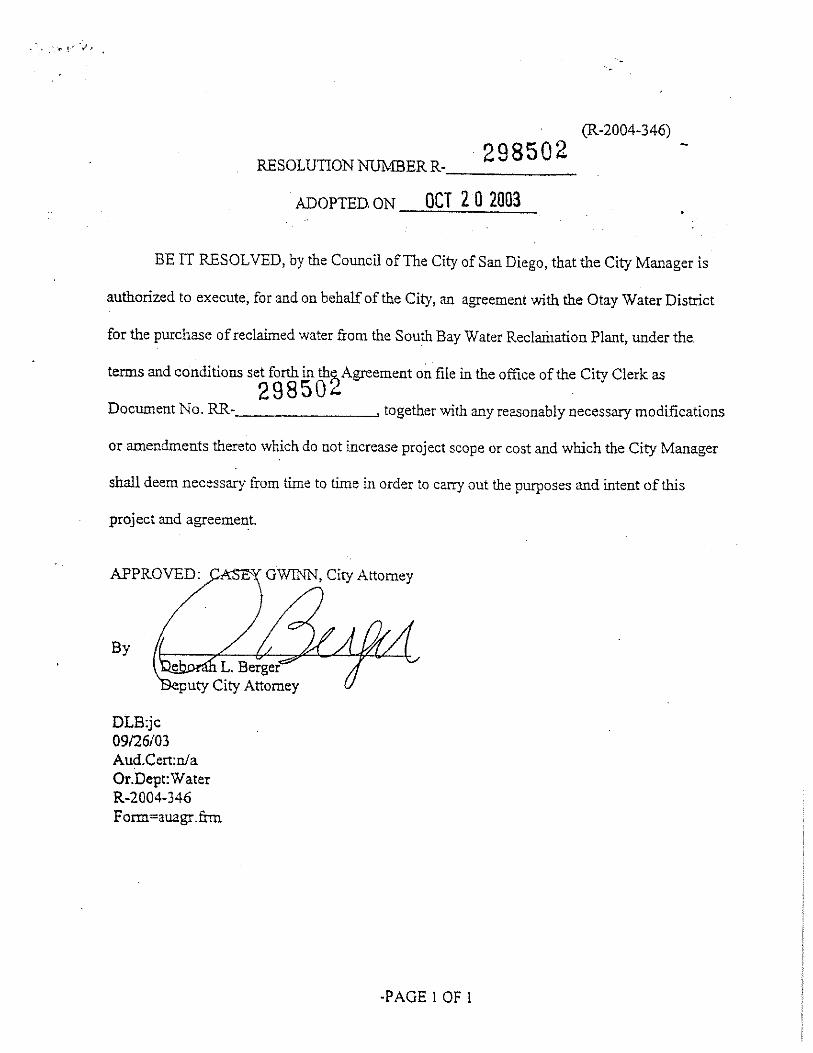


Appendix G District Code of Ordinance Section 26
Water Recycling Plan and Implementation Procedures

SECTION 26 WATER RECYCLING PLAN AND IMPLEMENTING PROCEDURES 26.01 FINDINGS The state policies regarding use of recycled water are in the best interest of the Otay Water District. The majority of jurisdictions in San Diego County have adopted measures to promote water reclamation. This ordinance is necessary to protect the common water supply of the region which is vital to public health and safety, and to prevent endangerment of public and private property. San Diego County is highly dependent on limited imported
water for domestic, agricultural and industrial uses. The reliability of the supply of imported water is uncertain. By developing and utilizing recycled water, the need for additional imported water can be reduced. In light of these circumstances, certain uses of potable water may be considered unreasonable or to constitute a nuisance where recycled water is available. 26.02 USE OF RECYCLED WATER A. District Policy: It is the policy of the Dis-
trict that recycled water shall be used within the jurisdiction wherever its use is financially and technically feasible, and consistent with legal
requirements, preservation of public health, safety and welfare, and the environment.
A customer’s recycled water service must at all
time be in compliance with any requirements of service, including but not limited to the requirements established under this Section 26, the District’s Rules and Regulations for Recycled Water Use, the California Water Code, commencing with Section 13520, the California Health and Safety Code, Section 116555, the California Code of Regulations, Titles 17 and 22, and Water Agency Standards.
B. Required Use for Greenbelt Purposes: Pursuant to
Section 13550 of the California Water Code, no customer of the District shall make, cause, use or permit the use of potable water supplied by the District for greenbelt uses, including, but not limited to, cemeteries, golf courses, parks and highway landscaped areas, when, following notice and a hearing, the District finds that recycled water is available for such greenbelt uses and that the following conditions are met:

26-2
1. the recycled water is of adequate quality; 2. the recycled water may be furnished to such
areas at a reasonable cost, comparable to or less than the cost of supplying potable domestic water;
3. the State Department of Health Services has
determined that such use would not be detri-mental to public health; and
4. the use of recycled water will not adversely
affect downstream water rights, will not degrade water quality.
The findings may include terms and conditions under which recycled water shall be used. In addition, the District may assist the customer in obtaining any permits or approvals required for the use of recycled water.
26.03 DEFINITIONS The following terms are defined for purposes of this ordinance: A. Agricultural Purposes: Agricultural purposes
include the growing of field and nursery crops, row crops, trees, and vines and the feeding of
fowl and livestock. B. Artificial Lake: A human-made lake, pond, lagoon,
or other body of water that is used wholly or partly for landscape, scenic or noncontact recre-ational purposes.
C. Commercial Office Building: Any building for
office or commercial uses with water requirements which include, but are not limited to, landscape irrigation, toilets, urinals and decorative foun-tains.
D. Recycled Water Distribution System: A piping
system intended for the delivery of recycled water
separate from and in addition to the potable water distribution system.
E. Greenbelt Areas: A greenbelt area includes, but
is not limited to golf courses, cemeteries, parks and landscaping.
F. Industrial Process Water: Water used by any
industrial facility with process water require-ments which include, but are not limited to, rins-

26-3
ing, washing, cooling and circulation, or con-struction, including any facility regulated for industrial waste or other objectionable discharge under District Code of Ordinances Sections 52.04, 52.05 and 52.06.
G. Off-Site Facilities: Water facilities from the
source of supply to the point of connection with the on-site facilities, normally up to and includ-ing the water meter.
H. On-Site Facilities: Water facilities under the
control of the owner normally downstream from the water meter.
I. Potable Water: Water which conforms to the fed-eral, state and local standards for human consump-tion.
J. Recycled Water: Recycled water means water which,
as a result of treatment, is suitable for a direct beneficial use or controlled use that would not otherwise occur. (See Water Code Section 13050(n).)
K. Recycled Water Use Permit: A recycled water
permit means a permit issued by the District approving and conditioning recycled water service for a particular site.
L. Recycled Water Site Supervisor: A person
responsible for the safe and efficient installation, operation and maintenance of a recycled water use site, including but not limited to compliance with all applicable permits, enforcement of the recycled water producer’s rules and regulations and the prevention of potential hazards, such as cross-connections. The Recycled Water Site Supervisor must be certified by an approved Recycled Water Site Supervisor Certification Training Class offered within the County of San Diego and must have evidence of valid certification at all times while acting as Recycled Water Site Supervisor.
M. Temporary Recycled Water Use Permit: Temporary
recycled water use permit means a permit issued by the District, at its discretion, to allow temporary use of recycled water pending issuance of a recycled water use permit or pending renewal of such permit following suspension or termination due to a violation of the provisions of this Section.

26-4
N. Waste Discharge: Waste Discharge means water deposited, released or discharged into a sewer system from any commercial, industrial or residen-tial source which contains levels of any substance or substances which may cause substantial harm to any water treatment or reclamation facility or which may prevent any use of reclaimed water authorized by law.
26.04 WATER RECLAMATION MASTER PLAN A. General: The General Manager shall prepare and
adopt a Water Recycling Master Plan to define, encourage, and develop the use of recycled water within the District's boundaries. The Master Plan
shall be updated not less often than every five years.
B. Contents of the Water Recycling Master Plan: The
Master Plan shall include, but not be limited to, the following:
1. Plants and Facilities. Evaluation of the
location and size of present and future recycling treatment plants, distribution pipelines, pump stations, reservoirs, and other related facilities, including cost estimates and potential financing methods.
2. Recycled Water Service Areas. A designation, based on the criteria set forth in Section 26.02 and the information derived from Section 26.04B.1. and this Section 26.04B.2. of the areas within the District that can or may in the future use recycled water in lieu of potable water. Recycled water uses may include, but are not limited to, the irriga-tion of greenbelt and agricultural areas, filling of artificial lakes, and appropriate industrial and commercial uses.
3. Designate Tributary Areas. For each water
reclamation facility identified in the Master Plan, designate proposed tributary areas.
Within such areas, discharges to the sewage system shall be subject to permitting, moni-toring and control measures to protect public health, safety and public and private prop-erty. Designation of tributary areas shall be adopted by ordinances, and may be included in the Master Plan. Prior to designation of tributary areas, appropriate notice shall be given to property owners and residents of the area.

26-5
4. Quality of Water to be Recycled. For each
water reclamation treatment facility, evalu-ate water quality with respect to the effect on anticipated uses of recycled water to be served by each treatment facility. Evaluate sources of waste discharge and sewer inflow that may, directly or cumulatively, substan-tially contribute to adverse water quality conditions in recycled water.
5. Tributary Protection Measures. Develop rec-
ommended control measures and management practices for each designated tributary area to maintain or improve the quality of
recycled water. Such control measures may include capital improvements to the sewer collection system and waste discharge restrictions for industrial, commercial and residential discharges.
6. Mandatory Recycled Water Use. For each
recycled water service area, evaluate whether greenbelt irrigation, agricultural irrigation, commercial office buildings, filling of artificial lakes, or industrial processes shall be limited to the use of recycled water. As appropriate, mandate construction of recycled water distribution
systems or other facilities in new and exist-ing developments for current or future recycled water use as a condition of any development approval or continued water ser-vice if future reclamation facilities are proposed in the Master Plan that could ade-quately serve the development, in accordance with the procedures described in Section 26.05. Identify resources and adopt measures to assist water users in the financing of necessary conversions.
7. Rules and Regulations for Recycled Water Use.
Establish general rules and regulations governing the use and distribution of
recycled water. 8. Public Awareness Program. Establish a com-
prehensive water reclamation public awareness program.
9. Coordination Among Agencies. An examination
of the potential for initiating a coordinated effort between the District and other

26-6
regional agencies to share in the production and utilization of recycled water.
26.05 PROCEDURES A. Existing Potable Water Service. 1. Preliminary Determination. Based upon the
Master Plan, upon the designation of each recycled water service area or the commence-ment of the design of new recycled water facilities, the General Manager shall make preliminary determinations as to which exist-ing potable water customers shall be con-verted to the use of recycled water. Each
water customer shall be notified of the basis for a determination that conversion to recycled water service will be required, as well as the proposed conditions and schedule for conversion.
2. Notice. The notice of the preliminary deter-
mination, including the proposed conditions and time schedule for compliance, and a recycled water permit application shall be sent to the water customer by certified mail.
3. Objections; Appeals. The water customer may
file a notice of objection with the District
within thirty (30) days after any notice of determination to comply is delivered or mailed to the customer, and may request reconsideration of the determination or modi-fication of the proposed conditions or sched-ule for conversion. The objection must be in writing and specify the reasons for the objection. The preliminary determination shall be final if the customer does not file a timely objection. Staff (Engineering Department) shall review the objection and shall confirm, modify or abandon the prelimi-nary determination. Upon issuance of a final determination in writing by Staff, customer may appeal the determination upon written
application to the Board of Directors after the final determination made by the Staff (Engineering Department). The customer’s written application to the Board of Directors to appeal the final determination must be received within thirty (30) days of the customer receiving the final determination.
B. Development and Water Service Approvals.
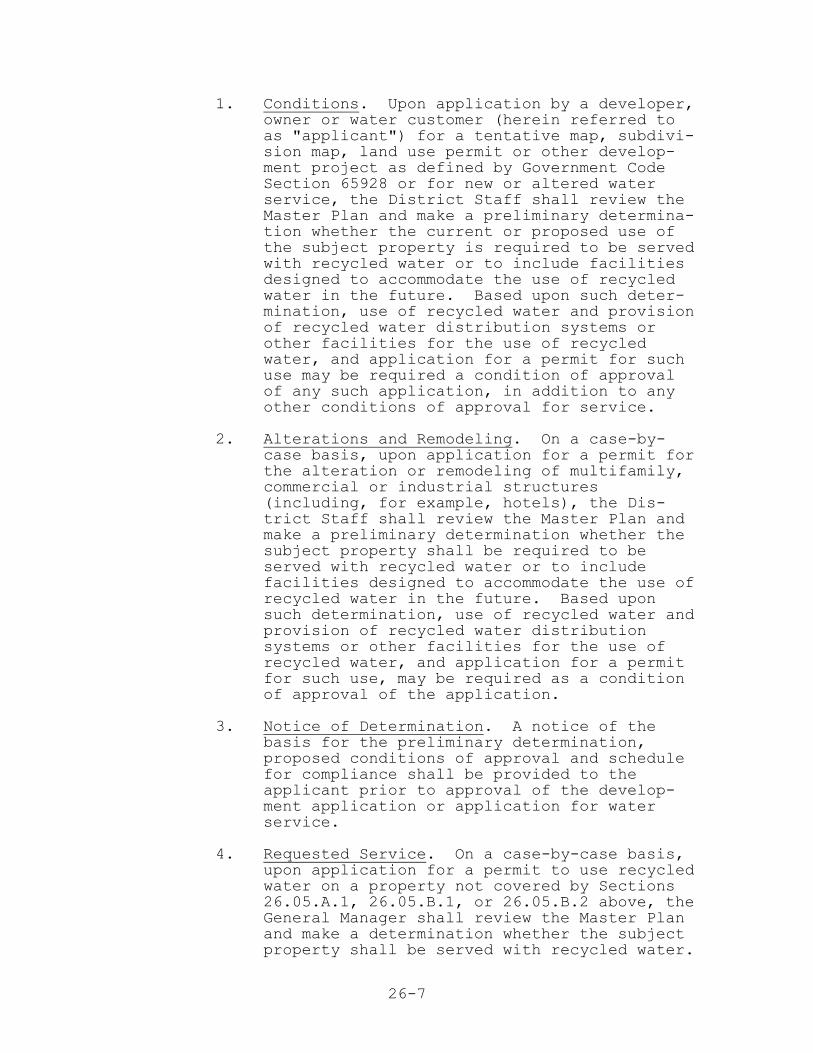
26-7
1. Conditions. Upon application by a developer, owner or water customer (herein referred to as "applicant") for a tentative map, subdivi-sion map, land use permit or other develop-ment project as defined by Government Code Section 65928 or for new or altered water service, the District Staff shall review the Master Plan and make a preliminary determina-tion whether the current or proposed use of the subject property is required to be served with recycled water or to include facilities designed to accommodate the use of recycled water in the future. Based upon such deter-mination, use of recycled water and provision of recycled water distribution systems or
other facilities for the use of recycled water, and application for a permit for such use may be required a condition of approval of any such application, in addition to any other conditions of approval for service.
2. Alterations and Remodeling. On a case-by-
case basis, upon application for a permit for the alteration or remodeling of multifamily, commercial or industrial structures (including, for example, hotels), the Dis-trict Staff shall review the Master Plan and make a preliminary determination whether the subject property shall be required to be
served with recycled water or to include facilities designed to accommodate the use of recycled water in the future. Based upon such determination, use of recycled water and provision of recycled water distribution systems or other facilities for the use of recycled water, and application for a permit for such use, may be required as a condition of approval of the application.
3. Notice of Determination. A notice of the
basis for the preliminary determination, proposed conditions of approval and schedule for compliance shall be provided to the applicant prior to approval of the develop-
ment application or application for water service.
4. Requested Service. On a case-by-case basis,
upon application for a permit to use recycled water on a property not covered by Sections 26.05.A.1, 26.05.B.1, or 26.05.B.2 above, the General Manager shall review the Master Plan and make a determination whether the subject property shall be served with recycled water.
26-8
Based upon such determination, the application for the permit shall be accepted and processed subject to Section 26.05.C.
C. Recycled Water Permit Process. Upon a final
determination by the General Manager that a prop-erty shall be served with recycled water, or adoption of a condition of development approval or water service requiring use or accommodation of the use of recycled water, the water customer owner or applicant shall obtain a recycled water permit.
1. Permit Conditions. The permit shall specify
the design and operational requirements for
the applicant's water distribution facilities and schedule for compliance, based on the rules and regulations adopted pursuant to Section 26.04.B and shall require compliance with both the California Department of Health Services Wastewater Recycling Criteria (see California Code of Administrative Regula-tions, Title 22), and requirements of the Regional Water Quality Control Board.
2. Plan Approval. Plans for the recycled and
non-recycled water distribution systems for the parcel shall be reviewed by the District Engineer and a field inspection conducted
before the plans are approved.
3. Meter Permit Issuance. Upon completion of construction and approval by the District and the County Department of Environmental Health the meter permit shall be issued. Recycled water shall not be supplied to a property until inspection by the District determines that the applicant is in compliance with the permit conditions.
4. Recycled Water Use Permit Issuance. If the
site has a certified Recycled Water Site Supervisor, a Recycled Water Use Permit will be issued by the District. If the site does
not have a certified Recycled Water Site Supervisor identified, a Temporary Recycled Water Use Permit may be issued, for a maximum of 120 days, to allow the site to receive recycled water while a proposed Recycled Water Site Supervisor is being certified. Failure to secure a certified Recycled Water Site Supervisor for the site under a Temporary Recycled Water Use Permit may
26-9
result in discontinuation of recycled water service to the site.
D. Temporary Use of Potable Water. At the discretion
of the General Manager, potable water may be made available on a temporary basis, until recycled water is available. Before the applicant receives temporary potable water, a water reclamation per-mit, as described in Section 26.05.C, must be obtained for new on-site distribution facilities. Prior to commencement of recycled water service, an inspection of the on-site facilities will be conducted to verify that the facilities have been maintained and are in compliance with the recycled water permit and current requirements for service.
Upon verification of compliance, the applicant shall be notified of the corrective actions necessary and shall have at least thirty (30) days to take such actions prior to initiation of enforcement proceedings.
E. Recycled Water Rate. The rate charged for
recycled water shall be established by Ordinance of the Board of Directors.
F. Certified Recycled Water Site Supervisor
Requirements.
1. Each Approved Recycled Water Use Site is
required to have a Certified Recycled Water
Site Supervisor. It is the responsibility of
the recycled water use site owner or property
designee to assure a Certified Recycled Water
Site Supervisor is assigned to the recycled
water use site.
2. Each approved recycled water use site shall
maintain and report annually proof of
Recycled Water Site Supervisor certification,
a current address, and a 24-hour emergency
contact phone number for the assigned
Recycled Water Site Supervisor on a form
approved by the Otay Water District. Failure
to report the prescribed Recycled Water Site
Supervisor information annually may result in
discontinuation of recycled water service to
the site.
3. Recycled Water Site Supervisors shall hold a
valid and current certification from a
Recycled Water Site Supervisor Certification
Training Course recognized by the San Diego

26-10
County Health Department and approved by Otay
Water District. Evidence of said
certification shall be available on site and
upon request by the District. Certification
alone does not constitute District approval.
Recertification of the Recycled Water Site
Supervisor is required every five years.
4. The Recycled Water Site Supervisor shall be
solely responsible for communications with
the property owner or property designee for
all on site recycled water issues.
5. Periodic inspection of the Approved Recycled
Water Use Site may be made by the District to
verify conformance with the approved Recycled
Water Use Permit. If at any time the Otay
Water District conducts an inspection of a
recycled water use site and the Recycled
Water Site Supervisor’s certification is
expired or it has been determined that the
recycled water use site has failed to meet
the requirements of the permit, recycled
water service to the site shall be
discontinued until the recycled water site is
brought back into compliance with the
approved Recycled Water Use Permit.
6. The District reserves the right to recommend
removal of a Recycled Water Site Supervisor
if it has been determined upon inspection
that the Recycled Water Site Supervisor’s
actions have placed the public at risk
through improper conduct, testing, repairs,
unapproved modifications, and/or reporting
with respect to an Approved Recycled Water
Use Site.
26.06 REGULATION OF WASTE DISCHARGE TO SEWERAGE SYSTEMS A. Intent. The District recognizes that to maintain
adequate wastewater quality for water reclamation treatment processes, and to protect public and private property, restrictions may be required on certain industrial, commercial and residential waste discharges to a sewerage system that is located within a designated tributary area of an existing or planned reclamation facility.
B. Adopted Tributary Protection Measures. Waste dis-
charges to the sewerage system from any indus-
26-11
trial, commercial or residential source may be restricted or prohibited upon a finding, following a noticed public hearing, that the type or class of discharge involved is capable of causing or may cause substantial damage or harm to any sewage treatment or reclamation facility or to any sig-nificant user or users or potential user or users of recycled water within an area which has been planned for recycled water service. Prohibitions for certain discharges and guidelines for accept-ability of wastes are set forth in District Code of Ordinances Sections 52.04, PROHIBITIONS AGAINST DISCHARGE OF OBJECTIONABLE WASTES, which prohibits discharge of certain items into the District sewer system, including, but not limited to, brine dis-
charge from on-site self-regenerating water sof-tener units; 52.05, GUIDELINES TO DETERMINE ACCEPTABILITY OF WASTES; and 52.06, DISCHARGE OF INDUSTRIAL WASTE.
26.07 SANCTIONS. In addition to the remedies
established under Division IV of this Code, the following sanctions and remedies apply to violations of the provisions of this Section.
A. Public Nuisance. Discharge of wastes or the use
of recycled water in any manner in violation of this ordinance or of any permit issued hereunder is hereby declared a public nuisance and shall be
corrected or abated as directed by the General Manager. Any person creating such a public nui-sance is guilty of a misdemeanor.
B. Injunction. Whenever a discharge of wastes or use
of recycled water is in violation of this ordi-nance or otherwise causes or threatens to cause a public nuisance, the District may seek injunctive relief as may be appropriate to enjoin such discharge or use.
C. Permit Suspension or Revocation. In addition to
any other provision of this Code or state statute or rule authorizing termination of water service, the General Manager may suspend or revoke a permit
issued hereunder if a violation of any provision of this ordinance or the Rules and Regulations for Recycled Water Use is found to exist or if a discharge of wastes or use of recycled water causes or threatens to cause a nuisance. If a permit is revoked, the General Manager may, at its discretion, issue the recycled water user a temporary recycled water permit for up to 120 days to allow service to continue while corrective measures are completed.
26-12
D. Penalty. Any owner and/or operator who violates
this ordinance shall, for each day of violation, or portion thereof, be subject to an administrative fine as described in Section 72.05.
26.08 VALIDITY If any provision of this Section 26 or the application thereof to any person or circumstance is held invalid, the remainder of Section 26 and the application of such provi-sions to other persons or circumstances shall not be affected thereby.

Appendix H Water Authority Documentation of
Supply Reliability

Section 5 Member Agency Supplies
5.1 Introduction Local resources developed and managed by the Water Authority’s member agencies are critical to securing a diverse and reliable supply for the region. Local projects reduce demands for imported water and provide agencies with a drought-resilient supply. This section provides general information on the local resources being developed and managed by the member agencies. These supplies include surface water, groundwater, recycled water, potable reuse and desalinated seawater.
The Water Authority, working closely with its member agencies, took the following steps to update the yields anticipated from the member agencies’ local supplies:
1. Provided the member agencies with the projected supply numbers included in the Water Authority’s Updated 2010 Plan and requested they update the figures for their specific project(s) and separate the projects into three project categories: “verifiable,” “additional planned,” and “conceptual.” These categories are based on the stages of development, as defined in the introduction of Section 4, “San Diego County Water Authority Supplies.”
2. Prepared revised projections based on input from agencies.
3. Presented revised supply numbers to member agencies at several meetings and continued working with them to ensure the figures accurately reflected their project implementation efforts.
4. Distributed the administrative draft of the 2015 Plan to member agencies for their review, providing the agencies another opportunity to review and revise the updated local supply figures prior to Water Authority Board approval.
Before 1947, the San Diego region relied on local surface water runoff in normal and wet weather years and on groundwater pumped from local aquifers during dry years when stream flows were reduced. As the economy and population grew, local resources became insufficient to meet the region’s water supply needs. From the 1950s onward, the region became increasingly reliant on imported water supplies. Since 1980, a range of 5 to 36 percent of the water used within the Water Authority’s service area has come from local sources, primarily from surface water reservoirs with yields that vary directly with annual rainfall. A small but growing share of local supply comes from recycled water and groundwater recovery projects, with additional local supply planned from potable reuse and seawater desalination. Yield from these projects is considered drought-resilient since the projects are primarily independent of precipitation. In fiscal year 2015, total local water sources provided 10 percent of the water used in the Water Authority’s service area.
DRAFT 2015 Urban Water Management Plan 5-1 April 2016

San Diego County Water Authority
Section 5. Member Agency Supplies
5.2 Surface Water 5.2.1 Description
The regional surface water yield is supported by 24 surface reservoirs with a combined capacity of 746,385 AF. These reservoirs are located in seven of San Diego County’s nine coastal watersheds. Runoff in these watersheds occurs at the crest of the county’s Peninsular Range and drains into the Pacific Ocean. The oldest of these reservoirs, Cuyamaca, was constructed in 1887. Table 5-1 lists the 24 reservoirs, together with their operating agency and storage capacity.
Olivenhain Reservoir, completed in 2003, is the region’s newest reservoir. It is part of the Water Authority’s Emergency Storage Project (ESP) and has a storage capacity of 24,789 AF. The ESP adds 90,100 AF of additional storage capacity and is designed to protect the region from disruptions in the water delivery system. In addition, the 2002 Regional Water Facilities Master Plan (Master Plan) identified an opportunity to augment the ESP with a carryover storage component at San Vicente. The Water Authority completed the ESP and Carryover Storage Project (CSP) portion of the San Vicente Dam Raise in mid-2014, which provides an additional 152,000 AF of water storage capacity. Refer to Section 11.1.2 and 11.2.3 for additional information on the Water Authority’s emergency and carryover storage.
Table 5-1 Major San Diego County Reservoirs
Agency (Owner) Reservoir Capacity (AF)
Carlsbad MWD Maerkle 600
Escondido, City of Dixon 2,606
Escondido, City of Wohlford 6,506
Fallbrook PUD Red Mountain 1,335
Helix WD Cuyamaca 8,195
Helix WD Jennings 9,790
Poway, City of Poway 3,330
Rainbow MWD Morro Hill 465
Ramona MWD Ramona 12,000
San Diego, City of Barrett 34,806
San Diego, City of El Capitan 112,807
San Diego, City of Hodges 30,633
San Diego, City of Lower Otay 49,849
San Diego, City of Miramar 6,682
San Diego, City of Morena 50,694
San Diego, City of Murray 4,684
San Diego, City of San Vicente 1 249,358
San Diego, City of Sutherland 29,508
DRAFT 2015 Urban Water Management Plan 5-2 April 2016
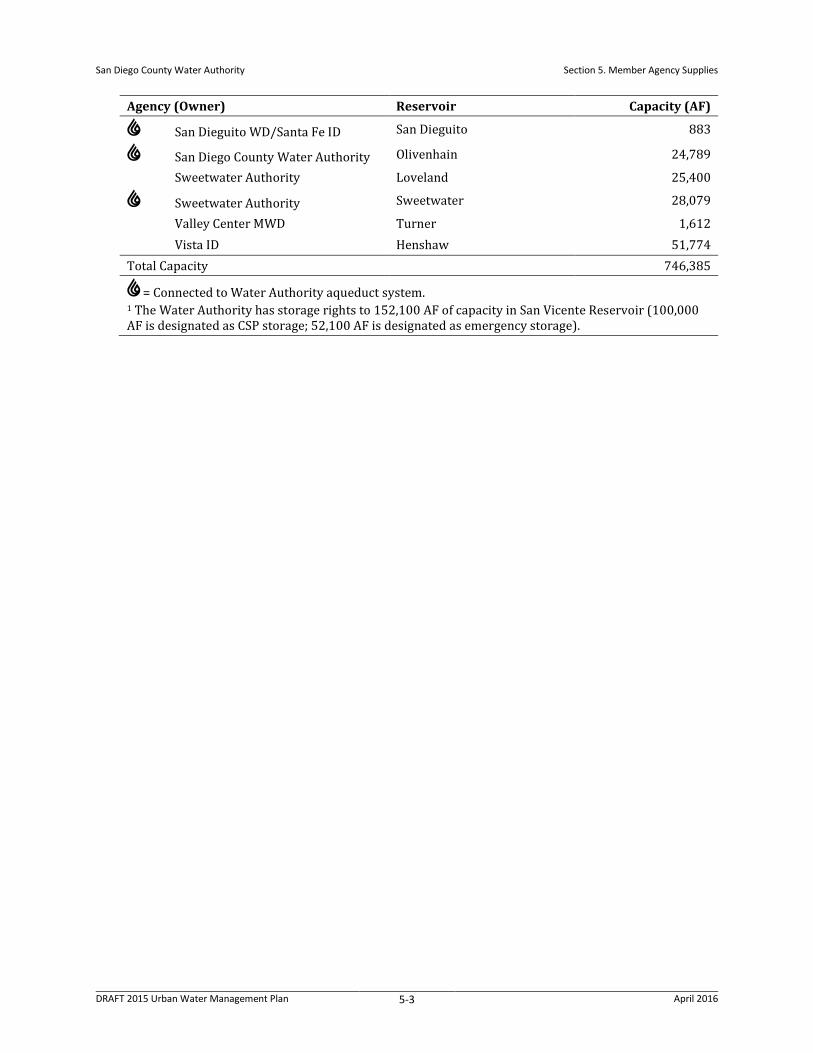
San Diego County Water Authority
Section 5. Member Agency Supplies
Agency (Owner) Reservoir Capacity (AF)
San Dieguito WD/Santa Fe ID San Dieguito 883
San Diego County Water Authority Olivenhain 24,789
Sweetwater Authority Loveland 25,400
Sweetwater Authority Sweetwater 28,079
Valley Center MWD Turner 1,612 Vista ID Henshaw 51,774 Total Capacity 746,385
= Connected to Water Authority aqueduct system. 1 The Water Authority has storage rights to 152,100 AF of capacity in San Vicente Reservoir (100,000 AF is designated as CSP storage; 52,100 AF is designated as emergency storage).
DRAFT 2015 Urban Water Management Plan 5-3 April 2016
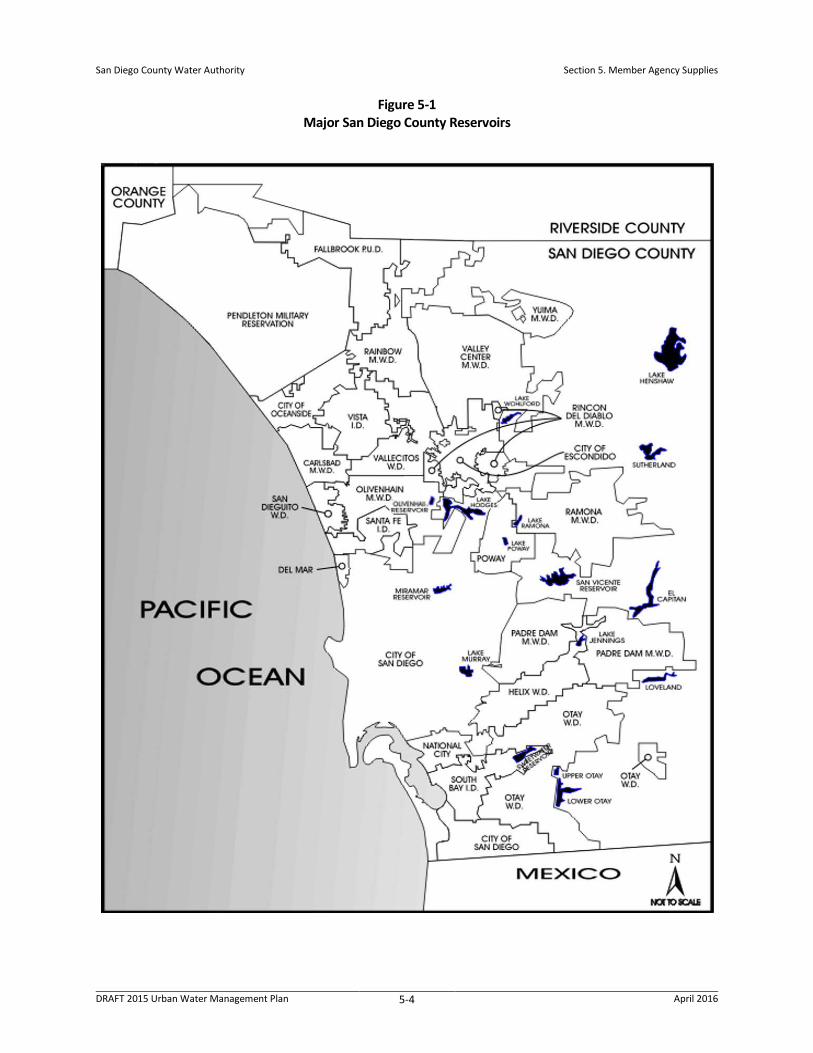
San Diego County Water Authority
Section 5. Member Agency Supplies
Figure 5-1 Major San Diego County Reservoirs
DRAFT 2015 Urban Water Management Plan 5-4 April 2016

San Diego County Water Authority
Section 5. Member Agency Supplies
5.2.2 Issues
Management The Water Authority’s member agencies manage most of the region’s reservoirs. The San Vicente Dam Raise was completed in mid-2014 and CSP water began to be stored a year later. Together with the city of San Diego, the Water Authority coordinates San Vicente operations to optimize the use of their respective storage pools. The Water Authority also coordinates storage in Lake Hodges with the city, in order to manage its pumped storage project. The Lake Hodges Pumped Storage Project delivers water uphill to Olivenhain Reservoir in off-peak hours, generating electricity during peak demand periods through a coordinated release schedule. Also, in coordination with its member agencies, the Water Authority manages the imported conveyance system to achieve the optimal use of local and imported water resources, which include the local reservoirs. To reduce the need for imported water purchases, the reservoirs are operated to maximize the use of this local supply. Local surface water supplies can also offset dry-year shortfalls in imported water. Maximizing local yield reduces losses due to evaporation and spills, but it also results in increased demands for imported water during dry years when imported water is more likely in short supply. Most member agencies maintain some portion of their storage capacity for emergency storage. To optimize the use of local storage, the Water Authority works with its member agencies through periodic storage agreements and through its annual Aqueduct Operating Plan. Storage agreements allow for carryover storage to be placed in member agency reservoirs and to provide increased local storage capacity, which can be used during peaks on the aqueduct system. The aqueduct operating plans coordinate imported water deliveries and optimize reservoir fill opportunities. Local yield is maximized by the member agencies that operate the reservoirs.
Water Quality See Section 7, “Water Quality,” for a relevant discussion of water quality issues related to the region’s water supply.
5.2.3 Projected Surface Water Supplies Surface water supplies can represent the largest single local resource in the Water Authority’s service area. However, annual surface water yields can vary substantially due to fluctuating hydrologic cycles. Since 1990, annual surface water yields have ranged from a low of 4,100 AF in fiscal year 2015 to a high of 140,300 AF in fiscal year 1984. Water Authority member agencies project average annual surface water use to decrease slightly, from 51,580 AF in 2020 to 51,180 AF in 2040.
A list of the individual reservoirs, expected yield, and basis for the supply figure can be found in Appendix F, Table F-1. Table 5-2 shows the projected average surface water supply within the Water Authority’s service area, and the yields are utilized in the reliability analysis included in Section 9, “Water Supply Reliability.”
Member agencies expect to include specific information on the projected yields from local reservoirs in 2015 plans.
DRAFT 2015 Urban Water Management Plan 5-5 April 2016
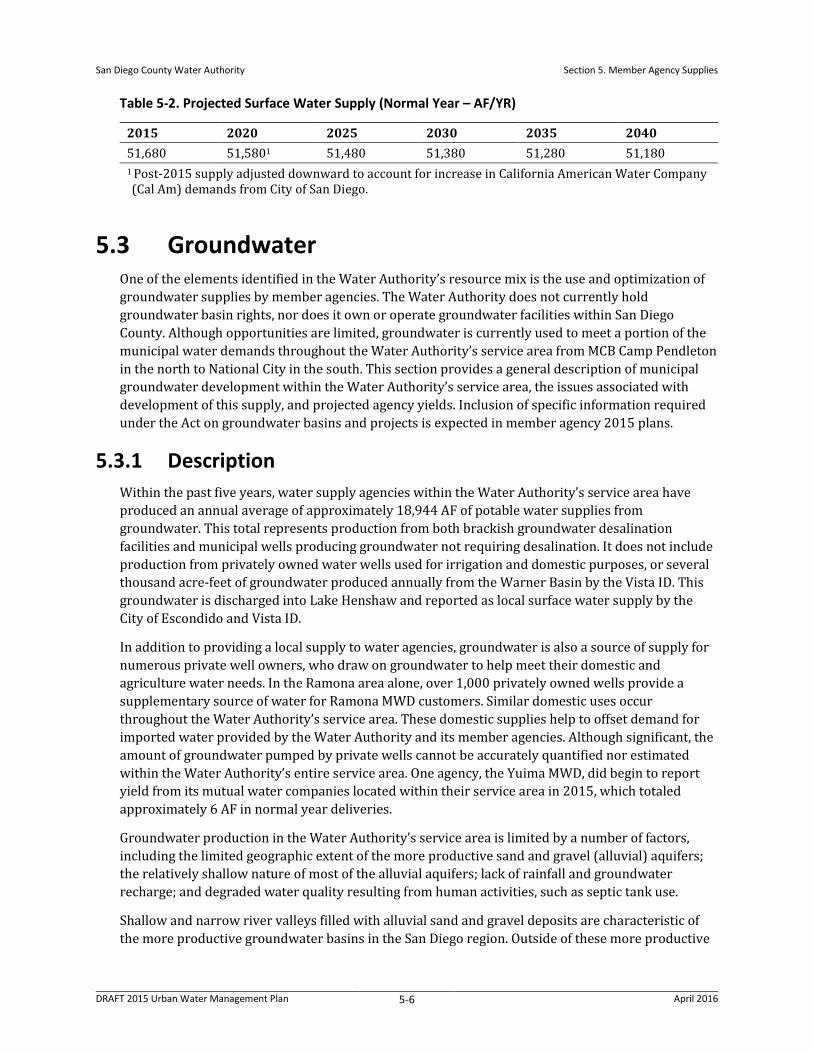
San Diego County Water Authority
Section 5. Member Agency Supplies
Table 5-2. Projected Surface Water Supply (Normal Year – AF/YR)
2015 2020 2025 2030 2035 2040 51,680 51,5801 51,480 51,380 51,280 51,180 1 Post-2015 supply adjusted downward to account for increase in California American Water Company (Cal Am) demands from City of San Diego.
5.3 Groundwater One of the elements identified in the Water Authority’s resource mix is the use and optimization of groundwater supplies by member agencies. The Water Authority does not currently hold groundwater basin rights, nor does it own or operate groundwater facilities within San Diego County. Although opportunities are limited, groundwater is currently used to meet a portion of the municipal water demands throughout the Water Authority’s service area from MCB Camp Pendleton in the north to National City in the south. This section provides a general description of municipal groundwater development within the Water Authority’s service area, the issues associated with development of this supply, and projected agency yields. Inclusion of specific information required under the Act on groundwater basins and projects is expected in member agency 2015 plans.
5.3.1 Description Within the past five years, water supply agencies within the Water Authority’s service area have produced an annual average of approximately 18,944 AF of potable water supplies from groundwater. This total represents production from both brackish groundwater desalination facilities and municipal wells producing groundwater not requiring desalination. It does not include production from privately owned water wells used for irrigation and domestic purposes, or several thousand acre-feet of groundwater produced annually from the Warner Basin by the Vista ID. This groundwater is discharged into Lake Henshaw and reported as local surface water supply by the City of Escondido and Vista ID.
In addition to providing a local supply to water agencies, groundwater is also a source of supply for numerous private well owners, who draw on groundwater to help meet their domestic and agriculture water needs. In the Ramona area alone, over 1,000 privately owned wells provide a supplementary source of water for Ramona MWD customers. Similar domestic uses occur throughout the Water Authority’s service area. These domestic supplies help to offset demand for imported water provided by the Water Authority and its member agencies. Although significant, the amount of groundwater pumped by private wells cannot be accurately quantified nor estimated within the Water Authority’s entire service area. One agency, the Yuima MWD, did begin to report yield from its mutual water companies located within their service area in 2015, which totaled approximately 6 AF in normal year deliveries.
Groundwater production in the Water Authority’s service area is limited by a number of factors, including the limited geographic extent of the more productive sand and gravel (alluvial) aquifers; the relatively shallow nature of most of the alluvial aquifers; lack of rainfall and groundwater recharge; and degraded water quality resulting from human activities, such as septic tank use.
Shallow and narrow river valleys filled with alluvial sand and gravel deposits are characteristic of the more productive groundwater basins in the San Diego region. Outside of these more productive
DRAFT 2015 Urban Water Management Plan 5-6 April 2016
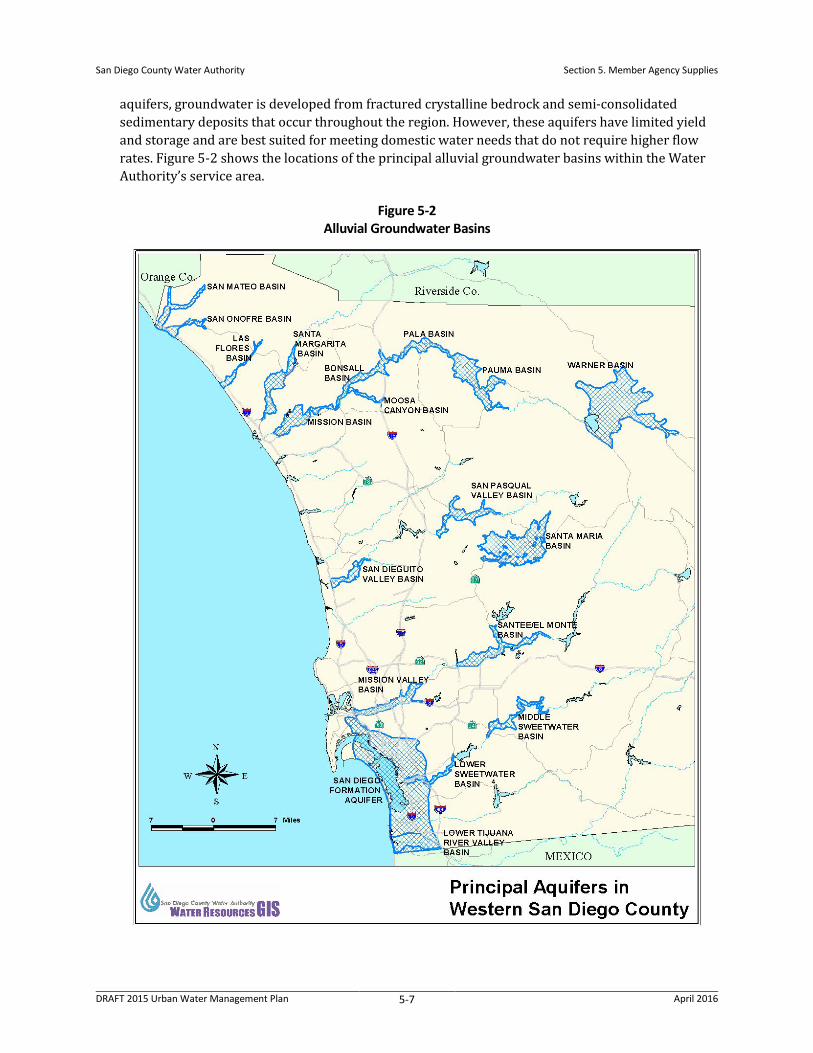
San Diego County Water Authority
Section 5. Member Agency Supplies
aquifers, groundwater is developed from fractured crystalline bedrock and semi-consolidated sedimentary deposits that occur throughout the region. However, these aquifers have limited yield and storage and are best suited for meeting domestic water needs that do not require higher flow rates. Figure 5-2 shows the locations of the principal alluvial groundwater basins within the Water Authority’s service area.
Figure 5-2 Alluvial Groundwater Basins
DRAFT 2015 Urban Water Management Plan 5-7 April 2016
San Diego County Water Authority
Section 5. Member Agency Supplies
Although groundwater supplies are less plentiful in the San Diego region than in some other areas of California, such as the Los Angeles Basin in Southern California and the Central Valley in Northern California, the Water Authority believes that sufficient undeveloped brackish groundwater supplies exist that could help meet a greater portion of the region’s future water demand. Several agencies within the Water Authority’s service area have identified potential projects that may provide several thousands of acre-feet of additional groundwater production in the coming years. A general summary and description of these projects is presented below.
Groundwater Extraction and Disinfection Projects Groundwater that can be extracted and used as a potable water supply, with little more than disinfection, generally occurs outside the influence of human activities and within the upper reaches of the east–west trending watersheds. Wells producing higher quality water are operated by MCB Camp Pendleton (Santa Margarita River watershed) and the Sweetwater Water Authority (San Diego Formation aquifer). The Vista ID also operates numerous high-quality extraction wells in the Warner Basin, located in the upper San Luis Rey River watershed. The water from these wells is discharged to Lake Henshaw and eventually to the San Luis Rey River where it is then diverted farther downstream for use in Escondido and elsewhere. The unit cost of water produced from simple groundwater extraction and disinfection projects is low and generally well below the cost of imported water. Although a substantial amount of the higher quality groundwater within the Water Authority’s service area is already utilized, the primary focus for future local groundwater development is brackish groundwater recovery and recharge projects.
Brackish Groundwater Recovery Projects Groundwater high in salts and total dissolved solids (TDS) and other contaminants, that requires advanced treatment prior to potable use, is typically found in shallow basins in the downstream portions of watersheds. Brackish groundwater recovery projects use membrane technology, principally reverse osmosis, to treat extracted groundwater to potable water standards. The City of Oceanside’s 6.37-MGD capacity Mission Basin Desalter and the Sweetwater Authority's existing 4.0-MGD Richard A. Reynolds Groundwater Desalination Facility are the only currently operating brackish groundwater recovery and treatment facilities within the Water Authority’s service area. The City of San Diego is currently gauging the feasibility of developing two brackish groundwater projects, including the Mission Valley Brackish Groundwater Recovery Project. Unit costs for brackish groundwater recovery projects are considerably higher than those for simple groundwater extraction and disinfection projects due to the additional treatment requirements and the cost of concentrate (brine) disposal. However, where economical options exist for disposal of brine, this type of groundwater project has proven to be an economically sound water-supply option.
Groundwater Recharge and Recovery Projects Artificial recharge and recovery projects, also referred to as conjunctive-use projects, can increase groundwater basin yields by supplementing the natural recharge process. Conjunctive-use projects divert water supplies to percolation basins or injection wells to supplement natural rainfall runoff recharge. Captured rainfall runoff, recycled water, imported water, or a combination thereof, can be used to recharge groundwater basins when water levels have been lowered sufficiently by pumping. Groundwater basins can be operated similar to surface water reservoirs to supply stored water to the region if imported deliveries are limited due to high demand, supply and facility constraints, or a
DRAFT 2015 Urban Water Management Plan 5-8 April 2016
San Diego County Water Authority
Section 5. Member Agency Supplies
combination thereof. The Fallbrook PUD and MCB Camp Pendleton are currently exploring the feasibility of such projects.
5.3.2 Issues Local water agencies often need to consider a multitude of issues during the planning, permitting, design, construction and operation of a groundwater project. The issues can include dealing with hydrogeological uncertainties, high upfront study and subsurface investigation costs, higher unit costs association with brackish groundwater recovery and treatment, project funding considerations, water rights, regulatory and environmental concerns, and possible contamination of groundwater that might occur after the project is constructed and facilities are brought online. Although these issues in the past have discouraged decision makers and have limited groundwater development in San Diego County, state-wide drought conditions and water supply reliability concerns are prompting renewed consideration of the viability of local groundwater development and cleanup projects for this region.
Hydrogeological and Environmental Impact Uncertainty In groundwater basins not recently used as a source of a municipal water supply by an agency, and where a general lack of information exists regarding issues such as the physical nature of the aquifer materials, existing wells and groundwater production, water quality, and potential impact of pumping to riparian habitat, significant resources must be expended prior to determining the feasibility of a project. Subsurface exploration and field investigations are costly and time consuming. In addition, data management and utilization generally requires the development of costly large-scale numerical models. These issues, in conjunction with financial considerations, often dictate that groundwater projects be developed, and production increased incrementally, in a planned and managed fashion.
Economic and Financial Considerations Because of the saline nature of the water and the presence of other contaminants in many of the groundwater basins in San Diego County, the cost of groundwater development often requires demineralization and brine disposal facilities, which can be costly to construct and operate.
Institutional, Legal, and Regulatory Issues Institutional and legal issues can also impact project development. Because groundwater basins often involve multiple water agencies and/or numerous private wells and water-right holders, water rights and management authority should be addressed before a project progresses beyond the planning stage. Agencies are often reluctant to initiate groundwater development projects that go beyond the feasibility study stage unless jurisdiction and water rights issues are resolved beforehand. As challenging as those issues may be, recent drought conditions have prompted local agencies to attempt to resolve or overcome those barriers to groundwater development and proceed to groundwater project implementation. In September 2014, Gov. Jerry Brown signed a package of three bills known as the Sustainable Groundwater Management Act (SGMA), which sought to provide local agencies with a framework for managing groundwater basins in a manner that ensured basin resiliency, recognized that groundwater is most effectively managed at the local level, and empowered local agencies to achieve basin sustainability within 20 years. The SGMA
DRAFT 2015 Urban Water Management Plan 5-9 April 2016
San Diego County Water Authority
Section 5. Member Agency Supplies
further respected regional differences and provided for a tailored approach to planning. Other goals of the SGMA included:
• Established minimum standards for sustainable groundwater management
• Improved coordination between land use and groundwater planning
• Provided state technical assistance
• Created a mechanism for state intervention if, and only if, a local agency was not managing its groundwater sustainably
• Protected water rights
DWR Bulletin 118 identified 515 alluvial groundwater basins in California. DWR conducted an initial prioritization of the identified 515 basins, and those basins deemed high-and medium-priority basins are required by SGMA to develop Groundwater Sustainability Plans (GSPs) via a designated Groundwater Sustainability Agency (GSA). A GSA can be a local agency, a combination of local agencies, or a county. It is the GSA’s responsibility to develop and implement a GSP that considers all beneficial uses and users of groundwater in the basin. GSAs must be formed by June 30, 2017. In the San Diego region, four local basins were deemed medium priority:
• San Luis Rey Valley
• San Pasqual Valley
• Santa Margarita Valley
• San Diego River Valley
Regional and local agencies impacted by this requirement are taking steps to ensure SGMA compliance within the allotted timeframe. Uncertainty over future regulatory requirements for drinking water supplies can also pose additional barriers to project development. When developing facilities and compliance plans for groundwater development and/or groundwater recharge projects, agencies must take into account proposed or potential regulatory changes related to water quality issues. Some of the regulations for which changes are expected over the next decade include state and federal drinking water standards and California Division of Drinking Water (DDW) groundwater recharge regulations.
Environmental Regulatory Constraints Issues related to the environmental impacts that could potentially result from the fluctuation of groundwater levels when large quantities of groundwater are extracted are common to many of the groundwater projects proposed within the principal alluvial aquifers in the Water Authority’s service area. These issues include potential impacts on endangered species habitat and groundwater-dependent vegetation. Impacts may occur if a project results in seasonal or long-term decreases in the depth of the groundwater. Although potential environmental impacts can generally be mitigated, mitigation costs can reduce the cost-effectiveness of a project.
DRAFT 2015 Urban Water Management Plan 5-10 April 2016
Water Quality Remediation of groundwater contamination presents a significant, ongoing operations and maintenance cost that presents barriers to project implementation. See Section 7.5, “Groundwater,” for additional information on water quality for groundwater supplies.
Funding Grant funding for groundwater development has been steadily increasing. Beginning with Title XVI of Public Law (PL) 102-575, the Reclamation Wastewater and Groundwater Study and Facilities Act, which initially authorized the federal government to fund up to 25 percent of the capital cost of authorized recycling projects. PL 104-266, the Reclamation Recycling and Water Conservation Act of 1996, authorized two additional projects. One of those projects included funding for the City of Oceanside’s Mission Basin Brackish Groundwater Desalting Demonstration Project (additional detailed Title XVI funding information can be found under Section 5.4.3).
Since 1994, this project, along with the Sweetwater Authority’s groundwater desalination facility, also benefitted from receiving Groundwater Recovery Program Funding from Metropolitan. To date, over $13.9 million has been received from this funding source for both the City of Oceanside and Sweetwater Authority’s groundwater brackish projects.
Along with local and federal funding sources, in 2007, the San Diego Integrated Regional Water Management (IRWM) Program submitted a grant proposal to DWR for Proposition 50 funds. As a result of this grant award, the Santa Margarita Conjunctive Use Project was awarded grant funding to enhance groundwater basin recharge and recovery to provide water supplies for both MCB Camp Pendleton and Fallbrook PUD, which also resolved a long-standing water rights dispute. The project will provide approximately 3,100 acre-feet per year (AF/YR) of new local supply from the Santa Margarita River by conjunctively managing the groundwater basin. Additionally, 1,380 acres of sensitive habitat will also be preserved along the river as a result of this project. In Southern California, wastewater, brackish water and urban runoff are high in total dissolved solids (TDS) and other impurities that require advanced treatment to allow beneficial reuse.
The North San Diego County Cooperative Demineralization Project funded under Proposition 84 - Round 1 Implementation Grant, focuses on developing new local water supplies and managing water quality issues by constructing an advanced water treatment facility (San Elijo Water Reclamation Facility) to mitigate high TDS sources, increase beneficial reuse, and study the feasibility of brackish to potable water desalination in North San Diego County.
In 2014, also with Proposition 84 grant funding awarded through the San Diego IRWM, the Sweetwater Authority will be able to expand their production of potable water from desalinated brackish groundwater through expansion of the Richard A. Reynolds Groundwater Desalination Facility for an additional 5,200 AF/YR. The project involved drilling five new wells in the San Diego Formation, construction of an additional 20,000 linear feet of conveyance and potable pipelines, and facility modifications. The desalinated groundwater produced by the project will be added directly into the potable water supply, which will offset imported water purchases. Brine discharge from this project will also help to maintain the brackish quality in the Sweetwater River estuary, protecting against incursion by non-native freshwater species. The project was implemented by the Sweetwater Authority, in partnership with the City of San Diego. This multi-year project is expected to be completed in fiscal years 2016 and 2017.
DRAFT 2015 Urban Water Management Plan 5-11 April 2016

San Diego County Water Authority
Section 5. Member Agency Supplies
5.3.3 Projected Groundwater Supply Yield The Water Authority has worked closely with its member agencies to develop groundwater yield projections. The most reliable projections have been developed by considering only existing (verifiable) groundwater projects, which include planned expansions to existing projects.
Table 5-3 shows the projected annual yield from verifiable groundwater projects in five-year increments, based on projections and implementation schedules or existing projects and planned expansions provided by the member agencies. These are included in the reliability analysis found in Section 9, “Water Supply Reliability.” Table F-2, Appendix F contains a list of the projects and the projected supplies.
Table 5-3. Projected Groundwater Supply (Normal Year – AF/YR)
2015 2020 2025 2030 2035 2040 23,773 31,240 32,430 33,470 33,470 33,470
An overall projected increase in groundwater production from 2020 and beyond is due primarily from the expansion of the brackish groundwater recovery and treatment project currently operated by the City of Oceanside. The City of Oceanside completed an expansion of the capacity of its Mission Basin Desalter (6.37-MGD / 4.0-MGD expansion). The new conveyance and pumping facilities, completed in November 2013, can now convey all of the production produced. Monitoring will continue of ultimate production capacity or “safe yield” of the Mission Basin.
As previously described in Section 5.3.2, the Sweetwater Authority and the City of San Diego have joined together to expand the capacity of the Richard A. Reynolds Desalination Facility (owned by the Sweetwater Authority), and share in the cost of the project and the total 8,800 AF of water produced. The Reynolds Desalination Facility treats a local groundwater supply that has previously been non-potable or unusable. The facility was initially designed and constructed to accommodate an expansion in the production capacity.
Additional Planned Projects – Groundwater Maximizing groundwater development is critical to diversifying the region’s water supply portfolio. Beyond the projections of the more reliable and verifiable projects included in Table 5-3, member agencies have also identified two additional planned projects, with an estimated total of 3,600 AF/YR of additional yield in 2040. The Otay WD Rancho Del Rey Groundwater Well Development Project is expected to yield 500 AF/YR by 2030. Fallbrook PUD/MCB Camp Pendleton’s Santa Margarita Conjunctive-Use Project is projected to yield an additional 3,100 AF/YR by 2020. These additional yields are considered additional planned supplies and are reflected in Section 10, “Scenario Planning – Managing an Uncertain Future,” as potential strategies to manage future uncertainty planning scenarios. These additional planned projects, as well as the conceptual projects provided by the member agencies, are also included in Table F-2, Appendix F.
5.4 Water Recycling Another local supply identified in the Water Authority’s resource mix is the optimization of recycled water use. Every gallon of recycled water used within the region reduces the need to import or
DRAFT 2015 Urban Water Management Plan 5-12 April 2016
San Diego County Water Authority
Section 5. Member Agency Supplies
develop other water supplies. This section provides a general description of recycled water development within the Water Authority’s service area, the issues associated with developing this supply, and projected regional yield. Documentation on specific existing and future recycling projects is expected to be part of the 2015 plans for those agencies that include water recycling as a supply. The Water Authority coordinated the preparation of this section with its member agencies and those wastewater agencies that operate water recycling facilities within the Water Authority’s service area.
5.4.1 Description Water may be recycled for non-potable or potable purposes. This section considers non-potable recycling. Non-potable recycling is the treatment and disinfection of municipal wastewater to provide a water supply suitable for non-drinking uses. Non-potable recycling in the San Diego Region started back in the 1960s when Padre Dam MWD began recycling water for use in Santee Lakes. Water recycling started to increase significantly in the 1990s. Today agencies in San Diego County use recycled water to fill lakes, ponds, and ornamental fountains; to irrigate parks, campgrounds, golf courses, freeway medians, community greenbelts, school athletic fields, food crops, and nursery stock; and to control dust at construction sites. Recycled water can also be used in certain industrial processes, in cooling towers, and for flushing toilets and urinals in non-residential buildings. Recycled water is also used for street sweeping and firefighting purposes.
Local agencies must consider a number of issues when developing recycled water projects, including economic and financial considerations; regulatory, institutional, and public acceptance issues; and water quality concerns related to unknown or perceived health and environmental risks. These issues, if unresolved, can limit the amount of recycled water use in San Diego County. The following sections discuss some of the specific challenges associated with recycled water development.
With additional water treatment, recycled water can also be treated to drinking (potable) water standards. Additional information on this highly treated water source (termed “potable reuse”) can be found in Section 5.5.
Economic and Financial Considerations The capital-intensive cost of constructing recycled water projects and managing a dual distribution system has traditionally been a barrier to project implementation. The up-front capital costs for construction of treatment facilities and recycled water distribution systems can be high, while full market implementation is usually phased in over a number of years, resulting in very high initial unit costs that affect cash flow in the early project years. Some local agencies have been successful in expanding recycled water by requiring developers to install dual plumbed systems as new development infrastructure is built. Otay WD, Carlsbad MWD, and the City of San Diego have all been successful utilizing this approach.
The high costs associated with converting existing water customers to non-potable recycled water use have also been challenging. This situation is compounded by the seasonal nature of recycled water demands, a lack of seasonal storage and the lack of large industrial water users in San Diego County that can use recycled water. Projects that serve a large portion of irrigation demands, like the majority of the projects in the Water Authority’s service area, often use only half of their annual production capacity due to these seasonal demand patterns. The unit costs associated with these projects are generally higher than those of projects that serve year-round demands, since the project
DRAFT 2015 Urban Water Management Plan 5-13 April 2016

San Diego County Water Authority
Section 5. Member Agency Supplies
facilities must be sized to accommodate seasonal peaking. Projects that serve mostly irrigation demands also tend to have less stable revenue bases because irrigation demands are heavily influenced by hydrologic conditions.
Recycled water is typically stored in storage tanks and ponds. Availability of seasonal and operational storage can help ensure a continuous demand and production of recycled water throughout the year, thus making projects more cost-effective. To be economically feasible, a project’s benefits must offset or exceed its associated costs. Project benefits can take the form of (1) revenues from the sale of recycled water; (2) increased supply reliability; (3) increased control over the cost of future water supplies; and (4) avoided water and wastewater treatment, storage, and conveyance costs. Agencies developing recycled water projects must be able to quantify these benefits to determine the economic feasibility of a project. In addition, financial incentives and grant funding from federal and state agencies are critical to offsetting project costs and project implementation.
Regulatory Two state agencies have primary responsibility for regulating the application and use of recycled water: the State Water Resources Control Board Division of Drinking Water (DDW) and the California Regional Water Quality Control Boards (Water Boards). As of July 1, 2014, the administration of the Drinking Water Program (DWP) transferred from the Department of Public Health (DPH) to the State Water Resources Control Board (SWRCB). That reorganization specifically created the new DDW. This transfer of responsibility aligned the state’s drinking water and water quality programs in an integrated organizational structure that positioned the state to both protect water quality and the public health as related to water quality, while meeting current needs and future demands on water supplies. Planning and implementing water recycling projects entails numerous interactions with these regulatory agencies prior to project approval.
The DDW is responsible for establishing statewide criteria for recycled water uses in Title 22 of the California Administrative Code. Under Title 22, the standards are established for each general type of use based on the potential for human contact with recycled water. The highest degree of standards for recycled water is for unrestricted body contact.
The San Diego Water Board is charged with issuing permits and enforcing requirements for the application and use of recycled water for each recycled operation, which ensures compliance with basin plan objectives and incorporates recommendations from the DDW. As part of the permit application process, applicants must demonstrate that the proposed recycled water operation will meet the ground and surface water quality objectives in the basin management plan, and will comply with Title 22 requirements. With the consent of the recycled water supplier, the San Diego Water Board and DDW may delegate review of individual non-potable use sites to the County of San Diego Department of Environmental Health (DEH).
Coordination between the regulatory agencies responsible for monitoring development of recycled water is important, along with the development of a reasonable and consistent application of regulations. Project proponents need to work closely and cooperatively with regulatory agencies in their efforts to satisfy the regulations and still be able to develop much needed, cost-effective water recycling projects. To address regulatory gaps, the Water Authority and its member agencies met with local regulators in 2012 to tackle some of these regulatory concerns. This resulted in the drafting and execution of Consent Agreements between the DEH (with consent from DDW) and the
DRAFT 2015 Urban Water Management Plan 5-14 April 2016
San Diego County Water Authority
Section 5. Member Agency Supplies
member agencies that helped to target and focus limited regulatory staff resources to new sites and higher risk, complicated recycled water sites. Ongoing oversight of recycled water sites deemed low risk is now handled intenally by experienced, water agency staff. Cost savings and expedited recycled water hook-ups have resulted.
More recently, Water Authority staff provided direct technical assistance to local agencies by coordinating ad-hoc committee meetings and drafting technical documents to assist agencies to expedite the approval and installation of hauled recycled water fill stations and use of hauled recycled water for the following recycled water uses:
1. Street sweeping and cleaning of sidewalks and outdoor work areas,
2. Dust control, soil compaction, and construction,
3. Sewer flushing,
4. Pressure testing of newly constructed tertiary recycled water or sewer force main pipelines and gas pipelines,
5. Use of recycled water for irrigation of commercial and residential landscapes, crops, and nursery stock, and
6. Fire protection.
Acting regionally has simplified and expedited local agencies’ efforts to offer their customers the option to use recycled water for these approved uses. This, in turn, has helped reduce demand on potable water systems.
Institutional The primary institutional issue related to the development of water recycling in San Diego County is interagency coordination, such as when the wastewater agency that produces the recycled water is not the water purveyor within the reuse area. At those times, effective communication and cooperation between both agencies regarding the distribution of recycled water and providing service to the water customer is vital and should begin early in the planning process.
These institutional arrangements require contracts and/or agreements between the parties and/or agencies involved, the terms of which must be established on a case-by-case basis. The agreements usually define the reporting and compliance responsibilities, the amount of recycled water deliveries, water pricing, and a financing plan that identifies which agency will receive the financial incentives. Many local entities in the San Diego region have responsibilities to provide both water and wastewater services. Where the water and wastewater agencies are not the same, close collaboration takes place for planning, permitting and operating recycled water facilities. These close relationships have helped to advance recycled water in the San Diego region.
Public Acceptance Without public acceptance, siting, financing, constructing, and operating a water-recycling project becomes increasingly difficult. For many in the public, a general sense of water quality and safety concerns exists due to a lack of understanding regarding the water recycling treatment process. The most successful means to obtaining public acceptance is through education and involvement. Recent
DRAFT 2015 Urban Water Management Plan 5-15 April 2016
San Diego County Water Authority
Section 5. Member Agency Supplies
focus group findings indicate that the public is now more accepting of the safety and beneficial use of recycled water for non-potable uses, particularly during drought events.
5.4.2 Wastewater Generation, Collection, Treatment, and Disposal
Approximately 200 MGD of wastewater is currently generated, collected, treated, and disposed of within the Water Authority’s service area and provides significant potential for recycled water use. Most of the large wastewater treatment plants are located along the coast for easy and convenient access to an ocean outfall. These plants serve most of the San Diego region’s highly urbanized areas. Figure 5-3 identifies the location of the wastewater treatment plants and the associated outfall systems. The coastal location of the plants is not always conducive to development of recycled water. Most of the market for recycled water is located at higher elevations, making distribution systems costly. However, recycled water costs could be offset by possible savings on wastewater treatment costs where those savings are available. Table F-3, Appendix F shows a detailed list of the wastewater treatment plants within the county, their capacities at various levels of treatment, and the type of disposal. In addition, according to the County of San Diego, approximately 10 to 15 MGD of wastewater within the Water Authority’s service area is generated and disposed of through private systems, such as septic tanks.
5.4.3 Encouraging Recycled Water Development The Act requires agencies to describe in their plan the actions, including financial incentives, that agencies may take to encourage the use of recycled water. Table 5-4 summarizes the existing funding programs used by the Water Authority’s member agencies. Water and wastewater agencies develop some of the programs, while others are developed or funded by other water providers and agencies, such as the Water Authority, Metropolitan, and state and federal agencies. In addition to helping with funding, regional coordination on planning and regulatory issues can also reduce costs associated with development of recycled water.
Funding Programs Another important component of a successful recycling project is securing diversified funding and establishing funding partnerships. The Water Authority has focused on providing and facilitating the acquisition of outside funding for water recycling projects.
Financial assistance programs that have been utilized by San Diego County agencies include the Water Authority's Local Water Supply Development Program, Metropolitan’s Local Resources Program (LRP), the U.S. Bureau of Reclamation (USBR) Title XVI Grant Program, the State Water Resources Control Board (SWRCB) low-interest loan programs and the IRWM Plan Grant Program. Together, these programs offer funding assistance for all project phases, from initial planning and design, to construction and operation. Financial assistance programs administered by the Water Authority and Metropolitan have provided $7.7 million to San Diego County agencies during fiscal year 2015.
DRAFT 2015 Urban Water Management Plan 5-16 April 2016

San Diego County Water Authority
Section 5. Member Agency Supplies
Figure 5-3 Wastewater Treatment and Water Recycling Facilities
DRAFT 2015 Urban Water Management Plan 5-17 April 2016
San Diego County Water Authority
Section 5. Member Agency Supplies
Table 5-4. Programs to Encourage Recycled Water Use
Incentive Programs Local Water Supply Development (Water Authority – existing executed agreements) Local Resources Program (Metropolitan – existing executed agreements) On-site Retrofit Pilot Program provides financial incentives directly to public or private property
owners to convert potable water irrigation or industrial water systems to recycled water service. (Metropolitan)
Grants Title XVI Funding Program (U.S. Bureau of Reclamation) Public Facility Retrofit Program provides grant funding assistance for site retrofits and construction costs to increase recycled water use. (administered by Water Authority, funded through Proposition 50 grant funding, State of California) Proposition 84 Planning Grants and Implementation (State of California)
Low Interest Loans Clean Water State Revolving Fund Program (State of California)
Long-Term Contracts to Ensure Price and Reliability
Funding Assistance to State Water Resources Control Board to fund staff position(s) to expedite water recycling projects (Water Authority)
Regional Planning and Regulatory Assistance Regional coordination with member agencies and regulatory agencies such as the San Diego Regional
Board, Division of Drinking Water, and the San Diego County Department of Environmental Health on recycled water issues
Initiate, review, and comment on statewide regulatory developments and legislation to support local projects.
Preparation of guidelines and Engineering reports in conjunction with member agencies, such as Recycled Water Fill Stations.
Local Water Supply Development Program
The Water Authority administers the Local Water Supply Development (LWSD) Program (formerly referred to as the Recycled Water Development Fund (RWDF) Program initially adopted by the Board in April 1991), which is designed to ensure the financial feasibility of local water recycling projects during their initial years of operation. To date, the Water Authority has entered into LWSD agreements with 11 water and wastewater agencies for a combined project yield of over 30,000 AF/YR. Over $40 million in Water Authority incentive funding has been awarded to program participants. In fiscal year 2015, the Water Authority provided local agencies with $3.7 million in LWSD incentives for agencies with existing executed agreements.
The Reclamation Wastewater and Groundwater Study and Facilities Act – Title XVI
Since 1995, the Title XVI Grant Program has been a significant source of funding for San Diego area water recycling projects. Title XVI of Public Law (PL) 102-575, the Reclamation Wastewater and Groundwater Study and Facilities Act, authorized the federal government to fund up to 25 percent of the capital cost of authorized recycling projects, including the San Diego Area Water Reclamation Program, an inter-connected system of recycling projects serving the Metropolitan Sewage System service area. PL 104-266, the Reclamation Recycling and Water Conservation Act of 1996, authorized two additional projects in northern San Diego County: the North San Diego County Area
DRAFT 2015 Urban Water Management Plan 5-18 April 2016
San Diego County Water Authority
Section 5. Member Agency Supplies
Water Recycling Project and the Mission Basin Brackish Groundwater Desalting Demonstration Project. The North San Diego County project received its final federal funding in 2008 when it reached its maximum federal funding limit of $20 million. The City of Oceanside’s Mission Basin project was also completed and received final funding totaling $3,484,000. To date, San Diego agencies have been authorized to receive more than $110.8 million under the Title XVI grant program. The funding mechanism for the San Diego Area projects (and all other authorized Title XVI projects) was changed from direct appropriations to a competitive process that requires applications to be submitted in response to an annual Funding Opportunity Announcement (FOA). The Sweetwater Authority has successfully applied for funds from the last two FOA solicitations. It is expected that the Sweetwater Authority will apply again for federal funding and, if successful, will utilize this grant funding to fully fund its Richard A. Reynolds Groundwater Desalination Facility expansion project. Solicitation of additional funding by the City of San Diego, Padre Dam MWD, and the City of Escondido is anticipated for their respective potable reuse projects.
Clean Water State Revolving Fund/Water Recycling Grants
The SWRCB, through the Division of Financial Assistance, offers low interest financing agreements for water quality projects and water reclamation facilities. For fiscal years 2014 and 2015, the SWRCB made 33 binding commitments totaling over $789 million in low cost financing to eligible projects. The Clean Water State Revolving Fund (CWSRF) offers agencies a below-market interest rate that can result in substantial savings on debt service. Approximately $69 million was appropriated to the SWRCB in fiscal year 2016 for funding water recycling projects. An example of funding awarded to one of the Water Authority’s member agencies is a $29.5 million funding commitment to the Carlsbad MWD for advanced treatment, storage, and recycled water distribution costs. Additional construction funding can be obtained through Water Recycling Grants that provide up to 35 percent of actual eligible construction costs incurred up to a maximum of $15 million, including construction allowances. Planning grants of up to $75,000 maximum are also provided for eligible facilities planning/feasibility study costs.
Integrated Regional Water Management Plan Grant Funding: Propositions 50 and 84
In 2007, the San Diego IRWM program submitted a grant proposal to DWR for Proposition 50 grant funds and was awarded $25 million in grant funding. Section 8 describes the IRWM program in more detail. Operation of the Recycled Water Retrofit Assistance Program, managed and administered by Water Authority staff on behalf of its member agencies, continues to provide Proposition 50 grant funding to the Water Authority’s member agencies and their customers. Project grant funding facilitated the retrofitting of user sites to receive recycled water and provided direct funding to water and wastewater agencies to make the required alterations and distribution system expansions to bring recycled water to their respective customer base.
In 2011, the San Diego IRWM program was awarded $7.9 million in Proposition 84 Round 1 grant funds. One of the projects funded through this source was the Phase I North San Diego County Regional Recycled Water Project (NSDCRRWP). This project is an effort by North San Diego County water and wastewater agencies to regionalize recycled water systems by identifying new agency interconnections, seasonal storage opportunities, and indirect potable water use that would maximize supplies, reduce wastewater discharges to the ocean, reduce energy consumption due to diminished delivery of imported water, and allow recycled water to play an even more significant role in meeting the region’s future water needs. This project involved the support of many partners, including the Olivenhain MWD, Carlsbad MWD, Vallecitos WD, Santa Fe ID, City of Oceanside,
DRAFT 2015 Urban Water Management Plan 5-19 April 2016

San Diego County Water Authority
Section 5. Member Agency Supplies
Leucadia WD, City of Vista/Buena Sanitation District, San Elijo Joint Powers Authority, City of Escondido, and Rincon del Diablo MWD.
In 2013, the San Diego IRWM program was awarded approximately $10 million in grant funds made available through Proposition 84 Round 2. One of the selected projects helped to implement the 10 priority sub-projects identified in Phase I of the NSDCRRWP. The Phase II NSDCRRWP helped to increase connectivity between recycled water facilities in North San Diego County. This effort increased the use of recycled water by allowing it to be distributed across the North County region, and produced an estimated 6,790 AF/YR of recycled water. Project benefits included: reducing imported water dependency, reducing discharge of recycled water to the ocean, reducing energy consumption from pumping imported water, and providing more recycled water for future water needs. The agencies involved with this effort were the Leucadia Wastewater District, Vallecitos WD, Vista ID, Rincon del Diablo MWD, Olivenhain MWD, Santa Fe ID, Carlsbad MWD, the City of Escondido, the City of Oceanside, and the San Elijo Joint Powers Authority. Grant funding totals are listed under Table 5.4.1 below:
Table 5.4.1 Recycled Water Grant Sources
Lead Agency Grant Award Proposition 50 Ray Stoyer Water Recycling Facility Demo. Plant for AWT Recycled Water Retrofit Assistance Program Recycled Water Distribution System Expansion
Padre Dam MWD SDCWA City of San Diego
$3,000,000
$800,000
$476,5146 Proposition 84 Round 1 North San Diego County Regional Recycled Water Project North San Diego County Demineralization Project
Olivenhain MWD San Elijo JPA
$1,455,000
$1,018,500
Proposition 84 Round 2 No. S. D. County Regional Recycled Water Project Phase II Failsafe Potable Reuse at the Advanced Water Purification Facility
Olivenhain MWD WateReuse Research Foundation
$3,452,000
$2,113,000
Proposition 84 Drought Round Fallbrook Plant Nurseries Recycled Water System Expansion Carlsbad Recycled Water Plant and Distribution System
Fallbrook PUD Carlsbad MWD
$772,000
$4,000,000
DRAFT 2015 Urban Water Management Plan 5-20 April 2016

San Diego County Water Authority
Section 5. Member Agency Supplies
Lead Agency Grant Award Proposition 84 Final Round Padre Dam AWT Phase I Expansion Safari Park Drought Response and Outreach Integrated Water Resource Solutions for the Carlsbad Watershed Escondido AWT for Agriculture UC San Diego Water Conservation and Watershed Protection Project
Padre Dam MWD Zoological Society of San Diego San Elijo JPA City of Escondido UC San Diego
$6,000,000
$2,900,000
$2,500,000
$2,000,000
$1,435,000
TOTAL $36,210,646
Optimizing the Use of Recycled Water – Regional Coordination In support of the SWRCB call for salinity and nutrient planning, the Water Authority, in cooperation with the Southern California Salinity Coalition (SCSC), worked in partnership with San Diego Regional Board staff to develop guidelines for the development of Salinity/Nutrient Management Plans. The State Water Resources Control Board Recycled Water Policy (Recycled Water Policy) encouraged a stakeholder-driven process for the development of plans for the management of salt and nutrients on a basin-wide basis, as opposed to an individual discharge permit level. The San Diego region was unique in that the planning process encompassed 17 fairly small groundwater basins with varying levels of use and variable water quality. Consistent with the Recycled Water Policy, the Southern California Salinity Coalition and the San Diego County Water Authority worked with local stakeholders and San Diego Regional Board staff to develop agreed-upon guidelines for development of salt and nutrient management plans within the region.
The guidelines established priorities and recommended levels of effort for the plans depending on the size and importance of each basin within the region. Other key components of the guidelines were the recommended technical approaches for completing the salt and nutrient management plans and suggested strategies for managing salts. These guidelines were supported by both the stakeholders and the Regional Board staff. The final guidelines were endorsed by the San Diego Regional Board through a resolution adopted at their November 2010 board meeting. The agreement between the Regional Board and local stakeholders provided regulatory certainty for stakeholders and helped expedite the development of these plans within the region. Also with support from the San Diego Regional Board, IRWM grant funding was secured to help fund the development of five local Salinity Nutrient Management Plans. The following water agencies were awarded Proposition 84 grant funding and developed Salinity/Nutrient Management Plans for the following basins:
• City of San Diego for the Hodges/San Pasqual Basin
• Padre Dam MWD for the Santee Basin
• Rincon del Diablo MWD for the Escondido Basin
• Fallbrook PUD for the Middle Santa Margarita Basin
DRAFT 2015 Urban Water Management Plan 5-21 April 2016

San Diego County Water Authority
Section 5. Member Agency Supplies
• Ramona MWD for the San Vicente/Gower Basin
Of the basins listed above, three fell under the higher priority Tier A basin category as defined in the Salt/Nutrient Management Guidelines. One fell under Tier B, and another was listed as a Tier C basin. The salt and nutrient management plans were completed and submitted to the State of California in October 2013. The implementation of these plans will improve overall water quality and use of groundwater resources within the San Diego region.
5.4.4 Projected Recycled Water Use The Water Authority worked closely with its member agencies to determine the projected yield from existing and planned recycled water projects. Table 5-5 shows the estimated annual yield from the projects in five-year increments based on the implementation schedules provided by the member agencies and the likelihood of development. These projected supply yields will be included in the reliability analysis found in Section 9, “Water Supply Reliability.” Table F-4, Appendix F contains a detailed list of the projects and projected supplies.
Table 5-5. Projected Recycled Water Use (Normal Year – AF/YR)
2015 2020 2025 2030 2035 2040 32,595 47,460 48,825 48,959 49,159 49,459
The Water Authority’s 2010 Plan projected a verifiable water yield of 38,660 AF/YR in the year 2015. As shown in Table 5-5 above, the actual yield for 2015 was 32,595 AF/YR. The increase in projected recycled water use shown in Table 5-5 in 2020 and beyond is primarily from the expansion of existing facilities.
For example, the City of Oceanside is in the process of expanding their current recycled water system with a tertiary treatment capacity expansion of 0.8 MGD at the San Luis Rey Water Reclamation Facility (SLRWRF) in addition to the construction of a 1.5-MGD tertiary treatment train, existing pump station upgrades, construction of a 1-million-gallon recycled water reservoir, and construction of over 4,500 linear feet of recycled water pipeline to serve approximately 5,225 AF/YR of recycled water demand. Another San Diego North County agency, the Carlsbad MWD, will be expanding its Water Recycling Facility’s capacity to 7 MGD from its current 4 MGD, a 75 percent capacity increase. The expansion project includes adding 18 miles of new pipe to the existing recycled water distribution system for irrigation and other non-drinking purposes, and building a new 1.5 million-gallon reservoir for recycled water storage. It is projected that, by 2020, one-third of the City of Carlsbad’s total water supplies will be recycled water. Recycled water development helps relieve pressure on the region’s potable water supplies by providing a drought-proof, locally controlled water supply source.
Further, the City of Escondido’s Advanced Water Treatment for Agriculture project, funded under Proposition 84, will construct a new microfiltration/reverse osmosis (MFRO) advanced treatment facility with a total production capacity of 2.0 MGD. Water treated at the MFRO facility will be blended with tertiary treated water from an existing recycled water plant and distributed to agricultural customers in the northern and eastern areas of Escondido. The City of Escondido has partnered with Escondido Growers for Agricultural Preservation, Vista ID, City of San Diego, and Rincon del Diablo MWD to implement this project. This project supports the San Diego region’s goals
DRAFT 2015 Urban Water Management Plan 5-22 April 2016

San Diego County Water Authority
Section 5. Member Agency Supplies
of supply reliability and sustainability, and protects water quality while supporting local agriculture and the economy.
Additional Planned Projects – Recycled Water Maximizing recycled water development is critical to diversifying the region’s water supply portfolio. Beyond the verifiable project yields included in Table 5-5 above, member agencies have also identified additional planned projects. Aside from Carlsbad MWD and City of Escondido projects described above, the Padre Dam MWD, MCB Camp Pendleton, and Santa Fe ID have identified additional planned projects that are projected to yield an additional 2,468 AF/YR by 2035. These yields are considered additional planned supplies and are utilized in Section 10, “Scenario Planning – Managing an Uncertain Future.” These additional planned projects, as well as the conceptual projects provided by the member agencies, are also included in Table F-4, Appendix F.
5.5 Potable Reuse 5.5.1 Background and Description
Recycled water can be further treated for potable reuse through the use of multi-barrier advanced purification treatment processes, which may include technologies such as reverse osmosis and advanced oxidation. The advanced treated water may be passed through a natural barrier, such as a groundwater basin or surface water reservoir, and provided with additional treatment to render wastewater suitable for potable purposes. Projects that include a natural barrier are considered indirect potable reuse. Projects that deliver advanced treated water directly to a raw or treated water pipeline are considered direct potable reuse.
Several Water Authority member agencies are completing studies pertaining to potable reuse in San Diego County through groundwater recharge or reservoir augmentation. Two agencies, the City of San Diego and the Padre Dam MWD, have implemented pilot projects to determine potable reuse project viability. Detailed member agency project information can be found in Section 5.5.3.
Currently, numerous drivers make potable reuse an attractive option not only for the San Diego region, but for the state of California as well. Climate change is creating unpredictable weather patterns, which may result in recurring droughts and cause scarcity of water supply. Potable reuse is a renewable resource, which can provide a cost-effective and sustainable, high-quality water supply. Being able to maximize the use of all recycled water can reduce the impacts and costs associated with discharging waste to the ocean. De facto or incidental reuse has taken place for many years as wastes are discharged to rivers and collected and treated for potable water supplies downstream. Clean Water Act standards placed on waste discharges and treatment requirements for water suppliers through the Safe Drinking Water Act have been designed to avoid waterborne disease outbreaks and to ensure a safe and reliable potable water supply for customers. These requirements protect the public from waterborne disease outbreaks and health impacts from chemical constituents and emerging compounds. The longest standing groundwater recharge project in California has been in existence since 1962. Recycled water may be percolated through into the groundwater, or highly treated water can be directly injected into the groundwater basin.
Locally, potable reuse was first considered in the early and mid-1990s. The Water Authority and the City of San Diego proposed a potable reuse project that would deliver advanced treated water from
DRAFT 2015 Urban Water Management Plan 5-23 April 2016

San Diego County Water Authority
Section 5. Member Agency Supplies
the North City Water Reclamation Plant and convey it to San Vicente Reservoir where it would blend with imported and local surface water prior to being treated at a surface water treatment plant. The Water Authority created a citizens advisory group to advise the Water Authority on the suitability of potable reuse as a water supply for San Diego County. In 1994, the Repurified Water Review Committee recommended that potable reuse be pursued as part of diversified mix of water supplies. The Water Authority sponsored the work of an Independent Advisory Panel of experts for indirect potable reuse and, along with the City of San Diego, conducted detailed studies that were submitted to state health authorities to determine regulatory guidelines for an indirect potable reuse project blending advanced treated recycled water in San Vicente Reservoir. The California Department of Public Health (CDPH) approved this concept of reservoir augmentation in 1996, but no reservoir augmentation project has been built in San Diego or other parts of California. In 1998, the Water Authority co-funded a report by the National Research Council on “Issues in Potable Reuse: The Viability of Augmenting Drinking Water Supplies with Reclaimed Water,” which concluded that planned indirect potable reuse was a viable option. In 2006, the City of San Diego again began planning for a potable reuse project and, in 2012, CDPH and the San Diego Regional Board conceptually approved the City of San Diego’s proposed indirect potable reuse project for surface water augmentation through San Vicente Reservoir.
The SWRCB DDW, formerly CDPH, has the authority to permit direct potable reuse projects, but no projects have been proposed or approved in California. Two direct potable reuse projects have been approved in Texas in response to extreme drought conditions and were placed into operation. The many years of advanced research concerning potable reuse in California and elsewhere have proven that reliable technology is now available to allow agencies to consider direct potable reuse as a potentially viable and acceptable treatment option. A direct potable reuse treatment scheme, if approved by DDW, will permit water suppliers in San Diego to maximize the use of existing infrastructure and produce a new, safe, and viable potable water supply for the San Diego region. As water supplies become scarcer, particularly in the arid west, more such projects will likely be proposed.
Economic and Financial Considerations Potable reuse projects are being considered when they are deemed more cost effective and feasible than non-potable recycled water projects. Potable reuse projects have an advantage as they do not require construction of a dual distribution system, and once treatment and conveyance facilities have been constructed, the full amount of water produced can be immediately available to augment local water supplies. Costs for potable reuse are in range with other locally developed supplies. An added cost advantage may result as a potable reuse project may also contribute to meeting waste discharge requirements. Cost of conveyance to move advanced treated water to a local reservoir can be a significant component of a project cost. If the advanced treated water can be delivered to a reservoir closer to the point of production, it can significantly reduce project costs. Regulatory requirements on which reservoirs can be used, and whether direct potable reuse can be permitted by the regulatory agencies, will have a significant impact on overall project costs.
Institutional The institutional arrangements between wastewater agencies and water suppliers will be similar for potable reuse projects in the region as they are for recycled water, as described in Section 5.4.1. An additional factor to consider will be the ongoing coordination between operators of advanced treatment facilities and the operators of local surface water treatment facilities for projects with a
DRAFT 2015 Urban Water Management Plan 5-24 April 2016
San Diego County Water Authority
Section 5. Member Agency Supplies
downstream surface water treatment plant. Increased coordination will be required to ensure a safe reliable drinking water supply.
Public Acceptance Like recycled water, public acceptance for potable reuse projects is critical for the success of the project. Potable reuse projects are under a high level of public scrutiny to ensure the safety of the drinking water supply. While the technology for potable reuse projects has been proven, these projects may fail due to lack of public acceptance. In the San Diego region, project proponents have done a significant level of public outreach for potable reuse projects. Tours of demonstration facilities, such as those constructed by the City of San Diego and Padre Dam MWD, have proven highly successful in convincing the public of the safety of the product water. Polls in the San Diego region have demonstrated increasing public acceptance of potable reuse as a safe water supply. The Water Authority has worked with the member agencies through the Potable Reuse Coordination Committee (PRCC) to coordinate and develop common language and messaging to be used throughout the region. This ad-hoc Committee, consisting of regional agencies interested in developing and promoting potable reuse projects meets on an as needed basis, to engage and keep the member agencies informed on the latest potable reuse regulatory, legislative, and stakeholder outreach efforts at the local and state levels.
Legislative and Regulatory
Legislative Requirements to Develop Potable Reuse Regulations
Potable reuse projects require a high level of regulatory scrutiny and are currently approved on a case-by-case basis. Historically, an expert panel has been convened to look at project specifics and provide recommendations to the project proponent and DDW. While all projects will build on the knowledge and efforts obtained through past indirect potable reuse projects, local reservoir augmentation projects are anticipated as the first to be approved in California. The California Legislature passed SB 918 in 2010 and SB 322 in 2013, legislation sponsored and actively supported by the Water Authority, which expedited specific regulations for indirect potable reuse use surface water augmentation. This legislation also sought acknowledgement by the State of California that direct potable reuse was a viable water supply option. Specifically, the bills directed the Department of Public Health to:
1. Adopt regulations for indirect potable reuse through groundwater recharge by Dec. 31, 2013 (later moved to July 1, 2014).
2. Form an expert panel to provide recommendations to DDW on the surface water augmentation regulations and feasibility of direct potable reuse.
3. Form a public advisory group representing diverse water supply, environmental, and business interests to provide input to the expert panel on issues related to direct potable reuse, with all of the public advisory group meetings to be open and transparent public meetings.
4. Adopt regulations for surface water (reservoir) augmentation by Dec. 31, 2016.
5. Report to the legislature by Dec. 31, 2016, on the ability to adopt regulations for direct potable reuse.
DRAFT 2015 Urban Water Management Plan 5-25 April 2016
San Diego County Water Authority
Section 5. Member Agency Supplies
Development of Potable Reuse Regulations
In June 2014, CDPH adopted regulatory criteria for approval of groundwater recharge projects. SB 322 was critical in helping move the evaluation of direct potable reuse forward in a timely manner in California.
In February 2014, CDPH formed the Public Advisory Group, which has met regularly. The City of San Diego and Padre Dam MWD are represented on the Public Advisory Group as well as other San Diego interests. In its first meeting, the Public Advisory Group provided recommendations to DDW on the formation of an Expert Panel to provide recommendations on technical issues related to surface water augmentation criteria and the feasibility of adopting regulations for potable reuse. The Expert Panel consists of 12 experts in the fields of toxicology, wastewater treatment, drinking water supplies treatment, drinking water standards, epidemiology, limnology, microbiology, and chemistry. The Public Advisory Group has weighed in on developing common terminology to describe potable reuse and the need and approach for having certified and qualified operators for advanced treatment facilities. The Advisory Group has also expressed interest in economic impacts and viability of implementing potable reuse as well as public health concerns including emerging contaminants, and will raise issues of public interest that may need to be addressed by the Expert Panel. The Advisory Group has also discussed concerns on how DDW may delineate between surface water augmentation and direct potable reuse. As the State of California develops criteria for surface water augmentation, projects using multi-purpose and smaller reservoirs could be considered direct potable reuse.
The Expert Panel has also been meeting regularly since 2014. The Expert Panel has considered the proposed research agenda of the WateReuse Research Foundation and provided recommendations to the DDW regarding possible research gaps. The DDW presented for consideration a proposed framework for surface water augmentation, the focus of which will be on multiple treatment barriers for removal of pathogens and chemical constituents and approaches for ensuring the reliable monitoring and operation of the treatment processes. To minimize the need for a case-by-case review of projects, the surface water augmentation criteria should provide for flexibility in the range of reservoir size and configuration that may be acceptable for surface water augmentation projects. The Expert Panel will also develop a white paper with a list of issues as it relates to direct potable reuse. Concepts regarding direct potable reuse are similar to the framework for surface water augmentation with an increased emphasis on reliability, including monitoring, operator qualifications, and response to treatment failures.
Permitting of Potable Reuse Projects
Potable reuse projects require close collaboration between the San Diego Water Board and DDW. Local groundwater recharge projects are permitted by the San Diego Water Board under reclamation criteria or waste discharge requirements. The Water Board will incorporate recommendations from the DDW to ensure the protection of public health. Groundwater projects will conform to the groundwater recharge criteria.
Local surface water augmentation projects will be permitted by the San Diego Water Board for the discharge into local reservoirs. For any discharge to waters of the United States, a discharge permit meeting federal Clean Water Act requirements is required. The new advanced treated supply will also be permitted by DDW as a drinking water supply under the Safe Drinking Water Act. While no direct potable reuse projects have been permitted in California, it is expected that these projects, if
DRAFT 2015 Urban Water Management Plan 5-26 April 2016

San Diego County Water Authority
Section 5. Member Agency Supplies
delivered directly to a piped system, would be permitted by DDW as a drinking water supply. Projects not falling within an existing set of regulations may be reviewed by DDW and the San Diego Water Board on a case-by-case basis. Projects determined protective of public health and the environment would be issued the appropriate permits.
Importance of Science Based Regulations
The primary obligation of all drinking water suppliers is to protect public health. Regulations and transparency of information ensure that drinking water is safe and that information is available to the public to instill confidence that the public’s health is protected. Any potable reuse project will be required to achieve the same high standard of public health protection as any other drinking water supply. Because of the high standard involved in protecting public health and the extensive use of treatment technology to meet drinking water standards for potable reuse, science-based research is essential to both the regulatory development process and instilling public confidence. The Water Authority has been active in promoting the importance of research in regulation development.
In 2012, the WateReuse Association and the WateReuse Research Foundation launched a potable reuse initiative and raised over $6 million to fund the research necessary to overcome any regulatory, scientific, technical and public perception barriers to potable reuse. The San Diego region has been a strong supporter of the direct potable reuse initiative. The Water Authority and several member agencies have directly contributed to this effort. An additional $2.113 million through the San Diego IRWM Program and DWR will fund the WateReuse Research Foundation’s “Failsafe Potable Reuse at the Advanced Water Purification Facility” project. The Water Authority supports this effort through its management of the San Diego IRWM grant program. WateReuse Research Foundation project research will be an important part of the State of California’s development of indirect and potentially direct potable reuse regulations, and will provide objective, science-based information for the public to understand the levels of protection and safety that contribute to developing this important new water supply.
Funding of Potable Reuse Projects
The primary sources of outside funding available for potable reuse projects include Title XVI, Clean Water State Revolving Funds, and IRWM. These funding sources are described in more detail in Section 5.4.3.1. Propositions 50 and 84 have already provided support for potable reuse through the San Diego IRWM by funding for the City of San Diego’s water purification demonstration project, Padre Dam MWD’s potable reuse demonstration project, and the WateReuse Failsafe Potable Reuse Project. These projects provided the research necessary to move potable reuse forward in the San Diego region and in California. Proposition 84 will also provide funding for the Padre Dam Phase IA recycled water treatment plant expansion, which will increase supply available for potable reuse projects.
5.5.2 Water Authority Activities in Support of Potable Reuse The Water Authority has been a staunch supporter and an active participant in advancing the goal of implementing potable reuse in San Diego County for over 20 years. The more recent focus of the Water Authority’s efforts to advance potable reuse has been through advocacy for legislation and regulations that move projects forward in the near term. Water Authority staff has been prominently involved through participation in the WateReuse Association Potable Reuse Task Force; WateReuse Legislative and Regulatory Committee; and though other regulatory advocacy
DRAFT 2015 Urban Water Management Plan 5-27 April 2016

San Diego County Water Authority
Section 5. Member Agency Supplies
venues, including attending and providing comments at Expert Panel meetings by advocating and supporting member agency interests.
The Water Authority has also been able to track trends in public acceptance of recycled water through its public opinion survey. This effort provides a foundation for member agency outreach and measures the effectiveness of those outreach efforts. In 2012, 71 percent of respondents believed that it was possible to further treat recycled water used for irrigation to make the water pure and safe for drinking. This was an increase over the 2011 survey findings where 66 percent felt that it is possible to further treat recycled water for drinking purposes. However, both the 2011 and 2012 survey results represent a substantial increase over the 2009 survey response where just 53 percent thought it was possible.
Water Authority staff has been supporting member agencies in three key areas: public outreach and messaging, engaging with regulatory agencies and the Expert Panel, and helping secure funding for local projects. While member agencies will lead the development of their own specific projects, the need continues for regional coordination and collaboration on potable reuse issues. Water Authority staff will continue to engage with member agencies and the DDW to ensure that the regulatory framework developed by the DDW and reviewed by the Expert Panel considers the wide range of approaches expected as part of member agency projects.
In addition, Water Authority staff has supported member agencies by actively engaging in public outreach in support of member agency projects. This support has included:
1. Coordinate with member agencies through Joint Public Information Committee to develop common outreach messaging that will support potable reuse projects.
2. Coordinate with the member agencies through the Potable Reuse Coordination Committee.
3. Outreach to the general public to increase public acceptance of potable reuse through presentations, development of handout materials for public outreach events and use by the member agencies, and sharing of information through the Water Authority’s website.
4. Communicate with regional, local, state, and federal elected officials on the importance of potable reuse for the San Diego region to gain support for potable reuse.
5. Communicate with SWRCB members and staff on the safety and importance of potable reuse.
6. Collaborate with other organizations that support potable reuse including WateReuse, the Water Reliability Coalition, and state and local environmental groups on common outreach to support potable reuse.
7. Advocate at the state and local level for reasonable regulations that will support the safe use of recycled water for local potable reuse projects.
5.5.3 Projected Supply through Potable Reuse The Water Authority worked closely with its member agencies to determine the projected yield from existing and planned potable water reuse projects. Table 5-6 shows the estimated verifiable annual yield from the projects in five-year increments based on the implementation schedules provided by the member agencies and the likelihood of development. These projected supply yields will be included in the reliability analysis found in Section 9, “Water Supply Reliability”. Table F-5, Appendix F contains a detailed list of the projects and projected supplies.
DRAFT 2015 Urban Water Management Plan 5-28 April 2016

San Diego County Water Authority
Section 5. Member Agency Supplies
Table 5-6. Projected Potable Reuse Water Use (Normal Year – AF/YR)
2015 2020 2025 2030 2035 2040 0 3,360 5,000 5,000 5,000 5,000
The increase in projected potable reuse shown in Table 5-6 in 2025 and beyond is primarily from the expansion of planned facilities.
The City of Oceanside completed the investigative phase of their Indirect Potable Reuse (IPR) project to enhance water supply reliability. This will involve the recharging of the Mission Groundwater Basin using water treated at the San Luis Rey Water Reclamation Facility (SLRWRF). This project will utilize advanced treated recycled water for subsurface and surface replenishment supplied through the AWT facility. The Phase I Project includes the construction of a 3-MGD capacity AWT facility, three injection wells, and a separate conveyance pipeline to the injection wells, which will result in the production of 3,360 AF/YR to be used for groundwater injection. Phase II consists of adding 1,700 AF/YR of advanced treated water for surface spreading at two water basins. This will necessitate increasing the capacity of the AWT facility to accommodate this additional supply for a final capacity of 4.5 MGD, which will provide an ultimate yield of 5,000 AF/YR of groundwater recharge. Both Project Phases 1 and 2 will require the construction of monitoring wells. It is expected that the City of Oceanside’s Indirect Potable Reuse Project will be operational in 2021.
Additional Planned Potable Reuse Projects
As part of the City of San Diego’s effort to provide a local and sustainable water supply, the City of San Diego’s Water Purification Demonstration Project (WPDP) examined the use of advanced water purification technology to provide a safe and reliable water supply, and determined if reservoir augmentation using this purified water was a feasible option for San Diego. The WPDP concluded in 2013. The information collected via various studies and the results of the WPDP determined that it was feasible for San Diego to use water purification technology.
Pure Water San Diego, the City's phased, multi-year program to produce purified water to supplement San Diego's drinking water supply, is scheduled to be operational by 2021. The long-term goal, producing 83 million gallons of purified water per day (one-third of San Diego's future drinking water supply), is scheduled for 2035.
The East County Regional Water Reuse Program Planning Study (Study) was partially grant funded and addressed the elements of the Recycled Water Facilities Planning Report outline provided by the SWRCB. The study evaluated the potential for expanding Title 22 tertiary recycled water for irrigation and developing potable reuse within the study area that included the following four agencies: Padre Dam Municipal Water District (Padre Dam MWD), Helix Water District (Helix WD), the County of San Diego (County), and the City of El Cajon (El Cajon). The objectives of the East County Regional Potable Reuse Program were as follows:
1. Produce potable water at a cost less than $2,000/AF.
2. Incur wastewater treatment cost at less than that projected for Metropolitan and associated Pure Water costs.
3. Yield at least 2 MGD for Phase 1 Groundwater Replenishment and Reuse Program (GRRP).
DRAFT 2015 Urban Water Management Plan 5-29 April 2016

San Diego County Water Authority
Section 5. Member Agency Supplies
Potable reuse will require full advanced treatment in addition to conventional wastewater treatment by microfiltration (MF), reverse osmosis (RO), ultraviolet (UV) disinfection, and advanced oxidation process (AOP), which is similar to treatment provided in Orange County. Further treatment using free chlorine to produce Advanced Water Treatment (AWT) water is also planned. The addition of free chlorine provides supplemental log removal to meet DDW requirements that allow a reduction in the environmental buffer, meaning reduced travel time requirements. The Study also evaluated the feasibility to treat all wastewater generated by Padre Dam MWD, the County, and El Cajon using full advanced treatment at Padre Dam MWD’s Ray Stoyer Water Recycling Facility (WRF) before being injected into the Santee Groundwater Basin or used to augment surface water at Lake Jennings. For surface water augmentation at Lake Jennings, AWT water will be blended with a mixture of imported surface water and local runoff in Lake Jennings before it is treated at Helix WD’s R. M. Levy Water Treatment Plant. In March 2015, Padre Dam opened the Advanced Water Purification Demonstration Facility, which uses a four-step water purification process to treat recycled water using state-of-the-art technologies. Since its opening, this pilot facility has produced approximately 100,000 gallons of purified water each day for testing purposes to ensure it meets the public health objectives to earn approval from the State Water Resources Control Board’s DDW. The water purified at the facility is not currently being distributed as drinking water.
Conceptual Potable Reuse Projects
Conceptual projects include the City of Escondido, which is planning to expand its non-potable water recycling program to include additional landscaping and agricultural irrigation, and incorporation of a future indirect potable reuse element. Escondido is pursuing this dual path for water supply reliability and to avoid the cost of a future ocean outfall expansion associated with its discharge of secondary treated wastewater. The Escondido City council has approved exploring this project alternative and has incorporated this approach into their long-range financial planning.
5.6 Member Agency Seawater Desalination 5.6.1 Carlsbad Desalination Plant
In June 2011, the Water Authority board of directors adopted guiding principles for the Water Authority to make available to its member agencies up to 49 percent of the Minimum Annual Demand Commitment (48,000 AF) and provide the opportunity for member agencies to enter into uniform contracts to make firm commitments to individually purchase from the Water Authority treated water in designated amounts that represent a portion of the Minimum Annual Demand Commitment. Vallecitos Water District (Vallecitos) and Carlsbad Municipal Water District (Carlsbad) both passed resolutions expressing their intention to enter into uniform contracts with the Water Authority to purchase desalinated water. Beginning in July 2016, Vallecitos and Carlsbad will purchase 3,500 and 2,500 AF/YR, respectively, for a full contract year, representing a total of 6,000 AF of member agency seawater desalination water supply annually.
5.6.2 Rosarito Beach Desalination Project, Otay Water District The Otay Rosarito Beach Desalination Project is not considered a verifiable supply and is therefore not included in the reliability assessment in Section 9. The Otay project is considered an additional
DRAFT 2015 Urban Water Management Plan 5-30 April 2016
San Diego County Water Authority
Section 5. Member Agency Supplies
planned project and is presented in Section 10 as a potential strategy to manage future uncertainty planning scenarios.
Plans are underway to develop a seawater desalination facility in Rosarito Beach by a private company, Consolidated Water Co. Ltd. This bi-national project would produce up to 100 MGD for potential distribution to the federal and /or state agencies serving the Rosarito and Tijuana areas, and to Otay Water District. The district has sought a presidential permit to build a cross-border pipeline to carry up to 50 million gallons per day from Mexico into its service area, which is currently awaiting approval.
DRAFT 2015 Urban Water Management Plan 5-31 April 2016

Section 9 Water Supply Reliability
Under the Act, every UWMP must include an assessment of water supply reliability. The assessment must compare the total projected water supply and demands over the next 20 years in 5-year increments under normal, single dry-year, and multiple dry water years. The assessment contained in the 2015 Plan evaluates reliability through the next 25 years. In addition to the verifiable mix of resources utilized in the reliability assessment, additional planned resources by the Water Authority and its member agencies have also been identified. Additional planned projects can further reduce the region’s reliance on sources of supply from Metropolitan, such as the Bay-Delta. This section presents a summary of the water demands and supplies within the Water Authority’s service area along with the reliability assessment and discussion on additional planned projects. Results from the reliability assessment demonstrate that the region’s existing and projected water resource mix is drought-resilient, with only minor shortages during multiple dry periods occurring 15 to 20 years in the future. These shortages can be mitigated through extraordinary water conservation actions and if necessary, dry-year transfers.
9.1 Development of Projected Water Resources Mix In summary, development of the projected mix of resources to meet future demands is based on the following factors:
I. Member agency information on projected water recycling, potable reuse, groundwater, desalination, and surface water (discussed in Section 5);
II. Attaining the additional regional water use efficiency targets (Section 2)
III. Board approvals taken in regard to Water Authority supplies (Section 4 and 11):
a. Agreement between IID and the Water Authority for Transfer of Conserved Water, and other related agreements (Section 4.2);
b. Agreements related to the ACC and CC Lining Projects, and other related agreements (Section 4.3);
c. Claude “Bud” Lewis Carlsbad Desalination Plant Water Purchase Agreement between the Water Authority and Poseidon Water (Section 4.5);
d. Acceptance of San Vicente Dam Raise Project (emergency and carryover storage) as complete (Section 11.2.4);
e. Approval of 2013 Regional Water Facilities Optimization and Master Plan Update (Section 1.6.4)
f. Agreements and actions related to out-of-region groundwater banking program (Section 11.2.4).
DRAFT 2015 Urban Water Management Plan 9-1 April 2016

San Diego County Water Authority
Section 9. Water Supply Reliability
9.2 Normal Water Year Assessment Table 9-1 shows the normal year assessment, summarizing the total water demands within the Water Authority’s service area through the year 2040 along with the supplies necessary to meet demands under normal conditions. Section 2 contains a discussion of the normal year water demands in the Water Authority's service area. If Metropolitan, the Water Authority and member agency supplies are maintained and developed as planned, along with achievement of the additional water conservation, no shortages are anticipated within the Water Authority’s service area in a normal year through 2040.
In the reliability assessment, the projected supplies from Metropolitan are considered supplemental and are calculated as the increment of supply necessary to meet demands after taking into account member agency and Water Authority supplies. Metropolitan staff provided the Water Authority with estimated demands on Metropolitan that will be used in their 2015 Plan. The estimated demands are shown to be adequate to cover the supplemental need identified in Table 9-1. The data provided by Metropolitan is included in Appendix I.
Table 9-1. Normal Water Year Supply and Demand Assessment (AF/YR)1
2020 2025 2030 2035 2040 Water Authority Supplies IID Water Transfer 190,000 200,000 200,000 200,000 200,000 ACC and CC Lining Projects 80,200 80,200 80,200 80,200 80,200 Carlsbad Desalination Plant 50,000 50,000 50,000 50,000 50,000 Sub-Total 320,200 330,200 330,200 330,200 330,200 Member Agency Supplies Surface Water 51,580 51,480 51,380 51,280 51,180 Water Recycling 47,460 48,825 48,959 49,159 49,459 Seawater Desalination 6,000 6,000 6,000 6,000 6,000 Potable Reuse 3,360 5,000 5,000 5,000 5,000 GW Recovery 13,300 13,300 13,300 13,300 13,300 Groundwater 17,940 19,130 20,170 20,170 20,170 Sub-Total 139,640 143,735 144,809 144,909 145,109
Metropolitan Water District Supplies 123,343 157,918 178,591 197,215 222,326
Total Projected Supplies 583,183 631,853 653,600 672,324 697,635
Total Demands w/ Water Efficiency Savings 583,183 631,853 653,600 672,324 697,635
1 Normal water year demands based on 1960 – 2013 hydrology.
DRAFT 2015 Urban Water Management Plan 9-2 April 2016

San Diego County Water Authority
Section 9. Water Supply Reliability
9.3 Dry Water Year Assessment In addition to a normal water year assessment, the Act requires an assessment to compare supply and demands under single dry and multiple dry water years over the next 20 years, in five-year increments. Section 2 describes the derivation of the dry water year demands. Table 9-2 shows the single dry-year assessment. The dry-year demands reflect long-term water use efficiency, but do not incorporate potential savings due to extraordinary conservation occurring during droughts. This approach allows for a more comprehensive shortage analysis and drought response planning.
The projected groundwater and surface water yields shown in the table are based on 2015 dry-year supplies during the present drought beginning 2012. The supplies available from member agency projected recycling, potable reuse, and groundwater recovery projects are assumed to experience little, if any, reduction in a dry-year. The Water Authority’s existing and planned conserved supplies from the IID transfer, canal lining projects, and Carlsbad Desalination Plant are also considered “drought-resilient” supplies as discussed in Section 4. For this single dry-year assessment, it was assumed that Metropolitan would have adequate supplies in storage and would not be allocating supplies. With the previous years leading up to the single dry-year being wet or average hydrologic conditions, Metropolitan should have adequate supplies in storage to cover potential shortfalls in core supplies and would not need to allocate.
Table 9-2. Single Dry Water Year Supply and Demand Assessment Five Year Increments (AF/YR)
2020 2025 2030 2035 2040
Water Authority Supplies IID Water Transfer 190,000 200,000 200,000 200,000 200,000 ACC and CC Lining Projects 80,200 80,200 80,200 80,200 80,200 Carlsbad Desalination Plant 50,000 50,000 50,000 50,000 50,000 Sub-Total 320,200 330,200 330,200 330,200 330,200 Member Agency Supplies Surface Water 6,004 6,004 6,004 6,004 6,004 Water Recycling 47,460 48,825 48,959 49,159 49,459 Seawater Desalination 6,000 6,000 6,000 6,000 6,000 Potable Reuse 3,360 5,000 5,000 5,000 5,000 GW Recovery 13,300 13,300 13,300 13,300 13,300 Groundwater 15,281 15,281 15,281 15,281 15,281 Sub-Total 91,405 94,410 94,544 94,744 95,044 Metropolitan Water District Supplies 212,918 252,296 275,715 296,199 335,223
Total Projected Supplies 624,523 676,906 700,459 721,143 760,467 Total Demands w/ Water Efficiency Savings 624,523 676,906 700,459 721,143 760,467
If Metropolitan, the Water Authority and member agency supplies are maintained and developed as planned, along with achievement of the additional conservation target, no shortages are anticipated within the Water Authority’s service area in a single dry-year through 2040.
DRAFT 2015 Urban Water Management Plan 9-3 April 2016

San Diego County Water Authority
Section 9. Water Supply Reliability
In accordance with the Act, Tables 9-3, 9-4, 9-5, 9-6, and 9-7 show the multiple dry water year assessments in five-year increments. Similar to the single dry-year assessment, the member agencies’ surface and groundwater yields shown in these tables are reflective of supplies available during the present drought beginning 2012, in years 2013, 2014 and 2015. While surface and groundwater yields are based on historic estimates and remain the same, recycled and brackish groundwater yields are based on projected growth in these member agency supplies. For the multi dry-year reliability analysis, the conservative planning assumption is that Metropolitan will be allocating supplies to its member agencies. By assuming allocations in this reliability assessment, it allows the Water Authority to analyze how storage supplies could potentially be utilized and the likelihood of shortages. Currently, Metropolitan allocates supplies through its Water Supply Allocation Plan. Because it is uncertain in the future how Metropolitan will allocate supplies to its member agencies, the analysis in the tables assumes they are allocated based on preferential right to Metropolitan supplies. As discussed in Section 6.1.1, Section 135, Preferential Right to Purchase Water, is included in Metropolitan’s Act and allows a Metropolitan member agency to acquire for use within the agency supplies based on preferential rights at any time.
The Water Authority’s annual preferential right percentage of Metropolitan supplies, used in Tables 9-3 through 9-7, is estimated through 2040 and is based on Metropolitan’s current method of calculating preferential rights. In 2015, a Superior Court ruled Metropolitan under-calculated the Water Authority’s preferential right to Metropolitan water. That ruling is being appealed. The analysis assumes total Metropolitan dry-year supplies available for allocation to be 1,500,000 AF throughout the planning period. This was maintained due to the numerous uncertainties associated with identifying Metropolitan’s future available supplies. In Section 10, there are scenarios presented that modify the dry-year supplies available for allocation. This total supply assumes reduced deliveries from the State Water Project and Colorado River Aqueduct along with limited storage supplies.
Table 9-3. Multiple Dry Water Year Supply and Demand Assessment Five-Year Increments (AF/YR) – 2017-2019 2017 2018 2019
Member Agency Supplies 114,600 96,027 83,308 Water Authority Supplies 230,200 260,200 290,200 Metropolitan Allocation (Preferential Right) 279,450 280,500 281,400
Total Estimated Core Supplies w/o Storage Takes 624,250 636,727 654,908 Total Demands w/ Water Efficiency Savings 604,829 628,721 660,670
Potential Supply (Shortage) or Surplus 19,421 8,006 -5,762 (Difference between Supplies and Demands)
Utilization Carryover Supplies 0 0 5,762 Total Projected Core Supplies w/ Utilization of Carryover Storage Supplies 624,250 636,727 660,670
Remaining Potential Surplus Supply, or (Shortage) that will be handled through Management Actions 19,421 8,006 0
DRAFT 2015 Urban Water Management Plan 9-4 April 2016

San Diego County Water Authority
Section 9. Water Supply Reliability
Table 9-4. Multiple Dry Water Year Supply and Demand Assessment Five-Year Increments (AF/YR) – 2021-2023
2021 2022 2023 Member Agency Supplies 132,771 110,062 93,208 Water Authority Supplies 330,200 330,200 330,200 Metropolitan Allocation (Preferential Right) 282,750 283,050 283,350 Total Estimated Core Supplies w/o Storage Takes 745,721 723,312 706,758 Total Demands w/ Water Efficiency Savings 632,681 665,756 707,457 Potential Supply (Shortage) or Surplus 113,040 57,556 (699) (Difference between Supplies and Demands) Utilization Carryover Supplies 0 0 699
Total Projected Core Supplies w/ Utilization of Carryover Storage Supplies
745,721 723,312 707,457
Remaining Potential Surplus Supply, or (Shortage) that will be handled through Management Actions
113,040 57,556 0
Table 9-5. Multiple Dry Water Year Supply and Demand Assessment Five-Year Increments (AF/YR) – 2026-2028
2026 2027 2028 Member Agency Supplies 135,202 111,919 94,490 Water Authority Supplies 330,200 330,200 330,200 Metropolitan Allocation (Preferential Right) 283,500 283,350 283,050 Total Estimated Core Supplies w/o Storage Takes 748,902 725,469 707,740 Total Demands w/ Water Efficiency Savings 681,549 710,641 749,758 Potential Supply (Shortage) or Surplus 67,353 14,828 (42,018) (Difference between Supplies and Demands) Utilization Carryover Supplies 0 0 42,018
Total Projected Core Supplies w/ Utilization of Carryover Storage Supplies
748,902 725,469 749,758
Remaining Potential Surplus Supply, or (Shortage) that will be handled through Management Actions
67,353 14,828 0
DRAFT 2015 Urban Water Management Plan 9-5 April 2016

San Diego County Water Authority
Section 9. Water Supply Reliability
Table 9-6. Multiple Dry Water Year Supply and Demand Assessment Five-Year Increments (AF/YR) – 2031-2033
2031 2032 2033 Member Agency Supplies 135,349 112,079 94,664 Water Authority Supplies 330,200 330,200 330,200 Metropolitan Allocation (Preferential Right) 281,550 280,950 280,350 Total Estimated Core Supplies w/o Storage Takes 747,099 723,229 705,214 Total Demands w/ Water Efficiency Savings 704,215 735,777 772,413 Potential Supply (Shortage) or Surplus 42,884 (12,548) (67,199) (Difference between Supplies and Demands) Utilization Carryover Supplies 0 12,548 40,000
Total Projected Core Supplies w/ Utilization of Carryover Storage Supplies
747,099 735,777 745,214
Remaining Potential Surplus Supply, or (Shortage) that will be handled through Management Actions
42,884 0 (27,199)
Table 9-7. Multiple Dry Water Year Supply and Demand Assessment Five-Year Increments (AF/YR) – 2036-2038
2036 2037 2038 Member Agency Supplies 135,569 112,319 94,924 Water Authority Supplies 330,200 330,200 330,200 Metropolitan Allocation (Preferential Right) 278,850 278,550 278,100 Total Estimated Core Supplies w/o Storage Takes 744,619 721,069 703,224 Total Demands w/ Water Efficiency Savings 730,024 763,528 807,375 Potential Supply (Shortage) or Surplus 14,595 (42,459) (104,151) (Difference between Supplies and Demands) Utilization Carryover Supplies 0 42,459 40,000
Total Projected Core Supplies w/ Utilization of Carryover Storage Supplies
744,619 763,528 743,224
Remaining Potential Surplus Supply, or (Shortage) that will be handled through Management Actions
14,595 0 (64,151)
Under specific parameters assumed in the multi dry-year analysis, some level of shortage could potentially be experienced, as shown in Tables 9-6, and 9-7. The shortages are minor and due primarily to increasing water demands due to economic growth within the region.
As discussed in Section 11.2.4, the Water Authority has invested in carryover storage supply capacity, which can be utilized in dry-years to improve reliability. The carryover storage investment includes both surface water storage in San Vicente Reservoir and out-of-region groundwater storage in California’s Central Valley, for a total of approximately 99,000 AF of storage supplies available.
As described in Section 11.2.4, there are a number of factors to consider when determining the utilization of carryover supplies to reduce or eliminate shortages. The storage take amount should
DRAFT 2015 Urban Water Management Plan 9-6 April 2016
San Diego County Water Authority
Section 9. Water Supply Reliability
be handled on a case-by-case basis, considering such items as, current demand trends, core supply availability, hydrologic conditions, and storage supply available for withdrawal. These factors will vary depending upon the situation. For the analysis in the 2015 Plan, it was assumed the carryover storage supplies would be full going into the dry-year period. In determining the amount to utilize, the analysis uses general guidelines that approximately one third of the San Vicente Reservoir carryover supplies available in storage will be utilized in one year. Utilizing a portion of available storage supplies avoids depletion of storage reserves, thereby making water available for potential ongoing or future shortages. The supplies taken from carryover storage will be considered a Water Authority regional supply to be combined with Water Authority’s core supplies and any potential dry-year transfers.
Under the Water Authority’s current Transitional Special Agricultural Water Rate (TSAWR) program requirements, customers in the TSAWR class of service receive no water from the Carryover Storage Program during Stage 2 or 3 of the Water Shortage Drought Response Plan. During shortages, TSAWR deliveries are also cutback at the same level of Metropolitan’s cutback to the Water Authority. Extension of the TSWR program had been approved by the Water Authority Board in March 2014 and will be revisited by the Board again in 2020. For planning purposes only, the assessments in Tables 9-3 through 9-7 do not factor in this program requirement, due to the uncertainties associated with the future of the program beyond 2020. This also provides a more conservative planning analysis.
In years where shortages may still occur, after utilization of carryover storage, additional regional shortage management measures, consistent with the Water Authority’s Water Shortage and Drought Response Plan (described in Section 11.2.1), will be taken to fill the supply shortfall. These measures could include extraordinary conservation, achieved through voluntary or mandatory water-use restrictions. A description of the savings achieved during the 2012-2016 shortage period is described in Section 11.2.3. As discussed in the following section, the amount of savings achieved through extraordinary conservation measures could be limited due to demand hardening. In addition, the Water Authority could evaluate the option of securing dry-year transfers, which the Water Authority successfully acquired and utilized during the 2007-2011 shortage management period. (Description of the Water Authority’s dry-year transfer program is included in Section 11.2.4.).
It should be emphasized that the amount of extraordinary conservation savings expected to be achieved through mandatory measures, such as water-use restrictions, could be less than that experienced in the previous shortage periods. This is due to the concept known as demand hardening. Demand hardening diminishes the ability or willingness of a customer to reduce demands during shortages as a result of having implemented long-term conservation measures. Responsiveness to drought pricing and general price increases will diminish because remaining essential uses are less responsive to price. This will reduce customer discretionary demands and create less flexibility in the managing of demand during shortages. This will increase the importance of acquiring supplemental dry-year supplies to eliminate or reduce potential supply shortages. Section 11.2.4 discusses the Water Authority’s potential dry-year supplies. Long-term permanent conservation savings is critical to ensuring water is used most efficiently and will help avoid or minimize drought situations. Due to potential demand hardening, shortage management measures such as water-use restrictions and drought pricing, may not be as effective in the future in achieving necessary savings to help reduce the supply gap.
DRAFT 2015 Urban Water Management Plan 9-7 April 2016
San Diego County Water Authority
Section 9. Water Supply Reliability
9.4 Reliability of Supply The above sections identify the diverse mix of resources planned to meet future demands in both a normal and dry-year. Implementation of this regional resource mix will require maintaining and developing projects and programs by the Water Authority, its member agencies, and Metropolitan. The Water Authority coordinated with its member agencies and Metropolitan during preparation of the 2015 Plan on the future demands and supplies projected for the region. The steps being taken by the member agencies and Metropolitan to develop supplies are addressed in their respective urban water management plans. Section 4 contains the steps taken and remaining actions necessary to develop and maintain the Water Authority supplies.
The Act requires agencies to describe reliability of the water supply and vulnerability to seasonal and climatic shortage. Sections 9.2 and 9.3 describes the results of the water supply reliability assessment for the region, during normal water years, single dry years, and multiple dry years. The Act also requires the 2015 Plan to contain historic data on supplies available for the three water year types. The following is the historic total supplies, both local and imported, that were utilized during the periods identified: Normal/average (607,200AF) based on 30-year average between 1986 and 2015, single dry year (477,458AF) based on 2015, and multiple dry water years (581,828AF, 590,119AF, and 477,458AF) based on years 2013-2015. Supplies utilized in a non-allocation dry period could exceed the supplies utilized in a normal year, due to the ability to purchase additional imported supplies from Metropolitan. It should also be noted that in the reliability assessment, contained in Section 9.2, the average local supply yields are not based on historic yields, but projected numbers provided by member agencies. These figures more accurately reflect the expected yield based on current local agency policies and procedures on operations and management of the supply.
Key to long-term reliability will be the monitoring of supplies and demands in order to make necessary modifications to the core and dry-year resources identified in the normal and dry-year resource mixes. The Water Authority Board will monitor reliability of existing supplies and development of identified future supplies through the Annual Supply Report and five year updates to the UWMP.
The Act requires that, for any water source that may not be available at a consistent level of use, given specific legal, environmental, water quality, or climatic factors, that the agency describe, to the extent practicable, plans to replace that source with alternative sources or water demand management measures. As stated throughout the 2015 Plan, the Water Authority and its member agencies are planning to develop a diverse supply of resources. The unavailability of any one supply source will be buffered because of the diversity of the supplies: the region is not reliant on a single source. To replace or supplement an existing supply, the Water Authority could take steps to further long-term water use efficiency and work with member agencies to further maximize development of recycled water, potable reuse, groundwater, and seawater desalination. In order to adequately plan for potential supply uncertainties and identify alternative sources, the 2015 Plan contains a scenario planning process described in Section 10.
DRAFT 2015 Urban Water Management Plan 9-8 April 2016

San Diego County Water Authority
Section 9. Water Supply Reliability
9.5 Additional Planned Supply Projects The mix of current and future supplies is developed jointly between the Water Authority and its member agencies. The mix of supplies is being represented in two ways. Verifiable supplies are those supplies identified by the Water Authority or member agencies as having achieved a level of certainty in their planning and implementation, such as where California Environmental Quality Act has been satisfied, permits are in hand or contracts have been executed. As part of this general definition, these projects also have the political support of the governing body to more forward and be implemented at this time. Verifiable supplies are included in water supply assessments and verifications prepared by retail water agencies and used by the cities and county in their land use decisions regarding available water supplies for growth under SB 221 and SB 610. Those projects with adequate documentation regarding implementation and supply utilization, or existing projects already planned for expansion, were included in the assessments discussed in Sections 9.2 and 9.3. Additional planned supplies are those that have not yet achieved the same level of certainty as the verifiable supplies, but have progressed to a point where the Water Authority or a member agency has taken significant financial actions to pursue the project. Additional planned supplies are not included in supply verifications for SB 221 and SB 610.
These additional planned supplies are important to the region for a number of reasons. The Water Authority and member agencies must continue to strive to develop cost-effective local resources that can further diversify the region’s supplies and reduce demands for imported water from Metropolitan. They provide objectives for the region to work towards by resolving any funding, regulatory, and other constraints associated with implementation. As part of conducting comprehensive supply planning, both the verifiable and additional planned projects are evaluated in regards to meeting future demands and the need for supplemental supplies from Metropolitan. Table 9-8 includes the evaluation of verifiable and additional planned projects compared with projected water demands in a normal year. It is important to emphasize that this evaluation is presented as a potential supply scenario and not the region’s reliability analysis for purposes of compliance with state laws governing approval of land-use projects (SB 610 and 221).
DRAFT 2015 Urban Water Management Plan 9-9 April 2016

San Diego County Water Authority
Section 9. Water Supply Reliability
Table 9-8. Supply Scenario with Additional Planned Projects (Normal Year AF/YR)
2020 2025 2030 2035 2040
Water Authority Supplies IID Water Transfer 190,000 200,000 200,000 200,000 200,000 ACC and CC Lining Projects 80,200 80,200 80,200 80,200 80,200 Regional Seawater Desalination 50,000 50,000 50,000 50,000 50,000
Sub-Total 320,200 330,200 330,200 330,200 330,200 Water Authority Additional Planned (Desal) 0 0 0 56,000 56,000
Water Authority Total 320,200 330,200 330,200 386,200 386,200
Member Agency Supplies Verifiable Total 139,640 143,735 144,809 144,909 145,109
(Additional Planned) Surface Water 0 0 0 0 0 Water Recycling 2,840 8,546 3,796 2,796 2,796 Desal 0 15,100 15,600 16,100 16,800 Reuse 4,470 29,086 46,686 106,099 106,099 GW Recovery 0 0 500 500 500 Groundwater 3,100 3,100 3,100 3,100 3,100
Member Agency Total 150,050 199,567 214,491 273,504 274,404
Total Projected Local Supplies 470,250 529,767 544,691 659,704 660,604
Metropolitan Water District Supplies 112,932 102,086 108,909 12,620 37,031
Total Supplies 583,182 631,853 653,600 672,324 697,635 Total Demands w/ Water Efficiency Savings 583,182 631,853 653,600 672,324 697,635
1 Normal water year demands based on 1960 – 2008 hydrology.
The specific member agency local recycled water, potable reuse and brackish groundwater projects included in the figures are listed in Tables F-2 and F-4, respectively, in Appendix F. Also included in the Appendix are conceptual projects identified by the member agencies.
DRAFT 2015 Urban Water Management Plan 9-10 April 2016
Appendix I District Code of Ordinance Section 39
Water Shortage Response Plan

39-1
SECTION 39. WATER SHORTAGE RESPONSE PROGRAM
39.01 DECLARATION OF NECESSITY AND INTENT (a) This Section establishes water management requirements necessary to conserve water, enable effective water supply planning, assure reasonable and beneficial use of water, prevent waste of water, prevent unreasonable use of water, prevent unreasonable method of use of water within the District in order to assure adequate supplies of water to meet the needs of the public, and further the public health, safety, and welfare, recognizing that water is a scarce natural resource that requires careful management not only in times of a water shortage, but at all times. (b) This Section establishes regulations to be implemented during times of declared water shortages, or declared water shortage emergencies. It establishes four levels of actions to be implemented in times of shortage, with increasing restrictions on water use in response to worsening water shortage conditions and decreasing available supplies. (c) The Level 1 water shortage response condition practices are voluntary and will be reinforced through local and regional public education and awareness measures that may be funded in part by the District. Beginning at the level 2 Water Shortage Response Condition, the District may implement water shortage pricing. When a water shortage response Level 2 condition is declared, all conservation practices and water-use restrictions may become mandatory and increasingly restrictive in order to attain escalating conservation goals. (d) During a Water Shortage Response Level 3 condition or higher, the water conservation practices and water use restrictions established by this ordinance are mandatory and violations are subject to criminal, civil, and administrative penalties and remedies specified in Section 72 of this ordinance.
Exhibit A-2

39-2
39.02 DEFINITIONS APPLICABLE TO THE PROGRAM
(a) The following words and phrases whenever used in this Section shall have the meaning defined in this sub-section:
1. “Grower” refers to those engaged in the
growing or raising, in conformity with recognized practices of husbandry, for the purpose of commerce, trade, or industry, or for use by public educational or correctional institutions, of agricultural, horticultural or floricultural products, and produced: (1) for human consumption or for the market, or (2) for the feeding of fowl or livestock produced for human consumption or for the market, or (3) for the feeding of fowl or livestock for the purpose of obtaining their products for human consumption or for the market. “Grower” does not refer to customers who purchase water subject to the Metropolitan Interim Agricultural Water Program or the Water Authority Special Agricultural Rate programs.
2. “Water Authority” means the San Diego County Water Authority.
3. “DMP” means the Water Authority’s Drought
Management Plan in existence on the effective date of this Section and as readopted or amended from time to time, or an equivalent plan of the Water Authority to manage or allocate supplies during shortages.
4. “Metropolitan” means the Metropolitan Water
District of Southern California.
5. “Person” means any natural person, corporation, public or private entity, public or private association, public or private agency, government agency or institution, school district, college, university, or any other user of water provided by the District.
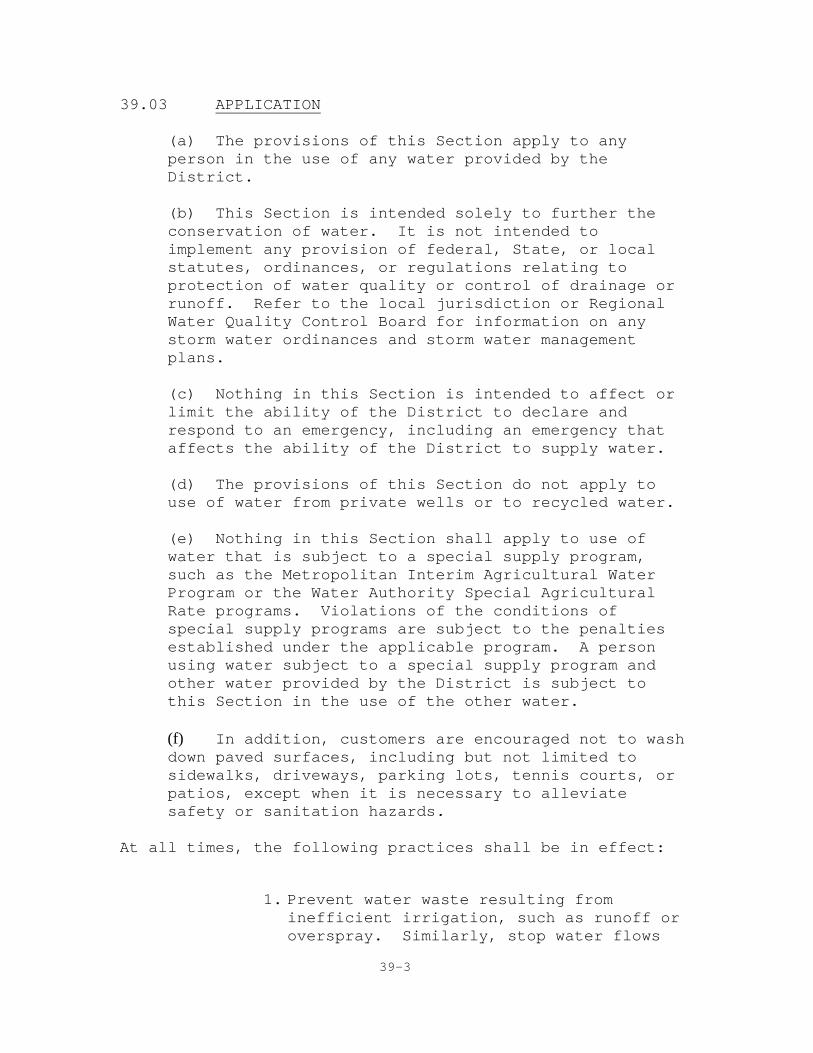
39-3
39.03 APPLICATION
(a) The provisions of this Section apply to any person in the use of any water provided by the District.
(b) This Section is intended solely to further the conservation of water. It is not intended to implement any provision of federal, State, or local statutes, ordinances, or regulations relating to protection of water quality or control of drainage or runoff. Refer to the local jurisdiction or Regional Water Quality Control Board for information on any storm water ordinances and storm water management plans. (c) Nothing in this Section is intended to affect or limit the ability of the District to declare and respond to an emergency, including an emergency that affects the ability of the District to supply water.
(d) The provisions of this Section do not apply to use of water from private wells or to recycled water. (e) Nothing in this Section shall apply to use of water that is subject to a special supply program, such as the Metropolitan Interim Agricultural Water Program or the Water Authority Special Agricultural Rate programs. Violations of the conditions of special supply programs are subject to the penalties established under the applicable program. A person using water subject to a special supply program and other water provided by the District is subject to this Section in the use of the other water. (f) In addition, customers are encouraged not to wash down paved surfaces, including but not limited to sidewalks, driveways, parking lots, tennis courts, or patios, except when it is necessary to alleviate safety or sanitation hazards.
At all times, the following practices shall be in effect:
1. Prevent water waste resulting from inefficient irrigation, such as runoff or overspray. Similarly, stop water flows
39-4
onto non-targeted areas, such as adjacent property, non-irrigated areas, hardscapes, roadways, or structures.
2. Serve and refill water in restaurants and other food service establishments only upon request.
3. Offer guests in hotels, motels, and other commercial lodging establishments the option of not laundering towels and linens daily.
4. Repair all water leaks within forty-eight hours (48) of notification by the District unless other arrangements are made with the General Manager or designee.
39.04 WATER SHORTAGE RESPONSE LEVEL 1 – SUPPLY WATCH CONDITION
(a) A Water Shortage Response Level 1 condition is also referred to as a “Supply Watch” condition. A Level 1 condition applies when the Water Authority notifies its member agencies that due to water shortage or other supply reductions, there is a reasonable probability there will be supply shortages and that a consumer demand reduction of up to 10 percent is required in order to ensure that sufficient supplies will be available to meet anticipated demands. The General Manager shall declare the existence of a Level 1 and take action to implement the Level 1 conservation practices identified in this Section.
(b) During a Level 1 condition, the District will increase its public education and outreach efforts to emphasize increased public awareness of the need to implement the following water conservation practices. The same water conservation practices may become mandatory if the District declares a Level 2 condition:
1. Irrigate residential and commercial
landscape before 10 a.m. and after 6 p.m. only. Customers are to water no more than three days a week using the suggested watering schedule as found on the District’s web page. New plantings and newly seeded areas are exempt for 30 days.

39-5
2. Use a hand-held hose equipped with a positive shut-off nozzle or bucket to water landscaped areas, including trees and shrubs located on residential and commercial properties that are not irrigated by a landscape irrigation system.
3. Irrigate nursery and commercial grower’s
products before 10 a.m. and after 6 p.m. only. Watering is permitted at any time with a hand-held hose equipped with a positive shut-off nozzle, a bucket, or when a drip/micro-irrigation system/equipment is used. Irrigation of nursery propagation beds is permitted at any time. Watering of livestock is permitted at any time.
4. Use re-circulated water to operate
ornamental fountains. 5. Wash vehicles, including but not limited to
motorcycles, farm equipment, trailers, boats and boat engines and motorhomes using a bucket and a hand-held hose with positive shut-off nozzle, mobile high pressure/low volume wash system, or at a commercial site that re-circulates (reclaims) water on-site. Vehicle washing is limited to once per week.
6. Use recycled or non-potable water for
construction purposes when available.
39.05 WATER SHORTAGE RESPONSE LEVEL 2 – SUPPLY ALERT CONDITION
(a) A Water Shortage Response Level 2 condition is also referred to as a “Supply Alert” condition. A Level 2 condition applies when the Water Authority notifies its member agencies that due to cutbacks caused by water shortage or other reduction in supplies, a consumer demand reduction of 11 to 20 percent is required in order to have sufficient supplies available to meet anticipated demands. The District Board of Directors may declare the existence of a Level 2 condition and implement the Level 2 conservation practices identified in this section of the ordinance. The District may decide to implement some or all of the Level 1 practices.
39-6
(b) All persons using District water shall make every effort to comply with Level 1 water conservation practices during a Level 2, and also to comply with the following additional conservation measures:
1. Limit residential and commercial landscape
irrigation to no more than three (3) days per week. This section shall not apply to homeowner’s vegetable gardens, fruit trees, commercial growers, or nurseries.
2. Limit lawn watering and landscape irrigation
using sprinklers to no more than fifteen (15) minutes per watering station per day. During the months of November through April, landscape irrigation shall not exceed seven (7) minutes per water watering station per assigned day. Watering times may need to be shortened to avoid run-off. This provision does not apply to landscape irrigation systems using water efficient devices, including but not limited to: weather based controllers, drip/micro-irrigation systems, rotating sprinkler nozzles and stream rotor sprinklers.
3. Water landscaped areas, including trees and
shrubs located on residential and commercial properties, and not irrigated by a landscape irrigation system on the same schedule set forth above by using a bucket, hand-held hose with positive shut-off nozzle, or low-volume non-spray irrigation.
4. Irrigation is not allowed during a rainstorm and for forty-eight hours after one-quarter inch or more of rainfall is measured at Lindbergh Field. No washing down of paved surfaces, including but not limited to sidewalks, driveways, parking lots, tennis courts, or patios, except when it is necessary to alleviate safety or sanitation hazards.
39.06 WATER SHORTAGE RESPONSE LEVEL 3 – SUPPLY CRITICAL CONDITION
(a) A Water Shortage Response Level 3 condition is also referred to as a “Supply Critical” condition. A Level 3 condition applies when the Water Authority notifies its member agencies that due to increasing cutbacks caused by

39-7
water shortage or other reduction of supplies, a consumer demand reduction of between 21 and 40 percent is required in order to have sufficient supplies available to meet anticipated demands. The District Board of Directors may declare the existence of a Level 3 condition and implement the Level 3 conservation practices identified in this Section.
(b) All persons using District water shall comply with Level 1 and Level 2 water conservation practices during a Level 3 condition and shall also comply with the following additional mandatory conservation measures:
1. Limit residential and commercial landscape irrigation to no more than two (2) assigned days per week on a schedule established by the General Manager or designee and posted by the District. During the months of November through April, landscape irrigation is limited to no more than once per week on a schedule established by the General Manager or designee and posted by the District. This section shall not apply to commercial growers or nurseries.
2. Water landscaped areas, including trees and
shrubs located on residential and commercial properties, and not irrigated by a landscape irrigation system on the same schedule set forth above by using a bucket, hand-held hose with a positive shut-off nozzle, or low-volume non-spray irrigation.
3. Stop filling or re-filling ornamental lakes
or ponds, except to the extent needed to sustain aquatic life, provided that such animals are of significant value and have been actively managed within the water feature prior to declaration of a water shortage response level under this Section.
4. Stop operating non-residential ornamental fountains or similar decorative water features unless recycled water is used.
5. Stop washing vehicles except at commercial
carwashes that re-circulate water, or by high pressure/low volume wash systems. If a commercial car wash cannot accommodate the vehicle because of the vehicle size or type, such as RVs, horse trailers, boats and commercial vehicles, customers will be

39-8
allowed to wash vehicles using a bucket and a hand-held hose with positive shut-off nozzle, mobile high pressure/low volume wash system.
(c) Upon the declaration of a Level 3 condition, the
District may suspend new potable water service and statements of immediate ability to serve or provide potable water service (such as, will serve letters, certificates, or letters of availability) except under the following circumstances:
1. A valid, unexpired building permit has been
issued for the project; or 2. The project is necessary to protect the
public’s health, safety, and welfare; or 3. The applicant provides substantial evidence
of an enforceable commitment that water demands for the project will be offset prior to the provision of a new water meter(s) to the satisfaction of the District.
This provision shall not be construed to preclude the resetting or turn-on of meters to provide continuation of water service or to restore service that has been interrupted.
(d) Upon the declaration of a Level 3 condition, the District will suspend consideration of annexations to its service area.
(e) The District may establish a water allocation for
property served by the District using a method that takes into consideration the implementation of conservation methods or the installation of water saving devices. If the District establishes a water allocation, it shall provide notice of the allocation by including it in the regular billing statement for the fee or charge or by any other mailing to the address to which the District customarily mails the billing statement for fees or charges for on-going water service. Following the effective date of the water allocation as established by the District, any person that uses water in excess of the allocation shall be subject to a penalty for each billing unit of water in excess of the allocation. The penalty for excess water
39-9
usage shall be cumulative to any other remedy or penalty that may be imposed for violation of this Section.
39.07 WATER SHORTAGE RESPONSE LEVEL 4 – SUPPLY EMERGENCY CONDITION
(a) A Water Shortage Response Level 4 condition is also referred to as a “Supply Emergency” condition. A Level 4 condition applies when the Water Authority Board of Directors declares a water shortage emergency pursuant to California Water Code section 350 and notifies its member agencies that Level 4 requires a demand reduction of more than 40 percent in order for the District to have maximum supplies available to meet anticipated demands. The District shall declare a Level 4 in the manner and on the grounds provided in California Water Code section 350.
(b) All persons using District water shall comply with conservation measures required during Level 1, Level 2, and Level 3 conditions and shall also comply with the following additional mandatory conservation measures:
1. Stop all landscape irrigation, except crops
and landscape products of commercial growers and nurseries. This restriction shall not apply to the following categories of use unless the District has determined that recycled water is available and may be lawfully applied to the use.
A. Maintenance of trees and shrubs that are watered on the same schedule as noted in the Level 3 Condition, by using a bucket, hand-held hose with a positive shut-off nozzle, or low-volume non-spray irrigation;
B. Maintenance of existing landscaping
necessary for fire protection as specified by the Fire Marshal of the local fire protection agency having jurisdiction over the property to be irrigated;
C. Maintenance of existing landscaping for
erosion control; D. Maintenance of plant materials
identified to be rare or essential to the well being of rare animals;

39-10
E. Maintenance of landscaping within
active public parks and playing fields, day care centers, school grounds, cemeteries, and golf course greens, provided that such irrigation does not exceed two (2) days per week according to the schedule established under the District’s Level 3 Condition;
F. Watering of livestock; and G. Public works projects and actively
irrigated environmental mitigation projects.
2. Repair all water leaks within twenty-four (24) hours of notification by the District unless other arrangements are made with the District.
(c) The District may establish a water allocation for property served by the District. If the District establishes water allocation it shall provide notice of the allocation by including it in the regular billing statement for the fee or charge or by any other mailing to the address to which the District customarily mails the billing statement for fees or charges for on-going water service. Following the effective date of the water allocation as established by the District, any person that uses water in excess of the allocation shall be subject to a penalty for each billing unit of water in excess of the allocation. The penalty for excess water usage shall be cumulative to any other remedy or penalty that may be imposed for violation of any provision of this Section.
39.08 CORRELATION BETWEEN DROUGHT MANAGEMENT PLAN (DMP) AND WATER SHORTAGE RESPONSE LEVELS
(a) The correlation between the Water Authority’s DMP
stages and the District’s water shortage response levels identified in this Section of the Code of Ordinance is described herein. Under DMP Stage 1, the District would implement Water Shortage Response Level 1 actions. Under DMP Stage 2, the District would implement Water Shortage Response Level 1 or Level 2 actions. Under DMP Stage 3, the District would implement Water Shortage Response Level 2, Level 3, or Level 4 actions.

39-11
(b) The water shortage response levels identified in
this Section correspond with the Water Authority DMP as identified in the following table:
Water Shortage Response Levels
Use Restrictions
Conservation Target
DMP Stage
1 - Supply Watch Voluntary Up to 10% Stage 1 or 2
2 - Supply Alert Mandatory 11 to 20% Stage 2 or 3
3 - Supply Critical Mandatory 21 to 40% Stage 3 4 - Supply
Emergency Mandatory Above 40% Stage 3
39.09 PROCEDURES FOR DETERMINATION AND NOTIFICATION OF
WATER SHORTAGE RESPONSE LEVEL
(a) The existence of a Water Shortage Response Level 1 condition may be declared by the General Manager upon a written determination of the existence of the facts and circumstances supporting the determination. A copy of the written determination shall be filed with the Clerk or Secretary of the District and provided to the District Board of Directors. The General Manager may publish a notice of the determination of existence of Water Shortage Response Level 1 condition in one or more newspapers, including a newspaper of general circulation within the District. The District will also post notice of the condition on their website.
(b) The existence of Water Shortage Response Level 2 or Level 3 conditions may be declared by resolution of the District Board of Directors adopted at a regular or special public meeting held in accordance with State law. The mandatory conservation measures applicable to Water Shortage Response Level 2 or Level 3 conditions shall take effect on the tenth (10) day after the date the response level is declared. Within five (5) days following the declaration of the response level, the District shall publish a copy of the resolution in a newspaper used for publication of official notices.
(c) The existence of a Water Shortage Response Level 4 condition may be declared in accordance with the procedures specified in California Water Code sections 350 to 352 as note below:
39-12
350. The governing body of a distributor of a public water supply, whether publicly or privately owned and including a mutual water company, may declare a water shortage emergency condition to prevail within the area served by such distributor whenever it finds and determines that the ordinary demands and requirements of water consumers cannot be satisfied without depleting the water supply of the distributor to the extent that there would be insufficient water for human consumption, sanitation, and fire protection. 351. Except in event of a breakage or failure of a dam, pump, Pipe line or conduit causing an immediate emergency, the declaration shall be made only after a public hearing at which consumers of such water supply shall have an opportunity to be heard to protest against the declaration and to present their respective needs to said governing board. 352. Notice of the time and place of hearing shall be published pursuant to Section 6061 of the Government Code at least seven days prior to the date of hearing in a newspaper printed, published, and circulated within the area in which the water supply is distributed, or if there is no such newspaper, in any newspaper printed, published, and circulated in the county in which the area is located.
The mandatory conservation measures applicable to Water Shortage Response Level 4 conditions shall take effect on the tenth (10) day after the date the response level is declared. Within five (5) days following the declaration of the response level, the District shall publish a copy of the resolution in a newspaper used for publication of official notices. If the District establishes a water allocation, it shall provide notice of the allocation by including it in the regular billing statement for the fee or charge or by any other mailing to the address to which the District customarily mails the billing statement for fees or charges for on-going water service. Water allocation shall be effective on the fifth (5) day following the date of mailing or at such later date as specified in the notice. (d) The District Board of Directors may declare an end to a Water Shortage Response Level by the adoption of a resolution at any regular or special meeting held in accordance with State law.

Appendix J District Code of Ordinance Section 72
Penalties and Damages
SECTION 72 PENALTIES AND DAMAGES 72.01 GENERAL
A. User and Owner Responsibility. Each person receiving service, or that owns a property that receives service, agrees to pay the District any applicable fees and charges. Such persons are also responsible for all costs and damages in connection with any violation of this Code relating to their service.
B. District Not Liable. The District shall bear no liability for any cost, damage, claim or expense incurred by District or any responsible party or third party on behalf of the District arising from or related to any violation, including, but not limited to, costs, damages, claims or expenses arising from any corrective action of the District. Such corrective actions include, but are not limited to, the removal, confiscation, disposition or use of any device, equipment, improvement or material encroaching on any District property or used in connection with any other violation.
C. District Obligation to Collect Damages. Pursuant to Government Code Section 53069.6, the District shall take all practical and reasonable steps, including appropriate legal action, if necessary, to recover civil damages for the negligent, willful, or unlawful damaging or taking of property of the District.
D. Assessment of Damages. Actual damages resulting from any violation, including late payment or failure or refusal to pay for service and any interest thereon, may be assessed and collected as part of a customer’s monthly bill to the extent allowed by law. The District will separately invoice any actual damages not assessed on a monthly bill, including any damages assessed against any responsible person who is not a customer.
E. Unpaid or Partially Paid Bills. Bills issued by the District are due in full as provided in such bills. Failure to timely pay bills in full may lead to a reduction, suspension, or termination of service, as provided in Section 72.02(B), below, in Section 34 of this Code, or pursuant to other provisions of this Code or applicable law. In addition, if bills remain unpaid, in full or in part, the District may lien the delinquent real property and may assess damages and penalties established by District or otherwise authorized by law.
72.02 VIOLATIONS AND GENERAL PENALTIES FOR VIOLATIONS
A. Notice of Violation. Notice and a reasonable period of time to correct a violation will be given prior to the termination, reduction or suspension of service or the imposition of any administrative fine. However, the District may, without notice, correct any condition or violation that endangers the health or safety or impairs any District service, facility or property or is otherwise determined by the District to require immediate action.
1. Investigative Procedures. If a possible violation is identified, observed or reported, the District will contact the allegedly responsible party to investigate. If the violation is in fact occurring, District staff will issue a notice of violation or otherwise inform the responsible party that corrective actions must be taken within a period of time deemed reasonable by the District, taking into consideration the nature of the violation and the potential damage that can arise if the violation continues.
2. Content of Notice of Violation. The notice will describe the violation, indicate the actions that must be taken, and indicate the date by which those actions must be taken. Unless immediate action is required, the notice will provide a reasonable time for the violation to be corrected. The notice will also specify the amount of any delinquency, actual damages or other amounts due the District, if any, and the telephone number of a representative of the District who can provide additional information.
3. No Notice Required; District Action. If the District determines that immediate or prompt correction of the violation is necessary to prevent waste or to maintain the integrity of the water supply, systems or facilities of the District, or for the immediate protection of the health, safety or welfare of persons or property, or for any other compelling reason, the District will take any action deemed necessary (including suspension, reduction or termination of service; locking or removal of meters; or repairs of any improvements) and a notice will be left at the affected parcel specifying any further corrective actions required. Any costs incurred by District and any applicable fines will be the responsibility of the responsible party.
4. Notice; Failure to Comply. The responsible party will be given an opportunity to correct the violation and to provide verbal, written and pictorial exculpatory evidence. If such evidence does not exonerate the responsible parties and if the violation(s) are not corrected to the satisfaction of the District within the time provided, the District may assess cost and penalties, administrative fines and may take any other action or pursue any other remedy available. Furthermore, if the violation concerns any service requirement or facility, or to prevent waste or protect the integrity of the system or the health and safety of the public, the District may suspend, reduce or terminate service to the extent permitted by law.
B. Service Termination, Suspension or Reduction; Removing or Locking Meters. Service may be reduced, suspended or terminated for failure to pay for service or in connection with a violation of this Code or applicable law. Termination, suspension or reduction of service will proceed as follows:
1. Notice Prior to Termination, Suspension or Reduction of Service. Except as provided in Paragraph A, above, or in other provisions of this Code or applicable law, not less than ten (10) days notice will be given prior to the date service is reduced, suspended or terminated; provided that, where service is terminated due to failure to comply with the terms of an amortization agreement, under Section 34 of this Code, only forty-eight (48) hours prior notice is required. The notice will be delivered to
the affected parcel and, if the owner of record does not reside in the affected parcel, a copy of the notice will be forwarded to the owner’s address on record with the assessor’s office via any available means, such as personal delivery, certified mail return receipt requested, email, fax or fed-ex.
2. Termination for failure to pay for service. The District may discontinue any or all service due to failure to pay the whole or any part of a bill issued by the District. In connection with termination of water service, the provisions of Section 60373 of the Government Code, or any other appropriate provision of law, or as set forth in Section 34 of this Code of Ordinance, will be followed. In connection with sewer, Section 71672 of the California Water Code or other applicable requirements will be followed.
C. Reconnection or Reinstatement of Service, Unlocking or Reinstalling Meters. If service is reduced, suspended or terminated for any reason, each of the following conditions applicable to the situation must be satisfied or arrangements satisfactory to the General Manager or a designee must be made before service is reinstated:
1. Outstanding amounts for service bills, including any service charges for benefits derived from the violation, must be paid;
2. All required deposits (including any security deposits), actual damages, fines, costs, charges and penalties must be paid;
3. Any amounts due for the removal, locking, servicing, repair or replacement of meters or other facilities required for service must be paid at the rates in effect at the time of reinstatement, as set forth on Appendix A to this Code or other schedule of fees then in effect;
4. All violations and related damages or conditions must have been corrected and/or repaired and evidence satisfactory to the District to that effect and demonstrating that it is safe to reinstate service, must have been provided to and approved by the District; and
5. If the service was originally in the name of a tenant, the District may require the owner of the parcel to request the service account under his or her name and responsibility.
D. Owner Responsibility for Account. In addition to owners’ obligations under subsection (A) of section 72.01 and subsection (C)(5) of Section 72.02, above, and any other remedies provided by this Code or by applicable law, Owners may be required to deliver to the District a form of acknowledgement or authorization for service to a tenant. In addition, if (i) a tenant engages in any violation, (ii) if the District has reduced, suspended or terminated any service to a tenant three (3) times within any twenty-four (24) month period or (iii) the tenant has failed or refuses to comply with the terms of payment arrangements with the District four (4) times, the District reserves the right to demand that the property owner take responsibility for services to the tenant-

occupied parcel. The General Manager or a designee shall develop procedures to implement these requirements.
E. Right of Access to Customer’s Premises; Interference. If any person refuses to consent to an investigation of a possible violation, or prevents or refuses to allow access to District staff or authorized representatives to any premises or facility during an investigation or in connection with any termination, reduction or suspension of service, the District may seek an injunction or a warrant, as provided in Section 71601 of the Water Code.
F. Other Remedies. In addition to the actions contemplated in this Section, the District may seek other remedies authorized or required by any applicable law, including imposing an administrative fine, pursuant to Section 72.06, or pursuing other available civil or criminal remedies.
72.03 CERTAIN SPECIFIC OPERATIONAL VIOLATIONS
A. Unauthorized Connections. The District shall bear no cost or liability for any unauthorized connection. In addition to other remedies, any unauthorized connection is subject to a Type II fine, pursuant to Section 72.06 depending upon the severity, duration and reoccurrence of the violation and any other factors the District may reasonably take into consideration.., Further, the District may demand that the unauthorized connection be immediately disconnected. In the alternative, if the customer refuses to take immediate action, or if immediate actions is necessary as set forth in Section 72.02(A)(3), above, the District may immediately disconnect, remove, confiscate, destroy or dispose of any parts installed or used for the unauthorized connection, all at the expense of the customer and any other responsible party. To the extent allowed by law, the District may also, immediately or as otherwise deemed advisable by the District, terminate service to any parcel and any person that allows, uses or benefits from such unauthorized connection.
B. Water waste. No customer shall knowingly permit leaks or other wastes of water, including, but not limited to, allowing runoff on any portion of his or her property, engaging in non-permitted uses of water, or failing to take corrective action after notice of any leaks or water waste is given. If the District determines that water waste is occurring, the District will:
1. Notify the customer that they are in violation of the District’s Code of Ordinances.
2. Notwithstanding the foregoing, the District may, without prior notice, repair or replace any District controlled facilities at the cost of the person identified as the responsible party, if any.
3. If the water waste is due to a condition within the customer’s property or facilities, the District may (i) require the customer to repair or replace the affected facilities, immediately or within a reasonable time, depending on the situation; or (ii) if necessary to prevent further waste, adjust, lock or remove the meter. If any repair

or replacement required is not completed in a timely manner, the District may perform the repair or replacement at the cost of the customer or may terminate service without further notice.
C. Meter Tampering. In addition to other remedies, tampering is subject to a Type II fine pursuant to Section 72.06 depending upon the severity, duration and reoccurrence of the violation and any other factors the District may reasonably take into consideration. Additionally, tampering may be prosecuted as a crime under Section 498 of the California Penal Code, as set forth in Section 73.01 of this Code.
D. Fire Service Violation. Fire service is subject to compliance with all provisions of this Code and the law concerning water service, and failure to comply with such provisions may result in the reduction, suspension, termination or disconnection of water service for fire protection, without any liability to District. Furthermore, illegal connections or other violations relating to fire service are subject to either a Type I or Type II fine, at the option of the District, and may be prosecuted as crimes.
E. Backflow prevention, screens and other safety devices. If service requirements include the installation, testing and maintenance of backflow prevention devices (Section 23.04 of this Code), screens or other safety operational items, in addition to, or in lieu of, other remedies provided herein, the District may apply any of the remedies under Section VI and VII of the District’s Ordinance No. 386, as amended or renumbered. Furthermore, violations relating to backflow testing may be prosecuted as set forth in Section 73.01 of this Code. Violations of backflow requirements or knowingly filing a false statement or report required by a local health officer are subject to either a Type I or Type II fine, at the option of the District, pursuant to Section 72.06, below.
F. Violation Concerning Recycled Water Service. In addition to any fine, revocation, suspension or penalty imposed under Section 26 in connection with any violation of said Section, including permit suspension or revocation under Section 26.07.C, the District may (i) suspend or terminate water and or sewer service to the property, the owner and/or the operator; (ii) require payment by the owner for any damage to the District facilities, reimbursement to District of costs and expenses, or fines imposed on the District in connection with such violation; or (iii) prosecute the responsible party under any applicable provision of this Code, the Water Code or the Penal Code. Additionally, any violation concerning recycled water service is subject to either a Type I or Type II fine, at the option of the District, pursuant to Section 72.06, below.
G. Violation Concerning Sewer Service. In addition to any other remedy, fine or penalty provided by this Code or applicable law, failure to comply with any requirements of sewer service, including requirements for the preservation of public health, safety and welfare and including, but not limited to, the requirements established under Article II, Chapter 2, Sections 50 to 56.04 of this Code, as hereafter amended or as supplemented by other District Rules and Regulations for Sewer Service, the California Health and Safety Code, the California Code of Regulations, Titles 17 and 22, and Water

Agency Standards. Furthermore, may be prosecuted as set forth in Section 73.01 of this Code. Additionally, any violation concerning sewer service is subject to a Type I or Type II fine, at the option of the District, pursuant to Section 72.06, below.
H. Theft, Fraud, or Misappropriation. In addition to any other remedy, fine or penalty provided by this Code or applicable law, any violation involving theft, fraud or misappropriation of District water, services, or property is subject to a Type I or Type II fine, at the option of the District, pursuant to Section 72.06, below.
72.04 VIOLATIONS OF CONSERVATION OR OTHER WATER USE RESTRICTION PROVISIONS
The District has established and published conservation measures set forth in Section 39 of the Code. Commencing with declared Level 2 conditions, the District may assess water shortage rates and charges previously adopted. In addition, after notice of the declared water shortage level is given as required by law, any person who uses, causes to be used, or permits the use of water in violation of such requirements (other than a person who qualifies for an applicable exemption, if any) may be assessed damages, penalties and fines.
A. Additional provisions concerning use restriction violations. In addition to payment of actual damages, the following may apply to a violation of any water conservation or water use restriction measure:
1. A change on the account holder shall not cause the account to revert to pre-violation status unless the new account holder provides evidence that it is not related to the violator and had no responsibility for the prior account.
2. The District may reduce, suspend or terminate service to any parcel immediately and without further notice if the violation involves or results in water waste, as set for in Section 72.03(B), above.
3. Willful violations of mandatory conservation measures described in Section 39 of this Code may be enforced by terminating service to the property at which the violation occurs, as provided by Section 356 of the California Water Code.
B. Prosecution for violations of conservation measures. Pursuant to Section 377 and 71644 of the California Water Code, each violation of the District’s Conservation Ordinance, set fort in Section 39 of this Code, may be prosecuted as a misdemeanor, punishable by imprisonment in the County jail for no more than thirty (30) days or by a fine, as set forth in subsection (C), below.
C. Assessment of fines for violations of conservation or water use restriction provisions. Any responsible party who fails to comply with any conservation or use restriction measure is subject to the assessment of an administrative Type I fine, added to account, pursuant to Section 72.06, below.

72.05 VIOLATIONS INVOLVING DISTRICT REAL PROPERTY
A. Removal, Disposition and Costs. The District has absolute discretion to determine the corrective action required in connection with any violation involving District real property, including requiring the owner of any unauthorized encroachment or improvement to remove it or taking action to remove it immediately and without notice. Any improvements or uses placed within or on any District property or right of way are subject to the following:
1. Costs and Damages. All costs and damages shall be the responsibility of the customer and any other responsible party. Furthermore, the District shall not be liable for costs to repair or replace any unauthorized encroachment or improvement, or any property, improvement or thing used in connection with, supported by or attached thereto.
2. Burden of proof. The burden shall be on the user to prove to the District’s satisfaction, the authority, scope and extent of any right to access, improve or use the District’s property. Only written evidence in the form of an agreement, deed, statute, recorded or official map or plat, governmental regulation or other right may be used to establish such claim of right.
B. Notice. In connection with any improvement or use that does not constitute a health hazard and does not interfere with the District’s use of its property, the District will give written notice of up to sixty (60) days, at the discretion of the General Manager, to cease, terminate, eliminate or remove the offending improvement, structure or use. Any written notice will be given to the responsible party or posted at the property where the trespass or encroachment occurs. If the responsible party is not the owner of any real property affected by the violation, the District will also give notice to the owner of record at the address on record with the assessor’s office via personal delivery, certified mail return receipt requested or via Fed-Ex.
C. Immediate action. In connection with any improvement that constitutes a health hazard or interferes with the District’s use of any District property, the District will take any immediate action deemed necessary by the General Manager.
D. Fines. In addition to all other remedies provided under this Article or under applicable law, the District may impose a fine as provided in Section 72.06. Additionally, the District may impose a fine up to either the amount specified on any sign, or a Type I or Type II fine, at the option of the District, in connection with any trespass on District property in violation of a sign prohibiting trespassing, pursuant to Section 72.06, below.
E. Separate violation. A separate violation will accrue for each day after the deadline to cease, terminate, eliminate or remove the trespass or encroachment, as set forth in the notice.

72.06 ADMINISTRATIVE FINES
Any administrative fines established herein shall be in the nature of civil penalties and shall be additional and cumulative to any other fines, damages or any other charges established by the District and are also separate from and cumulative to any other civil or criminal penalty, fine or remedy. In connection with each violation, the District may assess a fine up to the amount specified in the schedule of fines for the type of fine being imposed.
Each day during which a violation is in effect constitutes a separate violation and violations are cumulative while the account is in the name of the original violator or any person that participated in or benefited from the violation. Except where the violation creates an immediate danger to health or safety, the person responsible for the continuing violation will be provided a reasonable period of time to correct or otherwise remedy the violation(s) prior to the imposition of administrative fines.
A. Assessment of Fines for Technical Violations of Other Code Provisions. Any person who engages in a violation of any provision of this Code is subject to the assessment of a separate administrative Type I Fine, unless subject to a more severe fine as set forth in this Code.
B. Assessment of Separate Fines.
Nothing in this code or the limits specified per violation shall prevent the imposition of separate fines for each separate violation committed during a single act. For example, in connection with a violation concerning sewer service that involves a trespass on any portion of the District’s real property, separate fines may be assessed for the trespass, the damage to District personal property, the damage to District real property; the damage to the sewer system and the activity resulting on all the damages.
C. Types of Fines. The amount for each type of fine specified below may increase automatically to reflect any higher amount authorized by law or regulation. The District has determined to establish two types of fines based on the nature of the violation, as follows:
1. Type I Fine. Any violation that does not have the potential to endanger the health or safety of the public. The fine will not exceed the amount specified in the Section 36900(b) of the California Government Code or Appendix A for a first, second, third or each additional violation of that same ordinance or requirement within a twelve-month period.
2. Type II Fine. Any violation that has the potential to endanger the health or safety, including, but not limited to, unauthorized or illegal connections, meter tampering, water theft, , or knowingly filing a false statement or report required by a local health officer . The fine will not exceed the amount specified on Appendix A per each day the violation is identified or continues.
D. Collection of Fines. Any fines assessed by the District are payable directly to the District, are due upon issuance or as otherwise indicated on the notice or bill, and are delinquent 30 calendar days from the due date.
E. Notice of Administrative Fine; Content. Notice of an administrative fine pursuant to this section will contain the following information: (i) a brief description of the violation(s); (ii) the date and location of the violation(s); (iii) a brief description of corrective action(s) required, as appropriate; (iv) a statement explaining that each day the violation continues constitutes a new violation; (v) in the case of violations creating an immediate danger to health or safety, the amount of civil penalty assessed or, in all other cases, the amount of civil penalty to be assessed if the violation(s) are not corrected within the time provided by the notice; (vi) a statement of the procedure for payment and the consequences of failure to pay; (vii) contact information for the District employee that should be contacted to discuss the notice and provide evidence of compliance; and (viii) a brief statement describing the responsible party’s right to request further review, pursuant to subsection (F), below.
F. Option for Board Review . Persons receiving a Notice of Administrative Fine may request Board review. The request for Board consideration must be in writing, must be received by the District Secretary within ten (10) calendar days from the date of the notice and must include contact information, an explanation of the basis for the request, and any supporting documentation said person(s) wish to provide to the Board for review and consideration. District staff will review the petitioner’s request and will make a recommendation to the Board in light of its investigation. The District will provide notice of the date, time and place for Board consideration by electronic means, facsimile or first class mail sent to the return addressee indicated on the written request.
G. Any fines assessed pursuant to the Notice of Administrative Fines must be timely paid notwithstanding the filing of a request for Board review.
At the time of Board review, the petitioner may, address the Board and respond to the charges to show good cause why the fine should not be imposed; however, the customer is not entitled to a full judicial-type hearing with cross examination, sworn testimony, etc. In accordance with the provisions of Government Code Section 53069.4, the Board’s determination shall be final and conclusive, and shall be deemed confirmed, if not appealed within 20 calendar days to the Superior Court of the County of San Diego.

Appendix K BMP Reports 2011‐2014

GPCD in 2012:
GPCD Target for 2018:
127.27
Biennial GPCD Compliance Table
Year
2010
2012
2014
2016
2018
Report
1
2
3
4
5
% Base
96.4%
92.8%
89.2%
85.6%
82.0%
GPCD
186.09
179.14
172.19
165.24
158.29
% Base
100%
96.4%
92.8%
89.2%
82.0%
GPCD
193.04
186.09
179.14
172.19
158.29
Target Highest Acceptable Bound
179 Otay Water District
158.29
GPCD in 2006: 199.6
ON TRACK
CUWCC BMP Coverage Report 2012

1. Conservation Coordinator provided with necessary resources to implement BMPs?
Name:
Title:
Email:
Water Conservation Program Manager
William Granger
2. Water Waste Prevention Documents
Otay Water District179
WW Document Name WWP File Name WW Prevention URL WW Prevention Ordinance Terms Description
Option A Describe the ordinances or terms of service adopted by your agency to meet the water waste prevention requirements of this BMP.
72.03 CERTAIN SPECIFIC OPERATIONAL VIOLATIONSB. Water waste. No customer shall knowingly permit leaks or other wastesof water, including, but not limited to, allowing runoff on any portion of his or herproperty
Option B Describe any water waste prevention ordinances or requirements adopted by your local jurisdiction or regulatory agencies within your service area.
Option C Describe any documentation of support for legislation or regulations that prohibit water waste.
Option D Describe your agency efforts to cooperate with other entities in the adoption or enforcement of local requirements consistent with this BMP.
Option E Describe your agency support positions with respect to adoption of legislation or regulations that are consistent with this BMP.
Option F Describe your agency efforts to support local ordinances that establish permits requirements for water efficient design in new development.
At Least As effective As No
BMP 1.1 Operation Practices
Foundational Best Managemant Practices for Urban Water Efficiency
CUWCC BMP Retail Coverage Report 2011
ON TRACK

Exemption
Comments:
No 0
BMP 1.1 Operation Practices
Foundational Best Managemant Practices for Urban Water Efficiency
CUWCC BMP Retail Coverage Report 2011
ON TRACK
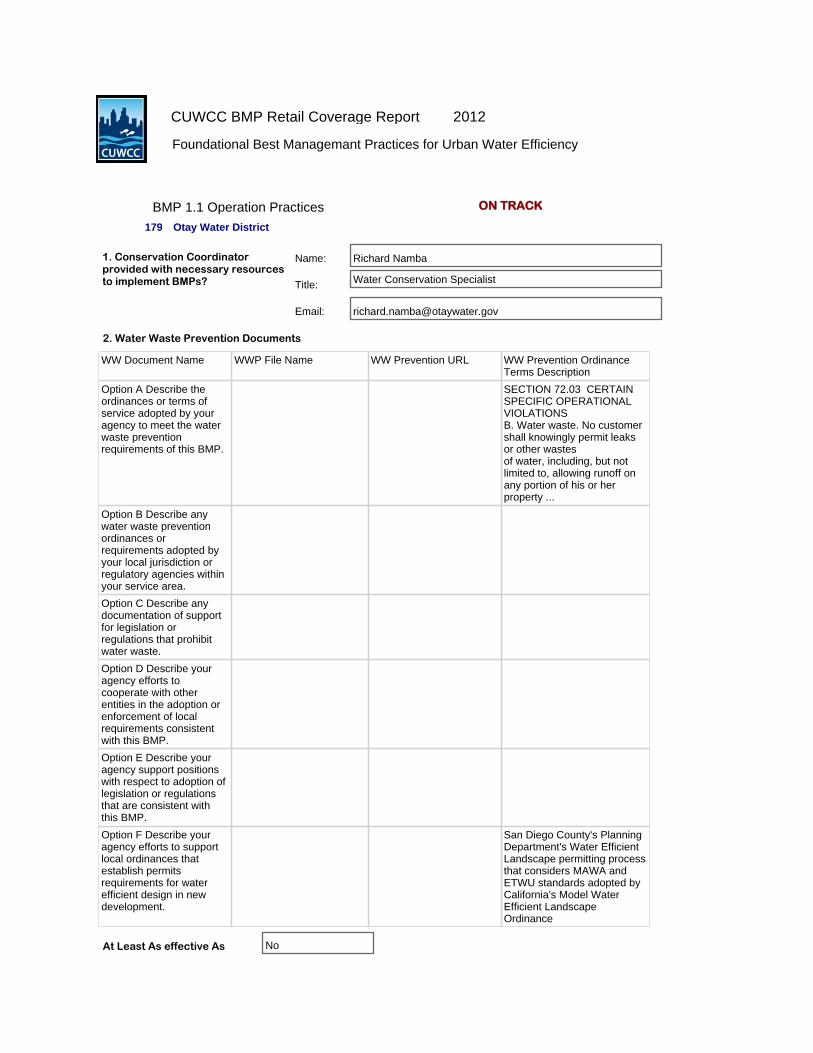
1. Conservation Coordinator provided with necessary resources to implement BMPs?
Name:
Title:
Email:
Water Conservation Specialist
Richard Namba
2. Water Waste Prevention Documents
Otay Water District179
WW Document Name WWP File Name WW Prevention URL WW Prevention Ordinance Terms Description
Option A Describe the ordinances or terms of service adopted by your agency to meet the water waste prevention requirements of this BMP.
SECTION 72.03 CERTAIN SPECIFIC OPERATIONAL VIOLATIONSB. Water waste. No customer shall knowingly permit leaks or other wastesof water, including, but not limited to, allowing runoff on any portion of his or herproperty ...
Option B Describe any water waste prevention ordinances or requirements adopted by your local jurisdiction or regulatory agencies within your service area.
Option C Describe any documentation of support for legislation or regulations that prohibit water waste.
Option D Describe your agency efforts to cooperate with other entities in the adoption or enforcement of local requirements consistent with this BMP.
Option E Describe your agency support positions with respect to adoption of legislation or regulations that are consistent with this BMP.
Option F Describe your agency efforts to support local ordinances that establish permits requirements for water efficient design in new development.
San Diego County's Planning Department's Water Efficient Landscape permitting process that considers MAWA and ETWU standards adopted by California's Model Water Efficient Landscape Ordinance
At Least As effective As No
BMP 1.1 Operation Practices
Foundational Best Managemant Practices for Urban Water Efficiency
CUWCC BMP Retail Coverage Report 2012
ON TRACK
Exemption
Comments:
No 0
BMP 1.1 Operation Practices
Foundational Best Managemant Practices for Urban Water Efficiency
CUWCC BMP Retail Coverage Report 2012
ON TRACK

179 Otay Water District
Completed Standard Water Audit Using AWWA Software? Yes
AWWA File provided to CUWCC? Yes
Otay 2011 AWWA Reporting Worksheet.xls
AWWA Water Audit Validity Score? 83
Complete Training in AWWA Audit Method Yes
Complete Training in Component Analysis Process? Yes
Component Analysis? No
Repaired all leaks and breaks to the extent cost effective? Yes
Locate and Repar unreported leaks to the extent cost effective? Yes
Maintain a record keeping system for the repair of reported leaks, including time of report, leak location, type of leaking pipe segment or fitting, and leak running time from
report to repair. Yes
CUWCC BMP Coverage Report 2011
Foundational Best Management Practices For Urban Water Efficiency
BMP 1.2 Water Loss Control ON TRACK
Provided 7 Types of Water Loss Control Info
Leaks Repairs Value Real Losses
Value Apparent Losses
Miles Surveyed Press Reduction Cost Of Interventions
Water Saved (AF)
Comments:
At Least As effective As No
0NoExemption

179 Otay Water District
Completed Standard Water Audit Using AWWA Software? Yes
AWWA File provided to CUWCC? Yes
Otay 2012 AWWA Reporting Worksheet.xls
AWWA Water Audit Validity Score? 78
Complete Training in AWWA Audit Method Yes
Complete Training in Component Analysis Process? Yes
Component Analysis? No
Repaired all leaks and breaks to the extent cost effective? Yes
Locate and Repar unreported leaks to the extent cost effective? Yes
Maintain a record keeping system for the repair of reported leaks, including time of report, leak location, type of leaking pipe segment or fitting, and leak running time from
report to repair. Yes
CUWCC BMP Coverage Report 2012
Foundational Best Management Practices For Urban Water Efficiency
BMP 1.2 Water Loss Control ON TRACK
Provided 7 Types of Water Loss Control Info
Leaks Repairs Value Real Losses
Value Apparent Losses
Miles Surveyed Press Reduction Cost Of Interventions
Water Saved (AF)
Comments:
At Least As effective As No
0NoExemption

179 Otay Water District
Numbered Unmetered Accounts No
Metered Accounts billed by volume of use Yes
Number of CII Accounts with Mixed UseMeters
2231
Conducted a feasibility study to assess merits of a program to provide incentives to switch mixed-use accounts to dedicated landscape meters?
Yes
Feasibility Study provided to CUWCC? Yes
Completed a written plan, policy or program to test, repair and replace meters
Yes
Comments:
Date:
Uploaded file name:
2/28/2013
Copy_of_MUM_Final_Report_Nov_2012.docx
At Least As effective As Yes
Refer to GPCD On track report below
2NoExemption
BMP 1.3 Metering With Commodity
CUWCC BMP Coverage Report 2011
Foundational Best Management Practices For Urban Water Efficiency
ON TRACK

179 Otay Water District
Numbered Unmetered Accounts No
Metered Accounts billed by volume of use Yes
Number of CII Accounts with Mixed UseMeters
993
Conducted a feasibility study to assess merits of a program to provide incentives to switch mixed-use accounts to dedicated landscape meters?
Yes
Feasibility Study provided to CUWCC? Yes
Completed a written plan, policy or program to test, repair and replace meters
Yes
Comments:
Date:
Uploaded file name:
11/30/2012
MUM Final Report Nov 2012.docx
At Least As effective As Yes
Refer to 2010 GPCD on track report below
0NoExemption
BMP 1.3 Metering With Commodity
CUWCC BMP Coverage Report 2012
Foundational Best Management Practices For Urban Water Efficiency
ON TRACK

Use Canadian Water Wastewater Association Rate Design ModelImplementation Option:
Implementation (Water Rate Structure)
179 Otay Water District
YesAgency Provide Sewer Service:
Customer Class Water Rate Type ConservingRate?
(V) Total RevenueComodity Charges
(M) Total Revenue Fixed Carges
549
Other Increasing Block Yes 33877300 10163190
33877300 10163190
77Calculate: V / (V + M) %
Customer Class Rate Type Conserving Rate?
Other Increasing Block Yes
Canadian Water and Wastewater Association
Use 3 years average instead of most recent year
Upload file:
Comments:
0NoExemption
District GPCD graph illustrates on target to meet target standard
YesAt Least As effective As
BMP 1.4 Retail Consrvation Pricing
CUWCC BMP Coverage Report 2011
Foundational Best Management Practices For Urban Water Efficiency
On Track

Use Canadian Water Wastewater Association Rate Design ModelImplementation Option:
Implementation (Water Rate Structure)
179 Otay Water District
YesAgency Provide Sewer Service:
Customer Class Water Rate Type ConservingRate?
(V) Total RevenueComodity Charges
(M) Total Revenue Fixed Carges
924
Other Increasing Block Yes 39385200 18523600
39385200 18523600
68Calculate: V / (V + M) %
Customer Class Rate Type Conserving Rate?
Other Increasing Block Yes
Canadian Water and Wastewater Association
Use 3 years average instead of most recent year
Upload file:
Comments:
0NoExemption
Review 2012 GPCD historical progress report
YesAt Least As effective As
BMP 1.4 Retail Consrvation Pricing
CUWCC BMP Coverage Report 2012
Foundational Best Management Practices For Urban Water Efficiency
On Track

179 Otay Water District Retail
The list of wholesale agencies performing public outreach which can be counted to help the agency comply with the BMP
Description of all other Public Outreach programs
p Public Outreach Program List Number
310460
Newsletter articles on conservation 200000
Flyers and/or brochures (total copies), bill stuffers, messages printed on bill, information packets
250000
Website 12000
Landscape water conservation media campaigns 2400
Total 464400
Number Media Contacts Number
Articles or stories resulting from outreach 4
Television contacts 2
Total 6
Annual Budget Category Annual Budget Amount
Public Programs 13000
Total Amount: 13000
Public Outreah Additional Programs
Bill stuffers
Newsletter
Otay provided residential & commercial surveys
Does your agency perform Public Outreach programs? Yes
Metropolitan Water District of SC,San Diego County Water Authority
Did at least one contact take place during each quater of the reporting year? Yes
Did at least one contact take place during each quater of the reporting year? Yes
Did at least one website update take place during each quater of the reporting year? Yes
Public Information Program Annual Budget
Joint water agency workshops & outreach events
Comments:
The name of agency, contact name and email address if not CUWCC Group 1 members
CUWCC BMP Coverage Report
BMP 2.1 Public Outreach
2011
Foundational Best Management Practices For Urban Water Efficiency
On Track

At Least As effective As No
No 0Exemption
CUWCC BMP Coverage Report
BMP 2.1 Public Outreach
2011
Foundational Best Management Practices For Urban Water Efficiency
On Track

179 Otay Water District Retail
The list of wholesale agencies performing public outreach which can be counted to help the agency comply with the BMP
Description of all other Public Outreach programs
p Public Outreach Program List Number
312012
Newsletter articles on conservation 200000
Flyers and/or brochures (total copies), bill stuffers, messages printed on bill, information packets
250000
Website 20000
Landscape water conservation media campaigns 5000
Total 475000
Number Media Contacts Number
News releases 12
Articles or stories resulting from outreach 2
Total 14
Annual Budget Category Annual Budget Amount
Total Budget 40000
Total Amount: 40000
Public Outreah Additional Programs
Bill stuffers
Newsletter
Otay provided residential& commercial surveys
Website
Does your agency perform Public Outreach programs? Yes
Metropolitan Water District of SC,San Diego County Water Authority
Did at least one contact take place during each quater of the reporting year? Yes
Did at least one contact take place during each quater of the reporting year? Yes
Did at least one website update take place during each quater of the reporting year? Yes
Public Information Program Annual Budget
Home Depot WaterSmart Plant Fairs
The name of agency, contact name and email address if not CUWCC Group 1 members
CUWCC BMP Coverage Report
BMP 2.1 Public Outreach
2012
Foundational Best Management Practices For Urban Water Efficiency
ON TRACK

Comments:
At Least As effective As No
No 0Exemption
CUWCC BMP Coverage Report
BMP 2.1 Public Outreach
2012
Foundational Best Management Practices For Urban Water Efficiency
ON TRACK

179 Otay Water District Retail
Materials meet state education framework requirements?
Splash and Wet outdoor education modules
Materials distributed to K-6?
2 children's activity books provided. Water books available for lending to teachers. Water experiential teaching resource box available for check out by teachers.
Materials distributed to 7-12 students? (Info Only)
Annual budget for school education program: 34300.00
Description of all other water supplier education programs
Water conservation themed workshops & seminars provided for residential & commercial customers.
Metropolitan Water District of SC,San Diego County Water Authority
NoDoes your agency implement School Education programs?
The list of wholesale agencies performing public outreach which can be counted to help the agency comply with the BMP
Yes
Yes
Yes
National Geographic water conservation themed booklets provided
Comments:
At Least As effective As No
Exemption 0No
BMP 2.2 School Education Programs
CUWCC BMP Coverage Report 2011
Foundational Best Management Practices For Urban Water Efficiency
ON TRACK

179 Otay Water District Retail
Materials meet state education framework requirements?
SPLASH and WET outdoor education modules
Materials distributed to K-6?
2 -3 children's water conservation activity books provided. Teacher water resource activity boxes provided.
Materials distributed to 7-12 students? (Info Only)
Annual budget for school education program: 25600.00
Description of all other water supplier education programs
Splash Lab or Green Machine funding. Water conservation classes for residential or commercial customers.
Metropolitan Water District of SC,San Diego County Water Authority
YesDoes your agency implement School Education programs?
The list of wholesale agencies performing public outreach which can be counted to help the agency comply with the BMP
Yes
Yes
Yes
National Geographic water conservation themed booklets provided.
Comments:
Refer to GPCD progress that illustrates the District is on track
At Least As effective As Yes
Exemption 0No
BMP 2.2 School Education Programs
CUWCC BMP Coverage Report 2012
Foundational Best Management Practices For Urban Water Efficiency
ON TRACK

Otay Water District
Otay Water DistrictAgency name:
Reporting unit name :
Base Year 2008
Reporting unit number:
179
BMP 1.3 Metering
Number of unmetered accounts in Base Year
BMP 3.1 & BMP 3.2 & BMP 3.3 Residential Programs
Number of Single Family Customers and Multy Family Customers
BMP 3.4 WaterSense Specification (WSS) Toilets
Number of Single Family Units and Number of Multi Family Units
Average number of toilets per Single Family household and Multi Family households
Five year average resale rate of Single Family households and Multi Family households
Average number of persons per Single Family households and Multi Family households
BMP 4.0 & BMP 5.0 CII & Landscape
Total water use (in Acre Feet) by CII accounts
Number of accounts with dedicated irrigation meters
Number of CII accounts without meters or with Mixed Use Meters
Number of CII accounts
Comments
Resale average obtained from Richard D'Ascoli, Chief Executive Officer, The Pacific Southwest Association of REALTORS. The whole basis for this calculation assumes that the homes for sale still have 3.5 gpf toilets In reality, the majority of the homes for sale in our service area were built after 1992, plus just over 22,000 toilets were retrofit through our rebate program that ran from 1991-2010. The resale rate in portions of our service area are high due to foreclosures, which drives up the average. Zip codes with a high resale rate already have ULFTs. Zip codes used: 91913, 91914, 91915, 91978.
0.00
40,698
6,23623,625
3,432
1.70 1.30
4.90 7.7000
3.50 2.70
4,268.19
1,813.00
422.00
1,416.00
in Base Year
prior to 1992
Base Year Data

Conservation Coordinator: Yes
First Name: William
Contact Information
Last Name: Granger
Title: Water Conservation Program Manager
Phone: 619/670-2730
Email: [email protected]
Water Waste Prevention
Otay Water District
Reporting unit name (District name) Reporting unit number:
179
WW Document Name WWP File Name WW Prevention URL WW Prevention Ordinance Terms Description
Option A Describe the ordinances or terms of service adopted by your agency to meet the water waste prevention requirements of this BMP.
72.03 CERTAIN SPECIFIC OPERATIONAL VIOLATIONSB. Water waste. No customer shall knowingly permit leaks or other wastesof water, including, but not limited to, allowing runoff on any portion of his or herproperty
Option B Describe any water waste prevention ordinances or requirements adopted by your local jurisdiction or regulatory agencies within your service area.
Option C Describe any documentation of support for legislation or regulations that prohibit water waste.
Option D Describe your agency efforts to cooperate with other entities in the adoption or enforcement of local requirements consistent with this BMP.
Option E Describe your agency support positions with respect to adoption of legislation or regulations that are consistent with this BMP.
Option F Describe your agency efforts to support local ordinances that establish permits requirements for water efficient design in new development.
BMP1.1 Operation Practices - Retail Only 2011
Comments:
At Least As effective As No
0NoExemption
BMP1.1 Operation Practices - Retail Only 2011

Conservation Coordinator: Yes
First Name: Richard
Contact Information
Last Name: Namba
Title: Water Conservation Specialist
Phone: 619/670-2730
Email: [email protected]
Water Waste Prevention
Otay Water District
Reporting unit name (District name) Reporting unit number:
179
WW Document Name WWP File Name WW Prevention URL WW Prevention Ordinance Terms Description
Option A Describe the ordinances or terms of service adopted by your agency to meet the water waste prevention requirements of this BMP.
SECTION 72.03 CERTAIN SPECIFIC OPERATIONAL VIOLATIONSB. Water waste. No customer shall knowingly permit leaks or other wastesof water, including, but not limited to, allowing runoff on any portion of his or herproperty ...
Option B Describe any water waste prevention ordinances or requirements adopted by your local jurisdiction or regulatory agencies within your service area.
Option C Describe any documentation of support for legislation or regulations that prohibit water waste.
Option D Describe your agency efforts to cooperate with other entities in the adoption or enforcement of local requirements consistent with this BMP.
Option E Describe your agency support positions with respect to adoption of legislation or regulations that are consistent with this BMP.
BMP1.1 Operation Practices - Retail Only 2012
Comments:
Option F Describe your agency efforts to support local ordinances that establish permits requirements for water efficient design in new development.
San Diego County's Planning Department's Water Efficient Landscape permitting process that considers MAWA and ETWU standards adopted by California's Model Water Efficient Landscape Ordinance
At Least As effective As No
0NoExemption
BMP1.1 Operation Practices - Retail Only 2012

AWWA Water Audit
Otay Water District
Agency to complete a Water Audit & Balance Using The AWWA Software
Uploaded filename:
Otay 2011 AWWA Reporting Worksheet.xls
83
Agency Completed Training In The AWWA Water Audit Method
Agency Completed Training In The Component Analysis Process
Completed/Updated the Component Analysis (at least every 4 years)?
Component Analysis Completed/Updated Date
Water Loss Performance
Agency Repaired All Reported Leaks & Breaks To The Extent Cost Effective
Agency Located and Repaired Unreported Leaks to the Extent Cost Effective
Type of Program Activities Used to Detect Unreported Leaks
Does your agency maintain in-house records of audit results or the completed AWWA worksheet for the completed audit which could be forwarded to CUWCC?
Does your agency keeps records of each component analysis performed, and incorporates results into future annual standard water balances?
Annual Summary Information
Complete the following table with annual summary information (required for reporting years 2-5 only)
Yes
Water Audit Validity Score from AWWA spreadsheet:
179
Reporting unit name Reporting unit number:
Yes
Yes
No
Yes
Yes
Yes
Yes
Please describe your infrastructure rehabilitation and renewal activity below
Water operations staff will provide data
AWWA Model
Operational Efficiency Indicator
Apparent Losses per service connection per day: 1.41
Real Losses per service connection per day: 16.5
N/A Real Losses per length of main per day:
Real Losses per service connection per day per psi pressure: 0.11
Recording Keeping Requirements Beginning in Year 2
Does your agency maintain a record keeping system for the following?
Date/Time Leak Reported Yes Leak Location Yes
Type of Leaking Pipe Segment or Fitting No Leak Running Time From Report to Repair Yes
Leak Volume Estimate No Cost of Repair Yes
Do you have an infrastructure rehabilitation and renewal program ? Yes
BMP 1.2 Water Loss Control 2011

Unavoidable Annual Real Losses(UARL): 687.48
Above, Real Losses=Current Annual Real Losses(CARL): 882.55
Infrastructure Leakage Index (ILI) [CARL/UARL]: 0.42
Comments:
At Least As effective As No
0NoExemption
BMP 1.2 Water Loss Control 2011

AWWA Water Audit
Otay Water District
Agency to complete a Water Audit & Balance Using The AWWA Software
Uploaded filename:
Otay 2012 AWWA Reporting Worksheet.xls
78
Agency Completed Training In The AWWA Water Audit Method
Agency Completed Training In The Component Analysis Process
Completed/Updated the Component Analysis (at least every 4 years)?
Component Analysis Completed/Updated Date
Water Loss Performance
Agency Repaired All Reported Leaks & Breaks To The Extent Cost Effective
Agency Located and Repaired Unreported Leaks to the Extent Cost Effective
Type of Program Activities Used to Detect Unreported Leaks
Does your agency maintain in-house records of audit results or the completed AWWA worksheet for the completed audit which could be forwarded to CUWCC?
Does your agency keeps records of each component analysis performed, and incorporates results into future annual standard water balances?
Annual Summary Information
Complete the following table with annual summary information (required for reporting years 2-5 only)
Yes
Water Audit Validity Score from AWWA spreadsheet:
179
Reporting unit name Reporting unit number:
Yes
Yes
No
Yes
Yes
In pipe video camera equipment to examine pipe integrity
Yes
No
Please describe your infrastructure rehabilitation and renewal activity below
Awaiting District operation staff reports to complete missing data fields
AWWA Model
Operational Efficiency Indicator
Apparent Losses per service connection per day: 1.42
Real Losses per service connection per day: 18.55
N/A Real Losses per length of main per day:
Recording Keeping Requirements Beginning in Year 2
Does your agency maintain a record keeping system for the following?
Date/Time Leak Reported Yes Leak Location Yes
Type of Leaking Pipe Segment or Fitting No Leak Running Time From Report to Repair Yes
Leak Volume Estimate No Cost of Repair Yes
Do you have an infrastructure rehabilitation and renewal program ? Yes
BMP 1.2 Water Loss Control 2012

Real Losses per service connection per day per psi pressure: 0.12
Unavoidable Annual Real Losses(UARL): 697.37
Above, Real Losses=Current Annual Real Losses(CARL): 1011.36
Infrastructure Leakage Index (ILI) [CARL/UARL]: 0.47
Comments:
At Least As effective As No
0NoExemption
BMP 1.2 Water Loss Control 2012

Implementation
Does your agency have any unmetered service connections?
If YES, has your agency completed a meter retrofit plan?
Enter the number of previously unmetered accounts fitted with meters during reporting year:
Are all new service connections being metered?
Are all new service connections being billed volumetrically?
Has your agency completed and submitted electronically to the Council a written plan, policy or program to test, repair and replace meters?
Meters Matrix
Account Type Num Of Metered Accounts
Num Of Metered Accounts Read
Num Of Metered Accounts Billed By
Volume
Billing Frequency
Estimated Bills
Per Year
Meter Readings Per Year
Single-Family 43903 43903 43903 Monthly
632
Commercial 797 797 797 Monthly
632
Institutional 1434 1434 1434 Monthly
632
Dedicated Irrigation 1223 1223 1223 Monthly
632
Recycled 701 701 701 Monthly
632
Number of CII Accounts with Mixed-use Meters
Number of CII Accounts with Mixed-use Meters Retrofitted with Dedicated Irrigation Meters during Reporting Period
2231 0
Feasibility Study
Has your agency conducted a feasibility study to assess the merits of a program to provide incentives to switch mixed-use accounts to dedicated landscape meters?
No
If YES, please fill in the following information:
A. When was the Feasibility Study conducted
Describe, upload or provide an electronic link to the Feasibility Study Upload File
2/28/2013
Report was completed in February 2013
Otay Water District 179
Reporting unit name Reporting unit number:
No
Yes
Yes
Yes
Yes
Copy_of_MUM_Final_Report_Nov_2012.docx
2NoExemption
Refer to GPCD On track report below
YesAt Least As effective As
BMP 1.3 Metering With Commodity 2011

Comments:
BMP 1.3 Metering With Commodity 2011

Implementation
Does your agency have any unmetered service connections?
If YES, has your agency completed a meter retrofit plan?
Enter the number of previously unmetered accounts fitted with meters during reporting year:
Are all new service connections being metered?
Are all new service connections being billed volumetrically?
Has your agency completed and submitted electronically to the Council a written plan, policy or program to test, repair and replace meters?
Meters Matrix
Account Type Num Of Metered Accounts
Num Of Metered Accounts Read
Num Of Metered Accounts Billed By
Volume
Billing Frequency
Estimated Bills
Per Year
Meter Readings Per Year
Single-Family 44509 44509 44509 Monthly
1093
Commercial 800 800 800 Monthly
1093
Institutional 2167 2167 2167 Monthly
1093
Dedicated Irrigation 1229 1229 1229 Monthly
1093
Recycled 699 699 699 Monthly
1093
Number of CII Accounts with Mixed-use Meters
Number of CII Accounts with Mixed-use Meters Retrofitted with Dedicated Irrigation Meters during Reporting Period
993 0
Feasibility Study
Has your agency conducted a feasibility study to assess the merits of a program to provide incentives to switch mixed-use accounts to dedicated landscape meters?
No
If YES, please fill in the following information:
A. When was the Feasibility Study conducted
Describe, upload or provide an electronic link to the Feasibility Study Upload File
11/30/2012
Otay Water District 179
Reporting unit name Reporting unit number:
No
Yes
Yes
Yes
Yes
MUM Final Report Nov 2012.docx
YesAt Least As effective As
BMP 1.3 Metering With Commodity 2012
Comments:
0NoExemption
Refer to 2010 GPCD on track report below
BMP 1.3 Metering With Commodity 2012

BMP 1.4 Retail Conservation Pricing
Implementation (Water Rate Structure)
Enter the Water Rate Structures that are assigned to the majority of your customers, by customer class
Customer Class Water Rate Type Total RevenueComodity Charges
Total Revenue Fixed Carges
549
Other Increasing Block 33877300 10163190
33877300 10163190
Implementation (Conservation Pricing Option)
Use Annual RevenueAs Reported
Use Canadian Water Wastewater (CWWA) Association Rate Design Model
Use 3 years average insteadof most recent year
Retail Waste Water (Sewer) Rate Structure by Customer Class
Agency Provide Sewer Service
Select the Retail Waste Water (Sewer) Rate Structure assigned to the majority of your customers within a specific customer class.
Sewer Rate Name Customer Class Name Sewer Total Revenue Commodity Charges
Sewer Total Revenue Customer Meter/Service
(Fixed Charges)
Increasing Block Other 1994000.00 598200.00
Comments:
179
Reporting unit number:
Otay Water District
Reporting unit name
Enter the Water Rate Structures that are assigned to the majority of your customers, by customer class
If CWWA is selected, please upload spreadsheet here.
Canadian Water and Wastewater Association
Yes
At Least As effective As Yes
District GPCD graph illustrates on target to meet target standard
No 0Exemption
2011

BMP 1.4 Retail Conservation Pricing
Implementation (Water Rate Structure)
Enter the Water Rate Structures that are assigned to the majority of your customers, by customer class
Customer Class Water Rate Type Total RevenueComodity Charges
Total Revenue Fixed Carges
924
Other Increasing Block 39385200 18523600
39385200 18523600
Implementation (Conservation Pricing Option)
Use Annual RevenueAs Reported
Use Canadian Water Wastewater (CWWA) Association Rate Design Model
Use 3 years average insteadof most recent year
Retail Waste Water (Sewer) Rate Structure by Customer Class
Agency Provide Sewer Service
Select the Retail Waste Water (Sewer) Rate Structure assigned to the majority of your customers within a specific customer class.
Sewer Rate Name Customer Class Name Sewer Total Revenue Commodity Charges
Sewer Total Revenue Customer Meter/Service
(Fixed Charges)
Increasing Block Other 2336000.00 628600.00
Comments:
179
Reporting unit number:
Otay Water District
Reporting unit name
Enter the Water Rate Structures that are assigned to the majority of your customers, by customer class
If CWWA is selected, please upload spreadsheet here.
Canadian Water and Wastewater Association
Yes
At Least As effective As Yes
Review 2012 GPCD historical progress report
No 0Exemption
2012

Reporting unit # 179
Otay Water District
Reporting unit name
/ Retail
Metropolitan Water District of SC,San Diego County Water Authority
Please provide the name of Agency if not CUWCC Group1 members
Did at least one contact take place duringeach quarter of the reporting year? Yes
Public Information Programs List
Number of Public Contacts
Public Information Programs Name
200000 Newsletter articles on conservation
250000 Flyers and/or brochures (total copies), bill stuffers, messages printed on bill, information packets
12000 Website
2400 Landscape water conservation media campaigns
Contact with the Media
Did at least one contact take place during each quarter of the reporting year? Yes
Number of Media Contacts
Public Outreach Media Contact Name List
4 Articles or stories resulting from outreach 77615
2 Television contacts 77615
IAgency Website Updates
Enter your agency's URL (website address): www:otaywater.gov
Does your agency perform Public Outreach programs?
The list of wholesale agencies performing public outreach which can be counted to help the agency comply with the BMP
Yes
Yes
Metropolitan Water District of SC,San Diego County Water Authority
The list of wholesale agencies performing public outreach which can be counted to help the agency comply with the BMP
Please provide the name of Agency if not CUWCC Group1 members
Wholesale Agency Website Updates
NoThe list of wholesale agencies performing public outreach which can be counted to help the agency comply with the BMP
Metropolitan Water District of SC,San Diego County Water Authority
Please provide the name of Agency if not CUWCC Group1 members
BMP 2.1 Public Outreach 2011

Describe a minimum of four water conservationrelated updates to your agency's website thattook place during the year:
Rebate list for OWD, MWD & CWAFree conservation servicesConservation class schedulesEducation program updates
Did at least one Website Update take place duringeach quarter of the reporting year? Yes
Public Information Programs Annual Budget
Enter budget for public outreach programs. You may enter total budget in a single line or brake the budget into discretecategories by entering many rows. Please indicate if personnel costs are included in the entry.
Annual BudgetCategory
Annual Budget Amount
Personal CostIncluded?
Comments
Public Programs 13000
Public Information Expenses
Enter expenses for public outreach programs. Please include the same kind of expenses you included in the question relatedto your budget (Section 2.1.7, above). For example, if you included personnel costs in the budget entered above,be sure to include them here as well.
Public Outreach Expense Category Expense Amount Personal Cost Included?
multi agency fund 1000
school giveaways 800
water con outreach items 11000
tour handouts 200
Additional Public Information Program
Please report additional public information contacts. List these additional contacts in order of howyour agency views their importance / effectiveness with respect to conserving water, with the mostimportant/ effective listed first(where 1 = most important).
Were there additional Public Outreach efforts? Yes
Public Outreach Additional Information
Public Information Additional Programs Importance
Bill stuffers 1 77615
Newsletter 2 77615
Otay provided residential & commercial surveys 3 77615
Social Marketing Programs
Branding Does your agency have a water conservation”brand,” “theme” or mascot? No
BMP 2.1 Public Outreach 2011
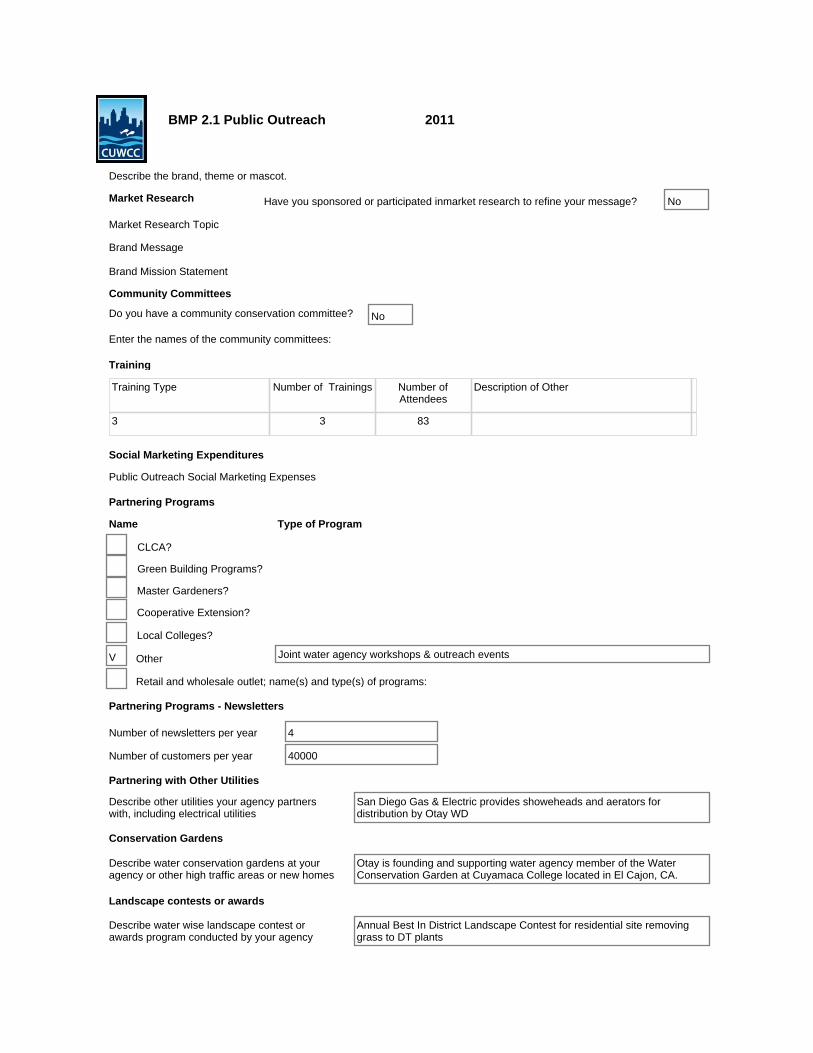
Describe the brand, theme or mascot.
Market Research Have you sponsored or participated inmarket research to refine your message? No
Market Research Topic
Brand Message
Brand Mission Statement
Community Committees
Do you have a community conservation committee? No
Enter the names of the community committees:
Training
Training Type Number of Trainings Number ofAttendees
Description of Other
3 3 83
Social Marketing Expenditures
Public Outreach Social Marketing Expenses
Partnering Programs
Name Type of Program
CLCA?
Green Building Programs?
Master Gardeners?
Cooperative Extension?
Local Colleges?
Joint water agency workshops & outreach eventsOtherV
Retail and wholesale outlet; name(s) and type(s) of programs:
Partnering Programs - Newsletters
Number of newsletters per year 4
Number of customers per year 40000
Describe other utilities your agency partnerswith, including electrical utilities
San Diego Gas & Electric provides showeheads and aerators for distribution by Otay WD
Partnering with Other Utilities
Conservation Gardens
Describe water conservation gardens at your agency or other high traffic areas or new homes
Otay is founding and supporting water agency member of the Water Conservation Garden at Cuyamaca College located in El Cajon, CA.
Landscape contests or awards
Describe water wise landscape contest orawards program conducted by your agency
Annual Best In District Landscape Contest for residential site removing grass to DT plants
BMP 2.1 Public Outreach 2011

Additional Programs supported by Agencybut not mentioned above:
Comments
At Least As effective As No
Exemption 0No
BMP 2.1 Public Outreach 2011

Reporting unit # 179
Otay Water District
Reporting unit name
/ Retail
Metropolitan Water District of SC,San Diego County Water Authority
Please provide the name of Agency if not CUWCC Group1 members
Did at least one contact take place duringeach quarter of the reporting year? Yes
Public Information Programs List
Number of Public Contacts
Public Information Programs Name
200000 Newsletter articles on conservation
250000 Flyers and/or brochures (total copies), bill stuffers, messages printed on bill, information packets
20000 Website
5000 Landscape water conservation media campaigns
Contact with the Media
Did at least one contact take place during each quarter of the reporting year? Yes
Number of Media Contacts
Public Outreach Media Contact Name List
12 News releases 78003
2 Articles or stories resulting from outreach 78003
IAgency Website Updates
Enter your agency's URL (website address): otaywater.gov
Does your agency perform Public Outreach programs?
The list of wholesale agencies performing public outreach which can be counted to help the agency comply with the BMP
Yes
Yes
Metropolitan Water District of SC,San Diego County Water Authority
The list of wholesale agencies performing public outreach which can be counted to help the agency comply with the BMP
Please provide the name of Agency if not CUWCC Group1 members
Wholesale Agency Website Updates
NoThe list of wholesale agencies performing public outreach which can be counted to help the agency comply with the BMP
Metropolitan Water District of SC,San Diego County Water Authority
Please provide the name of Agency if not CUWCC Group1 members
BMP 2.1 Public Outreach 2012
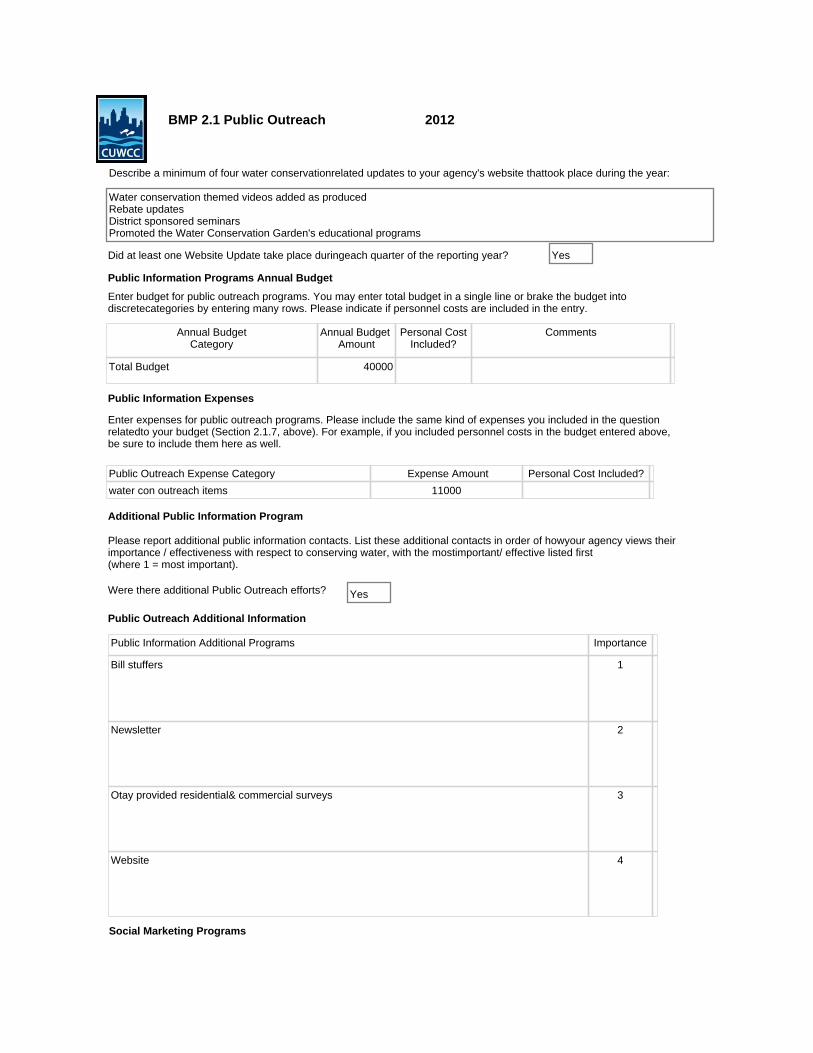
Describe a minimum of four water conservationrelated updates to your agency's website thattook place during the year:
Water conservation themed videos added as producedRebate updatesDistrict sponsored seminarsPromoted the Water Conservation Garden's educational programs
Did at least one Website Update take place duringeach quarter of the reporting year? Yes
Public Information Programs Annual Budget
Enter budget for public outreach programs. You may enter total budget in a single line or brake the budget into discretecategories by entering many rows. Please indicate if personnel costs are included in the entry.
Annual BudgetCategory
Annual Budget Amount
Personal CostIncluded?
Comments
Total Budget 40000
Public Information Expenses
Enter expenses for public outreach programs. Please include the same kind of expenses you included in the question relatedto your budget (Section 2.1.7, above). For example, if you included personnel costs in the budget entered above,be sure to include them here as well.
Public Outreach Expense Category Expense Amount Personal Cost Included?
water con outreach items 11000
Additional Public Information Program
Please report additional public information contacts. List these additional contacts in order of howyour agency views their importance / effectiveness with respect to conserving water, with the mostimportant/ effective listed first(where 1 = most important).
Were there additional Public Outreach efforts? Yes
Public Outreach Additional Information
Public Information Additional Programs Importance
Bill stuffers 1 78003
Newsletter 2 78003
Otay provided residential& commercial surveys 3 78003
Website 4 78003
Social Marketing Programs
BMP 2.1 Public Outreach 2012

Branding Does your agency have a water conservation”brand,” “theme” or mascot? No
Describe the brand, theme or mascot.
Market Research Have you sponsored or participated inmarket research to refine your message? No
Market Research Topic
Brand Message
Brand Mission Statement
Community Committees
Do you have a community conservation committee? Yes
Enter the names of the community committees: San Diego County Conservation Coordinators, Conservation Action Committee
Training
Training Type Number of Trainings Number ofAttendees
Description of Other
3 2 65
Social Marketing Expenditures
Public Outreach Social Marketing Expenses
Expense Categary Expense Amount Description
78003
Partnering Programs
Name Type of Program
CLCA?
Green Building Programs?
Master Gardeners?
Cooperative Extension?
Local Colleges?
Other
V Retail and wholesale outlet; name(s) and type(s) of programs:
Home Depot WaterSmart Plant Fairs
Partnering Programs - Newsletters
Number of newsletters per year 4
Number of customers per year 120000
San Diego Gas & Electric provides low flow showerheads and aerators
Partnering with Other Utilities
BMP 2.1 Public Outreach 2012

Describe other utilities your agency partnerswith, including electrical utilities
Conservation Gardens
Describe water conservation gardens at your agency or other high traffic areas or new homes
Otay is founding and supporting water agency member of the Water Conservation Garden at Cuyamaca College in El Cajon, CA.
Landscape contests or awards
Describe water wise landscape contest orawards program conducted by your agency
Landscape Contest identifies Otay's best residential site conversion removing grass to DT plants.
Additional Programs supported by Agencybut not mentioned above:
Comments
At Least As effective As No
Exemption 0No
BMP 2.1 Public Outreach 2012
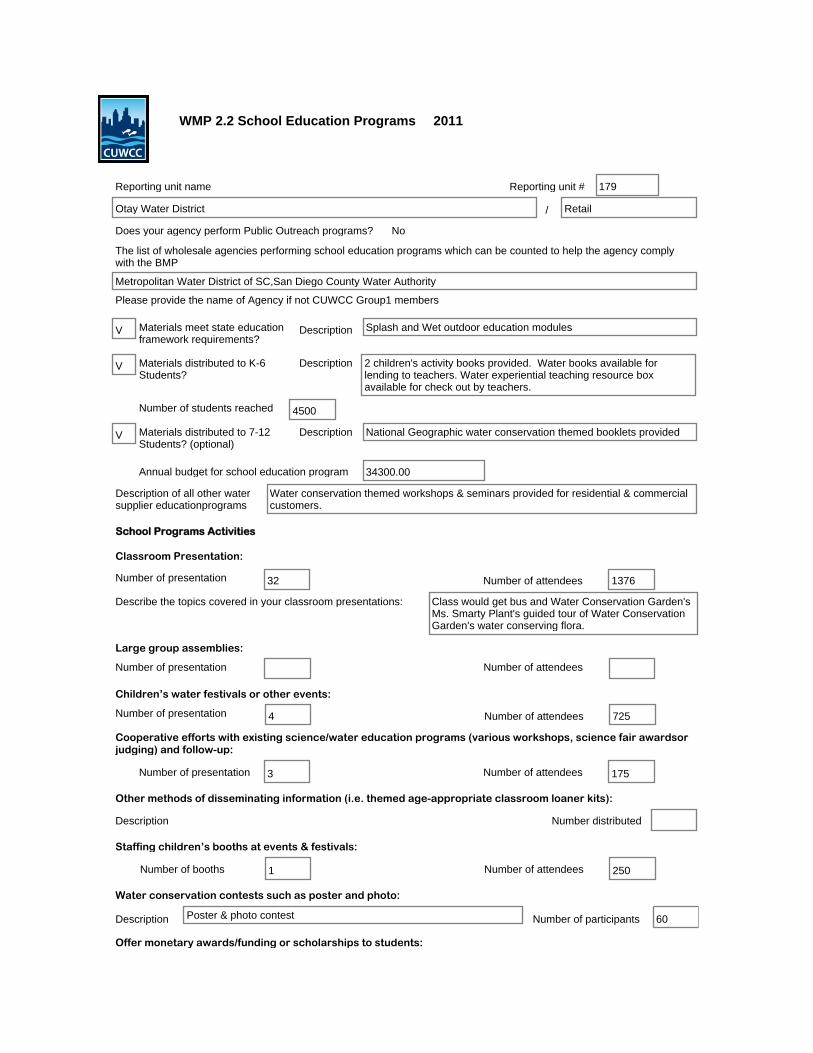
V Materials meet state educationframework requirements?
Description Splash and Wet outdoor education modules
2 children's activity books provided. Water books available for lending to teachers. Water experiential teaching resource box available for check out by teachers.
DescriptionMaterials distributed to K-6 Students?
V
Number of students reached 4500
V Materials distributed to 7-12 Students? (optional)
Description National Geographic water conservation themed booklets provided
Annual budget for school education program 34300.00
Description of all other water supplier educationprograms
Water conservation themed workshops & seminars provided for residential & commercial customers.
School Programs Activities
Classroom Presentation:
Number of presentation 32 Number of attendees 1376
Describe the topics covered in your classroom presentations: Class would get bus and Water Conservation Garden's Ms. Smarty Plant's guided tour of Water Conservation Garden's water conserving flora.
Large group assemblies:
Number of presentation Number of attendees
Children’s water festivals or other events:
Number of presentation 4 Number of attendees 725
Cooperative efforts with existing science/water education programs (various workshops, science fair awardsor judging) and follow-up:
Number of presentation 3 Number of attendees 175
Other methods of disseminating information (i.e. themed age-appropriate classroom loaner kits):
Description Number distributed
250Number of attendees1Number of booths
Staffing children’s booths at events & festivals:
60Number of participantsPoster & photo contestDescription
Water conservation contests such as poster and photo:
Offer monetary awards/funding or scholarships to students:
179Reporting unit #Reporting unit name
Otay Water District / Retail
Does your agency perform Public Outreach programs? No
The list of wholesale agencies performing school education programs which can be counted to help the agency comply with the BMP
Please provide the name of Agency if not CUWCC Group1 members
Metropolitan Water District of SC,San Diego County Water Authority
WMP 2.2 School Education Programs 2011

2800.00Total funding7Number offered
Number of attendeesNumber of presentation
Teacher training workshops:
1565Number of participants 33Number of tours or fieldtrips
Fund and/or staff student field trips to treatment facilities, recycling facilities, water conservation gardens,etc.:
0.00Total funding 2Number of internship
College internships in water conservation offered:
Number of attendees0Number of presentation
Career Fairs / Workshops:
Number of eventsDescription
Additional program(s) supported by agency but not mentioned above:
Number of participants
Comments
0NoExemption
At Least As effective As No
WMP 2.2 School Education Programs 2011
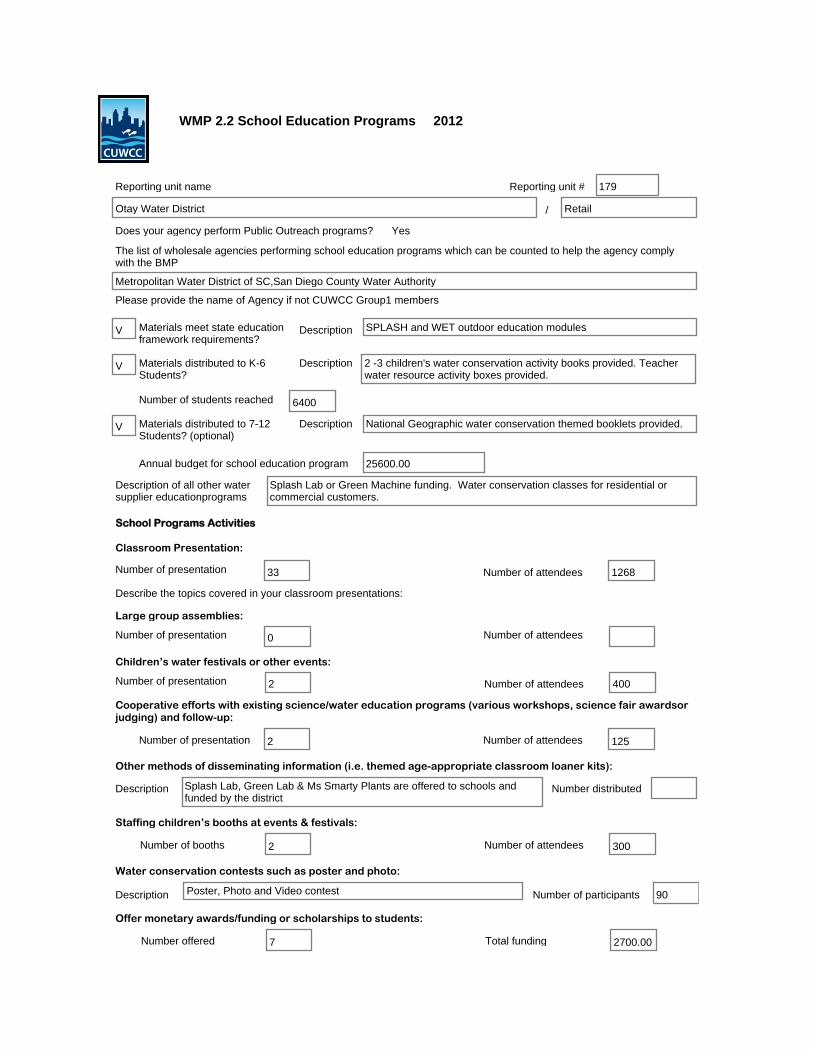
V Materials meet state educationframework requirements?
Description SPLASH and WET outdoor education modules
2 -3 children's water conservation activity books provided. Teacher water resource activity boxes provided.
DescriptionMaterials distributed to K-6 Students?
V
Number of students reached 6400
V Materials distributed to 7-12 Students? (optional)
Description National Geographic water conservation themed booklets provided.
Annual budget for school education program 25600.00
Description of all other water supplier educationprograms
Splash Lab or Green Machine funding. Water conservation classes for residential or commercial customers.
School Programs Activities
Classroom Presentation:
Number of presentation 33 Number of attendees 1268
Describe the topics covered in your classroom presentations:
Large group assemblies:
Number of presentation 0 Number of attendees
Children’s water festivals or other events:
Number of presentation 2 Number of attendees 400
Cooperative efforts with existing science/water education programs (various workshops, science fair awardsor judging) and follow-up:
Number of presentation 2 Number of attendees 125
Other methods of disseminating information (i.e. themed age-appropriate classroom loaner kits):
Description Splash Lab, Green Lab & Ms Smarty Plants are offered to schools and funded by the district
Number distributed
300Number of attendees2Number of booths
Staffing children’s booths at events & festivals:
90Number of participantsPoster, Photo and Video contestDescription
Water conservation contests such as poster and photo:
2700.00Total funding7Number offered
Offer monetary awards/funding or scholarships to students:
179Reporting unit #Reporting unit name
Otay Water District / Retail
Does your agency perform Public Outreach programs? Yes
The list of wholesale agencies performing school education programs which can be counted to help the agency comply with the BMP
Please provide the name of Agency if not CUWCC Group1 members
Metropolitan Water District of SC,San Diego County Water Authority
WMP 2.2 School Education Programs 2012

Number of attendees0Number of presentation
Teacher training workshops:
1518Number of participants 33Number of tours or fieldtrips
Fund and/or staff student field trips to treatment facilities, recycling facilities, water conservation gardens,etc.:
0.00Total funding 2Number of internship
College internships in water conservation offered:
Number of attendees0Number of presentation
Career Fairs / Workshops:
Number of eventsDescription
Additional program(s) supported by agency but not mentioned above:
Number of participants
Comments
0NoExemption
Refer to GPCD progress that illustrates the District is on track
At Least As effective As Yes
WMP 2.2 School Education Programs 2012

Service Area Population: 206000
Non Potable Water Sources2011
Reporting Unit Name
Otay Water District
Retail Only
Reporting Unit ID#:
179
1893
Local Watershed AF / Year Water Supply Type Water Supply Description
1893
Chapman Recycled 1154.00 Recycled Non Potable District recycled plant
1154.00
1893
Imported AF / Year Water Supply Type Water Supply Description
1893
South Bay Reclamation 2692.00 Other Purchased from city of San Diego plant
2692.00
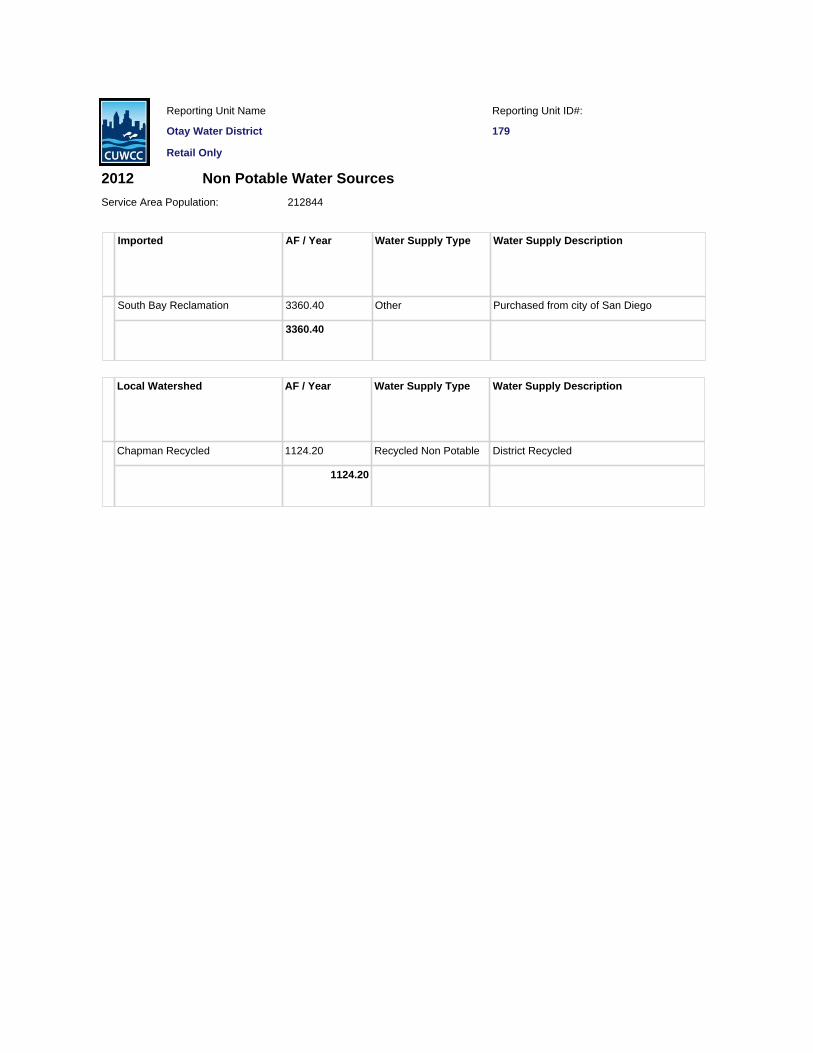
Service Area Population: 212844
Non Potable Water Sources2012
Reporting Unit Name
Otay Water District
Retail Only
Reporting Unit ID#:
179
1863
Local Watershed AF / Year Water Supply Type Water Supply Description
1863
Chapman Recycled 1124.20 Recycled Non Potable District Recycled
1124.20
1863
Imported AF / Year Water Supply Type Water Supply Description
1863
South Bay Reclamation 3360.40 Other Purchased from city of San Diego
3360.40

Service Area Population: 206000
Potable Water Sources2011
Reporting Unit Name
Otay Water District
Retail Only
Reporting Unit ID#:
179
1002
Imported AF / Year Water Supply Type Water Supply Description
1002
Wholesaler Supply 14039448.00 Raw Water CWA & MWD Supply
14039448.00

Service Area Population: 212844
Potable Water Sources2012
Reporting Unit Name
Otay Water District
Retail Only
Reporting Unit ID#:
179
1376
Imported AF / Year Water Supply Type Water Supply Description
1376
Wholesaler Supply 29651.80 Raw Water CWA & MWD
29651.80

Non Potable Water Uses2011
Reporting Unit Name
Otay Water District
Retail Only
Reporting Unit ID#:
179
Billed:
Un-Billed:
1695
CustomerType Metered Accounts
Metered Water Delivered AF/Year
Un-Metered Accounts
Un-Metered Water Delivered AF/Year
Description
1695
Dedicated Irrigation
685 5.14
685 5.14

Non Potable Water Uses2012
Reporting Unit Name
Otay Water District
Retail Only
Reporting Unit ID#:
179
Billed:
Un-Billed:
1694
CustomerType Metered Accounts
Metered Water Delivered AF/Year
Un-Metered Accounts
Un-Metered Water Delivered AF/Year
Description
1694
Dedicated Irrigation
696 5.10 0 0.00 Recycled water for irrigaiton
696 5.10 0 0.00
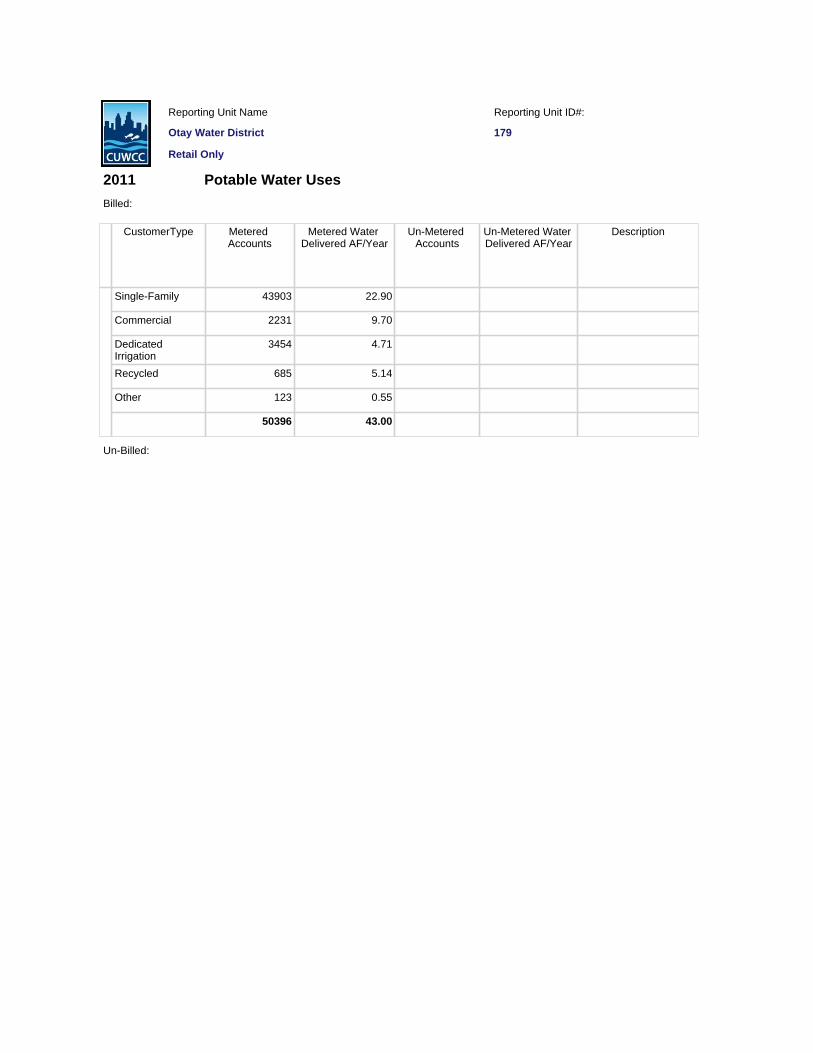
Potable Water Uses2011
Reporting Unit Name
Otay Water District
Retail Only
Reporting Unit ID#:
179
4400
CustomerType Metered Accounts
Metered Water Delivered AF/Year
Un-Metered Accounts
Un-Metered Water Delivered AF/Year
Description
880
Single-Family 43903 22.90
Commercial 2231 9.70
Dedicated Irrigation
3454 4.71
Recycled 685 5.14
Other 123 0.55
50396 43.00
Billed:
Un-Billed:

Potable Water Uses2012
Reporting Unit Name
Otay Water District
Retail Only
Reporting Unit ID#:
179
8335
CustomerType Metered Accounts
Metered Water Delivered AF/Year
Un-Metered Accounts
Un-Metered Water Delivered AF/Year
Description
1667
Single-Family 44396 23.00 0 0.00
Commercial 2232 10.00 0 0.00
Dedicated Irrigation
1227 4.80 0 0.00
Recycled 696 5.10 0 0.00
Other 105 0.60 0 0.00 Fire/Temp
48656 43.50 0 0.00
Billed:
Un-Billed: