Embed Size (px)
Citation preview
2015 STAR Data
September 29, 2015
Essential Questions
‣ Why is monitoring student growth and student achievement important?
‣ How can we best use the STAR assessment to give us feedback on student growth and achievement?
‣ Why is it important to have multiple measures to determine how every child is growing and achieving?

Presentation Timeline 2015-2016Timeline Growth & Achievement Presentations
June 2015 Framework for Growth & Achievement Emerges from Superintendent's Entry Plan
August 2015 Overview of Growth & Achievement Framework
September 2015
Application of Growth & Achievement Framework to STAR Data
October 2015Introduce School Improvement Plans and Math Goals and Anticipated Measure Introduce Math Curriculum Draft Goals & Measures
January 2016 Reading Curriculum Revised with embedded Goals, Measures & Success Targets
March 2016 Finalize Math Curriculum Goals, Measures & Success Target
June 2016 Year-End School Improvement Plan Updates, Math and Reading Goals and Measures Report
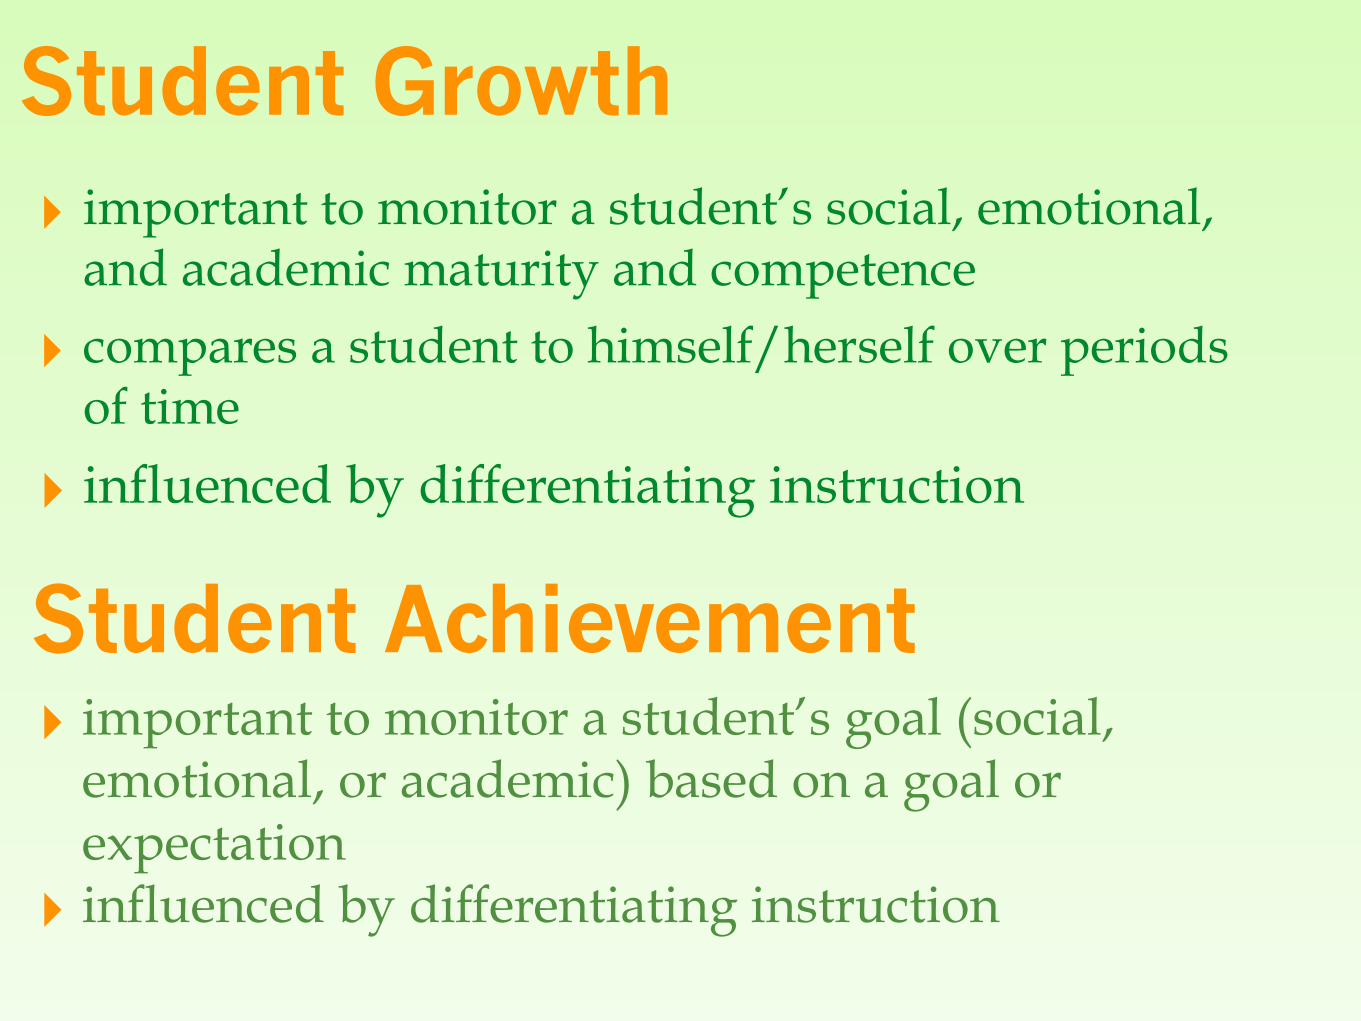
Student Growth‣ important to monitor a student’s social, emotional,
and academic maturity and competence
‣ compares a student to himself/herself over periods of time
‣ influenced by differentiating instruction
Student Achievement‣ important to monitor a student’s goal (social,
emotional, or academic) based on a goal or expectation ‣ influenced by differentiating instruction
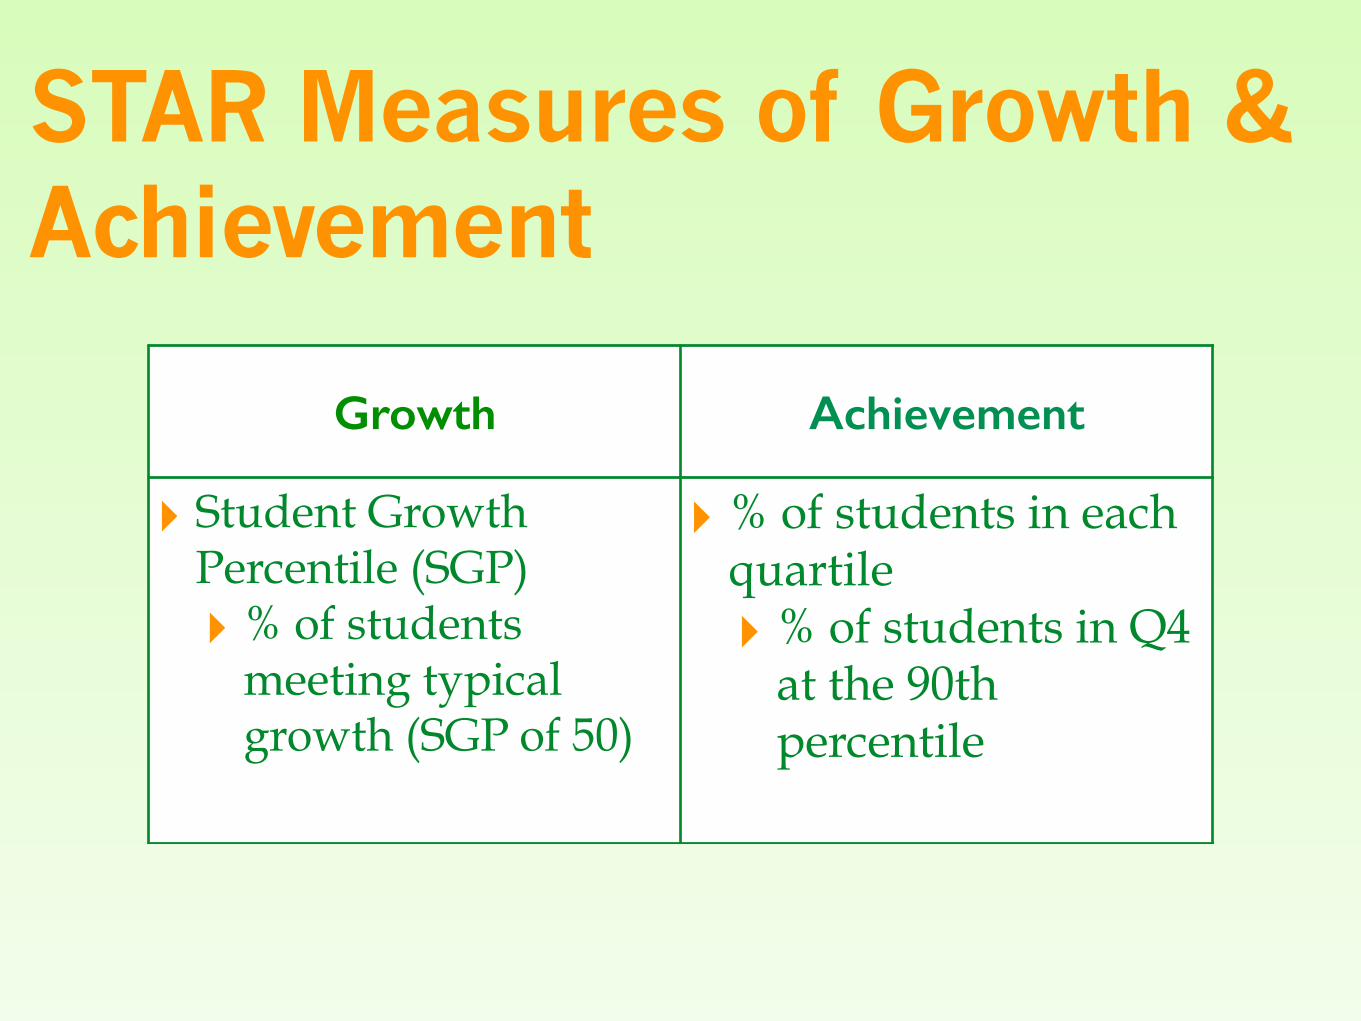
STAR Measures of Growth & Achievement
Growth Achievement
‣ Student Growth Percentile (SGP) ‣ % of students
meeting typical growth (SGP of 50)
‣ % of students in each quartile ‣ % of students in Q4
at the 90th percentile
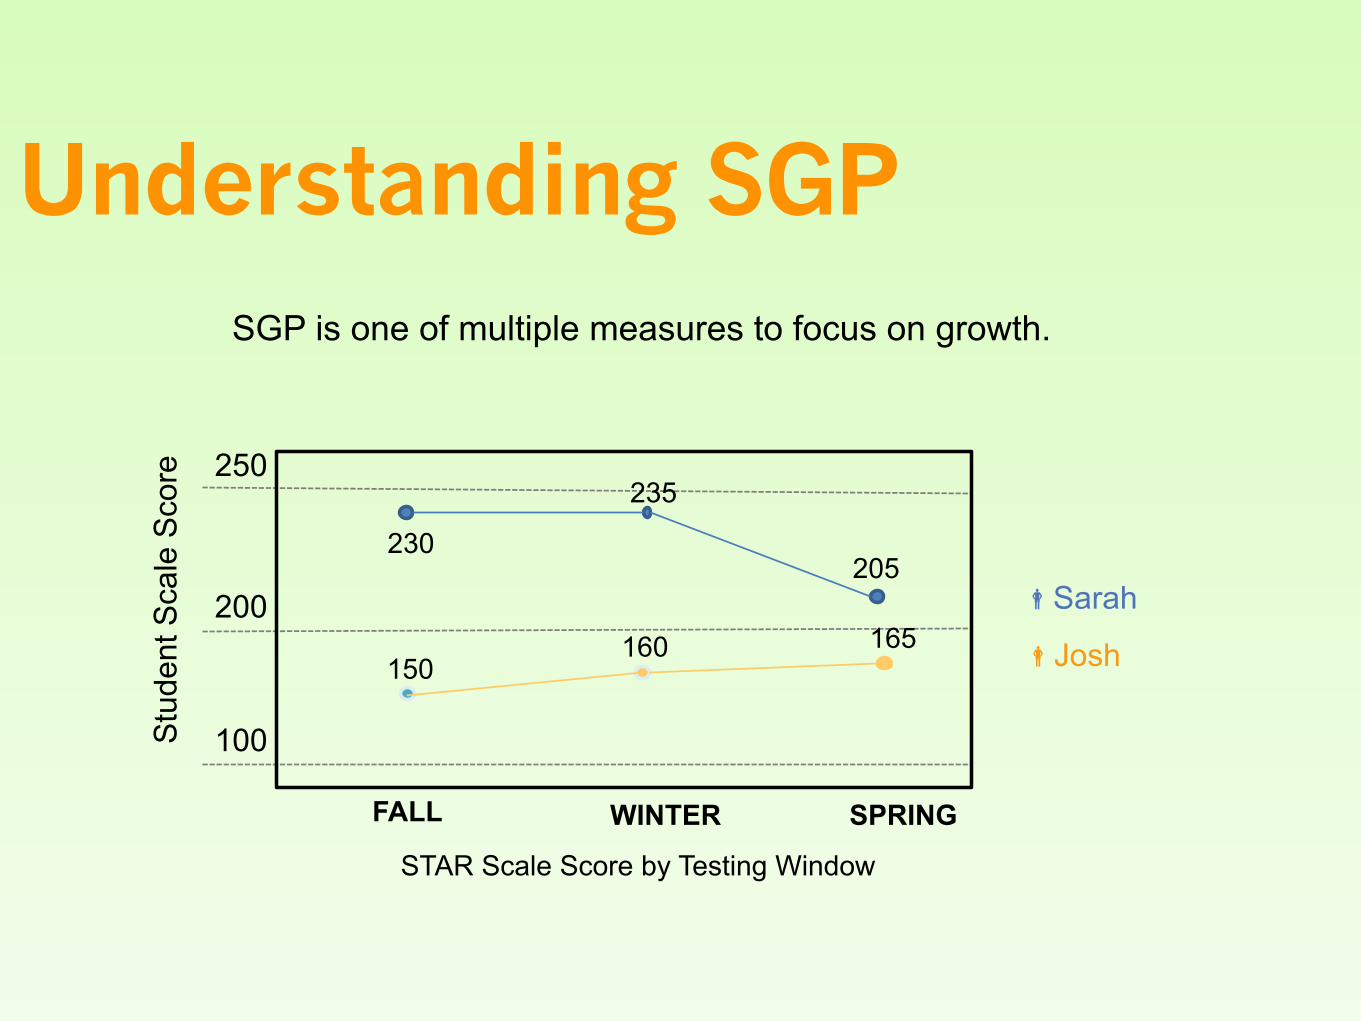
Understanding SGP
FALL WINTER SPRING
100
200
250
150 160 165
STAR Scale Score by Testing Window
Stu
dent
Sca
le S
core
230 205
235
!Josh
!Sarah
SGP is one of multiple measures to focus on growth.

Calculating SGPS
cale
Sco
re
100
200
150 160 165
250
Fall Spring Winter
100
200
150 160
200
110
250
Fall Spring Winter
Josh’s Scale Scores Josh’s Academic Peers’ Scale Scores
Josh scored 165 in the Spring. His academic peers scored between 110 and 200.
How did Josh do in comparison to them?
29%
70%
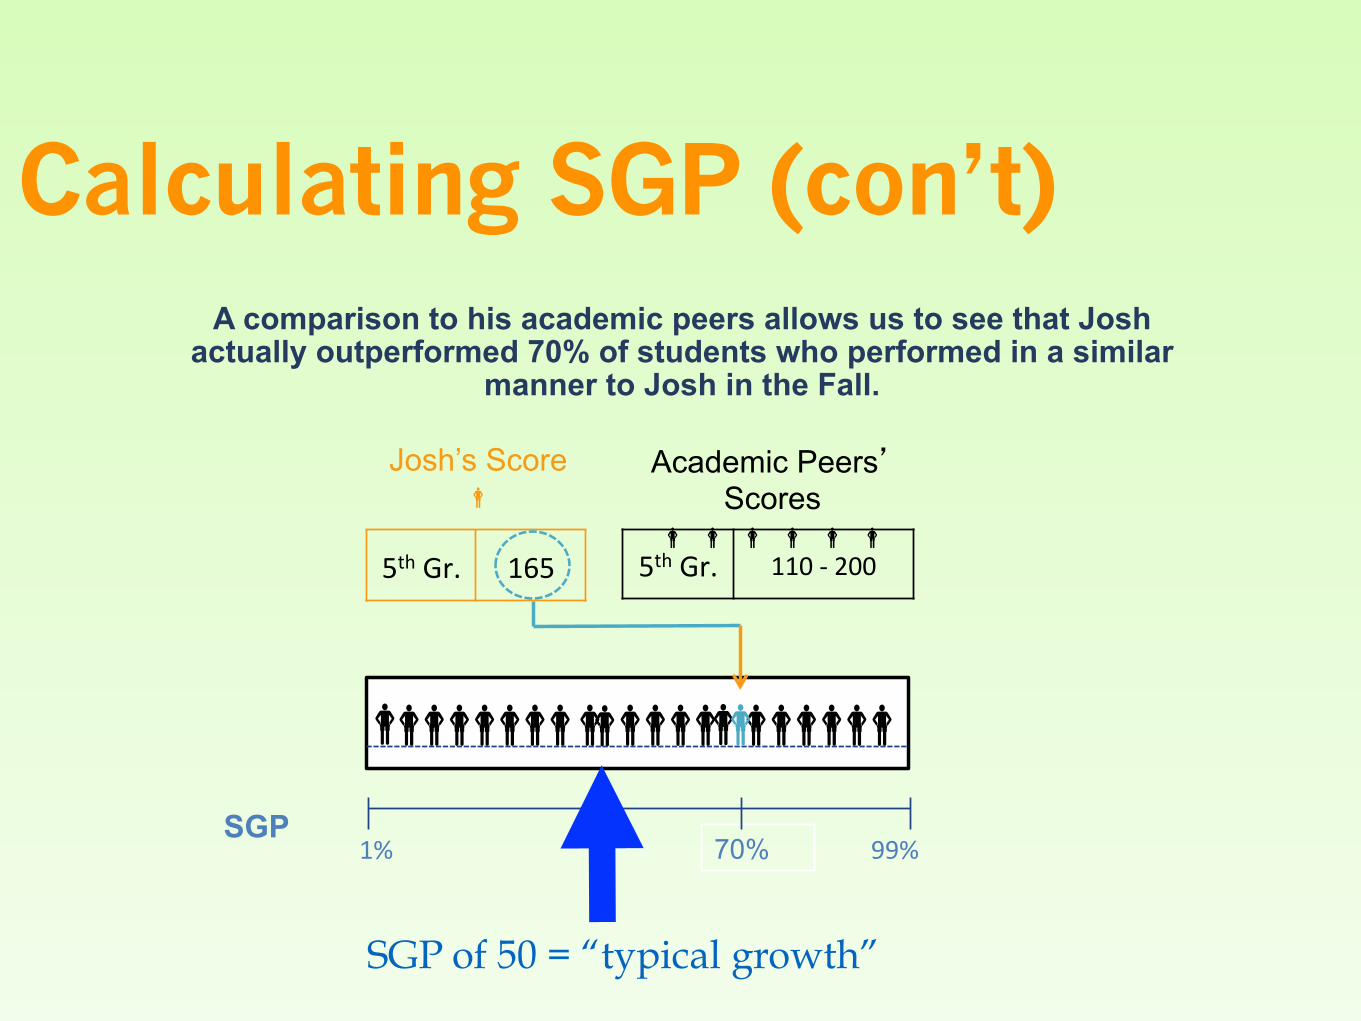
Calculating SGP (con’t)A comparison to his academic peers allows us to see that Josh
actually outperformed 70% of students who performed in a similar manner to Josh in the Fall.
1%# 99%#70%
Josh’s Score !
Academic Peers� Scores
! ! ! ! ! ! 5th#Gr.# 165# 5th#Gr.# 110#-#200###
! ! ! ! ! ! ! ! ! ! ! ! ! ! ! ! ! ! ! ! ! ! SGP
SGP of 50 = “typical growth”

Putting SGP into Context
Focus on grade level -
find the percentage of students with an SGP of 50
or greater
Compare the percentage of students with an SGP of 50 or greater by quartile to
State Average
Break down the data to
percentage of students with an SGP of 50 or greater by
quartile
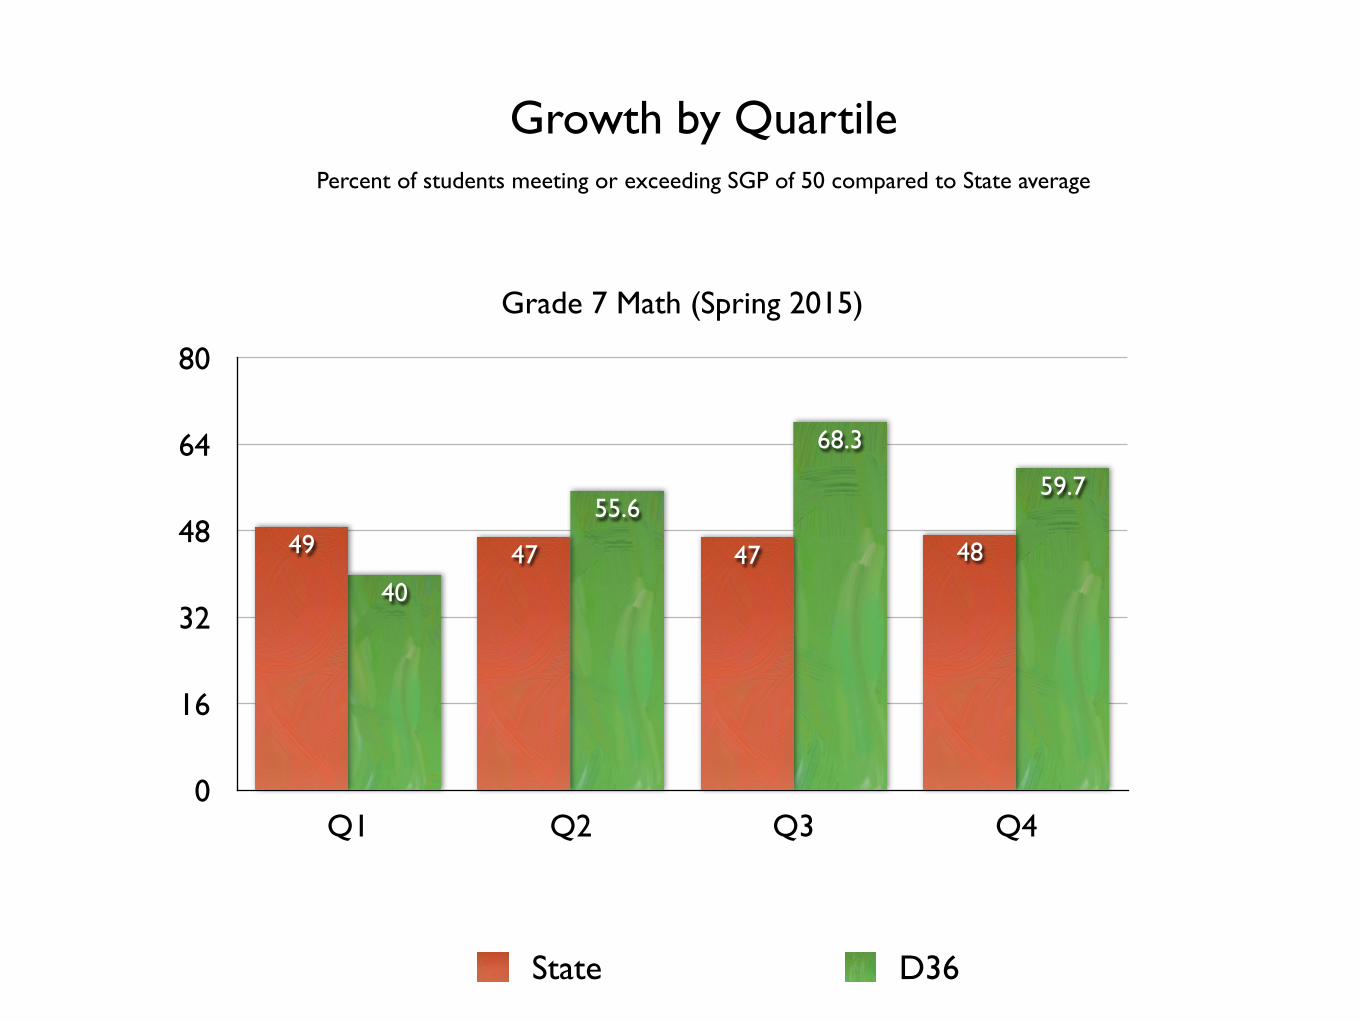
Growth by QuartilePercent of students meeting or exceeding SGP of 50 compared to State average
Grade 7 Math (Spring 2015)
0
16
32
48
64
80
Q1 Q2 Q3 Q4
59.7
68.3
55.6
40
48474749
State D36
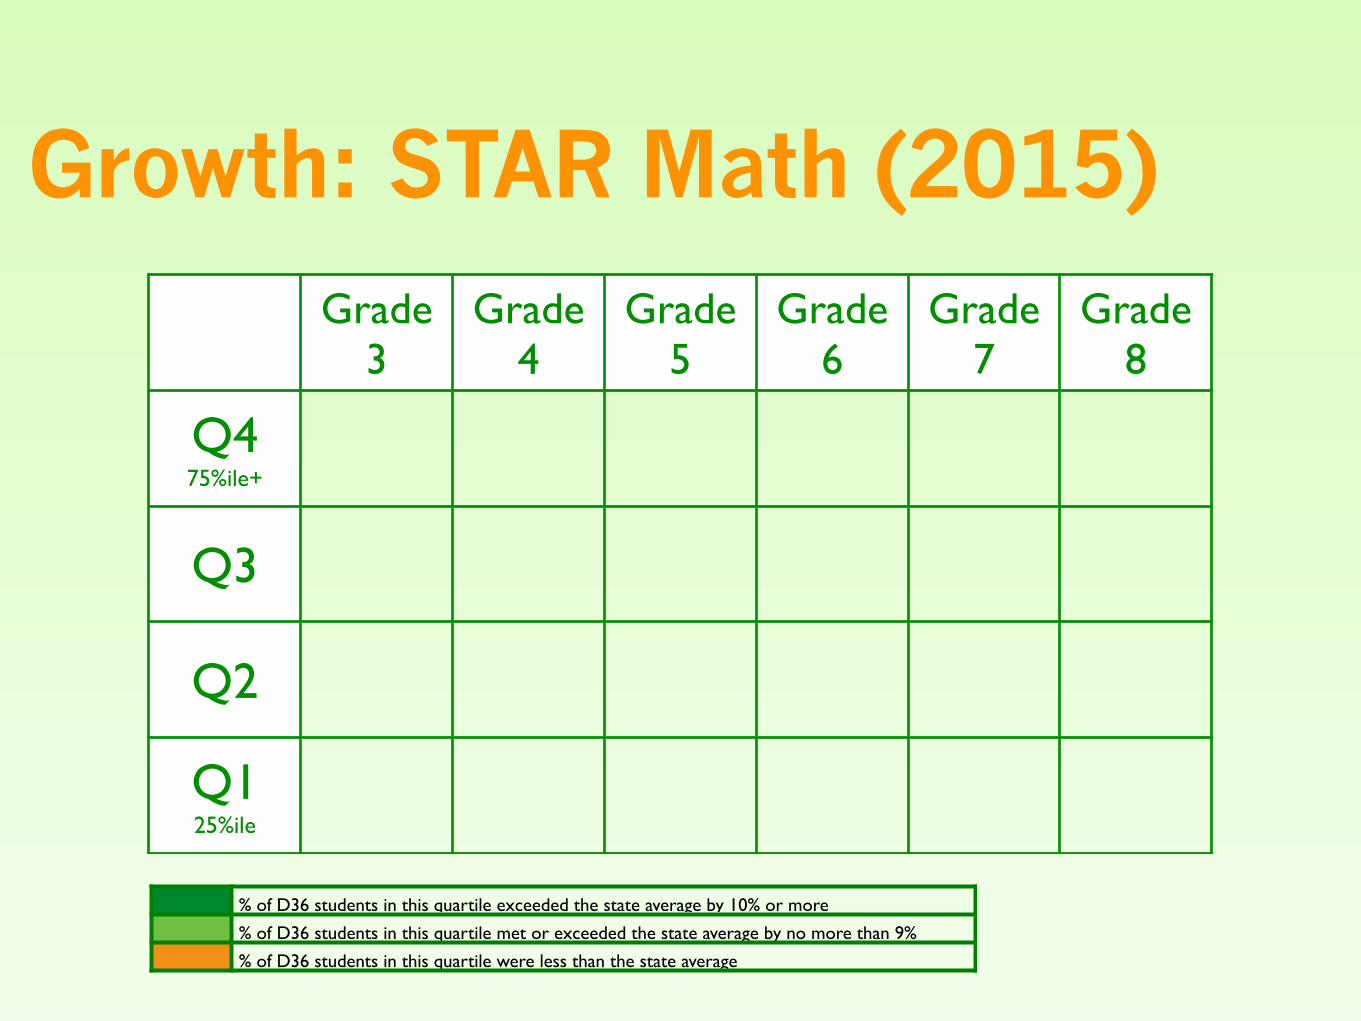
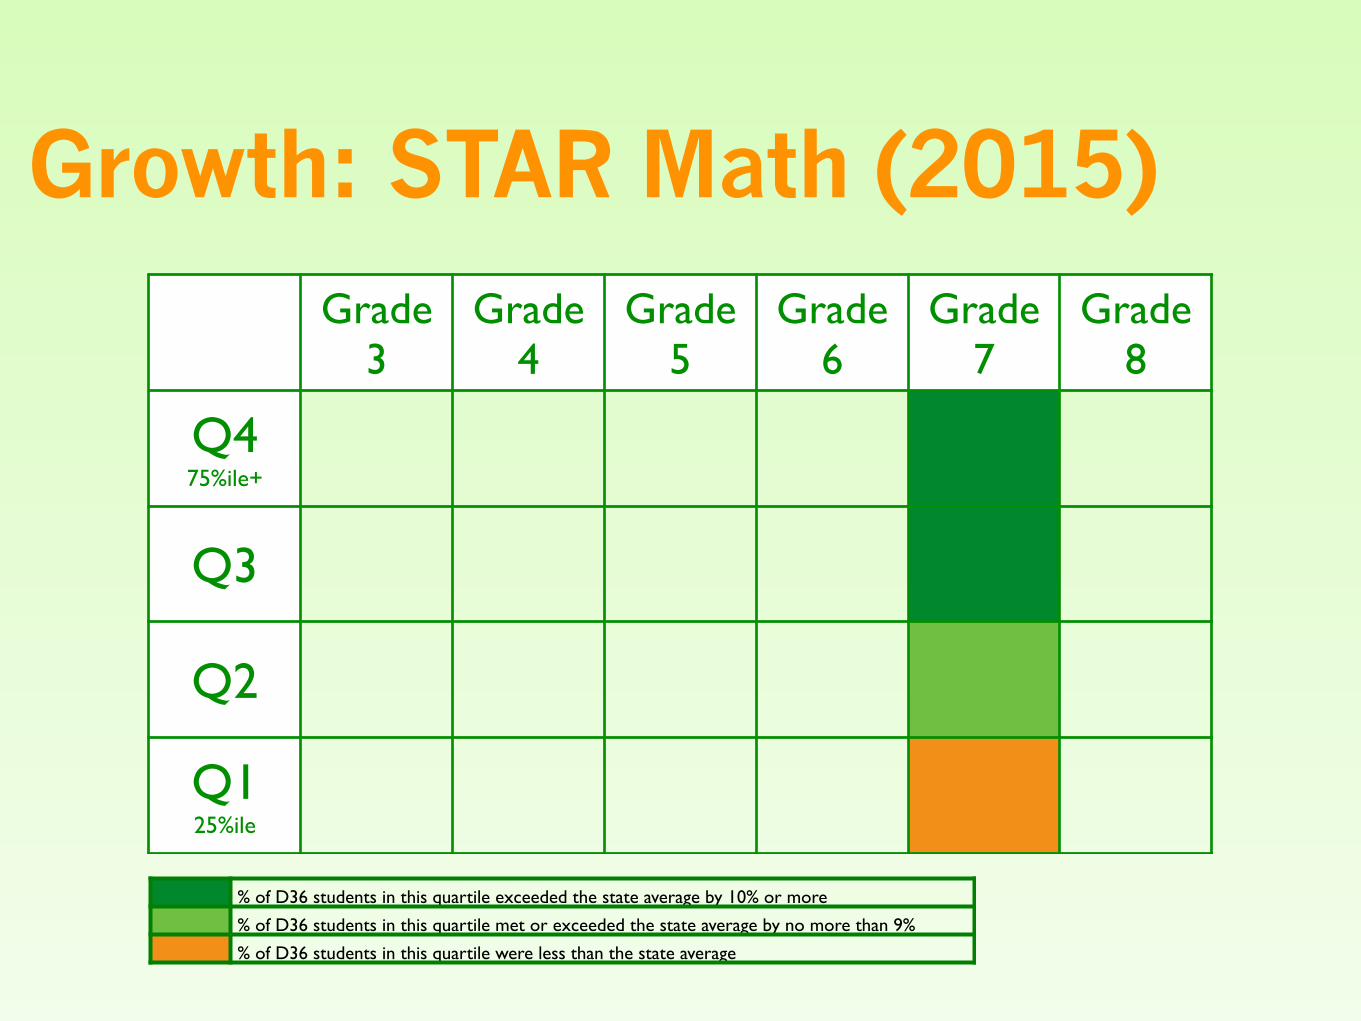
Growth: STAR Math (2015)Grade
3Grade
4Grade
5Grade
6Grade
7Grade
8
Q475%ile+
Q3
Q2
Q125%ile
% of D36 students in this quartile exceeded the state average by 10% or more
% of D36 students in this quartile met or exceeded the state average by no more than 9%
% of D36 students in this quartile were less than the state average

Growth by QuartilePercent of students meeting or exceeding SGP of 50 compared to State average
Grade 7 Math (Spring 2015)
0
16
32
48
64
80
Q1 Q2 Q3 Q4
59.7
68.3
55.6
40
48474749
State D36

Growth: STAR Math (2015)Grade
3Grade
4Grade
5Grade
6Grade
7Grade
8
Q475%ile+
Q3
Q2
Q125%ile
% of D36 students in this quartile exceeded the state average by 10% or more
% of D36 students in this quartile met or exceeded the state average by no more than 9%
% of D36 students in this quartile were less than the state average
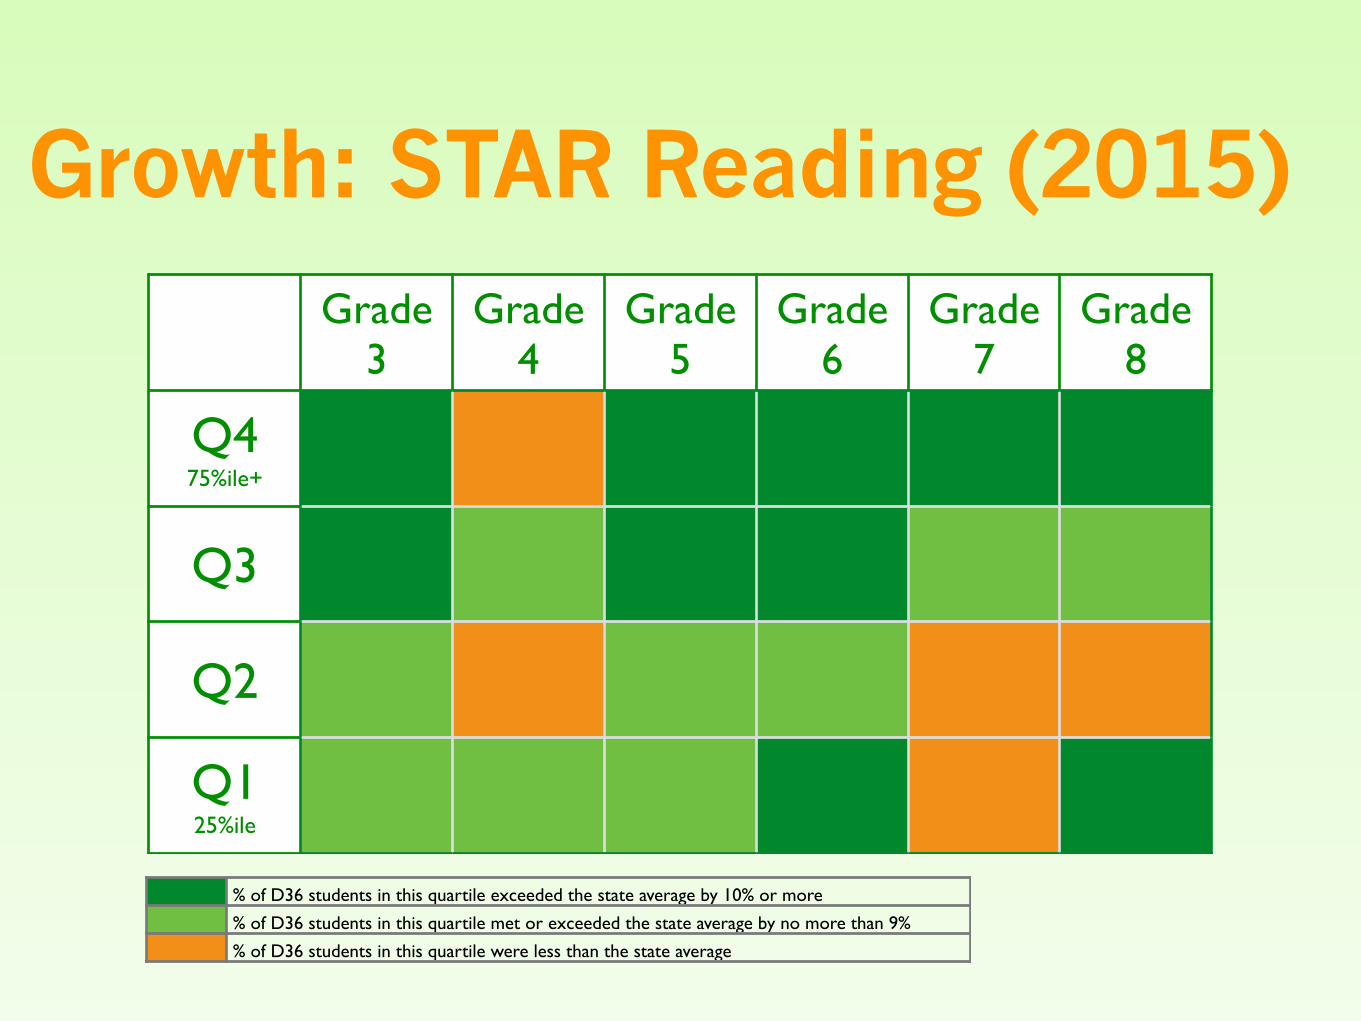
Growth: STAR Reading (2015)Grade
3Grade
4Grade
5Grade
6Grade
7Grade
8
Q475%ile+
Q3
Q2
Q125%ile
% of D36 students in this quartile exceeded the state average by 10% or more
% of D36 students in this quartile met or exceeded the state average by no more than 9%
% of D36 students in this quartile were less than the state average
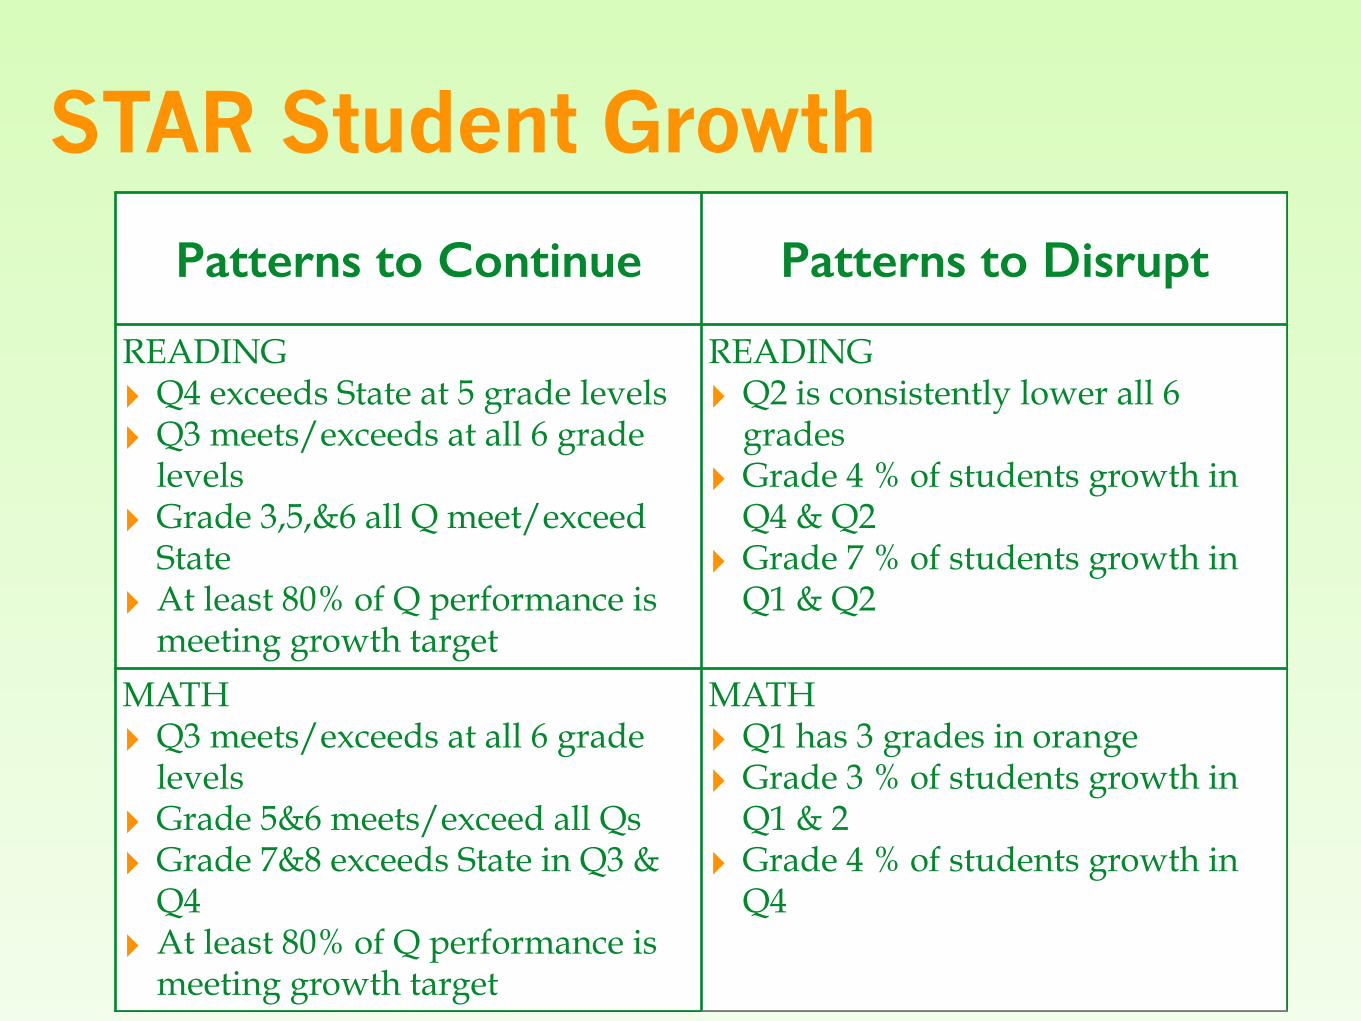
STAR Student Growth
Patterns to Continue Patterns to Disrupt
READING ‣ Q4 exceeds State at 5 grade levels ‣ Q3 meets/exceeds at all 6 grade
levels ‣ Grade 3,5,&6 all Q meet/exceed
State ‣ At least 80% of Q performance is
meeting growth target
READING ‣ Q2 is consistently lower all 6
grades ‣ Grade 4 % of students growth in
Q4 & Q2 ‣ Grade 7 % of students growth in
Q1 & Q2
MATH ‣ Q3 meets/exceeds at all 6 grade
levels ‣ Grade 5&6 meets/exceed all Qs ‣ Grade 7&8 exceeds State in Q3 &
Q4 ‣ At least 80% of Q performance is
meeting growth target
MATH ‣ Q1 has 3 grades in orange ‣ Grade 3 % of students growth in
Q1 & 2 ‣ Grade 4 % of students growth in
Q4
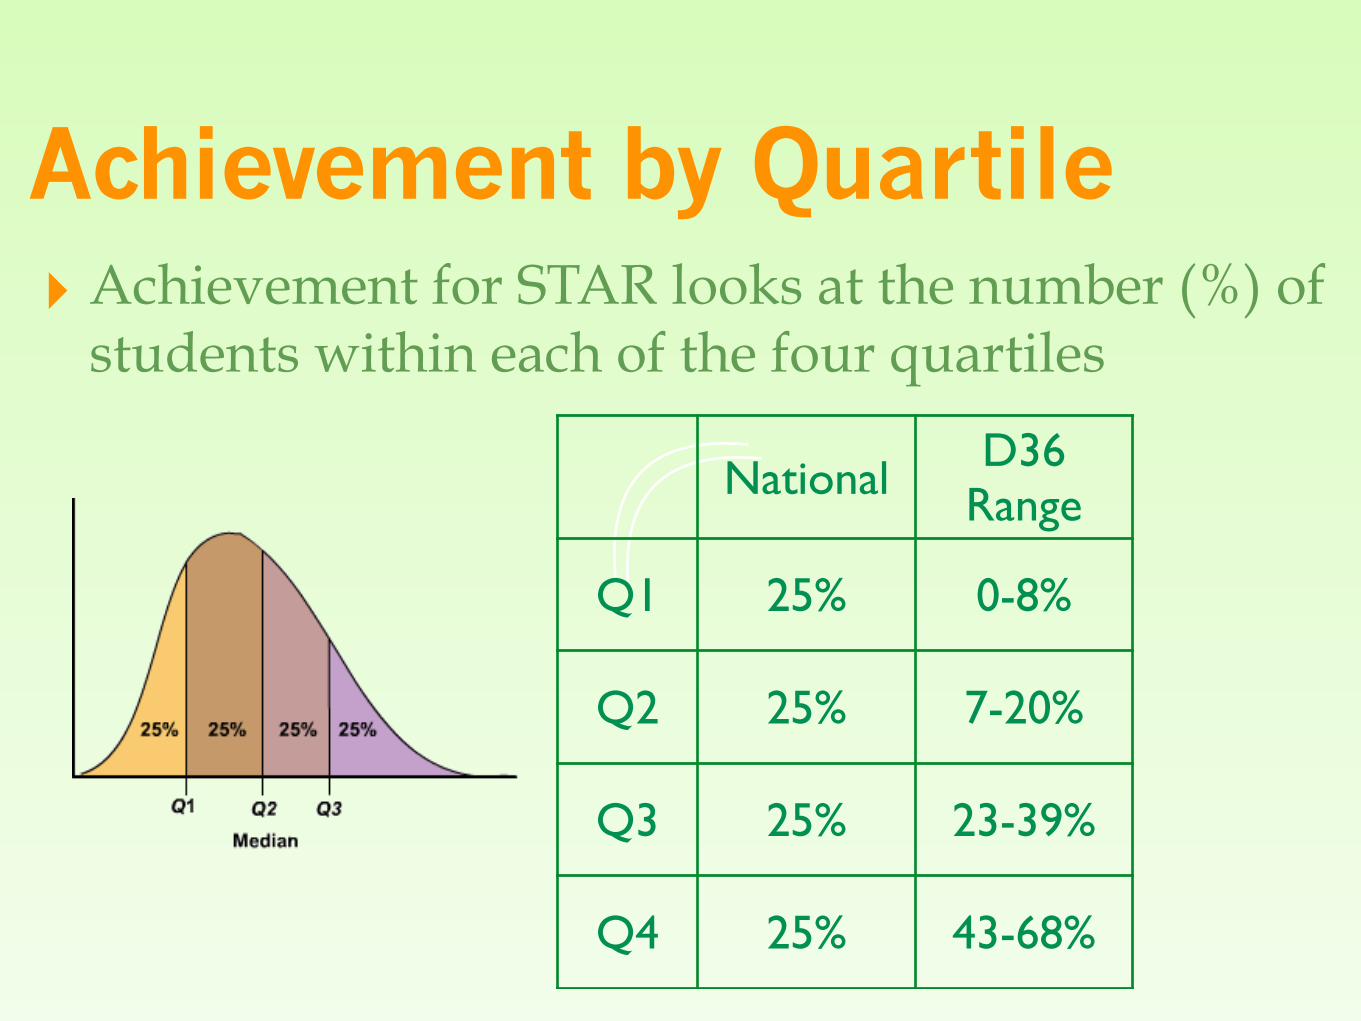
Achievement by Quartile‣ Achievement for STAR looks at the number (%) of
students within each of the four quartiles
NationalD36
Range
Q1 25% 0-8%
Q2 25% 7-20%
Q3 25% 23-39%
Q4 25% 43-68%
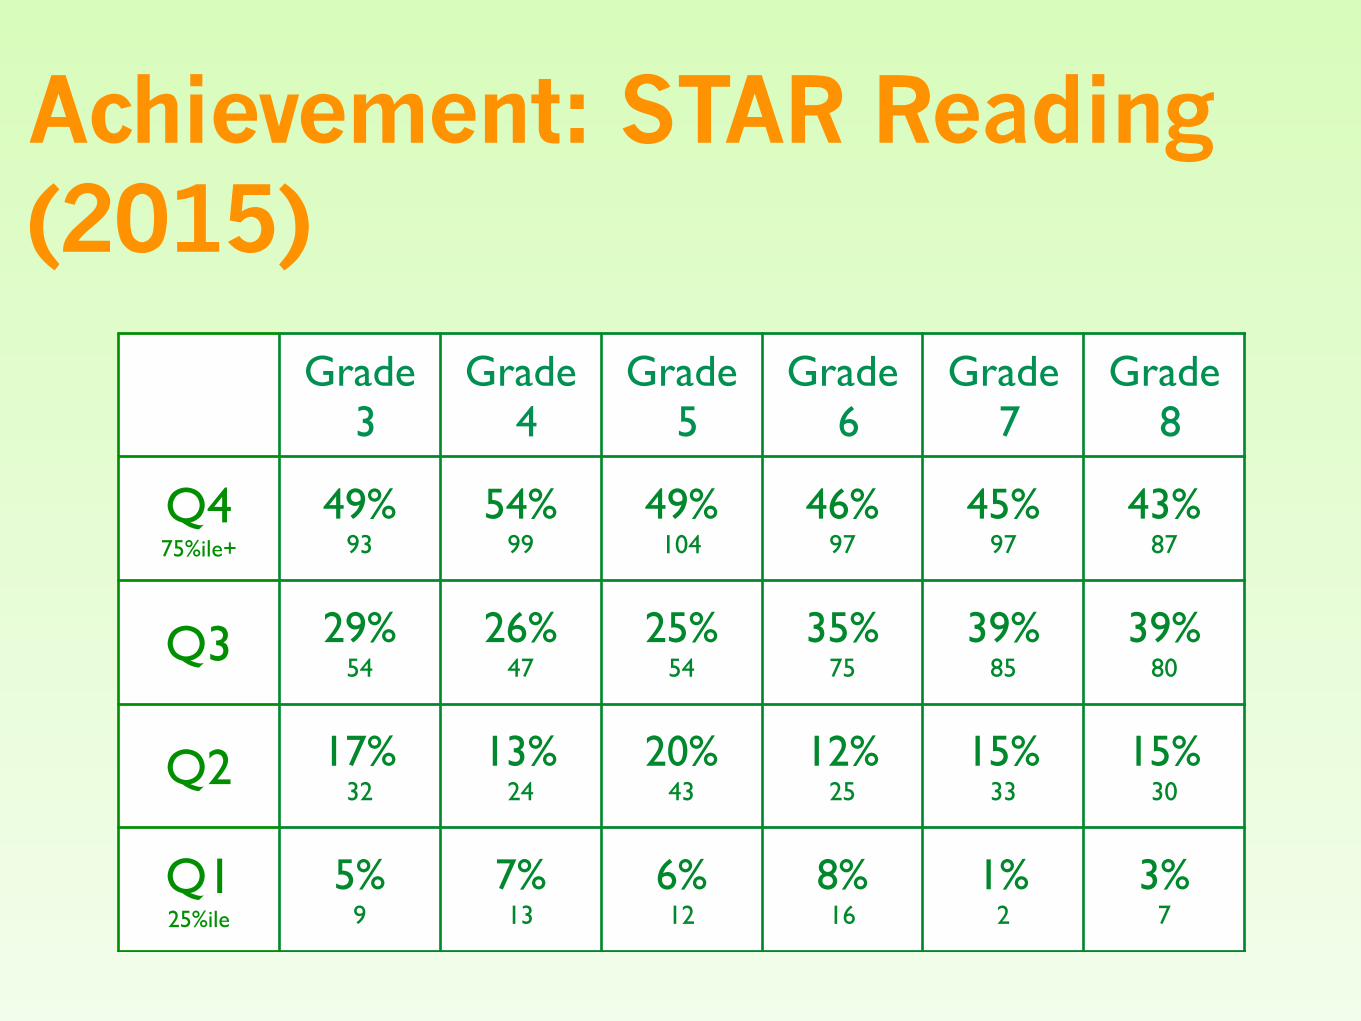
Achievement: STAR Reading (2015)
Grade 3
Grade 4
Grade 5
Grade 6
Grade 7
Grade 8
Q475%ile+
49%93
54%99
49%104
46%97
45%97
43%87
Q3 29%54
26%47
25%54
35%75
39%85
39%80
Q2 17%32
13%24
20%43
12%25
15%33
15%30
Q125%ile
5%9
7%13
6%12
8%16
1%2
3%7
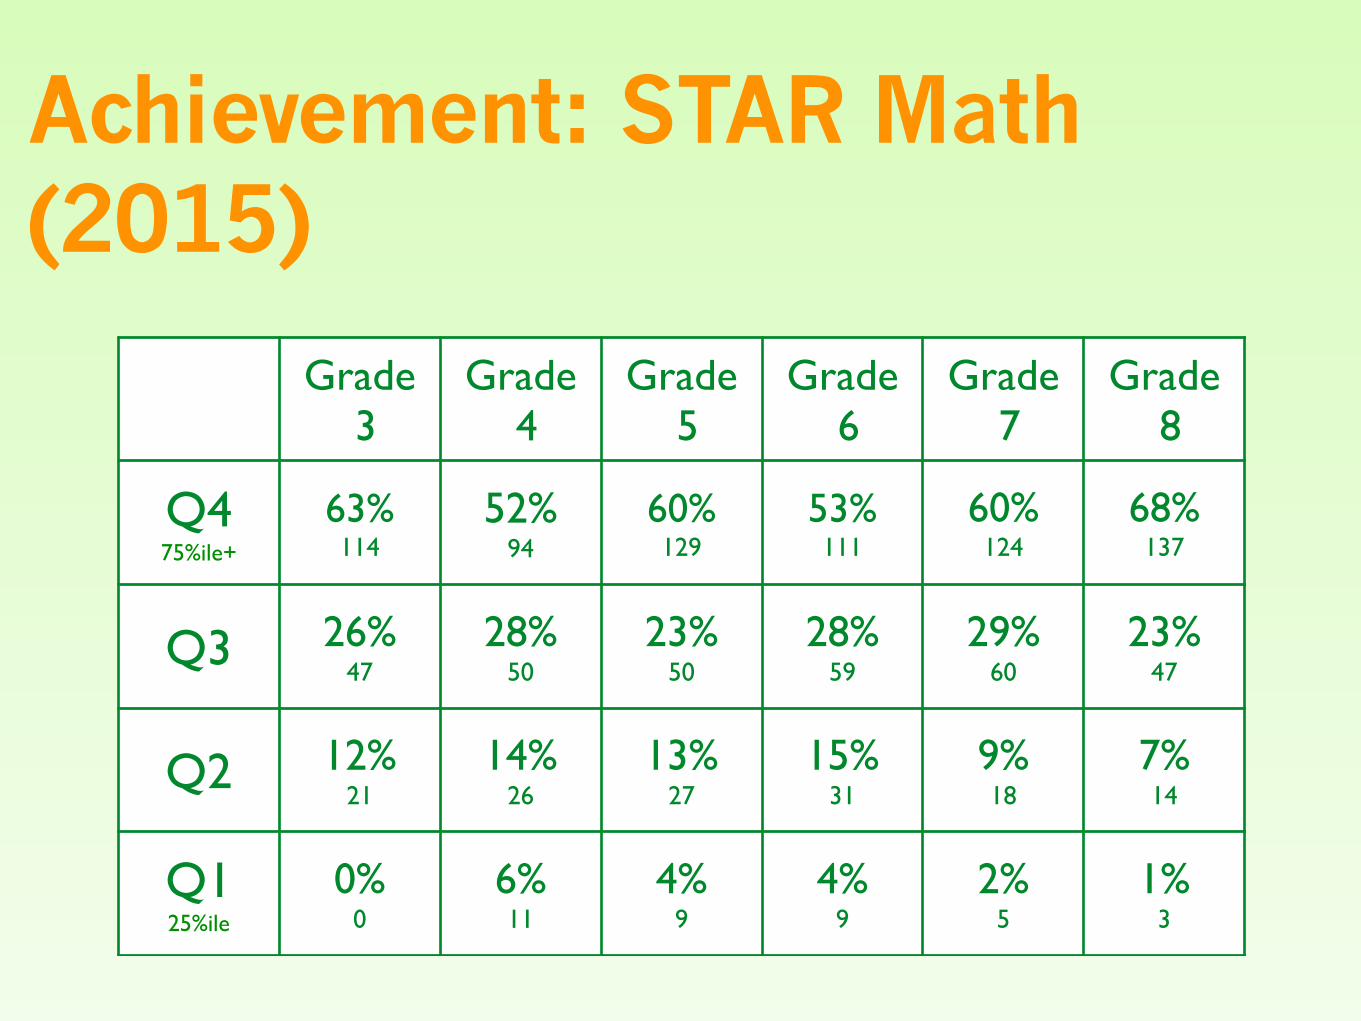
Achievement: STAR Math (2015)
Grade 3
Grade 4
Grade 5
Grade 6
Grade 7
Grade 8
Q475%ile+
63%114
52%94
60%129
53%111
60%124
68%137
Q3 26%47
28%50
23%50
28%59
29%60
23%47
Q2 12%21
14%26
13%27
15%31
9%18
7%14
Q125%ile
0%0
6%11
4%9
4%9
2%5
1%3
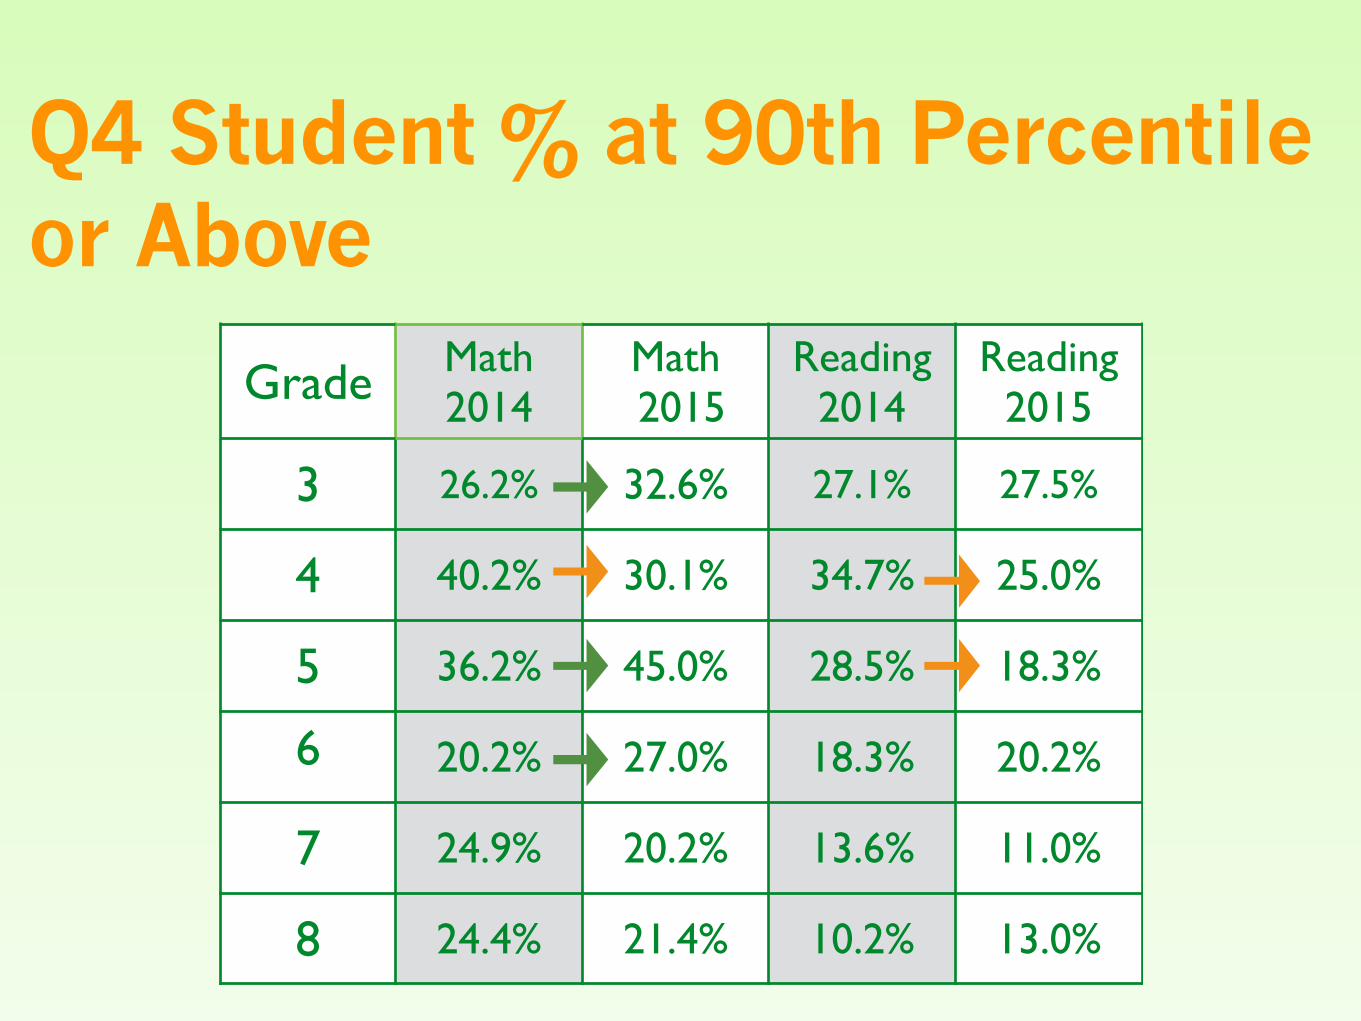
Q4 Student % at 90th Percentile or Above
Grade Math2014
Math 2015
Reading2014
Reading2015
3 26.2% 32.6% 27.1% 27.5%
4 40.2% 30.1% 34.7% 25.0%
5 36.2% 45.0% 28.5% 18.3%
6 20.2% 27.0% 18.3% 20.2%
7 24.9% 20.2% 13.6% 11.0%
8 24.4% 21.4% 10.2% 13.0%
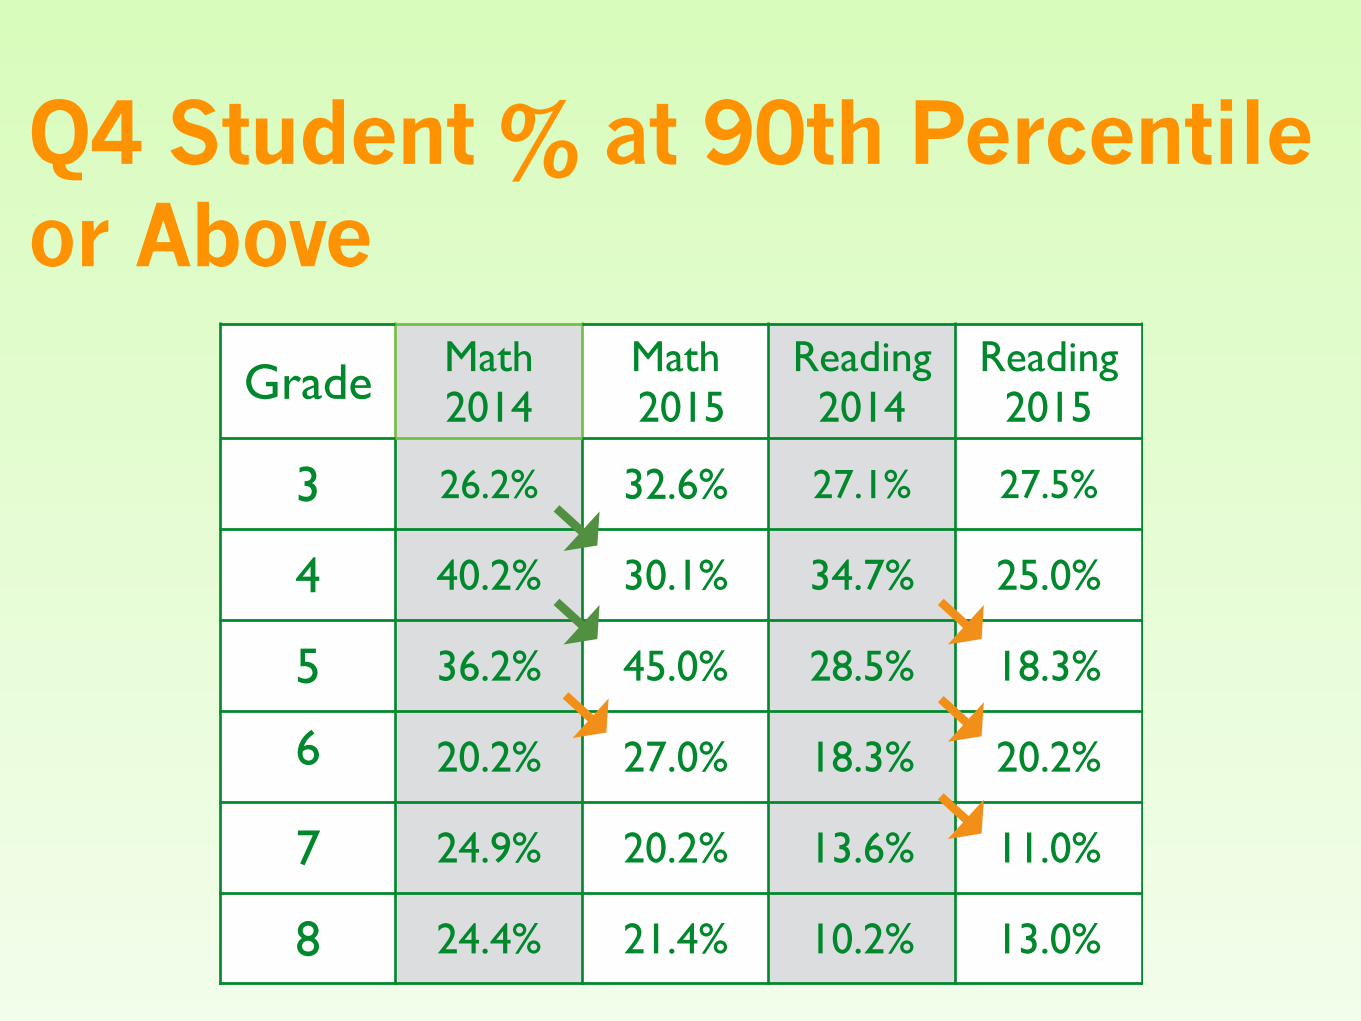
Q4 Student % at 90th Percentile or Above
Grade Math2014
Math 2015
Reading2014
Reading2015
3 26.2% 32.6% 27.1% 27.5%
4 40.2% 30.1% 34.7% 25.0%
5 36.2% 45.0% 28.5% 18.3%
6 20.2% 27.0% 18.3% 20.2%
7 24.9% 20.2% 13.6% 11.0%
8 24.4% 21.4% 10.2% 13.0%
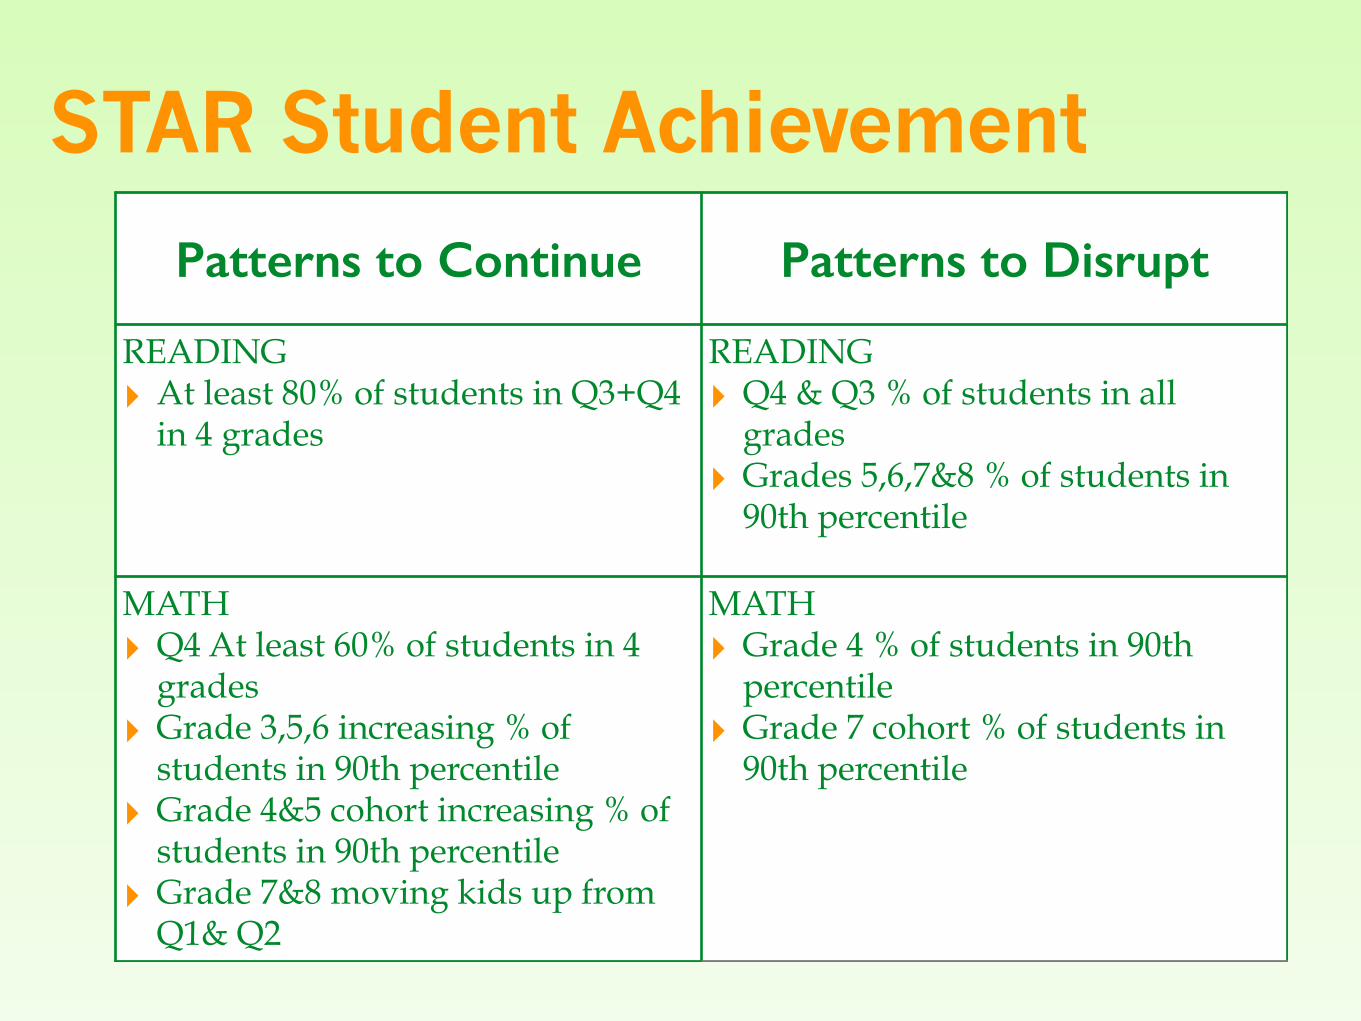
STAR Student Achievement
Patterns to Continue Patterns to Disrupt
READING ‣ At least 80% of students in Q3+Q4
in 4 grades
READING ‣ Q4 & Q3 % of students in all
grades ‣ Grades 5,6,7&8 % of students in
90th percentile
MATH ‣ Q4 At least 60% of students in 4
grades ‣ Grade 3,5,6 increasing % of
students in 90th percentile ‣ Grade 4&5 cohort increasing % of
students in 90th percentile ‣ Grade 7&8 moving kids up from
Q1& Q2
MATH ‣ Grade 4 % of students in 90th
percentile ‣ Grade 7 cohort % of students in
90th percentile

Response to STARMATH ‣ Provide differentiated digital resources to support the growth
of Q4 students. Analyze Q1 & Q2 individual students for RtI support.
‣ Skokie School will provide differentiated support for the Grade 5 cohort to include high-readiness learners and students in need of intervention. Skokie School is establishing Math Counts and offering a Math exploratory during the school day. Goal will appear in SIP plan.
‣ Although not highlighted in this District-level presentation, Hubbard Woods will continue the work it initiated last year for Grade 3 Math.
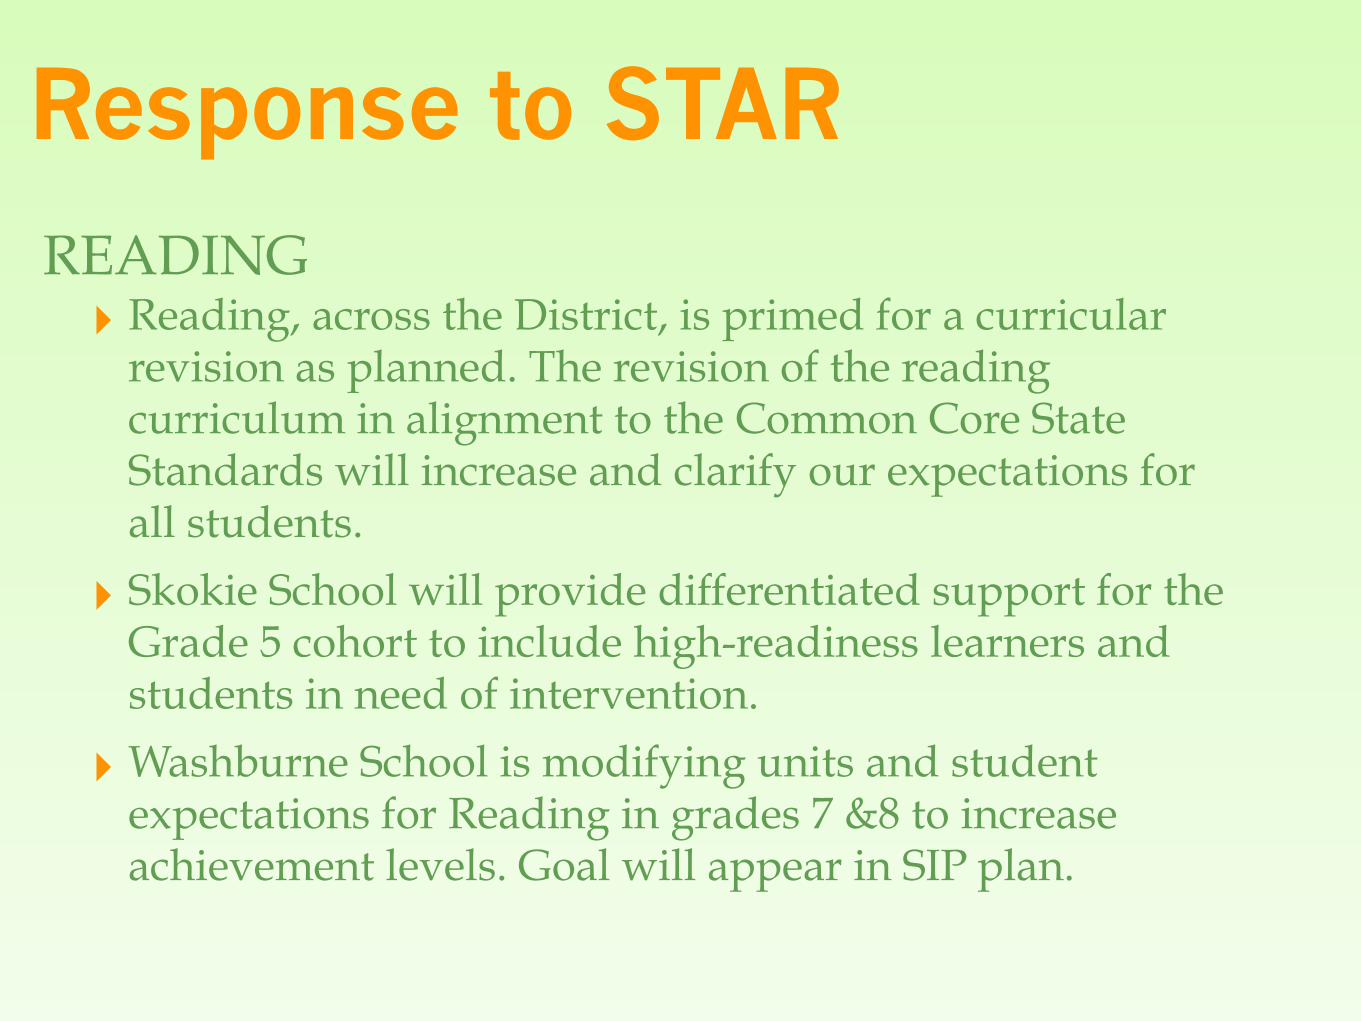
Response to STARREADING ‣ Reading, across the District, is primed for a curricular
revision as planned. The revision of the reading curriculum in alignment to the Common Core State Standards will increase and clarify our expectations for all students.
‣ Skokie School will provide differentiated support for the Grade 5 cohort to include high-readiness learners and students in need of intervention.
‣Washburne School is modifying units and student expectations for Reading in grades 7 &8 to increase achievement levels. Goal will appear in SIP plan.
Next Steps
‣ Building-specific School Improvement Plans to address student data will be shared at the October 20, 2015 School Board meeting.
‣ Comprehensive Math goals and measures to be presented to the School Board in October.
‣ Comprehensive Reading goals and measures to be presented to the School Board in January.

Q & A