Embed Size (px)
Citation preview

2015 SEMI ANNUAL REPORT AND UNAUDITED FINANCIAL STATEMENTS
31 December 2015
Russell Investment Company IV plcan umbrella fund with segregated liability between sub-funds
Russell Absolute Return Equity Fund*
Russell Alpha Fund
Russell Multi Strategy Volatility Fund
Russell Global Regional Equity Fund
* The fund ceased trading on 7 August 2015.


Russell Investment Company IV plc
Contents
Contents
Administration of the Company .................................................................................................................................... 2 Background to the Company ....................................................................................................................................... 3 Combined Statements ................................................................................................................................................. 4 Russell Absolute Return Equity Fund ......................................................................................................................... 7 Russell Alpha Fund ..................................................................................................................................................... 11 Russell Multi Strategy Volatility Fund .......................................................................................................................... 29 Russell Global Regional Equity Fund .......................................................................................................................... 41 Notes to the Financial Statements .............................................................................................................................. 57

Russell Investment Company IV plc
Administration of the Company
2 Administration of the Company
Board of Directors of the Company* Custodian and Trustee
Mr. James Firn (Chairman) State Street Custodial Services (Ireland) Limited
Mr. James Beveridge 78 Sir John Rogerson’s Quay
Mr. Peter Gonella Dublin 2
Mr. Neil Jenkins Ireland
Mr. John McMurray
Mr. Tom Murray Global Sub-Custodian
Mr. William Roberts State Street Bank and Trust Company
Mr. David Shubotham Copley Place
Mr. Kenneth Willman 100 Huntington Avenue
Boston, MA 02116
Members of the Manager’s Audit Committee United States of America
Mr. David Shubotham (Chairman)
Mr. Tom Murray Promoter
Mr. William Roberts Frank Russell Company
1301 Second Avenue
Registered Office 18th Floor
78 Sir John Rogerson’s Quay Seattle, WA 98101
Dublin 2 United States of America
Ireland
Company Secretary
Manager MFD Secretaries Limited
Russell Investments Ireland Limited 2nd Floor, Beaux Lane House
78 Sir John Rogerson’s Quay Mercer Street Lower
Dublin 2 Dublin 2
Ireland Ireland
Independent Auditors Adviser, Distributor and UK Facilities Agent
PricewaterhouseCoopers Russell Investments Limited
Chartered Accountants and Statutory Audit Firm Rex House
One Spencer Dock 10 Regent Street, St James’
North Wall Quay London SW1Y 4PE
Dublin 1 England
Ireland
Paying and Information Agent in Austria
Legal Adviser UniCredit Bank Austria AG
Maples and Calder Schottengasse 6-8
75 St. Stephen’s Green 1010 Vienna
Dublin 2 Austria
Ireland
Paying and Information Agent in Germany**
Administrator Marcard, Stein & Co. AG
State Street Fund Services (Ireland) Limited Ballindamm 36
78 Sir John Rogerson’s Quay 20095 Hamburg
Dublin 2 Germany
Ireland
* As of 31 December 2015.
** The Company’s Memorandum and Articles of Association, the Prospectus, the Key Investor Information Documents, the unaudited semi-
annual reports, as well as the audited annual reports can be obtained free of charge from the office of the paying and information agent via
regular mail or per e-mail. The net asset value of each of the Funds and the subscription and redemption prices of the shares of the Funds are
published jointly and daily on “www.fundinfo.com” for information purposes only and do not constitute an invitation to subscribe for or
repurchase the Company’s shares at those prices.
There have been no changes to Money Managers during the period.

Russell Investment Company IV plc
Background to the Company
Background to the Company 3
Russell Investment Company IV plc (the “Company”) was incorporated in Ireland as a public limited company on 10 November
2004. The Company operates under the Companies Act 2014 and has been authorised since 2 March 2005 by the Central Bank of
Ireland (the “Central Bank”).
The Company is an open-ended investment company with variable capital and is authorised by the Central Bank under the
European Communities (Undertakings for Collective Investment in Transferable Securities) Regulations, 2011 (as amended) and
under the Central Bank (Supervision & Enforcement) Act 2013 (Section 48(1) (Undertakings for Collective Investment in
Transferable Securities) Regulations 2015) (together the “Regulations”).
The Company is organised in the form of an umbrella fund and as of 31 December 2015 has three funds available for investment
(each a “Fund”, collectively the “Funds”).
The Adviser, the Manager and their affiliated group companies are referred to collectively as Russell Investments in these
financial statements.
Net assets under management for the Funds as at 31 December 2015 amounted to USD 918,553,199 (as at 30 June 2015: USD
1,129,980,608 as at 31 December 2014: USD 938,938,931) broken down as follows:
Fund Funded during
the year ended Functional
Currency
Net Assets
31 December 2015
‘000
Net Assets
30 June 2015
‘000
Net Assets
31 December 2014
‘000
Russell Absolute Return Equity Fund* 30 June 2009 GBP - 425,639 432,994
Russell Alpha Fund 30 June 2005 USD 278,342 226,253 263,757
Russell Multi Strategy Volatility Fund 30 June 2015 USD 284,075 234,274 -
Russell Global Regional Equity Fund 30 June 2016 EUR 327,859 - -
* The Fund ceased trading on 7 August 2015
All share classes listed throughout this report are Accumulation Class Shares unless otherwise indicated in the name of the share
class.
All references to “net assets” throughout this document refer to net assets attributable to holders of redeemable participating
shares unless otherwise stated.
Notice to the Shareholders: Removal of Manager reports in Semi Annual financial statements
The Manager reports are no longer included in the semi annual financial statements. For information regarding six months Fund
performance and market commentary please contact your client executive. Alternatively please email
During the period, there has been no change to the Fund’s investment objectives as stated within the Prospectus.
Russell Investment Company IV plc
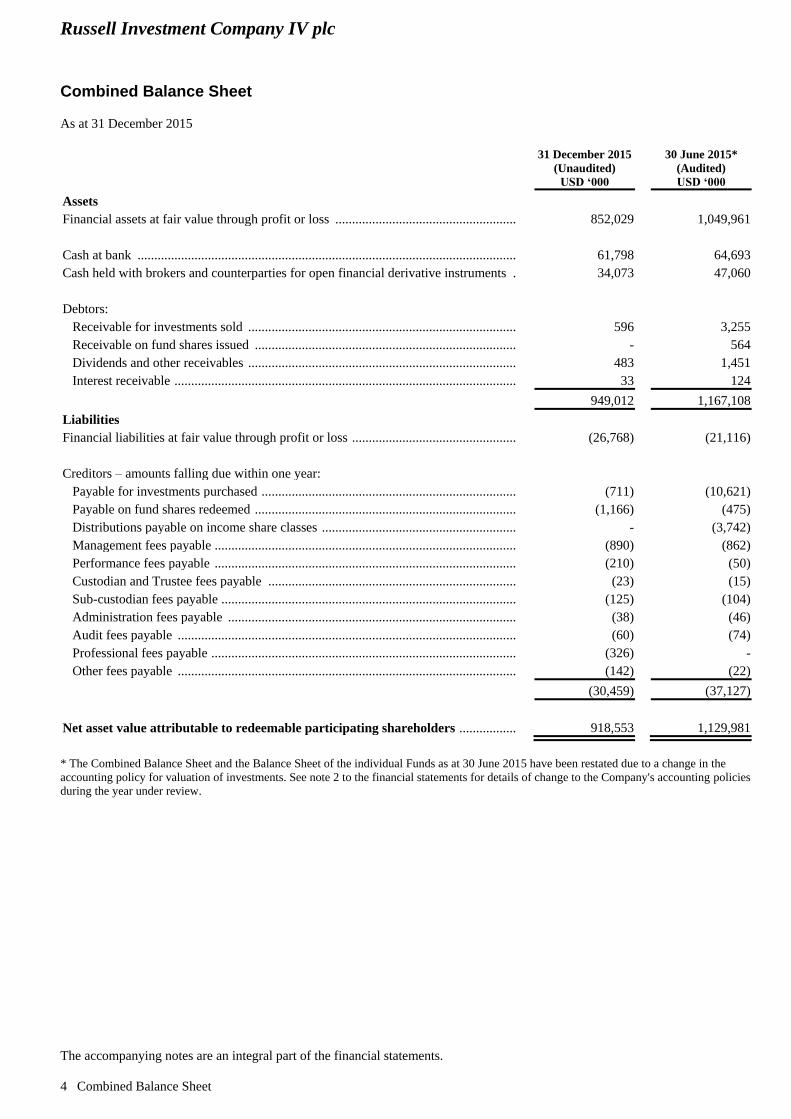
Combined Balance Sheet
As at 31 December 2015
The accompanying notes are an integral part of the financial statements.
4 Combined Balance Sheet
31 December 2015 (Unaudited)
USD ‘000
30 June 2015* (Audited)
USD ‘000
Assets
Financial assets at fair value through profit or loss ................................................................... 852,029 1,049,961
Cash at bank .............................................................................................................................. 61,798 64,693
Cash held with brokers and counterparties for open financial derivative instruments .............. 34,073 47,060
Debtors:
Receivable for investments sold ............................................................................................. 596 3,255
Receivable on fund shares issued ........................................................................................... - 564
Dividends and other receivables ............................................................................................. 483 1,451
Interest receivable ................................................................................................................... 33 124
949,012 1,167,108
Liabilities
Financial liabilities at fair value through profit or loss ..................................................... (26,768) (21,116)
Creditors – amounts falling due within one year:
Payable for investments purchased ......................................................................................... (711) (10,621)
Payable on fund shares redeemed ........................................................................................... (1,166) (475)
Distributions payable on income share classes ....................................................................... - (3,742)
Management fees payable ....................................................................................................... (890) (862)
Performance fees payable ....................................................................................................... (210) (50)
Custodian and Trustee fees payable ....................................................................................... (23) (15)
Sub-custodian fees payable ..................................................................................................... (125) (104)
Administration fees payable ................................................................................................... (38) (46)
Audit fees payable .................................................................................................................. (60) (74)
Professional fees payable ........................................................................................................ (326) -
Other fees payable .................................................................................................................. (142) (22)
(30,459) (37,127)
Net asset value attributable to redeemable participating shareholders .............................. 918,553 1,129,981
* The Combined Balance Sheet and the Balance Sheet of the individual Funds as at 30 June 2015 have been restated due to a change in the
accounting policy for valuation of investments. See note 2 to the financial statements for details of change to the Company's accounting policies
during the year under review.

Russell Investment Company IV plc
Combined Profit and Loss Account
For the six months ended 31 December 2015
The accompanying notes are an integral part of the financial statements.
Combined Profit and Loss Account 5
Six months ended
31 December 2015
(Unaudited)
USD ‘000
Six months ended
31 December 2014*
(Unaudited)
USD ‘000
Income
Dividends ................................................................................................................................ 4,224 6,903
Interest income ....................................................................................................................... 213 91
4,437 6,994
Net gain (loss) on investment activities .................................................................................. (50,254) (51,295)
Total investment income (expense) ..................................................................................... (45,817) (44,301)
Expenses
Management fees .................................................................................................................... (4,992) (3,703)
Performance fees .................................................................................................................... (213) 8
Custodian and Trustee fees ..................................................................................................... (48) (42)
Sub-custodian fees .................................................................................................................. (319) (248)
Administration and transfer agency fees ................................................................................. (191) (190)
Audit fees ................................................................................................................................ (61) (33)
Professional fees ..................................................................................................................... (379) (85)
Other fees ................................................................................................................................ (41) (38)
Total operating expenses ...................................................................................................... (6,244) (4,331)
Profit (loss) for the financial period before taxation ......................................................... (52,061) (48,632)
Taxation
Withholding tax ...................................................................................................................... (1,057) (1,053)
Net increase (decrease) in net assets attributable to redeemable participating
shareholders resulting from operations .............................................................................. (53,118) (49,685)
All amounts arose solely from continuing operations with the exception of Russell Absolute Return Equity Fund which was fully redeemed
during the period and therefore the financial statements are prepared on a discontinued basis. There are no recognised gains or losses other than
those dealt with in the Profit and Loss Account.
*The Combined Profit and Loss Account and the Profit and Loss Account of the individual Funds for the six months ended 31 December 2014
have been restated due to a change in the accounting policy for valuation of investments. See note 2 to the financial statements for details of
changes to the Company's accounting policies.
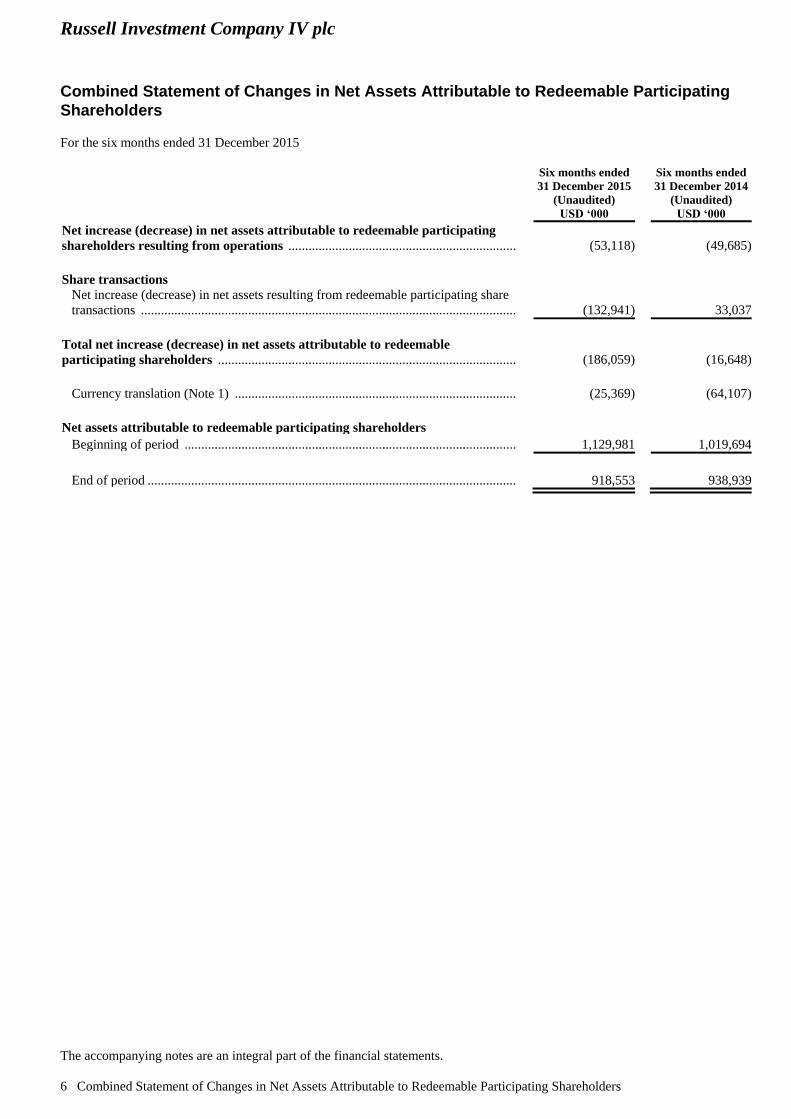
Russell Investment Company IV plc
Combined Statement of Changes in Net Assets Attributable to Redeemable Participating
Shareholders
For the six months ended 31 December 2015
The accompanying notes are an integral part of the financial statements.
6 Combined Statement of Changes in Net Assets Attributable to Redeemable Participating Shareholders
Six months ended
31 December 2015
(Unaudited)
USD ‘000
Six months ended
31 December 2014
(Unaudited)
USD ‘000
Net increase (decrease) in net assets attributable to redeemable participating
shareholders resulting from operations .........................................................................
(53,118) (49,685)
Share transactions
Net increase (decrease) in net assets resulting from redeemable participating share
transactions ............................................................................................................................. (132,941) 33,037
Total net increase (decrease) in net assets attributable to redeemable
participating shareholders .............................................................................................. (186,059) (16,648)
Currency translation (Note 1) ................................................................................................. (25,369) (64,107)
Net assets attributable to redeemable participating shareholders
Beginning of period ................................................................................................................ 1,129,981 1,019,694
End of period ........................................................................................................................... 918,553 938,939
Russell Investment Company IV plc
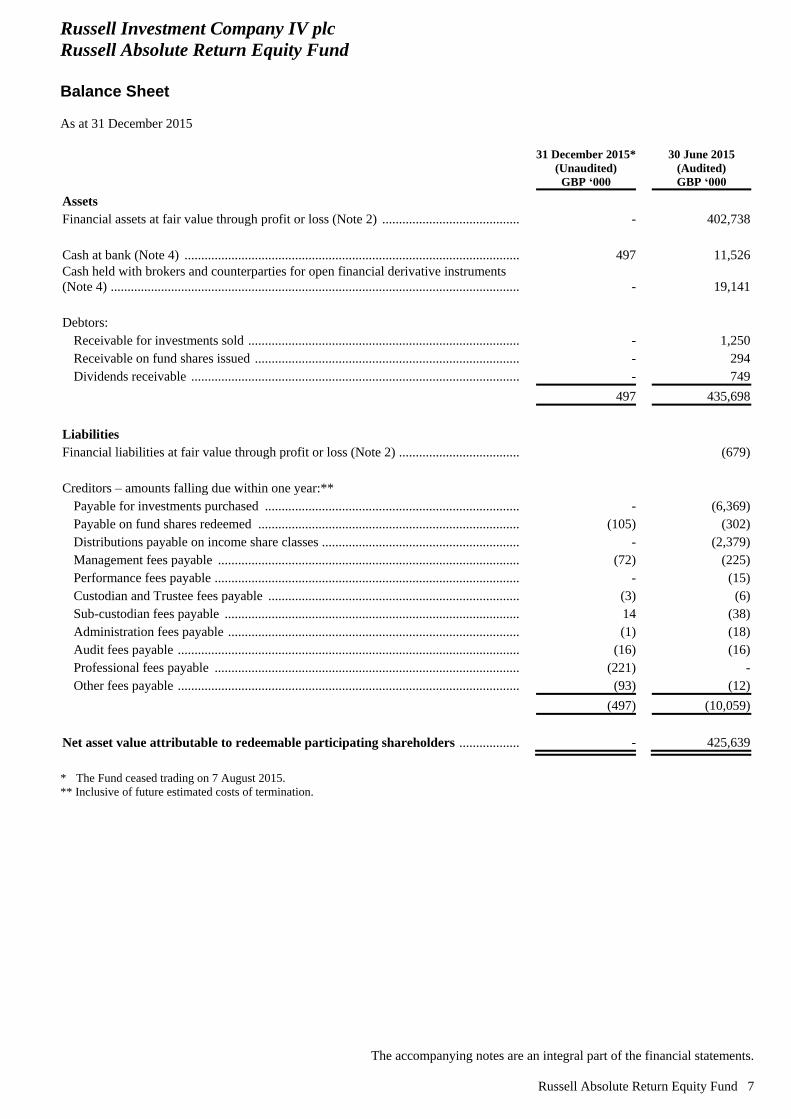
Russell Absolute Return Equity Fund
Balance Sheet
As at 31 December 2015
The accompanying notes are an integral part of the financial statements.
Russell Absolute Return Equity Fund 7
31 December 2015*
(Unaudited)
GBP ‘000
30 June 2015
(Audited)
GBP ‘000
Assets
Financial assets at fair value through profit or loss (Note 2) ................................................................................... - 402,738
Cash at bank (Note 4) .............................................................................................................................................. 497 11,526
Cash held with brokers and counterparties for open financial derivative instruments
(Note 4) .................................................................................................................................................................... - 19,141
Debtors:
Receivable for investments sold .................................................................................................................... - 1,250
Receivable on fund shares issued .................................................................................................................. - 294
Dividends receivable ..................................................................................................................................... - 749
497 435,698
Liabilities
Financial liabilities at fair value through profit or loss (Note 2) ....................................... (679)
Creditors – amounts falling due within one year:**
Payable for investments purchased ............................................................................................................... - (6,369)
Payable on fund shares redeemed ................................................................................................................. (105) (302)
Distributions payable on income share classes .............................................................................................. - (2,379)
Management fees payable ............................................................................................................................. (72) (225)
Performance fees payable .............................................................................................................................. - (15)
Custodian and Trustee fees payable .............................................................................................................. (3) (6)
Sub-custodian fees payable ........................................................................................................................... 14 (38)
Administration fees payable .......................................................................................................................... (1) (18)
Audit fees payable ......................................................................................................................................... (16) (16)
Professional fees payable .............................................................................................................................. (221) -
Other fees payable ......................................................................................................................................... (93) (12)
(497) (10,059)
Net asset value attributable to redeemable participating shareholders ................................................................... - 425,639
* The Fund ceased trading on 7 August 2015.
** Inclusive of future estimated costs of termination.

Russell Investment Company IV plc
Russell Absolute Return Equity Fund
Profit and Loss Account
For the six months ended 31 December 2015
The accompanying notes are an integral part of the financial statements.
8 Russell Absolute Return Equity Fund
Six months ended
31 December 2015*
(Unaudited)
GBP ‘000
Six months ended
31 December 2014
(Unaudited)
GBP ‘000
Income
Dividends ..................................................................................................................................................... 59 3,038
Interest income ............................................................................................................................................. 4 56
63 3,094
Net gain (loss) on investment activities ............................................................................................................................. (1,923) (11,221)
Total investment income (expense) ................................................................................................................................ (1,860) (8,127)
Expenses**
Management fees (Note 5) ........................................................................................................................... (276) (1,469)
Performance fees (Note 5) ............................................................................................................................ - (6)
Custodian and Trustee fees (Note 6) ............................................................................................................ (7) (18)
Sub-custodian fees (Note 6) ......................................................................................................................... (16) (94)
Administration and transfer agency fees (Note 6) ........................................................................................ (18) (81)
Audit fees ..................................................................................................................................................... (16) (10)
Professional fees ........................................................................................................................................... (221) (35)
Other fees ..................................................................................................................................................... (9) (10)
Total operating expenses .......................................................................................................................................... (563) (1,723)
Net income (expense) ................................................................................................................................................ (2,423) (9,850)
Taxation
Withholding tax (Note 9) ............................................................................................................................. (215) (413)
Net increase (decrease) in net assets attributable to redeemable participating
shareholders resulting from operations ........................................................................................................ (2,638) (10,263)
All amounts arose solely from continuing operations. There are no recognised gains or losses other than those dealt with in the Profit and Loss
Account.
* The Fund ceased trading on 7 August 2015.
** Inclusive of future estimated costs of termination.

Russell Investment Company IV plc
Russell Absolute Return Equity Fund
Statement of Changes in Net Assets Attributable to Redeemable Participating Shareholders
For the six months ended 31 December 2015
The accompanying notes are an integral part of the financial statements.
Russell Absolute Return Equity Fund 9
Six months ended
31 December 2015*
(Unaudited)
GBP ‘000
Six months ended
31 December 2014
(Unaudited)
GBP ‘000
Net increase (decrease) in net assets attributable to redeemable participating
shareholders resulting from operations ........................................................................................................ (2,638) (10,263)
Share transactions
Net increase (decrease) in net assets attributable to redeemable participating
shareholders resulting from share transactions (Note 10) ............................................................................ (423,001) 29,010
Total net increase (decrease) in net assets attributable to redeemable
participating shareholders .................................................................................................................................. (425,639) 18,747
Net assets attributable to redeemable participating shareholders
Beginning of period ...................................................................................................................................... 425,639 414,247
End of period ................................................................................................................................................ - 432,994
* The Fund ceased trading on 7 August 2015.
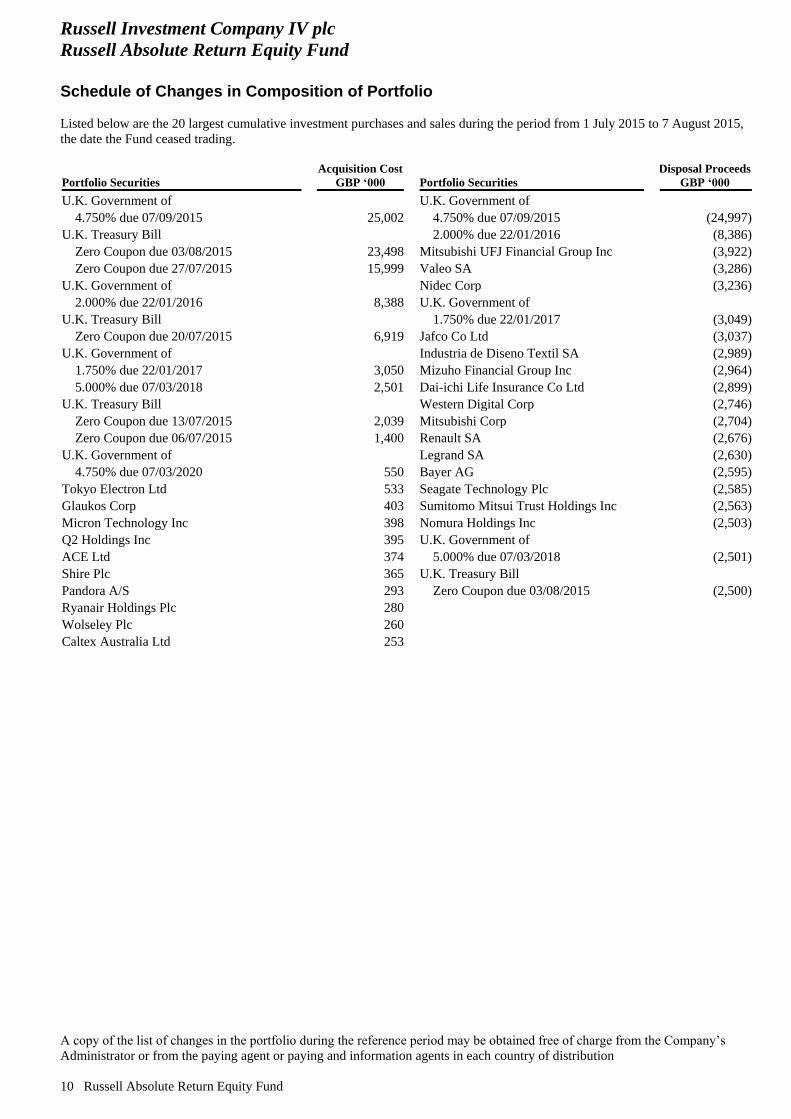
Russell Investment Company IV plc
Russell Absolute Return Equity Fund
Schedule of Changes in Composition of Portfolio
Listed below are the 20 largest cumulative investment purchases and sales during the period from 1 July 2015 to 7 August 2015,
the date the Fund ceased trading.
A copy of the list of changes in the portfolio during the reference period may be obtained free of charge from the Company’s
Administrator or from the paying agent or paying and information agents in each country of distribution
10 Russell Absolute Return Equity Fund
Portfolio Securities
Acquisition Cost
GBP ‘000 Portfolio Securities
Disposal Proceeds
GBP ‘000
U.K. Government of U.K. Government of
4.750% due 07/09/2015 25,002 4.750% due 07/09/2015 (24,997)
U.K. Treasury Bill 2.000% due 22/01/2016 (8,386)
Zero Coupon due 03/08/2015 23,498 Mitsubishi UFJ Financial Group Inc (3,922)
Zero Coupon due 27/07/2015 15,999 Valeo SA (3,286)
U.K. Government of Nidec Corp (3,236)
2.000% due 22/01/2016 8,388 U.K. Government of
U.K. Treasury Bill 1.750% due 22/01/2017 (3,049)
Zero Coupon due 20/07/2015 6,919 Jafco Co Ltd (3,037)
U.K. Government of Industria de Diseno Textil SA (2,989)
1.750% due 22/01/2017 3,050 Mizuho Financial Group Inc (2,964)
5.000% due 07/03/2018 2,501 Dai-ichi Life Insurance Co Ltd (2,899)
U.K. Treasury Bill Western Digital Corp (2,746)
Zero Coupon due 13/07/2015 2,039 Mitsubishi Corp (2,704)
Zero Coupon due 06/07/2015 1,400 Renault SA (2,676)
U.K. Government of Legrand SA (2,630)
4.750% due 07/03/2020 550 Bayer AG (2,595)
Tokyo Electron Ltd 533 Seagate Technology Plc (2,585)
Glaukos Corp 403 Sumitomo Mitsui Trust Holdings Inc (2,563)
Micron Technology Inc 398 Nomura Holdings Inc (2,503)
Q2 Holdings Inc 395 U.K. Government of
ACE Ltd 374 5.000% due 07/03/2018 (2,501)
Shire Plc 365 U.K. Treasury Bill
Pandora A/S 293 Zero Coupon due 03/08/2015 (2,500)
Ryanair Holdings Plc 280
Wolseley Plc 260
Caltex Australia Ltd 253
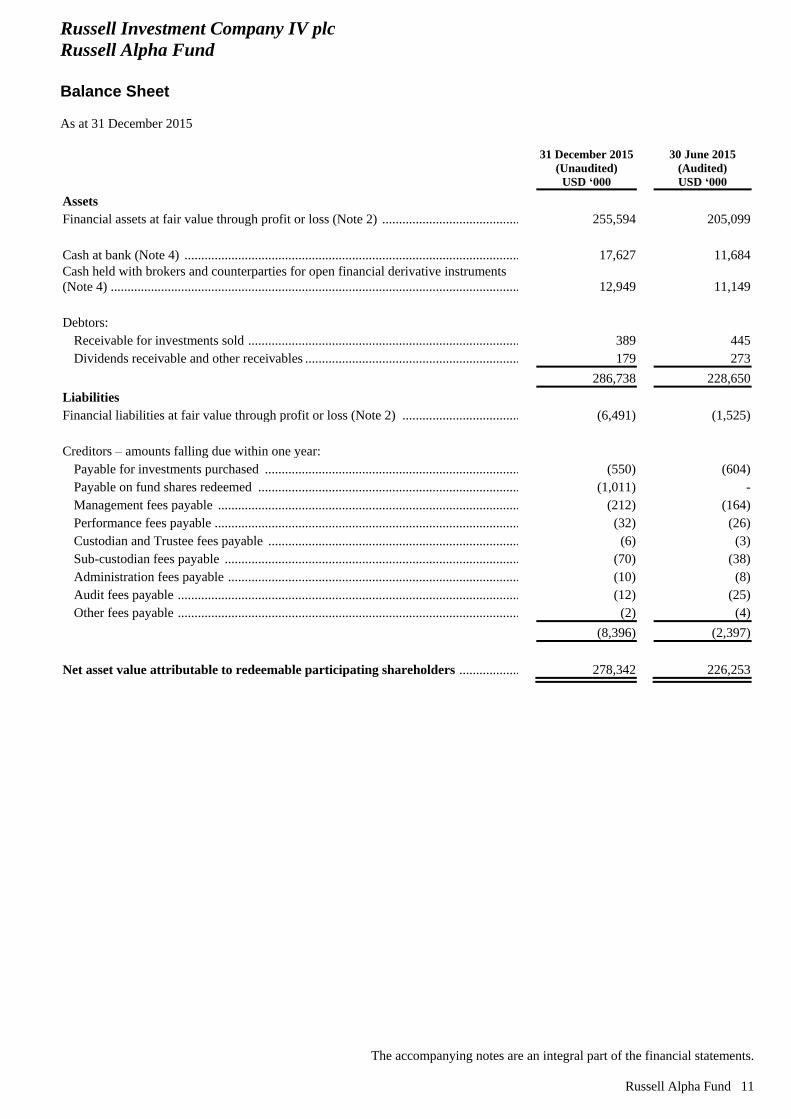
Russell Investment Company IV plc
Russell Alpha Fund
Balance Sheet
As at 31 December 2015
The accompanying notes are an integral part of the financial statements.
Russell Alpha Fund 11
31 December 2015
(Unaudited)
USD ‘000
30 June 2015
(Audited)
USD ‘000
Assets
Financial assets at fair value through profit or loss (Note 2) ................................................ 255,594 205,099
Cash at bank (Note 4) ........................................................................................................... 17,627 11,684
Cash held with brokers and counterparties for open financial derivative instruments
(Note 4) ................................................................................................................................. 12,949 11,149
Debtors:
Receivable for investments sold .......................................................................................... 389 445
Dividends receivable and other receivables ......................................................................... 179 273
286,738 228,650
Liabilities
Financial liabilities at fair value through profit or loss (Note 2) ...................................... (6,491) (1,525)
Creditors – amounts falling due within one year:
Payable for investments purchased ..................................................................................... (550) (604)
Payable on fund shares redeemed ....................................................................................... (1,011) -
Management fees payable ................................................................................................... (212) (164)
Performance fees payable .................................................................................................... (32) (26)
Custodian and Trustee fees payable .................................................................................... (6) (3)
Sub-custodian fees payable ................................................................................................. (70) (38)
Administration fees payable ................................................................................................ (10) (8)
Audit fees payable ............................................................................................................... (12) (25)
Other fees payable ............................................................................................................... (2) (4)
(8,396) (2,397)
Net asset value attributable to redeemable participating shareholders ......................... 278,342 226,253
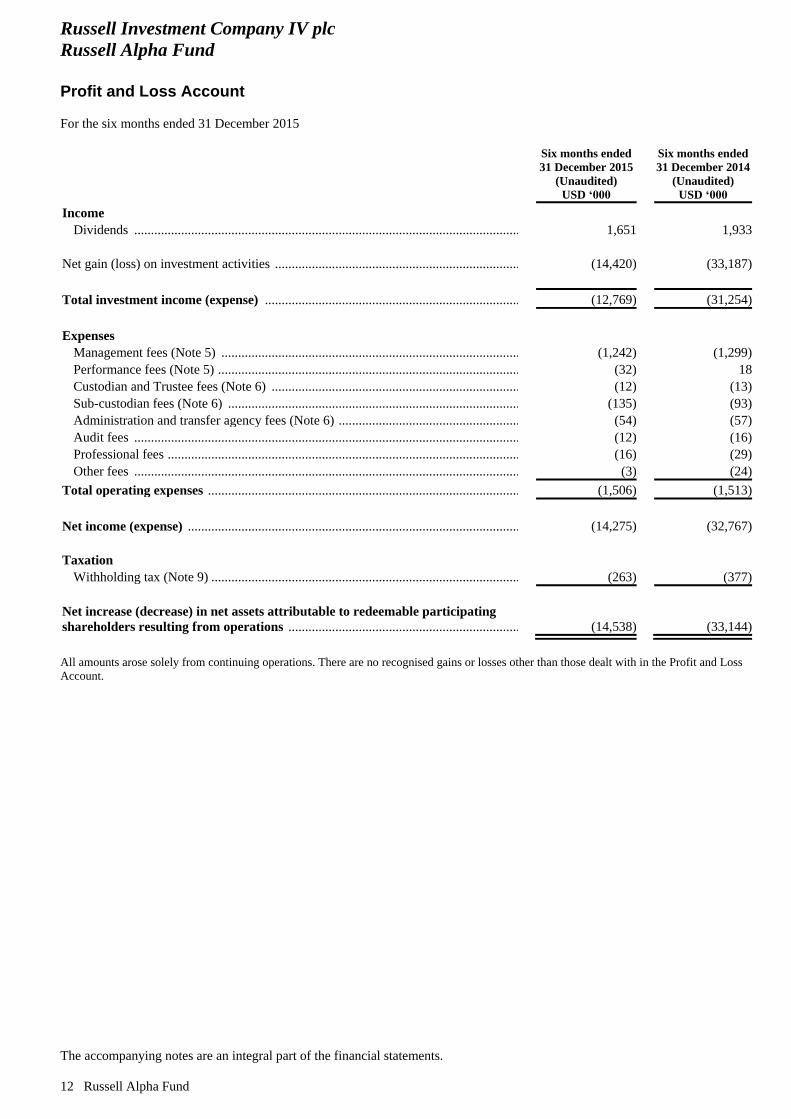
Russell Investment Company IV plc
Russell Alpha Fund
Profit and Loss Account
For the six months ended 31 December 2015
The accompanying notes are an integral part of the financial statements.
12 Russell Alpha Fund
Six months ended
31 December 2015
(Unaudited)
USD ‘000
Six months ended
31 December 2014
(Unaudited)
USD ‘000
Income
Dividends ............................................................................................................................ 1,651 1,933
Net gain (loss) on investment activities ................................................................................ (14,420) (33,187)
Total investment income (expense) ................................................................................... (12,769) (31,254)
Expenses
Management fees (Note 5) .................................................................................................. (1,242) (1,299)
Performance fees (Note 5) ................................................................................................... (32) 18
Custodian and Trustee fees (Note 6) ................................................................................... (12) (13)
Sub-custodian fees (Note 6) ................................................................................................ (135) (93)
Administration and transfer agency fees (Note 6) ............................................................... (54) (57)
Audit fees ............................................................................................................................ (12) (16)
Professional fees .................................................................................................................. (16) (29)
Other fees ............................................................................................................................ (3) (24)
Total operating expenses .................................................................................................... (1,506) (1,513)
Net income (expense) .......................................................................................................... (14,275) (32,767)
Taxation
Withholding tax (Note 9) ..................................................................................................... (263) (377)
Net increase (decrease) in net assets attributable to redeemable participating
shareholders resulting from operations ............................................................................ (14,538) (33,144)
All amounts arose solely from continuing operations. There are no recognised gains or losses other than those dealt with in the Profit and Loss
Account.

Russell Investment Company IV plc
Russell Alpha Fund
Statement of Changes in Net Assets Attributable to Redeemable Participating Shareholders
For the six months ended 31 December 2015
The accompanying notes are an integral part of the financial statements.
Russell Alpha Fund 13
Six months ended
31 December 2015
(Unaudited)
USD ‘000
Six months ended
31 December 2014
(Unaudited)
USD ‘000
Net increase (decrease) in net assets attributable to redeemable participating
shareholders resulting from operations .................................................................................... (14,538) (33,144)
Share transactions
Net increase (decrease) in net assets resulting from redeemable participating share
transactions (Note 10) ......................................................................................................... 66,627 (14,435)
Total net increase (decrease) in net assets attributable to redeemable
participating shareholders ......................................................................................................... 52,089 (47,579)
Net assets attributable to redeemable participating shareholders
Beginning of period ............................................................................................................. 226,253 311,336
End of period ....................................................................................................................... 278,342 263,757

Russell Investment Company IV plc
Russell Alpha Fund
Schedule of Investments
31 December 2015
The accompanying notes are an integral part of the financial statements.
14 Russell Alpha Fund
Number
of Shares
Fair Value
USD ‘000
Fund
%
Transferable Securities (80.33%)
Common Stock (78.29%)
Australia (0.24%)
Metals and Mining
69,491 Newcrest Mining Ltd .......... 656 0.24
Austria (0.02%)
Real Estate
29,720 Immofinanz AG .................. 68 0.02
Belgium (0.25%)
Pharmaceuticals
7,587 UCB SA .............................. 686 0.25
Bermuda (0.94%)
Banks
6,597 Credicorp Ltd ...................... 642 0.23
Chemicals
875,181
Huabao International
Holdings Ltd ....................... 320 0.11
Diversified Financials
7,000 Guoco Group Ltd ................ 77 0.03
Food Products
931,000
China Yurun Food Group
Ltd ....................................... 198 0.07
Gas Utilities
278,470
China Resources Gas Group
Ltd ....................................... 830 0.30
Insurance
31,600 Maiden Holdings Ltd .......... 471 0.17
Transport
11,471
Tsakos Energy Navigation
Ltd ....................................... 91 0.03
2,629 0.94
Brazil (0.42%)
Agriculture
26,300 SLC Agricola SA ................ 109 0.04
Commercial Services and Supplies
65,079 Cielo SA .............................. 553 0.20
Electric Utilities
27,400
Centrais Eletricas Brasileiras
SA ....................................... 40 0.01
Insurance
75,546
BB Seguridade Participacoes
SA ....................................... 465 0.17
1,167 0.42
Canada (2.27%)
Advertising
30,220 MDC Partners Inc ............... 656 0.24
Beverages
67,641 Cott Corp ............................. 743 0.27
Number
of Shares
Fair Value
USD ‘000
Fund
%
Diversified Financials
21,100 Dundee Corp ....................... 69 0.03
280,814 Sprott Inc ............................ 481 0.17
Metals and Mining
59,346 Barrick Gold Corp .............. 438 0.16
54,028 Cameco Corp ...................... 666 0.24
83,300
Dundee Precious Metals
Inc ....................................... 77 0.03
16,577 Goldcorp Inc ....................... 192 0.07
310,700 Ivanhoe Mines Ltd .............. 136 0.05
256,164 Kinross Gold Corp .............. 466 0.17
37,184 New Gold Inc ...................... 86 0.03
66,998 Novagold Resources Inc ..... 282 0.10
35,319
Silver Standard Resources
Inc ....................................... 183 0.06
11,740 Silver Wheaton Corp .......... 146 0.05
18,071 Tahoe Resources Inc ........... 156 0.05
84,262
Turquoise Hill Resources
Ltd ...................................... 214 0.08
Oil and Gas
20,769 MEG Energy Corp .............. 120 0.04
Other Finance
93,898
Uranium Participation
Corp .................................... 347 0.12
Transport
15,425
Canadian National Railway
Co ....................................... 862 0.31
6,320 2.27
Cayman Islands (0.48%)
Real Estate
76,762
China Overseas Property
Holdings Ltd ....................... 12 0.01
Semiconductor Equipment and Products
95,467
ASM Pacific Technology
Ltd ...................................... 751 0.27
Software
3,116 NetEase Inc (ADR) ............. 565 0.20
1,328 0.48
Chile (0.24%)
Chemicals
3,610
Sociedad Quimica y Minera
de Chile SA (ADR) ............. 69 0.03
Electric Utilities
2,449,188 Enersis SA .......................... 591 0.21
660 0.24
China (0.22%)
Building Products
153,106
Anhui Conch Cement Co
Ltd ...................................... 412 0.15
Transport
420,000
Guangshen Railway Co
Ltd ...................................... 210 0.07
622 0.22

Russell Investment Company IV plc
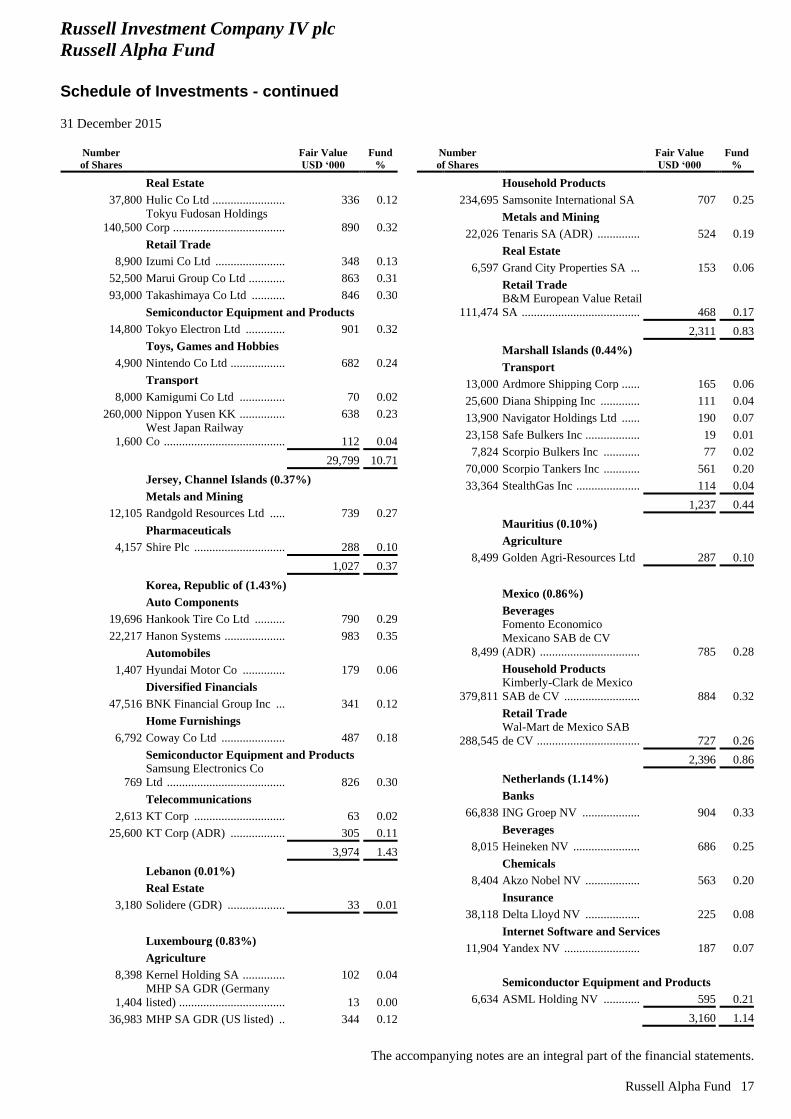
Russell Alpha Fund
Schedule of Investments - continued
31 December 2015
The accompanying notes are an integral part of the financial statements.
Russell Alpha Fund 15
Number
of Shares
Fair Value
USD ‘000
Fund
%
Denmark (0.84%)
Beverages
277 Carlsberg A/S ...................... 25 0.01
Health Care Equipment and Supplies
7,883 Coloplast A/S ...................... 639 0.23
Pharmaceuticals
16,251 Novo Nordisk A/S ............... 946 0.34
Retail Trade
5,665 Pandora A/S ........................ 719 0.26
2,329 0.84
Egypt (0.29%)
Banks
168,532
Commercial International
Bank Egypt SAE ................. 818 0.29
Finland (0.29%)
Telecommunications
113,595 Nokia OYJ ........................... 814 0.29
France (5.18%)
Aerospace and Defence
4,621 Thales SA ............................ 347 0.12
Auto Components
4,112 Faurecia ............................... 165 0.06
16,016 Valeo SA ............................. 2,480 0.89
Automobiles
95,497 Peugeot SA .......................... 1,681 0.61
19,173 Renault SA .......................... 1,929 0.69
Biotechnology
863 Genfit .................................. 31 0.01
Commercial Services and Supplies
2,649 Edenred ............................... 50 0.02
9,647 Elis SA ................................ 160 0.06
Computers and Peripherals
4,540 Cap Gemini SA ................... 422 0.15
Construction and Engineering
11,198 Eiffage SA ........................... 724 0.26
Electric Utilities
31,663 Electricite de France SA ...... 467 0.17
Electrical Equipment
36,019 Legrand SA ......................... 2,042 0.73
Food Products
19,769 Carrefour SA ....................... 572 0.20
13,457 Danone SA .......................... 910 0.33
5,687 Sodexo SA ........................... 557 0.20
Machinery
2,936 Alstom SA ........................... 90 0.03
23,899 Areva SA ............................. 141 0.05
Real Estate Investment Trust
395 Gecina SA ........................... 48 0.02
Number
of Shares
Fair Value
USD ‘000
Fund
%
Textile and Apparel
5,787
LVMH Moet Hennessy
Louis Vuitton SE ................ 911 0.33
Water Utilities
28,920 Veolia Environnement SA .. 687 0.25
14,414 5.18
Germany (2.78%)
Auto Components
294 Rheinmetall AG .................. 20 0.01
Chemicals
6,781 Linde AG ............................ 986 0.35
Commercial Services and Supplies
40,204 Wirecard AG ....................... 2,031 0.73
Diversified Financials
8,837 Deutsche Boerse AG ........... 781 0.28
Health Care Providers and Services
11,212 Fresenius SE & Co KGaA .. 803 0.29
Media
8,229 ProSiebenSat.1 Media SE ... 418 0.15
Pharmaceuticals
11,984 Bayer AG ............................ 1,508 0.54
Semiconductor Equipment and Products
7,440 Infineon Technologies AG .. 109 0.04
Telecommunications
6,139 Drillisch AG ....................... 261 0.09
Textile and Apparel
8,486 Adidas AG .......................... 829 0.30
7,746 2.78
Guernsey, Channel Islands (0.03%)
Real Estate
54,070 Etalon Group Ltd (GDR) .... 97 0.03
Hong Kong (1.42%)
Banks
229,898
BOC Hong Kong Holdings
Ltd ...................................... 702 0.25
Computers and Peripherals
641,578 Lenovo Group Ltd .............. 651 0.23
Holding Companies - Diversified Operations
87,239 Wharf Holdings Ltd ............ 486 0.17
Insurance
154,143 AIA Group Ltd ................... 927 0.33
Oil and Gas
333,494 Cnooc Ltd ........................... 347 0.13
Real Estate
230,288
China Overseas Land &
Investment Ltd .................... 805 0.29
Semiconductor Equipment and Products
48,000
Hua Hong Semiconductor
Ltd ...................................... 47 0.02
3,965 1.42

Russell Investment Company IV plc
Russell Alpha Fund
Schedule of Investments - continued
31 December 2015
The accompanying notes are an integral part of the financial statements.
16 Russell Alpha Fund
Number
of Shares
Fair Value
USD ‘000
Fund
%
India (0.51%)
Banks
20,184 Axis Bank Ltd ..................... 137 0.05
Oil and Gas
29,696
Reliance Industries Ltd
(GDR) ................................. 909 0.33
Software
28,029 HCL Technologies Ltd ........ 364 0.13
1,410 0.51
Indonesia (0.82%)
Banks
1,081,791
Bank Mandiri Persero Tbk
PT ........................................ 726 0.26
Gas Utilities
3,105,687
Perusahaan Gas Negara
Persero Tbk PT .................... 618 0.22
Telecommunications
4,156,027
Telekomunikasi Indonesia
Persero Tbk PT .................... 936 0.34
2,280 0.82
Ireland (2.58%)
Airlines
115,958 Ryanair Holdings Plc .......... 1,891 0.68
Building Products
5,078 Kingspan Group Plc ............ 134 0.05
Computers and Peripherals
12,816 Accenture Plc ...................... 1,339 0.48
22,083 Seagate Technology Plc ...... 810 0.29
Food Products
15,081 Glanbia Plc .......................... 278 0.10
6,586 Kerry Group Plc .................. 546 0.19
Health Care Equipment and Supplies
15,353 Medtronic Plc ...................... 1,181 0.43
38,500 Trinity Biotech Plc (ADR) .. 453 0.16
Miscellaneous Manufacturers
10,588 Eaton Corp Plc .................... 551 0.20
7,183 2.58
Israel (0.05%)
Electrical Equipment
26,400 SuperCom Ltd ..................... 138 0.05
Italy (0.44%)
Banks
293,124
Banca Monte dei Paschi di
Siena SpA ............................ 392 0.14
101,843 UniCredit SpA ..................... 568 0.20
Electric Utilities
7,449 ERG SpA ............................. 101 0.04
Internet Software and Services
4,434
Yoox Net-A-Porter Group
SpA ..................................... 166 0.06
1,227 0.44
Number
of Shares
Fair Value
USD ‘000
Fund
%
Japan (10.71%)
Banks
203,100
Mitsubishi UFJ Financial
Group Inc ............................ 1,278 0.46
833,600
Mizuho Financial Group
Inc ....................................... 1,687 0.60
332,000
Sumitomo Mitsui Trust
Holdings Inc ....................... 1,272 0.46
Building Products
45,400 LIXIL Group Corp .............. 1,019 0.37
Chemicals
125,000 Asahi Kasei Corp ................ 855 0.31
Computers and Peripherals
6,300
Japan Digital Laboratory Co
Ltd ...................................... 86 0.03
Distributors
68,800 Mitsubishi Corp .................. 1,160 0.42
40,800 Mitsui & Co Ltd .................. 490 0.17
Diversified Financials
212,400 Nomura Holdings Inc ......... 1,199 0.43
94,500 ORIX Corp ......................... 1,348 0.49
Electric Utilities
56,700
Kansai Electric Power Co
Inc ....................................... 688 0.25
Electrical Equipment
20,500 Nidec Corp .......................... 1,506 0.54
Environmental Control
11,300
Kurita Water Industries
Ltd ...................................... 239 0.09
Hand and Machine Tools
18,100 Makita Corp ........................ 1,058 0.38
Health Care Providers and Services
12,800 Miraca Holdings Inc ........... 569 0.20
Home Builders
27,400
Daiwa House Industry Co
Ltd ...................................... 798 0.29
Insurance
87,700
Dai-ichi Life Insurance Co
Ltd ...................................... 1,484 0.53
Iron and Steel
133,000 Japan Steel Works Ltd ........ 472 0.17
46,600
Nippon Steel & Sumitomo
Metal Corp .......................... 936 0.34
Machinery
52,300 Amada Holdings Co Ltd ..... 506 0.18
5,000 Fanuc Corp ......................... 876 0.32
161,000 Hitachi Ltd .......................... 925 0.33
56,700 Komatsu Ltd ....................... 939 0.34
Office Electronics
20,100 Canon Inc ............................ 614 0.22
61,600 Ricoh Co Ltd ...................... 641 0.23
Other Finance
37,100 Jafco Co Ltd ........................ 1,468 0.53
Russell Investment Company IV plc
Russell Alpha Fund
Schedule of Investments - continued
31 December 2015
The accompanying notes are an integral part of the financial statements.
Russell Alpha Fund 17
Number
of Shares
Fair Value
USD ‘000
Fund
%
Real Estate
37,800 Hulic Co Ltd ........................ 336 0.12
140,500
Tokyu Fudosan Holdings
Corp ..................................... 890 0.32
Retail Trade
8,900 Izumi Co Ltd ....................... 348 0.13
52,500 Marui Group Co Ltd ............ 863 0.31
93,000 Takashimaya Co Ltd ........... 846 0.30
Semiconductor Equipment and Products
14,800 Tokyo Electron Ltd ............. 901 0.32
Toys, Games and Hobbies
4,900 Nintendo Co Ltd .................. 682 0.24
Transport
8,000 Kamigumi Co Ltd ............... 70 0.02
260,000 Nippon Yusen KK ............... 638 0.23
1,600
West Japan Railway
Co ........................................ 112 0.04
29,799 10.71
Jersey, Channel Islands (0.37%)
Metals and Mining
12,105 Randgold Resources Ltd ..... 739 0.27
Pharmaceuticals
4,157 Shire Plc .............................. 288 0.10
1,027 0.37
Korea, Republic of (1.43%)
Auto Components
19,696 Hankook Tire Co Ltd .......... 790 0.29
22,217 Hanon Systems .................... 983 0.35
Automobiles
1,407 Hyundai Motor Co .............. 179 0.06
Diversified Financials
47,516 BNK Financial Group Inc ... 341 0.12
Home Furnishings
6,792 Coway Co Ltd ..................... 487 0.18
Semiconductor Equipment and Products
769
Samsung Electronics Co
Ltd ....................................... 826 0.30
Telecommunications
2,613 KT Corp .............................. 63 0.02
25,600 KT Corp (ADR) .................. 305 0.11
3,974 1.43
Lebanon (0.01%)
Real Estate
3,180 Solidere (GDR) ................... 33 0.01
Luxembourg (0.83%)
Agriculture
8,398 Kernel Holding SA .............. 102 0.04
1,404
MHP SA GDR (Germany
listed) ................................... 13 0.00
36,983 MHP SA GDR (US listed) .. 344 0.12
Number
of Shares
Fair Value
USD ‘000
Fund
%
Household Products
234,695 Samsonite International SA 707 0.25
Metals and Mining
22,026 Tenaris SA (ADR) .............. 524 0.19
Real Estate
6,597 Grand City Properties SA ... 153 0.06
Retail Trade
111,474
B&M European Value Retail
SA ....................................... 468 0.17
2,311 0.83
Marshall Islands (0.44%)
Transport
13,000 Ardmore Shipping Corp ...... 165 0.06
25,600 Diana Shipping Inc ............. 111 0.04
13,900 Navigator Holdings Ltd ...... 190 0.07
23,158 Safe Bulkers Inc .................. 19 0.01
7,824 Scorpio Bulkers Inc ............ 77 0.02
70,000 Scorpio Tankers Inc ............ 561 0.20
33,364 StealthGas Inc ..................... 114 0.04
1,237 0.44
Mauritius (0.10%)
Agriculture
8,499 Golden Agri-Resources Ltd 287 0.10
Mexico (0.86%)
Beverages
8,499
Fomento Economico
Mexicano SAB de CV
(ADR) ................................. 785 0.28
Household Products
379,811
Kimberly-Clark de Mexico
SAB de CV ......................... 884 0.32
Retail Trade
288,545
Wal-Mart de Mexico SAB
de CV .................................. 727 0.26
2,396 0.86
Netherlands (1.14%)
Banks
66,838 ING Groep NV ................... 904 0.33
Beverages
8,015 Heineken NV ...................... 686 0.25
Chemicals
8,404 Akzo Nobel NV .................. 563 0.20
Insurance
38,118 Delta Lloyd NV .................. 225 0.08
Internet Software and Services
11,904 Yandex NV ......................... 187 0.07
Semiconductor Equipment and Products
6,634 ASML Holding NV ............ 595 0.21
3,160 1.14
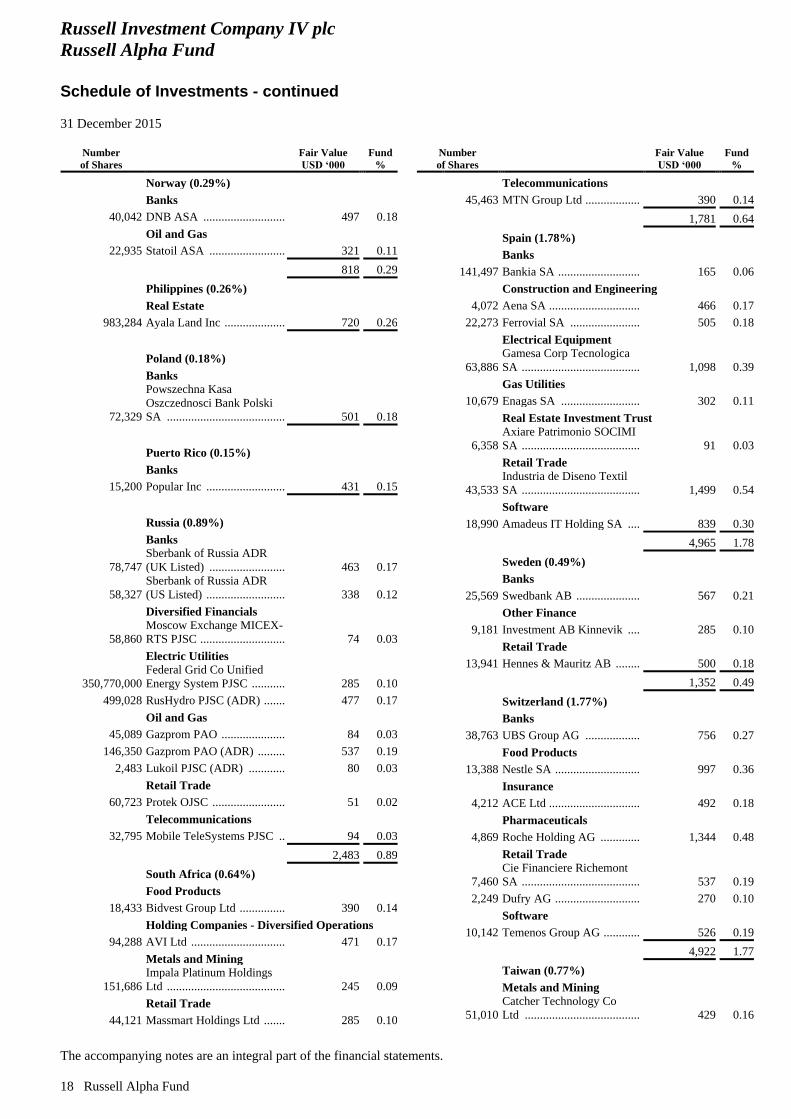
Russell Investment Company IV plc
Russell Alpha Fund
Schedule of Investments - continued
31 December 2015
The accompanying notes are an integral part of the financial statements.
18 Russell Alpha Fund
Number
of Shares
Fair Value
USD ‘000
Fund
%
Norway (0.29%)
Banks
40,042 DNB ASA ........................... 497 0.18
Oil and Gas
22,935 Statoil ASA ......................... 321 0.11
818 0.29
Philippines (0.26%)
Real Estate
983,284 Ayala Land Inc .................... 720 0.26
Poland (0.18%)
Banks
72,329
Powszechna Kasa
Oszczednosci Bank Polski
SA ....................................... 501 0.18
Puerto Rico (0.15%)
Banks
15,200 Popular Inc .......................... 431 0.15
Russia (0.89%)
Banks
78,747
Sberbank of Russia ADR
(UK Listed) ......................... 463 0.17
58,327
Sberbank of Russia ADR
(US Listed) .......................... 338 0.12
Diversified Financials
58,860
Moscow Exchange MICEX-
RTS PJSC ............................ 74 0.03
Electric Utilities
350,770,000
Federal Grid Co Unified
Energy System PJSC ........... 285 0.10
499,028 RusHydro PJSC (ADR) ....... 477 0.17
Oil and Gas
45,089 Gazprom PAO ..................... 84 0.03
146,350 Gazprom PAO (ADR) ......... 537 0.19
2,483 Lukoil PJSC (ADR) ............ 80 0.03
Retail Trade
60,723 Protek OJSC ........................ 51 0.02
Telecommunications
32,795 Mobile TeleSystems PJSC .. 94 0.03
2,483 0.89
South Africa (0.64%)
Food Products
18,433 Bidvest Group Ltd ............... 390 0.14
Holding Companies - Diversified Operations
94,288 AVI Ltd ............................... 471 0.17
Metals and Mining
151,686
Impala Platinum Holdings
Ltd ....................................... 245 0.09
Retail Trade
44,121 Massmart Holdings Ltd ....... 285 0.10
Number
of Shares
Fair Value
USD ‘000
Fund
%
Telecommunications
45,463 MTN Group Ltd .................. 390 0.14
1,781 0.64
Spain (1.78%)
Banks
141,497 Bankia SA ........................... 165 0.06
Construction and Engineering
4,072 Aena SA .............................. 466 0.17
22,273 Ferrovial SA ....................... 505 0.18
Electrical Equipment
63,886
Gamesa Corp Tecnologica
SA ....................................... 1,098 0.39
Gas Utilities
10,679 Enagas SA .......................... 302 0.11
Real Estate Investment Trust
6,358
Axiare Patrimonio SOCIMI
SA ....................................... 91 0.03
Retail Trade
43,533
Industria de Diseno Textil
SA ....................................... 1,499 0.54
Software
18,990 Amadeus IT Holding SA .... 839 0.30
4,965 1.78
Sweden (0.49%)
Banks
25,569 Swedbank AB ..................... 567 0.21
Other Finance
9,181 Investment AB Kinnevik .... 285 0.10
Retail Trade
13,941 Hennes & Mauritz AB ........ 500 0.18
1,352 0.49
Switzerland (1.77%)
Banks
38,763 UBS Group AG .................. 756 0.27
Food Products
13,388 Nestle SA ............................ 997 0.36
Insurance
4,212 ACE Ltd .............................. 492 0.18
Pharmaceuticals
4,869 Roche Holding AG ............. 1,344 0.48
Retail Trade
7,460
Cie Financiere Richemont
SA ....................................... 537 0.19
2,249 Dufry AG ............................ 270 0.10
Software
10,142 Temenos Group AG ............ 526 0.19
4,922 1.77
Taiwan (0.77%)
Metals and Mining
51,010
Catcher Technology Co
Ltd ...................................... 429 0.16

Russell Investment Company IV plc
Russell Alpha Fund
Schedule of Investments - continued
31 December 2015
The accompanying notes are an integral part of the financial statements.
Russell Alpha Fund 19
Number
of Shares
Fair Value
USD ‘000
Fund
%
Miscellaneous Manufacturers
7,794 Largan Precision Co Ltd ...... 539 0.19
Semiconductor Equipment and Products
267,506
Taiwan Semiconductor
Manufacturing Co Ltd ......... 1,165 0.42
2,133 0.77
Thailand (0.91%)
Banks
140,976 Kasikornbank Pcl (NVDR) . 590 0.21
Food Products
1,716,707 Thai Union Group PCL ....... 821 0.30
Holding Companies - Diversified Operations
60,073 Siam Cement Pcl (NVDR) .. 768 0.28
Oil and Gas
217,597
PTT Exploration &
Production PCL ................... 346 0.12
2,525 0.91
Turkey (0.89%)
Construction and Engineering
363,747 Enka Insaat ve Sanayi AS ... 563 0.20
80,323
TAV Havalimanlari Holding
AS ....................................... 501 0.18
Metals and Mining
64,503 Koza Altin Isletmeleri AS ... 271 0.10
Oil and Gas
21,943
Tupras Turkiye Petrol
Rafinerileri AS .................... 523 0.19
Real Estate
681,436
Emlak Konut Gayrimenkul
Yatirim Ortakligi AS ........... 607 0.22
2,465 0.89
United Kingdom (4.45%)
Aerospace and Defence
3,262 BAE Systems Plc ................ 24 0.01
Agriculture
3,427
British American Tobacco
Plc ....................................... 190 0.07
Banks
17,451 Shawbrook Group Plc ......... 90 0.03
Beverages
30,842 Diageo Plc ........................... 844 0.31
12,211 SABMiller Plc ..................... 732 0.26
Diversified Financials
10,365 Provident Financial Plc ....... 514 0.18
13,794 Schroders Plc ....................... 605 0.22
105,895 Worldpay Group Plc ............ 480 0.17
Entertainment
42,428 Merlin Entertainments Plc ... 285 0.10
Home Builders
88,733 Barratt Developments Plc .... 819 0.30
20,492 Persimmon Plc .................... 612 0.22
113,157 Taylor Wimpey Plc ............. 339 0.12
Number
of Shares
Fair Value
USD ‘000
Fund
%
Home Furnishings
33,786
Howden Joinery Group
Plc ....................................... 262 0.09
Household Products
17,371
Reckitt Benckiser Group
Plc ....................................... 1,608 0.58
Internet Software and Services
40,937 Just Eat Plc .......................... 298 0.11
Media
442
Liberty Global Plc (Non-
Voting Rights) .................... 18 0.01
14,660
Liberty Global Plc (Voting
Rights) ................................ 621 0.22
Oil and Gas
36,307 BG Group Plc ..................... 527 0.19
Pharmaceuticals
45,226 GlaxoSmithKline Plc .......... 915 0.33
Real Estate Investment Trust
4,184 Great Portland Estates Plc ... 51 0.02
Retail Trade
83,298
Sports Direct International
Plc ....................................... 708 0.25
Semiconductor Equipment and Products
44,054 ARM Holdings Plc ............. 675 0.24
Telecommunications
127,809
TalkTalk Telecom Group
Plc ....................................... 410 0.15
228,961 Vodafone Group Plc ........... 746 0.27
12,373 4.45
United States (28.62%)
Aerospace and Defence
3,749
United Technologies
Corp .................................... 360 0.13
Agriculture
15,400 Cadiz Inc ............................. 81 0.03
Airlines
13,923 SkyWest Inc ........................ 265 0.10
Auto Components
14,102
Metaldyne Performance
Group Inc ............................ 259 0.09
Banks
17,900
Central Pacific Financial
Corp .................................... 394 0.14
15,038 Citigroup Inc ....................... 778 0.28
22,900 Customers Bancorp Inc ....... 623 0.23
5,170 First Foundation Inc ............ 122 0.04
25,500 Fulton Financial Corp ......... 332 0.12
11,700 Kearny Financial Corp ........ 148 0.05
26,300
State Bank Financial
Corp .................................... 553 0.20
15,215 State Street Corp ................. 1,010 0.36
18,200
United Community Banks
Inc/GA ................................ 355 0.13
14,000 Yadkin Financial Corp ........ 352 0.13

Russell Investment Company IV plc
Russell Alpha Fund
Schedule of Investments - continued
31 December 2015
The accompanying notes are an integral part of the financial statements.
20 Russell Alpha Fund
Number
of Shares
Fair Value
USD ‘000
Fund
%
Biotechnology
3,348 Bio-Rad Laboratories Inc .... 464 0.17
Building Products
5,521 Apogee Enterprises Inc ....... 240 0.09
4,369 Trex Co Inc ......................... 166 0.06
Chemicals
15,440 Dow Chemical Co ............... 795 0.28
32,850 Landec Corp ........................ 389 0.14
5,398 Praxair Inc ........................... 553 0.20
14,061 Univar Inc ........................... 239 0.09
Commercial Services and Supplies
15,512
AMN Healthcare Services
Inc ....................................... 482 0.17
45,600
ARC Document Solutions
Inc ....................................... 202 0.07
3,442 CoStar Group Inc ................ 711 0.26
23,743
Cross Country Healthcare
Inc ....................................... 389 0.14
149,900
Great Lakes Dredge & Dock
Corp ..................................... 594 0.21
24,032 HealthEquity Inc ................. 602 0.22
19,178 ICF International Inc ........... 682 0.25
3,800 Landauer Inc ....................... 125 0.04
8,200
Matthews International
Corp ..................................... 438 0.16
17,212 Paylocity Holding Corp ....... 698 0.25
Computers and Peripherals
1,930 Apple Inc ............................. 203 0.07
69,700 Ciber Inc .............................. 245 0.09
10,300
Computer Task Group
Inc ....................................... 68 0.02
40,302 EMC Corp ........................... 1,035 0.37
5,300 Engility Holdings Inc .......... 172 0.06
11,373 EPAM Systems Inc ............. 894 0.32
13,115 Fortinet Inc .......................... 409 0.15
30,100 KEYW Holding Corp .......... 181 0.07
10,573
Manhattan Associates
Inc ....................................... 700 0.25
6,000 Mercury Systems Inc ........... 110 0.04
18,033 Virtusa Corp ........................ 745 0.27
17,842 Western Digital Corp .......... 1,071 0.39
Construction and Engineering
14,782 KBR Inc .............................. 250 0.09
56,000 Orion Marine Group Inc ...... 234 0.09
10,127 Primoris Services Corp ........ 223 0.08
18,700 Tutor Perini Corp ................ 313 0.11
Distributors
25,700 Libbey Inc ........................... 548 0.20
20,000 Titan Machinery Inc ............ 219 0.08
Diversified Financials
11,734
Discover Financial
Services ............................... 629 0.22
10,557 Ellie Mae Inc ....................... 636 0.23
Number
of Shares
Fair Value
USD ‘000
Fund
%
15,100 FBR & Co ........................... 300 0.11
19,000 FNFV Group ....................... 213 0.08
7,862
MarketAxess Holdings
Inc ....................................... 877 0.31
7,331 PRA Group Inc ................... 254 0.09
9,370 Synchrony Financial ........... 285 0.10
17,489 Visa Inc ............................... 1,356 0.49
Electric Utilities
3,700 Allete Inc ............................ 188 0.07
4,900
Empire District Electric
Co ....................................... 138 0.05
5,300 PNM Resources Inc ............ 162 0.06
6,200
Portland General Electric
Co ....................................... 225 0.08
Electrical Equipment
56,525 Corning Inc ......................... 1,033 0.37
6,000 Generac Holdings Inc ......... 179 0.07
11,818
Honeywell International
Inc ....................................... 1,224 0.44
5,852 Waters Corp ........................ 788 0.28
Energy Equipment and Services
59,250 Pacific Ethanol Inc .............. 283 0.10
Entertainment
21,840 Carmike Cinemas Inc ......... 501 0.18
Environmental Control
10,200 Covanta Holding Corp ........ 158 0.06
Food Products
14,003
Amplify Snack Brands
Inc ....................................... 161 0.06
5,950 Pilgrim's Pride Corp ............ 131 0.05
17,920 Pinnacle Foods Inc .............. 761 0.27
3,350 Tyson Foods Inc ................. 179 0.06
Gas Utilities
5,059
Chesapeake Utilities
Corp .................................... 287 0.10
Hand and Machine Tools
12,046 Milacron Holdings Corp ..... 151 0.05
Health Care Equipment and Supplies
9,015 ABIOMED Inc ................... 814 0.29
104,000 Accuray Inc ......................... 702 0.25
20,863 Affymetrix Inc .................... 211 0.08
2,200 Alere Inc ............................. 86 0.03
29,564 AtriCure Inc ........................ 663 0.24
25,977 Glaukos Corp ...................... 641 0.23
9,380 Inogen Inc ........................... 376 0.14
23,007 K2M Group Holdings Inc ... 454 0.16
9,968
Thermo Fisher Scientific
Inc ....................................... 1,414 0.51
6,219 VWR Corp .......................... 176 0.06
13,533
Zimmer Biomet Holdings
Inc ....................................... 1,388 0.50
Health Care Providers and Services
7,361
Acadia Healthcare Co
Inc ....................................... 460 0.16
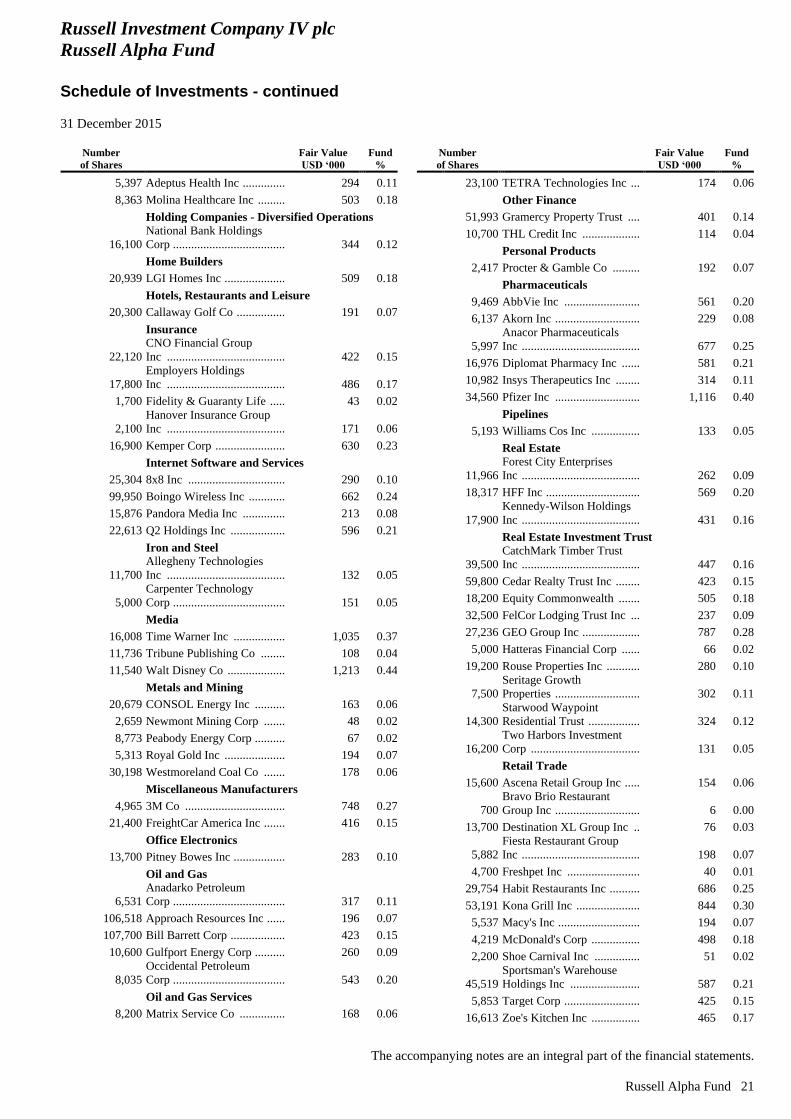
Russell Investment Company IV plc
Russell Alpha Fund
Schedule of Investments - continued
31 December 2015
The accompanying notes are an integral part of the financial statements.
Russell Alpha Fund 21
Number
of Shares
Fair Value
USD ‘000
Fund
%
5,397 Adeptus Health Inc .............. 294 0.11
8,363 Molina Healthcare Inc ......... 503 0.18
Holding Companies - Diversified Operations
16,100
National Bank Holdings
Corp ..................................... 344 0.12
Home Builders
20,939 LGI Homes Inc .................... 509 0.18
Hotels, Restaurants and Leisure
20,300 Callaway Golf Co ................ 191 0.07
Insurance
22,120
CNO Financial Group
Inc ....................................... 422 0.15
17,800
Employers Holdings
Inc ....................................... 486 0.17
1,700 Fidelity & Guaranty Life ..... 43 0.02
2,100
Hanover Insurance Group
Inc ....................................... 171 0.06
16,900 Kemper Corp ....................... 630 0.23
Internet Software and Services
25,304 8x8 Inc ................................ 290 0.10
99,950 Boingo Wireless Inc ............ 662 0.24
15,876 Pandora Media Inc .............. 213 0.08
22,613 Q2 Holdings Inc .................. 596 0.21
Iron and Steel
11,700
Allegheny Technologies
Inc ....................................... 132 0.05
5,000
Carpenter Technology
Corp ..................................... 151 0.05
Media
16,008 Time Warner Inc ................. 1,035 0.37
11,736 Tribune Publishing Co ........ 108 0.04
11,540 Walt Disney Co ................... 1,213 0.44
Metals and Mining
20,679 CONSOL Energy Inc .......... 163 0.06
2,659 Newmont Mining Corp ....... 48 0.02
8,773 Peabody Energy Corp .......... 67 0.02
5,313 Royal Gold Inc .................... 194 0.07
30,198 Westmoreland Coal Co ....... 178 0.06
Miscellaneous Manufacturers
4,965 3M Co ................................. 748 0.27
21,400 FreightCar America Inc ....... 416 0.15
Office Electronics
13,700 Pitney Bowes Inc ................. 283 0.10
Oil and Gas
6,531
Anadarko Petroleum
Corp ..................................... 317 0.11
106,518 Approach Resources Inc ...... 196 0.07
107,700 Bill Barrett Corp .................. 423 0.15
10,600 Gulfport Energy Corp .......... 260 0.09
8,035
Occidental Petroleum
Corp ..................................... 543 0.20
Oil and Gas Services
8,200 Matrix Service Co ............... 168 0.06
Number
of Shares
Fair Value
USD ‘000
Fund
%
23,100 TETRA Technologies Inc ... 174 0.06
Other Finance
51,993 Gramercy Property Trust .... 401 0.14
10,700 THL Credit Inc ................... 114 0.04
Personal Products
2,417 Procter & Gamble Co ......... 192 0.07
Pharmaceuticals
9,469 AbbVie Inc ......................... 561 0.20
6,137 Akorn Inc ............................ 229 0.08
5,997
Anacor Pharmaceuticals
Inc ....................................... 677 0.25
16,976 Diplomat Pharmacy Inc ...... 581 0.21
10,982 Insys Therapeutics Inc ........ 314 0.11
34,560 Pfizer Inc ............................ 1,116 0.40
Pipelines
5,193 Williams Cos Inc ................ 133 0.05
Real Estate
11,966
Forest City Enterprises
Inc ....................................... 262 0.09
18,317 HFF Inc ............................... 569 0.20
17,900
Kennedy-Wilson Holdings
Inc ....................................... 431 0.16
Real Estate Investment Trust
39,500
CatchMark Timber Trust
Inc ....................................... 447 0.16
59,800 Cedar Realty Trust Inc ........ 423 0.15
18,200 Equity Commonwealth ....... 505 0.18
32,500 FelCor Lodging Trust Inc ... 237 0.09
27,236 GEO Group Inc ................... 787 0.28
5,000 Hatteras Financial Corp ...... 66 0.02
19,200 Rouse Properties Inc ........... 280 0.10
7,500
Seritage Growth
Properties ............................ 302 0.11
14,300
Starwood Waypoint
Residential Trust ................. 324 0.12
16,200
Two Harbors Investment
Corp .................................... 131 0.05
Retail Trade
15,600 Ascena Retail Group Inc ..... 154 0.06
700
Bravo Brio Restaurant
Group Inc ............................ 6 0.00
13,700 Destination XL Group Inc .. 76 0.03
5,882
Fiesta Restaurant Group
Inc ....................................... 198 0.07
4,700 Freshpet Inc ........................ 40 0.01
29,754 Habit Restaurants Inc .......... 686 0.25
53,191 Kona Grill Inc ..................... 844 0.30
5,537 Macy's Inc ........................... 194 0.07
4,219 McDonald's Corp ................ 498 0.18
2,200 Shoe Carnival Inc ............... 51 0.02
45,519
Sportsman's Warehouse
Holdings Inc ....................... 587 0.21
5,853 Target Corp ......................... 425 0.15
16,613 Zoe's Kitchen Inc ................ 465 0.17
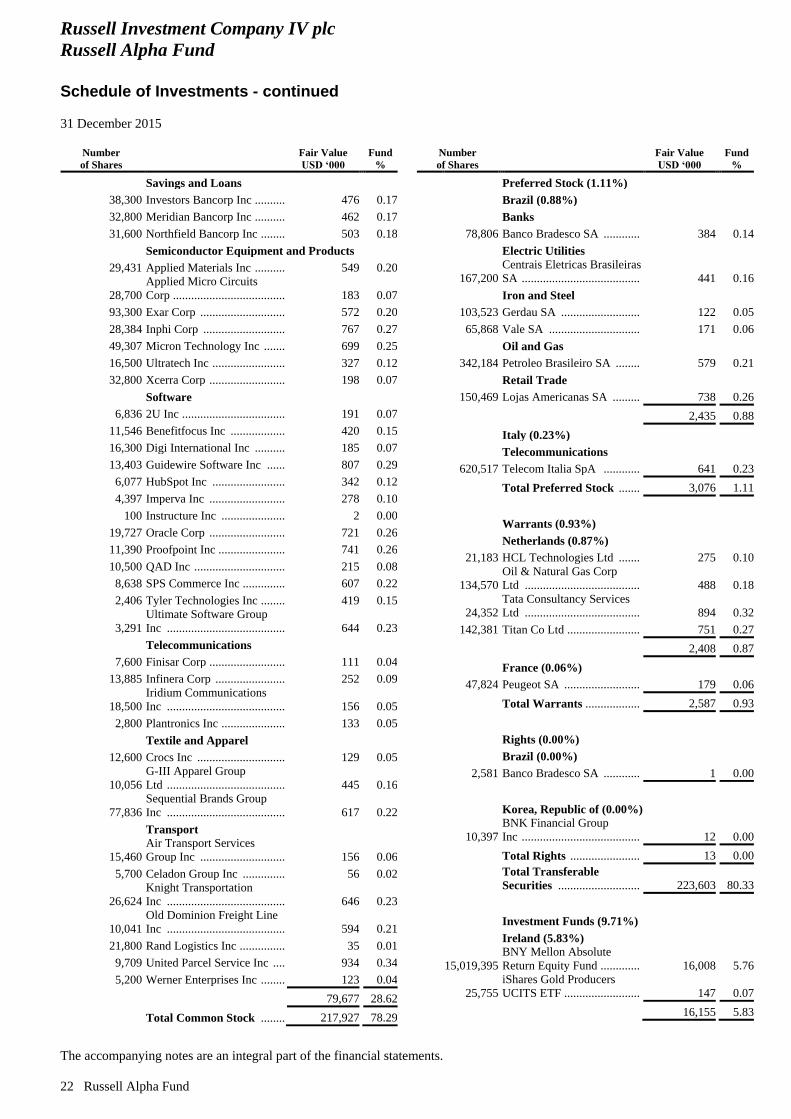
Russell Investment Company IV plc
Russell Alpha Fund
Schedule of Investments - continued
31 December 2015
The accompanying notes are an integral part of the financial statements.
22 Russell Alpha Fund
Number
of Shares
Fair Value
USD ‘000
Fund
%
Savings and Loans
38,300 Investors Bancorp Inc .......... 476 0.17
32,800 Meridian Bancorp Inc .......... 462 0.17
31,600 Northfield Bancorp Inc ........ 503 0.18
Semiconductor Equipment and Products
29,431 Applied Materials Inc .......... 549 0.20
28,700
Applied Micro Circuits
Corp ..................................... 183 0.07
93,300 Exar Corp ............................ 572 0.20
28,384 Inphi Corp ........................... 767 0.27
49,307 Micron Technology Inc ....... 699 0.25
16,500 Ultratech Inc ........................ 327 0.12
32,800 Xcerra Corp ......................... 198 0.07
Software
6,836 2U Inc .................................. 191 0.07
11,546 Benefitfocus Inc .................. 420 0.15
16,300 Digi International Inc .......... 185 0.07
13,403 Guidewire Software Inc ...... 807 0.29
6,077 HubSpot Inc ........................ 342 0.12
4,397 Imperva Inc ......................... 278 0.10
100 Instructure Inc ..................... 2 0.00
19,727 Oracle Corp ......................... 721 0.26
11,390 Proofpoint Inc ...................... 741 0.26
10,500 QAD Inc .............................. 215 0.08
8,638 SPS Commerce Inc .............. 607 0.22
2,406 Tyler Technologies Inc ........ 419 0.15
3,291
Ultimate Software Group
Inc ....................................... 644 0.23
Telecommunications
7,600 Finisar Corp ......................... 111 0.04
13,885 Infinera Corp ....................... 252 0.09
18,500
Iridium Communications
Inc ....................................... 156 0.05
2,800 Plantronics Inc ..................... 133 0.05
Textile and Apparel
12,600 Crocs Inc ............................. 129 0.05
10,056
G-III Apparel Group
Ltd ....................................... 445 0.16
77,836
Sequential Brands Group
Inc ....................................... 617 0.22
Transport
15,460
Air Transport Services
Group Inc ............................ 156 0.06
5,700 Celadon Group Inc .............. 56 0.02
26,624
Knight Transportation
Inc ....................................... 646 0.23
10,041
Old Dominion Freight Line
Inc ....................................... 594 0.21
21,800 Rand Logistics Inc ............... 35 0.01
9,709 United Parcel Service Inc .... 934 0.34
5,200 Werner Enterprises Inc ........ 123 0.04
79,677 28.62
Total Common Stock ........ 217,927 78.29
Number
of Shares
Fair Value
USD ‘000
Fund
%
Preferred Stock (1.11%)
Brazil (0.88%)
Banks
78,806 Banco Bradesco SA ............ 384 0.14
Electric Utilities
167,200
Centrais Eletricas Brasileiras
SA ....................................... 441 0.16
Iron and Steel
103,523 Gerdau SA .......................... 122 0.05
65,868 Vale SA .............................. 171 0.06
Oil and Gas
342,184 Petroleo Brasileiro SA ........ 579 0.21
Retail Trade
150,469 Lojas Americanas SA ......... 738 0.26
2,435 0.88
Italy (0.23%)
Telecommunications
620,517 Telecom Italia SpA ............ 641 0.23
Total Preferred Stock ....... 3,076 1.11
Warrants (0.93%)
Netherlands (0.87%)
21,183 HCL Technologies Ltd ....... 275 0.10
134,570
Oil & Natural Gas Corp
Ltd ...................................... 488 0.18
24,352
Tata Consultancy Services
Ltd ...................................... 894 0.32
142,381 Titan Co Ltd ........................ 751 0.27
2,408 0.87
France (0.06%)
47,824 Peugeot SA ......................... 179 0.06
Total Warrants .................. 2,587 0.93
Rights (0.00%)
Brazil (0.00%)
2,581 Banco Bradesco SA ............ 1 0.00
Korea, Republic of (0.00%)
10,397
BNK Financial Group
Inc ....................................... 12 0.00
Total Rights ....................... 13 0.00
Total Transferable
Securities ........................... 223,603 80.33
Investment Funds (9.71%)
Ireland (5.83%)
15,019,395
BNY Mellon Absolute
Return Equity Fund ............. 16,008 5.76
25,755
iShares Gold Producers
UCITS ETF ......................... 147 0.07
16,155 5.83

Russell Investment Company IV plc
Russell Alpha Fund
Schedule of Investments - continued
31 December 2015
The accompanying notes are an integral part of the financial statements.
Russell Alpha Fund 23
Number
of Shares
Fair Value
USD ‘000
Fund
%
Luxembourg (3.88%)
121,920
Fulcrum UCITS SICAV –
Fulcrum Alternative Beta
Plus Daily Fund ................. 10,776 3.88
Total Investment Funds .... 26,931 9.71
Total Investments
excluding Financial
Derivative Instruments ..... 250,534 90.04
Financial Derivative Instruments ((0.54)%)
Open Futures Contracts ((0.34)%)
Notional
Amount
USD ‘000
Average
Cost Price
USD
Unrealised
Gain (Loss)
USD ‘000
Fund
%
(1,310)
(467.68)
14 of Amsterdam Index Futures
Short Futures Contracts
Expiring January 2016 ........................................................................................ (34)
(0.01)
(4,177)
(4,972.31)
84 of CAC 40 Index Futures
Short Futures Contracts
Expiring January 2016 ........................................................................................ (56) (0.02)
(3,935)
(11,243.75)
14 of DAX Index Futures
Short Futures Contracts
Expiring March 2016 ......................................................................................... (160)
(0.06)
(18,198)
(3,486.24)
522 of Euro Stoxx 50 Index Futures
Short Futures Contracts
Expiring March 2016 ......................................................................................... (412)
(0.15)
(17,603)
(8,757.86)
201 of FTSE 100 Index Futures
Short Futures Contracts
Expiring March 2016 ......................................................................................... (759)
(0.27)
(1,152)
(23,034.99)
10 of FTSE MIB Index Futures
Short Futures Contracts
Expiring March 2016 ......................................................................................... (13)
0.00
(427)
(2,846.14)
3 of Hang Seng Index Futures
Short Futures Contracts
Expiring January 2016 3
0.00
(1,559)
(10,393.72)
15 of IBEX 35 Index Futures
Short Futures Contracts
Expiring January 2016 ........................................................................................ 7
0.00
(41,612)
(782.91)
1,063 of Mini MSCI Emerging Markets Index
Futures
Short Futures Contracts
Expiring March 2016 ......................................................................................... (244)
(0.09)
(2,272)
(167.04)
136 of OMSX 30 Index Futures
Short Futures Contracts
Expiring January 2016 ........................................................................................ (64)
(0.02)
(60,394)
(1,139.52)
530 of Russell 2000 Mini Index Futures
Short Futures Contracts
Expiring March 2016 ......................................................................................... 425
0.15
(970)
(539.15)
9 of S&P TSX 60 Index Futures
Short Futures Contracts
Expiring March 2016 ......................................................................................... (16)
(0.01)
(30,510)
(2,040.80)
299 of S&P 500 E Mini Index Futures
Short Futures Contracts
Expiring March 2016 ......................................................................................... 81
0.03
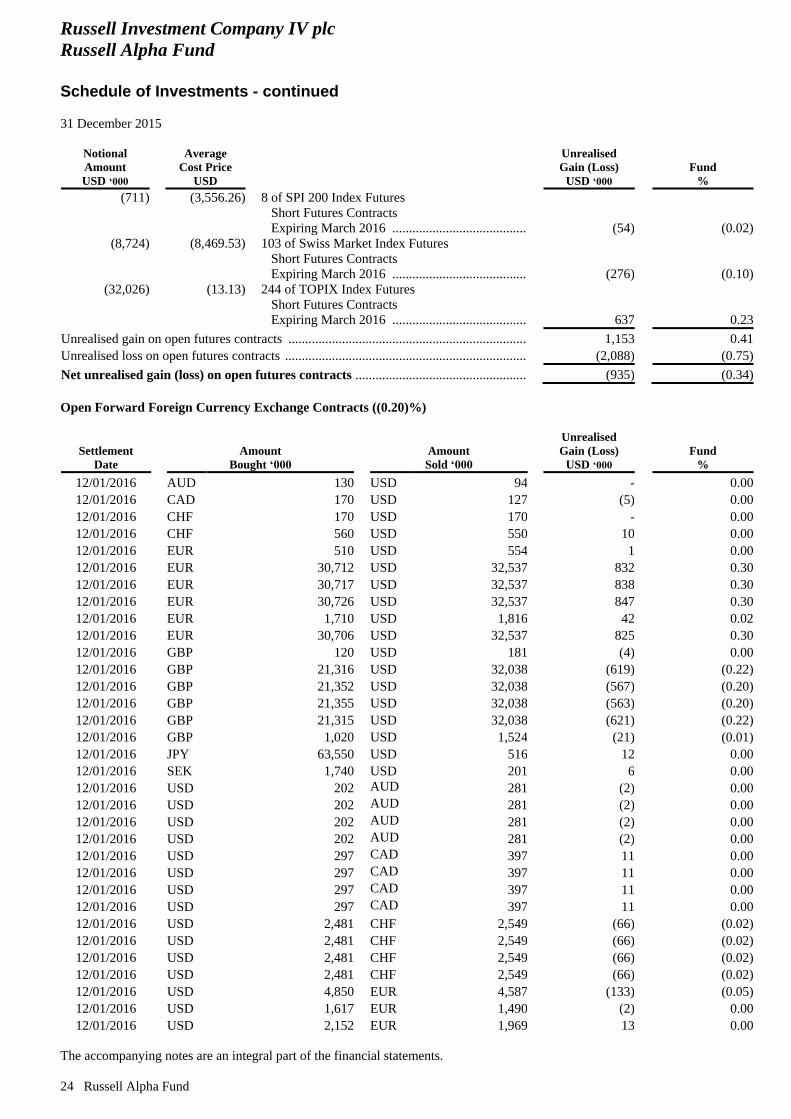
Russell Investment Company IV plc
Russell Alpha Fund
Schedule of Investments - continued
31 December 2015
The accompanying notes are an integral part of the financial statements.
24 Russell Alpha Fund
Notional
Amount
USD ‘000
Average
Cost Price
USD
Unrealised
Gain (Loss)
USD ‘000
Fund
%
(711)
(3,556.26)
8 of SPI 200 Index Futures
Short Futures Contracts
Expiring March 2016 ......................................................................................... (54)
(0.02)
(8,724)
(8,469.53)
103 of Swiss Market Index Futures
Short Futures Contracts
Expiring March 2016 ......................................................................................... (276) (0.10)
(32,026)
(13.13)
244 of TOPIX Index Futures
Short Futures Contracts
Expiring March 2016 ......................................................................................... 637 0.23
Unrealised gain on open futures contracts ......................................................................... 1,153 0.41
Unrealised loss on open futures contracts .......................................................................... (2,088) (0.75)
Net unrealised gain (loss) on open futures contracts ..................................................... (935) (0.34)
Open Forward Foreign Currency Exchange Contracts ((0.20)%)
Settlement
Date
Amount
Bought ‘000
Amount
Sold ‘000
Unrealised
Gain (Loss)
USD ‘000
Fund
%
12/01/2016 AUD 130 USD 94 - 0.00
12/01/2016 CAD 170 USD 127 (5) 0.00
12/01/2016 CHF 170 USD 170 - 0.00
12/01/2016 CHF 560 USD 550 10 0.00
12/01/2016 EUR 510 USD 554 1 0.00
12/01/2016 EUR 30,712 USD 32,537 832 0.30
12/01/2016 EUR 30,717 USD 32,537 838 0.30
12/01/2016 EUR 30,726 USD 32,537 847 0.30
12/01/2016 EUR 1,710 USD 1,816 42 0.02
12/01/2016 EUR 30,706 USD 32,537 825 0.30
12/01/2016 GBP 120 USD 181 (4) 0.00
12/01/2016 GBP 21,316 USD 32,038 (619) (0.22)
12/01/2016 GBP 21,352 USD 32,038 (567) (0.20)
12/01/2016 GBP 21,355 USD 32,038 (563) (0.20)
12/01/2016 GBP 21,315 USD 32,038 (621) (0.22)
12/01/2016 GBP 1,020 USD 1,524 (21) (0.01)
12/01/2016 JPY 63,550 USD 516 12 0.00
12/01/2016 SEK 1,740 USD 201 6 0.00
12/01/2016 USD 202 AUD 281 (2) 0.00
12/01/2016 USD 202 AUD 281 (2) 0.00
12/01/2016 USD 202 AUD 281 (2) 0.00
12/01/2016 USD 202 AUD 281 (2) 0.00
12/01/2016 USD 297 CAD 397 11 0.00
12/01/2016 USD 297 CAD 397 11 0.00
12/01/2016 USD 297 CAD 397 11 0.00
12/01/2016 USD 297 CAD 397 11 0.00
12/01/2016 USD 2,481 CHF 2,549 (66) (0.02)
12/01/2016 USD 2,481 CHF 2,549 (66) (0.02)
12/01/2016 USD 2,481 CHF 2,549 (66) (0.02)
12/01/2016 USD 2,481 CHF 2,549 (66) (0.02)
12/01/2016 USD 4,850 EUR 4,587 (133) (0.05)
12/01/2016 USD 1,617 EUR 1,490 (2) 0.00
12/01/2016 USD 2,152 EUR 1,969 13 0.00

Russell Investment Company IV plc
Russell Alpha Fund
Schedule of Investments - continued
31 December 2015
The accompanying notes are an integral part of the financial statements.
Russell Alpha Fund 25
Settlement
Date
Amount
Bought ‘000
Amount
Sold ‘000
Unrealised
Gain (Loss)
USD ‘000
Fund
%
12/01/2016 USD 7,870 EUR 7,426 (198) (0.07)
12/01/2016 USD 7,869 EUR 7,426 (199) (0.07)
12/01/2016 USD 7,868 EUR 7,426 (200) (0.07)
12/01/2016 USD 7,868 EUR 7,426 (199) (0.07)
12/01/2016 USD 2,545 GBP 1,690 54 0.02
12/01/2016 USD 5,010 GBP 3,334 96 0.03
12/01/2016 USD 5,011 GBP 3,334 97 0.03
12/01/2016 USD 5,007 GBP 3,334 93 0.03
12/01/2016 USD 5,012 GBP 3,334 97 0.03
12/01/2016 USD 102 HKD 793 - 0.00
12/01/2016 USD 102 HKD 793 - 0.00
12/01/2016 USD 102 HKD 793 - 0.00
12/01/2016 USD 102 HKD 793 - 0.00
12/01/2016 USD 2,049 JPY 252,310 (49) (0.02)
12/01/2016 USD 7,694 JPY 945,542 (167) (0.06)
12/01/2016 USD 7,693 JPY 945,542 (169) (0.06)
12/01/2016 USD 7,693 JPY 945,542 (170 ) (0.06)
12/01/2016 USD 7,693 JPY 945,542 (169) (0.06)
12/01/2016 USD 630 SEK 5,470 (19) (0.01)
12/01/2016 USD 630 SEK 5,470 (19) (0.01)
12/01/2016 USD 630 SEK 5,470 (19) (0.01)
12/01/2016 USD 630 SEK 5,470 (19) (0.01)
Unrealised gain on open forward foreign currency exchange contracts ................................ 3,907 1.36
Unrealised loss on open forward foreign currency exchange contracts ................................ (4,403) (1.56)
Net unrealised gain (loss) on open forward foreign currency exchange contracts ............................. (496) (0.20)
Total Financial Derivative Instruments ................................................................................................. (1,431) (0.54)
Fair Value
USD ‘000
Fund
%
Total Financial Assets at Fair Value through Profit or Loss
(91.81%) ............................................................................................................................... 255,594 91.81
Total Financial Liabilities at Fair Value through Profit or
Loss ((2.31)%) ...................................................................................................................... (6,491) (2.31)
Net Financial Assets at Fair Value through Profit or Loss
(89.50%) .................................................................................................................................................... 249,103 89.50
Other Net Assets (10.50%) ....................................................................................................................... 29,239 10.50
Net Assets .................................................................................................................................................. 278,342 100.00
Abbreviation used: ADR – American Depository Receipt
GDR – Global Depository Receipt
NVDR - Non-Voting Depository Receipt
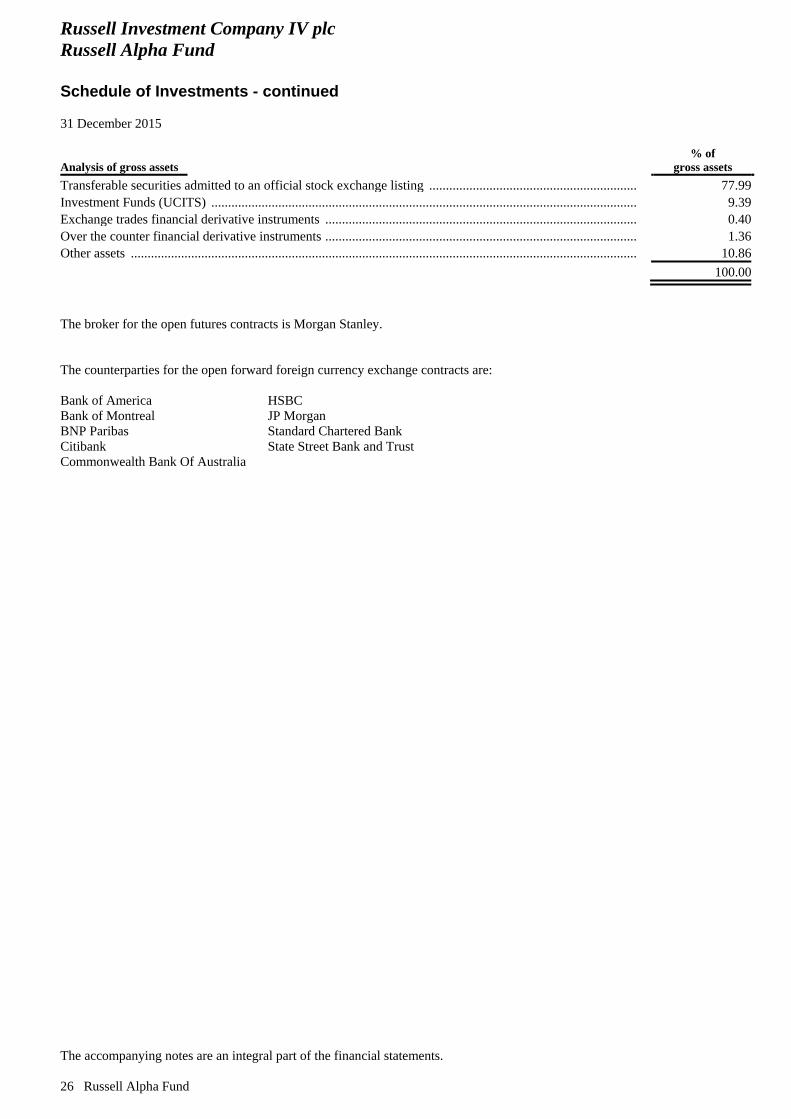
Russell Investment Company IV plc
Russell Alpha Fund
Schedule of Investments - continued
31 December 2015
The accompanying notes are an integral part of the financial statements.
26 Russell Alpha Fund
Analysis of gross assets
% of
gross assets
Transferable securities admitted to an official stock exchange listing ..................................................................... 77.99
Investment Funds (UCITS) ...................................................................................................................................... 9.39
Exchange trades financial derivative instruments .................................................................................................... 0.40
Over the counter financial derivative instruments .................................................................................................... 1.36
Other assets .............................................................................................................................................................. 10.86
100.00
The broker for the open futures contracts is Morgan Stanley.
The counterparties for the open forward foreign currency exchange contracts are:
Bank of America
Bank of Montreal
BNP Paribas
Citibank
Commonwealth Bank Of Australia
HSBC
JP Morgan
Standard Chartered Bank
State Street Bank and Trust
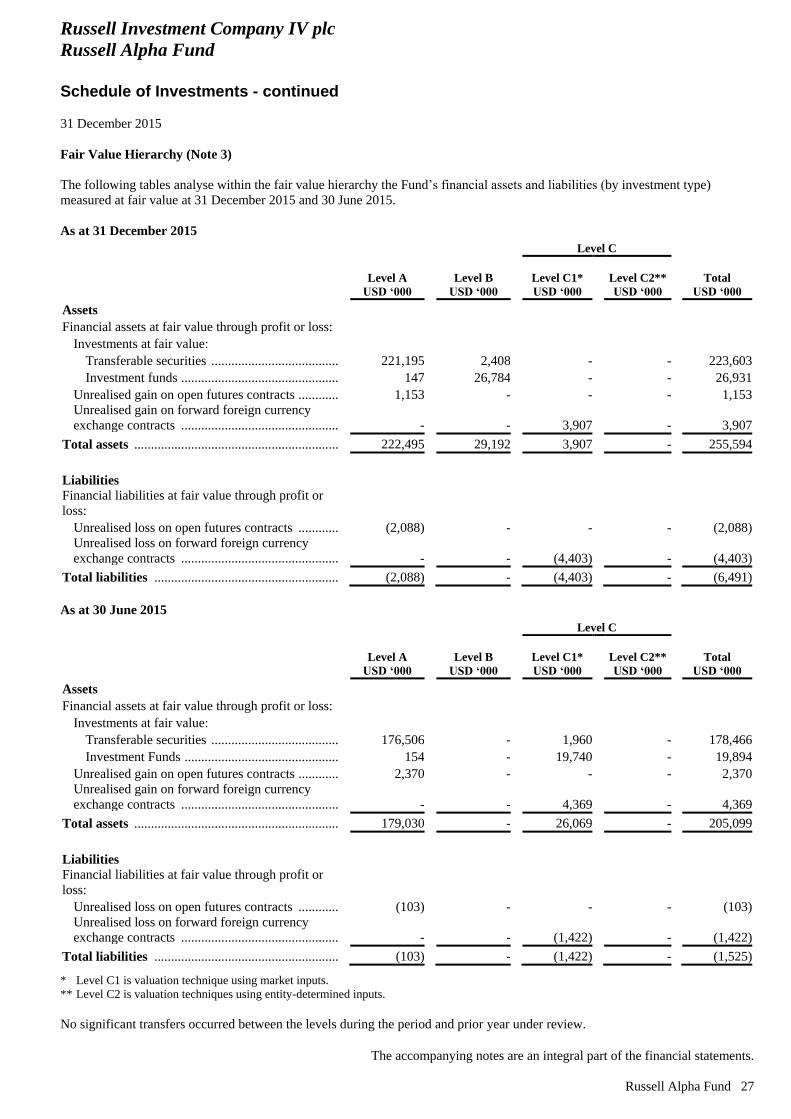
Russell Investment Company IV plc
Russell Alpha Fund
Schedule of Investments - continued
31 December 2015
The accompanying notes are an integral part of the financial statements.
Russell Alpha Fund 27
Fair Value Hierarchy (Note 3)
The following tables analyse within the fair value hierarchy the Fund’s financial assets and liabilities (by investment type)
measured at fair value at 31 December 2015 and 30 June 2015.
As at 31 December 2015
Level C
Level A
USD ‘000
Level B
USD ‘000
Level C1*
USD ‘000
Level C2**
USD ‘000
Total
USD ‘000
Assets
Financial assets at fair value through profit or loss:
Investments at fair value:
Transferable securities ............................................................... 221,195 2,408 - - 223,603
Investment funds ........................................................................ 147 26,784 - - 26,931
Unrealised gain on open futures contracts ............................................. 1,153 - - - 1,153
Unrealised gain on forward foreign currency
exchange contracts ........................................................................ - - 3,907 - 3,907
Total assets ...................................................................................... 222,495 29,192 3,907 - 255,594
Liabilities
Financial liabilities at fair value through profit or
loss:
Unrealised loss on open futures contracts ............................................. (2,088) - - - (2,088)
Unrealised loss on forward foreign currency
exchange contracts ................................................................................ - - (4,403) - (4,403)
Total liabilities ................................................................................ (2,088) - (4,403) - (6,491)
As at 30 June 2015
Level C
Level A
USD ‘000
Level B
USD ‘000
Level C1*
USD ‘000
Level C2**
USD ‘000
Total
USD ‘000
Assets
Financial assets at fair value through profit or loss:
Investments at fair value:
Transferable securities ............................................................... 176,506 - 1,960 - 178,466
Investment Funds ....................................................................... 154 - 19,740 - 19,894
Unrealised gain on open futures contracts ............................................. 2,370 - - - 2,370
Unrealised gain on forward foreign currency
exchange contracts ........................................................................ - - 4,369 - 4,369
Total assets ...................................................................................... 179,030 - 26,069 - 205,099
Liabilities
Financial liabilities at fair value through profit or
loss:
Unrealised loss on open futures contracts ............................................. (103) - - - (103)
Unrealised loss on forward foreign currency
exchange contracts ................................................................................ - - (1,422) - (1,422)
Total liabilities ................................................................................ (103) - (1,422) - (1,525)
* Level C1 is valuation technique using market inputs.
** Level C2 is valuation techniques using entity-determined inputs.
No significant transfers occurred between the levels during the period and prior year under review.

Russell Investment Company IV plc
Russell Alpha Fund
Schedule of Changes in Composition of Portfolio
Listed below are the 20 largest cumulative investment purchases and sales during the period ended 31 December 2015
A copy of the list of changes in the portfolio during the reference period may be obtained free of charge from the Company’s
Administrator or from the paying agent or paying and information agents in each country of distribution.
28 Russell Alpha Fund
Portfolio Securities
Acquisition Cost
USD ‘000 Portfolio Securities
Disposal Proceeds
USD ‘000
BNY Mellon Absolute Return Equity Fund 11,000 Western Digital Corp (1,830)
Western Digital Corp 1,983 Seagate Technology Plc (1,704)
Seagate Technology Plc 1,662 General Electric Co (1,323)
Micron Technology Inc 1,632 Micron Technology Inc (1,316)
Zimmer Biomet Holdings Inc 1,160 SABMiller Plc (1,141)
Peugeot SA 1,111 Oracle Corp (1,094)
Valeo SA 1,092 Tyson Foods Inc (1,066)
Legrand SA 952 Allstate Corp (1,030)
GEO Group Inc 937 Allergan Plc (1,006)
Reckitt Benckiser Group Plc 935 Industria de Diseno Textil SA (939)
Renault SA 889 Legrand SA (884)
Great Lakes Dredge & Dock Corp 869 Target Corp (881)
Bayer AG 868 Carrefour SA (878)
Industria de Diseno Textil SA 861 McDonald's Corp (866)
Libbey Inc 861 ASML Holding NV (851)
Pfizer Inc 853 LDR Holding Corp (832)
Fanuc Corp 843 United Technologies Corp (771)
Ryanair Holdings Plc 800 Walt Disney Co (765)
Wirecard AG 764 Bharat Heavy Electricals Ltd (752)
Glaukos Corp 760 Valeo SA (743)

Russell Investment Company IV plc
Russell Multi Strategy Volatility Fund
Balance Sheet
As at 31 December 2015
The accompanying notes are an integral part of the financial statements.
Russell Multi Strategy Volatility Fund 29
31 December 2015
(Unaudited)
USD ‘000
30 June 2015*
(Audited)
USD ‘000
Assets
Financial assets at fair value through profit or loss (Note 2) ..................................................................... 247,277 211,427
Cash at bank (Note 4) ................................................................................................................................ 41,415 34,881
Cash held with brokers and counterparties for open financial derivative instruments
(Note 4) ......................................................................................................................................................
14,308 5,806
Debtors:
Receivable for investments sold ............................................................................................................. - 844
Receivable on fund shares issued ........................................................................................................... - 102
Interest receivable and other receivables ................................................................................................ 32 124
303,032 253,184
Liabilities
Financial liabilities at fair value through profit or loss (Note 2) ..................................................................... (18,481) (18,523)
Creditors – amounts falling due within one year:
Management fees payable ............................................................................................................................ (436) (344)
Custodian and Trustee fees payable .......................................................................................................... (6) (3)
Sub-custodian fees payable .................................................................................................................... (10) (6)
Administration fees payable ........................................................................................................................ (12) (10)
Audit fees payable ..................................................................................................................................... (12) (24)
(18,957) (18,910)
Net asset value attributable to redeemable participating shareholders ..................................................... 284,075 234,274
* The Fund launched on 29 January 2015.
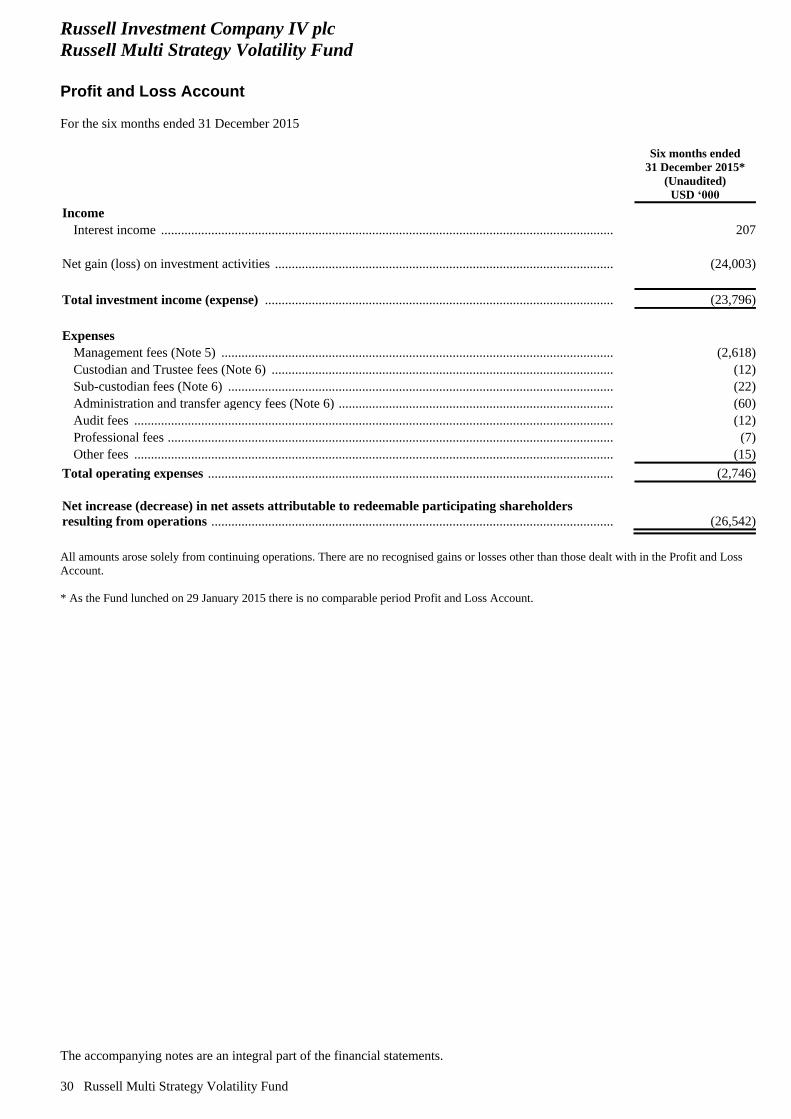
Russell Investment Company IV plc
Russell Multi Strategy Volatility Fund
Profit and Loss Account
For the six months ended 31 December 2015
The accompanying notes are an integral part of the financial statements.
30 Russell Multi Strategy Volatility Fund
Six months ended
31 December 2015*
(Unaudited)
USD ‘000
Income
Interest income .............................................................................................................................................. 207
Net gain (loss) on investment activities ............................................................................................................ (24,003)
Total investment income (expense) .............................................................................................................. (23,796)
Expenses
Management fees (Note 5) ............................................................................................................................. (2,618)
Custodian and Trustee fees (Note 6) ............................................................................................................... (12)
Sub-custodian fees (Note 6) ......................................................................................................................... (22)
Administration and transfer agency fees (Note 6) ...................................................................................... (60)
Audit fees .................................................................................................................................................. (12)
Professional fees ........................................................................................................................................... (7)
Other fees ..................................................................................................................................................... (15)
Total operating expenses ............................................................................................................................... (2,746)
Net increase (decrease) in net assets attributable to redeemable participating shareholders
resulting from operations ................................................................................................................................. (26,542)
All amounts arose solely from continuing operations. There are no recognised gains or losses other than those dealt with in the Profit and Loss
Account.
* As the Fund lunched on 29 January 2015 there is no comparable period Profit and Loss Account.
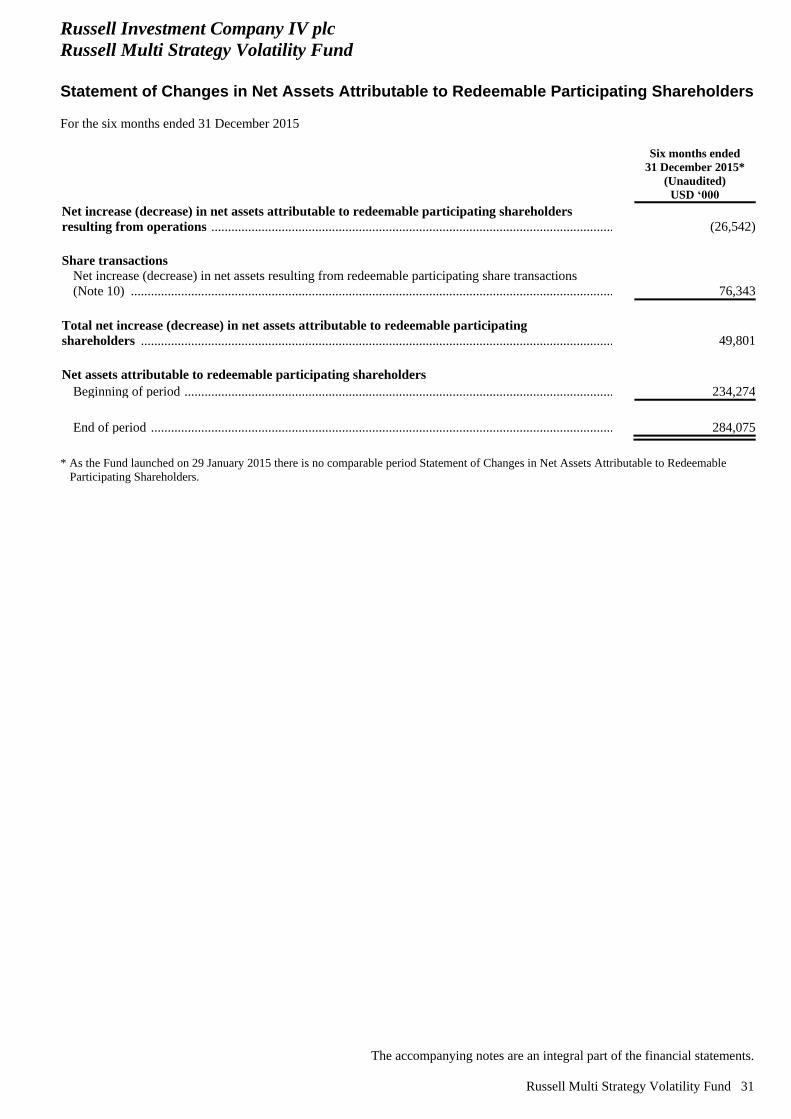
Russell Investment Company IV plc
Russell Multi Strategy Volatility Fund
Statement of Changes in Net Assets Attributable to Redeemable Participating Shareholders
For the six months ended 31 December 2015
The accompanying notes are an integral part of the financial statements.
Russell Multi Strategy Volatility Fund 31
Six months ended
31 December 2015*
(Unaudited)
USD ‘000
Net increase (decrease) in net assets attributable to redeemable participating shareholders
resulting from operations .......................................................................................................................... (26,542)
Share transactions
Net increase (decrease) in net assets resulting from redeemable participating share transactions
(Note 10) ................................................................................................................................................... 76,343
Total net increase (decrease) in net assets attributable to redeemable participating
shareholders ............................................................................................................................................. 49,801
Net assets attributable to redeemable participating shareholders
Beginning of period ................................................................................................................................. 234,274
End of period ............................................................................................................................................. 284,075
* As the Fund launched on 29 January 2015 there is no comparable period Statement of Changes in Net Assets Attributable to Redeemable
Participating Shareholders.

Russell Investment Company IV plc
Russell Multi Strategy Volatility Fund
Schedule of Investments
31 December 2015
The accompanying notes are an integral part of the financial statements.
32 Russell Multi Strategy Volatility Fund
Principal
Amount
Fair Value
USD ‘000
Fund
%
Transferable Securities (21.83%)
Long Term Bonds and Notes (0.69%)
United States (0.69%)
Toyota Motor Credit Corp
USD 2,000,000
0.872% due
12/03/20 ........................... 1,972 0.69
Total Long Term Bonds
and Notes ............................ 1,972 0.69
Short Term Investments (21.14%)
Australia (0.88%)
Commonwealth Bank of
Australia
2,500,000
Zero Coupon due
03/03/16 ........................... 2,500 0.88
United States (20.26%)
Bank of America Corp
3,300,000
1.250% due
11/01/16 ........................... 3,300 1.16
Federal Home Loan Bank
Discount Notes
4,800,000
Zero Coupon due
04/01/16 ........................... 4,800 1.69
30,000,000
Zero Coupon due
05/01/16 ........................... 30,000 10.56
4,550,000
Zero Coupon due
06/01/16 ........................... 4,550 1.60
8,300,000
Zero Coupon due
11/02/16 ........................... 8,298 2.92
Federal National Mortgage
Association
1,800,000
Zero Coupon due
04/01/16 .......................... 1,800 0.64
International Bank for
Reconstruction &
Development
4,000,000
Zero Coupon due
05/01/16 ........................... 4,000 1.41
JPMorgan Chase & Co
800,000
2.600% due
15/01/16 ........................... 800 0.28
57,548 20.26
Total Short Term
Investments ........................ 60,048 21.14
Total Transferable
Securities ............................ 62,020 21.83
Certificates of Deposit (1.05%)
Japan (1.05%)
Sumitomo Mitsui Banking
Corp
3,000,000
0.370% due
12/01/16 ........................... 3,000 1.05
Total Certificates of
Deposit ................................ 3,000 1.05
Principal
Amount
Fair Value
USD ‘000
Fund
%
Commercial Paper (20.98%)
Canada (1.58%)
Ontario Techers Finance
Trust
2,500,000
Zero Coupon due
08/03/16 .......................... 2,498 0.88
Quebec Government
2,000,000
Zero Coupon due
05/01/16 .......................... 2,000 0.70
4,498 1.58
France (1.06%)
Antalis SA
3,000,000
Zero Coupon due
05/01/16 .......................... 3,000 1.06
Ireland (1.41%)
Matchpoint Finance Plc
4,000,000
Zero Coupon due
11/02/16 .......................... 3,998 1.41
Japan (1.06%)
Bank of Tokyo Mitsubishi
UFJ Ltd
3,000,000
Zero Coupon due
12/01/16 .......................... 3,000 1.06
United States (15.87%)
American Express Credit
Corp
4,000,000
Zero Coupon due
19/01/16 .......................... 3,999 1.41
BMW US Capital
LLC
3,000,000
Zero Coupon due
05/01/16 .......................... 2,999 1.05
Concord Minutemen
Capital
2,900,000
Zero Coupon due
04/01/16 .......................... 2,900 1.02
ConocoPhillips Co
3,000,000
Zero Coupon due
15/01/16 .......................... 2,998 1.05
Crown Point Capital Co
LLC
1,000,000
Zero Coupon due
04/01/16 .......................... 1,000 0.35
Eni Finance USA
3,000,000
Zero Coupon due
04/01/16 .......................... 3,000 1.06
Exxon Mobil Corp
3,000,000
Zero Coupon due
13/01/16 .......................... 3,000 1.06
Fairway Finance Company
LLC
3,000,000
Zero Coupon due
11/01/16 .......................... 3,000 1.06

Russell Investment Company IV plc
Russell Multi Strategy Volatility Fund
Schedule of Investments - continued
31 December 2015
The accompanying notes are an integral part of the financial statements.
Russell Multi Strategy Volatility Fund 33
Principal
Amount
Fair Value
USD ‘000
Fund
%
Gotham Funding
Corporation
3,000,000
Zero Coupon due
12/01/16 ........................... 3,000 1.06
Liberty Street Funding
LLC
3,000,000
Zero Coupon due
15/01/16 ........................... 2,999 1.05
LMA SA
850,000
Zero Coupon due
11/01/16 ........................... 850 0.30
Manhattan Asset Funding
LLC
2,700,000
Zero Coupon due
01/02/16 ........................... 2,699 0.95
Nestle Capital Corp
3,000,000
Zero Coupon due
05/01/16 ........................... 3,000 1.06
PACCAR Financial Corp
2,350,000
Zero Coupon due
11/01/16 ........................... 2,350 0.83
Private Exporting Funding
Corp
500,000
Zero Coupon due
05/01/16 ........................... 500 0.17
Regency Markets No 1
LLC
600,000
Zero Coupon due
13/01/16 ........................... 600 0.21
1,500,000
Zero Coupon due
15/01/16 ........................... 1,500 0.53
700,000
Zero Coupon due
20/01/16 ........................... 700 0.25
Scotiabanc Inc
2,000,000
Zero Coupon due
04/01/16 ........................... 2,000 0.70
Sheffield Receivable Corp
Principal
Amount
Fair Value
USD ‘000
Fund
%
2,000,000
Zero Coupon due
04/01/16 .......................... 2,000 0.70
45,094 15.87
Total Commercial Paper .. 59,590 20.98
Money Market Instruments (27.05%)
United States (27.05%)
U.S. Treasury Bills
5,000,000
Zero Coupon due
07/01/16 .......................... 5,000 1.76
9,300,000
Zero Coupon due
14/01/16 .......................... 9,300 3.27
15,015,000
Zero Coupon due
04/02/16 .......................... 15,014 5.29
25,025,000
Zero Coupon due
03/03/16 .......................... 25,021 8.81
22,515,000
Zero Coupon due
28/04/16 .......................... 22,497 7.92
Total Money Market
Instruments ....................... 76,832 27.05
Number of
Shares
Investment Funds (7.52%)
Ireland (7.52%)
Russell Investment Company
III plc -
21,344
The US Dollar Cash Fund
II - Class R Roll-Up
Shares .............................. 21,357 7.52
Total Investment Funds .... 21,357 7.52
Total Investments
excluding Financial
Derivative Instruments ..... 222,799 78.43
Financial Derivative Instruments (2.11%)
Open Futures Contracts (0.73%)
Notional
Amount
USD ‘000
Average
Cost Price
USD
Unrealised
Gain (Loss)
USD ‘000
Fund
%
(8,647)
(19.56)
442 of CBOE Volatility Index Future
Short Futures Contracts
Expiring January 2016 .............................................. 459 0.16
5,462
20.61
265 of CBOE Volatility Index Future
Long Futures Contracts
Expiring May 2016 ................................................... (294) (0.10)
(185,083)
(2,056.47)
1,800 of S&P 500 E Mini Index Futures
Short Futures Contracts
Expiring March 2016 ................................................ 1,896 0.67
Unrealised gain on open futures contracts ......................................................................... 2,355 0.83
Unrealised loss on open futures contracts .......................................................................... (294) (0.10)
Net unrealised gain (loss) on open futures contracts ..................................................... 2,061 0.73

Russell Investment Company IV plc
Russell Multi Strategy Volatility Fund
Schedule of Investments - continued
31 December 2015
The accompanying notes are an integral part of the financial statements.
34 Russell Multi Strategy Volatility Fund
Open Forward Foreign Currency Exchange Contracts (0.73%)
Settlement
Date
Amount
Bought ‘000
Amount
Sold ‘000
Unrealised
Gain (Loss)
USD ‘000
Fund
%
12/01/2016 AUD 67,651 USD 48,714 489 0.17
12/01/2016 AUD 67,613 USD 48,714 462 0.16
12/01/2016 AUD 67,706 USD 48,714 530 0.20
12/01/2016 AUD 67,696 USD 48,714 522 0.18
12/01/2016 EUR 4,964 USD 5,256 137 0.05
12/01/2016 EUR 4,962 USD 5,256 135 0.05
12/01/2016 GBP 3,784 USD 5,677 (100) (0.03)
12/01/2016 GBP 3,783 USD 5,677 (100) (0.05)
12/01/2016 USD 896 AUD 1,239 (5) 0.00
12/01/2016 USD 441 EUR 417 (12) 0.00
12/01/2016 USD 504 GBP 335 11 0.00
Unrealised gain on open forward foreign currency exchange contracts ................................ 2,286 0.81
Unrealised loss on open forward foreign currency exchange contracts ................................ (217) (0.08)
Net unrealised gain (loss) on open forward foreign currency exchange contracts ............................. 2,069 0.73
Futures Options Purchased (6.98%)
Notional
Amount
USD ‘000
Fair Value
USD ‘000
Fund
%
United States
1,750
Call at 22 of CBOE Volatility Index
Expiring January 2016 ............................................................... 1,793 0.63
158
Call at 27 of CBOE Volatility Index
Expiring February 2016 ............................................................. 177 0.06
420
Call at 30 of CBOE Volatility Index
Expiring February 2016 ............................................................. 378 0.13
490
Put at 19 of CBOE Volatility Index
Expiring January 2016 ............................................................... 1,054 0.37
280
Put at 20 of CBOE Volatility Index
Expiring March 2016 ................................................................. 980 0.34
120
Call at 2200 of S&P 500 Index
Expiring June 2016 .................................................................... 2,075 0.74
1,300
Put at 14 of CBOE Volatility Index
Expiring January 2016 ............................................................... 65 0.02
60
Put at 1970 of S&P 500 Index
Expiring January 2016 ............................................................... 460 0.16
420
Put at 22 of CBOE Volatility Index
Expiring January 2016 ............................................................... 1,889 0.67
1,200
Put at 14 of CBOE Volatility Index
Expiring February 2016 ............................................................. 180 0.06
60
Call at 2080 of S&P 500 Index
Expiring January 2016 ............................................................... 466 0.16
350
Call at 25 of CBOE Volatility Index
Expiring March 2016 ................................................................. 569 0.20
193
Call at 25 of CBOE Volatility Index
Expiring February 2016 ............................................................. 260 0.09
420
Call at 30 of CBOE Volatility Index
Expiring March 2016 ................................................................. 452 0.16
490
Put at 19 of CBOE Volatility Index
Expiring February 2016 ............................................................. 1,261 0.44
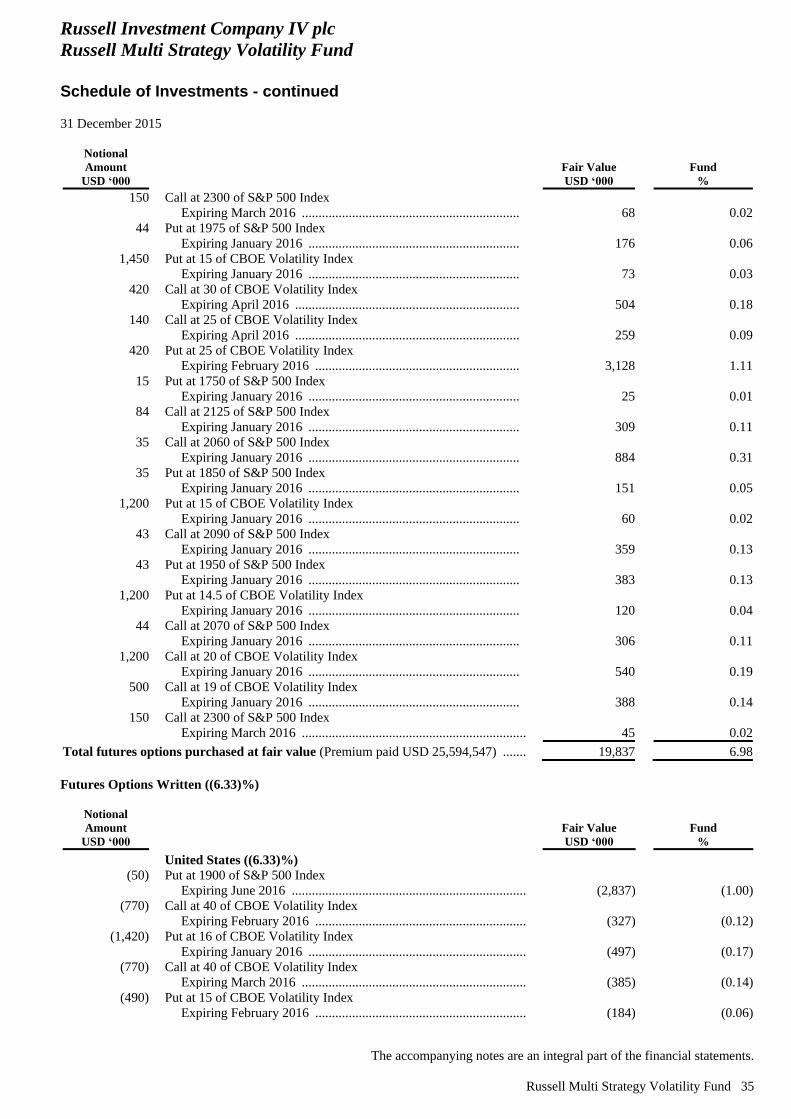
Russell Investment Company IV plc
Russell Multi Strategy Volatility Fund
Schedule of Investments - continued
31 December 2015
The accompanying notes are an integral part of the financial statements.
Russell Multi Strategy Volatility Fund 35
Notional
Amount
USD ‘000
Fair Value
USD ‘000
Fund
%
150
Call at 2300 of S&P 500 Index
Expiring March 2016 ................................................................. 68 0.02
44
Put at 1975 of S&P 500 Index
Expiring January 2016 ............................................................... 176 0.06
1,450
Put at 15 of CBOE Volatility Index
Expiring January 2016 ............................................................... 73 0.03
420
Call at 30 of CBOE Volatility Index
Expiring April 2016 ................................................................... 504 0.18
140
Call at 25 of CBOE Volatility Index
Expiring April 2016 ................................................................... 259 0.09
420
Put at 25 of CBOE Volatility Index
Expiring February 2016 ............................................................. 3,128 1.11
15
Put at 1750 of S&P 500 Index
Expiring January 2016 ............................................................... 25 0.01
84
Call at 2125 of S&P 500 Index
Expiring January 2016 ............................................................... 309 0.11
35
Call at 2060 of S&P 500 Index
Expiring January 2016 ............................................................... 884 0.31
35
Put at 1850 of S&P 500 Index
Expiring January 2016 ............................................................... 151 0.05
1,200
Put at 15 of CBOE Volatility Index
Expiring January 2016 ............................................................... 60 0.02
43
Call at 2090 of S&P 500 Index
Expiring January 2016 ............................................................... 359 0.13
43
Put at 1950 of S&P 500 Index
Expiring January 2016 ............................................................... 383 0.13
1,200
Put at 14.5 of CBOE Volatility Index
Expiring January 2016 ............................................................... 120 0.04
44
Call at 2070 of S&P 500 Index
Expiring January 2016 ............................................................... 306 0.11
1,200
Call at 20 of CBOE Volatility Index
Expiring January 2016 ............................................................... 540 0.19
500
Call at 19 of CBOE Volatility Index
Expiring January 2016 ............................................................... 388 0.14
150
Call at 2300 of S&P 500 Index
Expiring March 2016 ................................................................... 45 0.02
Total futures options purchased at fair value (Premium paid USD 25,594,547) ........... 19,837 6.98
Futures Options Written ((6.33)%)
Notional
Amount
USD ‘000
Fair Value
USD ‘000
Fund
%
United States ((6.33)%)
(50)
Put at 1900 of S&P 500 Index
Expiring June 2016 ...................................................................... (2,837) (1.00)
(770)
Call at 40 of CBOE Volatility Index
Expiring February 2016 ............................................................... (327) (0.12)
(1,420)
Put at 16 of CBOE Volatility Index
Expiring January 2016 ................................................................. (497) (0.17)
(770)
Call at 40 of CBOE Volatility Index
Expiring March 2016 ................................................................... (385) (0.14)
(490)
Put at 15 of CBOE Volatility Index
Expiring February 2016 ............................................................... (184) (0.06)
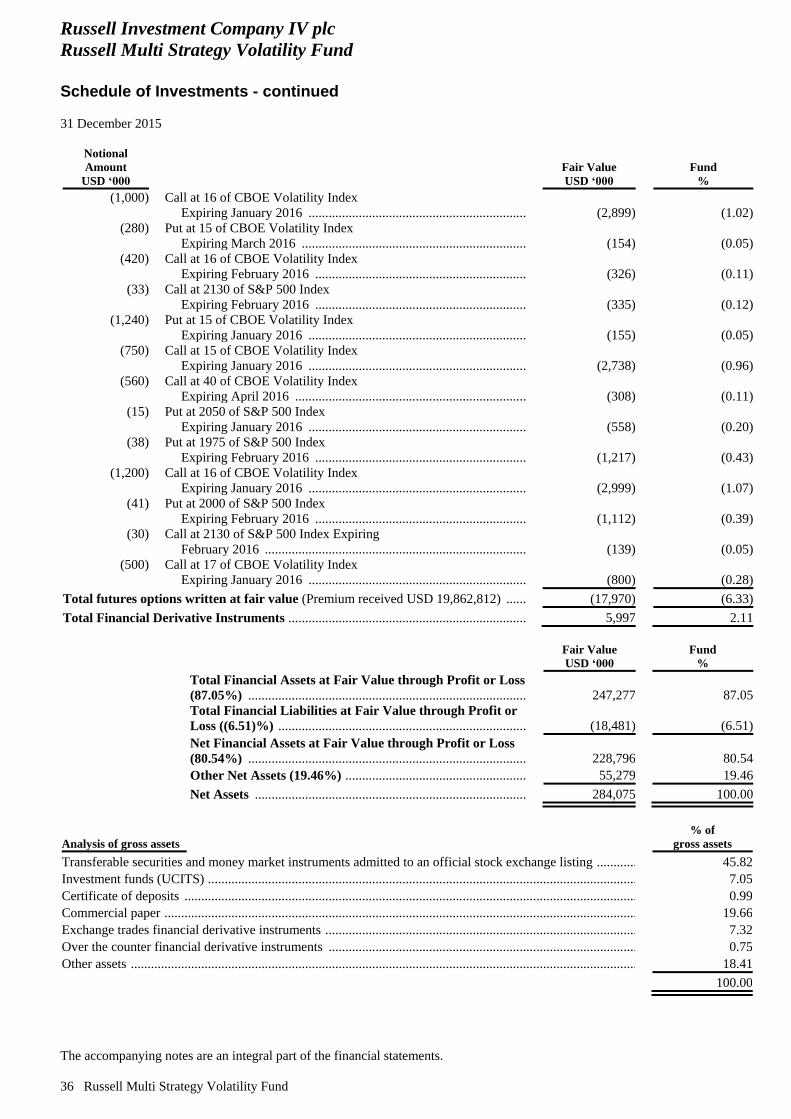
Russell Investment Company IV plc
Russell Multi Strategy Volatility Fund
Schedule of Investments - continued
31 December 2015
The accompanying notes are an integral part of the financial statements.
36 Russell Multi Strategy Volatility Fund
Notional
Amount
USD ‘000
Fair Value
USD ‘000
Fund
%
(1,000)
Call at 16 of CBOE Volatility Index
Expiring January 2016 ................................................................. (2,899) (1.02)
(280)
Put at 15 of CBOE Volatility Index
Expiring March 2016 ................................................................... (154) (0.05)
(420)
Call at 16 of CBOE Volatility Index
Expiring February 2016 ............................................................... (326) (0.11)
(33)
Call at 2130 of S&P 500 Index
Expiring February 2016 ............................................................... (335) (0.12)
(1,240)
Put at 15 of CBOE Volatility Index
Expiring January 2016 ................................................................. (155) (0.05)
(750)
Call at 15 of CBOE Volatility Index
Expiring January 2016 ................................................................. (2,738) (0.96)
(560)
Call at 40 of CBOE Volatility Index
Expiring April 2016 ..................................................................... (308) (0.11)
(15)
Put at 2050 of S&P 500 Index
Expiring January 2016 ................................................................. (558) (0.20)
(38)
Put at 1975 of S&P 500 Index
Expiring February 2016 ............................................................... (1,217) (0.43)
(1,200)
Call at 16 of CBOE Volatility Index
Expiring January 2016 ................................................................. (2,999) (1.07)
(41)
Put at 2000 of S&P 500 Index
Expiring February 2016 ............................................................... (1,112) (0.39)
(30)
Call at 2130 of S&P 500 Index Expiring
February 2016 .............................................................................. (139) (0.05)
(500)
Call at 17 of CBOE Volatility Index
Expiring January 2016 ................................................................. (800) (0.28)
Total futures options written at fair value (Premium received USD 19,862,812) .......... (17,970) (6.33)
Total Financial Derivative Instruments .................................................................................................... 5,997 2.11
Fair Value
USD ‘000
Fund
%
Total Financial Assets at Fair Value through Profit or Loss
(87.05%) ............................................................................................................................... 247,277 87.05
Total Financial Liabilities at Fair Value through Profit or
Loss ((6.51)%) ...................................................................................................................... (18,481) (6.51)
Net Financial Assets at Fair Value through Profit or Loss
(80.54%) .................................................................................................................................................... 228,796 80.54
Other Net Assets (19.46%) ....................................................................................................................... 55,279 19.46
Net Assets .................................................................................................................................................. 284,075 100.00
Analysis of gross assets
% of
gross assets
Transferable securities and money market instruments admitted to an official stock exchange listing ................... 45.82
Investment funds (UCITS) ....................................................................................................................................... 7.05
Certificate of deposits .............................................................................................................................................. 0.99
Commercial paper .................................................................................................................................................... 19.66
Exchange trades financial derivative instruments .................................................................................................... 7.32
Over the counter financial derivative instruments ................................................................................................... 0.75
Other assets .............................................................................................................................................................. 18.41
100.00
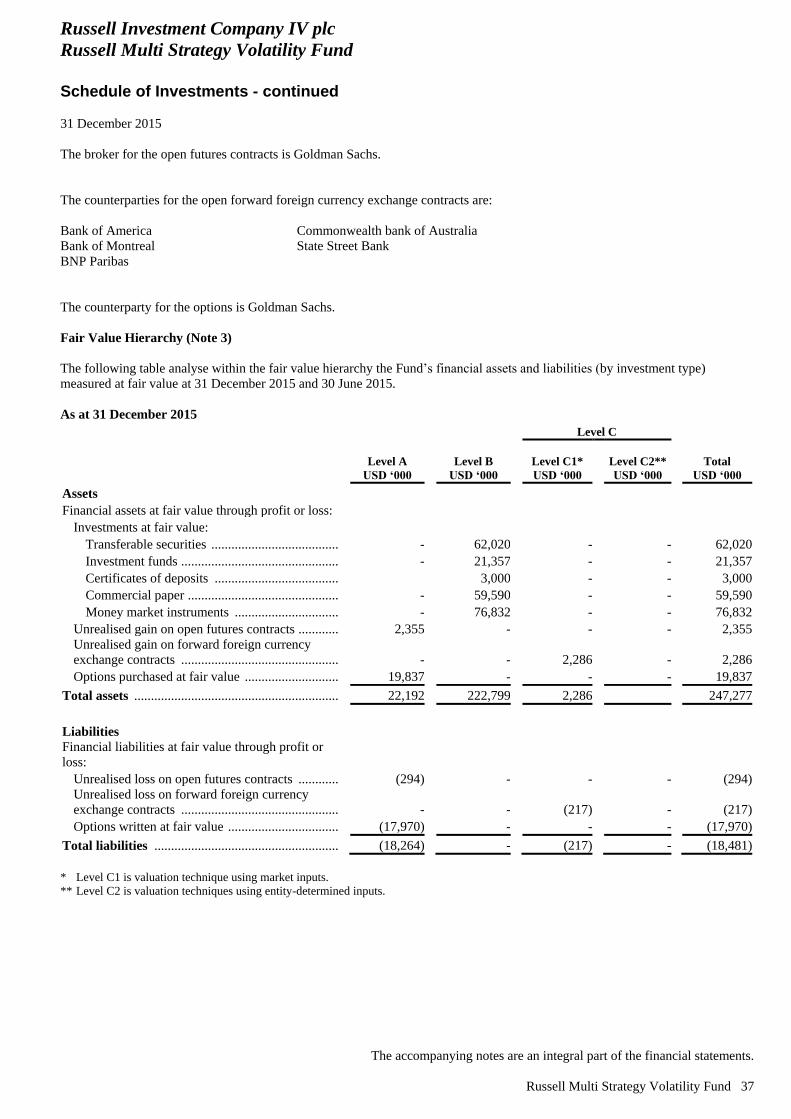
Russell Investment Company IV plc
Russell Multi Strategy Volatility Fund
Schedule of Investments - continued
31 December 2015
The accompanying notes are an integral part of the financial statements.
Russell Multi Strategy Volatility Fund 37
The broker for the open futures contracts is Goldman Sachs.
The counterparties for the open forward foreign currency exchange contracts are:
Bank of America
Bank of Montreal
BNP Paribas
Commonwealth bank of Australia
State Street Bank
The counterparty for the options is Goldman Sachs.
Fair Value Hierarchy (Note 3)
The following table analyse within the fair value hierarchy the Fund’s financial assets and liabilities (by investment type)
measured at fair value at 31 December 2015 and 30 June 2015.
As at 31 December 2015
Level C
Level A
USD ‘000
Level B
USD ‘000
Level C1*
USD ‘000
Level C2**
USD ‘000
Total
USD ‘000
Assets
Financial assets at fair value through profit or loss:
Investments at fair value:
Transferable securities ............................................................... - 62,020 - - 62,020
Investment funds ........................................................................ - 21,357 - - 21,357
Certificates of deposits .............................................................. 3,000 - - 3,000
Commercial paper ...................................................................... - 59,590 - - 59,590
Money market instruments ........................................................ - 76,832 - - 76,832
Unrealised gain on open futures contracts ..................................... 2,355 - - - 2,355
Unrealised gain on forward foreign currency
exchange contracts ........................................................................ - - 2,286 - 2,286
Options purchased at fair value ..................................................... 19,837 - - - 19,837
Total assets ...................................................................................... 22,192 222,799 2,286 247,277
Liabilities
Financial liabilities at fair value through profit or
loss:
Unrealised loss on open futures contracts ..................................... (294) - - - (294)
Unrealised loss on forward foreign currency
exchange contracts ........................................................................ - - (217) - (217)
Options written at fair value .......................................................... (17,970) - - - (17,970)
Total liabilities ................................................................................ (18,264) - (217) - (18,481)
* Level C1 is valuation technique using market inputs.
** Level C2 is valuation techniques using entity-determined inputs.
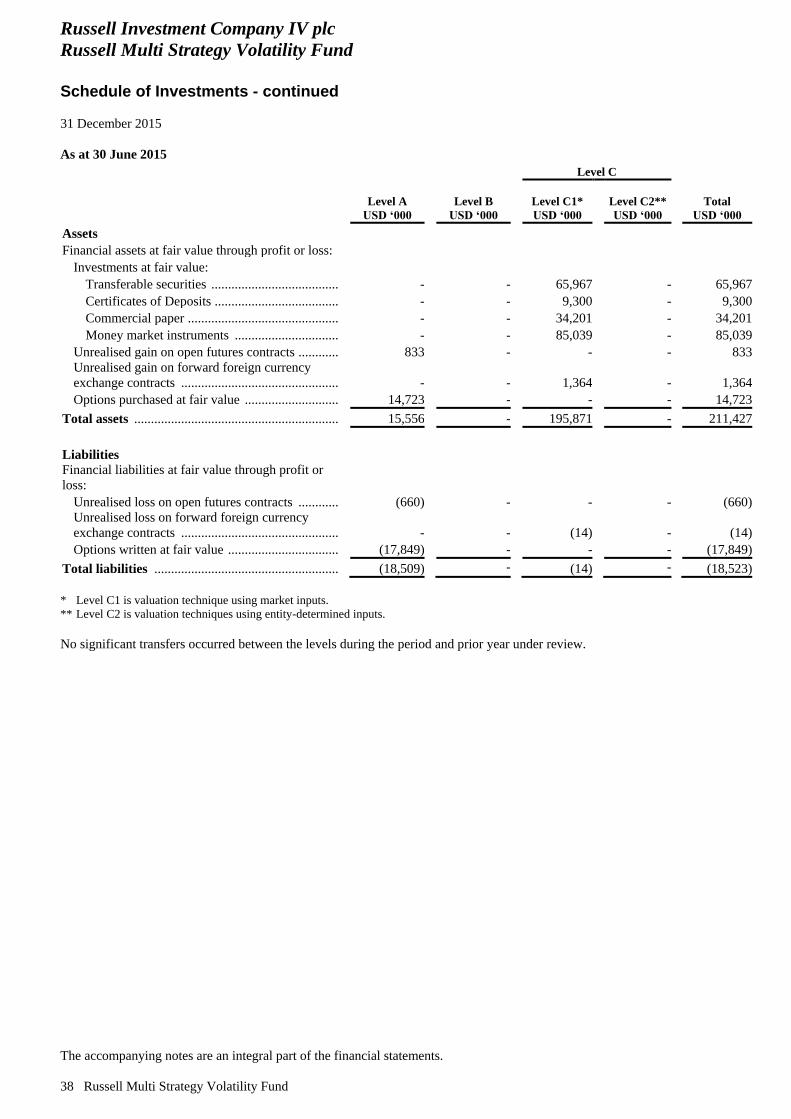
Russell Investment Company IV plc
Russell Multi Strategy Volatility Fund
Schedule of Investments - continued
31 December 2015
The accompanying notes are an integral part of the financial statements.
38 Russell Multi Strategy Volatility Fund
As at 30 June 2015
Level C
Level A
USD ‘000
Level B
USD ‘000
Level C1*
USD ‘000
Level C2**
USD ‘000
Total
USD ‘000
Assets
Financial assets at fair value through profit or loss:
Investments at fair value:
Transferable securities ............................................................... - - 65,967 - 65,967
Certificates of Deposits .............................................................. - - 9,300 - 9,300
Commercial paper ...................................................................... - - 34,201 - 34,201
Money market instruments ........................................................ - - 85,039 - 85,039
Unrealised gain on open futures contracts ..................................... 833 - - - 833
Unrealised gain on forward foreign currency
exchange contracts ........................................................................ - - 1,364 - 1,364
Options purchased at fair value ..................................................... 14,723 - - - 14,723
Total assets ...................................................................................... 15,556 - 195,871 - 211,427
Liabilities
Financial liabilities at fair value through profit or
loss:
Unrealised loss on open futures contracts ..................................... (660) - - - (660)
Unrealised loss on forward foreign currency
exchange contracts ........................................................................ - - (14) - (14)
Options written at fair value .......................................................... (17,849) - - - (17,849)
Total liabilities ................................................................................ (18,509) - (14) - (18,523)
* Level C1 is valuation technique using market inputs.
** Level C2 is valuation techniques using entity-determined inputs.
No significant transfers occurred between the levels during the period and prior year under review.
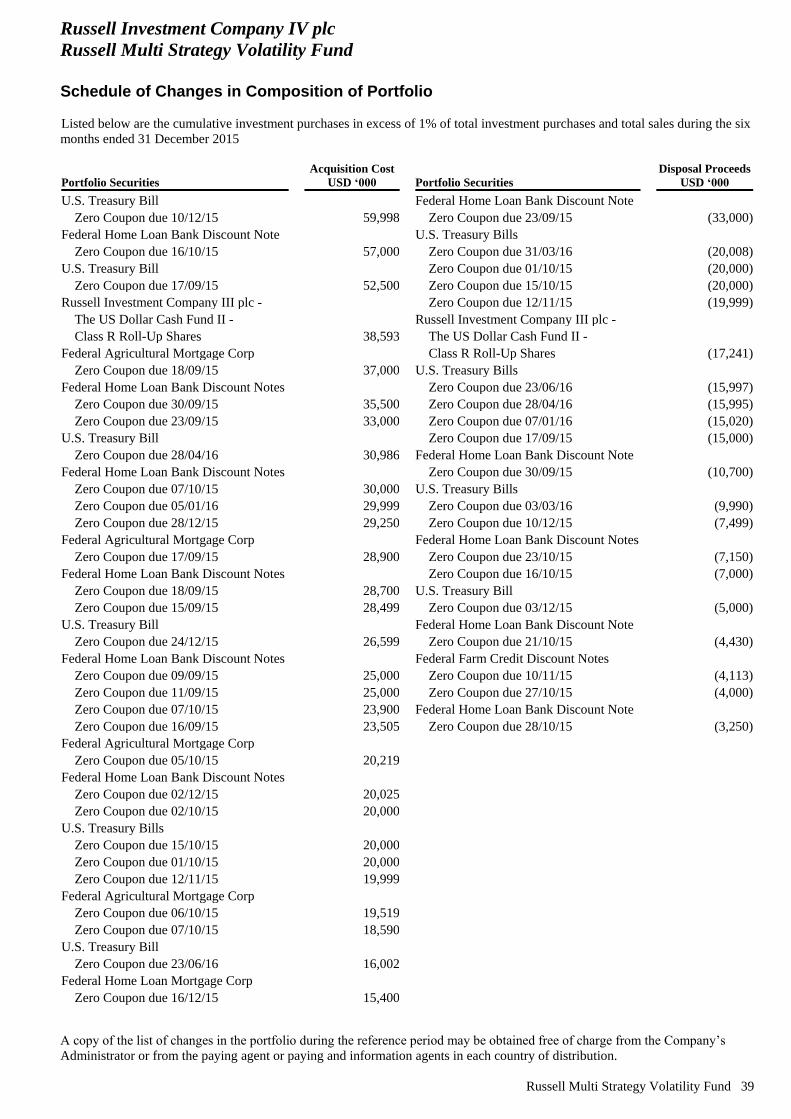
Russell Investment Company IV plc
Russell Multi Strategy Volatility Fund
Schedule of Changes in Composition of Portfolio
Listed below are the cumulative investment purchases in excess of 1% of total investment purchases and total sales during the six
months ended 31 December 2015
A copy of the list of changes in the portfolio during the reference period may be obtained free of charge from the Company’s
Administrator or from the paying agent or paying and information agents in each country of distribution.
Russell Multi Strategy Volatility Fund 39
Portfolio Securities
Acquisition Cost
USD ‘000 Portfolio Securities
Disposal Proceeds
USD ‘000
U.S. Treasury Bill Federal Home Loan Bank Discount Note
Zero Coupon due 10/12/15 59,998 Zero Coupon due 23/09/15 (33,000)
Federal Home Loan Bank Discount Note U.S. Treasury Bills
Zero Coupon due 16/10/15 57,000 Zero Coupon due 31/03/16 (20,008)
U.S. Treasury Bill Zero Coupon due 01/10/15 (20,000)
Zero Coupon due 17/09/15 52,500 Zero Coupon due 15/10/15 (20,000)
Russell Investment Company III plc - Zero Coupon due 12/11/15 (19,999)
The US Dollar Cash Fund II - Russell Investment Company III plc -
Class R Roll-Up Shares 38,593 The US Dollar Cash Fund II -
Federal Agricultural Mortgage Corp Class R Roll-Up Shares (17,241)
Zero Coupon due 18/09/15 37,000 U.S. Treasury Bills
Federal Home Loan Bank Discount Notes Zero Coupon due 23/06/16 (15,997)
Zero Coupon due 30/09/15 35,500 Zero Coupon due 28/04/16 (15,995)
Zero Coupon due 23/09/15 33,000 Zero Coupon due 07/01/16 (15,020)
U.S. Treasury Bill Zero Coupon due 17/09/15 (15,000)
Zero Coupon due 28/04/16 30,986 Federal Home Loan Bank Discount Note
Federal Home Loan Bank Discount Notes Zero Coupon due 30/09/15 (10,700)
Zero Coupon due 07/10/15 30,000 U.S. Treasury Bills
Zero Coupon due 05/01/16 29,999 Zero Coupon due 03/03/16 (9,990)
Zero Coupon due 28/12/15 29,250 Zero Coupon due 10/12/15 (7,499)
Federal Agricultural Mortgage Corp Federal Home Loan Bank Discount Notes
Zero Coupon due 17/09/15 28,900 Zero Coupon due 23/10/15 (7,150)
Federal Home Loan Bank Discount Notes Zero Coupon due 16/10/15 (7,000)
Zero Coupon due 18/09/15 28,700 U.S. Treasury Bill
Zero Coupon due 15/09/15 28,499 Zero Coupon due 03/12/15 (5,000)
U.S. Treasury Bill Federal Home Loan Bank Discount Note
Zero Coupon due 24/12/15 26,599 Zero Coupon due 21/10/15 (4,430)
Federal Home Loan Bank Discount Notes Federal Farm Credit Discount Notes
Zero Coupon due 09/09/15 25,000 Zero Coupon due 10/11/15 (4,113)
Zero Coupon due 11/09/15 25,000 Zero Coupon due 27/10/15 (4,000)
Zero Coupon due 07/10/15 23,900 Federal Home Loan Bank Discount Note
Zero Coupon due 16/09/15 23,505 Zero Coupon due 28/10/15 (3,250)
Federal Agricultural Mortgage Corp
Zero Coupon due 05/10/15 20,219
Federal Home Loan Bank Discount Notes
Zero Coupon due 02/12/15 20,025
Zero Coupon due 02/10/15 20,000
U.S. Treasury Bills
Zero Coupon due 15/10/15 20,000
Zero Coupon due 01/10/15 20,000
Zero Coupon due 12/11/15 19,999
Federal Agricultural Mortgage Corp
Zero Coupon due 06/10/15 19,519
Zero Coupon due 07/10/15 18,590
U.S. Treasury Bill
Zero Coupon due 23/06/16 16,002
Federal Home Loan Mortgage Corp
Zero Coupon due 16/12/15 15,400
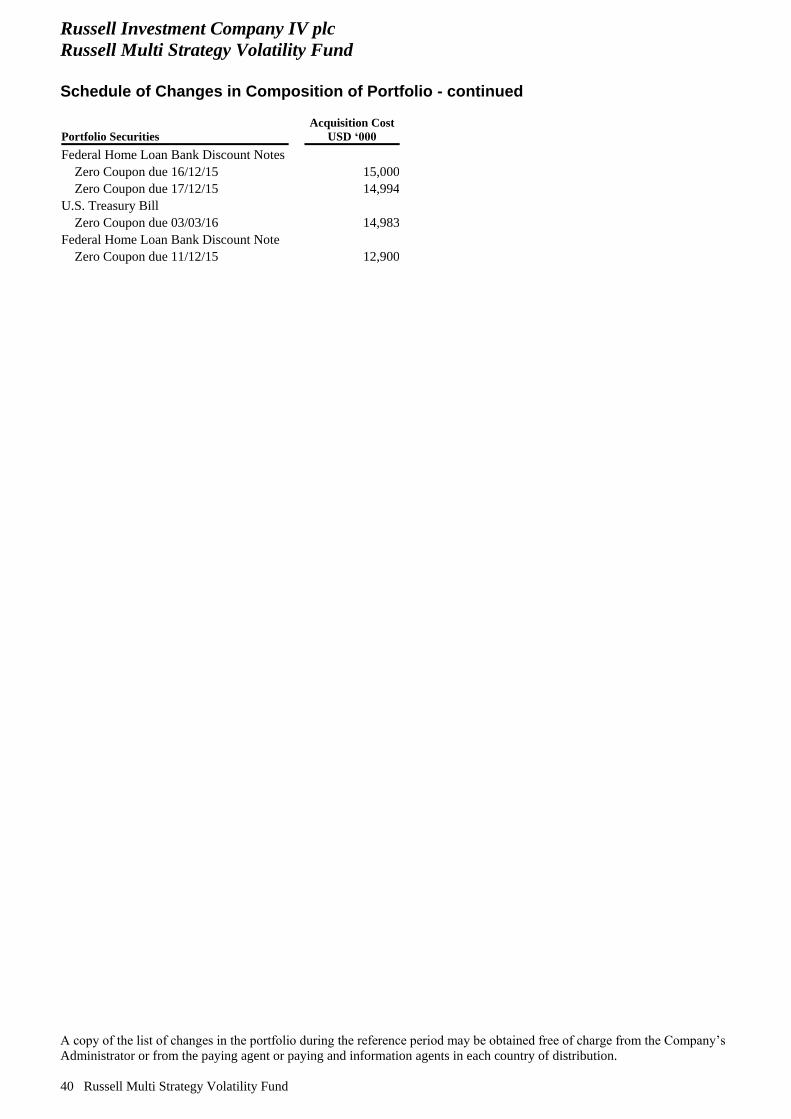
Russell Investment Company IV plc
Russell Multi Strategy Volatility Fund
Schedule of Changes in Composition of Portfolio - continued
A copy of the list of changes in the portfolio during the reference period may be obtained free of charge from the Company’s
Administrator or from the paying agent or paying and information agents in each country of distribution.
40 Russell Multi Strategy Volatility Fund
Portfolio Securities
Acquisition Cost
USD ‘000
Federal Home Loan Bank Discount Notes
Zero Coupon due 16/12/15 15,000
Zero Coupon due 17/12/15 14,994
U.S. Treasury Bill
Zero Coupon due 03/03/16 14,983
Federal Home Loan Bank Discount Note
Zero Coupon due 11/12/15 12,900

Russell Investment Company IV plc
Russell Global Regional Equity Fund
Balance Sheet
As at 31 December 2015
The accompanying notes are an integral part of the financial statements.
Russell Global Regional Equity Fund 41
31 December 2015*
(Unaudited)
EUR ‘000
Assets
Financial assets at fair value through profit or loss (Note 2) ........................................................................ 321,435
Cash at bank (Note 4) ...................................................................................................................................... 1,863
Cash held with brokers and counterparties for open financial derivative instruments (Note 4) ...................... 6,275
Debtors:
Receivable for investments sold ................................................................................................................... 191
Dividends receivable .................................................................................................................................... 280
330,044
Liabilities
Financial liabilities at fair value through profit or loss (Note 2) .................................................................. (1,653)
Creditors – amounts falling due within one year:
Payable for investments purchased ........................................................................................................... (148)
Management fees payable ............................................................................................................................ (125)
Performance fees payable ............................................................................................................................. (164)
Custodian and Trustee fees payable ............................................................................................................. (6)
Sub-custodian fees payable .......................................................................................................................... (60)
Administration fees payable ......................................................................................................................... (13)
Audit fees payable ........................................................................................................................................ (11)
Other fees payable ........................................................................................................................................ (5)
(2,185)
Net asset value attributable to redeemable participating shareholders .............................................. 327,859
* The Fund was launched on 7 July 2015.
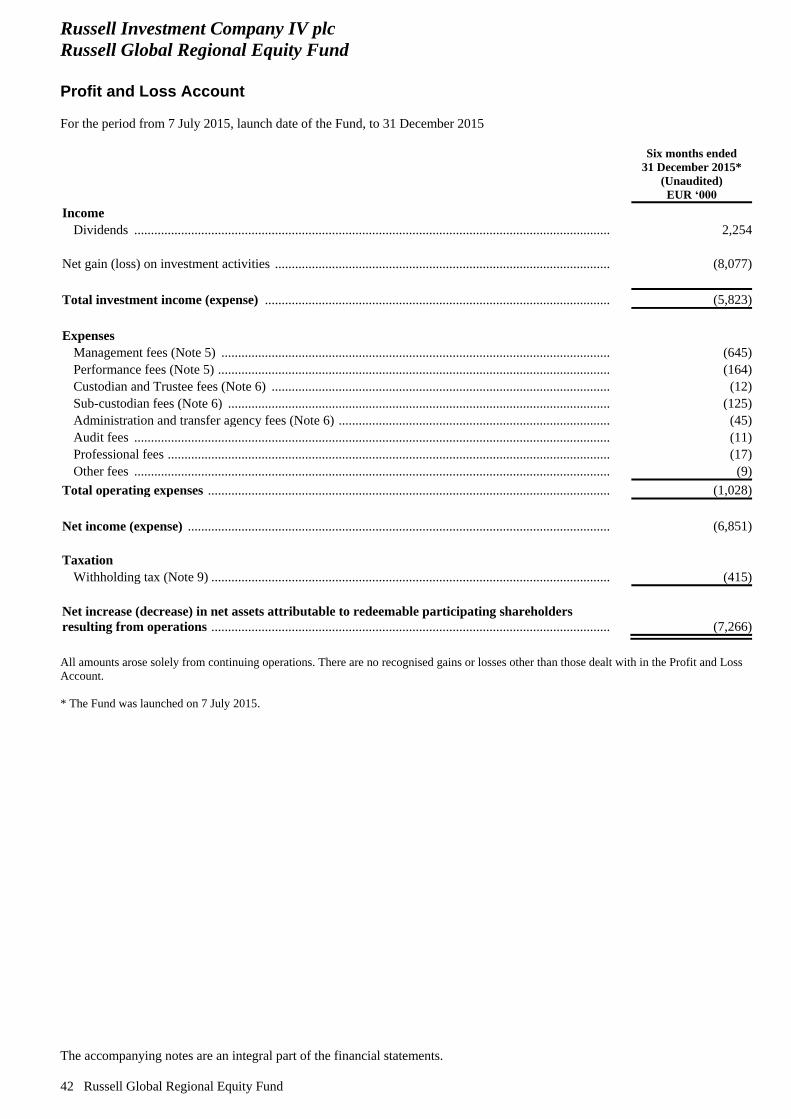
Russell Investment Company IV plc
Russell Global Regional Equity Fund
Profit and Loss Account
For the period from 7 July 2015, launch date of the Fund, to 31 December 2015
The accompanying notes are an integral part of the financial statements.
42 Russell Global Regional Equity Fund
Six months ended
31 December 2015*
(Unaudited)
EUR ‘000
Income
Dividends .............................................................................................................................................. 2,254
Net gain (loss) on investment activities ........................................................................................................... (8,077)
Total investment income (expense) ........................................................................................................... (5,823)
Expenses
Management fees (Note 5) ........................................................................................................................ (645)
Performance fees (Note 5) ......................................................................................................................... (164)
Custodian and Trustee fees (Note 6) ......................................................................................................... (12)
Sub-custodian fees (Note 6) ...................................................................................................................... (125)
Administration and transfer agency fees (Note 6) ..................................................................................... (45)
Audit fees .................................................................................................................................................. (11)
Professional fees ........................................................................................................................................ (17)
Other fees .................................................................................................................................................. (9)
Total operating expenses ........................................................................................................................ (1,028)
Net income (expense) .................................................................................................................................. (6,851)
Taxation
Withholding tax (Note 9) ........................................................................................................................ (415)
Net increase (decrease) in net assets attributable to redeemable participating shareholders
resulting from operations .............................................................................................................................. (7,266)
All amounts arose solely from continuing operations. There are no recognised gains or losses other than those dealt with in the Profit and Loss
Account.
* The Fund was launched on 7 July 2015.

Russell Investment Company IV plc
Russell Global Regional Equity Fund
Statement of Changes in Net Assets Attributable to Redeemable Participating Shareholders
For the period from 7 July 2015, launch date of the Fund, to 31 December 2015
The accompanying notes are an integral part of the financial statements.
Russell Global Regional Equity Fund 43
Period ended
31 December 2015*
(Unaudited)
EUR ‘000
Net increase (decrease) in net assets attributable to redeemable participating shareholders
resulting from operations ........................................................................................................................ (7,266)
Share transactions
Net increase (decrease) in net assets resulting from redeemable participating share transactions
(Note 10) ................................................................................................................................................... 335,125
Total net increase (decrease) in net assets attributable to redeemable participating
shareholders ............................................................................................................................................. 327,859
Net assets attributable to redeemable participating shareholders
Beginning of period ................................................................................................................................ -
End of period .......................................................................................................................................... 327,859
* The Fund was launched on 7 July 2015.
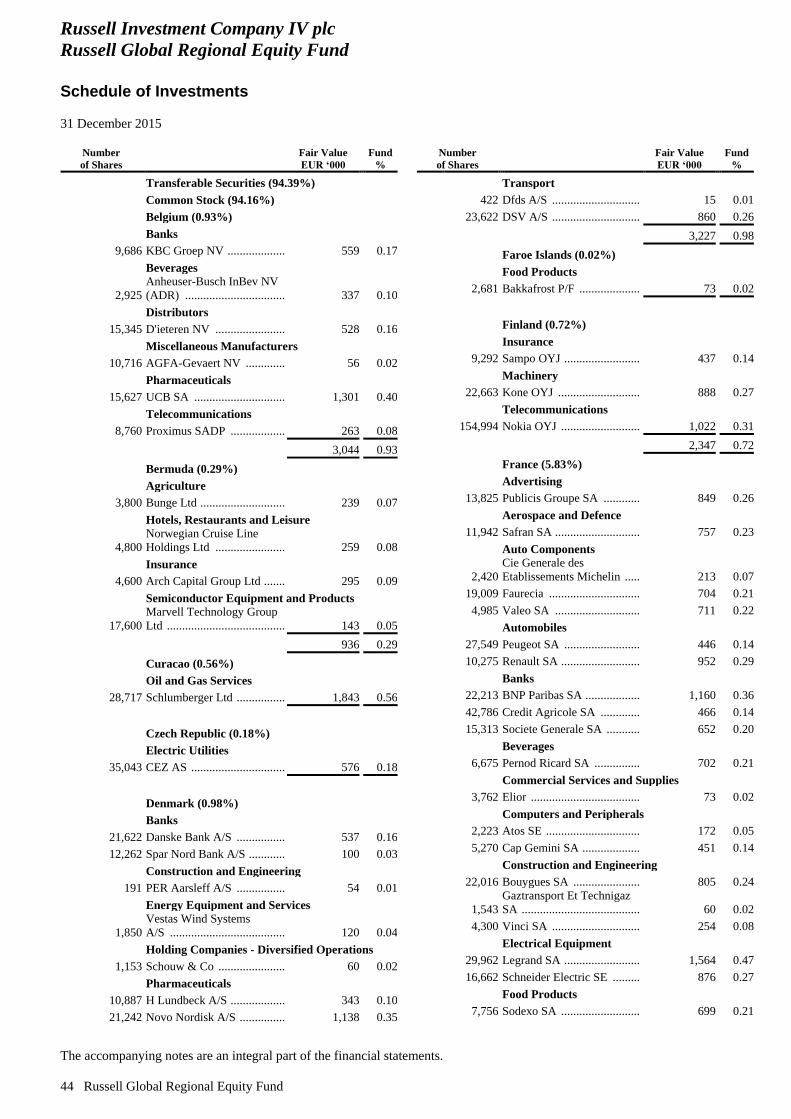
Russell Investment Company IV plc
Russell Global Regional Equity Fund
Schedule of Investments
31 December 2015
The accompanying notes are an integral part of the financial statements.
44 Russell Global Regional Equity Fund
Number
of Shares
Fair Value
EUR ‘000
Fund
%
Transferable Securities (94.39%)
Common Stock (94.16%)
Belgium (0.93%)
Banks
9,686 KBC Groep NV ................... 559 0.17
Beverages
2,925
Anheuser-Busch InBev NV
(ADR) ................................. 337 0.10
Distributors
15,345 D'ieteren NV ....................... 528 0.16
Miscellaneous Manufacturers
10,716 AGFA-Gevaert NV ............. 56 0.02
Pharmaceuticals
15,627 UCB SA .............................. 1,301 0.40
Telecommunications
8,760 Proximus SADP .................. 263 0.08
3,044 0.93
Bermuda (0.29%)
Agriculture
3,800 Bunge Ltd ............................ 239 0.07
Hotels, Restaurants and Leisure
4,800
Norwegian Cruise Line
Holdings Ltd ....................... 259 0.08
Insurance
4,600 Arch Capital Group Ltd ....... 295 0.09
Semiconductor Equipment and Products
17,600
Marvell Technology Group
Ltd ....................................... 143 0.05
936 0.29
Curacao (0.56%)
Oil and Gas Services
28,717 Schlumberger Ltd ................ 1,843 0.56
Czech Republic (0.18%)
Electric Utilities
35,043 CEZ AS ............................... 576 0.18
Denmark (0.98%)
Banks
21,622 Danske Bank A/S ................ 537 0.16
12,262 Spar Nord Bank A/S ............ 100 0.03
Construction and Engineering
191 PER Aarsleff A/S ................ 54 0.01
Energy Equipment and Services
1,850
Vestas Wind Systems
A/S ...................................... 120 0.04
Holding Companies - Diversified Operations
1,153 Schouw & Co ...................... 60 0.02
Pharmaceuticals
10,887 H Lundbeck A/S .................. 343 0.10
21,242 Novo Nordisk A/S ............... 1,138 0.35
Number
of Shares
Fair Value
EUR ‘000
Fund
%
Transport
422 Dfds A/S ............................. 15 0.01
23,622 DSV A/S ............................. 860 0.26
3,227 0.98
Faroe Islands (0.02%)
Food Products
2,681 Bakkafrost P/F .................... 73 0.02
Finland (0.72%)
Insurance
9,292 Sampo OYJ ......................... 437 0.14
Machinery
22,663 Kone OYJ ........................... 888 0.27
Telecommunications
154,994 Nokia OYJ .......................... 1,022 0.31
2,347 0.72
France (5.83%)
Advertising
13,825 Publicis Groupe SA ............ 849 0.26
Aerospace and Defence
11,942 Safran SA ............................ 757 0.23
Auto Components
2,420
Cie Generale des
Etablissements Michelin ..... 213 0.07
19,009 Faurecia .............................. 704 0.21
4,985 Valeo SA ............................ 711 0.22
Automobiles
27,549 Peugeot SA ......................... 446 0.14
10,275 Renault SA .......................... 952 0.29
Banks
22,213 BNP Paribas SA .................. 1,160 0.36
42,786 Credit Agricole SA ............. 466 0.14
15,313 Societe Generale SA ........... 652 0.20
Beverages
6,675 Pernod Ricard SA ............... 702 0.21
Commercial Services and Supplies
3,762 Elior .................................... 73 0.02
Computers and Peripherals
2,223 Atos SE ............................... 172 0.05
5,270 Cap Gemini SA ................... 451 0.14
Construction and Engineering
22,016 Bouygues SA ...................... 805 0.24
1,543
Gaztransport Et Technigaz
SA ....................................... 60 0.02
4,300 Vinci SA ............................. 254 0.08
Electrical Equipment
29,962 Legrand SA ......................... 1,564 0.47
16,662 Schneider Electric SE ......... 876 0.27
Food Products
7,756 Sodexo SA .......................... 699 0.21

Russell Investment Company IV plc
Russell Global Regional Equity Fund
Schedule of Investments - continued
31 December 2015
The accompanying notes are an integral part of the financial statements.
Russell Global Regional Equity Fund 45
Number
of Shares
Fair Value
EUR ‘000
Fund
%
Health Care Providers and Services
1,826 BioMerieux ......................... 201 0.06
Household Products
1,374 Societe BIC SA ................... 208 0.06
Insurance
3,420 AXA SA .............................. 86 0.03
Metals and Mining
31,677 Vallourec SA ....................... 272 0.08
Oil and Gas
32,035 Total SA .............................. 1,322 0.40
Other Finance
350 Eurazeo SA ......................... 22 0.01
Personal Products
3,548 L'Oreal SA ........................... 551 0.17
Pharmaceuticals
2,153 Ipsen SA .............................. 131 0.04
16,736 Sanofi .................................. 1,315 0.40
Telecommunications
14,720 Orange SA ........................... 228 0.07
Textile and Apparel
4,248 Christian Dior SE ................ 666 0.20
3,379
LVMH Moet Hennessy
Louis Vuitton SE ................. 490 0.15
36,750
LVMH Moet Hennessy
Louis Vuitton SE (ADR) ..... 1,065 0.33
19,123 5.83
Germany (5.43%)
Auto Components
3,094 Continental AG ................... 695 0.21
3,081 Norma Group SE ................. 158 0.05
Beverages
2,890 Royal Unibrew A/S ............. 108 0.03
Chemicals
13,248 Evonik Industries AG .......... 406 0.12
7,160 Lanxess AG ......................... 306 0.09
4,072 Linde AG ............................. 545 0.17
Commercial Services and Supplies
16,852 Wirecard AG ....................... 784 0.24
Construction and Engineering
260 Hochtief AG ........................ 22 0.01
Containers and Packaging
5,336 Gerresheimer AG ................ 385 0.12
Diversified Financials
19,773 Deutsche Boerse AG ........... 1,609 0.49
Electrical Equipment
6,180 OSRAM Licht AG .............. 240 0.07
Food Products
1,050 Metro AG ............................ 31 0.01
Health Care Providers and Services
20,529
Fresenius SE & Co
KGaA .................................. 1,354 0.41
Number
of Shares
Fair Value
EUR ‘000
Fund
%
Insurance
4,854 Allianz SE ........................... 794 0.24
5,806
Muenchener
Rueckversicherungs-
Gesellschaft AG in
Muenchen ........................... 1,071 0.33
Internet Software and Services
8,054 United Internet AG ............. 410 0.13
Iron and Steel
62,677 Salzgitter AG ...................... 1,424 0.43
Media
20,184 ProSiebenSat.1 Media SE ... 944 0.29
Metals and Mining
7,587 Aurubis AG ......................... 356 0.11
Personal Products
3,269 Beiersdorf AG ..................... 275 0.08
Pharmaceuticals
20,429 Bayer AG ............................ 2,366 0.72
4,704 Merck KGaA ...................... 421 0.13
Semiconductor Equipment and Products
39,341
Infineon Technologies
AG ...................................... 531 0.16
Software
2,520 SAP SE ............................... 185 0.06
Telecommunications
44,993 Deutsche Telekom AG ........ 751 0.23
Textile and Apparel
18,220 Adidas AG .......................... 1,638 0.50
17,809 5.43
Hungary (0.15%)
Banks
25,610 OTP Bank Plc ..................... 486 0.15
Ireland (1.24%)
Computers and Peripherals
6,220 Accenture Plc ...................... 598 0.18
Food Products
8,879 Kerry Group Plc .................. 678 0.21
Insurance
11,375 Willis Group Holdings Plc .. 509 0.15
Pharmaceuticals
5,425 Allergan Plc ........................ 1,561 0.48
Retail Trade
72,403 Grafton Group Plc ............... 727 0.22
4,073 1.24
Italy (2.00%)
Banks
9,307 Banca Generali SpA ........... 272 0.08
131,834 UniCredit SpA .................... 677 0.21
Commercial Services and Supplies
2,690 ASTM SpA ......................... 31 0.01
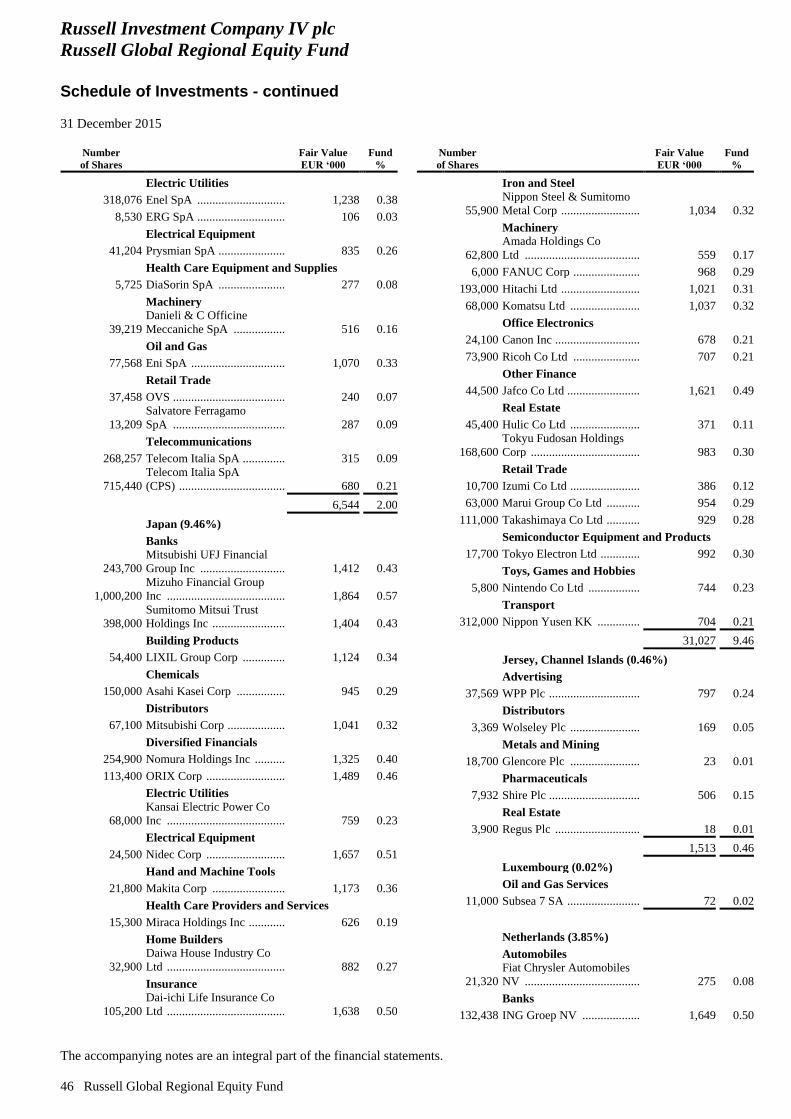
Russell Investment Company IV plc
Russell Global Regional Equity Fund
Schedule of Investments - continued
31 December 2015
The accompanying notes are an integral part of the financial statements.
46 Russell Global Regional Equity Fund
Number
of Shares
Fair Value
EUR ‘000
Fund
%
Electric Utilities
318,076 Enel SpA ............................. 1,238 0.38
8,530 ERG SpA ............................. 106 0.03
Electrical Equipment
41,204 Prysmian SpA ...................... 835 0.26
Health Care Equipment and Supplies
5,725 DiaSorin SpA ...................... 277 0.08
Machinery
39,219
Danieli & C Officine
Meccaniche SpA ................. 516 0.16
Oil and Gas
77,568 Eni SpA ............................... 1,070 0.33
Retail Trade
37,458 OVS ..................................... 240 0.07
13,209
Salvatore Ferragamo
SpA ..................................... 287 0.09
Telecommunications
268,257 Telecom Italia SpA .............. 315 0.09
715,440
Telecom Italia SpA
(CPS) ................................... 680 0.21
6,544 2.00
Japan (9.46%)
Banks
243,700
Mitsubishi UFJ Financial
Group Inc ............................ 1,412 0.43
1,000,200
Mizuho Financial Group
Inc ....................................... 1,864 0.57
398,000
Sumitomo Mitsui Trust
Holdings Inc ........................ 1,404 0.43
Building Products
54,400 LIXIL Group Corp .............. 1,124 0.34
Chemicals
150,000 Asahi Kasei Corp ................ 945 0.29
Distributors
67,100 Mitsubishi Corp ................... 1,041 0.32
Diversified Financials
254,900 Nomura Holdings Inc .......... 1,325 0.40
113,400 ORIX Corp .......................... 1,489 0.46
Electric Utilities
68,000
Kansai Electric Power Co
Inc ....................................... 759 0.23
Electrical Equipment
24,500 Nidec Corp .......................... 1,657 0.51
Hand and Machine Tools
21,800 Makita Corp ........................ 1,173 0.36
Health Care Providers and Services
15,300 Miraca Holdings Inc ............ 626 0.19
Home Builders
32,900
Daiwa House Industry Co
Ltd ....................................... 882 0.27
Insurance
105,200
Dai-ichi Life Insurance Co
Ltd ....................................... 1,638 0.50
Number
of Shares
Fair Value
EUR ‘000
Fund
%
Iron and Steel
55,900
Nippon Steel & Sumitomo
Metal Corp .......................... 1,034 0.32
Machinery
62,800
Amada Holdings Co
Ltd ...................................... 559 0.17
6,000 FANUC Corp ...................... 968 0.29
193,000 Hitachi Ltd .......................... 1,021 0.31
68,000 Komatsu Ltd ....................... 1,037 0.32
Office Electronics
24,100 Canon Inc ............................ 678 0.21
73,900 Ricoh Co Ltd ...................... 707 0.21
Other Finance
44,500 Jafco Co Ltd ........................ 1,621 0.49
Real Estate
45,400 Hulic Co Ltd ....................... 371 0.11
168,600
Tokyu Fudosan Holdings
Corp .................................... 983 0.30
Retail Trade
10,700 Izumi Co Ltd ....................... 386 0.12
63,000 Marui Group Co Ltd ........... 954 0.29
111,000 Takashimaya Co Ltd ........... 929 0.28
Semiconductor Equipment and Products
17,700 Tokyo Electron Ltd ............. 992 0.30
Toys, Games and Hobbies
5,800 Nintendo Co Ltd ................. 744 0.23
Transport
312,000 Nippon Yusen KK .............. 704 0.21
31,027 9.46
Jersey, Channel Islands (0.46%)
Advertising
37,569 WPP Plc .............................. 797 0.24
Distributors
3,369 Wolseley Plc ....................... 169 0.05
Metals and Mining
18,700 Glencore Plc ....................... 23 0.01
Pharmaceuticals
7,932 Shire Plc .............................. 506 0.15
Real Estate
3,900 Regus Plc ............................ 18 0.01
1,513 0.46
Luxembourg (0.02%)
Oil and Gas Services
11,000 Subsea 7 SA ........................ 72 0.02
Netherlands (3.85%)
Automobiles
21,320
Fiat Chrysler Automobiles
NV ...................................... 275 0.08
Banks
132,438 ING Groep NV ................... 1,649 0.50
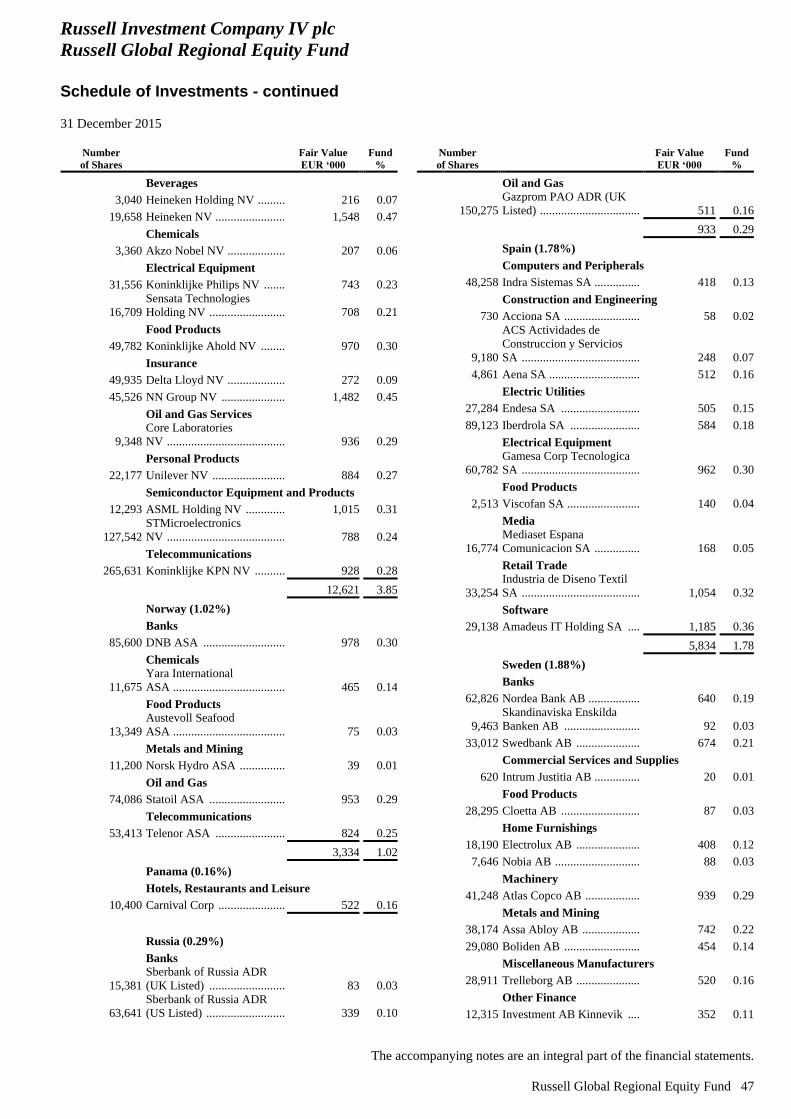
Russell Investment Company IV plc
Russell Global Regional Equity Fund
Schedule of Investments - continued
31 December 2015
The accompanying notes are an integral part of the financial statements.
Russell Global Regional Equity Fund 47
Number
of Shares
Fair Value
EUR ‘000
Fund
%
Beverages
3,040 Heineken Holding NV ......... 216 0.07
19,658 Heineken NV ....................... 1,548 0.47
Chemicals
3,360 Akzo Nobel NV ................... 207 0.06
Electrical Equipment
31,556 Koninklijke Philips NV ....... 743 0.23
16,709
Sensata Technologies
Holding NV ......................... 708 0.21
Food Products
49,782 Koninklijke Ahold NV ........ 970 0.30
Insurance
49,935 Delta Lloyd NV ................... 272 0.09
45,526 NN Group NV ..................... 1,482 0.45
Oil and Gas Services
9,348
Core Laboratories
NV ....................................... 936 0.29
Personal Products
22,177 Unilever NV ........................ 884 0.27
Semiconductor Equipment and Products
12,293 ASML Holding NV ............. 1,015 0.31
127,542
STMicroelectronics
NV ....................................... 788 0.24
Telecommunications
265,631 Koninklijke KPN NV .......... 928 0.28
12,621 3.85
Norway (1.02%)
Banks
85,600 DNB ASA ........................... 978 0.30
Chemicals
11,675
Yara International
ASA ..................................... 465 0.14
Food Products
13,349
Austevoll Seafood
ASA ..................................... 75 0.03
Metals and Mining
11,200 Norsk Hydro ASA ............... 39 0.01
Oil and Gas
74,086 Statoil ASA ......................... 953 0.29
Telecommunications
53,413 Telenor ASA ....................... 824 0.25
3,334 1.02
Panama (0.16%)
Hotels, Restaurants and Leisure
10,400 Carnival Corp ...................... 522 0.16
Russia (0.29%)
Banks
15,381
Sberbank of Russia ADR
(UK Listed) ......................... 83 0.03
63,641
Sberbank of Russia ADR
(US Listed) .......................... 339 0.10
Number
of Shares
Fair Value
EUR ‘000
Fund
%
Oil and Gas
150,275
Gazprom PAO ADR (UK
Listed) ................................. 511 0.16
933 0.29
Spain (1.78%)
Computers and Peripherals
48,258 Indra Sistemas SA ............... 418 0.13
Construction and Engineering
730 Acciona SA ......................... 58 0.02
9,180
ACS Actividades de
Construccion y Servicios
SA ....................................... 248 0.07
4,861 Aena SA .............................. 512 0.16
Electric Utilities
27,284 Endesa SA .......................... 505 0.15
89,123 Iberdrola SA ....................... 584 0.18
Electrical Equipment
60,782
Gamesa Corp Tecnologica
SA ....................................... 962 0.30
Food Products
2,513 Viscofan SA ........................ 140 0.04
Media
16,774
Mediaset Espana
Comunicacion SA ............... 168 0.05
Retail Trade
33,254
Industria de Diseno Textil
SA ....................................... 1,054 0.32
Software
29,138 Amadeus IT Holding SA .... 1,185 0.36
5,834 1.78
Sweden (1.88%)
Banks
62,826 Nordea Bank AB ................. 640 0.19
9,463
Skandinaviska Enskilda
Banken AB ......................... 92 0.03
33,012 Swedbank AB ..................... 674 0.21
Commercial Services and Supplies
620 Intrum Justitia AB ............... 20 0.01
Food Products
28,295 Cloetta AB .......................... 87 0.03
Home Furnishings
18,190 Electrolux AB ..................... 408 0.12
7,646 Nobia AB ............................ 88 0.03
Machinery
41,248 Atlas Copco AB .................. 939 0.29
Metals and Mining
38,174 Assa Abloy AB ................... 742 0.22
29,080 Boliden AB ......................... 454 0.14
Miscellaneous Manufacturers
28,911 Trelleborg AB ..................... 520 0.16
Other Finance
12,315 Investment AB Kinnevik .... 352 0.11
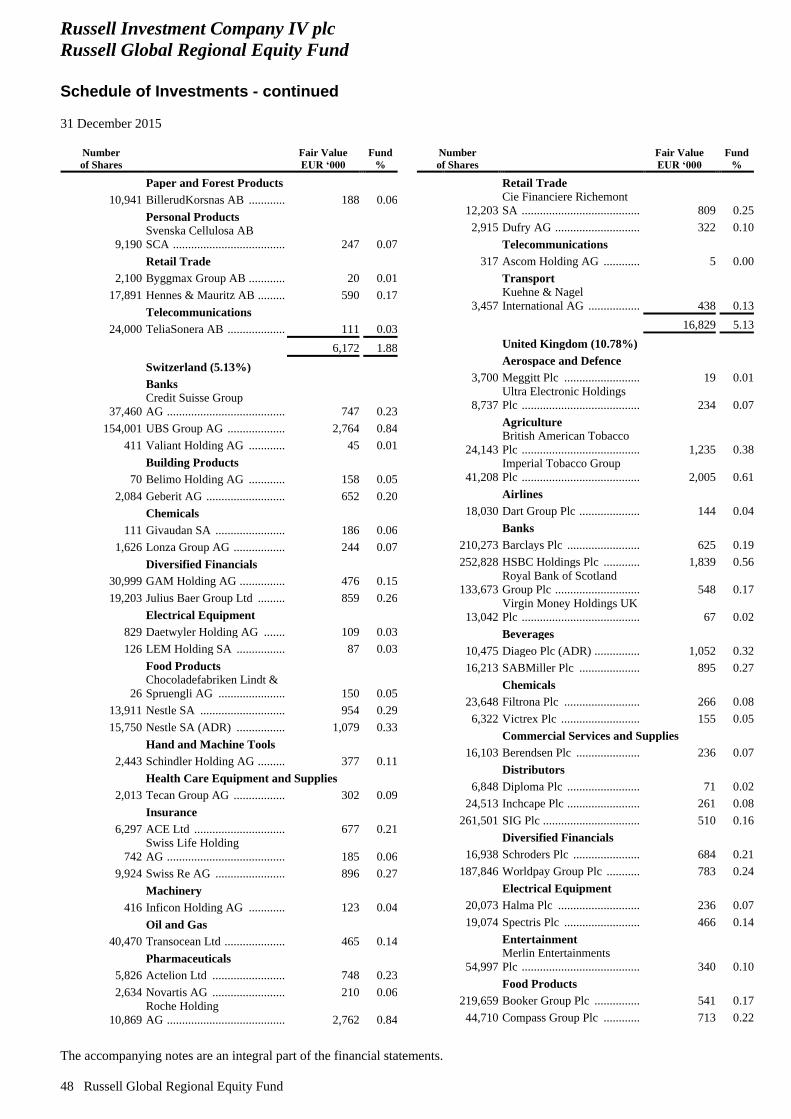
Russell Investment Company IV plc
Russell Global Regional Equity Fund
Schedule of Investments - continued
31 December 2015
The accompanying notes are an integral part of the financial statements.
48 Russell Global Regional Equity Fund
Number
of Shares
Fair Value
EUR ‘000
Fund
%
Paper and Forest Products
10,941 BillerudKorsnas AB ............ 188 0.06
Personal Products
9,190
Svenska Cellulosa AB
SCA ..................................... 247 0.07
Retail Trade
2,100 Byggmax Group AB ............ 20 0.01
17,891 Hennes & Mauritz AB ......... 590 0.17
Telecommunications
24,000 TeliaSonera AB ................... 111 0.03
6,172 1.88
Switzerland (5.13%)
Banks
37,460
Credit Suisse Group
AG ....................................... 747 0.23
154,001 UBS Group AG ................... 2,764 0.84
411 Valiant Holding AG ............ 45 0.01
Building Products
70 Belimo Holding AG ............ 158 0.05
2,084 Geberit AG .......................... 652 0.20
Chemicals
111 Givaudan SA ....................... 186 0.06
1,626 Lonza Group AG ................. 244 0.07
Diversified Financials
30,999 GAM Holding AG ............... 476 0.15
19,203 Julius Baer Group Ltd ......... 859 0.26
Electrical Equipment
829 Daetwyler Holding AG ....... 109 0.03
126 LEM Holding SA ................ 87 0.03
Food Products
26
Chocoladefabriken Lindt &
Spruengli AG ...................... 150 0.05
13,911 Nestle SA ............................ 954 0.29
15,750 Nestle SA (ADR) ................ 1,079 0.33
Hand and Machine Tools
2,443 Schindler Holding AG ......... 377 0.11
Health Care Equipment and Supplies
2,013 Tecan Group AG ................. 302 0.09
Insurance
6,297 ACE Ltd .............................. 677 0.21
742
Swiss Life Holding
AG ....................................... 185 0.06
9,924 Swiss Re AG ....................... 896 0.27
Machinery
416 Inficon Holding AG ............ 123 0.04
Oil and Gas
40,470 Transocean Ltd .................... 465 0.14
Pharmaceuticals
5,826 Actelion Ltd ........................ 748 0.23
2,634 Novartis AG ........................ 210 0.06
10,869
Roche Holding
AG ....................................... 2,762 0.84
Number
of Shares
Fair Value
EUR ‘000
Fund
%
Retail Trade
12,203
Cie Financiere Richemont
SA ....................................... 809 0.25
2,915 Dufry AG ............................ 322 0.10
Telecommunications
317 Ascom Holding AG ............ 5 0.00
Transport
3,457
Kuehne & Nagel
International AG ................. 438 0.13
16,829 5.13
United Kingdom (10.78%)
Aerospace and Defence
3,700 Meggitt Plc ......................... 19 0.01
8,737
Ultra Electronic Holdings
Plc ....................................... 234 0.07
Agriculture
24,143
British American Tobacco
Plc ....................................... 1,235 0.38
41,208
Imperial Tobacco Group
Plc ....................................... 2,005 0.61
Airlines
18,030 Dart Group Plc .................... 144 0.04
Banks
210,273 Barclays Plc ........................ 625 0.19
252,828 HSBC Holdings Plc ............ 1,839 0.56
133,673
Royal Bank of Scotland
Group Plc ............................ 548 0.17
13,042
Virgin Money Holdings UK
Plc ....................................... 67 0.02
Beverages
10,475 Diageo Plc (ADR) ............... 1,052 0.32
16,213 SABMiller Plc .................... 895 0.27
Chemicals
23,648 Filtrona Plc ......................... 266 0.08
6,322 Victrex Plc .......................... 155 0.05
Commercial Services and Supplies
16,103 Berendsen Plc ..................... 236 0.07
Distributors
6,848 Diploma Plc ........................ 71 0.02
24,513 Inchcape Plc ........................ 261 0.08
261,501 SIG Plc ................................ 510 0.16
Diversified Financials
16,938 Schroders Plc ...................... 684 0.21
187,846 Worldpay Group Plc ........... 783 0.24
Electrical Equipment
20,073 Halma Plc ........................... 236 0.07
19,074 Spectris Plc ......................... 466 0.14
Entertainment
54,997
Merlin Entertainments
Plc ....................................... 340 0.10
Food Products
219,659 Booker Group Plc ............... 541 0.17
44,710 Compass Group Plc ............ 713 0.22

Russell Investment Company IV plc
Russell Global Regional Equity Fund
Schedule of Investments - continued
31 December 2015
The accompanying notes are an integral part of the financial statements.
Russell Global Regional Equity Fund 49
Number
of Shares
Fair Value
EUR ‘000
Fund
%
36,513 SSP Group Plc ..................... 161 0.05
24,532
WM Morrison Supermarkets
Plc ....................................... 49 0.01
Health Care Equipment and Supplies
51,334 Smith & Nephew Plc ........... 841 0.26
Home Builders
13,714
Berkeley Group Holdings
Plc ....................................... 686 0.21
5,811 Persimmon Plc .................... 160 0.05
Hotels, Restaurants and Leisure
5,680 Carnival Plc ......................... 298 0.09
Household Products
20,033
Reckitt Benckiser Group
Plc ....................................... 1,707 0.52
Insurance
9,029 Aon Plc ................................ 766 0.23
92,526 Aviva Plc ............................. 648 0.20
8,400
Direct Line Insurance Group
Plc ....................................... 46 0.01
17,176
Jardine Lloyd Thompson
Group Plc ............................ 216 0.07
36,933 Prudential Plc ...................... 767 0.23
106,806
RSA Insurance Group
Plc ....................................... 618 0.19
97,726 Saga Plc ............................... 267 0.08
Internet Software and Services
98,046 Auto Trader Group Plc ........ 591 0.18
Iron and Steel
48,136 Evraz Plc ............................. 48 0.01
Machinery
9,038
Spirax-Sarco Engineering
Plc ....................................... 403 0.12
Media
16,533 Liberty Global Plc ............... 621 0.19
Metals and Mining
2,200 BHP Billiton Plc .................. 23 0.01
Oil and Gas
46,000 BG Group Plc ...................... 615 0.19
113,207 BP Plc .................................. 544 0.17
77,972 Royal Dutch Shell Plc ......... 1,645 0.50
Oil and Gas Services
37,913 Amec Plc ............................. 221 0.07
Other Finance
117,724 3i Group Plc ........................ 769 0.24
16,001 SVG Capital Plc .................. 107 0.03
Paper and Forest Products
5,600 DS Smith Plc ....................... 30 0.01
10,890 Mondi Plc ............................ 197 0.06
Pharmaceuticals
56,531 GlaxoSmithKline Plc ........... 1,053 0.32
8,349
Hikma Pharmaceuticals
Plc ....................................... 261 0.08
95,609 Indivior Plc .......................... 244 0.08
Number
of Shares
Fair Value
EUR ‘000
Fund
%
Real Estate
22,300
ST Modwen Properties
Plc ....................................... 126 0.04
Real Estate Investment Trust
7,068 Derwent London Plc ........... 352 0.10
41,535 Great Portland Estates Plc ... 467 0.14
51,748 Hammerson Plc ................... 421 0.13
22,091 Land Securities Group Plc .. 353 0.11
15,690 Segro Plc ............................. 91 0.03
Retail Trade
42,615
Sports Direct International
Plc ....................................... 334 0.10
8,368 SuperGroup Plc ................... 187 0.06
29,053 Travis Perkins Plc ............... 778 0.24
14,137 WH Smith Plc ..................... 339 0.10
Semiconductor Equipment and Products
57,566 ARM Holdings Plc ............. 812 0.25
1,676 Dialog Semiconductor Plc .. 52 0.01
Software
7,013 EMIS Group Plc ................. 108 0.03
Telecommunications
42,016 BT Group Plc ...................... 269 0.08
606,211 Vodafone Group Plc ........... 1,818 0.56
Transport
50,578 Royal Mail Plc .................... 305 0.09
35,339 10.78
United States (41.00%)
Aerospace and Defence
15,701 BE Aerospace Inc ............... 612 0.18
7,589 TransDigm Group Inc ......... 1,596 0.49
Agriculture
12,000 Altria Group Inc .................. 643 0.20
12,400 Reynolds American Inc ...... 527 0.16
Airlines
10,700 Delta Air Lines Inc ............. 499 0.15
4,400
United Continental Holdings
Inc ....................................... 232 0.07
Auto Components
22,072 Johnson Controls Inc .......... 802 0.25
1,000 Lear Corp ............................ 113 0.03
Automobiles
32,000 Ford Motor Co .................... 415 0.13
17,800 General Motors Co ............. 557 0.17
Banks
14,100
Bank of New York Mellon
Corp .................................... 535 0.16
16,333 Citigroup Inc ....................... 778 0.24
15,800
Citizens Financial Group
Inc ....................................... 381 0.12
8,500 Comerica Inc ....................... 327 0.10
17,233 JPMorgan Chase & Co ....... 1,047 0.32
34,072 Morgan Stanley ................... 998 0.30
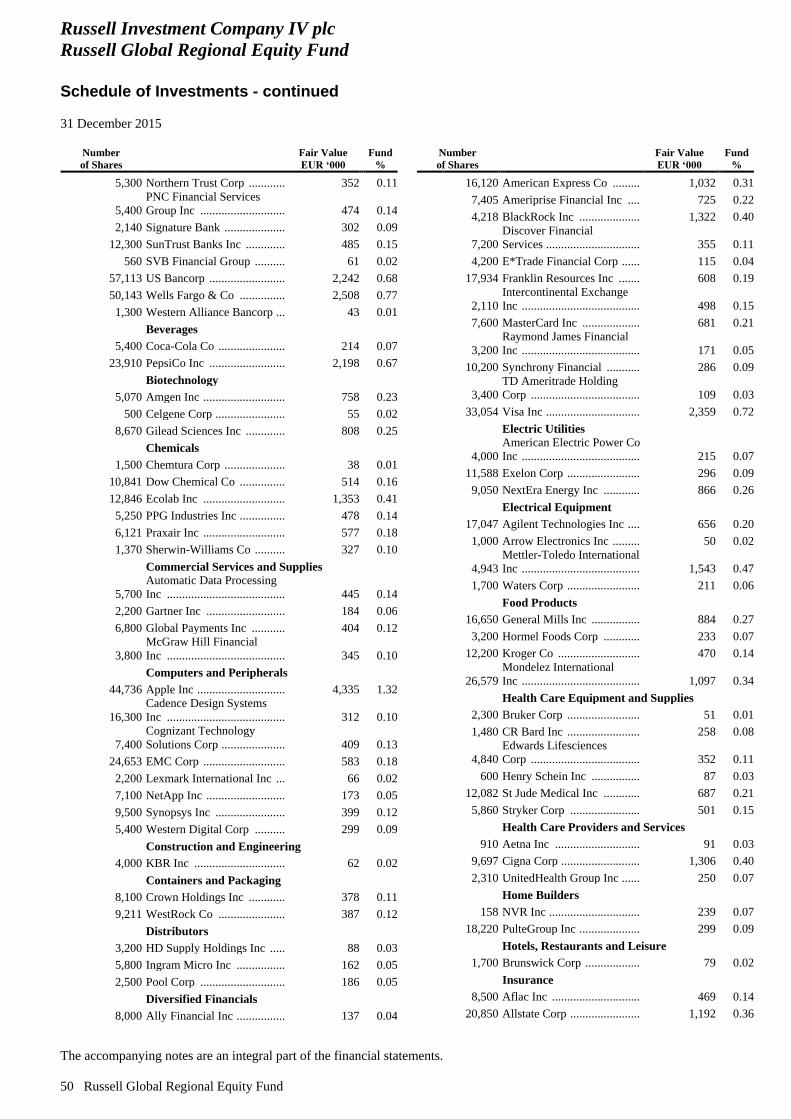
Russell Investment Company IV plc
Russell Global Regional Equity Fund
Schedule of Investments - continued
31 December 2015
The accompanying notes are an integral part of the financial statements.
50 Russell Global Regional Equity Fund
Number
of Shares
Fair Value
EUR ‘000
Fund
%
5,300 Northern Trust Corp ............ 352 0.11
5,400
PNC Financial Services
Group Inc ............................ 474 0.14
2,140 Signature Bank .................... 302 0.09
12,300 SunTrust Banks Inc ............. 485 0.15
560 SVB Financial Group .......... 61 0.02
57,113 US Bancorp ......................... 2,242 0.68
50,143 Wells Fargo & Co ............... 2,508 0.77
1,300 Western Alliance Bancorp ... 43 0.01
Beverages
5,400 Coca-Cola Co ...................... 214 0.07
23,910 PepsiCo Inc ......................... 2,198 0.67
Biotechnology
5,070 Amgen Inc ........................... 758 0.23
500 Celgene Corp ....................... 55 0.02
8,670 Gilead Sciences Inc ............. 808 0.25
Chemicals
1,500 Chemtura Corp .................... 38 0.01
10,841 Dow Chemical Co ............... 514 0.16
12,846 Ecolab Inc ........................... 1,353 0.41
5,250 PPG Industries Inc ............... 478 0.14
6,121 Praxair Inc ........................... 577 0.18
1,370 Sherwin-Williams Co .......... 327 0.10
Commercial Services and Supplies
5,700
Automatic Data Processing
Inc ....................................... 445 0.14
2,200 Gartner Inc .......................... 184 0.06
6,800 Global Payments Inc ........... 404 0.12
3,800
McGraw Hill Financial
Inc ....................................... 345 0.10
Computers and Peripherals
44,736 Apple Inc ............................. 4,335 1.32
16,300
Cadence Design Systems
Inc ....................................... 312 0.10
7,400
Cognizant Technology
Solutions Corp ..................... 409 0.13
24,653 EMC Corp ........................... 583 0.18
2,200 Lexmark International Inc ... 66 0.02
7,100 NetApp Inc .......................... 173 0.05
9,500 Synopsys Inc ....................... 399 0.12
5,400 Western Digital Corp .......... 299 0.09
Construction and Engineering
4,000 KBR Inc .............................. 62 0.02
Containers and Packaging
8,100 Crown Holdings Inc ............ 378 0.11
9,211 WestRock Co ...................... 387 0.12
Distributors
3,200 HD Supply Holdings Inc ..... 88 0.03
5,800 Ingram Micro Inc ................ 162 0.05
2,500 Pool Corp ............................ 186 0.05
Diversified Financials
8,000 Ally Financial Inc ................ 137 0.04
Number
of Shares
Fair Value
EUR ‘000
Fund
%
16,120 American Express Co ......... 1,032 0.31
7,405 Ameriprise Financial Inc .... 725 0.22
4,218 BlackRock Inc .................... 1,322 0.40
7,200
Discover Financial
Services ............................... 355 0.11
4,200 E*Trade Financial Corp ...... 115 0.04
17,934 Franklin Resources Inc ....... 608 0.19
2,110
Intercontinental Exchange
Inc ....................................... 498 0.15
7,600 MasterCard Inc ................... 681 0.21
3,200
Raymond James Financial
Inc ....................................... 171 0.05
10,200 Synchrony Financial ........... 286 0.09
3,400
TD Ameritrade Holding
Corp .................................... 109 0.03
33,054 Visa Inc ............................... 2,359 0.72
Electric Utilities
4,000
American Electric Power Co
Inc ....................................... 215 0.07
11,588 Exelon Corp ........................ 296 0.09
9,050 NextEra Energy Inc ............ 866 0.26
Electrical Equipment
17,047 Agilent Technologies Inc .... 656 0.20
1,000 Arrow Electronics Inc ......... 50 0.02
4,943
Mettler-Toledo International
Inc ....................................... 1,543 0.47
1,700 Waters Corp ........................ 211 0.06
Food Products
16,650 General Mills Inc ................ 884 0.27
3,200 Hormel Foods Corp ............ 233 0.07
12,200 Kroger Co ........................... 470 0.14
26,579
Mondelez International
Inc ....................................... 1,097 0.34
Health Care Equipment and Supplies
2,300 Bruker Corp ........................ 51 0.01
1,480 CR Bard Inc ........................ 258 0.08
4,840
Edwards Lifesciences
Corp .................................... 352 0.11
600 Henry Schein Inc ................ 87 0.03
12,082 St Jude Medical Inc ............ 687 0.21
5,860 Stryker Corp ....................... 501 0.15
Health Care Providers and Services
910 Aetna Inc ............................ 91 0.03
9,697 Cigna Corp .......................... 1,306 0.40
2,310 UnitedHealth Group Inc ...... 250 0.07
Home Builders
158 NVR Inc .............................. 239 0.07
18,220 PulteGroup Inc .................... 299 0.09
Hotels, Restaurants and Leisure
1,700 Brunswick Corp .................. 79 0.02
Insurance
8,500 Aflac Inc ............................. 469 0.14
20,850 Allstate Corp ....................... 1,192 0.36

Russell Investment Company IV plc
Russell Global Regional Equity Fund
Schedule of Investments - continued
31 December 2015
The accompanying notes are an integral part of the financial statements.
Russell Global Regional Equity Fund 51
Number
of Shares
Fair Value
EUR ‘000
Fund
%
13,783 Berkshire Hathaway Inc ...... 1,675 0.51
4,300 Lincoln National Corp ......... 199 0.06
2,009 Markel Corp ........................ 1,634 0.50
16,579 MetLife Inc ......................... 736 0.23
4,600
Principal Financial Group
Inc ....................................... 190 0.06
8,300 Progressive Corp ................. 243 0.07
5,200
Prudential Financial
Inc ....................................... 390 0.12
5,000 Travelers Cos Inc ................ 519 0.16
4,900 Unum Group ....................... 150 0.05
9,000 Voya Financial Inc .............. 306 0.09
Internet Software and Services
6,174 Alphabet Inc ........................ 4,313 1.32
2,599 Amazon.com Inc ................. 1,617 0.49
2,800 GoDaddy Inc ....................... 83 0.03
1,233 Priceline Group Inc ............. 1,447 0.44
15,700 Symantec Corp .................... 304 0.09
24,400 Twitter Inc ........................... 520 0.16
Lodging
7,900
Hilton Worldwide Holdings
Inc ....................................... 156 0.05
Machinery
8,223 Caterpillar Inc ...................... 514 0.16
1,800 Wabtec Corp ....................... 118 0.03
Media
15,500 AMC Networks Inc ............. 1,066 0.33
1,900 CBS Corp ............................ 82 0.02
49,980 Comcast Corp ...................... 2,595 0.79
21,600 News Corp ........................... 266 0.08
28,125 Time Warner Inc ................. 1,673 0.51
15,400
Twenty-First Century Fox
Inc ....................................... 385 0.12
18,905 Walt Disney Co ................... 1,829 0.56
Metals and Mining
2,770 Precision Castparts Corp ..... 592 0.18
Miscellaneous Manufacturers
28,508 General Electric Co ............. 817 0.25
Oil and Gas
23,450 ConocoPhillips .................... 1,008 0.31
14,369 EOG Resources Inc ............. 936 0.29
29,067 Exxon Mobil Corp ............... 2,086 0.64
17,357 Hess Corp ............................ 775 0.24
3,700 HollyFrontier Corp .............. 136 0.04
7,900 Marathon Petroleum Corp ... 377 0.11
20,503 Noble Energy Inc ................ 622 0.19
1,700 PBF Energy Inc ................... 58 0.02
5,400 Phillips 66 ........................... 407 0.12
1,100 Tesoro Corp ......................... 107 0.03
7,800 Valero Energy Corp ............ 508 0.15
Personal Products
16,685 Procter & Gamble Co .......... 1,220 0.37
Number
of Shares
Fair Value
EUR ‘000
Fund
%
Pharmaceuticals
12,100 AbbVie Inc ......................... 660 0.20
5,400 AmerisourceBergen Corp ... 516 0.16
19,239 Baxalta Inc .......................... 691 0.21
4,500
Bristol-Myers Squibb
Co ....................................... 285 0.09
6,300 Cardinal Health Inc ............. 518 0.16
6,700 Eli Lilly & Co ..................... 520 0.16
23,013 Johnson & Johnson ............. 2,175 0.66
3,160 McKesson Corp .................. 574 0.17
23,431 Merck & Co Inc .................. 1,139 0.35
70,130 Pfizer Inc ............................ 2,084 0.63
3,500
Quintiles Transnational
Holdings Inc ....................... 221 0.07
Real Estate
1,200
Four Corners Property Trust
Inc ....................................... 27 0.01
Real Estate Investment Trust
26,221 American Tower Corp ........ 2,340 0.71
6,536
Crown Castle International
Corp .................................... 520 0.16
Retail Trade
3,706 Advance Auto Parts Inc ...... 513 0.16
450 AutoZone Inc ...................... 307 0.09
18,925 Cheesecake Factory Inc ...... 803 0.24
7,410 Home Depot Inc .................. 902 0.27
7,800 Lowe's Cos Inc .................... 546 0.17
21,275 Lululemon Athletica Inc ..... 1,028 0.31
9,830 Macy's Inc ........................... 317 0.10
19,950 McDonald's Corp ................ 2,170 0.66
2,089
O'Reilly Automotive
Inc ....................................... 487 0.15
5,500 Ross Stores Inc ................... 272 0.08
26,027 Starbucks Corp ................... 1,438 0.44
9,125 Tiffany & Co ...................... 641 0.20
21,205 TJX Cos Inc ........................ 1,384 0.42
41,095 Wal-Mart Stores Inc ........... 2,319 0.71
20,525 Williams-Sonoma Inc ......... 1,104 0.34
Semiconductor Equipment and Products
26,055 Applied Materials Inc ......... 448 0.14
43,847 Intel Corp ............................ 1,391 0.42
10,409
Maxim Integrated Products
Inc ....................................... 364 0.11
13,604 Texas Instruments Inc ......... 686 0.21
Software
8,287 Adobe Systems Inc ............. 717 0.22
3,700
Allscripts Healthcare
Solutions Inc ....................... 52 0.02
2,100 Aspen Technology Inc ........ 73 0.02
10,389 Intuit Inc ............................. 923 0.28
61,289 Microsoft Corp ................... 3,129 0.95
80,536 Oracle Corp ......................... 2,707 0.83
1,700 Red Hat Inc ......................... 130 0.04

Russell Investment Company IV plc
Russell Global Regional Equity Fund
Schedule of Investments - continued
31 December 2015
The accompanying notes are an integral part of the financial statements.
52 Russell Global Regional Equity Fund
Number
of Shares
Fair Value
EUR ‘000
Fund
%
5,800 Salesforce.com Inc .............. 419 0.13
2,300 VMware Inc ........................ 120 0.04
33,400 Zynga Inc ............................ 82 0.02
Telecommunications
32,200 AT&T Inc ............................ 1,020 0.31
1,300 Ciena Corp .......................... 25 0.01
56,468 Cisco Systems Inc ............... 1,412 0.43
10,600 Juniper Networks Inc .......... 269 0.08
2,300 NETGEAR Inc .................... 89 0.03
6,200 Polycom Inc ........................ 72 0.02
30,453
Verizon Communications
Inc ....................................... 1,296 0.40
Textile and Apparel
14,720 Nike Inc ............................... 847 0.26
13,921 Ralph Lauren Corp .............. 1,429 0.44
Transport
15,576 CSX Corp ............................ 372 0.11
6,682 FedEx Corp ......................... 916 0.28
9,826 Kansas City Southern .......... 675 0.21
8,100 Union Pacific Corp .............. 583 0.18
13,175 United Parcel Service Inc .... 1,167 0.35
134,419 41.00
Total Common Stock ........ 308,696 94.16
Number
of Shares
Fair Value
EUR ‘000
Fund
%
Preferred Stock (0.23%)
Germany (0.23%)
Auto Components
13,968 Schaeffler AG ..................... 227 0.07
Automobiles
4,015 Volkswagen AG .................. 537 0.16
Total Preferred Stock ....... 764 0.23
Total Transferable
Securities ........................... 309,460 94.39
Investment Funds (3.19%)
Ireland (3.19%)
3,540
Russell Investment Company
III plc
The U.S. Dollar Cash Fund II
Class R Roll-Up Shares .... 3,261 0.99
7,223
Russell Investment Company
plc
Russell Euro Liquidity Fund
Class R Roll-Up Shares .... 7,211 2.20
Total Investment Funds .... 10,472 3.19
Total Investments
excluding Financial
Derivative Instruments ..... 319,932 97.58
Financial Derivative Instruments ((0.05)%)
Open Futures Contracts ((0.13)%)
Notional
Amount
EUR ‘000
Average
Cost Price
EUR
Unrealised
Gain (Loss)
EUR ‘000
Fund
%
(13,625)
(8,062.19)
169 of FTSE 100 Index Futures
Short Futures Contracts
Expiring March 2016 ................................................ (587) (0.18)
34,860
1,864.16
374 of S&P 500 E Mini Index Futures
Long Futures Contracts
Expiring March 2016 ................................................ 178 0.05
(1,060)
(21,205.00)
10 of FTSE MIB Index Futures
Short Futures Contracts
Expiring March 2016 ................................................ (12) 0.00
(1,205)
(430.53)
14 of Amsterdam Index Futures
Short Futures Contracts
Expiring January 2016 .............................................. (32) (0.01)
(12,131)
(3,209.34)
378 of Euro Stoxx 50 Index Futures
Short Futures Contracts
Expiring March 2016 ................................................ (275) (0.08)
(3,881)
(10,350.50)
15 of DAX Index Futures
Short Futures Contracts
Expiring March 2016 ................................................ (158) (0.05)
(6,783)
(7,796.68)
87 of Swiss Market Index Futures
Short Futures Contracts
Expiring March 2016 ................................................ (214) (0.07)
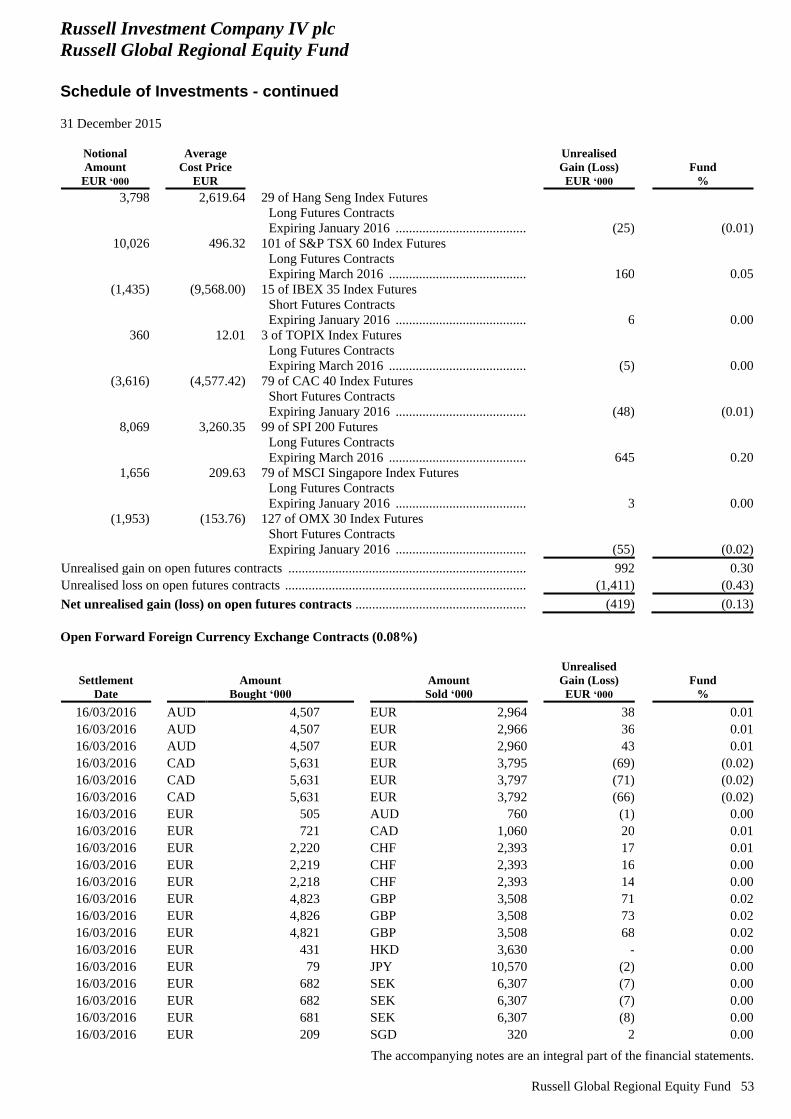
Russell Investment Company IV plc
Russell Global Regional Equity Fund
Schedule of Investments - continued
31 December 2015
The accompanying notes are an integral part of the financial statements.
Russell Global Regional Equity Fund 53
Notional
Amount
EUR ‘000
Average
Cost Price
EUR
Unrealised
Gain (Loss)
EUR ‘000
Fund
%
3,798
2,619.64
29 of Hang Seng Index Futures
Long Futures Contracts
Expiring January 2016 .............................................. (25) (0.01)
10,026
496.32
101 of S&P TSX 60 Index Futures
Long Futures Contracts
Expiring March 2016 ................................................ 160 0.05
(1,435)
(9,568.00)
15 of IBEX 35 Index Futures
Short Futures Contracts
Expiring January 2016 .............................................. 6 0.00
360
12.01
3 of TOPIX Index Futures
Long Futures Contracts
Expiring March 2016 ................................................ (5) 0.00
(3,616)
(4,577.42)
79 of CAC 40 Index Futures
Short Futures Contracts
Expiring January 2016 .............................................. (48) (0.01)
8,069
3,260.35
99 of SPI 200 Futures
Long Futures Contracts
Expiring March 2016 ................................................ 645 0.20
1,656
209.63
79 of MSCI Singapore Index Futures
Long Futures Contracts
Expiring January 2016 .............................................. 3 0.00
(1,953)
(153.76)
127 of OMX 30 Index Futures
Short Futures Contracts
Expiring January 2016 .............................................. (55) (0.02)
Unrealised gain on open futures contracts ......................................................................... 992 0.30
Unrealised loss on open futures contracts .......................................................................... (1,411) (0.43)
Net unrealised gain (loss) on open futures contracts ..................................................... (419) (0.13)
Open Forward Foreign Currency Exchange Contracts (0.08%)
Settlement
Date
Amount
Bought ‘000
Amount
Sold ‘000
Unrealised
Gain (Loss)
EUR ‘000
Fund
%
16/03/2016 AUD 4,507 EUR 2,964 38 0.01
16/03/2016 AUD 4,507 EUR 2,966 36 0.01
16/03/2016 AUD 4,507 EUR 2,960 43 0.01
16/03/2016 CAD 5,631 EUR 3,795 (69) (0.02)
16/03/2016 CAD 5,631 EUR 3,797 (71) (0.02)
16/03/2016 CAD 5,631 EUR 3,792 (66) (0.02)
16/03/2016 EUR 505 AUD 760 (1) 0.00
16/03/2016 EUR 721 CAD 1,060 20 0.01
16/03/2016 EUR 2,220 CHF 2,393 17 0.01
16/03/2016 EUR 2,219 CHF 2,393 16 0.00
16/03/2016 EUR 2,218 CHF 2,393 14 0.00
16/03/2016 EUR 4,823 GBP 3,508 71 0.02
16/03/2016 EUR 4,826 GBP 3,508 73 0.02
16/03/2016 EUR 4,821 GBP 3,508 68 0.02
16/03/2016 EUR 431 HKD 3,630 - 0.00
16/03/2016 EUR 79 JPY 10,570 (2) 0.00
16/03/2016 EUR 682 SEK 6,307 (7) 0.00
16/03/2016 EUR 682 SEK 6,307 (7) 0.00
16/03/2016 EUR 681 SEK 6,307 (8) 0.00
16/03/2016 EUR 209 SGD 320 2 0.00

Russell Investment Company IV plc
Russell Global Regional Equity Fund
Schedule of Investments - continued
31 December 2015
The accompanying notes are an integral part of the financial statements.
54 Russell Global Regional Equity Fund
Settlement
Date
Amount
Bought ‘000
Amount
Sold ‘000
Unrealised
Gain (Loss)
EUR ‘000
Fund
%
16/03/2016 HKD 35,720 EUR 4,233 5 0.00
16/03/2016 JPY 19,200 EUR 143 3 0.00
16/03/2016 JPY 19,200 EUR 143 3 0.00
16/03/2016 JPY 19,200 EUR 143 4 0.00
16/03/2016 SGD 2,860 EUR 1,859 (11) (0.01)
16/03/2016 USD 7,499 EUR 6,879 12 0.00
16/03/2016 USD 7,499 EUR 6,871 20 0.01
16/03/2016 USD 7,499 EUR 6,871 20 0.01
16/03/2016 USD 7,499 EUR 6,873 18 0.01
16/03/2016 USD 7,499 EUR 6,864 28 0.01
Unrealised gain on open forward foreign currency exchange contracts ................................ 511 0.15
Unrealised loss on open forward foreign currency exchange contracts ................................ (242) (0.07)
Net unrealised gain (loss) on open forward foreign currency exchange contracts ............................. 269 0.08
Total Financial Derivative Instruments ................................................................................................. (150) (0.05)
Fair Value
EUR ‘000
Fund
%
Total Financial Assets at Fair Value through Profit or Loss
(98.03%) ............................................................................................................................... 321,435 98.03
Total Financial Liabilities at Fair Value through Profit or
Loss ((0.50)%) ...................................................................................................................... (1,653) (0.50)
Net Financial Assets at Fair Value through Profit or Loss
(97.53%) .................................................................................................................................................... 319,782 97.53
Other Net Assets (2.47%) ......................................................................................................................... 8,077 2.47
Net Assets .................................................................................................................................................. 327,859 100.00
Abbreviation used: ADR – American Depository Receipt
CPS – Cumulative participating Shares
GDR – Global Depository Receipt
NVDR - Non-Voting Depository Receipt
Analysis of gross assets
% of
gross assets
Transferable securities admitted to an official stock exchange listing ..................................................................... 93.76
Investment Funds (UCITS) ...................................................................................................................................... 3.17
Exchange trades financial derivative instruments .................................................................................................... 0.30
Over the counter financial derivative instruments ................................................................................................... 0.15
Other assets .............................................................................................................................................................. 2.62
100.00
The broker for the open futures contracts is Merrill Lynch.
The counterparties for the open forward foreign currency exchange contracts are:
Bank of America
Bank of New York
Royal Bank of Canada
State Street bank and Trust
UBS AG

Russell Investment Company IV plc
Russell Global Regional Equity Fund
Schedule of Investments - continued
31 December 2015
The accompanying notes are an integral part of the financial statements.
Russell Global Regional Equity Fund 55
Fair Value Hierarchy (Note 3)
The following tables analyse within the fair value hierarchy the Fund’s financial assets and liabilities (by investment type)
measured at fair value at 31 December 2015.
As at 31 December 2015
Level C
Level A
EUR ‘000
Level B
EUR ‘000
Level C1*
EUR ‘000
Level C2**
EUR ‘000
Total
EUR ‘000
Assets
Financial assets at fair value through profit or loss:
Investments at fair value:
Transferable securities ............................................................... 309,460 - - - 309,460
Investment funds ........................................................................ - 10,472 - - 10,472
Unrealised gain on open futures contracts ............................................. 992 - - - 992
Unrealised gain on forward foreign currency
exchange contracts ........................................................................ - - 511 - 511
Total assets ...................................................................................... 310,452 10,472 511 - 321,435
Liabilities
Financial liabilities at fair value through profit or
loss:
Unrealised loss on open futures contracts ............................................. (1,411) - - - (1,411)
Unrealised loss on forward foreign currency
exchange contracts ................................................................................ - - (242) - (242)
Total liabilities ................................................................................ (1,411) - (242) - (1,653)
* Level C1 is valuation technique using market inputs.
** Level C2 is valuation techniques using entity-determined inputs.

Russell Investment Company IV plc
Russell Global Regional Equity Fund
Schedule of Changes in Composition of Portfolio
Listed below are the 20 largest cumulative investment purchases and sales during the period from 7 July 2015, launch date of the
Fund to 31 December 2015.
A copy of the list of changes in the portfolio during the reference period may be obtained free of charge from the Company’s
Administrator or from the paying agent or paying and information agents in each country of distribution.
56 Russell Global Regional Equity Fund
Portfolio Securities
Acquisition Cost
EUR ‘000 Portfolio Securities
Disposal Proceeds
EUR ‘000
Russell Investment Company Plc Russell Investment Company Plc
Russell Euro Liquidity Fund Russell Euro Liquidity Fund
Class R Roll-Up Shares 10,491 Class R Roll-Up Shares (3,279)
Apple Inc 5,606 Alphabet Inc (1,952)
Alphabet Inc 5,140 Scripps Networks Interactive Inc (1,342)
UBS Group AG 3,925 Chevron Corp (1,192)
Russell Investment Company III Sysco Corp (1,112)
The U.S. Dollar Cash Fund II UBS Group AG (1,070)
Class R Roll-Up Shares 3,748 Nielsen Holdings Plc (900)
Oracle Corp 3,428 Procter & Gamble Co (894)
Comcast Corp 3,080 Unilever NV (812)
Wal-Mart Stores Inc 3,040 Amazon.com Inc (801)
Microsoft Corp 2,825 Whole Foods Market Inc (765)
Exxon Mobil Corp 2,798 SanDisk Corp (759)
Bayer AG 2,759 Royal Dutch Shell Plc (727)
Roche Holding AG 2,745 EMC Corp (718)
American Tower Corp 2,692 Priceline Group Inc (714)
Visa Inc 2,636 Edison International (711)
Royal Dutch Shell Plc 2,603 Precision Castparts Corp (703)
Wells Fargo & Co 2,535 Anheuser-Busch InBev SA (682)
Pfizer Inc 2,489 Sanofi SA (681)
Walt Disney Co 2,374 WPP Plc (668)
US Bancorp 2,276
Vodafone Group Plc 2,188

Russell Investment Company IV plc
Notes to the Financial Statements
31 December 2015
Notes to the Financial Statements 57
1. Basis of preparation
The condensed semi-annual unaudited financial statements (the “Financial Statements”) have been prepared for the six
months ended 31 December 2015.
Statement of compliance
The Financial Statements are prepared in accordance with accounting standards generally accepted in Ireland (“Irish GAAP”)
for preparation of interim financial statements, namely Financial Reporting Standard (“FRS”) 104: Interim Financial
Reporting (“FRS 104”) (for the first time), the financial reporting standard applicable to in the UK and Republic of Ireland
and the provisions of the Regulations.
Accounting standards generally accepted in Ireland in preparing financial statements which present a true and fair view are
those promulgated by the Institute of Chartered Accountants in Ireland (the “Institute”) and issued by the Financial Reporting
Council (“FRC”).
These condensed unaudited interim financial statements should be read in conjunction with the Company’s annual audited
Financial Statements for the year ended 30 June 2015.
Transition to FRS 102 & FRS 104
In 2012, 2013 and 2014 the Financial Reporting Council (FRC) revised FRSs in the UK and Republic of Ireland. The
revisions fundamentally reformed financial reporting, replacing the extant standards with a number of new FRSs. The new
standards relevant to the Company are FRS 102: the Financial Reporting Standard applicable in the UK and Republic of
Ireland (“FRS 102”) and FRS 104. FRS 102 and FRS 104 are effective for accounting periods beginning on or after 1
January 2015 with early adoption permitted.
The Directors resolved, on the recommendation of the Manager’s audit committee, to adopt and prepare the Company’s
financial Statements in accordance with FRS 102 and FRS 104.
The date of transition to the new accounting framework is 1 July 2014 and accordingly the comparative amounts presented
for the six months ended 31 December 2014 and year ended 30 June 2015 are based on the Company’s financial statements
for that year after adjustment for the transition to FRS 104.
The transition to FRS 102 & FRS 104 has not resulted in any change to the financial position, financial performance or profit
and loss amounts of the Company to that previously reported and presented in the financial statements as at 31 December
2014 and 30 June 2015. The measurement basis to determine the Company's financial position and performance in the
current period is the same as that reported under the previous financial reporting framework at and for the six months ended
31 December 2014 and year ended 30 June 2015. There is no difference in the profit or loss determined in accordance with
the previous financial reporting framework for the latest period in the Company’s/Fund’s most recent annual financial
statements to its profit or loss determined in accordance with FRS 104 for the same period.
The accounting policies applied in preparing these financial statements under FRS 104 are consistent with the accounting
policies applied, except where noted in note 2 to the Financial Statements, in preparing the Company’s prior interim and
annual financial statements under the previous accounting framework.
Basis of measurement & presentation
The financial statements are prepared under the historical cost convention as modified by the revaluation of financial assets
and financial liabilities held at fair value through profit or loss. The Company will continue as a going concern and all Funds
trading at 30 June 2015 have been prepared on a going concern basis with the exception of Russell Absolute Return Equity
Fund which was fully redeemed during the period and therefore the financial statements are prepared on a discontinued basis.
The Company has availed of the exemption available to open ended investment funds that hold a substantial proportion of
highly liquid and fair valued investments under Section 7 of FRS 102 and is not presenting cash flow statements.
The information required by FRS 102 to be included in a statement of comprehensive income, is, in the opinion of the
Directors, contained in the Profit and Loss Account of the Company and each Fund.
The financial statements of the individual Funds are prepared in the functional currency of the respective Fund. The
functional currency of each Fund is that disclosed on the primary statements of the respective Fund.
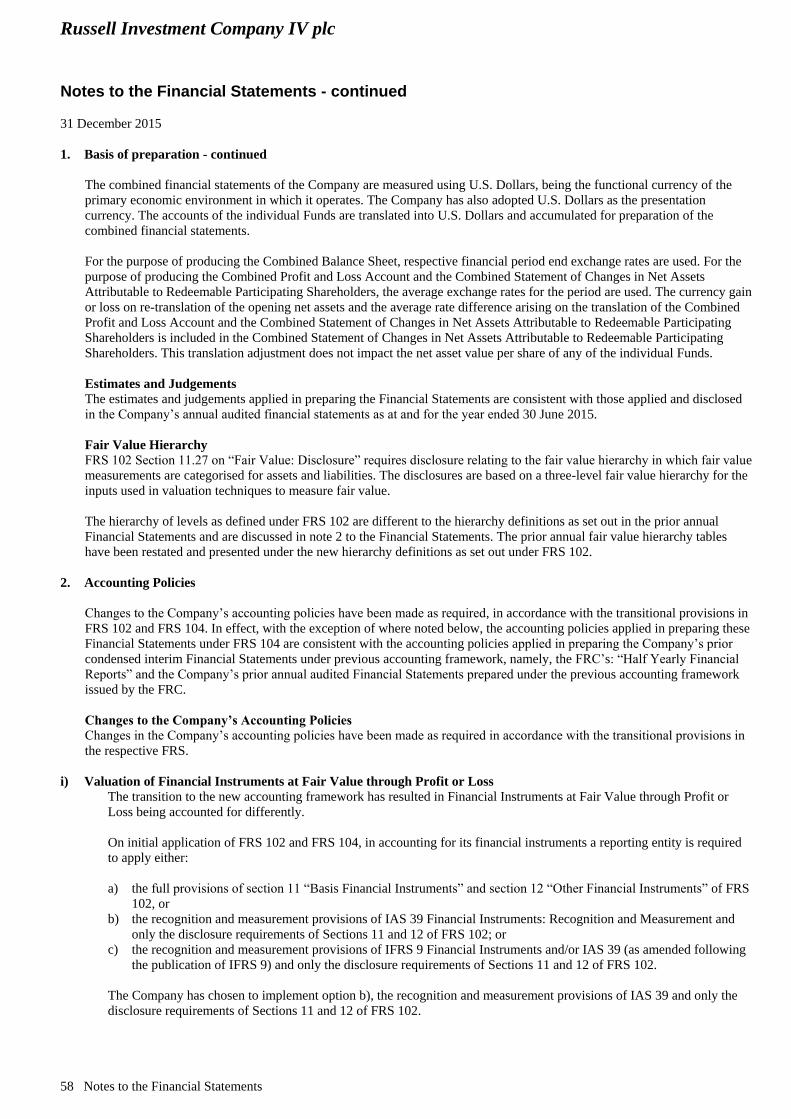
Russell Investment Company IV plc
Notes to the Financial Statements - continued
31 December 2015
58 Notes to the Financial Statements
1. Basis of preparation - continued
The combined financial statements of the Company are measured using U.S. Dollars, being the functional currency of the
primary economic environment in which it operates. The Company has also adopted U.S. Dollars as the presentation
currency. The accounts of the individual Funds are translated into U.S. Dollars and accumulated for preparation of the
combined financial statements.
For the purpose of producing the Combined Balance Sheet, respective financial period end exchange rates are used. For the
purpose of producing the Combined Profit and Loss Account and the Combined Statement of Changes in Net Assets
Attributable to Redeemable Participating Shareholders, the average exchange rates for the period are used. The currency gain
or loss on re-translation of the opening net assets and the average rate difference arising on the translation of the Combined
Profit and Loss Account and the Combined Statement of Changes in Net Assets Attributable to Redeemable Participating
Shareholders is included in the Combined Statement of Changes in Net Assets Attributable to Redeemable Participating
Shareholders. This translation adjustment does not impact the net asset value per share of any of the individual Funds.
Estimates and Judgements
The estimates and judgements applied in preparing the Financial Statements are consistent with those applied and disclosed
in the Company’s annual audited financial statements as at and for the year ended 30 June 2015.
Fair Value Hierarchy
FRS 102 Section 11.27 on “Fair Value: Disclosure” requires disclosure relating to the fair value hierarchy in which fair value
measurements are categorised for assets and liabilities. The disclosures are based on a three-level fair value hierarchy for the
inputs used in valuation techniques to measure fair value.
The hierarchy of levels as defined under FRS 102 are different to the hierarchy definitions as set out in the prior annual
Financial Statements and are discussed in note 2 to the Financial Statements. The prior annual fair value hierarchy tables
have been restated and presented under the new hierarchy definitions as set out under FRS 102.
2. Accounting Policies
Changes to the Company’s accounting policies have been made as required, in accordance with the transitional provisions in
FRS 102 and FRS 104. In effect, with the exception of where noted below, the accounting policies applied in preparing these
Financial Statements under FRS 104 are consistent with the accounting policies applied in preparing the Company’s prior
condensed interim Financial Statements under previous accounting framework, namely, the FRC’s: “Half Yearly Financial
Reports” and the Company’s prior annual audited Financial Statements prepared under the previous accounting framework
issued by the FRC.
Changes to the Company’s Accounting Policies
Changes in the Company’s accounting policies have been made as required in accordance with the transitional provisions in
the respective FRS.
i) Valuation of Financial Instruments at Fair Value through Profit or Loss
The transition to the new accounting framework has resulted in Financial Instruments at Fair Value through Profit or
Loss being accounted for differently.
On initial application of FRS 102 and FRS 104, in accounting for its financial instruments a reporting entity is required
to apply either:
a) the full provisions of section 11 “Basis Financial Instruments” and section 12 “Other Financial Instruments” of FRS
102, or
b) the recognition and measurement provisions of IAS 39 Financial Instruments: Recognition and Measurement and
only the disclosure requirements of Sections 11 and 12 of FRS 102; or
c) the recognition and measurement provisions of IFRS 9 Financial Instruments and/or IAS 39 (as amended following
the publication of IFRS 9) and only the disclosure requirements of Sections 11 and 12 of FRS 102.
The Company has chosen to implement option b), the recognition and measurement provisions of IAS 39 and only the
disclosure requirements of Sections 11 and 12 of FRS 102.

Russell Investment Company IV plc
Notes to the Financial Statements - continued
31 December 2015
Notes to the Financial Statements 59
2. Accounting Policies - continued
As a result the Company changed its fair valuation input to utilise last traded market price for both financial assets and
liabilities. Where the last traded price is not within the bid ask spread, management will determine the point within the bid
ask spread which is most representative of fair value. Under Previous Irish GAAP the accrued market price used for
financial assets held by the Company was the current bid price, the quoted market price for financial liabilities was the
current ask price. The Company’s prior year end Balance Sheet, as at 30 June 2015, has been restated within these Financial
Statements to recognise the fair value of the Company’s financial assets at fair value through profit or loss using last traded
market prices. The Company’s Profit and Loss Account for the six months ended 31 December 2014 has also been restated
to reflect the use of last traded market prices.
The following tables summaries the respective restatements reflected on the Balance Sheet as of 30 June 2015 and the Profit
and Loss Account six months ended 31 December 2014.
Balance Sheet as at 30 June 2015
Combined
USD ’000
Russell Absolute
Return Equity
Fund
GBP ’000
Russell Alpha
Fund
USD ’000
Russell Multi
Strategy
Volatility Fund
USD ’000
Financial assets at fair value through profit or loss (at bid market
prices) ................................................................................................................................ …………. 1,049,337 402,424 204,988 211,408
Adjustment from bid market prices to last traded market prices ...................................... ……….…. 624 314 111 19
Financial assets at fair value through profit or loss (at last traded
market prices) .................................................................................................................... 1,049,961 402,738 205,099 211,427
Profit and Loss Account for the six months ended 31 December 2014
Combined
USD ’000
Russell Absolute
Return Equity
Fund
GBP ’000
Russell Alpha
Fund
USD ’000
Net gain (loss) on investment activities (at bid market prices) ........................................ …………. (51,571) (11,185) (33,267)
Movement in adjustment from bid market prices to last traded
market prices ..................................................................................................................... ………. 276 (36) 80
Net gain (loss) on investment activities (at last traded market
prices) ................................................................................................................................ ………….. (51,295) (11,221) (33,187)
ii) Change in Presentation
Under the FRC’s “Half Yearly Financial Reports” the comparative information required to be disclosed for each primary
statement was the prior annual audited primary statement and the prior interim unaudited primary statement and their
respective notes to the financial statements. Under FRS 104 the comparative information required to be disclosed is the
prior annual audited primary statement for the Balance Sheet and the prior interim unaudited primary statement for the
Profit and Loss Account and Statement of Changes in Net Assets Attributable to Redeemable Participating Shareholders
3. Fair Value Hierarchy
FRS 102 Section 11.27 on “Fair Value: Disclosure” requires disclosure relating to the fair value hierarchy in which fair value
measurements are categorised for assets and liabilities. The disclosures are based on a three-level fair value hierarchy for the
inputs used in valuation techniques to measure fair value.
The hierarchy of levels as defined under FRS 102 are different to the hierarchy definitions as set out in the prior annual
Financial Statements and are discussed separately below. The prior annual hierarchy tables have been restated and presented
under the new hierarchy definitions as set out under FRS 102 and are disclosed at the base of the Schedule of Investments.

Russell Investment Company IV plc
Notes to the Financial Statements - continued
31 December 2015
60 Notes to the Financial Statements
3. Fair Value Hierarchy - continued
The fair value hierarchy as required under FRS 102 and FRS 104 is based on the valuation inputs used to fair value the
financial assets and liabilities and consideration of the market activity for each individual financial asset and liability. The
definition for levels A, B and C are set out below.
Level A: The best evidence of fair value is a quoted price for an identical asset in an active market. Quoted in an active
market in this context means quoted prices are readily and regularly available and those prices represent actual and regularly
occurring market transactions on an arm’s length basis. The quoted price is usually the current bid price.
Level B: When quoted prices are unavailable, the price of a recent transaction for an identical asset provides evidence of fair
value as long as there has not been a significant change in economic circumstances or a significant lapse of time since the
transaction took place. If the entity can demonstrate that the last transaction price is not a good estimate of fair value (e.g.
because it reflects the amount that an entity would receive or pay in a forced transaction, involuntary liquidation or distress
sale), that price is adjusted.
Level C: If the market for the asset is not active and recent transactions of an identical asset on their own are not a good
estimate of fair value, an entity estimates the fair value by using a valuation technique. The objective of using a valuation
technique is to estimate what the transaction price would have been on the measurement date in an arm’s length exchange
motivated by normal business considerations.
Please refer to the base of the Schedule of Investments for details of the Fund's fair value hierarchy as at 31 December 2015
and 30 June 2015.
4. Cash at Bank and Cash Held with Brokers and Counterparties
a) Cash at Bank
Cash at bank balances are comprised of cash balances held within State Street Bank and Trust Company’s (“State Street”)
custodian network*, unrestricted margin accounts held by brokers for exchange traded derivative instruments held by the
Funds and net unrealised gains and losses on open spot foreign currency exchange contracts. The names of brokers used by
each individual Fund can be found at the base of each relevant Fund’s Schedule of Investments.
Cash held in U.S. Dollar bank accounts with State Street automatically transfer into the demand deposit account at State
Street Bank and Trust New York in the name of State Street Bank and Trust Company - London.
b) Cash held with brokers and counterparties for open financial derivative instruments
Cash is also deposited by or on behalf of the Funds for initial margin purposes with brokers for options and futures contracts
and as collateral with counterparties in respect of OTC FDIs held on the Funds. As this amount is the minimum deemed by
the brokers and counterparties for collateral requirements the cash is as such restricted and is reported separately to the
unrestricted cash on the Funds’ Balance Sheets.
* Certain cash balances may be held by sub-custodians, as approved and appointed by State Street, in markets where State Street does not operate as a
custodian.
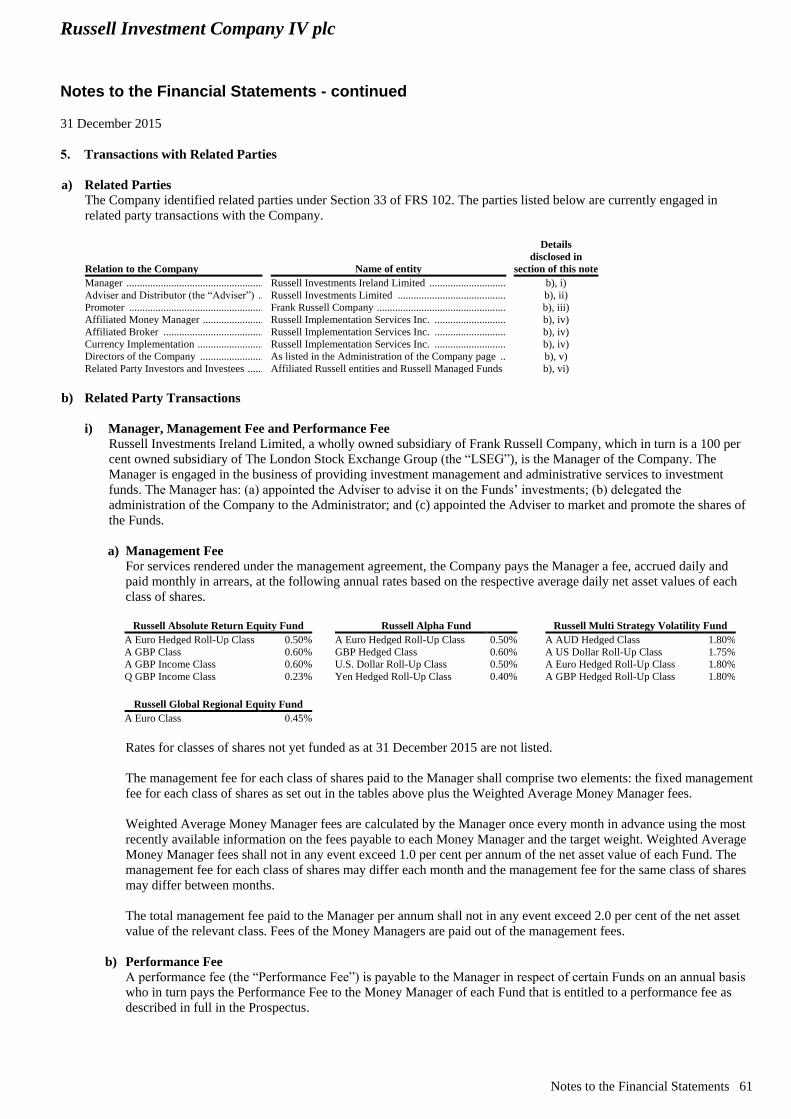
Russell Investment Company IV plc
Notes to the Financial Statements - continued
31 December 2015
Notes to the Financial Statements 61
5. Transactions with Related Parties
a) Related Parties
The Company identified related parties under Section 33 of FRS 102. The parties listed below are currently engaged in
related party transactions with the Company.
Relation to the Company Name of entity
Details
disclosed in
section of this note
Manager ............................................................................................................................. Russell Investments Ireland Limited ................................................................................ b), i)
Adviser and Distributor (the “Adviser”) ........................................................................... Russell Investments Limited ............................................................................................ b), ii)
Promoter ............................................................................................................................ Frank Russell Company .................................................................................................... b), iii)
Affiliated Money Manager ................................................................................................ Russell Implementation Services Inc. .............................................................................. b), iv)
Affiliated Broker ............................................................................................................... Russell Implementation Services Inc. .............................................................................. b), iv)
Currency Implementation .................................................................................................. Russell Implementation Services Inc. .............................................................................. b), iv)
Directors of the Company ................................................................................................. As listed in the Administration of the Company page ..................................................... b), v)
Related Party Investors and Investees ............................................................................... Affiliated Russell entities and Russell Managed Funds ................................................... b), vi)
b) Related Party Transactions
i) Manager, Management Fee and Performance Fee
Russell Investments Ireland Limited, a wholly owned subsidiary of Frank Russell Company, which in turn is a 100 per
cent owned subsidiary of The London Stock Exchange Group (the “LSEG”), is the Manager of the Company. The
Manager is engaged in the business of providing investment management and administrative services to investment
funds. The Manager has: (a) appointed the Adviser to advise it on the Funds’ investments; (b) delegated the
administration of the Company to the Administrator; and (c) appointed the Adviser to market and promote the shares of
the Funds.
a) Management Fee
For services rendered under the management agreement, the Company pays the Manager a fee, accrued daily and
paid monthly in arrears, at the following annual rates based on the respective average daily net asset values of each
class of shares.
Russell Absolute Return Equity Fund Russell Alpha Fund Russell Multi Strategy Volatility Fund
A Euro Hedged Roll-Up Class 0.50% A Euro Hedged Roll-Up Class 0.50% A AUD Hedged Class 1.80%
A GBP Class 0.60% GBP Hedged Class 0.60% A US Dollar Roll-Up Class 1.75%
A GBP Income Class 0.60% U.S. Dollar Roll-Up Class 0.50% A Euro Hedged Roll-Up Class 1.80%
Q GBP Income Class 0.23% Yen Hedged Roll-Up Class 0.40% A GBP Hedged Roll-Up Class 1.80%
Russell Global Regional Equity Fund
A Euro Class 0.45%
Rates for classes of shares not yet funded as at 31 December 2015 are not listed.
The management fee for each class of shares paid to the Manager shall comprise two elements: the fixed management
fee for each class of shares as set out in the tables above plus the Weighted Average Money Manager fees.
Weighted Average Money Manager fees are calculated by the Manager once every month in advance using the most
recently available information on the fees payable to each Money Manager and the target weight. Weighted Average
Money Manager fees shall not in any event exceed 1.0 per cent per annum of the net asset value of each Fund. The
management fee for each class of shares may differ each month and the management fee for the same class of shares
may differ between months.
The total management fee paid to the Manager per annum shall not in any event exceed 2.0 per cent of the net asset
value of the relevant class. Fees of the Money Managers are paid out of the management fees.
b) Performance Fee
A performance fee (the “Performance Fee”) is payable to the Manager in respect of certain Funds on an annual basis
who in turn pays the Performance Fee to the Money Manager of each Fund that is entitled to a performance fee as
described in full in the Prospectus.

Russell Investment Company IV plc
Notes to the Financial Statements - continued
31 December 2015
62 Notes to the Financial Statements
5. Transactions with Related Parties - continued
For the six months ended 31 December 2015, there was a performance fee of USD 2,379,965. For the six months
ended 31 December 2014, there was a performance total fee adjustment of USD 7,872 recognised in the Profit and
Loss Account.
ii) Adviser
The Manager discharges all fees payable to the Adviser out of its management fee.
iii) Promoter
Frank Russell Company acts as Promoter to the Company (the “Promoter”). The Promoter is not entitled to a fee in its
capacity as Promoter to the Company.
iv) Affiliated Money Managers, Affiliated Broker and Currency Implementation
Russell Implementation Services Inc. and Russell Implementation Services Limited (collectively called “RIS”) are
affiliated group companies to the Manager and the Adviser. The Adviser and Russell Implementation Services Inc. can
be appointed as Money Manager to the Funds. The appointment of Russell Group Companies as Money Manager to the Funds is subject to the same procedures as
appointing an external Money Manager and an intercompany agreement and investment guidelines are applied. The Funds effect certain transactions through RIS and its global network of unaffiliated correspondent brokers. Trades
placed through RIS and its correspondents are made (i) to manage trading associated with changes in Money Managers,
rebalancing across existing Money Managers, cash flows and other portfolio transitions or (ii) to execute portfolio
securities transactions for each Fund’s assets where RIS has been appointed as Money Manager. RIS may also be engaged by the Adviser to carry out foreign currency implementation trading for which a fee of 0.02 per
cent per trade is included in individual transactions. For the six months ended 31 December 2015, the total commission earned by RIS, encompassing the range of services
provided, amounted to USD 391,028 (six months ended 31 December 2014: USD 34,984).
v) Directors and Directors’ Fees
The Articles of Association provide that the Directors shall be entitled to a fee by way of remuneration at a rate to be
determined from time to time by the Directors. Directors’ fees are paid to non-executive Directors not employed by
Russell group companies. Directors’ fees shall not exceed the limits contained in the Prospectus and the Directors are
entitled to certain additional expenses as listed in the Prospectus. Directors’ fees charged during the six months ended 31
December 2015 were USD 6,678 (six months ended 31 December 2014: USD 5,630) these amounts are included in other
fees in the Combined Profit and Loss Account. All of the Directors of the Company are also directors of the Russell Funds discussed in section v) of this note below. All of the Directors of the Company are also directors of the Manager. The following Directors of the Company are
employed by Russell group companies: Mr. James Beveridge, Mr. Peter Gonella, Mr. Neil Jenkins, Mr. John McMurray
and Mr. Kenneth Willman. Mr. James Firn is a former employee of Russell Investments who retired in June 2014. He continues to act as a Director
of Russell Investments Ireland Limited and the Funds managed by Russell Investments Ireland Limited.
The Adviser operates a defined contribution pension plan for its employees which invests in Russell managed funds
including the Funds. The pension fund is subject to a management fee rebate. The Directors who are employed by
Russell group companies may be indirectly exposed to the Company through the pension scheme.

Russell Investment Company IV plc
Notes to the Financial Statements - continued
31 December 2015
Notes to the Financial Statements 63
5. Transactions with Related Parties - continued
vi) Related Party Investors and Investees
a) Investment in other Russell Funds
The Funds may invest in the sub-funds of other investment companies managed by the Manager as listed in the table
below. Details of the Fund’s investments in these sub-funds can be found in the Schedule of Investments of each
relevant Fund.
Fund Structure Name
Type of Fund
Structure
Management
Fee Rate
Russell Investment Company plc ............................................................................................................................................................................. UCITS Umbrella 0.05% - 2.80%
Russell Investment Company III plc ........................................................................................................................................................................ UCITS Umbrella 0.05%
b) Related Party Shareholders of the Company
During the six months ended 31 December 2015 and the year ended 30 June 2015 certain sub-funds of open-ended
investment funds also managed by the Manager and administered by the Administrator were invested in the Funds. In
accordance with Section 33 of FRS 102 these entities are deemed related party shareholders to the Company.
The table below discloses the value of shares held by related party shareholders in the Company and the percentage of
this value against the Company’s combined net asset value as at the respective balance sheet dates.
Related Party Shareholder
31 December
2015
USD ‘000
Company
%
30 June 2015
USD ‘000
Company
%
Russell Institutional Funds plc ................................................................................................................................ 157,892 17.19% 136,682 12.10%
Russell Investment Company plc ........................................................................................................................... 23,275 2.53% 38,337 3.39%
Russell Investment Company V plc ....................................................................................................................... 31,999 3.48% 14,587 1.29%
vii) Connected Party Transactions
Regulation 41 of the Regulations “Restrictions of transactions with connected persons” states that “A responsible person
shall ensure that any transaction between a UCITS and a connected person conducted a) at arm’s length; and b) in the
best interest of the unit-holders of the UCITS”.
As required under Regulation 78.4, the Directors, as responsible persons are satisfied that there are in place
arrangements, evidenced by written procedures, to ensure that the obligations that are prescribed by Regulation 41(1) are
applied to all transactions with a connected party; and all transactions with a connected parties that were entered into
during the period to which the report relates complied with the obligations that are prescribed by Regulation 41(1).
6. Significant Agreements
i) Custodian and Trustee
State Street Custodial Services (Ireland) Limited is the Company’s Custodian and Trustee. The Custodian and Trustee has
appointed its parent State Street as its global sub-custodian who in turn has appointed a network of local sub-custodial agents.
The sub-custodian fees are paid at annual rates based on the total assets held in each individual country in which the Funds
invest plus applicable transaction charges. Custodian and Trustee fees accrue daily and are paid monthly in arrears. Included within the Custodian agreement is a right of set off fees owing to and monies lent by the Custodian and Trustee.
ii) Administrator and Transfer Agency
State Street Fund Services (Ireland) Limited is the Company’s Administrator. The Administrator is responsible for the daily
determination of net asset value, maintaining the books and records of the Funds in respect of the Company and other
administrative services. The Manager has also appointed the Administrator as the Company’s Transfer Agent.
Such fees accrue daily and are paid monthly in arrears. The Manager shall discharge reasonable out of pocket expenses
payable to the Administrator out of the Funds’ assets.
The Administrator is also entitled to shareholder services fees as disclosed in the administration agreement and reporting
services fees of USD 7,000 per Fund per annum.

Russell Investment Company IV plc
Notes to the Financial Statements - continued
31 December 2015
64 Notes to the Financial Statements
6. Significant Agreements - continued
Transfer agency fees are charged based on the number of Funds in the umbrella structure, the number of shareholders,
number of statements issued, number of share classes and volume of trading in a period and are subject to adequate minimum
thresholds. Transfer agency fees are accrued and paid on a daily basis and are recognised within Administration and Transfer
Agency Fees in the Profit and Loss Account for each Fund.
The aggregate Administration fee and Custodian and Trustee fee per fund will not exceed 0.30 percent of the net asset value
of any Fund.
7. Soft Commissions and Commission Recapture Programme
The Adviser retains the right to request that the Money Managers participate in Russell’s soft commission and commission
recapture programme (the “Programme”) by executing a portion of their securities transactions through certain brokers (the
“Correspondent Broker Network”). Money Manager participation in the Programme is not mandatory and the appropriate
participation percentage target is determined on a Money Manager by Money Manager basis, based upon asset class,
investment mandate, trading habits, and tolerance for participation and is always subject to a Money Manager’s ability to
obtain best execution.
The Programme, including the Correspondent Broker Network, is administered by Recapture Services, a division of BNY
ConvergEx Execution Solutions LLC (“BNY”) and State Street Global Markets (“SSGM”).
A portion of the commission earned by the Correspondent Broker Network as a result of this trading activity will be set aside
in the Programme as “credits”. These credits are then earmarked for purchase of third party research (“Soft Commission
Credits”) or commission recapture (“Commission Credits”).
i) Soft Commission Credits
All soft commission use is overseen by Russell’s soft commission committee (the “Committee”) which is made up of
senior level investment personnel. The Committee, with the guidance of Russell’s investment strategy committee,
establishes an annual soft commission research budget for the use of the Soft Commission Credits.
Soft Commission Credits are used by the Adviser to purchase third party research that will aid Russell in its investment
decision-making process. Research purchased through the Programme is obtained from unaffiliated third parties at market
rates.
ii) Commission Credits
Once the soft commission research budget has been met the Committee will instruct BNY and SSGM to recapture the
Commission Credits which are then rebated directly back to the relevant Fund from which the commission was generated.
Commission Credits are recognised within other income in the relevant Fund’s Profit and Loss Account.
8. Distributions
a) Distribution Policy
The Company conducts its affairs so as to enable U.K. reporting fund status to be obtained under the United Kingdom
Income and Corporation Taxes Act, 1988 for the purposes of U.K. taxation for each applicable Fund.
Three Classes of Shares may be issued by the Funds, namely Income Class Shares, Accumulation Class Shares and Roll-Up
Class Shares. Income Class Shares distribute net income from time to time subject to Directors’ discretion. Accumulation
Class Shares are shares that declare a distribution but whose net income is then reinvested in the capital of the relevant Fund.
Roll-Up Class Shares do not declare or distribute net income and their net asset value reflects net income. Distributions
declared by Income Class Shares are paid in cash unless the shareholder chooses to reinvest part or all of the amount in the
capital of the relevant Share Class. Net income includes all interest, dividends and other amounts deemed by the Manager to
be in the nature of income less the estimated expenses of that Fund applicable to that dividend year.
b) Distributing Frequency
Distributions are calculated and declared on a calendar annual basis (i.e. annual period ended 30 June).

Russell Investment Company IV plc
Notes to the Financial Statements - continued
31 December 2015
Notes to the Financial Statements 65
9. Taxation
Under current law and practice the Company qualifies as an investment undertaking as defined in Section 739B of the Taxes
Consolidation Act, 1997, as amended (the “TCA”). On that basis, it is not chargeable to Irish tax on its income or gains.
However, Irish tax may arise on the occurrence of a “chargeable event”. A chargeable event includes any distribution
payments to shareholders or any encashment, redemption, transfer or cancellation of shares and any deemed disposal of
shares for Irish tax purposes arising as a result of holding shares in the Company for a period of eight years or more.
No Irish tax will arise in respect of chargeable events in respect of a shareholder who is an Exempt Irish Investor (as defined
in Section 739D of the TCA) or who is neither Irish resident nor ordinarily resident in Ireland for tax purposes at the time of
the chargeable event, provided, in each case, that an appropriate valid declaration in accordance with Schedule 2B of the
TCA is held by the Company or where the Company has been authorised by Irish Revenue to make gross payments in
absence of appropriate declarations.
Distributions, interest and capital gains (if any) received on investments made by the Company may be subject to
withholding taxes imposed by the country of origin and such taxes may not be recoverable by the Company or its
shareholders.
10. Number of Shares in Issue and Net Assets Attributable to Redeemable Participating Shareholders
a) Authorised Share Capital The authorised share capital of the Company is not less than EUR 2.00 represented by two subscriber shares of no par value
and the maximum issued share capital shall be not more than 500 billion participating shares of no par value. 39,000
subscriber shares have been issued but do not form part of the net asset value of the Company. They are disclosed in the
financial statements by way of this note only. Holders of subscriber shares are not entitled to dividends or any surplus of assets over liabilities upon the winding-up of the
Company. The subscriber shares are held by the Promoter and the Adviser.
b) Redeemable Participating Shares
Each of the shares entitles the holder to participate equally on a pro rata basis in the profits and dividends of the relevant
Fund attributable to such shares and to attend and vote at meetings of the Company and of the relevant Fund represented by
those shares. No class of shares confers on the holder thereof any preferential or pre-emptive rights or any rights to
participate in the profits and dividends of any other class of shares or any voting rights in relation to matters relating solely to
any other class of shares.
Each share represents an individual beneficial interest in the Company. The shares are not debt obligations or guaranteed by
the Company. The return on an investment in the Company will depend solely upon the investment performance of the assets
or the relevant Fund and the increase or decrease (as the case may be) in the net asset value of the shares. The amount
payable to a shareholder in respect of each share upon liquidation of the Company or a Fund will equal the net asset value per
share. However, in a relatively illiquid market, a Fund may not be able to dispose of its investments quickly and as such a
Fund may experience adverse price movements upon liquidation of its investments. Settlement of transactions may be subject
to delay and administrative uncertainties and the price repaid to the shareholders in such circumstances will not equal the
final published net asset value per share. Net assets attributable to shareholders represent a liability on the Balance Sheet, carried at the redemption amount that would
be payable at the balance sheet date if the shareholder exercised the right to redeem the shares in the Company.

Russell Investment Company IV plc
Notes to the Financial Statements - continued
31 December 2015
66 Notes to the Financial Statements
10. Number of Shares in Issue and Net Assets Attributable to Redeemable Participating Shareholders - continued
Participating Share Transactions
All cash amounts are in the functional currency of the Fund not the currency of the class. Russell Absolute Return Equity Fund
Number of Shares in issue
Six months ended 31 December 2014 Six months ended 31 December 2015
Share Class
Beginning
of period
Shares
Issued
Shares
Redeemed
End
of period
Beginning
of period
Shares
Issued
Shares
Redeemed
End
of period
A Euro
Hedged Roll-
Up Class ........................................................................... - 3,008,612 (201,939) 2,806,673 4,223,170 120,517 (4,343,687) -
A GBP Class .................................................................... 12,722,024 753,010 (34,200) 13,440,834 12,285,272 30,233 (12,315,505) -
A GBP
Income Class .................................................................... 23,001,120 946 (22,989,021) 13,045 10,562 - (10,562) -
Q GBP
Income Class .................................................................... 6,731,808 23,694,648 (1,576,637) 28,849,819 28,045,149 81,645 (28,126,794) -
Value of Share Transactions
Six months ended 31 December 2014 Six months ended 31 December 2015
Share Class
Subscriptions
GBP ‘000
Redemptions
GBP ‘000
Subscriptions
GBP ‘000
Redemptions
GBP ‘000
A Euro
Hedged Roll-
Up Class ............................................................................ 23,655 (1,588) 846 (30,103)
A GBP Class .................................................................... 7,430 (335) 300 (120,390)
A GBP Income
Class ................................................................................. 9 (217,373) - (98)
Q GBP Income
Class ................................................................................. 232,576 (15,364) 797 (274,353)
Russell Alpha Fund
Number of Shares in issue
Six months ended 31 December 2014 Six months ended 31 December 2015
Share Class
Beginning
of period
Shares
Issued
Shares
Redeemed
End
of period
Beginning
of period
Shares
Issued
Shares
Redeemed
End
of period
A Euro-
Hedged Roll-
Up Class ........................................................................... 7,291 1,220 (1,711) 6,800 7,470 4,204 (663) 11,011
GBP Hedged
Class ................................................................................. 9,409 2,096 (2,237) 9,268 6,394 3,324 (1,250) 8,468
U.S. Dollar
Roll-Up Class ................................................................... 2,555 201 (3) 2,753 3,148 264 (920) 2,492
Yen Hedged
Roll-Up Class ................................................................... 120,152 - (120,152) - - - - -
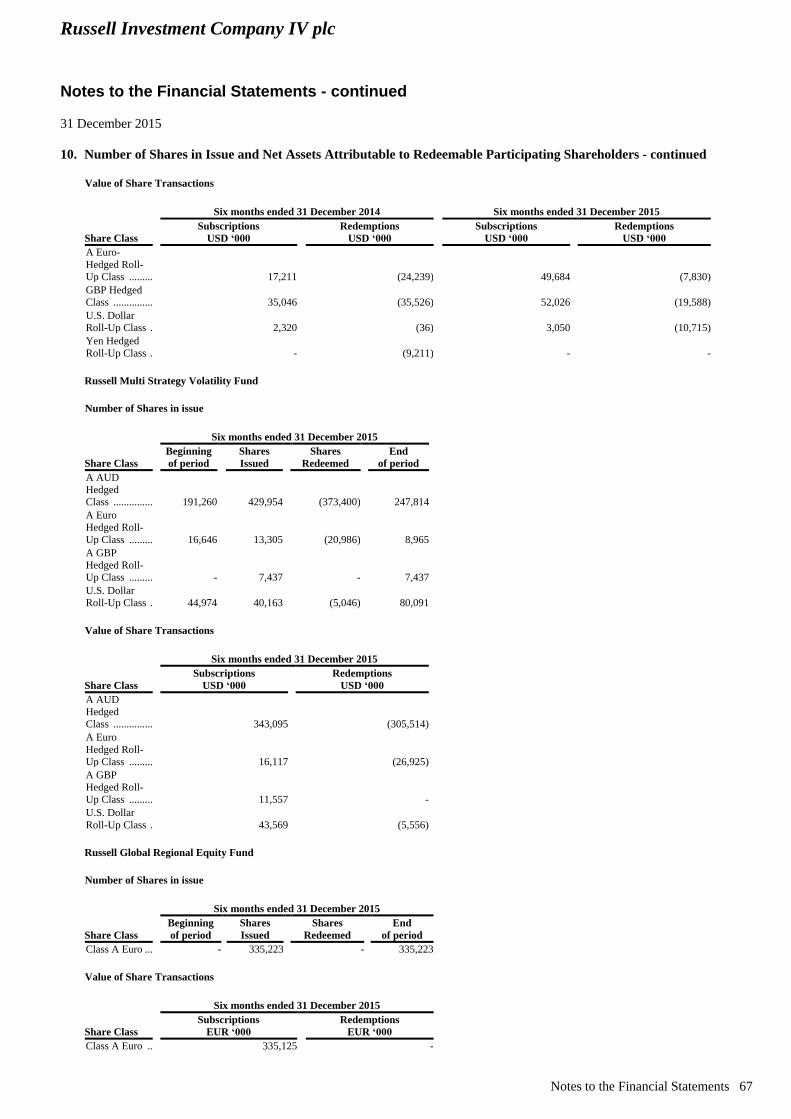
Russell Investment Company IV plc
Notes to the Financial Statements - continued
31 December 2015
Notes to the Financial Statements 67
10. Number of Shares in Issue and Net Assets Attributable to Redeemable Participating Shareholders - continued
Value of Share Transactions
Six months ended 31 December 2014 Six months ended 31 December 2015
Share Class
Subscriptions
USD ‘000
Redemptions
USD ‘000
Subscriptions
USD ‘000
Redemptions
USD ‘000
A Euro-
Hedged Roll-
Up Class ........................................................................... 17,211 (24,239) 49,684 (7,830)
GBP Hedged
Class ................................................................................. 35,046 (35,526) 52,026 (19,588)
U.S. Dollar
Roll-Up Class ................................................................... 2,320 (36) 3,050 (10,715)
Yen Hedged
Roll-Up Class ................................................................... - (9,211) - -
Russell Multi Strategy Volatility Fund
Number of Shares in issue
Six months ended 31 December 2015
Share Class
Beginning
of period
Shares
Issued
Shares
Redeemed
End
of period
A AUD
Hedged
Class ................................................................................. 191,260 429,954 (373,400) 247,814
A Euro
Hedged Roll-
Up Class ........................................................................... 16,646 13,305 (20,986) 8,965
A GBP
Hedged Roll-
Up Class ........................................................................... - 7,437 - 7,437
U.S. Dollar
Roll-Up Class ................................................................... 44,974 40,163 (5,046) 80,091
Value of Share Transactions
Six months ended 31 December 2015
Share Class
Subscriptions
USD ‘000
Redemptions
USD ‘000
A AUD
Hedged
Class ................................................................................. 343,095 (305,514)
A Euro
Hedged Roll-
Up Class ........................................................................... 16,117 (26,925)
A GBP
Hedged Roll-
Up Class ........................................................................... 11,557 -
U.S. Dollar
Roll-Up Class ................................................................... 43,569 (5,556)
Russell Global Regional Equity Fund
Number of Shares in issue
Six months ended 31 December 2015
Share Class
Beginning
of period
Shares
Issued
Shares
Redeemed
End
of period
Class A Euro ..................................................................... - 335,223 - 335,223
Value of Share Transactions
Six months ended 31 December 2015
Share Class
Subscriptions
EUR ‘000
Redemptions
EUR ‘000
Class A Euro .................................................................... 335,125 -

Russell Investment Company IV plc
Notes to the Financial Statements - continued
31 December 2015
68 Notes to the Financial Statements
10. Number of Shares in Issue and Net Assets Attributable to Redeemable Participating Shareholders - continued
c) Swing Pricing/Dilution Adjustments
The swing pricing (also known as dilution adjustment) is applied to a Fund once net subscriptions or redemptions for a Fund
relating to a Fund’s net asset value for a given dealing day is determined by the Administrator to exceed certain
predetermined percentage thresholds. In calculating the swing pricing, the net asset value of a Fund is swung by a “swing
factor”.
The range of swing factors applied is disclosed in the table below.
Swing Factor Rate Swing Factor Rate
As at 31 December 2015 As at 30 June 2015
Fund Name
On
Subscriptions
On
Redemptions
On
Subscriptions
On
Redemptions
Russell Absolute Return Equity Fund ...................................................................................................................................................................... - - 0.25% 0.20%
Russell Alpha Fund ................................................................................................................................................................................................... 0.20% 0.20% 0.20% 0.15%
Russell Multi Strategy Volatility Fund ............................................................................... 0.20% 0.20% 0.00% 0.00%
Russell Global Regional Equity Fund ................................................................................. 0.00% 0.00% - -
d) Significant Shareholders
The following table details the number of shareholders with significant holdings of at least 20 per cent of the relevant Fund’s
net asset value and the aggregate monetary value and percentage (of that Fund’s net asset value) of that holding as at 31
December 2015.
Fund
Number of
Significant
Shareholders
Value
of Holding
‘000
Aggregate
Shareholding as
a % of the Fund
Russell Alpha Fund ............................................................................................................. 1 USD 93,076 33.44%
Russell Multi Strategy Volatility Fund ............................................................................... 1 USD 64,815 22.87%
Russell Global Regional Equity Fund ................................................................................ 1 EUR 327,859 100.00%
The following table details the number of shareholders with significant holdings of at least 20 per cent of the relevant Fund’s
net asset value and the aggregate monetary value and percentage (of that Fund’s net asset value) of that holding as at 30 June
2015.
Fund
Number of
Significant
Shareholders
Value
of Holding ‘000
Aggregate
Shareholding as
a % of the Fund
Russell Absolute Return Equity Fund ................................................................................ 2 GBP 272,559 64.04%
Russell Alpha Fund ............................................................................................................. 1 USD 100,413 44.38%
11. Efficient Portfolio Management
The Company may enter into securities lending arrangements and repurchase agreements (together “Efficient Portfolio
Management Techniques”) and may invest in OTC FDIs, subject to the restrictions set forth the Prospectus and to the extent
consistent with the Fund’s investment objective and policies.
The use of techniques and instruments relating to transferable securities, money market instruments and/or other financial
instruments in which the Funds invest for efficient portfolio management purposes will generally be made for one or more of
the following reasons:
i) the reduction of risk;
ii) the reduction of cost; or
iii) the generation of additional capital or income for the relevant Fund with an appropriate level of risk, taking into account
the risk profile of the Fund and the risk diversification rules set out in the UCITS Regulations issued by the Central
Bank.
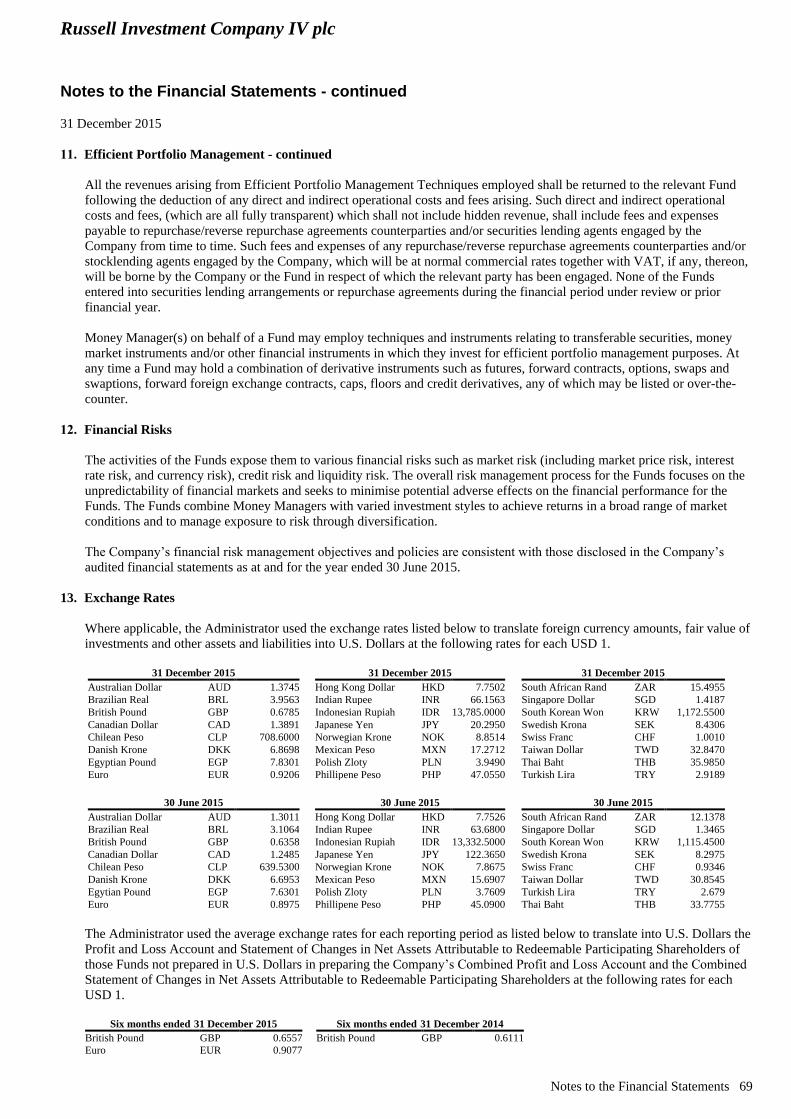
Russell Investment Company IV plc
Notes to the Financial Statements - continued
31 December 2015
Notes to the Financial Statements 69
11. Efficient Portfolio Management - continued
All the revenues arising from Efficient Portfolio Management Techniques employed shall be returned to the relevant Fund
following the deduction of any direct and indirect operational costs and fees arising. Such direct and indirect operational
costs and fees, (which are all fully transparent) which shall not include hidden revenue, shall include fees and expenses
payable to repurchase/reverse repurchase agreements counterparties and/or securities lending agents engaged by the
Company from time to time. Such fees and expenses of any repurchase/reverse repurchase agreements counterparties and/or
stocklending agents engaged by the Company, which will be at normal commercial rates together with VAT, if any, thereon,
will be borne by the Company or the Fund in respect of which the relevant party has been engaged. None of the Funds
entered into securities lending arrangements or repurchase agreements during the financial period under review or prior
financial year.
Money Manager(s) on behalf of a Fund may employ techniques and instruments relating to transferable securities, money
market instruments and/or other financial instruments in which they invest for efficient portfolio management purposes. At
any time a Fund may hold a combination of derivative instruments such as futures, forward contracts, options, swaps and
swaptions, forward foreign exchange contracts, caps, floors and credit derivatives, any of which may be listed or over-the-
counter.
12. Financial Risks
The activities of the Funds expose them to various financial risks such as market risk (including market price risk, interest
rate risk, and currency risk), credit risk and liquidity risk. The overall risk management process for the Funds focuses on the
unpredictability of financial markets and seeks to minimise potential adverse effects on the financial performance for the
Funds. The Funds combine Money Managers with varied investment styles to achieve returns in a broad range of market
conditions and to manage exposure to risk through diversification.
The Company’s financial risk management objectives and policies are consistent with those disclosed in the Company’s
audited financial statements as at and for the year ended 30 June 2015.
13. Exchange Rates
Where applicable, the Administrator used the exchange rates listed below to translate foreign currency amounts, fair value of
investments and other assets and liabilities into U.S. Dollars at the following rates for each USD 1.
31 December 2015 31 December 2015 31 December 2015
Australian Dollar AUD 1.3745 Hong Kong Dollar HKD 7.7502 South African Rand ZAR 15.4955
Brazilian Real BRL 3.9563 Indian Rupee INR 66.1563 Singapore Dollar SGD 1.4187
British Pound GBP 0.6785 Indonesian Rupiah IDR 13,785.0000 South Korean Won KRW 1,172.5500
Canadian Dollar CAD 1.3891 Japanese Yen JPY 20.2950 Swedish Krona SEK 8.4306
Chilean Peso CLP 708.6000 Norwegian Krone NOK 8.8514 Swiss Franc CHF 1.0010
Danish Krone DKK 6.8698 Mexican Peso MXN 17.2712 Taiwan Dollar TWD 32.8470
Egyptian Pound EGP 7.8301 Polish Zloty PLN 3.9490 Thai Baht THB 35.9850
Euro EUR 0.9206 Phillipene Peso PHP 47.0550 Turkish Lira TRY 2.9189
30 June 2015 30 June 2015 30 June 2015
Australian Dollar AUD 1.3011 Hong Kong Dollar HKD 7.7526 South African Rand ZAR 12.1378
Brazilian Real BRL 3.1064 Indian Rupee INR 63.6800 Singapore Dollar SGD 1.3465
British Pound GBP 0.6358 Indonesian Rupiah IDR 13,332.5000 South Korean Won KRW 1,115.4500
Canadian Dollar CAD 1.2485 Japanese Yen JPY 122.3650 Swedish Krona SEK 8.2975
Chilean Peso CLP 639.5300 Norwegian Krone NOK 7.8675 Swiss Franc CHF 0.9346
Danish Krone DKK 6.6953 Mexican Peso MXN 15.6907 Taiwan Dollar TWD 30.8545
Egytian Pound EGP 7.6301 Polish Zloty PLN 3.7609 Turkish Lira TRY 2.679
Euro EUR 0.8975 Phillipene Peso PHP 45.0900 Thai Baht THB 33.7755
The Administrator used the average exchange rates for each reporting period as listed below to translate into U.S. Dollars the
Profit and Loss Account and Statement of Changes in Net Assets Attributable to Redeemable Participating Shareholders of
those Funds not prepared in U.S. Dollars in preparing the Company’s Combined Profit and Loss Account and the Combined
Statement of Changes in Net Assets Attributable to Redeemable Participating Shareholders at the following rates for each
USD 1.
Six months ended 31 December 2015 Six months ended 31 December 2014
British Pound GBP 0.6557 British Pound GBP 0.6111
Euro EUR 0.9077

Russell Investment Company IV plc
Notes to the Financial Statements - continued
31 December 2015
70 Notes to the Financial Statements
14. Comparative Dealing Net Assets
Russell Absolute Return Equity Fund
A GBP
Class
GBP ‘000
A GBP Income
Class
GBP ‘000
A EUR Hedged
Roll-up Class
EUR ‘000
Q GBP Income
Class
GBP ‘000
Total net asset value
31 December 2015 ...................................... - - - -
30 June 2015 ............................................... 121,903 100 41,882 273,964
A GBP
Class
GBP
A GBP Income
Class
GBP
A EUR Hedged
Roll-up Class
EUR
Q GBP Income
Class
GBP
Net asset value per share
31 December 2015 ...................................... - - - -
30 June 2015 ............................................... 9.92 9.45 9.92 9.77
Russell Alpha Fund
A Euro Hedged
Roll-Up
Class
EUR ‘000
GBP Hedged
Class
GBP ‘000
U.S. Dollar
Roll-Up
Class
USD ‘000
Total net asset value
31 December 2015 ...................................... 116,470 83,642 28,540
30 June 2015 ............................................... 80,211 63,856 36,456
A Euro Hedged
Roll-Up
Class
EUR
GBP Hedged
Class
GBP
U.S. Dollar
Roll-Up
Class
USD
Net asset value per share
31 December 2015 ...................................... 10,577.25 9,877.76 11,454.34
30 June 2015 ............................................... 10,737.39 9,986.95 11,581.20
Russell Multi Strategy Volatility Fund
A Euro Hedged
Roll-Up
Class
EUR ‘000
GBP Hedged
Roll-Up
Class
GBP ‘000
AUD Hedged
Class
AUD ‘000
U.S. Dollar
Roll-Up
Class
USD ‘000
Total net asset value
31 December 2015 ...................................... 8,953 6,781 252,891 80,364
30 June 2015 ............................................... 18,392 - 213,381 49,776
A Euro Hedged
Roll-Up
Class
EUR
GBP Hedged
Class
GBP ‘000
AUD Hedged
Class
AUD
U.S. Dollar
Roll-Up
Class
USD
Net asset value per share
31 December 2015 ...................................... 998.73 911.70 1,020.49 1,003.42
30 June 2015 ............................................... 1,104.93 - 1,115.66 1,106.78
Russell Global Regional Equity Fund
A Euro Class
EUR’000
Total net asset value
31 December 2015 ...................................... 327,859
A Euro Class
EUR
Net asset value per share
31 December 2015 ...................................... 978.03
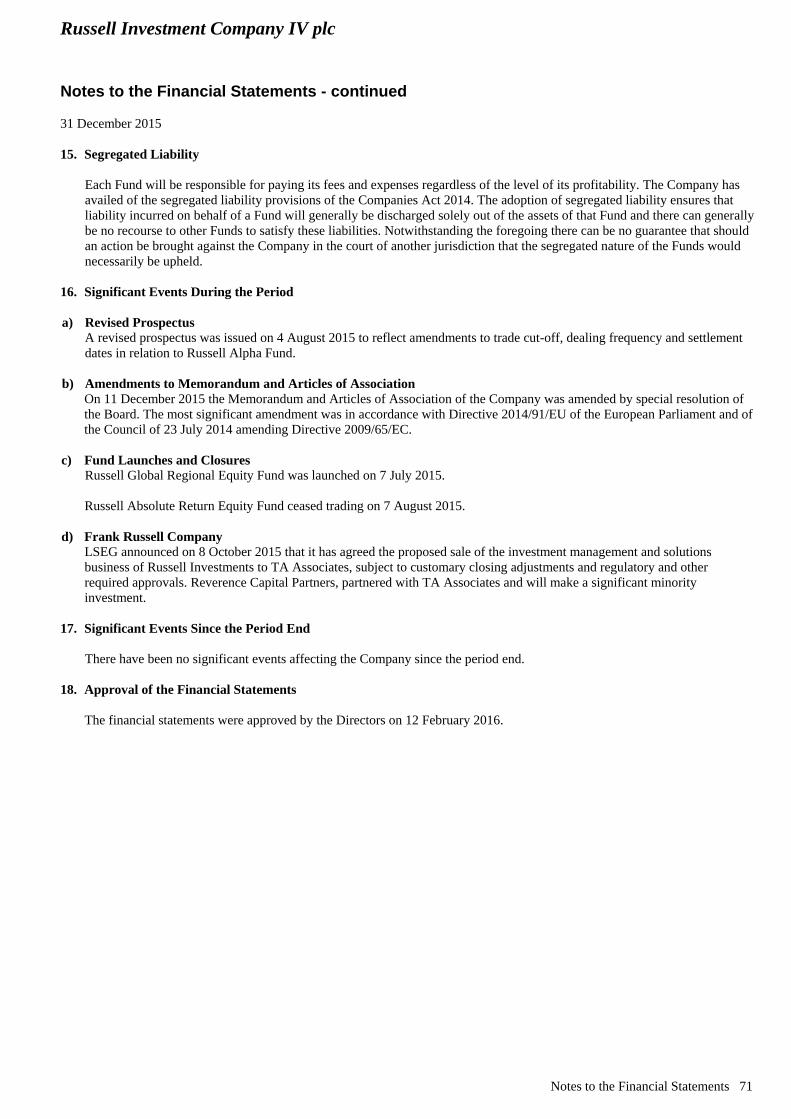
Russell Investment Company IV plc
Notes to the Financial Statements - continued
31 December 2015
Notes to the Financial Statements 71
15. Segregated Liability
Each Fund will be responsible for paying its fees and expenses regardless of the level of its profitability. The Company has
availed of the segregated liability provisions of the Companies Act 2014. The adoption of segregated liability ensures that
liability incurred on behalf of a Fund will generally be discharged solely out of the assets of that Fund and there can generally
be no recourse to other Funds to satisfy these liabilities. Notwithstanding the foregoing there can be no guarantee that should
an action be brought against the Company in the court of another jurisdiction that the segregated nature of the Funds would
necessarily be upheld.
16. Significant Events During the Period
a) Revised Prospectus A revised prospectus was issued on 4 August 2015 to reflect amendments to trade cut-off, dealing frequency and settlement
dates in relation to Russell Alpha Fund.
b) Amendments to Memorandum and Articles of Association
On 11 December 2015 the Memorandum and Articles of Association of the Company was amended by special resolution of
the Board. The most significant amendment was in accordance with Directive 2014/91/EU of the European Parliament and of
the Council of 23 July 2014 amending Directive 2009/65/EC.
c) Fund Launches and Closures
Russell Global Regional Equity Fund was launched on 7 July 2015.
Russell Absolute Return Equity Fund ceased trading on 7 August 2015.
d) Frank Russell Company
LSEG announced on 8 October 2015 that it has agreed the proposed sale of the investment management and solutions
business of Russell Investments to TA Associates, subject to customary closing adjustments and regulatory and other
required approvals. Reverence Capital Partners, partnered with TA Associates and will make a significant minority
investment.
17. Significant Events Since the Period End
There have been no significant events affecting the Company since the period end.
18. Approval of the Financial Statements
The financial statements were approved by the Directors on 12 February 2016.

Russell Investments Rex House10 Regent Street, St James’London, SW1Y 4PE
tel +44 (0) 20 7024 6000fax +44 (0) 20 7024 6001www.russell.com