Embed Size (px)
Citation preview
2015 Second Quarter Investor Presentation July 27, 2015
1
Cautionary Statement Regarding Forward-Looking Statements
The following slides are part of a presentation by Synchrony Financial and are intended to be viewed as part of that presentation.
This presentation contains certain forward-looking statements as defined in Section 27A of the Securities Act of 1933, as amended, and Section 21E of the Securities Exchange Act of 1934, as amended,
which are subject to the “safe harbor” created by those sections. Forward-looking statements may be identified by words such as “outlook,” “expects,” “intends,” “anticipates,” “plans,” “believes,” “seeks,”
“targets,” “estimates,” “will,” “should,” “may” or words of similar meaning, but these words are not the exclusive means of identifying forward-looking statements. Forward-looking statements are based on
management’s current expectations and assumptions, and are subject to inherent uncertainties, risks and changes in circumstances that are difficult to predict. As a result, actual results could differ
materially from those indicated in these forward-looking statements. Factors that could cause actual results to differ materially include global political, economic, business, competitive, market, regulatory
and other factors and risks, such as: the impact of macroeconomic conditions and whether industry trends we have identified develop as anticipated; retaining existing partners and attracting new partners,
concentration of our platform revenue in a small number of Retail Card partners, promotion and support of our products by our partners, and financial performance of our partners; our need for additional
financing, higher borrowing costs and adverse financial market conditions impacting our funding and liquidity, and any reduction in our credit ratings; our ability to securitize our loans, occurrence of an early
amortization of our securitization facilities, loss of the right to service or subservice our securitized loans, and lower payment rates on our securitized loans; our reliance on dividends, distributions and other
payments from Synchrony Bank; our ability to grow our deposits in the future; changes in market interest rates and the impact of any margin compression; effectiveness of our risk management processes
and procedures, reliance on models which may be inaccurate or misinterpreted, our ability to manage our credit risk, the sufficiency of our allowance for loan losses and the accuracy of the assumptions or
estimates used in preparing our financial statements; our ability to offset increases in our costs in retailer share arrangements; competition in the consumer finance industry; our concentration in the U.S.
consumer credit market; our ability to successfully develop and commercialize new or enhanced products and services; our ability to realize the value of strategic investments; reductions in interchange
fees; fraudulent activity; cyber-attacks or other security breaches; failure of third parties to provide various services that are important to our operations; disruptions in the operations of our computer
systems and data centers; international risks and compliance and regulatory risks and costs associated with international operations; alleged infringement of intellectual property rights of others and our
ability to protect our intellectual property; litigation and regulatory actions; damage to our reputation; our ability to attract, retain and motivate key officers and employees; tax legislation initiatives or
challenges to our tax positions and state sales tax rules and regulations; significant and extensive regulation, supervision, examination and enforcement of our business by governmental authorities, the
impact of the Dodd-Frank Act and the impact of the CFPB’s regulation of our business; changes to our methods of offering our CareCredit products; impact of capital adequacy rules; restrictions that limit
Synchrony Bank’s ability to pay dividends; regulations relating to privacy, information security and data protection; use of third-party vendors and ongoing third-party business relationships; failure to comply
with anti-money laundering and anti-terrorism financing laws; effect of General Electric Capital Corporation being subject to regulation by the Federal Reserve Board both as a savings and loan holding
company and as a systemically important financial institution; General Electric Company (GE) not completing the separation from us as planned or at all, GE’s inability to obtain savings and loan holding
company deregistration (GE SLHC Deregistration) and GE continuing to have significant control over us; completion by the Federal Reserve Board of a review (with satisfactory results) of our preparedness
to operate on a standalone basis, independently of GE, and Federal Reserve Board approval required for us to continue to be a savings and loan holding company, including the timing of the approval and
the imposition of any significant additional capital or liquidity requirements; our need to establish and significantly expand many aspects of our operations and infrastructure; delays in receiving or failure to
receive Federal Reserve Board agreement required for us to be treated as a financial holding company after the GE SLHC Deregistration; loss of association with GE’s strong brand and reputation; limited
right to use the GE brand name and logo and need to establish a new brand; GE has significant control over us; terms of our arrangements with GE may be more favorable than what we will be able to
obtain from unaffiliated third parties; obligations associated with being a public company; our incremental cost of operating as a standalone public company could be substantially more than anticipated; GE
could engage in businesses that compete with us, and conflicts of interest may arise between us and GE; and failure caused by us of GE’s distribution of our common stock to its stockholders in exchange
for its common stock to qualify for tax-free treatment, which may result in significant tax liabilities to GE for which we may be required to indemnify GE. For the reasons described above, we caution you
against relying on any forward-looking statements, which should also be read in conjunction with the other cautionary statements that are included elsewhere in this presentation and in our public filings,
including under the heading “Risk Factors” in the Company’s Annual Report on Form 10-K for the fiscal year ended December 31, 2014, as filed on February 23, 2015. You should not consider any list of
such factors to be an exhaustive statement of all of the risks, uncertainties, or potentially inaccurate assumptions that could cause our current expectations or beliefs to change. Further, any forward-
looking statement speaks only as of the date on which it is made, and we undertake no obligation to update or revise any forward-looking statement to reflect events or circumstances after the date on
which the statement is made or to reflect the occurrence of unanticipated events, except as otherwise may be required by law.
Non-GAAP Measures
The information provided herein includes measures we refer to as “platform revenue” and “platform revenue excluding retailer share arrangements” and certain capital ratios, which are not prepared in
accordance with U.S. generally accepted accounting principles (“GAAP”). The reconciliations of such measures to the most directly comparable GAAP measures are included in the appendix of this
presentation.
Disclaimers
2
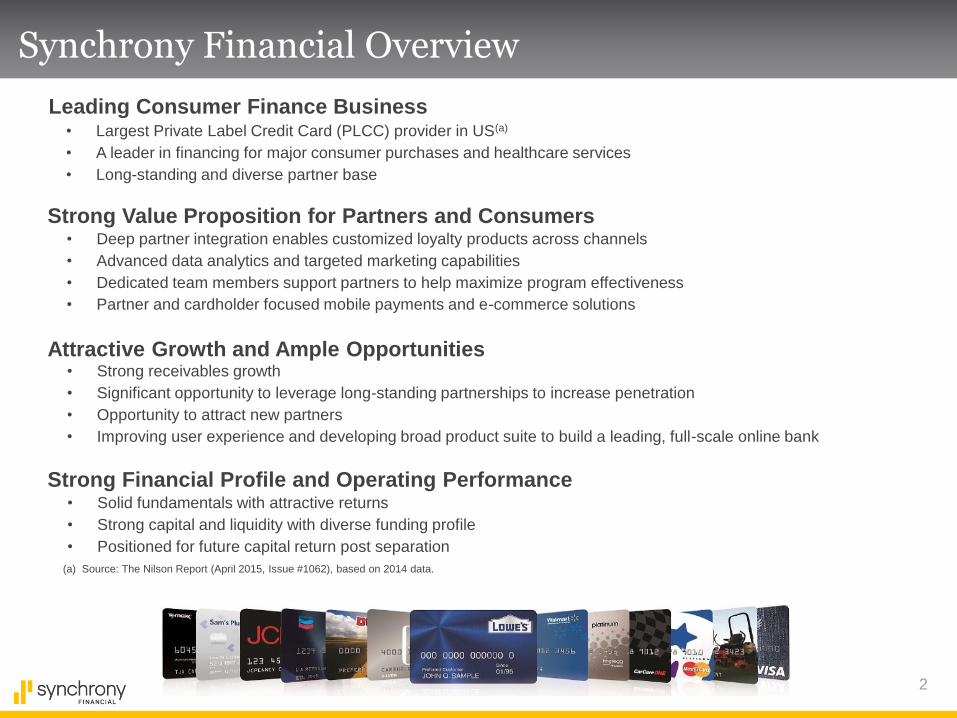
Synchrony Financial Overview
Strong Value Proposition for Partners and Consumers • Deep partner integration enables customized loyalty products across channels
• Advanced data analytics and targeted marketing capabilities
• Dedicated team members support partners to help maximize program effectiveness
• Partner and cardholder focused mobile payments and e-commerce solutions
Attractive Growth and Ample Opportunities • Strong receivables growth
• Significant opportunity to leverage long-standing partnerships to increase penetration
• Opportunity to attract new partners
• Improving user experience and developing broad product suite to build a leading, full-scale online bank
Strong Financial Profile and Operating Performance • Solid fundamentals with attractive returns
• Strong capital and liquidity with diverse funding profile
• Positioned for future capital return post separation
Leading Consumer Finance Business • Largest Private Label Credit Card (PLCC) provider in US(a)
• A leader in financing for major consumer purchases and healthcare services
• Long-standing and diverse partner base
(a) Source: The Nilson Report (April 2015, Issue #1062), based on 2014 data.
3
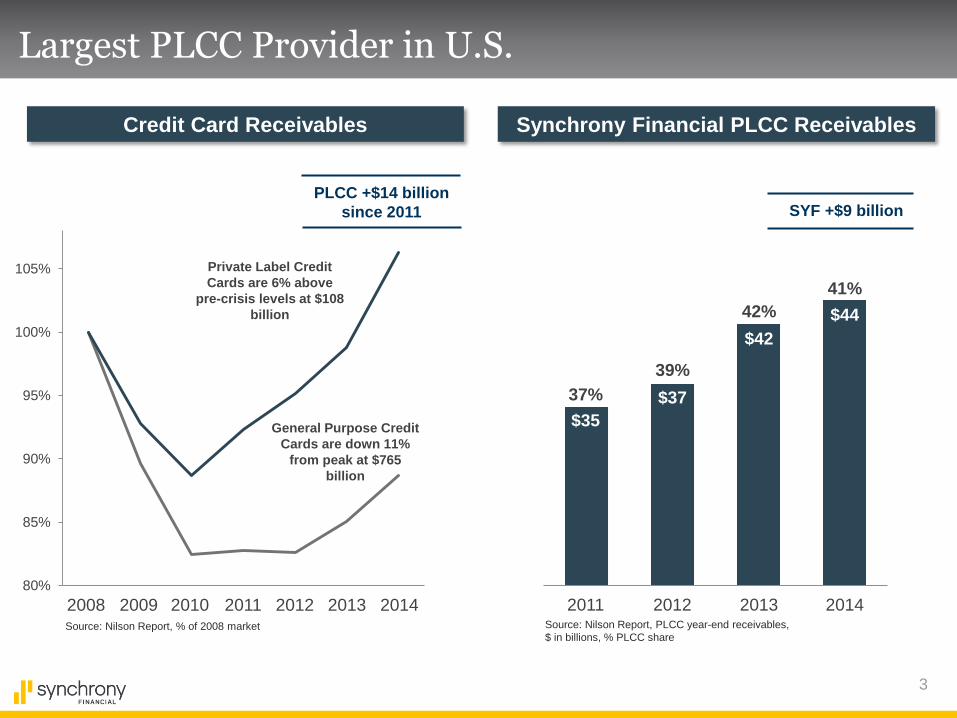
Largest PLCC Provider in U.S.
Source: Nilson Report, % of 2008 market
80%
85%
90%
95%
100%
105% Private Label Credit
Cards are 6% above
pre-crisis levels at $108
billion
General Purpose Credit
Cards are down 11%
from peak at $765
billion
2008 2009 2010 2011 2012 2013 Source: Nilson Report, PLCC year-end receivables,
$ in billions, % PLCC share
$42
$35
$37
SYF +$9 billion PLCC +$14 billion
since 2011
2014 2011 2012
42%
37%
39%
$44
41%
2014 2013
Credit Card Receivables Synchrony Financial PLCC Receivables
4
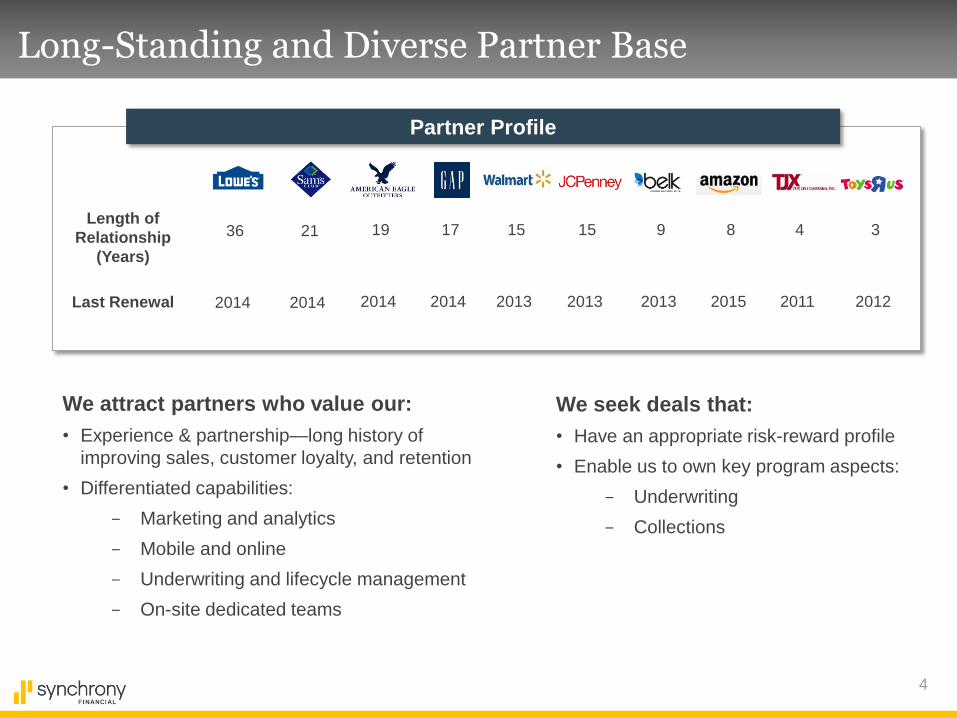
Long-Standing and Diverse Partner Base
Partner Profile
Length of
Relationship
(Years)
Last Renewal
36
2014
21
2014
19
2014
17
2014
15
2013
15
2013
9
2013
8
2015
4
2011
3
2012
We attract partners who value our:
• Experience & partnership—long history of
improving sales, customer loyalty, and retention
• Differentiated capabilities:
- Marketing and analytics
- Mobile and online
- Underwriting and lifecycle management
- On-site dedicated teams
We seek deals that:
• Have an appropriate risk-reward profile
• Enable us to own key program aspects:
- Underwriting
- Collections
5
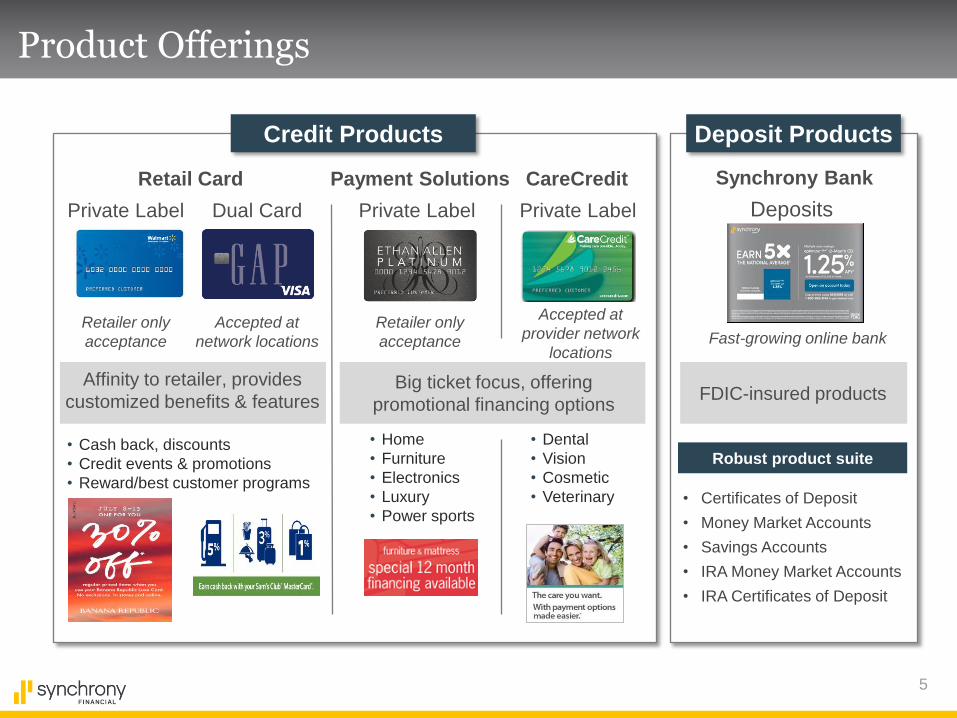
Product Offerings
Credit Products
Retailer only
acceptance
Accepted at
network locations
Deposit Products
Retailer only
acceptance
Accepted at
provider network
locations Fast-growing online bank
Private Label Dual Card
Payment Solutions CareCredit
Deposits
Affinity to retailer, provides
customized benefits & features FDIC-insured products Big ticket focus, offering
promotional financing options
Retail Card
Private Label Private Label
Synchrony Bank
Robust product suite
• Certificates of Deposit
• Money Market Accounts
• Savings Accounts
• IRA Money Market Accounts
• IRA Certificates of Deposit
• Dental
• Vision
• Cosmetic
• Veterinary
• Cash back, discounts
• Credit events & promotions
• Reward/best customer programs
• Home
• Furniture
• Electronics
• Luxury
• Power sports
6
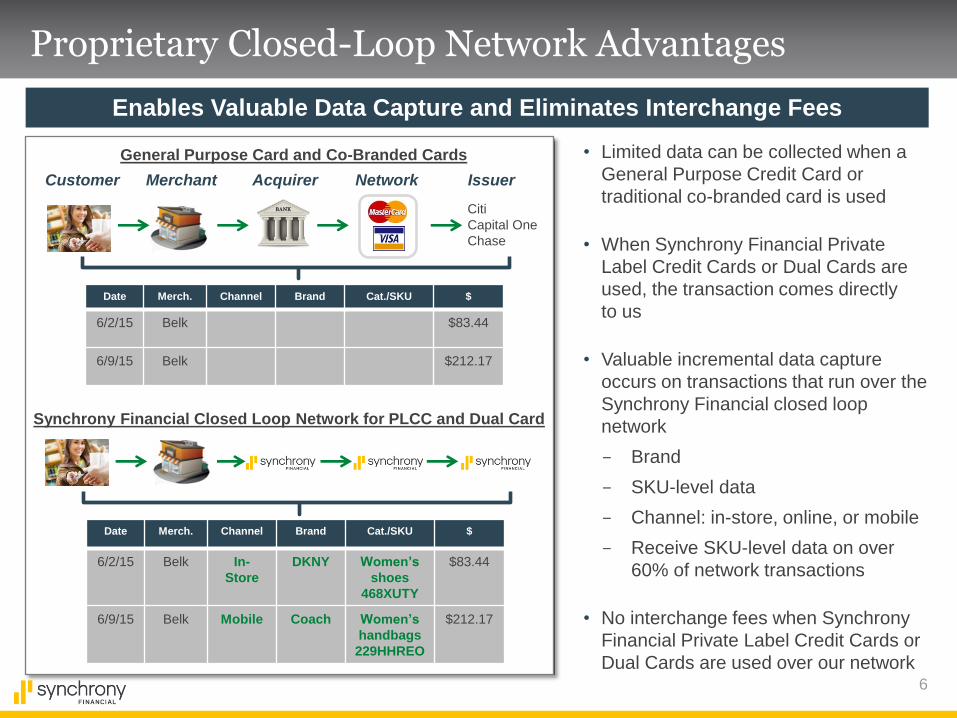
Proprietary Closed-Loop Network Advantages
Customer Merchant Acquirer Network Issuer
General Purpose Card and Co-Branded Cards
Synchrony Financial Closed Loop Network for PLCC and Dual Card
Citi
Capital One
Chase
Date Merch. Channel Brand Cat./SKU $
6/2/15 Belk In-
Store
DKNY Women’s
shoes
468XUTY
$83.44
6/9/15 Belk Mobile Coach Women’s
handbags
229HHREO
$212.17
Date Merch. Channel Brand Cat./SKU $
6/2/15 Belk $83.44
6/9/15 Belk $212.17
Enables Valuable Data Capture and Eliminates Interchange Fees
• Limited data can be collected when a
General Purpose Credit Card or
traditional co-branded card is used
• When Synchrony Financial Private
Label Credit Cards or Dual Cards are
used, the transaction comes directly
to us
• Valuable incremental data capture
occurs on transactions that run over the
Synchrony Financial closed loop
network
- Brand
- SKU-level data
- Channel: in-store, online, or mobile
- Receive SKU-level data on over
60% of network transactions
• No interchange fees when Synchrony
Financial Private Label Credit Cards or
Dual Cards are used over our network
7
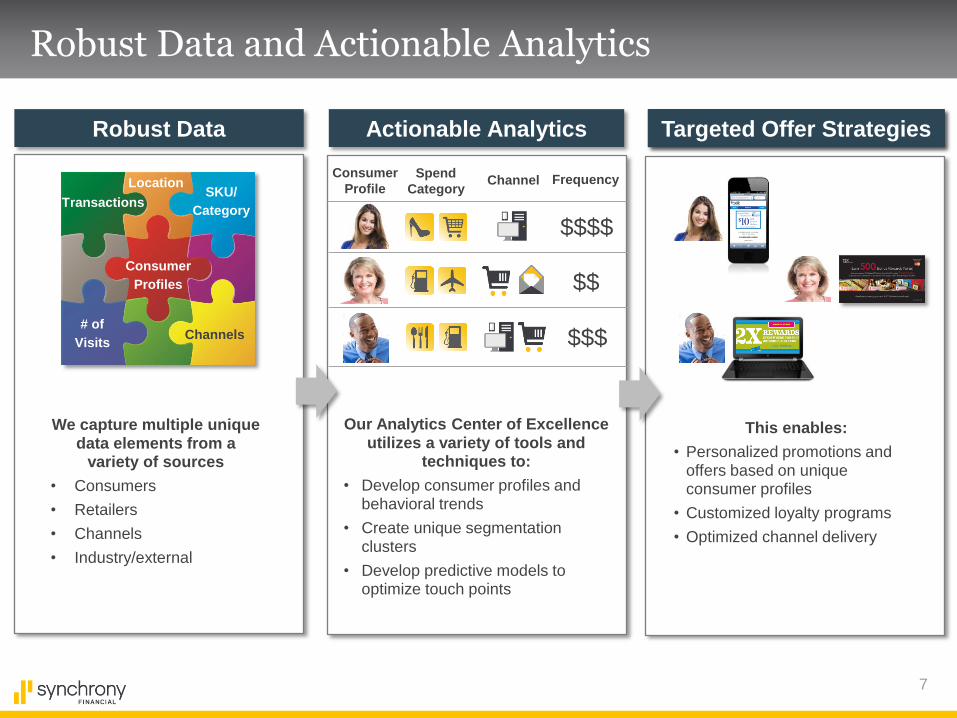
We capture multiple unique data elements from a
variety of sources
• Consumers
• Retailers
• Channels
• Industry/external
Our Analytics Center of Excellence utilizes a variety of tools and
techniques to:
• Develop consumer profiles and behavioral trends
• Create unique segmentation clusters
• Develop predictive models to optimize touch points
Robust Data Actionable Analytics Targeted Offer Strategies
Robust Data and Actionable Analytics
Transactions
Consumer
profiles
# of visits
Location
This enables:
• Personalized promotions and offers based on unique consumer profiles
• Customized loyalty programs
• Optimized channel delivery
Channels
SKU/
Category Transactions
Consumer
Profiles
# of
Visits
Location
Targeted Offer Strategies
Spend
Category Channel Frequency
$$$$
$$
$$$
Consumer
Profile
8
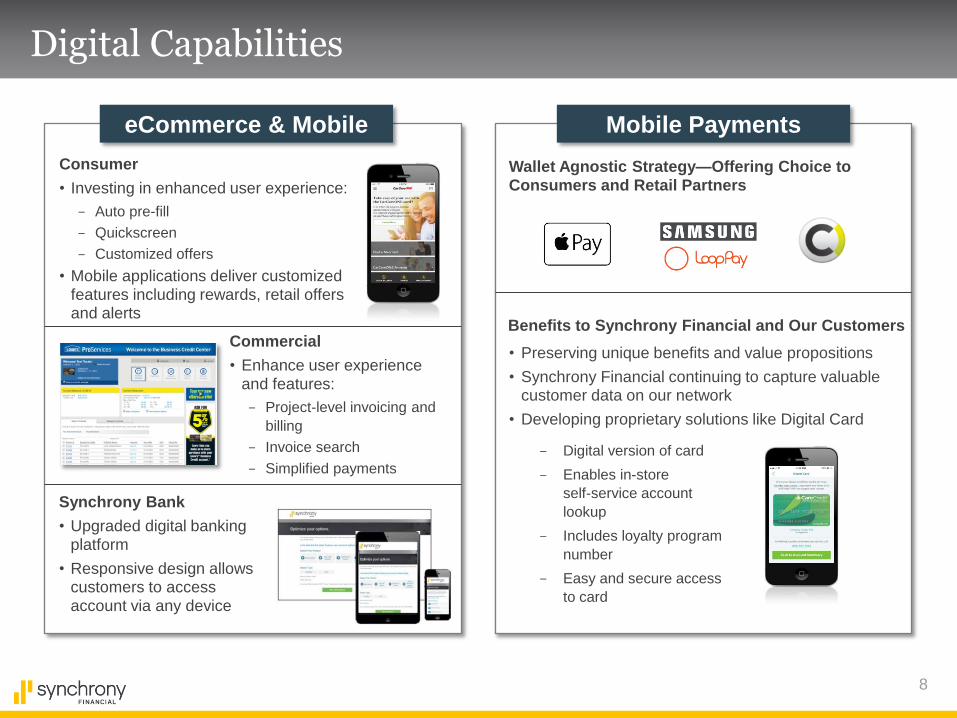
eCommerce & Mobile
Digital Capabilities
Mobile Payments
Consumer
• Investing in enhanced user experience:
- Auto pre-fill
- Quickscreen
- Customized offers
• Mobile applications deliver customized features including rewards, retail offers and alerts
Wallet Agnostic Strategy—Offering Choice to Consumers and Retail Partners
• Preserving unique benefits and value propositions
• Synchrony Financial continuing to capture valuable customer data on our network
• Developing proprietary solutions like Digital Card
Commercial
• Enhance user experience and features:
- Project-level invoicing and
billing
- Invoice search
- Simplified payments
Synchrony Bank
• Upgraded digital banking platform
• Responsive design allows customers to access account via any device
- Digital version of card
- Enables in-store
self-service account
lookup
- Includes loyalty program
number
- Easy and secure access
to card
Benefits to Synchrony Financial and Our Customers
9
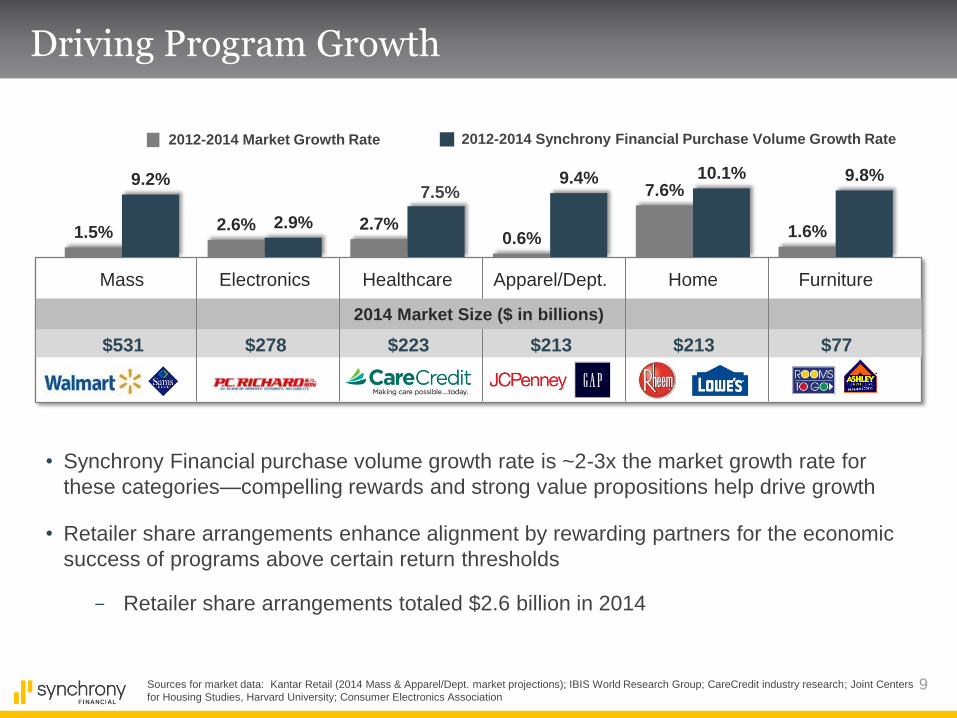
Driving Program Growth
1.5% 2.6% 2.7% 0.6%
7.6%
1.6%
9.2%
2.9%
7.5% 9.4% 10.1% 9.8%
Mass Electronics Healthcare Apparel/Dept. Home Furniture
$531 $278 $223 $213 $213 $77
2014 Market Size ($ in billions)
2012-2014 Market Growth Rate 2012-2014 Synchrony Financial Purchase Volume Growth Rate
Sources for market data: Kantar Retail (2014 Mass & Apparel/Dept. market projections); IBIS World Research Group; CareCredit industry research; Joint Centers
for Housing Studies, Harvard University; Consumer Electronics Association
• Synchrony Financial purchase volume growth rate is ~2-3x the market growth rate for
these categories—compelling rewards and strong value propositions help drive growth
• Retailer share arrangements enhance alignment by rewarding partners for the economic
success of programs above certain return thresholds
- Retailer share arrangements totaled $2.6 billion in 2014
10
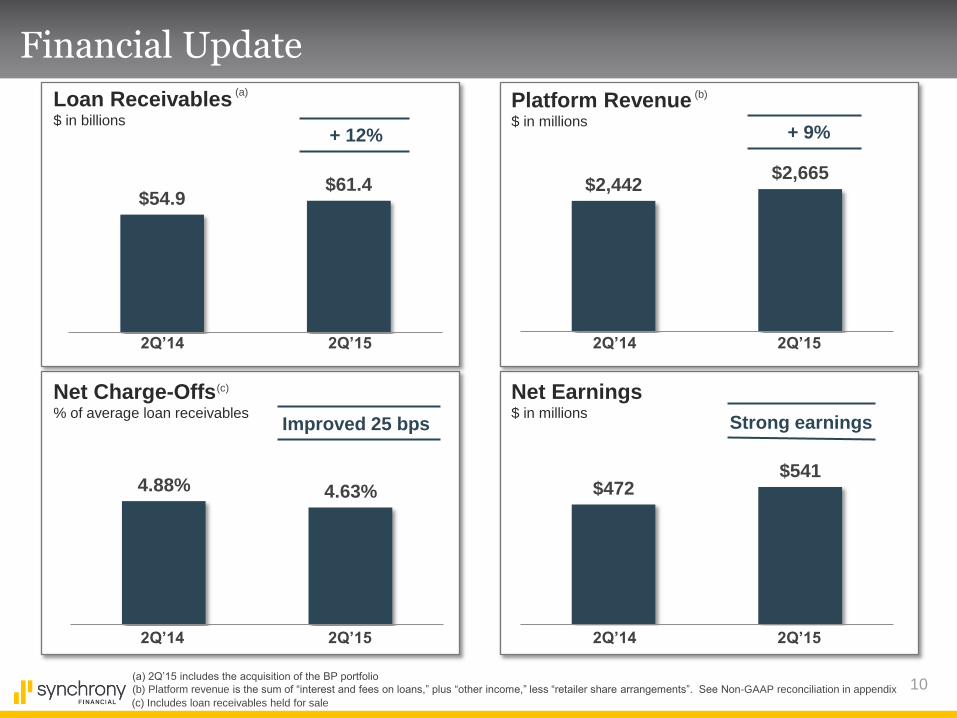
$472 $541
4.88% 4.63%
Financial Update
Net Earnings $ in millions
2Q’14 2Q’15
Strong earnings
Loan Receivables $ in billions
+ 12%
Net Charge-Offs % of average loan receivables
Platform Revenue $ in millions
$2,442 $2,665
+ 9%
Improved 25 bps
$54.9 $61.4
2Q’14 2Q’15
2Q’14 2Q’15
2Q’14 2Q’15
(b)
(b) Platform revenue is the sum of “interest and fees on loans,” plus “other income,” less “retailer share arrangements”. See Non-GAAP reconciliation in appendix
(c)
(c) Includes loan receivables held for sale
(a) 2Q’15 includes the acquisition of the BP portfolio
(a)
11
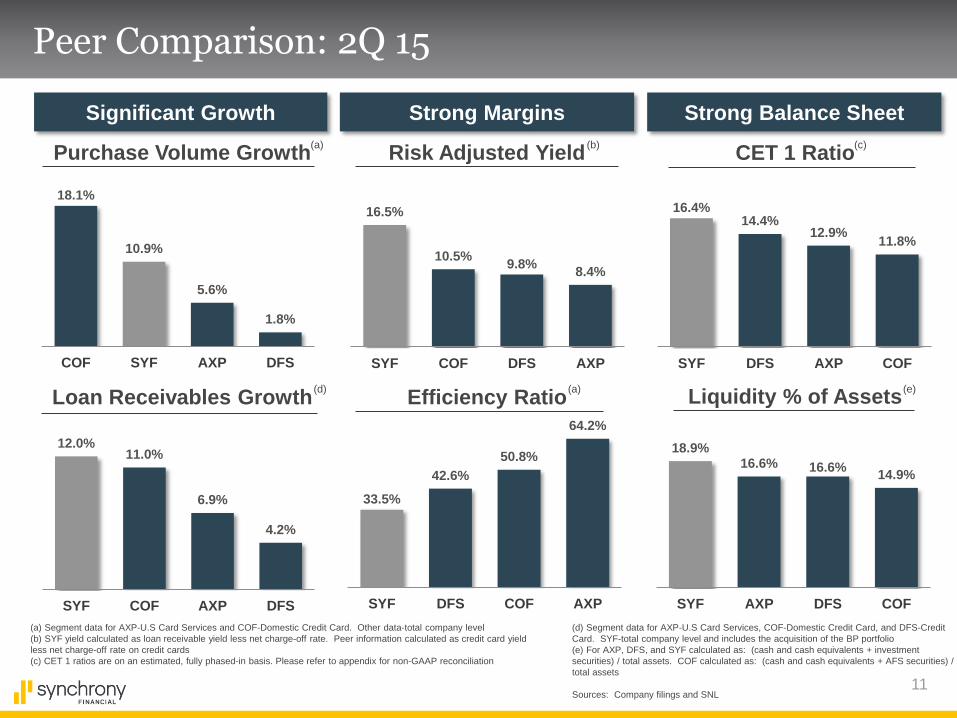
Peer Comparison: 2Q 15
(a) Segment data for AXP-U.S Card Services and COF-Domestic Credit Card. Other data-total company level
(b) SYF yield calculated as loan receivable yield less net charge-off rate. Peer information calculated as credit card yield
less net charge-off rate on credit cards
(c) CET 1 ratios are on an estimated, fully phased-in basis. Please refer to appendix for non-GAAP reconciliation
33.5%
42.6%
50.8%
64.2%
SYF DFS COF AXP
Efficiency Ratio
Risk Adjusted Yield
16.5%
10.5% 9.8%
8.4%
SYF COF DFS AXP
18.1%
10.9%
5.6%
1.8%
COF SYF AXP DFS
Purchase Volume Growth
Liquidity % of Assets
18.9% 16.6% 16.6%
14.9%
SYF AXP DFS COF
16.4% 14.4%
12.9% 11.8%
SYF DFS AXP COF
CET 1 Ratio
(e)
Strong Margins Significant Growth Strong Balance Sheet
Loan Receivables Growth
12.0% 11.0%
6.9%
4.2%
SYF COF AXP DFS
(a)
(d)
(d) Segment data for AXP-U.S Card Services, COF-Domestic Credit Card, and DFS-Credit
Card. SYF-total company level and includes the acquisition of the BP portfolio
(e) For AXP, DFS, and SYF calculated as: (cash and cash equivalents + investment
securities) / total assets. COF calculated as: (cash and cash equivalents + AFS securities) /
total assets
Sources: Company filings and SNL
(c)
(a)
(b)
12
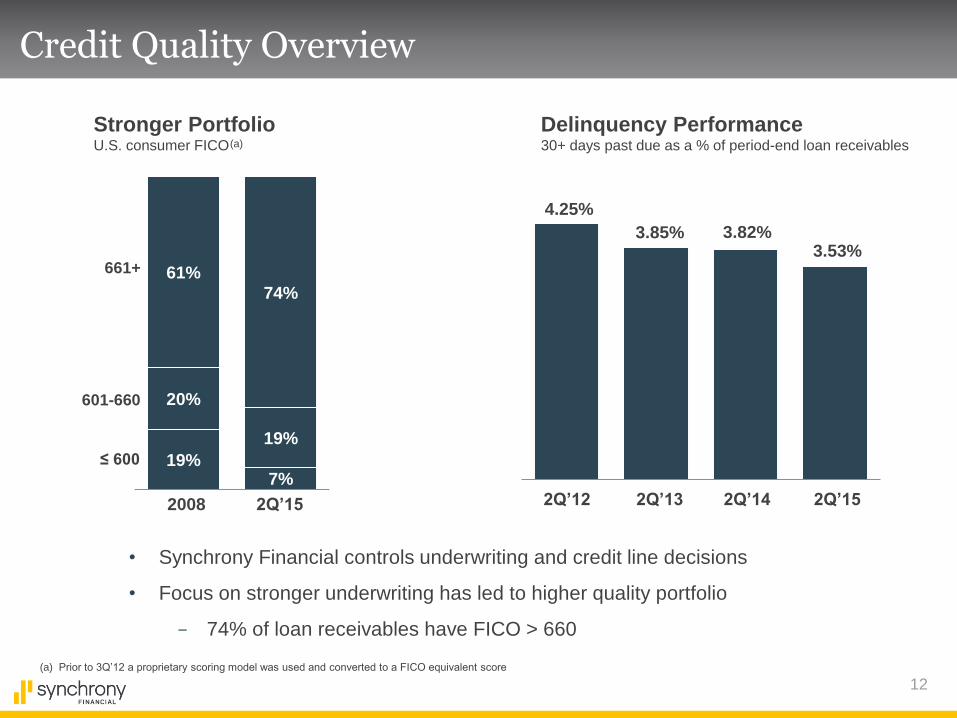
Credit Quality Overview
• Synchrony Financial controls underwriting and credit line decisions
• Focus on stronger underwriting has led to higher quality portfolio
- 74% of loan receivables have FICO > 660
Stronger Portfolio U.S. consumer FICO
Delinquency Performance 30+ days past due as a % of period-end loan receivables
3.85% 3.82% 3.53%
2Q’15 2Q’14 2Q’13
(a)
(a) Prior to 3Q’12 a proprietary scoring model was used and converted to a FICO equivalent score
4.25%
2Q’12
19% 7%
20%
19%
61%
74%
601-660
661+
2008 2Q’15
≤ 600
13
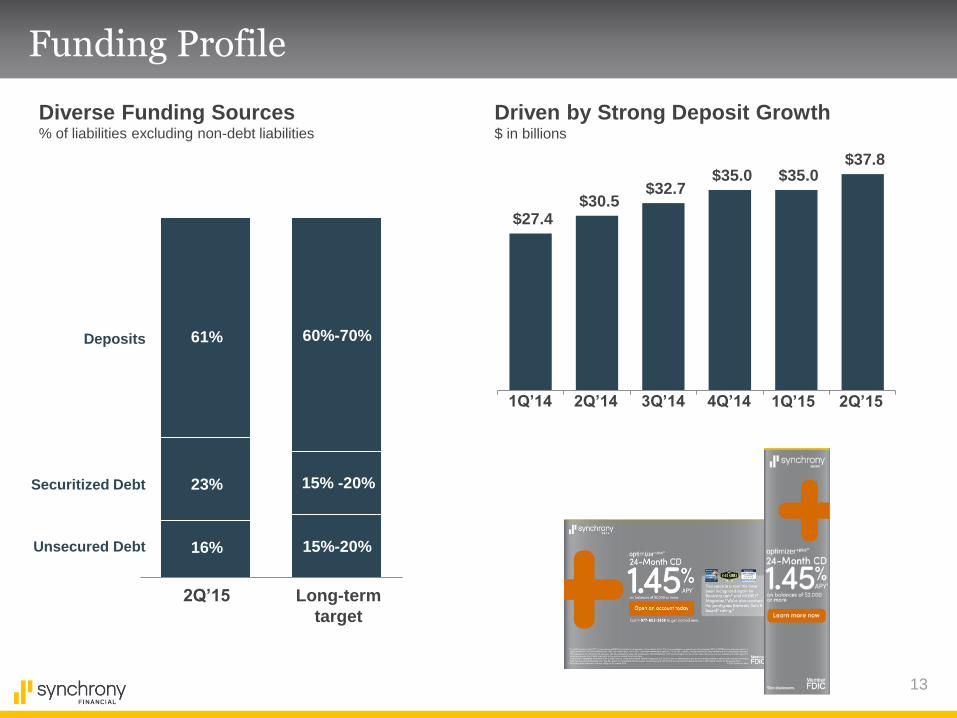
Funding Profile
Deposits
Securitized Debt
Unsecured Debt
2Q’15 Long-term
target
16%
61%
23%
15%-20%
60%-70%
15% -20%
Diverse Funding Sources % of liabilities excluding non-debt liabilities
Driven by Strong Deposit Growth $ in billions
$27.4 $30.5
$32.7 $35.0 $35.0
$37.8
2Q’14 1Q’14 3Q’14 4Q’14 1Q’15 2Q’15
14
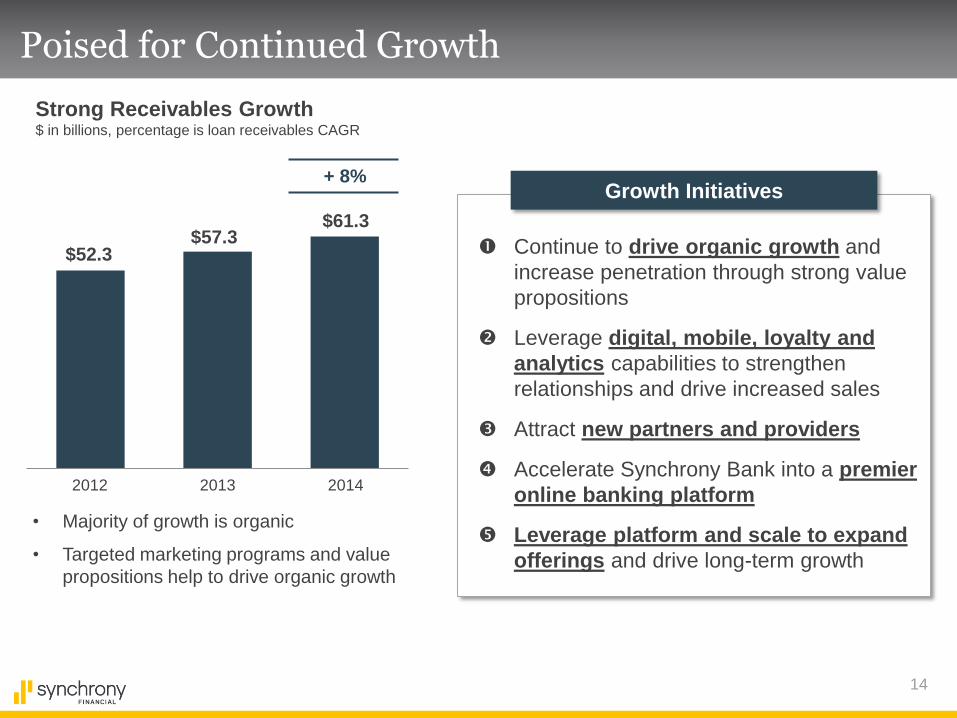
Poised for Continued Growth
Growth Initiatives
Strong Receivables Growth $ in billions, percentage is loan receivables CAGR
2012
$57.3
2013 2014
• Majority of growth is organic
• Targeted marketing programs and value
propositions help to drive organic growth
$52.3
$61.3
Continue to drive organic growth and
increase penetration through strong value
propositions
Leverage digital, mobile, loyalty and
analytics capabilities to strengthen
relationships and drive increased sales
Attract new partners and providers
Accelerate Synchrony Bank into a premier
online banking platform
Leverage platform and scale to expand
offerings and drive long-term growth
+ 8%
15
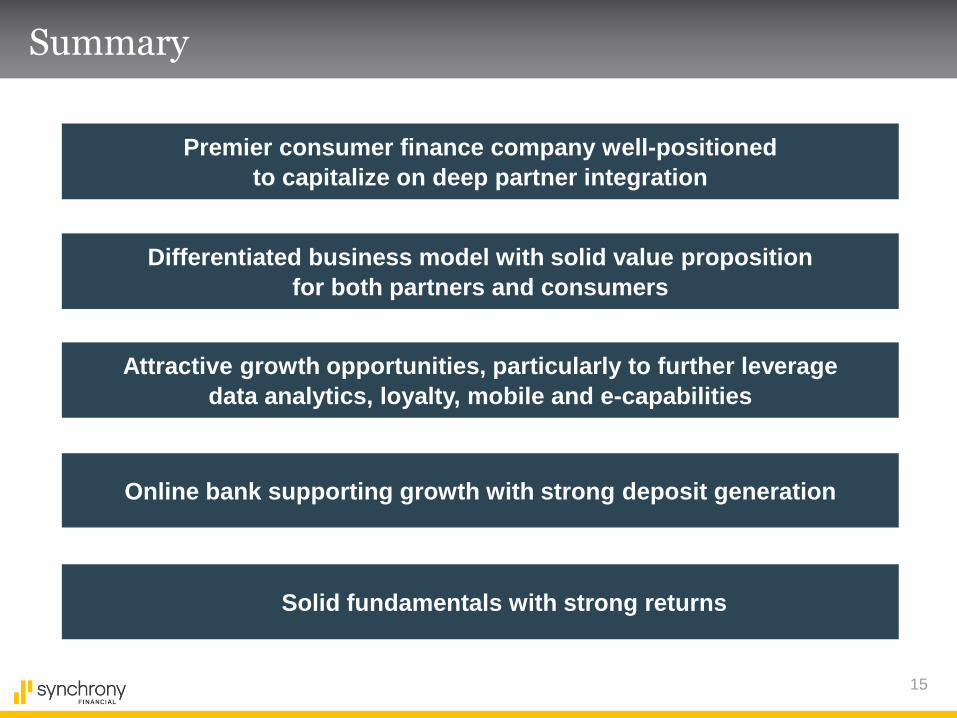
Summary
Online bank supporting growth with strong deposit generation
Solid fundamentals with strong returns
Attractive growth opportunities, particularly to further leverage
data analytics, loyalty, mobile and e-capabilities
Premier consumer finance company well-positioned
to capitalize on deep partner integration
Differentiated business model with solid value proposition
for both partners and consumers
Engage with us.
17
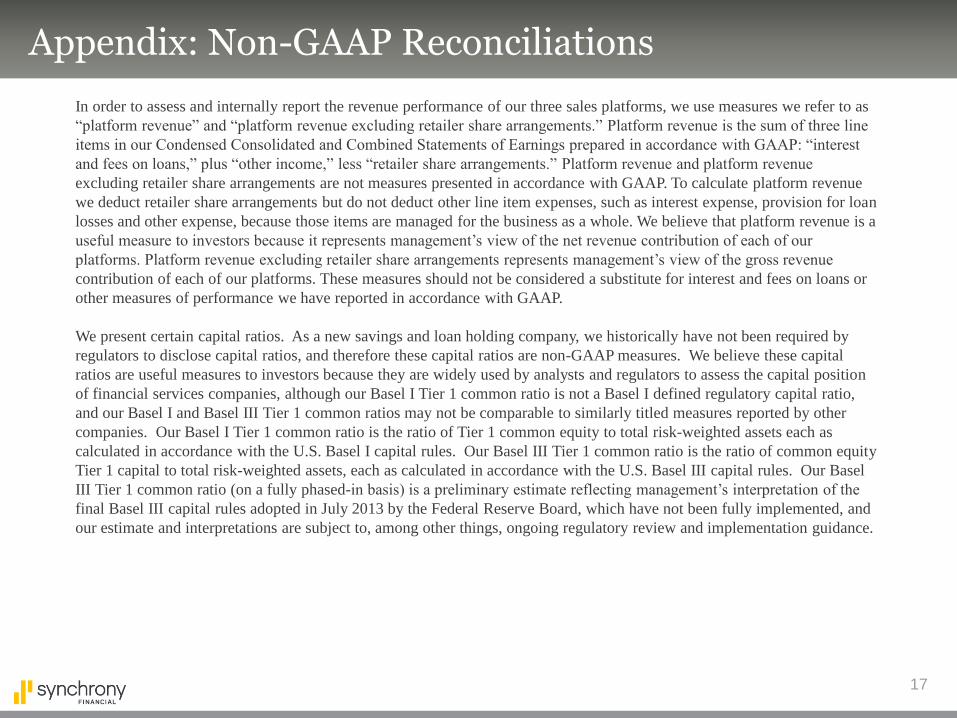
Appendix: Non-GAAP Reconciliations
In order to assess and internally report the revenue performance of our three sales platforms, we use measures we refer to as
“platform revenue” and “platform revenue excluding retailer share arrangements.” Platform revenue is the sum of three line
items in our Condensed Consolidated and Combined Statements of Earnings prepared in accordance with GAAP: “interest
and fees on loans,” plus “other income,” less “retailer share arrangements.” Platform revenue and platform revenue
excluding retailer share arrangements are not measures presented in accordance with GAAP. To calculate platform revenue
we deduct retailer share arrangements but do not deduct other line item expenses, such as interest expense, provision for loan
losses and other expense, because those items are managed for the business as a whole. We believe that platform revenue is a
useful measure to investors because it represents management’s view of the net revenue contribution of each of our
platforms. Platform revenue excluding retailer share arrangements represents management’s view of the gross revenue
contribution of each of our platforms. These measures should not be considered a substitute for interest and fees on loans or
other measures of performance we have reported in accordance with GAAP.
We present certain capital ratios. As a new savings and loan holding company, we historically have not been required by
regulators to disclose capital ratios, and therefore these capital ratios are non-GAAP measures. We believe these capital
ratios are useful measures to investors because they are widely used by analysts and regulators to assess the capital position
of financial services companies, although our Basel I Tier 1 common ratio is not a Basel I defined regulatory capital ratio,
and our Basel I and Basel III Tier 1 common ratios may not be comparable to similarly titled measures reported by other
companies. Our Basel I Tier 1 common ratio is the ratio of Tier 1 common equity to total risk-weighted assets each as
calculated in accordance with the U.S. Basel I capital rules. Our Basel III Tier 1 common ratio is the ratio of common equity
Tier 1 capital to total risk-weighted assets, each as calculated in accordance with the U.S. Basel III capital rules. Our Basel
III Tier 1 common ratio (on a fully phased-in basis) is a preliminary estimate reflecting management’s interpretation of the
final Basel III capital rules adopted in July 2013 by the Federal Reserve Board, which have not been fully implemented, and
our estimate and interpretations are subject to, among other things, ongoing regulatory review and implementation guidance.
18
Non-GAAP Reconciliation
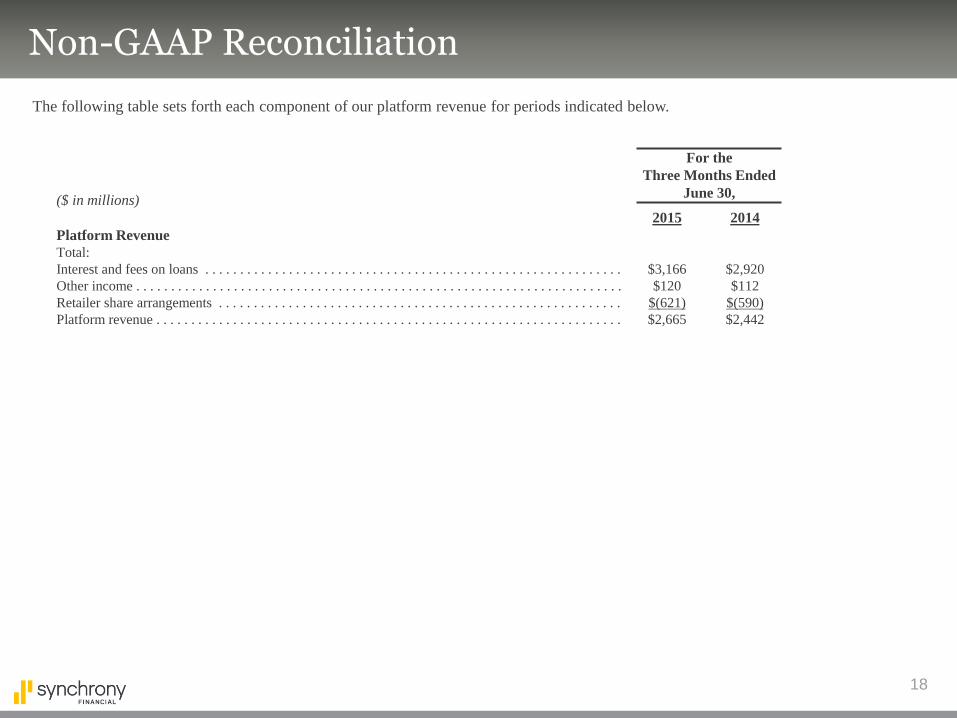
The following table sets forth each component of our platform revenue for periods indicated below.
($ in millions)
2015 2014
Platform Revenue
Total:
Interest and fees on loans . . . . . . . . . . . . . . . . . . . . . . . . . . . . . . . . . . . . . . . . . . . . . . . . . . . . . . . . . . . . . . $3,166 $2,920
Other income . . . . . . . . . . . . . . . . . . . . . . . . . . . . . . . . . . . . . . . . . . . . . . . . . . . . . . . . . . . . . . . . . . . . . . . . $120 $112
Retailer share arrangements . . . . . . . . . . . . . . . . . . . . . . . . . . . . . . . . . . . . . . . . . . . . . . . . . . . . . . . . . . . . $(621) $(590)
Platform revenue . . . . . . . . . . . . . . . . . . . . . . . . . . . . . . . . . . . . . . . . . . . . . . . . . . . . . . . . . . . . . . . . . . . . . $2,665 $2,442
For the
Three Months Ended
June 30,
19
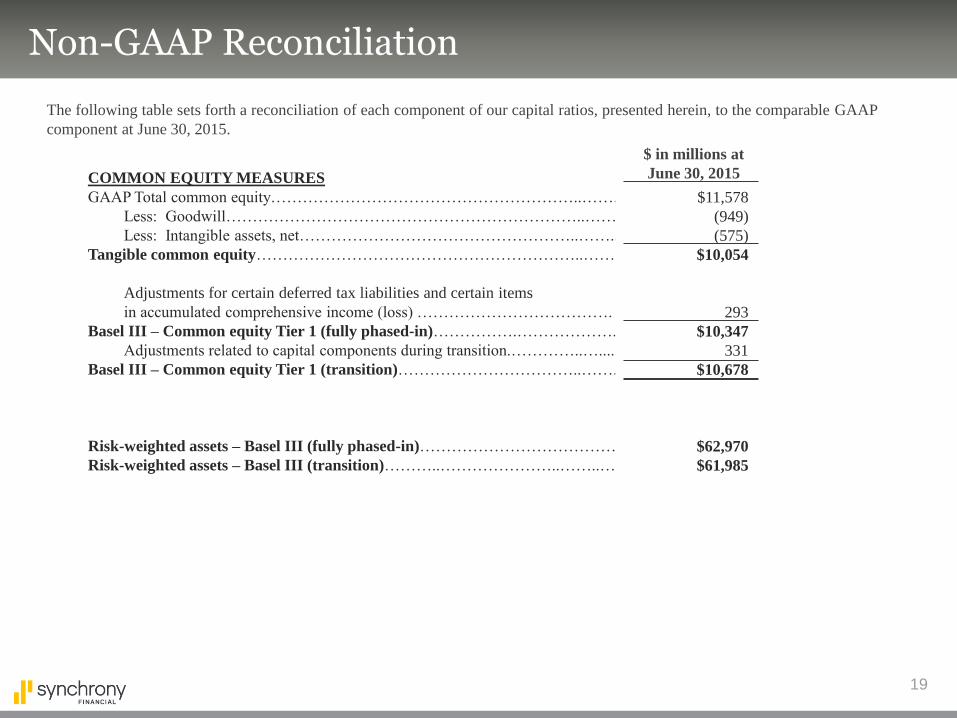
COMMON EQUITY MEASURES
GAAP Total common equity…………………………………………………..……..
Less: Goodwill…………………………………………………………..……..
Less: Intangible assets, net……………………………………………..……..
Tangible common equity……………………………………………………..…….
Adjustments for certain deferred tax liabilities and certain items
in accumulated comprehensive income (loss) ……………………………….
Basel III – Common equity Tier 1 (fully phased-in)…………….………………...
Adjustments related to capital components during transition.…………..…......
Basel III – Common equity Tier 1 (transition)……………………………..……..
Risk-weighted assets – Basel III (fully phased-in)………………………………………
Risk-weighted assets – Basel III (transition)………..…………………..……..…
Non-GAAP Reconciliation
The following table sets forth a reconciliation of each component of our capital ratios, presented herein, to the comparable GAAP
component at June 30, 2015.
$11,578
(949)
(575)
$10,054
293
$10,347
331
$10,678
$62,970
$61,985
$ in millions at
June 30, 2015