Embed Size (px)
Citation preview

2015 Roads Financing Report for the Long-Term
Roads Plan
County of Sonoma
November 10, 2015

Table of Contents
I. Introduction ............................................................................................ 2
II. Funding Sources for Sonoma County Roads .......................................... 2
III. Current Roads Investments .................................................................. 6
IV. Corrective Maintenance and Pavement Preservation ........................... 6
V. County Road Network Need ................................................................. 7
VI. Overview of Identified Funding Strategies ............................................ 9
VII. Federal and State Legislation Funding Possibilities ............................. 20
VIII. Recommendation ............................................................................... 22
IX. Appendix A: Sonoma County FY 15/16 Pavement Preservation
Program Maps by Supervisorial District .............................................. 24
1 | P a g e

I. INTRODUCTION
On October 28, 2014, the Board of Supervisors adopted the Final Long Term Roads Plan which describes a long-term vision for Sonoma County roads. To support financing of the Plan, the Board of Supervisors placed Measure A, a proposed ¼ cent sales tax increase on the June 2, 2015 special election ballot. It was anticipated that Measure A would generate approximately $20 Million per year, with the County’s share being approximately $8.7 Million to expand the Board’s $11.57 Million annual investment commitment to roads. Absent the revenue from Measure A, the Board of Supervisors directed staff to: (1) identify one-time available discretionary sources for the FY 15/16 and 16/17 Pavement Preservation Program to augment the current General Fund allocation toward pavement preservation of $11.57 Million, and (2) explore use of the Tax Revenue Loss Fund (“Teeter”) reserve policy and potential increase of the Transient Occupancy Tax for roads. It is important to note that the investment required to bring the condition of the County Road network to the goal of “Very Good” by 2035 as described in Policy 1A of the 2009 Comprehensive Transportation Plan for Sonoma County1 is approximately $954 Million over the next 20 years, or $47.7 Million per year.2 Without a minimal annual investment of $20 Million per year toward pavement preservation, the entire network will continue to decline, creating long-term economic costs. In that regard, the Board of Supervisors has committed to continuing its current $11.57 Million annual investment recognizing that at least $20 Million per year is required to begin seeing improvements in road conditions. Even with an investment of $20 Million per year there will still be an increase in the backlog of maintenance needs over the long term. This financing report provides an overview of an assessment of financing strategy options to increase the Board’s commitment towards the $40 Million annual investment needed to improve the County’s Road Network of which $20 Million will be dedicated for pavement preservation and $20 Million dedicated to other corrective maintenance activities, such as pothole patching, vegetation management, repair/maintenance of other road infrastructure such as culverts, signals, pavement markings, traffic signs, bridges, etc. In order to achieve the goal of providing $20 Million per year for rehabilitation and pavement preservation, the County must find another on-going source of an additional $8 Million annually.
II. FUNDING SOURCES FOR SONOMA COUNTY ROADS A large portion of the currently available fiscal resources are for a prescribed use. The majority of funds are directed by outside funding entities to new construction projects or to projects that
1 “2009 Comprehensive Transportation Plan for Sonoma County”, Sonoma County Transportation Authority 2 “Sonoma County 2013-14 Pavement Management Program Update”, Harris & Associates, January 2014.
2 | P a g e

extend the life of the road, in which the specific projects are identified in order to receive the funds. State gas taxes and general fund are the primary discretionary funds that may be used for non-primary road projects and corrective maintenance, which are the activities designed to keep the roads as safe as possible. Other funds are for defined activities, such as reducing discharge into streams, augmenting fish passage structures, or installing ramps in accordance with the Americans with Disabilities Act. Often, administrative costs cannot be recovered, or can only partially be recovered. Specifically Sonoma County Roads Division budget funding resources are: Federal Excise Tax Excise tax on gasoline is 18.4 cents per gallon of fuel sold, and the federal tax on diesel fuel is 24.4 cents per gallon of fuel sold. These revenues are deposited in the Highway Trust Fund and distributed to states for qualifying projects that meet categorical program definitions. The federal fuel excise funds returned to California are then deposited in the State Highway Account. These funds are made available as part of the Federal and State Transportation Improvement Programs (FTIP and STIP, respectively) for qualifying projects in four general categories: federal highway projects, federal bridge projects, federal safety projects, and congestion management and air quality. The County currently receives on the average approximately $1.8 Million per year for capital projects on the federally eligible road network in addition to bridge funds through for bridge retrofit and replacement. Moving Ahead for Progress in the 21st Century Act Moving Ahead for Progress in the 21st Century Act, or MAP-21, was signed into law in July 2012 and augmented by Congress with the Highway and Transportation Funding Act of 2014, an eight month extension of the federal surface transportation program, on which state and local agencies rely on for road, highway, bridge and transit funding. This legislation extends the current authorization for the highway and public transportation programs and transfers nearly $8 billion into the Highway Trust Fund (HTF) to preserve existing levels of highway and public transportation investment through October 29, 2015. The current proposal is to approve another short term extension to November 20, 2015. The level of funding and the provisions of the federal surface transportation program have a significant impact on highway and bridge conditions, roadway safety, transit service, quality-of-life and economic development opportunities in both California and Sonoma County. Unfortunately, Congress has been unable to come to any agreement on a long-term federal strategy to maintain consistent and adequate resources in the Highway Trust Fund.
3 | P a g e

From 2008 to 2012, for every dollar that California paid in federal motor fuel fees, the state received $1.32 back for road improvements.3 With that said, only 360 miles (26%) of the County’s 1,380 mile maintained network is eligible to use these federal funds. State The State of California has utilized a combination of funding sources to help local agencies finance road repairs, such as taxes, fees and bonds. Despite State legislative changes in 2010 that resulted in what is known as the “Gas Tax Swap”, the, State’s excise tax on fuels of 30 cents per gallon has gone unchanged for more than 20 years, similar to the federal government’s excise tax on fuels, reducing purchasing power by 28%, due to construction cost of inflation and decreased fuel consumption.4
Approximately 44% stays in the State Highway Account to supplement federal funds through the STIP, 12% is dedicated to the State Highway Operations and Protection Program (SHOPP) and the remaining 44% is provided to city and county streets and roads based on formula. Only 22% of California’s fuel taxes are returned to Counties, and that is further allocated via a 75%/25% formula based on the number of registered vehicles and maintained road miles, respectively. The County receives an average of $12.7 Million per year in state fuel tax funds, which is among the lowest in the State considering the number of road miles within the maintained system. The figure below shows the eight most populace counties receive approximately 47% of the total State fuel tax despite having only 12% of the total statewide
3 “California Transportation By The Numbers: Meeting the State’s Need for Safe and Efficient Mobility,” TRIP, September 2 014. 4 APWA Reporter
4 | P a g e

unincorporated roads. In FY 15/16 due to the volatility of the Gas Tax Swap the County is expected to receive $11 Million. Local funds Sonoma County roads benefit from a number of locally derived funds. These include funds from Measure M, mitigation fees for developments, and contributions from the County’s General Fund. Measure M - These funds were approved by Sonoma County voters in 2004 to pay for a specified list of projects. The funds derive from a ¼-cent local sales tax, with the majority to be used for capacity improvements on Highway 101, but inclusive of other transportation projects including 20% distributed to local agencies for local road rehabilitation projects. On average, the County has received about $1.8 Million annually in Local Street Rehabilitation funds, which are used for corrective maintenance. Mitigation Fees - These funds are assessed on a mitigation area for projects to reduce traffic congestion in that area. The funds are limited to the percentage of traffic impact coming from the mitigation area through the project site, and are generally used to provide a match for funds from other sources. These funds can only be used to support increase in road traffic capacity generated by a new development and to meet state and law requirements. Funds cannot be spent on road maintenance. The County, on average, receives about $1 Million a year in mitigation fees. Contributions from the County General Fund – In 2012 the Board reaffirmed its commitment to annually provide at least $4.4 Million in General Fund revenue for corrective maintenance, maintain investment of $2.2 Million in Franchise Fees (fees from the County’s waste hauler to compensate for the accelerated degradation of the roads resulting from the heavy vehicle use), and establish ongoing one-time General Fund allocation of $8 Million to pavement preservation for the implementation of the Long Term Roads Plan. In FY 14/15 the Board approved an additional ongoing allocation of $1.0 Million in General Fund dedicated to the “Worst First” to address significantly deteriorated segments of road. The Board also permanently reinstated one of the critical crews, Culvert Maintenance, which had been lost during the economic downturn in 2008, increasing the annual General Fund contribution associated with maintenance operations from $4.4 Million to $5.4 Million. Other FY 15/16 General Fund contributions include $375,000 in Aggregate Road Mitigation (ARM) fees used for pavement surface treatments on designated heavy truck haul routes, $147,988 for Dry Creek litter pick-up, $5.9 Million for Highway 12 improvements and $623,844 in administrative expenses. The total General Fund contribution to the County roads network for FY 15/16 is approximately $23.7 Million.
5 | P a g e
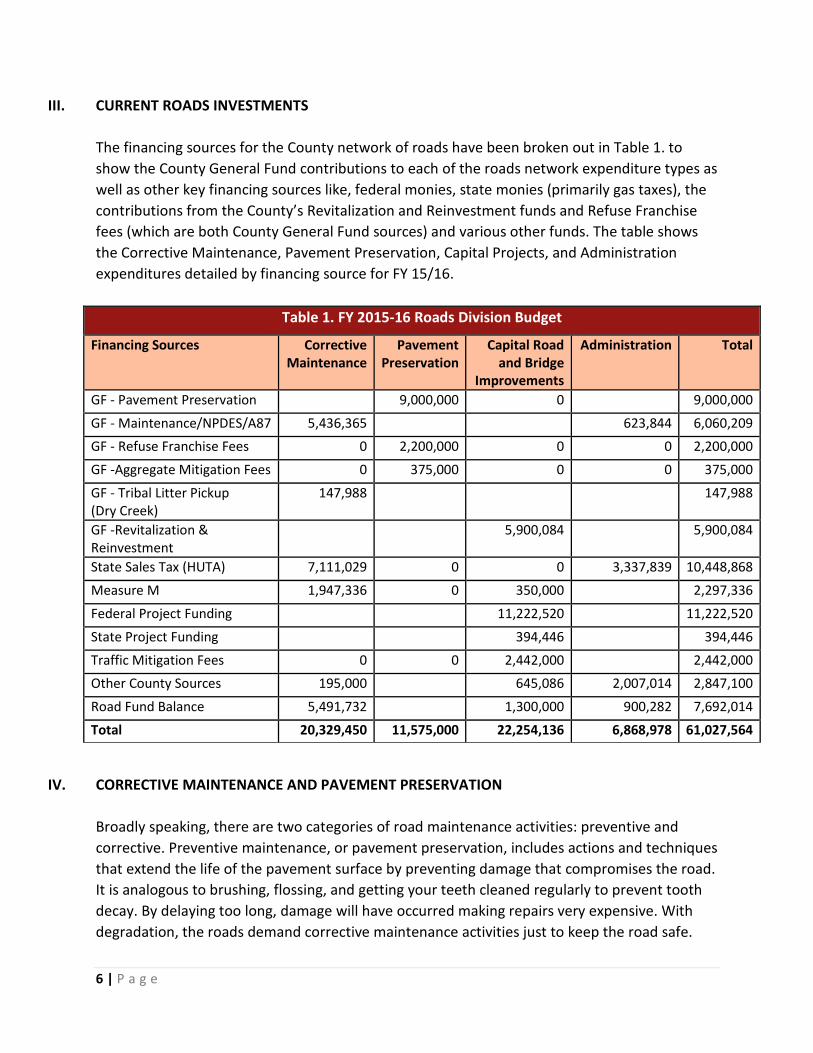
III. CURRENT ROADS INVESTMENTS The financing sources for the County network of roads have been broken out in Table 1. to show the County General Fund contributions to each of the roads network expenditure types as well as other key financing sources like, federal monies, state monies (primarily gas taxes), the contributions from the County’s Revitalization and Reinvestment funds and Refuse Franchise fees (which are both County General Fund sources) and various other funds. The table shows the Corrective Maintenance, Pavement Preservation, Capital Projects, and Administration expenditures detailed by financing source for FY 15/16.
Table 1. FY 2015-16 Roads Division Budget
Financing Sources Corrective Maintenance
Pavement Preservation
Capital Road and Bridge
Improvements
Administration Total
GF - Pavement Preservation 9,000,000 0 9,000,000
GF - Maintenance/NPDES/A87 5,436,365 623,844 6,060,209 GF - Refuse Franchise Fees 0 2,200,000 0 0 2,200,000
GF -Aggregate Mitigation Fees 0 375,000 0 0 375,000
GF - Tribal Litter Pickup (Dry Creek)
147,988 147,988
GF -Revitalization & Reinvestment
5,900,084 5,900,084
State Sales Tax (HUTA) 7,111,029 0 0 3,337,839 10,448,868
Measure M 1,947,336 0 350,000 2,297,336
Federal Project Funding 11,222,520 11,222,520
State Project Funding 394,446 394,446
Traffic Mitigation Fees 0 0 2,442,000 2,442,000 Other County Sources 195,000 645,086 2,007,014 2,847,100
Road Fund Balance 5,491,732 1,300,000 900,282 7,692,014
Total 20,329,450 11,575,000 22,254,136 6,868,978 61,027,564
IV. CORRECTIVE MAINTENANCE AND PAVEMENT PRESERVATION Broadly speaking, there are two categories of road maintenance activities: preventive and corrective. Preventive maintenance, or pavement preservation, includes actions and techniques that extend the life of the pavement surface by preventing damage that compromises the road. It is analogous to brushing, flossing, and getting your teeth cleaned regularly to prevent tooth decay. By delaying too long, damage will have occurred making repairs very expensive. With degradation, the roads demand corrective maintenance activities just to keep the road safe.
6 | P a g e

Corrective maintenance includes treatments that repair acute symptomatic damages and has a negligible effect on the extension of pavement life, but maintains the roads functionality. Preventive Maintenance: Pavement Preservation Good preventive maintenance prolongs the life of the road, as well as lowering the cost of maintaining it. This proactive approach is called “pavement preservation”. The Federal Highway Administration defines “pavement preservation” as “a program employing a network level, long-term strategy that enhances pavement performance by using an integrated, cost-effective set of practices that extend pavement life.”5 It involves careful planning and deployment of resources to make sure that the right technique is used on the right road at the right time. By applying lower cost and less disruptive techniques before significant damage occurs, pavement preservation maximizes limited resources. Perhaps more importantly, from the perspective of the motoring public, the ride quality remains at a high level and the intrusion of roadwork is minimal. There is a defined window of opportunity for using pavement preservation techniques. Pavement preservation is most effective on roads that have not sustained damage to the road base – that is, roads in “Good” condition or better. The pavement preservation program therefore depends on complete and reliable information about the condition of the roads such as the Streetsaver®, a pavement management program used by the County. It also depends on a plan that includes an established pavement condition index (PCI) threshold for implementing preventive maintenance activities. The County of Sonoma contributes about $17.2 Million per year in General Fund revenue sources to finance the County Road preventive and corrective maintenance. Pavement Preservation Program and Corrective Maintenance Program average allocations are shown in Table 1.
V. COUNTY ROAD NETWORK NEED
Over the last four budget periods the Board of Supervisors has allocated an unprecedented amount of General Fund revenue for pavement preservation and repair. As a result, in the summers of 2013 and 2014 a total 109 miles of roads were resurfaced. The Board then adopted a goal to try to reach 850 miles total over 10 years and adopted a two-year program for the summers of 2015 and 2016 with a plan to re-surface another approximately 89 miles. Currently there are about 650 miles to go. The first almost 200 miles programmed for repair have cost approximately $51 Million or on the average $255,000 per mile. All pavement
5FHWA Pavement Preservation Expert Task Group, http://www.fhw.dot.gov/pavement/preservation/091205.cfm
7 | P a g e

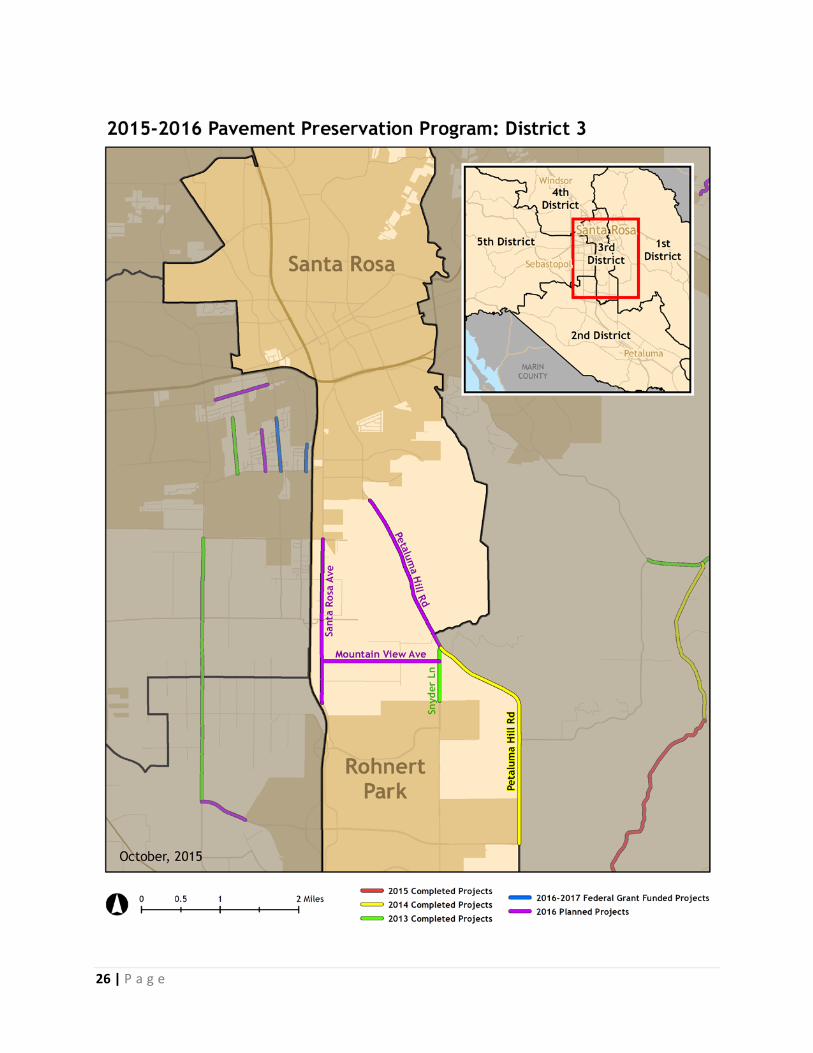
preservation projects completed or programed in 2013-2016 are shown in maps by supervisorial district in the Appendix A.
It is important to note that there are various road re-surfacing and repair treatments that are used which are selected for each road individually based upon its condition, its usage, and its original construction. In addition, the cost per mile also depends on the width of the road which can vary from 20 to 40 ft. and whether there are utilities, sidewalks, signal loops and pavement markings that must also be addressed as part of the project. In the latest years there have been generally low oil prices and a good bidding climate. This could change rapidly and effect the purchasing power of our dollars as well.
In 2012, prior to when the Board started allocating significant new revenues for roads, the network Pavement Condition Index (PCI) was 43, a condition that is considered “Poor”. Further, the Streetsaver Model® showed that Sonoma County would need to invest $47.7 Million dollars per year for the next 20 years for the network PCI to improve to an overall “Good” rating. In County’s latest year of inspections the network PCI is now 50. While this is contrary to what one might expect given the County’s continued under investment, this is consistent with what staff predicted would occur solely as a result of more frequent inspection intervals. That combined with the fact that the County has had several years of drought which slows down the normal degradation, and the positive impact on the PCI due to the County’s significant investments. All that being said, continued under-investment and significant storm activity in the coming winter could quickly reverse the trend.
Investment of Additional One Time Dollars
Understanding that the projects completed over the last several years have resulted in an average cost of $255,000 per mile, the County may achieve roughly up to 45 miles of resurfacing a year with the annual $11.57 Million investment. Continuing to use the average figure for every additional $1.0 Million investment the County may achieve an additional 3.9 miles. Again keeping in mind that that the number of actual miles achieved depends on the roads selected and all of the factors previously discussed above.
Should the Board identify additional one-time dollars by the Fall of 2015 for this fiscal year the earliest that the funding would result in construction would be the summer of 2017. The ideal timeline would be to identify the roads in early calendar year 2016 at the same time as the Board’s 16/17 annual contribution is programmed with a goal to construct in the summer of 2017.
8 | P a g e
VI. OVERVIEW OF IDENTIFIED FUNDING STRATEGIES TO AUGMENT THE BOARD’S COMMITMENT
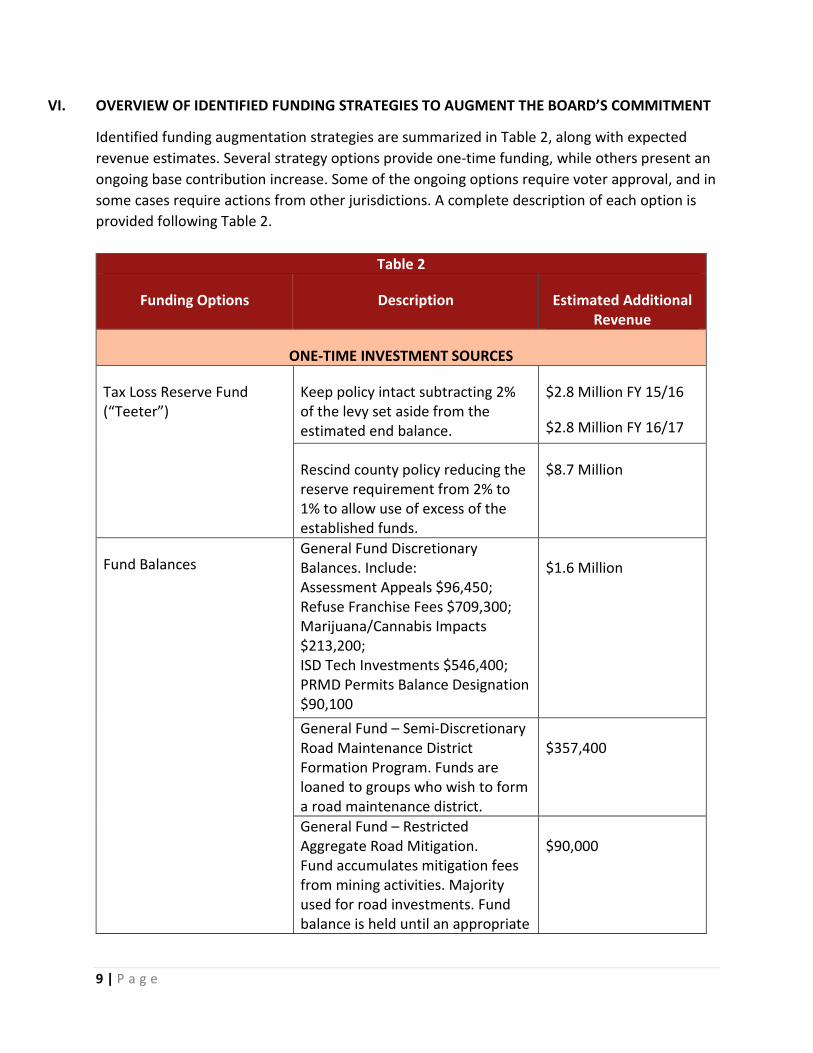
Identified funding augmentation strategies are summarized in Table 2, along with expected revenue estimates. Several strategy options provide one-time funding, while others present an ongoing base contribution increase. Some of the ongoing options require voter approval, and in some cases require actions from other jurisdictions. A complete description of each option is provided following Table 2.
Table 2
Funding Options Description Estimated Additional Revenue
ONE-TIME INVESTMENT SOURCES
Tax Loss Reserve Fund (“Teeter”)
Keep policy intact subtracting 2% of the levy set aside from the estimated end balance.
$2.8 Million FY 15/16
$2.8 Million FY 16/17
Rescind county policy reducing the reserve requirement from 2% to 1% to allow use of excess of the established funds.
$8.7 Million
Fund Balances General Fund Discretionary Balances. Include: Assessment Appeals $96,450; Refuse Franchise Fees $709,300; Marijuana/Cannabis Impacts $213,200; ISD Tech Investments $546,400; PRMD Permits Balance Designation $90,100
$1.6 Million
General Fund – Semi-Discretionary Road Maintenance District Formation Program. Funds are loaned to groups who wish to form a road maintenance district.
$357,400
General Fund – Restricted Aggregate Road Mitigation. Fund accumulates mitigation fees from mining activities. Majority used for road investments. Fund balance is held until an appropriate
$90,000
9 | P a g e
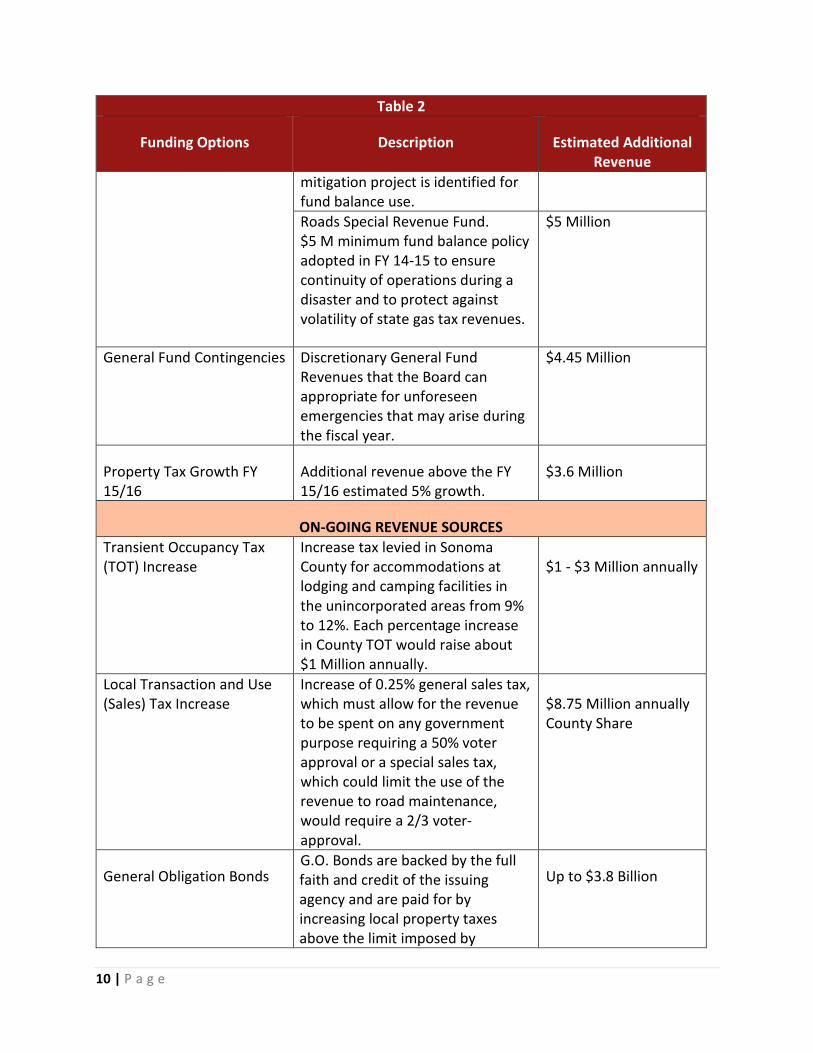
Table 2
Funding Options Description Estimated Additional Revenue
mitigation project is identified for fund balance use. Roads Special Revenue Fund. $5 M minimum fund balance policy adopted in FY 14-15 to ensure continuity of operations during a disaster and to protect against volatility of state gas tax revenues.
$5 Million
General Fund Contingencies Discretionary General Fund Revenues that the Board can appropriate for unforeseen emergencies that may arise during the fiscal year.
$4.45 Million
Property Tax Growth FY 15/16
Additional revenue above the FY 15/16 estimated 5% growth.
$3.6 Million
ON-GOING REVENUE SOURCES Transient Occupancy Tax (TOT) Increase
Increase tax levied in Sonoma County for accommodations at lodging and camping facilities in the unincorporated areas from 9% to 12%. Each percentage increase in County TOT would raise about $1 Million annually.
$1 - $3 Million annually
Local Transaction and Use (Sales) Tax Increase
Increase of 0.25% general sales tax, which must allow for the revenue to be spent on any government purpose requiring a 50% voter approval or a special sales tax, which could limit the use of the revenue to road maintenance, would require a 2/3 voter-approval.
$8.75 Million annually County Share
General Obligation Bonds G.O. Bonds are backed by the full faith and credit of the issuing agency and are paid for by increasing local property taxes above the limit imposed by
Up to $3.8 Billion
10 | P a g e

Table 2
Funding Options Description Estimated Additional Revenue
Proposition 13. Must be approved by a 2/3 majority vote. The maximum G.O. debt limit is 5% of assessed valuation. Collaboration with cities required.
Extension of SCTA’s Measure M
Extend the existing ¼ cent sales tax for an additional 20 years and increase the percentage of the funds dedicated to local streets and roads maintenance and rehabilitation. Another option to consider is to extend the ¼ cent sales tax and add another to ¼ cent for a total of ½ cent. This would require collaboration of all the cities and the County working with SCTA.
$3.8 Million annually
Solid Waste Franchise Fees Provide monthly franchise fees to the County based upon a percentage of franchise haulers’ operations gross revenue to offset expenses for: management of the franchise agreement staff costs, maintenance of closed landfills, road repair costs related to the impact of garbage trucks on County roads, and similar programs as determined by the Board. Augmentation of this revenue would depend on an increase in solid waste collection amount.
$2.2 Million annually
$709,300 One-Time FY 15/16 Fund Balance (Included in available $1.6M GF Discretionary Fund Balance)
Aggregate Road Mitigation Funds
All mining operations are subject to a road mitigation fee proportional to the annual truck traffic road impacts generated by the operation, currently 10 cents/ton. Funds will be used for improvements and maintenance
$375,000 current annual average
11 | P a g e

Table 2
Funding Options Description Estimated Additional Revenue
on aggregate haul routes and related planning and administration by the Department of Transportation and Public Works. Augmentation of this revenue would depend on increase in mitigation fees.
$90,000 One-Time FY 15/16 Fund Balance
Utility Users Tax Establish County Code to tax consumers of gas, electric, telephone, water and cable TV in the unincorporated area. Requires a voter approval of 50% for general tax or 2/3 for special sales tax.
$3.4 Million annually 2012 Estimate
Excise (Gas) Tax Increase Impose an additional local excise tax on motor fuel in increments of $0.01. Requires the majority of the city councils with a majority of the population in the incorporated county to approve the proposition to be put before the voters. Requires approval of 2/3 of the voters.
$4.5 Million annually (based on $.10/gallon)
Vehicle License Fees Establish a cities/counties Vehicle License fee of $10/year/vehicle, with the approval of 2/3 of the voters.
$5 Million annually
INDEX INCREASE Property Tax Growth
Up to 2% of the property tax growth change used in the Recommended budget. Based on the estimated assessed property value growth consistent with Prop 13.
$180,000
Consumer Price Index 2.33% average annual increase based on 2010-2014 Bureau of Labor Statistics Bay Area CPI percent change
$209,700
12 | P a g e

Table 2
Funding Options Description Estimated Additional Revenue
Producer Price Index (Other Non-Residential Construction)
3.19% average annual increase based on 2010-2015 Bureau of Labor Statistics PPI percent change
$287,100
Paving Asphalt Price Index 15% average annual increase based on 2010-2014 CA Statewide Paving Asphalt Price Index
$1.35 Million
One-Time Investment Sources
A) General Fund Tax Loss Reserve Fund (“Teeter”); Additional Revenue: $5.36 Million or $8.7 Million These funds are generated when payments are made to reimburse the County for advancing 100% of tax revenues each year to schools, cities, special districts, and other taxing agencies. The County then retains all future delinquent tax payments including related penalties and interest. State law requires the County to retain penalty and interest monies from these delinquent collections equal to at least 1% of the tax levy in order to protect for uncollectible delinquencies. Since adoption of the enabling legislation in 1993 the County has very conservatively budgeted an annual amount of revenue from this source to offset program costs and allowed the remainder to accumulate in the Tax Loss Reserve above the 1% tax levy requirement. In 2008, the Board recognized the increase of activity in this fund and directed that staff develop a policy for its potential use. The subsequent policy increased the set aside to 2% of the tax levy for additional protection against failure to collect against delinquent properties. This further safeguards the County from assuming the collection risk with the cash flow necessary to cover losses especially during economic downturns which would result in the need for substantial advances from the fund to cover tax rolls to taxing agencies. Current Board adopted policy with respect to these funds reads: “The Tax Loss Reserve Fund (TLRF) shall maintain as a restricted reserve an amount equal to 2% of the levy. The County Administrator in conjunction with the Auditor-Controller-Treasurer-Tax Collector may recommend the use of funds in excess of the established reserve to the Board of Supervisors for the purpose of balancing the budget.” Subtracting 2% of the levy set aside from the anticipated fund balance at the end of FY 15/16 and FY 16/17 is estimated at $2.8 Million available each year. Adjusting the FY 15/16 estimated end balance to support Sonoma County Transit Program initiatives would provide the Board with $2.56 Million in FY 15/16, and $2.8 Million in FY 16/17 for a total of $5.36 Million available to use for roads improvements. Alternatively, the Board may decide to amend
13 | P a g e
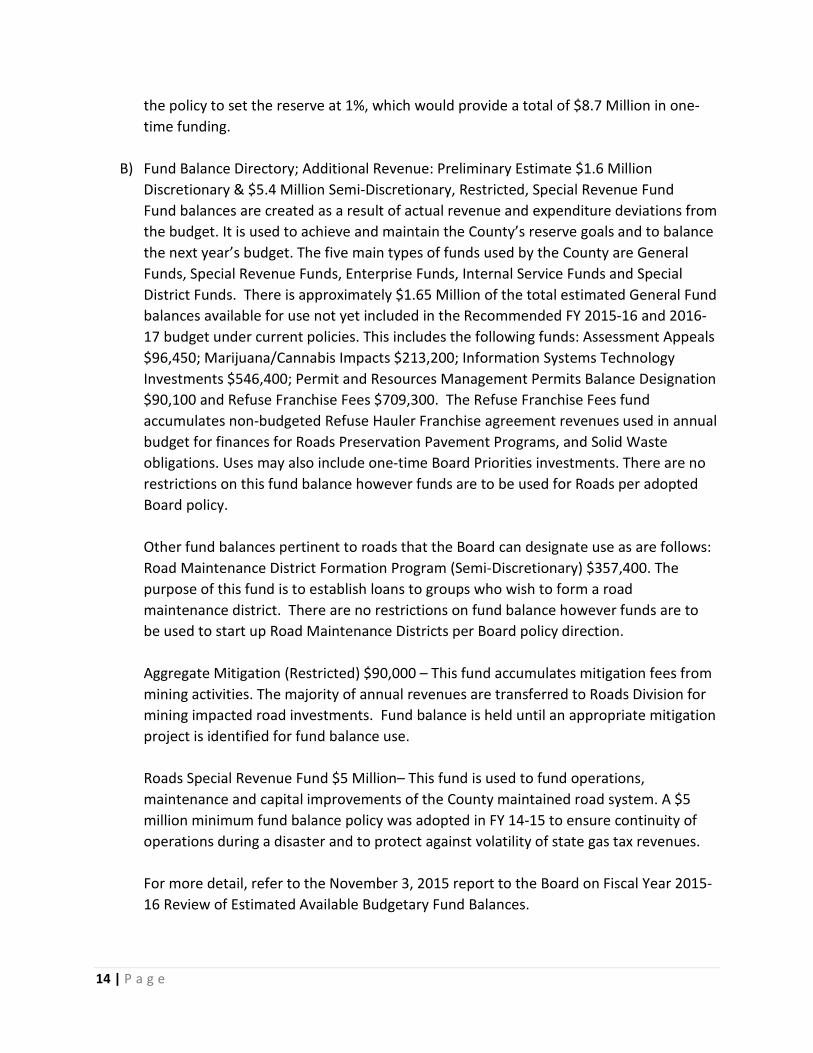
the policy to set the reserve at 1%, which would provide a total of $8.7 Million in one-time funding.
B) Fund Balance Directory; Additional Revenue: Preliminary Estimate $1.6 Million Discretionary & $5.4 Million Semi-Discretionary, Restricted, Special Revenue Fund Fund balances are created as a result of actual revenue and expenditure deviations from the budget. It is used to achieve and maintain the County’s reserve goals and to balance the next year’s budget. The five main types of funds used by the County are General Funds, Special Revenue Funds, Enterprise Funds, Internal Service Funds and Special District Funds. There is approximately $1.65 Million of the total estimated General Fund balances available for use not yet included in the Recommended FY 2015-16 and 2016-17 budget under current policies. This includes the following funds: Assessment Appeals $96,450; Marijuana/Cannabis Impacts $213,200; Information Systems Technology Investments $546,400; Permit and Resources Management Permits Balance Designation $90,100 and Refuse Franchise Fees $709,300. The Refuse Franchise Fees fund accumulates non-budgeted Refuse Hauler Franchise agreement revenues used in annual budget for finances for Roads Preservation Pavement Programs, and Solid Waste obligations. Uses may also include one-time Board Priorities investments. There are no restrictions on this fund balance however funds are to be used for Roads per adopted Board policy. Other fund balances pertinent to roads that the Board can designate use as are follows: Road Maintenance District Formation Program (Semi-Discretionary) $357,400. The purpose of this fund is to establish loans to groups who wish to form a road maintenance district. There are no restrictions on fund balance however funds are to be used to start up Road Maintenance Districts per Board policy direction. Aggregate Mitigation (Restricted) $90,000 – This fund accumulates mitigation fees from mining activities. The majority of annual revenues are transferred to Roads Division for mining impacted road investments. Fund balance is held until an appropriate mitigation project is identified for fund balance use. Roads Special Revenue Fund $5 Million– This fund is used to fund operations, maintenance and capital improvements of the County maintained road system. A $5 million minimum fund balance policy was adopted in FY 14-15 to ensure continuity of operations during a disaster and to protect against volatility of state gas tax revenues. For more detail, refer to the November 3, 2015 report to the Board on Fiscal Year 2015-16 Review of Estimated Available Budgetary Fund Balances.
14 | P a g e

C) General Fund Contingencies; Additional Revenue: $4.45 Million This fund serves as discretionary General Fund Revenues that the Board can appropriate for unforeseen emergencies that may arise during the fiscal year. The FY 2015-16 adopted budget allocated $4.7 Million in General Fund Contingencies. As of this report, $25,584 has been approved for sponsorships and fee waivers, $102,500 for Sonoma County Youth Ecology Corps and Drought/Fire Mitigation Pilot costs, $70,391 for Veterans Memorial Buildings, and $50,162 to finance staff support for the Human Services Department Veterans Services Office. The current estimated available balance is $4,451,362 which could be used as one-time funding for roads.
D) Property Tax; Additional Revenue above FY 15/16 estimated 5% growth: $3.6 Million For the development of the Recommended FY 15/16 Budget, staff conservatively estimated a 3% property value growth and subsequent to that the estimate was improved to 5% based on most recent Assessor’s Office completed work. The 2015-2016 value of all locally assessed taxable property in Sonoma County resulted in an increase in the roll of 6.90% above the prior year’s local assessment roll. This will result in the collection of approximately $3.6 Million in additional property taxes over the 5% estimate. Barring any other unanticipated revenue shortfalls, the additional tax revenue will contribute to the fiscal year ending available fund balance. Property tax is by nature an ongoing source of revenue, however the base growth of $3.6 Million is only available as one-time funds because in subsequent years it is needed to meet future County expenditure growth.
On-Going Revenue Sources
A) Transient Occupancy Tax (TOT) Increase; Additional Revenue per 1% increase: $1 Million per year. The TOT (Hotel, Motel, Campground or Bed Tax) is authorized under State Revenue and Taxation Code Section 7280, as an additional source of non-property tax revenue to local government. This tax is levied in Sonoma County at a rate of 9% for accommodations at lodging and camping facilities in the unincorporated areas of the County. The County’s TOT is a general tax and as such the use of the funds is discretionary, in that the Board of Supervisors may direct use of these funds for any legitimate county expense. Other jurisdictions such as Napa County, City of Healdsburg and the City of Rohnert Park have established a TOT of 12%. Each percentage increase in County TOT would raise about $1 Million annually. A three percent increase would provide about $3 Million annually. If the increased TOT revenues were to be specifically dedicated to roads, then the increment would be considered a special tax requiring a 2/3 voter approval.
15 | P a g e

B) Local Transaction and Use (Sales) Tax Increase; Additional Revenue: $20 Million per year. Sales taxes are imposed on the retail sale or the use of tangible personal property in this state. The State maximum allowable combined local sales tax imposed in a County can be no greater than 2%. The highest current combined sales tax rate in any Sonoma County jurisdiction is 1.75% which allows for an additional 0.25% increase within the County which includes each of the jurisdictions therein. Any increase of more than 0.25% will require legislative approval to increase the cap on Sales Tax rates. A general sales tax, which must allow for the revenue to be spent on any government purpose, would require a 50% voter-approval, whereas a special sales tax, which could limit the use of the revenue to road maintenance, would require a 2/3 voter-approval. A Sales Tax increase of 0.25% would generate $20 Million total revenue annually countywide. A special tax could include in its expenditure plan that the revenue is to be split amongst the County and the incorporated cities using an allocation formula using 50% population and 50% road miles (as is used by SCTA for the local roads formula).The County’s share under this formula would be $8.75 Million. A general tax could not state that the revenue is to be shared among the County and the cities, nor could it use the SCTA’s allocation formula. An advisory measure placed on the same ballot as the general tax could request that the voters express their desire for the revenue to be shared with the cities using SCTA’s formula.
C) General Obligation Bonds; Additional Revenue: Up to $3.8 Billion General Obligation Bonds, also called G.O. bonds, are commonly used to finance schools, libraries, jails and other large capital projects. Bond proceeds cannot be used for equipment purchases or to pay for operations and maintenance. The useful life of the improvements funded by the bonds need to be at least as long as the payments for the bond. Based on this, bond funding would be most appropriate for road rehabilitation projects such as full-depth reclamation, full reconstruction or deep lift overlays constituting a new road with 15-20 years life. G.O. bonds are backed by the full faith and credit of the issuing agency and are paid for by increasing local property taxes above the limit imposed by Proposition 13 (Under Prop. 13 property tax increases on property is limited to no more than 2% per year as long as the property is not sold). Because G.O Bonds involve an increase in property taxes, they require voter approval. The agency issuing a G.O. bond is authorized to levy an ad valorem property tax at the rate necessary to repay the principal and interest of the bonds. Counties have a maximum G.O. debt limit of 5% of assessed valuation. All general obligation bonds must be approved by a 2/3 majority vote. Issuance of G.O bonds would require collaboration with the cities.
16 | P a g e
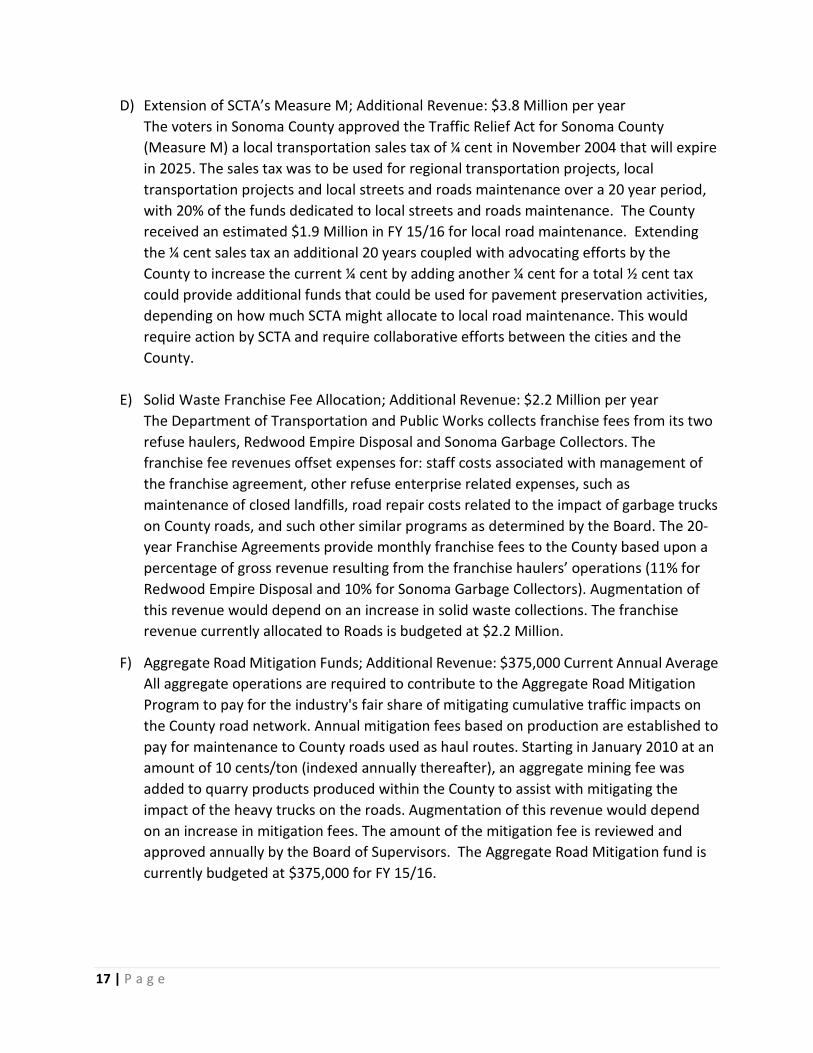
D) Extension of SCTA’s Measure M; Additional Revenue: $3.8 Million per year The voters in Sonoma County approved the Traffic Relief Act for Sonoma County (Measure M) a local transportation sales tax of ¼ cent in November 2004 that will expire in 2025. The sales tax was to be used for regional transportation projects, local transportation projects and local streets and roads maintenance over a 20 year period, with 20% of the funds dedicated to local streets and roads maintenance. The County received an estimated $1.9 Million in FY 15/16 for local road maintenance. Extending the ¼ cent sales tax an additional 20 years coupled with advocating efforts by the County to increase the current ¼ cent by adding another ¼ cent for a total ½ cent tax could provide additional funds that could be used for pavement preservation activities, depending on how much SCTA might allocate to local road maintenance. This would require action by SCTA and require collaborative efforts between the cities and the County.
E) Solid Waste Franchise Fee Allocation; Additional Revenue: $2.2 Million per year The Department of Transportation and Public Works collects franchise fees from its two refuse haulers, Redwood Empire Disposal and Sonoma Garbage Collectors. The franchise fee revenues offset expenses for: staff costs associated with management of the franchise agreement, other refuse enterprise related expenses, such as maintenance of closed landfills, road repair costs related to the impact of garbage trucks on County roads, and such other similar programs as determined by the Board. The 20-year Franchise Agreements provide monthly franchise fees to the County based upon a percentage of gross revenue resulting from the franchise haulers’ operations (11% for Redwood Empire Disposal and 10% for Sonoma Garbage Collectors). Augmentation of this revenue would depend on an increase in solid waste collections. The franchise revenue currently allocated to Roads is budgeted at $2.2 Million.
F) Aggregate Road Mitigation Funds; Additional Revenue: $375,000 Current Annual Average All aggregate operations are required to contribute to the Aggregate Road Mitigation Program to pay for the industry's fair share of mitigating cumulative traffic impacts on the County road network. Annual mitigation fees based on production are established to pay for maintenance to County roads used as haul routes. Starting in January 2010 at an amount of 10 cents/ton (indexed annually thereafter), an aggregate mining fee was added to quarry products produced within the County to assist with mitigating the impact of the heavy trucks on the roads. Augmentation of this revenue would depend on an increase in mitigation fees. The amount of the mitigation fee is reviewed and approved annually by the Board of Supervisors. The Aggregate Road Mitigation fund is currently budgeted at $375,000 for FY 15/16.
17 | P a g e

G) Utility Users Tax (UUT); Additional Revenue: $3.4 Million per year. A UUT is a tax that can be levied on the consumption of utility services including gas, electric, telephone, water and cable TV. The tax is levied by the County on the consumer and collected by the utility as part of its regular billing procedure and then remitted to the County. The UUT can be in the form of a General Tax, requiring a 50% voter-approval or a specific tax dedicating the funds specifically to roads which requires 2/3’s voter approval. A UUT has been enacted in many cities throughout California but has only been enacted within three counties – Alameda, Los Angeles and Sacramento. Assuming a 6.5% UUT, (this percentage is based upon the amount used by other government entities in the Bay Area) the annual revenue raised would be $3.4 Million annually. This tax would only be applicable to residents of the unincorporated areas of the county.
H) Excise (Gas) Tax Increase; Additional Revenue: $0.10/gallon would generate $4.5 Million
per year. An excise tax is a tax for each gallon of gas sold within the jurisdiction. Currently, the Federal excise tax is 18.4 cents/gallon of gasoline and 24.4 cents/gallon of diesel. The State excise tax is 30 cents/gallon of gasoline or diesel. California Law allows Counties to impose an excise tax on motor fuel in increments of $0.01 per gallon, provided that the majority of the city councils with a majority of the population in the incorporated county also approve the proposition to be put before the voters and approve a written agreement with the County with respect to the allocation of the revenues and provided that the tax is approved by the voters by a 2/3’s vote. The statute allowing for a countywide gas tax is virtually unknown, and we have found no county that has attempted to impose such a tax. Further research is required to confirm that there are not statutory obstacles to a county’s authority to impose a gas tax. The Metropolitan Transportation Commission (MTC) also has the authority to enact an excise tax of up to $0.10/gallon. If MTC were to request voter approval for an excise tax, each of the 9 counties in the region could opt out of the election.
I) Vehicle License Fees; Additional revenue: $5 Million per year.
Counties have the authority to increase the Vehicle License fee by $10/year/vehicle, with the approval of 2/3 of the voters. In 2010, SCTA placed a VLF measure on the ballot (60% transit, 23% road infrastructure, and 12% Safe Routes to School), and the measure only received 42% of the vote. After that time, the threshold was increased to 2/3 approval. Estimated annual revenue would be $5 Million. This revenue source would be stable, but not increase with the cost of maintaining roads.
18 | P a g e
Index Increase
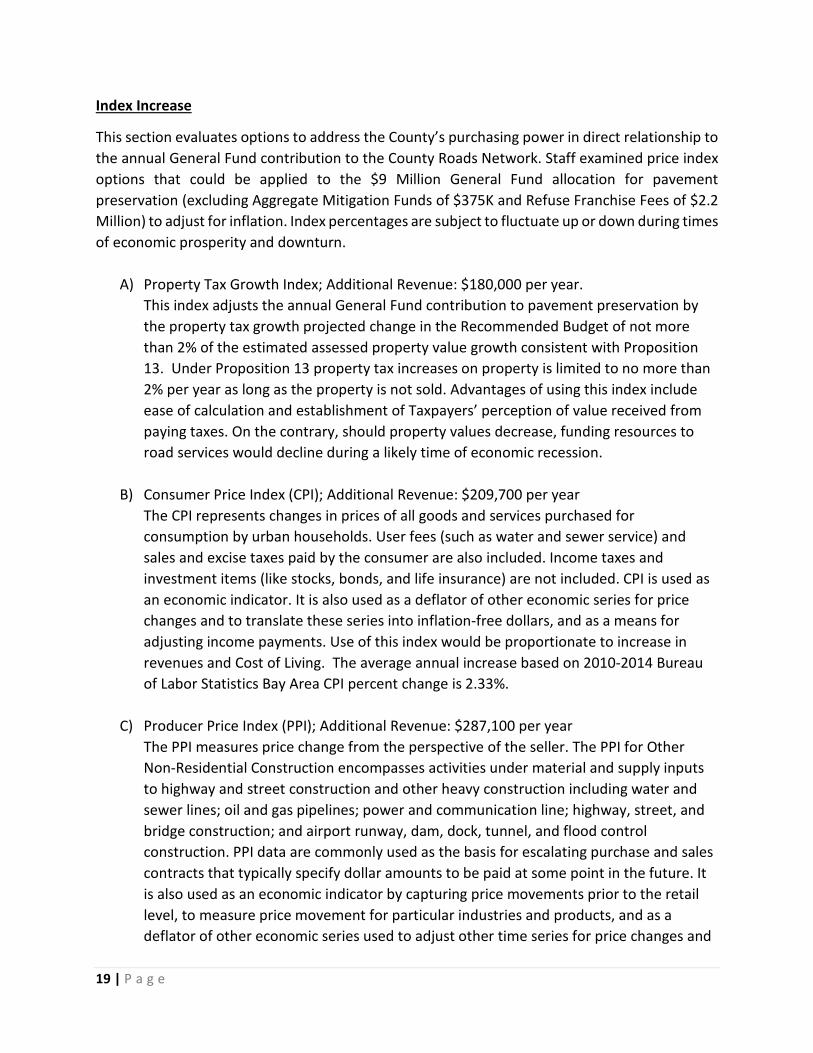
This section evaluates options to address the County’s purchasing power in direct relationship to the annual General Fund contribution to the County Roads Network. Staff examined price index options that could be applied to the $9 Million General Fund allocation for pavement preservation (excluding Aggregate Mitigation Funds of $375K and Refuse Franchise Fees of $2.2 Million) to adjust for inflation. Index percentages are subject to fluctuate up or down during times of economic prosperity and downturn.
A) Property Tax Growth Index; Additional Revenue: $180,000 per year. This index adjusts the annual General Fund contribution to pavement preservation by the property tax growth projected change in the Recommended Budget of not more than 2% of the estimated assessed property value growth consistent with Proposition 13. Under Proposition 13 property tax increases on property is limited to no more than 2% per year as long as the property is not sold. Advantages of using this index include ease of calculation and establishment of Taxpayers’ perception of value received from paying taxes. On the contrary, should property values decrease, funding resources to road services would decline during a likely time of economic recession.
B) Consumer Price Index (CPI); Additional Revenue: $209,700 per year The CPI represents changes in prices of all goods and services purchased for consumption by urban households. User fees (such as water and sewer service) and sales and excise taxes paid by the consumer are also included. Income taxes and investment items (like stocks, bonds, and life insurance) are not included. CPI is used as an economic indicator. It is also used as a deflator of other economic series for price changes and to translate these series into inflation-free dollars, and as a means for adjusting income payments. Use of this index would be proportionate to increase in revenues and Cost of Living. The average annual increase based on 2010-2014 Bureau of Labor Statistics Bay Area CPI percent change is 2.33%.
C) Producer Price Index (PPI); Additional Revenue: $287,100 per year The PPI measures price change from the perspective of the seller. The PPI for Other Non-Residential Construction encompasses activities under material and supply inputs to highway and street construction and other heavy construction including water and sewer lines; oil and gas pipelines; power and communication line; highway, street, and bridge construction; and airport runway, dam, dock, tunnel, and flood control construction. PPI data are commonly used as the basis for escalating purchase and sales contracts that typically specify dollar amounts to be paid at some point in the future. It is also used as an economic indicator by capturing price movements prior to the retail level, to measure price movement for particular industries and products, and as a deflator of other economic series used to adjust other time series for price changes and
19 | P a g e
to translate those series into inflation-free dollars. Although this index has a direct relationship to materials highway, street, and bridge construction costs, it is not based on actual revenue patterns. The average annual increase based on 2010-2015 Bureau of Labor Statistics PPI percent change is 3.19%.
D) Paving Asphalt Price Index; Additional Revenue: $1.35 Million per year This index is used for adjustments to compensation for paving asphalt in accordance with the provisions of the Caltrans Special Provisions section, "Compensation Adjustments for Price Index Fluctuations.” This specification allows increase or decrease payments to contractors for various contract items that contain paving asphalt when paving asphalt price fluctuation exceeds a threshold. The California Statewide Paving Asphalt Price Index is determined each month by the California Department of Transportation using the median of posted crude oil prices in effect on the first business day of the month as posted by Chevron, Exxon Mobil and Union 76 for the Buena Vista, Huntington Beach. Because the Paving Asphalt Price index is not based on revenues, volatility of this index could be problematic. The average annual increase based on 2010-2014 California Statewide Paving Asphalt Price Index is 15%.
VII. FEDERAL AND STATE LEGISLATION FUNDING POSSIBILITIES Funding for road maintenance and pavement preservation come from State and Federal sources, this section will discuss the current status of State and Federal Legislation that could increase funding for roads in the future.
Federal Legislation
The primary source of Federal Funds for roads comes from the Federal Highway Trust Fund. The guidance to how it is distributed and programmed for projects comes from the Federal Surface Transportation Act, the latest iteration of which is titled Moving Ahead for Progress in the 21st Century (MAP-21). MAP-21 was signed into law in 2012 and defined the Federal Transportation Program for Federal FY 2013 and FY 2014. At this time there has been no longer term Federal Surface Transportation re-authorization bill passed by Congress. The current extension of MAP-21 keeps the Highway trust Fund solvent through November 20, 2015.
Proposals to increase the amount of the Federal Excise Tax on gas and diesel have not gained traction in Congress therefore current lobbying efforts are primarily focused on retaining dedicated funding for bridges, streamlining federal project delivery processes, and lobbying for California Environmental Quality Act (CEQA) for National Environmental Policy Act (NEPA) reciprocity.
State Legislation
While the most recent State Budget did not increase revenue for transportation, the Governor did recognize the extreme need to increase funding for transportation, and as such appointed a
20 | P a g e

Special Session Transportation and Infrastructure Development Committee to work on legislation. The Special Session Committee met several times and there were numerous versions of proposed bills that would have resulted in significant increases to transportation revenue that included a variety of methods of raising revenues including, increased gas and diesel excise taxes, vehicle license and registration fees, cap and trade revenues, and user fees on non-fossil fuel vehicles. In September 2015 the Governor laid out a framework to increase transportation funding by $3.6 billion. Despite all the efforts the State Senate and the Assembly did not come to agreement before the end of the regular session, however, the special session was held open to continue their work into 2016. Sonoma County has taken every opportunity to contact our legislative delegation to lobby for increased revenue. The Board of Supervisors adopted a resolution in support of the proposals being discussed in special session and have joined the Fix Our Roads Coalition, to continue to support this effort.
On October 16, 2015 Governor Brown released the Transportation Funding Plan. This proposal is a combination of new revenue and reform with measurable targets for improvements including regular reporting, streamlined projects with exemptions for infrastructure repairs and flexibility on hiring for new workload. It will provide an estimated $36 Billion over the next decade or $3.6 Billion per year in new funding for transportation, with an emphasis on repairing and maintaining existing transportation infrastructure and a commitment to repay an additional $879 Million in outstanding loans. These investment are funded from a new road improvement charge of $65 per vehicle, stabilization of the gasoline excise tax, increase of diesel excise tax, greenhouse gas reduction fund and Caltrans Reforms. Sonoma County’s annual allocation is estimated to increase by $8.9 Million over 10 years.
Update on Road User Charge
SB 1077 requires California to study the concept of a road user charge as an alternative to the gas tax and to implement a Pilot Program by January 1, 2017. A Technical Advisory Committee (TAC), Chaired by California Transportation Commission (CTC) Commissioner, James Madaffer, was formed and is currently meeting monthly to gather public input and formulate recommendations on the design of the Pilot Program to be provided to the California State Transportation Agency (CalSTA) by December 2015. Members of the TAC include several County Supervisors, City Council members, as well as Senator Jim Beall and Assemblyman David Chiu, and other key stakeholders. The goals of the TAC are to: 1) study road charge alternatives to the gas tax, and use in the USA and around the world, 2) gather public comment on issues and concerns related to the potential pilot program, and 3) recommend to CalSTA a design of the pilot program to test alternative road charge approaches and a set of criteria to evaluate the pilot program.
The TAC is also supported by input from a Road Charge Workgroup which serves as a resource to the TAC to inform the pilot program design process. The Workgroup includes members of state and local government, vehicle and electric vehicle users and manufacturers, taxpayers,
21 | P a g e

and labor and industry representatives, to name a few. Susan Klassen, Sonoma County Transportation and Public Works Director, is the state Local Agency Representative.
The potential impact of conversion to a road user charge, as a method to collect revenues for transportation is still a question. What is known is that the current method of collection of transportation revenues which is based upon the number of gallons sold is not sustainable. Despite the fact that the number of vehicle miles traveled on California roads continues to rise, the number of gallons of fuel sold continues to drop due to increased use of hybrid and electric vehicles and new higher MPG standard fuel vehicles. Therefore the intent of looking at a Road User Charge is to develop a sustainable funding source for transportation maintenance and infrastructure. However, the Road User Charge Pilot program is not at this time addressing the need to increase revenue. Rather the goal of the pilot program is to test the various potential alternatives to per gallon gas tax with an initial goal to achieve revenue neutrality. Neutrality in this case means, to achieve only the total amount of revenue currently collected no more no less, and to achieve fair and equitable distribution of the charge between vehicle types, industry types, rural versus urban residents, income types, etc.
The Pilot Program is to be completed by January, 2017, at that time the results will be provided to CalSTA and the State Legislature for further consideration for full implementation. In summary, the Road User Charge will likely have little impact on increasing transportation revenues within the 5-year horizon.
VIII. RECOMMENDATION
A well maintained road network is vital to economic development. In particular, investment in road infrastructure promotes a healthy economy by creating well-paying construction and engineering jobs, promoting and supporting tourism and recreation, and providing measures of support for agriculture and the environment. The poor condition of the Sonoma County road network is decades in the making, and is a function of several critical factors. Among these are declining State and Federal transportation revenues, State funding allocation formulas that disadvantage rural and suburban counties, the recent great recession, and less than adequate local investment in road infrastructure. In fiscal years 12-13 through 15-16 the Board of Supervisors dedicated the highest level of funding for County roads infrastructure in recent history. This investment produced a greater amount of road improvements over the course of three years than had been accomplished in the prior three decades.
To reach the Board’s commitment towards the $40 Million annual investment needed to improve the County’s Road Network over the next 10 years, of which $20 Million will be dedicated for pavement preservation and $20 Million for corrective maintenance activities, staff recommends that the Board authorize use of one-time funds of Tax Loss Reserve Fund
22 | P a g e

reserves above the 2% of the levy set aside of $2.56 Million in FY 15/16 and a commitment of $2.8 Million in FY 16/17 for a total of $5.36 Million. Additionally, direct the County Administrator to annually review and recommend indexing the annual pavement preservation General Fund base contribution, after considering economic uncertainties, of $9 million by up to 2% based on financial revenue factors such as the annual projected property tax growth rate and the average annual Consumer Price Index. Staff will return to the Board in early 2016 to program funds for the FY 16/17 Pavement Preservation Program for construction in the summer of 2017.
23 | P a g e

IX. Appendix A: Sonoma County Pavement Preservation Program Maps by Supervisorial District
24 | P a g e

25 | P a g e
26 | P a g e

27 | P a g e

28 | P a g e