Embed Size (px)
Citation preview

i
2015
Reporting Experience
Including Trends (2007-2015)
Physician Quality Reporting System
2017

ii
Table of Contents I. EXECUTIVE SUMMARY ..................................................................................................................................... VIII
BUILDING ON EXISTING QUALITY PROGRAMS ....................................................................................... VIII
PARTICIPATION .............................................................................................................................. XIII
SATISFACTORY REPORTING AND CHALLENGES TO REPORTING .................................................................. XVI
2017 PQRS PAYMENT ADJUSTMENT ...............................................................................................XVIII
II. INTRODUCTION ................................................................................................................................................. 1
III. BACKGROUND AND METHODS ......................................................................................................................... 3
A. PROGRAM ORIGINS ...................................................................................................................... 3
B. PROGRAM EVOLUTION .................................................................................................................. 3
PQRS Measures ..................................................................................................................................................... 4
Participation Options and Mechanisms ................................................................................................................ 7
Satisfactory Reporting and PQRS Payment Adjustments ...................................................................................... 9
C. PQRS PAYMENT ADJUSTMENT ..................................................................................................... 13
D. DATA AND METHODS .................................................................................................................. 15
Data .................................................................................................................................................................... 15
Unit of Analysis ................................................................................................................................................... 15
IV. PARTICIPATION............................................................................................................................................... 17
A. HOW TO PARTICIPATE ................................................................................................................. 17
B. OVERALL PARTICIPATION RESULTS ................................................................................................. 19
Eligibility .............................................................................................................................................................. 19
Participation ........................................................................................................................................................ 20
C. USE OF MEASURES GROUPS AND REGISTRIES ................................................................................... 24
D. CHALLENGES TO PARTICIPATION AND SATISFACTORY REPORTING ......................................................... 25
E. PARTICIPATION BY SPECIALTY ........................................................................................................ 27
F. PARTICIPATION BY BENEFICIARY VOLUME AND SPECIALTY ................................................................... 32
G. GEOGRAPHIC VARIATION IN PARTICIPATION .................................................................................... 32

iii
H. PARTICIPATION BY MEASURE ........................................................................................................ 33
V. PQRS PAYMENT ADJUSTMENT ........................................................................................................................ 38
VI. CLINICAL PERFORMANCE RATES ..................................................................................................................... 51
VII. PQRS FEEDBACK REPORTS ............................................................................................................................. 68
A. BACKGROUND ............................................................................................................................ 68
B. ACCESSING PQRS FEEDBACK REPORTS ........................................................................................... 68
VIII. HELP DESK .................................................................................................................................................... 69
A. BACKGROUND ............................................................................................................................ 69
B. SUPPORT DESKS ......................................................................................................................... 69
IX. CONCLUSION .................................................................................................................................................. 72

iv
Table of Figures FIGURE 1 –TRENDS IN PARTICIPATION (2007 TO 2015) ............................................................................................ XIV
FIGURE 2 – PARTICIPATING ELIGIBLE PROFESSIONALS BY REPORTING MECHANISM (2011 TO 2015) ...................... XV
FIGURE 3 – DISTRIBUTION OF SATISFACTORILY REPORTED INDIVIDUAL MEASURES (2015) .................................... XVI
FIGURE 4 – TRENDS IN PQRS PARTICIPATION AND THE PQRS PAYMENT ADJUSTMENT (2011 TO 2015) ................. XIX
FIGURE 5 – NUMBER OF PQRS MEASURES BY REPORTING MECHANISM/OPTION (2009 TO 2015) ............................. 5
FIGURE 6 – GROUP PRACTICE REPORTING OPTIONS (2010 - 2015) .............................................................................. 8
FIGURE 7 – SUMMARY OF INDIVIDUAL MEASURES REPORTED THROUGH PQRS CLAIMS MECHANISM (2015) ......... 26
FIGURE 8 – GEOGRAPHIC DISTRIBUTION OF ELIGIBLE PROFESSIONALS PARTICIPATING IN PQRS (2015) ................... 33

v
Listing of Tables TABLE 1: REPORTING OPTIONS, MECHANISMS, AND ALTERNATIVE PROGRAMS (2007 TO 2015) .............................. IX
TABLE 2: NUMBER OF QUALITY MEASURES (2012 TO 2015)........................................................................................ XI
TABLE 3: REPORTING RESULTS BY MECHANISM OR ALTERNATIVE PROGRAM (2015)............................................. XVII
TABLE 4: SUMMARY OF PQRS PAYMENT ADJUSTMENT (2015 TO 2018) ...................................................................... 9
TABLE 5: REGISTRIES THAT SUBMITTED DATA ON BEHALF OF THE MOST PARTICIPANTS (2015) .............................. 24
TABLE 6: TOP SPECIALTIES PARTICIPATING VIA CLAIMS (2015) .................................................................................. 27
TABLE 7: TOP SPECIALTIES PARTICIPATING VIA REGISTRY (2015) ............................................................................... 28
TABLE 8: TOP SPECIALTIES PARTICIPATING VIA EHR (2015) ........................................................................................ 29
TABLE 9: TOP SPECIALTIES PARTICIPATING VIA QCDR (2015) ..................................................................................... 29
TABLE 10 : TOP SPECIALTIES PARTICIPATING VIA GPRO AND SHARED SAVINGS PROGRAM ACO (2015) ................... 30
TABLE 11: TOP SPECIALTIES VIA A PIONEER ACO OR THE CPC INITIATIVE (2015) ....................................................... 31
TABLE 12: TOP MEASURES REPORTABLE BY THE LARGEST NUMBER OF ELIGIBLE PROFESSIONALS (2015) ............... 34
TABLE 13: TOP MEASURES REPORTED BY THE LARGEST NUMBERS OF ELIGIBLE PROFESSIONALS (2015) ................. 35
TABLE 14: TOP REPORTED INDIVIDUAL MEASURES BY SPECIALTY (2015) .................................................................. 36
TABLE 15: 2015, 2016 AND 2017 PQRS PAYMENT ADJUSTMENT BY ELIGIBLE PROFESSIONAL CHARACTERISTICS .... 39
TABLE 16: 2015, 2016, AND 2017 PQRS PAYMENT ADJUSTMENT, BY SPECIALTY ....................................................... 43
TABLE 17: ELIGIBLE PROFESSIONALS AVOIDING THE 2017 PQRS PAYMENT ADJUSTMENT ........................................ 47
TABLE 18: HOW ELIGIBLE PROFESSIONALS AVOIDED THE 2015, 2016 AND 2017 PQRS PAYMENT ADJUSTMENTS, IN TOTAL AND BY HIERARCHY ................................................................................................................................. 48
TABLE 19: INDIVIDUAL MEASURES REPORTED WITH THE LARGEST PERCENTAGE POINT DECREASE IN CLINICAL PERFORMANCE RATE (2012 TO 2015) ................................................................................................................ 52
TABLE 20: INDIVIDUAL MEASURES REPORTED WITH THE LARGEST INCREASE IN CLINICAL PERFORMANCE RATE (2012 TO 2015) ................................................................................................................................................... 54
TABLE 21: INDIVIDUAL MEASURES REPORTED WITH THE HIGHEST MEAN CLINICAL PERFORMANCE RATES (2015) . 55
TABLE 22: INDIVIDUAL MEASURES WHERE AT LEAST 90 PERCENT OF SUBMITTING EPS HAD AT LEAST A 90 PERCENT PERFORMANCE RATE ON THE MEASURE (2015) ................................................................................................ 57
TABLE 23: ABBREVIATIONS .......................................................................................................................................... 73

vi
List of Appendix Tables (Excel File)
Table Name Tab Name
Table A1: Individual PQRS Measure Numbers and Descriptions (2015) Table A1
Table A2: Individual non-PQRS Measure Numbers and Descriptions (2015) Table A2
Table A3: Participation and Incentive Eligibility by Reporting Mechanism/Option or Alternative Program (2015)
Table A3
Table A4: Participation and Incentive Eligibility by Eligible Professional Characteristics (2015)
Table A4
Table A5: Trends in Eligible Professionals by Specialty (2011 to 2015) Table A5
Table A6: Trends in Participation by Reporting Mechanism/Option or Alternative Program (2012 to 2015)
Table A6
Table A7: Trends in Participation by Specialty (2012 to 2015) Table A7
Table A8: Trends in Participation via Claims by Specialty (2012 to 2015) Table A8
Table A9: Trends in Participation via Registry Individual Measures by Specialty (2012 to 2015)
Table A9
Table A10: Trends in Participation via Registry Measures Groups by Specialty (2012 to 2015)
Table A10
Table A11: Trends in Participation via EHR by Specialty (2012 to 2015) Table A11
Table A12: Trends in Participation via QCDR by Specialty (2014 to 2015) Table A12
Table A13: Participation by Specialty and Number of Beneficiaries (2015) Table A13
Table A14: Participation by State (2015) Table A14
Table A15: Claims Measures Submitted (2015) Table A15
Table A16: Trends in Eligibility and Reporting Rate by Individual Measures (2012 to 2015)
Table A16
Table A17: Successfully Submitted Measures and Domains, Individual Participants (2015)
Table A17
Table A18: Successfully Submitted Measures and Domains, GPRO Participants (2015) Table A18

vii
Table Name Tab Name
Table A19: Trends in Instances Reported and Performance Rate by Individual Measures (2012 to 2015)
Table A19
Table A20: Individual Measure Reporting Consistency Across Program Years (2012 to 2015)
Table A20
Table A21: Trends in Individual Measure Performance Rate, for Eligible Professionals who Submitted the Measure Continuously from 2012 to 2015
Table A21
Table A22: Trends in Individual Measure Performance Rate, for Eligible Professionals who Submitted the Measure Continuously from 2013 to 2015
Table A22
Table A23: Trends in Individual Measure Performance Rate, for Eligible Professionals who Submitted the Measure Continuously from 2014 to 2015
Table A23
Table A24: Submitting EPs with at least a 90% Performance Rate by Individual Measure (2015)
Table A24
Table A25: Measure Information for Group Practices Reporting via Registry (2015) Table A25
Table A26: Measure Information for Group Practices Reporting via QRDA I and QRDA III (2015)
Table A26
Table A27: Measure Information for Group Practices and ACOs Reporting via Web Interface (2015)
Table A27
Table A28: CAHPS Survey Results (2015) Table A28
Table A29: History of Available Reporting Mechanisms for each Measure by Program Year (2007–2015)
Table A29
2015 Physician Quality Reporting System Reporting Experience and Trends
viii
I. EXECUTIVE SUMMARY In 2007, the Centers for Medicare & Medicaid Services (CMS) implemented the Physician Quality Reporting System (PQRS), a quality reporting program for eligible professionals (EPs)1 that has grown substantially from its inception. PQRS gives participating EPs and group practices the opportunity to assess the quality of care they provide to their patients, helping to ensure that patients get the right care at the right time. The PQRS program entered its ninth year in 2015. In the first eight years of the program, PQRS encouraged eligible professionals to report clinical quality data by providing a payment incentive for successful reporting.
The payment adjustment applied to 2015 payments was based on 2013 data that was reported during the first quarter of CY2014. PQRS reporting for the 2014 program year forms the basis for the 2016 payment adjustment and PQRS reporting for 2015 forms the basis for the 2017 payment adjustment.
This report summarizes the historical reporting experience of eligible professionals in the PQRS program through program year 2015. Unless otherwise noted, all tables and figures are based on data reported for calendar year 2015. Findings in this report summarized at the practice level include both eligible professionals participating individually, as well as group practices that participated through the GPRO. Results for group reporting for PQRS also include eligible professionals participating as part of a Medicare ACO under the Shared Savings Program. Eligible professionals participating in PQRS as part of a Pioneer ACO Model and the Comprehensive Primary Care (CPC) initiative are summarized as individual participants in this report.2 For brevity, the tables and figures in this report present the Shared Savings Program and Pioneer Model ACO programs and CPC as “participation options” under PQRS; however, they are alternative programs and eligible professionals must meet all requirements under those programs. In addition, unless otherwise noted, participation information from eligible professionals who were part of group practices participating under the GPRO or as part of a Medicare ACO participating under the Shared Savings Program were combined with data for individual participants to describe the total number of eligible professionals that participated in the program.
Building on Existing Quality Programs
The Medicare Access and CHIP Reauthorization Act of 2015 (MACRA) streamlined three existing CMS programs with a single system where Medicare physicians and other eligible clinicians have a chance to be rewarded for better care. MACRA consolidated aspects of those programs into the Merit-based Incentive Payment System (MIPS) and incentive payments for participation in Advanced Alternative
1 https://www.cms.gov/Medicare/Quality-Initiatives-Patient-Assessment-Instruments/PQRS/Downloads/2015_PQRS_List_of_Eligible_Professionals.pdf
2 Eligible professionals within ACOs that meet specific PQRS requirements, as incorporated by the Shared Savings Program or Pioneer ACO Model, are eligible to receive PQRS incentive payments and avoid the PQRS paymentadjustment under the Medicare Shared Savings Program or the Pioneer ACO Model, respectively. Eligible professionals in the CPC initiative that elect a PQRS waiver and meet requirements under that program are eligible to receive PQRS incentive payments and avoid the PQRS payment adjustment.

2015 Physician Quality Reporting System Reporting Experience and Trends
ix
Payment Models (Advanced APMs), which we refer to collectively as the Quality Payment Program. This program, which is expected to affect Medicare payments for more than 600,000 clinicians across the country, is a major step in improving care across the entire health care delivery system. Clinicians may choose how they want to participate in the Quality Payment Program based on their practice size, specialty, location, or patient population. At its core, the Quality Payment Program, is about improving the quality of patient care and patient outcomes.
The PQRS program, along with the Medicare EHR Incentive Program for EPs and the value modifier program, sunset in 2018. Components of these programs are the foundation for the new Merit-based Incentive Payment System. There are four connected pillars on which payment adjustments will be based under MIPS – quality, clinical practice improvement activities (referred to as “improvement activities”), meaningful use of certified electronic health record technology (referred to as “advancing care information”), and resource use (referred to as “cost”).
The quality component of MIPS should look familiar to clinicians that participated in PQRS. CMS believes that given the flexibilities of the MIPS program, all clinicians, including those that received the downward payment adjustment under PQRS, can be successful in MIPS.
Please note, there are key differences between the PQRS program and MIPS which preclude drawing definitive conclusions for MIPS based upon historical PQRS data. Examples include program eligibility and quality measure requirements. Fewer clinicians will be eligible for MIPS than PQRS due to volume thresholds and the quality reporting requirements are significantly less burdensome and complex in MIPS compared to PQRS. Specifically, the PQRS program did not have an exemption for clinicians with a low volume of Medicare patients or allowed charges. CMS implemented this exemption based on analysis of the 2015 PQRS data applying the 2017 low volume threshold criteria (less than $30,000 in charges OR fewer than 100 Medicare beneficiaries in a year) to estimate what proportion of clinicians who participated in PQRS in 2015 would have fallen below the low volume threshold. Note that the charges used in PQRS are Physician Fee Schedule charges and not Part B charges used for MIPS/Quality Payment Program eligibility, so these estimates are not exact. Based on historical data, CMS found that the participation rate for practices falling below the low volume threshold “low volume” (< $30k charges OR <100 beneficiaries) would be approximately 60%. Based on historical data, the participation rate among practices falling above the low volume threshold (>= $30k charges AND >=100 beneficiaries) would be approximately 80%.
Table 1: Reporting Options, Mechanisms, and Alternative Programs (2007 to 2015)
Reporting Options and Mechanisms
2007 2008 2009 2010 2011 2012 2013 2014 2015
Individual Participation -- -- -- -- -- -- -- -- -- Claims-based: Individual
Measures Yes Yes Yes Yes Yes Yes Yes Yes Yes
Claims-based: Measures Groups
No Yes Yes Yes Yes Yes Yes No No
Registry: Individual Measures No Yes Yes Yes Yes Yes Yes Yes Yes Registry: Measures Groups No Yes Yes Yes Yes Yes Yes Yes Yes EHR: Individual Measures No No No Yes Yes Yes Yes Yes Yes

2015 Physician Quality Reporting System Reporting Experience and Trends
x
Reporting Options and Mechanisms
2007 2008 2009 2010 2011 2012 2013 2014 2015
Qualified Clinical Data Registry (QCDR)
No No No No No No No Yes Yes
GPRO -- -- -- -- -- -- -- -- -- GPRO I Web Interface No No No Yes Yes No No No No GPRO II Claims No No No No Yes No No No No GPRO II Registry No No No No Yes No No No No Small GPRO Web Interface No No No No No Yes No No No Small GPRO Registry No No No No No No Yes Yes Yes Small GPRO EHR No No No No No No No Yes Yes Medium GPRO Web Interface No No No No No No Yes Yes Yes Medium GPRO Registry No No No No No No Yes Yes Yes Medium GPRO EHR No No No No No No No Yes Yes Large GPRO Web Interface No No No No No Yes Yes Yes Yes Large GPRO Registry No No No No No No Yes Yes Yes Large GPRO EHR No No No No No No No Yes Yes
Accountable Care Organizations (ACO)
-- -- -- -- -- -- -- -- --
Shared Savings Program ACO via Web Interface
No No No No No Yes Yes Yes Yes
Pioneer ACO via GPRO Web Interface
No No No No No Yes Yes Yes Yes
Comprehensive Primary Care Initiative (CPC)
No No No No No No Yes Yes Yes
Notes: (1) In 2010, the Physician Quality Reporting System included a single option for group practices with 200 or more professionals (referred to as “GPRO I”). (2) In 2011, the GPRO II option was added for practices with 2 to 199 professionals. (3) In 2012, GPRO I and GPRO II were replaced with group practices reporting options for Large (100+ NPIs) and Small (25-99 NPIs) group practices. (4) In 2013, reporting options for Small (2-24 NPIs), Medium (25-99 NPIs), and Large (100+ NPIs) group practices became available; these options remained through 2015
• The number of PQRS quality measures from which eligible professionals could choose to participate in the PQRS decreased in program year 2015, but the number of non-PQRS measures more than doubled from 2014 (Table 2).

2015 Physician Quality Reporting System Reporting Experience and Trends
xi
Table 1: Number of Quality Measures (2012 to 2015)
Mechanism or Option 2012 2013 2014 2015 Total number of PQRS measures 266 258 284 253 Total number of non-PQRS measures N/A N/A 300 739 Number of measures groups [a] 22 22 25 22 Measures within measures groups [a] 117 119 127 108 Measures reportable via Claims 143 137 110 72 Measures reportable via Registry 208 203 201 175 Measures reportable via EHR 51 51 64 64 Measures reportable via QCDR [b] N/A N/A 584 992 Measures reportable via GPRO Web Interface 29 22 22 17 Measures reportable by ACOs via the GPRO Web Interface
22 22 22 17
Measures reportable via the CPC Initiative N/A 14 11 13
[a] Measures groups were available to report via Claims or Registry until 2013, and only via Registry starting 2014
[b] Any PQRS measure can be reported via QCDR. In addition, each QCDR registry could submit up to 20 custom, non-PQRS measures in 2014 and 30 non-PQRS measures in 2015
Note for table 2: Total number of measures reflects all measures, including all possible reporting mechanisms and options.
• Many of the measures reportable by the largest number of eligible professionals were preventive measures, which are not specific to a given diagnosis or condition and apply to a broad range of specialties (Table A16).
• CMS strives to include quality measures that are applicable to a wide range of specialties and annually requests suggestions for measures to be included in PQRS. Appendix Table A1 presents a list of PQRS measures in program year 2015. Of note, over 50% of these measures are related to effective clinical care.
• Nearly 1.36 million professionals were eligible to participate in the 2015 program year PQRS including those participating through the PQRS GPRO, those participating in Medicare ACOs under the Shared Savings Program or Pioneer ACO Model, and the CPC initiative—compared to 1.32 million eligible professionals in 2014 (Figure 1).
• Specialties with over 75,000 eligible professionals who participated in PQRS during program year 2015 included internal medicine, family practice, and nurse practitioner (Table A7).
• There were 4,089 practices (2,460 small, 1,040 medium, and 589 large) who self-nominated to participate via the GPRO in program year 2015, a significant increase from the 2,985 practices that self-nominated for the GPRO in 2014 and the 677 practices that self-nominated to report under the GPRO in 2013 (data not shown).

2015 Physician Quality Reporting System Reporting Experience and Trends
xii
• There were 397 Medicare ACOs that were eligible for PQRS under the Shared Savings Program, 13 Pioneer ACOs were eligible, and 199 practices were eligible through the CPC initiative (data not shown).

2015 Physician Quality Reporting System Reporting Experience and Trends
xiii
Participation
• Participation in PQRS has increased every year, especially among eligible professionals within practices participating via a group reporting option (Figure 2).
• The number of participating eligible professionals increased by 14 percent between 2014 and 2015 from 822,810 (62.2 percent of those eligible in 2014) to 938,939 (69.1 percent of those eligible in 2015).
• In 2015, 295,308 eligible professionals participated in PQRS as part of practices electing to participate under the GPRO (Table 3).
• Another 206,859 eligible professionals participated as part of a Medicare ACO participating under the Shared Savings Program.
• 18,755 eligible professionals participated as part of a practice under the Pioneer ACO model and 444 participated under the CPC initiative.
• The participation rate among all eligible professionals using any method to participate in PQRS increased from 15 percent to 69 percent between 2007 and 2015 (Figure 1).
• Of the 4,089 practices that self-nominated to participate under the PQRS GPRO, 3,418 participated:
• 1,900 practices encompassing 25,472 eligible professionals participated via Small GPRO (2-24 eligible professionals),
• 946 practices encompassing 56,211 eligible professionals participated via the Medium GPRO (25-99 eligible professionals),
• 572 practices encompassing 213,625 eligible professionals participated via the Large GPRO (100+ eligible professionals).
• There were 394 practices encompassing 206,859 eligible professionals that reported under the Shared Savings Program.
• There were 13 ACOs with 18,755 eligible professionals participating via the Pioneer ACO Model and out of 199 practices eligible to participate via the CPC initiative, 83 practices including 444 eligible professionals actually did participate (that is, the practices accepted the PQRS waiver).

2015 Physician Quality Reporting System Reporting Experience and Trends
xiv
Figure 1 –Trends in Participation (2007 to 2015)
688,329
964,196 1,006,833 1,042,595
1,101,773 1,201,362
1,253,599 1,322,529
15.1% 16.0% 20.9%
25.8% 29.1%
36.3%
51.2%
62.2% 69.1%
0.0%
10.0%
20.0%
30.0%
40.0%
50.0%
60.0%
70.0%
80.0%
90.0%
100.0%
-
200,000
400,000
600,000
800,000
Notes for Figure 1: (1) Results include all reporting mechanisms and options.
• The most common participation method in PQRS in program year 2015 continued to be reporting individual measures through claims(Figure 2).
o Registry reporting increased in program year 2015, particularly the use of registry measures groups; and the number of participants via the QCDR mechanism was over four times that of 2014 (15,381 eligible professionals, up from 3,274).
o EHR reporting also showed continued strong growth in 2015, with a 12% increase over 2014 participation.
1,000,000
1,200,000
1,400,000
1,600,000
2007 2008 2009 2010 2011 2012 2013 2014 2015
Eligible, but did not Participate Participating via Pioneer ACOParticipating via CPC Participating via Shared Savings Program ACOParticipating via GPRO Individual ParticipantsParticipation Rate
1,358,691

2015 Physician Quality Reporting System Reporting Experience and Trends
xv
Figure 2 – Participating Eligible Professionals by Reporting Mechanism (2011 to 2015)
18,755
206,859
295,308
444
15,381
56,761
38,694
72,275
-
330,863
24,144
139,921
261,156
453
3,274
50,656
31,806
57,427
-
286,289
21,678
85,059
131,859
508
-
23,194
16,423
51,473
8,632
329,102
49,856
40,085
44,056
-
-
19,817
10,478
36,473
4,776
248,206
-
-
40,193
-
-
560
12,894
50,215
4,472
229,282
0 50,000 100,000 150,000 200,000 250,000 300,000 350,000
PioneerACO
Shared Services Program ACO
GPRO
CPC
QCDR
EHR
RegistryMeasures
Groups
RegistryIndividualMeasures
ClaimsMeasures
Groups
ClaimsIndividualMeasures
2011
2012
2013
2014
2015
Note for Figure 2: Results include individually participating eligible professionals as well as eligible professionals in group practices that participated under the GPRO, eligible professionals in Medicare ACOs participating under the Shared Savings Program and Pioneer ACO Models, and eligible professionals participating through the CPC initiative. Some eligible professionals participated in more than one reporting mechanism.
• Some specialties participated in greater numbers and/or at higher rates in the 2015 programs than others (Appendix Table A7).
o Internal medicine, family practice, nurse practitioner, physician assistant, and emergency medicine had the largest numbers of overall participants.

2015 Physician Quality Reporting System Reporting Experience and Trends
xvi
• Pathology and radiology had the highest participation rates in 2015 (over 85 percent) (Appendix Table A7).
• The participation rate of EPs rises with increasing number of patients going from 48.7% for EPs with 25 or fewer patients to 83.5% for EPs with more than 200 patients (Table A13).
• The median participation rate by state was 69.5% in 2015, with Wisconsin having the highest participation rate of any state (82.3%)(Table A14).
Satisfactory Reporting and Challenges to Reporting
Figure 3 – Distribution of Satisfactorily Reported Individual Measures (2015)
20% 28%
22%
7%
19%
4% 0%
12% 11% 7%
31% 38%
0% 0% 0% 0% 3%
96%
0% 1% 1% 1%
11%
86%
0%
10%
20%
30%
40%
50%
60%
70%
80%
90%
100%
0 1 2 3 4 to 8 9+
Perc
ent o
f Elig
ible
Pro
fess
iona
ls
Who
Par
ticip
ated
Number of Individual Measures Satisfactorily Reported
Claims Registry EHR QCDR
• As in previous years, rates of satisfactory reporting of at least one measure in PQRS varied by participation method. For registry, EHR and QCDR, 100% of eligible professionals who participated were able to satisfactorily report at least one measure while only 80% of eligible professionals who participated through claims were able to do so (Figure 3).
• The number of satisfactorily reported measures varied by submission mechanism as well: eligible professionals reporting via EHR and QCDR were most likely to report 9 or more measures (96 percent of those using EHR and 86 percent for QCDR), compared to only 38 percent of those participating via registry and 4 percent of those reporting via claims (Figure3).
• The most common reporting errors via registry were submitting data for an eligible professional that had no Part B PFS allowed charges and submitting data for an eligible professional who was in a practice participating as part of an ACO or as part of a practice participating under the CPC Initiative.
• The most common issue for QCDR was submissions for EPs who did not have PFS charges, reporting denominator not equal to the initial population minus exclusions, and reporting rate not being equal to the reporting numerator divided by the reporting denominator; CMS has

2015 Physician Quality Reporting System Reporting Experience and Trends
xvii
reached out to entities reporting data under this mechanism to help improve future submissions.
Table 3 presents a summary of eligibility and participation, in the PQRS in 2015, at the level of eligible professional and group practices. There were 1,358,691 eligible professionals with 938,939 participating using any method. The most commonly used participation mechanism was through claims.
Table 2: Reporting Results by Mechanism or Alternative Program (2015)
Outcome and Mechanism or Alternative Program
Eligible Professionals
Eligible Practices
Eligible 1,358,691 262,875 Participated via Any Method 938,939 98,619 Participated via Claims 330,863 67,493 Participated via Registry 110,296 29,232 Participated via EHR 56,761 11,441 Participated via QCDR 15,381 1,268 Participated via Small GPRO 25,472 1,900 Participated via Medium GPRO 56,211 946 Participated via Large GPRO 213,625 572 Participated via Shared Savings Program ACO
206,859 394
Participated via Pioneer ACO 18,755 13 Participated via CPC 444 83
Notes for Table 3: (1) Results include eligible professionals who were part of a practice that participated under the PQRS GPRO, as part of a Medicare ACO participating under the Shared Savings Program or Pioneer ACO Model, or through the CPC initiative. (2) Some eligible professionals participated in more than one reporting method.

2015 Physician Quality Reporting System Reporting Experience and Trends
xviii
2017 PQRS Payment Adjustment
• Sixty-three percent of all eligible professionals avoided the reduction of 2.0 percent of their 2017 Part B PFS charges, based on 2015 PQRS reporting; this left 501,933 eligible professionals who were subject to the adjustment (Figure 4 and Table 16). Note that Table 16 is based on the eligible professionals who meet the definition of an eligible professional for the purposes of the payment adjustment (N=1,307,528).3
• Over seventy-eight percent of those subject to the adjustment did not attempt to participate in PQRS, and almost 21% of those subject to the payment adjustment were participating as individual professionals. Only 0.2 percent of those receiving the payment adjustment were unsuccessful participants, meaning their only attempt at participation involved the submission of invalid Quality Data Codes (QDCs). (Table 15).4
3 1,358,691 represents the number of EPs who had an eligible instance in claims or who participated through registry/QCDR/EHR/web-interface/ACO/CPC. When it comes to the payment adjustment, there are certain taxonomies that are automatically exempt. There are 51,163 such EPs who could never be subject for this reason so they are not part of the population of EPs who could be eligible. See https://www.cms.gov/Medicare/Quality-Initiatives-Patient-Assessment-Instruments/PQRS/Downloads/2015_PQRS_List_of_Eligible_Professionals.pdf and section III.C of this report for more information on the PQRS payment adjustment.
4 For more information on various types of QDC errors, please refer to the section on Challenges to Successful Reporting in Section IV.D of this report.

2015 Physician Quality Reporting System Reporting Experience and Trends
xix
Figure 4 – Trends in PQRS Participation and the PQRS Payment Adjustment (2011 to 2015)
320,422 435,878
642,114
822,810
938,939 457,351
553,914 501,933
29.1%
36.3%
51.2%
62.2%
69.1%
0.0%
10.0%
20.0%
30.0%
40.0%
50.0%
60.0%
70.0%
80.0%
0
100,000
200,000
300,000
400,000
500,000
600,000
700,000
800,000
900,000
1,000,000
2011 2012 2013 2014 2015 2015 2016 2017
Participation,by Program Year
Subject to thePayment Adjustment,
by Calendar Year
Part
icip
atio
n Ra
te
Num
ber o
f Elig
ible
Pro
fess
iona
ls
EP Count participation rate
Note for Figure 4: As shown in this chart, the participation counts and rates have increased every year; the number of EPs subject to the payment adjustment increased from 2015 to 2016 but has decreased for 2017. Table 18 provides more details on EPs who have avoided the payment adjustment as well as how they were able to do so.
• Eligible professionals who avoided the 2017 PQRS payment adjustment did so most often by reporting the required data (Table 18):
o For eligible professionals who were eligible for individual participation, 92 percent (N=563,680) avoided the payment adjustment due to satisfactory reporting; 97 percent (N=287,183) of those eligible for GPRO participation avoided the payment adjustment based on satisfactory reporting; nearly 100 percent of those eligible for ACO participation avoided the payment adjustment due to successful reporting, and 94 percent (N=1,919) of those eligible for CPC avoided the payment adjustment based on successful participation.

2015 Physician Quality Reporting System Reporting Experience and Trends
xx
o Some eligible professionals did not fit the specific definition of an eligible professional for the purposes of the payment adjustment; these individuals can submit measures data but they would not be subjected to the payment adjustment since they don’t have the autonomy to provide services without direct orders of another clinician; a couple of examples are recreational therapist assistant and prevention professional. These eligible professionals made up seven percent (N=43,256) of those who were eligible for individual participation, four percent of those who were eligible for GPRO participation (N=10,521), four percent (N=825) of those eligible for Pioneer ACO participation, three percent (N=6,340) of those eligible for Shared Savings Program ACO participation, and less than one percent (N=10) of those eligible for CPC participation.
o Finally, regardless of whether an eligible professional was eligible for individual, GPRO, ACO, or CPC participation, three percent of those avoiding the 2017 payment adjustment did so based on informal reviews processed through March 29, 2017.

2015 Physician Quality Reporting System Reporting Experience and Trends
1
II. INTRODUCTION In 2007, the Centers for Medicare & Medicaid Services (CMS) implemented the Physician Quality Reporting System (PQRS), a pay-for-reporting program for eligible professionals that has grown substantially from its inception.
5 The program (formerly, Physician Quality Reporting Initiative or PQRI) was authorized under Section 101(b) of division B of the Tax Relief and Health Care Act (TRHCA) of 2006 (Public Law 109-423; 120 Stat. 2975), and entered its ninth year in 2015. The program rewarded eligible professionals with a payment incentive—determined based on a percentage of the estimated Part B PFS allowed charges for covered professional services furnished by the eligible professional during the applicable reporting period—and applies a payment adjustment based on whether eligible professionals meet applicable requirements for reporting information on standardized clinical quality measures. The last year in which eligible professionals could earn an incentive payment was 2014. Beginning in 2015, eligible professionals who did not meet reporting requirements for program year 2013 or who did not have any other reason for avoiding the 2015 payment adjustment were subject to a 1.5 percent reduction in their Part B PFS charges. PQRS reporting in program year 2014 was used to determine which eligible professionals would be subject to a two percent reduction in their 2016 Part B PFS charges. PQRS reporting in program year 2015 was used to determine which eligible professionals would be subject to a two percent reduction in their 2017 Part B PFS charges.
This report summarizes the program year 2015 and historical reporting experience of eligible professionals in PQRS. Section III of this report presents background on the evolution of the PQRS program and payment adjustment and describes data and methods used for this report. Sections IV - VI detail findings for PQRS participation, payment adjustment, and clinical performance rates. Sections VII and VIII describe information about feedback reports available under PQRS and the services available from the Help Desk. Section IX concludes. At the end of the report is a table of abbreviations used in this report. The Appendix is a separate Microsoft Excel document for interested readers, which contains detailed tables of results.
This report uses the term “eligible professional” to describe physicians and other health care professionals who could participate in PQRS. The health care professionals who are eligible to participate in the program are precisely identified on the CMS website.6 In general, this includes professionals who furnish PFS covered services to Medicare Part B beneficiaries (including Railroad Retirement Board [RRB] and Medicare Secondary Payer [MSP]) for whom selected PQRS measure(s) are applicable.
5 http://www.cms.gov/Medicare/Quality-Initiatives-Patient-Assessment-Instruments/PQRS
6 https://www.cms.gov/Medicare/Quality-Initiatives-Patient-Assessment-Instruments/PQRS/Downloads/2015_PQRS_List_of_Eligible_Professionals.pdf

2015 Physician Quality Reporting System Reporting Experience and Trends
2
The unit of analysis for describing eligible professionals is a combination of a professional’s National Provider Identifier (NPI) number and the Taxpayer Identification Number (TIN) under which they billed for services; this is commonly referred to as a “TIN/NPI” (please see Section III for more details). Findings reported at the practice level include both eligible professionals participating individually, summarized at the practice level, as well as practices that participated through the group practice reporting option (GPRO). The results include eligible professionals reporting (for the purposes of PQRS) through a Medicare Accountable Care Organization (ACO) under the Shared Savings Program, eligible professionals reporting through a Medicare ACO participating in the Pioneer ACO Model, and eligible professionals participating in the Comprehensive Primary Care (CPC) Initiative. For brevity, the tables and figures in this report present the Shared Savings Program and Pioneer model ACO programs and CPC as “participation options” under PQRS; however, we note that they are alternative programs and eligible professionals must meet all requirements under those programs. Eligible professionals participating via the Pioneer ACO Model or the CPC initiative are summarized in this report as individual participants. While reporting through the GPRO or through a Medicare ACO participating under the Shared Savings Program are not individual participation options, unless otherwise noted, the participation information from these options are combined with participation information from the individual participation options to describe the total number of individual eligible professionals that participated in the programs.
The information and data in this report generally address PQRS, but also include certain PQRS data related to eligible professionals within Medicare ACOs under the Shared Savings Program, Pioneer ACO Model, and the Comprehensive Primary Care (CPC) initiative, given that eligible professionals within ACOs must report through the ACO for the purposes of avoiding the payment adjustment and CPC participants avoid the payment adjustment through successful participation in that program. However, such eligible professionals participating in such initiatives outside the traditional PQRS are subject to the reporting, participation, and program requirements specific to that program. Unless otherwise indicated, the program requirements discussed below (e.g. reporting options, mechanisms, periods, criteria, measures, participation rules, etc.) pertain to PQRS.

2015 Physician Quality Reporting System Reporting Experience and Trends
3
III. BACKGROUND AND METHODS
A. Program Origins
The Physician Quality Reporting System is part of an overall effort to move toward a value-based purchasing (VBP) system that aims to reward the value of care provided, rather than the quantity of services. To this end, PQRS quality measures are intended to define, standardize and drive improvement in the quality of health care. A payment adjustment, applicable to professionals who do not satisfy the criteria for reporting quality data under PQRS, is intended to encourage professionals to adopt evidence- based, outcomes-driven healthcare delivery practices.
The authorizing legislation for the program is contained in Section 101(b) of Division B (Medicare Improvements and Extension Act of 2006 [MIEA]) of the TRHCA, which was enacted on December 20, 2006. Section 101(b) of the MIEA-TRHCA added subsection K to section 1848 of the Social Security Act and required the establishment of a quality reporting system. CMS initially referred to the Physician Quality Reporting System as the Physician Quality Reporting Initiative or PQRI.
Section 101(c) of MIEA-TRHCA established a financial incentive for professionals to participate in a voluntary quality reporting program, which has been amended by subsequent legislation. An eligible professional who chose to participate in the 2007 program and satisfied the reporting criteria on a set of quality measures was eligible for an incentive, subject to a cap, equal to 1.5 percent of the total estimated Part B PFS charges for covered professional services furnished by the eligible professional during the reporting period.
B. Program Evolution
Measures for the 2007 program were defined by the TRHCA as quality measures that were developed under the Physician Voluntary Reporting Program (PVRP) and published on the CMS website as of the date of enactment of the TRHCA. The statute also provided that measures could be changed by the Secretary through a consensus-based process if such changes were published on the CMS website by a specified date. A portion of the original 74 measures and their specifications were developed by the American Medical Association-Physician Consortium for Performance Improvement (AMA-PCPI), physician specialty organizations, and the National Committee for Quality Assurance (NCQA). The AMA- PCPI collaborated with CMS on defining reporting specifications for measures used in the 2007 program and developed instructions on how data would be captured through a claims-based reporting process using quality data codes (QDCs) based on either Current Procedural Terminology (CPT) II codes or G- codes. QDCs indicate performance of a quality action, non-performance of the action, or an exclusion from performing the action.
The Medicare, Medicaid, and SCHIP Extension Act of 2007 (MMSEA), enacted on December 29, 2007 (Pub. Law 110-173), extended the quality reporting system through 2008 and 2009. The MMSEA authorized incentive payments for 2008 and removed the cap on the total earned incentive amount previously mandated by TRHCA. Additionally, the MMSEA required that CMS establish alternative reporting periods, criteria for reporting groups of clinically-related measures, and collecting quality information through a clinical data registry. Registries do not require QDCs to accept clinical data. In 2008, MIPPA (Pub. Law 110-275, section 131(b)) made changes to the quality measure requirements as well as authorized incentives through 2010. In 2009 and 2010, the applicable quality percent for the incentive was set at two percent; it was decreased to one percent in the 2011 program year and to one- half percent for program years 2012 through 2014.
2015 Physician Quality Reporting System Reporting Experience and Trends
4
The Patient Protection and Affordable Care Act, Pub. Law 111-148, enacted on March 23, 2010, as amended by the Health Care and Education Reconciliation Act of 2010, Pub. Law 111-152, and collectively known as the Affordable Care Act, made a number of changes to the PQRS, including authorizing incentive payments through 2014 and requiring a payment adjustment (penalty), beginning in 2015, for eligible professionals and group practices who do not meet reporting requirements, described in more detail below.
The Affordable Care Act also authorized an additional incentive (an additional one-half percent of PFS allowed charges) for 2011 through 2014 for eligible professionals who satisfactorily report data on quality measures under PQRS and satisfy certain requirements related to participation in a Maintenance of Certification Program Incentive (MOCP). Finally, Section 601(b) of the American Taxpayer Relief Act of 2012 (Pub. Law 112-240, enacted January 2, 2013) included an amendment to Section 1848 (m)(3) of the Social Security Act which would expand quality reporting options to include qualified clinical data registries (QCDRs) for 2014 and subsequent years.
PQRS Measures
CMS strives to include quality measures that are applicable to a wide range of specialties and annually requests suggestions for measures to be included in PQRS. CMS has generally expanded the number of measures and reporting options and mechanisms for PQRS each year (Figure 5). For example, the total number of measures available was 153 in 2009, 179 in 2010, 198 in 2011, and 266 in 2012. The 2013 program has 258 total measures; 10 measures were added and 18 measures were retired. The 2014 program further expanded the number of measures to 284. In 2015, the total number of measures declined to 253. Appendix Table A1 lists all individual measures that could be reported in the program during the 2015 program year. In 2016, the total measures will increase again to 281.
As seen in Figure 5, the number of measures reportable via the EHR mechanism has expanded from ten measures in 2010 when the reporting mechanism was first introduced to 51 measures in 2013, and 64 in 2014 and 2015. The measures under the GPRO web interface grew modestly from 26 in 2010 and 2011 to 29 in 2012, were reduced to 22 measures in 2013 and 2014, and to 17 in 2015, to align with the ACO GPRO web interface measures.

2015 Physician Quality Reporting System Reporting Experience and Trends
5
Figure 5 – Number of PQRS Measures by Reporting Mechanism/Option (2009 to 2015)
153 179
198
266 258 284
253
44 76 78
117 119 127 108
10 20 51 51 64 64
26 26 29 22 22 17 22 22 22 17
300 739
0
50
100
150
200
250
300
350
400
2009 2010 2011 2012 2013 2014 2015
Num
ber o
f Mea
sure
s
Total PQRS Measures Measures in Measures Groups
EHR Measures GPRO Measures
ACO Measures non-PQRS measures
Notes for Figure 5: Categories are not mutually exclusive; for example, an individual measure can also be part of a measures group. GPRO counts for PQRS in 2011 do not include the GPRO II reporting option and GPRO counts in 2013- 2015 include web interface measures only. The number of measures also includes measures reported by EPs through Medicare ACOs participating in the Shared Savings Program and Pioneer ACO Model and measures reported by EPs through the CPC Initiative.
Measures groups were introduced to PQRS in the 2008 program year and expanded each year thereafter.7 For program years from 2008 through 2014, measures groups are a subset of four or more clinically-related measures; in 2015, measures groups contain six or more clinically-related measures. Measures groups were reportable by claims or registry when first introduced, and from 2014 on are reportable via registry only. The number of measures groups has increased steadily: four measures groups in 2008, seven in 2009, 13 in 2010, 14 in 2011, 22 in 2012 and 2013, and 25 groups in 2014, though was reduced to 22 in 2015. In 2016, the number of measures groups will increase again to 25. Some measures groups are made up of measures reportable only via measures groups as noted below; although, beginning in 2014, eligible professionals reporting via the QCDR mechanism could report these “measures groups only” measures as individual measures.
7 Measures groups do not apply to reporting by ACOs participating in the Shared Savings Program and Pioneer ACO Model or to the CPC Initiative.

2015 Physician Quality Reporting System Reporting Experience and Trends
6
CMS has also revised measure group reporting requirements over the years to simplify measure group reporting. Beginning in 2009, CMS introduced a new QDC that allowed eligible professionals reporting on measures groups via claims to use a single code to indicate if all recommended quality actions were performed for each measure in the group. That is, eligible professionals could report a single QDC— referred to as a composite G-code—for the entire measures group. Before this code existed, eligible professionals reported one QDC for each measure within the measures group. Moreover, in an effort to simplify measures group reporting, the 2009 program year requirement to report on consecutive patients was removed. That is, beginning in the 2010 program year, eligible professionals could report a measures group measure on 30 non-consecutive beneficiaries—appropriate for the measures group—during the reporting period. This change applied to reporting measures groups through both claims and a registry. The 2013 program lowered the required patient count from 30 to 20 patients. The 2014 program removed the claims-based measure group reporting option. The 2015 program deleted five measures groups (Back Pain, Cardiovascular Prevention, Hypertension, Ischemic Vascular Disease, and Perioperative Care) and added two (Acute Otitis Externa and General Surgery). The available measures groups in 2015 were:
• [New] Acute Otitis Externa (AOE) (eight measures)
• Asthma (six measures)
• Cataracts (eight measures)
• Chronic kidney disease (CKD) (six measures)
• Chronic obstructive pulmonary disease (COPD) (seven measures)
• Coronary artery bypass graft (CABG) surgery (seven measures)
• Coronary artery disease (CAD) (six measures)
• Dementia (ten measures)
• Diabetes mellitus (six measures)
• [New] General Surgery (seven measures)
• Heart failure (six measures)
• Hepatitis C (eight measures)
• HIV/AIDS (eight measures)
• Inflammatory bowel disease (IBD) (seven measures)
• Oncology (seven measures)
• Optimizing Patient Exposure to Ionizing Radiation (six measures) – measures group only
• Parkinson’s disease (seven measures)
• Preventive care (ten measures)
• Rheumatoid arthritis (eight measures)
• [New] Sinusitis (six measures)
• Sleep apnea (seven measures)
• Total Knee Replacement (six measures)

2015 Physician Quality Reporting System Reporting Experience and Trends
7
Participation Options and Mechanisms
In addition to expanding the available measures, CMS has continued to refine the avenues for participation in the PQRS, as shown in Table 1. Individual reporting via a qualified EHR vendor directly was added to the program in 2010. In 2012, CMS added an EHR data submission vendor reporting mechanism, under which eligible professionals could work with an approved data submission vendor to submit EHR data on their behalf, rather than directly submitting EHR data. In addition, a new qualified clinical data registry (QCDR) reporting method was available for individual participants in 2014.
8
Beginning in 2014, the claims-based measures group reporting mechanism was no longer available.
The group reporting option was introduced in 2010 for practices with 200 or more eligible professionals. GPRO reporting differs from reporting for individually participating eligible professionals. To participate through the GPRO, a group practice self-nominates with CMS.9 Among practices that met requirements and were approved to participate through the GPRO, CMS provided a web interface containing a pre- selected sample of patients with select patient demographic and utilization characteristics.
10 The practices were responsible for completing data fields to report specific quality actions for GPRO measures for the selected patients. The GPRO was expanded in 2011 to include “GPRO I” for practices with 200 or more eligible professionals and “GPRO II” for practices with 2 to 199 eligible professionals. In 2012, GPRO I and GPRO II were replaced with Small GPRO for practices with 25 to 99 eligible professionals and Large GPRO for practices with 100 or more eligible professionals. In 2013, the GPRO option was further refined to include: Small GPRO (2 to 24 eligible professionals), Medium GPRO (25 to 99 eligible professionals, and Large GPRO (100 or more eligible professionals); these groups have been maintained since the 2013 program year. Figure 6 provides a summary of GPRO options over time.
8 Eligible professionals submitting via the QCDR mechanism and using the QRDA III format could also be used to meet Medicare EHR Incentive Program requirements. See the CMS website for more information: https://www.cms.gov/Medicare/Quality-Initiatives-Patient-Assessment-Instruments/PQRS/Downloads/2015QCDRVendorCriteria.pdf
9 For more information see: https://www.cms.gov/Medicare/Quality-Initiatives-Patient-Assessment-Instruments/PQRS/Downloads/2015_PQRS_GPRO_QRG.pdf
10 In the 2011 program, GPRO I used the web interface for reporting; GPRO II practices used claims, registry, or EHR reporting. In both 2010 and 2012, group practices could report via one method, a database tool and an online web interface, respectively. In 2013, Small GPRO practices could only report via registry, while those participating in the Medium and Large GPRO could report via web interface or registry. In 2014, all sizes of GPRO practices could also report via EHR.

2015 Physician Quality Reporting System Reporting Experience and Trends
8
Figure 6 – Group Practice Reporting Options (2010 - 2015)
GROUP SIZE 2010 2011 2012 2013 - 2015
2-24 N/A
GPRO II
N/A SMALL GPRO
25-99 N/A SMALL GPRO
MEDIUM GPRO
100-199 N/A
LARGE GPRO
LARGE GPRO
200+ GPRO GPRO I
2015 Physician Quality Reporting System Reporting Experience and Trends
9
Satisfactory Reporting and PQRS Payment Adjustments
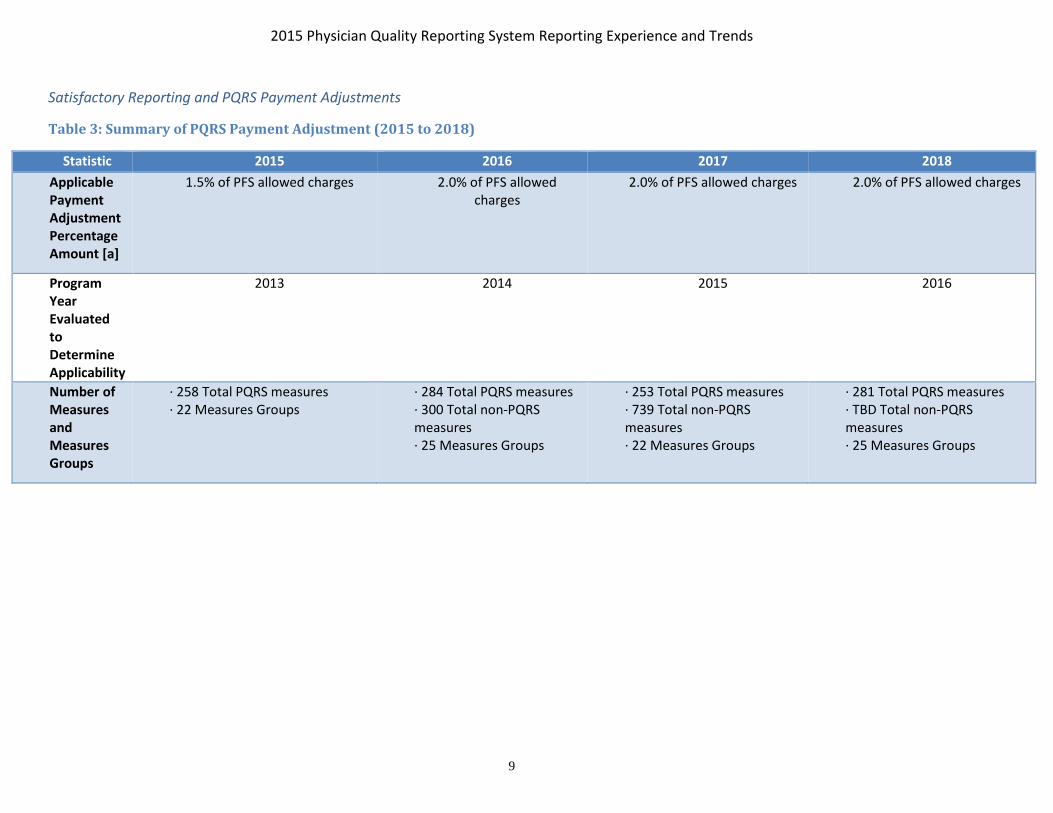
Table 3: Summary of PQRS Payment Adjustment (2015 to 2018)
Statistic 2015 2016 2017 2018 Applicable Payment Adjustment Percentage Amount [a]
1.5% of PFS allowed charges 2.0% of PFS allowed charges
2.0% of PFS allowed charges 2.0% of PFS allowed charges
Program Year Evaluated to Determine Applicability
2013 2014 2015 2016
Number of Measures and Measures Groups
· 258 Total PQRS measures · 22 Measures Groups
· 284 Total PQRS measures · 300 Total non-PQRS measures · 25 Measures Groups
· 253 Total PQRS measures · 739 Total non-PQRS measures · 22 Measures Groups
· 281 Total PQRS measures · TBD Total non-PQRS measures · 25 Measures Groups
2015 Physician Quality Reporting System Reporting Experience and Trends
10
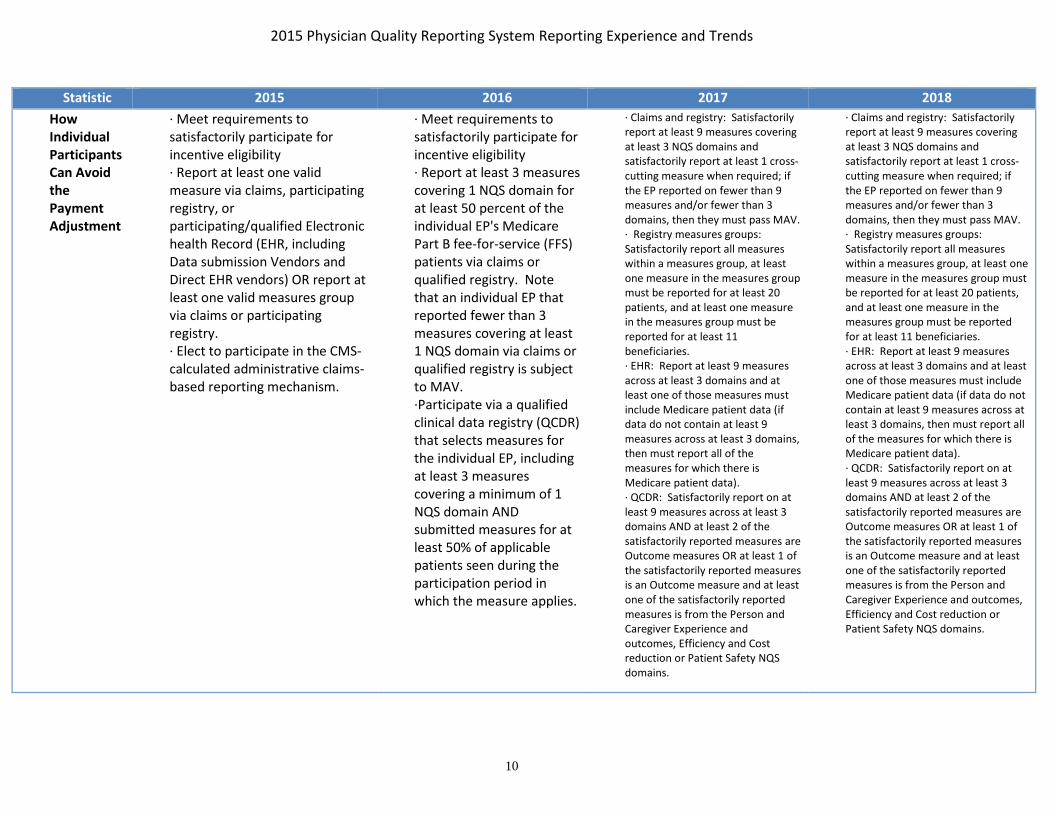
Statistic 2015 2016 2017 2018 How Individual Participants Can Avoid the Payment Adjustment
· Meet requirements to satisfactorily participate for incentive eligibility · Report at least one valid measure via claims, participating registry, or participating/qualified Electronic health Record (EHR, including Data submission Vendors and Direct EHR vendors) OR report at least one valid measures group via claims or participating registry. · Elect to participate in the CMS-calculated administrative claims-based reporting mechanism.
· Meet requirements to satisfactorily participate for incentive eligibility · Report at least 3 measures covering 1 NQS domain for at least 50 percent of the individual EP's Medicare Part B fee-for-service (FFS) patients via claims or qualified registry. Note that an individual EP that reported fewer than 3 measures covering at least 1 NQS domain via claims or qualified registry is subject to MAV. ·Participate via a qualified clinical data registry (QCDR) that selects measures for the individual EP, including at least 3 measures covering a minimum of 1 NQS domain AND submitted measures for at least 50% of applicable patients seen during the participation period in which the measure applies.
· Claims and registry: Satisfactorily report at least 9 measures covering at least 3 NQS domains and satisfactorily report at least 1 cross-cutting measure when required; if the EP reported on fewer than 9 measures and/or fewer than 3 domains, then they must pass MAV. · Registry measures groups: Satisfactorily report all measures within a measures group, at least one measure in the measures group must be reported for at least 20 patients, and at least one measure in the measures group must be reported for at least 11 beneficiaries. · EHR: Report at least 9 measures across at least 3 domains and at least one of those measures must include Medicare patient data (if data do not contain at least 9 measures across at least 3 domains, then must report all of the measures for which there is Medicare patient data). · QCDR: Satisfactorily report on at least 9 measures across at least 3 domains AND at least 2 of the satisfactorily reported measures are Outcome measures OR at least 1 of the satisfactorily reported measures is an Outcome measure and at least one of the satisfactorily reported measures is from the Person and Caregiver Experience and outcomes, Efficiency and Cost reduction or Patient Safety NQS domains.
· Claims and registry: Satisfactorily report at least 9 measures covering at least 3 NQS domains and satisfactorily report at least 1 cross-cutting measure when required; if the EP reported on fewer than 9 measures and/or fewer than 3 domains, then they must pass MAV. · Registry measures groups: Satisfactorily report all measures within a measures group, at least one measure in the measures group must be reported for at least 20 patients, and at least one measure in the measures group must be reported for at least 11 beneficiaries. · EHR: Report at least 9 measures across at least 3 domains and at least one of those measures must include Medicare patient data (if data do not contain at least 9 measures across at least 3 domains, then must report all of the measures for which there is Medicare patient data). · QCDR: Satisfactorily report on at least 9 measures across at least 3 domains AND at least 2 of the satisfactorily reported measures are Outcome measures OR at least 1 of the satisfactorily reported measures is an Outcome measure and at least one of the satisfactorily reported measures is from the Person and Caregiver Experience and outcomes, Efficiency and Cost reduction or Patient Safety NQS domains.

2015 Physician Quality Reporting System Reporting Experience and Trends
11
Statistic 2015 2016 2017 2018 How Group Participants Can Avoid the Payment Adjustment
· Meet requirements to satisfactorily participate for incentive eligibility · Report at least one valid measure via web interface (only available to practices of 25 or more EPs) or participating registry (available to all PQRS GPRO sizes) · Elect to participate in the CMS-calculated administrative claims-based reporting mechanism.
· Meet requirements for satisfactorily reporting for incentive eligibility. · Report at least 3 measures covering 1 NQS domain for at least 50% of the group practice's Medicare Part B FFS patients via qualified registry. · Report 1-8 measures covering 1-3 NQS domains for which there is Medicare patient data (subjecting the group practice to the MAV process) AND report each measure for at least 50% of the group practice's Medicare Part B FFS patients seen during the reporting period in which the measure applies.
· Web interface: Submit all web interface measures for the required population (at least one measure must have data for a Medicare patient). · Registry: If the group is required or elected to report CAHPS, then they must satisfactorily report on at least 6 measures across 2 domains; if they reported on fewer than 6 measures or across only 1 domain then they must pass MAV. If the group is not reporting CAHPS data then they must satisfactorily report on 9 measures across 3 domains (or they can report on fewer than 9 measures and/or fewer than 3 domains, provided they pass MAV) · EHR: If the group has elected or is required to report CAHPS, then they must report at least 6 measures across at least 2 domains; of these data at least 1 measure must include Medicare patient data. If the group is not reporting CAHPS, they must report at least 9 measures across at least 3 domains
· Web interface: Submit all web interface measures for the required population (at least one measure must have data for a Medicare patient). · Registry: If the group is required or elected to report CAHPS, then they must satisfactorily report on at least 6 measures across 2 domains; if they reported on fewer than 6 measures or across only 1 domain then they must pass MAV. If the group is not reporting CAHPS data then they must satisfactorily report on 9 measures across 3 domains (or they can report on fewer than 9 measures and/or fewer than 3 domains, provided they pass MAV) · EHR: If the group has elected or is required to report CAHPS, then they must report at least 6 measures across at least 2 domains; of these data at least 1 measure must include Medicare patient data. If the group is not reporting CAHPS, they must report at least 9 measures across at least 3 domains · QCDR: If the group is required or elected to report CAHPS, then they must satisfactorily report on at least 6 measures across 2 domains; otherwise the TIN must report at least 9 measures (PQRS measures and/or non-PQRS measures) covering at least 3 domains. Whether or not CAHPS data are reported, the submission must include at least 2 outcome measures. If 2 Outcome measures are not available, report at least 1 outcome measure and at least 1 of the following other types of measure: resource use, patient experience of care, efficiency appropriate use, or patient safety measure.
[a] Applicable Quality Percent is applied to estimated allowed charges for covered professional services furnished by the eligible professional in the applicable reporting period.
2015 Physician Quality Reporting System Reporting Experience and Trends
12
Notes for Table 4: Information in this table does not apply to EPs participating in Medicare ACOs under the Shared Savings Program or the Pioneer ACO Model, nor does it apply to those participating under the CPC Initiative.

2015 Physician Quality Reporting System Reporting Experience and Trends
13
C. PQRS Payment Adjustment
As mandated by Section 1848(a)(8) of the Social Security Act, a payment adjustment for the PQRS program was implemented in 2015, based on 2013 reporting. Eligible professionals and groups who did not meet reporting requirements in 2013 were subject to a 1.5 percent reduction in their PFS allowed charges in 2015; the adjustment increased to 2.0 percent reduction in PFS allowed charges for 2016, 2017, and 2018 based on reporting years 2014, 2015, and 2016 respectively (table 4).
CMS implemented changes to requirements for avoiding the payment adjustment for 2016. The administrative claims method was eliminated as a method to avoid the 2016 PQRS payment adjustment; to avoid an adjustment of two percent of PFS allowed charges in 2016, eligible professionals and groups had to meet more stringent criteria compared to prior program years (Table 4). For program year 2014, eligible professionals that assigned their reimbursement and billing to a critical access hospital under Method II (CAHs) also had to meet reporting requirements, or be subject to a two percent reduction in their 2016 CAH II charges.
The Measures Applicability Validation (MAV) process continued in 2015 for the claims and registry reporting mechanisms. MAV determines if eligible professionals reporting individual measures (via claims and registry) or groups reporting individual measures under the GPRO (via registry) satisfactorily reported despite reporting fewer measures than required under the satisfactory reporting requirements for avoiding the 2016 PQRS payment adjustment. For more details on MAV, please refer to the CMS website.11
There were several ways that individual eligible professionals could avoid the PQRS payment adjustment for 2017:
• For claims and registry individual measures: Satisfactorily report at least nine measures covering at least three NQS domains and satisfactorily report at least one cross-cutting measure when required (if the eligible professional saw at least one Medicare patient in a face-to-face encounter); if the EP reported on fewer than nine measures and/or fewer than three domains, then they must pass MAV.
• For registry measures groups: Report all measures within a measures group on a 20 patient sample; at least 11 of the 20 patients must be Medicare Part B FFS patients.
• For EHR: Report at least nine measures across at least three domains and at least one of those measures must include Medicare patient data (if data do not contain at least nine measures across at least three domains, then must report all of the measures for which there is Medicare patient data).
11 For details on the MAV process in 2015, please refer to the claims and registry MAV documents found under the Analysis and Payment section in following link: https://www.cms.gov/Medicare/Quality-Initiatives-Patient-Assessment-Instruments/PQRS/2015_Physician_Quality_Reporting_System.html

2015 Physician Quality Reporting System Reporting Experience and Trends
14
• For QCDR: Satisfactorily report on at least nine measures across at least three domains AND at least two of the satisfactorily reported measures are Outcome measures; if the QCDR does not report 2 Outcomes measures, at least one of the satisfactorily reported measures is an Outcome measure and at least one of the satisfactorily reported measures is from the Person and Caregiver Experience and outcomes, Efficiency and Cost reduction or Patient Safety NQS domains.
Group practices could avoid the 2017 payment adjustment if they:
• For Web interface: Submit all web interface measures for the first 248 consecutively ranked beneficiaries. If the pool of eligible beneficiaries is less than 248, then report on 100 percent of assigned beneficiaries; there must be at least one measure for which there is Medicare patient data. Practices with 25-99 EPs (Medium) can elect to report CAHPS summary survey modules as well but practices with 100 or more EPs must report all CAHPS summary survey modules.
• For Registry: If the group has elected or is required to report CAHPS, then in addition to the CAHPS data they must report at least 6 measures across at least 2 domains; if fewer than 6 measures or 2 domains apply, then they are subject to MAV. If the group is not reporting CAHPS, they must report at least 9 measures across at least 3 domains; if at least one Medicare patient is seen in a face-to-face encounter then they must report on at least one cross-cutting measure; if they report on fewer than 9 measures or fewer than 3 domains then they are subject to MAV.
• For EHR: If the group has elected or is required to report CAHPS, then they must report at least 6 measures across at least 2 domains; of these data at least 1 measure must include Medicare patient data. If the group is not reporting CAHPS, they must report at least 9 measures across at least 3 domains
Other reasons for avoiding the payment adjustment were related to not being eligible for PQRS:
• Not having at least one eligible denominator claim; or
• Not meeting the definition of an eligible professional for the PQRS payment adjustment; or
• Not having any PFS charges in 2015; or
• Being a member of an independent lab or diagnostic testing facility in 2015.
In addition, individual eligible professionals or groups participating via GPRO, ACO, or CPC were able to request an informal review of their downward payment determination between September 26, 2016 and December 7, 2016, for the 2015 PQRS program year.

2015 Physician Quality Reporting System Reporting Experience and Trends
15
D. Data and Methods
Data
This report draws on multiple sources of data: (1) Medicare Part B claims data; (2) data submitted by qualified registries and QCDRs; (3) data submitted by qualified EHR vendors; (4) PQRS measure data submitted through an online web interface by practices that were approved to participate in the GPRO and by eligible professionals participating via the Shared Savings Program and the Pioneer ACO Model; and (5) Consumer Assessment of Healthcare Providers and Systems (CAHPS) for PQRS data submitted by practices participating under the GPRO. Data on the 2017 PQRS payment adjustment were from the PQRS Payment Adjustment file dated March 29, 2017.
Claims data encompassed services within the respective program years and must have been processed by the last Friday in February of the following year to be included in analyses. For example, the analysis of the 2015 program year encompassed claims with service dates from January 1, 2015 through December 31, 2015 and processed by February 26, 2016. Similar to claims data, data collected from the registry, QCDR, and EHR mechanisms as well as the GPRO web interface aligns with the program year and must have been received by CMS by the established deadline for the reporting option.
Information on physician specialty and location was obtained from the National Plan and Provider Enumeration System (NPPES), which is publicly available data and downloadable from the NPPES website.12
Unit of Analysis
The most common unit of analysis in the report is the individual eligible professional. The National Provider Identifier number (NPI) within a billing unit (i.e., the Taxpayer Identification Number [TIN]) defined an eligible professional; the NPI was the performing NPI.13 All analyses regarding individual eligibility and participation were performed at the NPI level within a TIN (referred to as TIN/NPI). Consequently, a single eligible professional could be counted more than once if he/she worked for multiple practices (i.e., single NPI and more than one TIN).
An additional unit of analysis presented in the report is the group practice level, which was defined by a TIN. Practices that participated under the GPRO and Shared Savings Program ACO were analyzed at the practice (i.e., TIN) level. In addition to summarizing group reporting information at the TIN level, this report also aggregates information from individual eligible professionals to the practice (TIN) level for descriptive purposes. For these descriptions, a practice was defined as eligible or participating if at least one eligible professional associated with that practice was eligible or participating.
12 http://download.cms.gov/nppes/NPI_Files.html
13 There are multiple NPIs associated with a service (performing, referring, and ordering); the performing NPI identifies the eligible professional who actually performed the service.

2015 Physician Quality Reporting System Reporting Experience and Trends
16
This report also describes counts of individual eligible professionals who belong to a practice that participated under group reporting options (including those in practices participating under the GPRO and eligible professionals within Shared Savings Program ACOs reporting PQRS data).14 Unless otherwise noted, tables and figures that present counts of total eligible professionals also include the number of eligible professionals within practices participating under group reporting options. For the purposes of summarizing participation, all eligible professionals that are part of a practice that participates are considered to have participated. Eligible professionals that participated in PQRS as part of the Pioneer ACO model or by accepting the PQRS waiver as part of a CPC practice are reported as individual participants in this report.
The specialty and state for eligible professionals were obtained from NPPES. Region was based on CMS carrier regions on claims. In tables that provide regional breakouts, information on the Railroad Retirement Board (RRB) carrier is not provided. This is due to the RRB not being based on geographical location of the eligible professional.
14 As part of their quality reporting requirements, practices within Medicare ACOs reporting PQRS data under the Medicare Shared Savings Program and Pioneer ACO models submitted data on 17 measures via the GPRO web interface.
2015 Physician Quality Reporting System Reporting Experience and Trends
17
IV. PARTICIPATION
A. How to Participate
CMS provided multiple resources on the PQRS website (http://www.cms.gov/Medicare/Quality- Initiatives-Patient-Assessment-Instruments/PQRS/index.html?redirect=/PQRS/) to assist eligible professionals who chose to participate in the program. The 2015 Measure List and Implementation Guide gave guidance on how to determine which measures to report, the reporting method, and claims-based reporting principles. CMS also provided Frequently Asked Questions (FAQ’s) covering a wide range of topics regarding the program.
In 2015, there were six individual participation options and five participation group options (plus additional requirements for groups that elected to or were required to submit CAHPS data; see that section below for more details) for submitting measure data to PQRS. Unless otherwise noted, each mechanism applied to a 12-month period from January 1 to December 31, 2015:
1. Claims-Based Individual Measures. Eligible professionals could report QDCs for measures via claims. To avoid the 2017 payment adjustment, eligible professionals had to report on at least 9 measures from 3 NQS domains (or fewer than 9 measures or fewer than 3 NQS domains, subject to a MAV review) for at least 50 percent of reporting opportunities.
2. Registry-Based Reporting Individual Measures. Eligible professionals could submit measures through a qualified registry. To avoid the 2017 payment adjustment, eligible professionals had to report on at least 9 measures from 3 NQS domains (or fewer than 9 measures or fewer than 3 NQS domains, subject to a MAV review) for at least 50 percent of reporting opportunities.
3. Registry-Based Reporting Measures Groups. Eligible professionals could submit data through a qualified registry. To avoid the 2017 payment adjustment, eligible professionals had to report all applicable measures for at least 1 measures group on at least 20 patients (11 out of 20 patients had to be Medicare Part B FFS patients).
4. Qualified Clinical Data Registry (QCDR). Eligible professionals could submit measures through a CMS-approved entity that collects medical and/or clinical data for the purpose of patient and disease tracking to foster improvement in the quality of care furnished to patients. To avoid the 2017 payment adjustment, eligible professionals had to report at least 9 measures across 3 NQS domains for at least 50 percent of reporting opportunities, including 2 outcome measures or at least 1 Outcome measure and 1 measure from one of the following domains: Person and Caregiver Experience and outcomes, Efficiency and Cost reduction or Patient Safety; QCDRs are not limited to PQRS measures or Medicare beneficiaries.
5. EHR –Direct Submission Eligible professionals could submit data directly through a qualified EHR product. To avoid the 2017 payment adjustment, eligible professionals had to report on at least 9 EHR measures across 3 NQS domains for at least 50 percent of reporting opportunities via a direct EHR-based product that is CEHRT; if an eligible professional’s CEHRT does not contain patient data for at least 9 measures and 3 domains, he or she must report the measures for which there is Medicare patient data. Successful submission of CQM data and one measure with at least one Medicare beneficiary will enable eligible professionals to avoid the payment adjustment and meet the CQM component of the Medicare EHR Incentive Program.
6. EHR – Data Submission Vendor (DSV) Eligible professionals could submit data through a qualified data submission vendor. To avoid the 2017 payment adjustment, eligible professionals had to

2015 Physician Quality Reporting System Reporting Experience and Trends
18
meet the same requirements as described for EHR Direct Submission except submitted via an approved data submission vendor that is CEHRT.
7. GPRO – Registry Reporting. Practices with two or more NPIs that self-nominated and were selected for Small, Medium, or Large GPRO could report via a qualified registry. To avoid the 2017 payment adjustment, practices had to report on at least 9 measures across 3 NQS domains (or fewer than 9 measures or fewer than 3 NQS domains, subject to a MAV review) for at least 50 percent of the practice’s eligible Medicare Part B FFS patients; if at least one Medicare patient was seen in a face-to-face encounter, then at least one cross-cutting measure had to be reported satisfactorily. (Note: under the GPRO registry mechanism, Small (2-24 EPs) and Medium (25-99 EPs) GPRO practices had the option to report CAHPS data in addition to registry; Large (100+ EPs) practices were required to report CAHPS data. The measure criteria for when practices report CAHPS data is described under that mechanism below.)
8. GPRO – EHR Direct Submission. Practices with two or more NPIs that self-nominated and were selected for Small, Medium, or Large GPRO could report through a qualified EHR product. Practices had to report on at least 9 EHR measures across 3 NQS domains for at least 50 percent of reporting opportunities via a direct EHR-based product that is CEHRT. If a practice’s CEHRT does not contain patient data for at least 9 measures and 3 domains, it must report all measures for which there is Medicare patient data; it must report at least one measure with at least one Medicare beneficiary. (Note: under the GPRO EHR mechanism, Small (2-24 EPs) and Medium (25-99 EPs) GPRO practices had the option to report CAHPS data in addition to EHR; Large (100+ EPs) practices were required to report CAHPS data. The measure criteria for when practices report CAHPS data is described under that mechanism below.)
9. GPRO – EHR Data Submission Vendor (DSV). Same as GPRO EHR – Direct Submission except submitted via an approved data submission vendor that is CEHRT.
10. GPRO – Web Interface. Practices with 25 or more NPIs that self-nominated and were selected for Medium or Large GPRO could report the GPRO web interface for a pre-populated patient sample of 248 consecutively ranked and assigned beneficiaries. If the pool of eligible assigned beneficiaries is less than 248, they had to report on 100 percent of assigned beneficiaries. The group practice had to report on at least one measure for which there was Medicare patient data.
11. GPRO – CAHPS Certified Survey Vendor. Practices with more than 100 eligible professionals that reported via the web interface had to have all CAHPS for PQRS summary survey modules reported on the group’s behalf via a CMS-certified survey vendor; practices with 25-99 eligible professionals had the option to supplement their reporting with CAHPS data. GPRO practices of 2-99 eligible professionals who reported via registry or EHR had the option of reporting CAHPS data, practices with 100 or more eligible professionals were required to report CAHPS data; if they reported CAHPS data, they were required to report at least 6 measures across 2 NQS domains for at least 50% of reporting opportunities. For registry reporters, the reporting of CAHPS data fulfilled the requirement of reporting at least one cross-cutting measure.
In addition to the participation options for the traditional PQRS described above, Medicare ACOs participating in the Shared Savings Program or Pioneer ACO Model were required to submit the same 17 quality measures via the GPRO web interface. Eligible professionals participating in ACOs could avoid the 2017 payment adjustment if the ACO met the same requirements as applicable to the Large GPRO (with the exception of the CAHPS for PQRS measures), in addition to meeting the requirements for successful participation in the ACO program. For further information on how eligible professionals

2015 Physician Quality Reporting System Reporting Experience and Trends
19
participating in a Medicare ACO under the Shared Savings Program or Pioneer ACO Model, CMS provides multiple resources on its website. Practices that were part of the CPC and electing a PQRS waiver were required to meet the eCQM reporting requirements under that program to avoid the 2017 payment adjustment. The CMS website includes further information on these programs and initiatives.15
To participate through the claims reporting mechanism, eligible professionals submitted the specified Quality Data Code(s) (QDC) for a given measure on a Medicare Part B professional services claim that met the denominator criteria for that measure. QDCs indicate that a specific quality action or outcome was or was not met, or that exclusion criteria for the measure were met. QDCs are entered on a line item on the claim, similar to procedure codes. A QDC for a given quality measure must be entered on a claim that also has all the required denominator criteria for that measure. For example, a measure could require a specific combination of diagnosis, procedure codes, and beneficiary age to be an ‘eligible instance’; to report the measure validly, the eligible professional had to submit the required QDC(s) on line items for that claim.
To report measures through the registry, EHR, and QCDR mechanisms, eligible professionals submitted performance data via an approved vendor (for registry, QCDR, and EHR data submission vendor), or via an approved EHR product for each measure—such as number of eligible instances (denominator), instances of quality service performed (numerator), number of performance exclusions, reporting rates, and performance rates—in a file format specified by CMS.
B. Overall Participation Results
Eligibility
A professional was defined as eligible to participate individually in PQRS if he/she had at least one PFS professional services claim that contained the denominator criteria of the applicable quality measure for any PQRS measure, respectively, and was not part of an ACO practice participating under the Shared Savings Program; in addition, the eligible professionals could not submit individual PQRS data if they were participating under the CPC initiative or as part of a Pioneer ACO. Eligible practices (TINs) that chose to report under the GPRO applied and met requirements for participation.16 All eligible professionals that were part of an Shared Savings Program ACO were considered eligible under that reporting option only. Eligible professionals were considered eligible via the Pioneer ACO or CPC mechanism if they elected to participate via these programs.
15 Information on the Shared Savings Program can be found at http://www.cms.gov/Medicare/Medicare-Fee-for-Service- Payment/sharedsavingsprogram/index.html; information on the Pioneer ACO Model can be found at http://innovation.cms.gov/initiatives/Pioneer-ACO-Model/; and information on the CPC Initiative can be found at http://innovation.cms.gov/initiatives/comprehensive-primary-care-initiative/.
16 GPRO eligibility criteria varied by program year. In 2010, practices with at least 200 NPIs could participate in the GPRO option; in 2011, practices with 200+ NPIs could participate in “GPRO I” and those with 2-199NPIs could participate in the GPRO II option; in 2012, practices with 25-99 NPIs could participate in the “Small GPRO” option, while practices with 100+ NPIs could participate in the “Large GPRO” option; and in2013-2015, Small GPRO (2-24 NPIs), Medium GPRO (25-99 NPIs), and Large GPRO (100+ NPIs) were available.

2015 Physician Quality Reporting System Reporting Experience and Trends
20
In 2015, there were 1,358,691 professionals eligible to participate in PQRS, including 515,541 eligible professionals who were part of a group practice that self-nominated under the GPRO or as part of a Medicare ACO participating under the Shared Savings Program (Appendix Table A3). Among the 1,136,063 professionals eligible to participate individually, 1,116,864 were eligible to participate via claims, through registry, EHR, or QCDR,17 18,755 were eligible under the Pioneer ACO program and 2,127 as part of a CPC practice. Finally, 207,177 eligible professionals were eligible as part of an Shared Savings Program ACO.
Appendix Table A4 presents characteristics of eligible professionals that were eligible to participate in the 2015 PQRS. About half of all eligible professionals eligible for individual participation were in solo practices or practices with fewer than 25 NPIs and were in a primary care or other non-surgical specialty. The majority (over 70%) of eligible professionals eligible for group reporting (because their practice self-nominated) were in large practices (100 or more eligible professionals). Among individuals not participating in an Shared Savings Program ACO, Pioneer ACO, or CPC, almost half were eligible to report sixteen or more measures; however, 25 percent were eligible to report from one to five measures.
A broad range of specialties were eligible to report PQRS measures. Appendix Table A5 presents the number of eligible professionals who could have participated in PQRS through any reporting option by specialty for the 2011 to 2015 program years. As in prior years, internal medicine and family practice were the specialties with the largest number of eligible professionals who could have participated in the program in 2015 (119,111 and 113,930, respectively). Nurse practitioner and physician assistant also had large numbers eligible to participate (113,445 and 84,402, respectively). Most specialties had increases in the number of eligible professionals, with the largest increases seen in the nurse practitioner, physician assistant and other eligible professional categories (greater than 11%).
Participation
Eligible professionals were defined as participating in PQRS if they had a complete and valid submission of data on quality measures through claims or a valid submission from a qualified registry, EHR (via direct submission or the data submission vendor mechanism), or QCDR. A practice was defined as participating in the PQRS GPRO or Shared Savings Program ACO if the practice submitted data for an assigned sample of patients through a web interface provided by CMS (or submitted data through a registry or EHR for PQRS GPRO); all eligible professionals within a practice that participates under the GPRO or as part of an Shared Savings Program ACO are considered to be participating. A practice was defined as participating in PQRS as a Pioneer ACO if the TIN elected to participate in the Pioneer ACO model; note that some of these TINs are “split TINs” in which only some of the NPIs are participating in the Pioneer ACO model; in these cases, the non-ACO NPIs can only participate in PQRS through the usual individual participation mechanisms (i.e. claims, registry, EHR, or QCDR) unless the TIN was also
17 These figures are based on all eligible professionals that were not part of an Shared Savings Program ACO; they do not reflect the number that actually had access to a registry, EHR, or QCDR.

2015 Physician Quality Reporting System Reporting Experience and Trends
21
participating under the GPRO. Eligible professionals were considered participating in PQRS via the CPC if they were eligible to participate in this program and had submitted a PQRS waiver.18
As shown in Figure 2 in the Executive Summary, past years of program operation have seen growth in participation across most reporting options except for a decline in registry reporting from 2011 to 2012, a decline in Pioneer ACO participation from 2012 to 2013, and a decline in claims reporting from 2013 to 2014. For the 2015 program year, there was a decrease in Pioneer ACO and CPC. Overall, 481,704 eligible professionals (42 percent of those eligible) participated individually in the 2015 PQRS (Appendix Table A3). In addition, 295,308 eligible professionals within 3,418 practices participated under the GPRO; 206,859 eligible professionals participated through 394 Medicare ACOs participating under the Shared Savings Program; 18,755 eligible professionals participated in 13 ACOs under the Pioneer Model (Table 3). Including all reporting options and participation in other programs for the sake of avoiding the 2017 payment adjustment, the overall participation rate was 69 percent, and the total number participating in the PQRS increased 14 percent from 2014.
18 TIN/NPI that were on the CPC finder file but did not submit a PQRS waiver and submitted PQRS data via the claims, registry, QCDR, or EHR submission mechanisms are counted as participating under those mechanisms.

2015 Physician Quality Reporting System Reporting Experience and Trends
22
Eligible professionals who chose to participate in the 2015 PQRS using the registry, EHR, or QCDR-based reporting mechanisms contacted the CMS-qualified registries, EHR, or QCDR vendors listed in the posted CMS qualified lists.19 In 2015, there were 99 qualified registries that could submit data on behalf of eligible professionals, compared to 87 in 2014; 80 registries submitted quality measure information in 2015 compared to 69 in 2014. In 2015 there were also 50 qualified clinical data registries, 29 of which submitted data. The Office of the National Coordinator for Health Information Technology (ONC) certification process has established standards and other criteria for structured data that EHRs must use. As seen in Appendix Table A3, within the individual reporting option:
• 69 percent of individual participants used the claims mechanism (N=330,863)
• 23 percent used registry reporting (N=110,296)
• 12 percent participated via EHR (N=56,761, unduplicated)
• 4 percent participated as part of a Pioneer ACO (N=18,755)
• 3 percent participated via the QCDR (N=15,381)
• <1 percent participated as part of the CPC (N=444)
The number of participants reporting using specific mechanisms increased over 2014, for all reporting mechanisms except for individuals participating as part of a Pioneer ACO (Figure 2). In total, 9.9 percent of individual participants used more than one reporting mechanism. About 5.3 percent of individual participants used more than one individual participation mechanism. For example, three percent of individuals used claims and registry, one percent used claims and EHR, and 0.6 percent used claims and QCDR; less than one percent used other combinations such as registry and EHR (0.1 percent), or claims/registry/EHR (0.1%).
Within the group reporting option, participation by mechanism varied by practice size (Appendix Table A3). Within Small GPRO practices, 76 percent of eligible professionals reported via registry (with or without CAHPS), compared to 24 percent via QRDA III; no GPRO practices used QRDA I. Within Medium GPRO, 65 percent of eligible professionals were in a practice reporting via registry (with or without CAHPS), compared to 12 percent using web interface (with or without CAHPS), and 23 percent using QRDA III (with or without CAHPS). Finally, among Large GPROs, most eligible professionals were in practices reporting via the web interface (48 percent), compared to 38 percent using registry, and 15 percent using QRDA III.
Appendix Table A4 presents information on the characteristics of eligible professionals who were eligible and participating in the 2015 PQRS. As with the distribution of those eligible, the Atlanta, and Chicago regions had the most participating eligible professionals. Among individual participants, over half could report on 15 or fewer measures. For those who were eligible for individual participation, participation
19 Lists can be found at: https://www.cms.gov/Medicare/Quality-Initiatives-Patient-Assessment-Instruments/PQRS/2015_Physician_Quality_Reporting_System.html

2015 Physician Quality Reporting System Reporting Experience and Trends
23
rates were higher among those in larger practices; the same can be said for those who were eligible for group participation. It is also true that participation rates were higher for eligible professionals with higher beneficiary volumes and higher PFS charges.

2015 Physician Quality Reporting System Reporting Experience and Trends
24
C. Use of Measures Groups and Registries
Between 2014 and 2015, five measures groups were dropped and two were added. In 2015, one-third of eligible professionals reporting via registry (N=38,694 out of 110,269) reported via registry measures groups (Appendix Table A3). The number of eligible professionals participating using registry measures groups increased from 2014 to 2015 over 21% (Figure 2). Use of registry measures group reporting was concentrated within family practice, internal medicine, cardiology, oncology, nurse practitioner, and nephrology (Table A10).
The number of registries submitting data on behalf of eligible professionals had fluctuated over time. In 2008, 31 qualified registries submitted PQRS data on behalf of eligible professionals; this grew to 69 in 2014 and 80 in 2015 (data not shown).
Table 5 displays the registries that submitted data for the most eligible professionals in 201520. Some registries are more specific to a certain specialty and, therefore, might not have a high volume of eligible professionals to report measures via their registry.
Table 4: Registries that Submitted Data on Behalf of the Most Participants (2015)
Rank Registry Name Eps Submitted Practices Submitted
-- Individual Participants -- -- 1 CECity 19,656 N/A 2 MDinteractive 9,729 N/A 3 WebPT Inc. 9,439 N/A 4 NetHealth 7,485 N/A 5 NextGen_Registry 7,263 N/A 6 EClinicalWeb 5,796 N/A 7 PQRS Solutions 5,609 N/A 8 Covisint Corporation 5,156 N/A 9 athenaHealth, Inc. 4,131 N/A
10 Central Utah Informatics 4,038 N/A -- Group Participants -- -- 1 PQRS Solutions 24,157 457 2 CECity 18,922 389 3 HealthCare Financial Services LLC 10,467 122 4 Crimson Care Registry 7,233 25
20 A complete listing of qualified registries available for the 2015PQRS can be found at https://www.cms.gov/Medicare/Quality-Initiatives-Patient-Assessment-Instruments/PQRS/Downloads/2015QualifiedRegistries.pdf
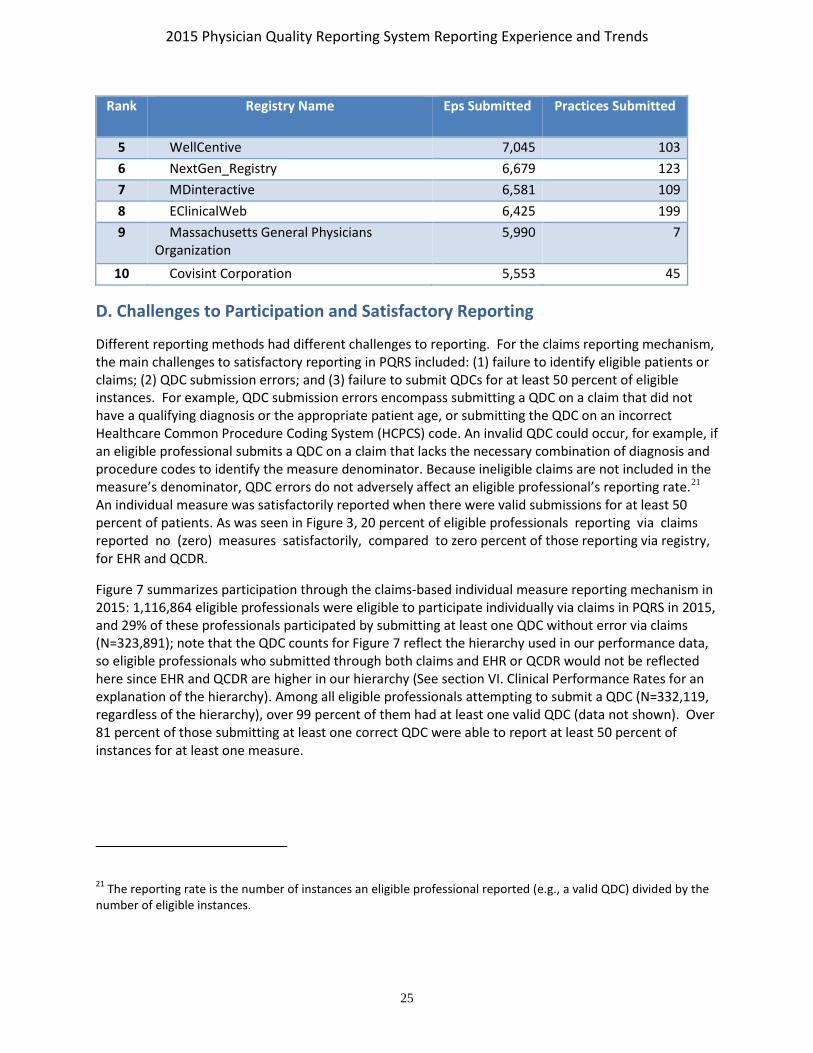
2015 Physician Quality Reporting System Reporting Experience and Trends
25
Rank Registry Name Eps Submitted Practices Submitted
5 WellCentive 7,045 103 6 NextGen_Registry 6,679 123 7 MDinteractive 6,581 109 8 EClinicalWeb 6,425 199 9 Massachusetts General Physicians
Organization 5,990 7
10 Covisint Corporation 5,553 45
D. Challenges to Participation and Satisfactory Reporting
Different reporting methods had different challenges to reporting. For the claims reporting mechanism, the main challenges to satisfactory reporting in PQRS included: (1) failure to identify eligible patients or claims; (2) QDC submission errors; and (3) failure to submit QDCs for at least 50 percent of eligible instances. For example, QDC submission errors encompass submitting a QDC on a claim that did not have a qualifying diagnosis or the appropriate patient age, or submitting the QDC on an incorrect Healthcare Common Procedure Coding System (HCPCS) code. An invalid QDC could occur, for example, if an eligible professional submits a QDC on a claim that lacks the necessary combination of diagnosis and procedure codes to identify the measure denominator. Because ineligible claims are not included in the measure’s denominator, QDC errors do not adversely affect an eligible professional’s reporting rate.21
An individual measure was satisfactorily reported when there were valid submissions for at least 50 percent of patients. As was seen in Figure 3, 20 percent of eligible professionals reporting via claims reported no (zero) measures satisfactorily, compared to zero percent of those reporting via registry, for EHR and QCDR.
Figure 7 summarizes participation through the claims-based individual measure reporting mechanism in 2015: 1,116,864 eligible professionals were eligible to participate individually via claims in PQRS in 2015, and 29% of these professionals participated by submitting at least one QDC without error via claims (N=323,891); note that the QDC counts for Figure 7 reflect the hierarchy used in our performance data, so eligible professionals who submitted through both claims and EHR or QCDR would not be reflected here since EHR and QCDR are higher in our hierarchy (See section VI. Clinical Performance Rates for an explanation of the hierarchy). Among all eligible professionals attempting to submit a QDC (N=332,119, regardless of the hierarchy), over 99 percent of them had at least one valid QDC (data not shown). Over 81 percent of those submitting at least one correct QDC were able to report at least 50 percent of instances for at least one measure.
21 The reporting rate is the number of instances an eligible professional reported (e.g., a valid QDC) divided by the number of eligible instances.

2015 Physician Quality Reporting System Reporting Experience and Trends
26
Figure 7 – Summary of Individual Measures Reported through PQRS Claims Mechanism (2015)
263,230
323,891
1,116,864
0 200,000 400,000 600,000 800,000 1,000,000 1,200,000
Reported at least 50%of Instances for
at least 1 Measure
Reported a QDCCorrectly
Eligible to Reporta Measure
Number of Eligible Professionals
Leve
l of P
artic
ipat
ion
Note: The counts for who reported a QDC correctly and who reported at least 50% of instances for at least 1 measure are derived after the application of our hierarchy in performance data.
Some PQRS participants who used a registry, QCDR, or EHR experienced submission problems. Eighty-four percent of registries submitted data for eligible professionals who did not have Part B PFS charges; this affected 7,096 eligible professionals. Of the eligible professionals who submitted through QCDR, about one percent were part of a practice participating as a Pioneer ACO. About five percent of EPs had submissions even though they did not have Part B PFS charges. The most prevalent data issues for QCDR were having reporting denominators not equal to the initial population count minus exclusions (affecting about four percent of eligible professionals submitting through a QCDR) and not having the reporting rate equal to the reporting numerator divided by the reporting denominator (also affecting about four percent of the eligible professionals submitting through a QCDR). CMS has communicated with the registries and QCDRs about these issues, so that they can improve on these submissions in future program years.
In addition, there were challenges for those who submitted data through the web interface (i.e. practices participating under the GPRO and eligible professionals participating as part of a Medicare ACO under the Shared Savings Program or Pioneer ACO Model). These included a lack of understanding about the assignment and/or sampling methodology, inexperience using the web interface, and challenges with the layers between those providing care and those abstracting the data for submission, which resulted in some users not inputting the data properly.

2015 Physician Quality Reporting System Reporting Experience and Trends
27
E. Participation by Specialty
The measures in PQRS apply to a broad range of specialties, providing numerous opportunities for eligible professionals in all specialties to report on their Medicare patients.22
Appendix Table A7 shows participation rates by specialty across all reporting options from 2012 to 2015. Participation rates by specialty and submission mechanism for 2012 through 2015 can be found in Appendix Tables A8 through A12.
As shown in Table 6, of eligible professionals who participated through the claims-based reporting option, several hospital-based specialties were among the top ten specialties using this reporting mechanism. For example, emergency medicine had the largest representation among all specialties and also had a high rate of participation in this mechanism (55 percent), followed by nurse anesthetist and anesthesiology, which had participation rates of 60 and 64 percent respectively. Radiology had the fifth highest number of participants via claims. Hospital-based practices may have processes in place to capture clinical data, facilitating quicker uptake of reporting quality measure data. Eligible professionals in the fields of physical therapy, internal medicine, family practice, optometry, chiropractor, and physician assistant also had a relatively large number of professionals who participated in the 2015 program via claims; however, with the exception of physical therapy, these specialties had participation rates of less than 50 percent. (Appendix Table A8 presents results for all specialties reporting via claims.)
Table 5: Top Specialties Participating via Claims (2015)
Rank Specialty Eligible Professionals
EPs who Participated
Percent of EPs who
Participated
1 Emergency Medicine 58,199 32,119 55.2% 2 Nurse Anesthetist 53,087 32,073 60.4% 3 Anesthesiology 44,822 28,744 64.1% 4 Physical Therapy 50,054 27,594 55.1% 5 Radiology 33,954 20,575 60.6% 6 Internal Medicine 86,292 19,831 23.0% 7 Family Practice 85,317 18,341 21.5% 8 Physician Assistant 65,746 17,165 26.1% 9 Optometry 35,574 14,977 42.1%
10 Chiropractor 45,584 14,832 32.5%
Notes for Table 6: Results exclude eligible professionals participating as part of a Medicare ACO under the Shared Savings Program or the Pioneer ACO Model and eligible professionals participating through the CPC initiative.
22 In this section, “specialty” was determined based on the primary specialty that was listed for the NPI in the National Provider and Plan Enumeration System (NPPES).

2015 Physician Quality Reporting System Reporting Experience and Trends
28
Physical therapy, internal medicine, family practice, and nurse practitioner had the highest numbers of eligible professionals participating via the registry individual measures mechanism in 2015 (Table 7). Within the registry measures group mechanism, the top specialties included family practice, internal medicine, nurse practitioner and nephrology (See Appendix Tables A9 and A10 for results for all specialties). Among the specialties with the most participants, dermatology had the highest rate ofparticipation via registry individual measures (32 percent), and nephrology had the highest participation rate (28 percent) in registry measures groups.
Table 7: Top Specialties Participating via Registry (2015)
Rank Specialty Eligible Professionals
EPs who Participated
Percent of EPs who
Participated
-- Registry Individual Measures -- -- -- 1 Physical Therapy 50,054 10,480 20.9% 2 Internal Medicine 86,292 6,024 7.0% 3 Family Practice 85,317 5,271 6.2% 4 Nurse Practitioner 89,732 5,060 5.6% 5 Physician Assistant 65,746 4,705 7.2% 6 Emergency Medicine 58,199 3,982 6.8% 7 Radiology 33,954 3,648 10.7% 8 Dermatology 11,273 3,558 31.6% 9 Other Eligible Professional 39,496 3,023 7.7%
10 Nurse Anesthetist 53,087 1,713 3.2% -- Registry Measures Groups -- -- -- 1 Internal Medicine 86,292 5,047 5.8% 2 Family Practice 85,317 4,779 5.6% 3 Nurse Practitioner 89,732 3,315 3.7% 4 Nephrology 8,502 2,357 27.7% 5 Cardiology 20,459 2,347 11.5% 6 Oncology/Hematology 11,058 2,196 19.9% 7 Other Eligible Professional 39,496 1,904 4.8% 8 Physician Assistant 65,746 1,522 2.3% 9 Ophthalmology 18,876 1,424 7.5%
10 General Surgery 21,320 1,346 6.3%
Note for Table 7: Results exclude eligible professionals participating as part of a Medicare ACO under the Shared Savings Program or the Pioneer ACO Model, and eligible professionals participating through the CPC initiative.
Table 8 presents the specialties with the most eligible professionals reporting via EHR in 2015. Family practice and nurse practitioner topped the list for the specialties with the most eligible professionals participating in PQRS via the EHR mechanism, followed by internal medicine, ophthalmology, and physician assistant. The rate of participation among these specialties using the EHR mechanism was

2015 Physician Quality Reporting System Reporting Experience and Trends
29
relatively low with the highest being 25.4 percent for ophthalmology. See Appendix Table A11 for more detail.
Table 6: Top Specialties Participating via EHR (2015)
Rank Specialty Eligible Professionals
EPs who Participated
Percent of EPs who
Participated
1 Family Practice 85,317 6,695 7.8% 2 Nurse Practitioner 89,732 5,797 6.5% 3 Internal Medicine 86,292 5,184 6.0% 4 Ophthalmology 18,876 4,799 25.4% 5 Physician Assistant 65,746 3,925 6.0% 6 Obstetrics/Gynecology 28,237 3,190 11.3% 7 Optometry 35,574 2,628 7.4% 8 Orthopedic Surgery 20,915 2,415 11.5% 9 Other Eligible Professional 39,496 2,186 5.5%
10 General Surgery 21,320 1,847 8.7%
Notes for Table 8: Results exclude eligible professionals participating as part of a Medicare ACO under the Shared Savings Program or the Pioneer ACO Model, and eligible professionals participating through the CPC initiative.
Table 9 presents the specialties with the most eligible professionals reporting via the QCDR mechanism in 2015. Anesthesiology had the most eligible professionals reporting via this mechanism, followed by nurse anesthetist. Thoracic/cardiac surgery had a relatively high rate of participation in this mechanism (17 percent) compared to 8 percent for Gastroenterology and anesthesiology, which had the second and third highest participation rates among the top 10 specialties based on participation counts (Table 9). See Appendix Table A12 for more detail on all specialties.
Table 7: Top Specialties Participating via QCDR (2015)
Rank Specialty Eligible Professionals
EPs who Participated
Percent of EPs who
Participated
1 Anesthesiology 44,822 3,459 7.7% 2 Nurse Anesthetist 53,087 3,327 6.3% 3 Emergency Medicine 58,199 1,472 2.5% 4 Physician Assistant 65,746 1,138 1.7% 5 Gastroenterology 11,691 980 8.4% 6 Cardiology 20,459 893 4.4% 7 Thoracic/Cardiac Surgery 3,285 564 17.2% 8 Internal Medicine 86,292 533 0.6% 9 Nurse Practitioner 89,732 500 0.6%

2015 Physician Quality Reporting System Reporting Experience and Trends
30
Rank Specialty Eligible Professionals
EPs who Participated
Percent of EPs who
Participated
10 Other Eligible Professional 39,496 421 1.1%
Notes for Table 9: Results exclude eligible professionals participating as part of a Medicare ACO under the Shared Savings Program or the Pioneer ACO Model, and eligible professionals participating through the CPC initiative.
The specialties with the most eligible professionals who were part of practices participating via the GPRO or as part of a Medicare ACO under the Shared Savings Program were concentrated among primary care (internal medicine, nurse practitioner, family practice, and physician assistant) (Table 10).
Table 8 : Top Specialties Participating via GPRO and Shared Savings Program ACO (2015)
Rank Specialty Eligible Professionals
EPs who Participated
Percent of EPs who
Participated
-- GPRO -- -- -- 1 Internal Medicine 33,174 32,280 97.3% 2 Nurse Practitioner 31,553 30,312 96.1% 3 Family Practice 28,868 27,758 96.2% 4 Physician Assistant 24,968 24,099 96.5% 5 Emergency Medicine 17,204 16,448 95.6% 6 Radiology 11,361 10,831 95.3% 7 Nurse Anesthetist 10,805 10,082 93.3% 8 Obstetrics/Gynecology 10,143 9,870 97.3% 9 Other Eligible Professional 9,791 9,346 95.5%
10 Cardiology 9,336 9,040 96.8% -- Shared Savings Program ACO -- -- -- 1 Internal Medicine 28,113 28,085 99.9% 2 Family Practice 25,737 25,693 99.8% 3 Nurse Practitioner 21,473 21,404 99.7% 4 Physician Assistant 16,144 16,119 99.8% 5 Cardiology 8,679 8,665 99.8% 6 Emergency Medicine 8,082 8,079 100.0% 7 Obstetrics/Gynecology 7,215 7,196 99.7% 8 Radiology 6,531 6,519 99.8% 9 Other Eligible Professional 5,957 5,941 99.7%
10 Nurse Anesthetist 5,516 5,515 100.0%
Finally, among eligible professionals who were participating in a Pioneer ACO or as part of practices participating in the CPC initiative the most common specialties were also internal medicine, family practice, and nurse practitioner (Table 11).

2015 Physician Quality Reporting System Reporting Experience and Trends
31
Table 9: Top Specialties via a Pioneer ACO or the CPC Initiative (2015)
Rank Specialty Eligible Professionals
EPs who Participated
Percent of EPs who
Participated
-- Pioneer ACO -- -- -- 1 Internal Medicine 3,758 3,758 100.0% 2 Family Practice 2,079 2,079 100.0% 3 Nurse Practitioner 1,175 1,175 100.0% 4 Radiology 921 921 100.0% 5 Physician Assistant 888 888 100.0% 6 Other Eligible Professional 722 722 100.0% 7 Cardiology 681 681 100.0% 8 Obstetrics/Gynecology 657 657 100.0% 9 Pediatrics 566 566 100.0%
10 Emergency Medicine 555 555 100.0% -- CPC -- -- -- 1 Family Practice 1,010 255 25.2% 2 Internal Medicine 598 77 12.9% 3 Nurse Practitioner 230 52 22.6% 4 Physician Assistant 220 42 19.1% 5 Geriatrics 21 7 33.3% 6 Other MD/DO 4 3 75.0% 7 Gastroenterology 3 2 66.7% 8 Pediatrics 9 2 22.2% 9 Emergency Medicine 2 1 50.0%
10 General Practice 10 1 10.0%

2015 Physician Quality Reporting System Reporting Experience and Trends
32
F. Participation by Beneficiary Volume and Specialty
Participation rates among eligible professionals generally increased by beneficiary volume—defined as the number of beneficiaries who had an eligible claim for at least one PQRS measure—but patterns varied by specialty. Among all specialties, eligible professionals with 25 or fewer patients had a participation rate of 49 percent, compared to 66 percent among those with 26 to 100 patients, 76 percent among those with 101 to 200 patients, and 84 percent among those with more than 200 patients (Appendix A13). This general pattern was present for almost all specialties, especially MD/DOs and those with larger numbers of participants overall. Within emergency medicine, pathology, radiology, radiation oncology, oncology/hematology, and interventional radiology, eligible professionals with larger beneficiary volume (over 200 patients) had a participation rate of 90 percent and above (Appendix Table A13). Some specialties had relatively high rates of participation among eligible professionals with low beneficiary volume (fewer than 25 patients) including: pathology (80 percent), certified nurse midwives (76 percent), nurse anesthetist (71 percent), and radiology (75 percent).
G. Geographic Variation in Participation
Figure 8 demonstrates the geographic variation in participation rates for the 2015 PQRS.23 Detailed state-by-state participation results are available in Appendix Table A14. Participation was generally highest in states in the Southeast, Midwest, and New England. Participation rates were highest in Wisconsin (82 percent), Minnesota and North Carolina (79 percent), Vermont (78 percent), North Dakota (77 percent), Maine and South Carolina (76 percent). Participation was lowest (below 45 percent) in Puerto Rico and the Virgin Islands. New York and California had the largest absolute number of eligible professionals who participated, although the participation rate in California was less than 60%.
23 State was identified by the eligible professional in the National Plan and Provider Enumeration System (NPPES). Please see Appendix for details.

2015 Physician Quality Reporting System Reporting Experience and Trends
33
Figure 8 – Geographic Distribution of Eligible Professionals Participating in PQRS (2015)
Notes for Figure 8: Results include all individual participation PQRS mechanisms (i.e., claims, registry, EHR, and QCDR) as well as eligible professionals who belong to a practice that participated under the PQRS GPRO, eligible professionals participating as part of a Medicare ACO under the Shared Savings Plan or Pioneer ACO Model, and eligible professionals participating through the CPC initiative. The data used to populate this map can be found in Appendix Table A14.
H. Participation by Measure
Many measures in PQRS were selected because they were applicable to a wide range of eligible professionals and Medicare beneficiaries. The measures applicable to the largest number of eligible professionals in 2015 were those related to documentation of current medications, preventive care for high blood pressure, pain assessment and follow-up, body mass index (BMI) screening, tobacco use, and clinical depression, as well as advance care planning(Table 12).

2015 Physician Quality Reporting System Reporting Experience and Trends
34
Table 10: Top Measures Reportable by the Largest Number of Eligible Professionals (2015)
Rank Measure Number
Measure Description Eligible Professionals
1 130 Documentation of Current Medications in the Medical Record 815,432 2 317 Preventive Care and Screening: Screening for High Blood Pressure
and Follow-Up Documented 810,094
3 131 Pain Assessment and Follow-Up 750,344 4 128 Preventive Care and Screening: Body Mass Index (BMI) Screening
and Follow-Up Plan 724,894
5 226 Preventive Care and Screening: Tobacco Use: Screening and Cessation Intervention
683,457
6 134 Preventive Care and Screening: Screening for Clinical Depression and Follow-Up Plan
669,133
7 47 Advance Care Plan 664,131 8 181 Elder Maltreatment Screen and Follow-Up Plan 644,648 9 154 Falls: Risk Assessment 632,119
10 110 Preventive Care and Screening: Influenza Immunization 579,385
Notes for Table 12: Results include the claims, registry, EHR, and QCDR mechanisms, exclude results for eligible professionals participating as part of a Medicare ACO under the Shared Savings Program or the Pioneer ACO Model, and eligible professionals participating through the CPC initiative.
Table 13 lists the ten measures reported by the largest number of eligible professionals in 2015. The top reported measures include six of the measures with the most eligible professionals able to report:
#130, #317, #128, #110, #131 and #226. They also include a number of other preventive measures, Controlling high blood pressure (#236), and Colorectal Cancer Screening (#113) as well for Diabetes- Hemoglobin A1c Poor Control (#1), and Perioperative Temperature Management (#193).
Although a relatively large number of eligible professionals reported these measures, several measures were submitted by 15 percent or fewer of those to which the measure was applicable: #111 (Preventive Care and Screening: Pneumonia Vaccination for Patients 65 Years or Older), #110 (Preventive Care and Screening: Influenza Immunization), #1 (Diabetes: Hemoglobin A1c Poor Control), #131 (Pain Assessment and Follow Up) and #317 (Preventive Care and Screening for High Blood Pressure). Appendix Table A15 displays the percentage of eligible professionals who reported each measure and the average reporting rate (total instances reported for a measure divided by total eligible instances for the measure) for each measure reported through claims.
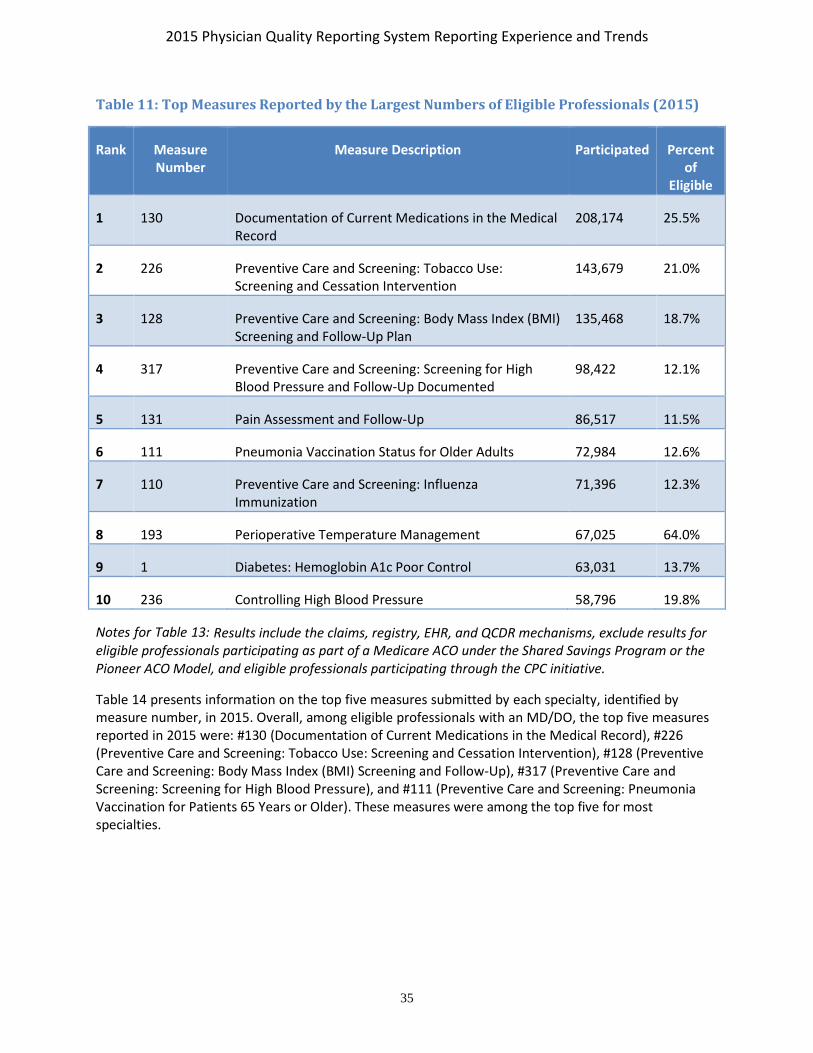
2015 Physician Quality Reporting System Reporting Experience and Trends
35
Table 11: Top Measures Reported by the Largest Numbers of Eligible Professionals (2015)
Rank Measure Number
Measure Description Participated Percent of
Eligible
1 130 Documentation of Current Medications in the Medical Record
208,174 25.5%
2 226 Preventive Care and Screening: Tobacco Use: Screening and Cessation Intervention
143,679 21.0%
3 128 Preventive Care and Screening: Body Mass Index (BMI) Screening and Follow-Up Plan
135,468 18.7%
4 317 Preventive Care and Screening: Screening for High Blood Pressure and Follow-Up Documented
98,422 12.1%
5 131 Pain Assessment and Follow-Up 86,517 11.5%
6 111 Pneumonia Vaccination Status for Older Adults 72,984 12.6%
7 110 Preventive Care and Screening: Influenza Immunization
71,396 12.3%
8 193 Perioperative Temperature Management 67,025 64.0%
9 1 Diabetes: Hemoglobin A1c Poor Control 63,031 13.7%
10 236 Controlling High Blood Pressure 58,796 19.8%
Notes for Table 13: Results include the claims, registry, EHR, and QCDR mechanisms, exclude results for eligible professionals participating as part of a Medicare ACO under the Shared Savings Program or the Pioneer ACO Model, and eligible professionals participating through the CPC initiative.
Table 14 presents information on the top five measures submitted by each specialty, identified by measure number, in 2015. Overall, among eligible professionals with an MD/DO, the top five measures reported in 2015 were: #130 (Documentation of Current Medications in the Medical Record), #226 (Preventive Care and Screening: Tobacco Use: Screening and Cessation Intervention), #128 (Preventive Care and Screening: Body Mass Index (BMI) Screening and Follow-Up), #317 (Preventive Care and Screening: Screening for High Blood Pressure), and #111 (Preventive Care and Screening: Pneumonia Vaccination for Patients 65 Years or Older). These measures were among the top five for most specialties.

2015 Physician Quality Reporting System Reporting Experience and Trends
36
Table 12: Top Reported Individual Measures by Specialty (2015)
Specialty #1 (Top) #2 #3 #4 #5 MD/DO 130 226 128 317 111
Allergy/Immunology 130 226 111 110 128 Anesthesiology 193 76 AQI 12 AQI 7 AQI 6 Cardiology 226 130 128 236 204 Colon/Rectal Surgery 130 226 113 128 111 Critical Care 130 47 226 76 111 Dermatology 130 226 137 224 138 Emergency Medicine 54 317 76 326 93 Endocrinology 1 130 226 128 119 Family Practice 130 226 1 128 111 Gastroenterology 130 113 226 128 111 General Practice 130 1 226 317 128 General Surgery 130 226 128 112 113 Geriatrics 130 226 110 128 1 Hand Surgery 130 226 128 131 238 Infectious Disease 130 226 128 110 111 Internal Medicine 130 1 226 47 128 Interventional Radiology 145 195 76 130 147 Nephrology 130 226 236 128 1 Neurology 130 226 128 204 111 Neurosurgery 130 226 128 111 110 Nuclear Medicine 147 195 145 130 226 Obstetrics/Gynecology 130 226 128 112 113 Oncology/Hematology 130 226 110 128 111 Ophthalmology 12 117 130 226 14 Oral/Maxillofacial Surgery 130 226 128 134 131 Orthopaedic Surgery 130 226 128 238 110 Other MD/DO 130 47 226 317 128 Otolaryngology 130 226 128 111 110 Pathology 99 249 100 395 251 Pediatrics 130 110 128 226 239 Physical Medicine 130 128 226 131 154 Plastic Surgery 130 226 128 112 110 Psychiatry 130 226 134 128 47 Pulmonary Disease 130 226 111 128 110 Radiation Oncology 130 226 110 128 111 Radiology 195 145 146 225 147 Rheumatology 130 226 128 111 236

2015 Physician Quality Reporting System Reporting Experience and Trends
37
Specialty #1 (Top) #2 #3 #4 #5 Thoracic/Cardiac Surgery 226 44 173 130 43 Urology 130 226 128 111 48 Vascular Surgery 130 226 128 204 111
Other Eligible Professionals 130 128 131 226 182 Agencies/Hospitals/Nursing and
Treatment Facilities 130 128 131 154 182
Audiology 130 261 134 111 128 Certified Nurse Midwives 130 226 128 112 134 Chiropractor 131 182 130 128 226 Clinical Nurse Specialists 130 226 128 110 111 Counselor/Psychologist 134 130 226 181 128 Dentist 128 130 131 226 317 Dietitian/Nutritionist 128 130 1 181 226 Nurse Anesthetist 193 76 AQI 12 AQI 7 AQI 11 Nurse Practitioner 130 226 128 317 111 Occupational Therapy 131 130 182 154 128 Optometry 226 117 130 12 14 Other Eligible Professional 130 226 128 317 111 Physical Therapy 131 182 130 154 128 Physician Assistant 317 130 226 128 54 Podiatry 226 163 130 128 111 Registered Nurse 193 130 226 128 317 Social Worker 130 134 226 181 128
Unknown/Missing 130 128 226 131 182 Total 130 226 128 317 131
Notes: (1) Results exclude data for eligible professionals participating as part of a Medicare ACO under the Shared Savings Program or Pioneer ACO Model, and eligible professionals participating through the CPC initiative. (2) Results include the claims, registry, EHR, and QCDR mechanisms.
2015 Physician Quality Reporting System Reporting Experience and Trends
38
V. PQRS PAYMENT ADJUSTMENT In 2017, eligible professionals who are eligible for PQRS but who did not meet the 2015 reporting requirements will be subject to a 2.0 percent payment reduction on all of their Part B Medicare PFS charges. Eligible professionals who are part of a practice that participated via the GPRO will be evaluated at TIN level. Eligible professionals who bill under the CAH II method continue to be potentially subject to the payment adjustment.
To avoid the PQRS payment adjustment for 2017, participants had to meet the criteria described in Section III.C and Table 4. Other reasons for not being subject to the payment adjustment were related to not being eligible for PQRS: not having at least one eligible denominator claim, not meeting the definition of an eligible professional for the 2017 PQRS payment adjustment, not having any PFS charges in 2015, or being part of an independent lab or diagnostic testing facility. Individual eligible professionals or groups participating via GPRO, ACO, or CPC were also able to request an informal review of their downward payment determination between September 26, 2016 and December 7, 2016, for the 2015 PQRS program year; this report presents payment adjustment results that reflect the informal reviews processed by March 29, 2017.
As seen in Table 15, 501,933 eligible professionals in total will be subject to the 2017 PQRS payment adjustment based on their 2015 reporting experience, prior to the final results from informal reviews. This count includes eligible professionals who participated in a Medicare ACO under the Shared Savings Program or Pioneer ACO Model as well as eligible professionals who participated through the CPC Initiative. The majority (79 percent) of eligible professionals who were subject to the adjustment did not submit any PQRS data in 2015. A limited number of eligible professionals subject to the payment adjustment attempted participation but were not successful because they submitted only invalid QDCs, and 21 percent of those subject to the 2017 adjustment were individual participants (compared to 15 percent who were subject to the 2016 payment adjustment) (Table 15).24 It should be noted that the criteria for successful reporting for avoiding the payment adjustment required more in 2015 (for the 2017 payment adjustment) than it did in 2014 (for the 2016 payment adjustment); see Table 4 for details. A total of 10,745 eligible professionals who are subject to the 2017 payment adjustment were part of a practice eligible to report under the GPRO; 7,375 of these were non-participants.
The regional distribution of eligible professionals subject to the 2017 PQRS payment adjustment was similar to the geographical distribution of participants in PQRS in 2015 (Table 15 and Appendix Table A4). As with the 2016 payment adjustment, eligible professionals were more likely to be subject to the payment adjustment if they were part of smaller practices, had lower PFS allowed charges, or had lower beneficiary volume. For example, among eligible professionals receiving the payment adjustment who were eligible for individual participation, 70 percent were in practices with fewer than 25 NPIs; in comparison, for all eligible professionals who were eligible for individual participation in PQRS, only 48 percent were in practices with fewer than 25 NPIs (Appendix Table A4). In particular, solo practitioners
24 Individual participants include any eligible professionals who submitted PQRS data from 1/1/2015 to 12/31/2015 and did not avoid the PQRS payment adjustment for any reason.

2015 Physician Quality Reporting System Reporting Experience and Trends
39
represented 29 percent of those who were eligible to participate as individuals and were subject to the adjustment, but 16 percent of those who were eligible to participate in PQRS as individuals (Table 15).
Table 13: 2015, 2016 and 2017 PQRS Payment Adjustment by Eligible Professional Characteristics
Eligible Professional Characteristics
EPs Subject to 2015
Payment Adjustment
Percent of Total EPs Subject to
2015 Payment Adjustment
EPs Subject to 2016
Payment Adjustment
Percent of Total EPs Subject to
2016 Payment
Adjustment
EPs Subject to 2017
Payment Adjustment
Percent of Total EPs Subject to
2017 Payment Adjustment
Participation Option [a] -- -- -- -- -- -- Non-participants 449,228 98.2% 464,297 83.8% 394,439 78.6% Attempted participation, but were not successful
7,642 1.7% 5,759 1.0% 1,162 0.2%
Individual Participants
359 0.1% 80,761 14.6% 103,123 20.5%
Small GPRO 34 0.0% 130 0.0% 630 0.1% Medium GPRO 0 0.0% 183 0.0% 963 0.2% Large GPRO 88 0.0% 2,169 0.4% 616 0.1% Shared Savings Program ACO
0 0.0% 615 0.1% 1,293 0.3%
Geography (Regions) [b] -- -- -- -- -- -- 1 - Boston 30,521 6.7% 36,770 6.6% 30,871 6.2% 2 - New York 61,307 13.4% 69,332 12.5% 62,290 12.4% 3 - Philadelphia 45,074 9.9% 54,896 9.9% 46,898 9.3% 4 - Atlanta 79,843 17.5% 95,784 17.3% 85,896 17.1% 5 - Chicago 71,863 15.7% 88,044 15.9% 80,942 16.1% 6 - Dallas 47,434 10.4% 59,535 10.7% 56,641 11.3% 7 - Kansas City 19,628 4.3% 28,264 5.1% 23,219 4.6% 8 - Denver 15,471 3.4% 20,510 3.7% 19,480 3.9% 9 - San Francisco 64,985 14.2% 74,502 13.5% 72,690 14.5% 10 - Seattle 19,904 4.4% 26,342 4.8% 23,274 4.6% Unknown 5 0.0% 86 0.0% 41 0.0%
Practice Size (# of NPIs) -- -- -- -- -- -- Individual Participants -- -- -- -- -- --
1 145,747 31.9% 153,997 27.8% 144,721 28.8% 2-4 74,492 16.3% 83,358 15.0% 80,472 16.0% 5-10 57,317 12.5% 63,240 11.4% 60,933 12.1% 11-24 55,683 12.2% 62,294 11.2% 61,772 12.3%

2015 Physician Quality Reporting System Reporting Experience and Trends
40
Eligible Professional Characteristics
EPs Subject to 2015
Payment Adjustment
Percent of Total EPs Subject to
2015 Payment Adjustment
EPs Subject to 2016
Payment Adjustment
Percent of Total EPs Subject to
2016 Payment
Adjustment
EPs Subject to 2017
Payment Adjustment
Percent of Total EPs Subject to
2017 Payment Adjustment
25-50 41,774 9.1% 51,950 9.4% 49,001 9.8% 51-99 30,162 6.6% 43,371 7.8% 39,485 7.9% 100-199 18,728 4.1% 33,372 6.0% 24,084 4.8% 200+ 29,921 6.5% 42,522 7.7% 39,936 8.0%
Group Participants -- -- -- -- -- -- 1-24 486 0.1% 4,444 0.8% 3,973 0.8% 25-50 217 0.0% 2,348 0.4% 2,329 0.5% 51-99 763 0.2% 2,569 0.5% 2,033 0.4% 100-199 1,520 0.3% 3,622 0.7% 1,964 0.4% 200+ 541 0.1% 6,827 1.2% 1,975 0.4%
Total PFS charges per EP -- -- -- -- -- -- Individual Participants -- -- -- -- -- --
less than or equal to $2,500
113,815 24.9% 139,598 25.2% 123,294 24.6%
$2,501 - $10,000 99,694 21.8% 110,800 20.0% 106,283 21.2% $10,001 - $40,000 118,190 25.8% 138,959 25.1% 133,933 26.7% $40,001 - $100,000
60,324 13.2% 74,096 13.4% 72,694 14.5%
over $100,000 61,801 13.5% 70,651 12.8% 64,200 12.8% Group Participants -- -- -- -- -- --
less than or equal to $2,500
689 0.2% 4,427 0.8% 2,539 0.5%
$2,501 - $10,000 684 0.1% 4,038 0.7% 2,426 0.5% $10,001 - $40,000 1,027 0.2% 5,351 1.0% 3,307 0.7% $40,001 - $100,000
683 0.1% 3,427 0.6% 2,014 0.4%
over $100,000 444 0.1% 2,567 0.5% 1,988 0.4% Beneficiary Volume -- -- -- -- -- --
Individual Participants -- -- -- -- -- -- 1-25 195,126 42.7% 222,864 40.2% 193,313 38.5% 26-100 118,255 25.9% 139,232 25.1% 133,716 26.6% 101-200 59,562 13.0% 72,437 13.1% 68,677 13.7% 201+ 80,880 17.7% 98,635 17.8% 104,233 20.8% Unknown 1 0.0% 936 0.2% 465 0.1%
Group Participants -- -- -- -- -- -- 1-25 1,082 0.2% 6,583 1.2% 3,531 0.7%

2015 Physician Quality Reporting System Reporting Experience and Trends
41
Eligible Professional Characteristics
EPs Subject to 2015
Payment Adjustment
Percent of Total EPs Subject to
2015 Payment Adjustment
EPs Subject to 2016
Payment Adjustment
Percent of Total EPs Subject to
2016 Payment
Adjustment
EPs Subject to 2017
Payment Adjustment
Percent of Total EPs Subject to
2017 Payment Adjustment
26-100 965 0.2% 5,283 1.0% 3,253 0.6% 101-200 645 0.1% 3,304 0.6% 1,955 0.4% 201+ 831 0.2% 4,514 0.8% 3,530 0.7% Unknown 4 0.0% 126 0.0% 5 0.0%
Specialty -- -- -- -- -- -- MD/DO -- -- -- -- -- --
Primary Care 78,931 17.3% 96,366 17.4% 82,545 16.4% Surgery 24,646 5.4% 30,508 5.5% 25,130 5.0% Other Specialties 128,435 28.1% 161,370 29.1% 143,336 28.6%
Other Eligible Professionals
-- -- -- -- -- --
Physicians 68,361 14.9% 78,443 14.2% 78,213 15.6% Physician Assistant
23,511 5.1% 28,201 5.1% 24,626 4.9%
Nurses 53,011 11.6% 66,593 12.0% 59,542 11.9% Other Eligible
Professionals 80,454 17.6% 92,433 16.7% 88,535 17.6%
Unknown/Missing 2 0.0% 0 0.0% 6 0.0% Provider Age -- -- -- -- -- --
44 and younger 51,096 11.2% 55,765 10.1% 40,314 8.0% 45 to 54 79,234 17.3% 99,003 17.9% 85,048 16.9% 55 to 65 90,986 19.9% 115,874 20.9% 101,032 20.1% 66 to 80 37,451 8.2% 50,772 9.2% 48,363 9.6% Older than 80 2,078 0.5% 2,870 0.5% 2,804 0.6% Unknown 196,506 43.0% 229,630 41.5% 224,372 44.7%
Total (Unduplicated) 457,351 100.0% 553,914 100.0% 501,933 100.0%
[a] Non-participants include any EPs who did not submit any PQRS data and did not avoid the payment adjustment for any reason. Attempted participation but were not successful means the eligible professional submitted only invalid QDCs and did not avoid the payment adjustment for any other reason. Individual participants include any EPs who submitted PQRS data and did not avoid the payment adjustment for any reason
[b] Regions are defined as follows: Boston (CT, MA, ME, NH, RI, VT); New York (NJ, NY, PR, VI); Philadelphia (DC, DE, MD, PA, VA, WA); Atlanta (AL, FL, GA, KY, MS, NC, SC, TN); Chicago (IL, IN, MI, MN, OH, WI); Dallas (AR, LA, NM, OK, TX); Kansas City (IA, KS, MO, NE); Denver (CO, MT, ND, SD, UT, WY); San Francisco (AZ, CA, HI, NV); and Seattle (AK, ID, OR, WA). Some eligible professionals submitted claims through multiple regions; consequently, sums across categories within the Geography results do not

2015 Physician Quality Reporting System Reporting Experience and Trends
42
equal totals. Information about the RRB carrier is not displayed due to the RRB not being based on the geographical location of the eligible professional.
Notes:(1) Results include eligible professionals participating in a Medicare ACO that participates under the Shared Savings Program or Pioneer ACO Model as well as eligible professionals participating under the CPC Initiative. (2) Individual Participants exclude TIN/NPIs that are part of a Medicare ACO participating under the Shared Savings Program Model.
The number of eligible professionals subject to the 2017 payment adjustment represents 38 percent of the 1,307,528 eligible professionals who did not automatically avoid the adjustment because they did not meet the CMS definition for eligible professionals subject to the payment adjustment (data not shown). Eligible professionals who were MD/DOs were less likely than those in non-MD/DO specialties to be subject to the 2017 payment adjustment based on 2015 reporting (see Table 16). For example, 32 percent of MD/DOs are subject to the payment adjustment compared to 49 percent of non-MD/DOs.

2015 Physician Quality Reporting System Reporting Experience and Trends
43
Table 14: 2015, 2016, and 2017 PQRS Payment Adjustment, by Specialty
Specialty EPs Subject to 2015 Payment
Adjustment
Percent of EPs Subject to 2015
Payment Adjustment
EPs Subject to 2016 Payment
Adjustment
Percent of EPs Subject to 2016
Payment Adjustment
EPs Subject to 2017 Payment
Adjustment
Percent of EPs Subject to 2017
Payment Adjustment
MD/DO 232,012 31.8% 288,244 36.6% 251,011 31.6% Allergy/ Immunology
1,918 49.6% 2,089 52.5% 1,829 45.9%
Anesthesiology 10,759 22.7% 14,960 30.4% 14,236 28.5% Cardiology 6,747 24.0% 8,442 26.4% 6,308 20.2% Colon/Rectal Surgery
407 30.0% 472 32.2% 366 24.4%
Critical Care 931 31.8% 1,151 35.1% 967 28.6% Dermatology 4,287 36.0% 4,604 36.9% 4,508 35.3% Emergency Medicine
11,445 19.0% 18,394 28.2% 18,316 27.4%
Endocrinology 1,586 25.5% 2,048 30.1% 1,583 23.8% Family Practice 37,067 35.3% 46,333 40.6% 38,176 33.5% Gastroenterology 3,803 27.3% 4,896 32.2% 3,721 24.5% General Practice 3,887 63.9% 4,592 72.0% 4,194 65.9% General Surgery 8,634 34.9% 10,665 39.4% 8,658 31.8% Geriatrics 1,649 35.1% 1,873 38.4% 1,427 31.0% Hand Surgery 710 36.9% 910 41.6% 746 33.8% Infectious Disease 2,273 34.9% 2,585 37.1% 2,144 30.4% Internal Medicine 34,708 31.5% 41,157 35.4% 36,384 30.6% Interventional Radiology
398 19.4% 675 28.6% 717 27.7%
Nephrology 2,660 27.3% 3,427 31.4% 2,760 25.2% Neurology 4,709 31.1% 5,809 34.7% 4,808 28.6% Neurosurgery 1,636 31.7% 2,229 38.2% 1,843 31.5% Nuclear Medicine 214 30.1% 239 31.6% 163 22.5%

2015 Physician Quality Reporting System Reporting Experience and Trends
44
Specialty EPs Subject to 2015 Payment
Adjustment
Percent of EPs Subject to 2015
Payment Adjustment
EPs Subject to 2016 Payment
Adjustment
Percent of EPs Subject to 2016
Payment Adjustment
EPs Subject to 2017 Payment
Adjustment
Percent of EPs Subject to 2017
Payment Adjustment
Obstetrics/ Gynecology
15,185 43.8% 16,315 44.5% 13,480 36.8%
Oncology/ Hematology
2,572 19.5% 3,672 24.9% 2,693 18.6%
Ophthalmology 5,637 27.5% 7,351 34.0% 7,591 35.2% Oral/Maxillofacial Surgery
288 71.3% 328 72.2% 310 69.7%
Orthopaedic Surgery
8,094 34.6% 10,180 39.4% 8,311 32.4%
Other MD/DO 4,717 36.1% 5,925 39.6% 5,649 35.8% Otolaryngology 3,537 36.4% 4,240 40.8% 3,587 34.7% Pathology 1,555 14.4% 1,891 16.0% 2,542 20.5% Pediatrics 3,269 31.8% 4,284 33.9% 3,791 31.5% Physical Medicine 4,275 46.2% 4,885 49.6% 4,277 43.8% Plastic Surgery 2,839 59.6% 3,092 60.4% 2,792 54.6% Psychiatry 21,634 66.9% 23,641 70.7% 21,553 64.0% Pulmonary Disease
3,350 29.1% 4,166 32.5% 3,283 25.7%
Radiation Oncology
1,251 24.3% 1,591 28.8% 1,196 21.6%
Radiology 7,326 18.3% 10,932 25.5% 9,737 22.2% Rheumatology 1,218 24.6% 1,657 30.0% 1,210 21.9% Thoracic/Cardiac Surgery
931 22.0% 1,243 27.4% 923 20.6%
Urology 2,799 26.7% 3,912 33.1% 3,051 26.8% Vascular Surgery 1,107 30.0% 1,389 34.6% 1,181 28.7%
Other Eligible Professionals
225,336 50.7% 264,831 55.0% 250,916 48.9%

2015 Physician Quality Reporting System Reporting Experience and Trends
45
Specialty EPs Subject to 2015 Payment
Adjustment
Percent of EPs Subject to 2015
Payment Adjustment
EPs Subject to 2016 Payment
Adjustment
Percent of EPs Subject to 2016
Payment Adjustment
EPs Subject to 2017 Payment
Adjustment
Percent of EPs Subject to 2017
Payment Adjustment
Agencies/Hospitals/Nursing and Treatment Facilities
57 38.5% 18 12.6% 23 45.1%
Audiology 3,502 48.1% 4,252 57.5% 3,373 45.1% Certified Nurse Midwives
698 34.2% 798 33.4% 662 25.0%
Chiropractor 36,515 77.8% 37,082 80.3% 34,514 75.4% Clinical Nurse Specialists
1,485 54.0% 1,644 55.2% 1,499 48.1%
Counselor/ Psychologist
25,483 75.8% 27,778 81.8% 26,528 77.4%
Dentist 2,633 84.9% 2,570 83.7% 2,490 82.2% Dietitian/ Nutritionist
1,824 57.8% 1,813 55.6% 1,707 48.1%
Nurse Anesthetist 16,239 31.2% 19,408 35.0% 15,121 25.7% Nurse Practitioner 34,530 41.8% 44,734 44.9% 42,189 37.2% Occupational Therapy
2,523 44.5% 3,054 47.9% 3,215 49.3%
Optometry 20,300 58.5% 25,616 71.6% 29,479 81.0% Other Eligible Professional
1,998 48.1% 1,525 43.2% 1,750 43.1%
Physical Therapy 16,011 34.7% 21,735 42.5% 20,401 38.9% Physician
Assistant 23,511 35.0% 28,201 37.2% 24,626 29.2%
Podiatry 8,913 48.9% 13,175 69.7% 11,730 61.9% Registered Nurse 59 43.7% 9 10.0% 71 46.7% Social Worker 29,055 85.2% 31,419 88.1% 31,538 83.5%
Unknown/Missing 3 9.1% 839 56.4% 6 17.6%

2015 Physician Quality Reporting System Reporting Experience and Trends
46
Specialty EPs Subject to 2015 Payment
Adjustment
Percent of EPs Subject to 2015
Payment Adjustment
EPs Subject to 2016 Payment
Adjustment
Percent of EPs Subject to 2016
Payment Adjustment
EPs Subject to 2017 Payment
Adjustment
Percent of EPs Subject to 2017
Payment Adjustment
Total 457,351 38.9% 553,914 43.6% 501,933 38.4%
Notes: Results include eligible professionals who were part of a practice that participated under the PQRS GPRO, eligible professionals participating as part of a Medicare ACO participating under the Shared Savings Program or the Pioneer ACO Model, and eligible professionals participating through the CPC initiative.

2015 Physician Quality Reporting System Reporting Experience and Trends
47
Table 15: Eligible Professionals Avoiding the 2017 PQRS Payment Adjustment
Method of Participation Eligible Count Participating Count
Participation Rate
Individual Participants 616,904 593,653 96.23% GPRO 297,619 295,215 99.19% Pioneer ACO 18,755 18,755 100.00% Shared Savings Program ACO
205,648 205,566 99.96%
CPC 2,054 1,954 95.13% Total 856,758 832,607 97.18%
Notes on Table 17: (1) This table provides an unduplicated count of eligible professionals avoiding the PQRS payment adjustment, including CAH II eligible professionals.
Table 18 provides more detail on how eligible professionals and practices avoided the 2015, 2016 and 2017 PQRS payment adjustments. Eligible professionals participating individually avoided the 2017 PQRS.
payment adjustment most often by reporting the required data (86 percent of those avoiding the adjustment), as seen in the rightmost column of Table 18, which applies a hierarchy to reasons for avoidance from top to bottom so each reason is represented as mutually exclusive. About 10 percent of individual eligible professionals avoided the adjustment because they did not meet the definition of an eligible professional for the 2017 PQRS payment adjustment, had no 2015 PFS charges, or did not have at least one denominator-eligible claim. Finally, four percent avoided the 2017 adjustment after an informal review. Among eligible professionals who were part of a practice reporting under the GPRO, 89 percent of those avoiding the adjustment did so because the practice met reporting requirements, while only four percent avoided the adjustment because they did not meet the definition of an eligible professional for the purposes of the 2017 PQRS Payment Adjustment, and three percent did so based on informal review. Among those in an Shared Savings Program ACO, 91 percent avoided the adjustment by meeting reporting requirements while among those in Pioneer ACOs, 58 percent of eligible professionals avoided the adjustment by meeting reporting requirements (note that these figures are based on the application of the hierarchy and all Pioneer participants were successful reporters).
Table 18 also highlights that eligible professionals met multiple conditions to avoid the adjustment. For example, 19,041 individually-participating eligible professionals in total avoided the 2017 adjustment because they did not have at least one denominator eligible claim, but 17,451 of these also did not meet the definition of an eligible professional for the PQRS payment adjustment or did not have PFS charges, and therefore only 1,590 are counted as avoiding the payment adjustment because they did not have at least one denominator eligible claim after applying the hierarchy used in the right-most column of the table. Many eligible professionals who met the reporting requirements also met one of the other conditions for avoiding the adjustment, especially among individual eligible professionals, those reporting under the GPRO, and those in an ACO participating under the Shared Savings Program.

2015 Physician Quality Reporting System Reporting Experience and Trends
48
Table 16: How Eligible Professionals Avoided the 2015, 2016 and 2017 PQRS Payment Adjustments, in Total and by Hierarchy
Reason for Avoiding Payment Adjustment EPs Avoiding 2015 Payment Adjustment,
Total
EPs Avoiding 2015 Payment Adjustment,
After Hierarchy
EPs Avoiding 2016 Payment Adjustment,
Total
EPs Avoiding 2016 Payment Adjustment,
After Hierarchy
EPs Avoiding 2017 Payment Adjustment,
Total
EPs Avoiding 2017 Payment Adjustment,
After Hierarchy
Individual Participants 388,196 388,196 341,439 341,439 616,904 616,904
Did Not Meet the Definition of an Eligible Professional for the PQRS Payment Adjustment
65,724 65,724 36,317 36,317 43,256 43,256
Did Not Have MPFS Charges 36,221 6,048 6,755 6,746 17,412 16,352
Did Not Have at least 1 Denominator Eligible Claim
6,378 474 20,583 14,049 19,041 1,590
Member of an Independent Lab or Diagnostic Testing Facility
N/A N/A N/A N/A 558 535
Elected Administrative Claims 1,083 1,034 N/A N/A N/A N/A
Met Reporting Requirements 322,296 303,319 295,615 270,947 563,680 530,000
Informal Review 11,597 11,597 13,406 13,380 25,171 25,171
GPRO 305,250 305,250 263,624 263,624 297,619 297,619
Did Not Meet the Definition of an Eligible Professional for the PQRS Payment Adjustment
9,899 9,899 9,422 9,422 10,521 10,521
Did Not Have MPFS Charges 1,539 1,357 14 13 0 0
Did Not Have at least 1 Denominator Eligible Claim
7,430 5,819 173 173 15,499 14,757
Member of an Independent Lab or Diagnostic Testing Facility
N/A N/A N/A N/A 429 397

2015 Physician Quality Reporting System Reporting Experience and Trends
49
Reason for Avoiding Payment Adjustment EPs Avoiding 2015 Payment Adjustment,
Total
EPs Avoiding 2015 Payment Adjustment,
After Hierarchy
EPs Avoiding 2016 Payment Adjustment,
Total
EPs Avoiding 2016 Payment Adjustment,
After Hierarchy
EPs Avoiding 2017 Payment Adjustment,
Total
EPs Avoiding 2017 Payment Adjustment,
After Hierarchy
Elected Administrative Claims 172,336 164,646 N/A N/A N/A N/A
Met Reporting Requirements 214,893 121,950 242,136 234,392 287,183 263,631
Informal Review 1,580 1,579 19,645 19,624 8,313 8,313
Pioneer ACO 17,743 17,743 24,144 24,144 18,755 18,755
Did Not Meet the Definition of an Eligible Professional for the PQRS Payment Adjustment
697 697 538 538 825 825
Did Not Have MPFS Charges 5,842 5,631 9,521 9,521 7,126 6,802
Did Not Have at least 1 Denominator Eligible Claim
6,108 260 9,521 0 7,441 311
Member of an Independent Lab or Diagnostic Testing Facility
N/A N/A N/A N/A 1 0
Elected Administrative Claims 0 0 N/A N/A N/A N/A
Met Reporting Requirements 17,743 11,155 24,144 14,085 18,755 10,817
Informal Review 0 0 0 0 0 0
Shared Savings Program ACO 85,059 85,059 139,408 139,408 205,648 205,648
Did Not Meet the Definition of an Eligible Professional for the PQRS Payment Adjustment
2,899 2,899 4,584 4,584 6,340 6,340
Did Not Have MPFS Charges 0 0 24 24 0 0
Did Not Have at least 1 Denominator Eligible Claim
3,766 3,606 89 89 11,945 11,478

2015 Physician Quality Reporting System Reporting Experience and Trends
50
Reason for Avoiding Payment Adjustment EPs Avoiding 2015 Payment Adjustment,
Total
EPs Avoiding 2015 Payment Adjustment,
After Hierarchy
EPs Avoiding 2016 Payment Adjustment,
Total
EPs Avoiding 2016 Payment Adjustment,
After Hierarchy
EPs Avoiding 2017 Payment Adjustment,
Total
EPs Avoiding 2017 Payment Adjustment,
After Hierarchy
Member of an Independent Lab or Diagnostic Testing Facility
N/A N/A N/A N/A 99 89
Elected Administrative Claims 0 0 N/A N/A N/A N/A
Met Reporting Requirements 85,059 78,554 139,214 134,635 205,445 187,721
Informal Review 0 0 76 76 58 20
CPC 1,221 1,221 1,096 1,096 2,054 2,054
Did Not Meet the Definition of an Eligible Professional for the PQRS Payment Adjustment
15 15 12 12 10 10
Did Not Have MPFS Charges 107 104 93 91 123 121
Did Not Have at least 1 Denominator Eligible Claim
111 4 34 7 125 2
Member of an Independent Lab or Diagnostic Testing Facility
N/A N/A N/A N/A 2 2
Elected Administrative Claims 171 168 N/A N/A N/A N/A
Met Reporting Requirements 1,109 901 995 956 1,919 1,873
Informal Review 29 29 30 30 46 46
Total 796,248 796,248 768,615 768,615 856,758 856,758
Notes: (1) The "Total" columns of data provide total counts of eligible professionals who avoided the PQRS payment adjustment for the reason cited; the "After Hierarchy" columns of data provide an unduplicated count of eligible professionals avoiding the PQRS payment adjustment based on the application of a hierarchy of exemption reasons in the order given. (2) Eligible professionals (TIN/NPI) in the Pioneer finder file and TINs on the Shared Savings Program ACO finder file are used to identify EPs eligible for these programs. (3) Administrative claims was only an option in program year 2013 (2015 payment adjustment) and does not apply to program years 2014 (2016 payment adjustment) or 2015 (2017 payment adjustment).

2015 Physician Quality Reporting System Reporting Experience and Trends
51
VI. CLINICAL PERFORMANCE RATES Although PQRS focuses on reporting of quality data by eligible professionals, clinical performance rates that use quality data submitted through the program can also be used to evaluate the quality of care provided to Medicare beneficiaries, and were used as part of the Physician Value-Based Payment Modifier (Value Modifier) Program beginning in 2015, based on performance in the 2013 performance year. Eligible professionals reported data on recommended quality actions that were performed, not performed, or did not apply (i.e., exclusions) on eligible instances; this information is used in this report to describe eligible professionals’ clinical performance on measures. Performance on a measure was calculated as the number of times the eligible professional reported that the recommended quality action for that measure was performed (numerator), divided by the number of instances they could have performed the quality action (denominator), multiplied by 100. For example, under claims-based reporting options, the numerator was the number of times the eligible professional reported the measure-specific QDC indicating the quality action was met and the denominator was the number of eligible instances for that measure identified through claims. Instances that did not apply (i.e., reported as exclusions) were excluded from performance rate calculations.
The following hierarchy was applied if an eligible professional participated through more than one reporting mechanism: (1) QCDR, (2) EHR (QRDA III, then QRDA I)25, (3) claims, and (4) registry. The hierarchy ensured only one performance rate for each measure for an eligible professional is displayed in results.
This report also presents data on measure performance trends; however, multiple factors should be considered when interpreting performance trends in this report. For example, there have been many changes within PQRS across program years. As described above, the participation options have been changed and refined. Individual measures have been added, removed, and in some cases their definitions have changed. Moreover, the eligible professionals who participated each year change, and there has been a shift from individual to group reporting. As a result, it is unclear the extent to which any observed changes in measure performance were artifacts of the aforementioned changes or trends in provided care.
Nonetheless, this section of the report aims to describe clinical performance rates and trends. The appendix contains detailed tables on reporting and performance rates; please refer to Appendix Tables A1 and A2 for the full name of measures in these tables. Appendix Table A16 provides eligibility and reporting information across program years for individual measures.
25 EHR performance rates of zero percent have been excluded. CMS has found that the EHR method of reporting has a high instance of zero percent performance rates. We believe this has to do with EHR functionality and submission that can result in a measure being submitted for an EP who did not intend to report the measure. These instances do not give an accurate reflection of performance and are notcomparable to other reporting methods where we are certain that an EP has intended to report the measure. Due to our concerns with the reliability of the EHR data for performance measurement, our policy has been to suppress the zero percent performance rates for PQRS measures in our public facing reports until we are more confident with the accuracy of the performance data

2015 Physician Quality Reporting System Reporting Experience and Trends
52
Appendix Table A19 presents the average number of reported instances and the average performance rate by measure for 2012 through 2015. To provide more context on cohort effects, Appendix Table A20 shows the number of eligible professionals who consistently reported measures across successive program years. Appendix Tables A21 through A23 also provide total counts and performance rates for eligible professionals who reported a measure for two, three or four consecutive years. These tables can provide context for changes in measure performance rates related to how constant the cohort reporting a measure has been over time.
Tables 19 and 20 display the measures with the largest percentage point decline and improvement in performance between 2012 and 2015, among eligible professionals who reported the measure for all four years (2012 to 2015). While this approach attempts to account for changes in participating eligible professionals, it does not account for other changes. For example, trends in reporting mechanisms— such as a growth in EHR reporting or a measure changing to/from registry reporting only—could cause performance rates to change. Other examples of changes to measures include the addition of new exclusions or changes in thresholds used to define clinical control of a condition. Registries, in some cases, incorporate processes that support eligible professionals’ selection of appropriate measures, edits that help to ensure that measures are submitted accurately, and reminders that help providers meet the performance criteria of the measures. In addition, performance rates may be less stable among measures with smaller reporting populations, as is the case with a number of the measures in the following tables.
The decrease in performance rates shown in Table 19 could be attributed to a change in the measure specifications; measure 317 started as simply screening for high blood pressure and was expanded in 2013 to include documentation of a follow-up plan. Measure 18 had a change in available reporting mechanisms; both claims and registry reporting were no longer available for this measure starting in 2015. Table 20 presents the five measures with the largest improvement in performance. These measures appeared to remain stable for the four program years analyzed and they did not receive any major revisions, although claims reporting was no longer available for measure 122 starting in 2015; this could suggest a genuine improvement in performance, although the number of eligible professionals reporting this measure consistently over the four year period is rather low.
Table 17: Individual Measures Reported with the Largest Percentage Point Decrease in Clinical Performance Rate (2012 to 2015)
Rank Measure Number
Measure Description 2012 Performance
Rate
2015 Performance
Rate
EPs Reporting the Measure in each year from 2012 to
2015
Percentage Point Change
2012-2015
1 317 Preventive Care and Screening: Screening for High Blood Pressure and Follow-Up Documented
97.5% 57.1% 2,840 40.4%
2 18 Diabetic Retinopathy: Documentation of Presence or Absence of Macular Edema and Level of Severity of Retinopathy
96.8% 59.0% 1,823 37.8%
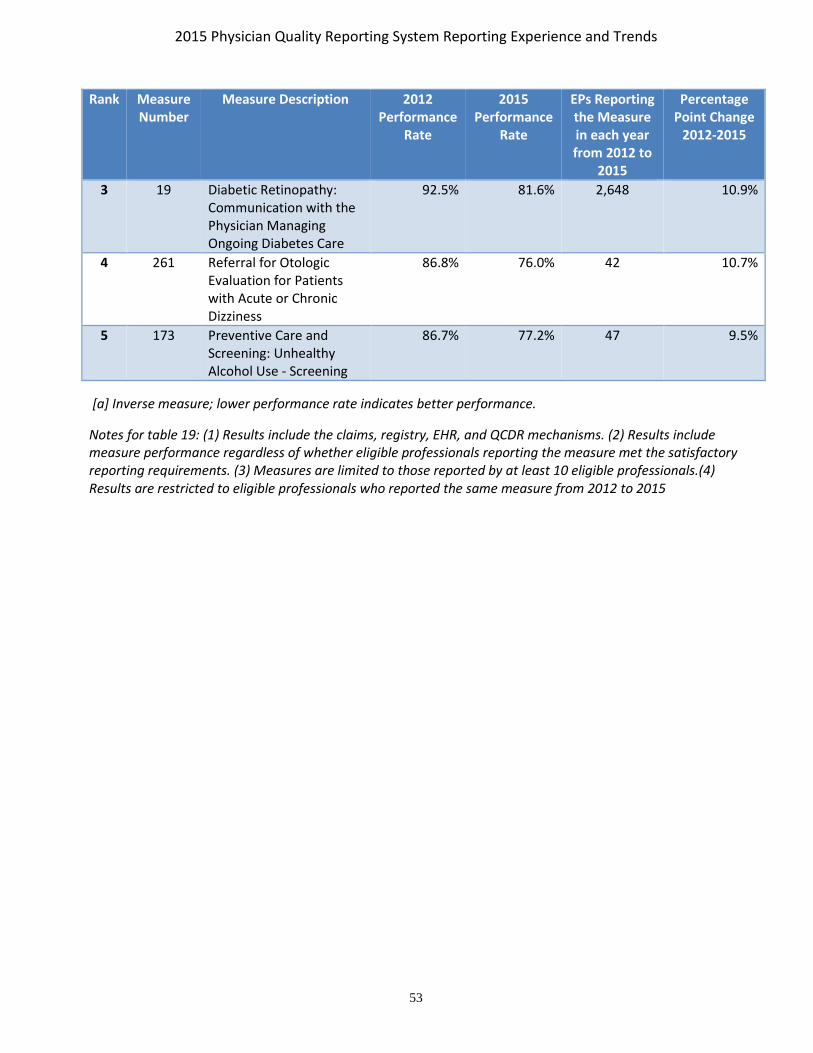
2015 Physician Quality Reporting System Reporting Experience and Trends
53
Rank Measure Number
Measure Description 2012 Performance
Rate
2015 Performance
Rate
EPs Reporting the Measure in each year from 2012 to
2015
Percentage Point Change
2012-2015
3 19 Diabetic Retinopathy: Communication with the Physician Managing Ongoing Diabetes Care
92.5% 81.6% 2,648 10.9%
4 261 Referral for Otologic Evaluation for Patients with Acute or Chronic Dizziness
86.8% 76.0% 42 10.7%
5 173 Preventive Care and Screening: Unhealthy Alcohol Use - Screening
86.7% 77.2% 47 9.5%
[a] Inverse measure; lower performance rate indicates better performance.
Notes for table 19: (1) Results include the claims, registry, EHR, and QCDR mechanisms. (2) Results include measure performance regardless of whether eligible professionals reporting the measure met the satisfactory reporting requirements. (3) Measures are limited to those reported by at least 10 eligible professionals.(4) Results are restricted to eligible professionals who reported the same measure from 2012 to 2015

2015 Physician Quality Reporting System Reporting Experience and Trends
54
Table 18: Individual Measures Reported with the Largest Increase in Clinical Performance Rate (2012 to 2015)
Rank Measure Number
Measure Description 2012 Performance
Rate
2015 Performance
Rate
EPs Reporting the Measure in each year from 2012 to
2015
Percentage Point
Change 2012-2015
1 219 Functional Deficit: Change in Risk-Adjusted Functional Status for Patients with Lower Leg, Foot or Ankle Impairments
38.7% 88.0% 162 49.3%
2 222 Functional Deficit: Change in Risk-Adjusted Functional Status for Patients with Elbow, Wrist or Hand Impairments
52.7% 89.7% 45 37.0%
3 220 Functional Deficit: Change in Risk-Adjusted Functional Status for Patients with Lumbar Spine Impairments
55.8% 89.6% 258 33.8%
4 223 Functional Deficit: Change in Risk-Adjusted Functional Status for Patients with Neck, Cranium, Mandible, Thoracic Spine, Ribs, or Other General Orthopedic Impairments
53.4% 87.0% 170 33.6%
5 122 Adult Kidney Disease: Blood Pressure Management
48.1% 79.4% 43 31.3%
[a] Inverse measure; lower performance rate indicates better performance.
Notes: (1) Results include the claims, registry, EHR, and QCDR mechanisms. (2) Results include measure performance regardless of whether eligible professionals reporting the measure met the satisfactory reporting requirements. (3) Measures are limited to those reported by at least 10 eligible professionals.(4) Results are restricted to eligible professionals who reported the same measure from 2012 to 2015.
For some measures, improvement in measure performance over time was limited by measure performance that ‘topped out.’ In other words, if performance is at or near 100 percent, the ability to improve performance is limited. Table 21 displays the measures—mostly QCDR non-PQRS measures— with the highest mean clinical performance rates in 2015.

2015 Physician Quality Reporting System Reporting Experience and Trends
55
Table 19: Individual Measures Reported with the Highest Mean Clinical Performance Rates (2015)
Rank Measure Number
Measure Description Mean Performance
Rate
EPs Submitting
1 359 Optimizing Patient Exposure to Ionizing Radiation: Utilization of a Standardized Nomenclature for Computerized Tomography (CT) Imaging Description
100.0% 122
2 362 Optimizing Patient Exposure to Ionizing Radiation: Computed Tomography (CT) Images Available for Patient Follow-up and Comparison Purposes
100.0% 94
3 363 Optimizing Patient Exposure to Ionizing Radiation: Search for Prior Computed Tomography (CT) Imaging Studies Through a Secure, Authorized, Media-Free, Shared Archive
100.0% 34
4 ABG 12 Anesthesia: Patient Experience Survey 100.0% 87 5 ABG 13 Malignant Hyperthermia [a] 0.0% 38 6 ABG 14 Corneal Abrasion [a] 0.0% 33 7 ABG 5 Composite Procedural Safety for All Vascular Access
Procedures [a] 0.0% 73
8 ABG 8 Use of Checklist for Transfer of Care From Anesthesia Provider
100.0% 104
9 ABG 9 OR Fire [a] 0.0% 143 10 AGACCSSR
4 Performance of Upper Endoscopic Examination With Colonoscopy
100.0% 11
11 IRIS 6 Acquired Involutional Entropion: Normalization of Eyelid Position within 90 Days Following Surgery for Acquired Involutional Entropion
100.0% 12
12 MUSIC 3 Prostate Cancer: Avoidance of Overuse of CT Scan for Staging Low Risk Prostate Cancer Patients:
100.0% 20
13 PInc 21 Thrombolytic Therapy 100.0% 42 14 THPSO 4 Pneumothorax rate as a complication of central line
placement [a] 0.0% 164
15 THPSO 12 Respiratory Arrest in PACU rate [a] 0.0% 917 16 THPSO 11 Post-obstructive Pulmonary Edema rate following
endo-tracheal intubation [a] 0.0% 1,118
17 THPSO 3 Perioperative Peripheral Nerve Injury rate [a] 0.0% 915 18 ABG 7 Immediate Adult Post-Operative Pain Management 100.0% 71 19 GIQIC 5 Incidence of perforation [a] 0.0% 1,082 20 THPSO 8 New perioperative central neurologic deficit [a] 0.0% 931 21 ABG 3 Total Perioperative Mortality Rate [a] 0.0% 143 22 THPSO 6 Perioperative Myocardial Infarction rate in low risk
patients [a] 0.0% 905
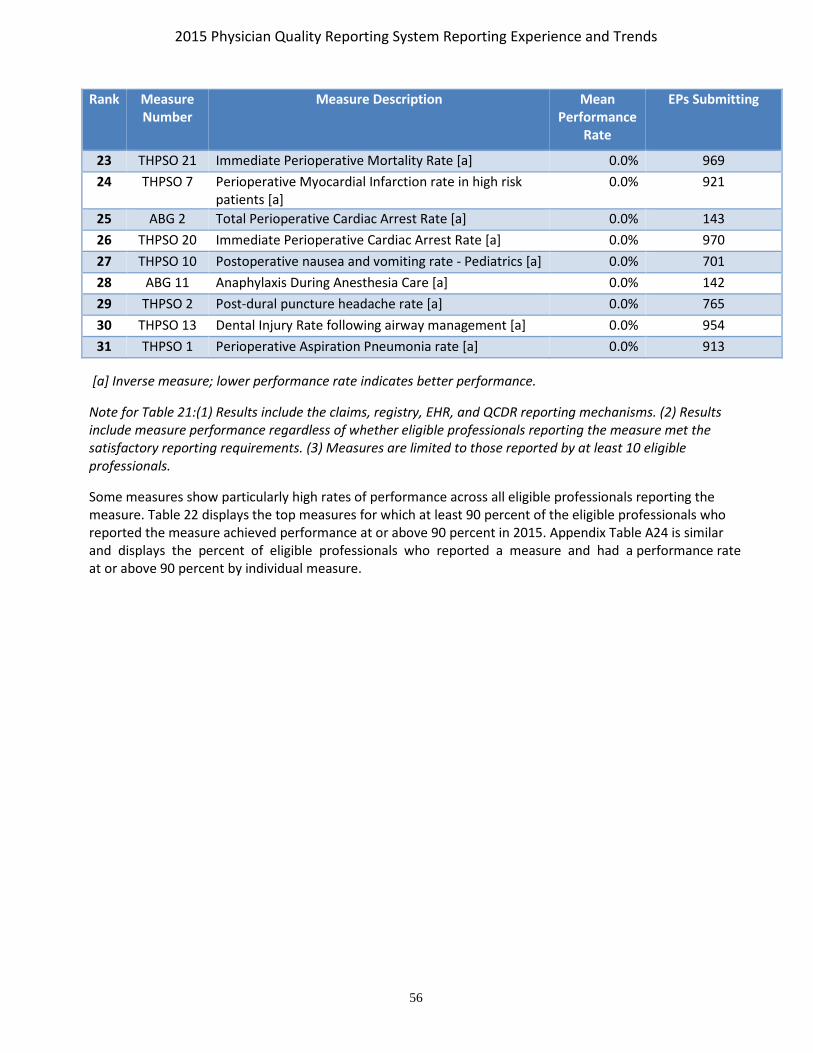
2015 Physician Quality Reporting System Reporting Experience and Trends
56
Rank Measure Number
Measure Description Mean Performance
Rate
EPs Submitting
23 THPSO 21 Immediate Perioperative Mortality Rate [a] 0.0% 969 24 THPSO 7 Perioperative Myocardial Infarction rate in high risk
patients [a] 0.0% 921
25 ABG 2 Total Perioperative Cardiac Arrest Rate [a] 0.0% 143 26 THPSO 20 Immediate Perioperative Cardiac Arrest Rate [a] 0.0% 970 27 THPSO 10 Postoperative nausea and vomiting rate - Pediatrics [a] 0.0% 701 28 ABG 11 Anaphylaxis During Anesthesia Care [a] 0.0% 142 29 THPSO 2 Post-dural puncture headache rate [a] 0.0% 765 30 THPSO 13 Dental Injury Rate following airway management [a] 0.0% 954 31 THPSO 1 Perioperative Aspiration Pneumonia rate [a] 0.0% 913
[a] Inverse measure; lower performance rate indicates better performance.
Note for Table 21:(1) Results include the claims, registry, EHR, and QCDR reporting mechanisms. (2) Results include measure performance regardless of whether eligible professionals reporting the measure met the satisfactory reporting requirements. (3) Measures are limited to those reported by at least 10 eligible professionals.
Some measures show particularly high rates of performance across all eligible professionals reporting the measure. Table 22 displays the top measures for which at least 90 percent of the eligible professionals who reported the measure achieved performance at or above 90 percent in 2015. Appendix Table A24 is similar and displays the percent of eligible professionals who reported a measure and had a performance rate at or above 90 percent by individual measure.

2015 Physician Quality Reporting System Reporting Experience and Trends
57
Table 20: Individual Measures Where at least 90 Percent of Submitting EPs had at least a 90 Percent Performance Rate on the Measure (2015)
Measure Number Measure Description Percent of EPs with At Least 90% Performance
Rate
258 Rate of Open Repair of Small or Moderate Non-Ruptured Abdominal Aortic Aneurysms (AAA) without Major Complications (Discharged to Home by Post-Operative Day #7)
100.0%
327 Pediatric Kidney Disease: Adequacy of Volume Management 100.0%
335 Maternity Care: Elective Delivery or Early Induction Without Medical Indication at >= 37 and < 39 Weeks
100.0%
336 Maternity Care: Post-Partum Follow-Up and Care Coordination 100.0%
348 HRS-3: Implantable Cardioverter-Defibrillator (ICD) Complications Rate [a] 100.0%
359 Optimizing Patient Exposure to Ionizing Radiation: Utilization of a Standardized Nomenclature for Computerized Tomography (CT) Imaging Description
100.0%
362 Optimizing Patient Exposure to Ionizing Radiation: Computed Tomography (CT) Images Available for Patient Follow-up and Comparison Purposes
100.0%
363 Optimizing Patient Exposure to Ionizing Radiation: Search for Prior Computed Tomography (CT) Imaging Studies Through a Secure, Authorized, Media-Free, Shared Archive
100.0%
386 Amyotrophic Lateral Sclerosis (ALS) Patient Care Preferences 100.0%
392 HRS-12: Cardiac Tamponade and/or Pericardiocentesis Following Atrial Fibrillation Ablation [a] 100.0%
393 HRS-9: Infection within 180 Days of Cardiac Implantable Electronic Device (CIED) Implantation, Replacement, or Revision [a]
100.0%
AAAAI 10 Documentation of the Consent Process for Subcutaneous Allergen Immunotherapy in the Medical Record
100.0%
AAAAI 7 Documented Rationale to Support Long-Term Aeroallergen Immunotherapy Beyond Five Years, as Indicated
100.0%
ABG 1 Anesthesia Safety in the Peri-Operative Period 100.0%

2015 Physician Quality Reporting System Reporting Experience and Trends
58
Measure Number Measure Description Percent of EPs with At Least 90% Performance
Rate
ABG 11 Anaphylaxis During Anesthesia Care [a] 100.0%
ABG 12 Anesthesia: Patient Experience Survey 100.0%
ABG 13 Malignant Hyperthermia [a] 100.0%
ABG 14 Corneal Abrasion [a] 100.0%
ABG 2 Total Perioperative Cardiac Arrest Rate [a] 100.0%
ABG 3 Total Perioperative Mortality Rate [a] 100.0%
ABG 5 Composite Procedural Safety for All Vascular Access Procedures [a] 100.0%
ABG 7 Immediate Adult Post-Operative Pain Management 100.0%
ABG 8 Use of Checklist for Transfer of Care From Anesthesia Provider 100.0%
ABG 9 OR Fire [a] 100.0%
ACRad 14 Participation in a National Dose Index Registry 100.0%
ACRad 20 CT IV Contrast Extravasation Rate (Low Osmolar Contrast Media) [a] 100.0%
ACRad 23 Lung Cancer Screening Abnormal Interpretation Rate [a] 100.0%
ACS 10 Risk Standardized Decubitus Ulcer Rate within 30 Days Following Operation [a] 100.0%
ACS 2 Discontinuation of Prophylactic Antibiotics in Abdominal Trauma 100.0% ACS 4 Prevention of Central Venous Catheter (CVC) - Related Bloodstream Infections in Elective CVC
Insertions following Trauma 100.0%
ACS 6 Documentation of Glasgow Coma Score at Time of Initial Evaluation 100.0%
AGACCSSR 2 Colonoscopy Assessment (Cecum reached) - Cecal Intubation / Depth of Intubation 100.0%
AGACCSSR 3 Hospital Visit Rate After Outpatient Colonoscopy [a] 100.0%
AGACCSSR 4 Performance of Upper Endoscopic Examination With Colonoscopy 100.0%
AGACCSSR 5 Unnecessary Screening Colonoscopy in Older Adults [a] 100.0%
ASBS 3 Specimen orientation for partial mastectomy or excisional breast biopsy 100.0%

2015 Physician Quality Reporting System Reporting Experience and Trends
59
Measure Number Measure Description Percent of EPs with At Least 90% Performance
Rate
ASNC 1 Cardiac Stress Nuclear Imaging Not Meeting Appropriate Use Criteria: Preoperative Evaluation in Low Risk Surgery Patients [a]
100.0%
ASNC 10 Nuclear cardiology imaging studies terminated due to technical problems [a] 100.0%
ASNC 2 Cardiac Stress Nuclear Imaging Not Meeting Appropriate Use Criteria: Routine Testing After Percutaneous Coronary Intervention (PCI) [a]
100.0%
ASNC 3 Cardiac Stress Nuclear Imaging Not Meeting Appropriate Use Criteria: Testing in Asymptomatic, Low-Risk Patients [a]
100.0%
ASNC 4 Utilization of standardized nomenclature and reporting for nuclear cardiology imaging studies 100.0%
ASNC 7 Nuclear cardiac stress imaging not meeting appropriate use criteria [a] 100.0%
ASNC 9 Physician reader is CBNC certified in nuclear cardiology 100.0%
ECPR 17 Three Day All Cause Return ED Visit Rate with Placement Into Inpatient or Observation Status on Re-Visit [a]
100.0%
GIQIC 5 Incidence of perforation [a] 100.0%
GIQIC 8 Age appropriate screening colonoscopy [a] 100.0%
IRIS 18 Chronic Anterior Uveitis: Post-treatment visual acuity 100.0%
IRIS 5 Acquired Involutional Ptosis: Improvement of Marginal Reflex Distance within 90 Days Following Surgery for Acquired Involutional Ptosis
100.0%
IRIS 6 Acquired Involutional Entropion: Normalization of Eyelid Position within 90 Days Following Surgery for Acquired Involutional Entropion
100.0%
MBS 1 Medical Complications [a] 100.0%
MBS 2 Surgical Site Complications [a] 100.0%
MBS 3 Serious Complications [a] 100.0%
MBS 7 Extended Length of Stay (LOS) [a] 100.0%

2015 Physician Quality Reporting System Reporting Experience and Trends
60
Measure Number Measure Description Percent of EPs with At Least 90% Performance
Rate
MBSAQIP 3 Risk standardized rate of patients who experienced a reoperation (likely related to the initial operation) within 30 days following a Laparoscopic Roux-en-Y Gastric Bypass or Laparoscopic Sleeve Gastrectomy operation, performed as a primary (not revisional) procedure. [a]
100.0%
MUSIC 2 Unplanned Hospital Admission within 30 Days of TRUS Biopsy: [a] 100.0%
MUSIC 3 Prostate Cancer: Avoidance of Overuse of CT Scan for Staging Low Risk Prostate Cancer Patients: 100.0%
OBERD 13 Orthopedic Functional and Pain Level Outcomes [a] 100.0%
PInc 21 Thrombolytic Therapy 100.0%
THPSO 1 Perioperative Aspiration Pneumonia rate [a] 100.0%
THPSO 10 Postoperative nausea and vomiting rate - Pediatrics [a] 100.0%
THPSO 11 Post-obstructive Pulmonary Edema rate following endo-tracheal intubation [a] 100.0%
THPSO 12 Respiratory Arrest in PACU rate [a] 100.0%
THPSO 13 Dental Injury Rate following airway management [a] 100.0%
THPSO 2 Post-dural puncture headache rate [a] 100.0%
THPSO 20 Immediate Perioperative Cardiac Arrest Rate [a] 100.0%
THPSO 21 Immediate Perioperative Mortality Rate [a] 100.0%
THPSO 3 Perioperative Peripheral Nerve Injury rate [a] 100.0%
THPSO 4 Pneumothorax rate as a complication of central line placement [a] 100.0%
THPSO 6 Perioperative Myocardial Infarction rate in low risk patients [a] 100.0%
THPSO 7 Perioperative Myocardial Infarction rate in high risk patients [a] 100.0%
THPSO 8 New perioperative central neurologic deficit [a] 100.0%
THPSO 9 Postoperative nausea and vomiting rate - Adults [a] 100.0%
USWR 18 Complications or Side Effects among patients undergoing Treatment with HBOT 100.0%
ASPIRE 11 Colloid use limited in cases with no indication 99.6%
165 Coronary Artery Bypass Graft (CABG): Deep Sternal Wound Infection Rate [a] 99.4%

2015 Physician Quality Reporting System Reporting Experience and Trends
61
Measure Number Measure Description Percent of EPs with At Least 90% Performance
Rate
MBSAQIP 4 Risk standardized rate of patients who experienced an anastomotic/staple line leak within 30 days following a Laparoscopic Roux-en-Y Gastric Bypass or Laparoscopic Sleeve Gastrectomy operation, performed as a primary (not revisional) procedure. [a]
99.2%
MBSAQIP 6 Risk standardized rate of patients who experienced a postoperative surgical site infection (SSI) (superficial incisional, deep incisional, or organ/space SSI) within 30 days following a Laparoscopic Roux-en-Y Gastric Bypass or Laparoscopic Sleeve Gastrectomy operation, performed as a primary (not revisional) procedure. [a]
99.2%
MBSAQIP 8 Risk standardized rate of patients who experienced extended length of stay (> 7 days) following a Laparoscopic Roux-en-Y Gastric Bypass or Laparoscopic Sleeve Gastrectomy operation, performed as a primary (not revisional) procedure. [a]
99.2%
249 Barrett's Esophagus 99.1%
224 Melanoma: Overutilization of Imaging Studies in Melanoma 99.0%
396 Lung Cancer Reporting (Resection Specimens) 99.0%
166 Coronary Artery Bypass Graft (CABG): Stroke [a] 98.8%
ECPR 11 Three Day All Cause Return ED Visit Rate - All Patients [a] 98.8%
ECPR 13 Three Day All Cause Return ED Visit Rate - Pediatrics [a] 98.7%
251 Quantitative Immunohistochemical (IHC) Evaluation of Human Epidermal Growth Factor Receptor 2 Testing (HER2) for Breast Cancer Patients
98.6%
388 Cataract Surgery with Intra-Operative Complications (Unplanned Rupture of Posterior Capsule Requiring Unplanned Vsitrectomy) [a]
98.6%
146 Radiology: Inappropriate Use of "Probably Benign" Assessment Category in Mammography Screening [a]
98.5%
AQI 5 Composite Anesthesia Safety 98.5%

2015 Physician Quality Reporting System Reporting Experience and Trends
62
Measure Number Measure Description Percent of EPs with At Least 90% Performance
Rate
MBSAQIP 5 Risk standardized rate of patients who experienced a bleeding/hemorrhage event requiring transfusion, intervention/operation, or readmission within 30 days following a Laparoscopic Roux-en-Y Gastric Bypass or Laparoscopic Sleeve Gastrectomy operation, performed as a primary (not revisional) procedure. [a]
98.4%
250 Radical Prostatectomy Pathology Reporting 98.3%
255 Rh Immunoglobulin (Rhogam) for Rh-Negative Pregnant Women at Risk of Fetal Blood Exposure 98.2%
AQI 10 Composite Procedural Safety for Central Line Placement 98.2%
167 Coronary Artery Bypass Graft (CABG): Postoperative Renal Failure [a] 98.0%
192 Cataracts: Complications within 30 Days Following Cataract Surgery Requiring Additional Surgical Procedures [a]
98.0%
ECPR 12 Three Day All Cause Return ED Visit Rate - Adults [a] 97.9%
PInc 25 ICU VTE Prophylaxis 97.7%
ASBS 2 Surgical Site Infection and Cellulitis After Breast and/or Axillary Surgery [a] 97.6%
43 Coronary Artery Bypass Graft (CABG): Use of Internal Mammary Artery (IMA) in Patients with Isolated CABG Surgery
97.5%
168 Coronary Artery Bypass Graft (CABG): Surgical Re-Exploration [a] 97.2%
ASBS 6 Perioperative Care: Discontinuation of Prophylactic Parenteral Antibiotics (Non-Cardiac Procedures)
97.0%
378 Children Who Have Dental Decay or Cavities [a] 96.9%
PInc 7 Venous Thromboembolism (VTE) Prophylaxis 96.8%
ASPIRE 5 Administration of dextrose containing solution or glucose recheck for patients with perioperative glucose < 60
96.7%
GIQIC 9 Documentation of history and physical rate - Colonoscopy 96.6%

2015 Physician Quality Reporting System Reporting Experience and Trends
63
Measure Number Measure Description Percent of EPs with At Least 90% Performance
Rate
100 Colorectal Cancer Resection Pathology Reporting: pT Category (Primary Tumor) and pN Category (Regional Lymph Nodes) with Histologic Grade
96.6%
ABG 4 PACU Intubation Rate [a] 96.3%
156 Oncology: Radiation Dose Limits to Normal Tissues 96.3%
MBSAQIP 7 Risk standardized rate of patients who experienced postoperative nausea, vomiting or fluid/electrolyte/nutritional depletion within 30 days following a Laparoscopic Roux-en-Y Gastric Bypass or Laparoscopic Sleeve Gastrectomy operation, performed as a primary (not revisional) procedure. [a]
96.1%
MBS 9 Unplanned Hospital Readmission within 30 Days of Principal Procedure [a] 95.8%
IRIS 9 Diabetic Retinopathy: Dilated Eye Exam 95.7%
MBSAQIP 2 Risk standardized rate of patients who experienced an unplanned readmission (likely related to the initial operation) to any hospital within 30 days following a Laparoscopic Roux-en-Y Gastric Bypass or Laparoscopic Sleeve Gastrectomy operation, performed as a primary (not revisional) procedure. [a]
95.3%
99 Breast Cancer Resection Pathology Reporting: pT Category (Primary Tumor) and pN Category (Regional Lymph Nodes) with Histologic Grade
95.2%
334 Adult Sinusitis: More than One Computerized Tomography (CT) Scan Within 90 Days for Chronic Sinusitis (Overuse) [a]
94.9%
67 Hematology: Myelodysplastic Syndrome (MDS) and Acute Leukemias: Baseline Cytogenetic Testing Performed on Bone Marrow
94.8%
263 Preoperative Diagnosis of Breast Cancer 94.6%
MBSAQIP 9 Percentage of patients who had complete 30 day follow-up following any metabolic and bariatric procedure.
94.5%
ASBS 5 Perioperative Care: Selection of Prophylactic Antibiotic - First OR Second Generation Cephalosporin 94.1%
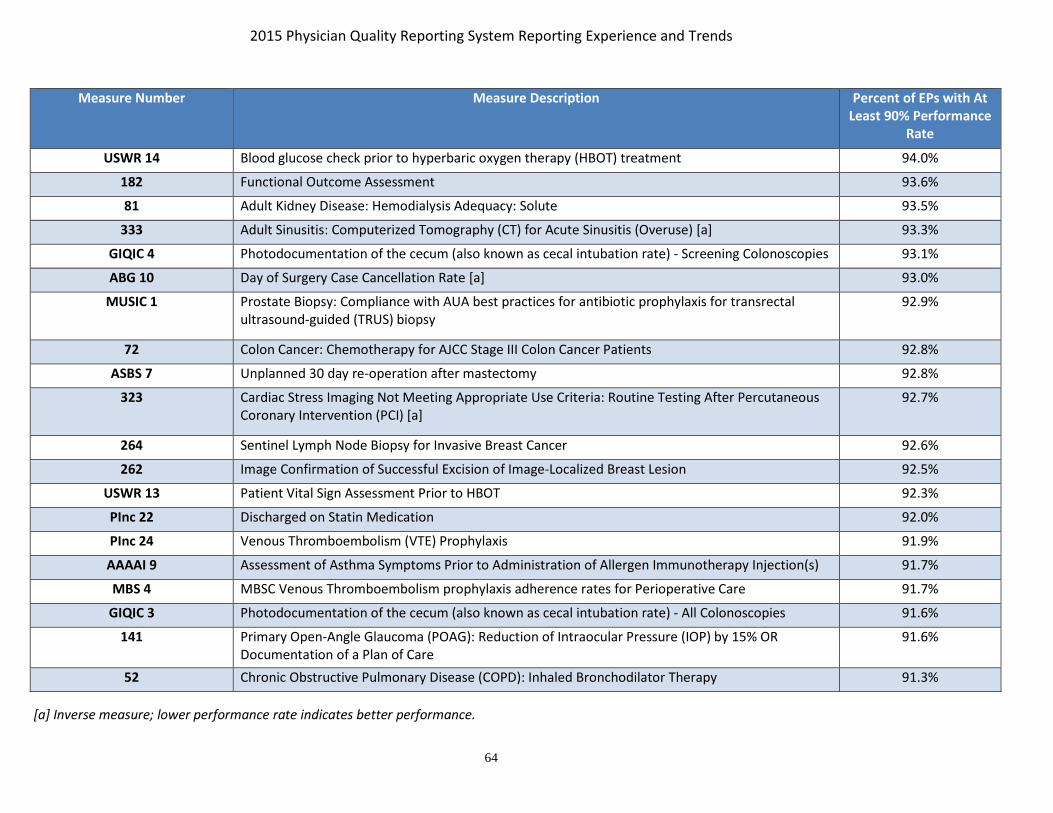
2015 Physician Quality Reporting System Reporting Experience and Trends
64
Measure Number Measure Description Percent of EPs with At Least 90% Performance
Rate
USWR 14 Blood glucose check prior to hyperbaric oxygen therapy (HBOT) treatment 94.0%
182 Functional Outcome Assessment 93.6%
81 Adult Kidney Disease: Hemodialysis Adequacy: Solute 93.5%
333 Adult Sinusitis: Computerized Tomography (CT) for Acute Sinusitis (Overuse) [a] 93.3%
GIQIC 4 Photodocumentation of the cecum (also known as cecal intubation rate) - Screening Colonoscopies 93.1%
ABG 10 Day of Surgery Case Cancellation Rate [a] 93.0%
MUSIC 1 Prostate Biopsy: Compliance with AUA best practices for antibiotic prophylaxis for transrectal ultrasound-guided (TRUS) biopsy
92.9%
72 Colon Cancer: Chemotherapy for AJCC Stage III Colon Cancer Patients 92.8%
ASBS 7 Unplanned 30 day re-operation after mastectomy 92.8%
323 Cardiac Stress Imaging Not Meeting Appropriate Use Criteria: Routine Testing After Percutaneous Coronary Intervention (PCI) [a]
92.7%
264 Sentinel Lymph Node Biopsy for Invasive Breast Cancer 92.6%
262 Image Confirmation of Successful Excision of Image-Localized Breast Lesion 92.5%
USWR 13 Patient Vital Sign Assessment Prior to HBOT 92.3%
PInc 22 Discharged on Statin Medication 92.0%
PInc 24 Venous Thromboembolism (VTE) Prophylaxis 91.9%
AAAAI 9 Assessment of Asthma Symptoms Prior to Administration of Allergen Immunotherapy Injection(s) 91.7%
MBS 4 MBSC Venous Thromboembolism prophylaxis adherence rates for Perioperative Care 91.7%
GIQIC 3 Photodocumentation of the cecum (also known as cecal intubation rate) - All Colonoscopies 91.6%
141 Primary Open-Angle Glaucoma (POAG): Reduction of Intraocular Pressure (IOP) by 15% OR Documentation of a Plan of Care
91.6%
52 Chronic Obstructive Pulmonary Disease (COPD): Inhaled Bronchodilator Therapy 91.3%
[a] Inverse measure; lower performance rate indicates better performance.
2015 Physician Quality Reporting System Reporting Experience and Trends
65
Note for Table 22: Results include the claims, registry, EHR, and QCDR reporting mechanisms. This table includes measure performance for eligible professionals regardless of whether the eligible professional met the satisfactory reporting requirement.
2015 Physician Quality Reporting System Reporting Experience and Trends
66
Appendix Tables A25 through A28 summarize quality measure reporting and performance of the group practices participating in the 2015 PQRS as a GPRO or ACO, via registry (Table A25), EHR (Table A26), web interface (Table A27), and CAHPS for PQRS (Table A28). Each table presents results separately for the type of group practice that could report via that mechanism.
Among practices participating via the Small GPRO registry mechanism, the most frequently reported registry measures were documentation of current medications (#130) and preventive measures such as tobacco screening and cessation intervention (#226) and BMI screening and follow-up (#128) (Appendix Table A25). The performance rates across the registry measures varied widely. All of the Small GPRO EHR submissions used the QRDA III format. The measures reported by the most practices under the Small GPRO EHR mechanism were also #226 and #130 (Appendix Table A26).
Group practices reporting under the Medium or Large GPRO web interface or as an ACO (Shared Savings Program or Pioneer) reported 17 measures covering care coordination/patient safety, coronary artery disease, diabetes mellitus, heart failure, hypertension, ischemic vascular disease, mental health, and preventive care. Among practices participating via the Medium and Large GPRO and the Shared Savings Program and Pioneer ACO model web interface, the highest performance rates are for the Care-3 (Documentation of Current Medications in the Medical Record) and Prev-10 (Prevention Care and Screening: Tobacco Use: Screening and Follow-up Plan); the lowest performance was in Prev-12 (Preventive Care and Screening: Screening for Clinical Depression and Follow-Up Plan) and MH-1 (Depression Remission at Twelve Months).
Performance rates among practices participating in the Medium and Largo GPRO via registry and EHR exhibited similar patterns to those among Small GPRO practices (Appendix Tables A25 and A26). The measures reported by the most TINs under the Medium and Large GPRO include Documentation of Current Medications (#130) and Tobacco Screening and Cessation Intervention (#226). In general, within the GPRO groups, the performance rates on similar measures were higher for those submitted via web-interface compared to those submitted via registry or EHR.
The 2015 CAHPS for PQRS Survey includes the core questions contained in the CAHPS Clinician & Group Survey (CG-CAHPS, Version 2.0)26, plus additional questions that measure key domains of beneficiaries’ experiences of care, for a total of 12 patient experience of care summary survey measures:
• Getting Timely Care, Appointments and Information
• How Well Providers Communicate
• Patient’s Rating of Provider
• Access to Specialists
• Health Promotion and Education
• Shared Decision-Making
26 The survey instrument and further information regarding summary survey measures and scoring are available at: http://www.pqrscahps.org.

2015 Physician Quality Reporting System Reporting Experience and Trends
67
• Health Status and Functional Status
• Courteous and Helpful Office Staff
• Care Coordination
• Between Visit Communication
• Helping You to Take Medications as Directed
• Stewardship of Patient Resources
Three of the summary survey measures (Health Promotion and Education, Shared Decision-Making, and Health Status and Functional Status) are comprised of subsidiary measures that are used to derive the overall summary survey measure score. To develop a score for each summary survey measure, a numerical value is assigned to each individual question response for that measure. Then, sampling and non-response weights are applied, case mix adjustment is applied, the assigned score is linearly transformed to a 0-100 possible range, and then the weighted, case mix adjusted, transformed responses are averaged to produce the overall summary score.
Appendix Table A28 presents the overall 2015 mean for the 12 CAHPS for PQRS summary survey measures, and, where applicable, the subsidiary measures that are used to derive them. Scores are presented on a 0-100 scale. In 2015, group practices with 100 or more EPs were required to contract with a vendor to administer the CAHPS for PQRS Survey to their patients. Group practices with 2-99 EPs that report via the GPRO web interface, EHR, or registry could elect to participate in the 2015 CAHPS for PQRS survey. In all, 461 practices participated in the CAHPS for PQRS Survey in 2015.
The national practice mean was above 90 out of 100 for How Well Providers Communicate (93 out of 100), Patient’s Rating of Provider (92 out of 100) and Courteous and Helpful Office Staff (93 out of 100). In contrast, practices showed greatest room for improvement on the Stewardship of Patient Resources summary survey measure, which had a national practice mean of 27 out of 100.

2015 Physician Quality Reporting System Reporting Experience and Trends
68
VII. PQRS FEEDBACK REPORTS
A. Background
CMS provides PQRS feedback reports for the Physician Quality Reporting System each year. Although these reports are not provided simultaneously with the notification of payment adjustment letters to eligible professionals, CMS strives to make PQRS feedback reports available as closely as possible to delivery of payment adjustment letters. A PQRS feedback report will be generated for each individual TIN/NPI and/or TIN for GPROs that reported PQRS data or that submitted Medicare PFS claims that included denominator-eligible events but did not submit PQRS data. The PQRS feedback reports will include all measures reported by the individual TIN/NPI and/or TIN for GPROs for each submission mechanism utilized (Registry, Claims, EHR, Web Interface and QCDR). The two types of feedback reports available for both individual TIN/NPI and group practices that submitted data as a GPRO are:
• PQRS Payment Adjustment Feedback Report – contains information regarding the individual EP’s or PQRS group practice’s payment adjustment status, rationale as to why the payment adjustment was or was not applied, and high-level PQRS reporting detail.
• PQRS Payment Adjustment Measure Performance Detail Report – contains specific detail on the measure(s) submitted by each mechanism utilized by the individual EP or PQRS group practice during the 2015 reporting year. Additionally, the Claim Measure tab on this table will identify measure(s) that had denominator-eligible instances that potentially could have been reported.
B. Accessing PQRS Feedback Reports
To access the 2015 PQRS feedback reports, an EIDM account with the appropriate role is required. Anyone is eligible to register for an EIDM account, but the account owner is the only user allowed to utilize the account. EIDM role requests are made at the TIN level and should be utilized by authorized representatives of the TIN. If a user is a representative of multiple TINs, a role for each TIN is required in order to access the feedback reports. A Security Official may also approve access for other group users who apply for the Group Representative roles and an Individual Practitioner may approve access for other Individual Practitioner Representative roles.
The Quick Reference Guide (QRG) for Accessing the 2015 PQRS Feedback Reports will provide information on accessing, navigating, and downloading the PQRS feedback reports. This document can be found on the PQRS Analysis and Payment webpage.
2014 PQRS feedback reports for TIN-level reports and the NPI-level reports are available through the Annual Quality Resource and Use Report (QRUR) at the Physician Value Portlet. The process for requesting 2008-2013 NPI-level feedback reports was established in 2011, allowing report requests to be made through the PQRS Communication Support Page (CSP).27
27 http://www.qualitynet.org/portal/server.pt/community/communications_support_system/234

2015 Physician Quality Reporting System Reporting Experience and Trends
69
VIII. HELP DESK
A. Background
In 2008, CMS recognized the need for a dedicated Physician Quality Reporting System Help Desk to support the reporting efforts of eligible professionals. The QualityNet Help Desk was tasked with providing such support, and began working with the External User Services Help Desk and all of the Medicare A/B Medicare Administrative Contractors (MACs) and carriers. Professionals who have questions on eligibility, reporting, accounts for Portal access, informal reviews, PQRS feedback reports, or payments can contact the appropriate support desk for assistance.
B. Support Desks
1. The CMS A/B MAC and Carrier Provider Contact Centers provide Medicare enrollment and claims submission support. This now includes the responsibility of disbursing the PQRS incentive payments to eligible professionals who earned incentives, paid at the TIN level for program years 2014 and prior. They answer questions related to payment disbursement, Remittance Advice, and any offsets or payment adjustments. The A/B MAC Carriers previously were tasked with accepting requests for individual NPI-level feedback reports through the Alternative Feedback Report Request Process. Instead, the CSP was made available in early 2012 as a means for individual eligible professionals to request NPI-level feedback reports for the years 2008-2013. The CSP is available through the Portal, and does not require an account login. This alternative was implemented in response to some difficulties eligible professionals were having obtaining their account login. The TIN-level and NPI-level feedback reports for the 2014 PQRS program year and the 2015 PQRS feedback reports are available through the Annual Quality and Resource Use Report (QRUR) at the Physician Value Portlet, and do require an EIDM account.
2. The QualityNet Help Desk initially consisted of one level of support, known as Tier I, which consisted of a team dedicated to issues related to the PQRS and eRx Incentive Programs. This tier handled questions in the summer and fall of 2008 regarding 2007 program year payments and feedback reports, as well as questions regarding 2008 program year reporting. They were available to answer a range of questions on issues such as eligibility, measures, reporting options, portal login, feedback reports, registries, and payments. In the summer of 2009, a second Tier was added, known as Inquiry Support, to address specific measure questions and assist CMS with escalated payment or report issues. This Tier was able to provide a level of detailed data review to eligible professionals who did not qualify for an incentive and needed information in addition to their feedback report. The Inquiry Support team became the Tier II Inquiry Support level to handle claims detail requests as well as other data specific issues. In 2010, a Tier II Inquiry Support team was implemented to focus on providing answers to measures questions and program inquiries for both individual measure reporting as well as measures groups reporting, so that eligible professionals could better understand their feedback reports and use that knowledge to be more successful in future years. Currently, there are two Tier II support teams; Physician Quality Measurement Management (PQMM) handles questions related to measures and Physician Quality Programs Management and Implementation (PQPMI) handles program inquiries. Near the end of 2010, the IACS support for PQRS transitioned to the QualityNet Help Desk (Tier I). This includes vetting for the Security Official role in Organizations, IACS account issues, the new Annual Recertification requirement, assistance in obtaining the data submission role, etc. The IACS accounts have transitioned to EIDM accounts for all of the
2015 Physician Quality Reporting System Reporting Experience and Trends
70
above noted access. Eligible professionals still need to contact the EUS Help Desk for issues related to Medicare enrollment and the PECOS system. In 2011, the QualityNet Help Desk at all levels also began to assist with questions related to the eRx payment adjustments for 2012-2014. Starting in 2013, all helpdesk levels began to assist with questions related to the PQRS payment adjustment for the 2015 and 2016 PQRS payment adjustment years.
3. There are additional Support Teams that the QualityNet Help Desk Tiers work with to resolve related issues:
a. The EHR Meaningful Use Information Center assists with Medicare EHR Incentive Program reporting, as well as with issues stemming from the eRx payment adjustment EHR-related significant hardship exemptions.
b. The PQPMI Support Team within the Tier II Help Desk assists with vetting new Registry and QCDR vendors, helps train these entities, and assists the aforementioned vendors and MOCP vendors with file submissions at the end of the reporting periods.
c. The PQMM Support team within the Tier II Help Desk assists with vetting PQRS measures that all Registry and QCDR vendors would like to support for the program year.
d. The Tier II ACO Help Desk provides guidance related to ACOs that report (via the GPRO Web Interface) on behalf of eligible professionals for purposes of Physician Quality Reporting System reporting under the Shared Savings Program or the Pioneer ACO model.
e. The Physician Value Tier II Help Desk assists with Value-Modifier (VM) and QRUR questions, as well as online registration to avoid Physician Quality Reporting System or VM adjustments.
f. The Physician Compare Tier II Help Desk assists with questions regarding public reporting of quality care data on Physician Compare data posted in calendar year 2014 & 2015.
Eligible professionals are encouraged to utilize the services provided by these support desks. The contact information for the support desks follows:
1. External User Services Help Desk for Medicare enrollment and PECOS questions:
• Phone: 1-866-484-8049
• TTY/TDD: 1-866-523-4759 (Monday-Friday; 7am-7pm EST)
• Email: [email protected]
2. CMS A/B MAC and Carrier Provider Contact Centers:
• To get information regarding Contact Centers, see the “Provider Compliance Group Interactive Map” by clicking on the following link: http://www.cms.gov/Research-Statistics-Data-and-Systems/Monitoring-Programs/provider-compliance-interactive-map/index.html.
3. QualityNet Help Desk for first-level questions on EIDM, Portal Login, payments, reports, measures, GPRO, ACO, Physician Value, eRx adjustments, file submissions etc. The Help Desk incidents generated, may then be escalated to the appropriate Tier II or Tier III support teams:
• Phone: 1-866-288-8912

2015 Physician Quality Reporting System Reporting Experience and Trends
71
• TTY: 1-877-715-6222
• Email: [email protected]

2015 Physician Quality Reporting System Reporting Experience and Trends
72
IX. CONCLUSION Participation in PQRS has increased steadily since its inception in 2007. The program saw strong growth in the 2015 program year, with a 15 percent increase in the number of participants over the 2014 program year and more than two-thirds of eligible professionals participating in the program via individual or group reporting options, as part of an ACO, or through the CPC initiative. The final year for reporting in this program will be 2016.
The PQRS program offered incentives for participation in program years 2007 through 2014. Beginning in calendar year 2015, the PQRS payment adjustment is applied to Part B FFS payments based on performance in program year 2013. Reporting in each of the program years in 2014, 2015, and 2016 determines who is subject to the payment adjustment for Part B FFS payments in calendar years 2016, 2017, and 2018, respectively. In the second year of the PQRS payment adjustment (2016), over 768,000 eligible professionals avoided the adjustment with most of them doing so by meeting the 2014 reporting requirements. In the third year of the payment adjustment, 2017, even more eligible professionals will avoid the payment adjustment (N=840,396) with most of them doing so by meeting the reporting requirements for 2015. Among those subject to the 2017 payment adjustment, most continued to be in small practices and were not participating in the program; however, an increasing proportion participated or at least tried to participate in the program compared to the 2016 payment adjustment.
CMS continues to foster growth and participation in PQRS and alignment with other programs. First, CMS is actively working to reduce the burden on eligible professionals by allowing them to report once for multiple programs. This is accomplished by aligning measures reported through various quality reporting initiatives. Second, CMS continues to streamline the measures available by eliminating measures that are topped out, redundant, or under-reported. Lastly, CMS continues to align with the National Quality Strategy by streamlining measures across programs as it balances competing goals of establishing parsimonious sets of measures while including sufficient measures to facilitate provider participation.
In addition to the payment adjustment, the Physician Value-Based Modifier (VM) was implemented in 2015 to provide a payment adjustment to PFS payments based on quality of care and cost. The VM was authorized under section 3007 of the Affordable Care Act; it began in calendar year 2015 and will continue through calendar year 2018. The VM was phased in over time with the first payment adjustment occurring in calendar year 2015 for physicians in groups of 100 or more eligible professionals based on quality and cost performance in 2013. The second year of the VM occurred in calendar year 2016 and is applied to PFS payments for physicians in groups of 10 or more eligible professionals based on quality and cost performance in 2014. The 2017 VM applies to PFS payments for physician solo practitioners and physicians in groups of 2 or more eligible professionals based on quality and cost performance in 2015. The final year of the VM, 2018, applies the adjustment to PFS payments for physicians, physician assistants, nurse practitioners, clinical nurse specialists, and certified nurse
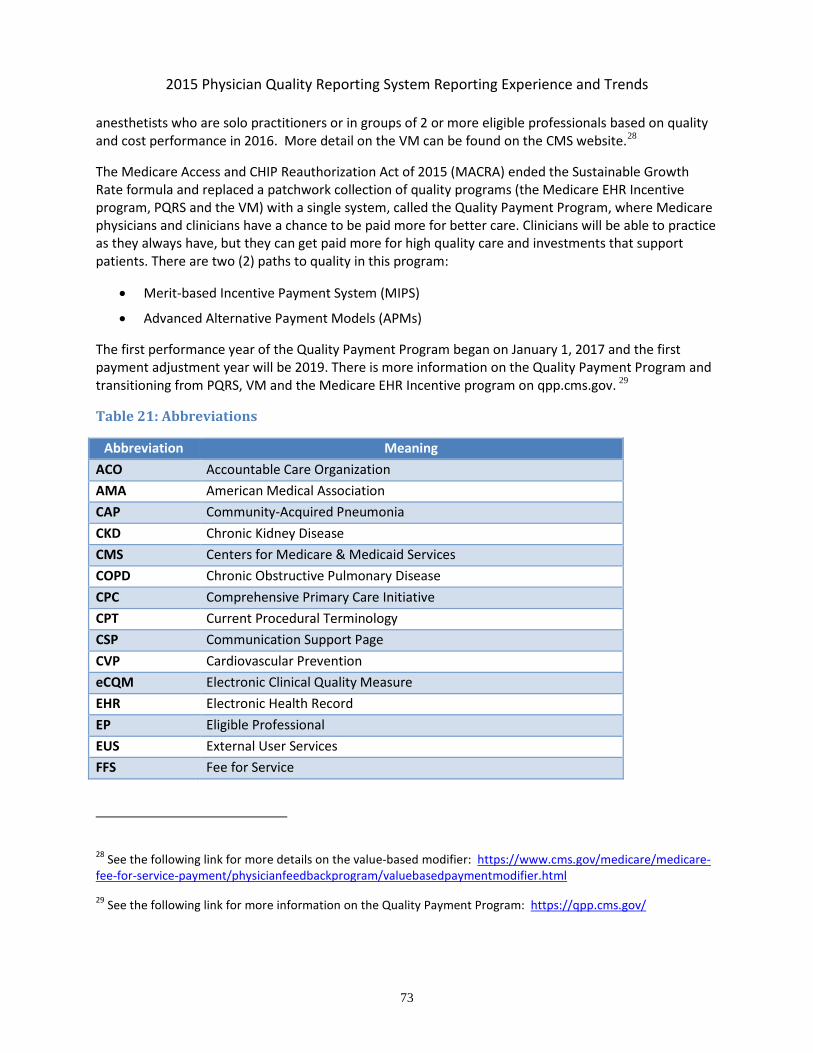
2015 Physician Quality Reporting System Reporting Experience and Trends
73
anesthetists who are solo practitioners or in groups of 2 or more eligible professionals based on quality and cost performance in 2016. More detail on the VM can be found on the CMS website.28
The Medicare Access and CHIP Reauthorization Act of 2015 (MACRA) ended the Sustainable Growth Rate formula and replaced a patchwork collection of quality programs (the Medicare EHR Incentive program, PQRS and the VM) with a single system, called the Quality Payment Program, where Medicare physicians and clinicians have a chance to be paid more for better care. Clinicians will be able to practice as they always have, but they can get paid more for high quality care and investments that support patients. There are two (2) paths to quality in this program:
• Merit-based Incentive Payment System (MIPS)
• Advanced Alternative Payment Models (APMs)
The first performance year of the Quality Payment Program began on January 1, 2017 and the first payment adjustment year will be 2019. There is more information on the Quality Payment Program and transitioning from PQRS, VM and the Medicare EHR Incentive program on qpp.cms.gov. 29
Table 21: Abbreviations
Abbreviation Meaning ACO Accountable Care Organization AMA American Medical Association CAP Community-Acquired Pneumonia CKD Chronic Kidney Disease CMS Centers for Medicare & Medicaid Services COPD Chronic Obstructive Pulmonary Disease CPC Comprehensive Primary Care Initiative CPT Current Procedural Terminology CSP Communication Support Page CVP Cardiovascular Prevention eCQM Electronic Clinical Quality Measure EHR Electronic Health Record EP Eligible Professional EUS External User Services FFS Fee for Service
28 See the following link for more details on the value-based modifier: https://www.cms.gov/medicare/medicare-fee-for-service-payment/physicianfeedbackprogram/valuebasedpaymentmodifier.html
29 See the following link for more information on the Quality Payment Program: https://qpp.cms.gov/
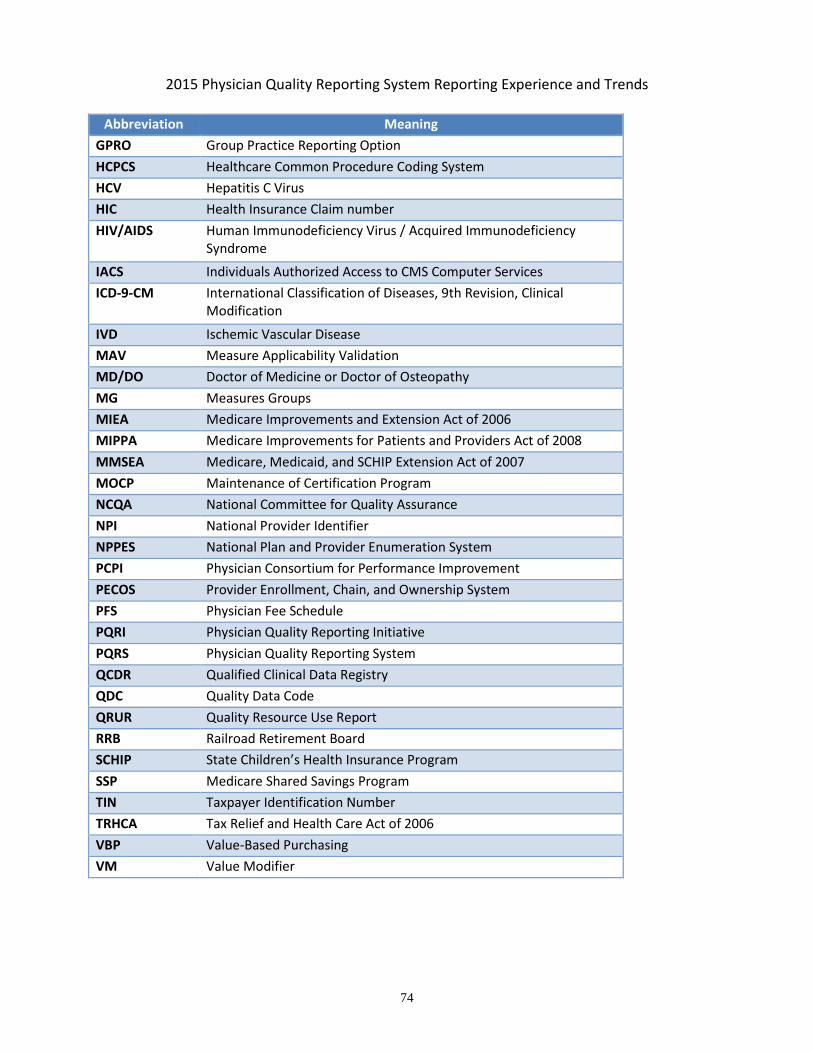
2015 Physician Quality Reporting System Reporting Experience and Trends
74
Abbreviation Meaning GPRO Group Practice Reporting Option HCPCS Healthcare Common Procedure Coding System HCV Hepatitis C Virus HIC Health Insurance Claim number HIV/AIDS Human Immunodeficiency Virus / Acquired Immunodeficiency
Syndrome
IACS Individuals Authorized Access to CMS Computer Services ICD-9-CM International Classification of Diseases, 9th Revision, Clinical
Modification
IVD Ischemic Vascular Disease MAV Measure Applicability Validation MD/DO Doctor of Medicine or Doctor of Osteopathy MG Measures Groups MIEA Medicare Improvements and Extension Act of 2006 MIPPA Medicare Improvements for Patients and Providers Act of 2008 MMSEA Medicare, Medicaid, and SCHIP Extension Act of 2007 MOCP Maintenance of Certification Program NCQA National Committee for Quality Assurance NPI National Provider Identifier NPPES National Plan and Provider Enumeration System PCPI Physician Consortium for Performance Improvement PECOS Provider Enrollment, Chain, and Ownership System PFS Physician Fee Schedule PQRI Physician Quality Reporting Initiative PQRS Physician Quality Reporting System QCDR Qualified Clinical Data Registry QDC Quality Data Code QRUR Quality Resource Use Report RRB Railroad Retirement Board SCHIP State Children’s Health Insurance Program SSP Medicare Shared Savings Program TIN Taxpayer Identification Number TRHCA Tax Relief and Health Care Act of 2006 VBP Value-Based Purchasing VM Value Modifier