Embed Size (px)
Citation preview
For TK use only. Source: PLANSPONSOR Defined Contribution Survey, 2013 0
All data as of November 2013 Updated data available November 2014
403(b) Plans
2015 PLAN BENCHMARKING REPORT A summary of overall results from the 2014 PLANSPONSOR Defined Contribution (DC) Survey Report courtesy of Sentinel Benefits & Financial Group

For TK use only. Source: PLANSPONSOR Defined Contribution Survey, 2013 1
All data as of November 2013 Updated data available November 2014
For use by Sentinel Benefits & Financial Group only. Source: PLANSPONSOR Defined Contribution Survey, 2014
Prepared December 2014 | page 1
Summary of Findings 2
Plan Types and Design Features 6
“Auto” Features 17
Participation and Eligibility 25
Employer Match 30
Plan Investments 39
Retirement Income 47
Fees/Expenses 51
Defined Contribution Providers 59
Advice and Advisers 63
Plan Oversight and Administration 70
Table of Contents

For TK use only. Source: PLANSPONSOR Defined Contribution Survey, 2013 2
All data as of November 2013 Updated data available November 2014
For use by Sentinel Benefits & Financial Group only. Source: PLANSPONSOR Defined Contribution Survey, 2014
Prepared December 2014 | page 2
Summary of Findings
For TK use only. Source: PLANSPONSOR Defined Contribution Survey, 2013 3
All data as of November 2013 Updated data available November 2014
For use by Sentinel Benefits & Financial Group only. Source: PLANSPONSOR Defined Contribution Survey, 2014
Prepared December 2014 | page 3
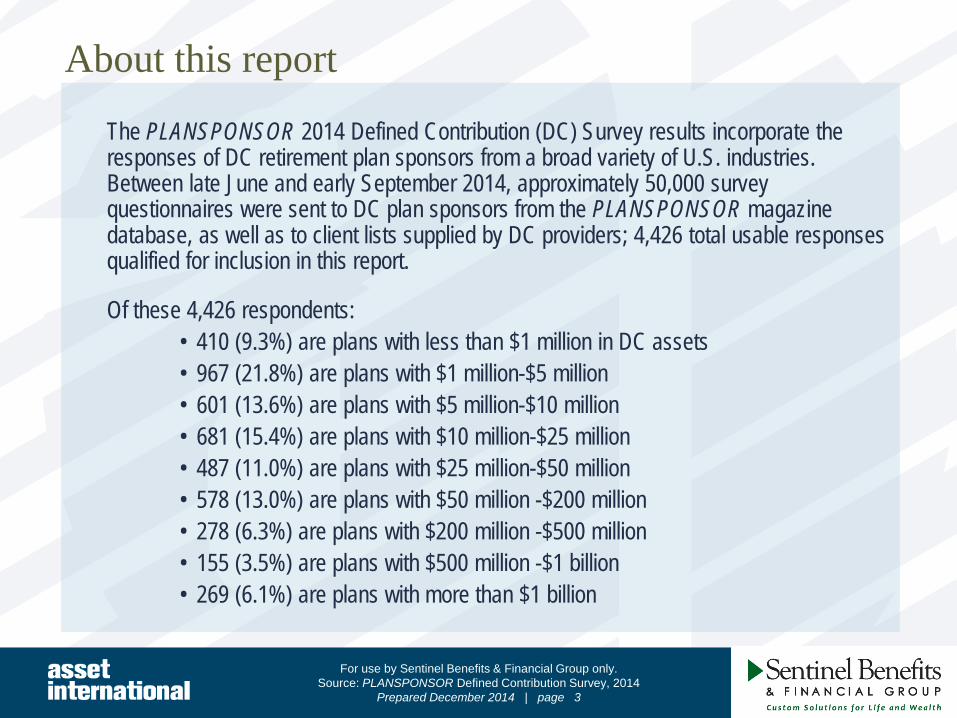
About this report The PLANSPONSOR 2014 Defined Contribution (DC) Survey results incorporate the
responses of DC retirement plan sponsors from a broad variety of U.S. industries. Between late June and early September 2014, approximately 50,000 survey questionnaires were sent to DC plan sponsors from the PLANSPONSOR magazine database, as well as to client lists supplied by DC providers; 4,426 total usable responses qualified for inclusion in this report.
Of these 4,426 respondents: • 410 (9.3%) are plans with less than $1 million in DC assets • 967 (21.8%) are plans with $1 million-$5 million • 601 (13.6%) are plans with $5 million-$10 million • 681 (15.4%) are plans with $10 million-$25 million • 487 (11.0%) are plans with $25 million-$50 million • 578 (13.0%) are plans with $50 million -$200 million • 278 (6.3%) are plans with $200 million -$500 million • 155 (3.5%) are plans with $500 million -$1 billion • 269 (6.1%) are plans with more than $1 billion

For TK use only. Source: PLANSPONSOR Defined Contribution Survey, 2013 4
All data as of November 2013 Updated data available November 2014
For use by Sentinel Benefits & Financial Group only. Source: PLANSPONSOR Defined Contribution Survey, 2014
Prepared December 2014 | page 4
Overall Rankings: Top 50% industries in key plan areas Participation Rate Average Account Balance Average Deferral Rate Participants with Loans Hardship Withdrawals
1 Labor Unions [89.1%] Law Firm [$181,176] Labor Unions [9.4%] Fortune 1000 [21.3%] Labor Unions [2.49%]
2 Credit Unions [87.9%] Utilities [$129,703] Research & Development [8.3%] Utilities [20.4%] Fortune 1000 [2.25%]
3 Pharmaceuticals [86.3%] Accounting [$120,216] Pharmaceuticals [8.1%] Manufacturing: Consumer [19.8%] Healthcare (not for profit) [2.09%]
4 Utilities [86.3%] Fortune 1000 [$111,550] Aerospace/Defense [7.9%] Chemicals/Mining [19.7%] Aerospace/Defense [1.97%]
5 Accounting [86.2%] Research & Development [$110,071] Education: Higher Ed [7.8%] Automotive: Manufacturing [18.3%] Utilities [1.88%]
6 Insurance/Reinsurance [85.7%] Engineering [$109,294] Accounting [7.8%] Manufacturing: Industrial [18.0%] Manufacturing: Consumer [1.86%]
7 Financial Services [85.6%] Consulting [$108,555] Engineering [7.7%] Telecommunications [17.4%] Automotive: Dealerships/Svc [1.85%]
8 Membership Orgs [84.8%] Financial Services [$107,853] Consulting [7.7%] Insurance/Reinsurance [17.2%] Restaurants/Food Service [1.75%]
9 Consulting [84.6%] Pharmaceuticals [$107,524] Utilities [7.7%] Oil & Gas/Energy [17.1%] Manufacturing: Industrial [1.72%]
10 Engineering [84.2%] Aerospace/Defense [$107,392] Fortune 1000 [7.4%] Hotels/Gaming [16.7%] Oil & Gas/Energy [1.65%]
11 Banking: Commercial [83.3%] Membership Orgs [$102,457] Technology [7.3%] Media/Communications [16.1%] Insurance/Reinsurance [1.61%]
12 Law Firm [83.2%] Architecture [$101,254] Oil & Gas/Energy [7.2%] Distribution [16.0%] Automotive: Manufacturing [1.61%]
13 Telecommunications [82.0%] Chemicals/Mining [$100,939] Govt: City/Municipal [7.2%] Credit Unions [15.5%] Transportation/Airlines [1.59%]
14 Oil & Gas/Energy [81.5%] Oil & Gas/Energy [$98,098] Financial Services [7.2%] Transportation/Airlines [15.5%] Chemicals/Mining [1.58%]
15 Technology [81.4%] Insurance/Reinsurance [$97,866] Insurance/Reinsurance [7.0%] Labor Unions [15.4%] Wholesale [1.48%]
16 Holding Co's/Inv Banking [80.7%] Technology [$94,039] Membership Orgs [7.0%] Aerospace/Defense [15.3%] Education: K-12, Preschool [1.45%]
17 Research/Development [80.6%] Telecommunications [$92,117] Telecommunications [7.0%] Automotive: Dealerships/Svc [15.2%] Healthcare (for profit) [1.44%]
18 Aerospace/Defense [80.2%] Building/Construction [$91,163] Architecture [6.9%] Wholesale [15.2%] Banking: Commercial [1.42%]
19 Agriculture [80.0%] Healthcare (for profit) [$90,297] Govt: County/State/Federal [6.7%] Building/Construction [14.5%] Govt: County/State/Federal [1.40%]
20 Real Estate [79.9%] Education: Higher Ed [$87,867] Business Services [6.6%] Consumer Services [14.2%] Holding Co's/Inv Banking [1.40%]
21 Chemicals/Mining [79.7%] Agriculture [$87,433] Law Firm [6.5%] Retail [14.0%] Consumer Services [1.38%]
22 Fortune 1000 [79.6%] Environmental [$81,939] Chemicals/Mining [6.4%] Banking: Commercial [13.7%] Telecommunications [1.38%]
23 Equipment [79.2%] Labor Unions [$79,664] Real Estate [6.4%] Agriculture [13.6%] Hotels/Gaming [1.37%]
24 Govt: City/Municipal [78.7%] Equipment [$78,909] Media/Communications [6.3%] Govt: City/Municipal [13.4%] Distribution [1.33%]

For TK use only. Source: PLANSPONSOR Defined Contribution Survey, 2013 5
All data as of November 2013 Updated data available November 2014
For use by Sentinel Benefits & Financial Group only. Source: PLANSPONSOR Defined Contribution Survey, 2014
Prepared December 2014 | page 5
Overall Rankings: Bottom 50% industries in key plan areas Participation Rate Average Account Balance Average Deferral Rate Participants with Loans Hardship Withdrawals
25 Architecture [78.5%] Real Estate [$78,769] Building/Construction [6.3%] Business Services [12.7%] Govt: City/Municipal [1.29%]
26 Non-Profit Orgs [78.1%] Manufacturing: Industrial [$78,588] Environmental [6.3%] Holding Co's/Inv Banking [12.6%] Building/Construction [1.28%]
27 Environmental [77.2%] Transportation/Airlines [$74,939] Equipment [6.2%] Financial Services [12.5%] Technology [1.26%]
28 Manufacturing: Industrial [77.1%] Advertising/Marketing [$74,829] Manufacturing: Industrial [6.2%] Healthcare (not for profit) [12.4%] Retail [1.26%]
29 Distribution [76.6%] Distribution [$73,309] Transportation/Airlines [6.2%] Law Firms [12.2%] Financial Services [1.26%]
30 Manufacturing: Consumer [76.4%] Wholesale [$72,731] Non-Profit Orgs [6.1%] Environmental [12.1%] Non-Profit Orgs [1.24%]
31 Education: Higher Ed [76.3%] Manufacturing: Consumer [$71,268] Banking: Commercial [6.1%] Research & Development [12.0%] Media/Communications [1.23%]
32 Automotive: Manufacturing [75.9%] Media/Communications [$71,011] Healthcare (for profit) [6.1%] Technology [12.0%] Education: Higher Ed [1.23%]
33 Healthcare (for profit) [75.1%] Holding Co's/Inv Banking [$70,921] Consumer Services [6.1%] Healthcare (for profit) [11.4%] Equipment [1.23%]
34 Business Services [74.0%] Automotive: Manufacturing [$70,813] Holding Co's/Inv Banking [6.1%] Religious Orgs/Social Svcs [11.0%] Religious Orgs/Social Svcs [1.18%]
35 Media/Communications [73.4%] Govt: City/Municipal [$70,674] Education: K-12, Preschool [6.0%] Engineering [10.8%] Real Estate [1.17%]
36 Advertising/Marketing [73.3%] Banking: Commercial [$70,636] Manufacturing: Consumer [6.0%] Membership Orgs/Industry Assns [10.7%] Business Services [1.08%]
37 Healthcare (not for profit) [73.2%] Business Services [$67,836] Credit Unions [5.9%] Pharmaceuticals/Biotech [10.5%] Pharmaceuticals [1.07%]
38 Building/Construction [72.8%] Non-Profit Orgs [$64,576] Healthcare (not for profit) [5.9%] Advertising/Marketing [10.2%] Research & Development [1.06%]
39 Wholesale [72.6%] Consumer Services [$63,411] Automotive: Manufacturing [5.8%] Non-Profit Orgs [9.9%] Agriculture [0.82%]
40 Religious Orgs/Social Svcs [71.1%] Automotive: Dealerships/Svc [$60,941] Agriculture [5.8%] Architecture [9.6%] Membership Orgs [0.77%]
41 Education: K-12, Preschool [70.5%] Credit Unions [$60,840] Wholesale [5.7%] Consulting [9.5%] Accounting [0.73%]
42 Transportation/Airlines [69.9%] Retail [$52,411] Automotive: Dealerships/Svc [5.6%] Accounting [9.2%] Law Firm [0.73%]
43 Consumer Services [66.5%] Govt: County/State/Federal [$50,091] Religious Orgs/Social Svcs [5.5%] Education: Higher Ed [8.9%] Advertising/Marketing [0.69%]
44 Automotive: Dealerships/Svc [66.0%] Healthcare (not for profit) [$46,215] Hotels/Gaming [5.4%] Education: K-12, Pre-School [7.6%] Consulting [0.66%]
45 Govt: County/State/Federal [63.1%] Education: K-12, Preschool [$43,930] Distribution [5.4%] Business Services [12.7%] Credit Unions [0.64%]
46 Retail [62.6%] Hotels/Gaming [$43,586] Retail [5.4%] Holding Co's/Inv Banking [12.6%] Engineering [0.64%]
47 Hotels/Gaming [57.0%] Restaurants/Food Service [$38,467] Advertising/Marketing [5.4%] Financial Services [12.5%] Architecture [0.56%]
48 Restaurants/Food Service [51.3%] Religious Orgs/Social Svcs [$33,875] Restaurants/Food Service [5.1%] Healthcare (not for profit) [12.4%] Environmental [0.54%]

For TK use only. Source: PLANSPONSOR Defined Contribution Survey, 2013 6
All data as of November 2013 Updated data available November 2014
For use by Sentinel Benefits & Financial Group only. Source: PLANSPONSOR Defined Contribution Survey, 2014
Prepared December 2014 | page 6
Plan Types and Design Features

For TK use only. Source: PLANSPONSOR Defined Contribution Survey, 2013 7
All data as of November 2013 Updated data available November 2014
For use by Sentinel Benefits & Financial Group only. Source: PLANSPONSOR Defined Contribution Survey, 2014
Prepared December 2014 | page 7
What type of DC plan does your organization offer?
Plan Size
Overall <$1MM $1MM -$5MM
$5MM -$10MM
$10MM -$25MM
$25MM -$50MM
$50MM -$200MM
$200MM -$500MM
$500MM -$1B >$1B
401(k) 87.0% 90.8% 92.6% 89.2% 88.0% 48.7% 80.4% 78.3% 80.8% 84.3%
403(b) 10.6% 5.7% 6.0% 8.2% 9.3% 5.5% 15.0% 22.8% 25.2% 13.1%
457 10.2% 2.2% 4.5% 6.7% 7.7% 5.9% 14.7% 25.7% 23.8% 18.4%
Money Purchase 2.9% 1.0% 1.2% 2.5% 2.1% 1.7% 4.1% 7.4% 6.0% 5.2%
Profit Sharing 20.3% 15.3% 21.4% 20.7% 23.5% 13.9% 19.8% 19.9% 20.5% 12.4%
ESOP 3.7% 0.0% 2.0% 3.9% 3.5% 1.7% 5.0% 7.0% 5.3% 9.4%
KSOP 0.6% 0.0% 0.4% 0.8% 0.3% 0.6% 0.5% 1.5% 0.0% 2.6%
Nonqualified Deferred Compensation (NQDC) 9.8% 0.7% 1.8% 1.5% 6.6% 4.6% 14.9% 30.5% 31.1% 39.0%
SEP 0.7% 1.0% 0.2% 0.5% 0.4% 0.8% 0.9% 1.5% 2.0% 0.7%
SIMPLE IRA 0.6% 1.2% 0.0% 0.3% 0.6% 1.1% 0.5% 1.8% 2.0% 0.4%
Other 3.5% 1.2% 1.7% 2.0% 2.7% 2.5% 5.0% 8.5% 8.6% 7.1%

For TK use only. Source: PLANSPONSOR Defined Contribution Survey, 2013 8
All data as of November 2013 Updated data available November 2014
For use by Sentinel Benefits & Financial Group only. Source: PLANSPONSOR Defined Contribution Survey, 2014
Prepared December 2014 | page 8
Does your organization offer any of these additional workplace retirement/savings plans?
Plan Size
Overall <$1MM $1MM -$5MM
$5MM -$10MM
$10MM -$25MM
$25MM -$50MM
$50MM -$200MM
$200MM -$500MM
$500MM -$1B >$1B
Defined Benefit Plan (Traditional) 21.9% 13.9% 14.2% 13.5% 16.6% 16.6% 27.9% 39.8% 49.7% 54.0%
Defined Benefit Plan (Cash Balance) 4.5% 0.5% 1.6% 1.5% 2.3% 2.6% 4.1% 11.5% 15.2% 24.5%
Defined Benefit Plan (Hybrid/Other formula) 1.9% 0.8% 0.6% 1.0% 0.8% 1.1% 1.4% 4.1% 6.0% 11.3%
Health Savings Account (HSA) 36.5% 18.4% 28.3% 32.6% 38.1% 38.4% 42.5% 49.8% 51.7% 59.2%
Retiree Health Benefits 10.4% 1.8% 1.2% 3.1% 3.9% 10.4% 16.8% 26.8% 35.8% 44.9%
529 College Savings Plan 7.6% 0.3% 2.4% 6.3% 7.1% 12.3% 13.5% 12.6% 14.6% 10.6%
NONE - Do not offer any of these benefits 43.9% 69.0% 58.6% 53.7% 45.2% 41.5% 27.9% 16.4% 13.9% 11.7%

For TK use only. Source: PLANSPONSOR Defined Contribution Survey, 2013 9
All data as of November 2013 Updated data available November 2014
For use by Sentinel Benefits & Financial Group only. Source: PLANSPONSOR Defined Contribution Survey, 2014
Prepared December 2014 | page 9
Do you provide a Roth contribution option?
Plan Size
Overall <$1MM $1MM -$5MM
$5MM -$10MM
$10MM -$25MM
$25MM -$50MM
$50MM -$200MM
$200MM -$500MM
$500MM -$1B >$1B
Yes 54.6% 45.2% 51.0% 53.9% 57.8% 58.1% 54.3% 53.6% 56.8% 65.8%
No 45.4% 54.8% 49.0% 46.1% 42.2% 41.9% 45.7% 46.4% 43.2% 34.2%

For TK use only. Source: PLANSPONSOR Defined Contribution Survey, 2013 10
All data as of November 2013 Updated data available November 2014
For use by Sentinel Benefits & Financial Group only. Source: PLANSPONSOR Defined Contribution Survey, 2014
Prepared December 2014 | page 10
Is your DC plan a “Safe Harbor” plan?
Plan Size
Overall <$1MM $1MM -$5MM
$5MM -$10MM
$10MM -$25MM
$25MM -$50MM
$50MM -$200MM
$200MM -$500MM
$500MM -$1B >$1B
Yes 46.9% 57.6% 55.0% 46.4% 48.7% 41.9% 38.7% 43.8% 40.7% 39.5%
No 53.1% 42.4% 45.0% 53.6% 51.3% 58.1% 61.3% 56.2% 59.3% 60.5%

For TK use only. Source: PLANSPONSOR Defined Contribution Survey, 2013 11
All data as of November 2013 Updated data available November 2014
For use by Sentinel Benefits & Financial Group only. Source: PLANSPONSOR Defined Contribution Survey, 2014
Prepared December 2014 | page 11
If so, which of the following Safe Harbor matching formulas have you adopted?
Plan Size
Overall <$1MM $1MM -$5MM
$5MM -$10MM
$10MM -$25MM
$25MM -$50MM
$50MM -$200MM
$200MM -$500MM
$500MM -$1B >$1B
Basic matching contribution (100% on first 3%; 50% on
next 2%) 27.3% 31.2% 34.0% 29.6% 21.0% 25.6% 25.9% 25.2% 16.1% 21.6%
Enhanced matching contribution (not to exceed 4%
total contribution) 10.5% 18.1% 9.6% 9.9% 8.5% 11.3% 9.6% 14.0% 12.5% 5.2%
Auto-Enrollment matching contribution (100% of first 1%;
50% of next 5%) 3.9% 1.4% 2.0% 2.3% 4.8% 4.4% 4.1% 9.3% 10.7% 5.2%
Non-elective contribution (guaranteed or flexible option
3%) 23.8% 29.7% 29.9% 24.9% 30.1% 20.0% 17.3% 12.1% 12.5% 9.3%
Other 23.4% 9.4% 12.2% 23.5% 25.4% 26.3% 31.5% 30.8% 33.9% 47.4%
Don't know 11.1% 10.1% 12.2% 9.9% 10.3% 12.5% 11.7% 8.4% 14.3% 11.3%

For TK use only. Source: PLANSPONSOR Defined Contribution Survey, 2013 12
All data as of November 2013 Updated data available November 2014
For use by Sentinel Benefits & Financial Group only. Source: PLANSPONSOR Defined Contribution Survey, 2014
Prepared December 2014 | page 12
Does the plan include a loan and/or hardship withdrawal provision?
Plan Size
Overall <$1MM $1MM -$5MM
$5MM -$10MM
$10MM -$25MM
$25MM -$50MM
$50MM -$200MM
$200MM -$500MM
$500MM -$1B >$1B
A loan provision is included 79.2% 62.7% 74.5% 78.2% 79.4% 84.1% 84.7% 87.9% 83.9% 90.2%
A hardship withdrawal provision is included 88.3% 79.9% 86.9% 88.4% 89.8% 87.7% 92.5% 89.7% 89.9% 91.7%

For TK use only. Source: PLANSPONSOR Defined Contribution Survey, 2013 13
All data as of November 2013 Updated data available November 2014
For use by Sentinel Benefits & Financial Group only. Source: PLANSPONSOR Defined Contribution Survey, 2014
Prepared December 2014 | page 13
If loans are offered, what percentage of plan participants have outstanding loans?
Plan Size
Overall <$1MM $1MM -$5MM
$5MM -$10MM
$10MM -$25MM
$25MM -$50MM
$50MM -$200MM
$200MM -$500MM
$500MM -$1B >$1B
Average 14.0% 7.8% 11.8% 12.5% 14.2% 14.7% 15.6% 15.9% 18.3% 20.5%
Median 12.0% 3.0% 10.0% 10.0% 12.6% 12.1% 15.0% 15.0% 18.2% 21.0%

For TK use only. Source: PLANSPONSOR Defined Contribution Survey, 2013 14
All data as of November 2013 Updated data available November 2014
For use by Sentinel Benefits & Financial Group only. Source: PLANSPONSOR Defined Contribution Survey, 2014
Prepared December 2014 | page 14
If offered, what percentage of plan participants have made hardship withdrawals in the past year?
Plan Size
Overall <$1MM $1MM -$5MM
$5MM -$10MM
$10MM -$25MM
$25MM -$50MM
$50MM -$200MM
$200MM -$500MM
$500MM -$1B >$1B
Average 1.4% 0.7% 1.0% 1.2% 1.4% 1.4% 1.7% 1.9% 1.9% 2.6%
Median 0.5% 0.0% 0.0% 0.0% 1.0% 1.0% 1.0% 1.0% 1.0% 1.7%

For TK use only. Source: PLANSPONSOR Defined Contribution Survey, 2013 15
All data as of November 2013 Updated data available November 2014
For use by Sentinel Benefits & Financial Group only. Source: PLANSPONSOR Defined Contribution Survey, 2014
Prepared December 2014 | page 15
Has your plan taken any of the following steps to limit a pre-retirement access to plan assets?
Plan Size
Overall <$1MM $1MM -$5MM
$5MM -$10MM
$10MM -$25MM
$25MM -$50MM
$50MM -$200MM
$200MM -$500MM
$500MM -$1B >$1B
Imposed limits on loan amounts 69.9% 32.5% 62.0% 70.0% 77.1% 77.6% 78.5% 81.3% 71.0% 80.7%
Imposed limits on number of loans 69.4% 27.2% 59.7% 69.7% 75.0% 75.6% 82.1% 82.1% 78.2% 83.8%
Instituted/raised processing charges 14.7% 4.6% 12.1% 10.9% 18.4% 15.5% 16.0% 15.3% 21.0% 26.3%
Enrolled plan in rollover management service 2.5% 4.2% 1.9% 1.5% 3.2% 3.1% 2.3% 2.1% 4.0% 0.9%
Discourage early access in communications 14.1% 9.9% 10.9% 13.5% 15.9% 17.6% 15.0% 12.3% 13.7% 20.6%
No additional steps taken to limit access 19.1% 55.1% 25.9% 18.2% 11.6% 14.2% 10.8% 9.4% 13.7% 9.6%

For TK use only. Source: PLANSPONSOR Defined Contribution Survey, 2013 16
All data as of November 2013 Updated data available November 2014
For use by Sentinel Benefits & Financial Group only. Source: PLANSPONSOR Defined Contribution Survey, 2014
Prepared December 2014 | page 16
Does your organization offer participants general education on any of the following financial topics?
Plan Size
Overall <$1MM $1MM -$5MM
$5MM -$10MM
$10MM -$25MM
$25MM -$50MM
$50MM -$200MM
$200MM -$500MM
$500MM -$1B >$1B
Saving & budgeting 34.4% 14.0% 21.6% 28.0% 33.7% 44.7% 43.6% 53.0% 54.4% 59.6%
Investing strategies 51.7% 24.0% 38.6% 48.5% 55.4% 62.6% 63.4% 64.9% 70.5% 71.9%
Managing credit/debt 14.5% 4.0% 6.9% 11.0% 12.6% 17.4% 18.2% 26.1% 30.9% 37.3%
Home buying 7.1% 2.3% 3.9% 5.9% 6.7% 8.6% 7.0% 10.8% 14.8% 20.0%
College saving 11.7% 3.5% 5.0% 9.5% 9.6% 15.7% 13.9% 17.9% 27.5% 31.5%
Social Security options 11.6% 3.5% 5.2% 6.6% 11.7% 14.4% 18.0% 23.1% 24.8% 20.8%
Tax/estate planning 10.5% 4.3% 4.9% 7.1% 8.5% 13.3% 13.0% 20.9% 20.1% 26.9%
Retiree healthcare costs/savings 19.0% 6.5% 11.2% 12.7% 16.8% 23.9% 27.3% 31.3% 35.6% 37.7%
Long-term care 9.0% 3.0% 5.3% 6.1% 7.0% 11.0% 12.5% 13.4% 21.5% 19.6%
No financial education offered 40.3% 71.8% 54.5% 43.6% 37.7% 27.5% 25.7% 23.9% 22.1% 20.8%

For TK use only. Source: PLANSPONSOR Defined Contribution Survey, 2013 17
All data as of November 2013 Updated data available November 2014
For use by Sentinel Benefits & Financial Group only. Source: PLANSPONSOR Defined Contribution Survey, 2014
Prepared December 2014 | page 17
“Auto” Features

For TK use only. Source: PLANSPONSOR Defined Contribution Survey, 2013 18
All data as of November 2013 Updated data available November 2014
For use by Sentinel Benefits & Financial Group only. Source: PLANSPONSOR Defined Contribution Survey, 2014
Prepared December 2014 | page 18
Do you use automatic enrollment?
Plan Size
Overall <$1MM $1MM -$5MM
$5MM -$10MM
$10MM -$25MM
$25MM -$50MM
$50MM -$200MM
$200MM -$500MM
$500MM -$1B >$1B
Yes 40.0% 17.2% 20.0% 34.3% 45.2% 48.0% 55.4% 60.3% 64.9% 65.2%
No 55.9% 70.2% 71.6% 62.7% 52.9% 50.5% 44.1% 39.0% 34.4% 34.8%
Don't know 4.0% 12.6% 8.4% 3.0% 1.9% 1.5% 0.5% 0.7% 0.7% 0.0%

For TK use only. Source: PLANSPONSOR Defined Contribution Survey, 2013 19
All data as of November 2013 Updated data available November 2014
For use by Sentinel Benefits & Financial Group only. Source: PLANSPONSOR Defined Contribution Survey, 2014
Prepared December 2014 | page 19
When you implemented auto enrollment, which employee groups were included in the rollout?
Plan Size
Overall <$1MM $1MM -$5MM
$5MM -$10MM
$10MM -$25MM
$25MM -$50MM
$50MM -$200MM
$200MM -$500MM
$500MM -$1B >$1B
New / future employees 90.5% 65.7% 88.7% 91.7% 93.0% 93.2% 91.7% 91.7% 90.7% 92.0%
Existing employees not enrolled in plan 30.1% 31.4% 31.5% 28.6% 29.5% 34.0% 30.8% 28.6% 27.9% 30.7%
Employees enrolled in plan but contributing below the default
rate (auto-boost) 14.9% 11.4% 6.5% 15.0% 16.0% 16.3% 17.2% 15.0% 7.0% 13.3%
Employees enrolled in plan but not invested in the QDIA 1.4% 2.9% 0.8% 0.8% 1.5% 1.4% 1.8% 0.8% 0.0% 1.3%
Other 2.9% 8.6% 3.2% 3.0% 1.0% 1.4% 4.1% 3.0% 4.7% 1.3%
For TK use only. Source: PLANSPONSOR Defined Contribution Survey, 2013 20
All data as of November 2013 Updated data available November 2014
For use by Sentinel Benefits & Financial Group only. Source: PLANSPONSOR Defined Contribution Survey, 2014
Prepared December 2014 | page 20
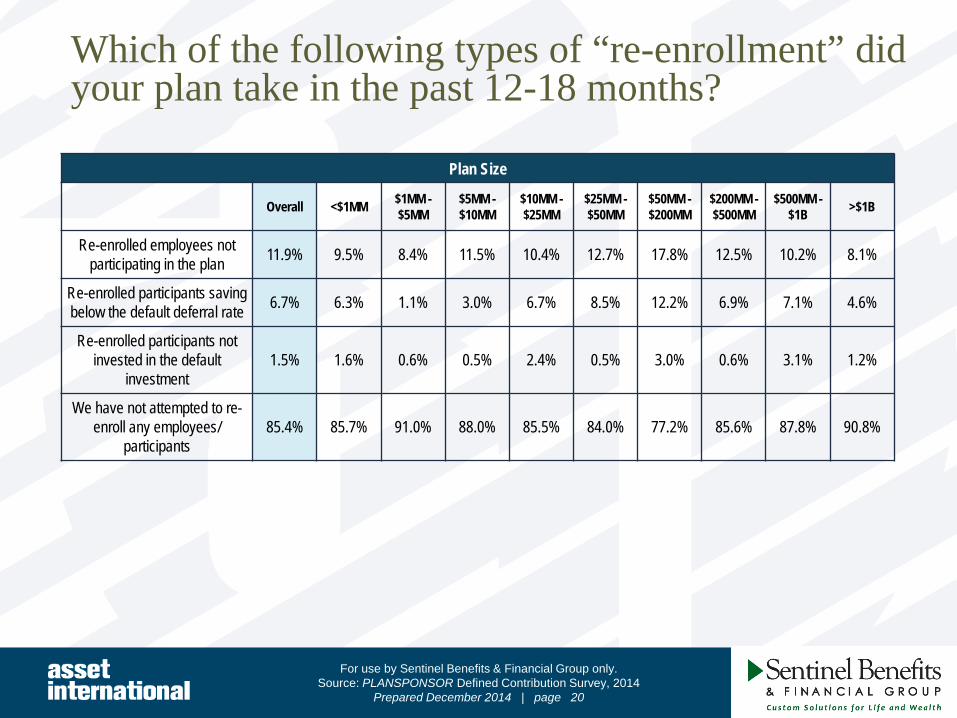
Which of the following types of “re-enrollment” did your plan take in the past 12-18 months?
Plan Size
Overall <$1MM $1MM -$5MM
$5MM -$10MM
$10MM -$25MM
$25MM -$50MM
$50MM -$200MM
$200MM -$500MM
$500MM -$1B >$1B
Re-enrolled employees not participating in the plan 11.9% 9.5% 8.4% 11.5% 10.4% 12.7% 17.8% 12.5% 10.2% 8.1%
Re-enrolled participants saving below the default deferral rate 6.7% 6.3% 1.1% 3.0% 6.7% 8.5% 12.2% 6.9% 7.1% 4.6%
Re-enrolled participants not invested in the default
investment 1.5% 1.6% 0.6% 0.5% 2.4% 0.5% 3.0% 0.6% 3.1% 1.2%
We have not attempted to re-enroll any employees/
participants 85.4% 85.7% 91.0% 88.0% 85.5% 84.0% 77.2% 85.6% 87.8% 90.8%

For TK use only. Source: PLANSPONSOR Defined Contribution Survey, 2013 21
All data as of November 2013 Updated data available November 2014
For use by Sentinel Benefits & Financial Group only. Source: PLANSPONSOR Defined Contribution Survey, 2014
Prepared December 2014 | page 21
What is the default investment for automatic enrollment?
Plan Size
Overall <$1MM $1MM -$5MM
$5MM -$10MM
$10MM -$25MM
$25MM -$50MM
$50MM -$200MM
$200MM -$500MM
$500MM -$1B >$1B
Retail Target-Date Fund (Active) 35.0% 42.3% 34.0% 33.3% 36.8% 27.3% 43.9% 33.7% 26.7% 29.8%
Retail Target-Date Fund (Indexed) 16.6% 5.8% 5.7% 16.2% 14.4% 18.4% 17.6% 27.9% 24.8% 29.3%
Custom Target-Date Fund 8.9% 0.6% 4.0% 8.1% 11.0% 9.4% 7.9% 11.0% 19.0% 14.4%
Risk-based Lifestyle Fund 5.1% 1.3% 5.0% 4.3% 5.2% 6.1% 5.2% 6.4% 9.5% 4.4%
Balanced Fund 10.5% 9.6% 16.0% 15.4% 11.0% 9.4% 10.3% 5.8% 6.7% 3.3%
Professionally Managed Acct 3.8% 2.6% 2.3% 4.7% 2.5% 6.5% 2.7% 5.2% 3.8% 5.5%
Stable Value Fund / GIC 5.8% 7.7% 9.3% 5.6% 8.6% 6.5% 3.0% 2.3% 2.9% 2.2%
Money Market Fund 4.1% 9.0% 8.7% 4.3% 4.6% 4.5% 1.8% 0.6% 0.0% 1.1%
Other 6.4% 4.5% 6.0% 5.6% 4.9% 9.4% 7.0% 6.4% 4.8% 8.8%

For TK use only. Source: PLANSPONSOR Defined Contribution Survey, 2013 22
All data as of November 2013 Updated data available November 2014
For use by Sentinel Benefits & Financial Group only. Source: PLANSPONSOR Defined Contribution Survey, 2014
Prepared December 2014 | page 22
What is the default deferral rate as a percentage of the employee’s salary?
Plan Size
Overall <$1MM $1MM -$5MM
$5MM -$10MM
$10MM -$25MM
$25MM -$50MM
$50MM -$200MM
$200MM -$500MM
$500MM -$1B >$1B
1% 4.2% 2.6% 12.9% 6.4% 4.9% 2.2% 2.6% 0.6% 2.1% 1.7%
2% 10.0% 11.8% 9.3% 13.4% 13.4% 10.4% 10.6% 9.7% 2.1% 3.4%
3% 43.4% 42.1% 40.7% 42.6% 44.8% 52.6% 45.3% 33.9% 43.3% 38.5%
4% 11.6% 3.9% 10.3% 11.4% 12.1% 9.1% 13.8% 15.2% 11.3% 11.5%
5% 8.7% 7.9% 5.7% 6.4% 6.2% 6.5% 8.4% 15.2% 14.4% 13.8%
6% 12.8% 13.2% 9.3% 8.9% 12.1% 12.2% 10.9% 16.4% 16.5% 20.7%
Other 9.3% 18.4% 11.9% 10.9% 6.5% 7.0% 8.4% 9.1% 10.3% 10.3%

For TK use only. Source: PLANSPONSOR Defined Contribution Survey, 2013 23
All data as of November 2013 Updated data available November 2014
For use by Sentinel Benefits & Financial Group only. Source: PLANSPONSOR Defined Contribution Survey, 2014
Prepared December 2014 | page 23
Does your plan offer “auto escalation” (i.e., automatic deferral increases)?
Plan Size
Overall <$1MM $1MM -$5MM
$5MM -$10MM
$10MM -$25MM
$25MM -$50MM
$50MM -$200MM
$200MM -$500MM
$500MM -$1B >$1B
Yes 25.5% 6.5% 8.4% 20.9% 25.6% 31.5% 35.9% 41.1% 47.0% 52.1%
No 67.1% 64.5% 77.7% 73.1% 69.8% 66.1% 62.4% 56.7% 53.0% 46.8%
Don't know 7.4% 29.0% 13.9% 6.1% 4.6% 2.4% 1.6% 2.2% 0.0% 1.1%

For TK use only. Source: PLANSPONSOR Defined Contribution Survey, 2013 24
All data as of November 2013 Updated data available November 2014
For use by Sentinel Benefits & Financial Group only. Source: PLANSPONSOR Defined Contribution Survey, 2014
Prepared December 2014 | page 24
Which of the following ranges best matches your organization’s default automatic escalation rate?
Plan Size
Overall <$1MM $1MM -$5MM
$5MM -$10MM
$10MM -$25MM
$25MM -$50MM
$50MM -$200MM
$200MM -$500MM
$500MM -$1B >$1B
Less than 1% 5.8% 10.5% 17.2% 6.0% 5.9% 3.9% 5.6% 1.9% 6.1% 4.8%
Exactly 1% 86.6% 68.4% 77.6% 85.0% 82.9% 89.0% 91.1% 91.7% 86.4% 86.3%
More than 1% 7.6% 21.1% 5.2% 9.0% 11.2% 7.1% 3.4% 6.5% 7.6% 8.9%

For TK use only. Source: PLANSPONSOR Defined Contribution Survey, 2013 25
All data as of November 2013 Updated data available November 2014
For use by Sentinel Benefits & Financial Group only. Source: PLANSPONSOR Defined Contribution Survey, 2014
Prepared December 2014 | page 25
Participation and Eligibility

For TK use only. Source: PLANSPONSOR Defined Contribution Survey, 2013 26
All data as of November 2013 Updated data available November 2014
For use by Sentinel Benefits & Financial Group only. Source: PLANSPONSOR Defined Contribution Survey, 2014
Prepared December 2014 | page 26
What is the participation rate in your DC plan among eligible employees?
Plan Size
Overall <$1MM $1MM -$5MM
$5MM -$10MM
$10MM -$25MM
$25MM -$50MM
$50MM -$200MM
$200MM -$500MM
$500MM -$1B >$1B
Average 77.2% 72.6% 74.9% 77.9% 77.6% 79.1% 77.5% 80.0% 80.0% 80.8%
Median 83.0% 80.0% 80.0% 83.0% 82.0% 85.0% 84.3% 86.0% 85.0% 87.1%

For TK use only. Source: PLANSPONSOR Defined Contribution Survey, 2013 27
All data as of November 2013 Updated data available November 2014
For use by Sentinel Benefits & Financial Group only. Source: PLANSPONSOR Defined Contribution Survey, 2014
Prepared December 2014 | page 27
Average participant account balances
Plan Size
Overall <$1MM $1MM -$5MM
$5MM -$10MM
$10MM -$25MM
$25MM -$50MM
$50MM -$200MM
$200MM -$500MM
$500MM -$1B >$1B
Average $84,166 $47,794 $81,122 $84,862 $82,357 $90,853 $85,334 $91,819 $95,666 $115,093
Median $65,099 $32,815 $62,940 $70,000 $62,778 $71,024 $69,069 $79,535 $83,941 $106,587

For TK use only. Source: PLANSPONSOR Defined Contribution Survey, 2013 28
All data as of November 2013 Updated data available November 2014
For use by Sentinel Benefits & Financial Group only. Source: PLANSPONSOR Defined Contribution Survey, 2014
Prepared December 2014 | page 28
Average contribution/deferral rate among active participants
Plan Size
Overall <$1MM $1MM -$5MM
$5MM -$10MM
$10MM -$25MM
$25MM -$50MM
$50MM -$200MM
$200MM -$500MM
$500MM -$1B >$1B
Average 6.4% 6.1% 6.2% 6.1% 6.1% 6.5% 6.6% 7.0% 7.5% 7.7%
Median 6.0% 5.0% 5.7% 6.0% 6.0% 6.2% 6.2% 6.6% 7.0% 7.5%

For TK use only. Source: PLANSPONSOR Defined Contribution Survey, 2013 29
All data as of November 2013 Updated data available November 2014
For use by Sentinel Benefits & Financial Group only. Source: PLANSPONSOR Defined Contribution Survey, 2014
Prepared December 2014 | page 29
When are full-time employees eligible to participate in the plan?
Plan Size
Overall <$1MM $1MM -$5MM
$5MM -$10MM
$10MM -$25MM
$25MM -$50MM
$50MM -$200MM
$200MM -$500MM
$500MM -$1B >$1B
Immediately upon hire 36.7% 19.8% 17.5% 21.8% 31.4% 38.3% 55.5% 71.6% 76.8% 77.1%
Within 3 months 26.3% 19.6% 25.1% 30.5% 31.2% 34.5% 25.4% 21.8% 16.6% 16.9%
After 4 to 6 months 9.0% 8.9% 12.3% 11.8% 11.0% 8.2% 7.4% 1.8% 0.7% 2.3%
After more than 6 months 28.0% 51.7% 45.2% 35.9% 26.4% 18.9% 11.7% 4.8% 6.0% 3.8%
For TK use only. Source: PLANSPONSOR Defined Contribution Survey, 2013 30
All data as of November 2013 Updated data available November 2014
For use by Sentinel Benefits & Financial Group only. Source: PLANSPONSOR Defined Contribution Survey, 2014
Prepared December 2014 | page 30
Employer Match
For TK use only. Source: PLANSPONSOR Defined Contribution Survey, 2013 31
All data as of November 2013 Updated data available November 2014
For use by Sentinel Benefits & Financial Group only. Source: PLANSPONSOR Defined Contribution Survey, 2014
Prepared December 2014 | page 31
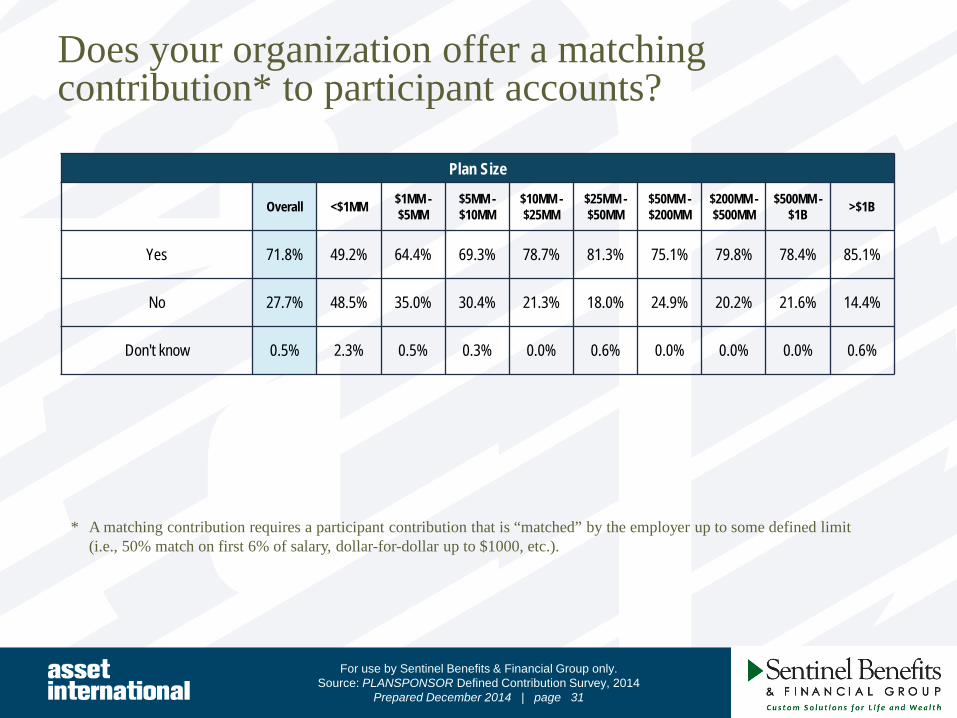
Does your organization offer a matching contribution* to participant accounts?
* A matching contribution requires a participant contribution that is “matched” by the employer up to some defined limit (i.e., 50% match on first 6% of salary, dollar-for-dollar up to $1000, etc.).
Plan Size
Overall <$1MM $1MM -$5MM
$5MM -$10MM
$10MM -$25MM
$25MM -$50MM
$50MM -$200MM
$200MM -$500MM
$500MM -$1B >$1B
Yes 71.8% 49.2% 64.4% 69.3% 78.7% 81.3% 75.1% 79.8% 78.4% 85.1%
No 27.7% 48.5% 35.0% 30.4% 21.3% 18.0% 24.9% 20.2% 21.6% 14.4%
Don't know 0.5% 2.3% 0.5% 0.3% 0.0% 0.6% 0.0% 0.0% 0.0% 0.6%

For TK use only. Source: PLANSPONSOR Defined Contribution Survey, 2013 32
All data as of November 2013 Updated data available November 2014
For use by Sentinel Benefits & Financial Group only. Source: PLANSPONSOR Defined Contribution Survey, 2014
Prepared December 2014 | page 32
Does your organization offer a non-elective or profit sharing contribution* to participant accounts?
* These contributions generally do NOT require participant contributions.
Plan Size
Overall <$1MM $1MM -$5MM
$5MM -$10MM
$10MM -$25MM
$25MM -$50MM
$50MM -$200MM
$200MM -$500MM
$500MM -$1B >$1B
Yes 44.4% 32.1% 43.1% 44.8% 49.3% 48.7% 48.5% 44.6% 46.4% 37.9%
No 52.3% 55.8% 53.7% 51.6% 49.3% 49.1% 49.6% 53.0% 52.6% 60.9%
Don't know 3.3% 12.1% 3.2% 3.7% 1.5% 2.2% 1.9% 2.4% 1.0% 1.1%

For TK use only. Source: PLANSPONSOR Defined Contribution Survey, 2013 33
All data as of November 2013 Updated data available November 2014
For use by Sentinel Benefits & Financial Group only. Source: PLANSPONSOR Defined Contribution Survey, 2014
Prepared December 2014 | page 33
If you provide a match, please select the option that most closely relates to your match formula:
Plan Size
Overall <$1MM $1MM -$5MM
$5MM -$10MM
$10MM -$25MM
$25MM -$50MM
$50MM -$200MM
$200MM -$500MM
$500MM -$1B >$1B
More than 100% of first 6% of salary 7.7% 6.5% 6.3% 7.4% 8.9% 7.2% 5.4% 11.1% 10.7% 11.1%
100% of first 6% of salary 9.6% 8.9% 6.8% 5.4% 9.2% 8.8% 9.7% 13.3% 14.7% 20.1%
51%-99% of first 6% of salary 19.8% 22.0% 21.0% 17.1% 12.4% 16.8% 20.4% 25.2% 30.7% 29.9%
50% of first 6% of salary 27.1% 22.8% 22.2% 26.8% 28.6% 33.2% 33.3% 26.7% 22.7% 19.4%
Less than 50% of first 6% of salary 28.8% 30.1% 36.6% 35.0% 34.9% 26.8% 25.4% 19.3% 17.3% 9.0%
Other 7.0% 9.8% 7.1% 8.2% 6.0% 7.2% 5.7% 4.4% 4.0% 10.4%

For TK use only. Source: PLANSPONSOR Defined Contribution Survey, 2013 34
All data as of November 2013 Updated data available November 2014
For use by Sentinel Benefits & Financial Group only. Source: PLANSPONSOR Defined Contribution Survey, 2014
Prepared December 2014 | page 34
If you provide a match, how frequently are matching contributions made to plan participants?
Plan Size
Overall <$1MM $1MM -$5MM
$5MM -$10MM
$10MM -$25MM
$25MM -$50MM
$50MM -$200MM
$200MM -$500MM
$500MM -$1B >$1B
Each pay period 73.9% 70.4% 71.6% 74.5% 70.6% 130.6% 73.7% 81.7% 88.3% 81.9%
Monthly 5.3% 6.6% 7.4% 3.6% 6.1% 7.8% 5.7% 3.0% 2.3% 3.8%
Quarterly 3.1% 1.6% 2.8% 3.6% 3.0% 4.6% 4.3% 2.6% 0.8% 4.6%
Annually 15.9% 19.1% 16.6% 19.1% 18.0% 33.3% 15.2% 10.2% 7.8% 8.0%
Other 1.9% 2.3% 1.6% 2.5% 2.3% 3.2% 1.1% 2.6% 0.8% 1.7%

For TK use only. Source: PLANSPONSOR Defined Contribution Survey, 2013 35
All data as of November 2013 Updated data available November 2014
For use by Sentinel Benefits & Financial Group only. Source: PLANSPONSOR Defined Contribution Survey, 2014
Prepared December 2014 | page 35
Does your plan include a provision to “true up” matching contributions*?
* A “true up” match can be used to restore matching contributions “lost” when a participant reaches the annual contribution limit prior to year-end and thus foregoes the opportunity to make additional contributions that would otherwise have been matched. In such situation, a plan may elect to “true up” the employer matching contribution.
Plan Size
Overall <$1MM $1MM -$5MM
$5MM -$10MM
$10MM -$25MM
$25MM -$50MM
$50MM -$200MM
$200MM -$500MM
$500MM -$1B >$1B
Yes 27.8% 15.5% 17.6% 19.7% 25.0% 29.8% 38.7% 47.9% 41.4% 44.1%
No 56.6% 48.8% 56.5% 62.9% 61.5% 60.1% 54.8% 49.6% 50.8% 49.6%
Don't know 15.6% 35.7% 25.8% 17.4% 13.5% 10.2% 6.5% 2.6% 7.8% 6.3%

For TK use only. Source: PLANSPONSOR Defined Contribution Survey, 2013 36
All data as of November 2013 Updated data available November 2014
For use by Sentinel Benefits & Financial Group only. Source: PLANSPONSOR Defined Contribution Survey, 2014
Prepared December 2014 | page 36
What percentage of active participants are deferring enough to take full advantage of the maximum employer match?
Plan Size
Overall <$1MM $1MM -$5MM
$5MM -$10MM
$10MM -$25MM
$25MM -$50MM
$50MM -$200MM
$200MM -$500MM
$500MM -$1B >$1B
All or nearly all participants (90% or more) 24.7% 35.1% 35.6% 28.6% 20.8% 15.0% 17.0% 16.9% 23.4% 20.0%
Vast majority (75% or more) 25.1% 16.8% 20.0% 22.1% 25.7% 26.4% 29.8% 30.7% 25.8% 37.8%
More than average (>50% but less than 75%) 25.1% 14.1% 16.2% 21.5% 28.7% 28.5% 33.0% 33.3% 32.8% 29.6%
Less than average (>25% but less than 50%) 14.1% 13.4% 13.3% 16.5% 15.3% 18.1% 12.8% 9.1% 12.5% 10.9%
A minority (Between 10% and 25%) 5.7% 8.4% 6.5% 5.4% 4.5% 8.0% 4.8% 6.9% 3.1% 1.3%
Very few (<10%) 5.4% 12.2% 8.3% 5.9% 5.0% 3.9% 2.6% 3.0% 2.3% 0.4%

For TK use only. Source: PLANSPONSOR Defined Contribution Survey, 2013 37
All data as of November 2013 Updated data available November 2014
For use by Sentinel Benefits & Financial Group only. Source: PLANSPONSOR Defined Contribution Survey, 2014
Prepared December 2014 | page 37
How long before participants are 100% vested in the match?
Plan Size
Overall <$1MM $1MM -$5MM
$5MM -$10MM
$10MM -$25MM
$25MM -$50MM
$50MM -$200MM
$200MM -$500MM
$500MM -$1B >$1B
Immediately upon enrollment 34.6% 40.9% 28.8% 29.6% 32.0% 33.2% 42.3% 40.3% 38.0% 42.6%
6 months 1.0% 1.5% 1.2% 0.6% 1.1% 0.0% 0.9% 2.1% 1.6% 0.9%
1 year 5.1% 12.4% 4.0% 3.8% 3.5% 4.7% 4.1% 7.2% 8.5% 6.0%
2 years 4.3% 1.9% 2.3% 4.3% 3.9% 2.5% 4.8% 8.5% 7.8% 10.2%
3 years 12.9% 8.1% 10.5% 7.5% 12.1% 15.7% 14.0% 19.9% 20.9% 19.6%
4 years 3.6% 1.9% 3.3% 3.4% 3.5% 4.2% 4.5% 5.5% 3.1% 2.1%
5 years 21.7% 17.0% 27.3% 24.5% 25.5% 23.4% 16.6% 11.4% 15.5% 15.7%
more than 5 years 16.7% 16.2% 22.6% 26.2% 18.3% 16.2% 12.7% 5.1% 4.7% 3.0%

For TK use only. Source: PLANSPONSOR Defined Contribution Survey, 2013 38
All data as of November 2013 Updated data available November 2014
For use by Sentinel Benefits & Financial Group only. Source: PLANSPONSOR Defined Contribution Survey, 2014
Prepared December 2014 | page 38
Which of the following actions relating to the match has your organization taken in the past 3 years?
Plan Size
Overall <$1MM $1MM -$5MM
$5MM -$10MM
$10MM -$25MM
$25MM -$50MM
$50MM -$200MM
$200MM -$500MM
$500MM -$1B >$1B
Increased matching contribution 11.9% 6.5% 10.3% 9.8% 13.7% 12.1% 14.0% 13.6% 12.4% 16.2%
Decreased matching contribution 3.1% 1.9% 2.5% 4.1% 2.8% 3.8% 2.6% 5.5% 3.1% 3.0%
“Stretched” matching contribution (i.e., was 100% on first 3%; now 50% on first 6%)
1.4% 0.0% 0.8% 2.1% 1.4% 1.8% 1.1% 3.0% 1.6% 1.3%
Changed match frequency 2.9% 1.9% 1.0% 2.3% 2.8% 2.5% 4.8% 5.5% 3.9% 4.7%
Suspended match 3.2% 4.6% 3.7% 4.3% 5.0% 2.3% 1.3% 1.7% 0.8% 1.3%
None: Have made no changes to match in past 3 years 80.6% 87.0% 83.3% 81.0% 78.1% 80.4% 79.7% 75.7% 79.8% 76.6%

For TK use only. Source: PLANSPONSOR Defined Contribution Survey, 2013 39
All data as of November 2013 Updated data available November 2014
For use by Sentinel Benefits & Financial Group only. Source: PLANSPONSOR Defined Contribution Survey, 2014
Prepared December 2014 | page 39
Plan Investments

For TK use only. Source: PLANSPONSOR Defined Contribution Survey, 2013 40
All data as of November 2013 Updated data available November 2014
For use by Sentinel Benefits & Financial Group only. Source: PLANSPONSOR Defined Contribution Survey, 2014
Prepared December 2014 | page 40
Do you currently offer any of the following types of investment options in your plan?
Plan Size
Overall <$1MM $1MM -$5MM
$5MM -$10MM
$10MM -$25MM
$25MM -$50MM
$50MM -$200MM
$200MM -$500MM
$500MM -$1B >$1B
Target-date funds 69.8% 48.2% 60.3% 71.5% 72.5% 69.2% 76.5% 83.3% 78.9% 86.3%
Target-risk funds (i.e., "growth,” "conservative," etc.) 39.5% 50.3% 50.2% 48.8% 40.7% 32.6% 30.9% 31.4% 26.5% 12.5%
Balanced funds 73.1% 64.6% 75.6% 78.9% 77.4% 75.3% 72.1% 66.7% 71.4% 59.0%
Money Market Fund 63.5% 62.2% 66.8% 68.6% 61.5% 62.3% 62.9% 64.7% 57.8% 53.9%
Employer Stock 7.7% 1.5% 1.3% 2.9% 2.4% 4.8% 8.3% 17.1% 28.6% 43.4%
Stable Value Fund 59.7% 25.3% 43.7% 60.8% 65.1% 66.4% 73.2% 76.0% 79.6% 73.4%
Real Estate/REITS 27.8% 17.7% 24.9% 24.3% 32.5% 28.3% 32.7% 36.0% 29.9% 26.2%
Alternative Investments (hedge funds, private equity, etc.) 4.8% 5.2% 4.6% 6.5% 4.1% 4.1% 5.3% 4.3% 4.1% 4.3%
Socially Responsible Funds 11.3% 9.8% 8.9% 9.6% 11.2% 10.0% 13.6% 14.7% 21.1% 13.7%

For TK use only. Source: PLANSPONSOR Defined Contribution Survey, 2013 41
All data as of November 2013 Updated data available November 2014
For use by Sentinel Benefits & Financial Group only. Source: PLANSPONSOR Defined Contribution Survey, 2014
Prepared December 2014 | page 41
Have you considered building a customized target-date series for your plan?
Plan Size
Overall <$1MM $1MM -$5MM
$5MM -$10MM
$10MM -$25MM
$25MM -$50MM
$50MM -$200MM
$200MM -$500MM
$500MM -$1B >$1B
Yes--considering 13.0% 7.5% 7.8% 9.8% 11.9% 10.6% 14.3% 19.7% 21.5% 29.1%
No--have not considered 77.0% 87.1% 84.7% 79.1% 78.8% 80.3% 74.2% 71.1% 67.7% 54.3%
Already in place 10.0% 5.4% 7.6% 11.0% 9.3% 9.1% 11.5% 9.2% 10.8% 16.6%

For TK use only. Source: PLANSPONSOR Defined Contribution Survey, 2013 42
All data as of November 2013 Updated data available November 2014
For use by Sentinel Benefits & Financial Group only. Source: PLANSPONSOR Defined Contribution Survey, 2014
Prepared December 2014 | page 42
Do you offer a professionally managed account to participants as an investment option?
Plan Size
Overall <$1MM $1MM -$5MM
$5MM -$10MM
$10MM -$25MM
$25MM -$50MM
$50MM -$200MM
$200MM -$500MM
$500MM -$1B >$1B
Yes 35.6% 39.0% 36.0% 29.8% 31.9% 16.9% 32.5% 35.7% 45.6% 48.8%
No 64.4% 61.0% 64.0% 70.2% 68.1% 83.1% 67.5% 64.3% 54.4% 51.2%

For TK use only. Source: PLANSPONSOR Defined Contribution Survey, 2013 43
All data as of November 2013 Updated data available November 2014
For use by Sentinel Benefits & Financial Group only. Source: PLANSPONSOR Defined Contribution Survey, 2014
Prepared December 2014 | page 43
How many investment options are offered in your defined contribution plan?
Plan Size
Overall <$1MM $1MM -$5MM
$5MM -$10MM
$10MM -$25MM
$25MM -$50MM
$50MM -$200MM
$200MM -$500MM
$500MM -$1B >$1B
Average 20.6 23.2 22.1 21.8 20.3 20.1 19.3 19.4 19.3 16.8
Median 19.0 24.0 20.0 20.0 19.0 18.0 18.0 18.0 17.0 15.0

For TK use only. Source: PLANSPONSOR Defined Contribution Survey, 2013 44
All data as of November 2013 Updated data available November 2014
For use by Sentinel Benefits & Financial Group only. Source: PLANSPONSOR Defined Contribution Survey, 2014
Prepared December 2014 | page 44
What is the average number of investment options held by your DC plan participants?
Plan Size
Overall <$1MM $1MM -$5MM
$5MM -$10MM
$10MM -$25MM
$25MM -$50MM
$50MM -$200MM
$200MM -$500MM
$500MM -$1B >$1B
Average 5.1 4.6 5.8 5.3 5.2 5.3 5.0 4.6 4.5 4.0
Median 4.0 4.0 5.0 4.0 4.4 4.8 4.0 4.0 4.0 4.0

For TK use only. Source: PLANSPONSOR Defined Contribution Survey, 2013 45
All data as of November 2013 Updated data available November 2014
For use by Sentinel Benefits & Financial Group only. Source: PLANSPONSOR Defined Contribution Survey, 2014
Prepared December 2014 | page 45
Which investment vehicles is your organization currently using in its DC plan?
Plan Size
Overall <$1MM $1MM -$5MM
$5MM -$10MM
$10MM -$25MM
$25MM -$50MM
$50MM -$200MM
$200MM -$500MM
$500MM -$1B >$1B
Mutual Funds 92.3% 88.3% 90.5% 91.3% 94.8% 93.1% 96.8% 94.9% 97.2% 83.9%
Separate Accounts 22.0% 19.5% 23.6% 22.1% 20.2% 18.4% 15.1% 19.9% 23.4% 46.3%
Collective Investment Trust 14.9% 8.7% 8.7% 8.5% 8.2% 10.1% 14.5% 24.2% 40.0% 58.4%
ETFs (outside of brokerage windows) 7.1% 12.0% 9.7% 7.5% 7.3% 4.6% 3.6% 5.1% 2.1% 7.1%
Self-directed Brokerage Window 18.3% 3.3% 8.8% 11.9% 13.5% 19.4% 26.4% 32.8% 42.1% 47.5%
Mutual Fund Window 4.5% 3.9% 5.0% 3.0% 4.2% 3.5% 4.7% 4.7% 3.4% 8.6%
Other 5.1% 4.8% 4.8% 4.7% 3.4% 4.6% 3.6% 9.4% 13.1% 7.1%

For TK use only. Source: PLANSPONSOR Defined Contribution Survey, 2013 46
All data as of November 2013 Updated data available November 2014
For use by Sentinel Benefits & Financial Group only. Source: PLANSPONSOR Defined Contribution Survey, 2014
Prepared December 2014 | page 46
How often do you formally review the investment options?
Plan Size
Overall <$1MM $1MM -$5MM
$5MM -$10MM
$10MM -$25MM
$25MM -$50MM
$50MM -$200MM
$200MM -$500MM
$500MM -$1B >$1B
Monthly 1.1% 1.3% 1.1% 0.3% 0.6% 1.5% 0.7% 2.2% 1.4% 2.7%
Quarterly 31.7% 9.3% 16.0% 20.1% 35.1% 42.3% 50.4% 50.4% 49.0% 49.8%
Twice a year 13.9% 8.0% 11.1% 18.0% 17.6% 18.9% 15.2% 11.6% 9.0% 7.8%
Annually 40.3% 44.1% 53.5% 49.0% 39.8% 29.7% 27.5% 30.6% 32.4% 30.2%
Every 1-2 years 4.4% 9.8% 5.6% 3.5% 3.5% 2.8% 2.9% 1.1% 6.2% 4.7%
Every 2-3 years 2.2% 4.3% 2.5% 3.1% 0.9% 2.0% 1.3% 2.2% 0.0% 2.7%
Every 3+ years 1.8% 3.2% 2.8% 2.2% 0.6% 1.7% 1.1% 0.7% 1.4% 1.6%
Never 4.6% 19.9% 7.5% 3.8% 1.8% 1.1% 0.9% 1.1% 0.7% 0.4%

For TK use only. Source: PLANSPONSOR Defined Contribution Survey, 2013 47
All data as of November 2013 Updated data available November 2014
For use by Sentinel Benefits & Financial Group only. Source: PLANSPONSOR Defined Contribution Survey, 2014
Prepared December 2014 | page 47
Retirement Income

For TK use only. Source: PLANSPONSOR Defined Contribution Survey, 2013 48
All data as of November 2013 Updated data available November 2014
For use by Sentinel Benefits & Financial Group only. Source: PLANSPONSOR Defined Contribution Survey, 2014
Prepared December 2014 | page 48
Which (if any) retirement income-oriented products/services do you offer in your plan?
Plan Size
Overall <$1MM $1MM -$5MM
$5MM -$10MM
$10MM -$25MM
$25MM -$50MM
$50MM -$200MM
$200MM -$500MM
$500MM -$1B >$1B
In-plan income products that guarantee monthly income 9.1% 6.6% 6.6% 11.1% 8.6% 8.5% 10.2% 11.8% 15.6% 11.0%
In-plan income products that guarantee a base benefit 4.0% 3.7% 3.3% 5.1% 3.2% 3.5% 3.8% 6.3% 7.1% 3.5%
In-plan income NOT offering guarantees 8.2% 5.5% 7.2% 7.1% 6.5% 8.3% 7.5% 13.7% 14.2% 14.1%
Out of plan annuity purchase/bidding service 4.7% 1.4% 3.0% 3.8% 3.0% 4.8% 4.4% 7.8% 9.2% 16.1%
Don't know 33.1% 52.3% 46.2% 38.3% 31.9% 31.3% 22.1% 17.6% 7.8% 7.8%
No income products offered 47.2% 34.2% 38.7% 42.4% 51.7% 47.5% 57.8% 54.9% 59.6% 57.3%
For TK use only. Source: PLANSPONSOR Defined Contribution Survey, 2013 49
All data as of November 2013 Updated data available November 2014
For use by Sentinel Benefits & Financial Group only. Source: PLANSPONSOR Defined Contribution Survey, 2014
Prepared December 2014 | page 49
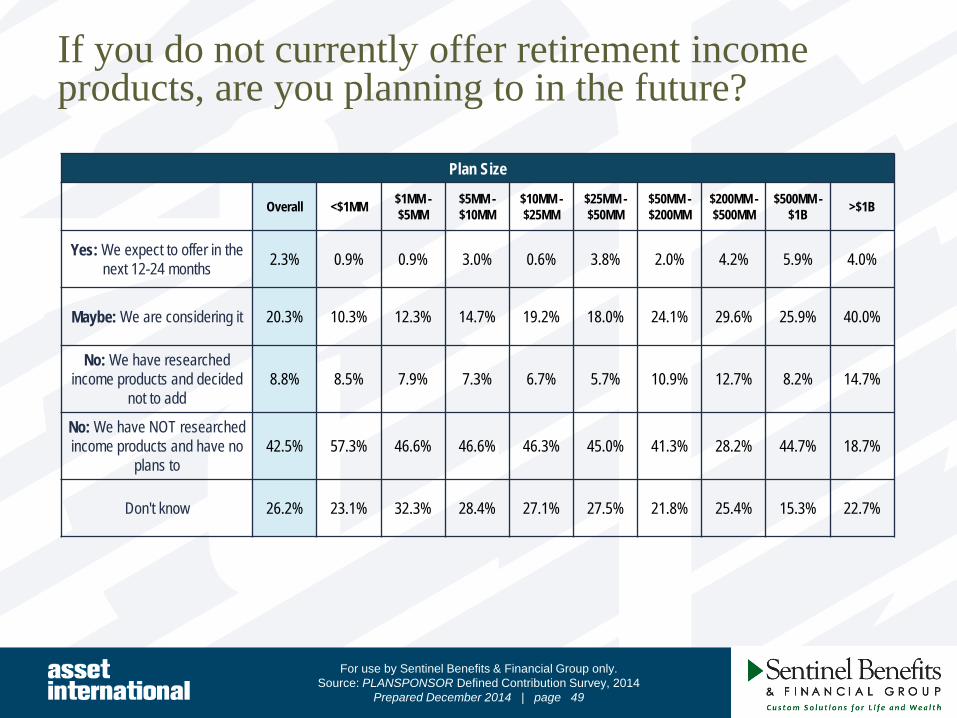
If you do not currently offer retirement income products, are you planning to in the future?
Plan Size
Overall <$1MM $1MM -$5MM
$5MM -$10MM
$10MM -$25MM
$25MM -$50MM
$50MM -$200MM
$200MM -$500MM
$500MM -$1B >$1B
Yes: We expect to offer in the next 12-24 months 2.3% 0.9% 0.9% 3.0% 0.6% 3.8% 2.0% 4.2% 5.9% 4.0%
Maybe: We are considering it 20.3% 10.3% 12.3% 14.7% 19.2% 18.0% 24.1% 29.6% 25.9% 40.0%
No: We have researched income products and decided
not to add 8.8% 8.5% 7.9% 7.3% 6.7% 5.7% 10.9% 12.7% 8.2% 14.7%
No: We have NOT researched income products and have no
plans to 42.5% 57.3% 46.6% 46.6% 46.3% 45.0% 41.3% 28.2% 44.7% 18.7%
Don't know 26.2% 23.1% 32.3% 28.4% 27.1% 27.5% 21.8% 25.4% 15.3% 22.7%

For TK use only. Source: PLANSPONSOR Defined Contribution Survey, 2013 50
All data as of November 2013 Updated data available November 2014
For use by Sentinel Benefits & Financial Group only. Source: PLANSPONSOR Defined Contribution Survey, 2014
Prepared December 2014 | page 50
Does your defined contribution plan design allow for systematic withdrawals* at retirement?
* Systematic withdrawals (vs. lump sum or partial distributions) allow participants to schedule a series of recurring payments, thus creating a predictable stream of retirement income.
Plan Size
Overall <$1MM $1MM -$5MM
$5MM -$10MM
$10MM -$25MM
$25MM -$50MM
$50MM -$200MM
$200MM -$500MM
$500MM -$1B >$1B
Yes 55.7% 38.6% 48.4% 56.7% 58.5% 58.5% 57.8% 67.3% 60.6% 64.7%
No 23.9% 13.6% 19.4% 20.0% 24.4% 27.5% 29.8% 28.1% 32.4% 29.5%
Don't know 20.3% 47.8% 32.2% 23.3% 17.1% 14.1% 12.4% 4.6% 7.0% 5.8%

For TK use only. Source: PLANSPONSOR Defined Contribution Survey, 2013 51
All data as of November 2013 Updated data available November 2014
For use by Sentinel Benefits & Financial Group only. Source: PLANSPONSOR Defined Contribution Survey, 2014
Prepared December 2014 | page 51
Fees/Expenses

For TK use only. Source: PLANSPONSOR Defined Contribution Survey, 2013 52
All data as of November 2013 Updated data available November 2014
For use by Sentinel Benefits & Financial Group only. Source: PLANSPONSOR Defined Contribution Survey, 2014
Prepared December 2014 | page 52
What is the approximate average asset-weighted expense ratio of all investment options in your plan?
Plan Size
Overall <$1MM $1MM -$5MM
$5MM -$10MM
$10MM -$25MM
$25MM -$50MM
$50MM -$200MM
$200MM -$500MM
$500MM -$1B >$1B
Less than 0.25% (<25 bps) 9.2% 7.7% 5.8% 5.6% 7.1% 9.3% 10.3% 13.1% 13.3% 28.3%
0.25%-.50% (25-50 bps) 16.7% 9.3% 11.2% 10.8% 12.8% 15.0% 21.0% 29.6% 37.1% 39.5%
0.51%-.75% (51-75 bps) 15.7% 2.6% 9.4% 11.5% 13.5% 20.2% 28.5% 33.1% 23.1% 15.5%
0.76%-1% (76-100 bps) 15.2% 5.6% 11.1% 22.2% 26.5% 22.7% 14.9% 6.5% 7.0% 1.6%
1.01%-1.50% (101-150 bps) 7.1% 6.1% 11.7% 12.2% 9.1% 4.1% 1.8% 1.2% 0.7% 1.9%
1.51%-2.00% (151-200 bps) 0.9% 2.6% 1.5% 1.2% 0.3% 0.7% 0.2% 0.0% 0.0% 0.0%
2.01%-2.50% (201-250 bps) 0.1% 0.5% 0.2% 0.0% 0.0% 0.2% 0.0% 0.0% 0.7% 0.0%
More than 2.50% (more than 250 bps) 0.1% 0.3% 0.0% 0.0% 0.2% 0.0% 0.2% 0.0% 0.0% 0.0%
Don't know 34.8% 65.1% 49.1% 36.2% 30.2% 27.5% 22.5% 16.5% 18.2% 13.2%

For TK use only. Source: PLANSPONSOR Defined Contribution Survey, 2013 53
All data as of November 2013 Updated data available November 2014
For use by Sentinel Benefits & Financial Group only. Source: PLANSPONSOR Defined Contribution Survey, 2014
Prepared December 2014 | page 53
Does your organization/plan have a policy to address fee equalization?
Plan Size
Overall <$1MM $1MM -$5MM
$5MM -$10MM
$10MM -$25MM
$25MM -$50MM
$50MM -$200MM
$200MM -$500MM
$500MM -$1B >$1B
Yes, a policy is in place 12.9% 6.6% 10.1% 10.8% 11.6% 15.4% 17.7% 17.9% 17.1% 18.5%
No, but we plan to implement in the next year 3.6% 2.1% 2.2% 2.3% 2.8% 5.6% 4.4% 6.1% 8.9% 5.9%
No, but we may develop one in future 13.7% 7.7% 10.4% 12.3% 14.1% 14.5% 17.3% 20.9% 20.5% 15.7%
No, and no plans to 27.0% 33.9% 28.2% 28.0% 27.6% 23.5% 27.7% 19.0% 20.5% 25.2%
Don't know 42.8% 49.7% 49.1% 46.7% 43.9% 40.9% 33.0% 36.1% 32.9% 34.6%
For TK use only. Source: PLANSPONSOR Defined Contribution Survey, 2013 54
All data as of November 2013 Updated data available November 2014
For use by Sentinel Benefits & Financial Group only. Source: PLANSPONSOR Defined Contribution Survey, 2014
Prepared December 2014 | page 54
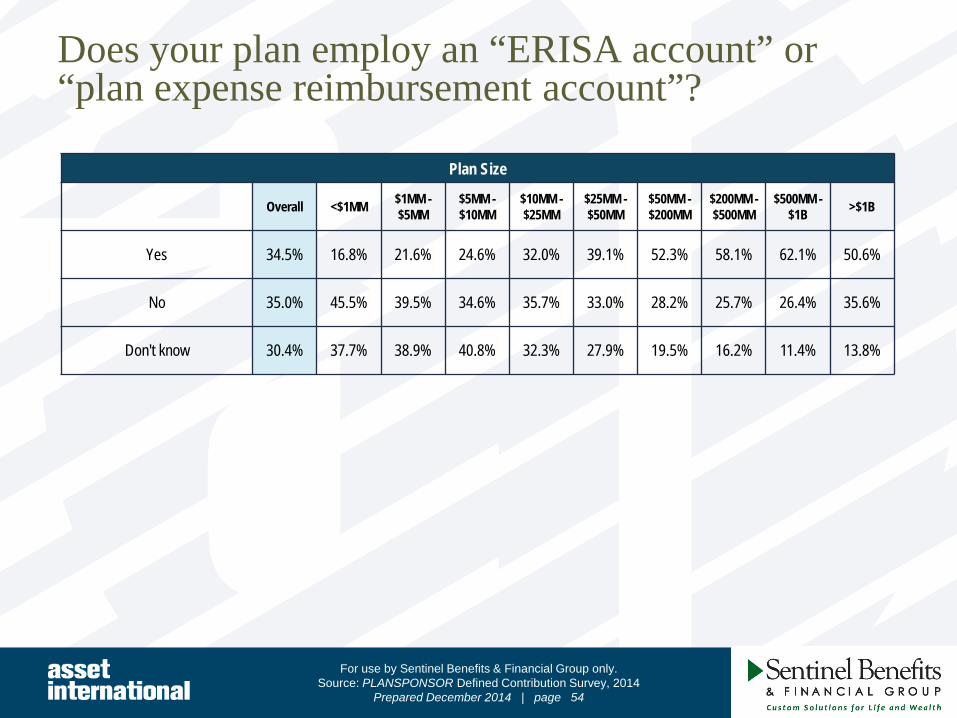
Does your plan employ an “ERISA account” or “plan expense reimbursement account”?
Plan Size
Overall <$1MM $1MM -$5MM
$5MM -$10MM
$10MM -$25MM
$25MM -$50MM
$50MM -$200MM
$200MM -$500MM
$500MM -$1B >$1B
Yes 34.5% 16.8% 21.6% 24.6% 32.0% 39.1% 52.3% 58.1% 62.1% 50.6%
No 35.0% 45.5% 39.5% 34.6% 35.7% 33.0% 28.2% 25.7% 26.4% 35.6%
Don't know 30.4% 37.7% 38.9% 40.8% 32.3% 27.9% 19.5% 16.2% 11.4% 13.8%
For TK use only. Source: PLANSPONSOR Defined Contribution Survey, 2013 55
All data as of November 2013 Updated data available November 2014
For use by Sentinel Benefits & Financial Group only. Source: PLANSPONSOR Defined Contribution Survey, 2014
Prepared December 2014 | page 55
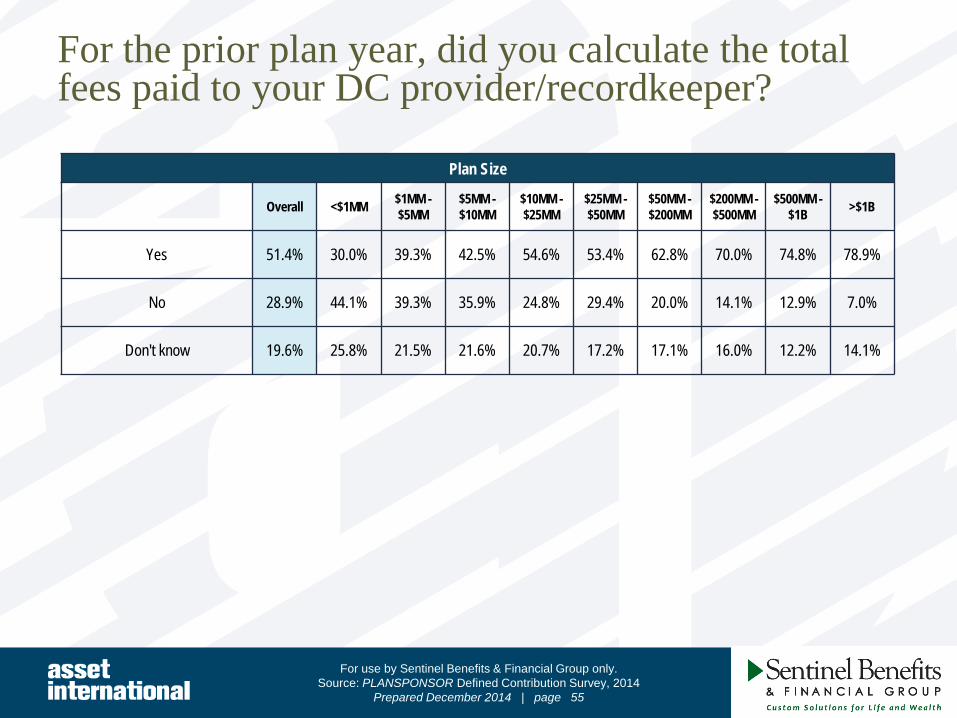
For the prior plan year, did you calculate the total fees paid to your DC provider/recordkeeper?
Plan Size
Overall <$1MM $1MM -$5MM
$5MM -$10MM
$10MM -$25MM
$25MM -$50MM
$50MM -$200MM
$200MM -$500MM
$500MM -$1B >$1B
Yes 51.4% 30.0% 39.3% 42.5% 54.6% 53.4% 62.8% 70.0% 74.8% 78.9%
No 28.9% 44.1% 39.3% 35.9% 24.8% 29.4% 20.0% 14.1% 12.9% 7.0%
Don't know 19.6% 25.8% 21.5% 21.6% 20.7% 17.2% 17.1% 16.0% 12.2% 14.1%

For TK use only. Source: PLANSPONSOR Defined Contribution Survey, 2013 56
All data as of November 2013 Updated data available November 2014
For use by Sentinel Benefits & Financial Group only. Source: PLANSPONSOR Defined Contribution Survey, 2014
Prepared December 2014 | page 56
If you recently calculated your admin fees, have you benchmarked those fees against similar plans?
Plan Size
Overall <$1MM $1MM -$5MM
$5MM -$10MM
$10MM -$25MM
$25MM -$50MM
$50MM -$200MM
$200MM -$500MM
$500MM -$1B >$1B
Yes 68.5% 50.8% 63.4% 63.9% 68.2% 71.4% 73.9% 76.5% 69.6% 73.3%
No 27.7% 45.8% 33.6% 32.5% 28.5% 26.1% 22.1% 18.2% 25.9% 19.4%
Don't know 3.9% 3.4% 3.0% 3.5% 3.3% 2.4% 4.0% 5.3% 4.5% 7.3%
For TK use only. Source: PLANSPONSOR Defined Contribution Survey, 2013 57
All data as of November 2013 Updated data available November 2014
For use by Sentinel Benefits & Financial Group only. Source: PLANSPONSOR Defined Contribution Survey, 2014
Prepared December 2014 | page 57
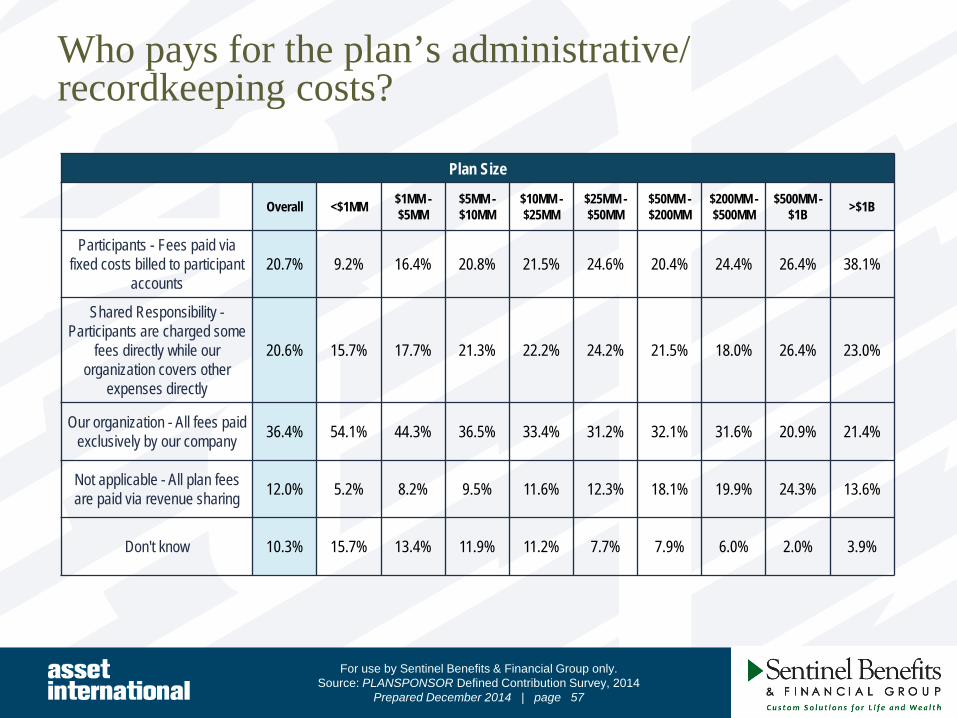
Who pays for the plan’s administrative/ recordkeeping costs?
Plan Size
Overall <$1MM $1MM -$5MM
$5MM -$10MM
$10MM -$25MM
$25MM -$50MM
$50MM -$200MM
$200MM -$500MM
$500MM -$1B >$1B
Participants - Fees paid via fixed costs billed to participant
accounts 20.7% 9.2% 16.4% 20.8% 21.5% 24.6% 20.4% 24.4% 26.4% 38.1%
Shared Responsibility - Participants are charged some
fees directly while our organization covers other
expenses directly
20.6% 15.7% 17.7% 21.3% 22.2% 24.2% 21.5% 18.0% 26.4% 23.0%
Our organization - All fees paid exclusively by our company 36.4% 54.1% 44.3% 36.5% 33.4% 31.2% 32.1% 31.6% 20.9% 21.4%
Not applicable - All plan fees are paid via revenue sharing 12.0% 5.2% 8.2% 9.5% 11.6% 12.3% 18.1% 19.9% 24.3% 13.6%
Don't know 10.3% 15.7% 13.4% 11.9% 11.2% 7.7% 7.9% 6.0% 2.0% 3.9%

For TK use only. Source: PLANSPONSOR Defined Contribution Survey, 2013 58
All data as of November 2013 Updated data available November 2014
For use by Sentinel Benefits & Financial Group only. Source: PLANSPONSOR Defined Contribution Survey, 2014
Prepared December 2014 | page 58
How often do you formally review actual administrative costs/fees?
Plan Size
Overall <$1MM $1MM -$5MM
$5MM -$10MM
$10MM -$25MM
$25MM -$50MM
$50MM -$200MM
$200MM -$500MM
$500MM -$1B >$1B
Annually 70.5% 61.9% 68.3% 71.8% 77.4% 71.1% 70.5% 71.6% 66.9% 70.5%
Every 1-2 years 8.9% 8.3% 10.1% 8.8% 6.6% 9.4% 10.0% 6.3% 10.8% 9.3%
Every 2-3 years 7.0% 6.2% 5.6% 6.7% 5.6% 6.6% 9.5% 10.4% 14.2% 6.2%
Every 3-5 years 3.6% 2.1% 2.8% 3.3% 3.6% 4.6% 3.8% 4.1% 4.7% 7.0%
Every 5+ years 1.5% 2.3% 1.3% 1.0% 1.2% 2.0% 1.8% 2.6% 0.7% 0.8%
Don't know 8.4% 19.2% 12.0% 8.3% 5.6% 6.4% 4.5% 4.9% 2.7% 6.2%

For TK use only. Source: PLANSPONSOR Defined Contribution Survey, 2013 59
All data as of November 2013 Updated data available November 2014
For use by Sentinel Benefits & Financial Group only. Source: PLANSPONSOR Defined Contribution Survey, 2014
Prepared December 2014 | page 59
Defined Contribution Providers

For TK use only. Source: PLANSPONSOR Defined Contribution Survey, 2013 60
All data as of November 2013 Updated data available November 2014
For use by Sentinel Benefits & Financial Group only. Source: PLANSPONSOR Defined Contribution Survey, 2014
Prepared December 2014 | page 60
For how long has your organization used your DC provider?
Plan Size
Overall <$1MM $1MM -$5MM
$5MM -$10MM
$10MM -$25MM
$25MM -$50MM
$50MM -$200MM
$200MM -$500MM
$500MM -$1B >$1B
Less than 1 year 3.3% 4.0% 2.5% 3.2% 4.1% 2.7% 2.4% 5.0% 3.3% 3.7%
More than 1 year but less than 3 years 14.6% 30.7% 18.0% 15.1% 15.2% 10.2% 9.6% 6.8% 7.2% 7.1%
More than 3 years but less than 5 years 14.0% 16.3% 15.6% 13.9% 15.1% 16.0% 13.1% 9.7% 5.9% 10.4%
More than 5 years but less than 7 years 13.0% 13.1% 15.4% 13.4% 12.9% 13.8% 12.2% 10.8% 13.2% 7.1%
More than 7 years 52.6% 30.2% 44.9% 52.4% 50.8% 55.8% 61.3% 65.8% 69.7% 70.3%
Don't Know 2.5% 5.7% 3.6% 2.0% 1.9% 1.5% 1.4% 1.8% 0.7% 1.5%

For TK use only. Source: PLANSPONSOR Defined Contribution Survey, 2013 61
All data as of November 2013 Updated data available November 2014
For use by Sentinel Benefits & Financial Group only. Source: PLANSPONSOR Defined Contribution Survey, 2014
Prepared December 2014 | page 61
What role does your recordkeeping provider play in producing your plan’s 5500 form?
Plan Size
Overall <$1MM $1MM -$5MM
$5MM -$10MM
$10MM -$25MM
$25MM -$50MM
$50MM -$200MM
$200MM -$500MM
$500MM -$1B >$1B
Delivers signature- ready Form 5500 documents 68.1% 67.6% 74.9% 77.3% 71.4% 70.2% 63.8% 57.2% 52.7% 40.8%
Supplies data needed to complete Form 5500
documents, but document is prepared by others
20.0% 18.5% 14.5% 14.4% 18.8% 19.3% 22.8% 27.9% 26.7% 40.8%
Not involved: Form 5500 is completed using other
providers 5.8% 9.0% 7.4% 4.1% 5.5% 4.3% 4.9% 3.7% 6.2% 5.1%
Not applicable: we are not required to complete a 5500 6.2% 4.9% 3.1% 4.3% 4.4% 6.1% 8.5% 11.2% 14.4% 13.3%

For TK use only. Source: PLANSPONSOR Defined Contribution Survey, 2013 62
All data as of November 2013 Updated data available November 2014
For use by Sentinel Benefits & Financial Group only. Source: PLANSPONSOR Defined Contribution Survey, 2014
Prepared December 2014 | page 62
How often do you formally evaluate your DC provider?
Plan Size
Overall <$1MM $1MM -$5MM
$5MM -$10MM
$10MM -$25MM
$25MM -$50MM
$50MM -$200MM
$200MM -$500MM
$500MM -$1B >$1B
Annually 57.8% 58.7% 62.5% 66.0% 60.2% 55.3% 50.3% 49.4% 41.7% 53.6%
Every 1 to <2 years 9.4% 11.2% 12.0% 8.4% 8.6% 10.4% 8.6% 8.5% 4.6% 4.9%
Every 2 to <3 years 9.8% 6.2% 8.4% 9.1% 10.5% 9.8% 14.1% 11.1% 13.2% 7.5%
Every 3 to <5 years 9.4% 2.5% 3.9% 5.2% 9.7% 11.1% 14.6% 16.2% 23.8% 18.9%
Every 5+ years 4.1% 1.2% 1.7% 1.9% 4.0% 6.2% 6.6% 7.0% 8.6% 7.5%
Don't know 9.6% 20.1% 11.6% 9.3% 7.0% 7.2% 5.9% 7.7% 7.9% 7.5%

For TK use only. Source: PLANSPONSOR Defined Contribution Survey, 2013 63
All data as of November 2013 Updated data available November 2014
For use by Sentinel Benefits & Financial Group only. Source: PLANSPONSOR Defined Contribution Survey, 2014
Prepared December 2014 | page 63
Advice and Advisers

For TK use only. Source: PLANSPONSOR Defined Contribution Survey, 2013 64
All data as of November 2013 Updated data available November 2014
For use by Sentinel Benefits & Financial Group only. Source: PLANSPONSOR Defined Contribution Survey, 2014
Prepared December 2014 | page 64
Does your plan use the services of a financial adviser or institutional retirement plan consultant?
Plan Size
Overall <$1MM $1MM -$5MM
$5MM -$10MM
$10MM -$25MM
$25MM -$50MM
$50MM -$200MM
$200MM -$500MM
$500MM -$1B >$1B
Yes 61.7% 43.7% 55.4% 56.6% 62.1% 66.7% 74.9% 70.6% 72.3% 68.2%
No 37.5% 52.5% 43.3% 43.1% 37.9% 32.7% 25.1% 29.4% 27.7% 31.8%

For TK use only. Source: PLANSPONSOR Defined Contribution Survey, 2013 65
All data as of November 2013 Updated data available November 2014
For use by Sentinel Benefits & Financial Group only. Source: PLANSPONSOR Defined Contribution Survey, 2014
Prepared December 2014 | page 65
What is the adviser’s fee arrangement?
Plan Size
Overall <$1MM $1MM -$5MM
$5MM -$10MM
$10MM -$25MM
$25MM -$50MM
$50MM -$200MM
$200MM -$500MM
$500MM -$1B >$1B
% of plan assets (bps) 42.8% 43.3% 52.4% 58.4% 55.8% 49.7% 31.9% 19.1% 16.3% 13.1%
Per participant 3.3% 4.3% 4.2% 2.5% 3.8% 3.7% 1.9% 3.7% 1.0% 4.0%
Project-based 4.0% 1.8% 1.8% 1.6% 3.0% 2.3% 5.3% 5.9% 11.5% 11.9%
Monthly/ Annual retainer 26.5% 6.1% 7.6% 7.5% 16.0% 27.0% 46.3% 58.5% 64.4% 54.0%
Performance (investments) 1.3% 3.0% 1.4% 0.9% 2.0% 1.3% 0.5% 0.5% 1.0% 1.1%
Performance (participation) 0.2% 0.0% 0.2% 0.3% 0.5% 0.3% 0.0% 0.5% 0.0% 0.0%
Don’t know 20.9% 42.7% 31.0% 26.7% 17.5% 14.0% 12.7% 11.7% 9.6% 15.3%
Other 5.5% 3.0% 5.0% 5.0% 5.8% 7.7% 6.0% 3.2% 4.8% 7.4%

For TK use only. Source: PLANSPONSOR Defined Contribution Survey, 2013 66
All data as of November 2013 Updated data available November 2014
For use by Sentinel Benefits & Financial Group only. Source: PLANSPONSOR Defined Contribution Survey, 2014
Prepared December 2014 | page 66
For the prior plan year, did you calculate the actual fees your plan paid to your adviser?
Plan Size
Overall <$1MM $1MM -$5MM
$5MM -$10MM
$10MM -$25MM
$25MM -$50MM
$50MM -$200MM
$200MM -$500MM
$500MM -$1B >$1B
Yes 50.9% 26.2% 33.8% 41.0% 52.4% 57.7% 63.4% 65.6% 70.9% 70.6%
No 34.1% 53.7% 51.2% 40.1% 33.4% 30.2% 23.2% 21.5% 17.5% 12.4%
Don't know 15.0% 20.1% 15.0% 18.9% 14.2% 12.1% 13.3% 12.9% 11.7% 16.9%

For TK use only. Source: PLANSPONSOR Defined Contribution Survey, 2013 67
All data as of November 2013 Updated data available November 2014
For use by Sentinel Benefits & Financial Group only. Source: PLANSPONSOR Defined Contribution Survey, 2014
Prepared December 2014 | page 67
Is your plan adviser a fiduciary to the plan?*
*Note: A 3(21) fiduciary status relates to fiduciary roles lacking discretion while 3(38) fiduciary roles afford the adviser discretion over investment decisions.
Plan Size
Overall <$1MM $1MM -$5MM
$5MM -$10MM
$10MM -$25MM
$25MM -$50MM
$50MM -$200MM
$200MM -$500MM
$500MM -$1B >$1B
Yes – 3(21) and 3(38) fiduciary 15.4% 11.6% 10.0% 12.0% 20.1% 19.3% 19.8% 15.8% 15.7% 12.8%
Yes – 3(21) fiduciary only 25.8% 11.0% 13.1% 18.3% 25.6% 26.5% 34.3% 42.6% 41.7% 42.8%
Yes – 3(38) fiduciary only 5.4% 5.2% 6.9% 5.7% 6.5% 3.6% 5.5% 4.7% 2.8% 3.9%
No 27.9% 26.7% 36.5% 37.7% 25.1% 25.5% 22.1% 18.4% 23.1% 23.9%
Don't Know 25.4% 45.3% 33.4% 26.3% 22.7% 25.2% 18.3% 18.4% 16.7% 16.7%

For TK use only. Source: PLANSPONSOR Defined Contribution Survey, 2013 68
All data as of November 2013 Updated data available November 2014
For use by Sentinel Benefits & Financial Group only. Source: PLANSPONSOR Defined Contribution Survey, 2014
Prepared December 2014 | page 68
What type(s) of services does the financial adviser or consultant provide?
Plan Size
Overall <$1MM $1MM -$5MM
$5MM -$10MM
$10MM -$25MM
$25MM -$50MM
$50MM -$200MM
$200MM -$500MM
$500MM -$1B >$1B
Review of fund performance 94.3% 86.8% 91.8% 92.6% 97.8% 96.4% 95.7% 97.4% 94.3% 93.2%
Investment selection guidance 91.8% 85.0% 88.4% 90.8% 93.4% 95.1% 93.8% 94.2% 93.4% 93.2%
Provider selection/due diligence 65.8% 55.1% 60.3% 60.7% 73.8% 72.5% 69.5% 74.1% 67.0% 53.1%
IPS review and monitoring 63.1% 35.9% 48.7% 57.1% 67.4% 71.5% 74.3% 79.4% 73.6% 67.2%
Provider fee analysis 79.0% 68.9% 74.1% 76.1% 85.3% 80.7% 83.1% 84.7% 82.1% 73.4%
Plan benchmarking 65.8% 41.9% 55.5% 64.1% 73.0% 68.2% 74.5% 73.0% 78.3% 63.8%
Plan education programs 50.2% 47.9% 56.1% 62.0% 61.3% 60.7% 46.9% 30.7% 28.3% 13.0%
One-on-one participant education 51.6% 69.5% 70.3% 75.8% 64.5% 57.0% 32.1% 17.5% 10.4% 5.6%
Group participant education 55.2% 61.1% 73.9% 77.3% 70.1% 63.9% 40.2% 19.0% 12.3% 6.8%
Review of funds with committee or internal plan administrator 76.5% 43.7% 60.5% 74.5% 85.5% 86.9% 87.1% 86.2% 83.0% 80.2%
Technical help with corporate transactions impacting the plan 31.2% 37.7% 32.7% 35.0% 34.1% 31.1% 26.7% 31.7% 25.5% 20.9%
Plan compliance review 47.0% 47.3% 48.1% 52.5% 53.4% 50.5% 45.7% 41.3% 34.9% 27.7%

For TK use only. Source: PLANSPONSOR Defined Contribution Survey, 2013 69
All data as of November 2013 Updated data available November 2014
For use by Sentinel Benefits & Financial Group only. Source: PLANSPONSOR Defined Contribution Survey, 2014
Prepared December 2014 | page 69
Is financial/investment advice offered to participants in your DC plan?
Plan Size
Overall <$1MM $1MM -$5MM
$5MM -$10MM
$10MM -$25MM
$25MM -$50MM
$50MM -$200MM
$200MM -$500MM
$500MM -$1B >$1B
Yes, through a financial adviser outside the plan 34.5% 36.9% 43.6% 43.7% 37.0% 38.5% 26.1% 19.2% 13.3% 9.1%
Yes, using a 3rd party (i.e., Financial Engines,
Morningstar, etc.) independent of our recordkeeper
19.3% 10.6% 16.0% 15.6% 17.9% 21.5% 19.6% 23.0% 30.7% 41.7%
Yes, using proprietary services/ tools offered through our DC
provider's website/call center/etc.
29.6% 12.3% 21.8% 29.4% 32.9% 35.9% 37.3% 44.5% 33.3% 32.2%
Yes, through another source 4.2% 2.8% 4.8% 5.9% 4.4% 4.1% 3.6% 4.2% 2.0% 2.3%
Total "Yes" 70.4% 57.5% 72.5% 75.6% 73.8% 74.2% 66.8% 71.3% 64.7% 64.4%
No 29.6% 42.5% 27.5% 24.4% 26.2% 25.8% 33.2% 28.7% 35.3% 35.6%

For TK use only. Source: PLANSPONSOR Defined Contribution Survey, 2013 70
All data as of November 2013 Updated data available November 2014
For use by Sentinel Benefits & Financial Group only. Source: PLANSPONSOR Defined Contribution Survey, 2014
Prepared December 2014 | page 70
Plan Oversight and Administration

For TK use only. Source: PLANSPONSOR Defined Contribution Survey, 2013 71
All data as of November 2013 Updated data available November 2014
For use by Sentinel Benefits & Financial Group only. Source: PLANSPONSOR Defined Contribution Survey, 2014
Prepared December 2014 | page 71
Does your organization have an investment committee for the DC plan?
Plan Size
Overall <$1MM $1MM -$5MM
$5MM -$10MM
$10MM -$25MM
$25MM -$50MM
$50MM -$200MM
$200MM -$500MM
$500MM -$1B >$1B
Yes - committee includes only internal employees 42.6% 13.4% 29.5% 39.8% 47.8% 52.9% 54.5% 56.1% 55.3% 63.6%
Yes - committee includes only people external to our
company 1.9% 1.5% 1.8% 1.4% 2.4% 1.9% 0.7% 3.0% 4.0% 3.0%
Yes - committee includes a mix of internal and external people 27.8% 7.3% 21.0% 28.7% 36.2% 33.6% 36.3% 30.5% 32.7% 25.8%
Yes - but unsure of composition of investment
committee 1.4% 1.0% 1.8% 1.4% 1.0% 1.3% 1.1% 2.6% 1.3% 1.5%
No investment committee 21.1% 63.4% 37.9% 21.8% 9.5% 7.1% 5.9% 6.7% 6.0% 4.2%
Don't know 5.2% 13.4% 8.0% 7.0% 3.0% 3.2% 1.6% 1.1% 0.7% 1.9%
For TK use only. Source: PLANSPONSOR Defined Contribution Survey, 2013 72
All data as of November 2013 Updated data available November 2014
For use by Sentinel Benefits & Financial Group only. Source: PLANSPONSOR Defined Contribution Survey, 2014
Prepared December 2014 | page 72
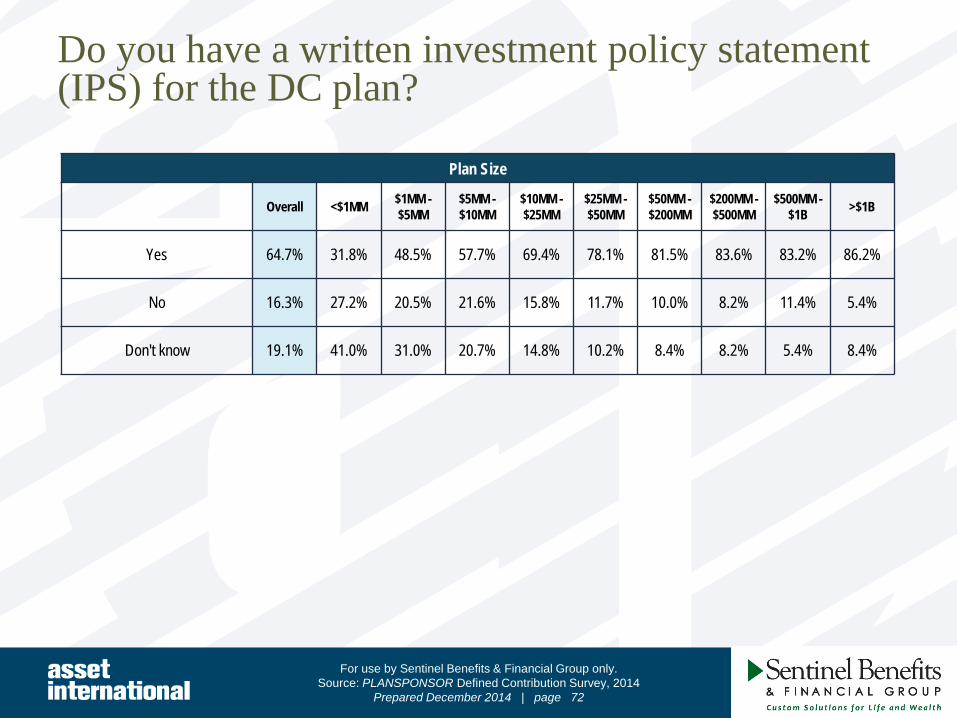
Do you have a written investment policy statement (IPS) for the DC plan?
Plan Size
Overall <$1MM $1MM -$5MM
$5MM -$10MM
$10MM -$25MM
$25MM -$50MM
$50MM -$200MM
$200MM -$500MM
$500MM -$1B >$1B
Yes 64.7% 31.8% 48.5% 57.7% 69.4% 78.1% 81.5% 83.6% 83.2% 86.2%
No 16.3% 27.2% 20.5% 21.6% 15.8% 11.7% 10.0% 8.2% 11.4% 5.4%
Don't know 19.1% 41.0% 31.0% 20.7% 14.8% 10.2% 8.4% 8.2% 5.4% 8.4%

For TK use only. Source: PLANSPONSOR Defined Contribution Survey, 2013 73
All data as of November 2013 Updated data available November 2014
For use by Sentinel Benefits & Financial Group only. Source: PLANSPONSOR Defined Contribution Survey, 2014
Prepared December 2014 | page 73
If you have an IPS, does it specifically cover target-date funds and their underlying funds?
Plan Size
Overall <$1MM $1MM -$5MM
$5MM -$10MM
$10MM -$25MM
$25MM -$50MM
$50MM -$200MM
$200MM -$500MM
$500MM -$1B >$1B
Yes 55.7% 38.6% 48.4% 56.7% 58.5% 58.5% 57.8% 67.3% 60.6% 64.7%
No 23.9% 13.6% 19.4% 20.0% 24.4% 27.5% 29.8% 28.1% 32.4% 29.5%
Don't know 20.3% 47.8% 32.2% 23.3% 17.1% 14.1% 12.4% 4.6% 7.0% 5.8%
For TK use only. Source: PLANSPONSOR Defined Contribution Survey, 2013 74
All data as of November 2013 Updated data available November 2014
For use by Sentinel Benefits & Financial Group only. Source: PLANSPONSOR Defined Contribution Survey, 2014
Prepared December 2014 | page 74
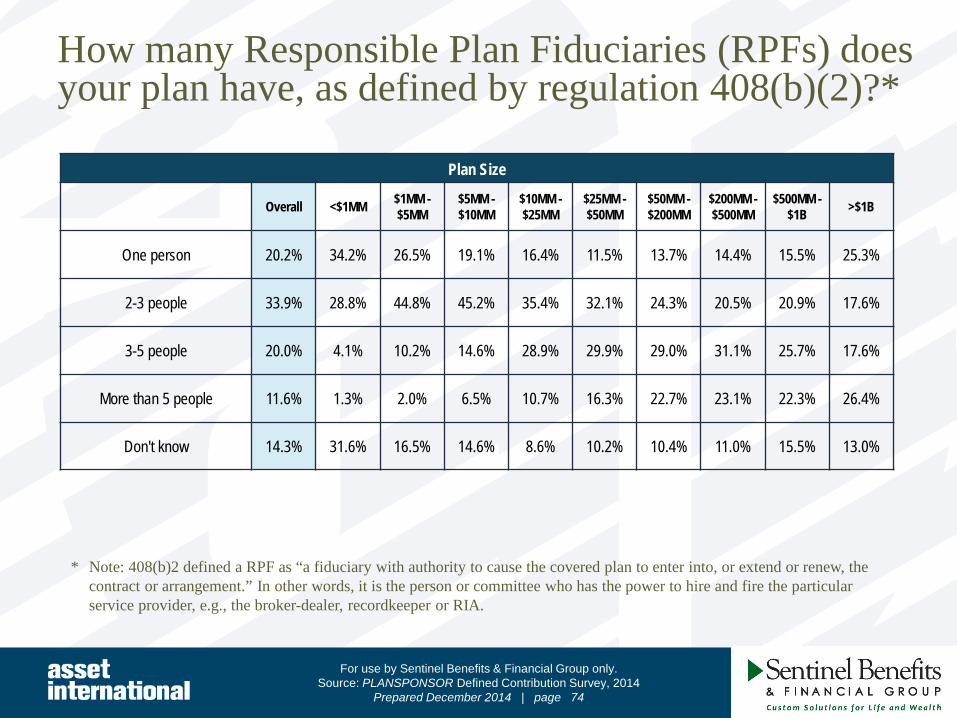
How many Responsible Plan Fiduciaries (RPFs) does your plan have, as defined by regulation 408(b)(2)?*
* Note: 408(b)2 defined a RPF as “a fiduciary with authority to cause the covered plan to enter into, or extend or renew, the contract or arrangement.” In other words, it is the person or committee who has the power to hire and fire the particular service provider, e.g., the broker-dealer, recordkeeper or RIA.
Plan Size
Overall <$1MM $1MM -$5MM
$5MM -$10MM
$10MM -$25MM
$25MM -$50MM
$50MM -$200MM
$200MM -$500MM
$500MM -$1B >$1B
One person 20.2% 34.2% 26.5% 19.1% 16.4% 11.5% 13.7% 14.4% 15.5% 25.3%
2-3 people 33.9% 28.8% 44.8% 45.2% 35.4% 32.1% 24.3% 20.5% 20.9% 17.6%
3-5 people 20.0% 4.1% 10.2% 14.6% 28.9% 29.9% 29.0% 31.1% 25.7% 17.6%
More than 5 people 11.6% 1.3% 2.0% 6.5% 10.7% 16.3% 22.7% 23.1% 22.3% 26.4%
Don't know 14.3% 31.6% 16.5% 14.6% 8.6% 10.2% 10.4% 11.0% 15.5% 13.0%

For TK use only. Source: PLANSPONSOR Defined Contribution Survey, 2013 75
All data as of November 2013 Updated data available November 2014
For use by Sentinel Benefits & Financial Group only. Source: PLANSPONSOR Defined Contribution Survey, 2014
Prepared December 2014 | page 75
Please indicate your level of agreement with the following statement: “Most of our employees will achieve their retirement goals by age 65”
Plan Size
Overall <$1MM $1MM -$5MM
$5MM -$10MM
$10MM -$25MM
$25MM -$50MM
$50MM -$200MM
$200MM -$500MM
$500MM -$1B >$1B
Agree 8.8% 10.8% 8.9% 7.5% 7.6% 7.7% 9.6% 7.0% 13.0% 11.6%
Slightly Agree 20.4% 19.6% 18.5% 19.2% 19.3% 19.5% 22.3% 16.5% 29.3% 25.2%
Undecided 22.2% 24.1% 25.3% 25.5% 21.3% 18.1% 18.1% 26.6% 19.6% 22.6%
Slightly Disagree 28.2% 23.4% 27.2% 25.8% 29.2% 31.7% 29.7% 35.4% 18.5% 27.7%
Disagree 20.3% 22.2% 20.0% 21.9% 22.6% 23.0% 20.3% 14.6% 19.6% 12.9%

For TK use only. Source: PLANSPONSOR Defined Contribution Survey, 2013 76
All data as of November 2013 Updated data available November 2014
For use by Sentinel Benefits & Financial Group only. Source: PLANSPONSOR Defined Contribution Survey, 2014
Prepared December 2014 | page 76
For more reports like this one…
If you would be interested in seeing a report similar to this one for another industry, or if you would like to see additional topics explored in this report, please contact Brian O’Keefe at (203) 979-3091 or [email protected].
For TK use only. Source: PLANSPONSOR Defined Contribution Survey, 2013 77
All data as of November 2013 Updated data available November 2014
For use by Sentinel Benefits & Financial Group only. Source: PLANSPONSOR Defined Contribution Survey, 2014
Prepared December 2014 | page 77
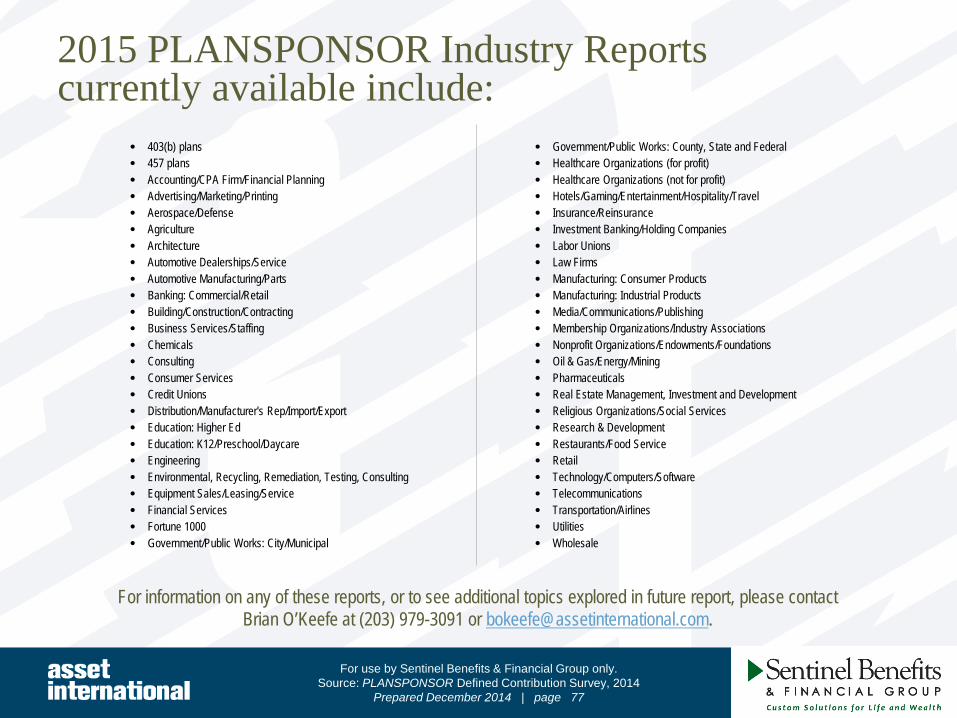
2015 PLANSPONSOR Industry Reports currently available include:
• 403(b) plans • 457 plans • Accounting/CPA Firm/Financial Planning • Advertising/Marketing/Printing • Aerospace/Defense • Agriculture • Architecture • Automotive Dealerships/Service • Automotive Manufacturing/Parts • Banking: Commercial/Retail • Building/Construction/Contracting • Business Services/Staffing • Chemicals • Consulting • Consumer Services • Credit Unions • Distribution/Manufacturer's Rep/Import/Export • Education: Higher Ed • Education: K12/Preschool/Daycare • Engineering • Environmental, Recycling, Remediation, Testing, Consulting • Equipment Sales/Leasing/Service • Financial Services • Fortune 1000 • Government/Public Works: City/Municipal
• Government/Public Works: County, State and Federal • Healthcare Organizations (for profit) • Healthcare Organizations (not for profit) • Hotels/Gaming/Entertainment/Hospitality/Travel • Insurance/Reinsurance • Investment Banking/Holding Companies • Labor Unions • Law Firms • Manufacturing: Consumer Products • Manufacturing: Industrial Products • Media/Communications/Publishing • Membership Organizations/Industry Associations • Nonprofit Organizations/Endowments/Foundations • Oil & Gas/Energy/Mining • Pharmaceuticals • Real Estate Management, Investment and Development • Religious Organizations/Social Services • Research & Development • Restaurants/Food Service • Retail • Technology/Computers/Software • Telecommunications • Transportation/Airlines • Utilities • Wholesale
For information on any of these reports, or to see additional topics explored in future report, please contact Brian O’Keefe at (203) 979-3091 or [email protected].