Embed Size (px)
Citation preview

Fishery Management Report No. 16-19
2015 Lower Cook Inlet Area Finfish Management Report
by
Glenn Hollowell
Edward O. Otis
and
Ethan Ford
May 2016
Alaska Department of Fish and Game Divisions of Sport Fish and Commercial Fisheries

Symbols and Abbreviations The following symbols and abbreviations, and others approved for the Système International d'Unités (SI), are used without definition in the following reports by the Divisions of Sport Fish and of Commercial Fisheries: Fishery Manuscripts, Fishery Data Series Reports, Fishery Management Reports, and Special Publications. All others, including deviations from definitions listed below, are noted in the text at first mention, as well as in the titles or footnotes of tables, and in figure or figure captions. Weights and measures (metric) centimeter cm deciliter dL gram g hectare ha kilogram kg kilometer km liter L meter m milliliter mL millimeter mm Weights and measures (English) cubic feet per second ft3/s foot ft gallon gal inch in mile mi nautical mile nmi ounce oz pound lb quart qt yard yd Time and temperature day d degrees Celsius °C degrees Fahrenheit °F degrees kelvin K hour h minute min second s Physics and chemistry all atomic symbols alternating current AC ampere A calorie cal direct current DC hertz Hz horsepower hp hydrogen ion activity pH (negative log of) parts per million ppm parts per thousand ppt, ‰ volts V watts W
General Alaska Administrative Code AAC all commonly accepted abbreviations e.g., Mr., Mrs.,
AM, PM, etc. all commonly accepted professional titles e.g., Dr., Ph.D., R.N., etc. at @ compass directions:
east E north N south S west W
copyright corporate suffixes:
Company Co. Corporation Corp. Incorporated Inc. Limited Ltd.
District of Columbia D.C. et alii (and others) et al. et cetera (and so forth) etc. exempli gratia (for example) e.g. Federal Information Code FIC id est (that is) i.e. latitude or longitude lat or long monetary symbols (U.S.) $, ¢ months (tables and figures): first three letters Jan,...,Dec registered trademark trademark United States (adjective) U.S. United States of America (noun) USA U.S.C. United States
Code U.S. state use two-letter
abbreviations (e.g., AK, WA)
Mathematics, statistics all standard mathematical signs, symbols and abbreviations alternate hypothesis HA base of natural logarithm e catch per unit effort CPUE coefficient of variation CV common test statistics (F, t, χ2, etc.) confidence interval CI correlation coefficient (multiple) R correlation coefficient (simple) r covariance cov degree (angular ) ° degrees of freedom df expected value E greater than > greater than or equal to ≥ harvest per unit effort HPUE less than < less than or equal to ≤ logarithm (natural) ln logarithm (base 10) log logarithm (specify base) log2, etc. minute (angular) ' not significant NS null hypothesis HO percent % probability P probability of a type I error (rejection of the null hypothesis when true) α probability of a type II error (acceptance of the null hypothesis when false) β second (angular) " standard deviation SD standard error SE variance population Var sample var

FISHERY MANAGEMENT REPORT NO. 16-19
2015 LOWER COOK INLET AREA FINFISH MANAGEMENT REPORT
by Glenn Hollowell, Edward O. Otis, and Ethan Ford
Alaska Department of Fish and Game, Division of Commercial Fisheries, Homer
Alaska Department of Fish and Game Division of Sport Fish, Research and Technical Services 333 Raspberry Road, Anchorage, Alaska, 99518-1565
May 2016

The Fishery Management Reports series was established in 1989 by the Division of Sport Fish for the publication of an overview of management activities and goals in a specific geographic area, and became a joint divisional series in 2004 with the Division of Commercial Fisheries. Fishery Management Reports are intended for fishery and other technical professionals, as well as lay persons. Fishery Management Reports are available through the Alaska State Library and on the Internet: http://www.adfg.alaska.gov/sf/publications/. This publication has undergone regional peer review.
Glenn Hollowell, Edward O. Otis, and Ethan Ford Alaska Department of Fish and Game, Division of Commercial Fisheries
3298 Douglas Place, Homer, Alaska 99603, USA This document should be cited as follows: Hollowell, G., E. O. Otis, and E. Ford. 2016. 2015 Lower Cook Inlet area finfish management report. Alaska
Department of Fish and Game, Fishery Management Report No. 16-19, Anchorage.
The Alaska Department of Fish and Game (ADF&G) administers all programs and activities free from discrimination based on race, color, national origin, age, sex, religion, marital status, pregnancy, parenthood, or disability. The department administers all programs and activities in compliance with Title VI of the Civil Rights Act of 1964, Section 504 of the Rehabilitation Act of 1973, Title II of the Americans with Disabilities Act (ADA) of 1990, the Age Discrimination Act of 1975, and Title IX of the Education Amendments of 1972.
If you believe you have been discriminated against in any program, activity, or facility please write: ADF&G ADA Coordinator, P.O. Box 115526, Juneau, AK 99811-5526
U.S. Fish and Wildlife Service, 4401 N. Fairfax Drive, MS 2042, Arlington, VA 22203 Office of Equal Opportunity, U.S. Department of the Interior, 1849 C Street NW MS 5230, Washington DC 20240
The department’s ADA Coordinator can be reached via phone at the following numbers: (VOICE) 907-465-6077, (Statewide Telecommunication Device for the Deaf) 1-800-478-3648,
(Juneau TDD) 907-465-3646, or (FAX) 907-465-6078 For information on alternative formats and questions on this publication, please contact:
ADF&G, Division of Sport Fish, Research and Technical Services, 333 Raspberry Rd, Anchorage AK 99518 (907) 267-2375
TABLE OF CONTENTS Page
LIST OF FIGURES ......................................................................................................................................................iii
LIST OF TABLES........................................................................................................................................................ iv
LIST OF APPENDICES .............................................................................................................................................. iv
ABSTRACT .................................................................................................................................................................. 1
INTRODUCTION ......................................................................................................................................................... 1
Lower Cook Inlet Management Area Commercial Salmon and Herring Fisheries ....................................................... 1 Overview of Areawide Salmon and Herring Fisheries .................................................................................................. 2
SALMON SEASON SUMMARY BY DISTRICT ....................................................................................................... 2
Southern District ............................................................................................................................................................ 2 Preseason Outlook and Harvest Strategy .................................................................................................................. 3 Season Summary ...................................................................................................................................................... 4
Outer District ................................................................................................................................................................. 7 Preseason Outlook and Harvest Strategy .................................................................................................................. 8 Season Summary ...................................................................................................................................................... 8
Eastern District .............................................................................................................................................................. 9 Preseason Outlook and Harvest Strategy ................................................................................................................ 10 Season Summary .................................................................................................................................................... 10
Kamishak Bay District ................................................................................................................................................. 11 Preseason Outlook and Harvest Strategy ................................................................................................................ 12 Season Summary .................................................................................................................................................... 12
LOWER COOK INLET SUBSISTENCE, PERSONAL USE AND HOMEPACK COMMERCIAL FISHERIES... 13
Nanwalek/Port Graham Subsistence Fishery ............................................................................................................... 14 Seldovia Subsistence Fishery ...................................................................................................................................... 15 China Poot Personal Use Dip Net and Personal Use Coho Salmon Fisheries ............................................................. 16 Commercial Homepack ............................................................................................................................................... 18
COOK INLET SALMON ENHANCEMENT ............................................................................................................ 18
Tutka Bay Lagoon Hatchery ........................................................................................................................................ 19 Trail Lakes Hatchery ................................................................................................................................................... 21 Port Graham Hatchery ................................................................................................................................................. 22 LCI Remote Releases .................................................................................................................................................. 23
Nanwalek Salmon Enhancement Project (NSEP) ................................................................................................... 23 Leisure and Hazel Lakes ......................................................................................................................................... 24 Kirschner Lake........................................................................................................................................................ 25 Tutka Bay Lagoon .................................................................................................................................................. 26 Port Graham ............................................................................................................................................................ 26 Paint River Fish Ladder .......................................................................................................................................... 26 Bear Lake and Resurrection Bay ............................................................................................................................ 27
LOWER COOK INLET COMMERCIAL HERRING FISHERY .............................................................................. 29
Harvest Strategy and Stock Assessment ...................................................................................................................... 29 Season Summary ......................................................................................................................................................... 31 2016 Herring Season Outlook ..................................................................................................................................... 32
i

TABLE OF CONTENTS (Continued) Page
ACKNOWLEDGEMENTS ......................................................................................................................................... 32
REFERENCES CITED ............................................................................................................................................... 34
FIGURES AND TABLES ........................................................................................................................................... 37
APPENDIX A: SOUTHERN DISTRICT ................................................................................................................... 71
APPENDIX B: OUTER DISTRICT............................................................................................................................ 85
APPENDIX C: EASTERN DISTRICT ..................................................................................................................... 103
APPENDIX D: KAMISHAK BAY DISTRICT ........................................................................................................ 117
APPENDIX E: SUBSISTENCE, PERSONAL USE AND HOMEPACK HARVESTS .......................................... 139
APPENDIX F: HATCHERY PRODUCTION AND RETURNS ............................................................................. 149
APPENDIX G: HERRING ........................................................................................................................................ 185
APPENDIX H: 2015 OUTLOOK ............................................................................................................................. 191
ii

LIST OF FIGURES Figure Page 1 Lower Cook Inlet management area showing commercial fishing districts, salmon hatcheries, weir and
fish ladder locations and remote video salmon monitoring sites. .................................................................. 38 2 Lower Cook Inlet management area showing commercial fishing districts and reporting subdistricts. ........ 39 3 Southern District of Lower Cook Inlet management area showing commercial fishing districts and
reporting subdistricts, Chugachik Island to Anisom Point. ........................................................................... 40 4 Southern District of Lower Cook Inlet management area showing commercial fishing districts and
reporting subdistricts, Anisom Point to Seldovia Point. ................................................................................ 41 5 Southern District of Lower Cook Inlet management area showing commercial fishing districts and
reporting subdistricts, Seldovia Point to Point Bede. .................................................................................... 42 6 Outer District of Lower Cook Inlet management area showing commercial fishing districts and
reporting subdistricts, Point Adam to Chugach Bay. .................................................................................... 43 7 Outer District of Lower Cook Inlet management area showing commercial fishing districts and
reporting subdistricts, Chugach Bay to Rocky Bay. ...................................................................................... 44 8 Outer District of Lower Cook Inlet management area showing commercial fishing districts and
reporting subdistricts, Port Dick area. ........................................................................................................... 45 9 Outer District of Lower Cook Inlet management area showing commercial fishing districts and
reporting subdistricts, Nuka Bay area. .......................................................................................................... 46 10 Eastern District of Lower Cook Inlet management area showing commercial fishing districts, reporting
subdistricts, and hatchery special harvest area (SHA), Aligo Point to Cape Fairfield. ................................. 47 11 Kamishak Bay District of Lower Cook Inlet management area showing commercial fishing districts
and reporting subdistricts, Chenik Lake to Cape Douglas............................................................................. 48 12 Kamishak Bay District of Lower Cook Inlet management area showing commercial fishing districts,
reporting subdistricts, and hatchery special harvest area, McNeil River to Ursus Cove. .............................. 49 13 Kamishak Bay District of Lower Cook Inlet management area showing commercial fishing districts,
Ursus Cove to Chinitna Point. ....................................................................................................................... 50 14 Kachemak Bay personal use coho salmon fishery registration areas. ........................................................... 51 15 Southern District personal use coho salmon fishery: Homer Spit area. ........................................................ 52 16 Lower Cook Inlet management area, Southern District hatchery special harvest areas, Halibut Cove to
Anisom Point. ................................................................................................................................................ 53 17 Lower Cook Inlet management area, Southern District hatchery special harvest areas, Anisom Point to
Seldovia Point. .............................................................................................................................................. 54 18 Lower Cook Inlet management area, Southern District hatchery special harvest areas, Port Graham
Area. .............................................................................................................................................................. 55 19 Commercial common property salmon harvests in Lower Cook Inlet, 1986–2015. ..................................... 56 20 Exvessel value of Lower Cook Inlet commercial salmon harvest, 2005–2015. ............................................ 57 21 Age-structured-assessment (ASA) biomass estimates and commercial harvests of Pacific herring in the
sac roe seine fishery, Kamishak Bay District, Lower Cook Inlet, 1985–2015 and 2016 projection. ............ 58
iii

LIST OF TABLES Table Page 1 Lower Cook Inlet Management Area commercial salmon harvest by gear and district, 2015. ..................... 59 2 Total commercial salmon harvest by species from all gear types, Lower Cook Inlet area, including cost
recovery for all Cook Inlet Area hatcheries, 1985–2015. .............................................................................. 60 3 Mean price and estimated exvessel value of the total commercial salmon harvest excluding homepacks
by gear type, Lower Cook Inlet, 2015. .......................................................................................................... 63 4 Average price paid to permit holders for salmon, Lower Cook Inlet, 1990–2015. ........................................ 64 5 Estimated exvessel value of commercial salmon harvest by gear type with previous 10-year average,
Lower Cook Inlet, 2005–2015. ...................................................................................................................... 65 6 Preseason harvest or total run projections for the 2015 commercial common property salmon fishery
by district and species, Lower Cook Inlet Area. ............................................................................................ 66 7 Emergency orders issued for the commercial, personal use, and subsistence salmon fisheries in Lower
Cook Inlet, 2015. ........................................................................................................................................... 67 8 Escapements relative to escapement goals and methods used to monitor escapements in 2015 for
Chinook, chum, pink and sockeye salmon stocks in Cook Inlet, Alaska. ..................................................... 69
LIST OF APPENDICES Appendix Page A1 Southern District commercial set gillnet salmon harvest (excluding homepacks) by period, 2015. ............. 72 A2 Southern District commercial purse seine salmon harvest (excluding homepacks) by period, 2015. ........... 73 A3 Total commercial common property salmon harvest (excluding homepacks) in the Southern District,
1970–2015. .................................................................................................................................................... 74 A4 Anticipated daily and cumulative sockeye salmon escapement versus actual escapement through the
English Bay weir, 2015. ................................................................................................................................ 77 A5 Minimum and maximum anticipated cumulative and daily escapement of sockeye salmon versus actual
escapement through the English Bay weir, 2015........................................................................................... 79 A6 Sockeye salmon escapement past the English Bay weir, 1927–1941 and 1993–2015. ................................. 80 A7 Pink and chum salmon escapements, as measured by ground survey, using area under the curve
estimation in the Southern District, 2015. ..................................................................................................... 81 A8 Escapement indices and harvests by subdistricts in the Southern District, Lower Cook Inlet, 2015. ........... 83 A9 Estimated pink and chum salmon escapements in thousands of fish for the major spawning systems in
the Southern District of the Lower Cook Inlet Area, 1975–2015. ................................................................. 84 B1 Outer District commercial purse seine salmon harvest (excluding homepacks) by period, 2015. ................ 86 B2 Total commercial common property salmon harvest (excluding homepacks) in Outer District 1970–
2015. .............................................................................................................................................................. 88 B3 Pink and chum salmon escapements measured by aerial survey using area under the curve estimation
in Outer District, 2015. .................................................................................................................................. 89 B4 Pink and chum salmon escapements measured by ground survey using area under the curve estimation
in Outer District, 2015. .................................................................................................................................. 97 B5 Sockeye salmon aerial survey counts from the Outer District, 2015. ............................................................ 99 B6 Escapement indices and harvests by subdistricts in the Outer District, Lower Cook Inlet, 2015................ 100 B7 Estimated pink, chum, and sockeye salmon escapements in thousands of fish for the major spawning
systems in the Outer District of the Lower Cook Inlet Area, 1975–2015. .................................................. 101 C1 Eastern District common property commercial purse seine salmon harvest (excluding homepacks) by
period, 2015. ................................................................................................................................................ 104 C2 Commercial common property and derby commercial sales harvest (excluding homepacks) by species
in the Eastern District, 1970–2015. ............................................................................................................. 105 C3 Anticipated daily and cumulative sockeye salmon escapement versus actual escapement through the
Bear Creek weir, 2015 ................................................................................................................................. 106 C4 Sockeye salmon passage past Bear Creek weir versus minimum and maximum inriver goals, 2015. ........ 108 C5 Coho salmon escapement through the Bear Creek weir, 2015. ................................................................... 109
iv

LIST OF APPENDICES (Continued) Appendix Page C6 Coho salmon passage past the Bear Creek weir, 2015. ............................................................................... 110 C7 Adult sockeye and coho salmon escapement, and Dolly Varden char and smolt outmigrations past Bear
Creek weir, 1992–2015. .............................................................................................................................. 111 C8 Sockeye salmon aerial survey counts from the Eastern District, 2015. ....................................................... 112 C9 Pink and chum salmon escapements using area under the curve estimation in the Eastern District,
2015. ............................................................................................................................................................ 113 C10 Escapement indices and harvests by subdistrict in the Eastern District of Lower Cook Inlet, 2015. .......... 114 C11 Estimated sockeye and pink salmon escapements in thousands of fish for the major spawning systems
in the Eastern District of the Lower Cook Inlet Area, 1975–2015. ............................................................. 115 D1 Kamishak Bay District commercial salmon harvest (excluding homepacks) by period, 2015.................... 118 D2 Total commercial common property harvest (excluding homepacks) by species in the Kamishak Bay
District 1970–2015. ..................................................................................................................................... 119 D3 Anticipated daily and cumulative sockeye salmon escapement versus actual escapement past the video
monitoring site at Chenik Lake, 2015. ........................................................................................................ 120 D4 Anticipated daily and cumulative sockeye salmon escapement versus actual escapement past the video
monitoring site at Mikfik Lake, 2015. ......................................................................................................... 122 D5 Minimum and maximum anticipated cumulative and daily escapement of sockeye salmon versus actual
escapement past the video monitoring station at Chenik Lake, 2015. ......................................................... 124 D6 Minimum and maximum anticipated cumulative and daily escapement of sockeye salmon versus actual
escapement past the Mikfik Lake video monitoring station, 2015. ............................................................. 125 D7 Sockeye salmon escapement into Chenik Lake and Mikfik Lake, 1927–2015. .......................................... 126 D8 Pink and chum salmon escapements as measured by aerial survey using area under the curve
estimation in the Kamishak Bay District, 2015. .......................................................................................... 127 D9 Sockeye salmon aerial survey counts from the Kamishak Bay District, 2015. ........................................... 134 D10 Escapement indices and harvests by subdistricts in the Kamishak Bay District, Lower Cook Inlet,
2015. ............................................................................................................................................................ 135 D11 Estimated pink, chum and sockeye salmon escapements in thousands of fish for the major spawning
systems in the Kamishak Bay District of the Lower Cook Inlet Area, 1975–2015. .................................... 136 E1 Subsistence net and rod and reel salmon harvest in numbers of fish by species for the village of Port
Graham, Lower Cook Inlet, 1979–2015. ..................................................................................................... 140 E2 Subsistence net and rod and reel salmon harvest in numbers of fish by species for the village of
Nanwalek (formerly English Bay), Lower Cook Inlet, 1978–2015............................................................. 141 E3 Salmon set gillnet harvest in numbers of fish by species and permit/effort information for the Seldovia
area subsistence fishery, Lower Cook Inlet, 1997–2015. ............................................................................ 142 E4 Personal use/subsistence set gillnet salmon harvest in numbers of fish by species and effort, Southern
District (excluding the Port Graham/Nanwalek subsistence fishery and the Seldovia subsistence fishery), Lower Cook Inlet, 1975–2015. ..................................................................................................... 143
E5 Summary of personal use/subsistence salmon gillnet permit holders in the Southern District of Lower Cook Inlet (excluding the Port Graham/Nanwalek subsistence fishery and the Seldovia subsistence fishery) by area of residence, 1990–2015. ................................................................................................... 144
E6 Historical harvest and numbers of permits actively fished by area for the Southern District personal use coho salmon set gillnet fishery, 1981–2015. ............................................................................................... 145
E7 Salmon retained from the commercial harvest for personal use (homepack) by species and gear type from Lower Cook Inlet districts, 1996–2015. ............................................................................................. 146
E8 Lower Cook Inlet commercial homepack and personal use harvest by permit holder community of residence, 2015. ........................................................................................................................................... 147
F1 Summary of salmon runs to Lower Cook Inlet hatchery release sites, 2015. .............................................. 151 F2 Daily sockeye salmon sales and broodstock collection; sales and broodstock summary in numbers of
fish for Cook Inlet Aquaculture Association, 2015. .................................................................................... 152 F3 Daily pink salmon sales and broodstock collection; sales and broodstock summary in numbers of fish
for Cook Inlet Aquaculture Association, 2015. ........................................................................................... 155 F4 Daily coho salmon sales and broodstock collection; sales and broodstock summary in numbers of fish
for Cook Inlet Aquaculture Association, 2015. ........................................................................................... 157
v

LIST OF APPENDICES (Continued) Appendix Page F5 Historical harvest contributions, and total run of sockeye and coho salmon to Cook Inlet hatchery
release sites, 1978–2015. ............................................................................................................................. 159 F6 Estimated historical harvest contributions and total runs of pink salmon to greater Cook Inlet hatchery
release sites, 1978–2015. ............................................................................................................................. 161 F7 Tutka Bay Lagoon Hatchery salmon releases, 1977–2015. ......................................................................... 163 F8 Trail Lakes Hatchery salmon releases, 1983–2015. .................................................................................... 164 F9 Port Graham Hatchery salmon releases, 1991–2015. .................................................................................. 165 F10 Ship Creek Hatchery Complex, (Fort Richardson, Elmendorf, and William Jack Hernandez combined)
hatchery salmon fry releases, 1966–2015.................................................................................................... 166 F11 Historic releases of Chinook salmon from hatcheries to Lower Cook Inlet, 1972–2015. ........................... 167 F12 Historic releases of sockeye salmon from hatcheries to Lower Cook Inlet, 1976–2015. ............................ 169 F13 Historical releases of coho salmon from hatcheries to Lower Cook Inlet, 1963–2015. .............................. 171 F14 Historical releases of pink salmon from hatcheries to greater Cook Inlet, 1975–2015. .............................. 175 F15 Harvest of sockeye salmon returning to China Poot and Neptune Bays in the Southern District of
Lower Cook Inlet, 1979–2015. .................................................................................................................... 177 F16 Commercial harvest and escapement of sockeye salmon at Chenik Lake in the Kamishak Bay District
of Lower Cook Inlet, 1976–2015. ............................................................................................................... 178 F17 Commercial harvest of sockeye salmon at Kirschner Lake in the Kamishak Bay District of Lower
Cook Inlet, 1989–2015. ............................................................................................................................... 179 F18 Commercial harvest and escapement of pink and sockeye salmon in the Tutka Bay Subdistrict in the
Southern District of Lower Cook Inlet, 1975–2015. ................................................................................... 180 F19 Harvest of salmon from the Port Graham Section of the Port Graham Subdistrict in the Southern
District of Lower Cook Inlet, 1985–2015. .................................................................................................. 181 G1 Total biomass estimates and commercial catch of Pacific herring in short tons by age class, Kamishak
Bay District, Lower Cook Inlet, 2015, and 2016 forecast. .......................................................................... 187 G2 Catch of Pacific herring in short tons and effort in number of permits making deliveries by district in
the commercial sac roe seine fishery, Lower Cook Inlet, 1961–2015. ........................................................ 188 G3 Preseason estimates of biomass and projected commercial sac roe seine harvests, versus actual
harvests, for Pacific herring in short tons (st), average roe recovery, numbers of permits making landings, and exvessel value in millions of dollars, Kamishak Bay District, Lower Cook Inlet, 1978–2015. ............................................................................................................................................................ 189
G4 Summary of herring sac roe seine fishery openings and commercial harvests in the Kamishak Bay District of Lower Cook Inlet, 1969–2015. .................................................................................................. 190
G5 Aerial survey indices, miles of observed spawn, and comparison of preseason biomass forecast/projected harvest and actual commercial herring sac roe seine harvest versus hindcast (age-structured-assessment) estimates of total biomass and exploitation rate in Kamishak Bay District, Lower Cook Inlet, 1990–2015. .................................................................................................................... 191
H1 Lower Cook Inlet salmon fishery outlook, 2015. ........................................................................................ 193
vi

ABSTRACT The 2015 Lower Cook Inlet (LCI) management area (all coastal waters and inland drainages entering waters north of Cape Douglas, west of Cape Fairfield, and south of Anchor Point) commercial salmon harvest was 6,751,859 salmon. The harvest was composed of 6,388,392 pink Oncorhynchus gorbuscha, 244,892 sockeye O. nerka, 113,441 chum O. keta, 4,340 coho O. kisutch, and 804 Chinook salmon O. tshawytscha. Approximately 67% of the harvest, 4,512,536 fish, was sold as common property harvest, and 2,239,323 fish were sold for hatchery cost recovery including carcass sales. Homepack harvest and donated fish (4,411) accounted for less than 1% of the harvest. Based on fish ticket reporting of prices, the preliminary value of the commercial salmon harvest was $6.2 million, including hatchery sales. This amount does not include postseason adjustments, bonuses, etc. During the 2015 season, 24 set gillnet and 19 purse seine permit holders reported deliveries. Set gillnet exvessel harvest value was an estimated $441,000, with average permit earnings of $18,362. Purse seine fishery exvessel harvest value was an estimated $3.5 million, with average permit earnings of $184,449. Revenue generated by cost recovery for hatchery operations was approximately $2.2 million. An additional $559,000 was disbursed to Cook Inlet Aquaculture Association from an Area H 2% salmon enhancement tax. The LCI management area personal use and subsistence fisheries harvested 4,527 salmon. For these fisheries, approximately 184 subsistence and personal use permits were issued to Alaska residents. In addition, 1,408 coho salmon were landed by sport fish permit holders in a fishing derby in Seward. Although these fish were subsequently sold commercially, they are not included in the total commercial harvest. The commercial Pacific herring Clupea pallasii fishery in the Kamishak Bay District remained closed in 2015 for the 14th consecutive year to allow the spawning population to continue rebuilding.
Key words: Pacific salmon Oncorhynchus spp., sockeye salmon O. ner , pink salmon O. gorbuscha, chum salmon O. keta, Chinook salmon O. tshawytscha, coho salmon O. kisutch, Pacific herring Clupea pallasii, harvest, set gillnet, purse seine, commercial salmon harvest, salmon enhancement, hatchery, cost recovery, sport fishery, subsistence fishery, personal use fishery, escapement, Cook Inlet Aquaculture Association CIAA, Lower Cook Inlet, Kamishak Bay, Kachemak Bay, Resurrection Bay, Annual Management Report AMR
INTRODUCTION LOWER COOK INLET MANAGEMENT AREA COMMERCIAL SALMON AND HERRING FISHERIES The Lower Cook Inlet (LCI) management area comprises waters of the Cook Inlet Area, south of the latitude of Anchor Point including the western shore of Cook Inlet south to Cape Douglas, and the eastern shore of Cook Inlet along the Kenai Peninsula to Cape Fairfield. This area is included in Area H and encompasses all coastal waters and inland drainages entering this area (Figure 1).
This salmon management area is divided into 5 districts that correspond to local geography and distribution of the 5 species of Pacific salmon (Oncorhynchus spp.) harvested by commercial fisheries (Figures 1–18). The management objective for all districts is the achievement of spawning escapement goals for major stocks, while allowing for orderly fisheries to harvest fish surplus to spawning requirements. In addition, Alaska Department of Fish and Game (ADF&G) follows regulatory guidelines to manage fisheries and allow private nonprofit hatcheries to achieve cost recovery and broodstock objectives.
Three hatcheries currently contribute to the area’s salmon fisheries. The Trail Lakes Hatchery (TLH) at Mile 29 of the Seward Highway produces sockeye O. nerka and coho salmon O. kisutch and is operated by the Cook Inlet Aquaculture Association (CIAA). ADF&G operates the Ship Creek Hatchery Complex near Anchorage that produces Chinook O. tshawytscha and coho salmon, which are released in the LCI area. In addition, the Tutka Bay Lagoon Hatchery once again began incubating pink salmon O. gorbuscha eggs in 2011 for release into Kachemak Bay.
1

Gear utilized in commercial salmon fisheries includes purse seine and set gillnet. Purse seine gear is permitted to be fished in the Southern, Outer, Eastern, and Kamishak Bay districts. Set gillnet gear is permitted to be fished in the Southern District. The Barren Islands District is closed by regulation to salmon harvest.
When Pacific herring Clupea pallasii spawning biomass allows for a commercial fishery in the Kamishak District, annual harvest level ranges are established in regulation and divided between the commercial purse seine sac roe fishery in that district (90%) and the Shelikof Strait food and bait fishery (10%) in the Kodiak management area. Other districts in LCI were closed to commercial herring harvest by the Alaska Board of Fisheries (BOF) in 2002, pending an increase in stock levels sufficient to ensure that a commercial herring fishery can be conducted in a sustainable manner.
OVERVIEW OF AREAWIDE SALMON AND HERRING FISHERIES The 2015 LCI management area commercial salmon harvest was 6,751,859 fish (Table 1; Figure 19). The harvest was composed of 6,388,392 pink, 244,892 sockeye, 113,441 chum O. keta, 4,340 coho, and 804 Chinook salmon. Hatchery runs of sockeye salmon in general were below forecast in Resurrection Bay and at other hatchery release sites. Commercial harvest of coho and sockeye salmon were below previous 10-year (2005–2014) averages (Table 2). Approximately 67% of the harvest, 4,512,536 fish, was attributed to the common property fishery, and 2,239,333 fish to hatchery cost recovery, including carcass sales and donations. An additional 17,755 sockeye and 265,203 pink salmon were harvested by hatcheries for broodstock (Appendices F2 and F3). Homepack harvest (1,253 salmon) accounted for less than 1% of the commercial harvest from LCI districts (Table 1). The 2015 preliminary exvessel value estimates by gear group from the common property fishery, both wild and enhanced salmon, were $3.5 million (88.8%) for purse seine and $440,698 (11.2%) for set gillnet (Table 3; Figure 20). The average price per pound paid to fishermen was below the previous 10-year average for all salmon species except sockeye (Table 4). The overall harvest values for purse seine in 2015 was approximately double the previous 10-year harvest average, whereas set gillnet harvest value was only 1.7 times the previous 10-year average value (Table 5).
No commercial fisheries for herring occurred in 2015 in order to allow the population further opportunity to rebuild from historically low abundance (Figure 21). This is the 14th consecutive year the commercial fisheries have remained closed to allow the spawning population to continue rebuilding.
SALMON SEASON SUMMARY BY DISTRICT SOUTHERN DISTRICT The Southern District includes the waters of eastern Cook Inlet south of Anchor Point and north of a line from Cape Elizabeth to Cape Douglas excluding waters east of a line from Point Adam to the tip of Cape Elizabeth (Figures 1–5). Commercial fishing in this district is restricted by regulation to waters along the south shore of Kachemak Bay from Chugachik Island near the terminus of Kachemak Bay to Point Bede approximately 4 miles south of the village of Nanwalek (English Bay). Purse seine gear is permitted in all open waters of this district during periods established by emergency order (EO). Commercial set gillnet harvest is restricted to approximately 15 miles of shoreline in 5 subdistricts in this district: east shore of Ismailof Island near Halibut Cove; waters surrounding McDonald Spit extending to Jakolof Bay; waters east of
2

Barabara Point extending approximately 1.4 miles; waters along the west shore of outer Seldovia Bay; and waters of a portion of the south shore of Port Graham and English Bay. Any Cook Inlet Area (Area H) commercial set gillnet permit holder may register to fish in these areas. This registration, however, would preclude that permit holder from fishing in the Northern and Central districts in Cook Inlet for the remainder of that calendar year. Other areas in the “Greater Cook Inlet Area,” as defined in 5 AAC 21.345, may be fished in a given year by set gillnet permit holders fishing in the Southern District. The primary target species in this district for both purse seine and set gillnet permit holders are sockeye and pink salmon, although modest numbers of chum and coho salmon are also harvested. The major natural producer of sockeye salmon in this district is the English Bay River. Pink salmon historically have returned in large numbers to Humpy Creek, as well as numerous smaller streams in the Southern District. Hatchery releases began in 1972, when 241,000 coho and 34,000 Chinook salmon were released into Kasitsna Creek. This was followed by releases of chum and pink salmon into Halibut Cove Lagoon in 1974 and 1975. Sockeye salmon were released into Leisure Lake and Halibut Cove Lagoon in 1976. Since that time, hatchery releases have continued to provide added salmon production to sites within this district (Appendices F12, F13, and F14).
Preseason Outlook and Harvest Strategy The 2015 commercial wild stock harvest forecast for the Southern District was 26,000 pink and 40,700 sockeye salmon (Table 6; Appendix H1). The enhanced sockeye salmon run to CIAA release sites was forecast to be 82,900 fish. A total of 1.5 million hatchery-produced pink salmon were anticipated to return to the LCI Area in 2015 from the 2014 release of 51 million fry from Tutka Bay Lagoon and 188,000 from Port Graham Bay (Appendices F7, F9, and F14).
As specified in regulation, the set gillnet fishing season in the Southern District opens on or after June 1 with two 48-hour periods per week specified unless modified by EO. The seine fishing season and fishing periods are opened and closed by EO depending on the available harvestable surplus of both wild and hatchery stock salmon. Given that cost-recovery objectives were initially anticipated to be met by sockeye salmon returns to Resurrection Bay, all returning hatchery sockeye and pink salmon in excess of broodstock requirements in other areas were anticipated to be available for commercial common property harvest. Considering recent irregular runs of sockeye salmon to the Port Graham Subdistrict, the commercial set gillnet fishery would remain closed in this area until observations at the English Bay River indicated sufficient escapement to achieve both the sustainable escapement goal (SEG) and hatchery broodstock requirements. Hatchery harvest for this and previous seasons is discussed fully in the Cook Inlet Salmon Enhancement section. Early season management of the Southern District (excluding the Port Graham Subdistrict) is based on actual harvest versus anticipated harvest. Port Graham Subdistrict management is based on anticipated versus actual run strength to the English Bay Lakes as measured by the English Bay River weir. Environmental conditions, fishing effort, and harvest consistency throughout the period are also taken into account. By early July, ground survey estimates of chum and early pink salmon escapement begin to weigh more heavily when scheduling commercial fishing periods. These surveys become primary tools in late July and August when management focus shifts to pink salmon in this district.
3

Season Summary The total 2015 Southern District sockeye salmon commercial common property harvest was 90,844 fish, with 36,061 (39.7%) harvested by the set gillnet fleet and 54,783 harvested by seine permit holders (Appendices A1–A3). In addition 32,455 sockeye salmon were harvested from the Tutka Bay Lagoon Hatchery Special Harvest Area (SHA) by CIAA for cost recovery, and 6,769 fish were harvested for broodstock purposes (Appendix F2). Total pink salmon harvest was 169,330 fish with 141,604 (83.7%) harvested by the seine fleet and 27,726 harvested by set gillnet permit holders. In addition, CIAA harvested 165,008 pink salmon from the Tutka Bay Lagoon Hatchery SHA and purchased 21,408 from the Port Graham Hatchery SHA for use as broodstock (Appendix F3). A total of 804 Chinook salmon were harvested in the Southern District with 752 fish harvested by set gillnet permit holders and the remaining by seine permit holders. Also, a total of 12,989 chum salmon were harvested, with 11,539 by set gillnet and 1,450 by seine permit holders. In addition, 4,099 coho salmon were landed, with 3,102 by set gillnet and 997 by seine permit holders (Table 1; Appendices A1 and A2). A total of 278 sockeye, 67 Chinook, 479 coho, 28 chum, and 401 pink salmon were retained by 20 commercial permit holders for personal “homepack” use and not sold (Table 1; Appendix E7).
Prior to the first commercial set gillnet fishing period on Monday, June 1, AD&FG released an EO that defined the seaward boundary of the 5 areas in the Southern District where commercial set gillnets are legal using GPS coordinates located 1,000 feet seaward of the mean lower low water (MLLW) isobar established on NOAA nautical charts. Prior to this EO, the legal boundary was implied by 5AAC 21.330(b)(1), which states that “Set gillnets may be used…within 1,000 feet of beach areas that at mean low water are connected by exposed land to the shore…”
This regulation was identified by Alaska State Troopers as being problematic for their field staff given that mean low water (MLW) is a nonstandard reference that would be highly difficult to establish in the field without additional technical staff and equipment. The standard reference used in all other shore fisheries in Cook Inlet as well as on NOAA navigational charts is MLLW, which is defined as the average of the lower low water height of each tidal day observed over the 17-year National Tidal Datum Epoch. Assigning GPS coordinates to points along a line 1,000 feet seaward of MLLW would further simplify identification of this line for stake holders and enforcement staff where the only equipment required to locate these points is a cell phone or inexpensive handheld GPS receiver.
Shortly after the first fishing period concluded, on June 4 a set gillnet permit holder contacted ADF&G and voiced concern that the section of the “new line” that was established on the east side of Ismailof Island invalidated a portion of her shore fishery lease that she had fished for 2 decades. Consulting DNR Shore Fishery Diagram No. 1824 showed that her lease terminated on a line identified only as “ADF&G Closure Line” on the diagram. Further examination revealed that this line was incorrectly located on this document. The actual boundary (151°12.25′W long) specified in regulation was approximately 400 feet to the west. The regulatory boundary was established in 1961 and was first identified in regulation using the North American Datum of 1927 as 151°12.12′W longitude.
Given that this error had been unnoticed by ADF&G management staff, DNR shore fishery permitting staff, and the Alaska State Troopers for close to 20 years, and impacted only 2 permit holders, the eastern boundary of the legal area where commercial set gillnet is legal was moved approximately 400 feet eastwards using EO authority.
4

The Southern District set gillnet commercial fishing season was announced by EO on May 8 and opened on June 1 (Table 7). The first 48-hour commercial fishing period was also announced in this EO to begin at 6:00 AM on Monday, June 1. The harvest from this period was 493 sockeye, 39 Chinook, and 50 chum salmon with 9 permit holders reporting deliveries (Appendix A1). During this period, waters of the Port Graham Subdistrict remained closed to commercial set gillnet harvest as a precautionary measure due to irregular sockeye salmon runs in recent years. The English Bay weir began operation on May 22 and through June 1 had passed 94 sockeye salmon during this period. Passage increased with a total of 501 sockeye salmon counted through June 7. This was within the anticipated SEG range of 234–526 fish for this period. The anticipated range was the SEG range apportioned out daily in accordance with the historic run timing that would be required to meet the SEG on July 31 (Appendices A4–A6; Table 8).
The second 48-hour period began the following Thursday on June 4 at 6:00 AM and had 8 permit holders reporting 302 sockeye, 21 Chinook, and 66 chum salmon harvested (Appendix A1). During the following period on Monday, June 8, harvest increased with a total of 640 sockeye, 62 Chinook, and 185 chum salmon harvested by 9 permit holders (Appendix A1). English Bay weir passage increased during the week of June 8–14 with a total of 1,983 sockeye salmon passed. A cumulative total of 1,141–2,567 fish were anticipated in order to fall within the final SEG range of 6,000–13,500 on July 31.
A commercial fishing period occurred beginning on Thursday, June 11, in the Southern District excluding the Port Graham Subdistrict with 9 permit holders reporting a harvest of 93 Chinook, 1,665 sockeye, and 773 chum salmon. Weather over the past weeks was overcast with warm temperatures and scant rain. Harvest from the following period beginning on Monday, June 15, decreased with 10 permit holders delivering 72 Chinook, 916 sockeye, and 442 chum salmon (Appendix A1). Although cumulative sockeye salmon passage at the English Bay weir remained within the SEG targets for those dates, ADF&G was concerned that inconsistent daily passage could portend an early and lackluster run. Consequently, the commercial fishery in the Port Graham Subdistrict remained closed. During the week of June 15–July 21, passage increased with a total of 933 sockeye salmon passed during this 7-day period versus an anticipated count of 642–1,444 fish during this time period. Cumulative passage on June 21 was 2,916 fish versus an anticipated cumulative count of 1,783–4,011 fish (Appendix A4). Historically, passage at the weir has been extremely sporadic with fish numbers influenced by rainfall and tides, as well as subsistence harvests by residents of Nanwalek and Port Graham. Consequently, staff elected to keep the common property commercial fishery in the Port Graham Subdistrict closed until this run could support additional commercial harvest, as well as subsistence harvest and escapement needs. Elsewhere in the Southern District, harvest from the Thursday, June 18 fishing period improved somewhat with 61 Chinook, 1,545 sockeye, and 562 chum harvested by 8 permit holders (Appendix A1).
Weir passage over the next week (June 22–28) decreased markedly with 778 fish counted, which was below the SEG range anticipated for passage during that week of 1,532–3,446 fish. Total passage through June 28 was 3,694 sockeye salmon versus an anticipated total cumulative passage of 3,315–7,458 fish. Historically, approximately 55% of the English Bay weir escapement has been counted as of this date (Appendix A4). Commercial set gillnet harvest in other portions of the Southern District during the week of June 22–28 was similar to previous weeks harvest (Appendix A1).
5

The Southern District commercial purse seine season was opened by EO on June 22 with a fishing schedule of 3 weekly 16-hour periods (6:00 AM to 10:00 PM) established on Mondays, Wednesdays, and Fridays in portions of the district east of McDonald Spit (Table 8). Although no deliveries were reported from the Monday, June 22 fishing period, harvest from the Wednesday fishing period was confidential due to fewer than 3 permit holders reporting deliveries (Appendix A2). Harvest from the Friday, June 26 fishing period was 137 sockeye salmon with 3 permit holders reporting deliveries. Harvest and participation increased the following week with 9 permit holders delivering 5,090 sockeye and 16,858 pink salmon. An increase in fishing time to 5 days per week (Monday–Friday) effective on Monday, July 6, was announced on Thursday, July 2. Hatchery SHAs remained closed during these fishing periods. The intent of this added time was to begin harvesting what was anticipated to be a significant enhanced pink salmon return to the Tutka Bay Lagoon Hatchery. Increased time would reduce the possibility of hatchery-produced salmon straying, as well as diminish the possibility that a large return would overwhelm the capability of cost-recovery boats to harvest these fish in an orderly and effective manner. Harvest from Monday, July 6, through Friday, July 10, was 12,981 sockeye and 33,264 pink salmon by 11 permit holders. Similarly, set gillnet harvest from the Monday and Thursday 48-hour fishing periods increased with 3,767 sockeye and 4,818 pink salmon harvested. Sockeye salmon passage at the English Bay River weir declined in both weeks from June 29–July 5 and from July 6–July 12. Cumulative passage on July 12 was 5,263 fish versus an anticipated minimum SEG of 5,607 sockeye salmon required to achieve the escapement goal of 6,000 fish on July 31, when the weir historically has been removed. Ground surveys of the Port Graham River on July 8 documented levels of chum salmon that were above the minimum final SEG of 1,450 for that system as well as levels of pink salmon that were above the escapement expected for that date. Consequently, on July 10, waters of the Port Graham Section of the Port Graham Subdistrict were opened to both set gillnet and purse seine commercial salmon harvest on the schedule established for those gears elsewhere in the Southern District. Weir passage at English Bay River remained lacking in vitality but steady the following week (July 13–19) with a cumulative passage of 5,785 counted through the weir on July 19 versus an anticipated minimum of 5,903 fish.
Purse seine pink salmon harvest increased significantly during the Monday, July 13 through Friday, July 17 fishing periods with 42,229 fish harvested by 11 permit holders (Appendix A2). Sockeye salmon harvest also increased this week with 16,567 harvested. A significant portion of the purse seine harvest occurred in the Tutka Hatchery SHA. Otoliths were sampled from these commercially harvested fish and examined for hatchery thermal marks. Pink salmon otoliths are still being analyzed and results will be documented in future versions of this annual report. Set gillnet harvest peaked during the week of July 12–July 18 with a total of 6,663 sockeye, 6,497 pink, and 2,339 chum salmon harvested by 20 permit holders. Sockeye salmon passage through the English Bay weir surpassed the minimum cumulative SEG of 6,000 fish for this system on Sunday, July 26, after subtraction of otolith harvested fish (Appendices A5 and A6). Commercial set gillnet harvest was opened the following day in the English Bay Section at 6:00 AM concurrent with other set gillnet fisheries ongoing in the Southern District. Set gillnet harvest remained robust during this week with 21 permits delivering 6,181 sockeye and 5,262 pink salmon. Purse seine harvests of both species declined during the July 20–July 24 fishing periods with 11 permit holders reporting 13,942 pink and 14,092 sockeye salmon landed. With harvests increasing in the Outer District, purse seine participation declined in the Southern District the following week with 7 permit holders delivering 10,091 pink and 5,661 sockeye salmon. During
6

the following week, nearly all seine fishing effort shifted to the Outer District, where a record pink salmon harvest was occurring. Set gillnet harvest continued to be productive through the next 2 weeks (July 26–August 1 and August 2–August 8), with 3,207 sockeye salmon harvested in the first week and 5,446 harvested in the second. Pink salmon harvest declined with only 2,933 and 2,076 harvested during those weeks respectively. Set gillnet harvest declined markedly during the week of August 9–August 15 with only 1,511 sockeye and 2,281 pink salmon delivered by 12 permit holders. Harvests in the weeks following this are confidential due to fewer than 3 permit holders reporting deliveries in these reporting periods. Similarly, purse seine harvest in Southern District was very low in August with only 1 significant delivery of 23,000 pink salmon from the Port Graham Subdistrict in late August that was sold live to a processor for resale to Cook Inlet Aquaculture Association for use as broodstock at the Port Graham Hatchery (Appendix A2). The 2015 salmon season was closed to purse seine fishing on September 19 and to set gillnet fishing by regulation on October 1 (Table 7).
The final escapement indices for Southern District pink salmon stocks monitored using ground surveys each exceeded at least the low end of their respective SEG ranges (Appendix A9). Spawning escapement for chum salmon to the Port Graham River was 4,030 fish, as measured by ground surveys. This was within the SEG range of 1,450–4,800 fish for this system (Appendices A7–A9). Final spawning escapement for English Bay River was 6,290 sockeye salmon. This is within the SEG range of 6,000–13,500 fish. The previous 10-year average spawning escapement was 11,425 for this system (Appendix A6).
Although the Port Graham Section of the Port Graham Subdistrict, as well as the English Bay Section, did open to commercial set gillnet harvest beginning on July 9 and July 27, respectively, no commercial set gillnet harvests were reported this season for that area.
The total 2015 Southern District common property commercial harvest of 90,844 sockeye salmon was above the previous 10-year average harvest of 55,153 fish (Table 6; Appendices A3, A8, and H1). The pink salmon commercial common property harvest (169,330) was above the anticipated harvest of 26,000 fish and the previous 10-year average harvest of 35,718 fish (Appendix A3).
OUTER DISTRICT The Outer District includes the waters of LCI along the Kenai Peninsula south and east of a line from Point Adam to Cape Elizabeth, and east of the longitude of Cape Elizabeth to the longitude of Aligo Point, which is 35 miles southwest of Seward (Figures 1, 2, and 6–9). Purse seine gear is permitted in all open waters of this district during periods established by EO. Historically, the primary target species have been sockeye and pink salmon. The major natural producers of sockeye salmon in this district are Delight, Desire, and Delusion lakes. All 3 of these lakes were reported to have been glaciated in the early part of the 20th century with the McCarty Glacier terminus stretching from James Lagoon on the west to McCarty Lagoon on the east (Cook and Norris 1998, page 251). Pink salmon return in large numbers to Rocky Bay, Port Dick, and Windy Bay, as well as several smaller systems. In addition, modest numbers of chum salmon are regularly harvested from Dogfish Lagoon and Port Dick. There have been no regular releases of hatchery salmon into this district (Appendix F12).
At the December 2013 BOF meeting, Dogfish Lagoon Creeks was added to the 8 pre-existing pink salmon index streams in the Outer District and an SEG of 1,200–8,400 pink salmon was created. This stream complex has been regularly surveyed for more than forty years.
7
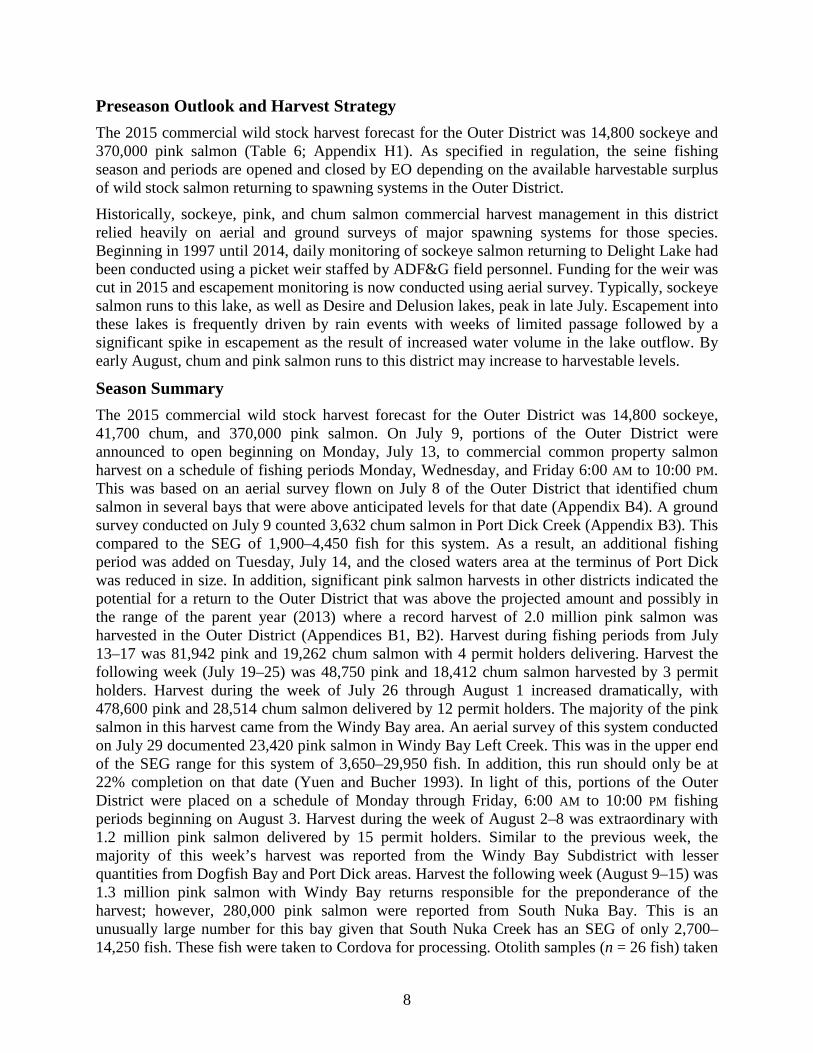
Preseason Outlook and Harvest Strategy The 2015 commercial wild stock harvest forecast for the Outer District was 14,800 sockeye and 370,000 pink salmon (Table 6; Appendix H1). As specified in regulation, the seine fishing season and periods are opened and closed by EO depending on the available harvestable surplus of wild stock salmon returning to spawning systems in the Outer District.
Historically, sockeye, pink, and chum salmon commercial harvest management in this district relied heavily on aerial and ground surveys of major spawning systems for those species. Beginning in 1997 until 2014, daily monitoring of sockeye salmon returning to Delight Lake had been conducted using a picket weir staffed by ADF&G field personnel. Funding for the weir was cut in 2015 and escapement monitoring is now conducted using aerial survey. Typically, sockeye salmon runs to this lake, as well as Desire and Delusion lakes, peak in late July. Escapement into these lakes is frequently driven by rain events with weeks of limited passage followed by a significant spike in escapement as the result of increased water volume in the lake outflow. By early August, chum and pink salmon runs to this district may increase to harvestable levels.
Season Summary The 2015 commercial wild stock harvest forecast for the Outer District was 14,800 sockeye, 41,700 chum, and 370,000 pink salmon. On July 9, portions of the Outer District were announced to open beginning on Monday, July 13, to commercial common property salmon harvest on a schedule of fishing periods Monday, Wednesday, and Friday 6:00 AM to 10:00 PM. This was based on an aerial survey flown on July 8 of the Outer District that identified chum salmon in several bays that were above anticipated levels for that date (Appendix B4). A ground survey conducted on July 9 counted 3,632 chum salmon in Port Dick Creek (Appendix B3). This compared to the SEG of 1,900–4,450 fish for this system. As a result, an additional fishing period was added on Tuesday, July 14, and the closed waters area at the terminus of Port Dick was reduced in size. In addition, significant pink salmon harvests in other districts indicated the potential for a return to the Outer District that was above the projected amount and possibly in the range of the parent year (2013) where a record harvest of 2.0 million pink salmon was harvested in the Outer District (Appendices B1, B2). Harvest during fishing periods from July 13–17 was 81,942 pink and 19,262 chum salmon with 4 permit holders delivering. Harvest the following week (July 19–25) was 48,750 pink and 18,412 chum salmon harvested by 3 permit holders. Harvest during the week of July 26 through August 1 increased dramatically, with 478,600 pink and 28,514 chum salmon delivered by 12 permit holders. The majority of the pink salmon in this harvest came from the Windy Bay area. An aerial survey of this system conducted on July 29 documented 23,420 pink salmon in Windy Bay Left Creek. This was in the upper end of the SEG range for this system of 3,650–29,950 fish. In addition, this run should only be at 22% completion on that date (Yuen and Bucher 1993). In light of this, portions of the Outer District were placed on a schedule of Monday through Friday, 6:00 AM to 10:00 PM fishing periods beginning on August 3. Harvest during the week of August 2–8 was extraordinary with 1.2 million pink salmon delivered by 15 permit holders. Similar to the previous week, the majority of this week’s harvest was reported from the Windy Bay Subdistrict with lesser quantities from Dogfish Bay and Port Dick areas. Harvest the following week (August 9–15) was 1.3 million pink salmon with Windy Bay returns responsible for the preponderance of the harvest; however, 280,000 pink salmon were reported from South Nuka Bay. This is an unusually large number for this bay given that South Nuka Creek has an SEG of only 2,700–14,250 fish. These fish were taken to Cordova for processing. Otolith samples (n = 26 fish) taken
8

by Cordova ADF&G staff from this delivery showed 100% unmarked pink salmon. Harvest opportunity was increased from Monday to Friday, 6:00 AM to 10:00 PM fishing periods to 7 day per week, 6:00 AM to 10:00 PM periods beginning on Saturday, August 15. Harvest during August 16–August 22 was 701,371 pink salmon with 11 permit holders reporting deliveries. Harvest the final week (August 23–29) was 332,465 pink salmon with 4 permits reporting. There were no further harvests from the Outer District in 2015 (Appendices B1–B7).
This district closed for the 2015 season on September 19. A total of 19 permits reported deliveries from the Outer District in 2015, which was above the previous 10-year annual average of 11 permits. Total harvest from this district was 613 sockeye, 4.1 million pink, 97,974 chum, and 41 coho salmon. Sockeye salmon harvest was below the anticipated harvest of 14,800 fish (Appendices B2, H1). With the closure of the Delight Lake weir, monitoring of this system was conducted by aerial survey (Appendix B5). Surveys were sporadic due to poor weather conditions and pilot availability. The peak count for sockeye salmon in Delight Lake was 3,220 fish. This was below the historic SEG range of 5,950–12,550 fish as calibrated for aerial observation. This was the SEG range used prior to 2010 when the range was adjusted to 7,550–17,650 at the BOF meeting for escapement monitoring and inseason management based on weir counts. Consequently, the East Nuka Subdistrict remained closed in 2015. The chum salmon harvest was above the anticipated harvest of 41,700 fish. Pink salmon harvest was significantly above the anticipated harvest of 370,000 fish (Appendices B1 and B2).
EASTERN DISTRICT The Eastern District includes all state waters of the Gulf of Alaska between the longitudes of Aligo Point and Cape Fairfield (Figures 1, 2, and 10). Purse seine gear is permitted in all open waters of this district during periods established by EO. Historically, the primary target species have been sockeye and pink salmon with commercial harvests in modest numbers occurring sporadically (Appendix C2). Harvests of chum salmon were larger in this district during the 1980s when hatchery runs of this species to neighboring Prince William Sound were also robust. The natural producers of sockeye salmon in this district have been Bear and Aialik lakes. Sockeye salmon production in Aialik Lake is a relatively recent event, with this lake having been covered by the Pedersen Glacier as late as 1909 (Cook and Norris 1998, pages 8 and 9). Beginning in 1990, CIAA released up to 3.4 million sockeye salmon juveniles into Bear Lake, in addition to 1.3 million to 1.7 million into Resurrection Bay in some years since 2008 (Appendix F12).
Pink salmon production in the Eastern District has been the result of natural spawning, excluding 1999 and 2000, when 24,000 and 48,000 pink salmon were released by the Alaska Sea Life Center into Resurrection Bay (Appendix F14). The largest pink salmon producers in this district are Salmon Creek with a 10-year (1980–1989) average escapement of 4,500 pink salmon and Bear Creek with a 10-year (1997–2006) average escapement of 11,800 fish. In addition, Thumb and Humpy coves collectively produced an average of 10,500 pink salmon per year from 1997 to 2006 (Appendix C11). Ground surveys of this area in recent years have been curtailed due to budgetary constraints combined with historic low runs to this area (Appendix C11).
Since the early 1960s, coho salmon production has been the subject of enhancement efforts in Resurrection Bay. Historically, commercial harvest of this species in the Eastern District was minimal (Appendix C2). In 1966, commercial harvest of coho salmon north of a line from Cape Resurrection to Callisto Head was prohibited, and in 1968 this regulatory line was moved south
9

to its current position at Aialik Cape. Beginning in 1985 with the start of hatchery releases of Chinook salmon in the Seward area (Appendix F11), commercial harvest of this species north of a line from Cape Resurrection to Aialik Cape was prohibited. In addition, since 1989 the Resurrection Bay Salmon Management Plan (5 AAC 21.376) has directed commercial fishery managers to conduct those fisheries in a manner that does not interfere with recreational fisheries for enhanced Chinook and coho salmon in Resurrection Bay. Consequently, the majority of coho salmon in this area have been harvested by sport users, and runs of pink and chum salmon have generally been insufficient to target for commercial harvest. Since 1956, the Seward Chamber of Commerce has conducted a fishing derby that focuses on enhanced and wild coho salmon returning to local spawning systems at the head of Resurrection Bay. Beginning in 1990, coho salmon harvested by participants in the derby have been sold commercially by the Chamber of Commerce to a local processor as a fundraiser for that organization and are listed separately from commercial common property harvests (Appendix C2).
Preseason Outlook and Harvest Strategy The enhanced sockeye salmon run to CIAA release sites in Resurrection Bay was forecast to be 323,000 fish (Table 6, Appendix H1). As specified in regulation, the seine fishing season and fishing periods are opened and closed by EO depending on the available harvestable surplus of both wild stock and enhanced salmon returning to the Eastern District. CIAA announced preseason that all of the sockeye salmon anticipated to return to Resurrection Bay release sites would be required to meet corporate cost recovery, as well as broodstock needs. Early season management of the Eastern District is based on actual harvest versus anticipated harvest, as well as passage at the Bear Creek weir, which is located 8 km (5 miles) from saltwater. Beginning in July, management is based on aerial surveys of sockeye salmon runs to Aialik Lake. Historically, runs of pink and chum salmon to this district have been below the level required to support consistent and sustainable commercial harvests.
Season Summary The total 2015 Eastern District sockeye salmon commercial common property harvest was 4,633 fish (Appendices C1 and C2). An additional 155 pink and 115 chum salmon were also harvested. CIAA harvested 92,776 sockeye salmon for cost recovery from Resurrection Bay and at the Bear Lake weir.
The Bear Lake SHA opened by regulation to corporate cost-recovery harvest and broodstock collection at 6:00 AM on May 15. Although the first delivery did not occur until May 26, sockeye salmon began arriving at the Bear Creek weir on May 19 with over 908 fish counted through May 31 versus an anticipated 18 fish past the weir by this date. This was similar to last year’s early run timing where 1,834 sockeye salmon were counted through the weir by this date. Cost-recovery harvest from May 26 through May 31 was 5,720 sockeye salmon. Harvests increased substantially from June 1 to June 6 with nearly 14,000 fish harvested during this period, and an additional 36,000 harvested the following week (June 7–13). Weir passage remained significantly above anticipated passage with over 10,513 sockeye salmon counted through June 13 versus an anticipated cumulative range of 406–891 fish to achieve the final escapement goal of 6,370–13,970 fish. This range is the combination of the SEG for Bear Lake sockeye salmon (700–8,300) and the CIAA broodstock goal for this species (5,670 fish). The Eastern District opened to daily commercial common property harvest fishing periods beginning on Thursday, July 2, after 57,017 sockeye salmon had been harvested by cost-recovery purse seine
10

vessels and 28,453 at the weir. Three commercial permit holders reported deliveries through the next week with a total of 4,633 sockeye, 155 pink, and 115 chum salmon landed. There were no further deliveries with this area closing by announcement on Friday, July 17. Similar to last year, weir counts remained well ahead of anticipated weir counts with nearly 47,000 enumerated as of July 10. Of those fish, only 12,778 were passed through the weir into the lake, with a final count of 35,759 sold for cost recovery at the weir and 2,062 fish donated to members of the public. Final passage into Bear Lake was 13,505 with 3,945 fish harvested for broodstock. The remaining 9,560 fish were allowed to spawn naturally in the lake. This escapement was above the SEG range of 700–8,300 fish and above the previous 10-year spawning escapement average of 9,158 sockeye salmon (Appendices C3, C4, C7, and F2).
A total of 261 coho salmon passed through the weir. An additional 705 coho salmon were harvested at the weir for CIAA and ADF&G broodstock. Also, 1,013 coho salmon were donated to members of the public (Appendices C5–C7, F4).
Poor weather conditions in 2015 resulted in only 3 aerial surveys of Aialik Lake. Surveys were conducted on July 8, August 4, and August 12 with a peak count of 3,182 fish occurring on the last survey. As has been the case in the past 3 years, high levels of suspended silt and algae in the lake made aerial surveying of this system problematic. This is the 5th consecutive year where the SEG range of 3,700–8,000 fish was not met. As a result of this, no commercial fishing periods were announced targeting sockeye salmon runs to Aialik Lake in 2015 (Appendices C8–C11). A total of 1,408 coho salmon were harvested by sport users and sold to local processors by the Seward Chamber of Commerce during the annual silver (coho) salmon derby (Appendix C2).
KAMISHAK BAY DISTRICT The Kamishak Bay District includes all state waters on the west side of Cook Inlet south of the latitude of Anchor Point and north of a line from Cape Douglas to Elizabeth Island (Figures 1, 2, and 11–13). Purse seine gear is permitted in all open waters of this district during periods established by EO. Historically, the primary naturally occurring target species was chum and pink salmon. From 1959 through 1980, the average harvest was 31,000 pink, 34,000 chum, and 2,000 sockeye salmon. However, after the release of hatchery sockeye salmon to systems in this district, this species became a major component of the harvest. From 1981 to 2010, the average harvest was 67,000 pink, 52,000 chum, and 55,000 sockeye salmon. In addition to sockeye releases, pink salmon were also released into Paint River from 1980 to 1983 (Appendices F12 and F14). The major natural producers of pink salmon in this district have been the Bruin Bay River, Sunday Creek, and Brown’s Peak Creek. Major chum salmon producers have been the Big Kamishak and Little Kamishak rivers as well as Cottonwood Creek. In addition, numerous other rivers and streams have periodically produced pink and chum salmon runs.
Prior to 1981, Mikfik Lake was the largest single producer of sockeye salmon in this district with an average run of 6,600 from 1970 to 1980. The second-largest producer, Chenik Lake, had an average run of 3,800 during this period with Amakdedori Creek and Kamishak rivers having average runs of 1,200 and 1,300 sockeye salmon, respectively. Generally, runs to Chenik Lake increased significantly after enhancement (1978–1996) with average harvests of 55,900 per year during this period (Appendix F16). However, there were years when escapement dropped below 1,000 fish, possibly stemming from high densities of sockeye salmon in the lake resulting in an infectious hematopoietic necrosis (IHN) outbreak. Stocking of Chenik Lake was curtailed in 1996 and the population recovered quickly without further enhancement. The large runs
11

experienced since 2002 have derived entirely from natural production. Average annual escapement to Mikfik Lake from 1981 to 2010 was 11,100 fish, with escapement to Chenik Lake at 8,700 fish and escapement to nearby Amakdedori Creek and Kamishak rivers increasing slightly to 2,700 and 1,800 respectively. Kirschner Lake has been stocked regularly with sockeye salmon since 1987. In addition, hatchery sockeye salmon were also released from 1986 to 1996 at several other smaller systems in this district (Appendix F12). In addition, at the 2013 BOF meeting, the SEG for Mikfik Lake was adjusted from 6,300–12,150 to 3,400–13,000 to reflect the change from aerial survey enumeration of the whole drainage to video monitoring of escapement into Mikfik Lake.
Preseason Outlook and Harvest Strategy The 2015 commercial wild stock harvest forecast for the Kamishak Bay District was 37,900 sockeye salmon. A commercial pink salmon harvest was not anticipated (Table 6; Appendix H1). The enhanced CIAA sockeye salmon run to Kirschner Lake was forecast to be 39,500 fish (Appendix F1; Table 6). As specified in regulation, the fishing season in the Kamishak Bay District opens from June 1 until closed by EO. Historically, the Kamishak District has been opened for extended 7-day periods, with specific areas closed as needed by EO to address anticipated escapement shortfalls (e.g., McNeil River chum salmon) or to allow for hatchery cost recovery harvest. CIAA initially announced that all of the 39,500 sockeye salmon anticipated to return to the Kirschner Lake release site would be available for common property harvest. Early season management of the Kamishak Bay District is based on actual harvest versus anticipated harvest as well as passage at the Mikfik and Chenik Lake video monitoring sites. In addition, aerial surveys are flown, weather permitting, to monitor sockeye and chum salmon escapement to index streams, as well as recover recording media from video monitoring sites for inseason review in the Homer office. Beginning in July, management is also based on aerial surveys of pink and chum salmon runs to spawning systems in this district. Surveys are also flown in late August and September to monitor progress of coho salmon runs to select streams in this district.
Season Summary The total 2015 Kamishak Bay District commercial common property harvest is confidential due to fewer than 3 seine permit holders participating (Appendix D1 and D2). Given the below-anticipated success of cost recovery in the Eastern District in 2015, commercial common property harvest in the Kirschner Lake SHA remained closed to allow corporate harvest of this run.
The portion of the Kamishak Bay District south of Nordyke Island was opened to commercial common property harvest on Monday, May 25, in order to harvest Mikfik sockeye salmon returns. In 2014, an unanticipated large and early return resulted in the opening of closed waters inside of the McNeil Spit to commercial salmon harvest. Historically, department fishery managers have endeavored to avoid opening waters inside of McNeil Spit by having preemptive fishing periods in outside waters to prevent a buildup of these fish. However, in 2015 a return of similar magnitude did not materialize. On June 1, the remaining subdistricts in the Kamishak District opened to commercial common property harvest 24 hours per day, 7 days a week. CIAA harvested 23,571 sockeye salmon for cost recovery and 3,666 for broodstock use from the
12

Kirschner Lake SHA (ADF&G fish ticket1 database; CIAA 2015 a-b). Robust chum, sockeye, and pink salmon returns to the Southern and Outer districts, as well as the difficulty in acquiring tender coverage in this area, probably all contributed to scant common property effort in the Kamishak District this year.
Video monitoring in 2015 of returning sockeye salmon to Mikfik and Chenik lakes occurred with only minimal technical difficulty at Mikfik Lake. An early breakup of ice allowed early floatplane access for installation of the Mikfik Lake video system on May 22. En route to Mikfik Lake, ADF&G staff noticed that beavers (Castor canadensis) had constructed a significant dam complex in Mikfik Creek below the lake. Two trips were made on June 2, and again on July 7 to remove these dams and open the creek to sockeye salmon passage. In spite of this, aerial surveys in late July and August revealed that the beavers had again rebuilt a dam blocking passage at Mikfik Creek.
A total of 3,502 sockeye salmon were counted from video at Mikfik Lake through August 11. The count was within the SEG range of 3,400–13,000 and below the previous 10-year average of 9,307 fish (Appendix D7). A total of 19,073 sockeye salmon were documented in Chenik Lake from June 15 to August 16 with the camera operational for the entire period (Appendices D3–D6). This was above the SEG range of 3,500–14,000 fish and also above the previous 10-year average of 14,647 sockeye salmon (Appendix D7).
The peak aerial survey count for Amakdedori Creek was 2,910 sockeye salmon (Appendix D9). This was above the SEG range of 1,250–2,600 fish and above the 10-year average of 2,243 fish. The SEG was met or exceeded for each of the 3 pink salmon index streams in Kamishak Bay (Appendices D8, D11). Poor observational conditions due to stormy weather or excessive glacial silt resulted in erratic aerial survey results that may have contributed to reduced counts of pink and chum salmon in this district.
There were no sockeye salmon harvested by the commercial common property fleet from the Kamishak District in 2015. The anticipated preseason harvest was of 37,900 wild sockeye and the previous 10-year average harvest was 70,093 sockeye salmon (Appendix D2). Total pink salmon harvest from this district is confidential. The previous 10-year average harvest was 29,547 pink salmon. Total chum salmon harvest is confidential. The previous 10-year average was 33,412 fish (Appendix D2). In addition to 23,571 sockeye, 1,560 wild pink salmon were harvested by CIAA for cost-recovery purposes from the Kirschner Lake SHA (Appendix F2).
LOWER COOK INLET SUBSISTENCE, PERSONAL USE AND HOMEPACK COMMERCIAL FISHERIES
The Cook Inlet subsistence management area (5 AAC 01.550) includes all state waters between Cape Douglas and Cape Fairfield, excluding waters of the upper Susitna River (5 AAC 01.550). Superimposed on this area is the Anchorage-Matsu-Kenai Nonsubsistence Area described in 5 AAC 99.015(a)(3). This area makes up more than 90% of the area described in 5 AAC 01.550. Under Alaska Statute 16.05.258 (c), the BOF may not permit subsistence fishing in nonsubsistence areas. A small portion of the LCI management area is outside the nonsubsistence areas, including the southwest tip of the Kenai Peninsula with the communities of Seldovia, Port
1 Statewide electronic fish ticket database [Internet]. 1985- . Juneau, AK: Alaska Department of Fish and Game, Division of Commercial Fisheries. (cited: May 2016). [URL not available as some information is confidential]. Hereafter referred to as fish ticket or fish ticket database.
13

Graham, and Nanwalek, as well as portions of the western shore of upper Cook Inlet near Tyonek in the Northern Cook Inlet management area. However, in order to provide harvest opportunity in addition to sport fishing to Alaska residents within these nonsubsistence areas, the BOF has defined 2 personal use salmon fisheries in LCI, and has defined seasons and gear types for personal use herring and smelt fisheries. In addition, both resident and nonresident commercial permit holders historically have been allowed to retain legally harvested fish from their commercial catch for their own use as homepacks.
NANWALEK/PORT GRAHAM SUBSISTENCE FISHERY Subsistence fishing is allowed in the Port Graham and Koyuktolik (Dogfish Bay) subdistricts from April 1 through September 30, and in the Port Chatham and Windy Bay subdistricts from April 1 through August 1. Extended fishing periods in these areas are defined in regulation as from 10:00 PM Thursday to 10:00 AM Wednesday (132 hours) each week. Set gillnets up to 35 fathoms in length, 6 inches in mesh size, and 45 meshes in depth may be used. This fishery has been specifically administered by ADF&G staff since the late 1970s. However, local dependence by residents on returning salmon to meet basic nutritional needs has been identified since pre-statehood (Stanek 1985). Fishing in these areas has tended to focus primarily on salmon returning to English Bay Lakes as well as to the Port Graham River. Over the last 20 years, sockeye salmon runs to English Bay Lakes have been significantly depressed. This has reduced both local commercial and subsistence salmon harvests. Partially in response to this at the November 2001 BOF meeting, waters of the Port Chatham and Windy Bay subdistricts were added to regulation as areas available for salmon harvest to subsistence permit holders. Historically, separate permits have been issued to residents of Port Graham (population 168) and Nanwalek (population 287). Permission to fish in Koyuktolik, Port Chatham, Port Graham, and Windy Bay is specified on both of these permits. Historically, there has been no requirement on these permits for the subsistence user to report from which harvest areas some or all of the harvest was caught. There is no bag or annual possession limit for subsistence salmon in the Port Graham, Port Chatham, Windy Bay, or Koyuktolik (Dogfish Bay) subdistricts.
In 2015, 50 permits were sent to the Nanwalek Traditional Council and 40 permits were sent to the Port Graham Village Council. In addition, 10 permits were sent to the Anchorage ADF&G office, and 10 permits were kept at the Homer ADF&G office front counter for distribution. All permits were serially numbered and printed on Rite-in-the-Rain paper. Representatives from the village councils were asked to disperse these permits to residents of these villages who intended to harvest salmon for subsistence use so that those households would be in compliance with 5 AAC 01.580. Prior to 2012, a village resident was paid to disperse and collect permits from both of these communities and provide ADF&G with a final harvest estimate. Permits were not actively distributed from ADF&G offices prior to 2012.
In 2015, sockeye salmon escapement past the English Bay River weir was generally at or above the anticipated escapement by date for this system. Consequently, subsistence fisheries were not restricted in 2015 as they had been in many previous years when escapement has been consistently below the SEG range (Appendix A4, A6, and E2).
In 2015, only 9 permits were issued to Nanwalek (English Bay) residents and only 1 was returned at the end of the season with 35 sockeye salmon reported harvested (Appendix E2, E8). This compares to the previous 10-year average of 23 permits reporting 24 Chinook, 2,259 sockeye, 1,087 coho, 1,234 pink, and 230 chum salmon. Nanwalek residents reported that
14

this harvest was shared among the community. A total of 18 permits were issued to Port Graham residents. Of those, 2 permits were returned with a harvest of 36 Chinook, 842 sockeye, 47 coho, 539 pink, and 872 chum salmon reported (Appendix E8). Two Anchorage residents also reported harvesting 273 salmon from subsistence fisheries in the Port Graham and Windy Bay areas (Appendix E8). Total reported subsistence harvest from the Port Graham area excluding the English Bay section but including the Windy Bay catch was 36 Chinook, 842 sockeye, 47 coho, 539 pink, and 872 chum salmon (Appendix E1). This compares to the previous 10-year average of 18 permits reporting 78 Chinook, 689 sockeye, 66 coho, 141 pink, and 145 chum salmon.
On August 19 Nanwalek IRA sent a letter to CIAA directing them to cease enhancement of Second Lake and to not land aircraft on Second Lake without express permission of the village council. Reasons given were that broodstock taken from the English Bay Lakes was being used to create runs elsewhere and that Nanwalek residents were seeing diminished subsistence runs as a result of this activity. The Port Graham Hatchery Association and later CIAA have removed broodstock from Second Lake during 22 of the past 27 years. During 10 of those years the resulting fry was released exclusively back into the English Bay Lakes system. During 4 of those years, fry were also released into Port Graham Bay. Fry originating from brood years 2009–2014 were released in areas outside of Port Graham Subdistrict (Appendix F21). From 2013 to 2015, returning adults were examined for hatchery otolith marks. In those years, hatchery contributions to English Bay Lake returns were estimated at 7.0%, 14.7%, and 12.3% respectively. In addition, otoliths were examined from sockeye salmon harvested in the commercial set gillnet fishery in the Seldovia, Tutka Bay, Barabara, and Halibut Cove subdistricts beginning in 2013. Although there were no English Bay origin marked fish identified in 2013, in 2014 out of the 768 sockeye salmon sampled that year, 748 had readable otoliths, 21 (2.8%) of which had a thermal mark associated with English Bay Lakes backstocked sockeye salmon. In 2015, out of 833 readable otoliths that have been analyzed so far, 11 (1.3%) have thermal marks indicating they are of English Bay Lake origin. Approximately 137 otoliths remain to be analyzed from 2015.
The combined total harvest as reported on subsistence permits from both the English Bay and Port Graham Sections was 2,371 salmon and was below the previous 10-year average of 5,934 salmon. This was also below the customary and traditional use finding of 4,800–7,200 salmon (5 AAC 01.566) for the Port Graham, Koyuktolik, Port Chatham, and Windy Bay subdistricts combined. This may be the result of under-reporting by residents of these 2 villages.
SELDOVIA SUBSISTENCE FISHERY There are 2 subsistence fishing seasons specified in regulation that take place each year in the waters of the Seldovia Bay Subdistrict. The first season consists of two 48-hour periods each week beginning at 6:00 AM on Monday and Thursday from April 1 through May 30. The second season consists of two 36-hour periods on the first 2 weekends in August. Legal gear is set gillnets up to 35 fathoms in length, 6 inches in mesh size, and 45 meshes in depth. This fishery was created in 1995 by the BOF. The intent of the BOF was for this fishery to avoid harvesting hatchery Chinook salmon that have been released annually into the Seldovia Harbor since 1987 (Appendix F15). These releases are funded under the federal Dingell–Johnson Sport Fish Restoration Fund. Allowing a subsistence harvest on these Chinook salmon would violate the intent of this federal program. Furthermore, there have been no significant historic runs of Chinook salmon to the Seldovia area (or other locations in LCI south of the Anchor River). The customary and traditional use worksheet submitted to the BOF in 2005 identified Chinook
15

salmon as being the least important of the 5 species to residents of Seldovia as far as traditional subsistence use was concerned. In addition to structuring the timing of the fishery to avoid this hatchery run, the BOF also imposed an annual possession limit of 20 Chinook salmon per household for this species and an overall guideline harvest level of 200 Chinook salmon per year. There is no bag or annual possession limit for other salmon species in the Seldovia subsistence fishery. A permit issued by ADF&G is required prior to setting gear, and catches are recorded on the permit. Catches are also reported to the Homer area office inseason so that cumulative harvest totals can be monitored and coho salmon deducted from the fall personal use coho salmon fishery guideline harvest level specified in 5 AAC 77.549(a).
In 2015, 40 permits for the spring fishery were sent to the Seldovia harbormaster’s office, in addition to 10 permits retained at the Homer ADF&G office and 10 that were sent to the Anchorage ADF&G office. An additional 20 permits for the fall fishery were sent to the harbormaster’s office, and a total of 15 permits were kept at both the Anchorage and Homer ADF&G offices. All permits were serially numbered and printed on Rite-in-the-Rain paper. The Seldovia harbormaster was instructed to have Alaska residents complete the name and address portion of the permits while under witness of a harbormaster employee and then have that employee fax a copy of the completed permit back to the Homer ADF&G office.
In 2015, out of 6 permits dispersed to Alaska residents for the early season, 4 permits were returned. Of these 4, all reported having fished. These 4 permits reported harvesting 16 Chinook, 70 sockeye, and 4 pink salmon. This compares to a previous 10-year average of 11 permits issued, 8 permits returned, and 5 reporting not fishing with an average harvest of 10 Chinook and 34 sockeye salmon. Two permits were issued for the August weekend seasons with both permits returned; however, neither of the permit holders reported having fished. The previous 10-year average for the August weekend fishery is 5 permits issued, and 4 permits returned with a harvest of 30 sockeye, 11 coho, 45 pink, and 17 chum salmon (Appendix E3). Total harvest for both the early and late season was 90 salmon versus a previous 10-year harvest average of 156 salmon. Currently, there is no customary and traditional use finding for this subsistence fishery as there are for other LCI subsistence fisheries (5 AAC 01.566(d)).
CHINA POOT PERSONAL USE DIP NET AND PERSONAL USE COHO SALMON FISHERIES There are 2 personal use salmon fisheries currently specified in regulation in LCI. These are the China Poot personal use dip net fishery and the Southern District personal use coho salmon fishery.
The China Poot dip net fishery dates back to 1980 when returns from the 1976 hatchery release of sockeye salmon began (Appendices F12 and F15). This fishery is managed by ADF&G, Division of Sport Fish. Prior to 1996, harvest from this fishery was documented as part of the Statewide Harvest Survey. Currently, there are no reporting requirements to monitor overall harvest from this fishery. The daily bag and possession limit for this fishery is 6 sockeye salmon.
The personal use coho fishery in the Southern District dates back prior to statehood, when it was considered a subsistence fishery. From 1986 through 1995, various court rulings converted it to a personal use fishery and then back to a subsistence fishery. A court action in late 1994 reestablished the boundaries of the Anchorage Nonsubsistence Area (5 AAC 99.015(a)(3)) that put the location of this fishery within the nonsubsistence area, thereby invalidating the subsistence regulations that governed this fishery at that time (Figure 14). As a result, early in
16

1995, the BOF readopted personal use regulations governing this fishery into permanent regulation and rescinded subsistence regulatory language pertaining to this fishery.
Regulations pertaining to this fishery are found in 5 AAC 77.549 Personal Use Coho Salmon Fishery Management Plan. These currently specify a guideline harvest range of 1,000–2,000 coho salmon. Additionally, coho salmon caught in the Seldovia subsistence fishery described in 5 AAC 01.560(b)(8)(B) are deducted from this annual harvest goal. Coho salmon targeted in this fishery have shifted from exclusively wild stock fish to include hatchery coho salmon, which have periodically been stocked in several locations in Kachemak Bay since the mid-1970s (Appendix F19). Since the late 1980s, annual releases of 100,000–325,000 coho salmon smolt into the Nick Dudiak Fishing Lagoon, located on the Homer Spit, have periodically contributed significantly to the personal use harvest (Figure 15). Samples taken in 1999 and 2000 of coho salmon caught in this fishery from sites on the Homer Spit adjacent to the Nick Dudiak Fishing Lagoon documented a hatchery component of 81% and 90%, respectively, for these 2 years (Szarzi et al. 2010). However, as a result of decreased releases and poor runs of late-season coho salmon in the Nick Dudiak Fishing Lagoon, harvest effort has shifted away from the Homer Spit to waters between Fritz Creek and Swift Creek (Appendix E6; Figure 14). The wild stock components of this fishery are primarily bound for the Fox River drainage at the head of Kachemak Bay. However, there are numerous smaller runs of coho salmon scattered throughout Kachemak Bay.
In addition to holding a valid sport fishing license and being an Alaska resident, participants in the personal use coho salmon fishery must obtain a fishery-specific permit from the Homer ADF&G office. Beginning in 1999, ADF&G has requested that permit holders voluntarily report their harvest daily in order to facilitate inseason management and assure that the 1,000–2,000 guideline harvest level specified in 5 AAC 77.549 is observed, while providing opportunity for harvest to reach at least the lower end of the goal. Harvest during the 2015 season was 1,373 coho, 509 sockeye, 10 Chinook, 152 pink, and 22 chum salmon, with 136 permits issued, 131 permits returned, and 91 reported as actively fished (Appendix E4). Coho salmon in 2015 were abundant with only 4 fishing days required to meet the guideline harvest level. The first 48 hour fishing period occurred on Monday, August 17 beginning at 6:00 AM, and the second fishing period began at 6:00 AM on Thursday, August 20. The fishery was closed by EO at the conclusion of the second period at 6:00 AM, August 22.
The previous 10-year average was 126 permits issued with 1,321 coho salmon harvested. Unlike recent years but similar to 2014, this season started with a significant number of coho salmon available for harvest along the Homer Spit and in the Mud Bay area. Leading up to the season, sport fishermen and observers on the Homer Spit observed large concentrations of coho salmon transiting the area. This resulted in increased interest and effort early in the season targeting coho salmon in this easily observable and accessible area. As might be expected, harvest by section shifted significantly from recent years, which had been dominated by catches from the Fritz Creek to Swift Creek section. This section still easily reported the highest number of coho harvested (647), with the adjacent area to the west (Mud Bay to Fritz Creek) reporting a harvest of 279. Continuing this westward trend, the harvest from the east side of the Homer Spit was 264 coho salmon. Coho harvest from Bear Cove to Neptune Bay was 117 coho salmon, followed by the Neptune Bay to Little Tutka section with 32 coho salmon. The Troublesome Creek to Coal Point section reported 4 coho salmon (Appendix E6).
17

Without a harvest sampling program in place it is difficult to tell what portion of the catch could be attributed to hatchery fish returning to the Nick Dudiak Fishing Lagoon on the Homer Spit. However, with a strong run to that location this year and significant harvest in adjacent areas, it was likely that enhanced runs contributed significantly to this year’s personal use harvest (Appendix E6). A single aerial survey of an index system within the Fox River drainage indicated reasonable natural runs of coho salmon as well.
Of the 136 permits issued, 82% were held by Homer area residents, 9% by Anchorage area residents, and the remaining 9% by residents of Anchor Point and other locations in Alaska (Appendices E5 and E8).
COMMERCIAL HOMEPACK Historically, both resident and nonresident commercial permit holders have been allowed to retain legally taken fish from their commercial catch for their own use. In 2007, the BOF amended 5 AAC 39.130(c)(10) requiring that the number of fish of any species retained by commercial fishermen for their own use be documented on a fish ticket. Previously these fish had been voluntarily noted on fish tickets by some permit holders.
In 2015, 16 set gillnet and 4 purse seine permit holders reported retaining 67 Chinook, 278 sockeye, 479 coho, 401 pink, and 28 chum salmon for their own personal use (Appendix E7). Of those, 10 were residents of Seldovia, 9 permit holders were Homer residents, and 1 permit holder was an Anchorage resident (Appendix E8).
COOK INLET SALMON ENHANCEMENT Fisheries enhancement and rehabilitation in Alaska began in earnest in the early 1970s with the creation by the Alaska State Legislature in 1971 of FRED to help build and stabilize fisheries production. Prior to and during this time, there were sporadic releases of coho and Chinook salmon to systems in Resurrection Bay and at Kasitsna Bay near Homer. These fish were produced at ADF&G hatcheries in Anchorage on Ship Creek as well as at the Big Lake and Fire Lake hatcheries.
In 1974, the Alaska legislature passed the Private Non-Profit Hatchery Act, which stated,
“It is the intent of this act to authorize the private ownership of salmon hatcheries by qualified non-profit corporations for the purpose of contributing by artificial means to the rehabilitation of the state's depleted and depressed salmon fishery. The program shall be operated without adversely affecting natural stocks of fish in the state and under a policy of management which allows reasonable segregation of returning hatchery reared salmon from naturally occurring stocks.”
Shortly thereafter, CIAA was created in 1976. Tutka Bay Lagoon Hatchery (TBLH) was built by the state of Alaska in 1976 and began rearing sockeye and pink salmon that year (Appendix F7). In 1983, the TBLH began operations producing sockeye and coho salmon (Appendix F8). Also in 1983, the Eklutna Hatchery began producing chum and coho salmon. The Crooked Creek Hatchery (CCH) was built in 1975 and began producing sockeye and Chinook salmon 2 years later, with coho salmon production starting in 1979. In 1991, residents of Port Graham formed the Port Graham Hatchery Corporation (PGHC) and began producing sockeye and pink salmon at a converted cannery in the village of Port Graham (Appendix F9). Early in 2014 CIAA
18

acquired the assets of the PGHC, including permitted egg capacity, and is currently restoring the hatchery to working condition after a protracted period of inactivity.
CIAA is among 12 nonprofit corporations in the State of Alaska that maintain private hatcheries with the capacity to produce salmon for harvest in common property fisheries. After merging with PGHC in early 2015, CIAA is now the second largest hatchery nonprofit in Alaska in terms of overall egg capacity.
In 2015, CIAA contributed 60.2% (148,802) of the total LCI sockeye salmon harvest of 247,232 fish, and just under one third of the total LCI pink salmon harvest of 6.4 million fish (Table 1; Appendices F1 and F6). These numbers are based on harvest location and not on otolith sampling of commercially harvested fish. In addition to sockeye and pink salmon releases, CIAA also has released an average of 627,200 coho salmon over the last 10 years (Appendices F8), and the Ship Creek Hatchery Complex (operated by ADF&G) has released an average of 613,000 Chinook salmon into LCI where both of these species are primarily harvested by sport users (Appendices F10 and F11).
Pink salmon otoliths were collected from selected streams in the Southern and Outer District. Samples were collected in groups of 96 otoliths from spawned out carcasses. Individual fish were sampled from throughout the spawning system with no preference for gender or carcass condition. Streams were sampled 1-3 times throughout the course of the run. Otoliths were examined for thermal marks that would indicate hatchery origin. Of the 1,893 otoliths that were readable, 23.1% had hatchery thermal marks. Of these 63.4% had marks indicating a Tutka Bay Lagoon Hatchery release, 0.4% had marks indicating they were released from the Port Graham SHA, and 8.0% had thermal marks from hatcheries in Prince William Sound (Appendix F22). This was similar to findings last year where otoliths were collected from 7 streams in the Southern District. Of the 1,142 otoliths that were readable in 2014, 44.5% were of hatchery origin. Of these, 30.9% had marks indicating a Tutka Bay Lagoon Hatchery release, 29.9% had marks indicating they were released from the Port Graham SHA, and 39.2% had thermal marks from hatcheries in Prince William Sound (Appendix F23). These results may not represent the full extent of stray hatchery pink salmon spawning in LCI streams because the Kitoi Hatchery located on Afognak Island does not currently mark their fish.
TUTKA BAY LAGOON HATCHERY TBLH is located in Tutka Bay, approximately 23 kilometers (14 miles) south of Homer (Figure 17). TBLH, constructed in 1976, is owned by ADF&G and has been operated by CIAA under contract since 1992. The facility was originally constructed as a pink and sockeye salmon hatchery. However, it also produced chum salmon from 1979 to 1990. Water for hatchery operations is supplied by Tutka Lagoon Creek. Permitted water capacity is 76 L/s, with a current usage of 68 L/s. The TBLH had an initial capacity of 10 million pink salmon eggs, but major renovation work in 1993–1994 increased the physical capacity to 150 million eggs. In addition, TBLH has a sockeye salmon egg physical capacity of 1.8 million, as well as raceways to accommodate the resulting fry. However, problems with infectious hematopoietic necrosis virus outbreaks have plagued this facility and made for erratic sockeye salmon releases from 1977 to 1999 when this species was incubated (Appendix F7). Sockeye salmon produced at TBLH were released into Leisure Lake (1977), Tustumena Lake (1978), English Bay (1990), and Tutka Bay (1996, 1997, and 1999). Fish released into Tutka Bay in 1996, 1997, and 1999 were of Packers Lake stock. Beginning in 2005, sockeye salmon were incubated and reared at the Trail Lakes
19

Hatchery using Hidden Lake broodstock and were transferred to Tutka Bay Lagoon for imprinting and release, which resulted in better survival rates. Discussion regarding sockeye salmon releases from this site is located in the Remote Releases portion of this section. Pink salmon were raised consistently at the TBLH from 1977 to 2004 with releases ranging in number from 318,000 (1977) to 105 million (1996) and an average release of 42.4 million fry. All pink salmon broodstock was derived locally from the adjacent Tutka Lagoon Creek. Pink salmon were not only released from the hatchery site directly but also remote released from Halibut Cove Lagoon (1975, 1977, 1986–1992), Paint River (1980–1983), Homer Spit (1987–1992), and Ingram Creek (1987–1990) in Turnagain Arm (Appendices F6, F7, and F14). Pink salmon production was halted in 2004 because of low prices for this species, which resulted in an inability to generate adequate cost recovery revenue to fund the pink salmon program. Chum salmon were reared and released on site from 1979 to 1990 in numbers ranging from 7,992 (1981) to 3.2 million in 1988, with an average release of 841,000 fish. The original broodstock for the chum salmon return was taken from Port Dick Creek (Appendices F7).
In 2013 CIAA resumed production of pink salmon. TBLH has a permitted capacity of 125 million pink and 660,000 sockeye salmon eggs. Prior to 2013, thermal marks were not applied to any fish cultured at this location. However, following facility upgrades in 2012, thermal marks were applied to the 4.4 million pink salmon that were released from Tutka Bay Lagoon in 2013, as well as releases in 2014 and 2015.
The 2015 pink salmon run to the TBLH was only the third year of returns since beginning production of this species after a 7-year hiatus. Of the 51.1 million BY2013 fry released last year, an estimated 1.5 million (3%) were anticipated to return (Appendix F14, H1). The actual run was estimated at 2.5 million fish (Appendix F1). Of these fish, 92,039 females and 72,969 males were collected and stored in net pens for broodstock (Appendix F2). Based on an average of 1,350 eggs per female, these fish had the potential of producing 124 million green eggs for incubation. However, high water temperatures and crowding in the lagoon with fish both inside and outside of the net pens, as well as very large numbers of decaying carcasses in Tutka Lagoon Creek, resulted in significant mortality. The final tally of green eggs harvested was 13.8 million eggs. This situation occurred in part due to the disappointing sockeye salmon return to hatchery release sites in Resurrection Bay. Those fish would have comprised the entirety of the CIAA cost-recovery goal, with the Tutka Bay pink salmon return (excluding escapement and broodstock needs) available to commercial common property permit holders. Compounding the problem were strong wild pink salmon returns in the Outer District that distracted commercial permit holders who had committed to harvest pink salmon for CIAA cost recovery. This resulted in periodic large buildups that crowded into the Tutka Lagoon and Tutka Lagoon Creek.
An additional 21,408 fish were harvested for broodstock from the Port Graham general subdistrict. These fish were caught in the common property fishery, sold live to a processor, and then resold to Cook Inlet Aquaculture Association. Of those, 17,795 were sorted for use as broodstock. From these fish (11,748 females), 2.2 million eggs were taken. This is significantly fewer eggs than could have been harvested (15.9 million) had significant mortality not occurred with these fish as well. The resulting fry will be released in the Port Graham SHA in the spring of 2016.
Total pink salmon cost recovery harvest was 2.1 million fish. Of the 17 years where CIAA has prosecuted cost-recovery harvests at this location for this species, the 2015 harvest was the second largest exceeded only by the 1997 return when 2.4 million fish were harvested.
20

The final escapement index for Tutka Lagoon Creek pink salmon in 2015 was 81,584. This was above the SEG of 6,500–17,000 pink salmon and above the previous 10-year average escapement for this system of 23,700 fish. This is the second largest escapement on record for this creek since 1970. In 2005, a total of 133,600 pink salmon were counted. During that year, 1.6 million fish were harvested for cost recovery by CIAA and no broodstock were taken.
TRAIL LAKES HATCHERY The TLH is located on the Seward Highway, approximately 47 kilometers (29 miles) north of Seward (Figure 10). ADF&G built this hatchery in 1982, and CIAA has operated it under contract since 1989. Initially, this facility produced sockeye, coho, and Chinook salmon. Water for hatchery operations is supplied by ground wells that are capable of producing approximately 139–186 L/s, of which 132 L/s are required for hatchery operations. All releases from this hatchery are remote releases. Sockeye salmon have been consistently produced at the TLH since 1983 with releases ranging from 516,000 (1986) to 18.9 million (2002), with an average of 9.2 million fish per year from 2005 to 2014. In addition to release sites in upper Cook Inlet, TLH-produced hatchery sockeye salmon have been released into LCI systems such as Bear Lake and Grouse Lake, as well as lakes (Leisure, Hazel, and Kirschner) that were stocked by the Tutka, Crooked Creek, and Eklutna hatcheries prior to 1998. See the section LCI Remote Releases under Cook Inlet Salmon Enhancement for further information regarding specific remote release sites. Coho salmon have also been produced at TLH in consistent numbers since 1983 with releases ranging in size from 75,000 (1996) up to 1.7 million (1987), with a previous 10-year average release of 627,200 fish from 2005 to 2014 (Appendix F8). The majority of the coho salmon reared in recent years have been released into Bear Lake. Chinook salmon were produced from 1984 to 1988, and chum salmon were raised for 1 year with a release of 455,809 in 1985 into Resurrection Bay systems. This hatchery has been consistently applying thermal marks to releases since 1991.
In 2015, the total run of adult sockeye salmon to remote release sites from this hatchery in Cook Inlet was 277,608 fish (Appendix F1). The overall documented run was less than the CIAA forecast run of 480,810 sockeye salmon (Appendix F1). A total of 148,802 sockeye salmon were sold for hatchery cost recovery worth $835,315 (Table 3). A total of 17,755 sockeye salmon were collected for broodstock, and of those, only 6,086 were viable broodstock with the remainder being holding mortalities or otherwise unsuitable for egg harvest and donated to members of the public (Appendix F2). The common property fishery harvested approximately 89,432 of the total TLH sockeye salmon run (Appendix F1). This includes remote releases at Hidden Lake, Kirschner Lake, Resurrection Bay, and sites in Kachemak Bay. Currently, TLH has a permitted capacity of 6 million coho, 4 million Chinook, and 30 million sockeye salmon eggs.
In 2015, a total of 7.7 million sockeye salmon eggs composed of 3 stocks were collected from 4 sites in Cook Inlet (CIAA 2015 a-b).
Sockeye salmon were released at 7 locations in LCI as well as into Hidden Lake in 2015. Bear Lake stock was released into Resurrection Bay and stocked back into Bear Lake. English Bay stock smolt taken from adults that returned in 2013 (BY2013) were backstocked (200,200 fish) into English Bay Lakes. Tutka Bay Lagoon sockeye salmon releases (523,500 smolt) were all from 2013 returns to Tutka Lagoon of English Bay lineage fish. No broodstock were taken from English Bay Lakes in 2015 at the written request of the Nanwalek IRA Council in an August 19,
21

2015 letter (see Lower Cook Inlet Subsistence, Personal Use And Homepack Commercial Fisheries section of this report for further information). Hazel, Leisure, and Kirschner lakes were stocked with English Bay stock fry (CIAA 2015 a-b).
In 2015, a total of 1,979 adult coho salmon returned to the Bear Creek weir. CIAA used 284 fish for broodstock with 4 of those nonviable. An additional 202 were holding mortalities with 219 used by ADF&G hatchery staff as broodstock for the “Salmon in the classroom” project. A total of 1,013 were excess fish that were donated to members of the public. Finally, 261 adult coho were allowed to migrate into Bear Lake where they spawned naturally. From the 280 fish used for broodstock, a total of 575,260 green eggs were harvested, which is fewer than the 4.0 million eggs that CIAA is permitted for this species (Appendices F1, F4, and F5). The majority of the coho salmon run originated from the BY12 fry release (460,000). No coho salmon were commercially harvested in the common property fishery from the Eastern District, and only 41were harvested from the Outer District in 2015. In the Southern District, 4,099 coho salmon were harvested in the commercial common property fishery with 479 of those fish retained as homepack by the permit holder. Given that 77,000 BY12 smolt from the Ship Creek Hatchery Complex in Anchorage were stocked into the Nick Dudiak Fishing Lagoon on the Homer Spit, an unknown percentage of the Southern District commercial coho salmon harvest may have originated from that facility.
PORT GRAHAM HATCHERY The Port Graham Hatchery (PGH) is in the village of Port Graham (Figures 1 and 18) and originally was located in a converted Whitney-Fidalgo salmon cannery. The hatchery was permitted in September 1992 and was actively operated by the Port Graham Hatchery Corporation until 2007. Ownership of this facility was transferred to Cook Inlet Aquaculture Association in 2014. Water for operations in the main hatchery building was supplied by the untreated Port Graham municipal water supply at a rate of 13–28 L/s. Freshwater for the adult holding and egg-take complex comes from nearby Cannery Creek via an 8 in pipeline at a rate of 50–107 L/s. Prior to permitting, the hatchery had been conducting experimental pink and sockeye salmon egg takes and fry releases via a scientific/educational permit since 1990. Sockeye salmon were raised at this facility during many years from 1991 to 2006 with releases ranging from 85,000 (1991) to 918,000 (1999) with an average release of 316,000 fish between 1991 and 2006 (Appendices F9 and F19). This facility provided sockeye salmon fry and smolt for the Nanwalek Salmon Enhancement Project (NSEP) from 1992 to 2008. See the NSEP section under LCI Remote Releases for further details on this project.
Pink salmon were released during most years from 1991 to 2007 with releases ranging from 255,000 (1991) up to 57.2 million (2003) and an average release of 11.6 million fry. In addition, coho salmon eggs were collected from the Port Graham River in 1996, and in October 1997 a total of 29,963 coho salmon smolt were released from this facility. The coho salmon project was discontinued after this release. In January 1998 a fire completely destroyed the original Port Graham Hatchery building, including incubation modules containing pink and sockeye salmon eggs collected during the previous year. A separate building that housed the empty coho salmon module was undamaged by the fire. This building was converted to pink and sockeye salmon incubation to allow for incubation of eggs collected during the upcoming summer. Rearing infrastructure in this newer building allowed the hatchery manager to thermally mark all pink salmon fry beginning in 1998. Sockeye salmon thermal marking began in 2003. In 2006 the loss
22

of a hatchery manager, combined with financial troubles, resulted in sockeye and pink salmon releases ending in 2006 and 2007, respectively. Consequently, the PGHC contracted with the CIAA in 2007 to harvest 510,000 sockeye salmon eggs from returning PGH fish, incubate them at the TLH, and then release them as fry in the English Bay Lakes (246,000; October 30, 2008) and as smolt in Port Graham (112,000; June 15, 2009) (CIAA 2015 a-b).
For the first time since 2007, pink salmon fry were released into the Port Graham Hatchery SHA in 2013 and again in 2014. In both years, fry were released directly into the bay without a net pen and without being fed. In 2014 188,000 fry were released with an anticipated return of 3% (5,640 adults) in 2015. However, similar to 2014, none of these fish materialized at the release site (CIAA 2015 a-b; Appendix F14).
As a result of this, CIAA reported purchasing 21,408 pink salmon caught in the Port Graham Subdistrict from a processor for use as broodstock. Of these, 17,795 were sorted to be used as brood. Of those, 11,748 were females with the capacity to yield 15.6 million eggs. However, as a result of holding mortality in the net pens in Tutka Bay lagoon, only 2.2 million green eggs were taken with only 61.1% of those (1.4 million) surviving to the eyed stage of development (CIAA 2015 a-b).
Some of the returning hatchery-reared fish may have strayed into the nearby Port Graham River. Escapement into the Port Graham River was 82,356 pink salmon. This is above the 10-year average escapement for this system of 28,100 fish (Appendix A9). Historically, many of the highest consecutive years of escapement for this system were also years when this hatchery was operational and releasing large numbers of pink salmon.
As was the case last year, broodstock for the Port Graham releases was transported to the TBLH where the eggs will be allowed to ripen and hatch, with the final release occurring at the Port Graham Hatchery historic release site without feeding or holding in net pens at this location. See the Tutka Bay Lagoon Hatchery section under Cook Inlet Salmon Enhancement for further information regarding the Port Graham pink salmon harvested in 2015.
A total of 2.2 million BY2014 pink salmon fry that were incubated at the TBLH were remote released directly into the Port Graham Hatchery SHA in 2015. No net pens were used and the fry were not fed (CIAA 2015 a-b).
LCI REMOTE RELEASES Nanwalek Salmon Enhancement Project (NSEP) The English Bay Lakes system is located approximately 1.6 kilometers (1 mile) southeast of the village of Nanwalek (formerly English Bay; Figures 1, 2, 5, and 18). The English Bay Lakes system is a chain of 5 small lakes with a total surface area of approximately 200 hectares (0.77 square miles). These lakes have the only commercially significant stock of sockeye salmon native to the Southern District of LCI. Production in this system declined in the early 1980s, resulting in commercial fishery closures beginning in 1985 and later subsistence harvest restrictions in order to increase escapement. ADF&G’s FRED Division conducted limnology studies and reported in 1992 that these lakes were nutrient poor, and given that recent escapements (1985–1990) were only 60% of the historical average, “the amount of nutrients from carcasses has been reduced from what it once was, and has further decreased fertility of the lakes in the English Bay watershed” (Edmundson et al. 1992). Stocking at English Bay Lakes began in 1990 with a release of 855,000 fry that were grown from eggs collected the previous
23

year in English Bay and reared at the Big Lake Hatchery facility near Wasilla. With the closure of Big Lake Hatchery in 1992, incubation and early rearing of sockeye salmon from English Bay Lakes occurred at the nearby PGH. The EBL system has received sockeye salmon releases in all but 7 years since 1990. These releases have varied significantly in number from 50,096 to 906,057 during that time, with an average of 207,000 fry per release over the last 4 years. In October 2015, CIAA released 200,200 “fall fry” (BY2014) into Second Lake in the English Bay Lake system (Appendices F12 and F20, F21).
A total of 126 sockeye salmon were sampled for otoliths throughout the summer at the English Bay weir. Of the 121 that could be read, 12.3% were found to have hatchery thermal marks. Age groups of the adult fish sampled at the weir were 30.6% age 1.2, 58.7% age 1.3, 8.2% age 2.2, and 2.5% age 2.3. In addition, a smolt weir was installed and maintained earlier in the season with 139,984 sockeye salmon smolt counted and otoliths collected from 693 individuals. Of the 670 that were readable, 14.2% had a hatchery thermal mark. Overall, 77.3% of the outmigrating smolt were age 1, with the remaining being age 2. In addition, a total of 6,839 coho salmon smolt and 27,882 pink salmon fry emigrated from English Bay Lakes (CIAA 2015b).
Leisure and Hazel Lakes Leisure Lake (also known as China Poot) is located approximately 18 kilometers (11 miles) southeast of Homer (Figures 1, 2, and 16). Leisure Lake has a surface area of approximately 100 hectares (0.4 square miles). The lake outlet has a set of impassable falls that prevents the return of anadromous adult sockeye salmon. This lake has been stocked regularly with an average of 1.6 million sockeye salmon fry per year since 1976 (Appendix F12). Until the early 1990s, Leisure Lake was used experimentally to determine fry stocking densities that would produce optimum adult returns. Lake fertilization was initiated in 1984 to increase salmon production. The brood source for stocking from 1976 until 2004 was Tustumena Lake. A lawsuit by the Wilderness Society and the Alaska Center for the Environment challenging the permit to collect these eggs in a designated wilderness area within the Kenai National Wildlife Refuge resulted in the loss of Tustumena Lake as a collection site. The broodstock source was changed to Hidden Lake in Upper Cook Inlet. Hidden Lake is 680 hectares (2.6 square miles) in size and is 68 kilometers (42 miles) east of Soldotna. Hidden Lake has an indigenous population of sockeye salmon of similar timing to Tustumena Lake. This stock was first enhanced by ADF&G in 1976 and later by CIAA. From 2004 through 2011, Hidden Lake was the source of broodstock for Leisure Lake and Hazel Lake stocking. In 2012, fry from English Bay Lakes were planted into Hazel Lake, with Hidden Lake stock sockeye salmon planted into Leisure Lake. In 2015, English Bay stock fry were planted into both Leisure and Hazel Lake. Hazel Lake is located approximately 4 kilometers (2.5 miles) southwest of Leisure Lake (Figure 1). Hazel Lake has a surface area of approximately 90 hectares (0.35 square miles) and drains into the Wosnesenski River, which is approximately 14 kilometers (9 miles) long. Hazel Lake has been stocked for 25 of the last 28 years with an average of 1.1 million sockeye salmon juveniles (Appendix F12).
Hatchery salmon returning to both Hazel and Leisure lakes have been thermally marked since brood year 1990. However, without funding to support a sampling program, ADF&G has been unable to take full advantage of these identifying features. Since 2013, ADF&G has collected 100 sockeye salmon heads per week from the Southern District set gillnet harvest and CIAA has examined their otoliths for thermal marks. In 2014 the proportion of marked fish from the commercial set gillnet fishery was 22.1% overall with over half (58.8%) of those probably originating from the Tutka Lagoon release. Hazel and Leisure Lake releases probably made up
24

22.4% of the hatchery fish, with English Bay Lake releases composing 12.7% of the marked fish. The remaining 6.1% were a combination of Resurrection Bay, PWS, and Hidden Lake fish. Of the 1,000 otoliths collected in 2015, 863 have been analyzed and 833 were sufficiently readable to determine the hatchery of origin, or if the fish was wild. Unfortunately, problems experienced during thermal marking meant it was only possible to determine the hatchery of origin (e.g., Trail Lakes Hatchery or TLH) for a good portion (18.3%) of the marked fish, but not the program/release site (e.g., Tutka). Overall, 77.1% of the readable otoliths were from wild fish and 22.9% were from hatchery fish. Of the 191 hatchery-marked fish examined in 2015, 93.2% came from TLH and 6.8% from Main Bay Hatchery in PWS. Of the 143 TLH marked fish that could be assigned to a release site, 31.5% were from Tutka, 27.3% from Hazel/Leisure/Kirschner, 7.7% from English Bay Lakes, and the remainder from Resurrection Bay/Bear Lake (33.6%) (data on file with Lower Cook Inlet Management group, Division of Commercial Fisheries, Homer).
Estimated commercial harvest contributions by returning Leisure Lake and Hazel Lake sockeye salmon are shown in Appendix F15. These values are the total seine harvest of all sockeye salmon from the Southern District. Prior to returns of significant numbers of enhanced salmon to the Southern District in 1980, the seine harvest of sockeye salmon was minimal with a range of 5 to 5,232 fish and an average of 1,749 fish since 1959, excluding 1978, when 54,000 were harvested (Appendix A3). Prior to enhancement, the set gillnet harvest from 1959 to 1980 ranged from 6,148 to 54,404 fish with an average of 19,538 fish. After enhancement, the set gillnet harvest increased to 30,015 fish per year on average. However, the average seine harvest since 1985 has increased more than 50 times over the previous amount to more than 96,000 fish per year.
Overall return to this site from 2011 (BY10) and 2012 (BY11) sockeye salmon releases (2.7 and 3.3 million respectively) was estimated at 23,513 fish. The 2011 fry release to both Leisure and Hazel lakes was derived from Hidden Lake stock; however, 2012 releases of BY11 fish were split with English Bay lineage fish released at Hazel Lake, and Hidden Lake stock fish released at Leisure Lake (Appendices F1, F12, and F15; Figures 19 and 20).
Kirschner Lake Kirschner Lake is the third lake in LCI that has historically been used for remote sockeye salmon releases. Kirschner Lake is located on the west side of Cook Inlet and is 24 kilometers (15 miles) due west of Burr Point, which is the northernmost point of Augustine Island (Figure 12). Kirschner Lake is approximately 140 hectares (0.54 square miles) in size and has a barrier falls at the outlet that prevents freshwater migration of returning anadromous salmon. Kirschner Lake has been stocked for 25 of the last 29 years with an average of 286,000 fry. In 2015 CIAA released 237,000 sockeye salmon fed fry of mixed English Bay and Hidden Lake stock into Kirschner Lake. Harvest in 2015 was below anticipated harvest (39,500 fish) with 23,571 sockeye salmon harvested for cost recovery, and 3,666 harvested for broodstock. An additional 1,439 wild stock pink salmon were harvested on August 2 along with 10,583 sockeye salmon. This represents an incidental harvest level of 13.6% non-hatchery produced salmon on that date. CIAA requested that the Kirschner Lake SHA remained closed to common property harvest in 2015 in order to allow harvest of returning sockeye salmon to meet brood and cost-recovery needs. This year’s run is the result of 2011 (BY10 English Bay) and 2012 (BY11 English Bay) fry releases (Appendices F1, F12, and F17).
25

Tutka Bay Lagoon In addition to pink salmon releases from the TBLH, the lagoon has also been a remote release site for sockeye salmon hatched at TLH since 2005. This is due to pathogen-related issues at the TBLH facility that are specific to sockeye salmon, which has hampered production of this species at this hatchery. Releases at this site historically have been of Hidden Lake stock since 2005 (with Packers Lake stock released during years of local TBLH production). However, beginning in 2011, all releases have been of English Bay Lake stock. The intent of this is to develop an independent English Bay stock brood source and not rely on annual runs to English Bay Lakes for brood. Sockeye salmon releases from this location are documented in Appendix F12.
The overall sockeye salmon adult run to this release site in 2015 was estimated at 84,806 fish (Appendices F1 and F18). Of these, 32,455 were reported on fish tickets as being harvested for cost recovery from the Tutka SHA, and 6,769 for broodstock and hatchery excess with an additional 45,582 harvested in the Tutka hatchery subdistrict outside of the SHA (Appendices F1 and F2).
In 2015, CIAA remote released 523,500 sockeye salmon smolt (BY 2013) into Tutka Lagoon. (CIAA 2015a-b). These fish were hatched and reared to smolt at the TLH before being transferred to net pens at TBLH for imprinting. Of those released, all were of English Bay Lake-Hidden Lake stock. The sockeye salmon run to this facility in 2015 were English Bay Lakes stock.
Port Graham Similar to the Tutka Bay Lagoon Hatchery SHA, in recent years the Port Graham Hatchery SHA has served as a remote release site for smolt and fry incubated at other locations. This occurred in 2009 with the release of 112,000 English Bay stock sockeye salmon, and again in 2013 with 102,000 BY2011 English Bay stock sockeye salmon. Also in 2013, CIAA released 14.3 million Port Graham River stock pink salmon fry into the PGH SHA, and 188,000 the following year (Appendices F12, F14). The intent of these pink salmon releases is that they can be used as a brood source for the PGH, which CIAA acquired in 2015. A return of 5,100 sockeye salmon were anticipated to return from the 2013 release; however, there were no reports of sockeye salmon staging at the release site in 2015.
Paint River Fish Ladder The Paint River drainage in the Kamishak Bay District contains at least 40 kilometers (25 miles) of potential salmon spawning and rearing habitat. Currently the Paint River system is barren of salmon due to a 12 m waterfall at tide line that was impassable prior to 1993. The former FRED Division and CIAA initiated feasibility studies for a fishway in 1979. CIAA received state and federal grant funds to build the fishway, completing construction in the fall of 1991. Commissioner Carl Rosier declared the fish pass officially operational in January 1993.
The Paint River Lakes were stocked via air drop with sockeye salmon fry in 9 of the 11 years from 1986 to 1996 and again in 2002 to test the feasibility of developing a sockeye salmon return to the fish pass project site. Releases ranged in size from 500,000 fry in 1996 to 2.2 million in 1988. In addition, the Paint River was stocked with approximately 0.5 million pink salmon fry from 1980 to 1983. Returns from the pink salmon releases were documented by aerial survey with a few dozen to 5,000 fish observed in saltwater below the fish ladder during 3 of the 4
26

return years. Although there were several sightings of sockeye salmon in the area of the fish ladder during return years of the sockeye releases, the only harvest that occurred was in 1991 where 400 sockeye salmon were harvested in the Paint River Subdistrict. The stated policy during these years was that the fish pass remained closed unless significant numbers of returning sockeye salmon were observed. Typically from 1991–2003, 500–1,000 sockeye salmon were observed in the Paint River Subdistrict with the peak observation occurring in 1998 when 1,900 fish were observed near the fish ladder. During these years the Paint River fish ladder remained closed to passage for the returning salmon (Hammarstrom 2003).
Modifications were made to the ladder in 2010, 2011, and 2012 to address concerns made by ADF&G Division of Wildlife Conservation that brown bears could fall into open cells of the fish ladder and drown. The fish ladder was opened for the first time to migrating salmon from early-June through September in 2011. Following this, an aerial survey was made of the Paint River drainage with no salmon observed. The ladder has been reopened seasonally since 2011. No salmon were observed on aerial surveys in 2012 or 2013. On September 7, 2014, visiting CIAA staff found 1 live coho salmon and 3 unidentified salmon carcasses above the ladder. In addition, later that day when flying a survey upstream of the ladder, ADF&G and CIAA staff observed what appeared to be 6 to10 coho (or possibly Chinook) salmon in Duneletak Creek 5 miles above the ladder (Hollowell et al. 2015). Aerial surveys in 2015 did identify what appeared to be 50 to 100 chum salmon over the summer in the Paint River drainage.
In 2014, CIAA purchased 3,028 pink salmon caught in Bruin Bay from commercial fishermen. From these fish 1.4 million green eggs were harvested, and 1.0 million fry produced (Hollowell et al. 2015).These were released on April 8 in Upper Paint River Lake, approximately 21 km above the Paint River fish ladder (Appendix F14). From these, 15,000 adults are anticipated to return in 2016.
Bear Lake and Resurrection Bay Bear Lake is located approximately 10 kilometers (6 miles) northeast of Seward. Bear Lake has a surface area of approximately 180 hectares (0.69 square miles) and has been monitored since 1960, when a picket weir was established where Bear Creek intersects the Salmon River. Initial enhancement activities in the early 1960s focused on coho salmon and the control of predators such as threespine stickleback (Gasterosteus aculeatus) and Dolly Varden char, as well as alleged competing species such as sockeye salmon. To accomplish this, the pesticide Rotenone was methodically applied to the lake on August 26, 1963, by ADF&G biologists. In addition, “a barrier 5 feet high was then constructed to hold the treated water until detoxification, and to prevent the ingress of nonsalmonid species” (Bandirola 1965, page 148).
Coho salmon hatched from eggs collected in Bear Creek in the previous fall were reintroduced in November and December of 1963.
“The barrier at the outlet of rehabilitated Bear Lake was destroyed as a result of the Good Friday earthquake and reinfestation of the lake by Dolly Varden and threespine sticklebacks occurred. A concrete weir to assess upstream and downstream salmon migrations and to serve as a permanent barrier was completed in Bear Creek on August 25, 1964.” (Bandirola 1966, page 129)
This barrier is a low concrete dam with spaced pickets along the upper surface. Water spilling over the top of the dam prevents smaller fish from travelling upstream, and larger fish are
27

stopped by the pickets. A submerged wire cage is set in the main water outflow. This is closed and mechanically hoisted into a building above the dam and opened onto a sorting table. Smaller fish such as Dolly Varden char, sculpin (Family Cottidae), Pacific lamprey (Entosphenus tridentatus), and threespine stickleback drop through the sides and bottom of the basket back to the downstream area. Once on the sorting table, salmon can be passed to the upstream side of the dam or harvested for broodstock and hatchery cost-recovery purposes. Trout, char, and species of salmon other than coho and sockeye are passed back to the downstream side of the weir. In addition to Dolly Varden char, weir operators have documented in annual reports returning steelhead trout (O. mykiss), Chinook salmon, and pink and chum salmon to the downstream side of the weir. Members of the public have also reported observing hundreds to thousands of coho salmon milling downstream of the weir in late fall after the weir has closed for the season. CIAA has been responsible for operation of this weir since 1990.
Bear Lake was again treated with Rotenone by ADF&G biologists in 1971 on July 21 and 22. The stated goal of this treatment was the eradication of threespine stickleback from Bear Lake with no mention of removing other species such as sockeye salmon, Dolly Varden char, Pacific lamprey, freshwater sculpin, etc. According to McHenry (1972), “the lake could no longer rear substantial numbers of juvenile coho salmon due to extreme competition for survival from threespine sticklebacks.” In 1988, the BOF revised the Bear Lake Management Plan (5 AAC 21.375) to allow for the enhancement of sockeye salmon in this lake. Bear Lake has been stocked since 1963 with coho salmon. From 2005 through 2014, an average of 516,800 coho salmon smolt have been released annually (Appendix F13). Broodstock for many of the coho salmon releases in the early 1960s came from the Swanson River (Kenai Peninsula), Pasagshak River (Kodiak Island), Ketchikan Creek (Southeast Alaska), and Dairy Creek (Seward Lagoon), as well as Big Creek in Oregon. Sockeye salmon have been stocked into this lake annually since 1990 with a recent 10-year (2005–2014) average of 2.6 million released (Appendix F12). Sockeye salmon released into this lake from the Trail Lakes Hatchery from 1990 to 1992 came from the Upper Russian River and Big River, both of which drain into upper Cook Inlet. In addition, in 1998, 507,000 Tustumena Lake sockeye salmon smolt that had also been reared at the Trail Lakes Hatchery were released. Since that time, all other releases have been derived from broodstock harvested at Bear Lake (McHenry 1972).
In addition to Bear Lake, coho and other species of Pacific salmon have been released into several locations in Resurrection Bay since the late 1970s. Returns for these species typically are targeted by noncommercial users as specified in the Resurrection Bay Salmon Management Plan (5 AAC 21.376). Both pink and chum salmon have been released irregularly into a variety of locations in Resurrection Bay (Appendices F14). In 2008, CIAA began releasing an average of 1.6 million sockeye salmon smolt annually from net pens anchored in Resurrection Bay.
The sockeye salmon runs to Resurrection Bay in 2015 primarily came from 3.8 million BY10 Bear Lake fry released in 2011, 2.5 million BY11 Bear Lake fry released in 2012, and 2.1 million BY11 smolt released in 2013. Of the fish released in 2012, 1.3 million were released from net pens in Resurrection Bay, as were all of the smolt in 2013. Although the anticipated run was 322,737 sockeye salmon, the actual run was approximately 200,000 fish shy of that at 112,976 (Appendices F1 and F12).
In 2015, 1,979 adult coho salmon returned to the Bear Creek weir during its period of operation. CIAA collected 280 coho salmon for broodstock for a total of 575,260 green eggs, which is fewer than the 4.0 million eggs that CIAA is permitted for this species. In addition, CIAA
28

donated 1,013 excess coho salmon from the weir to members of the public (Appendices F1 and F5). Sampling of the sport fishery from 2003 to 2005 determined that 29.8% of the fish harvested were thermally marked hatchery coho salmon (Bosch 2011). Additional information regarding 2015 runs to Bear Lake may be found in the Eastern District section of this report.
LOWER COOK INLET COMMERCIAL HERRING FISHERY LCI herring fishing first began in the Southern District in 1914 with the development of a gillnet fishery within Kachemak Bay. During the peak of the fishery, 8 salteries, including 6 near Halibut Cove, were in operation. A purse seine fishery in Kachemak Bay began in 1923. But after 3 successive years of average annual harvests approaching 8,000 short tons (1 short ton = 2,000 pounds), herring populations, and hence the fishery, collapsed (Rounsefell 1930).
The next LCI herring fishery began in 1939 and was centered in the Resurrection Bay and Day Harbor areas of the Eastern District (Figure 10). Product from this purse seine fishery was used exclusively for oil and meal reduction. Although the fishery continued through 1959, peak harvests occurred from 1944 to 1946, averaging 16,000 short tons over those years (Reid 1971). After this time period, stocks sharply declined, apparently due to overexploitation.
The Kamishak Bay sac roe fishery began in 1973 and will be discussed in more detail in the following section.
HARVEST STRATEGY AND STOCK ASSESSMENT The LCI herring management area includes waters of Cook Inlet, south of the latitude of Anchor Point including the western shore of Cook Inlet south to Cape Douglas, and the eastern shore of Cook Inlet along the Kenai Peninsula to Cape Fairfield (Figure 1). This management area is divided into 5 districts that match those for LCI salmon.
Commercial fishing for Pacific herring in LCI has historically occurred in 4 of the 5 management districts, with Barren Islands District the sole area where commercial herring fishing has not occurred (Figure 2). Historic fisheries have included food/bait, meal/oil reduction, and sac roe harvest with legal gear at times including both gillnet and seine. All of these fisheries have suffered periods of stock depletion and extended closures (Appendix G2).
Currently, 2 separate herring management plans regulate fisheries in LCI, both adopted in 2001 by the BOF. The first management plan (5 AAC 27.463) renders waters of the Southern, Outer, and Eastern Districts closed to commercial herring harvest, citing concerns for stock abundance and sustainability of commercial harvest in these areas. The Kamishak Bay District Herring Management Plan (5 AAC 27.465) describes the management strategies used to set and implement the guideline harvest levels for the Kamishak Bay sac roe fishery and is the only plan currently in place that could allow a commercial herring fishery in LCI. This plan was most recently adjusted in 2001 to include a reduction in the maximum exploitation rate allowed in the fishery, from a former level of 20% of the forecasted herring biomass, to a new level of 15%, and a reduction in the biomass threshold (the minimum necessary to allow a fishery) from 8,000 short tons to 6,000 short tons. Highlights of the original plan that were retained include a management strategy intended to limit the harvest of herring age 5 and younger, and an allocation of 10% of the allowable harvest of Kamishak Bay herring to the Shelikof food/bait fishery in the Kodiak management area. Lawful gear in the Kamishak Bay sac roe fishery is restricted to purse seine. The limited entry permit system for sac roe herring seining in Cook
29

Inlet was implemented in 1977, and 75 permanent permits are currently issued for the management area. Historical harvest and management information for the Kamishak Bay sac roe fishery can be found in Appendices G3 and G4.
The Kamishak Bay sac roe fishery began in 1973 when 8 permit holders harvested 243 short tons (Schroeder and Kyle 1986). Participation in the fishery and harvest increased rapidly, peaking at 4,824 short tons harvested in 1976 before a stock decline prompted closure of the fishery after only 415 short tons were harvested in 1979 (Schroeder and Kyle 1986). The stock recovered quickly, and the fishery reopened in 1985 with a harvest of 1,132 short tons (Schroeder and Kyle 1986). The fishery remained open seasonally from 1985 to 1998 with an average annual harvest of 2,878 short tons before being closed again beginning with the 1999 season due to low abundance levels (Hammarstrom 2000). Management since that time has concentrated on assessment of the Kamishak Bay herring biomass to determine when commercial harvest can be sustainably resumed.
The primary method of herring biomass assessment in LCI is aerial survey. When adequate funding is available, aerial surveys are conducted annually throughout the herring spawning season in the Kamishak Bay and Southern districts, from mid-April through early June, to determine the relative abundance and distribution of herring. Because a commercial herring fishery has not occurred in the Outer and Eastern districts in many years and is not likely to occur in the near future, aerial surveys of these areas are no longer conducted. Even though no commercial fishery is expected in Southern District, fishermen do annually participate in a personal use herring fishery in Kachemak Bay. Aerial surveys of Kamishak Bay have been moderately consistent across seasons, with numbers and distribution of herring schools, location and extent of spawning events, and visibility factors affecting survey results recorded on index maps for each survey. Beginning in 2012, hard copy index maps were replaced by tablet computers running a customized version of ArcPad that allowed surveyors to enter their observations directly onto digital charts. Three standard conversion factors are used to estimate herring biomass based on each 538 ft2 (50 m2) of school surface area sighted and the following water depth parameters: 1) 1.52 short tons for water depths of 16 ft or less; 2) 2.56 short tons for water depths between 16 and 26 ft; and 3) 2.83 short tons for water depths greater than 26 ft (Lebida and Whitmore 1985; Otis and Bechtol 1999).
Due to invariably poor weather and water clarity, aerial surveys rarely provide reliable estimates of total herring biomass returning to Kamishak District Bay waters (Otis et al. 1998). As a result, an age-structured-assessment (ASA) model has been used since 1994 to forecast herring abundance for Kamishak Bay, as well as to “hindcast” previous years’ total abundance (Appendix G5). This dynamic model incorporates a variety of heterogeneous data sources, including a time series of commercial catch age composition; total run age composition; and aerial survey biomass estimates from years with adequate survey conditions and coverage. The model simultaneously minimizes the differences between expected and observed values for each of its components, updates hindcasts of previous years’ abundance, and produces a forecasted estimate of the following year’s run. This tool is important both for management to help determine appropriate harvest levels and for research to revise previous biomass estimates with updated return data and gain a more accurate assessment of trends over time (Appendix G5).
When funding is available, ADF&G utilizes a chartered commercial seine vessel to aid in herring assessment in Kamishak Bay District and opportunistically in the Southern District. In years when no commercial fishery occurs, ADF&G is unable to utilize the fleet to collect samples for
30

age, sex, and size composition analysis. By chartering a commercial purse seine vessel, age, sex, and size and disease samples together with additional related information can be collected and used to further aid in understanding the dynamics of the Kamishak Bay herring stock. These surveys also facilitate the collection of samples for other cooperative research projects that have contributed to our overall understanding of herring disease (Hershberger et al. 2016) and stock structure (Otis et al. 2010; Libungan et al. 2016). When sufficient funding is available, separate vessel charters are conducted to sample different portions of the spawning migration (early and late). In years when a fishery occurs (traditionally in the early part of the migration), a single “late season” sampling charter is employed to obtain a more complete picture of the overall run. Hydroacoustic observations of herring schools and water temperature/depth parameters are concurrently documented during the charters. The information gathered during these sampling efforts provides age class data that 1) allows the staff to generate an age composition estimate of the overall biomass observed by aerial surveyors throughout the entire duration of the spawning migration; and 2) facilitates the evaluation of the relative strength of recruiting year classes. This is critical in generating the annual herring forecast. The charters further serve to corroborate the relative magnitude of herring biomass observed by aerial surveyors.
Funding for vessel charters was eliminated in 2011, resulting in a lack of age, sex, and size data for use in the ASA model during 2011 or 2012. Fortunately, temporary funding was identified in 2013, 2014, and 2015, enabling staff to resume use of this important stock assessment tool during those years.
SEASON SUMMARY In 2015, ADF&G staff flew 7 aerial surveys between 20 April and 29 May to assess the size and distribution of herring schools and herring spawning events in Kamishak Bay. In addition, ADF&G chartered a commercial herring seiner to conduct 2 vessel surveys from April 25 to May 1 and from May 10 to May 16 to collect representative age composition and disease samples from the spawning biomass. These charters collected over 2,300 herring throughout Kamishak Bay District between Cape Douglas and Oil Bay. This allowed ADF&G staff to estimate the age composition of the observed spawning biomass in 2015 and to generate a 2016 forecast. Appendix G1 summarizes the ASA model’s estimated age composition of the 2015 spawning biomass and the 2016 forecasted biomass.
Aerial surveyors documented just 666 short tons (st; 1 short ton = 2,000 pounds) of herring in Kamishak Bay in 2015, the lowest aerial survey biomass index in the past 26 years. Also, for only the third time since 1990, aerial surveyors did not observe any spawning events in 2015. This was in sharp contrast to 2013 when the aerial biomass (7,800 st) and miles of spawn indices (10.0 miles from 22 spawning events) were the highest levels documented since the mid-1990s. Although the 2014 indices were not quite as high (6,138 st; 3.2 miles of spawn from 14 spawning events), they were still relatively strong (Appendix G5). Thus, the sharp drop in abundance indices in 2015 was unexpected, but they were corroborated by equally poor hydroacoustic observations of herring schools during the 2 vessel charters conducted in 2015. The reason for this abrupt decline in abundance is unknown but is suspected to be related to the El Nino conditions that prevailed around the North Gulf of Alaska over the winter and spring of 2014/2015, resulting in water temperatures about 1.5-2.0° C warmer than usual.
Another component of the Kamishak Bay herring stock assessment program over the past decade has been disease assessment. Ichthyophonus is a protozoan pathogen that has been linked to
31

population declines of Atlantic herring (Burge et al. 2014), and is hypothesized to have contributed to the decline and lack of recovery of Pacific herring in Prince William Sound (Marty et al. 2003, 2010). ADF&G began collecting disease samples from the Kamishak stock in 2005 to evaluate whether disease may have been a factor in the decline and suppressed productivity of the Kamishak herring population. Samples collected during 2005-2007 showed high Ichthyophonus infection rates ranging from 17-55%. In 2015, ADF&G staff collected tissue samples from 60 herring during the first vessel charter and sent them to ADF&G’s Pathology Lab in Anchorage for analysis. For the seventh consecutive year, Ichthyophonus infection rates were found to be very low (1.7%) in the Kamishak Bay herring stock.
Ichthyophonus incidence has been demonstrated to increase with host size and age in Pacific herring (Herschberger et al. 2002, Herschberger et al. 2016). The period of time during which Ichthyophonus was most prevalent in the Kamishak stock coincided with the timing of the loss of older members of that population (e.g., herring > age-8). More recently, because infection rates have been very low, ADF&G is again finding herring up to age-13 in samples collected from Kamishak Bay. Along with Ichthyophonus, ADF&G regularly screens samples for viral hemorrhagic septicemia (VHS) and viral erythrocytic necrosis (VEN), neither of which has been found to be at levels triggering concern. Thus, it would appear that disease is not a contributing factor in the sharp decline of herring that occurred in Kamishak Bay in 2015.
The forecasted herring biomass generated by the ASA model for 2016 in Kamishak Bay District is 1,603 short tons, which is well below the Kamishak Bay District Herring Management Plan (KBDHMP) regulatory threshold of 6,000 short tons necessary to consider allowing a commercial harvest (Figure 21). Also, the second vessel charter in 2015 documented very few herring schools and no samples were collected, indicating extremely weak recruitment of age-3 to 5 herring within the current spawning biomass.
Management regulations governing commercial harvests in Kamishak Bay seek to target older, repeat spawners to protect recruit-class herring representing future productivity. Recent years’ observations confirm that recruitment of younger fish into the Kamishak spawning population over the past 20 years has been relatively poor. Although there is no definitive explanation for this lack of a strong recruitment event, the prevailing hypothesis suggests that poor fitness of the fish, characterized by low average weights-at-age, has contributed to higher than normal over-winter mortality. Although there was a slight increase in mean weight-at-age of herring sampled in Kamishak Bay in 2015, average weights remain near the lowest observed over the past 30 years.
2016 HERRING SEASON OUTLOOK The forecasted herring biomass generated by the ASA model for 2016 in Kamishak Bay District is 1,603 short tons. This is below the minimum regulatory threshold of 6,000 tons specified in the Kamishak Bay District Herring Management Plan (5 AAC 27.465). Given the low biomass and lack of recent strong recruitment events, ADF&G will not prosecute a commercial fishery in 2016.
ACKNOWLEDGEMENTS The authors gratefully acknowledge the entire staff of the Homer office of the Alaska Department of Fish and Game for their many contributions that are essential to the management of the various fisheries and the completion of this report.
32

Permanent Employees with the Division of Commercial Fisheries, Salmon/Herring Program Name Job Class Project / Title Ted Jewel Boat Officer III Captain, R/V Pandalus Glenn Hollowell FB III Area Management Biologist
Edward O. “Ted” Otis FB III Area Research Biologist Ethan Ford FB II Fishery Biologist Carolyn Bunker F&G Program Technician Office Administration
Seasonal Employees with the Division of Commercial Fisheries, Salmon/Herring Program. Name Job Class Project / Title Joey Lindberg Admin. Clerk II Office Administration Patrick Houlihan FWT II Stream Survey Technician David Knight Boat Officer I R/V Pandalus Joe Loboy FWT III Port Sampler/GIS Technician Tom Sigurdsson FWT III Stream Survey Technician
33

REFERENCES CITED Bandirola, L. S. 1965. Silver salmon studies in the Resurrection Bay area. Annual report of progress, 1963–1964
Federal Aid In Fish Restoration Project F-5-R-6 Sport Fish Investigations of Alaska, Vol. 5, Juneau.
Bandirola, L. S. 1966. Silver salmon studies in the Resurrection Bay Area. Annual report of progress, 1964–1965 Federal Aid in Fish Restoration Project F-5-R-6 Sport Fish Investigations of Alaska, Vol. 6, Juneau.
Bosch, D. 2011. Coho salmon thermal-marked otolith recovery, Resurrection Bay, Alaska, 2003–2005. Alaska Department of Fish and Game, Fishery Data Series No. 11-06, Anchorage.
Bue, B. G., S. M. Fried, S. Sharr, D. G. Sharp, J. A. Wilcock, and H. J. Geiger. 1998. Estimating salmon escapement using area-under-the-curve, aerial observer efficiency, and stream-life estimates: The Prince William Sound pink salmon example. North Pacific Anadromous Fish Commission Bulletin No. 1:240-250.
Burge, C. A., C. M. Eakin, C. S. Friedman, F. Froelich, P. K. Hershberger, E. E Hofmann, L. E. Petes, K. C. Prager, E. Weil, B. L. Willis, S. E. Ford, and C. D. Harvell. 2014. Climate change influences on marine infectious diseases: implications for management and society. Annual Review of Marine Science 6:249-277.
CIAA (Cook Inlet Aquaculture Association). 2015a. Annual reports: Trail Lakes Hatchery, Tutka Bay Lagoon Hatchery, Port Graham Hatchery, and Eklutna Hatchery. Cook Inlet Aquaculture Association, Soldotna, Alaska.
CIAA (Cook Inlet Aquaculture Association). 2015b. English Bay Lakes salmon enhancement progress report. Cook Inlet Aquaculture Association, Soldotna, Alaska.
CIAA (Cook Inlet Aquaculture Association). 1992–2015. Bear Lake sockeye and coho salmon enhancement progress report. Cook Inlet Aquaculture Association, Soldotna, Alaska.
Cook, L., and F. Norris. 1998. A stern and rock-bound coast: Kenai Fjords National Park historic resource study. National Park Service, Alaska Support Office, Anchorage, Alaska.
Edmundson, J. A., G. B. Kyle, and T. Balland. 1992. Rearing capacity, escapement level, and potential for sockeye salmon (Oncorhynchus nerka) enhancement in English Bay Lakes. Alaska Department of Fish and Game, Fisheries Research, Enhancement and Development Division Report No. 120, Anchorage.
Hammarstrom, L. F. 2000. 1999 Lower Cook Inlet annual finfish management report. Alaska Department of Fish and Game, Division of Commercial Fisheries, Regional Information Report 2A00-17, Anchorage.
Hammarstrom, L. F. 2003. 2002 Lower Cook Inlet annual finfish management report. Alaska Department of Fish and Game, Division of Commercial Fisheries, Regional Information Report 2A03-04, Anchorage.
Hershberger, P. K., K. Stick, B. Bui, C. Carroll, B. Fall, C. Mork, J. A. Perry, E. Sweeney, J. Wittouck, J. Winton, and R. Kocan. 2002. Incidence of Ichthyophonus hoferi in Puget Sound fishes and its increase with age in Pacific herring. Journal of Aquatic Animal Health 14:50-56.
Hershberger, P. K., J. L. Gregg, L. M. Hart, S. Moffitt, R. Brenner, K. Stick, E. Coonradt, E. O. Otis, J. J. Vollenweider, K. A. Garver, J. Lovy, T. R. Meyers. 2016. The parasite Ichthyophonus sp. in Pacific herring from the coastal NE Pacific. Journal of Fish Diseases 39:395-410.
Hollowell, G, E. O. Otis, and E. Ford. 2015. 2014 Lower Cook Inlet annual finfish management report. Alaska Department of Fish and Game, Fishery Management Report No. 15-32, Anchorage.
Lebida, R. C., and D. C. Whitmore. 1985. Bering Sea aerial survey manual. Alaska Department of Fish and Game, Division of Commercial Fisheries, Bristol Bay Data Report No. 85-2, Dillingham, Alaska.
Libungan, L. A., A. Slotte, E. O. Otis, and S. Palsson. 2016. Otolith variation in Pacific herring (Clupea pallasii) reflects mitogenomic variation rather than the subspecies classification. Published online in Polar Biology on 4 January 2016. DOI 10.1007/s00300-015-1882-x. http://link.springer.com/article/10.1007/s00300-015-1882-x
Marty, G. D., T. J. Quinn II, G. Carpenter, T. R. Meyers, and N. H. Willits. 2003. Role of disease in abundance of a Pacific herring (Clupea pallasii) population. Canadian Journal of Fisheries and Aquatic Sciences 60:1258-1265.
Marty, G. D, P. J. Hulson, S. E. Miller, T. J. Quinn II, S. T. Moffitt, and R. A. Merizon. 2010. Failure of population recovery in relation to disease in Pacific herring. Diseases of Aquatic Organisms 90:1-14.
34

REFERENCES CITED (Continued) McHenry, E. T. 1972. Annual progress report for silver salmon studies in the Resurrection Bay Area. Alaska
Department of Fish and Game, Division of Sport Fish, Anchorage.
Mills, M. J. 1984. Alaska statewide sport fish harvest studies. Alaska Department of Fish and Game, Federal Aid in Fish Restoration, Annual Performance Report 1983-1984, Project F-9-16(25)SW-I-A, Juneau.
Otis, E. O. 2004. Abundance, age, sex, and size statistics for Pacific herring in Lower Cook Inlet, 1995–1999. Alaska Department of Fish and Game, Division of Commercial Fisheries, Regional Information Report 2A04-14, Anchorage.
Otis, E. O., and W. R. Bechtol. 1999. Lower Cook Inlet herring stock structure and aerial survey assessment project operational plan. Alaska Department of Fish and Game, Division of Commercial Fisheries, Homer.
Otis, E. O., W. R. Bechtol, and W. A. Bucher. 1998. Coping with a challenging stock assessment situation: the Kamishak Bay sac-roe herring fishery. Pages 557-573 [In] F. Funk, T. J. Quinn, J. Heifetz, J. N. Ianelli, J. E. Powers, J. F. Schweigert, P. J. Sullivan, and C. I. Zhang, editors. Fishery stock assessment models: Proceedings of the International Symposium on fishery stock assessment models for the 21st century, October 8-11, 1997, Anchorage, Alaska. University of Alaska Sea Grant College Program AK-SG-98-01.
Otis, E. O., and J. L. Cope. 2004. Abundance, age, sex, and size statistics for Pacific herring in Lower Cook Inlet, 2000-2003. Alaska Department of Fish and Game, Division of Commercial Fisheries, Regional Information Report 2A04-04, Anchorage.
Otis, E. O., R. Heintz, and J. Maselko. 2010. Investigation of Pacific herring (Clupea pallasii) stock structure in Alaska using otolith microchemistry and heart tissue fatty acid composition. Exxon Valdez Oil Spill Restoration Project Final Report (Restoration Project 070769), Alaska Department of Fish and Game, Division of Commercial Fisheries, Homer, Alaska.
Reid, G. M. 1971. Age composition, weight, length, and sex of herring, Clupea pallasii, used for reduction in Alaska, 1929-1966. NOAA Technical Report, NMFS SSRF 634. 25 p.
Rounsefell, G. A. 1930. Contribution to the biology of the Pacific herring, Clupea pallasii, and the condition of the fishery in Alaska. Document No. 1080, Issued July 23, 1930, Bulletin of the United States Bureau of Fisheries, Volume XLV.
Schroeder, T. R., and S. C. Kyle. 1986. Annual finfish management report, 1985, Lower Cook Inlet. Alaska Department of Fish and Game, Division of Commercial Fisheries, Homer. .
Stanek, R. T. 1985. Patterns of wild resource use in English Bay and Port Graham, Alaska. Alaska Department of Fish and Game, Division of Subsistence. Technical Paper No. 104, Anchorage.
Szarzi, N. J., C. M. Kerkvliet, B. J. Failor, and M. D. Booz. 2010. Recreational fisheries in the Lower Cook Inlet Management Area, 2008–2010, with updates for 2007. Alaska Department of Fish and Game, Fishery Management Report No. 10-38, Anchorage.
Yuen, H. J. 1994. A model to predict Pacific herring age composition in early and late spawning migrations in Kamishak Bay, Alaska. Alaska Fishery Research Bulletin 1:35-54.
Yuen, H. J., and W. A. Bucher. 1993. Lower Cook Inlet salmon run timing curves. Alaska Department of Fish and Game, Division of Commercial Fisheries, Regional Informational Report 2A93-34, Anchorage.
35

36

FIGURES AND TABLES
37

38
Figure 1.–Lower Cook Inlet management area showing commercial fishing districts, salmon hatcheries, weir and fish
ladder locations, and remote video salmon monitoring sites.

39
Figure 2.–Lower Cook Inlet management area showing commercial fishing districts and reporting subdistricts.

40
Figure 3.–Southern District of Lower Cook Inlet management area showing commercial fishing districts and reporting subdistricts, Chugachik Island to Anisom Point.

41
Figure 4.–Southern District of Lower Cook Inlet management area showing commercial fishing districts and reporting
subdistricts, Anisom Point to Seldovia Point.

42
Figure 5.–Southern District of Lower Cook Inlet management area showing commercial fishing districts and reporting
subdistricts, Seldovia Point to Point Bede.

43
Figure 6.–Outer District of Lower Cook Inlet management area showing commercial fishing districts and reporting
subdistricts, Point Adam to Chugach Bay.

44
Figure 7.–Outer District of Lower Cook Inlet management area showing commercial fishing districts and reporting
subdistricts, Chugach Bay to Rocky Bay.

45
Figure 8.–Outer District of Lower Cook Inlet management area showing commercial fishing districts and reporting
subdistricts, Port Dick area.

46
Figure 9.–Outer District of Lower Cook Inlet management area showing commercial fishing districts and reporting
subdistricts, Nuka Bay area.

47
Figure 10.–Eastern District of Lower Cook Inlet management area showing commercial fishing districts, reporting
subdistricts, and hatchery special harvest area (SHA), Aligo Point to Cape Fairfield.

48
Figure 11.–Kamishak Bay District of Lower Cook Inlet management area showing commercial fishing districts and
reporting subdistricts, Chenik Lake to Cape Douglas.

49
Figure 12.–Kamishak Bay District of Lower Cook Inlet management area showing commercial fishing districts, reporting
subdistricts, and hatchery special harvest area, McNeil River to Ursus Cove.

50
Figure 13.–Kamishak Bay District of Lower Cook Inlet management area showing commercial fishing districts, Ursus Cove to
Chinitna Point.

51
Figure 14.–Kachemak Bay personal use coho salmon fishery registration areas.

52
Figure 15.–Southern District personal use coho salmon fishery: Homer Spit area.

53
Figure 16.–Lower Cook Inlet management area, Southern District hatchery special harvest areas, Halibut Cove to Anisom
Point.

54
Figure 17.–Lower Cook Inlet management area, Southern District hatchery special harvest areas, Anisom Point to Seldovia
Point.

55
Figure 18.–Lower Cook Inlet management area, Southern District hatchery special harvest areas, Port Graham Area.

56
Figure 19.–Commercial common property salmon harvests in Lower Cook Inlet, 1986–2015.

Figure 20.–Exvessel value of Lower Cook Inlet commercial salmon harvest, 2005–2015.
57

58
Figure 21.–Age-structured-assessment (ASA) biomass estimates and commercial harvests of Pacific herring in the sac roe seine fishery,
Kamishak Bay District, Lower Cook Inlet, 1985–2015 and 2016 projection. Note: All spawning biomass estimates derived from 2015 ASA calculations.

Table 1.–Lower Cook Inlet Management Area commercial salmon harvest by gear and district, 2015.
District Permits a Chinook a Sockeye a Coho a, b Pink a Chum a Total Southern District 15 52 54,783 997 141,604 1,450 198,886 Outer District 19
613 41 4,096,578 97,974 4,195,206
Eastern District 3
4,633
155 115 4,903 Kamishak Bay District c
c c c
Purse seine total 19 52 60,029 1,038 4,272,072 100,165 4,433,356
Southern District 24 752 36,061 3,102 27,726 11,539 79,180 Set gillnet total 24 752 36,061 3,102 27,726 11,539 79,180 Commercial common property total 804 96,090 4,140 4,299,798 111,704 4,512,536
Port Graham Hatchery Tutka Bay Hatchery
199 2,087,024 1,737 2,088,960 Trail Lakes Hatchery
148,802 1 1,560
150,363
Hatchery cost recovery totald 148,802 200 2,088,584 1,737 2,239,323
Commercially sold total 804 244,892 4,340 6,388,382 113,441 6,751,859
Homepack 20 67 278 479 401 28 1,253
Hatchery donated fishe
2,062 1,096
3,158 Misc. Total 67 2,340 1,575 401 28 4,411
Lower Cook Inlet total 871 247,232 5,915 6,388,783 113,469 6,756,270 a Numbers of fish and numbers of permit holders delivering are from ADF&G fish ticket database. b 1,408 coho salmon were harvested in the Seward Salmon Derby. These were sold by the sponsor to commercial processors.
These fish were caught by sport permit holders using rod and reel (troll gear). This harvest is not included in the commercial harvest total catch.
c Confidential data. Fewer than 3 permits reporting. d Hatchery sales for hatchery operating costs. e Excess sockeye and coho salmon harvested at the Bear Creek weir.
59

Table 2.–Total commercial salmon harvest by species from all gear types, Lower Cook Inlet area, including cost recovery for all Cook Inlet Area hatcheries, 1985–2015. Year Gear n-permits a Chinook a Sockeye a Coho a Pink a Chum a 1985 Purse seine 51 85 255,234 5,585 1,206,819 26,421 1985 Set gillnet 34 924 23,163 3,908 22,898 4,217 1985 Hatchery 0 0 0 0 0 0
Total 1,009 278,397 9,493 1,229,717 30,638
1986 Purse seine 61 51 213,054 15,258 1,394,049 80,262 1986 Set gillnet 34 745 21,807 2,827 14,244 2,426 1986 Hatchery 0 0 0 0 0 0
Total 796 234,861 18,085 1,408,293 82,688
1987 Purse seine 67 526 220,648 10,970 192,207 156,965 1987 Set gillnet 29 653 28,209 2,025 9,224 2,419 1987 Hatchery 0 0 0 0 0 0
Total 1,179 248,857 12,995 201,431 159,384
1988 Purse seine 72 549 306,309 4,742 895,420 319,768 1988 Set gillnet 27 1,145 14,758 2,819 29,268 4,423 1988 Hatchery 0 0 0 0 0 0
Total 1,694 321,067 7,561 924,688 324,191
1989 Purse seine 65 612 149,301 5,864 1,280,716 9,428 1989 Set gillnet 23 1,281 13,970 4,792 16,210 1,877 1989 Hatchery 0 0 0 0 0 0
Total 1,893 163,271 10,656 1,296,926 11,305
1990 Purse seine 71 199 188,032 733 353,781 5,013 1990 Set gillnet 20 1,361 15,863 1,046 12,646 1,938 1990 Hatchery 0 0 0 5,876 17,243 0
Total 1,560 203,895 7,655 383,670 6,951
1991 Purse seine 68 576 281,250 7,068 722,535 22,623 1991 Set gillnet 20 842 20,525 5,011 3,954 1,577 1991 Hatchery 0 0 0 0 0 0
Total 1,418 301,775 12,079 726,489 24,200
1992 Purse seine 61 603 143,537 3,049 187,853 20,511 1992 Set gillnet 20 1,288 17,002 848 15,958 1,687 1992 Hatchery 0 0 16,105 1,528 275,957 5
Total 1,891 176,644 5,425 479,768 22,203
1993 Purse seine 51 1,079 195,896 1,710 445,283 1,776 1993 Set gillnet 17 1,089 14,791 3,088 12,008 2,591 1993 Hatchery 0 0 0 0 0 0
Total 2,168 210,687 4,798 457,291 4,367
1994 Purse seine 30 127 73,543 7,024 670,944 3,049 1994 Set gillnet 16 1,103 14,004 1,073 23,621 2,419 1994 Hatchery 0 1 27,871 4,968 953,364 1
Total 1,231 115,418 13,065 1,647,929 5,469
1995 Purse seine 46 225 207,237 9,867 1,593,453 11,676 1995 Set gillnet 23 2,078 19,406 3,564 41,654 3,958 1995 Hatchery 0 0 38,780 1,318 1,213,357 2
Total 2,303 265,423 14,749 2,848,464 15,636 -continued-
60

Table 2.–Page 2 of 3. Year Gear n-permits a Chinook a Sockeye a Coho a Pink a Chum a 1996 Purse seine 34 126 339,626 3,892 17,546 946 1996 Set gillnet 24 1,054 69,338 5,779 14,813 2,792 1996 Hatchery 0 1 41,492 1,334 420,431 26
Total 1,181 450,456 11,005 452,790 3,764
1997 Purse seine 23 126 144,091 1,185 288,969 1,736 1997 Set gillnet 25 1,135 59,401 4,475 64,162 4,166 1997 Hatchery 0 0 36,681 3,177 2,461,300 6
Total 1,261 240,173 8,837 2,814,431 5,908
1998 Purse seine 39 119 177,250 2,325 639,505 883 1998 Set gillnet 24 952 26,131 1,057 24,403 3,754 1998 Hatchery 0 0 80,648 10,717 793,911 10
Total 1,071 284,029 14,099 1,457,819 4,647
1999 Purse seine 43 273 302,070 2,873 276,742 3,606 1999 Set gillnet 20 1,491 27,646 1,374 5,348 4,335 1999 Hatchery 0 0 147,063 2,502 858,398 0
Total 1,764 476,779 6,749 1,140,488 7,941
2000 Purse seine 36 168 129,133 506 321,342 67,769 2000 Set gillnet 24 1,019 26,503 621 21,845 5,214 2000 Hatchery 0 1 66,693 169 1,044,119 271
Total 1,188 222,329 1,296 1,387,306 73,254
2001 Purse seine 25 123 119,806 909 156,657 85,473 2001 Set gillnet 18 865 28,503 1,811 13,393 3,487 2001 Hatchery 0 0 60,619 34 422,881 9
Total 988 208,928 2,754 592,931 88,969
2002 Purse seine 25 40 158,284 1,502 1,013,649 38,541 2002 Set gillnet 24 1,513 46,812 2,393 6,741 4,681 2002 Hatchery 0 0 84,194 311 949,671 37
Total 1,553 289,290 4,206 1,970,061 43,259
2003 Purse seine 27 302 438,236 3,121 335,147 30,625 2003 Set gillnet 24 878 81,722 2,291 7,325 4,998 2003 Hatchery 0 0 122,024 253 513,649 63
Total 1,180 641,982 5,665 856,121 35,686
2004 Purse seine 24 258 84,633 5,647 57,878 205,445 2004 Set gillnet 19 1,400 16,087 1,164 834 1,234 2004 Hatchery 0 0 29,363 0 2,458,843 0
Total 1,658 130,083 6,811 2,517,555 206,679
2005 Purse seine 29 85 134,649 914 161,255 97,274 2005 Set gillnet 17 525 15,669 1,905 341 1,326 2005 Hatchery 0 0 81,058 1 2,144,818 2
Total 610 231,376 2,820 2,306,414 98,602
2006 Purse seine 24 50 125,878 26,019 1,206,631 69,810 2006 Set gillnet 22 580 14,219 2,426 12,288 2,019 2006 Hatchery 0 0 83,464 0 252,658 125
Total 630 223,561 28,445 1,471,577 71,954 -continued-
61

Table 2.–Page 3 of 3. Year Gear n-permits a Chinook a Sockeye a Coho a Pink a Chum a 2007 Purse seine 19 28 278,570 1,827 162,762 266 2007 Set gillnet 16 439 28,870 1,616 0 1,437 2007 Hatchery 0 0 58,514 26 124,649 74
Total 467 365,954 3,469 287,411 1,777
2008 Purse seine 25 42 293,363 740 498,930 174,128 2008 Set gillnet 18 148 26,819 599 1,884 1,394 2008 Hatchery 0 0 87,208 2 4,886 208
Total 190 407,390 1,341 505,700 175,730
2009 Purse seine 13 1 65,771 9 985,451 71,700 2009 Set gillnet 19 83 38,220 968 2,136 2,274 2009 Hatchery 0 0 175,539 1 1,760 0
Total 84 279,530 978 989,347 73,974
2010 Purse seine 14 10 8,615 589 274,859 93,245 2010 Set gillnet 21 29 14,765 171 3,106 1,503 2010 Hatchery 0 0 69,219 31 246 7
Total 39 92,599 791 278,211 94,755
2011 Purse seine 23 36 211,700 49 359,058 29,741 2011 Set gillnet 21 100 22,782 103 2,643 1,946 2011 Hatchery 0 0 158,272 0 205 4
Total 136 392,754 152 361,906 31,691
2012 Purse seine 16 47 61,728 142 245,190 54,177 2012 Set gillnet 15 86 10,260 33 10,305 927 2012 Hatchery 0 0 114,592 7 772 330
Total 133 186,580 182 256,267 55,434
2013 Purse seine 11 141 61,305 1,955 2,048,707 51,684 2013 Set gillnet 19 250 38,238 3,616 1,961 2,698 2013 Hatchery 0 0 70,193 0 48,017 20 Total 391 169,736 5,571 2,098,685 54,402
2014 Purse seine 20 18 64,898 269 267,808 67,865 2014 Set gillnet 19 330 33,090 521 3,549 5,372 2014 Hatchery 0 20 173,030 1 161 278 Total 368 271,018 791 271,518 73,515
Previous 10-yr Average
Purse seine 19 46 130,648 3,251 621,065 70,989 Set gillnet 19 257 24,293 1,196 3,821 2,090 Hatchery 0 2 107,109 7 257,817 105
Total 305 262,050 4,454 882,704 73,183
2015 Purse seine 19 59 60,149 1,100 4,272,374 100,165 2015 Set gillnet 24 812 36,219 3,519 27,825 11,567 2015 Hatchery 0 0 148,802 200 2,088,584 1,737 Total 871 245,170 4,819 6,388,783 113,469 a Numbers of fish and numbers of permit holders delivering are from ADF&G fish ticket database. These numbers do not
include sport caught fish from the Seward salmon derby that were later sold. Historical numbers in this table include commercial homepack fish.
62

Table 3.–Mean price and estimated exvessel value of the total commercial salmon harvest excluding homepacks by gear type, Lower Cook Inlet, 2015.
Purse seine
Average
Species Number a Pounds a weight Price a Value
Chinook 59 368 6.84 $1.70 $624
Sockeye 60,149 292,235 4.87 $1.45 $424,498
Coho 1,092 6,940 6.68 $0.42 $2,892
Pink 4,272,374 13,991,832 3.28 $0.20 $2,788,824
Chum 100,165 646,440 6.57 $0.45 $287,699
4,433,839 14,937,815
$3,504,537
Set gillnet
Average
Species Number a Pounds a weight Price a Value
Chinook 812 7,763 10.40 $3.16 $24,510
Sockeye 36,219 192,617 5.34 $1.86 $359,009
Coho 3,519 18,768 6.04 $0.73 $13,635
Pink 27,825 101,065 3.64 $0.18 $18,010
Chum 11,567 74,887 6.49 $0.34 $25,534
79,942 395,100
$440,698
Hatchery sales
Average
Species Number a Pounds a weight Price a Value
Chinook 0 0 0.00 $0.00 $0
Sockeye 148,802 624,042 4.19 $1.32 $821,739
Coho 200 1,386 6.93 $0.40 $554
Pink 2,088,584 6,004,909 2.88 $0.23 $1,383,195
Chum 1,737 11,110 6.40 $0.40 $4,444
2,239,323 6,641,447
$2,209,932
Total harvest
Average
Species Number a Pounds a weight Price a Value
Chinook 871 8,131 10.19 $3.09 25,135
Sockeye 245,180 1,108,894 4.53 $1.45 1,605,245
Coho 4,811 27,094 6.23 $0.63 17,082
Pink 6,388,783 20,097,806 3.14 $0.21 4,190,029
Chum 113,469 732,437 6.56 $0.43 317,677
6,753,104 21,974,362
$6,155,167
Value of
No. of Average
Gear type catch permits a earnings
Purse seine
$3,504,537 19 $184,449
Set gillnet $440,698 24 $18,362
Subtotal-
Value of CPF Catch $3,945,236
Hatchery
$2,209,932
Grand total $6,155,167 a Mean prices are based on weighted average prices from ADF&G fish ticket database. Pounds and numbers of fish are based
on fish ticket reporting.
63

64
Table 4.–Average price paid to permit holders for salmon, Lower Cook Inlet, 1990–2015.
Chinook salmon Sockeye salmon Coho salmon Pink salmon Chum salmon
Year Seine Set
gillnet Combined Seine Set
Gillnet Combined Seine Set
gillnet Combined Seine Set
gillnet Combined Seine Set
gillnet Combined 1990 NA NA $1.35 b $1.38 $1.89 $1.88
$0.50 $0.84 $0.84
$0.35 $0.30 $0.32
$0.40 $0.55 $0.55
1991 NA $1.53 $1.53
NA $1.45 $1.45
NA NA $0.29 b NA $0.25 $0.25
NA $0.41 $0.41 1992 $0.97 $1.41 $1.29
$1.45 $1.46 $1.45
$0.43 $0.50 $0.44
$0.15 $0.15 $0.15
$0.26 $0.33 $0.27
1993 $0.89 $1.10 $1.02
$0.78 $1.00 $0.80
$0.42 $0.58 $0.52
$0.14 $0.13 $0.14
$0.30 $0.26 $0.28 1994 $0.90 $0.96 $0.95
$1.12 $1.23 $1.14
$0.66 $0.71 $0.66
$0.16 $0.15 $0.16
$0.15 $0.35 $0.25
1995 $0.85 $1.19 $1.17
$1.11 $1.20 $1.11
$0.47 $0.53 $0.49
$0.15 $0.16 $0.15
$0.23 $0.26 $0.24 1996 $0.76 $1.37 $1.32
$0.90 $1.00 $0.92
$0.29 $0.40 $0.36
$0.05 $0.06 $0.05
$0.15 $0.19 $0.18
1997 $0.69 $1.32 $1.29
$0.81 $0.84 $0.82
$0.29 $0.49 $0.46
$0.11 $0.10 $0.11
$0.19 $0.25 $0.23 1998 $0.68 $1.58 $1.58
$0.98 $1.01 $0.99
$0.55 $0.66 $0.60
$0.13 $0.14 $0.13
$0.19 $0.29 $0.28
1999 $0.97 $2.07 $2.04
$1.32 $1.67 $1.41
$0.45 $0.70 $0.62
$0.13 $0.16 $0.14
$0.10 $0.43 $0.35 2000 $0.75 $1.94 $1.86
$0.98 $1.01 $0.98
$0.45 $0.54 $0.49
$0.09 $0.15 $0.09
$0.29 $0.18 $0.28
2001 $0.75 $1.87 $1.76
$0.64 $0.73 $0.66
$0.30 $0.43 $0.39
$0.09 $0.05 $0.09
$0.36 $0.20 $0.35 2002 $0.30 $1.12 $1.10
$0.56 $0.68 $0.58
$0.17 $0.25 $0.22
$0.06 $0.03 $0.06
$0.16 $0.19 $0.16
2003 $0.25 $1.14 $1.02
$0.61 $0.74 $0.64
$0.20 $0.11 $0.16
$0.05 $0.02 $0.05
$0.15 $0.20 $0.15 2004 $0.33 $1.68 $1.56
$0.80 $1.16 $0.86
$0.44 $0.52 $0.45
$0.05 $0.07 $0.05
$0.20 $0.21 $0.20
2005 $0.83 $1.65 $1.54
$0.87 $1.30 $0.93
$0.29 $0.53 $0.45
$0.08 $0.10 $0.08
$0.22 $0.24 $0.22 2006 $0.50 $2.41 $2.26
$1.10 $1.74 $1.18
$0.50 $0.82 $0.53
$0.11 $0.11 $0.11
$0.31 $0.26 $0.31
2007 $0.70 $2.73 $2.70
$0.88 $1.45 $0.95
$0.50 $0.46 $0.48
$0.11 $0.11 $0.11
$0.25 $0.25 $0.25 2008 $0.65 $3.67 $3.57
$1.39 $1.64 $1.42
$0.50 $0.84 $0.66
$0.23 $0.23 $0.23
$0.55 $0.25 $0.55
2009 $1.00 $3.50 $3.45
$1.20 $1.49 $1.33
$0.52 $0.80 $0.80
$0.22 $0.18 $0.22
$0.54 $0.25 $0.53 2010 $0.50 $3.76 $3.57
$1.46 $1.88 $1.74
$1.08 $1.27 $1.12
$0.33 $0.25 $0.33
$0.79 $0.47 $0.79
2011 $1.93 $4.19 $3.85
$1.56 $1.56 $1.56
$0.52 $0.79 $0.70
$0.41 $0.30 $0.37
$0.83 $0.61 $0.81 2012 $2.08 $4.53 $4.09
$1.59 $1.80 $1.63
$0.75 $1.06 $0.80
$0.39 $0.25 $0.38
$0.70 $0.37 $0.70
2013 $1.02 $5.14 $4.53
$2.00 $2.21 $2.11
$0.83 $1.01 $0.95
$0.38 $0.33 $0.38
$0.53 $0.35 $0.52 2014 $2.67 $3.92 $3.89
$1.94 $2.23 $2.15
$0.75 $1.24 $1.11
$0.28 $0.26 $0.28
$0.59 $0.47 $0.57
10-year Average $1.11 $3.38 $3.18 $1.34 $1.68 $1.44 $0.61 $0.85 $0.73 $0.24 $0.20 $0.23 $0.50 $0.34 $0.49
2015 $1.70 $3.16 $3.11 $1.45 $1.86 $1.62 $0.42 $0.73 $0.64 $0.20 $0.18 $0.20 $0.45 $0.34 $0.43 Note: These prices are based on weighted average prices from ADF&G fish ticket database and do not reflect postseason adjustments and bonuses. Caution should be used when
estimating value from these prices.

65
Table 5.–Estimated exvessel value of commercial salmon harvest by gear type with previous 10-year average, Lower Cook Inlet, 2005–2015.
Purse seine 10-yr
Average
Species 2005 2006 2007 2008 2009 2010 2011 2012 2013 2014 2015
Chinook 889 344 305 228 34 15 648 483 689 411 405 624
Sockeye 488,641 605,442 1,080,994 1,924,898 347,202 58,349 1,485,538 461,300 644,508 618,967 771,584 424,498
Coho 1,842 96,927 5,112 2,183 41 4,131 157 706 9,366 1,314 13,385 2,892
Pink 43,183 473,506 57,072 408,666 665,639 328,849 423,068 300,992 2,403,739 264,127 567,190 2,788,824
Chum 183,716 180,231 443 784,343 314,421 619,305 166,691 323,923 205,517 294,110 308,732 287,699
$718,271 $1,356,450 $1,143,925 $3,120,319 $1,327,338 $1,010,648 $2,076,101 $1,087,404 $3,263,819 $1,178,929 1,678,253 $3,504,537
Set gillnet
Species
Chinook 12,921 19,100 19,991 14,408 5,412 1,792 8,032 4,847 15,135 11,533 11,317 24,510
Sockeye 115,746 134,339 251,705 253,544 332,005 151,183 218,700 109,526 502,583 433,220 250,255 359,009
Coho 6,864 16,475 4,724 3,406 4,953 1,458 488 200 20,959 3,220 6,614 13,635
Pink 133 5,337 0 1,650 1,073 2,728 2,606 10,074 2,217 3,351 2,869 18,010
Chum 2,287 4,350 2,508 2,678 4,216 4,972 7,975 2,528 6,842 18,062 4,262 25,534
$137,950 $179,600 $278,928 $275,685 $347,659 $162,132 $237,801 $127,176 $547,736 $469,385 254,963 $440,698
Hatchery sales
Species
Chinook 0 0 0 0 0 0 0 0 0 245 24 0
Sockeye 291,395 419,805 222,175 528,507 1,177,187 430,230 1,625,199 1,021,125 910,285 1,799,731 842,564 821,739
Coho 2 0 96 4 2 222 0 44 0 0 41 554
Pink 585,235 97,059 44,580 3,867 1,249 280 487 1,074 57,622 130 87,939 1,383,195
Chum 3 282 142 1,009 0 33 16 1,034 83 628 289 4,444
$876,635 $517,146 $266,993 $533,387 $1,178,437 $430,765 $1,625,702 $1,023,277 $967,990 $1,800,733 824,482 $2,209,932
Average earnings
Purse seine $24,768 $56,519 $60,207 $124,813 $102,103 $72,189 $90,265 $67,963 $296,711 $58,946 95,448 $184,449
Set gillnet $8,115 $8,164 $17,433 $15,316 $18,298 $7,721 $11,324 $8,478 $28,828 $24,704 14,838 $18,362
Number of permits fished Purse seine 29 24 19 25 13 14 23 16 11 20 19 19
Set gillnet 17 22 16 18 19 21 21 15 19 19 19 24

Table 6.–Preseason harvest or total run projections for the 2015 commercial common property salmon fishery by district and species, Lower Cook Inlet Area.
District/facility Forecast type Chinooka
Sockeyea
Cohoa
Pinkb
Chuma
Southern District Commercial harvest 210 40,700 1,400 26,000 3,500
Outer District Commercial harvest 4 14,800 40 370,000 41,700
Eastern District Commercial harvest 0 0 0 0 230
Kamishak Bay District Commercial harvest 2 37,900 100 0 16,800
Total wild stock 216 93,400 1,540 396,000 62,230 Tutka Lagoon Hatchery Total return 0
48,160
0
1,533,000
0
Port Graham Hatchery Total return 0
5,100
0
2,820
0 Kirschner Lake Total return 0
39,500
0
0
0
Leisure Lake Total return 0 27,944
0
0
0 Hazel Lake Total return 0
0
0
0
Resurrection Bay Total return 0
322,737
0
0
0 Halibut Cove Total return 0
0
0
0
0
English Bay Lakes Total return 0
1,696
0
0
0 Total hatcheryc 445,137 0 1,535,820 0
Total Hatchery and wild 216 538,537 1,540 1,931,820 62,230
a Chinook, coho, chum, and natural sockeye salmon harvests are 2010–2014 average commercial harvests. b Pink salmon commercial harvests are projected total run minus anticipated escapement. c Hatchery operators provide total run forecasts.
66

Table 7.–Emergency orders issued for the commercial, personal use, and subsistence salmon fisheries in Lower Cook Inlet, 2015.
E.O. number/ Issue date Description 2-F-H-01-15/ Friday, May 1
Identification of some salmon streams in Lower Cook Inlet pursuant to 5AAC 39.290(a)(2).
2-F-H-02-15/ Friday, May 8
Southern and Kamishak districts, set gillnet and purse seine. Opens waters of the Kamishak District south of Nordyke Island to commercial salmon harvest on May 25 and establishes 7-day per week purse seine fishing periods in this area. Opens remaining subdistricts in this district on June 1 on this schedule. Opens waters of the Southern District to commercial salmon harvest and establishes two weekly 48-hour set gillnet fishing periods in the Southern District excluding the Pt. Graham Subdistrict beginning at 6:00 am on Mondays and Thursdays effective Monday, June 1.
2-F-H-03-15/ Monday, June 1
Southern District, set gillnet. Defines seaward boundaries approximately 1,000 offshore of mean lower low water in which set gillnets may be used to commercially harvest salmon in the Southern District.
2-F-H-04-15/ Friday, June 5
Southern District, set gillnet. Redefines the eastern boundary of the area in the Halibut Cove Subdistrict where set gillnets may be used to commercially harvest salmon.
2-F-H-05-15/ Friday, June 12
Southern District, subsistence harvest. Expands the subsistence fishing schedule in the Port Graham Section of the Port Graham Subdistrict to 7 days per week.
2-F-H-06-15/ Friday, June 19
Kamishak and Southern districts, purse seine. Closes waters of McNeil, Chenik and Paint River to commercial salmon harvest and effective Monday, June 22 opens Tutka Bay, China Poot, and Halibut Cove subdistricts excluding hatchery special harvest areas to commercial salmon purse seine harvest for 16-hour fishing periods from 6:00 am to 10:00 pm on Mondays, Wednesdays, and Fridays until further notice.
2-F-H-07-15/ Monday, June 29
Eastern District, purse seine. Opens portions of the Eastern District to daily Monday-Friday 16-hour 6:00 am to 10:00 pm salmon purse seine fishing periods. Closes this fishery on Friday, July 3.
2-F-H-08-15/ Friday, July 2
Southern District, purse seine. Modifies 2-F-H-06-15 by extending the Monday, Wednesday, Friday fishing schedule in the Southern District to a Monday through Friday schedule of daily 16-hour fishing periods effective Monday, July 6.
2-F-H-09-15/ Thursday, July 9
Southern, Kamishak and Outer subdistricts, purse seine and set gillnet. Opens the Seldovia and Port Graham subdistricts on a seine fishing schedule concurrent with the schedule established in emergency order 2-F-H-08-15. Opens the Port Graham Section of the Port Graham Subdistrict to commercial set gillnet harvest on a schedule of fishing periods concurrent with those established in emergency order 2-F-H-02-15 for this gear. Opens portions of the Outer District from Dogfish Bay to Petrof Glacier on a Monday, Wednesday and Friday schedule of 16-hour fishing periods. Opens portions of the Chenik Subdistrict to commercial purse seine harvest.
2-F-H-10-15/ Friday, July 10
Outer District, purse seine. Opens portions of the western end of Port Dick from July 13-15 for daily 16-hour fishing periods.
-continued-
67

Table 7.–Page 2 of 2.
E.O. number/ Issue date Description 2-F-H-11-15/ Tuesday, July 14
Outer District, purse seine. Opens Windy Bay, Port Dick Head End, and Port Dick Middle Creek subdistricts on a schedule of Monday, Wednesday, and Friday 16-hour fishery openings.
2-F-H-12-15/ Friday, July 24
Port Graham Subdistrict, purse seine and set gillnet. Opens the English Bay section to commercial set gillnet harvest for regular 48-hour Monday and Thursday fishing periods beginning at 6:00 am on those days. Moves the regulatory closed waters line at the head of Port Graham Bay southwards.
2-F-H-13-15/ Friday, July 30
Outer District, purse seine. Expands the fishing schedule in portions of the Outer District to a Monday through Friday schedule of daily 16-hour fishing periods. Adjusts regulatory closed waters in the Dogfish Bay Subdistrict and opens the Port Chatham Subdistrict to commercial purse seine harvest.
2-F-H-14-15/ Wednesday, August 5
Outer District, purse seine. Opens the Port Dick Outer Section and waters in the area of South Nuka Bay. Suspends selected regulatory closed waters areas in the Outer District.
2-F-H-15-15/ Friday, August 7
Kamishak and Southern districts, purse seine. Rescinds closed waters restrictions above the “Pothole” of the Bruin River as well as the Port Graham Subdistrict.
2-F-H-16-15/ Friday, August 7
Southern District, personal use fishing. Clarifies regulatory language regarding the scheduling of the Kachemak Bay Personal Use Coho fishery and associated closed waters.
2-F-H-17-15/ Thursday, August 13
Outer and Southern subdistricts, purse seine. Extends fishing time in portions of the Outer District from a schedule of Monday through Friday daily fishing periods to a seven day per week schedule of daily 16-hour openings. Opens waters of Touglaalek Bay, the Port Dick Island Creek Section, and the China Poot and Hazel Lake special harvest areas to purse seine harvest on schedules concurrent with those districts.
2-F-H-18-15/ Friday, August 1
Outer districts, purse seine. Suspends regulatory closed waters in the Rocky Bay and Dogfish Bay subdistricts.
2-F-H-19-15/ Thursday, August 20
Southern District, personal use fishery. Closes the personal use fishery on Saturday, August 22.
2-F-H-20-15/ Friday, September 18
Southern District, purse seine fishery. Closes the 2015 commercial salmon purse seine fishing season in Area H.
68

Table 8.–Escapements relative to escapement goals and methods used to monitor escapements in 2015 for Chinook, chum, pink, and sockeye salmon stocks in Cook Inlet, Alaska.
Escapement goal
Monitoring method
2015
Type Range
Stock Escapement (BEG, SEG) Lower Midpoint Upper Aerial Ground Video Weir
Chum salmon (12 with goals) Port Graham River 4,030
SEG 1,450 3,125 4,800
X
Dogfish Lagoon 13,312
SEG 3,350 6,250 9,150
X Rocky River 3,138
SEG 1,200 3,300 5,400
X X
Port Dick Creek 13,230
SEG 1,900 3,175 4,450
X X Island Creek 18,479
SEG 6,400 11,000 15,600
X X
Big Kamishak River 6,990
SEG 9,350 16,675 24,000
X Little Kamishak River 14,370
SEG 6,550 15,175 23,800
X
McNeil River 20,494
SEG 24,000 36,000 48,000
X Bruin River 11,006
SEG 6,000 8,125 10,250
X
Ursus Cove 14,783
SEG 6,050 7,950 9,850
X Cottonwood Creek 16,962
SEG 5,750 8,875 12,000
X
Iniskin Bay 7,513 SEG 7,850 10,775 13,700 X
Pink salmon (18 with goals) Humpy Creek 38,025
SEG 21,650 53,600 85,550
X
China Poot Creek 7,366
SEG 2,900 5,550 8,200
X Tutka Creek 81,584
SEG 6,500 11,750 17,000
X
Barabara Creek 25,203
SEG 1,900 5,425 8,950
X Seldovia Creek 108,793
SEG 19,050 29,000 38,950
X
Port Graham River 82,356
SEG 7,700 13,775 19,850
X Dogfish Lagoon Cks. 50,058
SEG 1,200 4,800 8,400
X X
Port Chatham 42,613
SEG 7,800 14,400 21,000
X Windy Creek Right 17,009
SEG 3,350 7,150 10,950
X
Windy Creek Left 33,640
SEG 3,650 16,800 29,950
X Rocky River 107,931
SEG 9,350 31,800 54,250
X
Port Dick Creek 98,002
SEG 18,550 38,425 58,300
X X Island Creek 50,387
SEG 7,200 17,750 28,300
X X
S. Nuka Island Creek 8,900
SEG 2,700 8,475 14,250
X Desire Lake 46,290
SEG 1,900 11,050 20,200
X
Bruin River 40,801
SEG 18,650 87,200 155,750
X Sunday Creek 60,385
SEG 4,850 16,850 28,850
X
Brown's Peak Creek 29,141 SEG 2,450 10,625 18,800 X
Sockeye salmon (8 with goals) English Bay 6,290
SEG 6,000 9,750 13,500
X
X
Delight Lake 3,220
SEG 5,950 9,250 12,550
X Desire Lake 2,830
SEG 8,800 12,000 15,200
X
Bear Lake 9,560
SEG 700 4,500 8,300
X Aialik Lake 3,182
SEG 3,700 5,850 8,000
X
Mikfik Lake 3,502
SEG 3,400 8,200 13,000
X
X Chenik Lake 19,073
SEG 3,500 8,750 14,000
X
X
Amakdedori Creek 2,910 SEG 1,250 1,925 2,600 X Note: SEG = sustainable escapement goal, BEG = biological escapement goal.
69

70

APPENDIX A: SOUTHERN DISTRICT
71

72
Appendix A1.–Southern District commercial set gillnet salmon harvest (excluding homepacks) by period, 2015.
Permits Chinook Sockeye Coho Pink Chum Period a Date Hours Fished Landings Number Pounds Number Pounds Number Pounds Number Pounds Number Pounds 1 a 06/01-06/03 48 9 12 39 442 493 2,549 50 339 2 a 06/04-06/06 48 8 10 21 236 302 1,460 66 387 3 a 06/08-06/10 48 9 13 62 734 640 3,167 1 5 185 1,334 4 a 06/11-06/13 48 9 14 93 983 1,665 8,193 1 6 4 12 773 5,639 5 a 06/15-06/17 48 10 12 72 827 916 4,423 442 2,890 6 a 06/18-06/20 48 12 14 61 710 1,545 7,725 30 110 9 28 562 3,483 7 a 06/22-06/24 48 8 16 76 794 724 3,698 99 631 9 27 518 3,460 8 a 06/25-06/27 48 8 14 65 530 920 4,445 18 90 26 86 499 3,195 9 a 06/29-07/01 48 12 19 69 676 1,153 5,880 59 364 1,312 4,772 801 5,304 10 a 07/02-07/04 48 8 12 30 266 681 3,472 219 1,317 1,890 7,131 531 3,383 11 a 07/06-07/08 48 11 20 14 120 2,001 10,405 219 1,387 1,847 7,269 869 5,729 12 a 07/09-07/11 48 14 33 39 390 1,766 9,483 208 1,263 2,971 10,895 818 5,081 13 a 07/13-07/15 48 15 27 36 346 2,179 11,596 255 1,552 3,194 11,471 1,015 6,499 14 a,b 07/16-07/18 48 17 37 17 145 4,484 24,825 271 1,702 3,303 11,829 1,324 8,601 15 a,b,c 07/20-07/22 48 14 24 16 175 3,178 17,597 318 1,879 2,853 10,313 642 4,076 16 a,b,c 07/23-07/25 48 15 32 11 145 3,003 15,861 209 1,285 2,409 8,769 585 3,439 17 a,b,c 07/27-07/29 48 12 22 7 75 1,473 8,208 288 1,638 1,026 3,654 337 2,156 18 a,b,c 07/30-08/01 48 10 18 3 28 1,734 9,690 246 1,225 1,907 6,832 279 1,835 19 a,b,c 08/03-08/05 48 10 17 20 133 2,889 16,307 105 670 806 2,956 311 1,993 20 a,b,c 08/06-08/08 48 10 13 2,557 14,219 128 855 1,270 4,427 411 2,693 21 a,b,c 08/10-08/12 48 9 11 1 8 906 4,888 206 1,338 645 2,435 199 1,227 22 a,b,c 08/13-08/15 48 7 7 605 3,278 150 1,017 1,636 5,591 214 1,390 23 a,b,c,d 08/17-08/19 48 d d
d d d d
d d d d
24 a,b,c,d 08/20-08/22 48 d d d d
d d d d
d d 25 a,b,c,d 08/24-08/26 48 d d
d d d d
d d d d
35 a,b,c,e 09/28-09/30 18 Total 24 402 752 7,763 36,061 192,618 3,102 18,768 27,726 101,065 11,539 74,886 Average weight 10.40 5.34 6.03 3.64 6.49 a Set gillnet sections located in Halibut Cove, Tutka Bay, Barabara Creek, and Seldovia Bay Subdistricts open to commercial harvest. b Set gillnet section in Port Graham Section open to commercial harvest concurrent with Halibut Cove, Tutka Bay, Barabara Creek, and Seldovia Bay Subdistricts. c Set gillnet section in English Bay Section open to commercial harvest concurrent with the Port Graham Section and the Halibut Cove, Tutka Bay, Barabara Creek, and Seldovia
Bay Subdistricts. d Confidential data. Fewer than 3 permits reporting. e No deliveries during Periods 26–35 that occurred from August 27 through September 30.
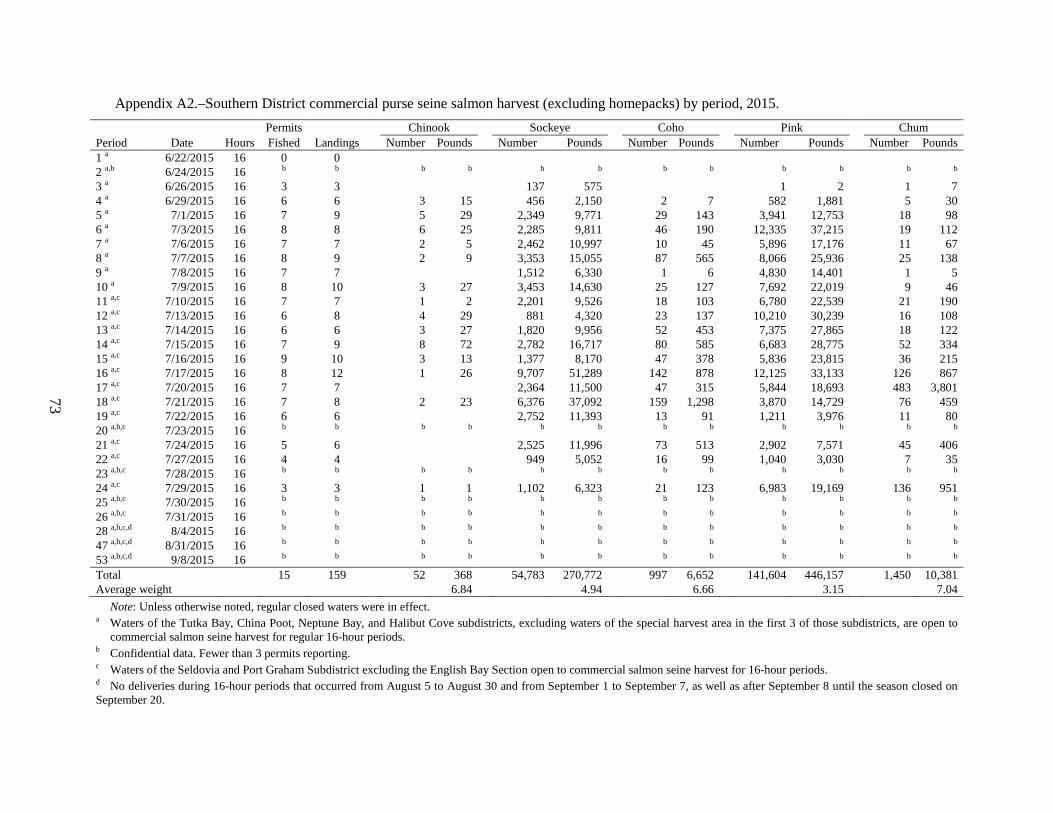
73
Appendix A2.–Southern District commercial purse seine salmon harvest (excluding homepacks) by period, 2015. Permits Chinook Sockeye Coho Pink Chum Period Date Hours Fished Landings Number Pounds Number Pounds Number Pounds Number Pounds Number Pounds 1 a 6/22/2015 16 0 0 2 a,b 6/24/2015 16 b b
b b
b b
b b
b b
b b
3 a 6/26/2015 16 3 3 137 575 1 2 1 7 4 a 6/29/2015 16 6 6 3 15 456 2,150 2 7 582 1,881 5 30 5 a 7/1/2015 16 7 9 5 29 2,349 9,771 29 143 3,941 12,753 18 98 6 a 7/3/2015 16 8 8 6 25 2,285 9,811 46 190 12,335 37,215 19 112 7 a 7/6/2015 16 7 7 2 5 2,462 10,997 10 45 5,896 17,176 11 67 8 a 7/7/2015 16 8 9 2 9 3,353 15,055 87 565 8,066 25,936 25 138 9 a 7/8/2015 16 7 7 1,512 6,330 1 6 4,830 14,401 1 5 10 a 7/9/2015 16 8 10 3 27 3,453 14,630 25 127 7,692 22,019 9 46 11 a,c 7/10/2015 16 7 7 1 2 2,201 9,526 18 103 6,780 22,539 21 190 12 a,c 7/13/2015 16 6 8 4 29 881 4,320 23 137 10,210 30,239 16 108 13 a,c 7/14/2015 16 6 6 3 27 1,820 9,956 52 453 7,375 27,865 18 122 14 a,c 7/15/2015 16 7 9 8 72 2,782 16,717 80 585 6,683 28,775 52 334 15 a,c 7/16/2015 16 9 10 3 13 1,377 8,170 47 378 5,836 23,815 36 215 16 a,c 7/17/2015 16 8 12 1 26 9,707 51,289 142 878 12,125 33,133 126 867 17 a,c 7/20/2015 16 7 7 2,364 11,500 47 315 5,844 18,693 483 3,801 18 a,c 7/21/2015 16 7 8 2 23 6,376 37,092 159 1,298 3,870 14,729 76 459 19 a,c 7/22/2015 16 6 6 2,752 11,393 13 91 1,211 3,976 11 80 20 a,b,c 7/23/2015 16 b b
b b b b
b b b b
b b
21 a,c 7/24/2015 16 5 6 2,525 11,996 73 513 2,902 7,571 45 406 22 a,c 7/27/2015 16 4 4 949 5,052 16 99 1,040 3,030 7 35 23 a,b,c 7/28/2015 16 b b
b b b b
b b b b
b b
24 a,c 7/29/2015 16 3 3 1 1 1,102 6,323 21 123 6,983 19,169 136 951 25 a,b,c 7/30/2015 16 b b
b b b b
b b b b
b b
26 a,b,c 7/31/2015 16 b b b b
b b b b
b b
b b 28 a,b,c,d 8/4/2015 16 b b
b b b b
b b b b
b b
47 a,b,c,d 8/31/2015 16 b b b b
b b b b
b b
b b 53 a,b,c,d 9/8/2015 16 b b
b b b b
b b b b
b b
Total 15 159 52 368 54,783 270,772 997 6,652 141,604 446,157 1,450 10,381 Average weight 6.84 4.94 6.66 3.15 7.04 Note: Unless otherwise noted, regular closed waters were in effect. a Waters of the Tutka Bay, China Poot, Neptune Bay, and Halibut Cove subdistricts, excluding waters of the special harvest area in the first 3 of those subdistricts, are open to
commercial salmon seine harvest for regular 16-hour periods. b Confidential data. Fewer than 3 permits reporting. c Waters of the Seldovia and Port Graham Subdistrict excluding the English Bay Section open to commercial salmon seine harvest for 16-hour periods. d No deliveries during 16-hour periods that occurred from August 5 to August 30 and from September 1 to September 7, as well as after September 8 until the season closed on September 20.

Appendix A3.–Total commercial common property salmon harvest (excluding homepacks) in the Southern District, 1970–2015. Year Permits Chinook Sockeye Coho Pink Chum Set gillnet 1970
26
11,455
1,154
18,512
1,575
1971
41
18,398
1,449
8,564
1,352 1972
69
31,340
323
6,303
2,819
1973
134
23,970
1,089
20,222
2,374 1974
175
26,996
3,010
11,097
2,713
1975 32
96
26,588
2,337
49,490
4,020 1976 27
176
33,993
1,321
13,412
1,353
1977 25
175
54,404
869
38,064
2,765 1978 26
1,052
86,934
3,053
11,556
4,117
1979 39
483
34,367
7,595
69,368
5,266 1980 38
225
29,922
8,038
26,613
2,576
1981 40
222
53,665
6,735
68,794
8,524 1982 40
894
42,389
5,557
15,838
7,113
1983 39
822
41,707
1,799
20,553
4,377 1984 24
643
45,806
2,979
20,764
5,412
1985 34
924
23,163
3,908
22,898
4,217 1986 34
745
21,807
2,827
14,244
2,426
1987 29
653
28,209
2,025
9,224
2,419 1988 27
1,145
14,758
2,819
29,268
4,423
1989 23
1,281
13,970
4,792
16,210
1,877 1990 20
1,361
15,863
1,046
12,646
1,938
1991 20
842
20,525
5,011
3,954
1,577 1992 20
1,288
17,002
848
15,958
1,687
1993 17
1,089
14,791
3,088
12,008
2,591 1994 16
1,103
14,004
1,073
23,621
2,419
1995 23
2,078
19,406
3,564
41,654
3,958 1996 24
1,054
69,338
5,779
14,813
2,792
1997 25
1,135
59,401
4,475
64,162
4,166 1998 24
952
26,131
1,057
24,403
3,754
1999 20
1,491
27,646
1,374
5,348
4,335 2000 24
1,019
26,503
621
21,845
5,214
2001 18
865
28,503
1,811
13,393
3,487 2002 24
1,513
46,812
2,393
6,741
4,681
2003 24
878
81,722
2,291
7,325
4,998 2004 19
1,400
16,087
1,164
834
1,234
2005 17
525
15,669
1,905
341
1,326 2006 22
580
14,219
2,426
12,288
2,019
2007 16
439
28,870
1,616
0
1,437 2008 18
148
26,819
599
1,884
1,394
2009 19
83
38,220
968
2,136
2,274 2010 21
29
14,765
171
3,106
1,503
2011 21
100
22,782
103
2,643
1,946 2012 15
86
10,260
33
10,305
928
2013 18 234 38,238 3,466 1,804 2,685 2014 18 320 32,910 393 3,231 5,355 Previous 10-yr avg
19
254
24,275
1,168
3,774
2,087
2015 24 752 36,061 3,102 27,726 11,539 -continued-
74
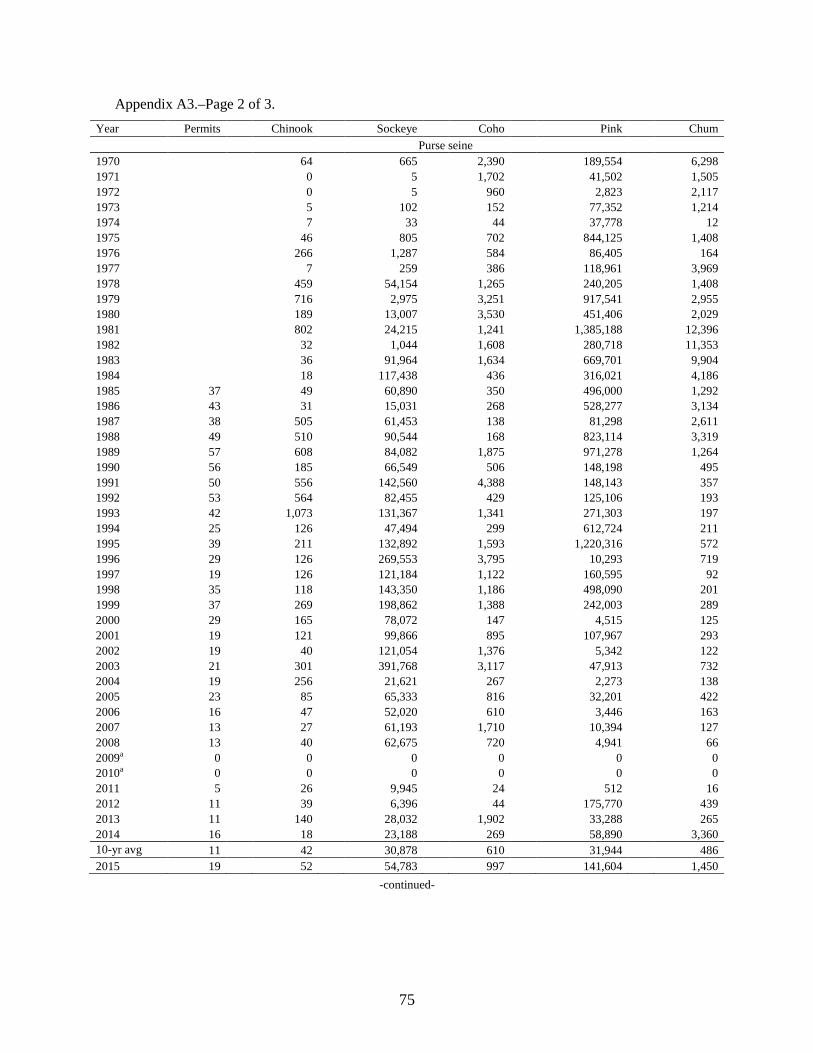
Appendix A3.–Page 2 of 3. Year Permits Chinook Sockeye Coho Pink Chum Purse seine 1970
64
665
2,390
189,554
6,298
1971
0
5
1,702
41,502
1,505 1972
0
5
960
2,823
2,117
1973
5
102
152
77,352
1,214 1974
7
33
44
37,778
12
1975
46
805
702
844,125
1,408 1976
266
1,287
584
86,405
164
1977
7
259
386
118,961
3,969 1978
459
54,154
1,265
240,205
1,408
1979
716
2,975
3,251
917,541
2,955 1980
189
13,007
3,530
451,406
2,029
1981
802
24,215
1,241
1,385,188
12,396 1982
32
1,044
1,608
280,718
11,353
1983
36
91,964
1,634
669,701
9,904 1984
18
117,438
436
316,021
4,186
1985 37
49
60,890
350
496,000
1,292 1986 43
31
15,031
268
528,277
3,134
1987 38
505
61,453
138
81,298
2,611 1988 49
510
90,544
168
823,114
3,319
1989 57
608
84,082
1,875
971,278
1,264 1990 56
185
66,549
506
148,198
495
1991 50
556
142,560
4,388
148,143
357 1992 53
564
82,455
429
125,106
193
1993 42
1,073
131,367
1,341
271,303
197 1994 25
126
47,494
299
612,724
211
1995 39
211
132,892
1,593
1,220,316
572 1996 29
126
269,553
3,795
10,293
719
1997 19
126
121,184
1,122
160,595
92 1998 35
118
143,350
1,186
498,090
201
1999 37
269
198,862
1,388
242,003
289 2000 29
165
78,072
147
4,515
125
2001 19
121
99,866
895
107,967
293 2002 19
40
121,054
1,376
5,342
122
2003 21
301
391,768
3,117
47,913
732 2004 19
256
21,621
267
2,273
138
2005 23
85
65,333
816
32,201
422 2006 16
47
52,020
610
3,446
163
2007 13
27
61,193
1,710
10,394
127 2008 13
40
62,675
720
4,941
66
2009a 0
0
0
0
0
0 2010a 0
0
0
0
0
0
2011 5
26
9,945
24
512
16 2012 11
39
6,396
44
175,770
439
2013 11 140 28,032 1,902 33,288 265 2014 16 18 23,188 269 58,890 3,360 10-yr avg 11 42 30,878 610 31,944 486 2015 19 52 54,783 997 141,604 1,450
-continued-
75

Appendix A3.–Page 3 of 3. Year Permits Chinook Sockeye Coho Pink Chum Purse seine and set gillnet combined 1970
90
12,120
3,544
208,066
7,873
1971
41
18,403
3,151
50,066
2,857 1972
69
31,345
1,283
9,126
4,936
1973
139
24,072
1,241
97,574
3,588 1974
182
27,029
3,054
48,875
2,725
1975
142
27,393
3,039
893,615
5,428 1976
442
35,280
1,905
99,817
1,517
1977
182
54,663
1,255
157,025
6,734 1978
1,511
141,088
4,318
251,761
5,525
1979
1,199
37,342
10,846
986,909
8,221 1980
414
42,929
11,568
478,019
4,605
1981
1,024
77,880
7,976
1,453,982
20,920 1982
926
43,433
7,165
296,556
18,466
1983
858
133,671
3,433
690,254
14,281 1984
661
163,244
3,415
336,785
9,598
1985
973
84,053
4,258
518,898
5,509 1986
776
36,838
3,095
542,521
5,560
1987
1,158
89,662
2,163
90,522
5,030 1988
1,655
105,302
2,987
852,382
7,742
1989
1,889
98,052
6,667
987,488
3,141 1990
1,546
82,412
1,552
160,844
2,433
1991
1,398
163,085
9,399
152,097
1,934 1992
1,852
99,457
1,277
141,064
1,880
1993
2,162
146,158
4,429
283,311
2,788 1994
1,229
61,498
1,372
636,345
2,630
1995
2,289
152,298
5,157
1,261,970
4,530 1996
1,180
338,891
9,574
25,106
3,511
1997
1,261
180,585
5,597
224,757
4,258 1998
1,070
169,481
2,243
522,493
3,955
1999
1,760
226,508
2,762
247,351
4,624 2000
1,184
104,575
768
26,360
5,339
2001
986
128,369
2,706
121,360
3,780 2002
1,553
167,866
3,769
12,083
4,803
2003
1,179
473,490
5,408
55,238
5,730 2004
1,656
37,708
1,431
3,107
1,372
2005
610
81,002
2,721
32,542
1,748 2006
627
66,239
3,036
15,734
2,182
2007
466
90,063
3,326
10,394
1,564 2008
188
89,494
1,319
6,825
1,460
2009 a 83
38,220
968
2,136
2,274 2010 a 29
14,765
171
3,106
1,503
2011 126
32,727
127
3,155
1,962 2012 125
16,656
77
186,075
1,367
2013 374 66,270 5,368 35,092 2,950 2014 338 56,098 662 62,121 8,715 Previous 10-yr avg 297 55,153 1,778 35,718 2,573
2015 804 90,844 4,099 169,330 12,989 Source: ADF&G fish ticket database. a No commercial common property purse seine fishing periods occurred in 2009 or 2010.
76

Appendix A4.–Anticipated daily and cumulative sockeye salmon escapement versus actual escapement through the English Bay weir, 2015.
Apportioned SEG
Actual
Anticipated percent
Projected minimum
Projected maximum
Date Daily Cumulative Daily Cumulative Daily Cumulative Comments 6/1 19 94 0.0% 1 1 3 3 Weir installed 5/22 6/2 4 98
0.1%
3 5
8 11
6/3 0 98
0.1%
1 6
2 13 6/4 127 225
0.7%
34 40
77 90
6/5 62 287
1.1%
23 63
52 142 6/6 107 394
2.1%
63 126
142 285
6/7 107 501 3.9% 107 234 241 526 6/8 177 678 7.0% 186 420 419 945 6/9 474 1,152
7.7%
42 462
95 1,041
6/10 327 1,479
11.8%
247 710
556 1,596 6/11 140 1,619
15.8%
239 949
538 2,134
6/12 52 1,671
17.1%
78 1,027
176 2,311 6/13 82 1,753
18.0%
50 1,077
112 2,423
6/14 230 1,983 19.0% 64 1,141 144 2,567 6/15 37 2,020 20.1% 66 1,207 148 2,715 6/16 35 2,055
21.1%
56 1,262
125 2,840
6/17 119 2,174
21.8%
46 1,309
104 2,945 6/18 48 2,222
22.9%
67 1,375
150 3,094
6/19 391 2,613
24.3%
83 1,458
186 3,280 6/20 158 2,771
27.6%
199 1,657
448 3,728
6/21 145 2,916 29.7% 126 1,783 284 4,011 6/22 265 3,181 32.3% 156 1,939 350 4,362 6/23 56 3,237
35.9%
216 2,155
487 4,849
6/24 109 3,346
39.9%
239 2,394
538 5,386 6/25 147 3,493
43.5%
212 2,606
478 5,864
6/26 52 3,545
46.0%
150 2,757
338 6,202 6/27 99 3,644
49.2%
196 2,952
440 6,643
6/28 50 3,694 55.3% 362 3,315 815 7,458 6/29 48 3,742 60.7% 324 3,639 730 8,187 6/30 120 3,862
64.4%
225 3,864
507 8,695
7/1 71 3,933
68.1%
220 4,084
494 9,189 7/2 379 4,312
71.4%
199 4,283
447 9,636
7/3 80 4,392
74.5%
185 4,467
415 10,051 7/4 99 4,491
76.5%
119 4,587
269 10,320
7/5 233 4,724 79.4% 175 4,762 394 10,714 7/6 63 4,787 81.4% 122 4,884 274 10,988 7/7 62 4,849
84.3%
175 5,058
394 11,382
7/8 58 4,907
86.3%
121 5,179
271 11,653 7/9 94 5,001
87.8%
90 5,269
202 11,855
7/10 130 5,131
89.2%
84 5,353
189 12,044 7/11 74 5,205
91.7%
151 5,503
339 12,383
7/12 58 5,263 93.5% 103 5,607 232 12,615 -continued-
77

Appendix A4.–Page 2 of 2.
Apportioned SEG
Actual
Anticipated
percent Projected minimum
Projected maximum
Date Daily Cumulative Daily Cumulative Daily Cumulative Comments 7/13 89 5,352 94.3% 51 5,658 115 12,730 7/14 74 5,426 95.6% 78 5,736 176 12,906 7/15 105 5,531 96.3% 41 5,777 92 12,998 7/16 68 5,599 97.0% 41 5,818 93 13,090 7/17 64 5,663 97.8% 50 5,868 113 13,203 7/18 54 5,717 98.1% 19 5,887 43 13,246 7/19 68 5,785 98.4% 16 5,903 37 13,283 7/20 48 5,833 98.5% 7 5,910 15 13,297 7/21 43 5,876 98.6% 3 5,913 6 13,303 7/22 58 5,934 98.9% 19 5,931 42 13,345 7/23 65 5,999 99.1% 17 5,948 37 13,382 7/24 34 6,033 99.4% 16 5,963 35 13,417 7/25 21 6,054 99.5% 5 5,968 11 13,429 7/26 129 6,183 99.6% 7 5,975 15 13,444 7/27 65 6,248 99.7% 3 5,978 8 13,451 7/28 33 6,281 99.8% 8 5,986 18 13,469 7/29 41 6,322 99.9% 6 5,992 13 13,482 7/30 46 6,368 100.0% 7 5,999 16 13,498 7/31 48 6,416 100.0% 0 5,999 0 13,498 Last report from weir crew. Note: English Bay River sustainable escapement goal range is 6,000–13,500. Anticipated escapement derived using historical run
timing.
78

Appendix A5.–Minimum and maximum anticipated cumulative and daily escapement of sockeye
salmon versus actual escapement through the English Bay weir, 2015.
79

Appendix A6.–Sockeye salmon escapement past the English Bay weir, 1927–1941 and 1993–2015.
Year Sustainable escapement
goal Total weir
passage Broodstock
harvested Harvested
for otoliths Spawning
escapement 1927
19,197 0
19,197
1928
24,025 0
24,025 1929
15,407 0
15,407
1930
18,858 0
18,858 1931
18,878 0
18,878
1932
22,933 0
22,933 1933
NS 0
NS
1934
NS 0
NS 1935
15,851 0
15,851
1936
15,767 0
15,767 1937
14,857 0
14,857
1938
16,779 0
16,779 1939
48,777 0
48,777
1940
30,357 0
30,357 1941
26,905 0
26,905
1942–1992 – – – – – 1993 10,000–20,000 8,939 0
8,939
1994 10,000–20,000 13,800 0
13,800 1995 10,000–20,000 22,467 1,767
20,700
1996 10,000–20,000 12,335 1,230
11,105 1997 10,000–20,000 15,430 1,065
14,365
1998 10,000–20,000 15,432 1,296
14,136 1999 10,000–20,000 15,844 1,234
14,610
2000 10,000–20,000 12,613 1,376
11,237 2001 10,000–20,000 10,508 0
10,508
2002 6,000–13,500 16,550 1,573
14,977 2003 6,000–13,500 19,978 219
19,759
2004 6,000–13,500 16,435 1,390
15,045 2005 6,000–13,500 7,574 0
7,574
2006 6,000–13,500 16,533 0
16,533 2007 6,000–13,500 16,487 0
16,487
2008 6,000–13,500 11,993 0
11,993 2009 6,000–13,500 18,439 256
18,183
2010 6,000–13,500 12,253 0
12,253 2011 6,000–13,500 12,036 2,116
9,920
2012 6,000–13,500 3,855 411
3,444 2013 6,000–13,500 12,910 1,753 253 10,904 2014 6,000–13,500 7,995 877 163 6,955 Previous 10-yr average 12,008 541 11,425
2015 6,000–13,500 6,416 0 126 6,290
80
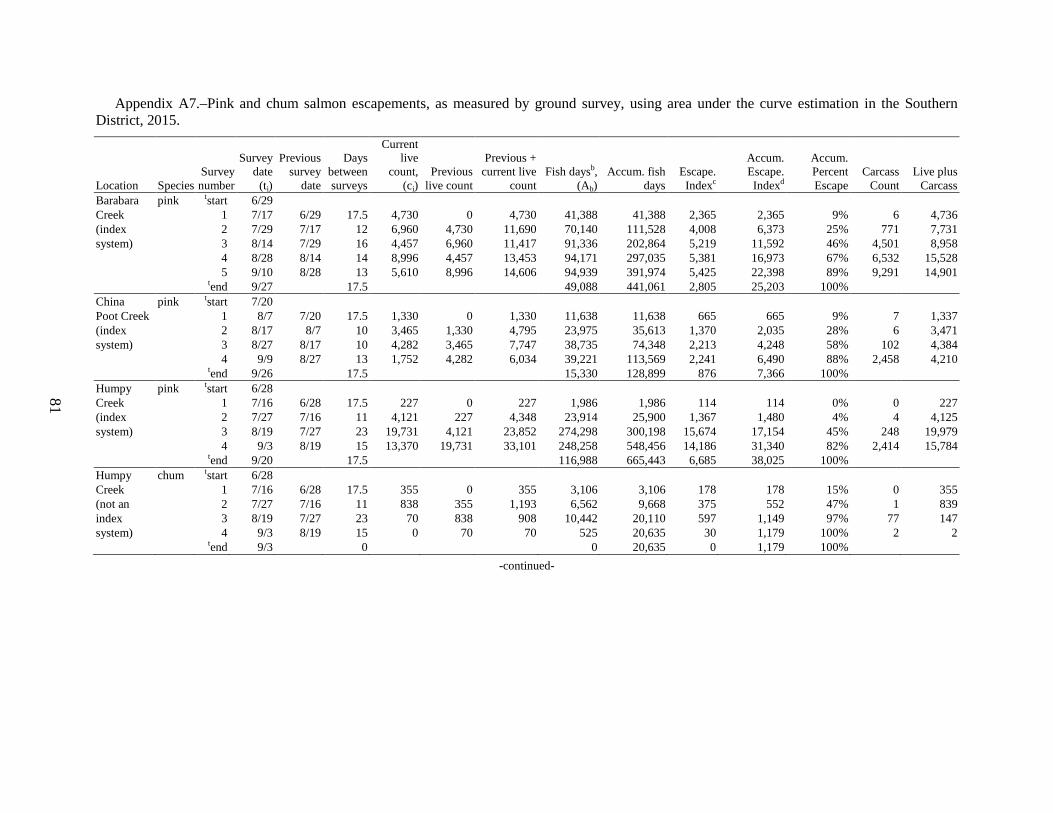
81
Appendix A7.–Pink and chum salmon escapements, as measured by ground survey, using area under the curve estimation in the Southern District, 2015.
Location Species Survey number
Survey date
(ti)
Previous survey
date
Days between surveys
Current live
count, (ci)
Previous live count
Previous + current live
count Fish daysb,
(Ab) Accum. fish
days Escape.
Indexc
Accum. Escape. Indexd
Accum. Percent Escape
Carcass Count
Live plus Carcass
Barabara pink tstart 6/29 Creek
1 7/17 6/29 17.5 4,730 0 4,730 41,388 41,388 2,365 2,365 9% 6 4,736
(index
2 7/29 7/17 12 6,960 4,730 11,690 70,140 111,528 4,008 6,373 25% 771 7,731 system)
3 8/14 7/29 16 4,457 6,960 11,417 91,336 202,864 5,219 11,592 46% 4,501 8,958
4 8/28 8/14 14 8,996 4,457 13,453 94,171 297,035 5,381 16,973 67% 6,532 15,528
5 9/10 8/28 13 5,610 8,996 14,606 94,939 391,974 5,425 22,398 89% 9,291 14,901
tend 9/27 17.5 49,088 441,061 2,805 25,203 100% China pink tstart 7/20
Poot Creek 1 8/7 7/20 17.5 1,330 0 1,330 11,638 11,638 665 665 9% 7 1,337 (index
2 8/17 8/7 10 3,465 1,330 4,795 23,975 35,613 1,370 2,035 28% 6 3,471
system)
3 8/27 8/17 10 4,282 3,465 7,747 38,735 74,348 2,213 4,248 58% 102 4,384
4 9/9 8/27 13 1,752 4,282 6,034 39,221 113,569 2,241 6,490 88% 2,458 4,210
tend 9/26 17.5 15,330 128,899 876 7,366 100% Humpy pink tstart 6/28
Creek
1 7/16 6/28 17.5 227 0 227 1,986 1,986 114 114 0% 0 227 (index
2 7/27 7/16 11 4,121 227 4,348 23,914 25,900 1,367 1,480 4% 4 4,125
system)
3 8/19 7/27 23 19,731 4,121 23,852 274,298 300,198 15,674 17,154 45% 248 19,979
4 9/3 8/19 15 13,370 19,731 33,101 248,258 548,456 14,186 31,340 82% 2,414 15,784
tend 9/20 17.5 116,988 665,443 6,685 38,025 100% Humpy chum tstart 6/28
Creek
1 7/16 6/28 17.5 355 0 355 3,106 3,106 178 178 15% 0 355 (not an
2 7/27 7/16 11 838 355 1,193 6,562 9,668 375 552 47% 1 839
index
3 8/19 7/27 23 70 838 908 10,442 20,110 597 1,149 97% 77 147 system)
4 9/3 8/19 15 0 70 70 525 20,635 30 1,179 100% 2 2
tend 9/3 0 0 20,635 0 1,179 100%
-continued-
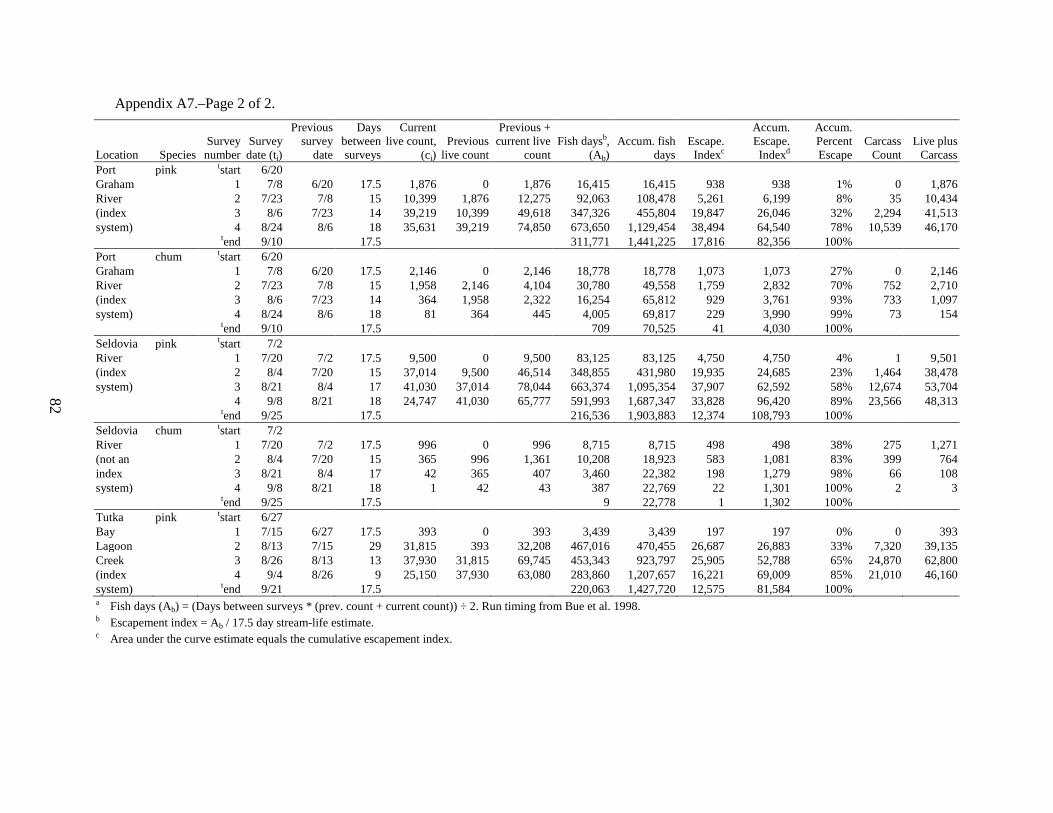
82
Appendix A7.–Page 2 of 2.
Location Species Survey number
Survey date (ti)
Previous survey
date
Days between surveys
Current live count,
(ci) Previous
live count
Previous + current live
count Fish daysb,
(Ab) Accum. fish
days Escape.
Indexc
Accum. Escape. Indexd
Accum. Percent Escape
Carcass Count
Live plus Carcass
Port pink tstart 6/20 Graham
1 7/8 6/20 17.5 1,876 0 1,876 16,415 16,415 938 938 1% 0 1,876
River
2 7/23 7/8 15 10,399 1,876 12,275 92,063 108,478 5,261 6,199 8% 35 10,434 (index
3 8/6 7/23 14 39,219 10,399 49,618 347,326 455,804 19,847 26,046 32% 2,294 41,513
system)
4 8/24 8/6 18 35,631 39,219 74,850 673,650 1,129,454 38,494 64,540 78% 10,539 46,170
tend 9/10 17.5 311,771 1,441,225 17,816 82,356 100%
Port chum tstart 6/20 Graham
1 7/8 6/20 17.5 2,146 0 2,146 18,778 18,778 1,073 1,073 27% 0 2,146
River
2 7/23 7/8 15 1,958 2,146 4,104 30,780 49,558 1,759 2,832 70% 752 2,710 (index
3 8/6 7/23 14 364 1,958 2,322 16,254 65,812 929 3,761 93% 733 1,097
system)
4 8/24 8/6 18 81 364 445 4,005 69,817 229 3,990 99% 73 154 tend 9/10 17.5 709 70,525 41 4,030 100% Seldovia pink tstart 7/2
River
1 7/20 7/2 17.5 9,500 0 9,500 83,125 83,125 4,750 4,750 4% 1 9,501 (index
2 8/4 7/20 15 37,014 9,500 46,514 348,855 431,980 19,935 24,685 23% 1,464 38,478
system)
3 8/21 8/4 17 41,030 37,014 78,044 663,374 1,095,354 37,907 62,592 58% 12,674 53,704
4 9/8 8/21 18 24,747 41,030 65,777 591,993 1,687,347 33,828 96,420 89% 23,566 48,313
tend 9/25 17.5 216,536 1,903,883 12,374 108,793 100% Seldovia chum tstart 7/2
River
1 7/20 7/2 17.5 996 0 996 8,715 8,715 498 498 38% 275 1,271 (not an
2 8/4 7/20 15 365 996 1,361 10,208 18,923 583 1,081 83% 399 764
index
3 8/21 8/4 17 42 365 407 3,460 22,382 198 1,279 98% 66 108 system)
4 9/8 8/21 18 1 42 43 387 22,769 22 1,301 100% 2 3
tend 9/25 17.5 9 22,778 1 1,302 100%
Tutka pink tstart 6/27 Bay
1 7/15 6/27 17.5 393 0 393 3,439 3,439 197 197 0% 0 393
Lagoon
2 8/13 7/15 29 31,815 393 32,208 467,016 470,455 26,687 26,883 33% 7,320 39,135 Creek
3 8/26 8/13 13 37,930 31,815 69,745 453,343 923,797 25,905 52,788 65% 24,870 62,800
(index
4 9/4 8/26 9 25,150 37,930 63,080 283,860 1,207,657 16,221 69,009 85% 21,010 46,160 system)
tend 9/21
17.5
220,063 1,427,720 12,575 81,584 100%
a Fish days (Ab) = (Days between surveys * (prev. count + current count)) ÷ 2. Run timing from Bue et al. 1998. b Escapement index = Ab / 17.5 day stream-life estimate. c Area under the curve estimate equals the cumulative escapement index.
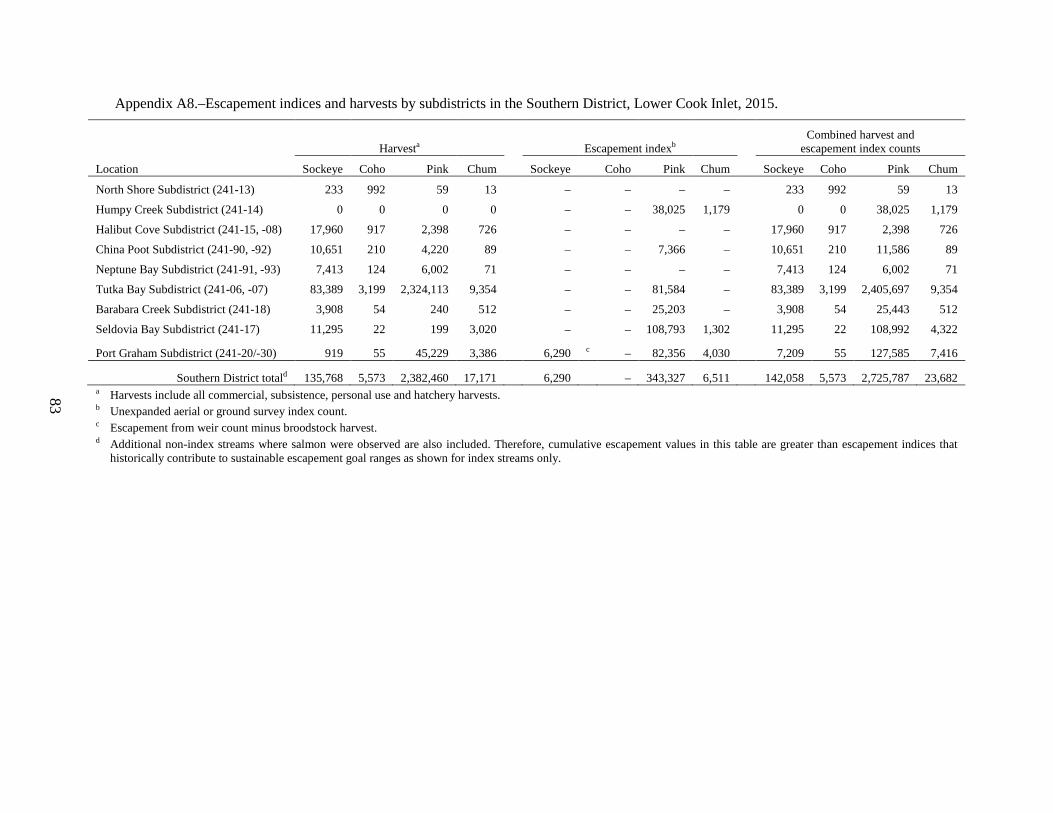
83
Appendix A8.–Escapement indices and harvests by subdistricts in the Southern District, Lower Cook Inlet, 2015.
Combined harvest and escapement index counts
Harvesta
Escapement indexb
Location Sockeye Coho Pink Chum
Sockeye
Coho Pink Chum
Sockeye Coho Pink Chum
North Shore Subdistrict (241-13) 233 992 59 13 – – – – 233 992 59 13
Humpy Creek Subdistrict (241-14) 0 0 0 0
–
– 38,025 1,179
0 0 38,025 1,179
Halibut Cove Subdistrict (241-15, -08) 17,960 917 2,398 726
–
– – –
17,960 917 2,398 726
China Poot Subdistrict (241-90, -92) 10,651 210 4,220 89
–
– 7,366 –
10,651 210 11,586 89
Neptune Bay Subdistrict (241-91, -93) 7,413 124 6,002 71
–
– – –
7,413 124 6,002 71
Tutka Bay Subdistrict (241-06, -07) 83,389 3,199 2,324,113 9,354
–
– 81,584 –
83,389 3,199 2,405,697 9,354
Barabara Creek Subdistrict (241-18) 3,908 54 240 512
–
– 25,203 –
3,908 54 25,443 512
Seldovia Bay Subdistrict (241-17) 11,295 22 199 3,020
–
– 108,793 1,302
11,295 22 108,992 4,322
Port Graham Subdistrict (241-20/-30) 919 55 45,229 3,386 6,290 c – 82,356 4,030 7,209 55 127,585 7,416
Southern District totald 135,768 5,573 2,382,460 17,171 6,290 – 343,327 6,511 142,058 5,573 2,725,787 23,682 a Harvests include all commercial, subsistence, personal use and hatchery harvests. b Unexpanded aerial or ground survey index count. c Escapement from weir count minus broodstock harvest. d Additional non-index streams where salmon were observed are also included. Therefore, cumulative escapement values in this table are greater than escapement indices that
historically contribute to sustainable escapement goal ranges as shown for index streams only.

Appendix A9.–Estimated pink and chum salmon escapements in thousands of fish for the major spawning systems in the Southern District of the Lower Cook Inlet Area, 1975–2015.
Pink salmon
Chum salmon
Humpy
Creek
China Poot
Creek
Tutka Lagoon
Creek Barabara
Creek Seldovia
River
Port Graham
River
Total pink salmon
escapement Port Graham
River 1975 64.0 21.6 17.6 22.7 36.2 27.3 189.4
3.0
1976 27.2 2.0 11.5 0.2 25.6 6.5 73.0
0.4 1977 86.0 3.9 14.0 5.7 35.7 20.6 165.9
5.2
1978 46.1 11.2 15.0 1.4 24.6 6.7 105.0
4.8 1979 200.0 20.6 10.6 10.0 43.7 32.7 317.6
2.2
1980 64.4 12.3 17.3 5.8 65.5 40.2 205.5
1.1 1981 115.0 5.0 21.1 16.8 62.7 18.4 239.0
4.8
1982 31.9 3.1 18.5 2.1 38.4 28.9 122.9
2.5 1983 104.0 14.1 12.9 14.8 27.9 4.6 178.3
1.9
1984 84.2 8.4 10.5 1.0 14.2 10.9 129.2
2.1 1985 117.0 1.9 14.0 1.6 22.8 26.3 183.6
0.5
1986 49.7 11.5 13.4 1.8 28.2 17.5 122.1
0.6 1987 26.6 3.1 4.8 0.3 7.6 3.8 46.2
1.5
1988 21.4 3.9 11.2 0.7 16.9 7.9 62.0
3.0 1989 93.0 8.5 11.9 4.5 26.2 19.1 163.2
1.3
1990 27.0 4.2 38.5 3.9 27.8 20.1 121.5
2.6 1991 17.4 2.6 16.8 10.9 30.0 29.0 106.7
1.1
1992 14.9 4.1 26.7 2.2 14.7 5.4 68.0
1.4 1993 36.0 1.6 27.4 11.9 43.4 12.8 133.1
2.5
1994 14.1 5.7 14.5 4.5 24.4 7.6 70.8
5.2 1995 89.3 2.0 15.9 10.8 48.5 10.0 176.5
3.8
1996 9.0 2.8 3.5 2.4 17.8 7.0 42.5
3.7 1997 78.3 2.8 45.0 12.5 39.1 12.5 190.2
4.1
1998 17.5 5.7 17.5 2.8 31.5 12.6 87.6
5.1 1999 12.8 0.7 27.9 3.9 12.2 9.7 67.2
6.6
2000 22.4 7.5 19.0 5.6 53.5 15.6 123.6
11.4 2001 30.5 6.6 4.5 2.3 12.3 10.3 66.5
6.0
2002 37.1 6.5 15.9 3.2 26.9 58.5 148.1
5.3 2003 90.9 6.7 30.9 5.1 35.1 14.9 183.6
2.9
2004 28.9 3.3 17.8 5.4 56.8 44.0 156.2
1.2 2005 93.8 9.2 133.6 14.4 98.6 69.1 418.7
0.7
2006 48.4 7.2 25.8 3.6 70.0 31.2 186.2
2.2 2007 54.0 6.2 5.7 25.2 69.4 25.6 186.1
1.9
2008 90.9 5.1 14.1 16.6 53.5 24.7 204.9
1.8 2009 5.2 1.1 3.8 2.6 14.6 14.0 41.3
1.0
2010 70.7 2.2 2.1 13.9 25.9 16.6 131.5
1.4 2011 1.7 3.5 22.0 8.2 46.2 20.9 102.4
1.8
2012 67.9 8.4 10.4 1.4 44.7 34.5 167.3
0.7 2013 6.7 7.1 9.5 17.4 36.8 11.9 89.5 1.9 2014 44.4 1.4 10.2 3.6 35.9 32.3 127.7 3.7 10-yr average 48.4 5.2 23.7 10.7 49.6 28.1 165.5 1.7
2015 38.0 7.4 81.6 25.2 108.8 82.4 343.3 4.0 Note: Area under the curve escapement indices are derived from periodic ground surveys with a 17.5 day stream-life factor
applied.
84

APPENDIX B: OUTER DISTRICT
85

86
Appendix B1.–Outer District commercial purse seine salmon harvest (excluding homepacks) by period, 2015. Permits
Fished Chinook Sockeye Coho Pink Chum
Period Date Hours Landings Number Pounds Number Pounds Number Pounds Number Pounds Number Pounds 1 a 7/13/2015 16 4 5
192 780
14 100
25,777 79,738
14,182 95,934
2 b 7/14/2015 16 3 a,c 7/15/2015 16 4 4
1 6
32,764 104,705
4,380 29,642
4 a,d 7/17/2015 16 d d
d d
d d
d d
d d
d d 5 a,c 7/20/2015 16 3 3
26,418 91,712
9,858 59,144
6 a,c,d 7/22/2015 16 d d
d d
d d
d d
d d
d d 7 a,c,d 7/24/2015 16 d d
d d
d d
d d
d d
d d
8 a,c 7/27/2015 16 5 8
143,410 443,096
270 1,462 9 a,c 7/29/2015 16 10 17
175,547 537,252
8,156 26,616
10 a,c,e 7/31/2015 16 12 15
4 21
159,649 594,450
20,088 140,512 11 a,c,e 8/3/2015 16 14 27
406 2,032
13 97
241,540 867,137
9,447 63,524
12 a,c,e 8/4/2015 16 14 20
144,704 450,214
2,378 16,666 13 a,c,e 8/5/2015 16 15 22
162,267 530,496
4,062 26,386
14 a,c,e,f 8/6/2015 16 15 24
289,277 899,184
171 1,031 15 a,c,e,f 8/7/2015 16 14 27
2 10
338,985 1,289,756
52 474
16 a,c,e,f 8/10/2015 16 11 15
3 10
268,444 842,578
817 4,904 17 a,c,e,f 8/11/2015 16 8 14
165,774 511,055
18 a,c,d,e 8/12/2015 16 11 18
5 25
5 32
282,714 821,584
104 810 19 a,c,e,f 8/13/2015 16 15 21
197,581 646,980
346 2,170
20 a,c,e,f,g 8/14/2015 16 10 13
243,018 743,752
6,507 45,528 21 a,c,e,f,g 8/15/2015 16 9 13
119,140 393,245
3,532 24,725
22 a,c,e,f,g 8/16/2015 16 12 25
4 38
161,468 520,468 23 a,c,e,f,g 8/17/2015 16 6 10
3 16
112,441 390,880
7 56
24 a,c,e,f,g 8/18/2015 16 7 7
105,393 330,773 25 a,c,e,f,g 8/19/2015 16 6 6
96,429 327,460
26 a,c,e,f,g 8/20/2015 16 9 19
132,374 443,485
1,204 6,652 27 a,c,e,f,g 8/21/2015 16 4 5
93,266 344,511
80 693
28 a,c,e,f,g 8/23/2015 16 3 4
2 11
82,813 230,851
1,878 13,146 29 a,c,e,f,g 8/24/2015 16 4 6
91,409 297,182
837 5,864
30 a,c,d,e,f,g 8/25/2015 16 d d
d d
d d
d d
d d
d d 31 a,c,d,e,f,g 8/26/2015 16 d d
d d
d d
d d
d d
d d
34 a,c,d,e,f,g,h 8/29/2015 16 d d
d d
d d
d d
d d
d d Total 19 348 0 0 613 2,890 41 288 3,892,602 12,732,544 88,356 565,939 Average weight NA 4.71 7.02 3.27 6.41
-continued-

87
Appendix B1.–Page 2 of 2.
Note: Unless otherwise noted, regular closed waters were in effect. a Portions of East Nuka Subdistrict, Dogfish Bay Subdistrict, Rocky Bay Subdistrict, and Port Dick Middle and Head End sections open to commercial harvest for 16-hour
periods. b Port Dick Middle Creek section and Head End section open to commercial harvest for a 16-hour period. c Waters of the Windy Bay Subdistrict open to commercial harvest for 16-hour period. d Confidential data. Fewer than 3 permits reporting. e Waters of Port Chatham Subdistrict and Port Dick Island Creek section open to commercial harvest for 16-hour periods. f Waters of the Port Dick Outer Section and waters near South Nuka Bay to commercial harvest for 16-hour periods. g Waters of the Outer District in the vicinity of Touglaalek Bay (aka One Haul Bay, Worthless Bay, Cockle Bay) open to commercial harvest for 16-hour periods. h No deliveries during 16-hour fishing periods from August 30 through September 19.

Appendix B2.–Total commercial common property salmon harvest (excluding homepacks) in Outer District 1970–2015. Year Fished Landings Chinook
Sockeye
Coho
Pink
Chum
1970
5
1,037
243
434,700
137,408 1971
0
1,625
174
310,706
118,995
1972
7
26,092
17
963
43,466 1973
1
2,006
31
195,342
76,286
1974
1
206
21
1,300
11,924 1975
0
124
7
159,908
11,348
1976
7
18,886
0
93
412 1977
34
33,733
78
1,129,250
70,167
1978
236
10,695
45
70,080
19,224 1979
30
25,297
135
1,945,536
180,558
1980
10
22,514
16
154,041
32,246 1981
61
18,133
485
1,714,115
238,393
1982
129
66,781
92
67,523
63,075 1983
14
16,835
54
199,794
27,203
1984
3
28,411
90
89,068
3,077 1985 34 632
19
91,957
3,210
618,222
11,844
1986 40 539
6
48,472
5,052
401,755
11,701 1987 32 396
14
31,845
2,481
23,890
28,663
1988 32 185
5
9,501
2
6,094
71,202 1989 10 66
1
10,286
72
52,677
43
1990 47 265
2
17,404
74
191,320
614 1991 35 255
2
6,408
12
359,664
14,337
1992 5 6
0
572
1
146
181 1993 21 143
2
4,613
119
159,159
970
1994 6 17
0
5,930
993
13,200
32 1995 13 78
12
17,642
1,272
192,098
474
1996 3 12
0
14,999
96
7,199
3 1997 9 27
0
6,255
63
128,373
1,575
1998 10 41
0
15,991
45
102,172
611 1999 8 29
3
51,117
1,482
32,484
2,062
2000 11 72
2
21,623
20
306,555
302 2001 5 23
0
7,339
5
48,559
408
2002 11 86
0
21,154
74
569,955
3,810 2003 6 21
1
26,615
4
281,663
137
2004 9 25
2
11,082
13
42,636
27,911 2005 5 20
0
1
3
110,195
12,524
2006 11 162
3
3,198
1,139
1,121,892
12,883 2007 5 31
1
32,461
113
147,409
49
2008 16 146
0
1,704
0
467,592
100,819 2009 11 150
1
8
9
853,037
35,126
2010 10 101
0
3,003
16
272,427
22,463 2011 13 106
10
46,356
25
357,472
25,763
2012 15 70
8
77
98
69,359
51,313 2013 11 229 1 119 53 2,015,105 49,062 2014 15 99 0 24,264 0 163,938 59,702 Previous 10-yr avg 11 111
2
11,119
146
557,843
36,970
2015 19 359 0 613 41 4,096,578 97,974 Source: ADF&G fish ticket database.
88

89
Appendix B3.–Pink and chum salmon escapements measured by aerial survey using area under the curve estimation in Outer District, 2015.
Location Species Survey number
Survey date (ti)
Previous survey
date (ti-1)
Days between surveys
(ti-ti-1)
Current live
count, (ci)
Previous live count
(ci-1)
Previous + current
live count (ci+ci-1)
Fish daysa, (Ab)
Accum. fish days, (Ab)
Escape. indexb
Accum. Escape.
Indexc
Accum. Percent Escape.
Peak count
Delight Lake pink tstart 6/24 (not an index
1 6/24 6/24 0 0 0 0 0 0 0 0 0%
system)
2 7/8 6/24 14 0 0 0 0 0 0 0 0%
3 7/14 7/8 6 0 0 0 0 0 0 0 0%
4 7/25 7/14 11 0 0 0 0 0 0 0 0%
5 7/29 7/25 4 1,210 0 1,210 2,420 2,420 138 138 3%
6 8/4 7/29 6 1,430 1,210 2,640 7,920 10,340 453 591 15%
7 8/12 8/4 8 5,000 1,430 6,430 25,720 36,060 1,470 2,061 51%
8 8/25 8/12 13 100 5,000 5,100 33,150 69,210 1,894 3,955 99%
tend 9/11 17.5 875 70,085 50 4,005 100% 5,000
Desire Lake pink tstart 6/24 (index
1 6/24 6/24 0 0 0 0 0 0 0 0 0%
system)
2 7/8 6/24 14 0 0 0 0 0 0 0 0%
3 7/14 7/8 6 0 0 0 0 0 0 0 0%
4 7/25 7/14 11 400 0 400 2,200 2,200 126 126 0%
5 7/29 7/25 4 0 400 400 800 3,000 46 171 0%
6 8/4 7/29 6 13,000 0 13,000 39,000 42,000 2,229 2,400 5%
7 8/12 8/4 8 29,210 13,000 42,210 168,840 210,840 9,648 12,048 26%
8 8/25 8/12 13 26,500 29,210 55,710 362,115 572,955 20,692 32,740 71%
tend 9/11 17.5 231,875 804,830 13,250 46,290 100% 29,210
Dogfish Lagoon chum tstart 6/20 Creeks
1 7/8 6/20 17.5 4,160 0 4,160 36,400 36,400 2,080 2,080 13%
(index
2 7/14 7/8 6 6,170 4,160 10,330 30,990 67,390 1,771 3,851 24% system)
3 7/25 7/14 11 12,330 6,170 18,500 101,750 169,140 5,814 9,665 59%
4 7/29 7/25 4 17,510 12,330 29,840 59,680 228,820 3,410 13,075 80%
5 8/4 7/29 6 330 17,510 17,840 53,520 282,340 3,058 16,134 99%
6 8/12 8/4 8 350 330 680 2,720 285,060 155 16,289 100%
7 8/18 8/12 6 0 350 350 1,050 286,110 60 16,349 100%
8 8/25 8/18 7 0 0 0 0 286,110 0 16,349 100%
tend 8/25
0
0 286,110 0 16,349 100% 17,510
-continued-
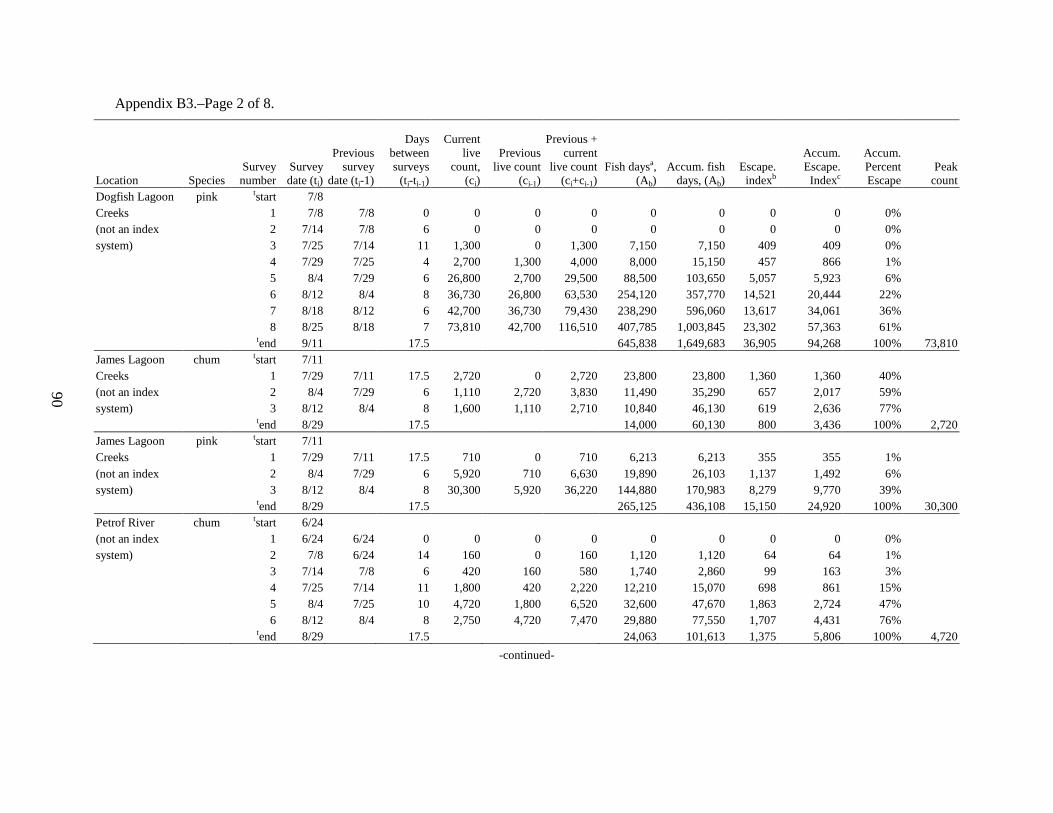
Appendix B3.–Page 2 of 8.
Location Species Survey number
Survey date (ti)
Previous survey
date (ti-1)
Days between surveys
(ti-ti-1)
Current live
count, (ci)
Previous live count
(ci-1)
Previous + current
live count (ci+ci-1)
Fish daysa, (Ab)
Accum. fish days, (Ab)
Escape. indexb
Accum. Escape.
Indexc
Accum. Percent Escape
Peak count
Dogfish Lagoon pink tstart 7/8 Creeks
1 7/8 7/8 0 0 0 0 0 0 0 0 0%
(not an index
2 7/14 7/8 6 0 0 0 0 0 0 0 0% system)
3 7/25 7/14 11 1,300 0 1,300 7,150 7,150 409 409 0%
4 7/29 7/25 4 2,700 1,300 4,000 8,000 15,150 457 866 1%
5 8/4 7/29 6 26,800 2,700 29,500 88,500 103,650 5,057 5,923 6%
6 8/12 8/4 8 36,730 26,800 63,530 254,120 357,770 14,521 20,444 22%
7 8/18 8/12 6 42,700 36,730 79,430 238,290 596,060 13,617 34,061 36%
8 8/25 8/18 7 73,810 42,700 116,510 407,785 1,003,845 23,302 57,363 61%
tend 9/11 17.5 645,838 1,649,683 36,905 94,268 100% 73,810
James Lagoon chum tstart 7/11 Creeks
1 7/29 7/11 17.5 2,720 0 2,720 23,800 23,800 1,360 1,360 40%
(not an index
2 8/4 7/29 6 1,110 2,720 3,830 11,490 35,290 657 2,017 59% system)
3 8/12 8/4 8 1,600 1,110 2,710 10,840 46,130 619 2,636 77%
tend 8/29 17.5 14,000 60,130 800 3,436 100% 2,720 James Lagoon pink tstart 7/11
Creeks
1 7/29 7/11 17.5 710 0 710 6,213 6,213 355 355 1% (not an index
2 8/4 7/29 6 5,920 710 6,630 19,890 26,103 1,137 1,492 6%
system)
3 8/12 8/4 8 30,300 5,920 36,220 144,880 170,983 8,279 9,770 39%
tend 8/29 17.5 265,125 436,108 15,150 24,920 100% 30,300
Petrof River chum tstart 6/24 (not an index
1 6/24 6/24 0 0 0 0 0 0 0 0 0%
system)
2 7/8 6/24 14 160 0 160 1,120 1,120 64 64 1%
3 7/14 7/8 6 420 160 580 1,740 2,860 99 163 3%
4 7/25 7/14 11 1,800 420 2,220 12,210 15,070 698 861 15%
5 8/4 7/25 10 4,720 1,800 6,520 32,600 47,670 1,863 2,724 47%
6 8/12 8/4 8 2,750 4,720 7,470 29,880 77,550 1,707 4,431 76%
tend 8/29 17.5 24,063 101,613 1,375 5,806 100% 4,720
-continued-
90

Appendix B3.–Page 3 of 8.
Location Species Survey number
Survey date (ti)
Previous survey
date (ti-1)
Days between surveys
(ti-ti-1)
Current live
count, (ci)
Previous live count
(ci-1)
Previous + current
live count (ci+ci-1)
Fish daysa, (Ab)
Accum. fish days, (Ab)
Escape. indexb
Accum. Escape.
Indexc
Accum. Percent Escape.
Peak count
Petrof River pink tstart 6/24 (not an index
1 6/24 6/24 0 0 0 0 0 0 0 0 0%
system)
2 7/8 6/24 14 0 0 0 0 0 0 0 0%
3 7/14 7/8 6 0 0 0 0 0 0 0 0%
4 7/25 7/14 11 0 0 0 0 0 0 0 0%
5 8/4 7/25 10 7,000 0 7,000 35,000 35,000 2,000 2,000 29%
6 8/12 8/4 8 4,610 7,000 11,610 46,440 81,440 2,654 4,654 67%
tend 8/29 17.5 40,338 121,778 2,305 6,959 100% 7,000
Port Chatham pink tstart 7/8 (index
1 7/8 7/8 0 0 0 0 0 0 0 0 0%
system)
2 7/25 7/8 17 3,300 0 3,300 28,050 28,050 1,603 1,603 6%
3 7/29 7/25 4 4,110 3,300 7,410 14,820 42,870 847 2,450 9%
4 8/4 7/29 6 2,000 4,110 6,110 18,330 61,200 1,047 3,497 13%
5 8/12 8/4 8 9,800 2,000 11,800 47,200 108,400 2,697 6,194 23%
6 8/25 8/12 13 19,000 9,800 28,800 187,200 295,600 10,697 16,891 64%
tend 9/11 17.5 166,250 461,850 9,500 26,391 100% 19,000
Port Dick- chum tstart 6/20 Headend Creek
1 7/8 6/20 17.5 1,300 0 1,300 11,375 11,375 650 650 10%
(index
2 7/14 7/8 6 4,230 1,300 5,530 16,590 27,965 948 1,598 26% system)
3 7/25 7/14 11 3,500 4,230 7,730 42,515 70,480 2,429 4,027 64%
4 7/29 7/25 4 2,600 3,500 6,100 12,200 82,680 697 4,725 76%
5 8/4 7/29 6 1,300 2,600 3,900 11,700 94,380 669 5,393 86%
6 8/25 8/4 21 70 1,300 1,370 14,385 108,765 822 6,215 99%
tend 9/11 17.5 613 109,378 35 6,250 100% 4,230
-continued-
91

Appendix B3.–Page 4 of 8.
Location Species Survey number
Survey date (ti)
Previous survey
date (ti-1)
Days between surveys
(ti-ti-1)
Current live
count, (ci)
Previous live count
(ci-1)
Previous + current
live count (ci+ci-1)
Fish daysa, (Ab)
Accum. fish days, (Ab)
Escape. indexb
Accum. Escape.
Indexc
Accum. Percent Escap.
Peak count
Port Dick- pink tstart 7/8 Headend Creek
1 7/8 7/8 0 0 0 0 0 0 0 0 0%
(index
2 7/14 7/8 6 5,200 0 5,200 15,600 15,600 891 891 3% system)
3 7/25 7/14 11 8,240 5,200 13,440 73,920 89,520 4,224 5,115 15%
4 7/29 7/25 4 9,170 8,240 17,410 34,820 124,340 1,990 7,105 21%
5 8/4 7/29 6 10,100 9,170 19,270 57,810 182,150 3,303 10,409 31%
6 8/25 8/4 21 15,500 10,100 25,600 268,800 450,950 15,360 25,769 77%
tend 9/11
17.5
135,625 586,575 7,750 33,519 100% 10,100
Port Dick- chum tstart 6/24 Island creek
1 6/24 6/24 0 0 0 0 0 0 0 0 0%
(index
2 7/8 6/24 14 100 0 100 700 700 40 40 1% system)
3 7/14 7/8 6 80 100 180 540 1,240 31 71 2%
4 7/25 7/14 11 3,620 80 3,700 20,350 21,590 1,163 1,234 27%
5 7/29 7/25 4 2,420 3,620 6,040 12,080 33,670 690 1,924 42%
6 8/4 7/29 6 2,100 2,420 4,520 13,560 47,230 775 2,699 59%
7 8/12 8/4 8 200 2,100 2,300 9,200 56,430 526 3,225 70%
8 8/25 8/12 13 1,500 200 1,700 11,050 67,480 631 3,856 84%
tend 9/11
17.5
13,125 80,605 750 4,606 100% 3,620
Port Dick- pink tstart 6/24 Island creek
1 6/24 6/24 0 0 0 0 0 0 0 0 0%
(index
2 7/8 6/24 14 0 0 0 0 0 0 0 0% system)
3 7/14 7/8 6 0 0 0 0 0 0 0 0%
4 7/25 7/14 11 0 0 0 0 0 0 0 0%
5 7/29 7/25 4 510 0 510 1,020 1,020 58 58 1%
6 8/4 7/29 6 3,000 510 3,510 10,530 11,550 602 660 6%
7 8/12 8/4 8 8,300 3,000 11,300 45,200 56,750 2,583 3,243 30%
8 8/25 8/12 13 5,300 8,300 13,600 88,400 145,150 5,051 8,294 76%
tend 9/11 17.5 46,375 191,525 2,650 10,944 100% 8,300
-continued-
92

Appendix B3.–Page 5 of 8.
Location Species Survey number
Survey date (ti)
Previous survey
date (ti-1)
Days between surveys
(ti-ti-1)
Current live
count, (ci)
Previous live count
(ci-1)
Previous + current
live count (ci+ci-1)
Fish daysa, (Ab)
Accum. fish days, (Ab)
Escape. indexb
Accum. Escape.
Indexc
Accum. Percent Escape.
Peak count
Port Dick- chum tstart 6/20 Middle Creek
1 7/8 6/20 17.5 130 0 130 1,138 1,138 65 65 15%
(not an index
2 7/14 7/8 6 110 130 240 720 1,858 41 106 25% system)
3 7/25 7/14 11 50 110 160 880 2,738 50 156 37%
4 7/29 7/25 4 300 50 350 700 3,438 40 196 47%
5 8/4 7/29 6 130 300 430 1,290 4,728 74 270 64%
6 8/12 8/4 8 200 130 330 1,320 6,048 75 346 82%
7 8/25 8/12 13 0 200 200 1,300 7,348 74 420 100%
tend 8/25 0 0 7,348 0 420 100% 300 Port Dick- pink tstart 7/8
Middle Creek
1 7/8 7/8 0 0 0 0 0 0 0 0 0% (not an index
2 7/14 7/8 6 1,400 0 1,400 4,200 4,200 240 240 8%
system)
3 7/25 7/14 11 320 1,400 1,720 9,460 13,660 541 781 28%
4 7/29 7/25 4 250 320 570 1,140 14,800 65 846 30%
5 8/4 7/29 6 0 250 250 750 15,550 43 889 31%
6 8/12 8/4 8 1,200 0 1,200 4,800 20,350 274 1,163 41%
7 8/25 8/12 13 1,400 1,200 2,600 16,900 37,250 966 2,129 75%
tend 9/11 17.5 12,250 49,500 700 2,829 100% 1,400
Port Dick- chum tstart 6/24 Slide Creek
1 6/24 6/24 0 0 0 0 0 0 0 0 0%
(not an index
2 7/8 6/24 14 90 0 90 630 630 36 36 4% system)
3 7/14 7/8 6 480 90 570 1,710 2,340 98 134 15%
4 7/25 7/14 11 450 480 930 5,115 7,455 292 426 48%
5 7/29 7/25 4 100 450 550 1,100 8,555 63 489 55%
6 8/4 7/29 6 520 100 620 1,860 10,415 106 595 67%
7 8/12 8/4 8 300 520 820 3,280 13,695 187 783 88%
8 8/25 8/12 13 0 300 300 1,950 15,645 111 894 100%
tend 8/25 0 0 15,645 0 894 100% 520
-continued-
93

Appendix B3.–Page 6 of 8.
Location Species Survey number
Survey date (ti)
Previous survey
date (ti-1)
Days between surveys
(ti-ti-1)
Current live
count, (ci)
Previous live count
(ci-1)
Previous + current
live count (ci+ci-1)
Fish daysa, (Ab)
Accum. fish days, (Ab)
Escape. indexb
Accum. Escape.
Indexc
Accum. Percent Escape.
Peak count
Port Dick- pink tstart 6/24 Slide Creek
1 6/24 6/24 0 0 0 0 0 0 0 0 0%
(not an index
2 7/8 6/24 14 0 0 0 0 0 0 0 0% system)
3 7/14 7/8 6 120 0 120 360 360 21 21 0%
4 7/25 7/14 11 0 120 120 660 1,020 38 58 1%
5 7/29 7/25 4 320 0 320 640 1,660 37 95 2%
6 8/4 7/29 6 1,700 320 2,020 6,060 7,720 346 441 8%
7 8/12 8/4 8 1,200 1,700 2,900 11,600 19,320 663 1,104 19%
8 8/25 8/12 13 4,900 1,200 6,100 39,650 58,970 2,266 3,370 58%
tend 9/11 17.5 42,875 101,845 2,450 5,820 100% 4,900
Rocky River chum tstart 6/20 (index
1 7/8 6/20 17.5 520 0 520 4,550 4,550 260 260 8%
system)
2 7/14 7/8 6 1,860 520 2,380 7,140 11,690 408 668 21%
3 7/25 7/14 11 2,400 1,860 4,260 23,430 35,120 1,339 2,007 64%
4 7/29 7/25 4 1,600 2,400 4,000 8,000 43,120 457 2,464 79%
5 8/4 7/29 6 1,000 1,600 2,600 7,800 50,920 446 2,910 93%
6 8/12 8/4 8 0 1,000 1,000 4,000 54,920 229 3,138 100%
7 8/18 8/12 6 0 0 0 0 54,920 0 3,138 100%
8 8/25 8/18 7 0 0 0 0 54,920 0 3,138 100%
tend 8/25 0 0 54,920 0 3,138 100% 2,400
Rocky River pink tstart 7/8 (index
1 7/8 7/8 0 0 0 0 0 0 0 0 0%
system)
2 7/14 7/8 6 3,200 0 3,200 9,600 9,600 549 549 1%
3 7/25 7/14 11 32,100 3,200 35,300 194,150 203,750 11,094 11,643 11%
4 7/29 7/25 4 23,830 32,100 55,930 111,860 315,610 6,392 18,035 17%
5 8/4 7/29 6 27,400 23,830 51,230 153,690 469,300 8,782 26,817 25%
6 8/12 8/4 8 39,000 27,400 66,400 265,600 734,900 15,177 41,994 39%
7 8/18 8/12 6 52,100 39,000 91,100 273,300 1,008,200 15,617 57,611 53%
8 8/25 8/18 7 57,000 52,100 109,100 381,850 1,390,050 21,820 79,431 74%
tend 9/11 17.5 498,750 1,888,800 28,500 107,931 100% 57,000
-continued-
94

Appendix B3.–Page 7 of 8.
Location Species Survey number
Survey date (ti)
Previous survey
date (ti-1)
Days between surveys
(ti-ti-1)
Current live
count, (ci)
Previous live count
(ci-1)
Previous + current
live count (ci+ci-1)
Fish daysa, (Ab)
Accum. fish days, (Ab)
Escape. indexb
Accum. Escape.
Indexc
Accum. Percent Escape.
Peak count
South Nuka pink tstart 7/11 Island Creek
1 7/29 7/11 17.5 310 0 310 2,713 2,713 155 155 3%
(index
2 8/4 7/29 6 700 310 1,010 3,030 5,743 173 328 7% system)
3 8/12 8/4 8 6,400 700 7,100 28,400 34,143 1,623 1,951 43%
4 8/18 8/12 6 100 6,400 6,500 19,500 53,643 1,114 3,065 67%
5 8/25 8/18 7 2,150 100 2,250 7,875 61,518 450 3,515 77%
tend 9/11 17.5 18,813 80,330 1,075 4,590 100% 8,900d Taylor Bay pink tstart 7/17
Creek
1 8/4 7/17 17.5 4,100 0 4,100 35,875 35,875 2,050 2,050 28% (not an index
2 8/12 8/4 8 6,000 4,100 10,100 40,400 76,275 2,309 4,359 59%
system)
tend 8/29 17.5 52,500 128,775 3,000 7,359 100% 6,000 Windy Bay- pink tstart 7/8
Left Creek
1 7/8 7/8 0 0 0 0 0 0 0 0 0% (index
2 7/14 7/8 6 1,920 0 1,920 5,760 5,760 329 329 1%
system)
3 7/25 7/14 11 10,620 1,920 12,540 68,970 74,730 3,941 4,270 13%
4 7/29 7/25 4 23,420 10,620 34,040 68,080 142,810 3,890 8,161 24%
5 8/4 7/29 6 9,600 23,420 33,020 99,060 241,870 5,661 13,821 41%
6 8/12 8/4 8 15,300 9,600 24,900 99,600 341,470 5,691 19,513 58%
7 8/25 8/12 13 9,690 15,300 24,990 162,435 503,905 9,282 28,795 86%
tend 9/11 17.5 84,788 588,693 4,845 33,640 100% 23,420
Windy Bay- pink tstart 7/8 Right Creek
1 7/8 7/8 0 0 0 0 0 0 0 0 0%
(index
2 7/14 7/8 6 3,340 0 3,340 10,020 10,020 573 573 3% system)
3 7/25 7/14 11 3,630 3,340 6,970 38,335 48,355 2,191 2,763 16%
4 7/29 7/25 4 4,200 3,630 7,830 15,660 64,015 895 3,658 22%
5 8/4 7/29 6 2,900 4,200 7,100 21,300 85,315 1,217 4,875 29%
6 8/12 8/4 8 11,900 2,900 14,800 59,200 144,515 3,383 8,258 49%
7 8/25 8/12 13 4,970 11,900 16,870 109,655 254,170 6,266 14,524 85%
tend 9/11 17.5 43,488 297,658 2,485 17,009 100% 11,900 -continued-
95

Appendix B3.–Page 8 of 8.
Location Species Survey number
Survey date (ti)
Previous survey
date (ti-1)
Days between surveys
(ti-ti-1)
Current live
count, (ci)
Previous live count
(ci-1)
Previous + current
live count (ci+ci-1)
Fish daysa, (Ab)
Accum. fish days, (Ab)
Escape. indexb
Accum. Escape.
Indexc
Accum. Percent Escape.
Peak count
Windy Bay- chum tstart 6/20 Right Creek
1 7/8 6/20 17.5 102 0 102 893 893 51 51 10%
(not an index
2 7/14 7/8 6 0 102 102 306 1,199 17 68 13% system)
3 8/4 7/14 21 400 0 400 4,200 5,399 240 308 61%
tend 8/21 17.5 3,500 8,899 200 508 100% 400 Note: Final counts include fish observed in bays if no further harvest occurred. Run timing from Bue et al. 1998. a Fish days (Ab) = (Days between surveys * (prev. count + current count)) ÷ 2 b Escapement index = Ab / 17.5 day stream-life estimate. c Area under the curve estimate equals the cumulative escapement index. d Includes 2,500 fish observed in bay counts on August 12.
96

Appendix B4.–Pink and chum salmon escapements measured by ground survey using area under the curve estimation in Outer District, 2015.
Location Species Survey number
Survey date (ti)
Previous survey
date (ti-1)
Days between surveys
(ti-ti-1)
Current live count,
(ci)
Previous live count
(ci-1)
Previous + current
live count (ci+ci-1)
Fish daysa, (Ab)
Accum. fish days,
(Ab) Escape.
indexb
Accum. Escape.
Indexc
Accum. Percent Escape.
Carcass Count
Live plus
Carcass Dogfish Lagoon chum tstart 6/26
Creeks
1 7/14 6/26 17.5 1,651 0 1,651 14,446 14,446 826 826 6% 13 1,664 (Index
2 7/28 7/14 14 5,985 1,651 7,636 53,452 67,898 3,054 3,880 29% 980 6,965
system)
3 8/20 7/28 23 4,752 5,985 10,737 123,476 191,374 7,056 10,936 82% 6,070 10,822
tend 9/6 17.5 41,580 232,954 2,376 13,312 100%
Dogfish Lagoon pink tstart 6/26 Creeks
1 7/14 6/26 17.5 394 0 394 3,448 3,448 197 197 0% 0 394
(not an
2 7/28 7/14 14 12,303 394 12,697 88,879 92,327 5,079 5,276 11% 980 13,283 index system)
3 8/20 7/28 23 31,714 12,303 44,017 506,196 598,522 28,925 34,201 68% 7,080 38,794
tend 9/6 17.5 277,498 876,020 15,857 50,058 100% Port Chatham chum tstart 7/12
Creeks
1 7/30 7/12 17.5 394 0 394 3,448 3,448 197 197 43% 111 505 (not an
2 8/11 7/30 12 154 394 548 3,288 6,736 188 385 83% 307 461
index system)
tend 8/28 17.5 1,348 8,083 77 462 100% Port Chatham pink tstart 7/12
Creeks
1 7/30 7/12 17.5 11,773 0 11,773 103,014 103,014 5,887 5,887 14% 485 12,258 (Index
2 8/11 7/30 12 36,804 11,773 48,577 291,462 394,476 16,655 22,541 55% 5,809 42,613
system)
tend 8/28 17.5 322,035 716,511 18,402 40,943 100% Port Dick- chum tstart 6/21
Headend Creek
1 7/9 6/21 17.5 3,632 0 3,632 31,780 31,780 1,816 1,816 14% 2 3,634 (Index
2 7/21 7/9 12 7,584 3,632 11,216 67,296 99,076 3,845 5,661 43% 851 8,435
system)
3 8/5 7/21 15 2,696 7,584 10,280 77,100 176,176 4,406 10,067 76% 5,363 8,059
4 9/15 8/5 41 3 2,696 2,699 55,330 231,506 3,162 13,229 100% 120 123
tend 10/2 17.5 26 231,532 2 13,230 100% Port Dick- pink tstart 6/21
Headend Creek
1 7/9 6/21 17.5 195 0 195 1,706 1,706 98 98 0% 0 195 (Index
2 7/21 7/9 12 7,818 195 8,013 48,078 49,784 2,747 2,845 3% 7 7,825
system)
3 8/5 7/21 15 35,942 7,818 43,760 328,200 377,984 18,754 21,599 22% 28 35,970
4 9/15 8/5 41 20,521 35,942 56,463 1,157,492 1,535,476 66,142 87,741 90% 8,950 29,471
tend 10/2 17.5 179,559 1,715,035 10,261 98,002 100% -continued-
97

Appendix B4.–Page 2 of 2.
Location Species Survey number
Survey date (ti)
Previous survey
date (ti-1)
Days between surveys
(ti-ti-1)
Current live count,
(ci)
Previous live count
(ci-1)
Previous + current
live count (ci+ci-1)
Fish daysa, (Ab)
Accum. fish days,
(Ab) Escape.
indexb
Accum. Escape.
Indexc
Accum. Percent Escape.
Carcass Count
Live plus
Carcass Port Dick- chum tstart 7/6 Island Creek 1 7/24 7/6 17.5 3,902 0 3,902 34,143 34,143 1,951 1,951 11% 5 3,907 (Index system) 2 7/31 7/24 7 6,674 3,902 10,576 37,016 71,159 2,115 4,066 22% 152 6,826
3 8/12 7/31 12 9,810 6,674 16,484 98,904 170,063 5,652 9,718 53% 1,929 11,739 4 9/2 8/12 21 2,692 9,810 12,502 131,271 301,334 7,501 17,219 93% 3,862 6,554 5 9/15 9/2 13 298 2,692 2,990 19,435 320,769 1,111 18,330 99% 2,930 3,228
tend 10/2 17.5 2,608 323,376 149 18,479 100% Port Dick- pink tstart 7/6 Island Creek 1 7/24 7/6 17.5 465 0 465 4,069 4,069 233 233 0% 0 465 (Index 2 7/31 7/24 7 1,611 465 2,076 7,266 11,335 415 648 1% 4 1,615 system) 3 8/12 7/31 12 20,773 1,611 22,384 134,304 145,639 7,675 8,322 17% 47 20,820
4 9/2 8/12 21 21,083 20,773 41,856 439,488 585,127 25,114 33,436 66% 980 22,063 5 9/15 9/2 13 10,466 21,083 31,549 205,069 790,195 11,718 45,154 90% 5,510 15,976
tend 10/2 17.5 91,578 881,773 5,233 50,387 100% Port Dick- chum tstart 6/21 Slide Creek 1 7/9 6/21 17.5 251 0 251 2,196 2,196 126 126 2% 0 251 (not an 2 7/21 7/9 12 1,939 251 2,190 13,140 15,336 751 876 15% 36 1,975 index system) 3 8/5 7/21 15 4,661 1,939 6,600 49,500 64,836 2,829 3,705 61% 787 5,448
tend 8/22 17.5 40,784 105,620 2,331 6,035 100% Port Dick- pink tstart 7/9 Slide Creek 1 7/9 7/9 0 0 0 0 0 0 0 0 0% 0 0 (not an 2 7/21 7/9 12 76 0 76 456 456 26 26 3% 0 76 index system) 3 8/5 7/21 15 885 76 961 7,208 7,664 412 438 50% 8 893
tend 8/22 17.5 7,744 15,407 443 880 100% Note: Final counts include fish observed in bays if no further harvest occurred. Run timing from Bue et al. 1998. a Fish days (Ab) = (Days between surveys * (prev. count + current count)) ÷ 2 b Escapement index = Ab / 17.5 day stream-life estimate. c Area under the curve estimate equals the cumulative escapement index.
98

Appendix B5.–Sockeye salmon aerial survey counts from the Outer District, 2015.
Survey Survey Live Peak Location number date count count Delusion Lake 1 07/01/15 100
2 07/11/15 100 100
Desire Lake 1 06/24/15 0
2 07/08/15 650
3 07/14/15 1,850
4 07/25/15 250
5 07/29/15 0
6 08/04/15 900
7 08/12/15 2,830 8 08/25/15 1,739 2,830
Delight Lake 1 06/24/15 0
2 07/08/15 2,890
3 07/14/15 1,720
4 07/25/15 190
5 07/29/15 2
6 08/04/15 25
7 08/12/15 3,220
8 08/25/15 170 3,220
99

Appendix B6.–Escapement indices and harvests by subdistricts in the Outer District, Lower Cook Inlet, 2015.
Combined harvest and Harvestb Escapement indexc escapement index counts
Location Sockeye Coho Pink Chum Sockeye Pink Chum Sockeye Coho Pink Chum Dogfish Bay Subdistrict (232-01) 0 144,863 33,526 50,058 13,312 0 194,921 46,838 Port Chatham Subdist. (232-02) 4 243,356 523 42,613 505 4 285,969 1,028 Chugach Bay Subdistrict (232-03) 0 0 0 Windy Bay Subdistrict (232-04) 412 20 2,799,182 12,630 50,649 508 412 20 2,849,831 13,138 Rocky Bay Subdistrict (232-05) 33 3 200,646 999 107,931 3,138 33 3 308,577 4,137 Outer Port Dick Subdist. (232-06) 25 11,944 2,878 25 11,944 2,878 Pt. Dick Headend Sect. (232-11) 134 11 34,133 21,211 98,002 13,230 134 11 132,135 34,441 Pt. Dick Mid. Ck. Sect. (232-12) 32,939 10,662 2,829 420 0 35,768 11,082 Pt. Dick Island Ck. Sect. (232-13) 2 115,706 13,620 50,387 18,479 0 2 166,093 32,099 Taylor Bay Subdistrict (232-08) 27,000 7,359 0 34,359 0
Port Dick area subtotal 192 422,368 49,370 158,577 32,129 192 36 580,945 81,499 E. Side Gore Pt. Subdist. (232-10) Nuka Island Subdistrict (232-15) 5 5 486,629 986 23,610 5,806 5 5 510,239 6,792 East Nuka Subdistrict (232-23) 6,150 81,290 3,436 6,150 81,290 3,436
Outer District totala 613 41 4,096,398 97,035 6,150 514,728 58,834 6,763 41 4,611,126 155,869 a Harvests include all commercial and subsistence harvests. b Unexpanded aerial or ground survey index count, or weir count. Also includes non-index streams. c Additional non-index streams where salmon were observed are also included. Therefore, cumulative escapement values in this table are greater than escapement indices that
historically contribute to SEG ranges as shown for index streams only.
100

Appendix B7.–Estimated pink, chum, and sockeye salmon escapements in thousands of fish for the major spawning systems in the Outer District of the Lower Cook Inlet Area, 1975–2015.
Pink salmon
Year Dogfish Lagoon
Port Chatham
Windy Right Creek
Windy Left
Creek Rocky River
Port Dick
Creek Island Creek
South Nuka Creek
Desire Lake
Creek James
Lagoona
Total index count
1975 2.3 7.7 18.7 9.7 4.4 62.8 0.1 28.0 0.4
134.1 1976
0.2 0.2 2.7 12.7
0.6
16.4
1977 8.1 14.2 11.1 47.3 36.7 109.3 0.6 12.0 0.8
240.1 1978 0.6 0.3 0.3 1.1 8.2 44.9 0.4
1.0
56.8
1979 7.3 20.8 10.4 74.8 85.0 116.0 0.6 15.0 3.0
332.9 1980 0.3 7.7 3.3 10.9 6.4 56.1 2.2 0.3 16.0 4.6 103.2 1981 2.6 11.2 4.7 31.3 25.0 106.0 25.0 16.0 5.0 14 226.8 1982 2.6 2.0 4.7 4.4 6.6 19.9 15.0 0.4 12.0 6 67.6 1983 1.0 3.5 4.3 11.9 16.6 64.1 15.3 8.5 5.1 125.2 1984 0.6 7.8 3.4 2.5 9.0 44.6 35.0 0.6 23.0 4 126.5 1985 0.2 8.9 5.4 8.9 12.1 65.3 27.9 3.6 62.5 9 194.8 1986 0.4 11.5 2.5 2.2 12.0 41.6 16.6 7.0 32.0 6.6 125.8 1987 1.2 10.2 2.0 5.6 4.5 4.5 0.1 2.8 11.0 1.1 41.9 1988 0.3 21.0 1.3 3.4 5.4 12.0 7.2 1.2 2.5 1.7 54.3 1989 0.2 31.7 6.6 25.2 10.3 55.4 6.7 7.3 47.0 4.9 190.4 1990 7.1 27.8 7.1 7.5 18.0 41.7 25.0 13.3 1.0 3.8 148.5 1991 9.3 23.8 20.7 34.5 26.1 54.2 24.4 16.4 1.3 4.4 210.7 1992
4.3 3.9 8.2 25.4 6.9 12.5 6.1 0.4 0.4 67.7
1993 0.3 22.2 13.6 25.9 70.0 37.0 12.1 34.3 19.3 3.3 234.7 1994 1.3 3.3 2.2 3.0 17.1 18.1 28.3 1.4
0.8 74.7
1995 13.3 14.0 11.4 31.6 56.3 6.6 10.6 6.2
0.6 150.0 1996 2.3 8.6 9.9 2.5 80.1 23.2 40.1 6.8
173.5
1997 20.0 42.7 13.9 64.6 48.1 36.9 71.1 9.3 6.2
312.8 1998 6.7 22.2 19.5 12.9 165.0 59.1 83.6 14.0 6.2
389.2
1999 12.4 10.7 5.2 24.0 17.2 8.5 8.6 2.4 6.8
95.8 2000 11.1 16.7 23.0 20.1 131.6 124.4 70.8 13.6 21.1 3.9 432.4 2001 2.0 17.9 10.3 61.8 73.0 44.7 81.8 20.7 67.5 2.3 379.7 2002 1.3 18.1 14.4 28.9 112.5 108.0 44.1 14.8 78.4 3.1 420.5 2003 5.2 35.0 23.3 82.8 287.4 107.7 118.6 41.4 34.8
736.2
2004 3.2 26.4 12.0 23.3 53.8 13.3 33.6 6.4 24.3
196.3 2005 22.3 44.4 22.2 72.0 198.7 122.2 26.4 11.2 46.0
565.4
2006 8.0 24.2 17.1 65.2 67.8 51.5 107.7 5.1 74.8
421.4 2007 4.1 14.5 18.3 37.3 190.0 44.2 87.2 6.6 11.8
414.0
2008 8.0 16.4 12.5 64.1 90.9 34.2 49.7 12.3 9.5
297.6 2009 9.2 25.3 15.0 57.3 173.6 41.7 44.5 19.9 73.9
460.4
2010 6.3 3.0 6.4 24.2 27.0 41.1 69.5
3.0
180.6 2011 3.9 15.8 1.7 12.2 22.7 16.9 10.2 0.6 0.3 84.0 2012 11.4 5.4 5.8 11.7 15.7 18.1 20.1 0.5 2.2 0.0 90.8 2013 26.4 57.4 11.7 47.8 75.8 55.8 26.0 8.4 56.9 24.4 366.4 2014 8.8 10.3 5.7 10.1 17.1 48.7 50.4 11.0 0.4 1.0 162.7 10-yr avg 10.9 21.7 11.7 40.2 87.9 47.4 49.2 9.4 27.9 6.4 306.2
2015 50.1 42.6 17.0 33.6 107.9 98.0 50.4 8.9 46.3 30.3 454.8 -continued-
101

Appendix B7.–Page 2 of 2. Chum salmon
Sockeye salmon
Year Dogfish Lagoon
Rocky River
Port Dick Creek
Island Creek
Total index count
Delusion Lake a
Delight Lake
Desire Lake
Total index count
1975 5.0 25.0 4.0 7.4 41.4
2.0
6.5 8.5 1976 3.0 12.0 1.5 1.0 17.5
6.0
11.0 17.0
1977 6.4 11.0 5.0 11.0 33.0
5.2
10.7 15.9 1978 9.3 6.3 8.9 17.0 41.4
8.0
10.0 18.0
1979 8.2 35.0 4.0 17.0 64.0
8.0
12.0 20.0 1980 4.0 23.0 4.2 11.0 42.1
10.0
17.0 27.0
1981 12 13.0 4.1 18.0 45.6
7.3
12.0 19.3 1982 8.5 2.8 1.7 8.7 21.7
25.0
18.0 43.0
1983 5.3 4.0 4.5 36.0 50.0
7.0
12.0 19.0 1984 8.6 3.5 2.7 26.0 40.4
10.5
15.0 25.5
1985 4.9 2.5 1.0 9.1 17.5
26.0
18.0 44.0 1986 2.5 2.0 1.7 8.6 14.8
13.0
10.0 23.0
1987 2.0 0.2 6.1 13.0 21.5
10.5
13.4 23.9 1988 8.6 0.3 9.0 7.8 25.7
1.2
9.0 10.2
1989 1.8 1.2 3.3 4.8 11.1
7.7
9.0 16.7 1990 1.0 0.8 1.1 2.3 5.2
5.2
9.5 14.7
1991 3.1
7.4 17.0 27.8
4.1
8.2 12.3 1992 0.8 1.7 5.4 6.7 14.6
5.9
11.9 17.8
1993 5.4 0.1 2.5 3.6 11.6
5.6
11.0 16.6 1994 11.0 1.9 3.5 8.8 25.5
5.6
10.5 16.1
1995 4.2 5.1 3.3 7.7 20.3
15.8
15.8 31.6 1996 6.7 2.0 2.3 6.9 17.9
7.7
9.4 17.1
1997 13.0 1.1 1.9 5.2 20.9
27.8 b 14.7 42.5 1998 9.8 0.7 1.8 3.4 15.7
9.2 b 7.9 17.1
1999 19.0 5.4 2.9 16.0 43.5
17.0
14.6 31.6 2000 20 4.2 3.4 12.0 39.3
12.3
4.0 16.3
2001 6.1 3.0 1.8 6.3 17.2
2.8 10.1
5.5 15.6 2002 10.0 5.7 12.0 15.0 43.4
3.6 19.6 c 16.0 35.6
2003 13.0 5.5 5.6 16.0 40.7
2.0 7.5 c 8.4 15.9 2004 3.6 17.0 8.6 15.0 44.5
1.0 7.3 c 10.7 18.0
2005 2.7 6.1 4.8 21.0 34.3
1.1 15.2 c 4.8 20.0 2006 5.4 11.0 2.8 5.6 25.0
1.0 10.9 c 18.6 29.5
2007 4.9 1.6 2.8 3.1 12.4
2.1 44.0 c 10.0 54.0 2008 6.2 3.8 12.0 13.0 34.7
1.8 23.9 c 10.7 34.6
2009 4.4 2.5 5.6 9.3 21.8
1.3 12.7 c 16.0 28.7 2010 12.7 1.3 2.4 3.4 19.8
0.6 23.8 c 6.3 30.1
2011 12.9 4.5 7.1 11.8 36.3
1.8 20.2 c 9.6 29.8 2012 8.8 3.1 8.4 14.9 35.2
10.9 c 8.8 19.7
2013 9.3 8.1 4.1 8.8 30.4 1.7 6.0 c 8.4 14.4 2014 11.2 6.9 1.8 2.7 22.6 0.0 22.3 c 11.5 33.8 Previous 10-yr avg
7.9 4.9 5.2 9.3 27.2
1.3 19.0
10.5 29.5
2015 13.3 3.1 13.2 18.5 48.2 0.1 3.2 c 2.8 6.1 a Non-index stream. b Escapement derived from weir counts. c Escapement derived from a combination of weir, video counts, and/or aerial counts.
102

APPENDIX C: EASTERN DISTRICT
103

104
Appendix C1.–Eastern District common property commercial purse seine salmon harvest (excluding homepacks) by period, 2015.
Permits Chinook Sockeye Coho Pink Chum Period Date Hours Fished Landings Number Pounds Number Pounds Number Pounds Number Pounds Number Pounds
1a 7/2 16 a a
a a
a a
a a
a a
a a
2 7/6 16 3 3
1,170 4,751
27 97
8 58
3a 7/7 16 a a
a a
a a
a a
a a
a a
4a 7/8 16 a a
a a
a a
a a
a a
a a
6a,b 7/10 16 a a
a a
a a
a a
a a
a a Total 3 8 0 0 4,633 18,573 0 0 155 578 115 847 Average weight NA 4.01 NA 3.73 7.37 a Confidential data. Fewer than 3 permits reporting. b No further deliveries were reported from this district for the remainder of the 2015 commercial salmon season.
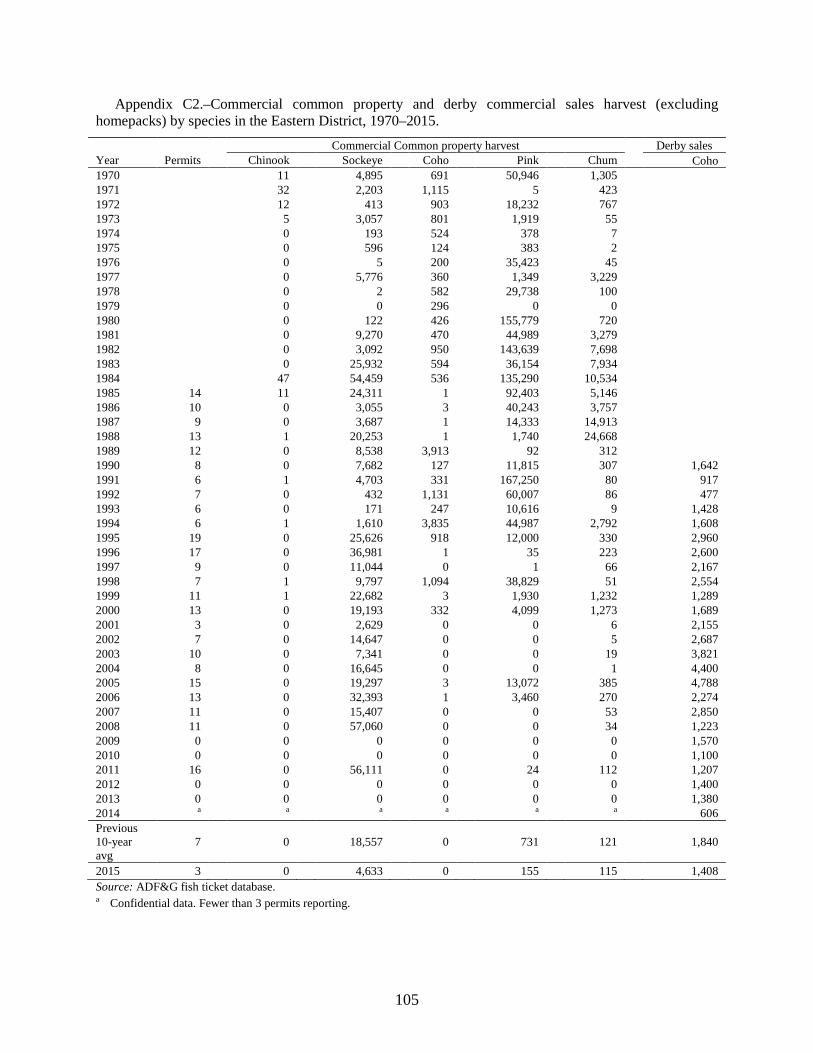
Appendix C2.–Commercial common property and derby commercial sales harvest (excluding homepacks) by species in the Eastern District, 1970–2015. Commercial Common property harvest Derby sales Year Permits Chinook Sockeye Coho Pink Chum Coho 1970 11 4,895 691 50,946 1,305 1971 32 2,203 1,115 5 423 1972 12 413 903 18,232 767 1973 5 3,057 801 1,919 55 1974 0 193 524 378 7 1975 0 596 124 383 2 1976 0 5 200 35,423 45 1977 0 5,776 360 1,349 3,229 1978 0 2 582 29,738 100 1979 0 0 296 0 0 1980 0 122 426 155,779 720 1981 0 9,270 470 44,989 3,279 1982 0 3,092 950 143,639 7,698 1983 0 25,932 594 36,154 7,934 1984 47 54,459 536 135,290 10,534 1985 14 11 24,311 1 92,403 5,146 1986 10 0 3,055 3 40,243 3,757 1987 9 0 3,687 1 14,333 14,913 1988 13 1 20,253 1 1,740 24,668 1989 12 0 8,538 3,913 92 312 1990 8 0 7,682 127 11,815 307 1,642 1991 6 1 4,703 331 167,250 80 917 1992 7 0 432 1,131 60,007 86 477 1993 6 0 171 247 10,616 9 1,428 1994 6 1 1,610 3,835 44,987 2,792 1,608 1995 19 0 25,626 918 12,000 330 2,960 1996 17 0 36,981 1 35 223 2,600 1997 9 0 11,044 0 1 66 2,167 1998 7 1 9,797 1,094 38,829 51 2,554 1999 11 1 22,682 3 1,930 1,232 1,289 2000 13 0 19,193 332 4,099 1,273 1,689 2001 3 0 2,629 0 0 6 2,155 2002 7 0 14,647 0 0 5 2,687 2003 10 0 7,341 0 0 19 3,821 2004 8 0 16,645 0 0 1 4,400 2005 15 0 19,297 3 13,072 385 4,788 2006 13 0 32,393 1 3,460 270 2,274 2007 11 0 15,407 0 0 53 2,850 2008 11 0 57,060 0 0 34 1,223 2009 0 0 0 0 0 0 1,570 2010 0 0 0 0 0 0 1,100 2011 16 0 56,111 0 24 112 1,207 2012 0 0 0 0 0 0 1,400 2013 0 0 0 0 0 0 1,380 2014 a a a a a a 606 Previous 10-year avg
7
0 18,557 0 731 121 1,840
2015 3 0 4,633 0 155 115 1,408 Source: ADF&G fish ticket database. a Confidential data. Fewer than 3 permits reporting.
105

Appendix C3.–Anticipated daily and cumulative sockeye salmon escapement versus actual escapement through the Bear Creek weir, 2015. Actual Anticipated Actual
Escapement to
SEG plus CIAA brood goal a
Actual weir
Actual weir Total sockeye at
Bear Lake
Antic.
Minimum
Maximum
donationsb
cost recovery Bear Creek weir
Date Daily Total percent Daily Total Daily Total Daily Total Daily Total Daily Total 5/17 0 0 0.0% 0 0 0 0
0 0
5/18 0 0
0.0%
0 0
0 0
0 0 5/19 1 1
0.0%
0 0
0 0
1 1
5/20 0 1
0.0%
0 0
0 0
0 1 5/21 0 1
0.0%
0 0
0 0
0 1
5/22 28 29
0.0%
0 0
0 0
28 29 5/23 57 86
0.0%
0 0
0 0
57 86
5/24 35 121
0.0%
0 0
0 0
35 121 5/25 41 162
0.0%
0 0
0 0
41 162
5/26 55 217
0.0%
2 2
4 4
55 217 5/27 54 271
0.1%
2 3
4 8
54 271
5/28 79 350
0.1%
0 4
1 8
79 350 5/29 185 535
0.1%
2 6
4 13
185 535
5/30 211 746
0.2%
9 15
20 33
211 746 5/31 162 908
0.3%
3 18
7 40
162 908
6/1 245 1,153
0.4%
10 28
21 61
245 1,153 6/2 356 1,509
0.8%
21 49
45 107
356 1,509
6/3 461 1,970
0.8%
3 52
7 113
461 1,970 6/4 606 2,576
1.1%
18 70
40 154
606 2,576
6/5 707 3,283
1.4%
19 89
41 195
707 3,283 6/6 453 3,736
1.7%
21 110
46 241
453 3,736
6/7 571 4,307
2.2%
30 140
66 307
571 4,307 6/8 702 5,009
2.6%
23 162
50 356
702 5,009
6/9 1,329 6,338
3.3%
46 209
101 457
1,329 6,338 6/10 1,712 8,050
3.9%
41 249
89 547
1,712 8,050
6/11 952 9,002
4.7%
51 301
112 659
0 952 9,002 6/12 794 9,796
5.5%
50 350
109 768
382 382 1,176 10,178
6/13 717 10,513
6.4%
56 406
123 891
870 1,252 1,587 11,765 6/14 791 11,304
7.6%
76 482
167 1,058
1,118 2,370 1,909 13,674
6/15 191 11,495
9.2%
102 584
223 1,281
1,315 3,685 1,506 15,180 6/16 211 11,706
10.9%
109 693
240 1,520
1,873 5,558 2,084 17,264
6/17 158 11,864
13.3%
154 847
338 1,858
1,854 7,412 2,012 19,276 6/18 213 12,077
15.4%
132 979
290 2,148
2,170 9,582 2,383 21,659
6/19 213 12,290
17.4%
132 1,111
289 2,437
1,131 10,713 1,344 23,003 6/20 163 12,453
20.4%
188 1,299
413 2,849
2,101 12,814 2,264 25,267
6/21 126 12,579
22.9%
158 1,457
347 3,196
3,381 16,195 3,507 28,774 6/22 199 12,778
25.6%
175 1,632
384 3,580
599 16,794 798 29,572
6/23 0 12,778
28.5%
186 1,819
408 3,988
1,431 18,225 1,431 31,003 6/24 0 12,778
31.4%
181 2,000
398 4,386
1,047 19,272 1,047 32,050
6/25 0 12,778
34.1%
174 2,174
382 4,768
903 20,175 903 32,953 6/26 0 12,778
36.2%
131 2,305
287 5,054
3,530 23,705 3,530 36,483
6/27 0 12,778
39.1%
186 2,490
407 5,461
582 24,287 582 37,065 6/28 0 12,778
41.9% 178 2,668
390 5,851
1,361 25,648 1,361 38,426
6/29 0 12,778
45.2%
213 2,881
467 6,318
528 26,176 528 38,954 6/30 0 12,778
49.1%
245 3,126
537 6,855
691 26,867 691 39,645
-continued-
106

Appendix C3.–Page 2 of 2. Actual Anticipated Actual
Escapement to
SEG plus CIAA brood goal a
Actual weir
Actual weir Total sockeye at
Bear Lake
Antic.
Minimum
Maximum
donationsb
cost recovery Bear Creek weir
Date Daily Total percent Daily Total Daily Total Daily Total Daily Total Daily Total 7/1 0 12,778
53.2%
261 3,387
572 7,428
690 27,557 690 40,335
7/2 0 12,778
57.6%
281 3,668
616 8,044
20 20
896 28,453 916 41,251 7/3 0 12,778
61.8%
267 3,935
585 8,629
26 46
1,107 29,560 1,133 42,384
7/4 0 12,778
65.3%
226 4,160
495 9,124
46
31,119 0 42,384 7/5 0 12,778
68.6%
212 4,372
465 9,589
46
1,559 31,831 1,559 43,943
7/6 0 12,778
71.0%
148 4,520
325 9,914
46
712 32,524 712 44,655 7/7 0 12,778
74.0%
192 4,712
421 10,335
7 53
693 33,013 700 45,355
7/8 0 12,778
77.2%
207 4,919
453 10,788
53
489 33,294 489 45,844 7/9 0 12,778
80.1%
184 5,103
404 11,192
53
281 33,987 281 46,125
7/10 0 12,778
83.3%
201 5,304
441 11,633
53
693 35,059 693 46,818 7/11 0 12,778
85.5%
139 5,443
304 11,937
19 72
1,072 35,293 1,091 47,909
7/12 0 12,778
86.8%
83 5,527
183 12,120
72
234 35,759 234 48,143 7/13 0 12,778
88.2%
93 5,619
204 12,324
72
466 35,759 466 48,609
7/14 0 12,778
89.3%
69 5,688
152 12,475
206 278
35,759 206 48,815 7/15 0 12,778
89.9%
39 5,727
85 12,560
360 638
35,759 360 49,175
7/16 0 12,778
90.7%
50 5,777
110 12,670
366 1,004
35,759 366 49,541 7/17 0 12,778
91.3%
41 5,818
89 12,759
182 1,186
35,759 182 49,723
7/18 0 12,778
92.8%
92 5,910
202 12,961
30 1,216
35,759 30 49,753 7/19 0 12,778
93.7%
56 5,966
123 13,084
1,216
35,759 0 49,753
7/20 0 12,778
94.8%
71 6,037
156 13,240
1,216
35,759 0 49,753 7/21 0 12,778
95.4%
37 6,074
82 13,322
1,216
35,759 0 49,753
7/22 541 13,319
95.8%
28 6,103
61 13,383
1,216
35,759 541 50,294 7/23 111 13,430
96.3%
34 6,137
75 13,458
59 1,275
35,759 170 50,464
7/24 75 13,505
96.6%
18 6,155
40 13,499
111 1,386
35,759 186 50,650 7/25 0 13,505
97.1%
28 6,183
62 13,560
42 1,428
35,759 42 50,692
7/26 0 13,505
97.5%
25 6,208
56 13,616
65 1,493
35,759 65 50,757 7/27 0 13,505
97.7%
17 6,225
36 13,652
54 1,547
35,759 54 50,811
7/28 0 13,505
97.9%
13 6,238
29 13,681
1,547
35,759 0 50,811 7/29 0 13,505
98.4%
29 6,267
63 13,744
173 1,720
35,759 173 50,984
7/30 0 13,505 98.6% 17 6,284 37 13,781 27 1,747 35,759 27 51,011 7/31 0 13,505 98.8% 9 6,292 19 13,800 113 1,860 35,759 113 51,124 8/1 0 13,505 0.0% 0 6,292 0 13,800 88 1,948 35,759 88 51,212 8/2 0 13,505 0.0% 0 6,292 0 13,800 1,948 35,759 0 51,212 8/3 0 13,505 0.0% 0 6,292 0 13,800 66 2,014 35,759 66 51,278 8/4 0 13,505c 0.0% 0 6,292 0 13,800 48 2,062 35,759 48 51,326 Note: Bear Creek sustainable escapement goal is 700–8,300 sockeye salmon. CIAA broodstock goal is 5,670 for a desired inriver
run of 6,370–13,970 fish. a Projected daily goal based on expected run timing applied to minimum and maximum cumulative goals at the end of the run. b Weir harvest is cost recovery and donations of excess fish above daily SEG plus broodstock needs. c A total of 3,945 sockeye salmon were beach seined from the lake for use as broodstock..
107

Appendix C4.–Sockeye salmon passage past Bear Creek weir versus minimum and maximum inriver
goals, 2015. Note: A total of 51,326 sockeye salmon returned to the Bear Creek weir in 2015. Of those, 13,505 were passed through the weir into Bear Lake. An additional 37,821 were harvested at the weir for cost recovery or donated to the public. A total of 3,945 were harvested from Bear Lake for use as hatchery broodstock. Total estimated natural spawning escapement is estimated at 9,560 fish. Inriver goal is the sustainable escapement goal range (700–8,300) added to the CIAA hatchery broodstock goal (5,670) for this species.
108

Appendix C5.–Coho salmon escapement through the Bear Creek weir, 2015.
Escapement to
Broodstock
Weir
Cumulative coho
Bear Lake
Antic.
harvesta
donations
at Bear Creek weir
Date Daily Total percent Daily Total Daily Total Daily Total 9/10 0 0
2.8%
0 0
0 0
0 0
9/11 12 12
3.8%
0 0
0 0
12 12 9/12 24 36
4.1%
0 0
0 0
24 36
9/13 35 71
5.0%
0 0
0 0
35 71 9/14 18 89
6.6%
0 0
0 0
18 89
9/15 2 91
7.4%
0 0
0 0
2 91 9/16 1 92
9.1%
0 0
0 0
1 92
9/17 3 95
12.1%
0 0
0 0
3 95 9/18 15 110
14.3%
0 0
0 0
15 110
9/19 23 133
16.4%
0 0
0 0
23 133 9/20 20 153
18.3%
0 0
0 0
20 153
9/21 0 153
19.4%
0 0
0 0
0 153 9/22 0 153
20.8%
13 13
0 0
13 166
9/23 3 156
22.1%
33 46
0 0
36 202 9/24 2 158
25.2%
16 62
0 0
18 220
9/25 4 162
27.9%
4 66
0 0
8 228 9/26 3 165
30.3%
17 83
0 0
20 248
9/27 4 169
33.4%
8 91
0 0
12 260 9/28 3 172
35.8%
22 113
0 0
25 285
9/29 0 172
40.1%
118 231
0 0
118 403 9/30 0 172
43.1%
42 273
81 81
123 526
10/1 1 173
47.2%
1 274
67 148
69 595 10/2 0 173
52.8%
26 300
17 165
43 638
10/3 0 173
57.3%
20 320
128 293
148 786 10/4 0 173
62.6%
22 342
135 428
157 943
10/5 0 173
66.7%
5 347
78 506
83 1,026 10/6 0 173
72.3%
10 357
73 579
83 1,109
10/7 0 173
75.0%
67 424
106 685
173 1,282 10/8 0 173
76.9%
73 497
88 773
161 1,443
10/9 0 173
80.6%
72 569
83 856
155 1,598 10/10 0 173
83.7%
33 602
69 925
102 1,700
10/11 6 179
86.4%
22 624
49 974
77 1,777 10/12 7 186
90.2%
28 652
13 987
48 1,825
10/13 1 187
91.0%
12 664
21 1,008
34 1,859 10/14 0 187
91.9%
15 679
5 1,013
20 1,879
10/15 1 188
93.3%
32 711
0 1,013
33 1,912 10/16 1 189
94.9%
30 741
0 1,013
31 1,943
10/17 0 189
95.7%
12 753
0 1,013
12 1,955 10/18 1 190
96.1%
17 770
0 1,013
18 1,973
10/19 2 192
96.4%
4 774
0 1,013
6 1,979 10/20 69 261 96.6% -69b 705 0 1,013 0 1,979 a A total of 486 fish were harvested for broodstock by CIAA, and 210 were used by ADF&G as broodstock for educational
programs. b A total of 69 coho salmon were removed from the raceways on October 20 and released into Bear Lake.
109

Appendix C6.–Coho salmon passage past the Bear Creek weir, 2015.
110
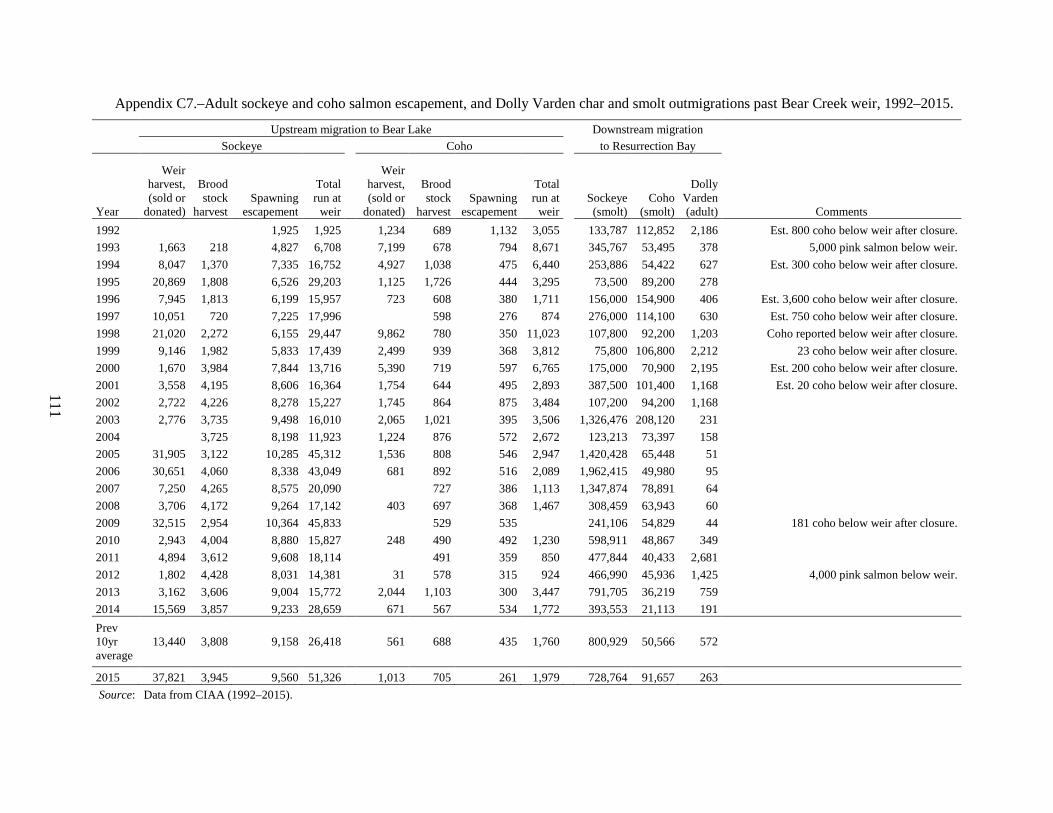
111
Appendix C7.–Adult sockeye and coho salmon escapement, and Dolly Varden char and smolt outmigrations past Bear Creek weir, 1992–2015.
Upstream migration to Bear Lake
Downstream migration
Sockeye Coho
to Resurrection Bay
Year
Weir harvest, (sold or
donated)
Brood stock
harvest Spawning
escapement
Total run at
weir
Weir harvest, (sold or
donated)
Brood stock
harvest Spawning
escapement
Total run at
weir
Sockeye (smolt)
Coho (smolt)
Dolly Varden (adult) Comments
1992 1,925 1,925
1,234 689 1,132 3,055
133,787 112,852 2,186 Est. 800 coho below weir after closure. 1993 1,663 218 4,827 6,708
7,199 678 794 8,671
345,767 53,495 378 5,000 pink salmon below weir.
1994 8,047 1,370 7,335 16,752
4,927 1,038 475 6,440
253,886 54,422 627 Est. 300 coho below weir after closure. 1995 20,869 1,808 6,526 29,203
1,125 1,726 444 3,295
73,500 89,200 278
1996 7,945 1,813 6,199 15,957
723 608 380 1,711
156,000 154,900 406 Est. 3,600 coho below weir after closure. 1997 10,051 720 7,225 17,996
598 276 874
276,000 114,100 630 Est. 750 coho below weir after closure.
1998 21,020 2,272 6,155 29,447
9,862 780 350 11,023
107,800 92,200 1,203 Coho reported below weir after closure. 1999 9,146 1,982 5,833 17,439
2,499 939 368 3,812
75,800 106,800 2,212 23 coho below weir after closure.
2000 1,670 3,984 7,844 13,716
5,390 719 597 6,765
175,000 70,900 2,195 Est. 200 coho below weir after closure. 2001 3,558 4,195 8,606 16,364
1,754 644 495 2,893
387,500 101,400 1,168 Est. 20 coho below weir after closure.
2002 2,722 4,226 8,278 15,227
1,745 864 875 3,484
107,200 94,200 1,168 2003 2,776 3,735 9,498 16,010
2,065 1,021 395 3,506
1,326,476 208,120 231
2004
3,725 8,198 11,923
1,224 876 572 2,672
123,213 73,397 158 2005 31,905 3,122 10,285 45,312
1,536 808 546 2,947
1,420,428 65,448 51
2006 30,651 4,060 8,338 43,049
681 892 516 2,089
1,962,415 49,980 95 2007 7,250 4,265 8,575 20,090
727 386 1,113
1,347,874 78,891 64
2008 3,706 4,172 9,264 17,142
403 697 368 1,467
308,459 63,943 60 2009 32,515 2,954 10,364 45,833
529 535
241,106 54,829 44 181 coho below weir after closure.
2010 2,943 4,004 8,880 15,827
248 490 492 1,230
598,911 48,867 349 2011 4,894 3,612 9,608 18,114
491 359 850
477,844 40,433 2,681
2012 1,802 4,428 8,031 14,381
31 578 315 924
466,990 45,936 1,425 4,000 pink salmon below weir. 2013 3,162 3,606 9,004 15,772
2,044 1,103 300 3,447
791,705 36,219 759
2014 15,569 3,857 9,233 28,659 671 567 534 1,772 393,553 21,113 191 Prev 10yr average
13,440 3,808 9,158 26,418 561 688 435 1,760
800,929 50,566 572
2015 37,821 3,945 9,560 51,326
1,013 705 261 1,979
728,764 91,657 263 Source: Data from CIAA (1992–2015).

Appendix C8.–Sockeye salmon aerial survey counts from the Eastern District, 2015.
Survey number
Survey date
Live count
Peak count Location
Aialik Lake and creek 1 7/8/15 70
2 8/4/15 561
3 8/12/15 3,182 3,182
112

113
Appendix C9.–Pink and chum salmon escapements using area under the curve estimation in the Eastern District, 2015.
Location Species Survey number
Survey date (ti)
Previous survey
date (ti-1)
Days between surveys
(ti-ti-1)
Current live
count, (ci)
Previous live count
(ci-1)
Previous + current
live count (ci+ci-1)
Fish daysa,
(Ab) Accum. fish
days, (Ab) Escape.
indexb
Accum. escape. indexc
Accum. percent escape.
Peak count
Aialik Lake pink tstart 7/8
1 7/8 7/8 0 0 0 0 0 0 0 0 0%
2 8/4 7/8 27 800 0 800 10,800 10,800 617 617 77%
3 8/12 8/4 8 0 800 800 3,200 14,000 183 800 100%
tend 8/12 0 0 14,000 0 800 100% 800 Note: Final counts include fish observed in bays if no further harvest occurred. Run timing from Bue et al. 1998. a Fish days (Ab) = (Days between surveys * (prev. count + current count)) ÷ 2 b Escapement index = Ab / 17.5 day stream-life estimate. c Area under the curve estimate equals the cumulative escapement index.

114
Appendix C10.–Escapement indices and harvests by subdistrict in the Eastern District of Lower Cook Inlet, 2015.
Combined harvest and escapement index counts
Harvesta
Escapement indexb
Location Sockeye Coho Pink Chum
Sockeye Coho Pink
Chum
Sockeye Coho Pink Chum
Aialik Bay Subdistrict (231-05) 3,182 800 3,182 800
Harding Entrance Subdistrict (231-10) Outer Resurrection Bay Subdist. (231-25)
Resurrection Bay Subdistrict (231-30) 99,471 3,127 155 115
9,560 261
109,031 3,388 155 115
Humpy Cove Subdistrict (231-40) Day Harbor Subdistrict (231-60)
Eastern District total 99,471 3,127 155 115 12,742 261 800 0 112,213 3,388 955 115 a Harvests include all commercial, sport derby, and hatchery harvests. b Unexpanded aerial or ground survey index counts or weir counts.

Appendix C11.–Estimated sockeye and pink salmon escapements in thousands of fish for the major spawning systems in the Eastern District of the Lower Cook Inlet Area, 1975–2015. Pink salmon Sockeye salmon
Year Aialik
Lagoon Bear
Creek Salmon
Creek Tonsina
Creek Thumb
Cove Humpy
Cove Total
Aialik Lake
Bear Lake a,b Total
1975
8.0 0 8.0 1976 0.4 10.0 16.9 5.7 2.0 1.4 36.4
8.0 0.6 8.6
1977
5.0 0 5.0 1978
7.8 11.0 1.5 2.0 0.9 23.2
3.0 0 3.0
1979
5.0 0 5.0 1980
13.3 15.5 0.7 1.2 5.7 36.4
6.6 1.5 8.1
1981
0.4 0.1 0.2 1.0 0.4 2.1
1.8 0.7 2.5 1982 5.0 7.9 21.0 7.5 7.9 4.0 53.3
22.4 0.5 22.9
1983 3.0 0.8 0.5 5.4 4.9 2.0 16.6
20.0 0.7 20.7 1984 4.0 7.7 10.2 6.0 4.2 2.5 34.6
22.0 0.5 22.5
1985 9.4 4.1 2.1 48.2 14.5 5.0 83.3
8.0 1.1 9.1 1986 6.0 14.0 8.3 11.2 4.0 0.9 44.4
7.6 0.8 8.4
1987 1.5 3.5 1.7 3.4 2.7 0.3 13.1
9.2 0.3 9.5 1988 0.7 0.2 0.1 0.1 0.3 0.4 1.8
13.0 0.1 13.1
1989 0.8 1.7 1.6 0.5 4.2 1.0 9.8
6.5 0.1 6.6 1990
4.4
1.2
3.8 9.4
5.7 1.1 6.8
1991 15.4 0.3 3.4 19.1
3.7 0.7 4.4 1992 2.3
0.4 2.7
2.5 1.9 4.4
1993 6.6 3.2 5.5 0.9 16.2
3.0 4.8 7.8 1994 34.8 7.0 10.8 2.2 54.8
7.3 7.3 14.6
1995 1.1 38.6 0.5 9.3 1.8 51.3
2.6 6.5 9.1 1996 8.0 0.4 9.5 3.4 21.3
3.5 6.2 9.7
1997 6.3 0.4 4.7 2.2 13.6
11.4 7.2 18.6 1998 0.4 13.2 2.3 21.0 1.2 38.1
4.9 6.2 11.1
1999 0.9 7.8 0.5 9.2 4.0 22.4
3.8 5.8 9.6 2000 35.6 6.6 8.5 1.7 52.4
4.3 7.8 12.1
2001 3.0 2.8 3.1 0.3 9.2
5.1 8.6 13.7 2002 2.7 6.9 3.7 1.8 15.1
6.1 8.3 14.4
2003 4.4 5.2 5.1 2.6 17.3
5.4 9.5 14.9 2004 1.2 3.5 4.3 1.0 10.0
10.1 8.2 18.3
2005 0.8 34.5 9.9 8.7 14.6 68.5
5.3 10.3 15.6 2006 9.0 6.5 5.2 1.9 22.6
4.8 8.3 13.1
2007
5.4 8.6 13.9 2008
4.2 9.3 13.5
2009
3.1 10.4 13.5 2010
5.3 8.9 14.2
2011
3.5 9.6 13.1 2012 0.0 4.1
2.1 8.0 10.1
2013 0.0 8.1 5.3 0.6 1.8 15.8 3.5 9.0 12.5 2014 0.0 0.5 9.2 9.7 10-yr avg 0.4 10.6 6.3 5.8 5.0 29.6 4.9 9.1 14.0
2015 0.8 0.8 3.2 9.6 12.7 a Weir counts. b Beginning in 1994, Bear Lake escapement figures are derived from total weir count minus number of fish collected for
hatchery broodstock.
115

116

APPENDIX D: KAMISHAK BAY DISTRICT
117

118
Appendix D1.–Kamishak Bay District commercial salmon harvest (excluding homepacks) by period, 2015.
Permits Chinook Sockeye Coho Pink Chum Period Date Hours Fished Landings Number Pounds Number Pounds Number Pounds Number Pounds Number Pounds 1 a 05/25-05/31 160 2 b 06/01-06/07 160 3 b 06/08-06/14 160 4 b 06/15-06/21 160 5 c 06/22-06/28 160 6 c 06/29-07/05 160 7 c,d,e 07/06-07/12 160 e e
e e e e
e e e e
e e 8 c,d 07/13-07/19 160 9 c,d 07/20-07/26 160
10 c,d,e 07/27-08/02 160 e e e e
e e e e
e e e e
11 c,d 08/03-08/09 160 12 c,d 08/10-08/16 160 13 c,d 08/17-08/23 160 14 c,d 08/24-08/30 160 15 c,d 08/31-09/06 160 16 c,d 09/07-09/13 160 Total e e e e e e e e e e e e Average weight NA NA NA 3.12 7.53 Note: Unless otherwise noted, all Kamishak Bay Subdistricts were open to commercial harvest from June 1, 2015, to September 19, 2015, with regular closed waters in effect. a Waters of Kamishak Bay District south of the latitude of Nordyke Island open to commercial purse seine harvest. b Waters of Kamishak Bay District open to commercial purse seine harvest. c Waters of Kamishak Bay District excluding the Kirschner Lake SHA, and excluding Chenik, McNeil River, and Paint River Subdistricts open to commercial purse seine
harvest. d Waters of Chenik Subdistrict open to commercial purse seine harvest. e Confidential data. Fewer than 3 permits reporting.

Appendix D2.–Total commercial common property harvest (excluding homepacks) by species in the Kamishak Bay District 1970–2015. Year Permits Landings Chinook Sockeye Coho Pink Chum 1970 0
2,846
218
22,500
95,841
1971 0
3
121
32,094
26,327 1972 0
47
31
342
26,374
1973 0
1
28
12,568
35,584 1974 0
0
2,915
48
4,554
1975 0
29
3,041
9,432
4,868 1976 1
3,988
1,111
1,112
48,848
1977 1
7,425
105
6,308
65,659 1978 0
4,619
1,584
982
48,669
1979 9
1,778
1,116
58,484
28,711 1980 0
3,877
2,495
101,864
35,921
1981 1
4,972
1,845
66,097
73,501 1982 11
18,014
38,685
43,871
108,946
1983 1
11,207
7,138
1,405
142,901 1984 2
24,642
13,230
137,133
70,595
1985 10 72
6
78,076
2,024
194
8,139 1986 25 386
14
146,496
9,935
423,774
61,670
1987 32 439
7
123,663
8,079
72,686
110,565 1988 38 634
33
186,011
4,471
64,468
220,579
1989 20 144
3
46,395
4
256,669
7,809 1990 30 318
12
96,397
26
2,448
3,597
1991 33 479
17
127,579
2,337
47,478
7,849 1992 23 232
39
60,078
1,488
2,594
20,051
1993 14 89
4
59,745
3
4,205
600 1994 8 17
0
18,509
1,897
33
14
1995 7 27
2
31,077
6,084
169,039
10,300 1996 a a
a
a
a
a
a
1997 3 6
0
5,608
0
0
3 1998 4 4
0
8,112
0
414
20
1999 6 8
0
29,409
0
325
23 2000 10 41
1
10,245
7
6,173
66,069
2001 7 40
2
9,972
9
131
84,766 2002 5 53
0
1,429
52
438,352
34,604
2003 a a
a
a
a
a
a 2004 6 46
0
35,285
5,367
12,969
177,395
2005 8 37
0
50,018
92
5,787
83,943 2006 5 34
0
38,267
24,269
77,833
56,494
2007 4 24
0
169,509
4
4,959
37 2008 11 44
2
171,924
20
26,397
73,209
2009 9 81
0
65,763
0
132,414
36,574 2010 9 54
10
5,612
573
2,432
70,782
2011 5 38
0
99,288
0
1,050
3,850 2012 6 34 0 55,255 0 61 2,425 2013 5 15 0 33,154 0 314 2,357 2014 8 20 0 12,137 0 44,227 4,449 Previous 10-yr avg 7 38 1 70,093 2,496 29,547 33,412
2015 a a a a a a a Source: ADF&G fish ticket database. a Confidential data. Fewer than 3 permits reporting.
119

Appendix D3.–Anticipated daily and cumulative sockeye salmon escapement versus actual escapement past the video monitoring site at Chenik Lake, 2015.
Apportioned sustainable escapement goals
Actual
Antic.
Projected minimum
Projected maximum Date Daily Cumulative percent Daily Cumulative Daily Cumulative Comments
6/14 0 0 0.0% 0 492 1 1,969 Camera installed on 6/14. 6/15 99 99 0.0% 25 518 102 2,070 6/16 6 105 0.0% 49 567 196 2,266 6/17 3 108 0.0% 218 784 872 3,138 6/18 0 108 0.0% 224 1,008 895 4,033 6/19 0 108 0.2% 268 1,277 1,073 5,106 6/20 0 108 0.2% 99 1,376 397 5,503 6/21 0 108 0.2% 169 1,545 677 6,180 6/22 0 108 0.2% 147 1,692 587 6,767 6/23 0 108 0.3% 23 1,714 90 6,857 6/24 0 108 0.6% 14 1,728 54 6,911 6/25 0 108 4.4% 62 1,790 249 7,160 6/26 7 115 8.6% 197 1,987 788 7,947 6/27 0 115 14.0% 186 2,173 744 8,692 6/28 1 116 14.1% 204 2,376 814 9,506 6/29 1,264 1,380 14.1% 127 2,504 509 10,014 6/30 2,066 3,446 14.8% 141 2,644 564 10,578 7/1 778 4,224 16.2% 126 2,770 504 11,081 7/2 0 4,224 22.4% 70 2,840 279 11,360 7/3 516 4,740 28.8% 93 2,933 370 11,730 7/4 829 5,569 36.5% 66 2,998 263 11,993 7/5 0 5,569 39.3% 88 3,086 350 12,343 7/6 551 6,120 44.2% 9 3,095 37 12,381 7/7 0 6,120 48.4% 41 3,136 165 12,546 7/8 0 6,120 49.0% 21 3,158 86 12,632 7/9 0 6,120 49.4% 15 3,173 59 12,691 7/10 0 6,120 51.2% 58 3,230 230 12,921 7/11 1,830 7,950 56.8% 35 3,266 142 13,062 7/12 428 8,378 62.1% 55 3,321 221 13,283 7/13 0 8,378 67.9% 57 3,378 227 13,510 7/14 663 9,041 71.6% 32 3,409 126 13,636 7/15 255 9,296 75.6% 16 3,425 65 13,701 7/16 447 9,743 79.2% 29 3,454 115 13,816 7/17 7 9,750 81.2% 11 3,465 44 13,860 7/18 0 9,750 83.8% 18 3,483 74 13,934 7/19 0 9,750 85.7% 1 3,484 3 13,936 7/20 0 9,750 88.2% 2 3,486 7 13,944 7/21 4 9,754 88.5% 7 3,493 27 13,970 7/22 7 9,761 89.6% 2 3,494 7 13,977 7/23 0 9,761 90.2% 4 3,498 14 13,992 7/24 673 10,434 90.7% 1 3,499 3 13,994 7/25 1,715 12,149 92.3% 0 3,499 2 13,996 7/26 307 12,456 93.3% 0 3,499 0 13,996 7/27 1,695 14,151 94.9% 0 3,499 0 13,996 7/28 2,797 16,948 96.5% 0 3,499 0 13,997 7/29 802 17,750 97.4% 0 3,499 0 13,997
-continued-
120

Appendix D3.–Page 2 of 2.
Apportioned sustainable escapement goals
Actual
Antic.
Projected minimum
Projected maximum Date Daily Cumulative percent Daily Cumulative Daily Cumulative Comments
7/30 252 18,002 97.9% 0 3,499 0 13,997 7/31 166 18,168 98.7% 0 3,499 0 13,997 8/1 98 18,266 99.0% 0 3,499 0 13,997 8/2 14 18,280 99.5% 0 3,499 0 13,997 8/3 121 18,401 99.6% 0 3,499 0 13,997 8/4 320 18,721 99.6% 0 3,499 0 13,997 8/5 70 18,791 99.8% 0 3,499 0 13,997 8/6 186 18,977 99.9% 0 3,499 2 13,999 8/7 7 18,984 100.0% 0 3,499 0 13,999 8/8 0 18,984 100.0% 0 3,499 0 13,999 8/9 0 18,984 100.0% 0 3,499 0 13,999 8/10 9 18,993 100.0% 0 3,499 0 13,999 8/11 48 19,041 100.0% 0 3,499 0 13,999 8/12 19 19,060 100.0% 0 3,499 0 13,999 8/13 0 19,060 100.0% 0 3,499 0 13,999 8/14 13 19,073 100.0% 0 3,499 0 13,999 8/15 0 19,073 100.0% 0 3,499 0 13,999 8/16 0 19,073 100.0% 0 3,499 0 13,999 8/17 0 19,073 100.0% 0 3,499 0 13,999 Hard drive filled 8/17 afternoon. Note: Anticipated escapement derived from run timing and Chenik Lake sockeye salmon sustainable escapement goal
(3,500–14,000 fish).
121

Appendix D4.–Anticipated daily and cumulative sockeye salmon escapement versus actual escapement past the video monitoring site at Mikfik Lake, 2015.
Apportioned sustainable escapement goal
Actual
Antic
Projected minimum
Projected maximum Date Daily Cumulative percent Daily Cumulative Daily Cumulative Comments
6/1 0 0
0.4%
15 15
58 58 Camera installed, 5/23. 6/2 377 377
0.5%
1 16
2 60 Beaver dam breached 5/23
6/3 156 533
0.5%
0 16
0 60 6/4 216 749
0.7%
9 25
36 97
6/5 34 783
1.8%
36 61
138 235 6/6 0 783
2.0%
6 67
23 258
6/7 111 894
2.2%
8 75
29 287 6/8 0 894
3.2%
33 108
128 414
6/9 0 894
6.0%
95 203
363 778 6/10 363 1,257
8.3%
78 282
299 1,077
6/11 1,513 2,770
11.3%
104 386
398 1,474 6/12 183 2,953
12.4%
35 420
133 1,608
6/13 8 2,961
26.1%
467 888
1,787 3,394 6/14 0 2,961
31.3%
177 1,065
678 4,073
6/15 2 2,963
33.6%
78 1,143
299 4,371 6/16 0 2,963
34.4%
25 1,168
96 4,467
6/17 0 2,963
38.5%
140 1,308
535 5,003 6/18 0 2,963
42.1%
122 1,430
467 5,469
6/19 0 2,963
47.9%
199 1,629
759 6,229 6/20 0 2,963
58.4%
357 1,986
1,365 7,594
6/21 0 2,963
65.6%
245 2,231
938 8,532 6/22 0 2,963
67.4%
59 2,291
227 8,759
6/23 0 2,963
67.9%
19 2,309
71 8,830 6/24 0 2,963
76.0%
276 2,586
1,056 9,886
6/25 0 2,963
76.8%
25 2,611
96 9,982 6/26 0 2,963
78.3%
51 2,662
194 10,177
6/27 0 2,963
82.1%
129 2,791
495 10,672 6/28 0 2,963
83.4% 45 2,836
173 10,845
6/29 0 2,963
84.1%
24 2,861
93 10,938 6/30 0 2,963
84.1%
0 2,861
0 10,938
7/1 0 2,963
84.2%
0 2,861
2 10,940 7/2 136 3,099
84.2%
2 2,863
9 10,949
7/3 0 3,099
84.3%
2 2,865
7 10,956 7/4 31 3,130
84.3%
2 2,867
7 10,963
7/5 0 3,130
84.6%
8 2,875
31 10,993 7/6 0 3,130
88.5%
133 3,008
508 11,501
7/7 110 3,240
90.3%
62 3,070
239 11,739 Beaver dam removal 7/8 2 3,242
92.7%
82 3,152
312 12,051
7/9 0 3,242
93.0%
9 3,161
36 12,088 7/10 0 3,242
93.3%
10 3,171
38 12,125
7/11 0 3,242
93.3%
1 3,172
4 12,130 7/12 0 3,242
93.5%
6 3,179
25 12,154
7/13 0 3,242
94.3%
29 3,207
109 12,263 7/14 0 3,242
94.7%
12 3,219
45 12,308
7/15 0 3,242
94.7%
1 3,220
4 12,312 7/16 0 3,242
94.7%
0 3,220
0 12,313
-continued-
122

Appendix D4.–Page 2 of 2.
Apportioned sustainable escapement goal
Actual
Antic
Projected minimum
Projected maximum Date Daily Cumulative percent Daily Cumulative Daily Cumulative Comments
7/17 0 3,242
97.8%
104 3,324
398 12,711 7/18 0 3,242
99.2%
50 3,374
190 12,900
7/19 0 3,242
99.3%
1 3,375
3 12,904 7/20 0 3,242
99.5%
7 3,382
28 12,932
7/21 0 3,242
99.5%
0 3,383
2 12,934 7/22 0 3,242
99.5%
0 3,383
2 12,935
7/23 34 3,276
99.5%
1 3,384
2 12,937 7/24 45 3,321
99.5%
0 3,384
1 12,939
7/25 0 3,321
99.5%
0 3,384
0 12,939 7/26 28 3,349
99.5%
0 3,384
0 12,939
7/27 55 3,404
99.5%
0 3,384
0 12,939 7/28 19 3,423
99.6%
1 3,385
3 12,942
7/29 27 3,450
99.6%
0 3,385
0 12,942 7/30 29 3,479
99.8%
9 3,394
35 12,977
7/31 1 3,480
99.9%
4 3,398
13 12,991 8/1 4 3,484
99.9%
0 3,398
0 12,991
8/2 13 3,497
99.9%
0 3,398
0 12,991 8/3 2 3,499
99.9%
0 3,398
1 12,992
8/4 0 3,499
99.9%
0 3,398
1 12,993 8/5 0 3,499
100.0%
1 3,399
3 12,996
8/6 3 3,502
100.0%
1 3,400
2 12,998 8/7 0 3,502 100.0% 0 3,400 398 12,711
8/8 0 3,502 100.0% 0 3,400 190 12,900 8/9 0 3,502 100.0% 0 3,400 3 12,904 8/10 0 3,502 100.0% 0 3,400 28 12,932 8/11 0 3,502
100.0%
0 3,400
2 12,934 Hard drive removed 8/11.
Note: Anticipated escapement derived from run timing and Mikfik Lake sockeye salmon sustainable escapement goal of 3,400–13,000 fish.
123

Appendix D5.–Minimum and maximum anticipated cumulative and daily escapement of sockeye
salmon versus actual escapement past the video monitoring station at Chenik Lake, 2015.
124

Appendix D6.–Minimum and maximum anticipated cumulative and daily escapement of sockeye
salmon versus actual escapement past the Mikfik Lake video monitoring station, 2015.
125

Appendix D7.–Sockeye salmon escapement into Chenik Lake and Mikfik Lake, 1927–2015.
Year Chenik Mikfik 1927
7,069 a
1928
31,007 a 1929
30,440 a
1930
23,638 a 1931
33,514 a
1932
53,012 a 1933
39,222 a
1934
35,778 a 1935
16,041 a
1936
19,349 a 1937
8,256 a
1938
3,804 a 1939
4,076 a
(No weir from 1940–1991)
1992
9,269 a 7,800 b 1993
4,000 a 6,400 b
1994
808 a 9,500 b 1995
1,086 a 10,100 b
1996
2,990 a 10,500 b 1997
2,338 a 8,500 b
1998
1,880 b 12,600 b 1999
2,850 b 15,700 b
2000
4,800 b 10,386 d 2001
250 b 5,400 b
2002
4,650 b 16,700 b 2003
13,825 b 8,009 d
2004
17,000 b 14,829 d 2005
14,507 c 6,499 d
2006
13,868 c 14,983 d 2007
18,288 c 10,975 d
2008
11,284 c 9,104 d 2009
15,264 d 20,965 d
2010
17,312 d 5,221 b 2011
10,330 d 345 b
2012
16,505 d 3,131 d 2013 11,333 d 4,042 d 2014 17,797 d 17,802 d Previous 10-yr average
14,647 9,307
2015 19,073 d 3,502 d a Escapement derived from weir counts. b Escapement derived from aerial surveys. c Escapement derived from a combination of weir, video counts, and/or aerial counts. d Escapement derived from video counts.
126

127
Appendix D8.–Pink and chum salmon escapements as measured by aerial survey using area under the curve estimation in the Kamishak Bay District, 2015.
Location Species Survey number
Survey date (ti)
Previous survey
date (ti-1)
Days between surveys
(ti-ti-1)
Current live
count, (ci)
Previous live count
(ci-1)
Previous + current
live count (ci+ci-1)
Fish daysa, (Ab)
Accum. fish days, (Ab)
Escape. Indexb
Accum. Escape.
Indexc
Accum. Percent Escape. Peak count
Amakdedori pink tstart 6/22 Creek
1 6/22 6/22 0 0 0 0 0 0 0 0 0%
(not an index
2 7/2 6/22 10 0 0 0 0 0 0 0 0% system)
3 7/10 7/2 8 0 0 0 0 0 0 0 0%
4 7/24 7/10 14 1,710 0 1,710 11,970 11,970 684 684 3%
5 7/30 7/24 6 10,100 1,710 11,810 35,430 47,400 2,025 2,709 10%
6 8/6 7/30 7 4,890 10,100 14,990 52,465 99,865 2,998 5,707 22%
7 8/14 8/6 8 18,000 4,890 22,890 91,560 191,425 5,232 10,939 42%
8 9/2 8/14 19 5,020 18,000 23,020 218,690 410,115 12,497 23,435 90%
tend 9/19 17.5 43,925 454,040 2,510 25,945 100% 18,000
Big chum tstart 7/10 Kamishak
1 7/10 7/10 0 0 0 0 0 0 0 0 0%
River
2 7/24 7/10 14 133 0 133 931 931 53 53 1%
3 7/30 7/24 6 2,910 133 3,043 9,129 10,060 522 575 8%
4 8/6 7/30 7 2,161 2,910 5,071 17,749 27,809 1,014 1,589 23%
5 8/14 8/6 8 5,820 2,161 7,981 31,924 59,733 1,824 3,413 49%
(index
6 9/2 8/14 19 400 5,820 6,220 59,090 118,823 3,377 6,790 97% system)
tend 9/19
17.5
3,500 122,323 200 6,990 100% 5,820
Brown's chum tstart 6/22 Peak Creek
1 7/10 6/22 17.5 115 0 115 1,006 1,006 58 58 4%
(not an index
2 7/24 7/10 14 300 115 415 2,905 3,911 166 224 16% system)
3 7/30 7/24 6 960 300 1,260 3,780 7,691 216 440 32%
4 8/6 7/30 7 1,700 960 2,660 9,310 17,001 532 972 71%
5 8/14 8/6 8 0 1,700 1,700 6,800 23,801 389 1,360 100%
6 9/2 8/14 19 0 0 0 0 23,801 0 1,360 100% tend 9/2 0 0 23,801 0 1,360 100% 1,700
-continued-

Appendix D8.–Page 2 of 7.
Location Species Survey number
Survey date (ti)
Previous survey
date (ti-1)
Days between surveys
(ti-ti-1)
Current live
count, (ci)
Previous live count
(ci-1)
Previous + current
live count (ci+ci-1)
Fish daysa, (Ab)
Accum. fish days, (Ab)
Escape. Indexb
Accum. Escape.
Indexc
Accum. Percent Escape. Peak count
Brown's pink tstart 7/10 Peak Creek
1 7/10 7/10 0 0 0 0 0 0 0 0 0%
(index
2 7/24 7/10 14 0 0 0 0 0 0 0 0% system)
3 7/30 7/24 6 6,820 0 6,820 20,460 20,460 1,169 1,169 4%
4 8/6 7/30 7 3,700 6,820 10,520 36,820 57,280 2,104 3,273 11%
5 8/14 8/6 8 23,500 3,700 27,200 108,800 166,080 6,217 9,490 33%
6 9/2 8/14 19 6,610 23,500 30,110 286,045 452,125 16,345 25,836 89%
tend 9/19
17.5
57,838 509,963 3,305 29,141 100% 23,500
Bruin River chum tstart 6/22 (index
1 7/10 6/22 17.5 1,880 0 1,880 16,450 16,450 940 940 9%
system)
2 7/24 7/10 14 6,900 1,880 8,780 61,460 77,910 3,512 4,452 40%
3 7/30 7/24 6 6,010 6,900 12,910 38,730 116,640 2,213 6,665 61%
4 8/6 7/30 7 900 6,010 6,910 24,185 140,825 1,382 8,047 73%
5 8/14 8/6 8 2,420 900 3,320 13,280 154,105 759 8,806 80%
6 9/2 8/14 19 850 2,420 3,270 31,065 185,170 1,775 10,581 96%
tend 9/19
17.5
7,438 192,608 425 11,006 100% 9,360
Bruin River pink tstart 7/10 (index
1 7/10 7/10 0 0 0 0 0 0 0 0 0%
system)
2 7/24 7/10 14 0 0 0 0 0 0 0 0%
3 7/30 7/24 6 16,500 0 16,500 49,500 49,500 2,829 2,829 7%
4 8/6 7/30 7 17,200 16,500 33,700 117,950 167,450 6,740 9,569 23%
5 8/14 8/6 8 29,010 17,200 46,210 184,840 352,290 10,562 20,131 49%
6 9/2 8/14 19 4,720 29,010 33,730 320,435 672,725 18,311 38,441 94%
tend 9/19 17.5 41,300 714,025 2,360 40,801 100% 29,010 -continued-
128

Appendix D8.–Page 3 of 7.
Location Species Survey number
Survey date (ti)
Previous survey
date (ti-1)
Days between surveys
(ti-ti-1)
Current live
count, (ci)
Previous live count
(ci-1)
Previous + current
live count (ci+ci-1)
Fish daysa, (Ab)
Accum. fish days, (Ab)
Escape. Indexb
Accum. Escape.
Indexc
Accum. Percent Escape. Peak count
Cottonwood chum tstart 7/10 Creek
1 7/10 7/10 0 0 0 0 0 0 0 0 0%
(index
2 7/24 7/10 14 710 0 710 4,970 4,970 284 284 2% system)
3 7/30 7/24 6 2,110 710 2,820 8,460 13,430 483 767 5%
4 8/6 7/30 7 2,100 2,110 4,210 14,735 28,165 842 1,609 10%
5 8/14 8/6 8 4,500 2,100 6,600 26,400 54,565 1,509 3,118 19%
6 9/2 8/14 19 10,300 4,500 14,800 140,600 195,165 8,034 11,152 68%
tend 9/19 17.5 90,125 285,290 5,150 16,962 100% 10,300
Douglas River chum tstart 7/6 (not an index
1 7/24 7/6 17.5 241 0 241 2,109 2,109 121 121 13%
system)
2 7/30 7/24 6 30 241 271 813 2,922 46 167 18%
3 8/6 7/30 7 800 30 830 2,905 5,827 166 333 37%
4 8/14 8/6 8 410 800 1,210 4,840 10,667 277 610 67%
5 9/2 8/14 19 70 410 480 4,560 15,227 261 870 96%
tend 9/19 17.5 613 15,839 35 905 100% 800
Douglas chum tstart 6/22 Beach River
1 7/10 6/22 17.5 10 0 10 88 88 5 5 0%
(not an index
2 7/30 7/10 20 1,530 10 1,540 15,400 15,488 880 885 7% system)
3 8/6 7/30 7 704 1,530 2,234 7,819 23,307 447 1,332 10%
4 8/14 8/6 8 8,300 704 9,004 36,016 59,323 2,058 3,390 26%
5 9/2 8/14 19 4,810 8,300 13,110 124,545 183,868 7,117 10,507 81%
tend 9/19
17.5
42,088 225,955 2,405 12,912 100% 8,300
-continued-
129

Appendix D8.–Page 4 of 7.
Location Species Survey number
Survey date (ti)
Previous survey
date (ti-1)
Days between surveys
(ti-ti-1)
Current live
count, (ci)
Previous live count
(ci-1)
Previous + current
live count (ci+ci-1)
Fish daysa, (Ab)
Accum. fish days, (Ab)
Escape. Indexb
Accum. Escape.
Indexc
Accum. Percent Escape. Peak count
Douglas chum tstart 7/10 Reef River
1 7/10 7/10 0 0 0 0 0 0 0 0 0%
(not an index
2 7/30 7/10 20 650 0 650 6,500 6,500 371 371 26% system)
3 8/6 7/30 7 98 650 748 2,618 9,118 150 521 37%
4 8/14 8/6 8 710 98 808 3,232 12,350 185 706 50%
5 9/2 8/14 19 320 710 1,030 9,785 22,135 559 1,265 89%
tend 9/19
17.5
2,800 24,935 160 1,425 100% 710 Douglas pink tstart 7/10 Reef River
1 7/10 7/10 0 0 0 0 0 0 0 0 0%
(not an index
2 7/30 7/10 20 0 0 0 0 0 0 0 0% system)
3 8/6 7/30 7 70 0 70 245 245 14 14 3%
4 8/14 8/6 8 500 70 570 2,280 2,525 130 144 35%
5 9/2 8/14 19 0 500 500 4,750 7,275 271 416 100%
tend 9/2
0
0 7,275 0 416 100% 500 Iniskin River chum tstart 7/6 (index
1 7/24 7/6 17.5 910 0 910 7,963 7,963 455 455 6%
system)
2 7/30 7/24 6 2,470 910 3,380 10,140 18,103 579 1,034 14%
3 8/6 7/30 7 3,000 2,470 5,470 19,145 37,248 1,094 2,128 28%
4 8/14 8/6 8 6,450 3,000 9,450 37,800 75,048 2,160 4,288 57%
tend 8/31
17.5
56,438 131,485 3,225 7,513 100% 6,450
Little chum tstart 6/22 Kamishak
1 7/10 6/22 17.5 150 0 150 1,313 1,313 75 75 1%
River
2 7/24 7/10 14 5,207 150 5,357 37,499 38,812 2,143 2,218 17% (index
3 7/30 7/24 6 14,370 5,207 19,577 58,731 97,543 3,356 5,574 42%
system)
4 8/6 7/30 7 2,855 14,370 17,225 60,288 157,830 3,445 9,019 67%
5 8/14 8/6 8 4,740 2,855 7,595 30,380 188,210 1,736 10,755 80%
6 9/2 8/14 19 70 4,740 4,810 45,695 233,905 2,611 13,366 100%
tend 9/19
17.5
613 234,518 35 13,401 100% 14,370
-continued-
130

Appendix D8.–Page 5 of 7.
Location Species Survey number
Survey date (ti)
Previous survey
date (ti-1)
Days between surveys
(ti-ti-1)
Current live
count, (ci)
Previous live count
(ci-1)
Previous + current
live count (ci+ci-1)
Fish daysa, (Ab)
Accum. fish days, (Ab)
Escape. Indexb
Accum. Escape.
Indexc
Accum. Percent Escape. Peak count
Little pink tstart 7/10 Kamishak
1 7/10 7/10 0 0 0 0 0 0 0 0 0%
River
2 7/24 7/10 14 0 0 0 0 0 0 0 0% (not an index
3 7/30 7/24 6 0 0 0 0 0 0 0 0%
system)
4 8/6 7/30 7 1,464 0 1,464 5,124 5,124 293 293 40%
5 8/14 8/6 8 100 1,464 1,564 6,256 11,380 357 650 90%
6 9/2 8/14 19 21 100 121 1,150 12,530 66 716 99%
tend 9/19
17.5
184 12,713 11 726 100% 1,464
McNeil chum tstart 6/1 River
1 6/15 6/1 14 860 0 860 5,934 5,934 430 430 3%
(index
2 6/22 6/15 7 1,802 860 2,662 9,317 15,251 675 1,105 6% system)
3 7/2 6/22 10 6,390 1,802 8,192 40,960 56,211 2,968 4,073 22%
4 7/10 7/2 8 5,010 6,390 11,400 45,600 101,811 3,304 7,378 40%
5 7/24 7/10 14 1,933 5,010 6,943 48,601 150,412 3,522 10,899 59%
6 7/30 7/24 6 10,580 1,933 12,513 37,539 187,951 2,720 13,620 74%
7 8/6 7/30 7 2,788 10,580 13,368 46,788 234,739 3,390 17,010 92%
tend 8/19 14 19,237 253,976 1,394 18,404 100% 10,580 North Head chum tstart 7/12
Creek
1 7/30 7/12 17.5 350 0 350 3,063 3,063 175 175 44% (not an index
2 8/6 7/30 7 350 350 700 2,450 5,513 140 315 80%
system)
3 8/14 8/6 8 0 350 350 1,400 6,913 80 395 100%
tend 8/14
0
0 6,913 0 395 100% 350
North Head pink tstart 7/12 Creek
1 7/30 7/12 17.5 5,000 0 5,000 43,750 43,750 2,500 2,500 16%
(not an index
2 8/6 7/30 7 7,100 5,000 12,100 42,350 86,100 2,420 4,920 31% system)
3 8/14 8/6 8 13,100 7,100 20,200 80,800 166,900 4,617 9,537 59%
tend 8/31 17.5 114,625 281,525 6,550 16,087 100% 13,100 -continued-
131

Appendix D8.–Page 6 of 7.
Location Species Survey number
Survey date (ti)
Previous survey
date (ti-1)
Days between surveys
(ti-ti-1)
Current live
count, (ci)
Previous live count
(ci-1)
Previous + current
live count (ci+ci-1)
Fish daysb, (Ab)
Accum. fish days, (Ab)
Escape. Indexc
Accum. Escape. Indexd
Accum. Percent Escape. Peak count
Sugarloaf chum tstart 7/6 Creek
1 7/24 7/6 17.5 250 0 250 2,188 2,188 125 125 12%
(not an index
2 7/30 7/24 6 302 250 552 1,656 3,844 95 220 20% system)
3 8/6 7/30 7 220 302 522 1,827 5,671 104 324 30%
4 8/14 8/6 8 970 220 1,190 4,760 10,431 272 596 55%
tend 8/31 17.5 8,488 18,918 485 1,081 100% 460
Sunday chum tstart 7/10 Creek
1 7/10 7/10 0 0 0 0 0 0 0 0 0%
(not an index
2 7/24 7/10 14 310 0 310 2,170 2,170 124 124 17% system)
3 7/30 7/24 6 130 310 440 1,320 3,490 75 199 27%
4 8/6 7/30 7 1,200 130 1,330 4,655 8,145 266 465 63%
8/14 8/6 8 0 1,200 1,200 4,800 12,945 274 740 100%
5 9/2 8/14 19 0 0 0 0 12,945 0 740 100%
tend 9/2
0
0 12,945 0 740 100% 1,200
Sunday pink tstart 7/10 Creek
1 7/10 7/10 0 0 0 0 0 0 0 0 0%
(index
2 7/24 7/10 14 1,380 0 1,380 9,660 9,660 552 552 1% system)
3 7/30 7/24 6 4,420 1,380 5,800 17,400 27,060 994 1,546 3%
4 8/6 7/30 7 8,700 4,420 13,120 45,920 72,980 2,624 4,170 7%
5 8/14 8/6 8 58,200 8,700 66,900 267,600 340,580 15,291 19,462 32%
6 9/2 8/14 19 8,850 58,200 67,050 636,975 977,555 36,399 55,860 93%
tend 9/19 17.5 77,438 1,054,993 4,425 60,385 100% 58,200 -continued-
132

Appendix D8.–Page 7 of 7.
Location Species Survey number
Survey date (ti)
Previous survey
date (ti-1)
Days between surveys
(ti-ti-1)
Current live
count, (ci)
Previous live count
(ci-1)
Previous + current
live count (ci+ci-1)
Fish daysb, (Ab)
Accum. fish days, (Ab)
Escape. Indexc
Accum. Escape. Indexd
Accum. Percent Escape. Peak count
Ursus chum tstart 6/22 Lagoon
1 7/10 6/22 17.5 230 0 230 2,013 2,013 115 115 1%
Creeks
2 7/24 7/10 14 164 230 394 2,758 4,771 158 273 2% (index
3 7/30 7/24 6 1,210 164 1,374 4,122 8,893 236 508 3%
system)
4 8/6 7/30 7 1,340 1,210 2,550 8,925 17,818 510 1,018 7%
5 8/14 8/6 8 5,510 1,340 6,850 27,400 45,218 1,566 2,584 17%
6 9/2 8/14 19 8,830 5,510 14,340 136,230 181,448 7,785 10,368 70%
tend 9/19
17.5
77,263 258,710 4,415 14,783 100% 2,840
Ursus pink tstart 7/10 Lagoon
1 7/10 7/10 0 0 0 0 0 0 0 0 0%
Creeks
2 7/24 7/10 14 0 0 0 0 0 0 0 0% (not an index
3 7/30 7/24 6 100 0 100 300 300 17 17 2%
system)
4 8/6 7/30 7 970 100 1,070 3,745 4,045 214 231 23%
5 8/14 8/6 8 300 970 1,270 5,080 9,125 290 521 52%
6 9/2 8/14 19 300 300 600 5,700 14,825 326 847 85%
tend 9/19 17.5 2,625 17,450 150 997 100% 970 Note: Final counts include fish observed in bays if no further harvest occurred. Run timing from Bue et al. 1998. a Fish days (Ab) = (Days between surveys x (prev. count + current count)) ÷ 2. b Escapement index = Ab / 17.5 day stream-life estimate (except McNeil River chum calculations use a 13.8-day stream-life estimate) c The McNeil River chum salmon AUC index is not the final escapement index. After applying a run-timing expansion factor, the final escapement index was 20,494. For all
other stocks, the area-under-the-curve estimate equals the cumulative escapement index.
133

Appendix D9.–Sockeye salmon aerial survey counts from the Kamishak Bay District, 2015.
Survey Survey Live Peak
Location number date count count
Amakdedori Creek 1 06/22/15 221
2 07/02/15 150
3 07/10/15 920
4 07/24/15 391
5 07/30/15 2,910
6 08/06/15 340
7 08/14/15 2,872
8 09/02/15 353 2,910
Big Kamishak 1 07/10/15 361
2 07/24/15 580
3 07/30/15 1,180
4 08/06/15 138
5 08/14/15 240
6 09/02/15 60 1,180
Douglas Reef River 1 07/10/15 90
2 07/30/15 450
3 08/06/15 15
4 08/14/15 80
5 09/02/15 30 450
Mikfik Lake a 1 6/15/2015 3,590
2 6/22/2015 1,330
3 7/2/2015 1,520
4 7/10/2015 420
5 7/24/2015 861
6 8/6/2015 200
7 9/2/2015 202 3,590 a Aerial surveys are used for inseason management but the final escapement index (3,502) was derived by video monitoring.
134

Appendix D10.–Escapement indices and harvests by subdistricts in the Kamishak Bay District, Lower Cook Inlet, 2015.
Combined harvest and escapement index counts
Harvesta
Escapement indexb
Location Sockeye Coho Pink Chum
Sockeye Coho Pink Chum
Sockeye Coho Pink Chum
Augustine Subdistrict (249-30)
Douglas River Subdistrict (249-40)
450 524 500 15,242
450 650 500 15,242
Kamishak River Subdistrict (249-45)
1,180 0 2,154 21,360
1,180
2,154 21,360
McNeil Cove Subdistrict (249-50)
3,502 0 500 14,899
3,502
500 14,899
Chenik/Amakdedori Subdistrict (249-55)
21,983 0 25,945 0
21,983
25,945 Bruin Bay Subdistrict (249-70)
0 0 40,801 11,006
0
40,801 11,006
Kirschner Lake Section (249-71)
– – – – Kirschner Lake SHA (249-72) 23,571
1,560
– – – –
23,571
1,560
Rocky Cove Subdistrict (249-78)
33,735 626
0
60,285 1,200
94,020 1,826
Ursus Cove Subdistrict (249-80)
0
30,111 16,483
30,111 16,483
Cottonwood Bay Subdistrict (249-83)
0
18,187 16,697
0
18,187 16,697
Iniskin Bay Subdistrict (249-85)
0
0 8,594
0 8,594
Kamishak Bay District totalc 23,571 0 35,295 626 27,115 524 178,483 105,481 50,686 650 213,778 106,107 a Harvests include all commercial and subsistence harvests. b Unexpanded aerial or ground survey index count, or weir count. Also includes non-index streams. c Additional non-index streams where salmon were observed are also included. Therefore cumulative escapement values in this table are greater than escapement indices that
historically contribute to SEG ranges as shown for index streams only.
135

Appendix D11.–Estimated pink, chum and sockeye salmon escapements in thousands of fish for the major spawning systems in the Kamishak Bay District of the Lower Cook Inlet Area, 1975–2015.
Pink salmon
Year Big Kamishak
River Little Kamishak
River Amakdedori
Creek Bruin Bay
River Sunday
Creek Brown's Peak
Creek Total of index
streams 1975 5.0 20.0 20.0 10.0 50.0 1976 8.0 6.0
13.5 0.3 1.2 15.0
1977 60.0 9.0 13.0 82.0 1978 12.0 0.4 0.9 33.0 0.2 0.9 34.1 1979 10.0 3.5 6.0 200.0 12.0 15.0 227.0 1980 2.0 0.6 3.8 400.0 5.2 2.3 407.5 1981 1.5 95.0 14.2 17.7 126.9 1982 5.0 2.2 6.3 75.0 12.0 3.5 90.5 1983 0.2 4.0 4.7 1.7 10.4 1984 0.1
110.0 12.0 6.8 128.8
1985 1.6 1.0 3.5 11.4 7.0 21.9 1986 5.0 2.0 6.0 1,200.0 109.0 28.0 1,337.0 1987 0.4 24.0 29.7 40.2 93.9 1988 1.0 0.5 1.0 29.0 18.0 17.0 64.0 1989 2.0 350.0 103.0 120.0 573.0 1990 0.1 19.0 2.8 1.0 22.8 1991
0.9 0.7 74.9 20.9 16.7 112.5
1992 3.2 3.2 2.9 5.0 11.1 1993 1.7 86.4 57.8 41.6 185.8 1994 0.7 5.9 3.1 1.3 10.3 1995 4.5 307.3 95.9 96.7 499.9 1996 16.7
27.5 2.8 2.4 32.7
1997 1.7 162.7 52.5 42.3 257.5 1998 2.0 134.9 24.0 7.9 166.8 1999 5.7 4.2
2.9 5.3 2.6 10.8
2000 14.9 13.0
176.7 39.8 9.8 226.3 2001 6.0 18.5 26.2 19.2 63.9 2002
3.4 0.9 1,598.5 81.9 27.5 1,707.9
2003 138.7 346.7 285.0 770.4 2004 3.0 66.5 31.5 18.1 116.1 2005
98.3 116.2 61.0 275.5
2006 77.0 515.1 70.0 35.7 620.9 2007 5.1 350.4 394.8 249.4 994.6 2008 34.3 150.7 20.4 17.4 188.5 2009 10.4 0.8 9.2 1,067.4 106.3 63.6 1,237.3 2010 0.7 40.3 6.6 3.1 50.0 2011 9.3 13.1 4.2 4.5 0.8 2.0 7.4 2012 2.7 9.3 3.0 31.8 1.3 2.8 35.9 2013 0.5 8.0 15.0 6.0 4.1 25.1 2014 4.8 2.4 121.6 7.7 4.0 133.3 10-yr avg 7.4 18.1 4.6 239.5 73.0 44.3 356.8
2015 0.7 1.5 24.9 40.8 60.4 29.1 130.3
-continued-
136

Appendix D11.–Page 2 of 3.
Chum salmon
Year
Big Kamishak
River
Little Kamishak
River McNeil
River Bruin
Bay Ursus Covea
Cottonwood Creek
Iniskin Bay
Total of index
streams 1975 1.1 1.9 1.5 1.5 5.0 8.0 7.0 26.0
1976 24.0 21.0 10.0 4.0 6.0 5.0 13.5 83.5 1977 20.0 18.0 9.3 10.0 4.4 61.7 1978 23.0 30.0 45.0 4.0 9.7 12.5 11.4 135.6 1979 15.0 15.0 8.0 15.0 5.0 2.5 4.0 64.5 1980 10.0 13.0 8.0 15.0 8.0 4.2 9.3 67.5 1981 11.0 6.0 30.0 10.0 10.0 9.0 9.0 85.0 1982 25.0 18.0 25.0 10.0 9.0 7.0 12.8 106.8 1983 25.0 25.0 48.0 5.5 7.7 8.3 12.0 131.5 1984 19.0 12.0 21.0 8.0 7.0 6.5 9.8 83.3 1985 6.0 4.5 9.5 2.0 3.0 3.0 5.0 33.0 1986 24.0 17.0 22.0 1.0 11.0 11.0 5.9 91.9 1987 12.0 18.0 26.0 10.0 9.9 17.0 9.1 102.0 1988 15.0 13.0 49.0 7.0 9.4 16.0 9.5 118.9 1989 30.0 12.0 34.0 8.0 6.3 8.0 5.9 104.2 1990 2.5 7.9 8.0 4.0 3.8 4.3 8.4 38.9 1991 8.7 8.4 10.0 6.0 1.3 7.7 8.3 50.4 1992 4.5 7.1 19.2 8.5 1.7 6.1 3.4 50.5 1993 9.1 6.3 17.4 6.0 7.7 12.0 8.0 66.5 1994
9.0 15.0 6.1 6.2 10.2 18.9 65.4
1995 14.4 6.6 11.1 15.4 22.7 70.2 1996 11.1 4.4 16.1 14.9 7.6 16.1 7.8 78.0 1997 27.5 8.8 6.2 5.6 15.4 63.5 1998 7.1 9.7 23.5 9.4 4.6 2.3 18.6 75.2 1999 11.6 8.9 13.5 10.3 21.0 12.0 23.3 100.6 2000 45.3 26.9 18.6 13.6 41.7 24.1 23.6 193.8 2001 36.3 27.2 17.0 21.8 37.7 15.9 13.8 169.7 2002 17.4 16.4 11.3 9.9 17.1 42.2 28.5 142.8 2003 16.4 22.2 23.3 13.1 30.4 72.8 18.7 196.9 2004 57.9 45.3 11.2 15.9 16.0 16.3 22.0 184.6 2005 25.7 12.1 17.4 21.2 12.2 17.9 16.5 123.0 2006 58.2 42.9 28.2 7.0 15.7 13.2 15.6 180.8 2007 14.8 15.6 13.6 3.1 20.9 12.5 5.3 85.8 2008 4.5 21.3 9.8 17.5 6.5 11.6 20.0 91.2 2009 15.0 4.2 18.8 10.1 12.9 19.4 30.8 111.2 2010
18.4 10.5 6.2 11.8 15.8 19.3 82.0
2011 5.5 19.3 31.0 3.5 10.6 4.7 16.5 91.2 2012 12.4 30.3 9.8 16.1 2.8 2.8 3.0 77.2 2013 3.3 6.7 9.5 8.8 10.3 5.2 5.9 49.8
2014 5.7 15.1 17.5 3.6 5.3 7.1 13.0 67.2 10-yr avg 16.1 18.6 16.6 9.7 10.9 11.0 14.6 97.6
2015 7.0 14.4 20.5 11.0 14.8 17.0 7.5 92.1 -continued-
137

Appendix D11.–Page 3 of 3.
Sockeye salmon
Year Mikfik Lake Chenik Lake Amakdedori
Creek Kamishak Rivers Total of index streams 1975 6.0 0.1
0.8 6.9
1976 10.0 0.9
1.6 12.5 1977 9.8 0.2
2.6 12.6
1978 12.0 0.1
2.6 1.0 15.7 1979 6.0 0.0
1.0 0.4 7.4
1980 6.5 3.5
2.6 0.1 12.7 1981 5.3 2.5
1.9 0.8 10.5
1982 35.0 8.0
3.2 10.0 56.2 1983 7.0 11.0
1.2 5.0 24.2
1984 6.0 13.0
1.4 2.5 22.9 1985 20.0 3.5
0.9 0.8 25.2
1986 7.8 7.0
1.9 5.0 21.7 1987 9.0 10.0
1.1 20.1
1988 10.1 9.0
0.4 0.5 20.0 1989 11.5 12.0
1.2 0.5 25.2
1990 8.8 17.0
1.8 0.2 27.8 1991 9.7 10.2 b 1.9 0.7 22.5 1992 7.8 9.3 b 1.9 4.9 23.9 1993 6.4 4.0 b 2.0 12.4 1994 9.5 0.8 b 0.8 11.1 1995 10.1 1.1 b 2.4 13.6 1996 6.5 3.0 b 2.9 1.8 14.2 1997 8.5 2.3 b 1.5 12.3 1998 12.6 1.9
4.1 18.6
1999 15.7 2.9
8.8 2.2 29.6 2000 10.9 4.8
3.3 1.5 20.5
2001 5.4 0.3
2.7 2.5 10.9 2002 16.7 4.7
3.2 3.3 27.9
2003 12.8 13.8
11.8 2.6 41.0 2004 14.0 17.0
7.2 0.8 39.0
2005 6.0 14.5 c 1.7 3.9 26.1 2006 17.7 13.9 c 0.3 31.9 2007 11.2 18.3 c 3.8 0.1 33.5 2008 5.6 11.3 c 3.2 0.2 20.3 2009 15.1 15.3 c 2.2 0.1 32.7 2010 11.3 17.3 c 1.2 0.1 29.9 2011 0.4 10.3 c 3.4 1.6 15.8 2012 3.1 16.5 c 0.8 1.1 21.5 2013 4.0 11.3 c 1.5 0.1 17.0 2014 18.1 17.8 c 4.3 0.2 40.3 Previous 10-yr avg 9.2 14.7 2.2 0.8 27.0
2015 3.5 19.1 c 2.9 1.2 26.7 Note: Unless otherwise noted, estimated escapements are derived from aerial surveys. a “Ursus Cove” is the sum of Ursus Lagoon RH Creek and Ursus Lagoon Creek. b Escapement derived from weir counts. c Escapement derived from a combination of weir, video counts, and/or aerial counts.
138
APPENDIX E: SUBSISTENCE, PERSONAL USE AND HOMEPACK HARVESTS
139

Appendix E1.–Subsistence net and rod and reel salmon harvest in numbers of fish by species for the village of Port Graham, Lower Cook Inlet, 1979–2015.
Reported Harvest
Year Households
Reporting Chinook
salmon Sockeye salmon
Coho salmon
Pink salmon
Chum salmon
Dolly Varden
Total salmon
1979 222 777 506 1,170 494 0 3,169 1980 1981 116 1,694 625 298 150 0 2,883 1982 34 107 820 602 858 183 15 2,570 1983 30 67 1,026 431 174 95 1 1,793 1984 23 27 2,037 125 269 6 0 2,464 1985 23 141 481 91 32 24 0 769 1986 27 123 274 179 237 13 12 826 1987 33 20 219 575 230 70 20 1,114 1988 27 96 411 459 542 75 18 1,583 1989 20 51 94 460 640 58 159 1,303 1990 32 211 524 803 1,013 102 666 2,653 1991 33 155 58 541 1,494 185 257 2,433 1992 36 129 98 475 745 178 398 1,625 1993 31 253 154 346 997 135 214 1,885 1994 42 273 260 859 866 461 1,133 2,719 1995 a 49 486 379 369 786 376 66 2,396 1996 48 255 684 341 312 251 161 1,843 1997 25 202 324 203 497 152 57 1,378 1998 16 164 271 243 459 240 20 1,377 1999 21 383 382 427 150 214 64 1,556 2000 35 241 784 252 355 483 0 2,115 2001 15 104 176 57 20 32 0 389 2002 23 250 417 90 150 74 0 981 2003 16 321 1,991 425 266 150 87 3,153 2004 b 50 283 572 514 363 130 0 1,862 2005 46 265 192 51 349 52 0 909 2006 14 192 31 1 26 24 207 274 2007 24 92 552 0 74 63 12 781 2008c 18 77 550 0 36 22 37 685 2009 25 33 1,982 132 49 69 40 2,265 2010 16 30 116 124 24 37 0 331 2011 15 35 684 107 132 150 0 1,108 2012 7 24 661 14 282 26 0 1,007 2013 10 15 1,034 66 27 86 0 1,228 2014 7 19 1,089 166 410 922 0 2,606
Previous 10-year Average
18 78 689 66 141 145 42 1,119
2015 4 36 842 47 539 872 0 2,336 Source: Data on file with ADF&G, Division of Subsistence; gear types include set gillnet, rod/reel, and handline. a Salmon totals and permits include 3 reports from nonresidents of Port Graham Village. b ADF&G Division of Subsistence estimate. c Harvest reports for 2008 incomplete.
140

Appendix E2.–Subsistence net and rod and reel salmon harvest in numbers of fish by species for the village of Nanwalek (formerly English Bay), Lower Cook Inlet, 1978–2015.
Year Households
reporting Chinook
salmon Sockeye salmon
Coho salmon
Pink salmon
Chum salmon
Dolly Varden
Total salmon
1978
1979 137 1,545 2,437 2,186 305 0 6,610
1980
1981 24 1,075 314 621 19 0 2,053
1982 27 17 1,534 891 2,074 37 75 4,553 1983 16 0 1,454 40 13 0 0 1,507 1984 1 18 1,225 385 404 0 0 2,032 1985 1 5 696 530 313 2 0 1,546 1986 17 2 373 302 825 1 144 1,503 1987 22 1 682 339 484 44 20 1,550 1988 21 8 610 385 1,214 35 70 2,252 1989 24 0 63 695 855 16 523 1,629 1990 28 54 638 614 1,947 49 2,833 3,302 1991 30 8 630 1,512 3,093 36 848 5,279 1992 35 71 437 675 676 58 1,331 1,917 1993 25 24 994 567 1,666 122 577 3,373 1994 28 27 570 511 1,113 43 473 2,264 1995 38 99 1,416 169 487 0 465 2,171 1996 27 55 1,060 598 437 25 221 2,175 1997 1 0 1 0 14 1 0 16 1998 3 5 18 0 0 0 31 23 1999 32 102 2,775 1,320 1,873 890 631 6,960 2000 32 18 3,880 1,579 1,251 471 7,199 2001 34 29 909 1,238 1,434 196 3,806 2002 56 96 10,203 967 1,681 414 230 13,361 2003 35 144 3,221 513 1,306 381 102 5,565 2004 24 52 2,968 842 1,277 95 291 5,234 2005 23 27 1,934 1,142 1,259 128 605 4,490 2006 39 111 2,215 1,179 2,038 207 679 5,750 2007 2008 53 46 3,615 1,345 2,646 76 315 7,728 2009 19 11 1,515 396 865 71 420 2,858 2010 20 0 1,514 1,324 1,030 271 365 4,139 2011 41 18 5,009 1,381 2,499 362
9,269
2012a 1 0 300 400 200 5 50 905 2013 a 4 2 3,854 2,619 383 811 500 7,669 2014 a 3 3 377 0 4 143 0 527
Previous 10-yr average
23 24 2,259 1,087 1,214 230 367 4,815
2015 a 1 35 35 Source: Data on file with ADF&G, Division of Subsistence; gear types include set gillnet, rod/reel, and handline. a Limited reporting from Nanwalek residents in 2012 - 2015 may have resulted in a conservative estimate of harvest.
141

Appendix E3.–Salmon set gillnet harvest in numbers of fish by species and permit/effort information for the Seldovia area subsistence fishery, Lower Cook Inlet, 1997–2015.
Permits Reported harvest Year Issued Returned Fished Not Fished Chinook Sockeye Coho Pink Chum Total
Early Season: April–Maya 1997 19 16 12 4 44 19 0 0 0 63
1998 20 19 10 9 132 61 0 8 0 201 1999 16 15 12 3 150 130 0 0 38 318 2000 28 21 17 4 189 249 0 0 14 452 2001 19 17 14 3 134 124 0 0 0 258 2002 20 18 12 6 123 222 0 0 3 348 2003 19 13 10 3 67 210 0 1 54 332 2004 13 10 9 1 91 63 0 0 15 169 2005 15 13 4 9 46 0 0 0 0 46 2006 15 12 6 6 12 10 0 1 0 23 2007 15 12 5 7 19 27 0 0 0 46 2008 10 8 3 5 3 15 0 0 0 18 2009 6 5 1 4 14 0 0 0 0 14 2010 11 8 2 6 0 54 0 0 0 54 2011 4 2 1 1 0 49 0 0 0 49 2012 16 6 2 4 3 26 0 0 0 29 2013 7 5 4 1 1 93 0 0 0 93 2014 12 8 4 4 3 69 0 0 2 74
Prev 10-yr average 11 8 3 5 10 34 0 0 0 54
2015 6 4 4 0 16 70 0 4 0 90
Late Season: Augustb 1997 1 1 0 1 0 0 0 0 0 0
1998 3 2 1 1 0 0 0 0 0 0 1999 0 0 0 0 0 0 0 0 0 0 2000 0 0 0 0 0 0 0 0 0 0 2001 0 0 0 0 0 0 0 0 0 0 2002 1 1 1 0 0 9 13 31 6 59 2003 1 1 1 0 0 10 1 12 1 24 2004 1 1 1 0 0 0 4 0 0 4 2005 3 2 2 0 0 70 13 93 12 188 2006 2 2 1 1 0 0 0 21 0 21 2007 4 4 3 1 0 24 9 80 27 140 2008 2 2 2 0 0 16 41 65 5 127 2009 12 9 8 1 0 78 10 44 14 146 2010 5 4 3 1 2 46 31 66 35 180 2011 3 2 1 1 0 6 0 10 0 16 2012 4 1 1 0 0 3 0 20 0 23 2013 5 3 3 0 1 5 1 45 10 62 2014 9 7 6 1 2 47 0 5 63 117
Prev 10-yr average 5 4 3 1 1 30 11 45 17 102
2015 2 2 0 2 0 0 0 0 0 0 Source: Data on file with ADF&G, Division of Subsistence; gear types include set gillnet, rod/reel, and handline. a Early season dates in 1996 and 1997 from April 1 to May 20; subsequent years were from April 1 to May 30. b Late season dates are restricted to the first 2 weekends in August.
142

Appendix E4.–Personal use/subsistence set gillnet salmon harvest in numbers of fish by species and effort, Southern District (excluding the Port Graham/Nanwalek subsistence fishery and the Seldovia subsistence fishery), Lower Cook Inlet, 1975–2015.
Permits
Reported harvest
Year Issued Returned Fished Not fished Chinook Sockeye Coho Pink Chum Other Total 1975 292 276 221 55 4 47 1,960 632 61 95 2,799 1976 242 221 138 83 16 46 1,962 1,513 56 75 3,668 1977 197 179 137 42 12 46 2,216 639 119 84 3,116 1978 311 264 151 113 4 35 2,482 595 34 89 3,239 1979 437 401 238 163 6 37 2,118 2,251 41 130 4,583 1980 533 494 299 195 43 32 3,491 1,021 25 153 a 4,765 1981 403 383 283 100 15 73 4,370 718 68 0 5,244 1982 395 372 301 71 41 49 7,398 956 154 0 8,598 1983 344 328 210 118 5 17 2,701 305 44 2 3,074 1984 368 346 219 127 3 25 3,639 804 105 27 4,603 1985 328 302 205 97 5 49 3,317 138 34 3 3,546 1986 349 310 247 63 7 68 3,831 3,132 56 0 7,094 1987 363 339 250 89 5 50 3,979 279 61 0 4,374 1988 439 417 300 117 14 73 5,007 1,445 75 0 6,614 1989 477 453 333 120 41 156 7,219 883 53 49 8,401 1990 578 543 420 123 12 200 8,323 1,846 69 0 10,450 1991 472 459 295 164 8 47 4,931 366 23 0 5,375 1992 365 350 239 111 5 63 2,277 643 21 0 3,009 1993 326 317 215 102 6 44 1,992 463 18 0 2,523 1994 286 284 224 60 66 80 4,097 1,178 18 0 5,439 1995 235 232 178 54 118 108 2,916 343 7 0 3,492 1996 299 293 213 80 302 102 3,347 1,022 24 0 4,797 1997 276 264 186 78 384 191 1,817 257 12 0 2,661 1998 227 214 142 72 135 20 1,461 167 5 0 1,788 1999 146 141 111 30 276 119 1,803 168 3 0 2,369 2000 213 206 151 55 104 28 2,064 304 4 0 2,504 2001 154 148 112 34 86 27 1,579 150 16 0 1,858 2002 122 113 93 20 61 33 1,521 251 12 0 1,878 2003 104 96 72 24 17 57 1,071 170 9 0 1,324 2004 91 83 65 18 7 56 1,554 172 16 0 1,805 2005 108 96 69 27 8 57 833 296 13 0 1,207 2006 89 82 62 20 15 41 1,295 221 5 0 1,577 2007 141 133 95 38 10 113 1,431 641 34 0 2,229 2008 146 142 107 35 2 92 1,844 687 14 0 2,639 2009 145 142 90 52 9 273 646 101 4 1 1,034 2010 128 122 82 41 14 149 875 251 17 0 1,306 2011 119 112 81 31 15 223 806 145 5 3 1,197 2012 98 95 69 26 5 137 1,471 275 6 0 1,894 2013 123 118 89 29 9 122 1,732 135 3 0 2,001 2014 160 154 115 39 13 310 2,273 20 178 0 2,794 Prev. 10-year Avg 126 120 86 34 10 152 1,321 277 28 0 1,788
2015 136 131 91 40 10 509 1,373 152 22 6 2,072 Note: Figures after 1991 include information from both returned permits and inseason oral reports. a Steelhead trout Oncorhynchus mykiss.
143

Appendix E5.–Summary of personal use/subsistence salmon gillnet permit holders in the Southern District of Lower Cook Inlet (excluding the Port Graham/Nanwalek subsistence fishery and the Seldovia subsistence fishery) by area of residence, 1990–2015.
Homer/ Anchorage Halibut Anchor Pt./ Seldovia
Pt.
Graham/ Kenai/ Other
Total
Fritz Cr.
Areaa
Cove
Ninilchik
Nanwalek
Soldotna
Permits
Year No. % No. % No. % No. % No. % No. % No. % No. % Issued 1990 441 76.3
36 6.2
5 0.9
65 11.2
12 2.1
0 0.0
6 1.0
13 2.2
578
1991 384 81.4
27 5.7
8 1.7
41 8.7
6 1.3
0 0.0
4 0.8
2 0.4
472 1992 302 82.7
21 5.8
5 1.4
32 8.8
3 0.8
0 0.0
1 0.3
1 0.3
365
1993 242 74.2
25 7.7
5 1.5
44 13.5
3 0.9
0 0.0
5 1.5
2 0.6
326 1994 235 82.2
20 7.0
4 1.4
21 7.3
1 0.3
0 0.0
1 0.3
4 1.4
286
1995 191 81.3
15 6.4
7 3.0
20 8.5
1 0.4
0 0.0
0 0.0
1 0.4
235 1996 241 80.6
16 5.4
7 2.3
26 8.7
3 1.0
1 0.3
2 0.7
3 1.0
299
1997 232 84.1
13 4.7
3 1.1
20 7.2
4 1.4
0 0.0
1 0.4
3 1.1
276 1998 175 77.1
18 7.9
2 0.9
24 10.6
5 2.2
0 0.0
2 0.9
1 0.4
227
1999 96 65.8
18 12.3
1 0.7
23 15.8
3 2.1
0 0.0
4 2.7
1 0.7
146 2000 168 78.9
15 7.0
2 0.9
21 9.9
4 1.9
0 0.0
1 0.5
2 0.9
213
2001 109 70.8
10 6.5
3 1.9
20 13.0
5 3.2
0 0.0
4 2.6
3 1.9
154 2002 85 70.2
7 5.8
3 2.5
14 11.6
6 5.0
0 0.0
5 4.1
1 0.8
121
2003 74 71.2
9 8.7
2 1.9
11 10.6
4 3.8
0 0.0
4 3.8
0 0.0
104 2004 70 76.9
9 9.9
2 2.2
7 7.7
2 2.2
0 0.0
1 1.1
0 0.0
91
2005 80 74.1
12 11.1
2 1.9
8 7.4
1 0.9
0 0.0
3 2.8
2 1.9
108 2006 74 84.1
6 6.8
1 1.1
4 4.5
0 0.0
0 0.0
2 2.3
1 1.1
88
2007 116 82.3
11 7.8
3 2.1
7 5.0
0 0.0
0 0.0
1 0.7
3 2.1
141 2008 121 82.9
3 2.1
2 1.4
13 8.9
2 1.4
0 0.0
3 2.1
2 1.4
146
2009 107 73.8
11 7.6
1 0.7
19 13.1
2 1.4
0 0.0
5 3.4
0 0.0
145 2010 103 80.5
8 6.3
1 0.8
9 7.0
2 1.6
0 0.0
5 3.9
0 0.0
128
2011 87 68.0
13 10.2
2 1.6
9 7.0
2 1.6
0 0.0
6 4.7
0 0.0
119 2012 75 76.5
7 7.1
1 1.0
10 10.2
0 0.0
0 0.0
5 5.1
0 0.0
98
2013 102 82.9 9 7.3 0 0.0 7 5.7 0 0.0 0 0.0 5 4.1 0 0.0 123 2014 125 78.1 13 8.1 1 0.6 11 6.9 1 0.6 0 0.0 8 5.0 1 0.6 160
Previous 10-year Average
99 78.3 9 7.4 2 1.1 10 7.6 1 0.7 0 0 4 3.4 1 0.7 125.6
2015 112 82.4 12 8.8 0 0.0 9 6.6 0 0.0 0 0.0 3 2.2 0 0.0 136 a After 1989, “Anchorage Area” includes Mat-Su Valley, Eagle River, Chugiak, and/or Fort Richardson.
144

Appendix E6.–Historical harvest and numbers of permits actively fished by area for the Southern District personal use coho salmon set gillnet fishery, 1981–2015.
Troublesome
Creek to tip of Homer Spit
East side of Homer Spit
Mud Bay to Fritz Creek
Fritz Creek to Swift Creek
Bear Cove to Neptune Bay
Neptune Bay to Little Tutka Bay
Year Permits Coho Permits Coho Permits Coho Permits Coho Permits Coho Permits Coho 1981 68
419
1,239
2,382
259
3
1982 118
471
3,307
3,260
237
5 1983 18
126
944
1,319
202
92
1984 25
274
1,686
1,517
102
35 1985 119
87
1,218
1,681
261
51
1986 36
490
1,415
1,651
166
73 1987 101
590
1,103
1,953
180
52
1988 78
472
1,248
2,769
384
56 1989 234
1,259
1,591
3,455
616
74
1990 287
2,117
1,748
3,478
465
228 1991 328
1,585
798
1,873
245
51
1992 37
938
464
719
116
18 1993 86
881
295
627
74
29
1994 211
1,413
596
1,558
314
5 1995 414
1,124
372
769
202
35
1996 16 220
85 1,871
39 364
38 603
32 272
3 17 1997 19 149
81 1,294
36 133
32 134
13 83
5 24
1998 10 86
77 1,062
29 162
10 39
13 75
3 37 1999 4 25
67 1,225
11 123
4 43
16 286
9 101
2000 11 210
84 1,372
18 169
15 126
16 120
7 67 2001 12 94
55 920
10 90
8 185
19 189
10 101
2002 11 212
38 624
13 99
8 195
13 201
10 190 2003 7 81
29 627
10 57
7 43
12 135
7 128
2004 2 75
23 610
8 131
9 228
15 365
8 145 2005 4 23
27 305
4 43
8 126
16 190
10 146
2006 1 20
20 388
9 179
9 248
18 375
5 85 2007 0 0
24 179
11 153
32 885
20 170
8 44
2008 1 28
23 322
30 368
25 776
16 259
12 91 2009 5 29
12 39
15 52
32 310
18 187
8 29
2010 0 0
15 118
18 65
38 466
28 194
13 32 2011 3 31
15 54
10 49
44 536
27 103
14 33
2012 3 0
11 72
13 32
42 1,202
19 140
7 25 2014 5 52
27 591
22 574
37 780
13 194
10 82
Previous 10-year Average
2 18 19 211 15 165 32 658 20 203 10 65
2015 3 4
23 264
19 279
28 647
13 117
4 32
145

Appendix E7.–Salmon retained from the commercial harvest for personal use (homepack) by species and gear type from Lower Cook Inlet districts, 1996–2015.
Permits Chinook salmon Sockeye salmon Coho salmon Pink salmon Chum salmon
Set Purse Set Purse Set Purse Set Purse Set Purse Set Purse Year gillnet seine gillnet seine gillnet seine gillnet seine gillnet seine gillnet seine 1996 1 2 6 19 32 5 1997 1 1 11 1998 1999 2000 2001 2002 1 20 100 3 2003 2 3 2 750 2004 1 2 38 10 9 4 2005 3 1 7 79 10 38 121 8 2006 4 3 9 58 169 73 17 72 13 7 2007 4 1 204 76 3 2008 2 39 7 40 6 2009 3 1 35 14 23 9 2010 2 2 29 4 3 2011 3 1 2 3 62 3 487 27 2012 7 4 63 61 323 31 2013 6 16 155 150 157 13 2014 8 1 10 180 3 128 318 17
Previous 10-year average
4 1 5 1 90 36 55 3 154 13 1
2015 16 4 60 7 158 120 417 62 99 302 28 Note: No homepacks from commercial harvest reported before 1996. Regulations requiring reporting of fish harvested but not
sold (5 AAC 39.130(c)(10)) on fish tickets established in 2008.
146

Appendix E8.–Lower Cook Inlet commercial homepack and personal use harvest by permit holder community of residence, 2015.
Commercial Homepacka Community Permits Chinook Sockeye Coho Pink Chum Total Homer
9 44 137 363 310 2 856
Seldovia
10 23 121 116 89 26 375 Anchorage 1 20 2 22 USA balance
0 0 0 0 0 0 0
Total 20 67 278 479 401 28 1,253
Southern District Personal Use set gillnet fishery b
Permits Chinook Sockeye Coho Pink Chum Total
Community issued returned salmon salmon salmon salmon salmon salmon Anchorage area 11
10 2 55 130 39 4 230
Anchor Pt./Ninilchik/Nikolaevsk 10
10
56 55 7
118 Fairbanks 0
0
Halibut Cove 0
0 Homer 112
108 8 366 1,176 99 15 1,664
Kenai/Soldotna 3
3
32 12 7 3 54 Pt.Graham/Nanwalek 0
0
Seldovia 0
0 Total 136 131 10 509 1,373 152 22 2,066
Port Graham/Nanwalek subsistence fishery c
Permits Chinook Sockeye Coho Pink Chum Total
Community issued returned salmon salmon salmon salmon salmon salmon Anchorage area 2 2 2 132 2 35 102 273 Homer 0 0
Nanwalek 9
1
34
34 Port Graham 18
2 34 710 45 504 770 2,063
Valdez 1 0 Total 40 5 36 877 47 539 872 2,371
Seldovia subsistence fishery d,e
Permits Chinook Sockeye Coho Pink Chum Total
Community issued returned salmon salmon salmon salmon salmon salmon Anchorage area 0
0
Homer 0
0 Nanwalek 0
0
Ninilchik 1
0 Pt.Graham/Nanwalek 0
0
Seldovia 7
6 16 70
4
90 Total 8 6 16 70
4
90
a Homepack fish as defined in 5 AAC 39.010 as finfish retained from lawfully taken commercial catch for that person’s own use.
b As defined in 5 AAC 77.549 Personal Use Coho Salmon Fishery Management Plan. c Defined as subsistence harvest from the Port Graham and Nanwalek Sections of the Port Graham Subdistrict in the Southern
District. d Defined as subsistence harvest from the Seldovia Subdistrict in the Southern District. e Includes harvests from both early and late season Seldovia subsistence fisheries.
147

148
149
APPENDIX F: HATCHERY PRODUCTION AND RETURNS

150
Appendix F1.–Summary of salmon runs to Lower Cook Inlet hatchery release sites, 2015.
Sockeye salmon BY 2010 BY 2011 2015 Estimated Estimated Broodstock Estimated 2015
Release Release Forecast CPFb Sales Harvestc & Unharvested Total EggsHatchery or release site, (hatchery a) Run Contribution Contribution Contribution Run CollectedBear Lake and Resurrection Bay, (TLH) 3,794,000 4,580,000 322,737 4,633 94,838 13,505 112,976 5,148,399Hidden Lake, (TLH) 1,044,000 948,000 35,673 15,711 600 12,736 29,047 1,445,598Leisure and Hazel lakes, (TLH) 2,659,000 3,314,000 27,944 23,477 0 36 23,513 0Kirschner Lake, (TLH) 160,000 300,000 39,500 0 23,571 3,666 27,237 401,073English Bay Lakes, (TLH) 203,300 213,000 1,696 unknown 0 6,416 unknown 0Tutka Bay Lagoon, (TLH)d 371,300 511,000 48,160 45,582 32,455 6,769 84,806 740,610Port Graham Hatchery, (TLH) 0 102,000 5,100 29 0 0 29 0Total Sockeye Salmon 8,231,600 9,968,000 480,810 89,432 151,464 43,128 277,608 7,735,680
Coho salmon BY 2012 2015 Estimated Estimated Broodstock Estimated
Release Forecast CPF Sales Harvest & Unharvested Total EggsHatchery or release site, (hatchery) Run Contribution Contribution Contribution Run Collected
Bear Lake and Resurrection Bay, (TLH) 460,000 10,094 NA 983 936 NA 575,260
Total Coho Salmon 460,000 10,094 NA 0 936 NA 575,260
Pink salmon
BY 2013 2015 Estimated Estimated Broodstock Estimated Release Forecast CPF Sales Harvest & Unharvested Total Eggs
Hatchery or release site, (hatchery) Run Contribution Contribution Contribution Run CollectedTutka Bay Lagoon Hatchery (TBLH) 51,110,000 1,533,000 110,298 2,143,277 246,592 2,500,167 29,125,813Port Graham hatchery site (TBLH) 188,000 2,820 0 0 0 0 2,247,953Total Pink Salmon 51,298,000 1,535,820 110,298 2,143,277 246,592 2,500,167 31,373,766
Total-All Salmon 199,730 2,294,741 290,656 2,777,775 39,684,706a TLH = Trail Lakes Hatchery, TBLH = Tutka Bay Lagoon Hatchery. b Common Property Fisheries (CPF) include commercial, sport, personal use, and subsistence harvests. c Hatchery cost recovery sales in number of fish. d Includes hatchery donated fish. Tutka Bay Lagoon Hatchery has not produced sockeye salmon since 2004. Returns of this species are from remote releases from the Trail Lakes
Hatchery. Sockeye salmon eggs collected at this facility were taken back to the Trail Lakes Hatchery for incubation.

151
Appendix F2.–Daily sockeye salmon sales and broodstock collection; sales and broodstock summary in numbers of fish for Cook Inlet Aquaculture Association, 2015.
Sales Harvesta Donated Broodstock Harvest Date Gear Location Daily Cumulative Daily Cumulative Daily Cumulative 5/26 Purse seine Resurrection Bay 501 5015/27 Purse seine Resurrection Bay 906 1,4075/28 Purse seine Resurrection Bay 1,159 2,5665/29 Purse seine Resurrection Bay 739 3,3055/30 Purse seine Resurrection Bay 1,224 4,5295/31 Purse seine Resurrection Bay 1,191 5,7206/1 Purse seine Resurrection Bay 1,763 7,4836/2 Purse seine Resurrection Bay 1,199 8,6826/3 Purse seine Resurrection Bay 760 9,4426/5 Purse seine Resurrection Bay 2,226 11,6686/6 Purse seine Resurrection Bay 2,111 13,7796/7 Purse seine Resurrection Bay 4,940 18,7196/8 Purse seine Resurrection Bay 5,799 24,5186/9 Purse seine Resurrection Bay 3,960 28,4786/11 Purse seine Resurrection Bay 6,414 34,8926/12 Purse seine Resurrection Bay 9,671 44,5636/13 Purse seine Resurrection Bay 5,353 49,9166/14 Purse seine Resurrection Bay 2,473 52,3896/15 Purse seine Resurrection Bay 2,505 54,8946/16 Purse seine Resurrection Bay 1,489 56,3836/17 Purse seine Resurrection Bay 634 57,017
6/12 Weir or beach seine Bear Lake 382 3826/13 Weir or beach seine Bear Lake 870 1,2526/14 Weir or beach seine Bear Lake 1,118 2,3706/15 Weir or beach seine Bear Lake 1,315 3,6856/16 Weir or beach seine Bear Lake 1,873 5,5586/17 Weir or beach seine Bear Lake 1,854 7,4126/18 Weir or beach seine Bear Lake 2,170 9,5826/19 Weir or beach seine Bear Lake 1,131 10,7136/20 Weir or beach seine Bear Lake 2,101 12,8146/21 Weir or beach seine Bear Lake 3,381 16,1956/22 Weir or beach seine Bear Lake 599 16,7946/23 Weir or beach seine Bear Lake 1,431 18,2256/24 Weir or beach seine Bear Lake 1,047 19,2726/25 Weir or beach seine Bear Lake 903 20,1756/26 Weir or beach seine Bear Lake 3,530 23,7056/27 Weir or beach seine Bear Lake 582 24,2876/28 Weir or beach seine Bear Lake 1,361 25,6486/29 Weir or beach seine Bear Lake 528 26,1766/30 Weir or beach seine Bear Lake 691 26,8677/1 Weir or beach seine Bear Lake 690 27,5577/2 Weir or beach seine Bear Lake 896 28,453 20 20 7/3 Weir or beach seine Bear Lake 1,107 29,560 26 46 7/5 Weir or beach seine Bear Lake 1,559 31,119 46 7/6 Weir or beach seine Bear Lake 712 31,831 46 7/7 Weir or beach seine Bear Lake 693 32,524 7 53
-continued-

152
Appendix F2.–Page 2 of 3.
Sales Harvesta Donated Broodstock Date Gear Location Daily Cumulative Daily Cumulative Daily Cumulative 7/8 Weir or beach seine Bear Lake 489 33,013 53 7/9 Weir or beach seine Bear Lake 281 33,294 53 7/10 Weir or beach seine Bear Lake 693 33,987 53 7/11 Weir or beach seine Bear Lake 1,072 35,059 19 72 7/12 Weir or beach seine Bear Lake 234 35,293 72 7/13 Weir or beach seine Bear Lake 466 35,759 72 7/14 Weir or beach seine Bear Lake 206 278 7/15 Weir or beach seine Bear Lake 360 638 7/16 Weir or beach seine Bear Lake 366 1,004 7/17 Weir or beach seine Bear Lake 182 1,186 7/18 Weir or beach seine Bear Lake 30 1,216 7/23 Weir or beach seine Bear Lake 59 1,275 7/24 Weir or beach seine Bear Lake 111 1,386 7/25 Weir or beach seine Bear Lake 42 1,428 7/26 Weir or beach seine Bear Lake 65 1,493 7/27 Weir or beach seine Bear Lake 1,493 266 2667/28 Weir or beach seine Bear Lake 54 1,547 570 8367/29 Weir or beach seine Bear Lake 173 1,720 308 1,1447/30 Weir or beach seine Bear Lake 27 1,747 572 1,7167/31 Weir or beach seine Bear Lake 113 1,860 576 2,2928/1 Weir or beach seine Bear Lake 88 1,948 408 2,7008/2 Weir or beach seine Bear Lake 66 2,014 411 3,1118/3 Weir or beach seine Bear Lake 48 2,062 420 3,5318/4 Weir or beach seine Bear Lake 2,062 414 3,945
6/22 Purse seine Tutka Bay 430 4306/25 Purse seine Tutka Bay 793 1,2236/29 Purse seine Tutka Bay 2,290 3,5137/2 Purse seine Tutka Bay 18 18 2,461 5,9747/5 Purse seine Tutka Bay 2,060 2,078 101 6,0757/6 Purse seine Tutka Bay 1,985 4,063 6,0757/8 Purse seine Tutka Bay 4,825 8,888 0 6,0757/9 Purse seine Tutka Bay 3,377 12,265 6,0757/10 Purse seine Tutka Bay 1,133 13,3987/13 Purse seine Tutka Bay 1,592 14,990 0 6,0757/14 Purse seine Tutka Bay 1,576 16,566 6,0757/15 Purse seine Tutka Bay 767 17,333 129 6,2047/16 Purse seine Tutka Bay 217 6,4217/17 Purse seine Tutka Bay 5,064 22,397 6,4217/18 Purse seine Tutka Bay 120 6,5417/19 Purse seine Tutka Bay 2,015 24,412 6,5417/21 Purse seine Tutka Bay 438 24,850 6,5417/23 Purse seine Tutka Bay 2,951 27,801 6,5417/24 Purse seine Tutka Bay 1,118 28,919 6,5417/25 Purse seine Tutka Bay 500 29,419 6,5417/26 Purse seine Tutka Bay 926 30,345 228 6,7697/27 Purse seine Tutka Bay 84 30,429 6,7697/28 Purse seine Tutka Bay 1,765 32,194 6,7698/1 Purse seine Tutka Bay 261 32,455 6,769
-continued-

153
Appendix F2.–Page 3 of 3.
Sales Harvesta Donated Broodstock Date Gear Location Daily Cumulative Daily Cumulative Daily Cumulative 7/10 Purse seine Kirschner Lake 12,988 12,9888/2 Purse seine Kirschner Lake 10,583 23,571 1,666 1,6669/2 Purse seine Kirschner Lake 23,571 2,000 3,666
9/9 Beach seine English Bay Lakes 0 09/15 Beach seine English Bay Lakes 0 09/20 Beach seine English Bay Lakes 0 0
9/16 weir or beach seine Hidden Lakeb 82 829/18 weir or beach seine Hidden Lakeb 82 1649/21 weir or beach seine Hidden Lakeb 120 284
Hatchery escapement summary in numbers of fishc Donated fish (Harv code 37) 2,062Raceway harvest (Harvest code 22) 0Viable broodstock (spawned, eggs in incubators) 6,086Unviable broodstock (green/over-ripe/bad) 140Unspawned fish (e.g., excess males/females) 0Holding mortalities (raceway, pen mortalities) 9,467Estimated unharvested return 0Total hatchery harvest 17,755
Sales summary Whole fish sales (Harv code 21) 148,802Carcass sales (Harv code 22) 0Total sales 148,802a Source: ADF&G fish ticket database. b CIAA projects conducted in Upper Cook Inlet. c Data from CIAA (2015a-b) and ADF&G fish ticket database.

154
Appendix F3.–Daily pink salmon sales and broodstock collection; sales and broodstock summary in numbers of fish for Cook Inlet Aquaculture Association, 2015.
Sales harvesta Broodstock harvestb Date Gear Location Daily Cumulative Daily Cumulative6/22 purse seine Tutka Bay Lagoon 1,461 1,4616/25 purse seine Tutka Bay Lagoon 3,628 5,0896/29 purse seine Tutka Bay Lagoon 3,079 8,1687/2 purse seine Tutka Bay Lagoon 16,691 16,691 9,711 17,8797/5 purse seine Tutka Bay Lagoon 42,735 59,426 5,270 23,1497/6 purse seine Tutka Bay Lagoon 62,641 122,067 23,1497/8 purse seine Tutka Bay Lagoon 38,421 160,488 22,311 45,4607/9 purse seine Tutka Bay Lagoon 34,505 194,993 45,4607/10 purse seine Tutka Bay Lagoon 20,091 215,0847/12 purse seine Tutka Bay Lagoon 38,600 253,684 45,4607/13 purse seine Tutka Bay Lagoon 38,978 292,662 6,952 52,4127/14 purse seine Tutka Bay Lagoon 201,719 494,381 52,4127/15 purse seine Tutka Bay Lagoon 14,919 509,300 8,309 60,7217/16 purse seine Tutka Bay Lagoon 509,300 3,535 64,2567/17 purse seine Tutka Bay Lagoon 191,779 701,079 64,2567/18 purse seine Tutka Bay Lagoon 701,079 6,203 70,4597/19 purse seine Tutka Bay Lagoon 98,034 799,113 70,4597/21 purse seine Tutka Bay Lagoon 48,240 847,353 70,4597/23 purse seine Tutka Bay Lagoon 190,745 1,038,098 70,4597/24 purse seine Tutka Bay Lagoon 67,907 1,106,005 70,4597/25 purse seine Tutka Bay Lagoon 110,431 1,216,436 70,4597/26 purse seine Tutka Bay Lagoon 101,540 1,317,976 70,4597/27 purse seine Tutka Bay Lagoon 11,897 1,329,873 70,4597/28 purse seine Tutka Bay Lagoon 133,175 1,463,048 6,549 77,0088/1 purse seine Tutka Bay Lagoon 52,266 1,515,314 77,0088/2 purse seine Tutka Bay Lagoon 1,515,314 11,000 88,0088/7 purse seine Tutka Bay Lagoon 1,515,314 13,000 101,0088/8 purse seine Tutka Bay Lagoon 74,317 1,589,631 101,0088/9 purse seine Tutka Bay Lagoon 226,777 1,816,408 101,0088/10 purse seine Tutka Bay Lagoon 90,427 1,906,835 13,000 114,0088/16 purse seine Tutka Bay Lagoon 1,906,835 17,000 131,0088/17 purse seine Tutka Bay Lagoon 158,151 2,064,986 131,0088/19 purse seine Tutka Bay Lagoon 22,038 2,087,024 131,0088/20 purse seine Tutka Bay Lagoon 2,087,024 11,000 142,0089/1 purse seine Tutka Bay Lagoon 2,087,024 23,000 165,008
7/10 purse seine Kirschner Lake 121 1218/2 purse seine Kirschner Lake 1,439 1,560
7/27 purse seine Port Graham 9,351c 9,3517/29 purse seine Port Graham 4,825c 14,1767/30 purse seine Port Graham 4,825c 19,0018/5 purse seine Port Graham 907c 19,9089/9 purse seine Port Graham 1,500c 21,408
-continued-

155
Appendix F3.–Page 2 of 2.
Hatchery escapement summary in numbers of fish
Donated fish (Harv code 37) 0
Raceway harvest 0
Viable broodstock (spawned, eggs in incubators) 40,821
Unviable broodstock (green/over-ripe/bad) 13,784
Unspawned fish (e.g., excess males/females) 22,047
Holding mortalities (raceway, pen mortalities) 106,151
Estimated unharvested return 82,400
Total hatchery harvest 265,203
Sales summary
Whole fish sales (Harv code 21) 2,088,584
Carcass sales (Harv code 22) 0
Total sales 2,088,584 a From ADF&G fish ticket database. b Data from CIAA (2015 a-b). c Broodstock harvested by common property permit holder. This is not included in total hatchery harvest.
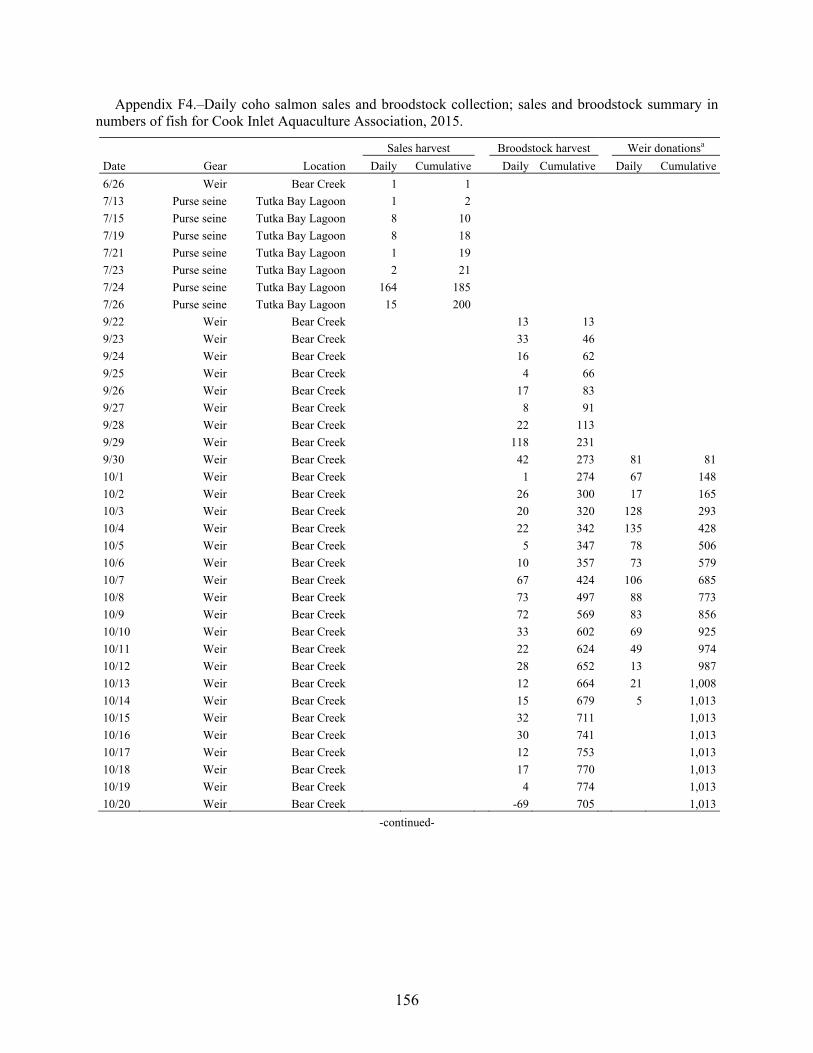
156
Appendix F4.–Daily coho salmon sales and broodstock collection; sales and broodstock summary in numbers of fish for Cook Inlet Aquaculture Association, 2015.
Sales harvest Broodstock harvest Weir donationsa
Date Gear Location Daily Cumulative Daily Cumulative Daily Cumulative
6/26 Weir Bear Creek 1 1
7/13 Purse seine Tutka Bay Lagoon 1 2
7/15 Purse seine Tutka Bay Lagoon 8 10
7/19 Purse seine Tutka Bay Lagoon 8 18
7/21 Purse seine Tutka Bay Lagoon 1 19
7/23 Purse seine Tutka Bay Lagoon 2 21
7/24 Purse seine Tutka Bay Lagoon 164 185
7/26 Purse seine Tutka Bay Lagoon 15 200
9/22 Weir Bear Creek 13 13
9/23 Weir Bear Creek 33 46
9/24 Weir Bear Creek 16 62
9/25 Weir Bear Creek 4 66
9/26 Weir Bear Creek 17 83
9/27 Weir Bear Creek 8 91
9/28 Weir Bear Creek 22 113
9/29 Weir Bear Creek 118 231
9/30 Weir Bear Creek 42 273 81 81
10/1 Weir Bear Creek 1 274 67 148
10/2 Weir Bear Creek 26 300 17 165
10/3 Weir Bear Creek 20 320 128 293
10/4 Weir Bear Creek 22 342 135 428
10/5 Weir Bear Creek 5 347 78 506
10/6 Weir Bear Creek 10 357 73 579
10/7 Weir Bear Creek 67 424 106 685
10/8 Weir Bear Creek 73 497 88 773
10/9 Weir Bear Creek 72 569 83 856
10/10 Weir Bear Creek 33 602 69 925
10/11 Weir Bear Creek 22 624 49 974
10/12 Weir Bear Creek 28 652 13 987
10/13 Weir Bear Creek 12 664 21 1,008
10/14 Weir Bear Creek 15 679 5 1,013
10/15 Weir Bear Creek 32 711 1,013
10/16 Weir Bear Creek 30 741 1,013
10/17 Weir Bear Creek 12 753 1,013
10/18 Weir Bear Creek 17 770 1,013
10/19 Weir Bear Creek 4 774 1,013
10/20 Weir Bear Creek -69 705 1,013
-continued-

157
Appendix F4.–Page 2 of 2.
Sales harvest Broodstock harvest Weir donationsa
Daily Cumulative Daily Cumulative Daily Cumulative
Hatchery escapement summary in numbers of fishb
Donated fish (Harv code 37) 1,013
Raceway harvest (Harvest code 22) 0
Viable broodstock (spawned, eggs in incubators) 280
Unviable broodstock (green/over-ripe/bad) 4
Brood stock for ADF&G “Salmon in the classroom” project 219
Holding mortalities (raceway, pen mortalities) 202
Escapement for hatchery watershed 261
Total hatchery return 1,979
Sales and donation summary
Whole fish sales (Harv code 21) 200
Carcass sale (Harv code 22) 0
Total sales 200a Donated to public at weir by CIAA. Source: ADF&G fish ticket database. b Sixty-nine fish were released into Bear Lake from the brood holding pen.

158
Appendix F5.–Historical harvest contributions, and total run of sockeye and coho salmon to Cook Inlet hatchery release sites, 1978–2015.
Sockeye salmon Coho salmona
Hatchery Hatchery Hatchery Hatchery Total Hatchery Hatchery Hatchery TotalReturn contrib. to contrib. to contrib. to donated hatchery contrib. to contrib. to donated hatchery Year the CCPF broodstock esc. cost recov. run broodstock esc. cost recov. run 1978 100 1001979 299,858 3,974 303,833 7,089 7,0891980 638,058 30,927 668,985 6,376 6,3761981 358,726 9,700 368,4601982 23,990 19,283 45,2181983 151,400 16,103 173,903 1984 231,444 50,800 287,758 4,620 4,6201985 415,493 179,400 608,252 5,335 5,3351986 808,503 12,020 841,552 1,938 1,9381987 521,349 34,600 572,648 300 3001988 676,669 594 686,1841989 251,532 12,000 78,731 356,2631990 370,195 2,708 8,513 389,059 5,855 5,8551991 479,910 86,650 3,604 590,136 6,035 6,0351992 378,823 24,103 9,198 420,374 689 1,234 1,9231993 459,756 38,231 37,620 551,457 678 7,199 7,8771994 205,837 17,655 51,140 277,632 731 4,967 5,6981995 260,844 6,010 63,404 344,048 1996 348,846 5,455 76,272 445,157 608 723 1,3311997 184,409 1,645 90,464 284,310 594 2,690 3,2841998 110,659 3,561 81,889 211,166 780 9,905 10,6851999 968,473 16,317 182,311 1,236,748 939 2,499 3,4382000 216,149 17,681 94,666 13,690 356,263 976 5,370 5,146 11,4922001 656,309 17,773 67,786 7,343 840,524 644 1,754 1,758 4,1562002 754,609 19,744 85,830 1,364 966,783 1,044 2,352 1,436 4,8322003 1,080,584 20,311 124,388 2,275 1,306,299 1,234 2,228 1,816 5,2782004 1,112,259 11,167 29,943 1,251,938 972 1,224 1,215 3,4112005 924,377 7,379 74,673 1,302 1,104,598 953 1,536 1,518 4,0072006 382,433 14,600 77,590 784 514,373 754 600 1,511 2,8652007 345,027 12,754 57,305 271 450,136 608 6082008 134,226 7,658 88,836 201 245,704 525 350 402 1,277
-continued-

159
Appendix F5.–Page 2 of 2.
Sockeye salmon Coho salmon
Hatchery Hatchery Hatchery Hatchery Total Hatchery Hatchery Hatchery TotalReturn contrib. to contrib. to contrib. to donated hatchery contrib. to contrib. to donated hatchery
Year the CCPF broodstock esc. cost recov. run broodstock esc. cost recov. run 2009 26,798 10,403 174,980 782 235,419 483 0 138 6212010 78,645 10,214 69,833 465 194,834 452 0 220 6722011 94,153 7,572 159,860 211 261,585 454 0 385 8392012 0 12,035 114,593 254 126,628 578 0 321 8992013 10,732 9,364 71,913 1,129 93,138 354 0 2,044 2,3982014 8,374 10,318 172,400 1,671 192,763 383 0 671 1,054
Previous 10-yr avg
222,752 10,230 106,198 707 341,918 554 829 801 1,524
2015 4,633 15,693 143,544 2,062 165,932 486 1 727 1,214Note: Harvest estimates of hatchery fish are from CIAA (2015 a-b). a Historic return locations documented were Bear Lake, Fritz Creek, Halibut Cove Lagoon, Grouse Lake, Caribou Lake, Homer Spit, Resurrection Bay, and Seldovia. Releases of
hatchery coho salmon in LCI began in 1966. No returns were documented prior to 1978. Includes CIAA Trail Lake Hatchery production and F&G Ship Creek Complex production.

160
Appendix F6.–Estimated historical harvest contributions and total runs of pink salmon to greater Cook Inlet hatchery release sites, 1978–2015.
Hatchery Hatchery Hatchery Hatchery Total EstimatedReturn Brood Fry contribution contribution contribution donated hatchery marineyear year release to the CCPF cost recovery broodstock esc. run survival1978 1976 318,280 3,700 3,700 1.16%1979 1977 4,820,937 369,000 369,000 7.65%1980 1978 9,243,717 315,000 315,000 3.41%1981 1979 6,795,244 963,350 47,279 1,010,629 14.87%1982 1980 10,268,753 181,400 4,400 185,800 1.81%1983 1981 15,475,435 577,200 577,200 3.73%1984 1982 15,232,750 230,000 230,000 1.51%1985 1983 18,142,463 463,600 463,600 2.56%1986 1984 23,818,500 380,135 55 50 380,240 1.60%1987 1985 26,265,176 84,500 84,500 0.32%1988 1986 8,278,967 836,000 836,000 10.10%1989 1987 15,589,360 877,600 877,600 5.63%1990 1988 36,977,190 167,400 167,400 0.45%1991 1989 36,974,370 204,800 204,800 0.55%1992 1990 30,602,576 97,577 276,000 69,000 442,577 1.45%1993 1991 33,760,487 228,376 409,431 102,000 739,807 2.19%1994 1992 48,700,000 604,037 959,064 153,966 1,717,067 3.53%1995 1993 62,395,000 1,210,572 1,213,322 182,348 2,606,242 4.18%1996 1994 63,358,000 19,510 423,306 140,152 582,968 0.92%1997 1995 111,469,975 172,262 2,465,108 188,197 2,825,567 2.53%1998 1996 89,918,000 507,850 787,538 175,468 1,470,856 1.64%1999 1997 90,000,000 222,228 857,902 151,903 1,232,033 1.37%2000 1998 64,797,691 8,580 1,043,705 269,808 1,322,093 2.04%2001 1999 66,287,812 108,735 421,530 198,148 728,413 1.10%2002 2000 126,635,207 9,791 1,041,529 252,777 1,304,097 1.03%2003 2001 105,971,985 2,924 616,155 261,457 590 881,126 0.83%2004 2002 125,167,000 1,523 2,459,189 117,222 2,577,934 2.06%2005 2003 84,247,031 4,779 2,138,538 84,088 2,227,405 2.64%2006 2004 26,567,983 5,000 246,781 27,741 279,522 1.05%2007 2005 13,883,682 112,801 112,801 0.81%2008 2006 13,282,049
-continued-

Appendix F6.–Page 2 of 2.
Hatchery Hatchery Hatchery Hatchery Total Estimated Return Brood Fry contribution contribution contribution donated hatchery marine year year release to the CCPF b cost recovery broodstock esc. return survival 2009 2007 0 0 0 0 0 2010 2008 0 0 0 0 0 2011 2009 0 0 0 0 0 2012 2010 0 0 0 0 0 2013 2011 11,246,399 0 48,017 143,884 0 191,901 1.71% 2014 2012 18,603,000 0 32 28,739 0 28,771 0.15% 2015 2013 51,298,000 0 2,087,024 165,008 0 2,252,032 4.39% 2016 2014 14,474,300
Note: Harvest estimates of hatchery fish are from CIAA (2015 a and b). CCPF = Commercial Common Property Fleet.
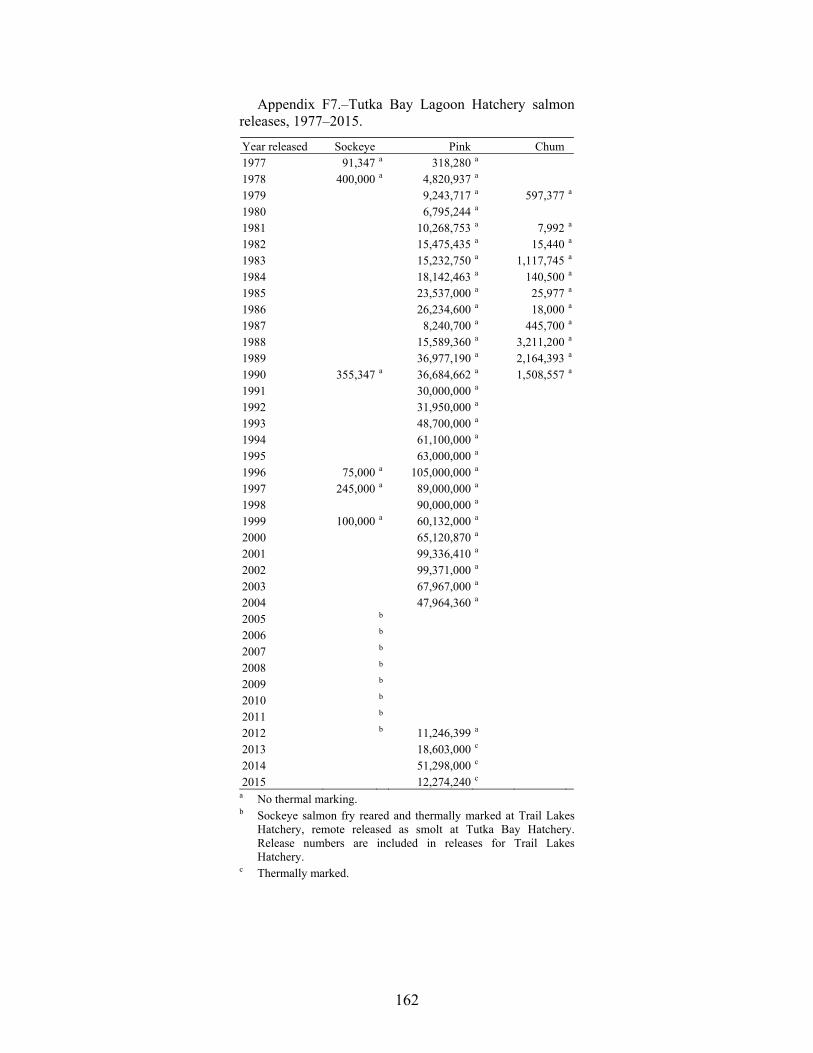
162
Appendix F7.–Tutka Bay Lagoon Hatchery salmon releases, 1977–2015.
Year released Sockeye Pink Chum1977 91,347 a 318,280 a 1978 400,000 a 4,820,937 a 1979 9,243,717 a 597,377 a 1980 6,795,244 a 1981 10,268,753 a 7,992 a 1982 15,475,435 a 15,440 a 1983 15,232,750 a 1,117,745 a 1984 18,142,463 a 140,500 a 1985 23,537,000 a 25,977 a 1986 26,234,600 a 18,000 a 1987 8,240,700 a 445,700 a 1988 15,589,360 a 3,211,200 a 1989 36,977,190 a 2,164,393 a 1990 355,347 a 36,684,662 a 1,508,557 a 1991 30,000,000 a 1992 31,950,000 a 1993 48,700,000 a 1994 61,100,000 a 1995 63,000,000 a 1996 75,000 a 105,000,000 a 1997 245,000 a 89,000,000 a 1998 90,000,000 a 1999 100,000 a 60,132,000 a 2000 65,120,870 a 2001 99,336,410 a 2002 99,371,000 a 2003 67,967,000 a 2004 47,964,360 a 2005 b 2006 b 2007 b 2008 b 2009 b 2010 b 2011 b 2012 b 11,246,399 a 2013 18,603,000 c 2014 51,298,000 c 2015 12,274,240 c
a No thermal marking. b Sockeye salmon fry reared and thermally marked at Trail Lakes
Hatchery, remote released as smolt at Tutka Bay Hatchery. Release numbers are included in releases for Trail Lakes Hatchery.
c Thermally marked.

163
Appendix F8.–Trail Lakes Hatchery salmon releases, 1983–2015.
Year released Chinook Sockeye Coho Chum1983 2,310,751 1,039,673 1984 406,755 1,236,864 1,283,815 1985 398,586 1,805,792 1,538,361 455,8091986 217,648 516,000 1,530,116 1987 268,399 3,718,311 1,702,446 1988 98,429 9,074,486 945,999 1989 5,690,000 1,337,340 1990 7,679,698 840,585 1991 6,345,252 a 390,841 1992 7,575,637 a 255,533 1993 7,979,820 a 620,588 1994 6,640,000 a 320,000 1995 6,339,485 a 516,400 1996 4,110,638 a 75,000 1997 10,857,470 a 601,700 1998 7,653,000 a 409,000 1999 9,923,500 a 357,000 2000 12,521,000 a 418,000 b 2001 1,140,000 a 432,000 b 2002 18,907,200 a 528,500 b 2003 16,128,000 a 761,000 b 2004 17,272,000 a 996,000 b 2005 9,959,000 a 988,000 b 2006 5,785,000 a 1,146,000 b 2007 12,668,800 a 956,000 b 2008 13,203,000 a 685,000 b 2009 7,953,000 a 382,000 b 2010 8,616,000 a 435,000 b 2011 9,324,200 a 437,000 b 2012 7,636,300 a 315,000 b 2013 7,482,000 a 405,000 b 2014 9,368,500 a 523,000 b Previous 10-year average 9,199,580 627,200
2015 8,302,700 a 546,000 b a Thermal marking of sockeye salmon releases began in 1991 (BY 1990). b Thermal marking of coho salmon releases began in 2000 (BY 1999).

164
Appendix F9.–Port Graham Hatchery salmon releases, 1991–2015.
Year Sockeye Coho Pink 1991 84,757 255,0001992 144,982 1,810,4871993 194,700 1994 830,159 1,295,0001995 358,0001996 292,134 6,469,9751997 199,000 29,963 918,0001998 1999 918,348 4,617,362 a
2000 906,057 1,142,726 a
2001 27,298,797 a
2002 6,600,985 a
2003 694,647 a 57,200,000 a
2004 159,616 a 36,282,671 a
2005 203,000 a 26,567,983 a
2006 422,060 a 13,883,682 a
2007 13,282,049 a
2008 2009 b 2010 2011 2012 2013 b c 2014 c 2015 2,205,000 a a Thermally marked. b Remote releases from Trail Lakes Hatchery. c Remote releases from Tutka Bay Lagoon Hatchery.
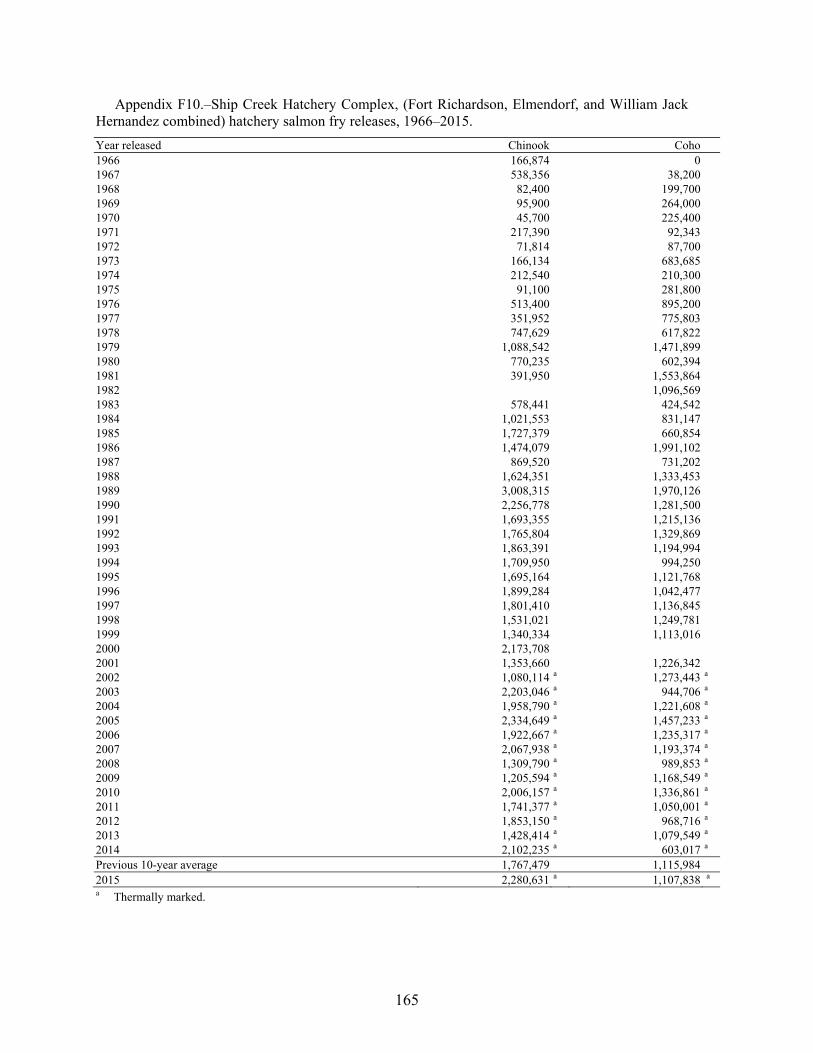
165
Appendix F10.–Ship Creek Hatchery Complex, (Fort Richardson, Elmendorf, and William Jack Hernandez combined) hatchery salmon fry releases, 1966–2015.
Year released Chinook Coho 1966 166,874 01967 538,356 38,200 1968 82,400 199,700 1969 95,900 264,000 1970 45,700 225,400 1971 217,390 92,343 1972 71,814 87,700 1973 166,134 683,685 1974 212,540 210,300 1975 91,100 281,800 1976 513,400 895,200 1977 351,952 775,803 1978 747,629 617,822 1979 1,088,542 1,471,899 1980 770,235 602,394 1981 391,950 1,553,864 1982 1,096,569 1983 578,441 424,542 1984 1,021,553 831,147 1985 1,727,379 660,854 1986 1,474,079 1,991,102 1987 869,520 731,202 1988 1,624,351 1,333,453 1989 3,008,315 1,970,126 1990 2,256,778 1,281,500 1991 1,693,355 1,215,136 1992 1,765,804 1,329,869 1993 1,863,391 1,194,994 1994 1,709,950 994,250 1995 1,695,164 1,121,768 1996 1,899,284 1,042,477 1997 1,801,410 1,136,845 1998 1,531,021 1,249,781 1999 1,340,334 1,113,016 2000 2,173,708 2001 1,353,660 1,226,342 2002 1,080,114 a 1,273,443 a 2003 2,203,046 a 944,706 a 2004 1,958,790 a 1,221,608 a 2005 2,334,649 a 1,457,233 a 2006 1,922,667 a 1,235,317 a 2007 2,067,938 a 1,193,374 a 2008 1,309,790 a 989,853 a 2009 1,205,594 a 1,168,549 a 2010 2,006,157 a 1,336,861 a 2011 1,741,377 a 1,050,001 a 2012 1,853,150 a 968,716 a 2013 1,428,414 a 1,079,549 a 2014 2,102,235 a 603,017 a Previous 10-year average 1,767,479 1,115,984 2015 2,280,631 a 1,107,838 a a Thermally marked.

166
Appendix F11.–Historic releases of Chinook salmon from hatcheries to Lower Cook Inlet, 1972–2015.
Southern District (241)
Year Halibut Cove
Lagoon Homer
Spit Tutka
Bay Kasitsna
Bay Seldovia
Harbor English Bay
Lakes 1972 33,800 1975 3,463 1976 16,183 26,000 1977 49,947 1978 126,306 1979 224,708 1980 155,054 1981 101,861 1983 200,900 1984 84,000 88,753 1985 98,000 152,226 1986 101,331 103,946 1987 94,100 103,860 80,420 1988 93,874 219,572 111,435 1989 115,682 212,737 108,300 1990 112,458 210,087 98,525 109,465 1991 92,363 190,915 91,592 1992 117,850 353,255 112,935 1993 100,228 312,292 106,497 1994 98,872 320,836 107,246 1995 37,577 339,074 116,165 1996 97,729 312,289 118,274 1997 78,133 318,706 103,757 1998 65,893 289,830 69,461 1999 79,221 222,781 74,057 2000 83,277 219,984 68,114 2001 106,719 208,062 102,793 2002 106,279 190,026 83,045 2003 106,844 206,292 107,521 2004 103,771 168,743 88,682 2005 112,521 220,822 114,984 2006 117,549 224,053 113,974 2007 54,560 226,972 54,276 2008 58,674 212,141 54,464 2009 35,065 164,234 44,487 2010 111,134 213,503 114,421 2011 107,338 219,787 103,382 2012 110,253 221,547 95,800 2013 60,666 216,292 63,311 2014 85,856 206,254 74,259 Previous 10-yr avg 85,362 212,561 83,336 2015 102,718 210,543 72,233
-continued-

167
Appendix F11.–Page 2 of 2.
Eastern District (231)
Year Resurrection
Bay Alaska Sea-Life Center Thumb
Cove Box
Canyon Lowell Creek
Spring Creek
1972 1975 1976 25,100 1977 50,036 1978 150,488 1979 257,530 1980 1981 1983 54,521 1984 71,427 39,206 1985 53,587 132,708 1986 100,900 1987 95,963 1988 109,020 95,673 1989 109,464 122,800 75,063 1990 112,831 216,220 1991 373,165 93,200 1992 261,803 108,390 1993 193,742 104,870 1994 165,596 104,477 1995 220,146 95,256 1996 300,000 115,000 1997 203,932 219,355 1998 205,133 101,992 1999 88,066 85,502 2000 212,873 109,461 2001 113,147 114,748 2002 100,314 93,296 2003 109,976 110,331 2004 126,280 30,066 89,388 2005 211,549 218,759 100,088 2006 303,217 120,000 2007 117,842 115,716 2008 142,469 2009 2010 110,671 109,779 2011 223,881 2012 219,743 2013 141,550 2014 183,464 Previous 10-yr avg 183,821 104,934 2015 298,542

168
Appendix F12.–Historic releases of sockeye salmon from hatcheries to Lower Cook Inlet, 1976–2015.
Southern District (241) Outer District
(232)
Year Leisure Lake Hazel Lake
Halibut Cove
Lagoon Tutka Bay
Lagoon English Bay
Lakes
Port Graham Subdist. Port Dick Lake
1976 1,085 7,777 1977 91,347 1978 83,422 1979 1980 532,650 1981 1,094,713 1982 1,527,876 1983 2,113,239 1984 2,110,000 1985 2,018,000 1986 2,250,303 1987 2,022,000 704,900 1988 2,100,000 783,000 221,700 1989 2,000,000 1,000,000 430,000 1990 2,000,000 1,500,000 855,3471991 2,000,000 1,300,000 255,071 84,757 1992 2,000,000 1,000,000 290,298 144,982 1993 2,000,000 1,000,000 755,6921994 820,174 9,985 1995 1,632,000 1,061,000 1996 1,490,000 1,030,000 75,000 292,1341997 2,000,000 1,000,000 245,000 199,0001998 1,877,000 1,218,000 1999 265,400 453,100 100,000 918,3482000 1,708,000 1,248,000 906,0572001 89,000 2002 2,246,200 1,280,100 2003 2,240,000 1,547,000 694,6472004 2,002,000 351,000 50,096 109,520 2005 2,252,000 1,558,000 96,000 203,0002006 680,000 260,000 422,060 2007 2,315,000 1,411,000 143,800 2008 2,053,000 1,161,000 483,000 246,0002009 1,225,000 1,186,000 301,000 112,000 2010 1,933,000 1,218,000 278,000 202,0002011 1,415,000 1,244,000 281,900 203,3002012 2,074,000 1,240,000 371,300 213,0002013 1,800,000 1,450,000 511,000 211,000 102,000 2014 1,353,000 1,223,000 599,500 209,000 2015 1,051,000 621,000 523,500 200,200
-continued-

169
Appendix F12.–Page 2 of 2.
Kamishak District (249) Eastern District (231)
Year Chenik
Lake Paint River
Lakes Kirschner
Lake Bruin Lake
Ursus Lake Bear Lake
Resurrection Bay
Grouse Lake
1976 1977 1978 98,082 1979 256,525 1980 1981 1,096,718 1982 1983 1984 1985 1986 839,000 820,026 1987 1,005,000 866,7001988 2,601,000 2,207,300 521,0001989 3,500,000 2,000,000 250,0001990 3,250,000 2,000,000 250,000 2,577,9621991 2,100,000 750,000 250,000 250,000 1,604,9221992 2,750,000 750,000 250,000 250,000 250,000 1,482,4891993 1,400,000 750,000 250,000 250,000 250,000 1,810,2611994 208,000 170,000 570,0001995 1,129,000 588,000 251,000 251,000 252,000 330,000 993,0001996 951,000 500,000 250,000 250,000 250,000 780,638 217,6051997 250,000 788,000 2,428,0001998 234,000 772,000 1,514,0001999 172,700 1,380,0002000 249,000 1,796,0002001 145,0002002 507,700 301,500 3,210,3002003 298,000 1,801,0002004 251,000 3,012,0002005 316,000 3,422,0002006 3,393,0002007 254,000 3,056,0002008 300,000 2,400,000 1,600,000 2009 2,543,000 1,675,000 2010 255,000 2,200,000 1,650,000 2011 160,000 2,488,000 0 2012 300,000 2,490,000 1,305,000 2013 2,548,000 2,090,000 2014 217,000 2,405,000 1,742,000 2015 237,000 2,415,000 1,758,000

170
Appendix F13.–Historical releases of coho salmon from hatcheries to Lower Cook Inlet, 1963–2015.
Southern District, (241)
Caribou Lake Fritz Creek Halibut Cove
Lagoon Homer Spit Kasitsna Bay
Creek Seldovia Port Graham
Subdistrict 1963 1964 1965 1966 1967 1968 1969 1970 1971 1972 241,4001973 326,8001974 755,2791975 141,217 475,6001976 155,700 461,244 112,661 1977 7,253 99,380 1978 66,545 1979 44,717 47,810 23,0151980 21,315 1981 55,006 1982 1983 1984 119,071 59,840 1985 139,789 31,242 81,924 1986 137,951 71,496 1987 150,000 45,000 1988 150,000 62,547 80,000 1989 153,8691990 180,000 122,945 50,000 1991 180,000 100,236 50,000 1992 150,000 100,570
-continued-

171
Appendix F13.–Page 2 of 4.
Eastern District, (231)
Resurrection
Bay Seward Lagoon
Bear Lake
Grouse Lake
Lowell Creek
Misc. small releases combined
Total coho salmon released
1963 148,057 148,0571964 43,000 43,0001965 69,800 69,8001966 360,100 360,1001967 246,400 246,4001968 42,400 0 42,4001969 27,100 47,900 75,0001970 38,600 6,400 3,200 45,0001971 10,900 50,983 61,8831972 66,500 606,100 914,0001973 30,200 443,300 800,3001974 100,000 450,800 1,306,0791975 100,700 449,900 1,167,4171976 100,600 260,200 35,200 1,125,6051977 100,456 45,902 35,003 287,9941978 148,999 254,394 53,455 523,3931979 98,566 265,963 44,010 524,0811980 100,757 150,011 50,286 322,3691981 109,958 246,545 54,953 466,4621982 53,970 227,800 13,238 295,0081983 82,506 248,801 331,3071984 67,722 220,000 53,100 519,7331985 50,256 300,446 56,134 659,7911986 212,812 445,693 53,607 867,9521987 66,525 223,300 57,232 257,461 542,0571988 118,741 347,155 63,806 822,2491989 272,346 490,000 66,606 982,8211990 145,619 426,911 63,733 989,2081991 119,057 390,060 30,400 4,000 869,7531992 154,219 255,533 59,492 719,814
-continued-

172
Appendix F13.–Page 3 of 4.
Southern District, (241) Caribou Lake Fritz Creek Halibut Cove Lagoon Homer Spit Kasitsna Bay Creek Seldovia Port Graham
1993 150,000 116,1291994 63,600 156,2131995 110,7011996 149,0001997 120,242 29,9631998 148,410 30,0001999 129,6022000 122,3382001 225,0422002 216,3552003 325,7352004 243,2432005 220,7072006 449,216 114,000 2007 228,244 97,000 2008 217,843 88,000 2009 157,6962010 130,2062011 129,0802012 107,2502013 132,027 2014 76,535
10-year avg 184,880
2015 122,963
-continued-

173
Appendix F13.–Page 4 of 4.
Eastern District, (231)
Resurrection
Bay Seward Lagoon
Bear Lake
Grouse Lake
Lowell Creek
Total coho salmon released
1993 159,091 620,588 64,361 1,110,1691994 221,577 320,000 38,000 799,3901995 133,700 516,400 50,698 811,4991996 182,000 425,000 69,000 825,0001997 144,112 601,700 61,687 957,7041998 74,365 409,000 65,687 727,4621999 109,142 357,000 62,580 658,3242000 145,693 418,000 54,184 740,2152001 124,703 432,000 125,618 907,3632002 121,743 528,500 119,512 986,1102003 123,718 658,000 124,225 1,231,6782004 192,000 323,798 691,000 131,989 1,582,0302005 132,229 893,000 132,276 1,378,2122006 131,326 562,000 277,261 1,533,8032007 132,811 758,000 130,892 1,346,9472008 233,365 502,000 1,041,2082009 91,979 338,000 91,833 679,5082010 134,008 435,000 133,947 833,1612011 255,252 437,000 821,3322012 249,309 315,000 671,5592013 216,444 405,000 753,4712014 97,675 532,000 697,210
10-year avg 167,440 516,800 153,242 975,641
2015 279,546 546,000 948,509

174
Appendix F14.–Historical releases of pink salmon from hatcheries to greater Cook Inlet, 1975–2015.
Tutka Bay Halibut Cove
Lagoon Halibut Cove-
bight Homer Spit Port Graham
Subdistrict 1975 50,916 1976 1977 318,280 1978 4,820,937 1979 9,243,717 1980 6,245,103 1981 9,759,144 1982 15,070,927 1983 14,730,794 1984 18,142,463 1985 23,537,000 1986 22,228,600 4,006,000 1987 4,385,600 3,001,400 594,500 1988 12,003,878 3,022,491 310,016 1989 30,091,053 6,229,062 331,695 1990 23,689,702 6,000,000 603,845 1991 23,657,112 6,039,062 303,826 255,000 1992 25,700,000 5,950,000 300,000 1,810,487 1993 48,700,000 1994 61,100,000 1,295,000 1995 63,000,000 358,000 1996 105,000,000 6,469,975 1997 89,000,000 918,000 1998 90,000,000 1999 60,132,000 4,617,362 2000 65,120,870 1,142,726 2001 99,336,410 27,298,797 2002 99,371,000 6,600,985 2003 67,967,000 57,200,000 2004 47,964,360 36,282,671 2005 26,567,983 2006 13,883,682 2007 13,282,049 2008 2009 2010 2011 2012 8,100,399 3,146,000a 2013 4,353,000 14,250,000 2014 51,110,000 188,000 2015 11,249,240 2,200,060
-continued-

175
Appendix F14.–Page 2 of 2.
Alaska Sea-Life Center
(Seward) Paint River Eklutna
River Ingram Creek
Total pink salmon released
1975 50,916 1976 1977 318,280 1978 4,820,937 1979 9,243,717 1980 550,141 6,795,244 1981 509,609 10,268,753 1982 404,508 15,475,435 1983 501,956 15,232,750 1984 18,142,463 1985 281,500 23,818,500 1986 30,576 26,265,176 1987 38,267 259,200 8,278,967 1988 252,975 15,589,360 1989 325,380 36,977,190 1990 311,101 36,974,370 1991 30,602,576 1992 33,760,487 1993 48,700,000 1994 62,395,000 1995 63,358,000 1996 111,469,975 1997 89,918,000 1998 90,000,000 1999 48,329 64,797,691 2000 24,216 66,287,812 2001 126,635,207 2002 105,971,985 2003 125,167,000 2004 84,247,031 2005 26,567,983 2006 13,883,682 2007 13,282,049 2008 2009 2010 2011 2012 11,246,399 2013 18,603,000 2014 51,298,000 2015 1,025,000 14,474,300 a Released outside of Halibut Cove Lagoon, 1 kilometer east.

176
Appendix F15.–Harvest of sockeye salmon returning to China Poot and Neptune Bays in the Southern District of Lower Cook Inlet, 1979–2015.
Return year Sport harvest a
Personal use dip net harvest b
Commercial harvest c
Hatchery cost recovery d Unharvested e Total run
1979 650 2,975 3,625 1980 1,000 953 13,007 14,960 1981 1,500 24,215 25,715 1982 450 1,320 1,044 1,430 4,244 1983 480 5,466 91,946 10 97,902 1984 500 1,794 117,438 500 120,232 1985 500 796 60,890 920 63,106 1986 100 1,815 15,031 200 17,146 1987 200 1,231 61,453 62,884 1988 500 1,910 90,544 470 93,424 1989 1,000 5,416 84,082 90,498 1990 500 5,835 66,549 72,884 1991 1,000 1,528 142,560 145,088 1992 300 3,468 82,455 7,336 93,559 1993 400 4,551 131,367 136,318 1994 500 5,715 47,494 3,025 56,734 1995 1,000 8,605 132,892 12,497 450 155,444 1996 1,000 4,773 269,553 14,235 441 290,002 1997 650 4,773 121,184 1,130 127,737 1998 640 4,773 143,350 20,579 380 169,722 1999 640 4,773 187,207 16,188 522 209,330 2000 640 4,773 77,462 18,103 256 101,234 2001 640 4,773 99,866 27,037 57 132,373 2002 640 4,773 114,639 29,517 51 149,620 2003 640 4,773 391,768 35,557 121 432,859 2004 640 4,773 21,621 12,991 448 40,473 2005 640 4,773 65,333 29,737 1 100,484 2006 640 4,773 52,020 23,283 820 81,536 2007 640 4,773 61,193 22,586 501 89,693 2008 640 4,773 62,675 1,907 103 70,098 2009 640 4,773 205 223 5,841 2010 640 4,773 1,007 45 6,465 2011 640 4,773 9,945 18 15,376 2012 640 4,773 5,559 11,938 45 22,955 2013 640 4,773 15,554 8,755 13 29,735 2014 640 4,773 7,280 0 366 13,059 2015 640 4,773 18,064 0 36 23,513 a Sport harvest figures for 1997–2014 represent the estimated previous 10-year average. b Personal use harvest data for 1979–1981 from permits issued from the Homer office. Data from 1983 to 1995 is from
historical sport fish harvest reports (e.g., Mills 1984). Data from 1996 to current is an average of the last 5 years that the data were collected specifically for this fishery.
c The final commercial harvest figures are the total common property seine harvest in the Southern District except for 1999, 2000, and 2002, which only include harvests east of the Tutka District due to returning Tutka hatchery sockeye salmon in those years.
d From cost recovery conducted in China Poot and Neptune bays. e Unharvested fish are the total count by ADF&G ground survey staff of sockeye salmon remaining in China Poot Creek.

177
Appendix F16.–Commercial harvest and escapement of sockeye salmon at Chenik Lake in the Kamishak Bay District of Lower Cook Inlet, 1976–2015.
Return year Commercial harvest Cost recovery Escapement a Total run 1976 b 900 900 1977 b 200 200 1978 b 100 100 1979 b c c 1980 b 3,500 3,500 1981 b 2,500 2,500 1982 b 8,000 8,000 1983 2,800 11,000 13,800 1984 16,500 13,000 29,500 1985 10,624 3,500 14,124 1986 111,348 7,000 118,348 1987 97,411 10,000 107,411 1988 161,936 9,000 170,936 1989 38,905 12,000 50,905 1990 70,347 17,000 87,347 1991 51,773 10,189 61,962 1992 5,609 8,769 9,269 14,878 1993 19,988 4,000 23,988 1994 b 808 808 1995 b 1,086 1,086 1996 b 2,990 2,990 1997 b 2,338 2,338 1998 b 1,880 1,880 1999 b 2,850 2,850 2000 b 4,800 4,800 2001 b 250 250 2002 b 4,650 4,650 2003 b 13,825 13,825 2004 33,177 17,000 50,177 2005 47,013 14,507 d 61,520 2006 11,783 13,868 d 25,651 2007 161,630 18,230 d 179,860 2008 171,255 11,284 d 182,539 2009 65,727 15,264 d 80,991 2010 5,471 17,312 d 22,783 2011 82,826 10,330 d 93,156
2012 55,255 16,505 d 71,760
2013 33,154 11,333 d 44,487
2014 7,241 17,774 d 25,015
2015 0 19,073 d 19,073 a Estimated from aerial surveys between 1976–1990 and 1998–present, weir counts between 1991 and 1997, unless otherwise
noted. b Closed to fishing. c No data. d Estimated from a combination of weir, video counts, and/or aerial counts.

178
Appendix F17.–Commercial harvest of sockeye salmon at Kirschner Lake in the Kamishak Bay District of Lower Cook Inlet, 1989–2015.
Return year
Common property commercial harvest Cost recovery Broodstock Unharvested a Total run
1989 190 190 1990 14,465 14,465 1991 42,654 42,654 1992 40,043 40,043 1993 36,322 36,322 1994 14,465 16,787 31,252 1995 8,772 5,350 14,122 1996 18,093 13,511 31,604 1997 2,842 6,125 8,967 1998 8,112 19,390 27,502 1999 22,256 17,504 39,760 2000 10,236 21,391 31,627 2001 9,198 29,740 38,938 2002 32,492 32,492 2003 11,671 38,741 50,412 2004 16,372 16,372 2005 14,969 14,969 2006 24,130 26,310 50,440 2007 7,725 27,719 35,444 2008 11,588 11,588 2009 18,771 18,771 2010 8,858 8,858 2011 12,732 210 12,942 2012 1,260 1,300 2,560 2013 8,288 8,288 2014 3,068 16,555 19,623 2015 23,571 3,666 27,237 a A barrier falls at the outlet of Kirschner Lake immediately above the intertidal zone precludes any escapement from entering
this lake.

179
Appendix F18.–Commercial harvest and escapement of pink and sockeye salmon in the Tutka Bay Subdistrict in the Southern District of Lower Cook Inlet, 1975–2015.
Sockeye salmon a Pink salmon a Return year
Commercial harvest
Cost recovery
Total run
Commercial harvest
Cost recovery
Brood stock Escapement
Sport catch Total run
1975 12,600 12,600 89,200 17,600 106,8001976 14,200 14,200 73,100 10,800 b 11,500 95,4001977 21,300 21,300 21,900 6,528 14,000 42,4281978 92,100 92,100 167,862 21,100 15,000 203,9621979 15,600 15,600 421,816 21,200 10,600 2,000 455,6161980 13,200 13,200 321,513 26,897 17,300 5,000 370,7101981 41,000 41,000 1,026,574 22,000 28,000 6,000 1,082,5741982 15,800 15,800 184,876 41,200 18,500 2,000 246,5761983 35,900 35,900 615,459 53,800 12,900 5,000 687,1591984 26,700 26,700 241,054 41,000 10,500 8,000 300,5541985 14,886 14,886 491,181 43,000 14,000 8,000 556,1811986 16,340 16,340 400,150 43,000 13,400 8,000 464,5501987 14,659 14,659 56,465 22,000 4,800 500 83,7651988 12,900 12,900 723,929 65,000 11,200 8,500 808,6291989 13,461 13,461 632,147 5,100 11,900 10,000 659,1471990 7,922 7,922 20,183 17,243 62,000 38,500 2,000 139,9261991 7,039 34 7,073 14,691 101,837 103,100 16,820 2,000 238,4481992 8,578 8,578 41,642 275,897 67,324 25,921 2,500 413,2841993 5,797 8 5,805 128,347 409,431 107,242 27,403 2,000 674,4231994 9,129 8 9,137 498,436 953,231 154,000 14,546 2,000 1,622,2131995 12,323 3 12,326 1,212,342 1,213,322 166,052 15,899 3,000 2,610,6151996 20,226 74 20,300 6,941 420,411 138,021 3,456 1,000 569,8291997 9,686 9,686 130,406 2,375,653 216,786 45,000 2,100 2,769,9451998 8,480 8,480 504,764 792,542 153,580 17,473 2,000 1,470,3591999 18,711 c 88 18,799 222,228 857,902 151,903 27,947 2,000 1,261,9802000 6,602 896 7,498 8,580 1,043,705 179,970 19,048 1,500 1,252,8032001 16,500 5 16,505 109,682 421,408 179,006 4,451 1,500 716,0472002 14,318 14,318 4,725 703,205 161,864 15,884 1,500 887,1782003 24,090 2 24,092 4,324 507,215 207,285 30,866 1,500 751,1902004 5,827 5,827 1,523 1,175,326 0d 17,846 1,500 1,196,1952005 6,252 6,252 4,779 1,631,806 133,600 1,500 1,771,6852006 5,865 5,865 11,223 25,800 1,500 38,5232007 8,272 8,272 5,700 1,500 7,2002008 6,414 14,604 21,018 1,884 377 14,100 1,500 17,8612009 9,185 11,584 20,769 2,136 3,800 1,500 7,4362010 6,307 38,087 44,394 2,536 161 2,100 1,500 6,2972011 10,516 7,836 18,352 1,911 5 12,665 e 21,974 1,500 38,0552012 4,839 17,756 22,595 4,434 171 8,140 10,436 1,500 24,6812013 16,285 9,707 25,992 866 39,153 143,884 9,541 1,500 194,9442014 27,425 30,404 57,829 11,004 32 22,401 10,152 1,500 45,0892015 45,582 32,455 78,037 110,130 2,087,024 165,008 82,400 1,500 2,446,062a Data from CIAA (2015 a and b). b Start of enhancement at Tutka Lagoon Hatchery. c First return of enhanced BY95 sockeye salmon. Previous year’s harvest is intercepted China Poot runs and wild production. d CIAA announced suspension of operations at Tutka Lagoon Hatchery. e CIAA resumed operations at Tutka Lagoon Hatchery.

180
Appendix F19.–Harvest of salmon from the Port Graham Section of the Port Graham Subdistrict in the Southern District of Lower Cook Inlet, 1985–2015.
Sockeye salmon Pink salmon
Return year
Commercial harvest
Subsist. harvesta
Cost recovery
Commercial harvest
Subsist. harvesta
Cost recovery
Broodstock (plus excess) Escapement Total run
1985 787 481 3,668 32 26,300 30,0001986 363 274 4,658 237 17,500 22,3951987 246 219 359 230 3,800 4,3891988 103 411 126 542 7,900 8,5681989 94 640 19,100 19,7401990 524 1,013 20,100 21,1131991 58 1,494 29,000 30,4941992 98 745 5,400 6,1451993 154 997 12,800 13,7971994 260 866 7,600 8,4661995 379 786 16,224 10,000 27,0101996 5,203 684 821 312 2,131 7,000 10,2641997 8,597 324 46,854 497 85,354 21,888 12,500 167,0931998 3,652 271 598 459 21,888 12,600 35,5451999 382 150 9,700 9,8502000 1,153 784 355 89,838 15,600 105,7932001 176 20 34,773 10,300 45,0932002 3,576 417 14 150 238,672 146,433 58,500 443,7692003 5,034 1,991 266 78,241 14,900 93,4072004 1,032 572 363 1,283,517 99,376 44,000 1,427,2562005 192 349 510,802 84,088 69,100 664,3392006 31 26 247,990 27,741 31,200 306,9572007 552 23 74 117,962 25,600 143,6362008 2,971 550 26,274 36 2,670 24,700 27,4062009 9,057 1,982 8,292 49 866 14,000 14,9152010 740 116 24 16,600 16,6242011 59 687 132 20,883 21,0152012 30 661 30 21,645 282 b 34,486 56,4132013 463 1,034 13,188 27 c 11,893 25,1082014 42 136 43,442 164 1,740 32,295 77,6412015 29 842 34,522 539 d 82,356 117,417a Harvest as reported by Port Graham subsistence permit holders. The preponderance of harvest reported on the Port Graham
permits are from the Port Graham section of the Port Graham Subdistrict. b Commercial Common Property pink salmon; 19,918 fish of the 21,645 harvested commercially were sold alive to processor
for resale to hatchery as broodstock. c Commercial Common Property pink salmon; 11,800 fish of the 13,188 harvested commercially were sold alive to processor
for resale to hatchery as broodstock. d Commercial Common Property pink salmon; 21,408 fish of the 34,522 harvested commercially were sold alive to processor
for resale to hatchery as broodstock.

181
Appendix F20.–Harvest of salmon in the English Bay Section of the Port Graham Subdistrict of the Southern District of Lower Cook Inlet, 1985–2015.
Sockeye salmon Coho salmon Pink salmon
Return year
Commercial harvest
Subsist. harvest a
Cost recovery
Commercial harvest
Subsist. harvest a
Cost recovery
Commercial harvest
Subsist. harvest a
Cost recovery
1985 2,712 696 2,250 530 8,830 3131986 1,592 373 1,475 302 4,106 8251987 2,114 682 1,352 339 1,985 4841988 1,254 610 1,384 385 10,562 1,2141989 63 695 8551990 638 614 1,9471991 630 1,512 3,0931992 437 675 6761993 994 567 1,6661994 570 511 1,1131995 2,580 1,416 1,823 169 10,168 4871996 6,981 1,060 5,934 1,553 598 658 4371997 16,657 1 7,817 1,414 12,940 141998 8,080 18 6,202 23 760 11999 2,775 660 1,320 1,8732000 984 3,880 1,579 1,2512001 909 1,238 1,4342002 10,912 10,203 20,245 1 967 6 1,6812003 16,525 3,221 45,011 2 513 82 1,3062004 1,537 2,968 3 842 1,2772005 1,934 1,142 1,2592006 2,215 1,179 2,0382007 4,270 b 3 b b
2008 2,421 3,615 1,345 2,6462009 491 1,515 396 8652010 1,157 1,514 1,324 1,0302011 1,375 5,009 1,381 702 2,499 2002012 300 400 2002013 3,854 2,619 3832014 211 2015 35 a Harvest as reported by Nanwalek subsistence permit holders. The preponderance of harvest reported on the Nanwalek permits
are from the English Bay section of the Port Graham Subdistrict b No data available.
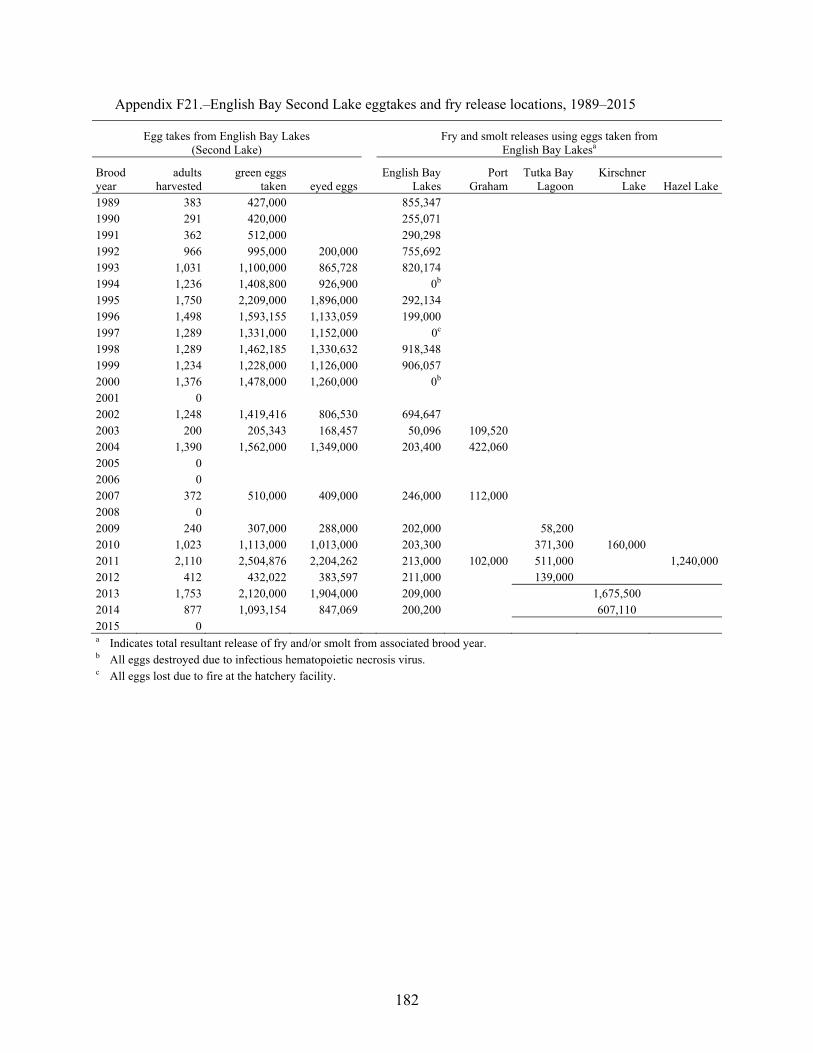
182
Appendix F21.–English Bay Second Lake eggtakes and fry release locations, 1989–2015
Egg takes from English Bay Lakes (Second Lake)
Fry and smolt releases using eggs taken from English Bay Lakesa
Brood year
adults harvested
green eggs taken eyed eggs
English Bay Lakes
Port Graham
Tutka Bay Lagoon
Kirschner Lake Hazel Lake
1989 383 427,000 855,3471990 291 420,000 255,0711991 362 512,000 290,2981992 966 995,000 200,000 755,6921993 1,031 1,100,000 865,728 820,1741994 1,236 1,408,800 926,900 0b
1995 1,750 2,209,000 1,896,000 292,1341996 1,498 1,593,155 1,133,059 199,0001997 1,289 1,331,000 1,152,000 0c
1998 1,289 1,462,185 1,330,632 918,3481999 1,234 1,228,000 1,126,000 906,0572000 1,376 1,478,000 1,260,000 0b
2001 0 2002 1,248 1,419,416 806,530 694,6472003 200 205,343 168,457 50,096 109,5202004 1,390 1,562,000 1,349,000 203,400 422,0602005 0 2006 0 2007 372 510,000 409,000 246,000 112,0002008 0 2009 240 307,000 288,000 202,000 58,200 2010 1,023 1,113,000 1,013,000 203,300 371,300 160,000 2011 2,110 2,504,876 2,204,262 213,000 102,000 511,000 1,240,0002012 412 432,022 383,597 211,000 139,000 2013 1,753 2,120,000 1,904,000 209,000 1,675,500 2014 877 1,093,154 847,069 200,200 607,110 2015 0 a Indicates total resultant release of fry and/or smolt from associated brood year. b All eggs destroyed due to infectious hematopoietic necrosis virus. c All eggs lost due to fire at the hatchery facility.

183
Appendix F22.–Occurrence of hatchery pink salmon in LCI index streams, 2015.
Location, collection date AFK CCH SGH WNH PGH TBLH PWS
hatc
heri
es
com
bine
d
LC
I ha
tche
ries
co
mbi
ned
Hat
cher
y to
tal
no m
ark
Tot
al f
ish
(unm
arke
d +
ha
tche
ry)
Total percent
hatchery
Total percent
PWS
Total percent
LCIPercent
unmarkedBarabara Creek, 8/14/2015 5 5 0 5 91 96 5.2% 5.2% 0.0% 94.8%Barabara Creek, 8/28/2015 1 6 5 3 12 3 15 81 96 15.6% 12.5% 3.1% 84.4%Barabara Creek, 9/10/2015 3 9 7 7 19 7 26 70 96 27.1% 19.8% 7.3% 72.9%
Barabara Creek- combined 4 9 11 12 0 10 36 10 46 242 288 16.0% 12.5% 3.5% 84.0%China Poot Creek, 8/27/2015 5 1 1 5 2 7 35 42 16.7% 11.9% 4.8% 83.3%China Poot Creek, 9/9/2015 0 0 0 96 96 0.0% 0.0% 0.0% 100.0%
China Poot Creek - combined 0 0 5 0 1 1 5 2 7 131 138 5.1% 3.6% 1.4% 94.9%Humpy Creek, 8/19/2015 1 3 1 3 4 92 96 4.2% 1.0% 3.1% 95.8%Humpy Creek, 9/3/2015 1 1 2 0 2 94 96 2.1% 2.1% 0.0% 97.9%
Humpy Creek - combined 1 0 2 0 0 3 3 3 6 186 192 3.1% 1.6% 1.6% 96.9%Port Dick Creek- Head End, 8/5/2015 1 0 1 1 32 33 3.0% 0.0% 3.0% 97.0%Port Dick Creek- Head End, 9/15/2015 4 8 2 14 0 14 76 90 15.6% 15.6% 0.0% 84.4%
Port Dick Creek- Head End - combined 4 8 0 2 1 0 14 1 15 108 123 12.2% 11.4% 0.8% 87.8%Port Dick- Island Creek, 9/2/2015 12 3 2 5 22 0 22 74 96 22.9% 22.9% 0.0% 77.1%Port Dick- Island Creek, 9/15/2015 10 5 1 16 0 16 80 96 16.7% 16.7% 0.0% 83.3%
Port Dick- Island Creek - combined 22 8 2 6 0 0 38 0 38 154 192 19.8% 19.8% 0.0% 80.2%Port Graham River, 8/6/2015 1 1 0 2 2 94 96 2.1% 0.0% 2.1% 97.9%Port Graham River, 8/24/2015 1 0 1 1 95 96 1.0% 0.0% 1.0% 99.0%
Port Graham River - combined 0 0 0 0 2 1 0 3 3 189 192 1.6% 0.0% 1.6% 98.4%Seldovia River, 8/4/2015 3 0 3 3 93 96 3.1% 0.0% 3.1% 96.9%Seldovia River, 9/8/2015 3 3 1 2 9 0 9 87 96 9.4% 9.4% 0.0% 90.6%
Seldovia River - combined 3 3 1 2 3 0 9 3 12 180 192 6.3% 4.7% 1.6% 93.8%Tutka Lagoon Creek, 8/13/2015 94 0 94 94 2 96 97.9% 0.0% 97.9% 2.1%Tutka Lagoon Creek, 9/4/2015 88 0 88 88 8 96 91.7% 0.0% 91.7% 8.3%
Tutka Lagoon Creek - combined 0 0 0 0 0 182 0 182 182 10 192 94.8% 0.0% 94.8% 5.2%Dogfish Bay Creeks, 8/20/2015 3 1 1 4 1 5 91 96 5.2% 4.2% 1.0% 94.8%English Bay River, 8/11/2015 31 1 4 32 4 36 60 96 37.5% 33.3% 4.2% 62.5%South Nuka Bay, 9/2/2015 6 1 1 6 2 8 88 96 8.3% 6.3% 2.1% 91.7%Tutka Head End Creek, 8/26/2015 5 74 5 74 79 17 96 82.3% 5.2% 77.1% 17.7%Total 43 29 57 23 8 277 152 285 437 1,456 1,893 23.1% 8.0% 15.1% 76.9%Percent of total fish in creeks 2.3% 1.5% 3.0% 1.2% 0.4% 14.6% 8.0% 15.1% 23.1% 76.9%Percent of hatchery fish in creeks 9.8% 6.6% 13.0% 5.3% 1.8% 63.4% 34.8% 65.2% Percent of PWS hatchery fish by facility 28.3% 19.1% 37.5% 15.1%Percent of LCI hatchery fish by facility 2.8% 97.2%
Note: AFH = Armin F. Koernig Hatchery; CCH = Cannery Creek Hatchery; SGH = Solomon Gulch Hatchery; WNH = Wally Noerenberg Hatchery; PGH = Port Graham Hatchery; TBLH = Tutka Bay Lagoon Hatchery.

184
Appendix F23.–Occurrence of hatchery pink salmon in LCI index streams, 2014.
Location, collection date AFH CCH SGH WNH PGH TBLH
PWS
hatc
heri
es
com
bine
d
LC
I ha
tche
ries
co
mbi
ned
Hat
cher
y to
tal
no m
ark
Tot
al f
ish
(unm
arke
d +
ha
tche
ry)
Total percent marked
Total percent
PWS
Total percent
LCIPercent
unmarkedBarabara Creek, 8/26/2014 6 2 3 2 1 11 3 14 2 16 87.5% 68.8% 18.8% 12.5%
Barabara Creek, 9/8/2014 25 25 1 21 2 72 2 74 5 79 93.7% 91.1% 2.5% 6.3%
Barabara Creek - combined 31 25 3 24 4 1 83 5 88 7 95 92.6% 87.4% 5.3% 7.4%
China Poot Creek, 8/28/2014 2 2 0 2 49 51 3.9% 3.9% 0.0% 96.1%
China Poot Creek, 9/5/2014 1 1 0 1 41 42 2.4% 2.4% 0.0% 97.6%
China Poot Creek - combined 0 0 0 3 0 0 3 0 3 90 93 3.2% 3.2% 0.0% 96.8%
Humpy Creek, 8/11/2014 0 0 0 94 94 0.0% 0.0% 0.0% 100.0%
Humpy Creek, 9/4/2014 1 1 0 1 94 95 1.1% 1.1% 0.0% 98.9%
Humpy Creek - combined 0 0 0 1 0 0 1 0 1 188 189 0.5% 0.5% 0.0% 99.5%
Port Graham River, 8/25/2014 1 1 1 1 50 4 50 54 41 95 56.8% 4.2% 52.6% 43.2%
Port Graham River, 9/11/2014 10 8 8 38 26 38 64 33 97 66.0% 26.8% 39.2% 34.0%
Port Graham River - combined 11 9 1 9 88 0 30 88 118 74 192 61.5% 15.6% 45.8% 38.5%
Seldovia River, 8/14/2014 5 0 5 5 102 107 4.7% 0.0% 4.7% 95.3%
Seldovia River, 8/27/2014 5 3 4 40 12 40 52 41 93 55.9% 12.9% 43.0% 44.1%
Seldovia River - combined 5 3 0 4 45 0 12 45 57 143 200 28.5% 6.0% 22.5% 71.5%
Tutka Lagoon 8/18/2014 1 2 85 1 87 88 7 95 92.6% 1.1% 91.6% 7.4%
Tutka Lagoon, 9/8/2014 2 5 5 4 70 12 74 86 6 92 93.5% 13.0% 80.4% 6.5%
Tutka Lagoon - combined 2 5 1 5 6 155 13 161 174 13 187 93.0% 7.0% 86.1% 7.0%
Dogfish Lagoon Creeks, 9/9/2014 14 5 10 8 1 29 9 38 55 93 40.9% 31.2% 9.7% 59.1%
English Bay River, 8/26/2014 14 5 1 8 1 28 1 29 64 93 31.2% 30.1% 1.1% 68.8%
Total 77 52 6 64 152 157 199 309 508 634 1,142
Percent of total fish in creeks 6.7% 4.6% 0.5% 5.6% 13.3% 13.7% 17.4% 27.1% 44.5% 55.5%
Percent of hatchery fish in creeks 15.2% 10.2% 1.2% 12.6% 29.9% 30.9% 39.2% 60.8%
Percent of PWS hatchery fish by facility 38.7% 26.1% 3.0% 32.2%
Percent of LCI hatchery fish by facility 49.2% 50.8%
Note: AFH = Armin F. Koernig Hatchery; CCH = Cannery Creek Hatchery; SGH = Solomon Gulch Hatchery; WNH = Wally Noerenberg Hatchery; PGH = Port Graham Hatchery; TBLH = Tutka Bay Lagoon Hatchery.

185
APPENDIX G: HERRING

186
Appendix G1.–Total biomass estimates and commercial catch of Pacific herring in short tons by age class, Kamishak Bay District, Lower Cook Inlet, 2015, and 2016 forecast.
2015 Est. Percent 2015 Percent 2015 Percent 2016 Percent
Spawning by Commercial by Total by Forecast by
Age Biomass Weight Harvesta Weight Biomass Weight Biomass Weight
1
2
3 0 0.0% 0 0 0 0.0% 267 16.7%
4 15 0.8% 0 0 15 0.8% 0 0.0%
5 136 6.7% 0 0 136 6.7% 17 1.1%
6 158 7.8% 0 0 158 7.8% 124 7.7%
7 176 8.8% 0 0 176 8.8% 134 8.4%
8 706 35.1% 0 0 706 35.1% 126 7.9%
9 169 8.4% 0 0 169 8.4% 483 30.1%
10 301 14.9% 0 0 301 14.9% 102 6.4%
11 260 12.9% 0 0 260 12.9% 168 10.5%
12 67 3.3% 0 0 67 3.3% 141 8.8%
13+ 27 1.3% 0 0 27 1.3% 40 2.5%
TOTALS 2,015 100.0% 0 0 2,015 100.0% 1,603 100.0%
Note: st = short ton = 2,000 lbs. a The commercial herring fishery in Kamishak Bay did not open in 2015.

187
Appendix G2.–Catch of Pacific herring in short tons and effort in number of permits making deliveries by district in the commercial sac roe seine fishery, Lower Cook Inlet, 1961–2015.
Southern Kamishak Eastern Outer Total Year Tons Permits Tons Permits Tons Permits Tons Permits Tons Permits1961 1962 1963 1 1 1964 1965 2 2 1966 7 7 1967 1968 20 20 1969 551 758 38 1,347 1970 2,709 2,100 4,809 1971 a a 831 22 844 24 1972 a a a a a a
1973 204 16 243 14 831 25 301 12 1,579 37 1974 110 7 2,114 26 47 5 384 26 2,655 45 1975 24 5 4,119 40 CLOSED CLOSED 4,143 41 1976 4,842 66 CLOSED CLOSED 4,842 66 1977 291 13 2,908 57 CLOSED CLOSED 3,199 58 1978 17 7 402 44 CLOSED CLOSED 419 44 1979 13 3 415 35 CLOSED CLOSED 428 36 1980 CLOSED CLOSED CLOSED CLOSED CLOSED 1981 CLOSED CLOSED CLOSED CLOSED CLOSED 1982 CLOSED CLOSED CLOSED CLOSED CLOSED 1983 CLOSED CLOSED CLOSED CLOSED CLOSED 1984 CLOSED CLOSED CLOSED CLOSED CLOSED 1985 CLOSED 1,132 23 204 7 a a 1,348 29 1986 CLOSED 1,959 54 167 4 28 3 2,154 57 1987 CLOSED 6,132 63 584 4 202 9 6,918 69 1988 CLOSED 5,548 75 a a 5,605 76 1989 170 6 4,801 75 4,971 81 1990 CLOSED 2,264 75 CLOSED CLOSED 2,264 75 1991 CLOSED 1,992 58 1,992 58 1992 CLOSED 2,282 56 2,282 56 1993 CLOSED 3,570 60 CLOSED CLOSED 3,570 60 1994 CLOSED 2,167 61 CLOSED CLOSED 2,167 61 1995 CLOSED 3,378 60 CLOSED CLOSED 3,378 60 1996 CLOSED 2,984 62 CLOSED CLOSED 2,984 62 1997 CLOSED 1,746b 45b CLOSED CLOSED 1,746 45 1998 CLOSED 331b 20b CLOSED CLOSED 331 20 1999 CLOSED 100c 1c CLOSED CLOSED 100 1 2000-2015 CLOSED CLOSED CLOSED CLOSED CLOSED
1961-1999 Average d
295
2,520 49
556
146
2,205
Source: ADF&G fish ticket database. Commercial Fisheries Entry Commission License Statistics, 1974–2015, Juneau. a Confidential data. Fewer than 3 permits reporting. b Includes both commercial harvest and ADF&G test fish harvest. c Commercial fishery closed, ADF&G test fish harvest only. d Averages based only on years with reported harvest.

188
Appendix G3.–Preseason estimates of biomass and projected commercial sac roe seine harvests, versus actual harvests, for Pacific herring in short tons (st), average roe recovery, numbers of permits making landings, and exvessel value in millions of dollars, Kamishak Bay District, Lower Cook Inlet, 1978–2015.
Preseason Actual Average
roe %
No. of Exvessel Forecasted Projected commercial permits valueb
Year biomass (st) harvest (st)a harvest (st)a w/landings (in millions)1978 c d 402 33.4 44 e 1979 c d 415 12.5 e e 1980 c d CLOSED 1981 c d CLOSED 1982 c d CLOSED 1983 c d CLOSED 1984 c d CLOSED 1985 c d 1,132 11.3 23 1 1986 c d 1,959 10.4 54 2.2 1987 c 3,833 6,132 11.3 63 8.4 1988 c 5,190 5,548 11.1 75 9.3 1989 37,785 5,000 4,801 9.5 75 3.5f 1990 28,658 2,292 2,264 10.8 75 1.8 1991 17,256 1,554 1,992 11.3 58 1.3 1992 16,431 1,479 2,282 9.7 56 1.4 1993 28,805 2,592 3,570 10.2 60 2.2 1994 25,300 3,421 2,167 10.6 61 1.5 1995 21,998 2,970 3,378 9.8 60 4.0 1996 20,925 2,250 2,984 10.1 62 6.0f 1997 25,300 3,420 1,746 9.3 45 0.4 1998 19,800 1,780 331 8.5 20 0.1 1999 g CLOSEDh 2000 6,330 CLOSED 2001 11,352 CLOSED 2002 9,020 CLOSED 2003 4,771 CLOSED 2004 3,554 CLOSED 2005 3,058 CLOSED 2006 2,650 CLOSED 2007 2,286 CLOSED 2008 2,069 CLOSED 2009 i CLOSED 2010 2,963 CLOSED 2011 3,830 CLOSED 2012 i CLOSED 2013 i CLOSED 2014 6,318 CLOSED 2015 5,699 CLOSED a Kamishak Bay allocation only; does not include Shelikof Strait food/bait allocation. b Exvessel values exclude any postseason retroactive adjustments (except where noted). c Prior to 1989, preseason forecasts of biomass were not generated. d Prior to 1987, preseason harvest projections were not generated. e Data not available. f Includes retroactive adjustment. g 1999 preseason biomass calculated as a range of 6,000 to 13,000 st. h ADF&G test fishing harvested 100 st. i No forecast of abundance generated for 2009, 2012, and 2013 due to lack of samples in previous year(s).

189
Appendix G4.–Summary of herring sac roe seine fishery openings and commercial harvests in the Kamishak Bay District of Lower Cook Inlet, 1969–2015.
Harvest Catch Rate Number ofDates of (short (short tons/ permits
Year openings Total hours open tons) hour open) w/landings1969–1972 No closed periods 1973 No closed periods 243 81974 1/1–5/20 2,114 261975 1/1–6/6 Closed Iniskin Bay, 5/17 4,119 40
1976 1/1-5/21 (Closed Iniskin Bay, 5/17. Reopened
Kamishak, 6/2) 4,824 66
1977 1/1–5/31 (Closed Kamishak Dist. 5/12;
reopened 5/14–5/17; reopened 5/29–5/31) 2,908 57
1978a 4/16–5/31 96 402 4 441979 5/12–5/24 112 415 4 361980–1984 CLOSED 1985 4/20–6/15 1,350 1,132 1 231986 4/20–6/13 1,303 1,959 2 541987 4/21–4/23 65 6,132 94 631988 4/22–4/29 42 5,548 132 741989 4/17–4/30 24.5 4,801 196 741990 4/22–4/23 8 2,264 283 751991 4/26 1 1,992 1,992 581992 4/24 0.5 2,282 4,564 561993 4/21 0.75 3,570 4,760 60
1994 4/25 0.5 778 1,556 354/29 1 1,338 1,338 53
1995 4/27 0.5 1,685 3,370 454/28 1 1,693 1,693 44
1996 4/24 0.5 2,984 5,968 62
1997
4/25b 0.5 4/29 1.5 1,580 1,053 424/30 c c c c
5/1 12 51 4 45/22d d 54 d –
1998
4/21 0.5 160 320 124/22 2 136 68 11
5/14d d 10 d –5/22d d 23 d –
1999–2015 CLOSED 100e a Management by emergency order began (closed until opened). b Despite the open fishing period, the entire fleet collectively agreed not to fish due to ongoing price negotiations with
processors. c Confidential data. Fewer than 3 permits reporting. d ADF&G test fish harvest. e ADF&G test fish harvest in 1999.

190
Appendix G5.–Aerial survey indices, miles of observed spawn, and comparison of preseason biomass forecast/projected harvest and actual commercial herring sac roe seine harvest versus hindcast (age-structured-assessment) estimates of total biomass and exploitation rate in Kamishak Bay District, Lower Cook Inlet, 1990–2015.
Aerial Survey
biomass index (st)
Miles of
spawn obs.
Preseason Actual
commercial harvest
(st)a
Estimated exploitation
rate (%)b
ASA
Hindcast
Hindcast exploitation
rate (%)c,f
Forecasted Projected
total biomass
Year biomass
(st) harvest
(st)a estimate
(st)c,d,e 1990 17,506 16.1 28,658 2,292 2,264 7.9 17,102 13.2 1991 3,067 3.5 17,256 1,554 1,992 11.5 18,108 11 1992 12,257 5.9 16,431 1,479 2,282 13.9 16,583 13.8 1993 7,939 5.4 28,805 2,592 3,570 12.4 14,777 24.2 1994 4,633 7.2 25,300 3,421 2,167 8.6 12,183 17.8 1995 7,750 5.4 21,998 2,970 3,378 15.4 9,805 34.5 1996 5,924 19.5 20,925 2,250 2,984 14.3 7,559 39.5 1997 2,974 0.8 25,300 3,420 1,746 6.9 5,710 30.6 1998 1,885 2.2 19,800 1,780 331 1.7 5,074 6.5 1999 5,456 3.8 g CLOSEDh 5,030 2000 8,117 0.6 6,330 CLOSED 5,074 2001 2,437 1.3 11,352 CLOSED 4,751 2002 3,748 0.2 9,020 CLOSED 4,548 2003 1,692 1.6 4,771 CLOSED 4,666 2004 857 0.9 3,554 CLOSED 4,825 2005 1,319 0.0 3,058 CLOSED 5,245 2006 1,298 0.0 2,650 CLOSED 5,143 2007 1,237 0.2 2,286 CLOSED 5,979 2008 2,098 1.2 2,069 CLOSED 6,652 2009 2,161 3.2 i CLOSED 5,852 2010 4,500 1.8 2,963 CLOSED 6,327 2011 3,471 2.9 3,830 CLOSED 5,619 2012 1,399 1.0 i CLOSED 4,810 2013 7,838 10.0 i CLOSED 3,743 2014 6,138 3.2 6,318 CLOSED 1990–2014 Average j
4,477 0.0 12,508 2,418 2,302 10 7,518 21.2
2015 666 5,699 CLOSED 2,015
Note: st = short ton. Sources: Data from Otis 2004; Otis and Cope 2004; and Yuen 1994. a Kamishak Bay allocation only; does not include Shelikof Strait food/bait allocation. b Estimated exploitation rate based on preseason forecasted biomass and actual commercial harvest for each year. c Figures are based on the best available data at the time of publishing and are subject to change as new data is incorporated into
the model; therefore, all figures herein supersede those previously reported. d Age-structured-assessment (ASA) model integrates heterogeneous data sources and simultaneously minimizes differences
between observed and expected return data to forecast the following year’s biomass as well as hindcast previous years’ biomass.
e ASA estimates based on the most recent available hindcast, run after the 2015 survey season. f Estimated exploitation rate based on ASA hindcast estimates of biomass divided by actual commercial harvest. g 1999 preseason biomass calculated as a range of 6,000 to 13,000 short ton. h ADF&G test fishing harvested 100 short ton. i No ASA forecasted or hindcasted abundance estimate possible due to lack of age composition samples. j Averages based only on years with data presented.

191
APPENDIX H: 2015 OUTLOOK

192
Appendix H1.–Lower Cook Inlet salmon fishery outlook, 2015.
ALASKA DEPARTMENT OF FISH AND GAME DIVISION OF COMMERCIAL FISHERIES
NEWS RELEASE
Sam Cotten, Commissioner
Jeff Regnart, Director
Contact: Homer Area OfficeGlenn Hollowell, Area Finfish Management Biologist 3298 Douglas PlaceTed Otis, Area Finfish Research Biologist Homer, AK 99603Ethan Ford, Fisheries Date Issued: April 28, 2015, Phone: (907) 235-8191 Time: 2:00 PM 2015 LOWER COOK INLET SALMON FISHERY OUTLOOK General Information This outlook is provided to assist the commercial salmon industry in planning for the 2015 season in the Lower Cook Inlet (LCI) Management Area. Preseason forecasts and recent 5 year commercial common property harvest averages are the basis for the information provided. Forecasts for LCI can be found on ADF&G’s web site:
http://www.adfg.alaska.gov/index.cfm?adfg=commercialbyarealci.salmon
Cook Inlet Aquaculture Association (CIAA) manages the Trail Lakes Hatchery (TLH), Port Graham Hatchery (PGH), and Tutka Bay Lagoon Hatchery (TBLH). Hatchery forecasts can be found through the CIAA web site:
http://www.ciaanet.org
Inseason modifications to harvest projections, season opening dates, and strategies for weekly fishing periods may occur as fisheries develop.
The forecasts for commercial common property fishery (CCPF) harvests by species are summarized in Table 1. The wild stock pink salmon forecast is derived from a spawner-recruit analysis, whereas run projections for other wild stock species are based on recent 5-year average historical production. Projected runs of hatchery-origin salmon are provided by CIAA. These projections of hatchery and wild stock runs will provide the basis for early-season management in all districts with other management tools such as aerial survey estimates, weir counts, remote video monitoring and anticipated harvest used as the season progresses.
Management of the LCI commercial salmon fisheries is based in the Homer area office. All emergency order (EO) announcements of fishery openings and closures are broadcast on VHF channel 10. As was done last year, fishery announcements from the Homer ADF&G office will
-continued-

193
Appendix H1.–Page 2 of 4.
routinely occur on Fridays at 2:00 PM, or earlier if possible. Announcement recordings will be available for commercial fisheries at 907-235-7307. Emergency order announcement information is also transmitted by email to all registered processors, local radio stations, news media and interested members of the public. Harvest information and fisheries announcements are located on the ADF&G web site: http://www.adfg.alaska.gov/index.cfm?adfg=commercialbyarealci.salmon
In addition, interested individuals may sign up to receive email announcements:
http://www.adfg.alaska.gov/index.cfm?adfg=cfnews.main
The first announcement is anticipated to be released at 2:00 PM, Friday, May 1.
CIAA anticipates a total of 445,137 hatchery produced sockeye and 1.5 million pink salmon to return to LCI release sites in 2015. The 2015 CIAA cost recovery goal is 4.1 million dollars. The majority of the cost recovery harvest is anticipated to come from Resurrection Bay with allowances made for some harvest during broodstock collections at Tutka Bay Hatchery if needed. As in past years, CIAA anticipates beginning cost recovery harvest in Resurrection Bay and expanding it to other areas until the goal is met. The overall commercial common property harvest from Lower Cook Inlet is anticipated to be 2.0 million salmon. Of these, 72.6% of the salmon are anticipated to be of hatchery origin (Table 1).
Set Gillnet Fishery
The Southern District is anticipated to open for the 2015 season on Monday, June 1 at 6:00 AM for a 48-hour period. Following periods will likely be 48-hours in length beginning at 6:00 AM on Monday and Thursday, as specified in regulation. Harvests for 2015 are anticipated to be similar to the historic average. The 5-year average harvest for this area and gear are 154 Chinook, 800 coho and 2,500 chum salmon. The 5-year commercial harvest average for the wild sockeye salmon is 23,800 fish. The department’s preliminary pink salmon forecast estimated a harvestable surplus of 26,000 fish from the Southern District; which is to be shared by commercial set gillnet and purse seine permit holders. Fishing time in the Port Graham Subdistrict will be closely linked to escapement levels to English Bay Lakes. Management priority will be to provide for subsistence needs (4,800–7,200 salmon). The Port Graham Subdistrict is anticipated to remain closed to commercial harvest until English Bay River escapement is tracking to meet the overall spawning escapement goal (6,000–13,500) and hatchery broodstock goals. CIAA anticipates 10,200 sockeye salmon returning to the Port Graham Hatchery SHA. Further information regarding previous year’s hatchery releases and commercial harvests may be found in Annual Management Reports for this area at:
http://www.adfg.alaska.gov/index.cfm?adfg=commercialbyarealci.salmon#/management
Purse Seine Fishery
Portions of the Southern District are anticipated to open to purse seine harvest in mid-June coinciding with enhanced returns to Leisure and Hazel lakes. Historically this return peaks from July 12–18 (week 29). CIAA anticipates a return of 27,944 sockeye salmon to Leisure and Hazel lakes combined, as well as 48,160 sockeye salmon to Tutka Bay, and 10,200 to Port Graham.
Commercial fishing time after mid-July will be correlated to pink salmon escapement at Humpy
-continued-

194
Appendix H1.–Page 3 of 4.
Creek, Seldovia Bay, Port Graham and other locations in this district. A total of 1.5 million hatchery produced pink salmon are anticipated to return to release sites in the Southern District.
Hatchery sockeye salmon returns to the Eastern District are forecast by CIAA to be 322,737 fish, all of which may be required for cost recovery and broodstock purposes. Wild stock harvest opportunity in the Eastern District will be linked to aerial survey observations of wild sockeye and pink salmon escapements to Aialik Lake and other spawning systems in this district. In addition, surveys of chum salmon index systems in Resurrection Bay and Day Harbor will be flown weather and time permitting.
Portions of the Outer District may open to commercial harvest in mid-July focusing on sockeye returns to McCarty Fjord lakes. Escapement to these systems is monitored by aerial survey (Desire and Delusion lakes), as well as a weir at the outlet of Delight Lake. In addition, waters in the western portion of this district may be open by this time focusing on pink and chum salmon returns to Port Dick, as well as Windy and Rocky bays. There are numerous other smaller systems in the Nuka Passage area that are also monitored for returning chum and pink salmon. In the far west end of this district, systems with the latest return timing: Dogfish Bay, Chugach Bay and Port Chatham will be evaluated for chum and pink salmon harvest potential from August to early September. The previous 5-year harvest average for this district is 14,800 sockeye and 41,700 chum salmon. The department has forecast a harvestable surplus of 370,000 pink salmon from this district. The parent year harvest of pink salmon in this district was 2.0 million fish.
While portions of the Kamishak Bay District typically open by regulation to commercial harvest on June 1, portions of this district may open on Monday, May 25 targeting sockeye salmon returns to Mikfik Lake. This may occur if significant numbers of returning sockeye are observed in this area at that time. Last year sockeye salmon were observed in the lower Mikfik River on May 22 with over 600 fish counted entering the lake by June 1. The final escapement to this lake of 18,062 exceeded the SEG range of 3,400–13,000 fish. The Mikfik Creek–McNeil Lagoon Salmon Fishery Management Plan directs fishery managers to prosecute the commercial fishery outside of the McNeil/Mikfik Lagoon to the maximum extent possible. Previous 5-year average harvests for this district (excluding the Kirschner Subdistrict) are 37,900 sockeye and 16,800 chum salmon with the majority of the sockeye salmon harvest attributed to Chenik Lake runs and the chum salmon harvest spread throughout the district. Due to poor pink salmon escapement in 2013, the department has forecast there will not be a large commercial harvest of pink salmon from this district. Returns of hatchery released sockeye salmon to the Kirschner Lake outfall remote release site are anticipated to be 39,500 fish. The department tracks salmon escapement in this district using remote video monitoring sites at Chenik and Mikfik lakes, as well as regular aerial survey observations of index streams.
-continued-

195
Appendix H1.–Page 4 of 4.
Table 1.- Projected commercial common property harvests and hatchery returns for Lower Cook Inlet, 2015.
SOCKEYE SALMON Total anticipated harvest = 215,600Natural stocks, (5-yr average commercial harvest) Southern District, (purse seine, excluding hatchery SHAs) 16,900Southern District, (set gillnet) 23,800Eastern District, (Aialik Bay) 0Outer District 14,800Kamishak Bay District, (excluding Kirschner Lake Subdistrict) 37,900
Sockeye salmon hatchery stocksa Hatchery
returnBroodstock
harvestCost recovery
harvest Commercial
harvestResurrection Bay 322,737 12,558 310,179 0China Poot and Hazel lakes 27,944 0 0 27,944Tutka Bay Lagoon 48,160 5,200 0 42,960Kirschner Lake 39,500 0 0 39,500Port Graham Bay 5,100 0 0 5,100English Bay Lakes 1,696 0 0 1,696
PINK SALMON, ADF&G Preliminary Pink Salmon Forecastb Total anticipated harvest = 1,738,000Southern District (combined gear) 26,000Eastern District 0Outer District 370,000Kamishak Bay District 0
Pink salmon hatchery stocksa Hatchery
returnBroodstock
harvestCost recovery
harvest Commercial
harvestTutka Bay Lagoon 1,533,000 191,000 0 1,342,000Port Graham Bay 2,820 2,820 0 0
CHUM SALMON - 5-year average harvest Total anticipated harvest = 62,230Southern District (purse seine) 1,000Southern District (set gillnet) 2,500Eastern District 230Outer District 41,700Kamishak Bay District 16,800
COHO SALMON - 5-year average harvest Total anticipated harvest = 1,540Southern District (purse seine) 600Southern District (set gillnet) 800Eastern District 0Outer District 40Kamishak Bay District 100
CHINOOK SALMON – 5-year average harvest Total anticipated harvest = 216Southern District (purse seine) 56Southern District (set gillnet) 154Eastern District 0Outer District 4Kamishak Bay District 2
Total LCI anticipated commercial common property harvest- all salmon species = 2,012,586a Available online at: http://www.adfg.alaska.gov/index.cfm?adfg=commercialbyarealci.salmon#/forecasts. b Provided by Cook Inlet Aquaculture Association, based on parent year releases and recent ocean survival.