Embed Size (px)
Citation preview
2015 IT Audit & Information Security SurveyWhitepaper Guidance for Healthcare Internal Auditors
and Information Security Professionals
Table of ContentsExecutive Summary 1
Introduction 3
Overview of Study Participants 3
Information Technology Environment 5
Information Security Program 6
IT Audit 8
Disaster Recovery 9
Vendor Management 10
Identity and Access Management (IAM) 10
IT Security Risk Assessment 11
Passwords / Authentication 12
Cybersecurity 14
Conclusions 15
Association of Healthcare Internal Auditors 1
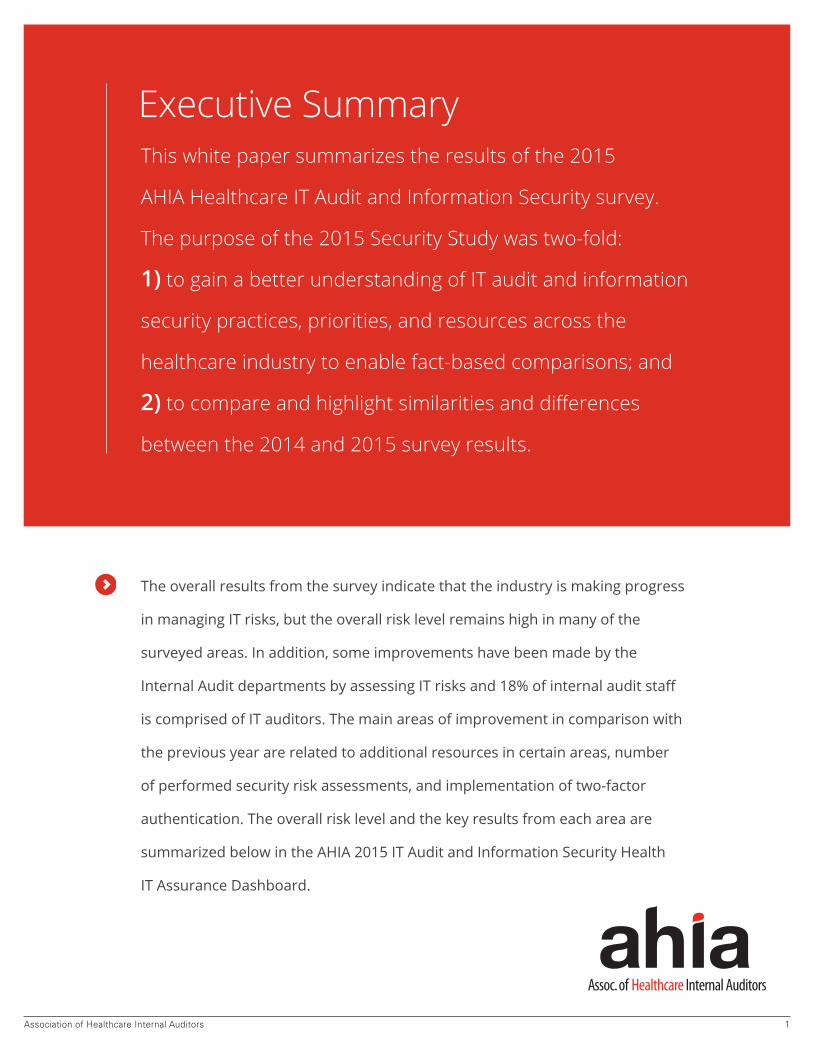
Executive SummaryThis white paper summarizes the results of the 2015
AHIA Healthcare IT Audit and Information Security survey.
The purpose of the 2015 Security Study was two-fold:
1) to gain a better understanding of IT audit and information
security practices, priorities, and resources across the
healthcare industry to enable fact-based comparisons; and
2) to compare and highlight similarities and differences
between the 2014 and 2015 survey results.
The overall results from the survey indicate that the industry is making progress
in managing IT risks, but the overall risk level remains high in many of the
surveyed areas. In addition, some improvements have been made by the
Internal Audit departments by assessing IT risks and 18% of internal audit staff
is comprised of IT auditors. The main areas of improvement in comparison with
the previous year are related to additional resources in certain areas, number
of performed security risk assessments, and implementation of two-factor
authentication. The overall risk level and the key results from each area are
summarized below in the AHIA 2015 IT Audit and Information Security Health
IT Assurance Dashboard.
2015 IT Audit and Information Security Survey2
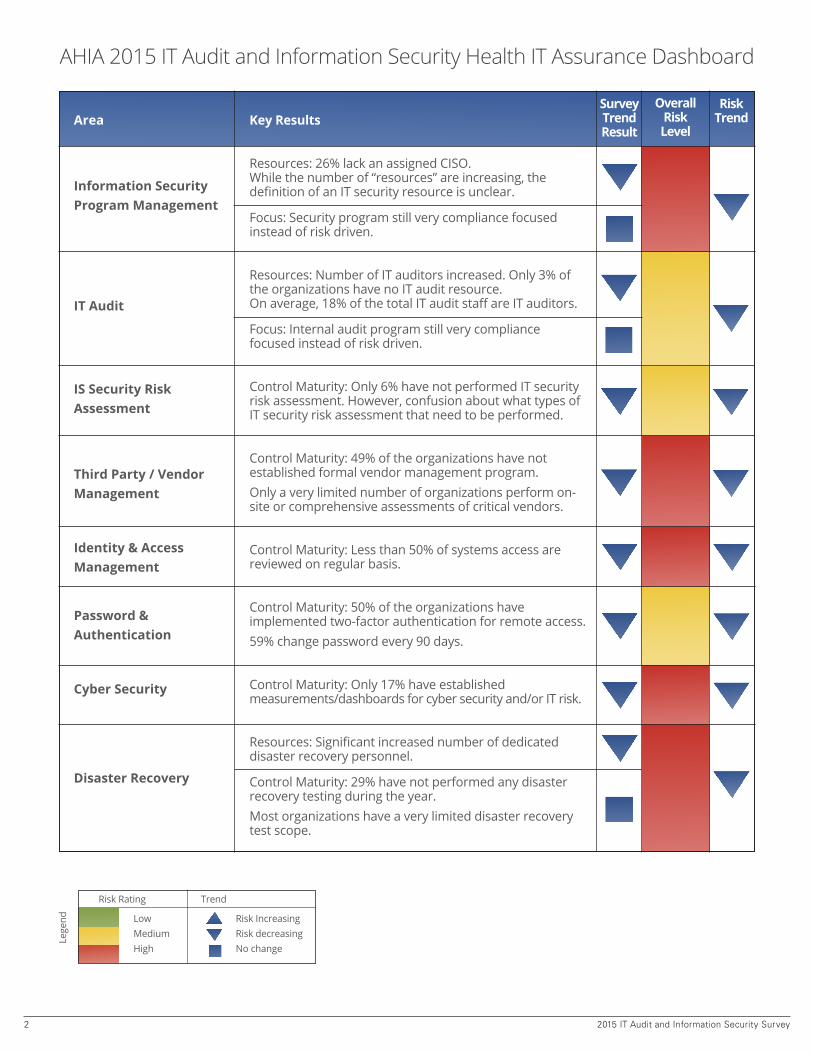
AHIA 2015 IT Audit and Information Security Health IT Assurance Dashboard
Area
Information Security Program Management
IT Audit
IS Security Risk Assessment
Third Party / Vendor Management
Identity & Access Management
Password & Authentication
Cyber Security
Disaster Recovery
Key Results
Resources: 26% lack an assigned CISO.While the number of “resources” are increasing, the definition of an IT security resource is unclear.
Focus: Security program still very compliance focused instead of risk driven.
Resources: Number of IT auditors increased. Only 3% of the organizations have no IT audit resource.On average, 18% of the total IT audit staff are IT auditors.
Focus: Internal audit program still very compliance focused instead of risk driven.
Control Maturity: Only 6% have not performed IT security risk assessment. However, confusion about what types of IT security risk assessment that need to be performed.
Control Maturity: 49% of the organizations have not established formal vendor management program.Only a very limited number of organizations perform on-site or comprehensive assessments of critical vendors.
Control Maturity: Less than 50% of systems access are reviewed on regular basis.
Control Maturity: 50% of the organizations have implemented two-factor authentication for remote access.59% change password every 90 days.
Control Maturity: Only 17% have established measurements/dashboards for cyber security and/or IT risk.
Resources: Significant increased number of dedicated disaster recovery personnel.
Control Maturity: 29% have not performed any disaster recovery testing during the year.Most organizations have a very limited disaster recovery test scope.
SurveyTrendResult
OverallRiskLevel
RiskTrend
Risk Rating
LowMediumHigh
Trend
Risk IncreasingRisk decreasingNo change
Lege
nd
Association of Healthcare Internal Auditors 3
Over the past several years the pace of technology implementation in the healthcare industry has accelerated while the risk landscape has become significantly more complex. Hospitals, physician practices, payers, and health systems have invested millions of dollars to implement systems that manage essential business and clinical processes. Management demand for better insight into healthcare technology risk has resulted in the publication of a number of excellent studies by Symantec1, PricewaterhouseCoopers2, Verizon3, EMC4, Ponemon Institute5 and other reputable sources. Although these resources have been effective in providing industry and technology risk perspective, none of them have addressed risk from the technology internal audit perspective in healthcare. Also, there has been little specific benchmarking data that could be used to
understand healthcare IT audit and information security norms and trends.
The purpose of the 2015 Healthcare IT Audit and Information Security Study was two-fold: 1) to gain a better understanding of IT audit and information security practices, priorities, and resources across the healthcare industry; and 2) to compare and highlight similarities and differences between the 2014 and 2015 survey results. Positive feedback has been received from the results of the 2014 survey and it was clear that IT auditors and information security professionals will continue to benefit from receiving this type of information. These professionals frequently ask “What are other healthcare organizations doing?” when trying to recommend controls or justify requests for additional resources. Without industry-specific data, it is difficult to make fact-based comparisons.
Introduction
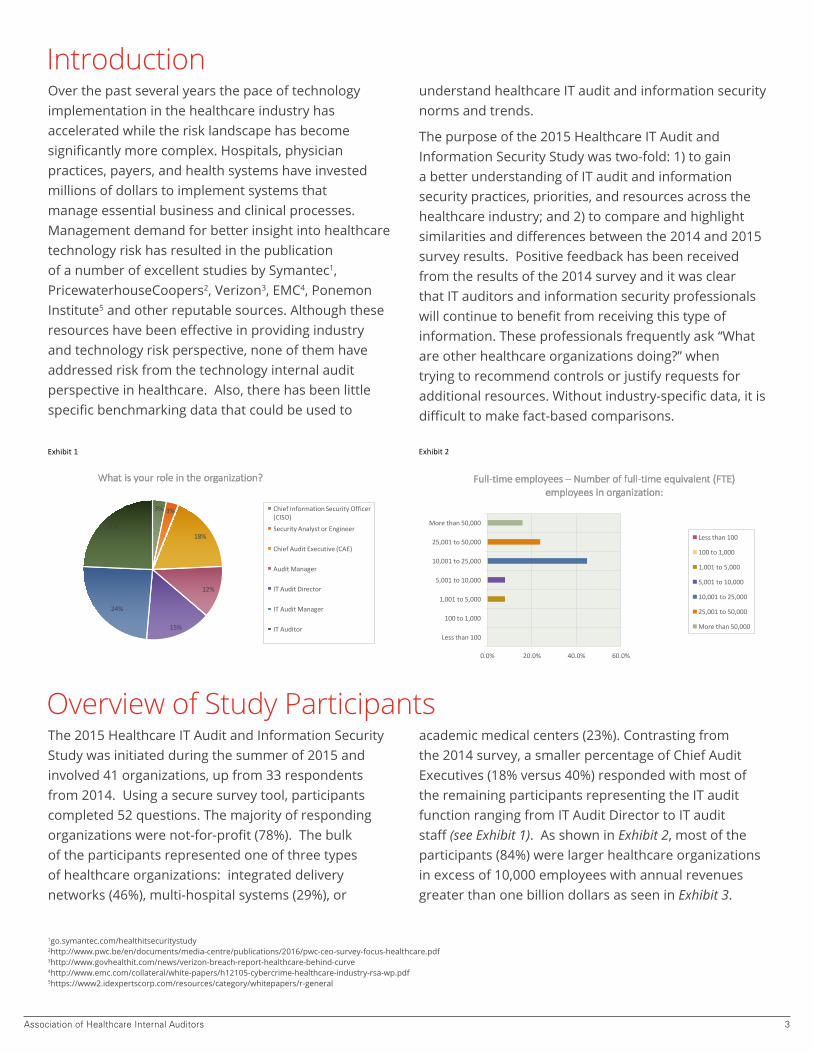
The 2015 Healthcare IT Audit and Information Security Study was initiated during the summer of 2015 and involved 41 organizations, up from 33 respondents from 2014. Using a secure survey tool, participants completed 52 questions. The majority of responding organizations were not-for-profit (78%). The bulk of the participants represented one of three types of healthcare organizations: integrated delivery networks (46%), multi-hospital systems (29%), or
academic medical centers (23%). Contrasting from the 2014 survey, a smaller percentage of Chief Audit Executives (18% versus 40%) responded with most of the remaining participants representing the IT audit function ranging from IT Audit Director to IT audit staff (see Exhibit 1). As shown in Exhibit 2, most of the participants (84%) were larger healthcare organizations in excess of 10,000 employees with annual revenues greater than one billion dollars as seen in Exhibit 3.
Overview of Study Participants
Exhibit1
Exhibit2
3% 3%
18%
12%
15%
24%
24%
Whatisyourroleintheorganization?
ChiefInformationSecurityOfficer(CISO)
SecurityAnalystorEngineer
ChiefAuditExecutive(CAE)
AuditManager
ITAuditDirector
ITAuditManager
ITAuditor
Lessthan100
100to1,000
1,001to5,000
5,001to10,000
10,001to25,000
25,001to50,000
Morethan50,000
0.0% 20.0% 40.0% 60.0%
Full-timeemployees– Numberoffull-timeequivalent(FTE)employeesinorganization:
Exhibit1
Exhibit2
3% 3%
18%
12%
15%
24%
24%
Whatisyourroleintheorganization?
ChiefInformationSecurityOfficer(CISO)
SecurityAnalystorEngineer
ChiefAuditExecutive(CAE)
AuditManager
ITAuditDirector
ITAuditManager
Lessthan100
100to1,000
1,001to5,000
5,001to10,000
10,001to25,000
25,001to50,000
Morethan50,000
0.0% 20.0% 40.0% 60.0%
Full-timeemployees– Numberoffull-timeequivalent(FTE)employeesinorganization:
Lessthan100
100to1,000
1,001to5,000
5,001to10,000
10,001to25,000
25,001to50,000
Morethan50,000
1go.symantec.com/healthitsecuritystudy 2http://www.pwc.be/en/documents/media-centre/publications/2016/pwc-ceo-survey-focus-healthcare.pdf 3http://www.govhealthit.com/news/verizon-breach-report-healthcare-behind-curve 4http://www.emc.com/collateral/white-papers/h12105-cybercrime-healthcare-industry-rsa-wp.pdf 5https://www2.idexpertscorp.com/resources/category/whitepapers/r-general

2015 IT Audit and Information Security Survey4
Most of the participants (84%) were larger healthcare organizations in excess of 10,000 employees with annual revenues greater than one billion dollars. “ ”
Association of Healthcare Internal Auditors 5
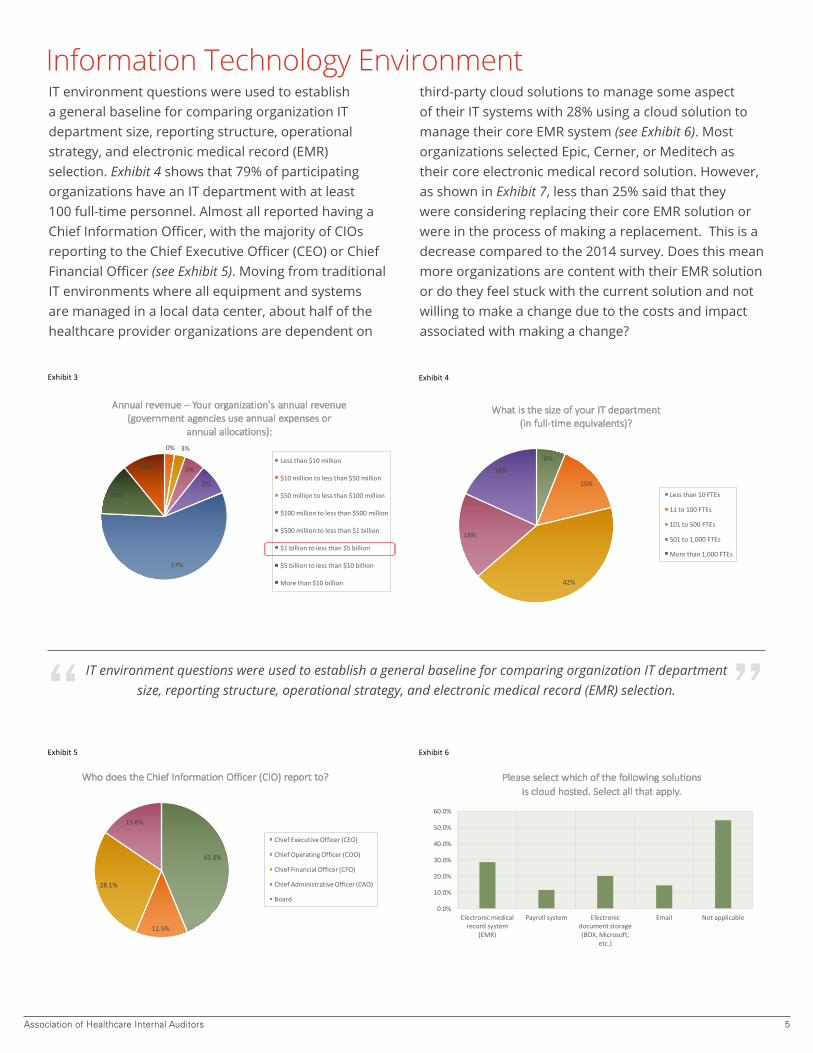
IT environment questions were used to establish a general baseline for comparing organization IT department size, reporting structure, operational strategy, and electronic medical record (EMR) selection. Exhibit 4 shows that 79% of participating organizations have an IT department with at least 100 full-time personnel. Almost all reported having a Chief Information Officer, with the majority of CIOs reporting to the Chief Executive Officer (CEO) or Chief Financial Officer (see Exhibit 5). Moving from traditional IT environments where all equipment and systems are managed in a local data center, about half of the healthcare provider organizations are dependent on
third-party cloud solutions to manage some aspect of their IT systems with 28% using a cloud solution to manage their core EMR system (see Exhibit 6). Most organizations selected Epic, Cerner, or Meditech as their core electronic medical record solution. However, as shown in Exhibit 7, less than 25% said that they were considering replacing their core EMR solution or were in the process of making a replacement. This is a decrease compared to the 2014 survey. Does this mean more organizations are content with their EMR solution or do they feel stuck with the current solution and not willing to make a change due to the costs and impact associated with making a change?
Information Technology Environment
Exhibit3
Exhibit4
0% 3%
5%
8%
57%
14%
11%
Annualrevenue– Yourorganization'sannualrevenue(governmentagenciesuseannualexpensesor
annualallocations):
Lessthan$10million
$10milliontolessthan$50million
$50milliontolessthan$100million
$100milliontolessthan$500million
$500milliontolessthan$1billion
$1billiontolessthan$5billion
$5billiontolessthan$10billion
Morethan$10billion
6%
15%
42%
18%
18%
WhatisthesizeofyourITdepartment(infull-timeequivalents)?
Lessthan10FTEs
11to100FTEs
101to500FTEs
501to1,000FTEs
Morethan1,000FTEs
Exhibit5
Exhibit6
43.8%
12.5%
28.1%
15.6%
WhodoestheChiefInformationOfficer(CIO)reportto?
ChiefExecutiveOfficer(CEO)
ChiefOperatingOfficer(COO)
ChiefFinancialOfficer(CFO)
ChiefAdministrativeOfficer(CAO)
Board
0.0%
10.0%
20.0%
30.0%
40.0%
50.0%
60.0%
Electronicmedicalrecordsystem
(EMR)
Payrollsystem Electronicdocumentstorage(BOX,Microsoft,
etc.)
Email Notapplicable
Pleaseselectwhichofthefollowingsolutionsiscloudhosted.Selectallthatapply.
Exhibit3
Exhibit4
0% 3%
5%
8%
57%
14%
11%
Annualrevenue– Yourorganization'sannualrevenue(governmentagenciesuseannualexpensesor
annualallocations):
Lessthan$10million
$10milliontolessthan$50million
$50milliontolessthan$100million
$100milliontolessthan$500million
$500milliontolessthan$1billion
$1billiontolessthan$5billion
$5billiontolessthan$10billion
Morethan$10billion
6%
15%
42%
18%
18%
WhatisthesizeofyourITdepartment(infull-timeequivalents)?
Lessthan10FTEs
11to100FTEs
101to500FTEs
501to1,000FTEs
Morethan1,000FTEs
IT environment questions were used to establish a general baseline for comparing organization IT department size, reporting structure, operational strategy, and electronic medical record (EMR) selection. “ ”
2015 IT Audit and Information Security Survey6
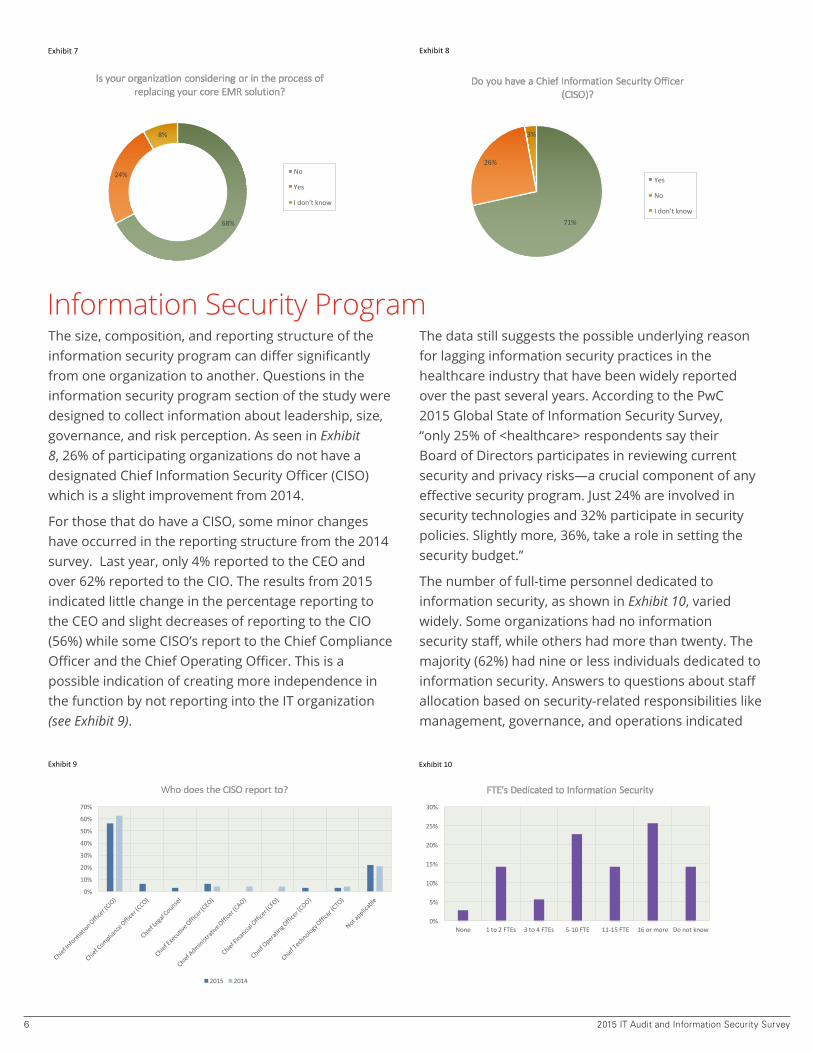
The size, composition, and reporting structure of the information security program can differ significantly from one organization to another. Questions in the information security program section of the study were designed to collect information about leadership, size, governance, and risk perception. As seen in Exhibit 8, 26% of participating organizations do not have a designated Chief Information Security Officer (CISO) which is a slight improvement from 2014.
For those that do have a CISO, some minor changes have occurred in the reporting structure from the 2014 survey. Last year, only 4% reported to the CEO and over 62% reported to the CIO. The results from 2015 indicated little change in the percentage reporting to the CEO and slight decreases of reporting to the CIO (56%) while some CISO’s report to the Chief Compliance Officer and the Chief Operating Officer. This is a possible indication of creating more independence in the function by not reporting into the IT organization (see Exhibit 9).
The data still suggests the possible underlying reason for lagging information security practices in the healthcare industry that have been widely reported over the past several years. According to the PwC 2015 Global State of Information Security Survey, “only 25% of <healthcare> respondents say their Board of Directors participates in reviewing current security and privacy risks—a crucial component of any effective security program. Just 24% are involved in security technologies and 32% participate in security policies. Slightly more, 36%, take a role in setting the security budget.”
The number of full-time personnel dedicated to information security, as shown in Exhibit 10, varied widely. Some organizations had no information security staff, while others had more than twenty. The majority (62%) had nine or less individuals dedicated to information security. Answers to questions about staff allocation based on security-related responsibilities like management, governance, and operations indicated
Information Security Program
Exhibit7
Exhibit8
68%
24%
8%
IsyourorganizationconsideringorintheprocessofreplacingyourcoreEMRsolution?
No
Yes
Idon’tknow
71%
26%
3%
DoyouhaveaChiefInformationSecurityOfficer(CISO)?
Yes
No
Idon’tknow
Exhibit7
Exhibit8
68%
24%
8%
IsyourorganizationconsideringorintheprocessofreplacingyourcoreEMRsolution?
No
Yes
Idon’tknow
71%
26%
3%
DoyouhaveaChiefInformationSecurityOfficer(CISO)?
Yes
No
Idon’tknow
Exhibit9
Exhibit10
0%
10%
20%
30%
40%
50%
60%
70%
WhodoestheCISOreportto?
2015 2014
0%
5%
10%
15%
20%
25%
30%
None 1to2FTEs 3to4FTEs 5-10FTE 11-15FTE 16ormore Donotknow
FTE'sDedicatedtoInformationSecurity
Exhibit7
Exhibit8
68%
24%
8%
IsyourorganizationconsideringorintheprocessofreplacingyourcoreEMRsolution?
No
Yes
Idon’tknow
71%
26%
3%
DoyouhaveaChiefInformationSecurityOfficer(CISO)?
Yes
No
Idon’tknow
Exhibit7
Exhibit8
68%
24%
8%
IsyourorganizationconsideringorintheprocessofreplacingyourcoreEMRsolution?
No
Yes
Idon’tknow
71%
26%
3%
DoyouhaveaChiefInformationSecurityOfficer(CISO)?
Yes
No
Idon’tknow
Exhibit9
Exhibit10
0%
10%
20%
30%
40%
50%
60%
70%
WhodoestheCISOreportto?
2015 2014
0%
5%
10%
15%
20%
25%
30%
None 1to2FTEs 3to4FTEs 5-10FTE 11-15FTE 16ormore Donotknow
FTE'sDedicatedtoInformationSecurity
Association of Healthcare Internal Auditors 7
that security roles may not be consistently defined or understood from one organization to the next.
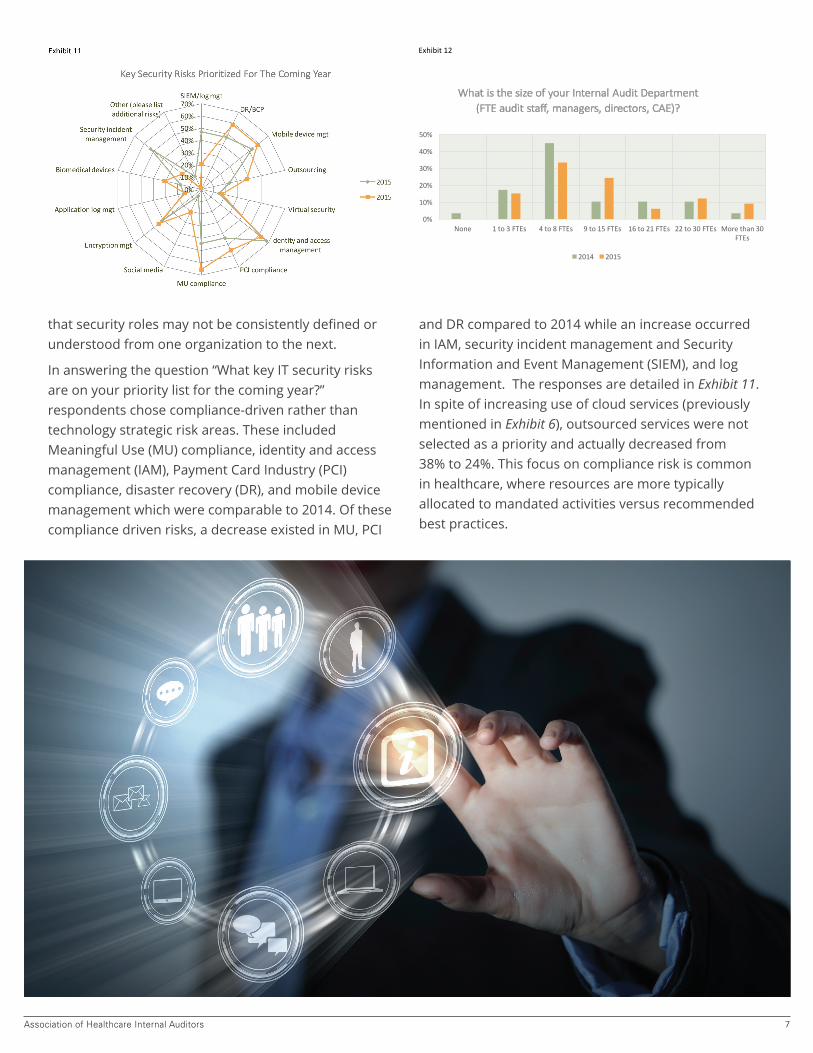
In answering the question “What key IT security risks are on your priority list for the coming year?” respondents chose compliance-driven rather than technology strategic risk areas. These included Meaningful Use (MU) compliance, identity and access management (IAM), Payment Card Industry (PCI) compliance, disaster recovery (DR), and mobile device management which were comparable to 2014. Of these compliance driven risks, a decrease existed in MU, PCI
and DR compared to 2014 while an increase occurred in IAM, security incident management and Security Information and Event Management (SIEM), and log management. The responses are detailed in Exhibit 11. In spite of increasing use of cloud services (previously mentioned in Exhibit 6), outsourced services were not selected as a priority and actually decreased from 38% to 24%. This focus on compliance risk is common in healthcare, where resources are more typically allocated to mandated activities versus recommended best practices.
Exhibit12
Exhibit13a
0%
5%
10%
15%
20%
25%
30%
35%
40%
45%
50%
None 1to3FTEs 4to8FTEs 9to15FTEs 16to21FTEs 22to30FTEs >30FTEs
WhatisthesizeofyourInternalAuditDepartment(FTEauditstaff,managers, directors,CAE)?
0%
10%
20%
30%
40%
50%
60%
70%
80%
None 1to3FTEs 4to6FTEs 7to10FTEs
Morethan10FTEs
Other(pleasespecify)
2015
2014
Number ofFTEresourcesdedicatedtoperformingITaudits
0%
10%
20%
30%
40%
50%
None 1to3FTEs 4to8FTEs 9to15FTEs 16to21FTEs 22to30FTEs Morethan30FTEs
WhatisthesizeofyourInternalAuditDepartment(FTEauditstaff,managers,directors,CAE)?
2014 2015
2015 IT Audit and Information Security Survey8
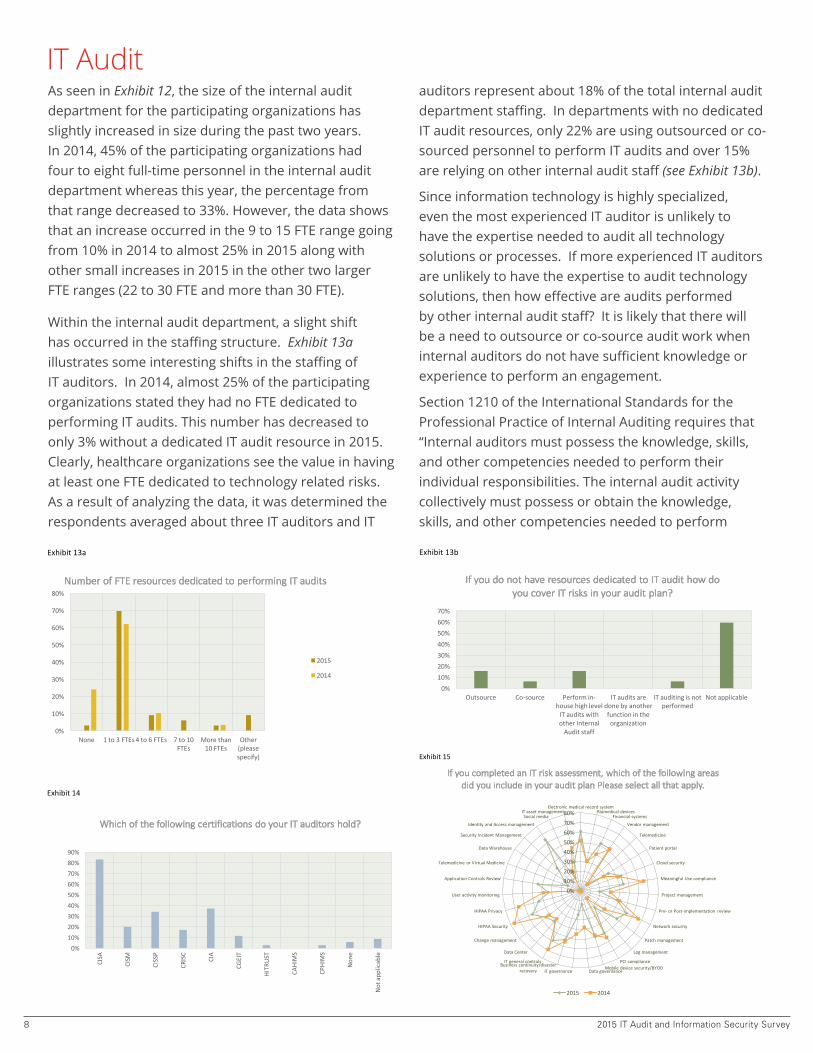
As seen in Exhibit 12, the size of the internal audit department for the participating organizations has slightly increased in size during the past two years. In 2014, 45% of the participating organizations had four to eight full-time personnel in the internal audit department whereas this year, the percentage from that range decreased to 33%. However, the data shows that an increase occurred in the 9 to 15 FTE range going from 10% in 2014 to almost 25% in 2015 along with other small increases in 2015 in the other two larger FTE ranges (22 to 30 FTE and more than 30 FTE).
Within the internal audit department, a slight shift has occurred in the staffing structure. Exhibit 13a illustrates some interesting shifts in the staffing of IT auditors. In 2014, almost 25% of the participating organizations stated they had no FTE dedicated to performing IT audits. This number has decreased to only 3% without a dedicated IT audit resource in 2015. Clearly, healthcare organizations see the value in having at least one FTE dedicated to technology related risks. As a result of analyzing the data, it was determined the respondents averaged about three IT auditors and IT
auditors represent about 18% of the total internal audit department staffing. In departments with no dedicated IT audit resources, only 22% are using outsourced or co-sourced personnel to perform IT audits and over 15% are relying on other internal audit staff (see Exhibit 13b).
Since information technology is highly specialized, even the most experienced IT auditor is unlikely to have the expertise needed to audit all technology solutions or processes. If more experienced IT auditors are unlikely to have the expertise to audit technology solutions, then how effective are audits performed by other internal audit staff? It is likely that there will be a need to outsource or co-source audit work when internal auditors do not have sufficient knowledge or experience to perform an engagement.
Section 1210 of the International Standards for the Professional Practice of Internal Auditing requires that “Internal auditors must possess the knowledge, skills, and other competencies needed to perform their individual responsibilities. The internal audit activity collectively must possess or obtain the knowledge, skills, and other competencies needed to perform
IT Audit
Exhibit12
Exhibit13a
0%
5%
10%
15%
20%
25%
30%
35%
40%
45%
50%
None 1to3FTEs 4to8FTEs 9to15FTEs 16to21FTEs 22to30FTEs >30FTEs
WhatisthesizeofyourInternalAuditDepartment(FTEauditstaff,managers, directors,CAE)?
0%
10%
20%
30%
40%
50%
60%
70%
80%
None 1to3FTEs 4to6FTEs 7to10FTEs
Morethan10FTEs
Other(pleasespecify)
2015
2014
Number ofFTEresourcesdedicatedtoperformingITaudits
Exhibit13b
Exhibit14
0%10%20%30%40%50%60%70%
Outsource Co-source Performin-househighlevelITauditswithotherInternalAuditstaff
ITauditsaredonebyanotherfunctionintheorganization
ITauditingisnotperformed
Notapplicable
IfyoudonothaveresourcesdedicatedtoITaudithowdoyoucoverITrisksinyourauditplan?
0%10%20%30%40%50%60%70%80%90%
CISA
CISM
CISSP
CRISC
CIA
CGEIT
HITR
UST
CAHIMS
CPHIMS
Non
e
Notapp
licable
WhichofthefollowingcertificationsdoyourITauditorshold?
0%10%20%30%40%50%60%70%80%
ElectronicmedicalrecordsystemBiomedicaldevices
Financialsystems
Vendormanagement
Telemedicine
Patientportal
Cloudsecurity
MeaningfulUsecompliance
Projectmanagement
Pre- orPost-implementation review
Networksecurity
Patchmanagement
Logmanagement
PCIcomplianceMobiledevicesecurity/BYOD
DatagovernanceITgovernanceBusinesscontinuity/disaster
recovery
ITgeneralcontrols
DataCenter
Changemanagement
HIPAASecurity
HIPAAPrivacy
Useractivitymonitoring
ApplicationControlsReview
TelemedicineorVirtualMedicine
DataWarehouse
SecurityIncidentManagement
IdentityandAccessmanagement
SocialmediaITassetmanagement
IfyoucompletedanITriskassessment,whichofthefollowingareasdidyouincludeinyourauditplanPleaseselectallthatapply.
2015 2014
Exhibit15
0%
10%
20%
30%
40%
50%
60%
70%
80%Electronicmedicalrecordsystem
BiomedicaldevicesFinancialsystems
Vendormanagement
Telemedicine
Patientportal
Cloudsecurity
MeaningfulUsecompliance
Projectmanagement
Pre- orPost-implementation review
Networksecurity
Patchmanagement
Logmanagement
PCIcomplianceMobiledevicesecurity/BYOD
DatagovernanceITgovernanceBusinesscontinuity/disasterrecovery
ITgeneralcontrols
DataCenter
Changemanagement
HIPAASecurity
HIPAAPrivacy
Useractivitymonitoring
ApplicationControlsReview
TelemedicineorVirtualMedicine
DataWarehouse
SecurityIncidentManagement
IdentityandAccessmanagement
SocialmediaITassetmanagement
IfyoucompletedanITriskassessment,whichofthefollowingareasdidyouincludeinyourauditplanPleaseselectallthatapply.
2015 2014
Association of Healthcare Internal Auditors 9
its responsibilities.” Exhibit 14 shows the distribution of professional certifications held by IT auditors as reported by the participating organizations. The results are very positive showing that the majority have achieved some type of certification including 83% achieving the Certified Information Systems Auditor credential.
In answering the question “What areas did you include in your audit plan?” respondents in both 2014 and 2015 primarily chose compliance-related topics rather than strategic risk topics. These included HIPAA security, Meaningful Use compliance, IT general controls, Payment Card Industry (PCI) compliance, disaster recovery, network security, electronic medical records,
and vendor management (see Exhibit 15). However, in 2015, there were some shifts in the results in which a decrease occurred in the percent of respondents for some of the compliance related topics. In contrast, an increase occurred in the following topics which are both compliance and strategic related: financial systems, patch management, security incident management, identity and access management, application controls review, and log management. The results indicate a general need for collaboration in the IT risk assessment process involving key contributors (clinical, operational, technical, legal) to help internal audit better understand and evaluate technology risks beyond what is required to comply with laws and regulatory baselines.
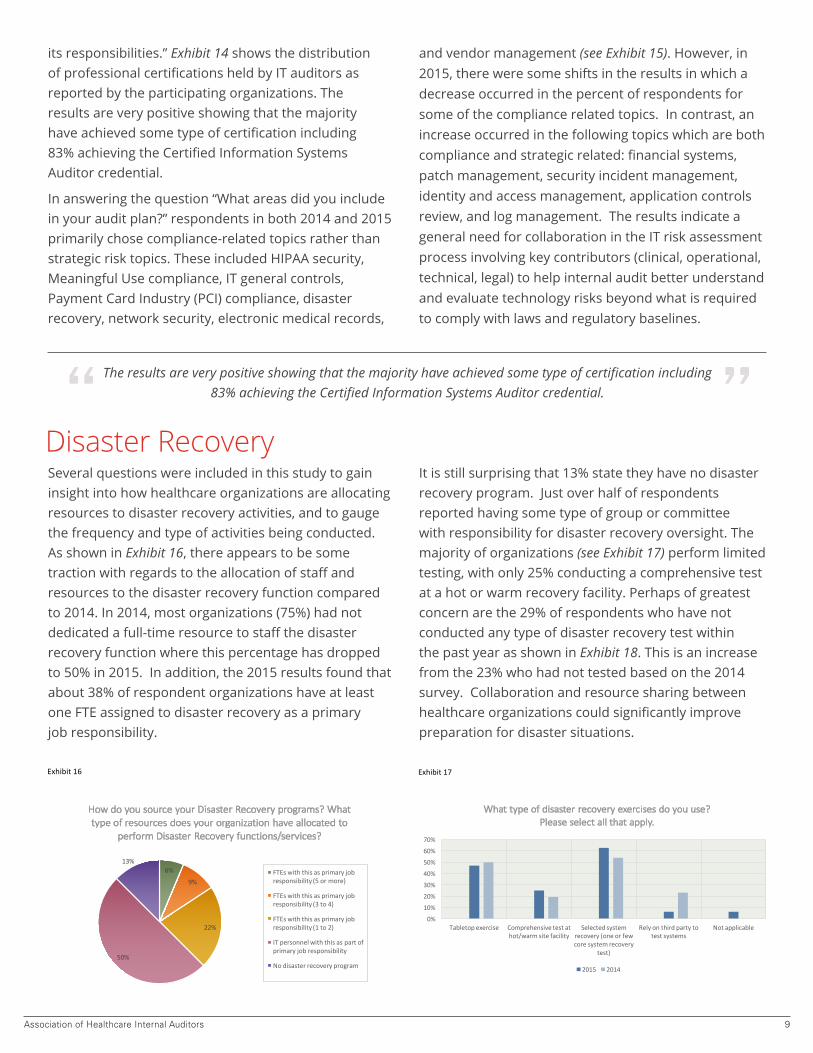
Several questions were included in this study to gain insight into how healthcare organizations are allocating resources to disaster recovery activities, and to gauge the frequency and type of activities being conducted. As shown in Exhibit 16, there appears to be some traction with regards to the allocation of staff and resources to the disaster recovery function compared to 2014. In 2014, most organizations (75%) had not dedicated a full-time resource to staff the disaster recovery function where this percentage has dropped to 50% in 2015. In addition, the 2015 results found that about 38% of respondent organizations have at least one FTE assigned to disaster recovery as a primary job responsibility.
It is still surprising that 13% state they have no disaster recovery program. Just over half of respondents reported having some type of group or committee with responsibility for disaster recovery oversight. The majority of organizations (see Exhibit 17) perform limited testing, with only 25% conducting a comprehensive test at a hot or warm recovery facility. Perhaps of greatest concern are the 29% of respondents who have not conducted any type of disaster recovery test within the past year as shown in Exhibit 18. This is an increase from the 23% who had not tested based on the 2014 survey. Collaboration and resource sharing between healthcare organizations could significantly improve preparation for disaster situations.
Disaster Recovery
Exhibit16
Exhibit17
6%
9%
22%
50%
13%
HowdoyousourceyourDisasterRecoveryprograms?Whattypeofresourcesdoesyourorganizationhaveallocatedto
performDisasterRecoveryfunctions/services?
FTEswiththisasprimaryjobresponsibility(5ormore)
FTEswiththisasprimaryjobresponsibility(3to4)
FTEswiththisasprimaryjobresponsibility(1to2)
ITpersonnelwiththisaspartofprimaryjobresponsibility
Nodisasterrecoveryprogram
0%
10%
20%
30%
40%
50%
60%
70%
Tabletopexercise Comprehensivetestathot/warmsitefacility
Selectedsystemrecovery(oneorfewcoresystemrecovery
test)
Relyonthirdpartytotestsystems
Notapplicable
Whattypeofdisasterrecoveryexercisesdoyouuse?Pleaseselectallthatapply.
2015 2014
The results are very positive showing that the majority have achieved some type of certification including 83% achieving the Certified Information Systems Auditor credential.“ ”
2015 IT Audit and Information Security Survey10
The healthcare industry relies on third-party vendors to design, develop, implement, support, and host critically important information systems. Vendor evaluation practices (see Exhibit 19) heavily rely on desk reviews of requested information. However, considerable improvement is evident in the percentage of respondents (53%) who require and review third-party assurance reports compared to only 32% in 2014. Although Exhibit 20 shows that almost half the
healthcare organizations have not established a formal program for assessing IT vendors, progress has been made in this area compared to 2014. Improvements have been made in the percentage of respondents that perform regular assessments of IT vendors both for all vendors and just critical vendors. In addition, almost all respondents expressed an interest in collaborating with other healthcare organizations to perform assessments.
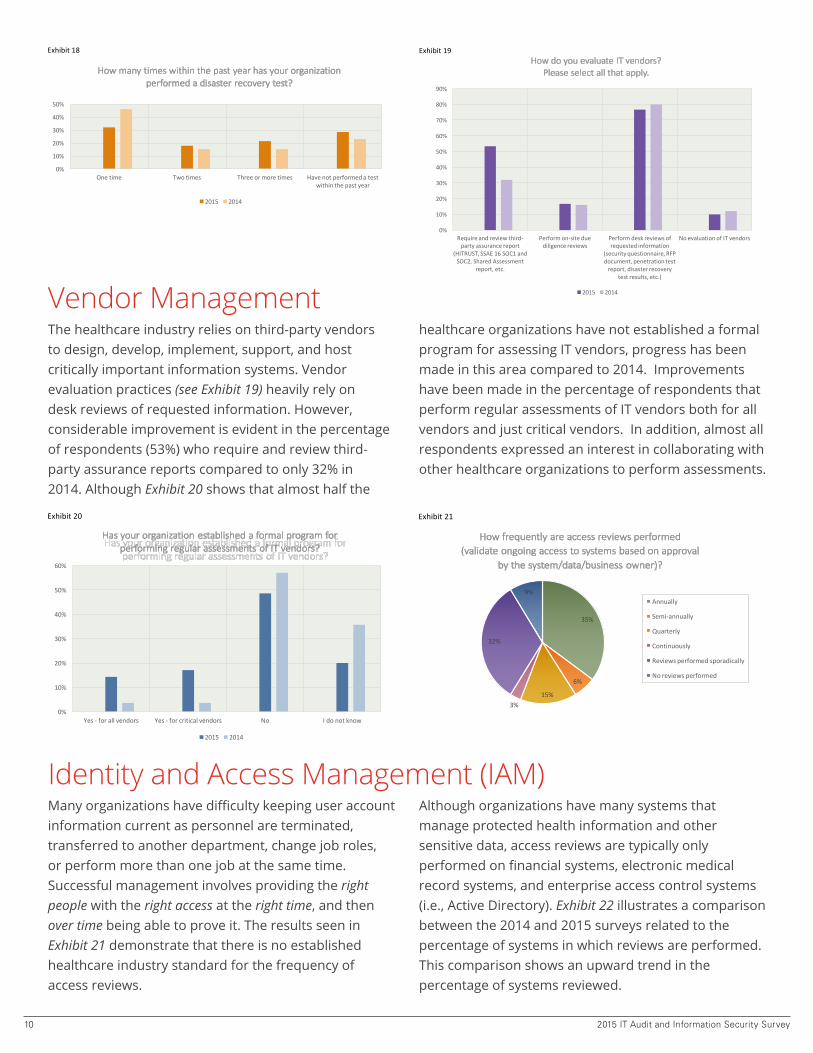
Many organizations have difficulty keeping user account information current as personnel are terminated, transferred to another department, change job roles, or perform more than one job at the same time. Successful management involves providing the right people with the right access at the right time, and then over time being able to prove it. The results seen in Exhibit 21 demonstrate that there is no established healthcare industry standard for the frequency of access reviews.
Although organizations have many systems that manage protected health information and other sensitive data, access reviews are typically only performed on financial systems, electronic medical record systems, and enterprise access control systems (i.e., Active Directory). Exhibit 22 illustrates a comparison between the 2014 and 2015 surveys related to the percentage of systems in which reviews are performed. This comparison shows an upward trend in the percentage of systems reviewed.
Vendor Management
Identity and Access Management (IAM)
Exhibit18
Exhibit19
0%
10%
20%
30%
40%
50%
Onetime Twotimes Threeormoretimes Havenotperformedatestwithinthepastyear
Howmanytimeswithinthepastyearhasyourorganizationperformedadisasterrecoverytest?
2015 2014
0%
10%
20%
30%
40%
50%
60%
70%
80%
90%
Requireandreviewthird-partyassurancereport
(HITRUST,SSAE16SOC1andSOC2,SharedAssessment
report,etc.
Performon-siteduediligencereviews
Performdeskreviewsofrequestedinformation
(securityquestionnaire,RFPdocument,penetrationtestreport,disasterrecovery
testresults,etc.)
NoevaluationofITvendors
HowdoyouevaluateITvendors?Pleaseselectallthatapply.
2015 2014
Exhibit20
Exhibit21
0%
10%
20%
30%
40%
50%
60%
Yes- forallvendors Yes- forcriticalvendors No Idonotknow
HasyourorganizationestablishedaformalprogramforperformingregularassessmentsofITvendors?
2015 2014
35%
6%
15%3%
32%
9%
Howfrequentlyareaccessreviewsperformed(validateongoingaccesstosystemsbasedonapproval
bythesystem/data/businessowner)?
Annually
Semi-annually
Quarterly
Continuously
Reviewsperformedsporadically
Noreviewsperformed
Exhibit18
Exhibit19
0%
10%
20%
30%
40%
50%
Onetime Twotimes Threeormoretimes Havenotperformedatestwithinthepastyear
Howmanytimeswithinthepastyearhasyourorganizationperformedadisasterrecoverytest?
2015 2014
0%
10%
20%
30%
40%
50%
60%
70%
80%
90%
Requireandreviewthird-partyassurancereport
(HITRUST,SSAE16SOC1andSOC2,SharedAssessment
report,etc.
Performon-siteduediligencereviews
Performdeskreviewsofrequestedinformation
(securityquestionnaire,RFPdocument,penetrationtestreport,disasterrecovery
testresults,etc.)
NoevaluationofITvendors
HowdoyouevaluateITvendors?Pleaseselectallthatapply.
2015 2014
Exhibit20
Exhibit21
0%
10%
20%
30%
40%
50%
60%
Yes- forallvendors Yes- forcriticalvendors No Idonotknow
HasyourorganizationestablishedaformalprogramforperformingregularassessmentsofITvendors?
2015 2014
35%
6%
15%3%
32%
9%
Howfrequentlyareaccessreviewsperformed(validateongoingaccesstosystemsbasedonapproval
bythesystem/data/businessowner)?
Annually
Semi-annually
Quarterly
Continuously
Reviewsperformedsporadically
Noreviewsperformed
Association of Healthcare Internal Auditors 11
Exhibit22
Exhibit23
0%
5%
10%
15%
20%
25%
30%
35%
40%
45%
50%
Allsystems(100%)
75%to99% 50%to74% 25%to49% 1%to25% None Idon’tknow
Ifaccessreviewsareperformed,forwhatpercentageofyoursystemsarereviewsperformed?
2015 2014
0%
10%
20%
30%
40%
50%
60%
70%
80%
Annually Semi-annually Quarterly Continuously Havenotperformed
FrequencyofITSecurityRiskAssessments
2015 2014
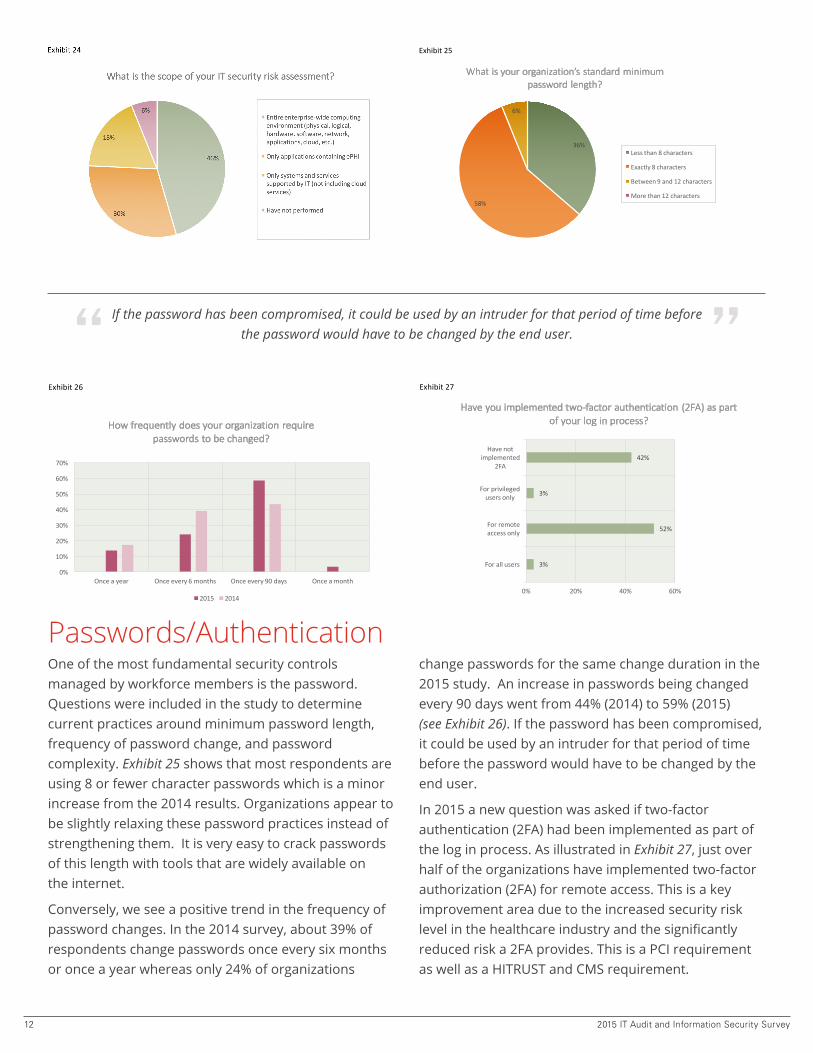
The security risk assessment process has become an area of focus for most healthcare organizations over the past several years, because it is the fundamental activity on which the HIPAA security compliance effort is based. It was also established as a requirement of the Meaningful Use program. In Exhibit 23, the results show a decrease in the percentage of organizations that have not performed this critical activity. In 2014, 28% of the participants reported not performing a security risk assessment while the percentage is down to a mere 6% in 2015. This may demonstrate organizations either see
the value of or acknowledge the need for performing this activity. This means 94% of the hospitals and health systems are performing the risk assessment at least annually. When asked about the approach taken to perform the risk assessment, organizations indicate a level of inconsistency or confusion about risk assessment scope and regulatory expectations (see Exhibit 24). Some organizations assess the entire enterprise, others only assess applications containing ePHI, while some only look at systems supported by IT.
IT Security Risk Assessment
2015 IT Audit and Information Security Survey12
Exhibit26
Exhibit27
0%
10%
20%
30%
40%
50%
60%
70%
Onceayear Onceevery6months Onceevery90days Onceamonth
Howfrequentlydoesyourorganizationrequirepasswordstobechanged?
2015 2014
3%
52%
3%
42%
Forallusers
Forremoteaccessonly
Forprivilegedusersonly
Havenotimplemented
2FA
0% 20% 40% 60%
Haveyouimplementedtwo-factorauthentication(2FA)aspartofyourloginprocess?
Exhibit24
Exhibit25
46%
30%
18%
6%
WhatisthescopeofyourITsecurityriskassessment?
Entireenterprise-widecomputingenvironment(physical,logical,hardware,software,network,applications,cloud,etc.)
OnlyapplicationscontainingePHI
OnlysystemsandservicessupportedbyIT(notincludingcloudservices)
Havenotperformed
36%
58%
6%
Whatisyourorganization’sstandardminimumpasswordlength?
Lessthan8characters
Exactly8characters
Between9and12characters
Morethan12characters
Deleted:
Exhibit26
Exhibit27
0%
10%
20%
30%
40%
50%
60%
70%
Onceayear Onceevery6months Onceevery90days Onceamonth
Howfrequentlydoesyourorganizationrequirepasswordstobechanged?
2015 2014
3%
52%
3%
42%
Forallusers
Forremoteaccessonly
Forprivilegedusersonly
Havenotimplemented
2FA
0% 20% 40% 60%
Haveyouimplementedtwo-factorauthentication(2FA)aspartofyourloginprocess?
One of the most fundamental security controls managed by workforce members is the password. Questions were included in the study to determine current practices around minimum password length, frequency of password change, and password complexity. Exhibit 25 shows that most respondents are using 8 or fewer character passwords which is a minor increase from the 2014 results. Organizations appear to be slightly relaxing these password practices instead of strengthening them. It is very easy to crack passwords of this length with tools that are widely available on the internet.
Conversely, we see a positive trend in the frequency of password changes. In the 2014 survey, about 39% of respondents change passwords once every six months or once a year whereas only 24% of organizations
change passwords for the same change duration in the 2015 study. An increase in passwords being changed every 90 days went from 44% (2014) to 59% (2015) (see Exhibit 26). If the password has been compromised, it could be used by an intruder for that period of time before the password would have to be changed by the end user.
In 2015 a new question was asked if two-factor authentication (2FA) had been implemented as part of the log in process. As illustrated in Exhibit 27, just over half of the organizations have implemented two-factor authorization (2FA) for remote access. This is a key improvement area due to the increased security risk level in the healthcare industry and the significantly reduced risk a 2FA provides. This is a PCI requirement as well as a HITRUST and CMS requirement.
Passwords/Authentication
If the password has been compromised, it could be used by an intruder for that period of time before the password would have to be changed by the end user.“ ”
Association of Healthcare Internal Auditors 13
Exhibit28
Exhibit29
3% 6%
47%
14%
14%
11%
6%
Inyourorganization,whoisresponsibleformakingdecisionsaboutcybersecurityrisk?
ChiefExecutiveOfficer(CEO)
ChiefOperationsOfficer(COO)
ChiefInformationOfficer(CIO)
ChiefInformationSecurityOfficer(CISO)
ExecutiveCabinet(leadershipgroupincludingkeyexecutiveleaders)
Board
Idon’tknow
Other(pleasespecify)
44%
6%
25%
3%
22%
HowhasyourBoardbeeninvolvedincybersecuritygovernanceoverthepastyear?
Receivedupdatesonthestatusofthecybersecurityprogram
Madedecisionsaboutcybersecuritystrategyand/orrisk
Soughttoincreasetheirownunderstandingofcybersecurityrisk
Noinvolvement
Notsureofinvolvement
2015 IT Audit and Information Security Survey14
Exhibit30
Exhibit31
11%
11%
25%
8%3%
33%
8%
HowoftenistheBoardorExecutiveLeadershipinformedabouttheorganization’scybersecurity status?
Annually
Semi-annually
Quarterly
Continuously
Never
Idon’tknow
Other(pleasespecify)
17%
20%
46%
17%
Havecybersecuritymetricsand/ordashboardsbeenestablishedtoassisttheboardand/or
executive managementwiththeiroversightresponsibility?
Yes
Indevelopment
No
Idon'tknow
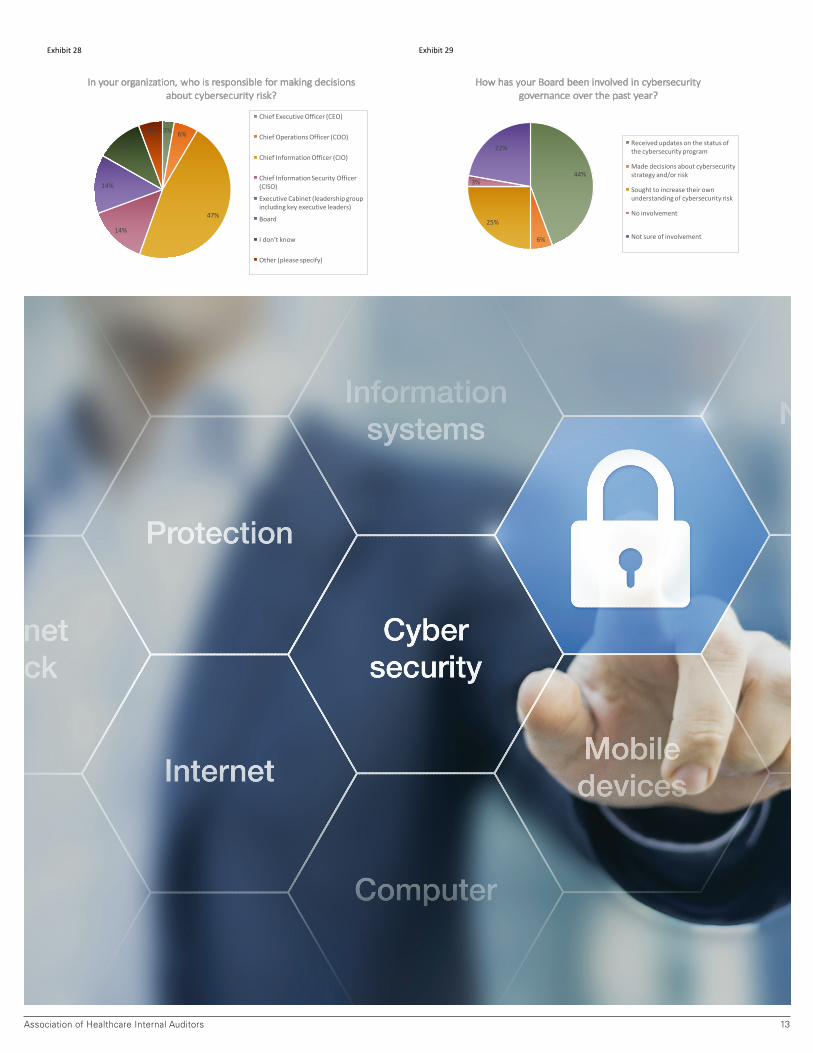
As defined by techopedia, “cybersecurity refers to preventative methods used to protect information from being stolen, compromised or attacked. It requires an understanding of potential information threats, such as viruses and other malicious code. Cybersecurity strategies include identity management, risk management and incident management.” The survey introduced several questions related to cybersecurity to determine how organizations are handling this topic and who is responsible for this risk.
Exhibit 28 shows that CIO’s in about 50% of the organizations are responsible for making decisions about cybersecurity. It appears as though the message about the ‘reality’ of cybersecurity risk has reached Executive Management and the Board level in many of the organizations. This is based on how often the Board and Executive Management is informed about the organization’s cybersecurity status. However, the data is somewhat inconclusive as 22% of the respondents
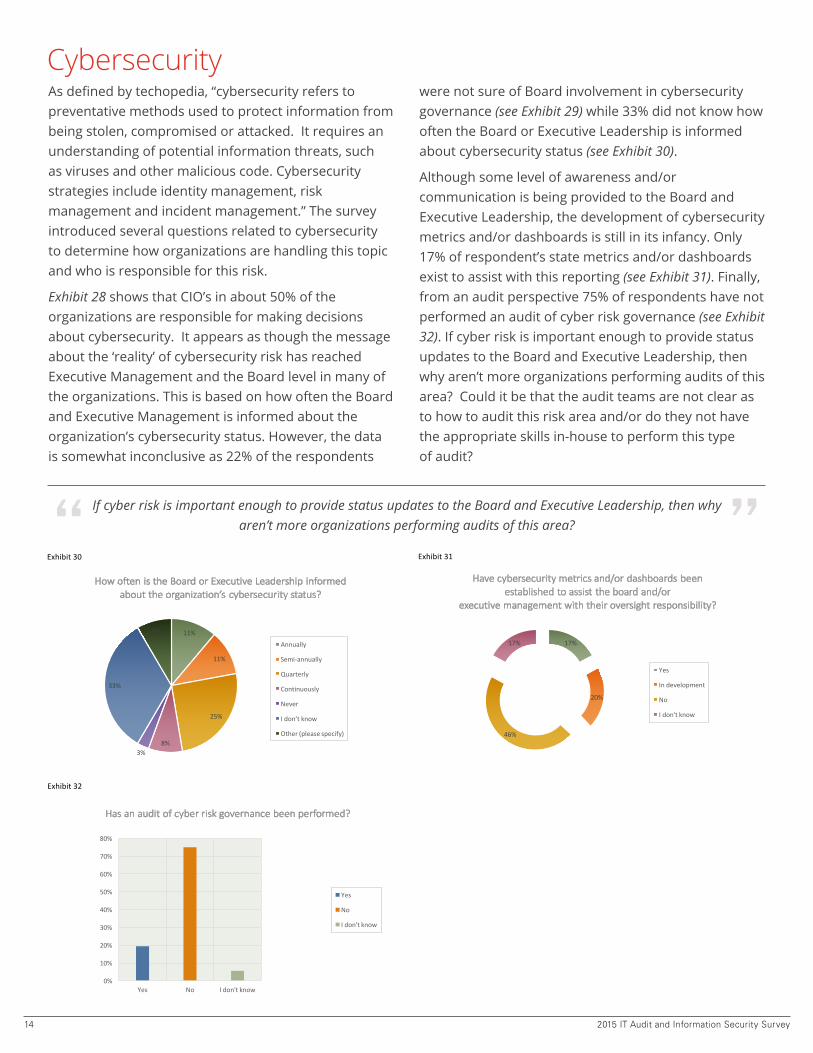
were not sure of Board involvement in cybersecurity governance (see Exhibit 29) while 33% did not know how often the Board or Executive Leadership is informed about cybersecurity status (see Exhibit 30).
Although some level of awareness and/or communication is being provided to the Board and Executive Leadership, the development of cybersecurity metrics and/or dashboards is still in its infancy. Only 17% of respondent’s state metrics and/or dashboards exist to assist with this reporting (see Exhibit 31). Finally, from an audit perspective 75% of respondents have not performed an audit of cyber risk governance (see Exhibit 32). If cyber risk is important enough to provide status updates to the Board and Executive Leadership, then why aren’t more organizations performing audits of this area? Could it be that the audit teams are not clear as to how to audit this risk area and/or do they not have the appropriate skills in-house to perform this type of audit?
Cybersecurity
If cyber risk is important enough to provide status updates to the Board and Executive Leadership, then why aren’t more organizations performing audits of this area? “ ”
Exhibit32
0%
10%
20%
30%
40%
50%
60%
70%
80%
Yes No Idon'tknow
Hasanauditofcyberriskgovernancebeenperformed?
Yes
No
Idon'tknow
Association of Healthcare Internal Auditors 15
AHIATodd Havens
AHIA White Paper Committee Chair(615) 875-7728
Johan Lidros CISA,CISM,CGEIT,CRISC,HITRUST CCSCFP, ITIL-FAHIA IT Subject Matter Leader
Eminere Group LLC [email protected]
Jennifer McGill, CIA, CISA, CGEIT AHIA IT Audit Subject Matter Leader
Carolinas HealthCare [email protected]
AUTHORS
ConclusionsThe results of the 2015 Healthcare IT Audit and Information Security Study compared to the 2014 results confirm the general perception that information security resources are limited in the healthcare industry and that not all healthcare organizations have implemented fundamental security controls. Although IT audit resources are limited, organizations are starting to recognize the need to have dedicated, certified IT auditors on staff as the data shows this upward trend with an average IT audit staff ratio of 18%. Technology risks need to be considered in the audit risk assessment process and addressed in the audit plan.
We are seeing that organizations are aware of and concerned about the threat of cybersecurity as this type of risk has elevated to Executive Management and the Board where status updates are provided. Despite the level of awareness associated with cybersecurity, the auditing of this type of risk has not been broadly performed. When organizations avoid investments in information security and IT audit expertise, they increase the likelihood that uncontrolled risks in their
computing environment will be exploited and their business disrupted.
To determine resource needs, healthcare organizations need to continue to broaden their risk assessment focus beyond baseline compliance risks to include risks associated with IT strategy, third-party services, disaster recovery, mobile devices, information governance, and cybersecurity. Most hospitals and healthcare systems have not yet developed IT governance structures to guide decision-making about risk mitigation and risk acceptance.
There is a trend that security resource needs will continue to increase as more breaches are publicized in the media and the increased focus on Health IT and its impact on patient safety and quality. Executive leadership and Boards are asking about the organization’s IT risk preparedness efforts and being provided status reports. Management needs to have appropriate tools and resources to be able to provide metrics and demonstrate that the organization’s risk is properly managed.
We would like to express our appreciation to the organizations that participated in this study.
CONTACTS

ABOUT AHIA
The Association of Healthcare Internal Auditors (AHIA) is a network of experienced healthcare internal auditing professionals who come together to share tools, knowledge and insight on how to assess and evaluate risk within a complex and dynamic healthcare environment. AHIA is an advocate for the profession, continuing to elevate and champion the strategic importance of healthcare internal auditors with executive management and the Board. If you have a stake in healthcare governance, risk management and internal controls, AHIA is your one-stop resource. Explore our website for more information. If you are not a member, please join our network.