Embed Size (px)
Citation preview
City of Albany 2015 Hazard Analysis Page 1 of 1
2015 HAZARD ANALYSIS
CITY OF ALBANY
INTRODUCTION
Hazard effects are variable and severity will differ depending on such factors as location, time of
occurrence, population, location, intensity, duration, response capabilities and mitigation efforts taken
before the occurrences.
The Federal Emergency Management Administration (FEMA) classifies the causes of hazards as:
Natural
Technological (human caused)
National security events (warfare or civil disturbance)
Natural hazards can include earthquakes, floods, severe weather, and fires. Technological hazards
include hazardous materials releases and large scale transportation accidents. National security hazards
include armed attack on the country by armed military forces, terrorist attacks, sabotage and civil
insurrection. Since the terrorist attacks of September 11, 2001, the federal government has placed a high
priority on the use of weapons of mass destruction (WMD) by terrorists as a real threat to the nation. This
analysis will now include the threat of WMD events as a potential hazard.
The purpose of this hazard analysis is to identify and classify hazards that are potentially harmful to the
City of Albany and its residents. The method used in this analysis provides a sense of hazard priorities,
also known as relative risk. It does not predict the occurrence of a particular hazard, but it does "quantify"
the risk of one hazard compared with another. By doing this analysis, planning can then be focused where
the risk is the greatest. This information will allow us to establish priorities, and to address preparation,
response and mitigation measures to overcome the effects of the hazards on the community.
The method for determining a random order for hazards affecting the City of Albany is prescribed by
Oregon Emergency Management (OEM). This hazard analysis methodology was first developed by the
Federal Emergency Management Agency (FEMA) circa 1983, and gradually refined by Oregon
Emergency Management (OEM) over the years. During 1984 the predecessor agency to OEM
(Emergency Management Division) conducted workshops around the State of Oregon that resulted in all
of Oregon’s 36 counties producing an analysis using this methodology. Since then several cities have
also conducted an analysis using this method. These analyses are updated by the local governments on a
cycle of about five years.
The City of Albany Hazard Analysis Matrix used by individuals to score the 25 individual hazards
affecting the City of Albany are found as figure #1, pages 44 and 45, at the end of this document.
The City of Albany has adopted a Hazard Mitigation Plan and the Regional Hazard Mitigation Master
Plan. One element of these plans is a method for analyzing the effects a hazard may have on a particular
location or structure. These methods detail the cost versus benefit in determining the need for mitigating
the hazard. A copy of this description can be located in the RHMMP and the City of Albany Hazard
Mitigation documents and provides a good starting point for more effective hazard mitigation.
City of Albany 2015 Hazard Analysis Page 2 of 2
COMMUNITY PROFILE
ALBANY'S HISTORY
The first settlers to the Albany area were farmers who came in the 1840's. Agriculture, production, and
processing were the Albany area’s first industry. For more than four decades, 1845 to 1885, wheat was
the principle crop in Linn County.
In 1850, Albany's first post office was established. By 1851, Albany was designated as the county seat
and the first courthouse was built in 1853.
The first steamboat arrived in Albany in 1852. Steamboats brought the farmers and townspeople their
necessities. Boats running upstream carried mail, sheep, cattle, kerosene and everyday items for the
farms, homes and mills. The California Stage Company began operation in Oregon in 1860, with stages
leaving daily from Portland to Sacramento.
In 1871, the first locomotive arrived in Albany. The world's longest wooden railroad drawbridge was built
in 1888 for the Albany-Corvallis run. The Santiam Canal which brought water, water power and
transportation to the city was completed in 1874. In 1875, fifteen manufacturing plants such as sawmills,
flour mills and a twine mill were powered by water power. In 1887, electricity was first generated by
water power from the canal.
Albany became the manufacturing and transportation hub of the Willamette Valley. Foundries,
blacksmith shops, furniture factories, tanneries, a bag factory, carriage factories, flour and flax mills, a
twine factory, creameries and sawmills supplied local farmers and processed their crops.
Today Albany remains the seat of Linn County and continues to be called the “Hub of the Willamette
Valley” due to its location at the junction of US Highways 99 and 20 and Interstate 5. Albany is 24 miles
south of Salem, the state capital, and 69 miles south of Portland.
The City of Albany operates under the provision of its own charted and applicable state law. It has a City
Manager/Council form of government. The City Council consists of seven members who are elected by
the citizens of Albany. The city of Albany provides a full range of municipal services including fire and
police protection, street construction, maintenance and lighting, planning, zoning, and general
administrative services. It also operates water, storm and waste water systems.
As of the end of the year 2014 the population of Albany was about 50,239.
LINN COUNTY HISTORY
The first known inhabitants of the Willamette valley were tribes and bands generally classified as the
Kalapuya (or the Calapooia). Molalla bands also ranges along the western slopes of the Cascade mountain
range. The first non-Native American visitors to the Willamette Valley were fur trappers and traders
from the Hudson’s Bay Company in 1828. Large scale emigration over the Oregon Trail began in 1843.
In 1847, the Provisional Legislature created Linn County from the southern portion of Champoeg (later
Marion) County. The boundaries were altered in 1851 and 1854 with the creation of Lane and Wasco
Counties. The county consists of 2,297 square miles and is bounded on the north by Marion County, on
City of Albany 2015 Hazard Analysis Page 3 of 3
the east by Deschutes and Jefferson Counties, on the south by Lane County, and on the west by Benton
County. Linn County was named for U.S. Senator Lewis F. Linn of Missouri who was the author of the
Donation Land Act that gave free land to settlers in the West.
The county seat was originally located in Calapooia (Brownsville), but in 1851 the Territorial Legislature
passed an act establishing Albany as the county seat. A special election in 1856 reaffirmed Albany as the
county seat. The Spaulding School in Brownsville served as the first courthouse. A new courthouse was
erected in Albany in 1853 but was destroyed by fire in 1861. A third courthouse was built in 1865, and
remodeled in 1890 and 1899. The present courthouse was constructed in 1940 adjacent to the earlier
courthouses.
The estimated population of Linn county in 2014 was 118,765 compared to the estimated population in
2007 of 113,264 a 4.85 % increase.
Principle industries are agriculture and food products, wood products, rare metals, and manufacturing.
Linn County's economy relies heavily on the lumber and wood products industry; and in 1990, this
industry accounted for 40 percent of the county's manufacturing jobs.
BENTON COUNTY HISTORY
Benton County was established by the Provisional Legislature in 1847. It was named in honor of Senator
Thomas Hart Benton of Missouri. Carved from Polk County, Benton County stretched from the Polk
County boundary south to the California border and from the Pacific Ocean east to the Willamette River.
Umpqua, Lane, Douglas, Jackson, Lincoln, Josephine, Curry, and Coos Counties were created from
portions of the original Benton County. Today Benton County occupies 679 square miles of the central
Willamette Valley and is bordered on the east by the Willamette River and Linn County, on the west by
the summit of the Coast Range and Lincoln County, on the north by Polk County, and on the south by
Lane County.
The city of Marysville, later renamed Corvallis, became the county seat in 1851. The first county
courthouse was erected in 1854. The second courthouse, built in 1889, is the oldest in Oregon that is still
used for its original purpose. It was extensively renovated in 1976 to restore and preserve the historic
character of the building. Nearby buildings provide offices not located in the courthouse.
Benton County was created out of land originally inhabited by the Klickitat Indians. All Indian claims to
land within Benton County were ceded in the Treaty of Dayton in 1855. In 1862, Corvallis became the
site of the Oregon State Agricultural College, known today as Oregon State University. Along with the
university, agriculture, lumber, and wood products from the economic base of the county.
The estimated population of Benton County in 2014 was 86,591 compared to 2007 when the population
was estimated at 81,428. This was a 6.34% increase.
City of Albany 2015 Hazard Analysis Page 4 of 4
METHOD USED TO RANK THE HAZARDS
The City of Albany used the State of Oregon’s recommended method of scoring hazards. We first
determined what hazards had occurred or were most likely to occur in and around Albany. This created a
list of 25 hazards. We then developed a matrix that listed all of these hazards in one column and for each
hazard had three categories that each of the hazards were to be scored for. These included Vulnerability,
Maximum Threat (Severity) and Probability. A fourth category, History, was scored by the developer of
the Hazard Analysis plan, after all the historical data was collected for each hazard.
Copies of the Hazard Analysis Matrix’s were sent to 139 individuals, 34 were returned. This year we
used Survey Monkey as our method of distributing the Hazard Analysis rather than mailing out hard
copies. Of the 34 individuals who participated in the survey 16 were city employees and 18 were non city
employees. These people were selected for their professional emergency response work, business
background in the city, volunteerism in the community, participation in City of Albany boards and
commissions, and responsibility as department directors, managers, or first line supervisors for the City of
Albany. Surveys were also sent to the Emergency Managers of Linn and Benton Counties.
At the end of the survey period scoring results were entered in an Excel spreadsheet that scored each
hazard with the weight assigned to each of the four categories. This provided each of the hazards with an
overall score, which ranked the hazard from 1, being the most hazardous, to 25, being the least hazardous.
The results are listed below.
City of Albany 2015 Hazard Analysis Page 5 of 5
HAZARDS ANALYSIS CRITERIA
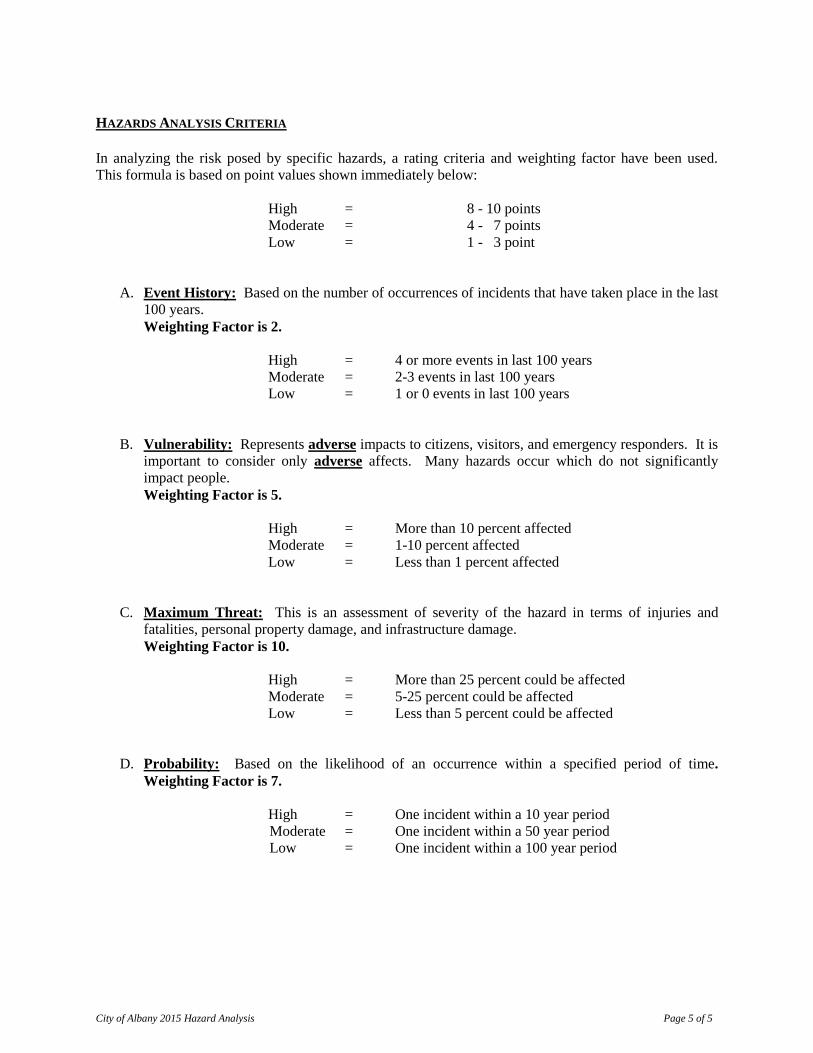
In analyzing the risk posed by specific hazards, a rating criteria and weighting factor have been used.
This formula is based on point values shown immediately below:
High = 8 - 10 points
Moderate = 4 - 7 points
Low = 1 - 3 point
A. Event History: Based on the number of occurrences of incidents that have taken place in the last
100 years.
Weighting Factor is 2.
High = 4 or more events in last 100 years
Moderate = 2-3 events in last 100 years
Low = 1 or 0 events in last 100 years
B. Vulnerability: Represents adverse impacts to citizens, visitors, and emergency responders. It is
important to consider only adverse affects. Many hazards occur which do not significantly
impact people.
Weighting Factor is 5.
High = More than 10 percent affected
Moderate = 1-10 percent affected
Low = Less than 1 percent affected
C. Maximum Threat: This is an assessment of severity of the hazard in terms of injuries and
fatalities, personal property damage, and infrastructure damage.
Weighting Factor is 10.
High = More than 25 percent could be affected
Moderate = 5-25 percent could be affected
Low = Less than 5 percent could be affected
D. Probability: Based on the likelihood of an occurrence within a specified period of time.
Weighting Factor is 7.
High = One incident within a 10 year period
Moderate = One incident within a 50 year period
Low = One incident within a 100 year period
City of Albany 2015 Hazard Analysis Page 6 of 6
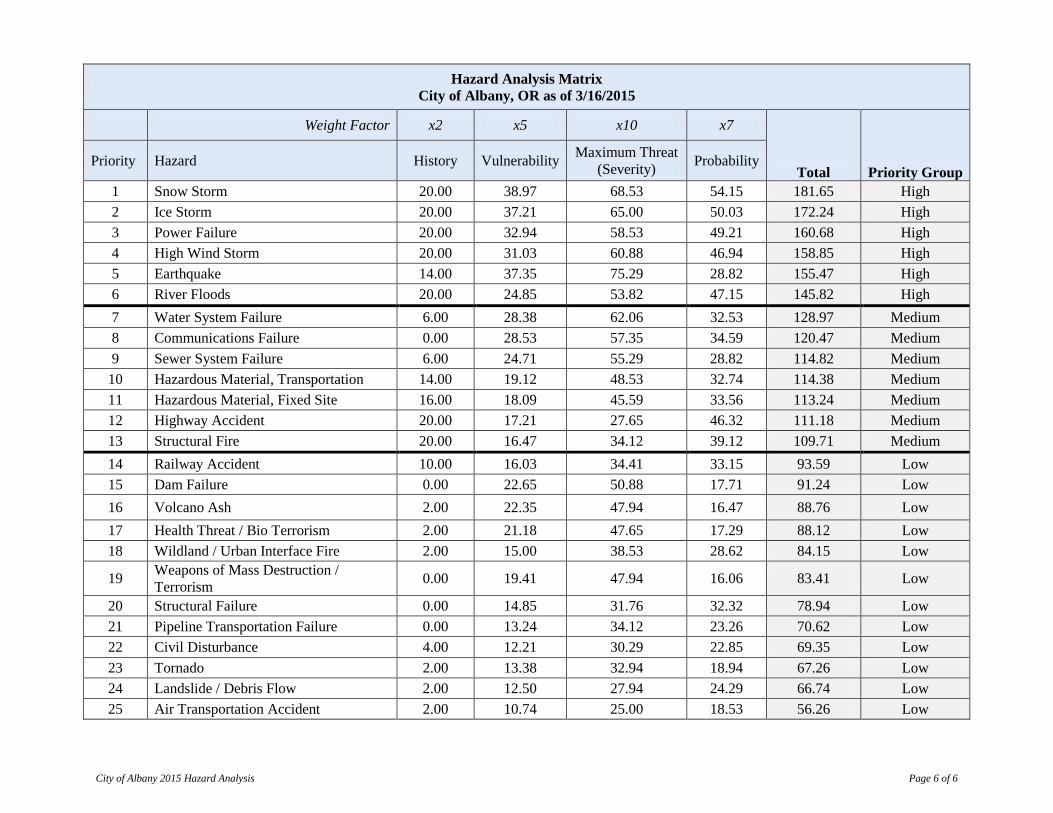
Hazard Analysis Matrix
City of Albany, OR as of 3/16/2015
Weight Factor x2 x5 x10 x7
Total Priority Group Priority Hazard History Vulnerability
Maximum Threat
(Severity) Probability
1 Snow Storm 20.00 38.97 68.53 54.15 181.65 High
2 Ice Storm 20.00 37.21 65.00 50.03 172.24 High
3 Power Failure 20.00 32.94 58.53 49.21 160.68 High
4 High Wind Storm 20.00 31.03 60.88 46.94 158.85 High
5 Earthquake 14.00 37.35 75.29 28.82 155.47 High
6 River Floods 20.00 24.85 53.82 47.15 145.82 High
7 Water System Failure 6.00 28.38 62.06 32.53 128.97 Medium
8 Communications Failure 0.00 28.53 57.35 34.59 120.47 Medium
9 Sewer System Failure 6.00 24.71 55.29 28.82 114.82 Medium
10 Hazardous Material, Transportation 14.00 19.12 48.53 32.74 114.38 Medium
11 Hazardous Material, Fixed Site 16.00 18.09 45.59 33.56 113.24 Medium
12 Highway Accident 20.00 17.21 27.65 46.32 111.18 Medium
13 Structural Fire 20.00 16.47 34.12 39.12 109.71 Medium
14 Railway Accident 10.00 16.03 34.41 33.15 93.59 Low
15 Dam Failure 0.00 22.65 50.88 17.71 91.24 Low
16 Volcano Ash 2.00 22.35 47.94 16.47 88.76 Low
17 Health Threat / Bio Terrorism 2.00 21.18 47.65 17.29 88.12 Low
18 Wildland / Urban Interface Fire 2.00 15.00 38.53 28.62 84.15 Low
19 Weapons of Mass Destruction /
Terrorism 0.00 19.41 47.94 16.06 83.41 Low
20 Structural Failure 0.00 14.85 31.76 32.32 78.94 Low
21 Pipeline Transportation Failure 0.00 13.24 34.12 23.26 70.62 Low
22 Civil Disturbance 4.00 12.21 30.29 22.85 69.35 Low
23 Tornado 2.00 13.38 32.94 18.94 67.26 Low
24 Landslide / Debris Flow 2.00 12.50 27.94 24.29 66.74 Low
25 Air Transportation Accident 2.00 10.74 25.00 18.53 56.26 Low
City of Albany 2015 Hazard Analysis Page 7 of 7
HAZARD ANALYSIS RESULTS
Snow Storm
Definition Severe winter weather conditions that affect day-to-day activities and include heavy snow or
sometimes blowing snow.
Description
Snow storms generally can occur between November and February in Oregon. Heavy snows can
immobilize transportation systems, downed trees and power lines, and collapse buildings. Heavy
snows of more than six inches in a 12-hour period can cause hazardous conditions in the
community and slow or stop the flow of commerce. Heavy Snows can disrupt emergency,
medical and law enforcement services. Loose snow begins to drift when the wind speed reaches
9 to 10 mph under freezing conditions.
Historical
Occurrence
Snow events are not common in Albany and the Willamette Valley. They need two ingredients:
cold air and moisture. Rarely do the two ingredients occur at the same time over western Oregon,
except in the higher elevations of the Coast Range and especially in the Cascades. But
snowstorms do occur over eastern Oregon regularly during December through February. Cold
arctic air sinks south along the Columbia River Basin, filling the valleys with cold air. Storms
moving across the area drop precipitation, and if conditions are right, snow will occur. Since
1884 to the present, there have been at least 14 significant snow events in Albany. The last was
in 2003.
On December 6, 2013 snow began to fall with accumulation of 4 – 6 inches depending on
location in the city. Total accumulation was between 6 and 7 inches. Temperatures dropped to
between 0 and 6 degrees on the evening of December 6 and again on December 7th. They
remained in the low to mid 20s throughout the weekend.
On February 6 - 7, 2014 a snow began that continued for two days. There first day of snow
totaled 9” with the second day adding another 6 “for a total of 15 inches. This was followed by a
freezing rain event that began on Saturday, February 8th. Presidential Declaration (4169)
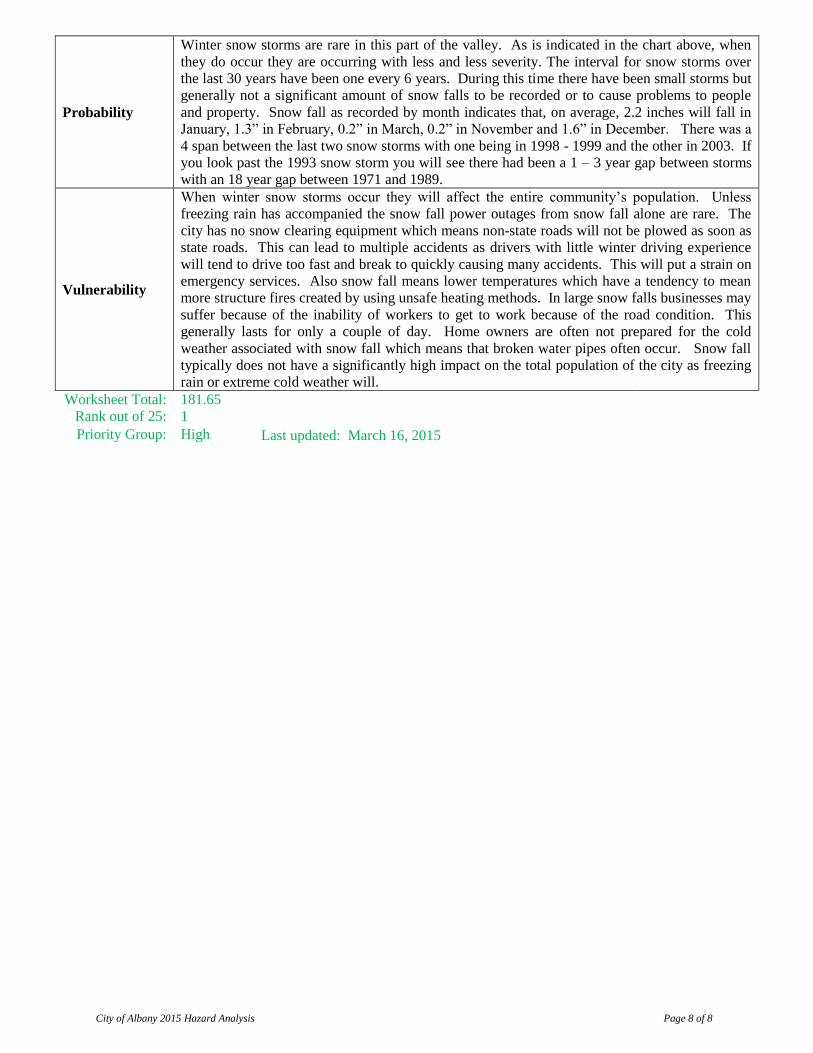
The following are the dates, one day amounts and total storm accumulations for those storms:
Dates 1 Day Amount Storm Total
December 16 – 18, 1884 16” 19”
December 20- - 23, 1892 9” 15”
January 5 – 10, 1909 3.5” 11.5”
January 11 – 15, 1916 5 – 8”
December 9 – 11, 1919 10” 25.5”
January 31 – February 4, 1937 16” 18”
January 9 – 18, 1950 54.7”
January 25 – 31, 1969 24 to 30”
December 29 - 1971 1.3”
February 1 – 8, 1989 6”
February 14 – 16, 1990 2 – 4”
February - 1993 6”
Winter 1998 - 1999 2 – 5”
December - 2003 3.8”
March 20 – 21, 2012 4.25” 6”
December 6 – 7, 2013 4-6 “ 6-7”
February 6-7, 2014 9” 15”
City of Albany 2015 Hazard Analysis Page 8 of 8
Probability
Winter snow storms are rare in this part of the valley. As is indicated in the chart above, when
they do occur they are occurring with less and less severity. The interval for snow storms over
the last 30 years have been one every 6 years. During this time there have been small storms but
generally not a significant amount of snow falls to be recorded or to cause problems to people
and property. Snow fall as recorded by month indicates that, on average, 2.2 inches will fall in
January, 1.3” in February, 0.2” in March, 0.2” in November and 1.6” in December. There was a
4 span between the last two snow storms with one being in 1998 - 1999 and the other in 2003. If
you look past the 1993 snow storm you will see there had been a 1 – 3 year gap between storms
with an 18 year gap between 1971 and 1989.
Vulnerability
When winter snow storms occur they will affect the entire community’s population. Unless
freezing rain has accompanied the snow fall power outages from snow fall alone are rare. The
city has no snow clearing equipment which means non-state roads will not be plowed as soon as
state roads. This can lead to multiple accidents as drivers with little winter driving experience
will tend to drive too fast and break to quickly causing many accidents. This will put a strain on
emergency services. Also snow fall means lower temperatures which have a tendency to mean
more structure fires created by using unsafe heating methods. In large snow falls businesses may
suffer because of the inability of workers to get to work because of the road condition. This
generally lasts for only a couple of day. Home owners are often not prepared for the cold
weather associated with snow fall which means that broken water pipes often occur. Snow fall
typically does not have a significantly high impact on the total population of the city as freezing
rain or extreme cold weather will.
Worksheet Total: 181.65
Rank out of 25: 1
Priority Group: High Last updated: March 16, 2015
City of Albany 2015 Hazard Analysis Page 9 of 9
Ice Storm
Definition Severe winter condition that affects day-to-day activities and includes freezing rain, and
heavy sleet.
Description
Winter Ice Storms generally occur between November and February in Oregon. Ice storms
result in fallen trees, broken tree limbs, downed power lines and utility poles, fallen
communications towers and impassable transportation routes. Severe ice storms have
caused electric power losses over large areas of Linn and Benton Counties, including the
city of Albany, rendering up to 18,000 customers without power. Generally during these
events transportation routes are nearly impossible to use. Because of the lack of experience
in driving in these conditions many accidents occur when individuals use the road ways.
Historical
Occurrence
Historical data on ice storms which have occurred in the past has been difficult to locate.
However record searches indicate that as far back as the 1880’s ice storms did occur in
Albany with one actually freezing the Willamette river so individuals could walk from one
bank to the other. Ice Storms have also occurred in Albany and the surrounding area in
1942, 1950, 1963, 1970, 1973, 1993, and 1995 and finally in 2003-2004. Climatologist
George Taylor of Oregon State University states that, on average, one ice storm occurs
every 10 years. Ice storms generally have created wide spread power outages because of
downed power lines due to iced power lines that have broken, tree’s that have fallen over
power lines or branches that have fallen onto power lines or traffic accidents that have
damaged power poles. Secondary to the power problem is the transportation route
problems. The area is not set up to deal with routine ice problems like other areas of
Oregon or the united states. Therefore when they occur there is no immediate de-icing
program to assist getting the roads usable. This leads to many accidents on the road way
which creates increased difficulties for emergency responders. Generally ice storms are not
storms that occur in a very short period of time, but rather develop over a 1 – 4 hour period,
and can last for 1 – 4 days. The 2003 -2004 ice storm was a Presidential Declared Disaster
for Oregon (1510).
On Saturday, February 8, 2014 after a two day snow storm there was a freezing rain event
with an accumulation of 0.5 inches of freezing rain in Albany. This event, along with the
snow from the previous two days, became a Presidential Declaration (4169) for both Linn
and Benton County. Little or no power outages because of this freezing rain event occurred.
Probability
Review of the historical data above indicated an average of 1 ice storm has occurred every
10 years. Given this information it is most likely we will continue to have additional future
ice storm at this same interval. Though they do not occur on regular interval, but rather
within a certain time period we can expect at least one to occur between 2004 and 2013.
Vulnerability
Past historical records indicates our entire city and surrounding populations is vulnerable to
power outages during ice storms. During the last such storm there were 18,000 customers
initially without power. After 1 day the outage was isolated to a small geographic area
which included North Albany. Power was out as long as 2 ½ days in this area. In addition
to power concerns the entire population is affected by the road conditions and is susceptible
to a higher rate of traffic accidents. Requests for emergency service personally generally
increase by 100% during ice storms putting a strain on emergency personnel.
Worksheet Total: 172.24
Rank out of 25: 2
Priority Group: High Last updated: March 16, 2015
City of Albany 2015 Hazard Analysis Page 10 of 10
Power Failure
Definition The loss of electricity to the residents, businesses and emergency service facilities.
Description
Every year, wind, snow, ice and severe rain storms, auto accidents, and equipment failure cause
periodic power loss in different areas of the city. Power failures affect both residential and
business in the community and can create severe emergency situations. Most power outages are
short in duration lasting not more than three or four hours depending on the severity of the break.
Weather outages tend to be the longest in duration because of the wide areas that can be affected.
Auto accidents are more localized and tend to be shorter in duration.
Repairs for the larger power system outages are made from power distribution stations and
substations outward to the end users. Typically residential customers farthest away from the
problem will be connected last. After major weather emergencies, ice, storms snow storms and
earthquakes, re-connection delays could be measured in days to weeks.
Historical
Occurrence
No historical data pertaining to exactly when power failures have occurred in Albany exist.
Small localized power outages occur on a regular basis averaging 2 – 3 a month. Depending on
the density of the area affected these outages can have an impact on 10 – 200 people.
In 2003 and 2004 rather large area power failures occurred do to equipment failure at the
Bonneville substation and a Presidential declared ice storm Typically complete grid failures
have not occurred in Albany, even in the Columbus Day Storm of 1964 power to many portions
of the city were still available. Power outage on May 19, 2010 affected 40,000 people for up to
1- 2 hours. July 7, 2010 a power outage affected up to 20,000 people lasted up to 2 hours in
some areas. High winds on March 13, 2011 were between 25 and 35 miles with power outage
for up to 2,000 for several hours. March 12, 2012 high winds ranging between 18 – 22 miles per
hour with gusts between 28 and 32. Over 7,000 customers were without power for up to two
hours. Up to four locations in the city were effected with power outages.
Generally localized power outages occur because of traffic accidents, ice storms, snow storms,
wind storms, transformers that going bad, or trees that fall across lines. When these localized
outages occur, the power companies will have power restored within 1 – 2, hours and if it is a
more extensive outage power will be restored within 4 hours
Tuesday, December 18, 2012 – 16,000 pacific power customers lost service for an unknown
problem that affected the transmission lines. Majority of those customers regained power about
20 minutes later.
Monday, August 26, 2013 about 2,800 Pacific power customers and 45 NW Natural customers
lost service after a power line went down and ignited a fire that burst out on both sides of a
sidewalk near the intersection of Bernard Avenue and Century Drive N.E. Electricity from the
line arced downward into an underground gas pipe, causing a release of gas from the pipe, which
started the fire at about 10:20 pm Monday.
February 6 – 9, 2014 due to a snow storm that dumped 15 inches of snow in Albany followed by
a freezing rain storm that left 0.5 inches of freezing rain power as out in the city of Albany in
isolated areas. There was no wide spread outage only localized.
April 28, 2014 Pacific power outage in Albany and Corvallis that began at 4:30 pm and ended at
7:02 pm. A total of 33,700 homes and businesses were affected by the outage. Outage was
caused by an electrical equipment failure at the Hazelwood substation. This was a major
distribution line that was affected.
June 26, 2014 a power outage caused by tree interference left more than 4,000 customers in
North Albany without power. The outage occurred about 5.40 pm and by 9:50 pm power had
been restored to all but 255 customers. The outage knocked out power to traffic signals on
City of Albany 2015 Hazard Analysis Page 11 of 11
Highway 20 at both North Albany road and spring hill drive.
July 13, 2014 power outage affects 33,000 people. Around 1 pm on Sunday there was a 20
minute outage that impacted business and homes around the Queen Avenue Substation. A
Switch failed for an unknown reason, causing a cascading effect that hit other stations. All
power was back on before 2 pm.
December 11, 2014 high winds accorded beginning about 12 noon and continuing until about 5
pm. Sustained winds of 25 to 35 mph occurred with gust of 45 to 55 mph. Minor damage
occurred throughout the city of surrounding area. Downtown area lost power for about bout 1
hour beginning at 2:15 and coming back on about 3:15. 17, 000 customers were without power
in the Albany, Corvallis, Dallas and Portland area according to Pacific Power.
Probability
It is likely there will continue to be power outage somewhere in the city of Albany and the
surrounding area on the same regularity that exists now. It is unlikely there will be a complete
power failure without some type of catastrophic event taking place. Our local system has
considerable redundancy as electricity is provided from several feeder sources. Even smaller
outages are being mitigated by the power company which has implemented an aggressive tree
trimming program beginning in about 1997. This program has significantly reducing the
chances of power lines breaking because of limbs falling during wind, ice and snow storms.
Vulnerability
Residents and businesses are very susceptible to power outages. Since most individuals or
business do not have back up power sources they are at the mercy of the power company to get
the problems repaired. 75% of the city has it power provided by above ground power lines
which means an outage could occur at any time. Historically a very small portion of the
community is normally affected by power outages when they have occurred. Large outages have
been rare.
Worksheet Total: 160.68
Rank out of 25: 3
Priority Group: High Last updated: March 16, 2015
City of Albany 2015 Hazard Analysis Page 12 of 12
High Wind Storm
Definition Extreme winds associated with severe winter storms, severe thunderstorms, downbursts, and
very steep pressure gradients.
Description
Large-scale extreme wind phenomena are experienced over every region of the United States.
Historically, high wind events are associated with severe thunderstorms and blizzards. It is often
difficult to separate windstorms and tornado damage when winds get above 70 knots.
Historical
Occurrence
It appears statistically that one high wind storm occurs each 10 years though in the last decade
wind storms have occurred more often which has had some impact on the city.
Since 1880, there have been 12 significant high windstorms that have taken place in the Albany
area. The wind speeds for these events ranged from as low as 40 mph to as high as 127 mph,
gust speed. In at least three of the storms individuals where killed, and in a fourth there were 4
injuries. The most significant high wind event was the “Columbus Day Storm” of October 12,
1962. It is the storm that all present day storms are measured against. In the 1960’s, there were
three high wind storms, in the 1970’s one, 1980’s one, 1990’s one and 2002 one. The 1995
(1107) and 2002 (1405) high wind events were Presidentially Declared Disasters. In December
2005 (1632) a wind storm moved up the Willamette Valley bringing strong winds to the central
and southern valley.
In all of the 13 high wind storms, power was lost to a large segment of the community.
Depending on the duration and wind speed of the event it was 4 hours to several days before all
the power to the communities and neighborhoods was restored. In the earlier part of the century,
the impact of a power outage was not as important as it has been in the last 30 years, as far fewer
people had electricity, and not as many critical facilities existed. All of the storms caused
significant damage to buildings, trees and infrastructure. The building and infrastructure damage
has risen over the last 30 years as more buildings have been constructed in Albany.
September 25, 2013funnel cloud was spotted between Albany and Lebanon. No touchdown, it
lasted about 15 minutes before disappearing.
Probability
In review of the historical occurrences another high wind storm will occur in the future. As with
other winter storms it is impossible to predict when, but it appears that one each 10 years is
likely and we since our last significant wind storm was in 2002 we can expect at least 1 more
significant wind storm to occur by 2012.
Vulnerability
When a wind storm does occur it will affect the entire population. The first will be because of
the power lost that will occur to the residential and businesses in the community. Like the ice
events power will be interrupted because of downed power lines due to tree’s blowing over or
tree branches falling on power lines. Power companies have been proactive in the area by
implementing mitigation programs that cut back tree branches at least 10 feet from power lines.
For wind events this will help keep limps from falling out of the trees on to the power lines.
Secondary to the power outage will be debris in the road ways that will cause driving hazards for
the public and emergency service personnel. Rural areas outside the city are more at risk
because of the number of trees, but the problem exists within the city as the city strives to
increase the number of trees is has for beatification and livability goals. Debris clearing becomes
a top priority for the city after high wind storms.
Worksheet Total: 158.85
Rank out of 25: 4
Priority Group: High Last updated: March 16, 2015
City of Albany 2015 Hazard Analysis Page 13 of 13
Earthquake
Definition Any shaking or vibration of the earth caused by the sudden release of energy that
may impose a direct threat on life and property.
Description
An earthquake is a sudden, rapid shaking of the earth caused by the breaking and
shifting of rock beneath the earth’s surface. This shaking can cause buildings and
bridges to collapse disrupt gas, electric, and phone service; and sometimes trigger
landslides, flash floods, and fires. The three general causes of earthquakes now
recognized are: tectonic, volcanic and artificially produced.
Historical
Occurrence
There has been one earthquake that has done minor damage in Albany out of the
many earthquakes that have occurred in Oregon, Washington, California and in the
Pacific Ocean. A strong earthquake in Del Norte County, California on November
22, 1873, was felt from Portland to San Francisco. On October 12, 1877, an
earthquake apparently centered in the Cascade Mountains was felt in Portland. On
February 3, 1892, another earthquake was felt from Astoria to Salem. On April
1896, three shock waves were felt from Portland to Salem. Other dates where quakes
occurred and were felt in Oregon were April 19, 1906; October 4, 1913; May 18,
1915; April 14, 1920; February 25, 1921; January 10, 1923; April 8, 1927; July 15,
1936; December 29, 1941; December 15, 1953; November 16, 1957; August 18,
1961 (minor damage to Albany and Lebanon); November 6 1961; and May 26, 1968.
The largest earthquakes in the state of Oregon before 1993 were reported on August
8, 1910, and September 21, 1993, both a 5.7 magnitude. The 1910 earthquake was
the largest historical shock within the state’s boundaries, but it occurred too far
offshore to cause damage. The damaging 1993 earthquake was the largest historical
earthquake beneath the land area of Oregon.
Since 1993 there have been 14 notable earthquakes in Oregon ranging in magnitude
from 2.5 to 6.0. Most are in the 2.5 to 3.9 range. In 1993, Scotts Mills, Oregon, had
the distinction of having the largest earthquake in Oregon’s history with a 5.6
Magnitude quake on March 25. It was short lived as a record when on September 20,
1993, Klamath Falls, Oregon, reported magnitudes of 5.9 and 6.0 earthquakes.
Probability
Though it is likely that another earthquake will occur, knowing when is really
impossible to predict. The last one to do damage in Albany was in 1961, 43 years
ago. It is likely that an earthquake which will do damage in Albany will occur in the
next 20 years.
Vulnerability
Depending on the strength of the earthquake and the location to Albany this type of
event will likely affect all of the citizens in the community. If the earthquake is of
any significant size the downtown portion of Albany will likely have significant
damage to it. The majority of the buildings in the downtown are un-reinforced
masonry anywhere from one to seven stories. At this time the majorities of the
second stories and above are unoccupied, but there is a push to refurbish many of the
second stories in the downtown area into living space. Bringing these buildings up to
present day earthquake code may not be possible. An earthquake during the day
would create significantly higher deaths and injuries in this area than one that would
occur in the evening.
Most homes in the city are single story levels, but the majority are now build to the
present day earthquake level so in a significant earthquake it would be anticipated
that many of the homes will be moved off their foundations. Most of Albany is
located on flat land, but there are many homes in the North Albany area that are built
in multiple levels on sloped land. Many of these homes are newer and have been
built to a higher standard. Still it would be expected that a large number of homes
would be damaged not only form the earthquake, but also from moving land they are
City of Albany 2015 Hazard Analysis Page 14 of 14
built on.
Infrastructure damage in the way of water and sewer would have a large impact on
the citizens of Albany after an earthquake. The city’s water system is old and being
replaced a little each year. It would be expected that depending on the type of
ground movement created from an earthquake, significant damage to underground
pipes would occur as well as damage to the old treatment plant, which has not be
seismically updates. This is true for the water treatment plant which was built during
the 1950’s and has not been upgraded. Since the pipes for this system are located in
the same area as the water pipes you would expect significant damage to this system
also.
The city has quite a few bridges that are not seismically upgraded. Two that are
major traffic routes between Albany in Linn County and Albany in Benton County.
Both go over the Willamette river and after a significant earthquake will be out of
services. In addition to these larger bridges there are many smaller bridges and
culverts that are underneath the city’s streets. Depending on the size and type of
earthquake event these bridges and culverts will create significant transportation
problems within the city. Safe emergency traffic routes will need to be created to
assure that emergency vehicles can get from section of town to the other safely.
Critical facilities will be impacted during an earthquake. At this time two fire
stations and city hall have been built at the latest earthquake standard. The two
remaining fire stations have been evaluated but not upgraded and the police station
was built prior to the increased standards and has not been upgraded. Albany’s
hospital, which is four stories, was not built and has not been upgraded top the
newest standard. It can be expected that if a significant earthquake occurs major
damage will take place at this facility.
The type and magnitude of an earthquake will have different affects on the city. For
the most part the city is not prepared to with stand a major event. The affect on the
citizens and its infrastructure will be catastrophic
Worksheet Total: 155.47
Rank out of 25: 5
Priority Group: High Last update: March 16, 2015
City of Albany 2015 Hazard Analysis Page 15 of 15
River Floods
Definition
A rising or overflowing of a tributary or body of water that covers adjacent land not
usually covered by water or when the volume of water in a stream exceeds the channel’s
capacity.
Description
Floods are the most common and widespread of all natural disasters, except fire. Most
communities in the United States can experience some kind of flooding after spring
rains, heavy thunderstorms, winter snow thaws, waterway obstructions, and levee or dam
failures. Often it is a combination of these elements that causes damaging floods.
Floodwaters can be extremely dangerous. The force of six inches of swiftly moving
water can knock people off their feet and two feet of water can float a car. Floods can be
slow, or fast-rising, but generally develop over a period of days. Flooding is a natural
and expected phenomenon that occurs annually, usually restricted to specific streams,
rivers or watershed areas.
Historical
Occurrence
The rainy season in western Oregon runs from October through May, while eastern
Oregon experiences its rainy or snowy season from late autumn through early spring.
Strong storm systems develop in the upper level flow over the Pacific during the rainy
season, bringing rain to the lower elevations and snow to the higher elevations.
Occasionally, a sub-tropical feed of moisture often referred to as the Pineapple
Connection, will be tapped by the stronger storms. The Pineapple Connection is just a
term used to describe a continuous stream of upper level moisture originating from the
tropics, often near Hawaii. This stream of moisture is warm and as a result the air can
hold more moisture. The subtropical moisture will enhance the precipitation process in
the storms, producing more precipitation than would normally be expected. Flooding can
occur if the several storms move across the same area in succession, with heavy snow
falling in the higher terrain. There is at least one subtropical connection that brings
heavy rain to some part of the Pacific Coast nearly every year. The key to how much
precipitation falls during a storm is closely related to how strong and persistent the
subtropical connection is.
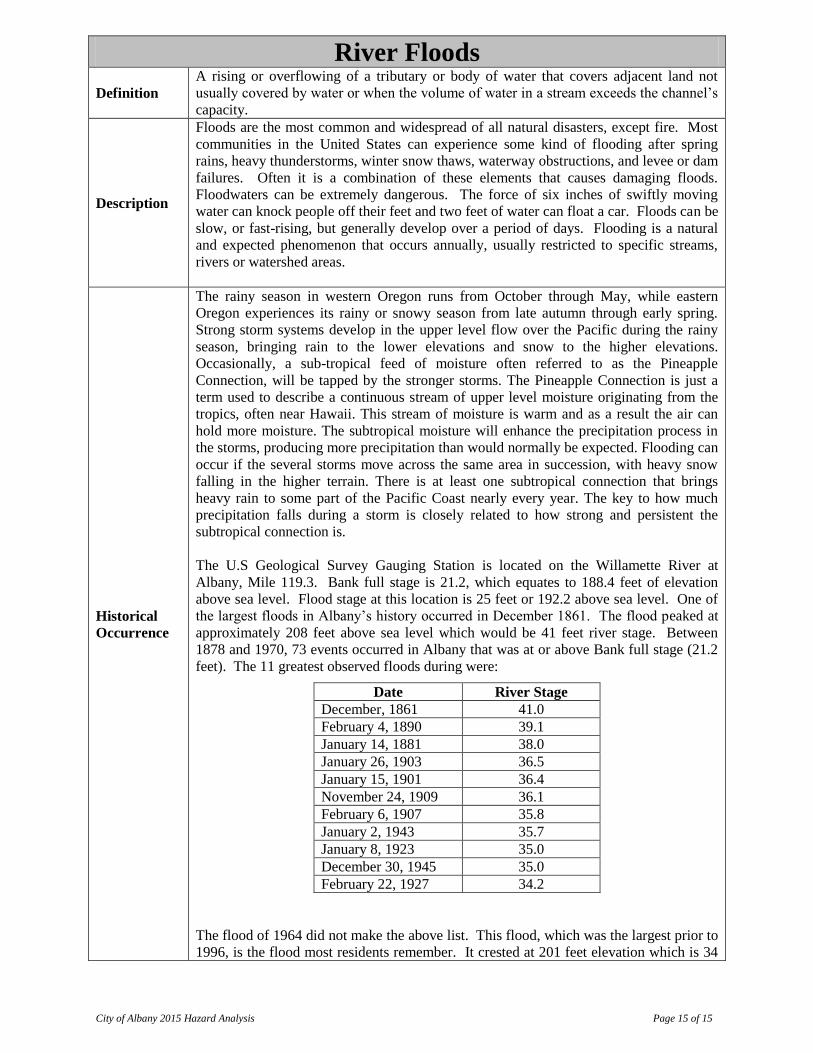
The U.S Geological Survey Gauging Station is located on the Willamette River at
Albany, Mile 119.3. Bank full stage is 21.2, which equates to 188.4 feet of elevation
above sea level. Flood stage at this location is 25 feet or 192.2 above sea level. One of
the largest floods in Albany’s history occurred in December 1861. The flood peaked at
approximately 208 feet above sea level which would be 41 feet river stage. Between
1878 and 1970, 73 events occurred in Albany that was at or above Bank full stage (21.2
feet). The 11 greatest observed floods during were:
Date River Stage
December, 1861 41.0
February 4, 1890 39.1
January 14, 1881 38.0
January 26, 1903 36.5
January 15, 1901 36.4
November 24, 1909 36.1
February 6, 1907 35.8
January 2, 1943 35.7
January 8, 1923 35.0
December 30, 1945 35.0
February 22, 1927 34.2
The flood of 1964 did not make the above list. This flood, which was the largest prior to
1996, is the flood most residents remember. It crested at 201 feet elevation which is 34
City of Albany 2015 Hazard Analysis Page 16 of 16
feet river stage. Had the upstream dam regulations not been in place the 1964, flood
would have been as high as the December 1861 flood, which was estimated at 41 feet
river stage, 208 feet elevation, or 16 feet above flood stage.
The last significant flood occurred in February 1996. At that time the river crested at 30
feet river stage or 197.2 feet above sea level. This flood did damage to the low areas in
the city, particularly in North Albany where it isolated a community by flooding all the
roads into the area. This became a Presidential Declared Disaster and had impact
throughout most of Oregon. Since that time there has not been significant flooding in or
around Albany. The Corps. of Engineers indicate that without flood control on the river,
the flood water would have been 5 to 6 feet higher. This would have put the flood waters
at 36 feet flood stage, 203 feet elevation, or equivalent to the 4th, 5
th, or 6th greatest
flood in Albany’s history.
Flooding occurred in January 2012, 18 – 22, begins with 6.75 inches of rain over a 3 day
period. Surface flooding occurred throughout Albany and the Willamette river go to 27
inches which is two feet above flood stage, no significant damage was reported at this
river depth.
From the Afternoon of Thursday, September 5, 2013 and the Friday morning of
September 6, 2013 4.34 inches of rain fell in Albany. The Albany Public Works rain
gauge recorded 3.65 inches of rain between 3 pm and 7 pm on Thursday, September 5,
2013. Rivers were low because it was summer so no river flooding took place, but
localized street flooding did occurred in many locations throughout Albany. There were
also reports of lightning strikes, with one occurring at the Albany Senior Center and
hitting an antenna on top of the roof.
March 14 – 15, 2015 at Hyslop Farm between Albany and Corvallis, during the 24-hour,
one day period from 8 a.m. Saturday to 8 a.m. Sunday. 1.75 inches of rain fell. That
eclipsed the previous record of 1.74 inches over the same time period in 1908. No
flooding occurred as river levels were low and the mountain snowpack was nonexistent.
Probability
Flood records for the City of Albany indicates there is no regular schedule, such as once
every 10 or 20 years, in which floods occur. Heavy rains which saturate the ground and
fill the rivers and creeks coupled with warming weather that melts heavy snow in the
mountains and foothills create the major flooding the City of Albany has seen over the
last 150 years. The time period between the 1964 and 1996 flood was 32 years. Two
major floods occurred in 1943 and 1945 and are the only recent examples of flooding to
have occurred within a three year period. These floods took place before the dams were
built on the rivers up stream of the city. Since then only the 1964 and 1996 floods have
occurred.
It is very likely another flood will occur in the future which will equal either the 1964 or
1996 flood. When it will occur is very difficult to predict since may factors need to
come together to create a major flood for this area.
City of Albany 2015 Hazard Analysis Page 17 of 17
Vulnerability
Since the dams were build upstream of the City of Albany the community is at little
risk to major flood event. The 1964 flood did do major damage to areas around the
City of Albany. Since then mitigation activities have been implemented to assure
similar flooding didn’t take place in the future.
The east side of the Willamette River is quite high in relation to the west side. It
would take a large flood to do any damage to the core of the city. The west side of
the Willamette river is where most of the mitigation activity has taken place. The
positive effect of this work could be seen in the 1996 flood where most areas in
North Albany were not affected by the flood waters. More work needs to be done to
elevate the roads in that area above the 100 flood level. The roads were the major
problems during the 1996 flood. Few, if any, structures were affected by river
flooding.
Drainage flooding in the east and north part of the city did do damage to quite a few
homes in these areas. Since the 1996 flood a number of mitigation projects have
taken place that will assure these same types of flooding do not occur in future.
Worksheet Total: 145.82
Rank out of 25: 6
Priority Group: High Last Updated: March 16, 2015
City of Albany 2015 Hazard Analysis Page 18 of 18
Water System Failure
Definition Failure to provide water processing for the purpose of storage, or for the stored water
to reach customers/residents using the water.
Description
Situations can occur which create power outages to the city’s water treatment plant,
due to power failures, internal electrical problems, or motor problems. The
distribution system could have broken pipes, or malfunctioning pump motor that
would not allow water to be distributed to the storage tanks. The water itself could
be contaminated which would eliminate a source of water for the treatment plant to
process. Typically, because of the redundancy in the larger diameter water
distribution systems, water will get to different parts of the city one way or another.
One broken pipe will not create a system failure. In smaller feeder lines to residents
or businesses, this may not be true. These lines, if broken, can cause a failure to the
system to that localized area.
Historical
Occurrence
The present water treatment plant was built in 1918 and has over 190 miles of pipes.
The City of Albany purchased the system from Pacific Power in 1984. Historical
data prior to 1984 is not available. Since the purchase of the water system, Albany
has experienced at least 4 situations in which water was not able to be produced or
the water being produced was not able to be transmitted through the system to homes
or storage facilities. Three of these incidents had to do with transformers and these
were caused by an electrical panel that caught fire. None of these incidents caused
the plant or distribution system to be down for more than 12 hours.
A new transformer supplying the water plant was installed in the summer of 2002.
There has never been a complete water distribution failure of the system, but there
have been sections of the system that have failed for up to 18 hours.
The potential for more widespread failure exists as several of the larger parts of
Albany, such as North Albany and South West Albany near Linn Benton Community
College, have only one feeder source. No redundancy in the system exists at this
time for these areas. The age of the system as a whole provides a problem as many
of the pipes are over 50 years old and in need of upgrading. May leaks are present in
the system today, but they are to numerous to repair at this time.
Another area of concern is the water source. Albany has only one at this time. A
canal that begins on the Santiam River in Lebanon, Oregon, and travels 18 miles to
Albany’s Calapooia River as the source. If this water source becomes contaminated,
the city is not able to produce any potable water. Beginning in 2004 the City of
Albany and City of Millersburg began a joint water venture that will provide the city
with a second source of water. It will also expand the reservoir capacity for the city
to nearly double of what i presently is.
Probability
Complete failure of the water system could occur in at least three different situations:
(1) Would take place if there were contamination to Albany’s intake water source.
Up until recently there was only one water supply source, the Santiam river intake in
Lebanon. Contamination of this water source would completely shut down the city’s
ability to make water. It would be necessary to use water in the reservoir system and
to conserve water by all users residential, commercial and industrial. A second
source of water will be coming on line in mid 2005 which will mean that two intake
locations would have to be contaminated to produce complete shutdown. Another
likely hood would be the contamination of the Santiam river upstream from the 1st
intake location. The 2nd
location is downstream from the first.
(2) Power failure to the water plant. At this time there are two locations where water
is treated. The chances are less that a major power failure would occur at both
City of Albany 2015 Hazard Analysis Page 19 of 19
locations at the same time. The ability to be able to treat water at two different
locations increases our storage of water. If total power failure occurred we would
need to rely on the water stored in our reservoirs until power came back on at one of
our treatment locations. At this time no backup power is available at either of the
treatment site so resumption of water treatment could only occur when the power
was restored.
(3) Electrical or mechanical failure within in the plant which would halt the treatment
of water. This scenario would likely take place at one of the two locations and with
two sites available to treat water interruption of water service would likely not be
severe.
Vulnerability
If any one of the three above mentioned failures were to occur at this time it would
likely have a mild to severe impact on the residents, commercial businesses and
industrial plants within the city of Albany and Millersburg. It could also have a
significant impact on fire service, depending on the severity of the failure, as the
water used for firefighting may need to come from the reservoirs. In addition,
because the City of Albany provides water to the city of Millersburg those residents
and businesses would also be impacted. A total of 45,000 to 50,000 people could be
affected. The good news is if one plant were to go off line the other would be able to
provide the necessary treated water to all the locations in Albany and Millersburg.
Typically during the year there may be one or two water disruptions which occur due
to water main failure or hydrant damage due to motor vehicle accidents. These
disruptions are much localized and generally affect 50 to 200 people at any one time.
These types of disruptions will continue to occur from year to year since they are due
to the age of the water system or accident which occurs to the system.
Major vulnerability has been reduced with the addition of a second water plant in
Millersburg and continued update of the city of Albany’s present water system. If
generators were to be added to each of the two plants it would eliminate power
failure as one of the three factors causing severe water problems to the city.
Routine scheduled maintenance of plant equipment would reduce another of the three
causes of water plant failures.
Contamination of water will always be a concern and absent of completely enclosing
all water sources will need to be something to deal with on a continuing basis.
Monitoring systems at the water intake locations will help reduce a contamination
problem but will never eliminate it.
Worksheet Total: 128.97
Rank out of 25: 7
Priority Group: Medium Last Updated: March 16, 2015
City of Albany 2015 Hazard Analysis Page 20 of 20
Communications Failure
Definition
Communication failure is defined as the severe interruption or loss of private
and or public communications systems, including but not limited to
transmission lines, broadcast, relay, switching and repeater stations as well as
communications satellites, electrical generation capabilities, and associated
hardware and software applications necessary to operate communications
equipment. These disruptions may result from equipment failure, human acts,
(deliberate or accidental) or the results of natural or human made disasters.
Description
Emergency 911, law enforcement, fire, emergency medical services, public works,
and emergency warning systems are just a few of the vital services which rely on
communication systems to effectively protect citizens. Business and industry rely
heavily on various communication media as well. Mechanical failure, traffic
accidents, power failure, line severance, and weather can affect communication
systems and disrupt service. Disruptions and failures can range from localized and
temporary to widespread and long-term. If switching stations are affected, outages
could be more widespread.
Historical
Occurrence
There is no data to indicate wide spread communications failures have occurred in
Albany or the surrounding area. As with power outages, communication failures do
occur, but they are localized rather than community wide. These communication
failures generally occur for the same reason as the power outages. Traffic accidents,
snow, ice and wind storms, trees falling across lines, and switching stations or
equipment failing, are the main causes.
Probability
Communication failure will most likely occur from wind, snow and ice storms
occurring in our local area. These are generally short term. Though earthquakes do
not occur on a regular basis in our area an earthquake will have the biggest impact on
the community as far as communications failure is concerned.
Vulnerability
Communication systems, like other utilities may suffer disruption from
natural or manmade disasters. Transmission stations, land lines, satellites,
cellular and other facilities cannot be made completely secure and are
therefore vulnerable to disruption. Satellites are vital in the respect that they
provide communication capabilities with the world outside of our local area.
We depend on them daily for news, weather forecasts and national defense.
They are subject to the effects of natural disasters such as cosmic debris and
mass coronal ejections (MCE). They are also subject to mechanical and
electrical system failure like any other communication device.
Emergency response capabilities are dependent upon communication systems
such as radio and telephone to direct and coordinate resources and to provide
vital public information and warning during emergencies.
Worksheet Total: 120.47
Rank out of 25: 8
Priority Group: Medium Last Updated: March 16, 2015
City of Albany 2015 Hazard Analysis Page 21 of 21
Sewer System Failure
Definition Failure to provide sewer system services because the system plant is offline or the
distribution system is not working.
Description
When electrical power, due to external or internal failure to the treatment plant goes
out, the plant is will not operate. If any motors or piping within the plant’s operations
were to fail or become disabled, the plant will not operate. If a unique chemical was
to get into the system that would do harm to the processing of the material received
at the plant, the plant will not operate. If there are no operations of the plant, there is
little storage capacity at the plant, the affluent coming into the plant is sent into the
Willamette River untreated.
Historical
Occurrence
There has been an Albany wastewater system since the early 1900’s. The present
day treatment plant was built in 1952 and upgraded in 1969. The system has 180
miles of pipe and 18 pump stations. The City of Albany is working towards
separating their wastewater System and their storm drain system, but has not yet
completed that project. There are no historical records or data prior to 1983.
Since 1983 there have been four separate events that have affected the operations of
the facility. A power failure due to a windstorm, flooding, below freezing weather
and an oil spill in the system. All of the failures resulted in untreated wastewater
flowing into the Willamette River. The major concerns for the wastewater system
are power to operate the pumps to process the affluent, keeping the system free of
contaminates, which would require shutting down the plant and cleaning the
contaminate pipes, and major flooding, which can cause the plant to be shut down.
(The flooding in 1996 did not require the system to be closed down, but there was 70
percent surcharging of the system and overflowing into the river, and the storm
system throughout the city.) Failure of pipes within the system will create problems,
but will not shut the system down or cause it to fail.
Probability
The probability of an event occurring do to power outage was reduced when the
sanitary sewer system facility was updated in 2009 when power from two directions
was included in the update. Also the likely hood of river or system flooding was
reduced when the capacity of the facility was upgraded. A long term power outage
and an earthquake will have the biggest impact on the system’s ability to function.
Vulnerability
The city is vulnerable to sewer system failure and will continue to be. Complete
migration of the problem is not possible. The impact of a failure will be felt by the
entire community and will have it biggest impact on industrial sites. Efforts to
mitigate the problem has been addressed by the city and will continue to be when
cost effective efforts are found that can be implemented.
Worksheet Total: 114.82
Rank out of 25: 9
Priority Group: Medium Last Updated: March 16, 2015
City of Albany 2015 Hazard Analysis Page 22 of 22
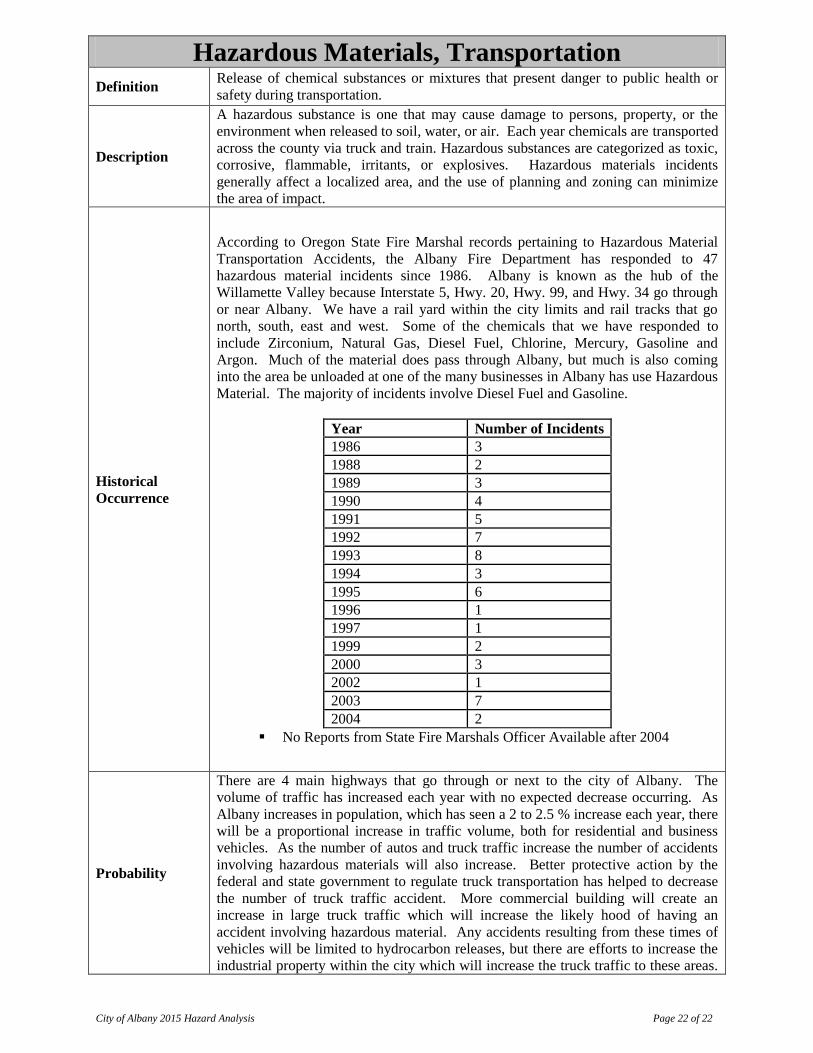
Hazardous Materials, Transportation
Definition Release of chemical substances or mixtures that present danger to public health or
safety during transportation.
Description
A hazardous substance is one that may cause damage to persons, property, or the
environment when released to soil, water, or air. Each year chemicals are transported
across the county via truck and train. Hazardous substances are categorized as toxic,
corrosive, flammable, irritants, or explosives. Hazardous materials incidents
generally affect a localized area, and the use of planning and zoning can minimize
the area of impact.
Historical
Occurrence
According to Oregon State Fire Marshal records pertaining to Hazardous Material
Transportation Accidents, the Albany Fire Department has responded to 47
hazardous material incidents since 1986. Albany is known as the hub of the
Willamette Valley because Interstate 5, Hwy. 20, Hwy. 99, and Hwy. 34 go through
or near Albany. We have a rail yard within the city limits and rail tracks that go
north, south, east and west. Some of the chemicals that we have responded to
include Zirconium, Natural Gas, Diesel Fuel, Chlorine, Mercury, Gasoline and
Argon. Much of the material does pass through Albany, but much is also coming
into the area be unloaded at one of the many businesses in Albany has use Hazardous
Material. The majority of incidents involve Diesel Fuel and Gasoline.
Year Number of Incidents
1986 3
1988 2
1989 3
1990 4
1991 5
1992 7
1993 8
1994 3
1995 6
1996 1
1997 1
1999 2
2000 3
2002 1
2003 7
2004 2
No Reports from State Fire Marshals Officer Available after 2004
Probability
There are 4 main highways that go through or next to the city of Albany. The
volume of traffic has increased each year with no expected decrease occurring. As
Albany increases in population, which has seen a 2 to 2.5 % increase each year, there
will be a proportional increase in traffic volume, both for residential and business
vehicles. As the number of autos and truck traffic increase the number of accidents
involving hazardous materials will also increase. Better protective action by the
federal and state government to regulate truck transportation has helped to decrease
the number of truck traffic accident. More commercial building will create an
increase in large truck traffic which will increase the likely hood of having an
accident involving hazardous material. Any accidents resulting from these times of
vehicles will be limited to hydrocarbon releases, but there are efforts to increase the
industrial property within the city which will increase the truck traffic to these areas.
City of Albany 2015 Hazard Analysis Page 23 of 23
These vehicles will carry more toxic chemicals to their site.
Albany has a rail yard which in the last three years has seen more activity on the
smaller lines headed West and East and South and North. There have been an
increase number of smaller derailments seen on these lines which have resulted in
hazardous materials spills. All of these spills have been of diesel fuel and all of the
derailments have been at low speed. Most of the cars for the rail systems are
transporting non- hazardous materials, primarily lumber and metal.
Vulnerability
Depending on the location of the accident, a hazardous materials transportation
accident will affect a small percentage of the population. Because the primary
transportation releases have been hydro carbons there is a small risk associated than
if it were a more serious chemical. Hydro carbon releases at this time pose a
problem to the sewer system and ground contamination. Few problems occur to the
atmosphere that would require sheltering in place or evacuation.
Because of the truck and rail traffic that does occur in the city and they types of
chemicals these transpiration vehicles carry it is likely that a leak of a more toxic
chemical will occur in the future and that it will effect up to 10% of the population or
400 people directly and another 10% or 400 people indirectly. Generally spills of
smaller sizes with less toxic chemicals will take between 2 – 4 hours to work
through, while a more serious chemical spill may take up to 48 hours to deal with
and effect 20% of the population directly and another 15% indirectly.
Worksheet Total: 114.38
Rank out of 25: 10
Priority Group: Medium Last Updated: March 16, 2015
City of Albany 2015 Hazard Analysis Page 24 of 24
Hazardous Materials, Fixed Site
Definition Release of chemical substances or mixtures that present dangers to public health or
safety during production or handling at a fixed facility.
Description
A hazardous substance is one that may cause damage to persons, property, or the
environment when released to soil, water, or air. Chemicals are manufactured and used
in ever increasing types and quantities. As many as 500,000 products pose physical or
health hazards and can be defined as “hazardous.” Each year, over 1,000 new synthetic
chemicals are introduced. Hazardous substances are categorized as toxic, corrosive,
flammable, irritants, or explosives. Hazardous materials incidents generally affect a
localized area and the use of planning and zoning can minimize the area of impact.
Historical
Occurrence
Albany has a number of industrial operations that utilize and produce hazardous
material. In the Millersburg and Albany area, exotic and special metals are produced at
many local facilities. Quantities of Chlorine and Ammonia are used at several facilities
within the Albany and Millersburg area.
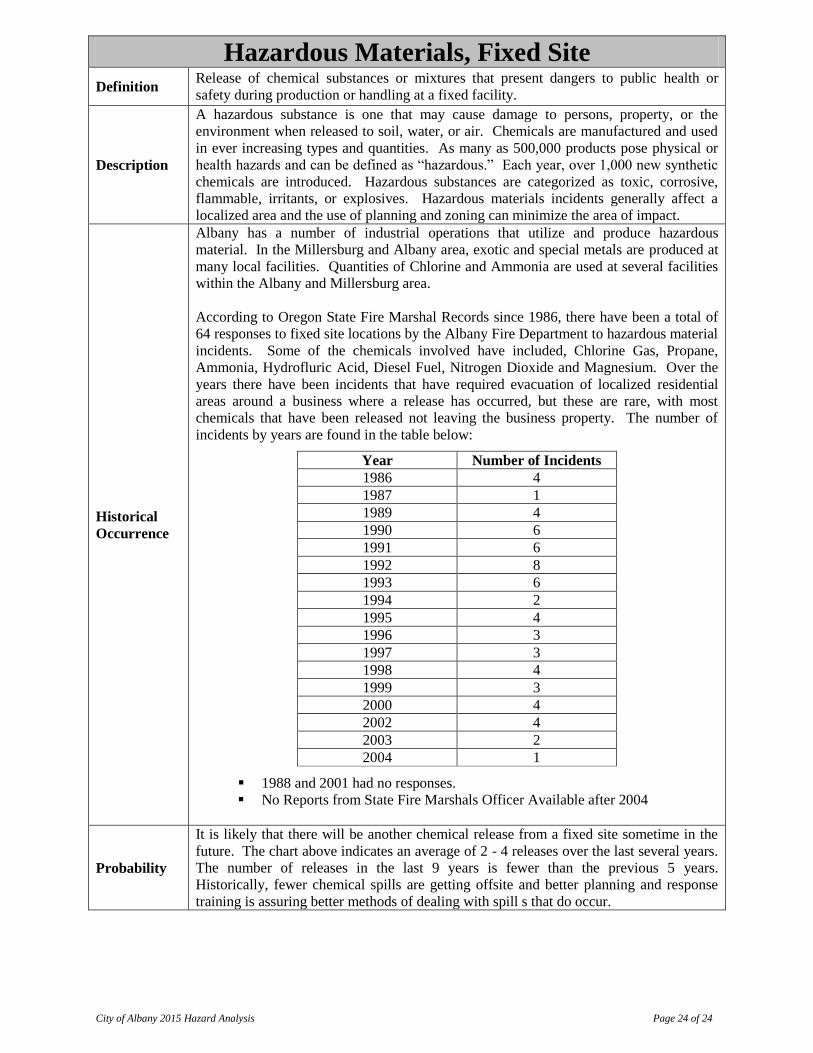
According to Oregon State Fire Marshal Records since 1986, there have been a total of
64 responses to fixed site locations by the Albany Fire Department to hazardous material
incidents. Some of the chemicals involved have included, Chlorine Gas, Propane,
Ammonia, Hydrofluric Acid, Diesel Fuel, Nitrogen Dioxide and Magnesium. Over the
years there have been incidents that have required evacuation of localized residential
areas around a business where a release has occurred, but these are rare, with most
chemicals that have been released not leaving the business property. The number of
incidents by years are found in the table below:
Year Number of Incidents
1986 4
1987 1
1989 4
1990 6
1991 6
1992 8
1993 6
1994 2
1995 4
1996 3
1997 3
1998 4
1999 3
2000 4
2002 4
2003 2
2004 1
1988 and 2001 had no responses.
No Reports from State Fire Marshals Officer Available after 2004
Probability
It is likely that there will be another chemical release from a fixed site sometime in the
future. The chart above indicates an average of 2 - 4 releases over the last several years.
The number of releases in the last 9 years is fewer than the previous 5 years.
Historically, fewer chemical spills are getting offsite and better planning and response
training is assuring better methods of dealing with spill s that do occur.

City of Albany 2015 Hazard Analysis Page 25 of 25
Vulnerability Generally the percentage of the community affected by a fixed site chemical spill is
small.
Worksheet Total: 113.24
Rank out of 25: 11
Priority Group: Medium Last updated: March 16, 2015
City of Albany 2015 Hazard Analysis Page 26 of 26
Highway Accident
Definition A single or multi-vehicle incident which requires responses exceeding normal day-
to-day capabilities.
Description
An extensive surface transportation network exists in Oregon. Local residents,
travelers, business, and industry rely on this network on a daily basis. Thousands of
trips a day are made on the streets, roads, state and federal highways in and around
Albany. If the designed capacity of the roadway is exceeded, the potential for a
major highway incident increases. Weather conditions play a major factor in the
ability of traffic to flow safely in and through the state. Time of day (rush hour), day
of week, and incidents involving buses and other high-occupancy vehicles could
trigger a response that exceeds the normal day-to-day capabilities of response
agencies.
Historical
Occurrence
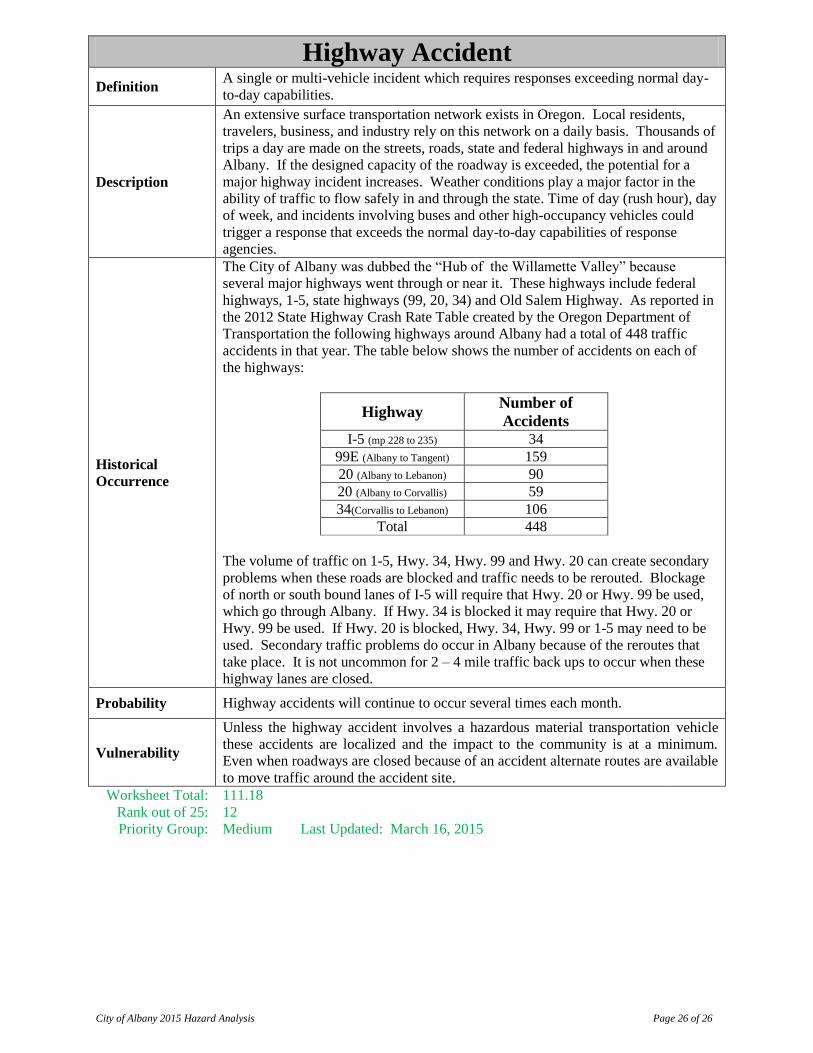
The City of Albany was dubbed the “Hub of the Willamette Valley” because
several major highways went through or near it. These highways include federal
highways, 1-5, state highways (99, 20, 34) and Old Salem Highway. As reported in
the 2012 State Highway Crash Rate Table created by the Oregon Department of
Transportation the following highways around Albany had a total of 448 traffic
accidents in that year. The table below shows the number of accidents on each of
the highways:
Highway Number of
Accidents I-5 (mp 228 to 235) 34
99E (Albany to Tangent) 159
20 (Albany to Lebanon) 90
20 (Albany to Corvallis) 59
34(Corvallis to Lebanon) 106
Total 448
The volume of traffic on 1-5, Hwy. 34, Hwy. 99 and Hwy. 20 can create secondary
problems when these roads are blocked and traffic needs to be rerouted. Blockage
of north or south bound lanes of I-5 will require that Hwy. 20 or Hwy. 99 be used,
which go through Albany. If Hwy. 34 is blocked it may require that Hwy. 20 or
Hwy. 99 be used. If Hwy. 20 is blocked, Hwy. 34, Hwy. 99 or 1-5 may need to be
used. Secondary traffic problems do occur in Albany because of the reroutes that
take place. It is not uncommon for 2 – 4 mile traffic back ups to occur when these
highway lanes are closed.
Probability Highway accidents will continue to occur several times each month.
Vulnerability
Unless the highway accident involves a hazardous material transportation vehicle
these accidents are localized and the impact to the community is at a minimum.
Even when roadways are closed because of an accident alternate routes are available
to move traffic around the accident site.
Worksheet Total: 111.18
Rank out of 25: 12
Priority Group: Medium Last Updated: March 16, 2015
City of Albany 2015 Hazard Analysis Page 27 of 27
Structural Fire
Definition
1. A structure fire is a fire involving the structural components of various types
of residential, commercial or industrial buildings. Residential buildings range
from single-family detached homes and townhouses to apartments and tower
blocks, or various commercial buildings ranging from offices to shopping
malls.
Description
Structural fires present a far greater threat to life and property and the potential for
much larger economic losses. Modern fire codes and fire suppression requirements
in new construction and building renovations, coupled with improved firefighting
equipment, training, and techniques, lessen the chance and impact of a major fire.
Most structural fires occur in residential structures, but the occurrence of a fire in a
commercial or industrial facility could affect more people and pose a greater threat to
those near the fire, or those fighting the fire, because of the volume or type of the
material involved.
Historical
Occurrence
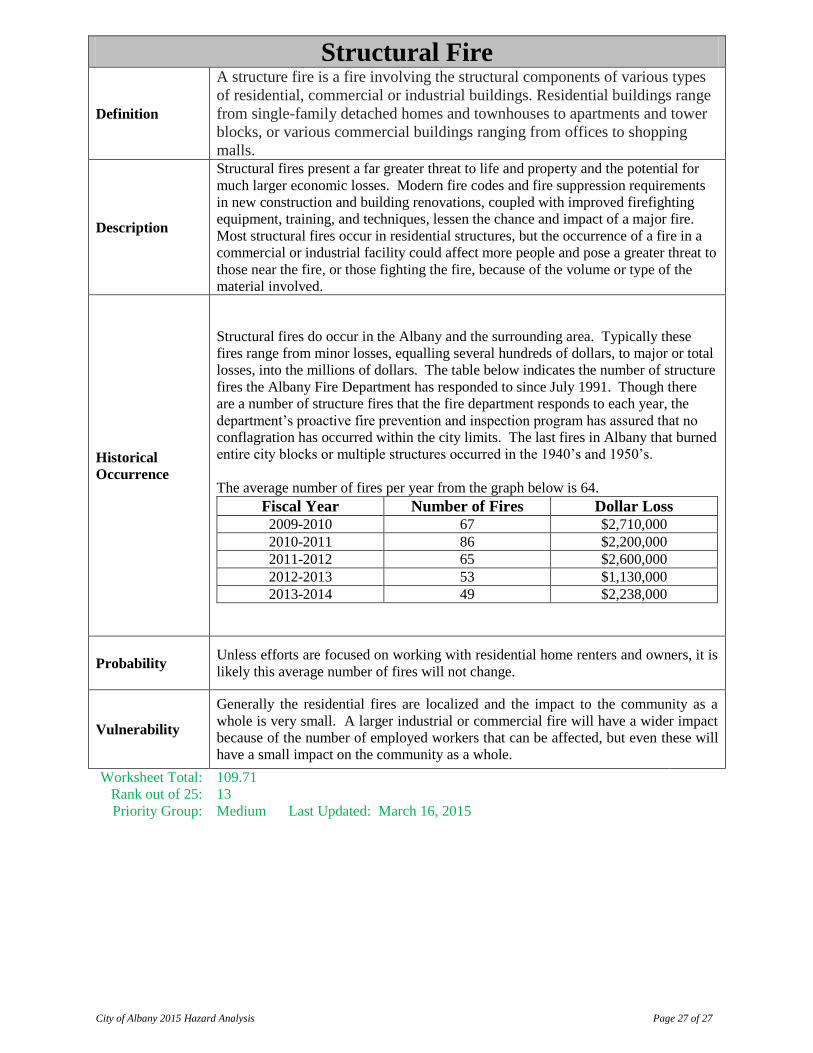
Structural fires do occur in the Albany and the surrounding area. Typically these
fires range from minor losses, equalling several hundreds of dollars, to major or total
losses, into the millions of dollars. The table below indicates the number of structure
fires the Albany Fire Department has responded to since July 1991. Though there
are a number of structure fires that the fire department responds to each year, the
department’s proactive fire prevention and inspection program has assured that no
conflagration has occurred within the city limits. The last fires in Albany that burned
entire city blocks or multiple structures occurred in the 1940’s and 1950’s.
The average number of fires per year from the graph below is 64.
Fiscal Year Number of Fires Dollar Loss 2009-2010 67 $2,710,000
2010-2011 86 $2,200,000
2011-2012 65 $2,600,000
2012-2013 53 $1,130,000
2013-2014 49 $2,238,000
Probability Unless efforts are focused on working with residential home renters and owners, it is
likely this average number of fires will not change.
Vulnerability
Generally the residential fires are localized and the impact to the community as a
whole is very small. A larger industrial or commercial fire will have a wider impact
because of the number of employed workers that can be affected, but even these will
have a small impact on the community as a whole.
Worksheet Total: 109.71
Rank out of 25: 13
Priority Group: Medium Last Updated: March 16, 2015
City of Albany 2015 Hazard Analysis Page 28 of 28
Railway Accident
Definition
Any impact between railroad on-track equipment and a highway user at a highway-
rail grade crossing. The term “highway user” includes automobiles, buses, trucks,
motorcycles, bicycles, farm vehicles, pedestrians, and all other modes of surface
transportation motorized and un-motorized; Any collision, derailment, fire,
explosion, or other event involving operation of railroad on-track equipment
(standing or moving) that results in reportable damages greater than the current
reporting threshold to railroad on-track equipment, signals, track, track structures,
and roadbed;
Description
Railway incidents may include derailments, collisions, and highway/rail crossing
incidents. Train incidents can result from a variety of causes. Human error,
mechanical failure, faulty signals, and problems with the tracks can lead to railway
incidents. Results of an incident can range from minor “track hops” to catastrophic
hazardous materials incidents and even passenger casualties.
Historical
Occurrence
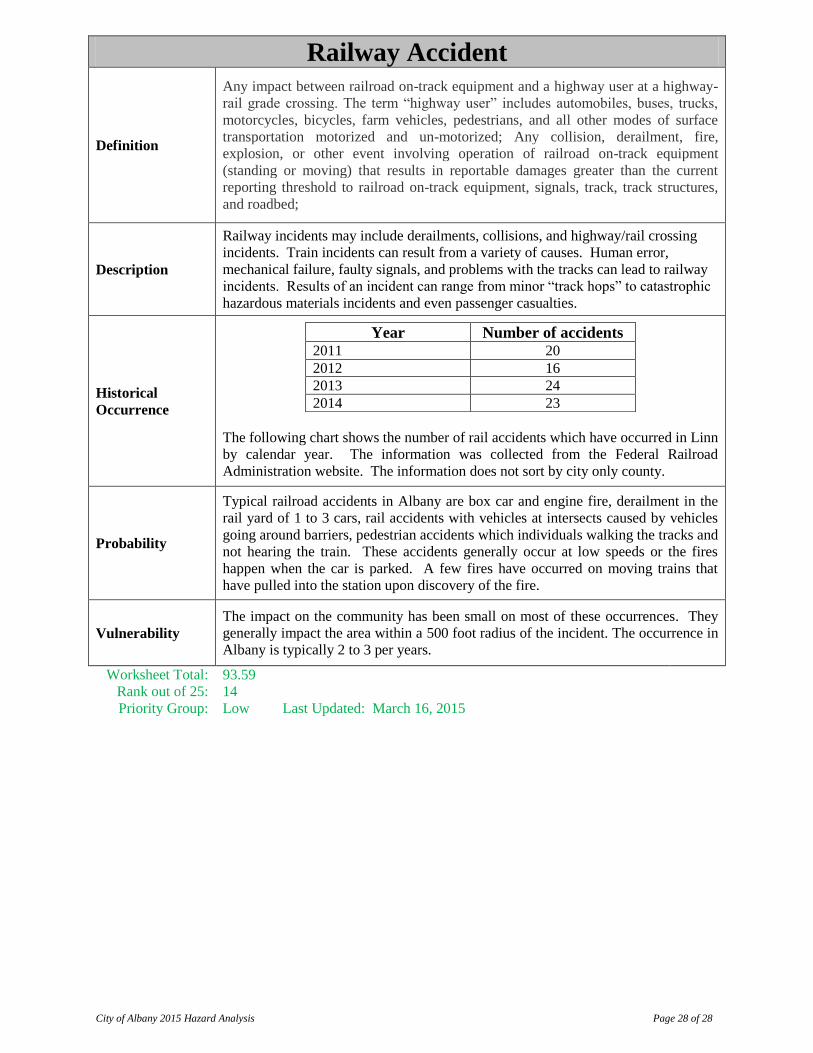
Year Number of accidents 2011 20
2012 16
2013 24
2014 23
The following chart shows the number of rail accidents which have occurred in Linn
by calendar year. The information was collected from the Federal Railroad
Administration website. The information does not sort by city only county.
Probability
Typical railroad accidents in Albany are box car and engine fire, derailment in the
rail yard of 1 to 3 cars, rail accidents with vehicles at intersects caused by vehicles
going around barriers, pedestrian accidents which individuals walking the tracks and
not hearing the train. These accidents generally occur at low speeds or the fires
happen when the car is parked. A few fires have occurred on moving trains that
have pulled into the station upon discovery of the fire.
Vulnerability
The impact on the community has been small on most of these occurrences. They
generally impact the area within a 500 foot radius of the incident. The occurrence in
Albany is typically 2 to 3 per years.
Worksheet Total: 93.59
Rank out of 25: 14
Priority Group: Low Last Updated: March 16, 2015
City of Albany 2015 Hazard Analysis Page 29 of 29
Dam Failure
Definition A break, or imposed threat from any water retention fixture which may endanger
population downstream of the containment area.
Description
Dams are constructed for a variety of uses, including flood control, erosion control,
water supply impoundment, hydroelectric power generation, and recreation.
Flooding, operating error, poor construction, lack of maintenance, damage due to
burrowing animals, vandalism, terrorism, and earthquakes can cause dam failure.
Dams are classified into three categories based on the potential risk to people and
property should a failure occur:
High Hazard – If the dam were to fail, lives would be lost and extensive property
damage could result.
Moderate Hazard – Failure could result in loss of life and significant property
damage.
Low Hazard – Failure results in minimal property damage only.
Dam hazard potential classifications have nothing to do with the material condition
of a dam, only the potential for death or destruction due to the size of the
impoundment and the characteristics of the area downstream of the dam.
Historical
Occurrence
Albany has not experienced a dam failure.
The Corp of Engineers controlled dams on the Willamette and Santiam have a high
vulnerability and maximum threat rating, but the probability is low. No dam failures
have occurred since the dams on the mentioned rivers have been built.
Before the U.S Army Corps of Engineers (USACE) dams on the North Santiam,
South Santiam and Willamette rivers was built, cities in the Willamette Valley were
subject to 25 year storm events in which severe flooding occurred. USACE officials
estimated that during the February 1996 flood event, the levels of the Willamette
River in Albany would have been 5 to 6 feet higher at the maximum flood stage.
This would surely have inundated a larger part of North Albany and the western
portion of Albany.
A dam failure can either be slow in nature or catastrophic, depending upon a number
of variables, such as the strength of containment structure, the amount and velocity
of water released and the distance of affected structures from the failure.
Probability
There are a number of events that could occur to trigger a dam failure they include
over toping, erosion, landslides, earthquakes, terrorism and seepage. Information
quoted in the Sweet Home Hazard Mitigation Plan indicates the probability of a dam
failure is 0.1% per year or less than once in 1,000 years. It is unlikely that a dam
failure will occur, unless an earthquake or terrorist attack was to trigger a failure.
Dams build in the 1960 were designed to a ground shaking level of 0.10 g, today this
same dam would need to be built to a 0.21 g level. This indicates all the dams, which
were built in the 1960’s, that would affect the City of Albany where built at the
lower ground shake level and could be effected by an earthquake of medium size.
Terrorism has always been a concern, but after September 11, 2001 more awareness
on the need to provide for security at dams was identified and plan were developed to
provide more security.
City of Albany 2015 Hazard Analysis Page 30 of 30
Dams are inspected on a regular basis.
Vulnerability
The worst case event would be a catastrophic failure of the Hills Creek Dam on the
Middle Fork of the Willamette River, near Oakridge. Flood flows from such a
failure would breach Lookout Point and Dexter Dams and continue down the
Willamette River to Willamette Falls at Oregon City. Albany would be impacted by
this type of an event. The Hills Creek Dam failure would create water levels at
approximately 216 feet above sea level in Albany. It would take 24 hours to get to
Albany, and 31 hours to reach the peak elevation. Lookout Point Dam failure would
provide water levels at approximately 210 feet above sea level in Albany. This
would take 27 hours to get to Albany and 35 hours to reach peak elevation. Cougar
Dam on the McKenzie River would provide a flood elevation of 207 feet; take 51
hours to get to Albany and 57 hours to reach peak elevation.
On the Santiam River we have Green Peter Dam and Foster Dam which could fail.
The results of these dams failing would not have the same impact on Albany as
would the others since they are located on the Santiam River and its influence to the
Willamette River is downstream of Albany. The impacts of these dams would be
felt on the north and northeast portions of Albany having to do with Burkhart Creek
between Knox Butte and the airport.
A dam failure on the Santiam river will have much smaller impact on Albany since
the river enters in to the Willamette river downstream of the city. Only the north and
north east part of Albany will be effected. This part of Albany has a smaller
population base and sets on higher ground. In this situation the Willamette river
would rise because of the high volumes of water entering the river, but the effect on
Albany upstream would still be minimal. 5 – 10% of the population may be
affected.
A dam failure on the Willamette River would have a greater affect on Albany as the
water level would come to the 4th or 5th Street level. These are the levels of flooding
that occurred in the 1890’s in Albany. Though the effects on the east bank of the
river in Albany would be primarily to businesses the west side would have a greater
impact on residential buildings. In either case the impact to the population of Albany
would still be small when compared to the total population, about 5 – 10 %.
Whether the dam failure occurred on the Santiam or the Willamette river it would
take 8 – 10 for the water to arrive in Albany. This would be ample time to
implement evacuation and response procedure for this event.
Worksheet Total: 91.24
Rank out of 25: 15
Priority Group: Low Last Updated: March 16, 2015
City of Albany 2015 Hazard Analysis Page 31 of 31
Volcanic Ash
Definition Fallout of ash resulting from the explosion of a volcano somewhere in the world carried
via high level air currents.
Description
The eruption of Mt. Saint Helens in 1980 showed that air currents can move ash a
considerable distance. Volcanic ash dispersed into the atmosphere can provide non-
radioactive fallout that would cover everything in the area. Such fallout can be abrasive
and cause damage to painted surfaces, reciprocal and jet engines.
Historical
Occurrence
Except for Mt. St. Helens, no other volcanic eruption in the immediate area or the world
has had an effect on Albany.
Volcanic activity in the Pacific Northwest appears to be entering a more active cycle. In
1980, the eruption of Mt. St. Helens in Washington State demonstrated the destructive
effects of a volcanic event. Mt. Hood has recently experienced ground movement and
minor venting. Theoretically, an eruption may occur in the cascade range at 60-year
intervals. Intensity of such eruptions is unpredictable. If an eruption originates from the
earth’s interior, it can produce lava flows or violent explosions spewing rock gasses and
debris, as occurred with Mt. St. Helens. It is more likely that a non-lava explosion will
occur once every 100 years. Volcanic ash thrown into the atmosphere can provide a
non-radioactive fallout that can cover everything in the area. In 2004 there was once
again activity in the dome of the area. The dome is building up and clouds of steam
have been released. There also has been underground movement taking place at the
mountain.
The three most active volcanos in Oregon are Mt. Hood, Three Sisters, and Newberry
Crater. Mt. Hood last erupted about 200 years ago. Three Sisters erupted about 2,000
years ago, but since 1997 a broad area centered three miles west of the South Sister has
domed upward by more than 5 inches. Scientists think that this doming reflects the
ongoing accumulation of magma at a depth of 3 to 4 miles. Newberry Crater erupted
about 1,300 years ago.
In Washington State, Mt. Baker, erupted in the mid-1800s; Glacier Peak, erupted at least
six times in the past 4,000 years; Mt. Rainier, four eruptions and numerous lahars in the
past 4,000 years; Mt. St. Helens, erupted on May 18, 1980; and Mt. Adams experienced
a series of small eruptions about 1,000 years ago.
In Northern California, Mt. Shasta, last erupted in 1786, and has erupted on an average
of once every 300 years. Medicine Lake has erupted at least eight times in the past
4,000 years, most recently about 900 years ago. It is the largest volcano in the Cascades.
The most recent volcanic eruptions in California occurred at Lassen Peak from 1914 to
1917. An explosive eruption on May 22, 1915, produced a large pyroclastic flow, lahars
and ash that fell as far away as Elko, Nevada, (300 miles to the East).
Probability
It is likely that a volcanic eruption will occur at sometime in the future from Mt. St.
Helens, the Three Sisters or Mt. Hood. Since many of the volcanic activities are
measured in 100’s of years it may be a while before we see something occur like what
happened with Mt. St. Helens.
City of Albany 2015 Hazard Analysis Page 32 of 32
Vulnerability
If an eruption was to occur, the entire city population could be affected depending on
what mountain erupted, whether it was a magna eruption or a steam eruption and
what direction the winds, at the lower and higher levels, were traveling. This will be
one of those events where either the whole population is affected or none of the
population will be affected.
Worksheet Total: 88.76
Rank out of 25: 16
Priority Group: Low Last Updated: March 16, 2015
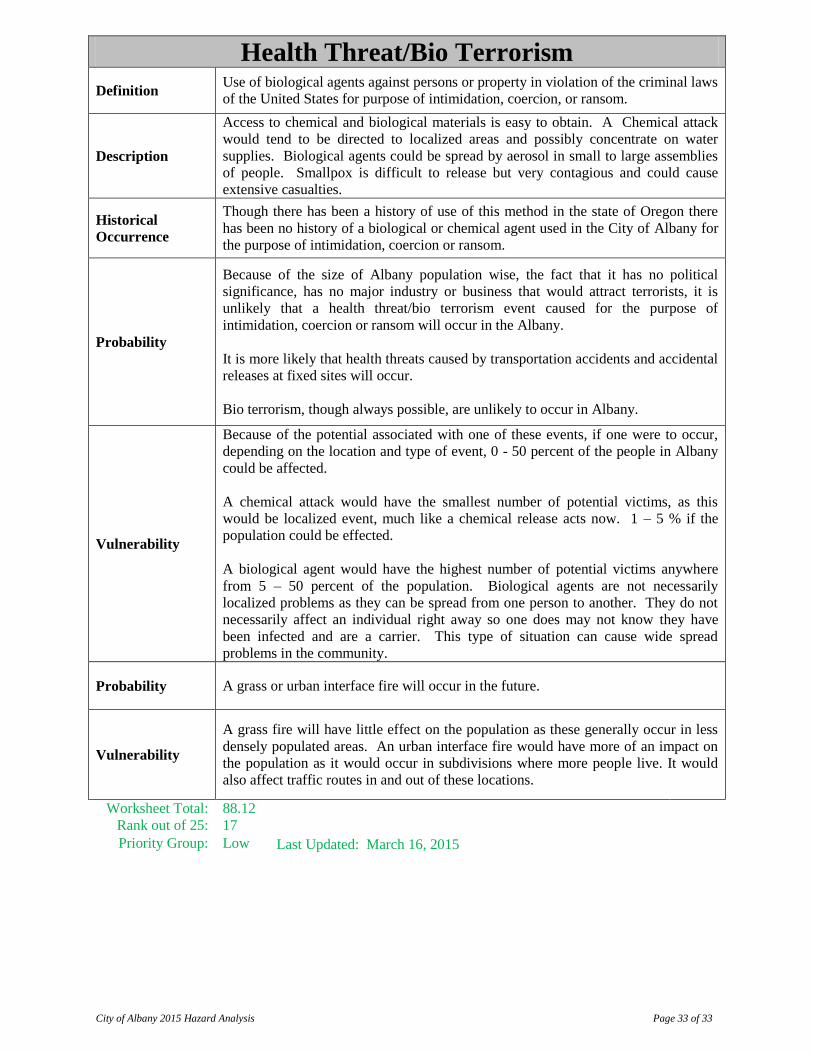
City of Albany 2015 Hazard Analysis Page 33 of 33
Health Threat/Bio Terrorism
Definition Use of biological agents against persons or property in violation of the criminal laws
of the United States for purpose of intimidation, coercion, or ransom.
Description
Access to chemical and biological materials is easy to obtain. A Chemical attack
would tend to be directed to localized areas and possibly concentrate on water
supplies. Biological agents could be spread by aerosol in small to large assemblies
of people. Smallpox is difficult to release but very contagious and could cause
extensive casualties.
Historical
Occurrence
Though there has been a history of use of this method in the state of Oregon there
has been no history of a biological or chemical agent used in the City of Albany for
the purpose of intimidation, coercion or ransom.
Probability
Because of the size of Albany population wise, the fact that it has no political
significance, has no major industry or business that would attract terrorists, it is
unlikely that a health threat/bio terrorism event caused for the purpose of
intimidation, coercion or ransom will occur in the Albany.
It is more likely that health threats caused by transportation accidents and accidental
releases at fixed sites will occur.
Bio terrorism, though always possible, are unlikely to occur in Albany.
Vulnerability
Because of the potential associated with one of these events, if one were to occur,
depending on the location and type of event, 0 - 50 percent of the people in Albany
could be affected.
A chemical attack would have the smallest number of potential victims, as this
would be localized event, much like a chemical release acts now. 1 – 5 % if the
population could be effected.
A biological agent would have the highest number of potential victims anywhere
from 5 – 50 percent of the population. Biological agents are not necessarily
localized problems as they can be spread from one person to another. They do not
necessarily affect an individual right away so one does may not know they have
been infected and are a carrier. This type of situation can cause wide spread
problems in the community.
Probability A grass or urban interface fire will occur in the future.
Vulnerability
A grass fire will have little effect on the population as these generally occur in less
densely populated areas. An urban interface fire would have more of an impact on
the population as it would occur in subdivisions where more people live. It would
also affect traffic routes in and out of these locations.
Worksheet Total: 88.12
Rank out of 25: 17
Priority Group: Low Last Updated: March 16, 2015
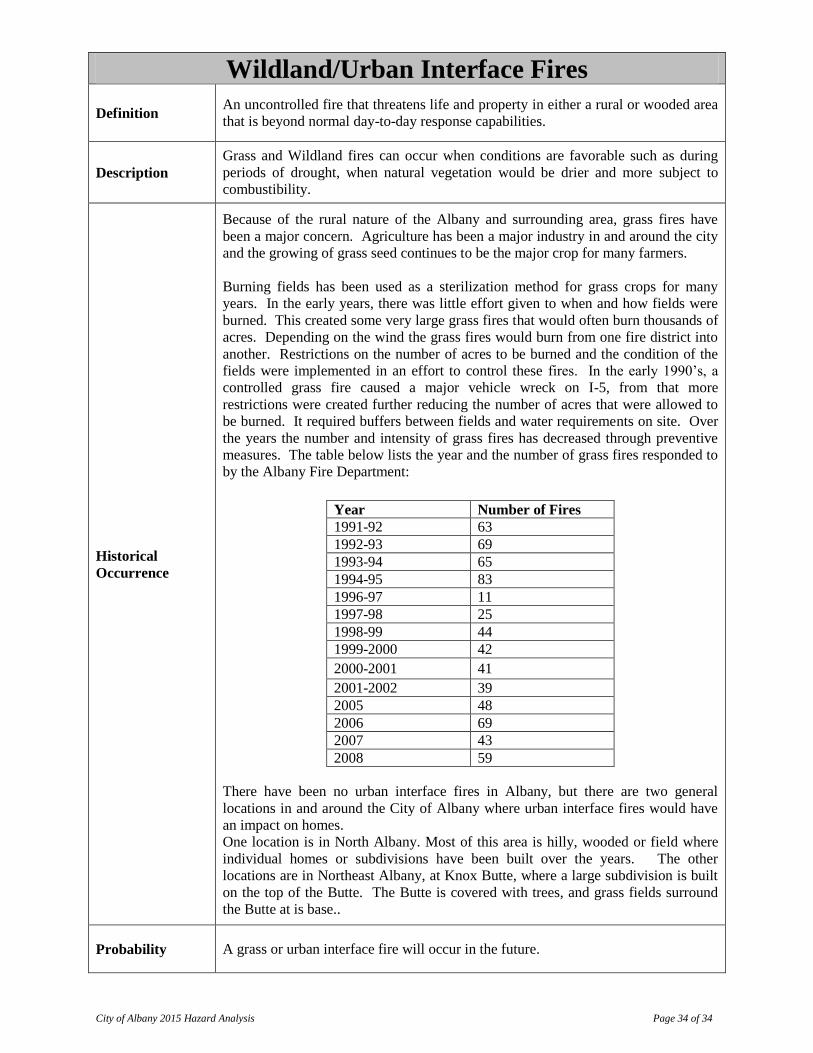
City of Albany 2015 Hazard Analysis Page 34 of 34
Wildland/Urban Interface Fires
Definition An uncontrolled fire that threatens life and property in either a rural or wooded area
that is beyond normal day-to-day response capabilities.
Description
Grass and Wildland fires can occur when conditions are favorable such as during
periods of drought, when natural vegetation would be drier and more subject to
combustibility.
Historical
Occurrence
Because of the rural nature of the Albany and surrounding area, grass fires have
been a major concern. Agriculture has been a major industry in and around the city
and the growing of grass seed continues to be the major crop for many farmers.
Burning fields has been used as a sterilization method for grass crops for many
years. In the early years, there was little effort given to when and how fields were
burned. This created some very large grass fires that would often burn thousands of
acres. Depending on the wind the grass fires would burn from one fire district into
another. Restrictions on the number of acres to be burned and the condition of the
fields were implemented in an effort to control these fires. In the early 1990’s, a
controlled grass fire caused a major vehicle wreck on I-5, from that more
restrictions were created further reducing the number of acres that were allowed to
be burned. It required buffers between fields and water requirements on site. Over
the years the number and intensity of grass fires has decreased through preventive
measures. The table below lists the year and the number of grass fires responded to
by the Albany Fire Department:
There have been no urban interface fires in Albany, but there are two general
locations in and around the City of Albany where urban interface fires would have
an impact on homes.
One location is in North Albany. Most of this area is hilly, wooded or field where
individual homes or subdivisions have been built over the years. The other
locations are in Northeast Albany, at Knox Butte, where a large subdivision is built
on the top of the Butte. The Butte is covered with trees, and grass fields surround
the Butte at is base..
Year Number of Fires
1991-92 63
1992-93 69
1993-94 65
1994-95 83
1996-97 11
1997-98 25
1998-99 44
1999-2000 42
2000-2001 41
2001-2002 39
2005 48
2006 69
2007 43
2008 59
Probability A grass or urban interface fire will occur in the future.

City of Albany 2015 Hazard Analysis Page 35 of 35
Vulnerability
A grass fire will have little effect on the population as these generally occur in less
densely populated areas. An urban interface fire would have more of an impact on
the population as it would occur in subdivisions where more people live. It would
also affect traffic routes in and out of these locations.
Worksheet Total: 84.15
Rank out of 25: 18
Priority Group: Low Last Updated: March 16, 2015
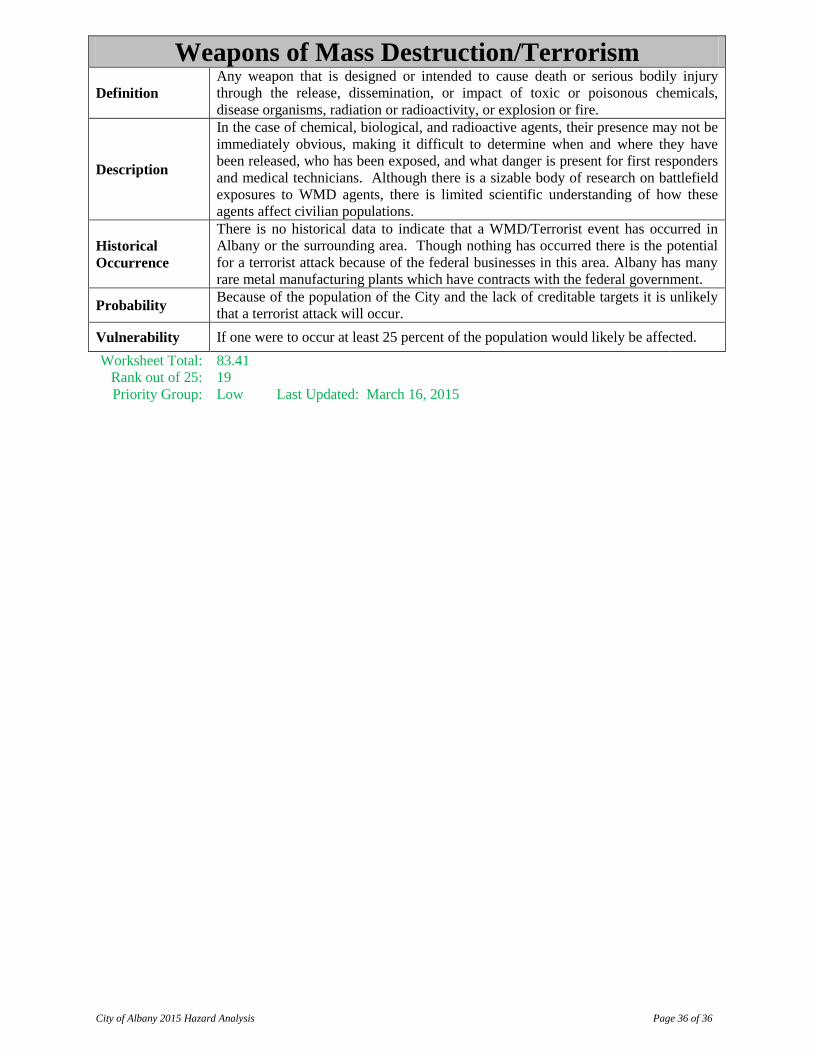
City of Albany 2015 Hazard Analysis Page 36 of 36
Weapons of Mass Destruction/Terrorism
Definition
Any weapon that is designed or intended to cause death or serious bodily injury
through the release, dissemination, or impact of toxic or poisonous chemicals,
disease organisms, radiation or radioactivity, or explosion or fire.
Description
In the case of chemical, biological, and radioactive agents, their presence may not be
immediately obvious, making it difficult to determine when and where they have
been released, who has been exposed, and what danger is present for first responders
and medical technicians. Although there is a sizable body of research on battlefield
exposures to WMD agents, there is limited scientific understanding of how these
agents affect civilian populations.
Historical
Occurrence
There is no historical data to indicate that a WMD/Terrorist event has occurred in
Albany or the surrounding area. Though nothing has occurred there is the potential
for a terrorist attack because of the federal businesses in this area. Albany has many
rare metal manufacturing plants which have contracts with the federal government.
Probability Because of the population of the City and the lack of creditable targets it is unlikely
that a terrorist attack will occur.
Vulnerability If one were to occur at least 25 percent of the population would likely be affected.
Worksheet Total: 83.41
Rank out of 25: 19
Priority Group: Low Last Updated: March 16, 2015
City of Albany 2015 Hazard Analysis Page 37 of 37
Pipeline Transportation Failure
Definition
When a low or high pressure pipeline, typically Natural Gas, Fuel, or Propane,
ruptures or is punctured and creates an opening in the pipeline for the product to flow
from and into or on the ground or a fire or explosion occurs because of the rupture or
puncture.
Description
Linn County is served by several high pressure pipelines that are transportation lines
to industries. An underground pipeline incident can be caused by environmental
disruption, accidental damage, or sabotage. Incidents can range from a small leak
that is not ignited, to a large rupture in which the gas is ignited. Inspection and
maintenance of the pipeline system, along with marked gas line locations, and an
early warning and response procedure can lessen the risk to those in proximity to the
pipelines.
Historical
Occurrence
From time to time there are breaches of small residential or feeder lines, but there is
no history of any of the larger lines being breached in Albany or the surrounding
area.
There are two pipeline systems running north to south in Linn County and east of
Albany. The local pipeline system runs various petroleum products through the
lines. These materials range from high octane fuel to less combustible motor oils.
The other pipeline system contains natural gas. The system consists of 20 inch
outside diameter (O.D.) lines and a parallel 12 ¾ inch O.D. line. Eight- inch feeder
lines route from the main pipeline to serve the cities ranged east and west of the main
line. Progressively smaller lines provide service to the local consumer. Most of the
length of the gas lines is sited in rural areas and risk to the population of a major
breach is nominal. The most common cause of breaches is from farm or construction
equipment digging in the area of a pipeline.
Probability
It is likely that small ruptures to low pressure pipelines will continue to occur in
Albany. These have been and will continue to be spermatic and isolated accidents
that are occurring in the city. High pressure pipelines are located outside the city and
typically the regulations on inspection and safety concerns for these pipelines are
much higher than low pressure pipes, thus reducing, but not eliminating, the
opportunity for the failure to occur.
Vulnerability
For low pressure lines the vulnerability to the community is low. Typically when a
rupture does occur in a low pressure line it only impacts the immediate area.
Generally within 500 feet of the occurrence.
Worksheet Total: 70.62
Rank out of 25: 21
Priority Group: Low Last Updated: March 16, 2015
City of Albany 2015 Hazard Analysis Page 38 of 38
Civil Disturbance
Definition Mass demonstrations or direct conflict by large groups of citizens, as in marches,
protest rallies, riots, and non-peaceful strikes.
Description
People assembled together in a manner to substantially interfere with public peace
constitutes a threat, whether it’s by use of unlawful force or violence against another
person, causing property damage or attempting to interfere with, disrupting, or
destroying the government, political subdivision, or group of people. Labor strikes
and work stoppages are not considered in this hazard unless they escalate into a
threat to the community. Vandalism is usually initiated by a small number of
individuals and limited to a small target group or institution. Most events are within
the capacity of local law enforcement.
Historical
Occurrence
The traditional type of civil disturbance involving demonstrations, rioting, looting
and other violent disorderly behavior has not been a problem in the Albany nor has it
posed much of a potential threat to the citizens of Albany. There are no records of
any civil disturbance that required intervention by the police department.
Probability It is unlikely that a civil disturbance will occur in Albany.
Vulnerability A very small percentage of the people in Albany would be affected by a civil
disturbance.
Worksheet Total: 69.35
Rank out of 25: 22
Priority Group: Low Last Updated: March 16, 2015
City of Albany 2015 Hazard Analysis Page 39 of 39
Tornado
Definition
A violent, destructive, rotating column of air taking, a funnel-shaped cloud that
progresses in a narrow, erratic path. Rotating wind speeds can exceed 200 mph
and travel across the ground at average speeds of 25 to 30 mph.
Description
A tornado is a violent whirling wind characteristically accompanied by a funnel
shaped cloud extending down from a cumulonimbus cloud. A tornado can be a
few yards to a mile wide where it touches the ground. An average tornado,
however, is a few hundred yards wide. It can move over land for distances ranging
from short hops to many miles, causing great damage wherever it descends. The
funnel is made visible by the dust sucked up and by condensation of water droplets
in the center of the funnel.
Historical
Occurrence
As improbable as it may sound, tornados do occur in the city and the surrounding
areas. Since 1925, from Eugene to McMinnville there have been 9 reported
tornados. In the immediate Albany vicinity there have been two reported tornados.
The first on May 23, 1990, and the second on March 22, 1994. The 1990 tornado
produced 3 funnel clouds, but there was no confirmation that anyone of the three
touched down. The 1994 tornado touched down near a shopping area in Albany
and blew out store windows and damaged some merchandise in the stores. For
the surrounding area the last tornado was reported in Eugene in 1989.
Typically funnel clouds are spotted in and around Albany, but very few of these
funnels extend to the ground. On average one funnel cloud is spotted in Albany or
the surrounding area about once every three years.
The closest tornado occurred in Aumsville, Oregon on December 14, 2010 when a
F2 struck the downtown area.
A tornado in the Albany area was recorded at a F2 in 2010 and caused 2 injuries
and 0 deaths.
September 25, 2013 funnel cloud was spotted between Albany and Lebanon. No
touchdown, it lasted about 15 minutes before disappearing.
Probability
The occurrence of a tornado has been low over the years, though it seems like more
funnel spotting have occurred over the last 6 – 7 years. The number of spotting
will likely continue at its present level.
Vulnerability
The city at least 10 – 15 % of the city could be impacted by a tornado if one were
to actually strike the ground. Much of that depends on the intensity, duration and
location of the touchdown. Since tornados are localized the majority of the
community will not be impacted except by power outages created by the
destruction.
Worksheet Total: 67.26
Rank out of 25: 23
Priority Group: Low Last Updated: March 16, 2015
City of Albany 2015 Hazard Analysis Page 40 of 40
Landslide/Debris Flow
Definition A downward and outward movement of slope-forming materials reacting under the
force of gravity.
Description
Landslides occur when masses of rock, earth, or debris move down a slope.
Landslides may be very small or very large, and can move at slow to very high
speeds. Many landslides have been occurring over the same terrain since prehistoric
times. They are activated by storms and fires and by human modification of the land.
New landslides occur as a result of rainstorms, earthquakes, and various human
activities.
Historical
Occurrence
There are no historical records of landslides in the Albany area. The only known
debris flows occurred prior to the flood control dams being built in the 1950’s. Prior
to that there were indications of the Willamette and Calapooia Rivers having debris
flows of trees when flooding occurred. In the late 1800’s, the forests along the
Willamette and Calapooia River, were very extensive and major flooding would
cause trees to be swept down the river which would cause log jams.
Because of the flat land on which Albany is located there are not many locations
were landslide/debris flows can take place. The following are a few locations that
have been identified as potential sites.
One location is in North Albany, along Springhill Road, where Springhill begins to
parallel the Willamette River. Those hills have been identified as potential Rapidly
Moving Landside areas.
Another area is West Thornton Lake Drive, between North Albany Road and the
2500 block of West Thornton Lake Drive. There are five locations that have been
identified as having Potential Rapidly Moving Landslide possibilities. All locations
are North of West Thornton Lake Drive.
The final potential Rapidly Moving Landslide area is located on the west side of
Knox Butte between the hill and Scravel Hill Road. One of the two sites
encompasses the road going up to the subdivision with landslide areas on the west
and east side. The other location is on the west side and below the subdivision.
Probability
It is unlikely that any landslide or debris flows will occur unless extremely high
amount so rain occurs or an earthquake takes place. A dam failure, depending on
whether it occurred on the Willamette or Santiam River could create a debris flow.
Vulnerability
Though by percentage few people within the city would be affected by a landslide it
could have an impact on some transportation routes. More people and business
would be affected by a debris flow, if one were to occur.
Worksheet Total: 66.74
Rank out of 25 24
Priority Group: Low Last Updated: March 16, 2015
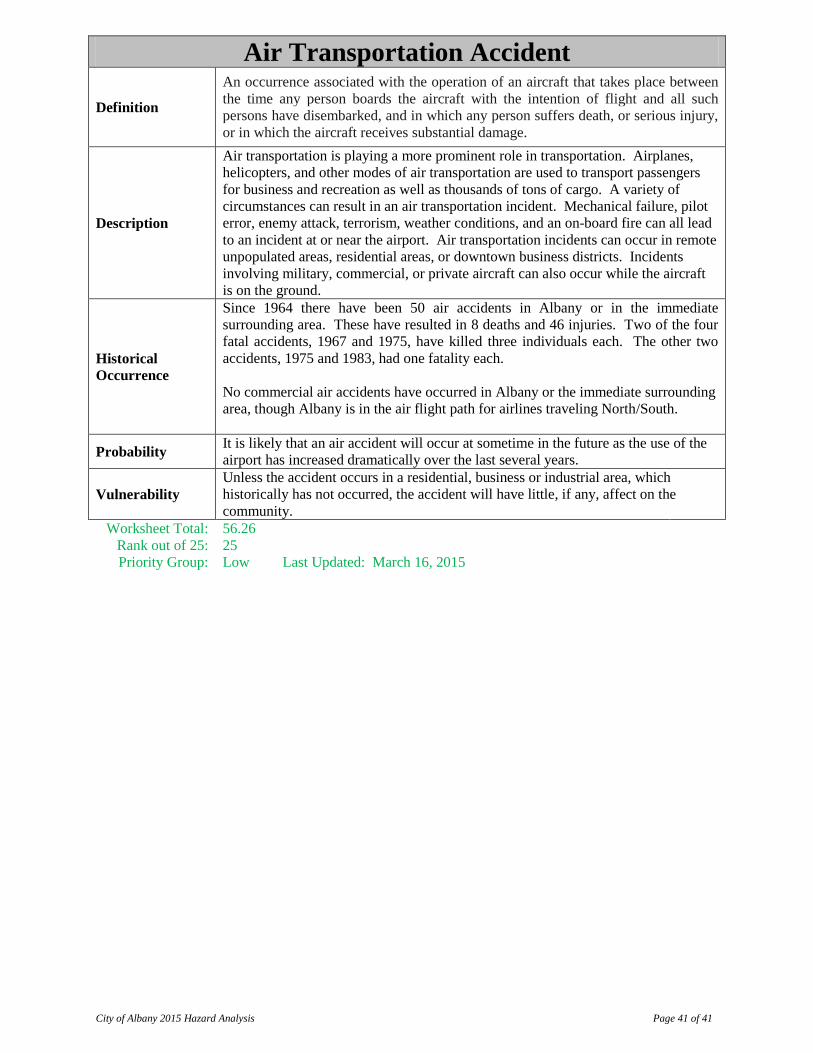
City of Albany 2015 Hazard Analysis Page 41 of 41
Air Transportation Accident
Definition
An occurrence associated with the operation of an aircraft that takes place between
the time any person boards the aircraft with the intention of flight and all such
persons have disembarked, and in which any person suffers death, or serious injury,
or in which the aircraft receives substantial damage.
Description
Air transportation is playing a more prominent role in transportation. Airplanes,
helicopters, and other modes of air transportation are used to transport passengers
for business and recreation as well as thousands of tons of cargo. A variety of
circumstances can result in an air transportation incident. Mechanical failure, pilot
error, enemy attack, terrorism, weather conditions, and an on-board fire can all lead
to an incident at or near the airport. Air transportation incidents can occur in remote
unpopulated areas, residential areas, or downtown business districts. Incidents
involving military, commercial, or private aircraft can also occur while the aircraft
is on the ground.
Historical
Occurrence
Since 1964 there have been 50 air accidents in Albany or in the immediate
surrounding area. These have resulted in 8 deaths and 46 injuries. Two of the four
fatal accidents, 1967 and 1975, have killed three individuals each. The other two
accidents, 1975 and 1983, had one fatality each.
No commercial air accidents have occurred in Albany or the immediate surrounding
area, though Albany is in the air flight path for airlines traveling North/South.
Probability It is likely that an air accident will occur at sometime in the future as the use of the
airport has increased dramatically over the last several years.
Vulnerability
Unless the accident occurs in a residential, business or industrial area, which
historically has not occurred, the accident will have little, if any, affect on the
community.
Worksheet Total: 56.26
Rank out of 25: 25
Priority Group: Low Last Updated: March 16, 2015
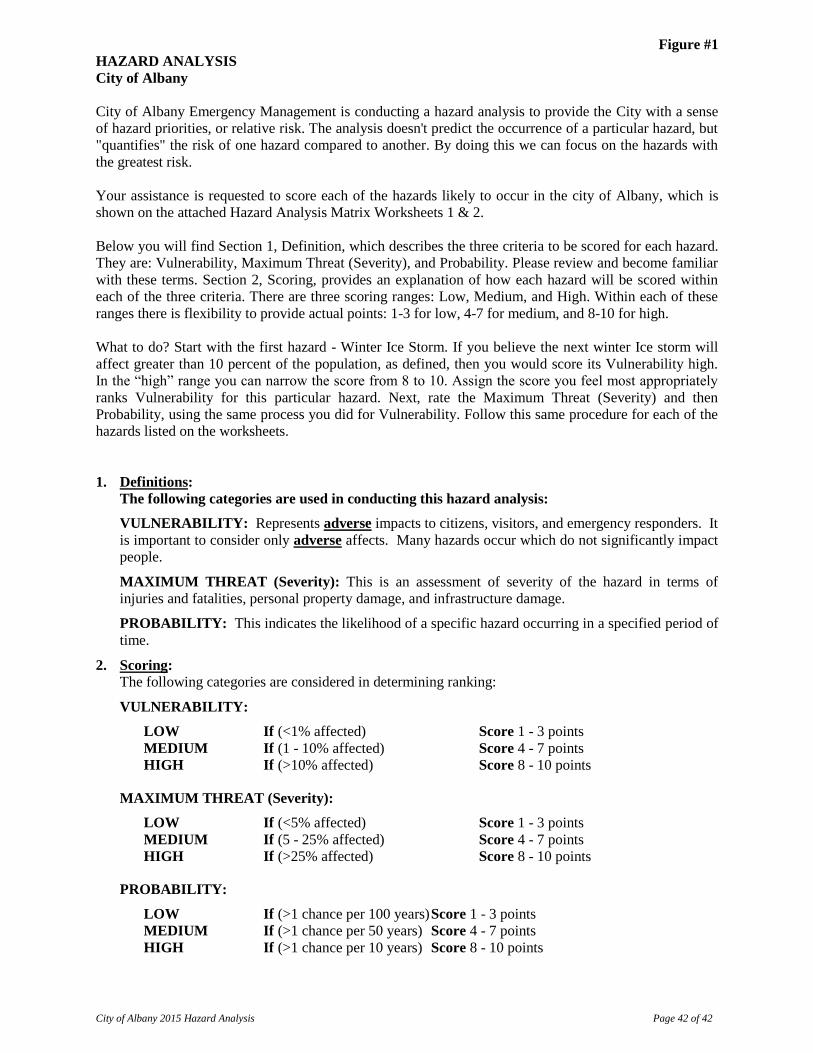
City of Albany 2015 Hazard Analysis Page 42 of 42
Figure #1
HAZARD ANALYSIS
City of Albany
City of Albany Emergency Management is conducting a hazard analysis to provide the City with a sense
of hazard priorities, or relative risk. The analysis doesn't predict the occurrence of a particular hazard, but
"quantifies" the risk of one hazard compared to another. By doing this we can focus on the hazards with
the greatest risk.
Your assistance is requested to score each of the hazards likely to occur in the city of Albany, which is
shown on the attached Hazard Analysis Matrix Worksheets 1 & 2.
Below you will find Section 1, Definition, which describes the three criteria to be scored for each hazard.
They are: Vulnerability, Maximum Threat (Severity), and Probability. Please review and become familiar
with these terms. Section 2, Scoring, provides an explanation of how each hazard will be scored within
each of the three criteria. There are three scoring ranges: Low, Medium, and High. Within each of these
ranges there is flexibility to provide actual points: 1-3 for low, 4-7 for medium, and 8-10 for high.
What to do? Start with the first hazard - Winter Ice Storm. If you believe the next winter Ice storm will
affect greater than 10 percent of the population, as defined, then you would score its Vulnerability high.
In the “high” range you can narrow the score from 8 to 10. Assign the score you feel most appropriately
ranks Vulnerability for this particular hazard. Next, rate the Maximum Threat (Severity) and then
Probability, using the same process you did for Vulnerability. Follow this same procedure for each of the
hazards listed on the worksheets.
1. Definitions:
The following categories are used in conducting this hazard analysis:
VULNERABILITY: Represents adverse impacts to citizens, visitors, and emergency responders. It
is important to consider only adverse affects. Many hazards occur which do not significantly impact
people.
MAXIMUM THREAT (Severity): This is an assessment of severity of the hazard in terms of
injuries and fatalities, personal property damage, and infrastructure damage.
PROBABILITY: This indicates the likelihood of a specific hazard occurring in a specified period of
time.
2. Scoring:
The following categories are considered in determining ranking:
VULNERABILITY:
LOW If (<1% affected) Score 1 - 3 points
MEDIUM If (1 - 10% affected) Score 4 - 7 points
HIGH If (>10% affected) Score 8 - 10 points
MAXIMUM THREAT (Severity):
LOW If (<5% affected) Score 1 - 3 points
MEDIUM If (5 - 25% affected) Score 4 - 7 points
HIGH If (>25% affected) Score 8 - 10 points
PROBABILITY:
LOW If (>1 chance per 100 years) Score 1 - 3 points
MEDIUM If (>1 chance per 50 years) Score 4 - 7 points
HIGH If (>1 chance per 10 years) Score 8 - 10 points
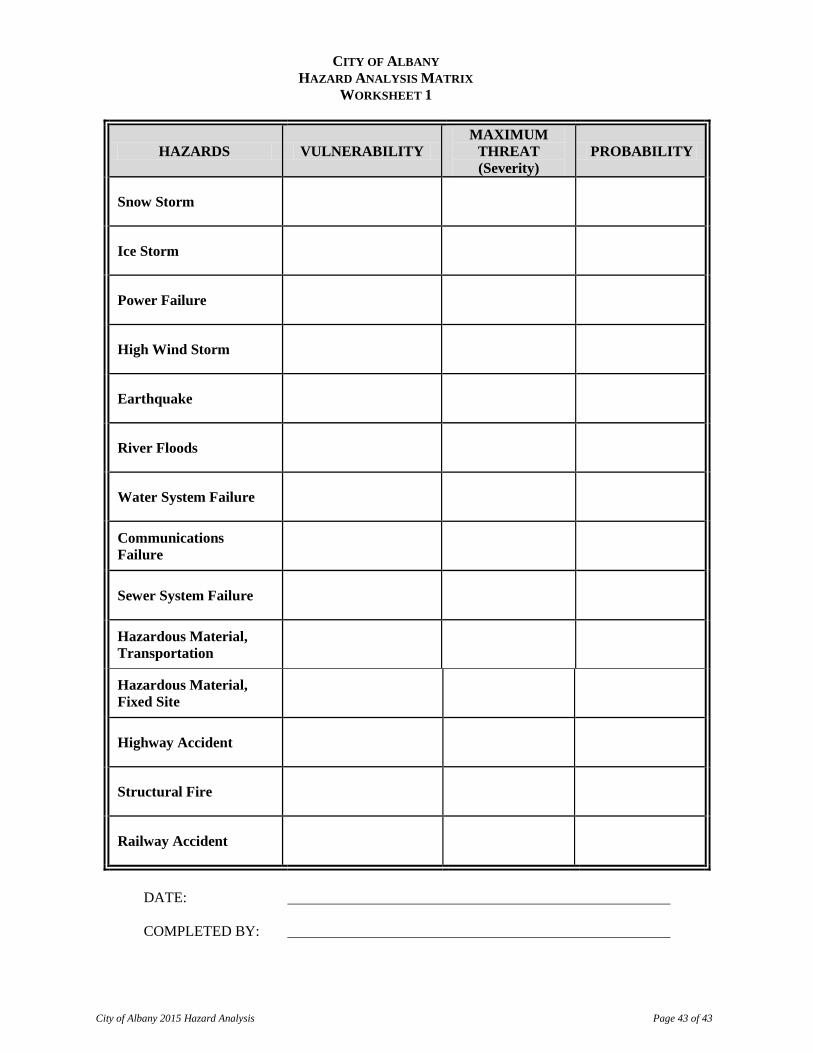
City of Albany 2015 Hazard Analysis Page 43 of 43
CITY OF ALBANY
HAZARD ANALYSIS MATRIX
WORKSHEET 1
HAZARDS VULNERABILITY
MAXIMUM
THREAT
(Severity)
PROBABILITY
Snow Storm
Ice Storm
Power Failure
High Wind Storm
Earthquake
River Floods
Water System Failure
Communications
Failure
Sewer System Failure
Hazardous Material,
Transportation
Hazardous Material,
Fixed Site
Highway Accident
Structural Fire
Railway Accident
DATE:
COMPLETED BY:
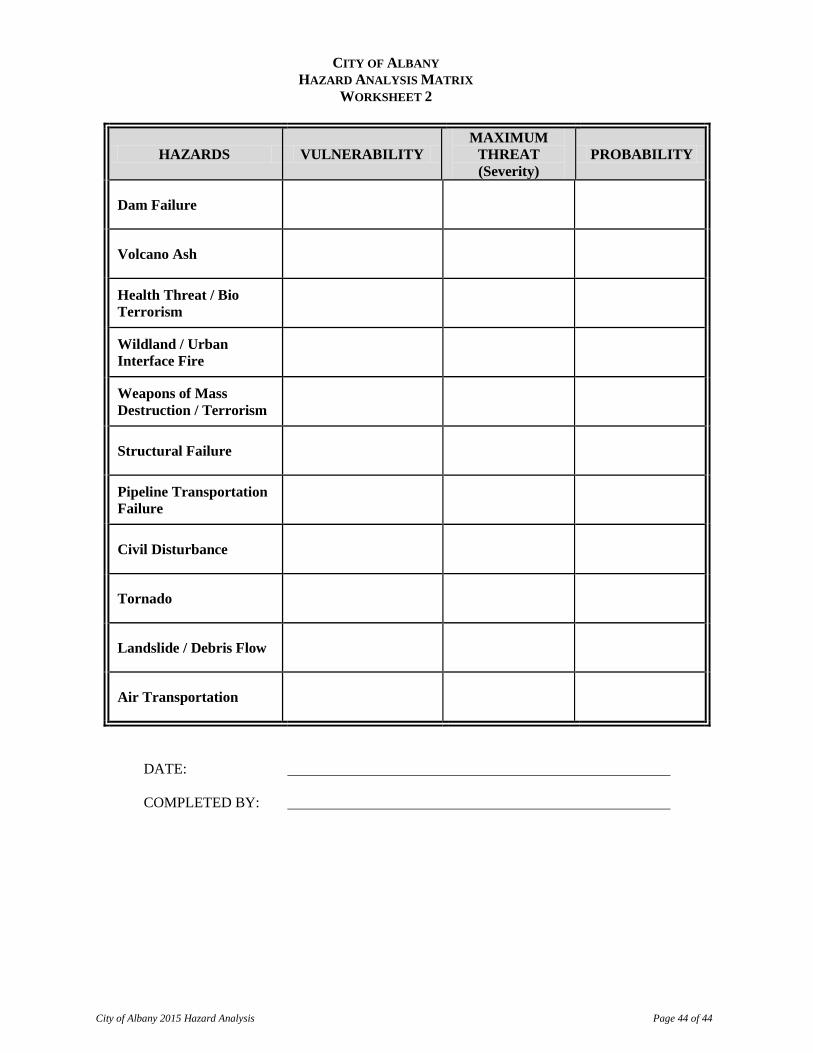
City of Albany 2015 Hazard Analysis Page 44 of 44
CITY OF ALBANY
HAZARD ANALYSIS MATRIX
WORKSHEET 2
HAZARDS VULNERABILITY
MAXIMUM
THREAT
(Severity)
PROBABILITY
Dam Failure
Volcano Ash
Health Threat / Bio
Terrorism
Wildland / Urban
Interface Fire
Weapons of Mass
Destruction / Terrorism
Structural Failure
Pipeline Transportation
Failure
Civil Disturbance
Tornado
Landslide / Debris Flow
Air Transportation
DATE:
COMPLETED BY: