Embed Size (px)
Citation preview
Russell Investments // Russell Indexes 2015 Global Guidebook Commentary
INDEX INSIGHTS
Russell Indexes 2015 Global Guidebook Commentary
By: Mat Lystra, Senior Research Analyst1 APRIL 2015
Key points:
The Russia-Ukraine crisis moved equity markets in 2014. With economic sanctions from the
West, the continued index eligibility of certain Russian stocks was threatened and heavy
pressure was placed on the Russian ruble.
Sharp declines in global oil prices in the second half of 2014 created a potential economic
boost to oil-importing countries and increased the potential for fiscal instability in oil-exporting
economies.
The approximately US$3T China A-share market is now partially accessible through three
foreign investment programs. Each program comes with a different set of rules, and investors
experience each program differently. As a result, the need exists for a customized set of
solutions to proxy an investor’s exposure to Mainland China equities.
This Russell Indexes Global Guidebook Commentary expands on global equity themes noted
during the creation of the Russell Indexes Global Guidebook. The guidebook, which is published
annually, provides reviews of approximately 90 countries under Russell Indexes’ country
classification methodology. A variety of statistics related to the sizes of their economies and equity
markets is included, as are measures of market accessibility to investors. In aggregate, much of
this information serves as the basis for Russell Indexes’ classification of countries as having
developed, emerging or frontier markets.
In this commentary we review a 2014 that saw instability in Ukraine draw neighboring Russia into
a proxy war over Western influence. The economic sanctions that followed have had ripple effects
across equity markets, and in a few cases, even among index constituents. Further escalating
Russia’s economic predicament was the falling price of oil, which negatively impacted the
economy of other large oil-exporting countries as well. Although low oil prices were a drag on oil-
supplying countries’ economies, many other nations’ economies were boosted as a result.
We also look at investors’ rapidly expanding options for accessing the China A-share market, and
how this might ultimately lead to China’s inclusion in a global equity index.
1 The author wishes to thank Layla Hirschfelt and Tom Goodwin for their editorial contributions; and a special thank you to Ben Van and Jackson Peng for their invaluable contributions to this research.
Russell Investments // Russell Indexes 2015 Global Guidebook Commentary / p 2
The Russia-Ukraine crisis
Ukraine was roiled by political unrest and violence in 2014, in Ukraine’s national identity struggle
between Russian and Western2 loyalties. Following Russia’s unilateral annexation of Ukraine’s
Crimean peninsula, and again after the downing of a commercial airliner in Ukrainian airspace,
Western countries led by the U.S and European Union (E.U.) enacted a series of economic
sanctions against Russia, which are detailed in Table 1 below. Some of these sanctions impacted
constituents of indexes maintained by Russell Indexes and FTSE, now both wholly-owned
subsidiaries of the London Stock Exchange Group. Index constituents impacted are shown in
Table 1.1.
Sanctions against Russia
The sanctions executed by the West in 2014 targeted the sectors most vital to Russia’s economy,
including oil and gas, defense and banking sectors (which are partially if not completely state
owned) and/or those linked to the crisis. Prohibitions included the financing of new debt, trading in
dual-use goods and technologies for defense companies, and supporting oil exploration and
production.
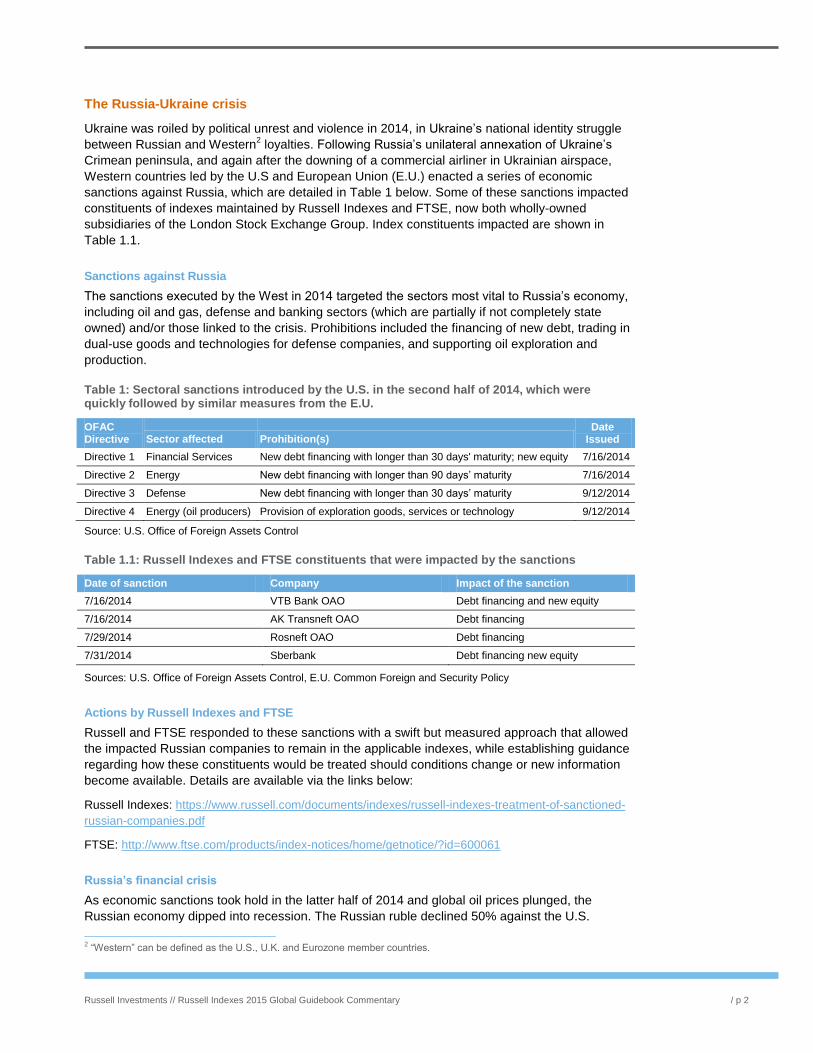
Table 1: Sectoral sanctions introduced by the U.S. in the second half of 2014, which were quickly followed by similar measures from the E.U.
OFAC Directive Sector affected Prohibition(s)
Date Issued
Directive 1 Financial Services New debt financing with longer than 30 days' maturity; new equity 7/16/2014
Directive 2 Energy New debt financing with longer than 90 days’ maturity 7/16/2014
Directive 3 Defense New debt financing with longer than 30 days’ maturity 9/12/2014
Directive 4 Energy (oil producers) Provision of exploration goods, services or technology 9/12/2014
Source: U.S. Office of Foreign Assets Control
Table 1.1: Russell Indexes and FTSE constituents that were impacted by the sanctions
Date of sanction Company Impact of the sanction
7/16/2014 VTB Bank OAO Debt financing and new equity
7/16/2014 AK Transneft OAO Debt financing
7/29/2014 Rosneft OAO Debt financing
7/31/2014 Sberbank Debt financing new equity
Sources: U.S. Office of Foreign Assets Control, E.U. Common Foreign and Security Policy
Actions by Russell Indexes and FTSE
Russell and FTSE responded to these sanctions with a swift but measured approach that allowed
the impacted Russian companies to remain in the applicable indexes, while establishing guidance
regarding how these constituents would be treated should conditions change or new information
become available. Details are available via the links below:
Russell Indexes: https://www.russell.com/documents/indexes/russell-indexes-treatment-of-sanctioned-
russian-companies.pdf
FTSE: http://www.ftse.com/products/index-notices/home/getnotice/?id=600061
Russia’s financial crisis
As economic sanctions took hold in the latter half of 2014 and global oil prices plunged, the
Russian economy dipped into recession. The Russian ruble declined 50% against the U.S.
2 “Western” can be defined as the U.S., U.K. and Eurozone member countries.
Russell Investments // Russell Indexes 2015 Global Guidebook Commentary / p 3
dollar, and the Russian Trading System (RTS) index, denominated in USD, saw an even
steeper decline, of 55%, during the same period. On December 15, the Bank of Russia raised
the country’s key interest rate from 10.5% to 17% in an attempt to slow the ruble’s decline, but
with little effect.
The collapse of the ruble has made foreign debt repayment significantly more expensive for
Russian companies issuing foreign currency–denominated debt. Russian banks currently owe
$170 billion in debt3, and in December 2014, research analysts at Capital Economics predicted
that the banks could suffer as much as $22 billion in losses.4 In addition, in January 2015,
Standard & Poor’s cut Russia’s sovereign debt rating to junk status.5
With Russian companies, including banks, restricted from access to Western capital markets,
the Bank of Russia has been left as the only means of borrowing dollars or euros to repay
foreign debt. This has placed added pressure on Russia’s already declining foreign currency
reserves, which fell from approximately $510 billion at the start of 2014 to $385 billion by year-
end. Through 2015, the country’s reserves continued declining at an average pace of $10 billion
per month. If this rate of decline were to continue, Russia’s currency reserves could become
critically low.6
The impact of Russia’s crisis has not been limited to Russian companies. A distressed Russian
economy has hit multinational companies as well, including Apple, Ikea and GM, which have
halted or suspended their sales in Russia.
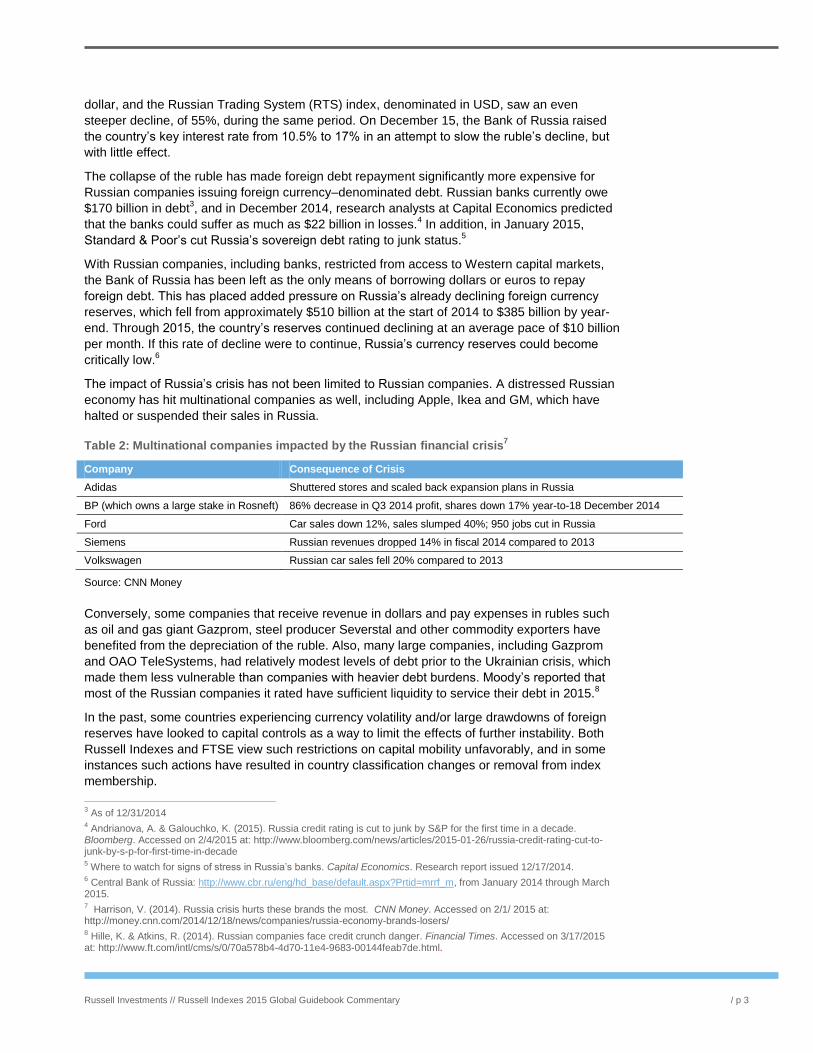
Table 2: Multinational companies impacted by the Russian financial crisis7
Company Consequence of Crisis
Adidas Shuttered stores and scaled back expansion plans in Russia
BP (which owns a large stake in Rosneft) 86% decrease in Q3 2014 profit, shares down 17% year-to-18 December 2014
Ford Car sales down 12%, sales slumped 40%; 950 jobs cut in Russia
Siemens Russian revenues dropped 14% in fiscal 2014 compared to 2013
Volkswagen Russian car sales fell 20% compared to 2013
Source: CNN Money
Conversely, some companies that receive revenue in dollars and pay expenses in rubles such
as oil and gas giant Gazprom, steel producer Severstal and other commodity exporters have
benefited from the depreciation of the ruble. Also, many large companies, including Gazprom
and OAO TeleSystems, had relatively modest levels of debt prior to the Ukrainian crisis, which
made them less vulnerable than companies with heavier debt burdens. Moody’s reported that
most of the Russian companies it rated have sufficient liquidity to service their debt in 2015.8
In the past, some countries experiencing currency volatility and/or large drawdowns of foreign
reserves have looked to capital controls as a way to limit the effects of further instability. Both
Russell Indexes and FTSE view such restrictions on capital mobility unfavorably, and in some
instances such actions have resulted in country classification changes or removal from index
membership.
3 As of 12/31/2014 4 Andrianova, A. & Galouchko, K. (2015). Russia credit rating is cut to junk by S&P for the first time in a decade. Bloomberg. Accessed on 2/4/2015 at: http://www.bloomberg.com/news/articles/2015-01-26/russia-credit-rating-cut-to-junk-by-s-p-for-first-time-in-decade 5 Where to watch for signs of stress in Russia’s banks. Capital Economics. Research report issued 12/17/2014. 6 Central Bank of Russia: http://www.cbr.ru/eng/hd_base/default.aspx?Prtid=mrrf_m, from January 2014 through March 2015. 7 Harrison, V. (2014). Russia crisis hurts these brands the most. CNN Money. Accessed on 2/1/ 2015 at: http://money.cnn.com/2014/12/18/news/companies/russia-economy-brands-losers/ 8 Hille, K. & Atkins, R. (2014). Russian companies face credit crunch danger. Financial Times. Accessed on 3/17/2015 at: http://www.ft.com/intl/cms/s/0/70a578b4-4d70-11e4-9683-00144feab7de.html.
Russell Investments // Russell Indexes 2015 Global Guidebook Commentary / p 4
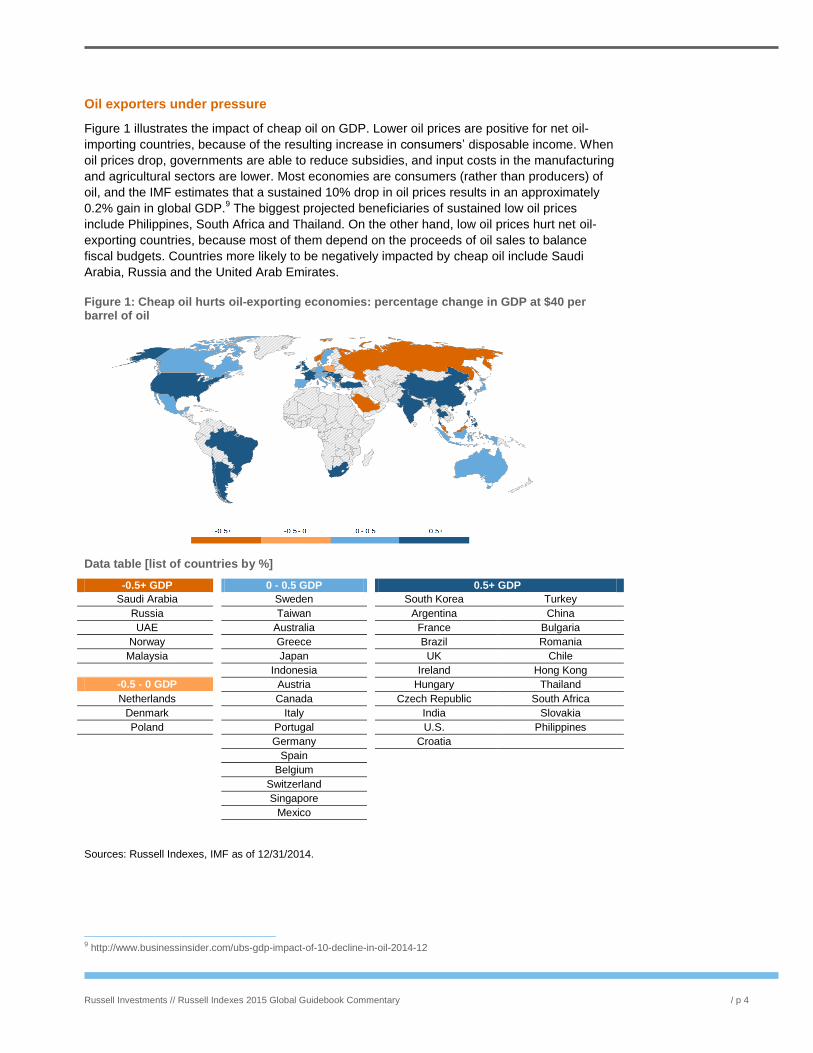
Oil exporters under pressure
Figure 1 illustrates the impact of cheap oil on GDP. Lower oil prices are positive for net oil-
importing countries, because of the resulting increase in consumers’ disposable income. When
oil prices drop, governments are able to reduce subsidies, and input costs in the manufacturing
and agricultural sectors are lower. Most economies are consumers (rather than producers) of
oil, and the IMF estimates that a sustained 10% drop in oil prices results in an approximately
0.2% gain in global GDP.9 The biggest projected beneficiaries of sustained low oil prices
include Philippines, South Africa and Thailand. On the other hand, low oil prices hurt net oil-
exporting countries, because most of them depend on the proceeds of oil sales to balance
fiscal budgets. Countries more likely to be negatively impacted by cheap oil include Saudi
Arabia, Russia and the United Arab Emirates.
Figure 1: Cheap oil hurts oil-exporting economies: percentage change in GDP at $40 per barrel of oil
Data table [list of countries by %]
-0.5+ GDP 0 - 0.5 GDP 0.5+ GDP
Saudi Arabia Sweden South Korea Turkey
Russia Taiwan Argentina China
UAE Australia France Bulgaria
Norway Greece Brazil Romania
Malaysia Japan UK Chile
Indonesia Ireland Hong Kong
-0.5 - 0 GDP Austria Hungary Thailand
Netherlands Canada Czech Republic South Africa
Denmark Italy India Slovakia
Poland Portugal U.S. Philippines
Germany Croatia
Spain
Belgium
Switzerland
Singapore
Mexico
Sources: Russell Indexes, IMF as of 12/31/2014.
9 http://www.businessinsider.com/ubs-gdp-impact-of-10-decline-in-oil-2014-12
Russell Investments // Russell Indexes 2015 Global Guidebook Commentary / p 5
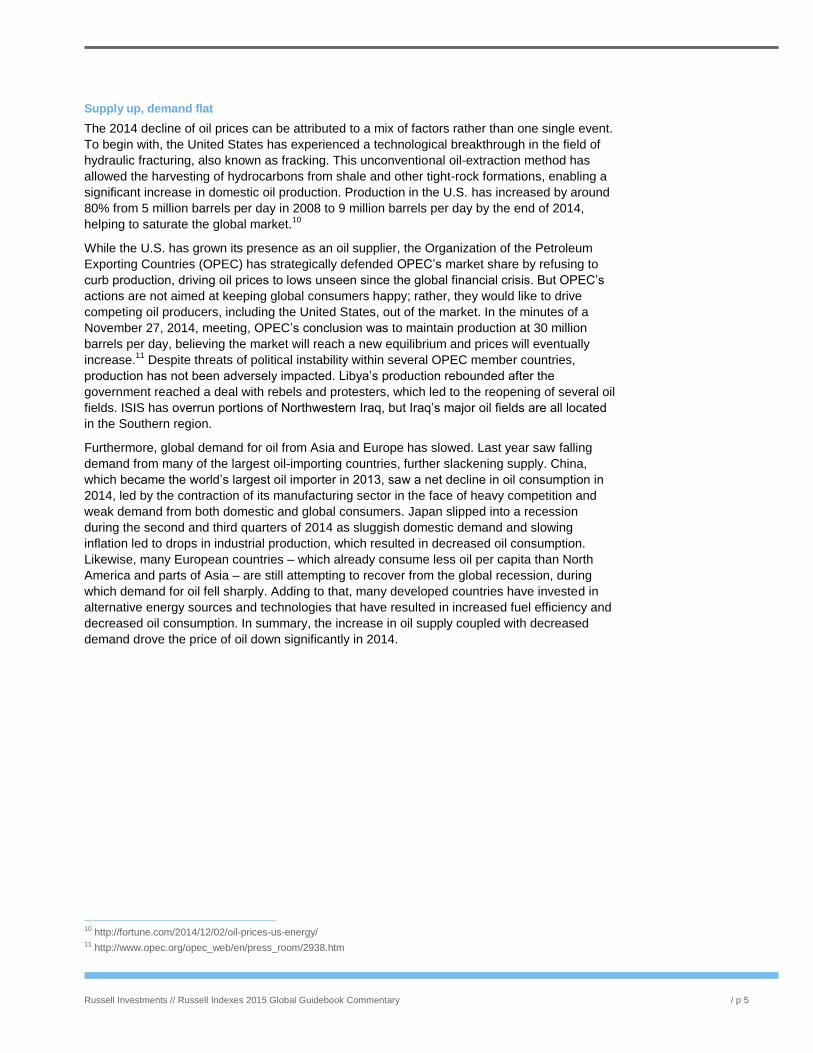
Supply up, demand flat
The 2014 decline of oil prices can be attributed to a mix of factors rather than one single event.
To begin with, the United States has experienced a technological breakthrough in the field of
hydraulic fracturing, also known as fracking. This unconventional oil-extraction method has
allowed the harvesting of hydrocarbons from shale and other tight-rock formations, enabling a
significant increase in domestic oil production. Production in the U.S. has increased by around
80% from 5 million barrels per day in 2008 to 9 million barrels per day by the end of 2014,
helping to saturate the global market.10
While the U.S. has grown its presence as an oil supplier, the Organization of the Petroleum
Exporting Countries (OPEC) has strategically defended OPEC’s market share by refusing to
curb production, driving oil prices to lows unseen since the global financial crisis. But OPEC’s
actions are not aimed at keeping global consumers happy; rather, they would like to drive
competing oil producers, including the United States, out of the market. In the minutes of a
November 27, 2014, meeting, OPEC’s conclusion was to maintain production at 30 million
barrels per day, believing the market will reach a new equilibrium and prices will eventually
increase.11
Despite threats of political instability within several OPEC member countries,
production has not been adversely impacted. Libya’s production rebounded after the
government reached a deal with rebels and protesters, which led to the reopening of several oil
fields. ISIS has overrun portions of Northwestern Iraq, but Iraq’s major oil fields are all located
in the Southern region.
Furthermore, global demand for oil from Asia and Europe has slowed. Last year saw falling
demand from many of the largest oil-importing countries, further slackening supply. China,
which became the world’s largest oil importer in 2013, saw a net decline in oil consumption in
2014, led by the contraction of its manufacturing sector in the face of heavy competition and
weak demand from both domestic and global consumers. Japan slipped into a recession
during the second and third quarters of 2014 as sluggish domestic demand and slowing
inflation led to drops in industrial production, which resulted in decreased oil consumption.
Likewise, many European countries – which already consume less oil per capita than North
America and parts of Asia – are still attempting to recover from the global recession, during
which demand for oil fell sharply. Adding to that, many developed countries have invested in
alternative energy sources and technologies that have resulted in increased fuel efficiency and
decreased oil consumption. In summary, the increase in oil supply coupled with decreased
demand drove the price of oil down significantly in 2014.
10 http://fortune.com/2014/12/02/oil-prices-us-energy/ 11 http://www.opec.org/opec_web/en/press_room/2938.htm
Russell Investments // Russell Indexes 2015 Global Guidebook Commentary / p 6
Impact of oil prices on the equity markets of China, Russia, OPEC nations and the United
States
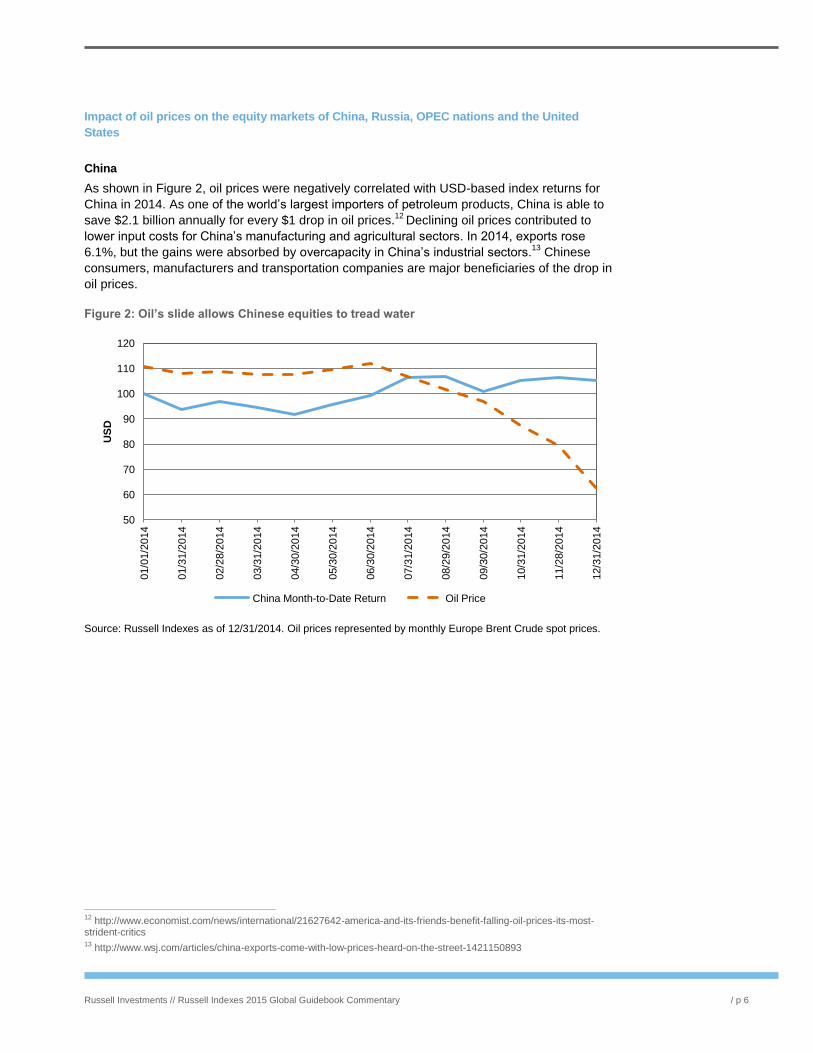
China
As shown in Figure 2, oil prices were negatively correlated with USD-based index returns for
China in 2014. As one of the world’s largest importers of petroleum products, China is able to
save $2.1 billion annually for every $1 drop in oil prices.12
Declining oil prices contributed to
lower input costs for China’s manufacturing and agricultural sectors. In 2014, exports rose
6.1%, but the gains were absorbed by overcapacity in China’s industrial sectors.13
Chinese
consumers, manufacturers and transportation companies are major beneficiaries of the drop in
oil prices.
Figure 2: Oil’s slide allows Chinese equities to tread water
Source: Russell Indexes as of 12/31/2014. Oil prices represented by monthly Europe Brent Crude spot prices.
12 http://www.economist.com/news/international/21627642-america-and-its-friends-benefit-falling-oil-prices-its-most-strident-critics 13 http://www.wsj.com/articles/china-exports-come-with-low-prices-heard-on-the-street-1421150893
50
60
70
80
90
100
110
120
01/0
1/2
014
01/3
1/2
014
02/2
8/2
014
03/3
1/2
014
04/3
0/2
014
05/3
0/2
014
06/3
0/2
014
07/3
1/2
014
08/2
9/2
014
09/3
0/2
014
10/3
1/2
014
11/2
8/2
014
12/3
1/2
014
US
D
China Month-to-Date Return Oil Price
Russell Investments // Russell Indexes 2015 Global Guidebook Commentary / p 7
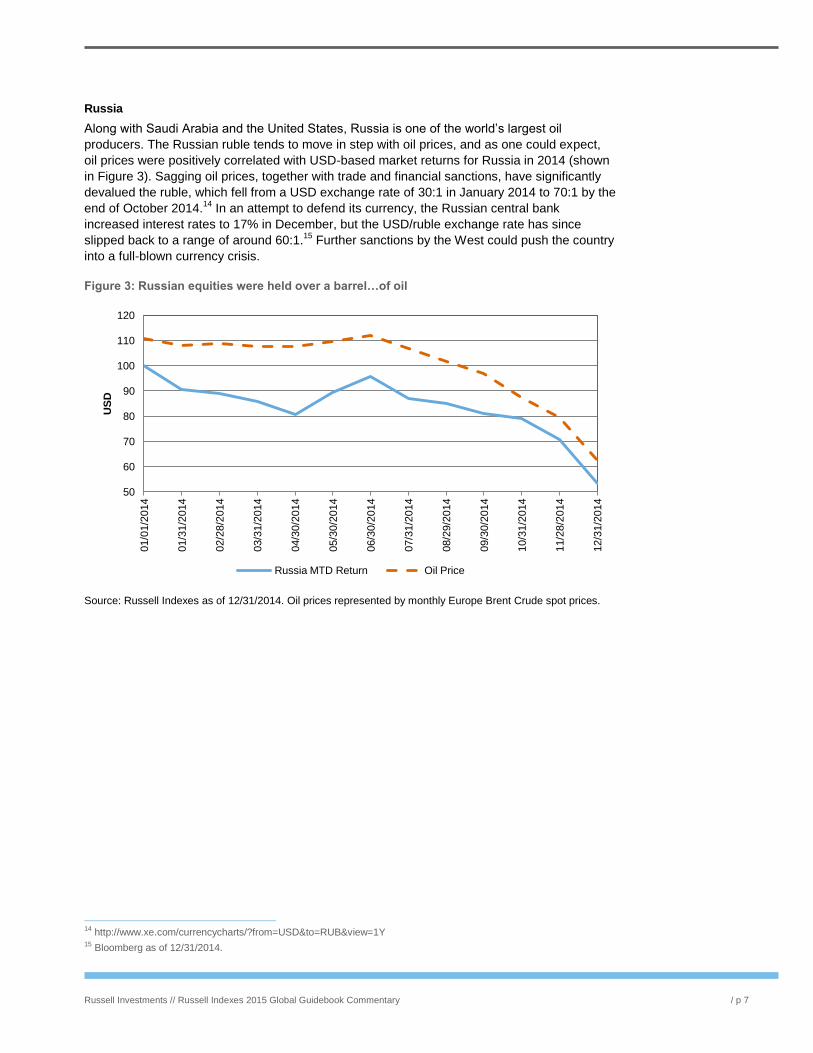
Russia
Along with Saudi Arabia and the United States, Russia is one of the world’s largest oil
producers. The Russian ruble tends to move in step with oil prices, and as one could expect,
oil prices were positively correlated with USD-based market returns for Russia in 2014 (shown
in Figure 3). Sagging oil prices, together with trade and financial sanctions, have significantly
devalued the ruble, which fell from a USD exchange rate of 30:1 in January 2014 to 70:1 by the
end of October 2014.14
In an attempt to defend its currency, the Russian central bank
increased interest rates to 17% in December, but the USD/ruble exchange rate has since
slipped back to a range of around 60:1.15
Further sanctions by the West could push the country
into a full-blown currency crisis.
Figure 3: Russian equities were held over a barrel…of oil
Source: Russell Indexes as of 12/31/2014. Oil prices represented by monthly Europe Brent Crude spot prices.
14 http://www.xe.com/currencycharts/?from=USD&to=RUB&view=1Y 15 Bloomberg as of 12/31/2014.
50
60
70
80
90
100
110
120
01/0
1/2
014
01/3
1/2
014
02/2
8/2
014
03/3
1/2
014
04/3
0/2
014
05/3
0/2
014
06/3
0/2
014
07/3
1/2
014
08/2
9/2
014
09/3
0/2
014
10/3
1/2
014
11/2
8/2
014
12/3
1/2
014
US
D
Russia MTD Return Oil Price
Russell Investments // Russell Indexes 2015 Global Guidebook Commentary / p 8
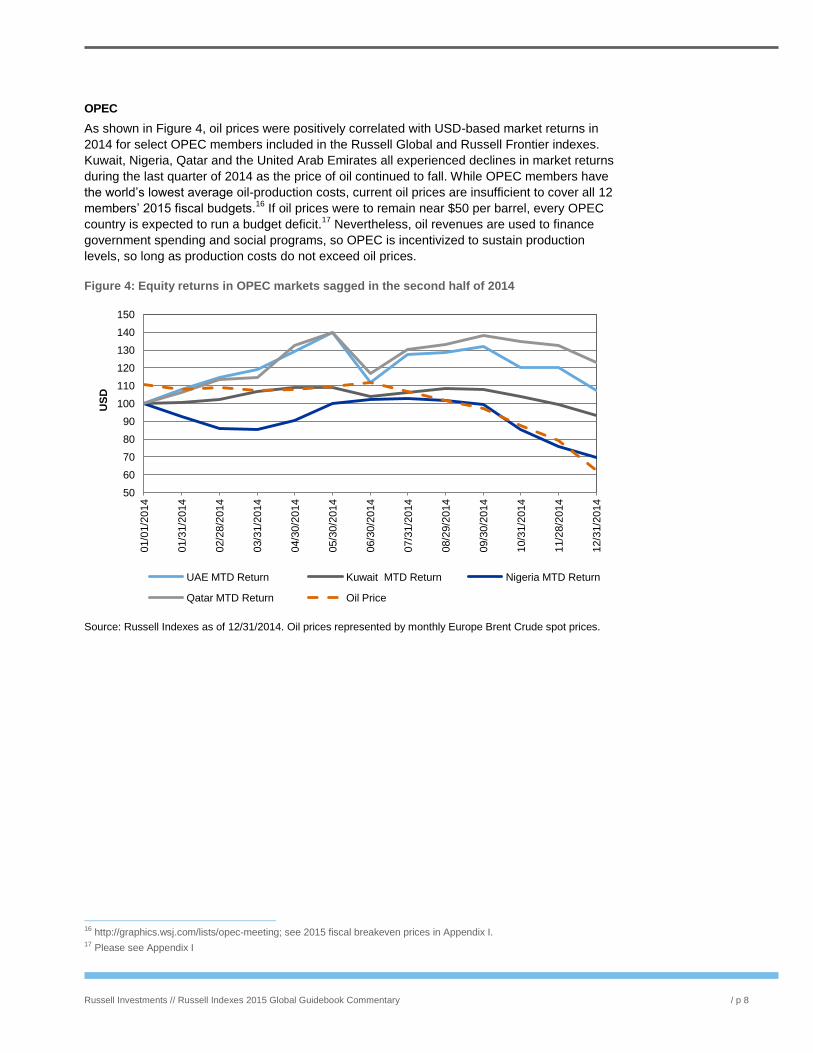
OPEC
As shown in Figure 4, oil prices were positively correlated with USD-based market returns in
2014 for select OPEC members included in the Russell Global and Russell Frontier indexes.
Kuwait, Nigeria, Qatar and the United Arab Emirates all experienced declines in market returns
during the last quarter of 2014 as the price of oil continued to fall. While OPEC members have
the world’s lowest average oil-production costs, current oil prices are insufficient to cover all 12
members’ 2015 fiscal budgets.16
If oil prices were to remain near $50 per barrel, every OPEC
country is expected to run a budget deficit.17
Nevertheless, oil revenues are used to finance
government spending and social programs, so OPEC is incentivized to sustain production
levels, so long as production costs do not exceed oil prices.
Figure 4: Equity returns in OPEC markets sagged in the second half of 2014
Source: Russell Indexes as of 12/31/2014. Oil prices represented by monthly Europe Brent Crude spot prices.
16 http://graphics.wsj.com/lists/opec-meeting; see 2015 fiscal breakeven prices in Appendix I. 17 Please see Appendix I
50
60
70
80
90
100
110
120
130
140
150
01/0
1/2
014
01/3
1/2
014
02/2
8/2
014
03/3
1/2
014
04/3
0/2
014
05/3
0/2
014
06/3
0/2
014
07/3
1/2
014
08/2
9/2
014
09/3
0/2
014
10/3
1/2
014
11/2
8/2
014
12/3
1/2
014
US
D
UAE MTD Return Kuwait MTD Return Nigeria MTD Return
Qatar MTD Return Oil Price
Russell Investments // Russell Indexes 2015 Global Guidebook Commentary / p 9
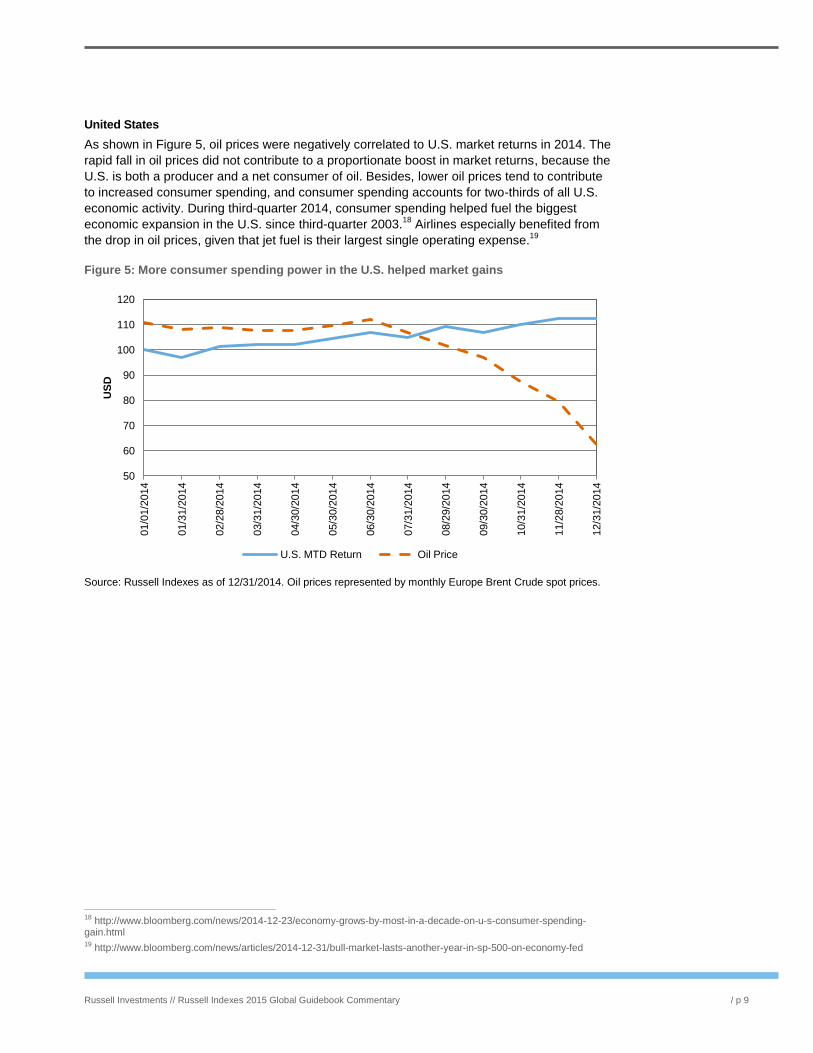
United States
As shown in Figure 5, oil prices were negatively correlated to U.S. market returns in 2014. The
rapid fall in oil prices did not contribute to a proportionate boost in market returns, because the
U.S. is both a producer and a net consumer of oil. Besides, lower oil prices tend to contribute
to increased consumer spending, and consumer spending accounts for two-thirds of all U.S.
economic activity. During third-quarter 2014, consumer spending helped fuel the biggest
economic expansion in the U.S. since third-quarter 2003.18
Airlines especially benefited from
the drop in oil prices, given that jet fuel is their largest single operating expense.19
Figure 5: More consumer spending power in the U.S. helped market gains
Source: Russell Indexes as of 12/31/2014. Oil prices represented by monthly Europe Brent Crude spot prices.
18 http://www.bloomberg.com/news/2014-12-23/economy-grows-by-most-in-a-decade-on-u-s-consumer-spending-gain.html 19 http://www.bloomberg.com/news/articles/2014-12-31/bull-market-lasts-another-year-in-sp-500-on-economy-fed
50
60
70
80
90
100
110
120
01/0
1/2
014
01/3
1/2
014
02/2
8/2
014
03/3
1/2
014
04/3
0/2
014
05/3
0/2
014
06/3
0/2
014
07/3
1/2
014
08/2
9/2
014
09/3
0/2
014
10/3
1/2
014
11/2
8/2
014
12/3
1/2
014
US
D
U.S. MTD Return Oil Price
Russell Investments // Russell Indexes 2015 Global Guidebook Commentary / p 10
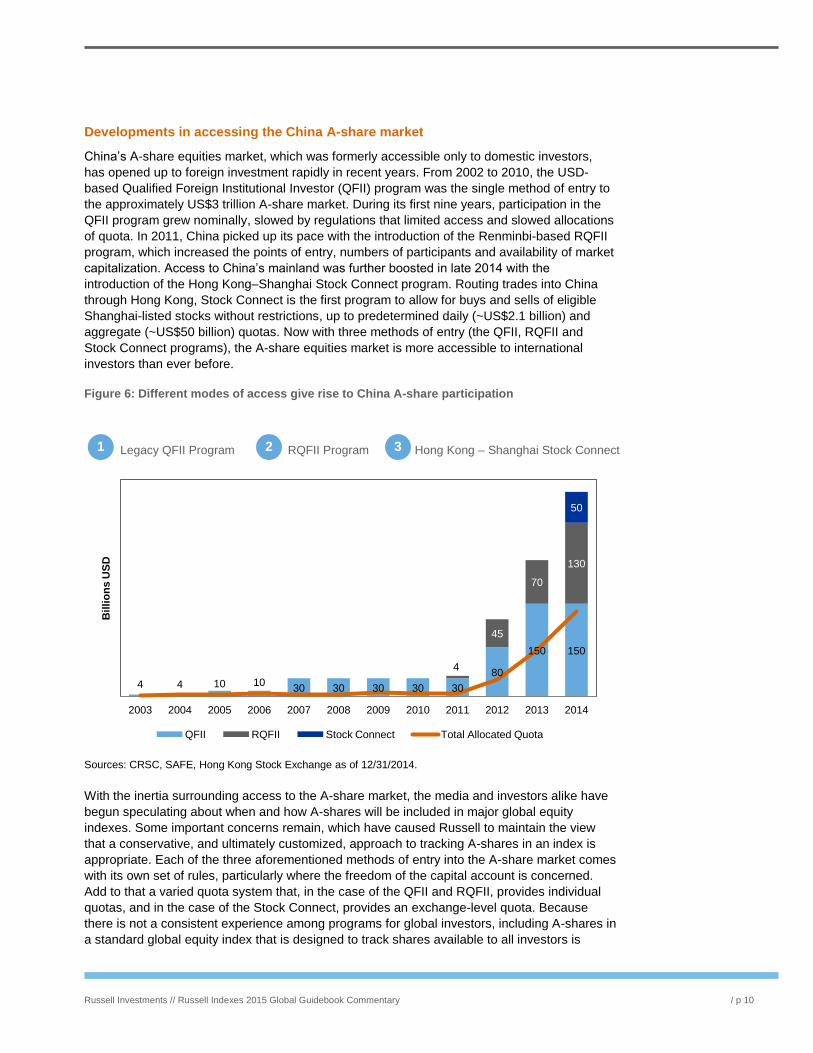
Developments in accessing the China A-share market
China’s A-share equities market, which was formerly accessible only to domestic investors,
has opened up to foreign investment rapidly in recent years. From 2002 to 2010, the USD-
based Qualified Foreign Institutional Investor (QFII) program was the single method of entry to
the approximately US$3 trillion A-share market. During its first nine years, participation in the
QFII program grew nominally, slowed by regulations that limited access and slowed allocations
of quota. In 2011, China picked up its pace with the introduction of the Renminbi-based RQFII
program, which increased the points of entry, numbers of participants and availability of market
capitalization. Access to China’s mainland was further boosted in late 2014 with the
introduction of the Hong Kong–Shanghai Stock Connect program. Routing trades into China
through Hong Kong, Stock Connect is the first program to allow for buys and sells of eligible
Shanghai-listed stocks without restrictions, up to predetermined daily (~US$2.1 billion) and
aggregate (~US$50 billion) quotas. Now with three methods of entry (the QFII, RQFII and
Stock Connect programs), the A-share equities market is more accessible to international
investors than ever before.
Figure 6: Different modes of access give rise to China A-share participation
Legacy QFII Program RQFII Program Hong Kong – Shanghai Stock Connect
Sources: CRSC, SAFE, Hong Kong Stock Exchange as of 12/31/2014.
With the inertia surrounding access to the A-share market, the media and investors alike have
begun speculating about when and how A-shares will be included in major global equity
indexes. Some important concerns remain, which have caused Russell to maintain the view
that a conservative, and ultimately customized, approach to tracking A-shares in an index is
appropriate. Each of the three aforementioned methods of entry into the A-share market comes
with its own set of rules, particularly where the freedom of the capital account is concerned.
Add to that a varied quota system that, in the case of the QFII and RQFII, provides individual
quotas, and in the case of the Stock Connect, provides an exchange-level quota. Because
there is not a consistent experience among programs for global investors, including A-shares in
a standard global equity index that is designed to track shares available to all investors is
4 4 10 10 30 30 30 30 30
80
150 150
4
45
70
130
50
2003 2004 2005 2006 2007 2008 2009 2010 2011 2012 2013 2014
Bil
lio
ns
US
D
QFII RQFII Stock Connect Total Allocated Quota
1 2 3
Russell Investments // Russell Indexes 2015 Global Guidebook Commentary / p 11
challenging. Accordingly, there is a need to create customized index options, in order to
represent the different investor experiences when A-shares are added to global equity
portfolios.20
Russell Indexes has not historically maintained a stand-alone China A-share index, but FTSE
offers a full suite of China A-share indices that serve as the basis for some of the largest A-
share-linked ETFs in the world.21
FTSE offers three different approaches to replicating an A-
share exposure within a global equity or emerging markets equity portfolio:
1. A full free-floated A-share representation with stocks weighted up to the 30%
foreign ownership limit
2. A quota-based weighting of the A-share market based on the available total
across the QFII, RQFII and Stock Connect programs
3. A quota-based weighting using a client’s individually allocated quota
These customized options allow clients choose their A-Share allocation, and in line with their
own target weights for China.
Ultimately, we believe global index providers will take a similarly gradual approach to adding A-
shares to standard equity benchmarks. If the A-share market were added to the standard
equity index today, even after being adjusted for free-float and foreign ownership limits, FTSE
estimates that China’s weight within FTSE’s emerging markets index would jump from ~22% to
~34%!22
The magnitude of such a change could not be implemented over a single rebalance;
rather, it would require a phase-in approach applied over time. Because of the large shifts in
index weight that full inclusion of A-shares would create, an allocation based on the
outstanding QFII, RQFII and Stock Connect quota may more closely approximate the path of
incremental uptake of A-shares that index providers are likely to follow. FTSE estimates that
including A-shares by the allocated quota would increase China’s weight to a more achievable
~24% (from 22%). Finding the right balance in when and how to add A-shares will be one of
the most high-profile, high-impact decisions index providers and their clients make in the
coming years.
20 For more details on each program and FTSE’s approach to the China A-share market, please visit: http://www.ftse.com/products/downloads/Preparing_for_Chinas_Inclusion_in_Global_Benchmarks.pdf 21 For more details on FTSE’s China indices please visit: http://www.ftse.com/products/indices/china 22 Estimates provided in: http://www.ftse.com/products/downloads/Preparing_for_Chinas_Inclusion_in_Global_Benchmarks.pdf
Russell Investments // Russell Indexes 2015 Global Guidebook Commentary / p 12
Conclusions
The Global Guidebook serves as a dashboard of sorts for countries around the world –
assessing market size, liquidity, macroeconomic stability and trading environment. The Russia-
Ukraine crisis threatened the regional stability of Eastern Europe in 2014. And as their effects
continue into 2015, Western sanctions may further isolate the Russian equity market and
continue to pressure Russia’s currency. Adding to these geopolitical concerns is the potential
impact of lower oil prices on large oil-exporting economies, such as Russia, Saudi Arabia and
the United Arab Emirates. Yet if the price of oil remains low, oil-importing countries and end
consumers stand to benefit.
One such beneficiary may be China, a major oil importer that is also seeking to import more
foreign asset inflows via its domestic A-share equity market. Following the introduction of the
Hong Kong–Shanghai Stock Connect program in November 2014, China now has three foreign
investment programs that could allow foreigners to collectively own up to 10% of the A-share
market. China appears committed to reaching a level of market openness that will allow the A-
share market to be included in standard global equity benchmarks, but how and when that will
happen in still uncertain.
In the current environment, FTSE’s customizable approach to the A-share market can
accommodate investors’ needs, regardless of which path to A-share allocation they choose.
Russell Investments // Russell Indexes 2015 Global Guidebook Commentary / p 13
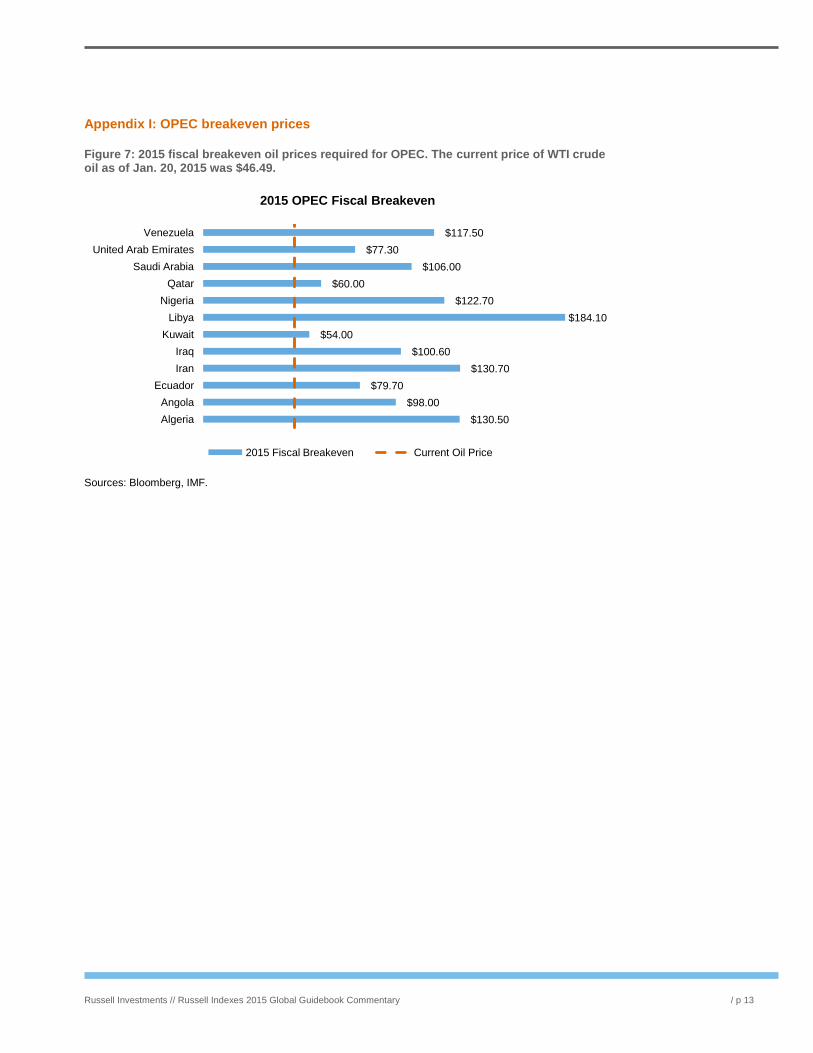
Appendix I: OPEC breakeven prices
Figure 7: 2015 fiscal breakeven oil prices required for OPEC. The current price of WTI crude oil as of Jan. 20, 2015 was $46.49.
Sources: Bloomberg, IMF.
$130.50
$98.00
$79.70
$130.70
$100.60
$54.00
$184.10
$122.70
$60.00
$106.00
$77.30
$117.50
Algeria
Angola
Ecuador
Iran
Iraq
Kuwait
Libya
Nigeria
Qatar
Saudi Arabia
United Arab Emirates
Venezuela
2015 OPEC Fiscal Breakeven
2015 Fiscal Breakeven Current Oil Price
Russell Investments // Russell Indexes 2015 Global Guidebook Commentary / p 14
About Russell Indexes
Russell’s indexes business, which began in 1984, accurately measures U.S. market segments
and tracks investment manager behavior for Russell’s investment management and consulting
businesses. Today, our series of U.S. and global equity indexes reflect distinct investment
universes – asset class, geographic region, capitalization and style – with no gaps or overlaps.
Russell Indexes offers more than three dozen product families and calculates more than
700,000 benchmarks daily, covering 98% of the investable market globally, 81 countries and
more than 10,000 securities. As of December 31, 2014, approximately $5.7 trillion in assets are
benchmarked to the Russell Indexes.
For more information about Russell Indexes, call us or visit www.russell.com/indexes.
Americas: +1-877-503-6437; APAC: +65-6880-5003; EMEA: +44-0-20-7024-6600
Disclosures
Russell Investments is a trade name and registered trademark of Frank Russell Company, a Washington USA
corporation, which operates through subsidiaries worldwide and is part of London Stock Exchange Group.
Russell Investments is the owner of the trademarks, service marks and copyrights related to its
respective indexes.
Indexes are unmanaged and cannot be invested in directly. Returns represent past performance, are not a
guarantee of future performance and are not indicative of any specific investment.
This material is proprietary and may not be reproduced, transferred or distributed in any form without prior written
permission from Russell Investments. It is delivered on an “as is” basis without warranty.
This is not an offer, solicitation or recommendation to purchase any security or the services of any organization.
Copyright © Russell Investments 2015. All rights reserved. First use: April 2015.
CORP-10357-04-2016E