Embed Size (px)
Citation preview
2015 FAST+ Evaluation: Year-End Report
November 15, 2015
Shira Solomon, PhD
This report was funded by a 21st Century Community Learning Center grant (award #155412) from the Maryland State Department of Education. Questions about the report may be directed to the author: [email protected] Nondiscrimination Statement: Title IX of the Educational Amendments of 1972 prohibits discrimination on the basis of gender in educational programs or activities receiving federal funds and requires equal opportunity in admissions, athletics, counseling, access to courses, and employment policies regarding marital or parental status of students and treatment of students. All students and employees are covered by this law. Questions or concerns about the application of Title IX should be directed to the FCPS Legal Services Office.
Page 3
Summer 2015 FAST+ Year-End Evaluation Report to FCPS
Contents
Executive Summary ........................................................................................................ 5
Program Description Context .......................................................................................................................... 6 Setting ............................................................................................................................ 7 Performance Measures ........................................................................................... 9 Outcomes ................................................................................................................... 12
Methods Quantitative Methods ........................................................................................... 14 Qualitative Methods .............................................................................................. 15
Outcomes Academic Progress ................................................................................................ 17 Student Engagement ............................................................................................. 21 Family Engagement ............................................................................................... 25 Community Engagement ..................................................................................... 28 Program Quality ..................................................................................................... 28
Conclusion Accomplishments ................................................................................................... 34 Considerations ........................................................................................................ 35 Recommendations ................................................................................................. 36
Appendices Appendix A. Student Survey Results .............................................................. 37 Appendix B. Teacher Survey Results ............................................................. 38 Appendix C. Staff Survey Results ..................................................................... 39 Appendix D. Family Survey Content ............................................................... 40 Appendix E. Focus Group Protocols ............................................................... 41
Page 4
Summer 2015 FAST+ Year-End Evaluation Report to FCPS
Tables & Figures
List of Tables Table 1. Objectives Accomplished ...................................................................... 5 Table 2. Outcomes, Variables & Program Quality Indicators ............... 13 Table 3. FHS Participation by Student Group ............................................. 17 Table 4. FHS Reading Scores by ELL, Special Education
& Low-Income Status ............................................................................ 19 Table 5. WFMS Reading & Math Scores by Grade Level, ELL
& Special Education Status ................................................................. 20 Table 6. Student Satisfaction with Core Program Components .......... 22 Table 7. Changing Student Attitudes .............................................................. 23 Table 8. Outlook toward the High School Transition .............................. 24 Table 9. Teacher Views of Family Outcomes .............................................. 27 Table 10. Student Views of Family Involvement ....................................... 27 Table 11. Quality of Classroom Environment & Instruction ................ 29 Table 12. Teacher Views of Planning, Preparation
& Implementation .................................................................................. 29 Table 13. Teacher Views of Student Outcomes ......................................... 31 Table 14. CBO Partner Views of Their Contribution to
Student Outcomes .................................................................................. 32 Table 15. CBO Partner Views of Program Integration ............................ 33 Table 16. Evidence of Objectives Accomplished ....................................... 34
List of Figures Figure 1. Rising Ninth Graders’ Reading Levels, Spring 2015 ................ 8 Figure 2. Above or High Average Middle School Achievement
Levels, Spring 2015 .................................................................................. 8 Figure 3. Logic Model ........................................................................................... 12 Figure 4. Relationship of Reading Assessment Scores
& Course Content Mastery .................................................................. 18 Figure 5. WFMS Participation by Grade Level, Special Education
& ELL Status ............................................................................................. 19 Figure 6. WFMS Summer Attendance & Missing Assessments ........... 21 Figure 7. Student Satisfaction with Program Experience ...................... 21 Figure 8. Enduring Student Interest in Enrichment Activities ............ 25
Page 5
Summer 2015 FAST+ Year-End Evaluation Report to FCPS
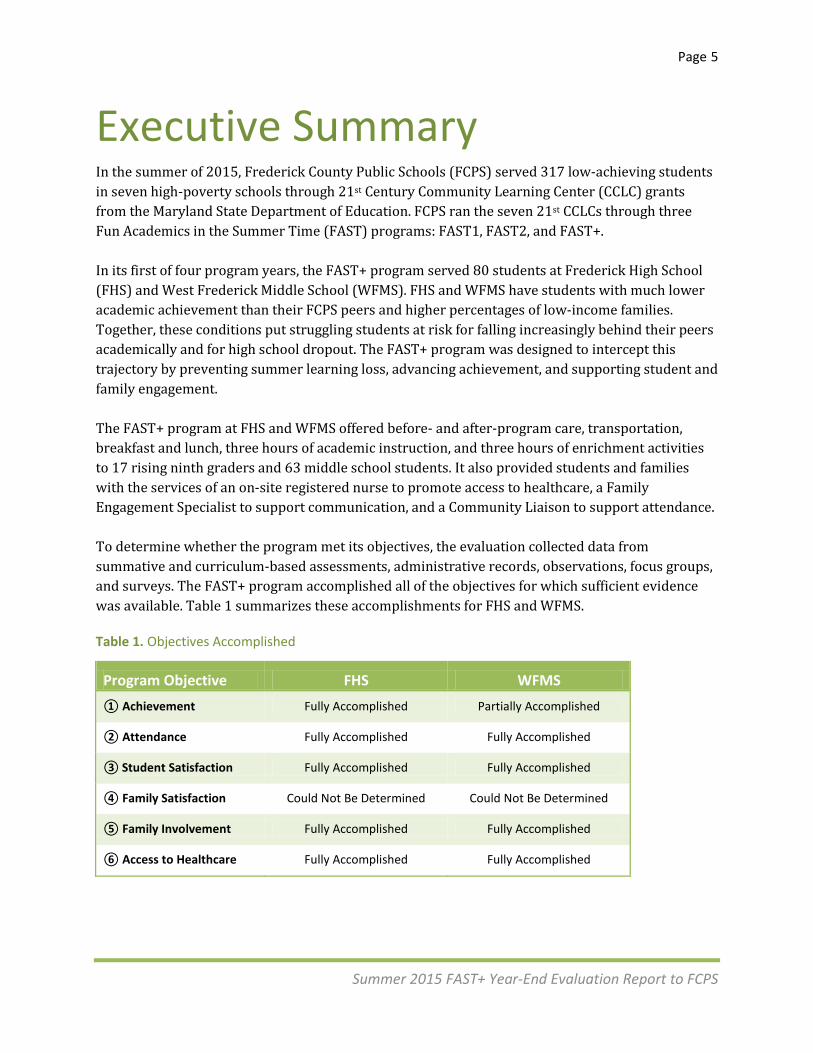
Executive Summary In the summer of 2015, Frederick County Public Schools (FCPS) served 317 low-achieving students in seven high-poverty schools through 21st Century Community Learning Center (CCLC) grants from the Maryland State Department of Education. FCPS ran the seven 21st CCLCs through three Fun Academics in the Summer Time (FAST) programs: FAST1, FAST2, and FAST+. In its first of four program years, the FAST+ program served 80 students at Frederick High School (FHS) and West Frederick Middle School (WFMS). FHS and WFMS have students with much lower academic achievement than their FCPS peers and higher percentages of low-income families. Together, these conditions put struggling students at risk for falling increasingly behind their peers academically and for high school dropout. The FAST+ program was designed to intercept this trajectory by preventing summer learning loss, advancing achievement, and supporting student and family engagement. The FAST+ program at FHS and WFMS offered before- and after-program care, transportation, breakfast and lunch, three hours of academic instruction, and three hours of enrichment activities to 17 rising ninth graders and 63 middle school students. It also provided students and families with the services of an on-site registered nurse to promote access to healthcare, a Family Engagement Specialist to support communication, and a Community Liaison to support attendance. To determine whether the program met its objectives, the evaluation collected data from summative and curriculum-based assessments, administrative records, observations, focus groups, and surveys. The FAST+ program accomplished all of the objectives for which sufficient evidence was available. Table 1 summarizes these accomplishments for FHS and WFMS.
Table 1. Objectives Accomplished
Program Objective FHS WFMS ① Achievement Fully Accomplished Partially Accomplished
② Attendance Fully Accomplished Fully Accomplished
③ Student Satisfaction Fully Accomplished Fully Accomplished
④ Family Satisfaction Could Not Be Determined Could Not Be Determined
⑤ Family Involvement Fully Accomplished Fully Accomplished
⑥ Access to Healthcare Fully Accomplished Fully Accomplished
Page 6
Summer 2015 FAST+ Year-End Evaluation Report to FCPS
Program Description Context Frederick County Public Schools (FCPS) offers an array of out-of-school-time programs for students and families who need extra support. Since 2003, FCPS has served low-achieving students in high-poverty schools through a series of 21st Century Community Learning Center grants funded by the Maryland State Department of Education. In the summer of 2015, FCPS used three such grants to administer the Fun Academics in the Summer Time (FAST) program. Together, the FAST1, FAST2, and FAST+ programs provided academic support and enrichment to seven schools clustered by feeder pattern.1 The FAST1 program ran for eight weeks (June 22 through August 13); FAST2 and FAST+ ran for five weeks (June 29 through July 30). Three hours per day of academic instruction were provided by highly qualified FCPS teachers; three hours per day of enrichment was provided by community-based organizations (CBOs). The core academic and enrichment activities occurred between 9:00 A.M. and 4:30 P.M. and the program sites were open to students between 6:30 A.M. and 6:00 P.M. Breakfast and lunch were served free of charge to all participating students through the U.S. Department of Agriculture’s Summer Food Services Program. All FAST programs had a four-day week structure and an extended day schedule. Mondays through Thursdays, students could arrive at the Early Risers Club as early as 6:30 A.M., where they would be supervised by Boys & Girls Club staff members. At 8:30 A.M., FCPS buses dropped students off, and breakfast was served to all students. Between 9:00 A.M. and 12:15 P.M., students had two blocks of academic instruction, followed by lunch.2 From 1:15 to 4:30 P.M., students had two blocks of enrichment activities led by the following CBOs: FC Frederick (soccer), YMCA sports/fitness and performing arts, FCPS Environmental Club, Maryland Science Olympiad, and Young Rembrandts (visual arts). Boys & Girls Club staff members supervised breakfast, lunch, all transitions between activities, and the After the Bell Club, which was available from 4:30 until 6:00 P.M. Consistent with 21st Century Community Learning Center guidance and best practices for out-of-school-time learning, FCPS developed its FAST programs to reflect the unique needs of its target populations. Specifically, FAST schools have greater concentrations of low-income families and families who do not speak English fluently. These circumstances may create hardships in meeting basic needs such as food, medical care, and transportation, and may inhibit families’ involvement in their child’s education. 1 FAST1: Monocacy Elementary School, Monocacy Middle School FAST2: Hillcrest Elementary School, Lincoln Elementary School, Waverly Elementary Schools FAST+: West Frederick Middle School, Frederick High School 2 One center implemented three, one-hour instructional periods instead of two, one-and-a-half hour blocks in order to include a STEM laboratory class.
Page 7
Summer 2015 FAST+ Year-End Evaluation Report to FCPS
To address these needs, each FAST program made available a nurse, a Family Engagement Specialist, and a Community Liaison to better serve FAST students and their families. In addition to administering medications and first aid, nurses reached out to families to ensure access to healthcare and to promote health education. Family Engagement Specialists facilitated communication between teachers and families and supported family involvement. Community Liaisons supported registration, transportation, and attendance. Both Family Engagement Specialists and Community Liaisons participated in the Family Advisory Council, supported communication between school and home, and helped plan special events for families. All participating FAST schools employed curriculum strategies that would complement, rather than repeat, those in use during the regular school year. Curriculum materials were selected by the principal at each school, with the assistance of school and district specialists. Some of these strategies facilitated direct remediation and performance acceleration by covering the same material students struggled with during the school year. Other strategies were indirect, focusing on content that was related to the core academic performance measures but also substantively distinct. For example, some schools used a writing curriculum as a complementary approach to improving reading performance.
Setting The summer of 2015 marked the first of three program years for the FAST+ program, which served rising sixth through ninth grade students. Although the 21st CCLCs at West Frederick Middle School (WFMS) and Frederick High School (FHS) are different in many ways, they are united by a feeder pattern and a physical campus. FHS draws from WFMS in its entirety and partially from one other middle school. The FHS center targeted exiting WFMS students who would be transitioning to the high school in the fall of 2015, while the WFMS program selected students who would be entering grades 6, 7, and 8. 3 Because the two schools are adjacent, the incoming FHS students spent the academic portion of their day at the high school and had meals and enrichment activities at the middle school. The FHS and WFMS achievement profiles that follow compare Global Scholar (GS)4 performance bands with district averages.
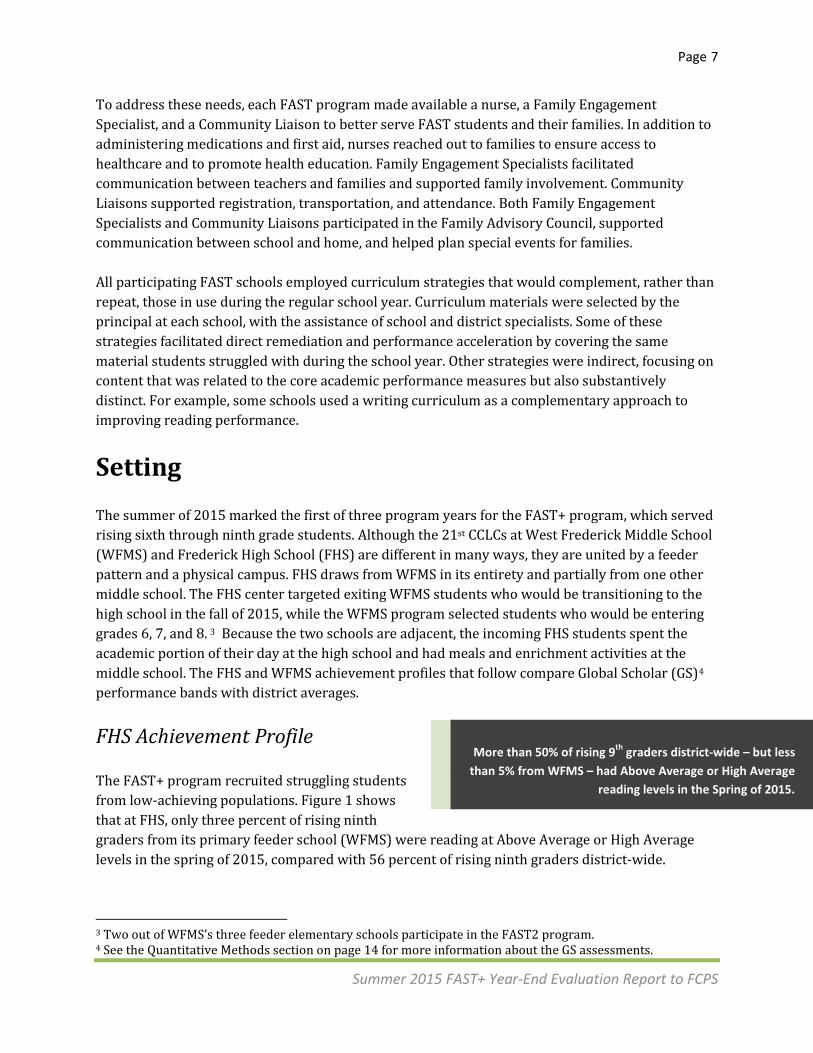
FHS Achievement Profile The FAST+ program recruited struggling students from low-achieving populations. Figure 1 shows that at FHS, only three percent of rising ninth graders from its primary feeder school (WFMS) were reading at Above Average or High Average levels in the spring of 2015, compared with 56 percent of rising ninth graders district-wide. 3 Two out of WFMS’s three feeder elementary schools participate in the FAST2 program. 4 See the Quantitative Methods section on page 14 for more information about the GS assessments.
More than 50% of rising 9th graders district-wide – but less than 5% from WFMS – had Above Average or High Average
reading levels in the Spring of 2015.
Page 8
Summer 2015 FAST+ Year-End Evaluation Report to FCPS
Figure 1. Rising Ninth Graders’ Reading Levels, Spring 2015
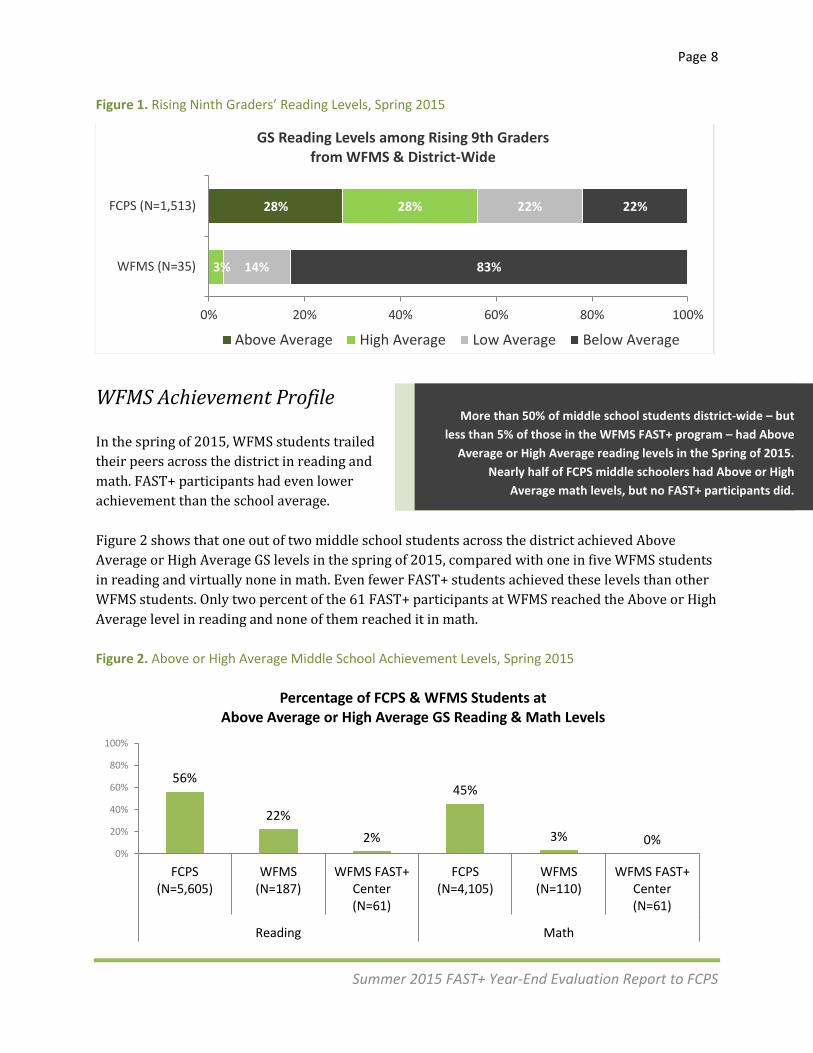
WFMS Achievement Profile In the spring of 2015, WFMS students trailed their peers across the district in reading and math. FAST+ participants had even lower achievement than the school average. Figure 2 shows that one out of two middle school students across the district achieved Above Average or High Average GS levels in the spring of 2015, compared with one in five WFMS students in reading and virtually none in math. Even fewer FAST+ students achieved these levels than other WFMS students. Only two percent of the 61 FAST+ participants at WFMS reached the Above or High Average level in reading and none of them reached it in math. Figure 2. Above or High Average Middle School Achievement Levels, Spring 2015
28%
3%
28%
14%
22%
83%
22%
0% 20% 40% 60% 80% 100%
WFMS (N=35)
FCPS (N=1,513)
GS Reading Levels among Rising 9th Graders from WFMS & District-Wide
Above Average High Average Low Average Below Average
56%
22% 2%
45%
3% 0% 0%
20%
40%
60%
80%
100%
FCPS(N=5,605)
WFMS(N=187)
WFMS FAST+Center(N=61)
FCPS(N=4,105)
WFMS(N=110)
WFMS FAST+Center(N=61)
Reading Math
Percentage of FCPS & WFMS Students at Above Average or High Average GS Reading & Math Levels
More than 50% of middle school students district-wide – but less than 5% of those in the WFMS FAST+ program – had Above
Average or High Average reading levels in the Spring of 2015. Nearly half of FCPS middle schoolers had Above or High
Average math levels, but no FAST+ participants did.
Page 9
Summer 2015 FAST+ Year-End Evaluation Report to FCPS
Performance Measures
Student & Family Needs The stated goal of the FAST+ program is to increase academic achievement among struggling students in high-poverty schools. Specifically, it calls for raising achievement in the core content areas of English Language Arts (ELA) and math. FAST+ Program Goal: By June 2018, 80% of students participating in the FAST+ program will improve their ELA and/or math levels. Three problems were instrumental in identifying student and family needs. Problem 1: Summer learning loss among low performing students in high poverty schools Need: Prevention of summer learning loss among at-risk students
Problem 2: High school dropout among students who fail 9th grade courses and lack credits to be promoted to 10th grade
Need: Anticipatory credit gains for rising 9th graders at risk of dropout Problem 3: Lack of health insurance among children and families Need: School nurse for health access outreach
Objectives FCPS set six objectives for measuring the performance of the FAST+ program toward meeting these needs. These objectives are described below, along with their supporting strategies and activities. Achievement Objective: By September 2015, 65% of FAST+ students will improve their ELA and/or math levels as measured by LEA summative assessments. The academic achievement objective calls for an increase in ELA and/or math levels as measured by district-wide summative assessments. This performance measure builds on the program’s expected success in preventing summer learning loss. For this reason, the avoidance of summer learning loss must also be evaluated.
The FAST+ program at WFMS and FHS employed both direct and indirect curriculum strategies. WFMS followed the standard FAST structure of two, one-and-a-half hour instructional blocks. For math, the middle school program used Key Elements of Mathematics Success. For ELA, it used 6+1
Page 10
Summer 2015 FAST+ Year-End Evaluation Report to FCPS
Traits of Writing to stimulate students’ interest and to boost written language skills that may indirectly support reading comprehension. At FHS, the entire three-hour instructional block was devoted to a single, one-credit course that is required for high school graduation: Money, Finance & Economics. Students worked independently on school-issued Chromebooks to progress through this online course. Two teacher-mentors supervised and supported students’ daily progress. The teacher of record came to the class once a week to work with students one-on-one and was available by email during the other three days. Students were expected to successfully complete the course by the end of the five-week program, earning one credit toward their first year of high school and satisfying a Maryland high school graduation requirement. Attendance
Objective: In the summer of 2015, 80% of FAST+ students will attend 75% of the days the program is offered. The FAST+ summer program ran for 20 days, providing a total of 60 hours of academic instruction. A student who attended 75 percent of the program would miss five program days and 15 instructional hours. A student missing three days would have an 85 percent attendance rate. In addition to affecting students’ learning time, attendance also affects opportunities to increase student engagement through enrichment activities and relationship building.
The program used a variety of strategies to bolster student attendance. FCPS bus transportation to and from the program site was made available to all participants, and the FAST+ Community Liaison followed up with families on a daily basis to resolve any barriers to attendance. Breakfast and lunch was served to all students every day through the U.S. Department of Agriculture’s Summer Food Program. At FHS and WFMS, the Boys & Girls Club provided a consistent adult presence throughout the day. Boys & Girls Club staff members had primary responsibility for supervising before- and after- program activities, meals, and transitions, and were available to support teachers and other enrichment partners. Although all teachers and staff shared responsibility for creating a safe and nurturing environment, Boys & Girls Club staff members had a unique opportunity to build supportive connections with individual students.
Page 11
Summer 2015 FAST+ Year-End Evaluation Report to FCPS
Student Satisfaction Objective: In the summer of 2015, 75% of FAST+ students will be satisfied with the program. The FAST+ program aimed to engage students in learning and strengthen the connections between school, home, and community. Surveys allowed students to offer anonymous feedback and focus groups gave them a confidential opportunity to discuss the program with their peers. Both surveys and focus groups were designed to contribute to students’ experience of a safe and empowering environment. The survey asked about students’ overall satisfaction with their summer experience and with the various components of the program, as well as soliciting open-ended feedback on program improvement. It also asked students to reflect on how their attitudes toward school and toward themselves as learners may have changed over the summer, and whether they were becoming more interested in enrichment activities. Family Satisfaction Objective: In the summer of 2015, 75% of FAST+ families will be satisfied with the program. Surveys and focus groups were employed as tools for evaluation as well as participatory events. Online surveys allowed families to offer anonymous feedback and focus groups gave them a confidential opportunity to discuss their experiences with their peers. The survey asked about families’ overall satisfaction with their summer program and with its various components, as well as soliciting open-ended feedback on program improvement. It also asked families to reflect on how their children’s attitudes toward school and toward themselves as learners may have changed over the summer. Family Involvement Objective: In the summer of 2015, 78% of FAST+ families will participate in at least one school- or community-based partner activity that helps support their child’s education. The FAST+ program aimed to promote family involvement in their child’s education by encouraging communication between teachers and families and by providing formal and informal opportunities for family participation. Teachers were responsible for filling out a weekly report template as well as reaching out to families for phone and in-person conferences. Families were asked to sign teachers’ weekly reports and read other program documents in students’ Thursday folders. All program-level documents, such as invitations to participate in the survey, in family events, and in meetings of the Family Advisory Council, were translated into Spanish.
Page 12
Summer 2015 FAST+ Year-End Evaluation Report to FCPS
Access to Healthcare Objective : By September 2015, 65% of FAST+ students will have health insurance. A school health nurse was on site four hours a day to increase families’ access to healthcare and healthcare resources. On a daily basis, the nurse dispensed medications, administered first aid, and reviewed student records to ensure that all families had health insurance. Nurses reached out to families to connect them with appropriate medical and educational resources to support their children’s ongoing health needs.
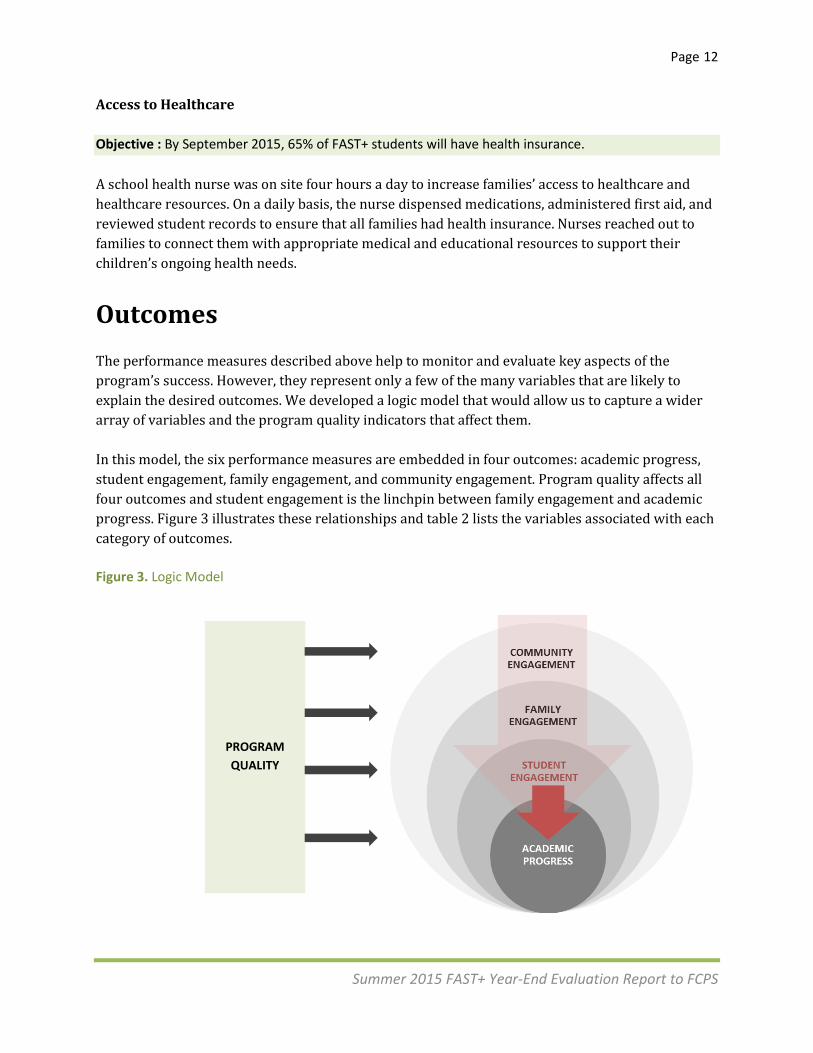
Outcomes The performance measures described above help to monitor and evaluate key aspects of the program’s success. However, they represent only a few of the many variables that are likely to explain the desired outcomes. We developed a logic model that would allow us to capture a wider array of variables and the program quality indicators that affect them. In this model, the six performance measures are embedded in four outcomes: academic progress, student engagement, family engagement, and community engagement. Program quality affects all four outcomes and student engagement is the linchpin between family engagement and academic progress. Figure 3 illustrates these relationships and table 2 lists the variables associated with each category of outcomes. Figure 3. Logic Model
PROGRAM QUALITY

Page 13
Summer 2015 FAST+ Year-End Evaluation Report to FCPS
Table 2. Outcomes, Variables & Program Quality Indicators
Outcomes Variables Program Quality Indicators Academic Progress • Avoidance of summer learning loss • Achievement gains • Completion of sufficient high school credits for
promotion to 10th grade • Participation in at- or above-grade level
instruction during school year • High school graduation
• Attendance • Spring and Fall summative assessments • Pretest/posttest curriculum-based assessments • Course completion and course grade • At- or above-grade level course-taking (2015) • Promotion to 10th grade (2016) • High school graduation (2109)
• Student recruitment strategy • Choice of curriculum and assessments • Instructional time • Teacher preparation/instructional planning • Quality of classroom environment • Quality of instruction • Instructional integration of enrichment
Student Engagement
• Academic self-efficacy: confidence in learning ability, identification with educational values
• Motivation to participate in academics and enrichment activities
• Social self-efficacy: prosocial behavior
• Satisfaction with program experience • Satisfaction with program components • Attitudes towards family involvement • Changing attitudes toward school and self • Relationships with peers in program community • Relationships with adults in program community
• Student choice of enrichment activities • Food quality and quantity • Quality and variety of enrichment activities • Consistency of behavior management • Potency of motivational strategies
Family Engagement
• Welcoming school environment • Communication between home and school • School support for home learning • Family involvement in child’s education • Family participation in school community
• Satisfaction with academic support and enrichment
• Satisfaction with child’s self-efficacy • Satisfaction with communication and
opportunities for family involvement • Participation (real-time involvement)
• Planning of opportunities for family involvement
• Communication of formal and informal opportunities for family involvement
• CBO integration into family programming
Community Engagement • Access to healthcare • Ongoing CBO availability (opportunities for
continued student and/or family involvement) • Community outreach (diffusion of FAST network
in local community) • Community presence (infusion of local culture
into FAST program)
• At-school support for daily clinical needs • Student health insurance coverage • Accessibility of health resource information • Accessibility of medical care • Media/locations used for community outreach • Visibility of local languages, ethnicities, and
occupations in program community
• Specialist collaboration (Family Engagement Specialist, Community Liaison, school nurse)
• CBOs partners’ local presence • Use of effective media, communications
technologies, and community locations • Use of translation and interpretation • Celebration of local diversity
Page 14
Summer 2015 FAST+ Year-End Evaluation Report to FCPS
Methods We collected extensive quantitative and qualitative data to obtain the fullest possible view of program implementation and outcomes. Quantitative data including demographics, attendance, and assessments, were extracted from FCPS Spring and Fall 2015 administrative databases and supplemented by teacher and administrator records of summer program activities. Qualitative data including interviews, observations, focus groups, and surveys, were conducted by the evaluator during the summer program.
Quantitative Methods Assessments A variety of summative and curriculum-based assessments contributed to the measurement of academic achievement outcomes. With WFMS, we used Global Scholar (GS) test scores in math and reading, which are used district-wide in grades 3 through 8. The biannual GS tests provided stable pretest and posttest measures of math and reading achievement.5 Differences between Spring and Fall GS scores were calculated and tested for statistical significance. Assessment scores were analyzed instead of performance band because they offer a more sensitive measure of change, especially in small data sets. Where possible, assessment results were also disaggregated by student characteristics such as grade level, ELL status, and Special Education status. With FHS, we used a specially designed curriculum-based assessment to measure the center’s impact on students’ reading proficiency. We also looked at successful completion of the academic course and analyzed the relationship between the reading assessment and content mastery. Administrative Records Quantitative measures of family engagement outcomes included: teachers’ logs of their weekly outreach efforts, such as written progress reports and phone calls to families; the school nurse’s logs of phone calls and letters to families; school-based administrators’ records of family outreach efforts, such as the advertisement of events and ongoing opportunities for involvement; and administrators’ records of family participation in events and other kinds of involvement.
5 In school year 2014-2015, FCPS transitioned from the annual state-wide Maryland School Assessment (MSA) system to the Partnership for Assessment of Readiness for College and Careers (PARCC) assessment system. While GS scores provide consistent measures, they may not assess the same standards as either the MSAs or the more rigorous Common Core assessments. Recent FAST evaluations have used Global Scholar (GS) assessments to track progress in reading and math.
Page 15
Summer 2015 FAST+ Year-End Evaluation Report to FCPS
Qualitative Methods A principal focus group, a teacher survey and focus group, and classroom observations were used to explore outcomes related to academic achievement. Student engagement outcomes were explored through a student survey, student and family focus groups, a CBO partner survey and focus group, and in-class and out-of-class observations. A family survey was unsuccessfully attempted.
Surveys Web-based surveys were designed by the evaluator and administered by program staff. An unrestricted, public web link was generated for each stakeholder group’s survey to facilitate distribution and to assure stakeholders that their participation would be anonymous. Central office administrators emailed the link to the teacher survey directly to teachers. Principals managed their teachers’ administration of the student surveys on Chromebooks during class time. Because few family emails were on file, the link to the family survey was advertised in English and Spanish on a full-page print flyer at the front of students’ weekly folders. Teachers and program staff also encouraged families to take the survey on Chromebooks at the family events. Teacher and student participation was strong. The student response rate was 76 percent at both WFMS (48 out of 63 possible responses) and FHS (13 out of 17), as well as 76 percent overall. The teacher response rate was 90 percent, with 9 out of 10 FAST+ teachers taking the survey.
Focus Groups Student & Family Focus Groups All student focus groups followed strict opt-out and opt-in procedures and were supervised by a school or district administrator. Families could opt students out prior to the focus groups; students could opt themselves out before the focus groups or while they were in progress. The week before the student focus groups, principals mailed home flyers with information about the student and family focus groups. The flyers, which were printed in English and Spanish, told families who to contact if they did not want their child to participate in the focus group. Prior to participant selection, the names of student volunteers were checked against the list of any students whose families had opted them out. The flyer also invited families to a one-hour focus group and informed them that a Spanish interpreter would be present.
The survey response rate was 76% for students and 90% for teachers.
Student focus groups followed opt-in and opt-out procedures. An interpreter supported Spanish-speaking families at the family focus group, and all printed outreach materials were translated into Spanish.
Page 16
Summer 2015 FAST+ Year-End Evaluation Report to FCPS
The day before each scheduled focus group, teachers read students a script inviting them to anonymously indicate their interest in participating in the focus group. All students were asked to write their names on a slip of paper and to indicate their interest by a checkmark if they wanted to participate, or an X, if they did not. The slips were collected by the Boys & Girls Club site coordinator, sorted, and checked against the opt-out list of students. Focus groups were capped at 12 participants, who were randomly selected from the volunteers. The evaluator began each focus group by explaining that participation was confidential and voluntary. The evaluator told students that they were free to leave at any time for any reason, and established a simple hand signal to receive an escort back to their classroom. In this way, several students at WFMS opted themselves out while the focus group was in progress. Teacher, Principal & Staff Partner Focus Groups Focus groups among teachers, principals, and staff partners were conducted at the program or cross-program level to facilitate the most productive peer-to-peer conversations. One focus group was held for FAST+ teachers, one for the principals of FAST1, FAST2, and FAST+ centers, one for CBOs directors, and one for Boys & Girls Club staff members, who were the only CBO staff partners who did not rotated among centers.
Interviews & Observations The evaluator conducted on-site interviews with the school nurse and informal interviews with teachers and staff partners. The nurse interview was intended to describe her clinical and outreach work and to explore its processes and challenges. Informal, impromptu interviews with teachers and CBO staff members were prompted by the evaluator’s observations during academic and enrichment activities, lunch, and transitions between structured activities. Interviews and observations were intended to attune the evaluation to features of implementation that other data collection methods may not have covered.
Page 17
Summer 2015 FAST+ Year-End Evaluation Report to FCPS
Outcomes This section presents results for the variables and program quality indicators associated with academic progress, student engagement, family engagement, and community engagement.
Academic Progress
Frederick High School
Attendance
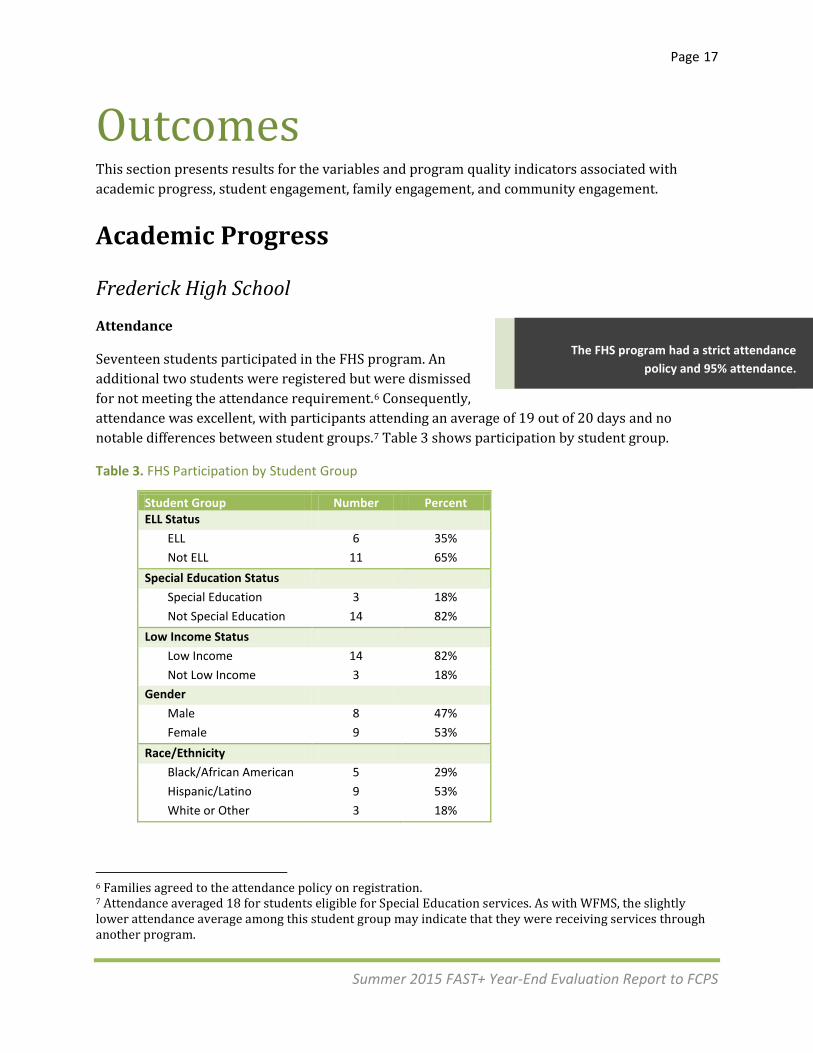
Seventeen students participated in the FHS program. An additional two students were registered but were dismissed for not meeting the attendance requirement.6 Consequently, attendance was excellent, with participants attending an average of 19 out of 20 days and no notable differences between student groups.7 Table 3 shows participation by student group.
Table 3. FHS Participation by Student Group
Student Group Number Percent ELL Status
ELL 6 35% Not ELL 11 65%
Special Education Status Special Education 3 18% Not Special Education 14 82%
Low Income Status Low Income 14 82% Not Low Income 3 18%
Gender Male 8 47% Female 9 53%
Race/Ethnicity Black/African American 5 29% Hispanic/Latino 9 53% White or Other 3 18%
6 Families agreed to the attendance policy on registration. 7 Attendance averaged 18 for students eligible for Special Education services. As with WFMS, the slightly lower attendance average among this student group may indicate that they were receiving services through another program.
The FHS program had a strict attendance policy and 95% attendance.
Page 18
Summer 2015 FAST+ Year-End Evaluation Report to FCPS
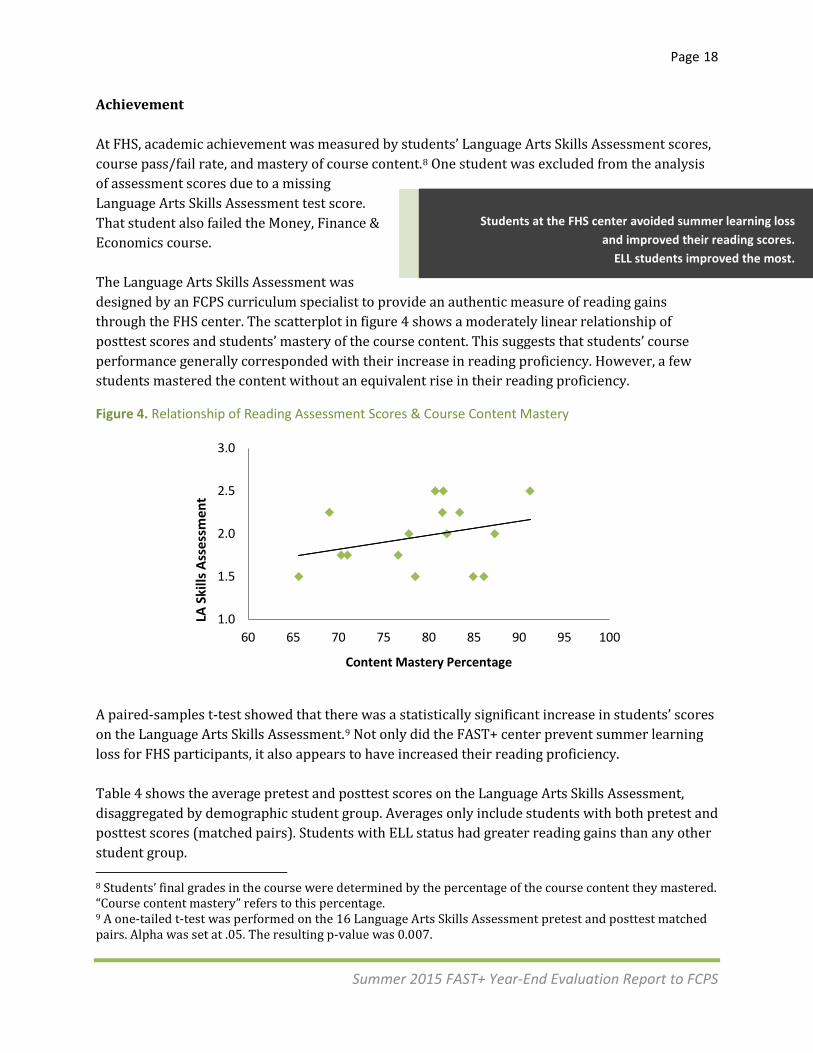
Achievement At FHS, academic achievement was measured by students’ Language Arts Skills Assessment scores, course pass/fail rate, and mastery of course content.8 One student was excluded from the analysis of assessment scores due to a missing Language Arts Skills Assessment test score. That student also failed the Money, Finance & Economics course. The Language Arts Skills Assessment was designed by an FCPS curriculum specialist to provide an authentic measure of reading gains through the FHS center. The scatterplot in figure 4 shows a moderately linear relationship of posttest scores and students’ mastery of the course content. This suggests that students’ course performance generally corresponded with their increase in reading proficiency. However, a few students mastered the content without an equivalent rise in their reading proficiency.
Figure 4. Relationship of Reading Assessment Scores & Course Content Mastery
A paired-samples t-test showed that there was a statistically significant increase in students’ scores on the Language Arts Skills Assessment.9 Not only did the FAST+ center prevent summer learning loss for FHS participants, it also appears to have increased their reading proficiency. Table 4 shows the average pretest and posttest scores on the Language Arts Skills Assessment, disaggregated by demographic student group. Averages only include students with both pretest and posttest scores (matched pairs). Students with ELL status had greater reading gains than any other student group. 8 Students’ final grades in the course were determined by the percentage of the course content they mastered. “Course content mastery” refers to this percentage. 9 A one-tailed t-test was performed on the 16 Language Arts Skills Assessment pretest and posttest matched pairs. Alpha was set at .05. The resulting p-value was 0.007.
1.0
1.5
2.0
2.5
3.0
60 65 70 75 80 85 90 95 100
LA S
kills
Ass
essm
ent
Content Mastery Percentage
Students at the FHS center avoided summer learning loss and improved their reading scores.
ELL students improved the most.
Page 19
Summer 2015 FAST+ Year-End Evaluation Report to FCPS
Table 4. FHS Reading Scores by ELL, Special Education & Low-Income Status
Language Arts Skills Assessment (N=16)
Assessment Scale: 0 – 4
Pretest Posttest Difference Percent Increase
ELL 1.50 1.88 0.38 9% Not ELL 1.75 1.84 0.09 2%
Special Ed 1.58 1.67 0.08 2% Not Special Ed 1.68 1.89 0.21 5%
Low-Income 1.6 1.8 0.2 4% Not Low-Income 1.8 2.1 0.3 6%
Average: 1.64 1.97 0.33 8%
West Frederick Middle School Attendance
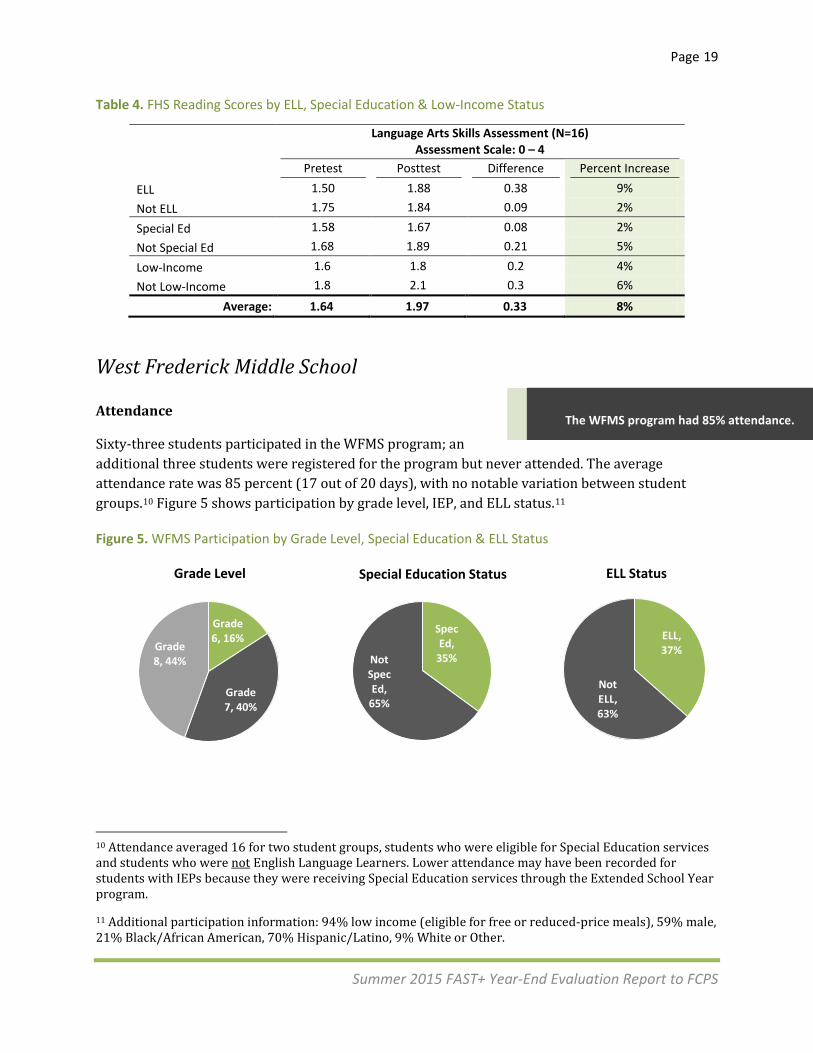
Sixty-three students participated in the WFMS program; an additional three students were registered for the program but never attended. The average attendance rate was 85 percent (17 out of 20 days), with no notable variation between student groups.10 Figure 5 shows participation by grade level, IEP, and ELL status.11
Figure 5. WFMS Participation by Grade Level, Special Education & ELL Status
10 Attendance averaged 16 for two student groups, students who were eligible for Special Education services and students who were not English Language Learners. Lower attendance may have been recorded for students with IEPs because they were receiving Special Education services through the Extended School Year program. 11 Additional participation information: 94% low income (eligible for free or reduced-price meals), 59% male, 21% Black/African American, 70% Hispanic/Latino, 9% White or Other.
Grade 6, 16%
Grade 7, 40%
Grade 8, 44%
Grade Level
Spec Ed,
35% Not Spec Ed,
65%
Special Education Status
ELL, 37%
Not ELL, 63%
ELL Status
The WFMS program had 85% attendance.
Page 20
Summer 2015 FAST+ Year-End Evaluation Report to FCPS
Achievement At WFMS, academic achievement was measured by students’ Spring 2015 and Fall 2015 Global Scholar reading and math scores. Paired-samples t-tests showed that there were no statistically significant differences between students’ Spring and Fall Global Scholar test scores in reading or math.12 Summer learning loss did not occur for WFMS participants with both Spring and Fall test scores.
Student group analysis. Although there are no statistically significant differences between student achievement before and after the summer program, student group averages suggest that some students benefitted from the program more than others. Table 5 shows that in reading, students with IEPs had an average 13 point gain, while in math, students in Grade 6 had a 19 point gain. Note that student group averages are restricted to students with both Spring and Fall test scores for each subject.13
Table 5. WFMS Reading & Math Scores by Grade Level, ELL & Special Education Status
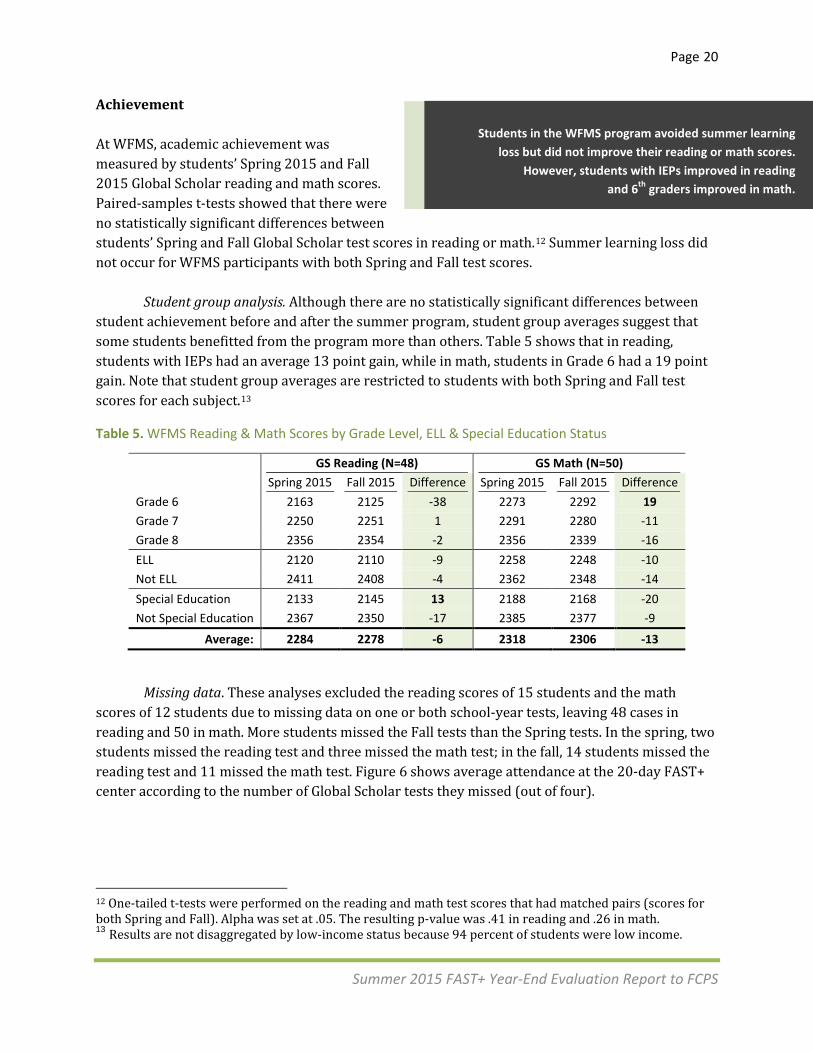
Missing data. These analyses excluded the reading scores of 15 students and the math scores of 12 students due to missing data on one or both school-year tests, leaving 48 cases in reading and 50 in math. More students missed the Fall tests than the Spring tests. In the spring, two students missed the reading test and three missed the math test; in the fall, 14 students missed the reading test and 11 missed the math test. Figure 6 shows average attendance at the 20-day FAST+ center according to the number of Global Scholar tests they missed (out of four).
12 One-tailed t-tests were performed on the reading and math test scores that had matched pairs (scores for both Spring and Fall). Alpha was set at .05. The resulting p-value was .41 in reading and .26 in math. 13 Results are not disaggregated by low-income status because 94 percent of students were low income.
GS Reading (N=48) GS Math (N=50)
Spring 2015 Fall 2015 Difference Spring 2015 Fall 2015 Difference
Grade 6 2163 2125 -38 2273 2292 19 Grade 7 2250 2251 1 2291 2280 -11 Grade 8 2356 2354 -2 2356 2339 -16 ELL 2120 2110 -9 2258 2248 -10 Not ELL 2411 2408 -4 2362 2348 -14 Special Education 2133 2145 13 2188 2168 -20 Not Special Education 2367 2350 -17 2385 2377 -9
Average: 2284 2278 -6 2318 2306 -13
Students in the WFMS program avoided summer learning loss but did not improve their reading or math scores.
However, students with IEPs improved in reading and 6th graders improved in math.
Page 21
Summer 2015 FAST+ Year-End Evaluation Report to FCPS
Figure 6. WFMS Summer Attendance & Missing Assessments
Student Engagement This section presents survey and focus group results pertaining to student satisfaction, self-efficacy, and enduring interest in enrichment activities.
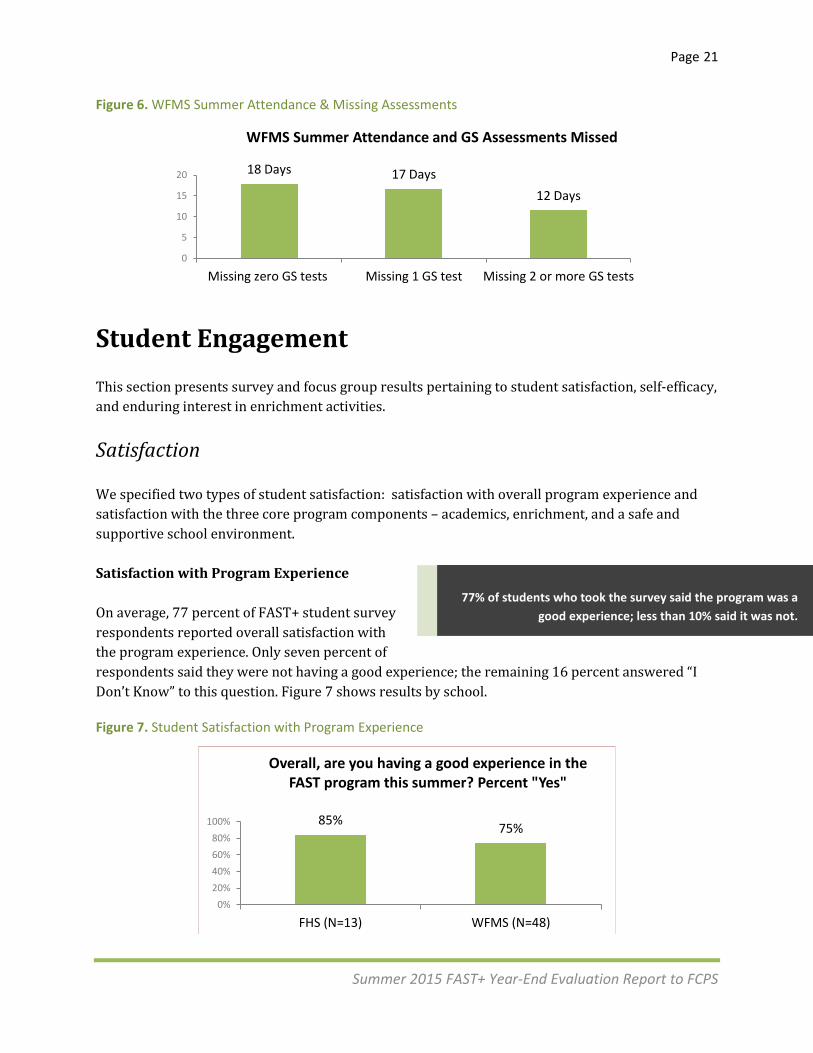
Satisfaction We specified two types of student satisfaction: satisfaction with overall program experience and satisfaction with the three core program components – academics, enrichment, and a safe and supportive school environment. Satisfaction with Program Experience On average, 77 percent of FAST+ student survey respondents reported overall satisfaction with the program experience. Only seven percent of respondents said they were not having a good experience; the remaining 16 percent answered “I Don’t Know” to this question. Figure 7 shows results by school.
Figure 7. Student Satisfaction with Program Experience
18 Days 17 Days 12 Days
0
5
10
15
20
Missing zero GS tests Missing 1 GS test Missing 2 or more GS tests
WFMS Summer Attendance and GS Assessments Missed
85% 75%
0%20%40%60%80%
100%
FHS (N=13) WFMS (N=48)
Overall, are you having a good experience in the FAST program this summer? Percent "Yes"
77% of students who took the survey said the program was a good experience; less than 10% said it was not.
Page 22
Summer 2015 FAST+ Year-End Evaluation Report to FCPS
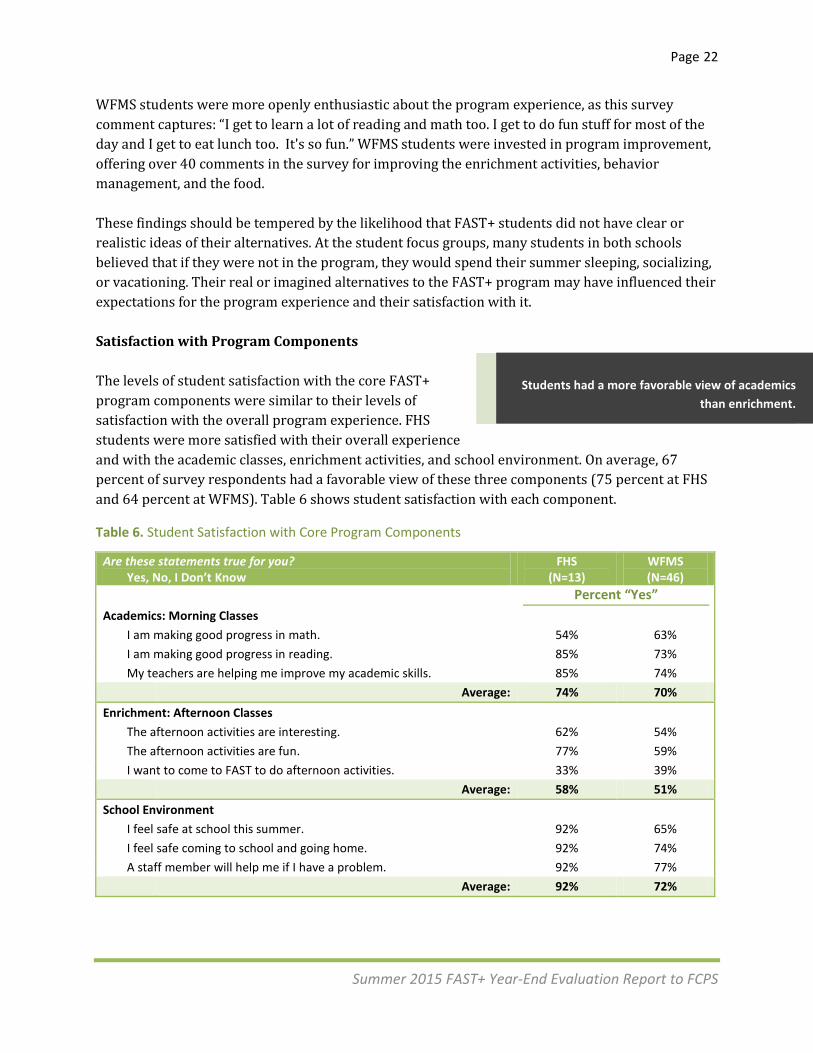
WFMS students were more openly enthusiastic about the program experience, as this survey comment captures: “I get to learn a lot of reading and math too. I get to do fun stuff for most of the day and I get to eat lunch too. It's so fun.” WFMS students were invested in program improvement, offering over 40 comments in the survey for improving the enrichment activities, behavior management, and the food. These findings should be tempered by the likelihood that FAST+ students did not have clear or realistic ideas of their alternatives. At the student focus groups, many students in both schools believed that if they were not in the program, they would spend their summer sleeping, socializing, or vacationing. Their real or imagined alternatives to the FAST+ program may have influenced their expectations for the program experience and their satisfaction with it. Satisfaction with Program Components The levels of student satisfaction with the core FAST+ program components were similar to their levels of satisfaction with the overall program experience. FHS students were more satisfied with their overall experience and with the academic classes, enrichment activities, and school environment. On average, 67 percent of survey respondents had a favorable view of these three components (75 percent at FHS and 64 percent at WFMS). Table 6 shows student satisfaction with each component.
Table 6. Student Satisfaction with Core Program Components
Are these statements true for you? Yes, No, I Don’t Know
FHS (N=13)
WFMS (N=46)
Percent “Yes” Academics: Morning Classes
I am making good progress in math. 54% 63% I am making good progress in reading. 85% 73% My teachers are helping me improve my academic skills. 85% 74%
Average: 74% 70% Enrichment: Afternoon Classes
The afternoon activities are interesting. 62% 54% The afternoon activities are fun. 77% 59% I want to come to FAST to do afternoon activities. 33% 39%
Average: 58% 51% School Environment
I feel safe at school this summer. 92% 65% I feel safe coming to school and going home. 92% 74% A staff member will help me if I have a problem. 92% 77%
Average: 92% 72%
Students had a more favorable view of academics than enrichment.

Page 23
Summer 2015 FAST+ Year-End Evaluation Report to FCPS
At both schools, student satisfaction was greatest with respect to the safety and supportiveness of the school environment. This result was especially pronounced in the FHS survey, where satisfaction with school environment was 18 percentage points higher than satisfaction with academics and 34 percentage points higher than satisfaction with enrichment. In both schools, the statement, “I want to come to FAST to do afternoon activities” elicited the least favorable response. Only 38 percent of respondents said this statement was true for them, even though 59 percent said the enrichment activities were interesting and fun. Students generally liked the enrichment activities but did not see them as a compelling reason to participate in the program. FHS students appeared to be more focused on the academic part of the program than WFMS students. This focus may have led them to take a dimmer view of the enrichment experience. While the middle school students used the focus group and the survey space to talk about making the activities better, the rising ninth graders expressed very little interest in or tolerance for the activities. One FHS focus group participant bluntly summed up this view: “The morning is valuable. The afternoon is a waste.”
Self-Efficacy The survey asked students about their attitudes toward school and toward themselves as students. Table 7 shows that 55 percent of FAST+ student participants reported positive changes in their self-efficacy over the course of the summer.
Table 7. Changing Student Attitudes
Please think about your feelings at the end of the school year compared to now. Are these statements true for you?
Yes, No, I Don’t Know FHS
(N=13) WFMS (N=46)
Percent “Yes” Student Attitudes
I like school more now. 38% 37% I am a better student now. 85% 54% I am a more confident student now. 77% 64%
Average: 67% 52%
Although only 37 percent of respondents reported positive changes in their attitude toward school, 64 percent said that at the end of the summer program, they were better and/or more confident students. The FAST+ center seems to have especially benefitted FHS students’ self-concept, with 85 percent of respondents reporting that they were better students at the end of the summer program. The survey also asked the rising ninth graders about the summer’s impact on their transition to high school. On average, 87 percent of participating FHS students had a positive outlook about
Over half of students who took the survey reported positive changes in their attitudes toward school and toward themselves as students.
FHS students reported especially strong changes in their self-concept.
Page 24
Summer 2015 FAST+ Year-End Evaluation Report to FCPS
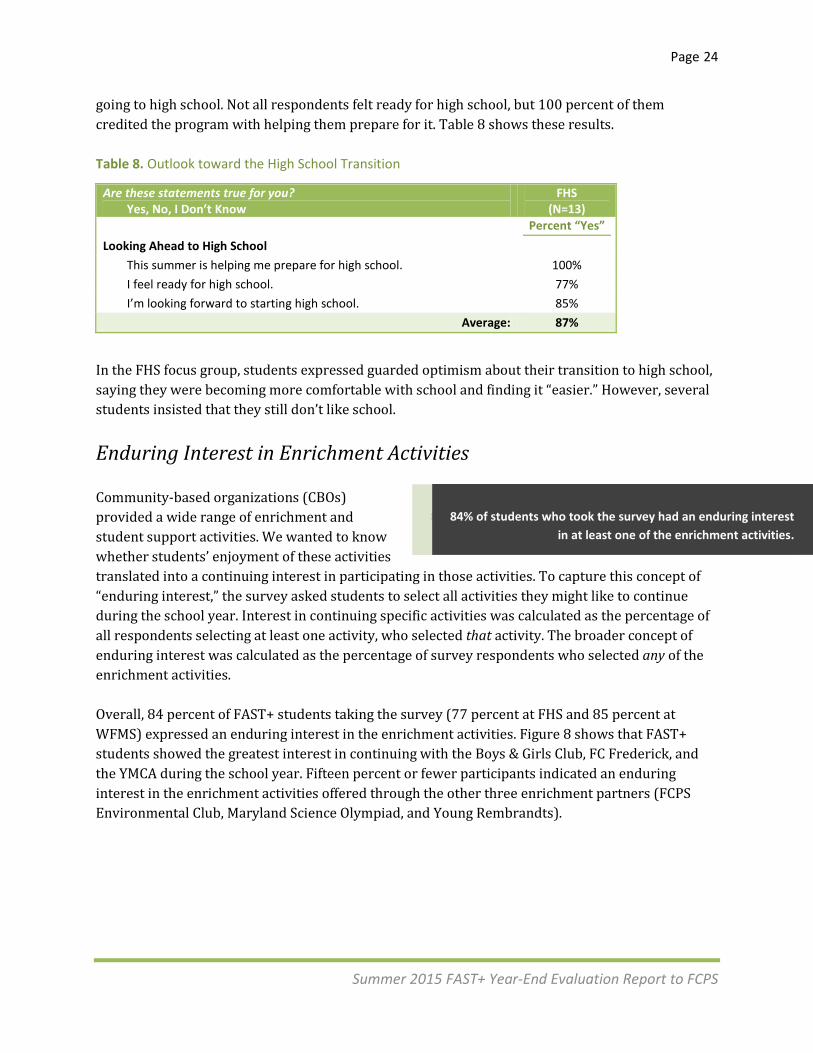
going to high school. Not all respondents felt ready for high school, but 100 percent of them credited the program with helping them prepare for it. Table 8 shows these results. Table 8. Outlook toward the High School Transition
Are these statements true for you? Yes, No, I Don’t Know
FHS (N=13)
Percent “Yes” Looking Ahead to High School
This summer is helping me prepare for high school. 100% I feel ready for high school. 77% I’m looking forward to starting high school. 85%
Average: 87%
In the FHS focus group, students expressed guarded optimism about their transition to high school, saying they were becoming more comfortable with school and finding it “easier.” However, several students insisted that they still don’t like school.
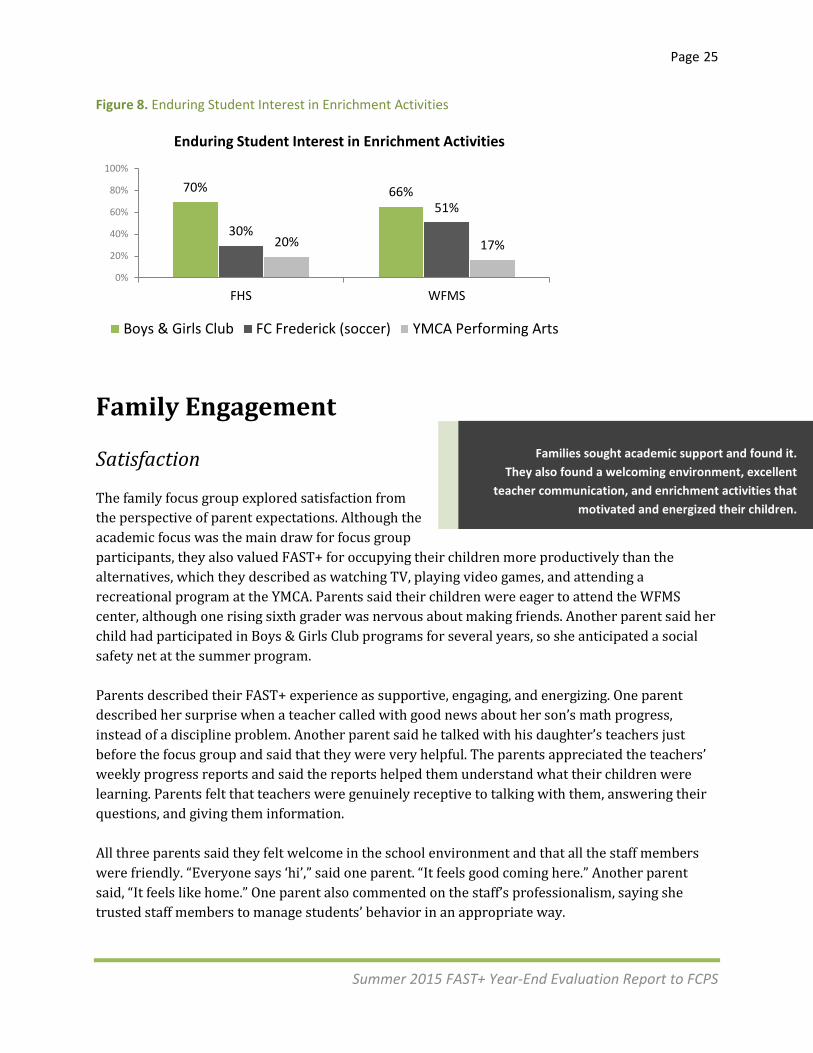
Enduring Interest in Enrichment Activities Community-based organizations (CBOs) provided a wide range of enrichment and student support activities. We wanted to know whether students’ enjoyment of these activities translated into a continuing interest in participating in those activities. To capture this concept of “enduring interest,” the survey asked students to select all activities they might like to continue during the school year. Interest in continuing specific activities was calculated as the percentage of all respondents selecting at least one activity, who selected that activity. The broader concept of enduring interest was calculated as the percentage of survey respondents who selected any of the enrichment activities. Overall, 84 percent of FAST+ students taking the survey (77 percent at FHS and 85 percent at WFMS) expressed an enduring interest in the enrichment activities. Figure 8 shows that FAST+ students showed the greatest interest in continuing with the Boys & Girls Club, FC Frederick, and the YMCA during the school year. Fifteen percent or fewer participants indicated an enduring interest in the enrichment activities offered through the other three enrichment partners (FCPS Environmental Club, Maryland Science Olympiad, and Young Rembrandts).
84% of students who took the survey had an enduring interest in at least one of the enrichment activities.
Page 25
Summer 2015 FAST+ Year-End Evaluation Report to FCPS
Figure 8. Enduring Student Interest in Enrichment Activities
Family Engagement
Satisfaction
The family focus group explored satisfaction from the perspective of parent expectations. Although the academic focus was the main draw for focus group participants, they also valued FAST+ for occupying their children more productively than the alternatives, which they described as watching TV, playing video games, and attending a recreational program at the YMCA. Parents said their children were eager to attend the WFMS center, although one rising sixth grader was nervous about making friends. Another parent said her child had participated in Boys & Girls Club programs for several years, so she anticipated a social safety net at the summer program. Parents described their FAST+ experience as supportive, engaging, and energizing. One parent described her surprise when a teacher called with good news about her son’s math progress, instead of a discipline problem. Another parent said he talked with his daughter’s teachers just before the focus group and said that they were very helpful. The parents appreciated the teachers’ weekly progress reports and said the reports helped them understand what their children were learning. Parents felt that teachers were genuinely receptive to talking with them, answering their questions, and giving them information. All three parents said they felt welcome in the school environment and that all the staff members were friendly. “Everyone says ‘hi’,” said one parent. “It feels good coming here.” Another parent said, “It feels like home.” One parent also commented on the staff’s professionalism, saying she trusted staff members to manage students’ behavior in an appropriate way.
70% 66%
30%
51%
20% 17%
0%
20%
40%
60%
80%
100%
FHS WFMS
Enduring Student Interest in Enrichment Activities
Boys & Girls Club FC Frederick (soccer) YMCA Performing Arts
Families sought academic support and found it. They also found a welcoming environment, excellent
teacher communication, and enrichment activities that motivated and energized their children.
Page 26
Summer 2015 FAST+ Year-End Evaluation Report to FCPS
Participation The FAST+ program offered families multiple opportunities for real-time involvement in their child’s education and in the school community. In the course of the summer, FAST+ families participated in the following formal and informal events and opportunities for ongoing involvement at the program site:
1. According to administrative records, some families of FAST+ students attended the May 26 program orientation. Families’ informal feedback about the event was positive.
2. The FAST+ Community Liaison logged 83 direct contacts with families, including outreach efforts on behalf of teachers or program staff as well as family-initiated conversations. In addition to communicating with families about student absences and late arrivals, the Liaison connected families with community services and resources, provided ad hoc support to teachers in communicating with Spanish-speaking families, and developed relationships with families that serve as a bridge to the school community.
3. The families of two WFMS students participated in the June 30 Family Advisory Council meeting, where, the Community Liaison solicited feedback on developing activities to connect families with the school community and help them support their child’s education.
4. The families of four WFMS students participated in the July 14 focus group that was part of the program evaluation.
5. The families of eight students visited their children’s classrooms in the weeks of July 13 and 20. Two of these families made impromptu visits to their children’s classrooms after the family focus group.
6. The families of 71 students participated in one-on-one phone conferences with their child’s teachers in the week of July 20.
7. The families of 22 students came to the FAST+ campus on July 30 for a picnic. Informal feedback conveyed families’ enjoyment of the event and appreciation for the opportunity to get to know teachers and staff in an informal setting.
Involvement Teacher Views WFMS families received weekly, printed progress reports from their children’s teachers. These reports followed an FCPS template designed for use in the FAST centers, which let teachers identify their weekly goal in reading and math and indicate whether students were developing toward, meeting, or exceeding that goal. The document allowed teachers and families to make comments. In the teacher focus group, there were questions about the merit of these reports. Many teachers felt that families did not read them because they were often returned without family signatures, let
89% of families participated in parent-teacher conferences and 28% came to the picnic. 10% of families visited their child’s classroom and 5% participated in the focus group.
Page 27
Summer 2015 FAST+ Year-End Evaluation Report to FCPS
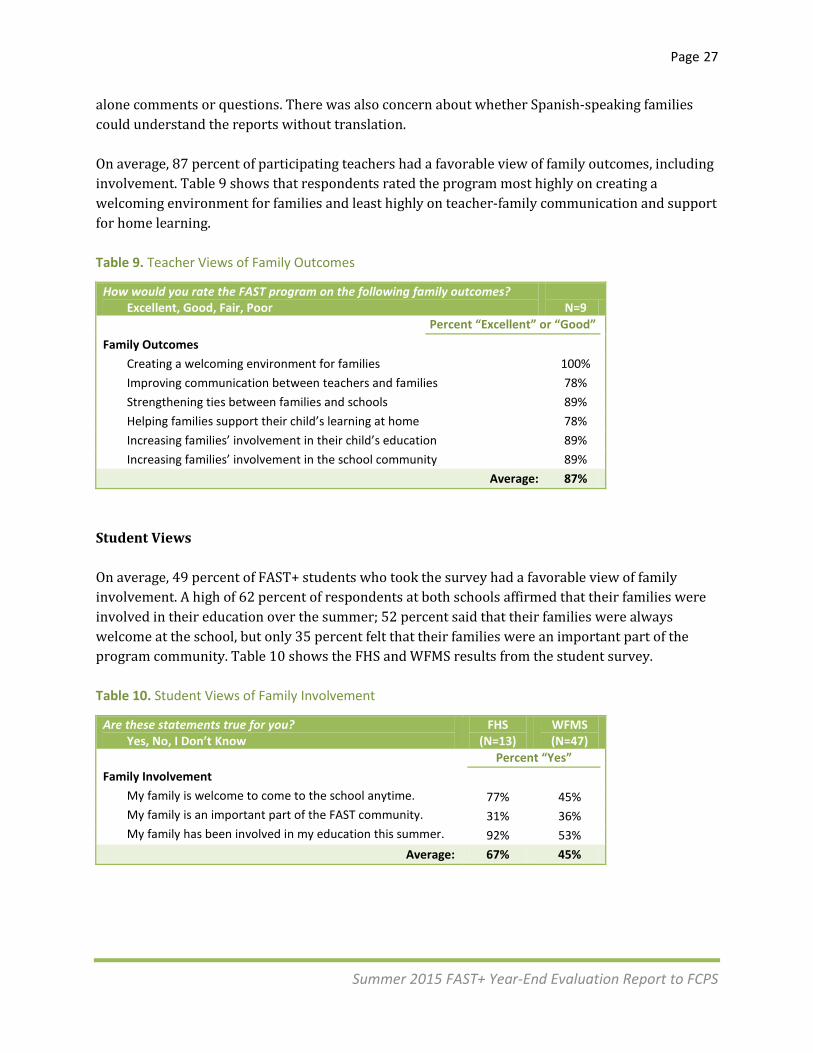
alone comments or questions. There was also concern about whether Spanish-speaking families could understand the reports without translation. On average, 87 percent of participating teachers had a favorable view of family outcomes, including involvement. Table 9 shows that respondents rated the program most highly on creating a welcoming environment for families and least highly on teacher-family communication and support for home learning. Table 9. Teacher Views of Family Outcomes
How would you rate the FAST program on the following family outcomes? Excellent, Good, Fair, Poor N=9
Percent “Excellent” or “Good” Family Outcomes
Creating a welcoming environment for families 100% Improving communication between teachers and families 78% Strengthening ties between families and schools 89% Helping families support their child’s learning at home 78% Increasing families’ involvement in their child’s education 89% Increasing families’ involvement in the school community 89%
Average: 87% Student Views On average, 49 percent of FAST+ students who took the survey had a favorable view of family involvement. A high of 62 percent of respondents at both schools affirmed that their families were involved in their education over the summer; 52 percent said that their families were always welcome at the school, but only 35 percent felt that their families were an important part of the program community. Table 10 shows the FHS and WFMS results from the student survey. Table 10. Student Views of Family Involvement
Are these statements true for you? Yes, No, I Don’t Know
FHS (N=13)
WFMS (N=47)
Percent “Yes”
Family Involvement My family is welcome to come to the school anytime. 77% 45% My family is an important part of the FAST community. 31% 36% My family has been involved in my education this summer. 92% 53%
Average: 67% 45%
Page 28
Summer 2015 FAST+ Year-End Evaluation Report to FCPS
Community Engagement
Access to Healthcare Administrative records show that the beginning of the 2015-2016 school year, 65 percent of students participating in the FHS center and 88 percent of WFMS center participants had health insurance, as did 84 percent of FAST1 students overall. The nurse interview took place in the first week of the FAST+ program. At that point, the nurse, who was new to the school, was reviewing student records while getting to know families and managing students’ daily clinical needs. Many of the health forms submitted with program registration were incomplete, so it was not clear how many families did not have health insurance. The nurse described the school setting as quiet and orderly and characterized her FAST+ colleagues—in particular, the Family Engagement Specialist and the Community Liaison—as very helpful.
Program Quality
Academic Progress Outcomes Classroom & Instructional Quality
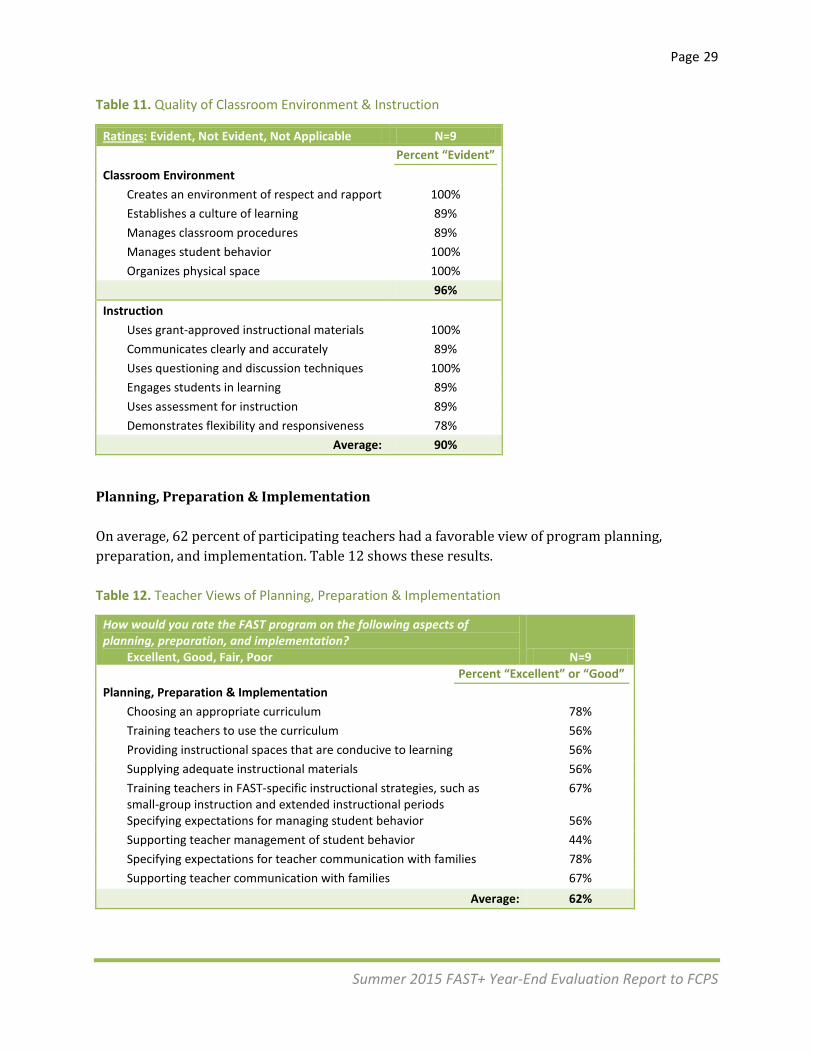
All WFMS teachers were observed by the FCPS director on the FAST+ leadership team, who rated the quality of classroom environments and instruction. On average, evidence of an effective classroom environment was observed among 96 percent of WFMS teachers for whom these indicators were relevant; evidence of effective instruction was observed among 90 percent of them. Table 11 shows these results.
Page 29
Summer 2015 FAST+ Year-End Evaluation Report to FCPS
Table 11. Quality of Classroom Environment & Instruction
Ratings: Evident, Not Evident, Not Applicable N=9 Percent “Evident” Classroom Environment
Creates an environment of respect and rapport 100% Establishes a culture of learning 89% Manages classroom procedures 89% Manages student behavior 100% Organizes physical space 100% 96%
Instruction Uses grant-approved instructional materials 100% Communicates clearly and accurately 89% Uses questioning and discussion techniques 100% Engages students in learning 89% Uses assessment for instruction 89% Demonstrates flexibility and responsiveness 78%
Average: 90%
Planning, Preparation & Implementation On average, 62 percent of participating teachers had a favorable view of program planning, preparation, and implementation. Table 12 shows these results. Table 12. Teacher Views of Planning, Preparation & Implementation
How would you rate the FAST program on the following aspects of planning, preparation, and implementation?
Excellent, Good, Fair, Poor N=9
Percent “Excellent” or “Good” Planning, Preparation & Implementation
Choosing an appropriate curriculum 78% Training teachers to use the curriculum 56% Providing instructional spaces that are conducive to learning 56% Supplying adequate instructional materials 56% Training teachers in FAST-specific instructional strategies, such as small-group instruction and extended instructional periods
67%
Specifying expectations for managing student behavior 56% Supporting teacher management of student behavior 44% Specifying expectations for teacher communication with families 78% Supporting teacher communication with families 67%
Average: 62%
Page 30
Summer 2015 FAST+ Year-End Evaluation Report to FCPS
Although 78 percent of teachers approved of the choice of curriculum, only 56 percent felt adequately trained to use the curriculum. Similarly, 78 percent of teachers reported that they were informed of the family communication expectations, but 67 percent felt adequately supported in these efforts. Both expectation-setting and support for managing student behavior were low. The teacher and principal focus groups shed light on some of these issues. For example, teachers had very different experiences of communication with families. One teacher described having more time to make phone calls home than during the school year, and consequently using these calls to build positive relationships rather than report problems. An FHS teacher said that all family communication was done by email, which created little opportunity for interaction. In both English Language Arts and math, teachers liked the curriculum materials but felt that they were not implemented as intended, and as a result, achievement had not been measured accurately. Math teachers explained that their training in the new curriculum did not transfer to their classroom instruction, because the grade-level materials were too advanced for their WFMS students. One teacher said, “We won’t touch the 8th grade materials. We’ll only use the 6th and 7th grade materials.” Another teacher said they needed elementary-level materials to help “fill in the gaps.” “We’ll backtrack all summer,” she said. Math teachers focused on specific, tangible academic skills as well as student self-efficacy:
• “They are learning how to attack word problems. It’s a big takeaway from this program.” • “Their confidence is much higher now than at the beginning of the program. Kids will raise
their hands; they usually don’t do that in merit level math.” • “For ELL students, it’s a big difference. The smaller classes make them more comfortable.
They will ask questions. They will present their work out loud. In mainstream classes during the school year, they just sit and drown.”
Similarly, English Language Arts teachers offered a nuanced view of student achievement and engagement, describing students” learning gains in these ways:
• “It will take more than five weeks for these kids to catch up. But they’ve done more writing in the past two weeks than in the past two years.”
• “They are making improvements, but not a full grade level. But they’ll be able to keep pace with their on-grade peers in writing.”
There was considerable discussion of student selection in the teacher focus group as well as their comments on the survey. A number of teachers felt that students’ achievement levels were too low to benefit from the summer curriculum, or that achievement levels were too varied to be served in a single group. Several teachers suggested that principals recruit students with higher achievement— those who were not more than one grade level behind—and others thought it would be helpful to
Teachers liked the curriculum but wanted support for implementation and assessment.
Page 31
Summer 2015 FAST+ Year-End Evaluation Report to FCPS
group students by their achievement levels in math and reading. The principal focus group confirmed that they recruited students who were at least a full year behind, although exceptions were occasionally made for siblings with higher achievement or for students with special needs who were concurrently served by the FCPS Extended School Year program. Teachers distinguished between students with low achievement due to cognitive challenges versus behavioral issues, and emphasized that each type of student required different instructional strategies. Some teachers thought it would help to create separate groups for students with cognitive or behavioral challenges, while others thought it would be best to restrict participation to students who were able to meet behavioral standards.
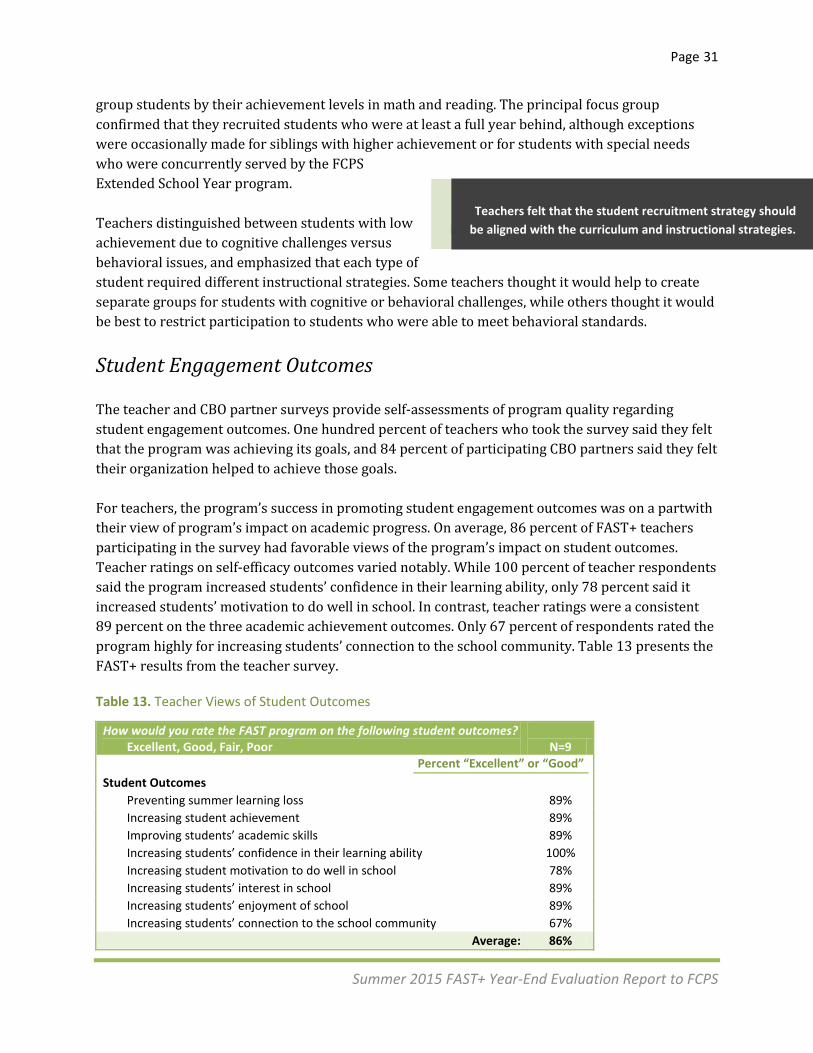
Student Engagement Outcomes The teacher and CBO partner surveys provide self-assessments of program quality regarding student engagement outcomes. One hundred percent of teachers who took the survey said they felt that the program was achieving its goals, and 84 percent of participating CBO partners said they felt their organization helped to achieve those goals. For teachers, the program’s success in promoting student engagement outcomes was on a partwith their view of program’s impact on academic progress. On average, 86 percent of FAST+ teachers participating in the survey had favorable views of the program’s impact on student outcomes. Teacher ratings on self-efficacy outcomes varied notably. While 100 percent of teacher respondents said the program increased students’ confidence in their learning ability, only 78 percent said it increased students’ motivation to do well in school. In contrast, teacher ratings were a consistent 89 percent on the three academic achievement outcomes. Only 67 percent of respondents rated the program highly for increasing students’ connection to the school community. Table 13 presents the FAST+ results from the teacher survey.
Table 13. Teacher Views of Student Outcomes
How would you rate the FAST program on the following student outcomes? Excellent, Good, Fair, Poor N=9
Percent “Excellent” or “Good” Student Outcomes
Preventing summer learning loss 89% Increasing student achievement 89% Improving students’ academic skills 89% Increasing students’ confidence in their learning ability 100% Increasing student motivation to do well in school 78% Increasing students’ interest in school 89% Increasing students’ enjoyment of school 89% Increasing students’ connection to the school community 67%
Average: 86%
Teachers felt that the student recruitment strategy should be aligned with the curriculum and instructional strategies.
Page 32
Summer 2015 FAST+ Year-End Evaluation Report to FCPS
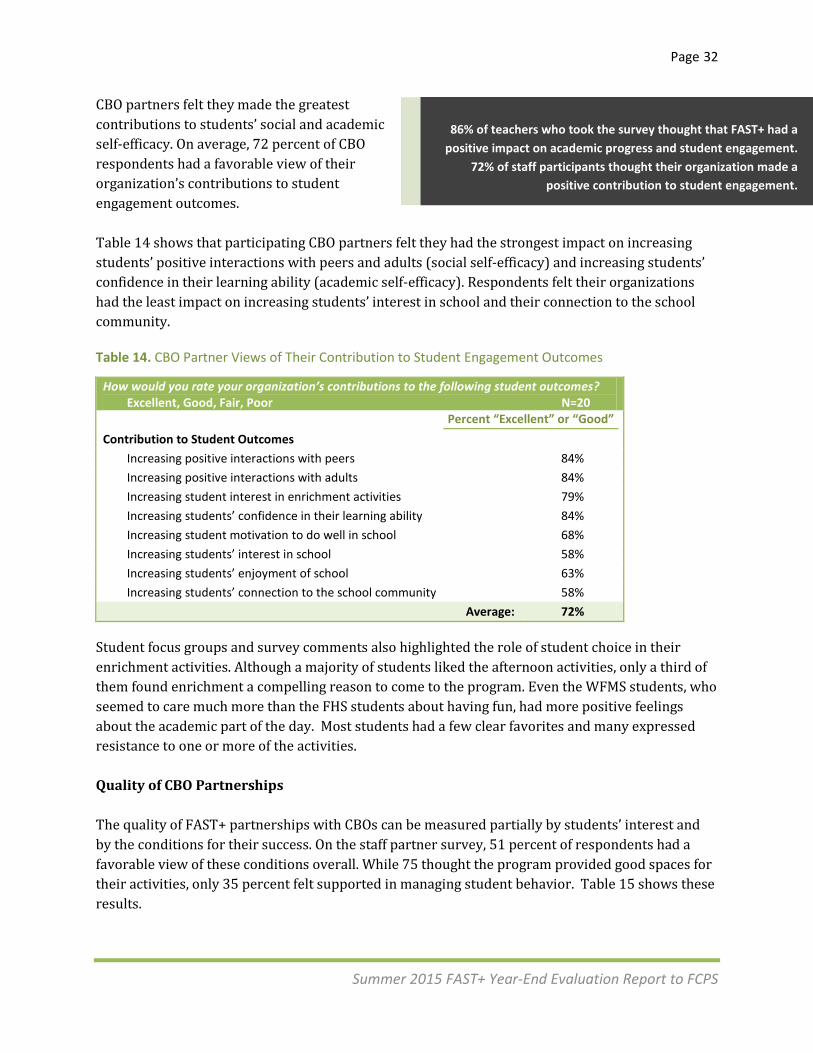
CBO partners felt they made the greatest contributions to students’ social and academic self-efficacy. On average, 72 percent of CBO respondents had a favorable view of their organization’s contributions to student engagement outcomes. Table 14 shows that participating CBO partners felt they had the strongest impact on increasing students’ positive interactions with peers and adults (social self-efficacy) and increasing students’ confidence in their learning ability (academic self-efficacy). Respondents felt their organizations had the least impact on increasing students’ interest in school and their connection to the school community.
Table 14. CBO Partner Views of Their Contribution to Student Engagement Outcomes
How would you rate your organization’s contributions to the following student outcomes? Excellent, Good, Fair, Poor N=20
Percent “Excellent” or “Good” Contribution to Student Outcomes
Increasing positive interactions with peers 84% Increasing positive interactions with adults 84% Increasing student interest in enrichment activities 79% Increasing students’ confidence in their learning ability 84% Increasing student motivation to do well in school 68% Increasing students’ interest in school 58% Increasing students’ enjoyment of school 63% Increasing students’ connection to the school community 58%
Average: 72%
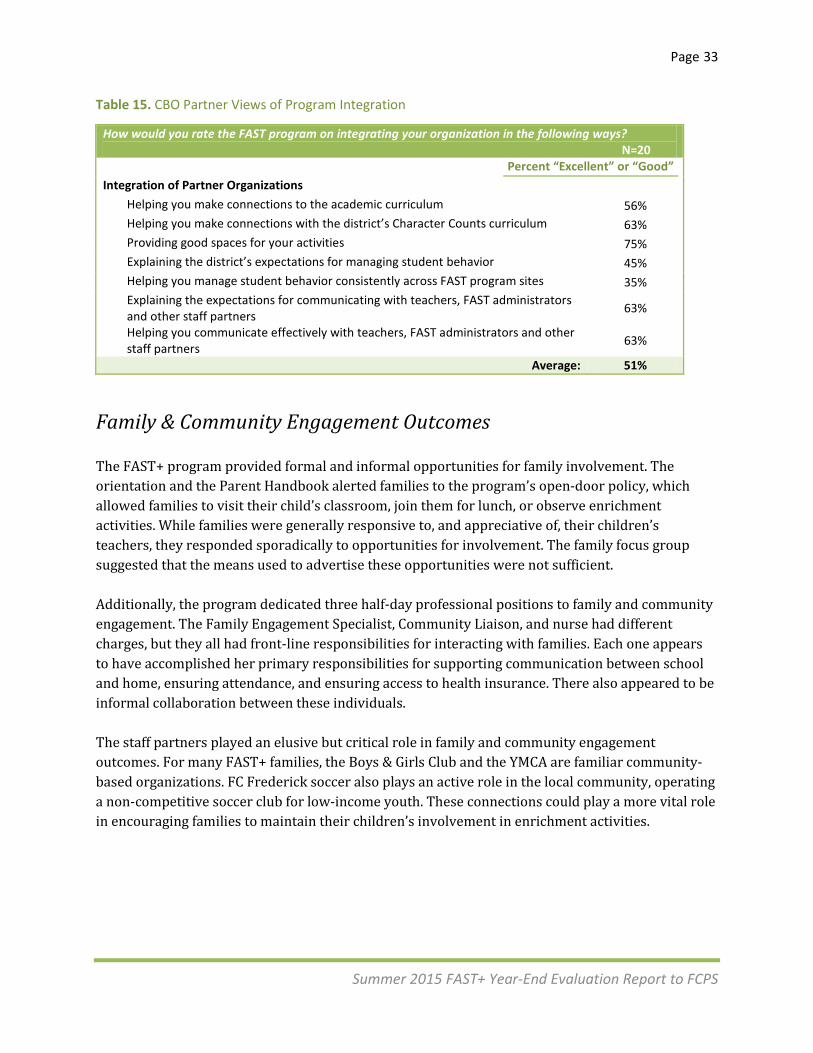
Student focus groups and survey comments also highlighted the role of student choice in their enrichment activities. Although a majority of students liked the afternoon activities, only a third of them found enrichment a compelling reason to come to the program. Even the WFMS students, who seemed to care much more than the FHS students about having fun, had more positive feelings about the academic part of the day. Most students had a few clear favorites and many expressed resistance to one or more of the activities. Quality of CBO Partnerships The quality of FAST+ partnerships with CBOs can be measured partially by students’ interest and by the conditions for their success. On the staff partner survey, 51 percent of respondents had a favorable view of these conditions overall. While 75 thought the program provided good spaces for their activities, only 35 percent felt supported in managing student behavior. Table 15 shows these results.
86% of teachers who took the survey thought that FAST+ had a positive impact on academic progress and student engagement.
72% of staff participants thought their organization made a positive contribution to student engagement.
Page 33
Summer 2015 FAST+ Year-End Evaluation Report to FCPS
Table 15. CBO Partner Views of Program Integration
How would you rate the FAST program on integrating your organization in the following ways? N=20
Percent “Excellent” or “Good” Integration of Partner Organizations
Helping you make connections to the academic curriculum 56% Helping you make connections with the district’s Character Counts curriculum 63% Providing good spaces for your activities 75% Explaining the district’s expectations for managing student behavior 45% Helping you manage student behavior consistently across FAST program sites 35% Explaining the expectations for communicating with teachers, FAST administrators and other staff partners 63%
Helping you communicate effectively with teachers, FAST administrators and other staff partners 63%
Average: 51%
Family & Community Engagement Outcomes The FAST+ program provided formal and informal opportunities for family involvement. The orientation and the Parent Handbook alerted families to the program’s open-door policy, which allowed families to visit their child’s classroom, join them for lunch, or observe enrichment activities. While families were generally responsive to, and appreciative of, their children’s teachers, they responded sporadically to opportunities for involvement. The family focus group suggested that the means used to advertise these opportunities were not sufficient. Additionally, the program dedicated three half-day professional positions to family and community engagement. The Family Engagement Specialist, Community Liaison, and nurse had different charges, but they all had front-line responsibilities for interacting with families. Each one appears to have accomplished her primary responsibilities for supporting communication between school and home, ensuring attendance, and ensuring access to health insurance. There also appeared to be informal collaboration between these individuals. The staff partners played an elusive but critical role in family and community engagement outcomes. For many FAST+ families, the Boys & Girls Club and the YMCA are familiar community-based organizations. FC Frederick soccer also plays an active role in the local community, operating a non-competitive soccer club for low-income youth. These connections could play a more vital role in encouraging families to maintain their children’s involvement in enrichment activities.
Page 34
Summer 2015 FAST+ Year-End Evaluation Report to FCPS
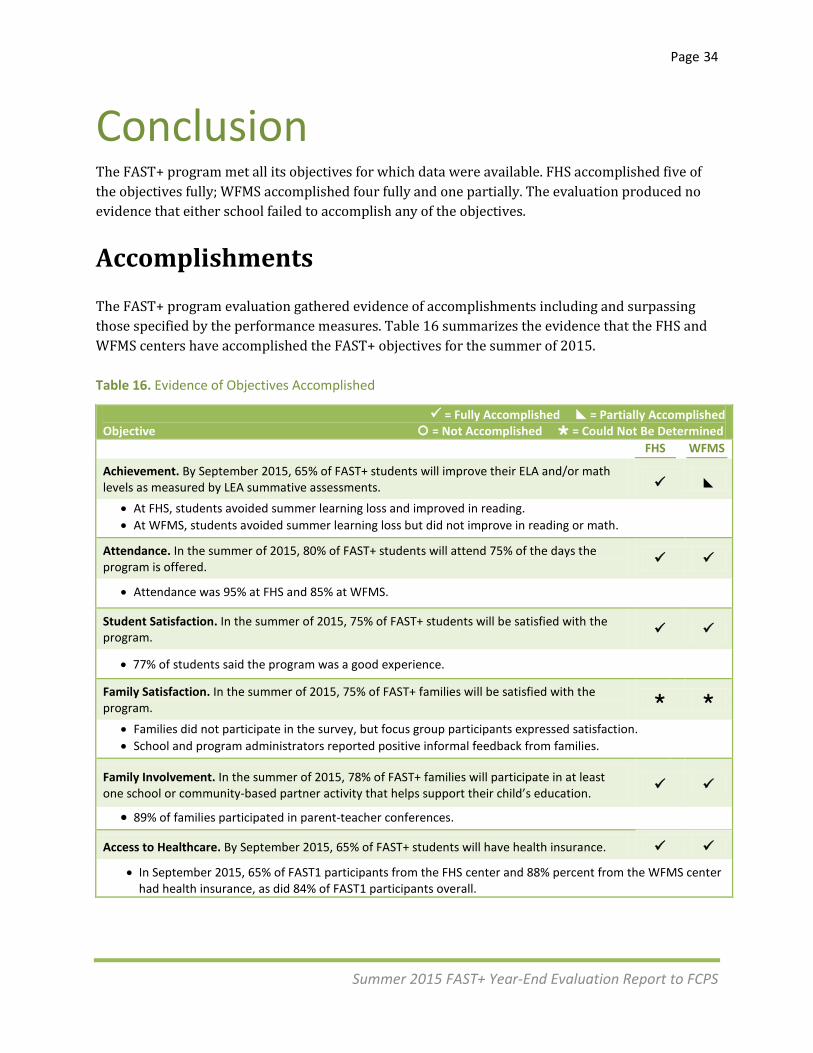
Conclusion The FAST+ program met all its objectives for which data were available. FHS accomplished five of the objectives fully; WFMS accomplished four fully and one partially. The evaluation produced no evidence that either school failed to accomplish any of the objectives.
Accomplishments The FAST+ program evaluation gathered evidence of accomplishments including and surpassing those specified by the performance measures. Table 16 summarizes the evidence that the FHS and WFMS centers have accomplished the FAST+ objectives for the summer of 2015. Table 16. Evidence of Objectives Accomplished
= Fully Accomplished = Partially Accomplished Objective = Not Accomplished = Could Not Be Determined FHS WFMS
Achievement. By September 2015, 65% of FAST+ students will improve their ELA and/or math levels as measured by LEA summative assessments.
• At FHS, students avoided summer learning loss and improved in reading. • At WFMS, students avoided summer learning loss but did not improve in reading or math.
Attendance. In the summer of 2015, 80% of FAST+ students will attend 75% of the days the program is offered.
• Attendance was 95% at FHS and 85% at WFMS.
Student Satisfaction. In the summer of 2015, 75% of FAST+ students will be satisfied with the program.
• 77% of students said the program was a good experience.
Family Satisfaction. In the summer of 2015, 75% of FAST+ families will be satisfied with the program.
• Families did not participate in the survey, but focus group participants expressed satisfaction. • School and program administrators reported positive informal feedback from families.
Family Involvement. In the summer of 2015, 78% of FAST+ families will participate in at least one school or community-based partner activity that helps support their child’s education.
• 89% of families participated in parent-teacher conferences.
Access to Healthcare. By September 2015, 65% of FAST+ students will have health insurance. • In September 2015, 65% of FAST1 participants from the FHS center and 88% percent from the WFMS center
had health insurance, as did 84% of FAST1 participants overall.
Page 35
Summer 2015 FAST+ Year-End Evaluation Report to FCPS
Considerations This evaluation has provided both quantitative and qualitative evidence for the FAST+ performance measures of the student and family outcomes. Although evidence for the student outcomes was largely quantitative, its interpretation should be tempered by validity considerations. The reading assessments were not closely aligned with the summer curriculum in either school. This is not surprising, as the FAST+ program is designed offer an academic experience that complements the school-year curriculum. Nonetheless, the pre- and post-assessments confirmed that FHS students improved their reading scores and that WFMS students achieved the necessary preconditions, the avoidance of summer learning loss in math and reading. Attendance, though superficially the most straightforward measure, reflected selection decisions and may have affected achievement results. Figure 6 showed that students with poor summer attendance were the most likely to be excluded from the analysis because of missing Spring or Fall test scores. While students with poor attendance also have low achievement, it is also plausible that such students may have thrived in the intensive, individualized, and supportive instructional environment of the FAST+ program. Students with missing data may have had lower than average achievement but higher than average growth. Likewise, the qualitative data have clear patterns but do not allow us to speculate about the satisfaction of non-participants. Student participation in the survey and focus groups was good, but does not account for the factors that may have motivated some students to self-select for these data collection events. Family focus group participation was nominal and survey participation was nonexistent, despite robust outreach efforts including translation and event-based access. However, administrative records were replete with informal accounts of positive family feedback, and three enthusiastic focus group participants gave us insight into individual expectations and experiences. In short, this evaluation has collected a great deal of data on a great many data points. These data present a rich portrait of a complex program, even if they do not provide infallible measures of the program’s performance.
Page 36
Summer 2015 FAST+ Year-End Evaluation Report to FCPS
Recommendations The FAST+ program was served well by its team. Teachers, staff partners, and school and district administrators routinely went above and beyond their prescribed duties to enhance their practice, support their colleagues, and serve the FAST+ students and families. All members of the team were clearly invested in the program’s immediate and long-term success. The evaluation identified opportunities for program improvement. We recommend the following:
1. Improve the alignment of assessments and academic instruction. Supplement the assessments currently in use with more sensitive diagnostic assessments.
2. Organize enrichment schedules to promote deeper involvement in fewer activities. Allowing students some choice over their activities will promote relationship-building with adults and peers. It is also likely to increase their satisfaction with the program.
3. Offer teachers and staff joint training opportunities. Training teachers and staff
partners together will promote the consistent implementation of the Character Counts curriculum and the FCPS system of positive behavioral supports.
4. Offer teachers and staff collaborative planning opportunities. Integrating instructional
and enrichment activities may increase program cohesion, promote student engagement, and advance academic progress.
5. Showcase student work and play. Use traditional mediums (such as paper and email
newsletters) as well as communication technologies (such as social media) to share students’ day-to-day experiences and celebrate their accomplishments within the FAST+ community.
6. Engage families at natural points of contact. Give teachers and staff a list of reference list
of formal and informal opportunities for family involvement and a variety of reminder materials, such as refrigerator magnets. Hand out save-the-date flyers at dropoff and pickup. Accompany every handout with a question about their child and an offer of support.
7. Time events to motivate continued involvement. Holding a picnic or other social event
at the beginning of the program would reinforce the message of a welcoming environment and increase the likelihood that families will come back.
8. Create a hub of enriching community resources. Offer families lists of free community resources such as public libraries, museums, and parks. Highlight reading programs, adult educational programs, and cultural activities such as music and performing arts series.
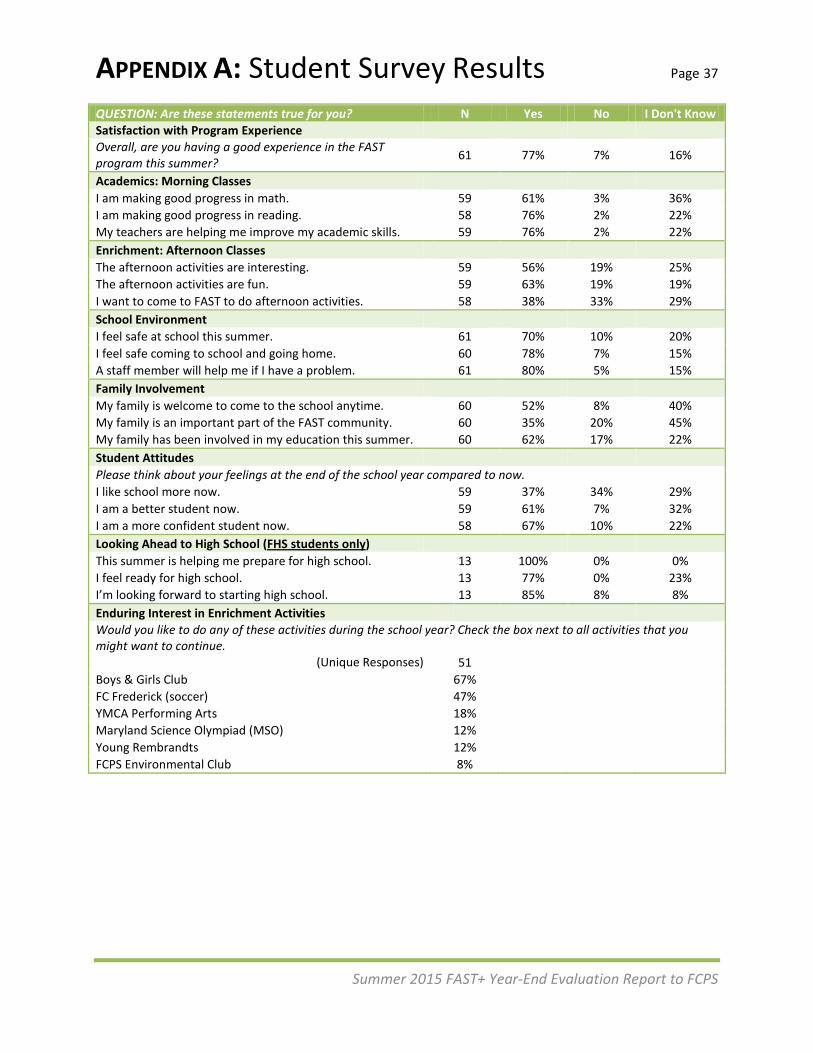
APPENDIX A: Student Survey Results Page 37
Summer 2015 FAST+ Year-End Evaluation Report to FCPS
QUESTION: Are these statements true for you? N Yes No I Don't Know Satisfaction with Program Experience Overall, are you having a good experience in the FAST program this summer? 61 77% 7% 16%
Academics: Morning Classes I am making good progress in math. 59 61% 3% 36% I am making good progress in reading. 58 76% 2% 22% My teachers are helping me improve my academic skills. 59 76% 2% 22% Enrichment: Afternoon Classes The afternoon activities are interesting. 59 56% 19% 25% The afternoon activities are fun. 59 63% 19% 19% I want to come to FAST to do afternoon activities. 58 38% 33% 29% School Environment I feel safe at school this summer. 61 70% 10% 20% I feel safe coming to school and going home. 60 78% 7% 15% A staff member will help me if I have a problem. 61 80% 5% 15% Family Involvement My family is welcome to come to the school anytime. 60 52% 8% 40% My family is an important part of the FAST community. 60 35% 20% 45% My family has been involved in my education this summer. 60 62% 17% 22% Student Attitudes Please think about your feelings at the end of the school year compared to now. I like school more now. 59 37% 34% 29% I am a better student now. 59 61% 7% 32% I am a more confident student now. 58 67% 10% 22% Looking Ahead to High School (FHS students only) This summer is helping me prepare for high school. 13 100% 0% 0% I feel ready for high school. 13 77% 0% 23% I’m looking forward to starting high school. 13 85% 8% 8% Enduring Interest in Enrichment Activities Would you like to do any of these activities during the school year? Check the box next to all activities that you might want to continue.
(Unique Responses) 51 Boys & Girls Club 67% FC Frederick (soccer) 47% YMCA Performing Arts 18% Maryland Science Olympiad (MSO) 12% Young Rembrandts 12% FCPS Environmental Club 8%
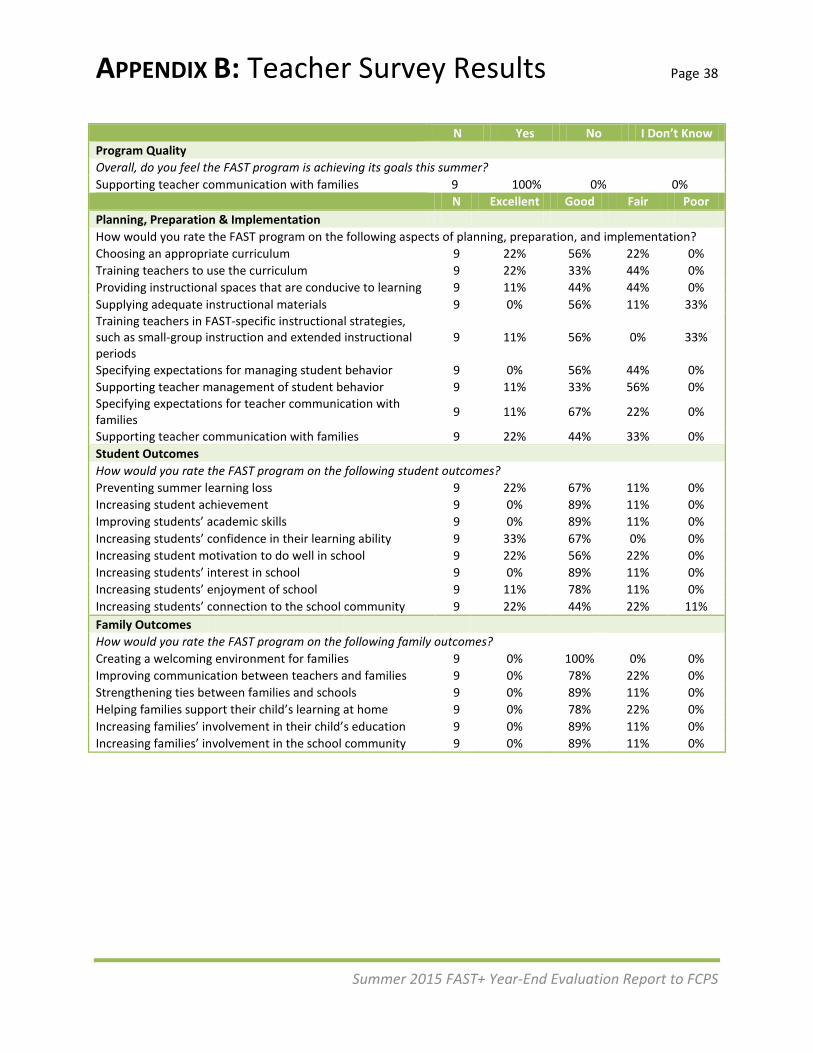
APPENDIX B: Teacher Survey Results Page 38
Summer 2015 FAST+ Year-End Evaluation Report to FCPS
N Yes No I Don’t Know Program Quality Overall, do you feel the FAST program is achieving its goals this summer? Supporting teacher communication with families 9 100% 0% 0% N Excellent Good Fair Poor Planning, Preparation & Implementation How would you rate the FAST program on the following aspects of planning, preparation, and implementation? Choosing an appropriate curriculum 9 22% 56% 22% 0% Training teachers to use the curriculum 9 22% 33% 44% 0% Providing instructional spaces that are conducive to learning 9 11% 44% 44% 0% Supplying adequate instructional materials 9 0% 56% 11% 33% Training teachers in FAST-specific instructional strategies, such as small-group instruction and extended instructional periods
9 11% 56% 0% 33%
Specifying expectations for managing student behavior 9 0% 56% 44% 0% Supporting teacher management of student behavior 9 11% 33% 56% 0% Specifying expectations for teacher communication with families 9 11% 67% 22% 0%
Supporting teacher communication with families 9 22% 44% 33% 0% Student Outcomes How would you rate the FAST program on the following student outcomes? Preventing summer learning loss 9 22% 67% 11% 0% Increasing student achievement 9 0% 89% 11% 0% Improving students’ academic skills 9 0% 89% 11% 0% Increasing students’ confidence in their learning ability 9 33% 67% 0% 0% Increasing student motivation to do well in school 9 22% 56% 22% 0% Increasing students’ interest in school 9 0% 89% 11% 0% Increasing students’ enjoyment of school 9 11% 78% 11% 0% Increasing students’ connection to the school community 9 22% 44% 22% 11% Family Outcomes How would you rate the FAST program on the following family outcomes? Creating a welcoming environment for families 9 0% 100% 0% 0% Improving communication between teachers and families 9 0% 78% 22% 0% Strengthening ties between families and schools 9 0% 89% 11% 0% Helping families support their child’s learning at home 9 0% 78% 22% 0% Increasing families’ involvement in their child’s education 9 0% 89% 11% 0% Increasing families’ involvement in the school community 9 0% 89% 11% 0%
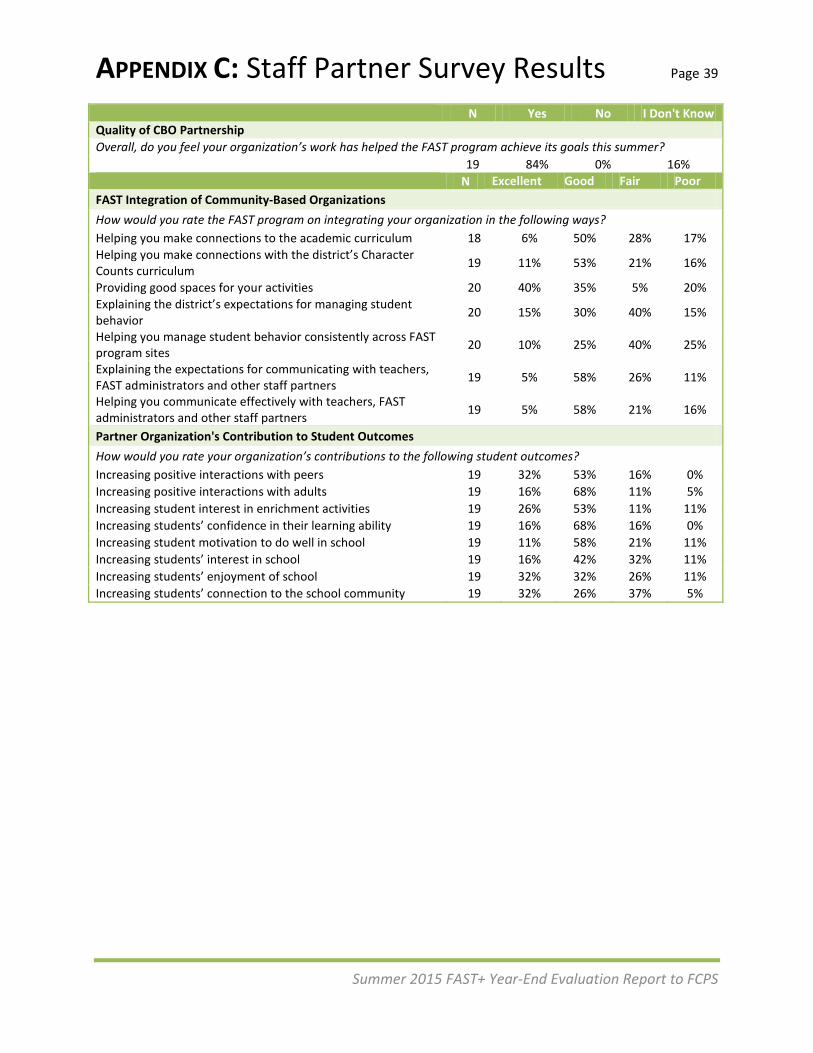
APPENDIX C: Staff Partner Survey Results Page 39
Summer 2015 FAST+ Year-End Evaluation Report to FCPS
N Yes No I Don't Know Quality of CBO Partnership Overall, do you feel your organization’s work has helped the FAST program achieve its goals this summer? 19 84% 0% 16% N Excellent Good Fair Poor FAST Integration of Community-Based Organizations How would you rate the FAST program on integrating your organization in the following ways? Helping you make connections to the academic curriculum 18 6% 50% 28% 17% Helping you make connections with the district’s Character Counts curriculum 19 11% 53% 21% 16%
Providing good spaces for your activities 20 40% 35% 5% 20% Explaining the district’s expectations for managing student behavior 20 15% 30% 40% 15%
Helping you manage student behavior consistently across FAST program sites 20 10% 25% 40% 25%
Explaining the expectations for communicating with teachers, FAST administrators and other staff partners 19 5% 58% 26% 11%
Helping you communicate effectively with teachers, FAST administrators and other staff partners 19 5% 58% 21% 16%
Partner Organization's Contribution to Student Outcomes How would you rate your organization’s contributions to the following student outcomes? Increasing positive interactions with peers 19 32% 53% 16% 0% Increasing positive interactions with adults 19 16% 68% 11% 5% Increasing student interest in enrichment activities 19 26% 53% 11% 11% Increasing students’ confidence in their learning ability 19 16% 68% 16% 0% Increasing student motivation to do well in school 19 11% 58% 21% 11% Increasing students’ interest in school 19 16% 42% 32% 11% Increasing students’ enjoyment of school 19 32% 32% 26% 11% Increasing students’ connection to the school community 19 32% 26% 37% 5%
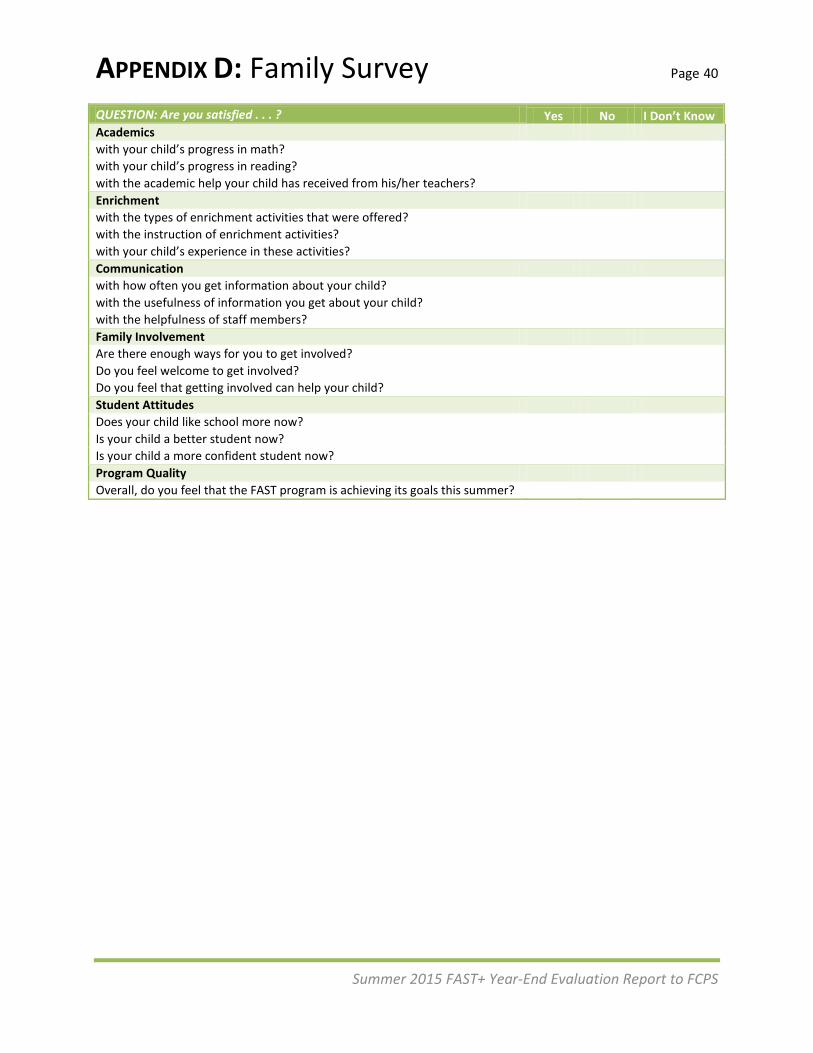
APPENDIX D: Family Survey Page 40
Summer 2015 FAST+ Year-End Evaluation Report to FCPS
QUESTION: Are you satisfied . . . ? Yes No I Don’t Know Academics with your child’s progress in math? with your child’s progress in reading? with the academic help your child has received from his/her teachers? Enrichment with the types of enrichment activities that were offered? with the instruction of enrichment activities? with your child’s experience in these activities? Communication with how often you get information about your child? with the usefulness of information you get about your child? with the helpfulness of staff members? Family Involvement Are there enough ways for you to get involved? Do you feel welcome to get involved? Do you feel that getting involved can help your child? Student Attitudes Does your child like school more now? Is your child a better student now? Is your child a more confident student now? Program Quality Overall, do you feel that the FAST program is achieving its goals this summer?
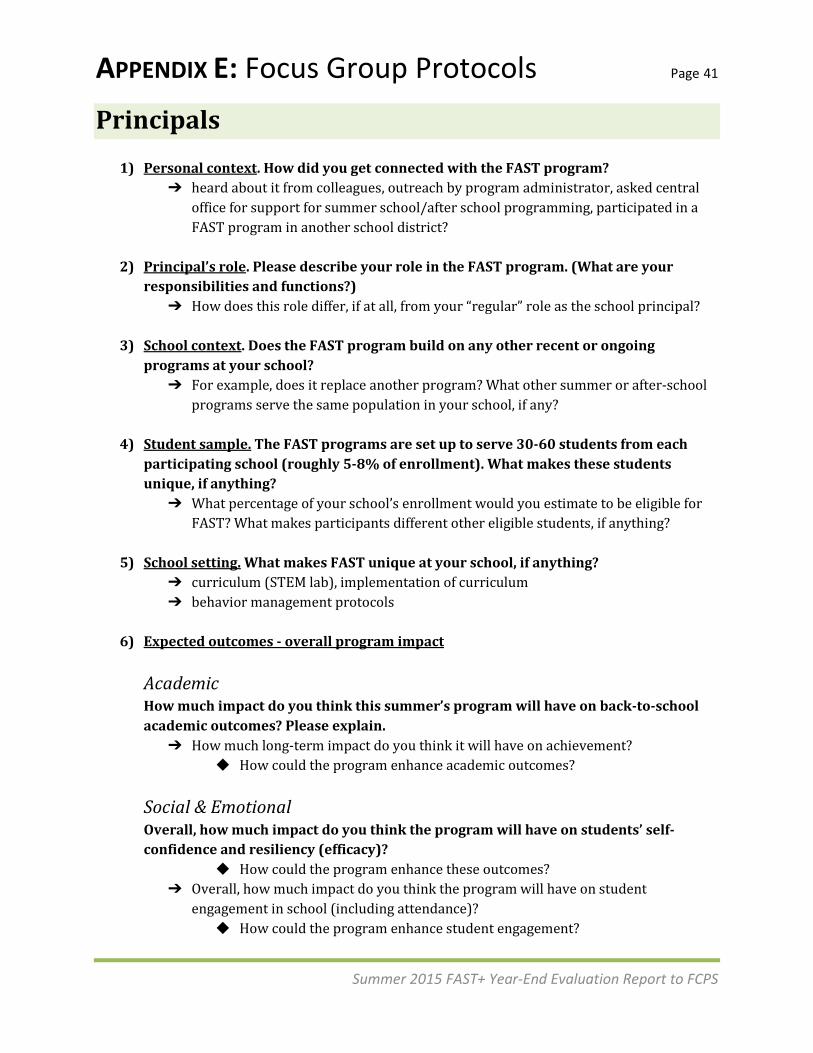
APPENDIX E: Focus Group Protocols Page 41
Summer 2015 FAST+ Year-End Evaluation Report to FCPS
Principals
1) Personal context. How did you get connected with the FAST program? ➔ heard about it from colleagues, outreach by program administrator, asked central
office for support for summer school/after school programming, participated in a FAST program in another school district?
2) Principal’s role. Please describe your role in the FAST program. (What are your
responsibilities and functions?) ➔ How does this role differ, if at all, from your “regular” role as the school principal?
3) School context. Does the FAST program build on any other recent or ongoing
programs at your school? ➔ For example, does it replace another program? What other summer or after-school
programs serve the same population in your school, if any?
4) Student sample. The FAST programs are set up to serve 30-60 students from each participating school (roughly 5-8% of enrollment). What makes these students unique, if anything?
➔ What percentage of your school’s enrollment would you estimate to be eligible for FAST? What makes participants different other eligible students, if anything?
5) School setting. What makes FAST unique at your school, if anything?
➔ curriculum (STEM lab), implementation of curriculum ➔ behavior management protocols
6) Expected outcomes - overall program impact
Academic How much impact do you think this summer’s program will have on back-to-school academic outcomes? Please explain.
➔ How much long-term impact do you think it will have on achievement? ◆ How could the program enhance academic outcomes?
Social & Emotional Overall, how much impact do you think the program will have on students’ self-confidence and resiliency (efficacy)?
◆ How could the program enhance these outcomes? ➔ Overall, how much impact do you think the program will have on student
engagement in school (including attendance)? ◆ How could the program enhance student engagement?
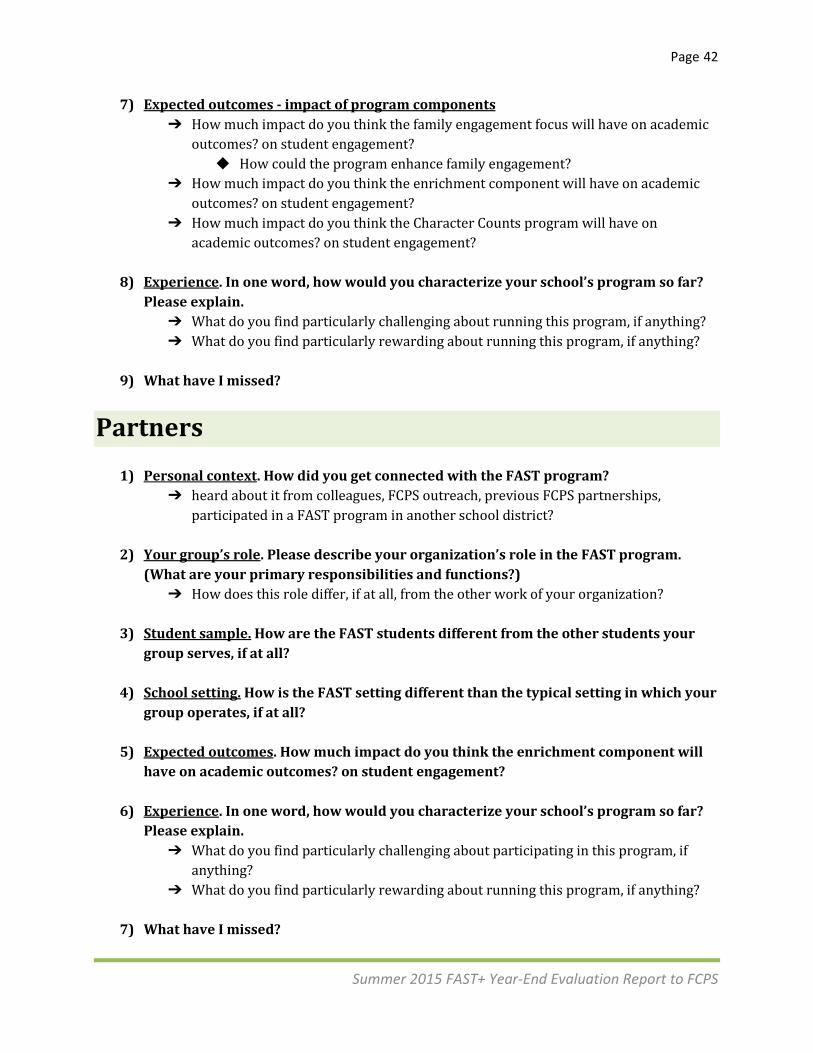
Page 42
Summer 2015 FAST+ Year-End Evaluation Report to FCPS
7) Expected outcomes - impact of program components ➔ How much impact do you think the family engagement focus will have on academic
outcomes? on student engagement? ◆ How could the program enhance family engagement?
➔ How much impact do you think the enrichment component will have on academic outcomes? on student engagement?
➔ How much impact do you think the Character Counts program will have on academic outcomes? on student engagement?
8) Experience. In one word, how would you characterize your school’s program so far?
Please explain. ➔ What do you find particularly challenging about running this program, if anything? ➔ What do you find particularly rewarding about running this program, if anything?
9) What have I missed?
Partners
1) Personal context. How did you get connected with the FAST program? ➔ heard about it from colleagues, FCPS outreach, previous FCPS partnerships,
participated in a FAST program in another school district?
2) Your group’s role. Please describe your organization’s role in the FAST program. (What are your primary responsibilities and functions?)
➔ How does this role differ, if at all, from the other work of your organization?
3) Student sample. How are the FAST students different from the other students your group serves, if at all?
4) School setting. How is the FAST setting different than the typical setting in which your
group operates, if at all?
5) Expected outcomes. How much impact do you think the enrichment component will have on academic outcomes? on student engagement?
6) Experience. In one word, how would you characterize your school’s program so far?
Please explain. ➔ What do you find particularly challenging about participating in this program, if
anything? ➔ What do you find particularly rewarding about running this program, if anything?
7) What have I missed?
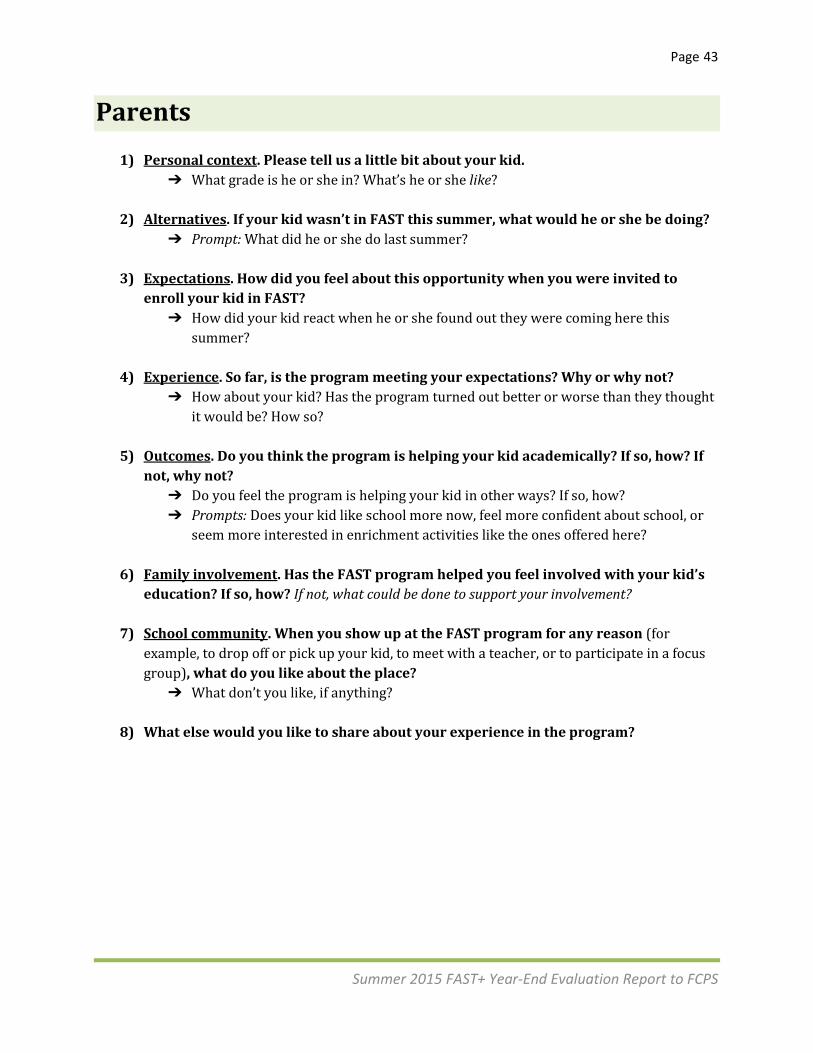
Page 43
Summer 2015 FAST+ Year-End Evaluation Report to FCPS
Parents
1) Personal context. Please tell us a little bit about your kid. ➔ What grade is he or she in? What’s he or she like?
2) Alternatives. If your kid wasn’t in FAST this summer, what would he or she be doing?
➔ Prompt: What did he or she do last summer?
3) Expectations. How did you feel about this opportunity when you were invited to enroll your kid in FAST?
➔ How did your kid react when he or she found out they were coming here this summer?
4) Experience. So far, is the program meeting your expectations? Why or why not?
➔ How about your kid? Has the program turned out better or worse than they thought it would be? How so?
5) Outcomes. Do you think the program is helping your kid academically? If so, how? If
not, why not? ➔ Do you feel the program is helping your kid in other ways? If so, how? ➔ Prompts: Does your kid like school more now, feel more confident about school, or
seem more interested in enrichment activities like the ones offered here?
6) Family involvement. Has the FAST program helped you feel involved with your kid’s education? If so, how? If not, what could be done to support your involvement?
7) School community. When you show up at the FAST program for any reason (for
example, to drop off or pick up your kid, to meet with a teacher, or to participate in a focus group), what do you like about the place?
➔ What don’t you like, if anything?
8) What else would you like to share about your experience in the program?
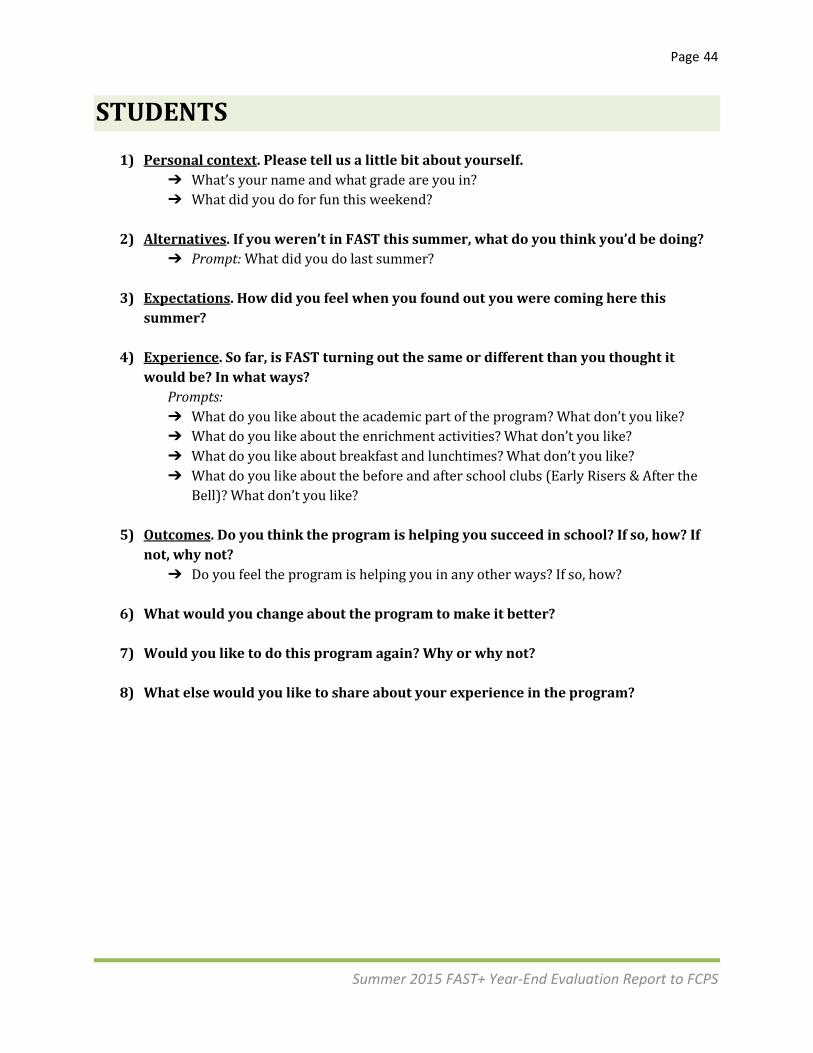
Page 44
Summer 2015 FAST+ Year-End Evaluation Report to FCPS
STUDENTS
1) Personal context. Please tell us a little bit about yourself. ➔ What’s your name and what grade are you in? ➔ What did you do for fun this weekend?
2) Alternatives. If you weren’t in FAST this summer, what do you think you’d be doing?
➔ Prompt: What did you do last summer?
3) Expectations. How did you feel when you found out you were coming here this summer?
4) Experience. So far, is FAST turning out the same or different than you thought it
would be? In what ways? Prompts: ➔ What do you like about the academic part of the program? What don’t you like? ➔ What do you like about the enrichment activities? What don’t you like? ➔ What do you like about breakfast and lunchtimes? What don’t you like? ➔ What do you like about the before and after school clubs (Early Risers & After the
Bell)? What don’t you like?
5) Outcomes. Do you think the program is helping you succeed in school? If so, how? If not, why not?
➔ Do you feel the program is helping you in any other ways? If so, how?
6) What would you change about the program to make it better?
7) Would you like to do this program again? Why or why not?
8) What else would you like to share about your experience in the program?
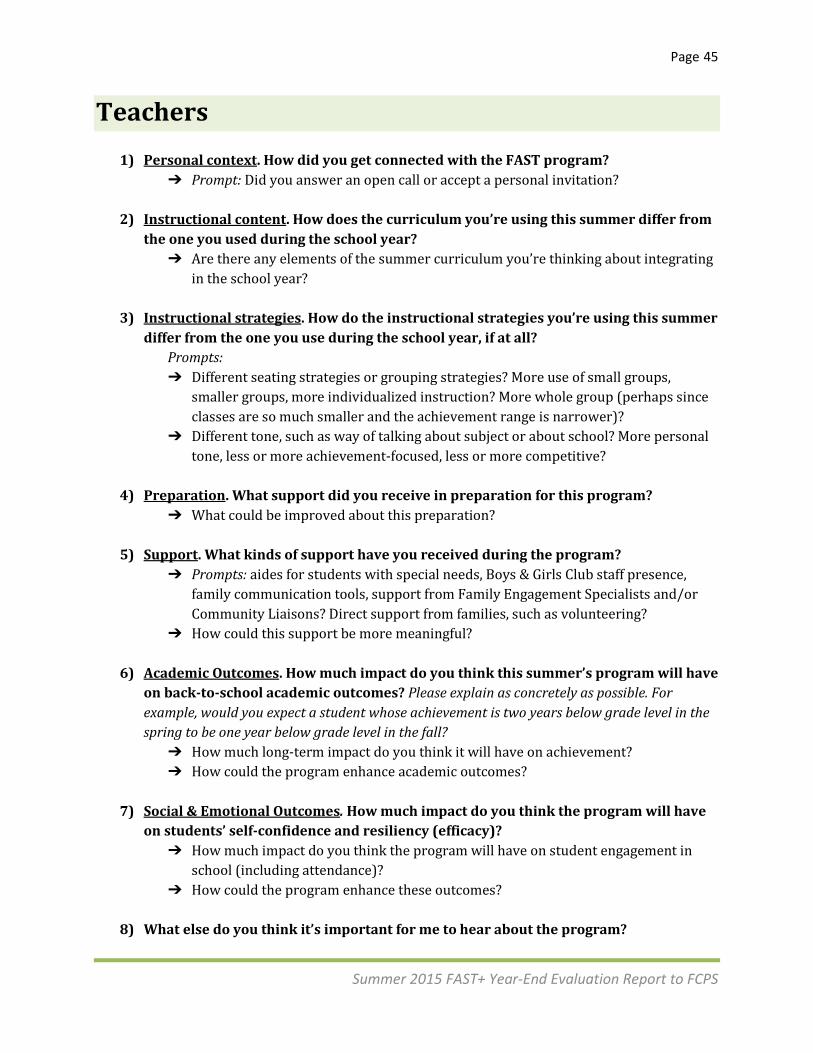
Page 45
Summer 2015 FAST+ Year-End Evaluation Report to FCPS
Teachers
1) Personal context. How did you get connected with the FAST program? ➔ Prompt: Did you answer an open call or accept a personal invitation?
2) Instructional content. How does the curriculum you’re using this summer differ from
the one you used during the school year? ➔ Are there any elements of the summer curriculum you’re thinking about integrating
in the school year?
3) Instructional strategies. How do the instructional strategies you’re using this summer differ from the one you use during the school year, if at all?
Prompts: ➔ Different seating strategies or grouping strategies? More use of small groups,
smaller groups, more individualized instruction? More whole group (perhaps since classes are so much smaller and the achievement range is narrower)?
➔ Different tone, such as way of talking about subject or about school? More personal tone, less or more achievement-focused, less or more competitive?
4) Preparation. What support did you receive in preparation for this program?
➔ What could be improved about this preparation?
5) Support. What kinds of support have you received during the program? ➔ Prompts: aides for students with special needs, Boys & Girls Club staff presence,
family communication tools, support from Family Engagement Specialists and/or Community Liaisons? Direct support from families, such as volunteering?
➔ How could this support be more meaningful?
6) Academic Outcomes. How much impact do you think this summer’s program will have on back-to-school academic outcomes? Please explain as concretely as possible. For example, would you expect a student whose achievement is two years below grade level in the spring to be one year below grade level in the fall?
➔ How much long-term impact do you think it will have on achievement? ➔ How could the program enhance academic outcomes?
7) Social & Emotional Outcomes. How much impact do you think the program will have
on students’ self-confidence and resiliency (efficacy)? ➔ How much impact do you think the program will have on student engagement in
school (including attendance)? ➔ How could the program enhance these outcomes?
8) What else do you think it’s important for me to hear about the program?