Embed Size (px)
Citation preview
2015 Electric Vehicle Market Summary and Barriers
Dr. David Block Dr. Paul Brooker
Florida Solar Energy Center 1679 Clearlake Road
Cocoa, FL 32922-5703 E-mail: [email protected]
Submitted to:
Ms. Denise Dunn Grants Manager
University Transportation Centers Program Office Office of the Assistant Secretary for
Research and Innovative Technology Administration (OST-R) 1200 New Jersey Avenue, SE
Washington, DC 20590 E-mail: [email protected]
DOT Contract Number: DTRT13-G-UTC51 FSEC Report Number: FSEC-CR-2027-16
June 2016
2
Electric Vehicle Transportation Center
Report on
2015 Electric Vehicle Market Summary and Barriers
David Block, Paul Brooker Florida Solar Energy Center
July 30, 2016
1. Summary
The object of this research report is to present the current market status of plug-in-electric vehicles (PEVs) and to predict their future penetration within the world and U.S. markets. The sales values for 2015 show that China leads in yearly sales at 214,283 (triple increase for 2014) followed by Western Europe at 184,500 vehicles sold. The U.S. is third at 115,262 followed by Japan at 46,339 vehicles. These four countries comprise 95% of the global sales market. The world total of EV sales for 2015 is estimated to be 565,668 up from 315,519 in 2014. This data also shows that the overall world growth is 79% and that Western Europe is now ahead of the U.S. in total cumulative vehicles.
Within the U.S., the PEV sales results for 2015 show that 115,262 vehicles were sold as compared to 118,882 vehicles in 2014 which is lower by -3 % from 2014. However, sales for the first 6 months of 2016 are 19% greater than the sales for the same period in 2015. On a state basis, California is the largest market with about 55% of the sales for 2015 and a growth of 4.6% over 2014. The total cumulative number of EVs sold in the U.S. over the six year lifetime is now at more than 400,000 vehicles. Looking at the U.S. PEV sales data, the future has dimmed over the past year. However, when consideration is given to the world market, the future is extremely bright and the U.S. may well be left behind. PEVs in the world market are rapidly growing due to the various country policies and to the development of lithium-ion batteries from both a technological and manufacturing standpoint.
The current work also evaluated the types of barriers to EV usage and the actions, incentives and research to overcome the barriers. The barriers to large scale EV usage are costs, range, availability of charging stations, charging time, battery life and infrastructure, standard and permitting. Results are presented for overcoming each of the barriers that includes incentives and technical progress. 2. Electric Vehicle Definitions Plug-in Electric Vehicle (PEV): This refers to any vehicle that plugs into the electric grid for all or part of its power source. PEVs are battery-electric vehicles (BEV) such as the Nissan Leaf, plug-in hybrid electric vehicles (PHEVs) such as the Chevy Volt, or extended-range electric vehicles (EREVs).
Hybrid Electric Vehicle (HEV): HEVs are those vehicles that combine a conventional internal combustion engine (ICE) propulsion system with an electric propulsion system, but that whose batteries are not recharged by plugging into the grid. Examples of HEVs include the original Toyota Prius, Honda Accord hybrid, or the Hyundai Sonata hybrid.
3
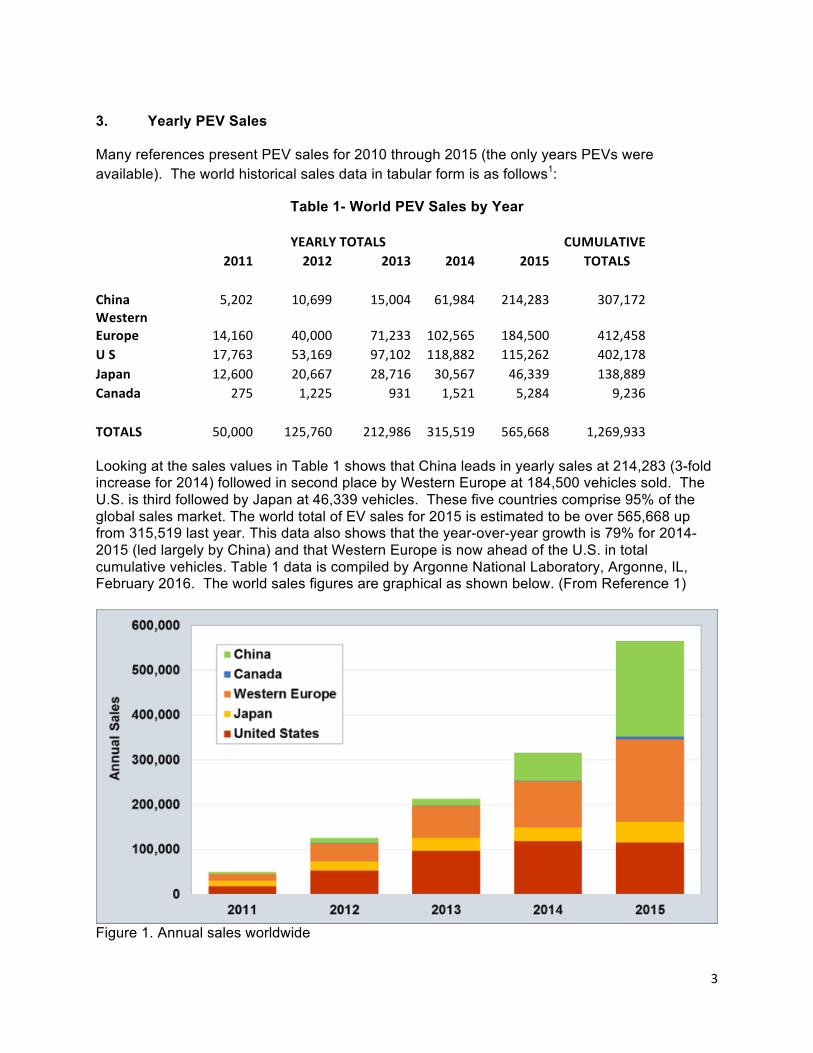
3. Yearly PEV Sales Many references present PEV sales for 2010 through 2015 (the only years PEVs were available). The world historical sales data in tabular form is as follows1:
Table 1- World PEV Sales by Year
YEARLY TOTALS
CUMULATIVE
2011 2012 2013 2014 2015 TOTALS
China 5,202 10,699 15,004 61,984 214,283 307,172 Western Europe 14,160 40,000 71,233 102,565 184,500 412,458 U S 17,763 53,169 97,102 118,882 115,262 402,178 Japan 12,600 20,667 28,716 30,567 46,339 138,889 Canada 275 1,225 931 1,521 5,284 9,236
TOTALS 50,000 125,760 212,986 315,519 565,668 1,269,933 Looking at the sales values in Table 1 shows that China leads in yearly sales at 214,283 (3-fold increase for 2014) followed in second place by Western Europe at 184,500 vehicles sold. The U.S. is third followed by Japan at 46,339 vehicles. These five countries comprise 95% of the global sales market. The world total of EV sales for 2015 is estimated to be over 565,668 up from 315,519 last year. This data also shows that the year-over-year growth is 79% for 2014-2015 (led largely by China) and that Western Europe is now ahead of the U.S. in total cumulative vehicles. Table 1 data is compiled by Argonne National Laboratory, Argonne, IL, February 2016. The world sales figures are graphical as shown below. (From Reference 1)
Figure 1. Annual sales worldwide
4
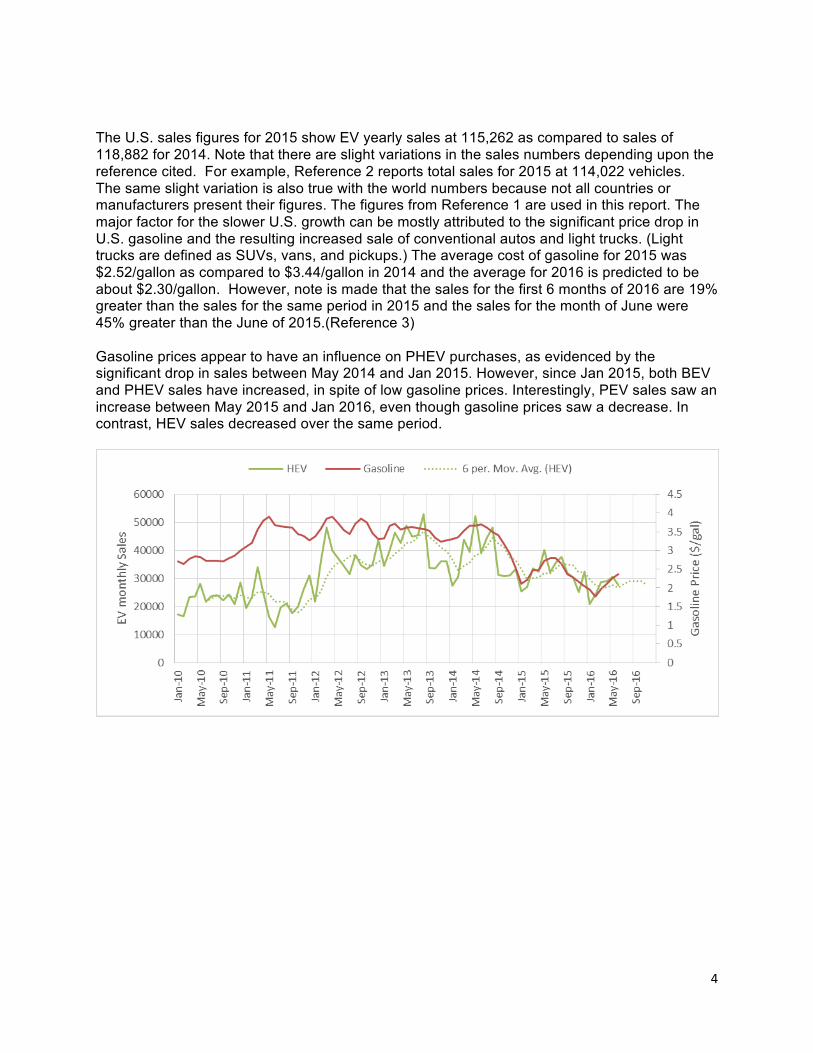
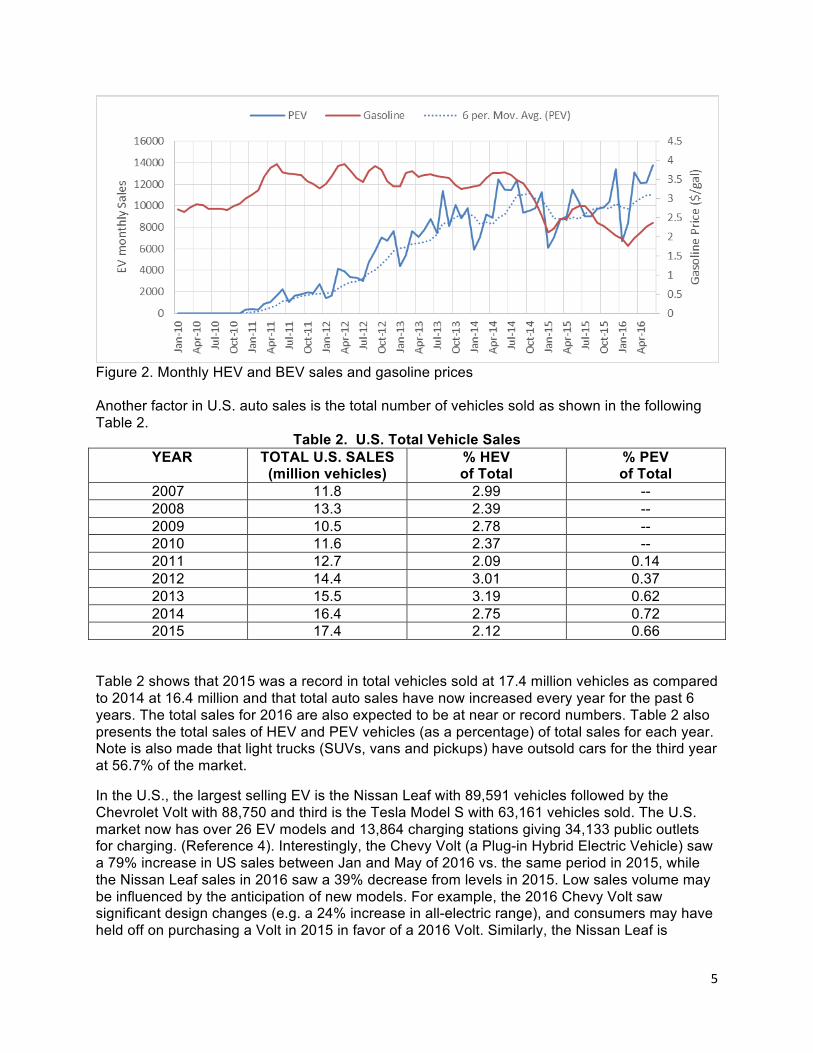
The U.S. sales figures for 2015 show EV yearly sales at 115,262 as compared to sales of 118,882 for 2014. Note that there are slight variations in the sales numbers depending upon the reference cited. For example, Reference 2 reports total sales for 2015 at 114,022 vehicles. The same slight variation is also true with the world numbers because not all countries or manufacturers present their figures. The figures from Reference 1 are used in this report. The major factor for the slower U.S. growth can be mostly attributed to the significant price drop in U.S. gasoline and the resulting increased sale of conventional autos and light trucks. (Light trucks are defined as SUVs, vans, and pickups.) The average cost of gasoline for 2015 was $2.52/gallon as compared to $3.44/gallon in 2014 and the average for 2016 is predicted to be about $2.30/gallon. However, note is made that the sales for the first 6 months of 2016 are 19% greater than the sales for the same period in 2015 and the sales for the month of June were 45% greater than the June of 2015.(Reference 3) Gasoline prices appear to have an influence on PHEV purchases, as evidenced by the significant drop in sales between May 2014 and Jan 2015. However, since Jan 2015, both BEV and PHEV sales have increased, in spite of low gasoline prices. Interestingly, PEV sales saw an increase between May 2015 and Jan 2016, even though gasoline prices saw a decrease. In contrast, HEV sales decreased over the same period.
5
Figure 2. Monthly HEV and BEV sales and gasoline prices Another factor in U.S. auto sales is the total number of vehicles sold as shown in the following Table 2.
Table 2. U.S. Total Vehicle Sales YEAR TOTAL U.S. SALES
(million vehicles) % HEV of Total
% PEV of Total
2007 11.8 2.99 -- 2008 13.3 2.39 -- 2009 10.5 2.78 -- 2010 11.6 2.37 -- 2011 12.7 2.09 0.14 2012 14.4 3.01 0.37 2013 15.5 3.19 0.62 2014 16.4 2.75 0.72 2015 17.4 2.12 0.66
Table 2 shows that 2015 was a record in total vehicles sold at 17.4 million vehicles as compared to 2014 at 16.4 million and that total auto sales have now increased every year for the past 6 years. The total sales for 2016 are also expected to be at near or record numbers. Table 2 also presents the total sales of HEV and PEV vehicles (as a percentage) of total sales for each year. Note is also made that light trucks (SUVs, vans and pickups) have outsold cars for the third year at 56.7% of the market.
In the U.S., the largest selling EV is the Nissan Leaf with 89,591 vehicles followed by the Chevrolet Volt with 88,750 and third is the Tesla Model S with 63,161 vehicles sold. The U.S. market now has over 26 EV models and 13,864 charging stations giving 34,133 public outlets for charging. (Reference 4). Interestingly, the Chevy Volt (a Plug-in Hybrid Electric Vehicle) saw a 79% increase in US sales between Jan and May of 2016 vs. the same period in 2015, while the Nissan Leaf sales in 2016 saw a 39% decrease from levels in 2015. Low sales volume may be influenced by the anticipation of new models. For example, the 2016 Chevy Volt saw significant design changes (e.g. a 24% increase in all-electric range), and consumers may have held off on purchasing a Volt in 2015 in favor of a 2016 Volt. Similarly, the Nissan Leaf is
6
expected to release a new model with around 120 miles of range, and this may be causing some consumers to hesitate purchasing a new Leaf until the 2017 model is available.
4. PEVs by State
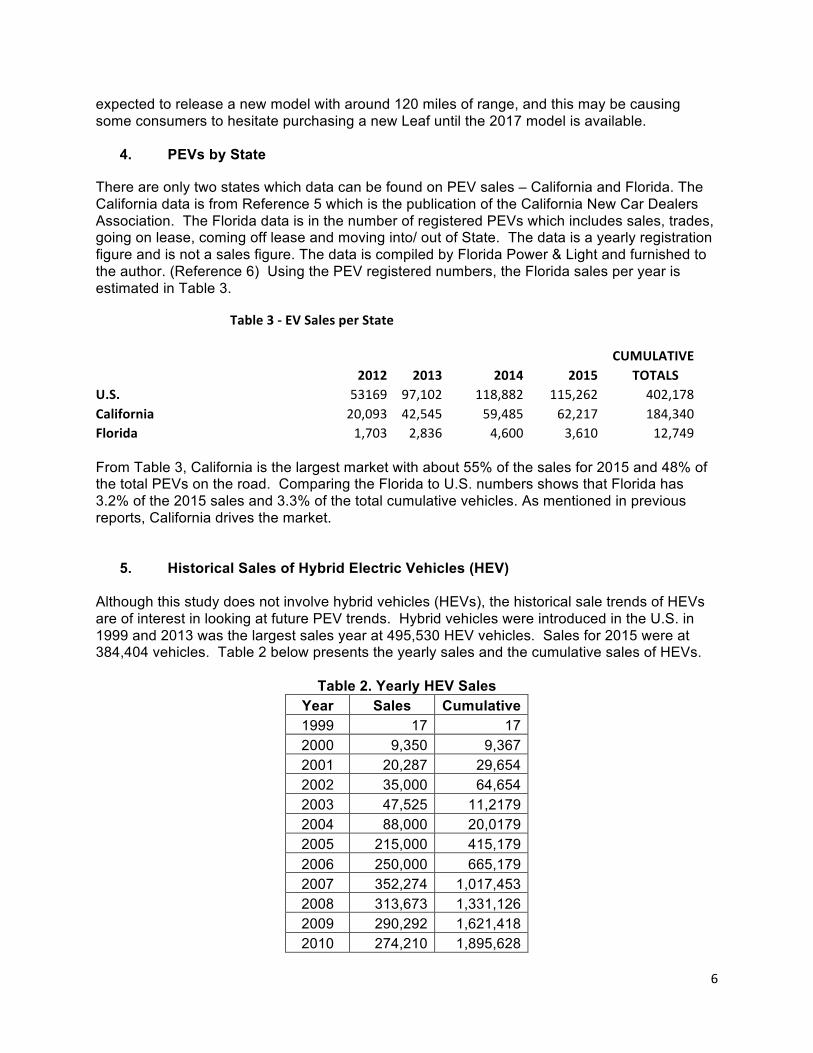
There are only two states which data can be found on PEV sales – California and Florida. The California data is from Reference 5 which is the publication of the California New Car Dealers Association. The Florida data is in the number of registered PEVs which includes sales, trades, going on lease, coming off lease and moving into/ out of State. The data is a yearly registration figure and is not a sales figure. The data is compiled by Florida Power & Light and furnished to the author. (Reference 6) Using the PEV registered numbers, the Florida sales per year is estimated in Table 3.
Table 3 -‐ EV Sales per State
CUMULATIVE
2012 2013 2014 2015 TOTALS
U.S.
53169 97,102 118,882 115,262 402,178 California
20,093 42,545 59,485 62,217 184,340
Florida
1,703 2,836 4,600 3,610 12,749 From Table 3, California is the largest market with about 55% of the sales for 2015 and 48% of the total PEVs on the road. Comparing the Florida to U.S. numbers shows that Florida has 3.2% of the 2015 sales and 3.3% of the total cumulative vehicles. As mentioned in previous reports, California drives the market.
5. Historical Sales of Hybrid Electric Vehicles (HEV)
Although this study does not involve hybrid vehicles (HEVs), the historical sale trends of HEVs are of interest in looking at future PEV trends. Hybrid vehicles were introduced in the U.S. in 1999 and 2013 was the largest sales year at 495,530 HEV vehicles. Sales for 2015 were at 384,404 vehicles. Table 2 below presents the yearly sales and the cumulative sales of HEVs.
Table 2. Yearly HEV Sales Year Sales Cumulative 1999 17 17 2000 9,350 9,367 2001 20,287 29,654 2002 35,000 64,654 2003 47,525 11,2179 2004 88,000 20,0179 2005 215,000 415,179 2006 250,000 665,179 2007 352,274 1,017,453 2008 313,673 1,331,126 2009 290,292 1,621,418 2010 274,210 1,895,628
7
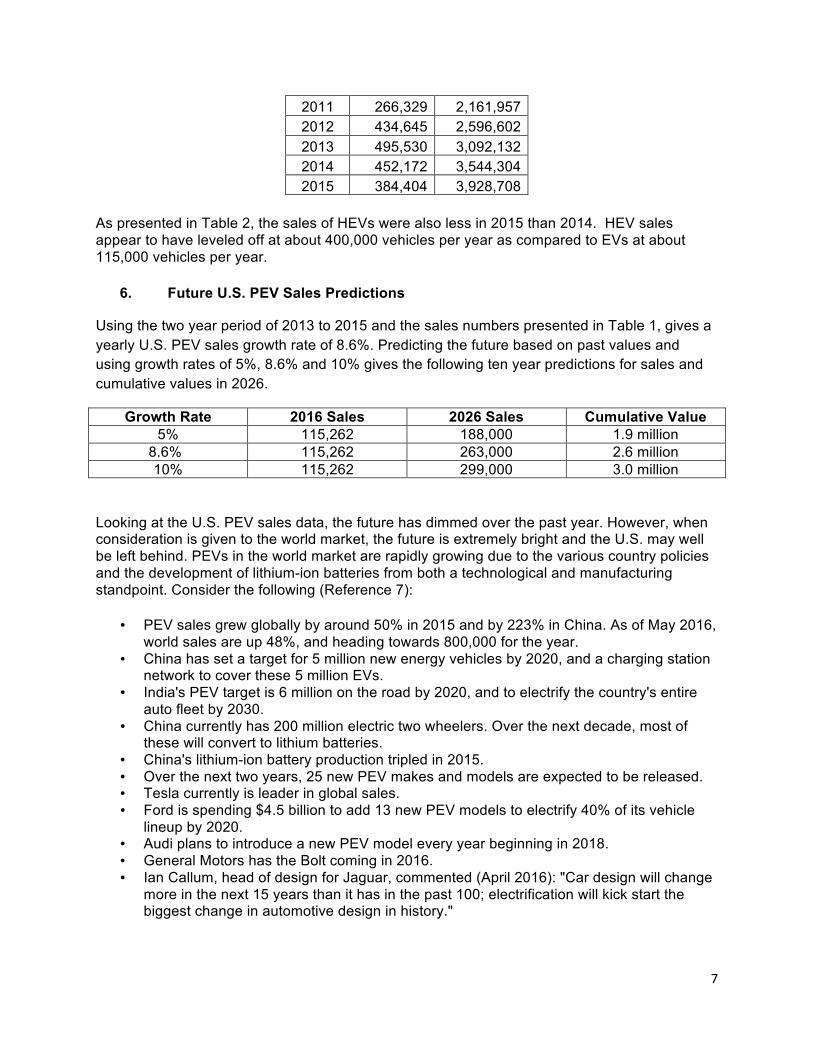
2011 266,329 2,161,957 2012 434,645 2,596,602 2013 495,530 3,092,132 2014 452,172 3,544,304 2015 384,404 3,928,708
As presented in Table 2, the sales of HEVs were also less in 2015 than 2014. HEV sales appear to have leveled off at about 400,000 vehicles per year as compared to EVs at about 115,000 vehicles per year.
6. Future U.S. PEV Sales Predictions
Using the two year period of 2013 to 2015 and the sales numbers presented in Table 1, gives a yearly U.S. PEV sales growth rate of 8.6%. Predicting the future based on past values and using growth rates of 5%, 8.6% and 10% gives the following ten year predictions for sales and cumulative values in 2026.
Growth Rate 2016 Sales 2026 Sales Cumulative Value 5% 115,262 188,000 1.9 million
8.6% 115,262 263,000 2.6 million 10% 115,262 299,000 3.0 million
Looking at the U.S. PEV sales data, the future has dimmed over the past year. However, when consideration is given to the world market, the future is extremely bright and the U.S. may well be left behind. PEVs in the world market are rapidly growing due to the various country policies and the development of lithium-ion batteries from both a technological and manufacturing standpoint. Consider the following (Reference 7):
• PEV sales grew globally by around 50% in 2015 and by 223% in China. As of May 2016, world sales are up 48%, and heading towards 800,000 for the year.
• China has set a target for 5 million new energy vehicles by 2020, and a charging station network to cover these 5 million EVs.
• India's PEV target is 6 million on the road by 2020, and to electrify the country's entire auto fleet by 2030.
• China currently has 200 million electric two wheelers. Over the next decade, most of these will convert to lithium batteries.
• China's lithium-ion battery production tripled in 2015. • Over the next two years, 25 new PEV makes and models are expected to be released. • Tesla currently is leader in global sales. • Ford is spending $4.5 billion to add 13 new PEV models to electrify 40% of its vehicle
lineup by 2020. • Audi plans to introduce a new PEV model every year beginning in 2018. • General Motors has the Bolt coming in 2016. • Ian Callum, head of design for Jaguar, commented (April 2016): "Car design will change
more in the next 15 years than it has in the past 100; electrification will kick start the biggest change in automotive design in history."
8
• Daimler Mercedes Benz comments (in June 2016), "Battery electric cars will be able to run for 500 kilometers between five-minute recharges - and outperform any petrol-powered car on the road - in less than five years."
• Goldman Sachs comments: "lithium the new gasoline," they forecast 22% EV penetration by 2025, and "lithium demand for all EV applications could grow more than 11x by 2025."
• The lithium-ion price in China trebled in the past 6 months from 6,000 per tonne, to over 18,000 per tonne. This is mostly due to increased demand from electric vehicles (buses, cars and bikes).
• 12 lithium ion battery "mega factories" are set to come on line (or expand) by 2020, (with 7 of those in China).
• Tesla's Elon Musk recently announced that Tesla "could triple the total planned battery output of its Gigafactory to ~105 GWh of cells and ~150 GWh of battery packs”. This is over 3 times the current total lithium-ion battery production worldwide. He also stated around half of this capacity would be needed to cater for the growing energy storage business.
• EVs accounted for nearly 30% of all new cars sold in Norway in 2015. • Norway's four major political parties are readying a bill to ban the sale of gas-powered
cars by 2025. • Germany announced that by 2030, all new cars registered in the country must be electric
vehicles.
7. Activities to Overcome Barriers
7.1 Barriers
The growth of PEVs is dependent upon the barriers and the actions, incentives or research to overcome the barriers. The barriers to large scale PEVs usage can be stated as follows:
1. Vehicle cost and resale 2. Vehicle range 3. Availability of charging stations 4. Charging time 5. Vehicle maintenance and, in particular, battery life 6. Infrastructure, standards, and permitting
The above barriers can be classed as barriers related to cost, charging, batteries, infrastructure, policies/regulations and technology or manufacturing challenges.
7.2 Actions to Overcome Barriers
Beginning with cost barriers, an EV will generally cost more than the comparable ICE. This negative barrier is balanced on the positive side by an EV cost per mile of about $1 per gallon equivalent for electricity at 12 cents/kWh and minimal to very little maintenance costs. It is also noted that U.S. electricity costs are much more stable than oil prices giving an EV a more predictable future fuel cost value. Also in 2012, President Obama announced the EV Everywhere Grand Challenge. This Department of Energy (DOE) program has the goal of making PEVs that are as affordable and convenient as ICEs by 2022. The specific numbers are that the EV purchase cost combined with the operating cost and a range of 280 miles will be comparable to that of an ICE vehicle of similar size after 5 years of ownership. (Reference 8) The EV Everywhere technical goals and results are presented in the following sections.
9
The second cost consideration, but not as important as initial cost, is the resale value. Since EVs are just beginning to hit the resale market there is minimal experience. Our experience in purchasing two Leafs for research purposes showed that EVs depreciated much the same as conventional vehicles. But, note is made that EVs do not frequently change body styles and there is a much anticipated public wait for new vehicles with longer range batteries, thus, hurting resale. Any discussion of costs leads to the laws and regulations that both federal and state governments have passed that give incentives to assist EV owners with a variety of usage and cost incentives. At the federal level, there is an EV purchase personal income tax credit of $2,500 to $7,500 depending upon vehicle battery size. Both the Leaf and Volt qualify for the $7,500 value. This incentive will begin to be phased out once an individual model’s cumulative sales exceed 200,000 units. At the state and local levels there are numerous types of incentives. These incentives can be classed as tax credits, registration fee reductions, toll reductions, high-occupancy vehicle lane exemptions, financial incentives, emission test exemptions, parking incentives and utility rate reductions. Again, the Income or Other Tax Credit/Exemption incentive is most important and is offered in 15 states. There are incentives in 37 states. For anyone interested in an individual state incentive there are two excellent references that list the incentives by state (see References 9 or 10). Following the above comments on cost, which have high potential of being solved, is what many researchers and industry representatives feel is the most critical barrier, the barrier of range anxiety. There are two solutions to the range problem. The first is to increase battery energy and decrease weight which is a DOE technical program goal and is discussed later in this section. The second solution is to research, develop and demonstrate the use of wireless charging and to place the wireless charging within the vehicle roadway of travel. The wireless charging option is receiving expanded R&D and is being tested by researchers at Utah State University which has a wireless track and test bed facility. (Reference 11) Results for the barrier on the number of charging stations shows that the federal government initially provided heavily subsidized charging station installations and that presently new charging stations are being supported by state or local governments or private firms. Today, the total charging station number continues to increase. In the U.S., there are 13,864 charging stations giving 34,133 public charging outlets. Again, California leads the U.S. with over 20% of the charging stations and outlets. Charging time is not considered a significant barrier since most vehicles are charged at the vehicle owner’s home during the night. Also, DC fast chargers can supply a 90-95% charge in 20-30 minutes for people on the go. A recent report by Navigant Research (Reference 12) has shown that the optimal placing of 95 DC fast charging stations would enable EVs to travel long distances from the coasts and across the nation and that 408 stations would create a comprehensive U.S. network. Next are the results from DOE funded work on EV’s technical barriers. The technical barriers are related to vehicle design and battery technology and are addressed by DOE and product manufacturers. As previously mentioned, the EV Everywhere Grand Challenge announced in March 2012 and the resulting EV Roadmap has resulted in technical targets that fall into four
10
areas: battery R & D; electric drive system R & D; reducing vehicle weight; and advanced climate control technologies. (Reference 13) Specific goals include:
• Cutting battery costs from their current $500/kWh to $125/kWh and increasing energy density from 50 Wh/L to 400 Wh/L
• Eliminating almost 30% of vehicle weight through lighter weight materials • Reducing the cost of electric drive systems from $40/kW to $8/kW
The program is now at end of the fourth year and the published results are as follows:
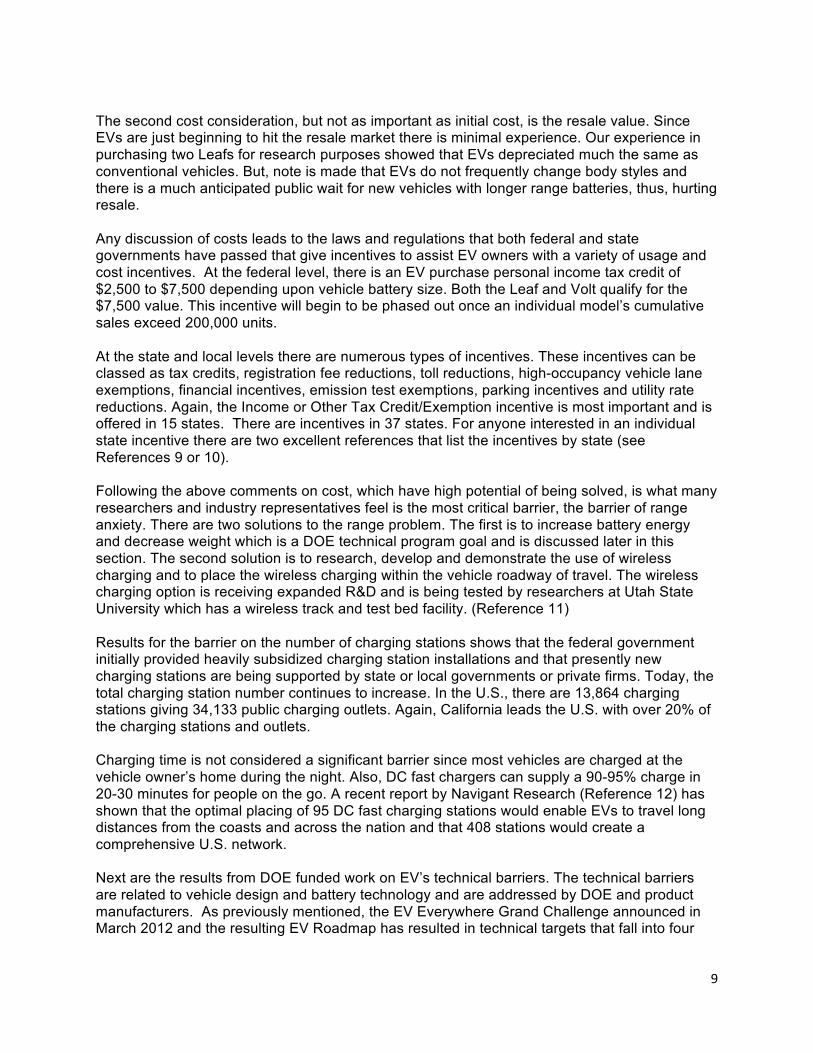
1. Battery cost and range – In 2016, Christy Cooper (Acting Director of DOE’s Vehicle Technology Office) stated that Li-ion battery costs have decreased by over 70% since 2008 (see Figure 3).
Figure 3. Battery Costs and Energy Density (Reference 14)
In late 2015, GM announced that their Li-ion cell costs were at $145/kWh, with projections to reach $100/kWh by 2022 (Reference 15). Anecdotal reports indicate that Tesla may have battery pack costs below $190/kWh (Reference 16). DOE has presented an analysis that illustrates a pathway to achieve battery packs at $100/kWh (Figure 4).
11
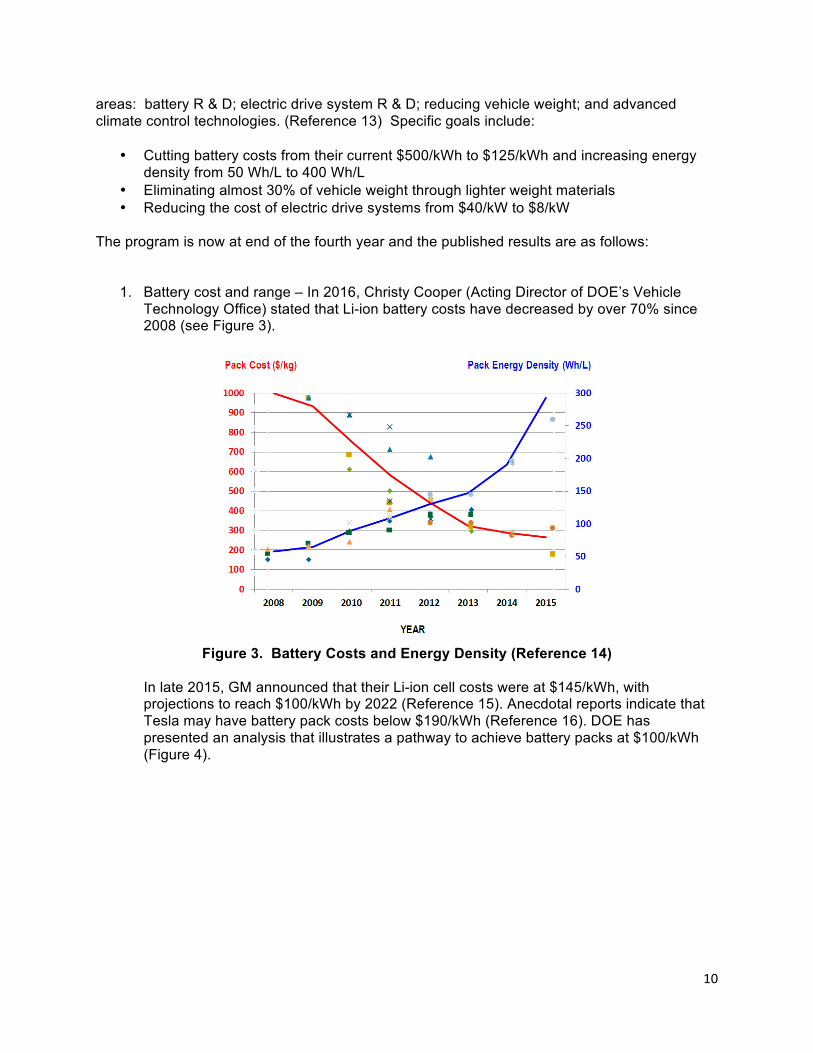
Figure 4. Projected cost for a $100/kWh battery pack (Reference 17)
These results were obtained using the ANL BatPaC model, and demonstrate that developing a silicon anode with high capacity cathode represents a low-risk pathway to pack costs around $125/kWh. The higher risk, but greater reward, is to develop lithium metal anodes, which could bring pack costs down to less than $100/kWh. This model represents a “best case” scenario, and does not consider potential chemistry problems or performance limitations of the advanced cell architectures. A major issue facing the development of Si-based anodes is the high performance loss that occurred after only 400 cycles. If this technology is to be employed, more research is needed to develop a mitigation strategy that can significantly improve Si-based anode cycling tolerances.
2. Reducing vehicle weight – Research into reducing vehicle weight is being conducted in
four broad categories: magnesium alloys, aluminum alloys, carbon fiber composites and advanced high strength steel (Reference 18).
• Magnesium alloys – These alloys are challenged by poor corrosion resistance
and poor mechanical properties (e.g. strength, stiffness and ductility). • Aluminum alloys – Conventional alloys lack the required strength and they
present challenges when forming the metal at room temperature. Furthermore, joining these alloys to other metals has been problematic
• Advanced High Strength Steels (AHSS) – These metals have present several challenges in applying them to vehicles, such as a deterioration in mechanical properties in the heat affected zone (HAZ), limited weld fatigue strength, and excessive wear on tooling used to create parts using this metal.
• Carbon fiber materials – These materials may be able to reduce weight by 30-65%, but they have demonstrated issues related to corrosion and joining with dissimilar materials.
Accomplishments in 2015 include the following:
• A process has been developed that could reduce carbon fiber manufacturing costs by 20%
12
• Joining technologies (e.g. vaporizing reactive thermite foil adhesion, friction stir welding, laser assisted adhesive) have demonstrated successful joining of more than 14 dissimilar metal combinations.
• An advanced steel has been demonstrated with >1,200 MPa tensile strength and >30% elongation to failure
• Computational models have been developed that predict mechanical properties of advanced steels
3. Electric drive systems research focused on power electronics as well as the electric motor. Wide bandgap semiconductors are actively being researched for inverter and charger applications in order to improve the power and efficiencies while minimizing weight and volume. Next generation inverters are expected to achieve the DOE cost target of $3.30/kW, while GaN research expects to provide a 6.6kW converter module with 50% reductions in cost, weight and volume. Electric motor research has developed a non-rare-earth metal magnet with the same volume as the Prius motor, but with increased power. (Reference 19).
As a final note, the President’s goal of 1 million vehicles on the road by 2017 now appears to not be achievable. Results presented here show 650,000 to 700,000 vehicles by 2017. However, as noted above, the DOE technical goals are progressing as according to schedule. Note is also made that DOE has announced, in June 2016, a request for proposals that will be awards available for advancing PEV R&D.
8. Concluding Remarks
Predicted values of world and U.S. PEV yearly sales and cumulative sales have been presented based on 2015 data. As additional sales data is received, the results will be updated. The sales values for 2015 show that China leads in yearly sales at 214,283 (triple increase for 2014) following in second place by Western Europe at 184,500 vehicles sold. The U.S. is third at 115,262 followed by Japan at 46,339 vehicles. These five countries comprise 95% of the global sales market. The world total of EV sales for 2015 is estimated to be over 565,900 up from 320,713 last year. The data also shows that the world growth is 79% and that Western Europe is now ahead of the U.S. in total cumulative vehicles. Within the U.S., the PEV sales results for 2015 show that 115,262 vehicles were sold as compared to 118,882 vehicles in 2014 which is lower by -3 % from 2014. However, sales for the first 6 months of 2016 are 19% greater than the sales for the same period in 2015. On a state basis, California is the largest market with about 55% of the sales for 2015 and a growth of 4.6% over 2014. The total cumulative number of EVs sold in the U.S. over the six year lifetime is now at more than 400,000 vehicles. Using the sales figures of 2013 to 2015, gives a sales growth rate of 8.6%. Using the 8.6 % growth, will give the U.S. in ten years a sales of 263,000 PEVs per year with cumulative number of vehicles on the road at 2.6 million. Looking at the U.S., the future has dimmed over the past year. However, when consideration is given to the world market, the future is extremely bright and the U.S. may well be left behind. PEVs in the world market are rapidly growing due to the various country policies and the development of lithium-ion batteries from both a technological and manufacturing standpoint. The work also evaluated the types of barriers to EV usage and the actions, incentives and research to overcome the barriers. The barriers to large scale EV usage are costs, range,
13
availability of charging stations, charging time, battery life and infrastructure, standard and permitting. Public knowledge and education is also a never ending need. Results are presented for overcoming each of the barriers that includes incentives and technical progress.
9. References
1. Inside EVs (June 2016): http://insideevs.com/plug-in-electric-car-sales-visualized-from-2011-to-2015/
2. Electric Drive Transportation Association (May 2016): http://www.electricdrive.org/index.php?ht=d/sp/i/20952/pid/20952
3. All-Time EV Sales Record Easily Set In US for June, Props to Tesla and Ford. http://insideevs.com/all-time-ev-sales-record-easily-set-in-us-for-june-props-to-tesla-and-ford/
4. EV Everywhere: Charging on the Road: http://energy.gov/eere/eveverywhere/ev-everywhere-charging-road
5. California New Car Dealers Association (CNCDA). (May 2016). California Auto Outlook Covering First Quarter 2016: http://www.cncda.org/CMS/Pubs/CA%20Auto%20Outlook%201Q%202016.pdf
6. Agnew, Patrick, Florida Power & Light Co. (personal communication, June 2016). 7. 2016 Electric Vehicles Will Be Affordable and Popular By 2020 - An EV Portfolio to
Consider. (June) http://seekingalpha.com/article/3983030-electric-vehicles-will-affordable-popular-2020-ev-portfolio-consider
8. About EV Everywhere. (June 2016) http://energy.gov/eere/eveverywhere/about-ev-everywhere
9. State Efforts Promote Hybrid and Electric Vehicles (June 2016) http://www.ncsl.org/research/energy/state-electric-vehicle-incentives-state-chart.aspx
10. EV Everywhere: Tax Credits and Other Incentives (June 2016) http://energy.gov/eere/eveverywhere/ev-everywhere-tax-credits-and-other-incentives
11. Zane, Regan, Utah State University (personal communication, May 2016). 12. 408 DC Fast Chargers All That's Needed For Long-Distance EV Travel In 100 Biggest US Cities
(June 2016) http://cleantechnica.com/2016/06/26/408-dc-fast-chargers-thats-needed-long-distance-ev-travel-100-biggest-us-cities/
13. U. S. Department of Energy. EV Everywhere: Grand Challenge Blueprint (January, 2014), published by Argonne National Laboratory. http://energy.gov/sites/prod/files/2016/05/f31/eveverywhere_road_to_success.pdf
14. Christy Cooper. Vehicle Technologies Office Overview, Annual Merit Review June 6, 2016.
15. GM Says Li-ion Battery Cells Down to $145/kWh and Still Falling. http://www.hybridcars.com/gm-ev-battery-cells-down-to-145kwh-and-still-falling/. Accessed 6/29/16.
16. Electric-car battery costs: Tesla $190 per kWh for pack, GM $145 for cells. http://www.greencarreports.com/news/1103667_electric-car-battery-costs-tesla-190-per-kwh-for-pack-gm-145-for-cells. Accessed 6/29/16.
17. David Howell, Brian Cunningham, Tien Duong, and Peter Faguy. Overview of the DOE VTO Advanced Battery R&D Program, Annual Merit Review June 6, 2016.
18. Felix Wu, Jerry Gibbs, Carol Schutte, Will Joost, and Sara Ollila. Materials Technology – Overview, Annual Merit Review June 6, 2016
19. Susan Rogers and Steven Boyd. Overview of the DOE VTO Electric Drive Technologies R&D Program, Annual Merit Review June 7, 2016.