Embed Size (px)
Citation preview
2015
DIRECTOR COMPENSATION
STUDY
CONTENTS
Steven Hall & Partners
Executive Summary ...................................................................................................................................... 1
Study Sample .................................................................................................................................................. 2
Methodology .................................................................................................................................................. 3
Trends Among the Top 200 ...................................................................................................................... 5
Total Compensation ..................................................................................................................................... 9
Pay Mix ............................................................................................................................................................ 11
Board Retainers ............................................................................................................................................ 12
Meeting Fees ................................................................................................................................................ 14
Committee Fees ........................................................................................................................................... 15
Board Leadership
Non-Executive Chairperson ....................................................................................................... 19
Lead and Presiding Director ...................................................................................................... 20
Share Ownership and Retention Guidelines...................................................................................... 21
Total Board Cost .......................................................................................................................................... 22
Conclusion ..................................................................................................................................................... 24
Appendix A: Companies Studied ........................................................................................................... 25
Appendix B: 2014 Director Compensation Data .............................................................................. 31
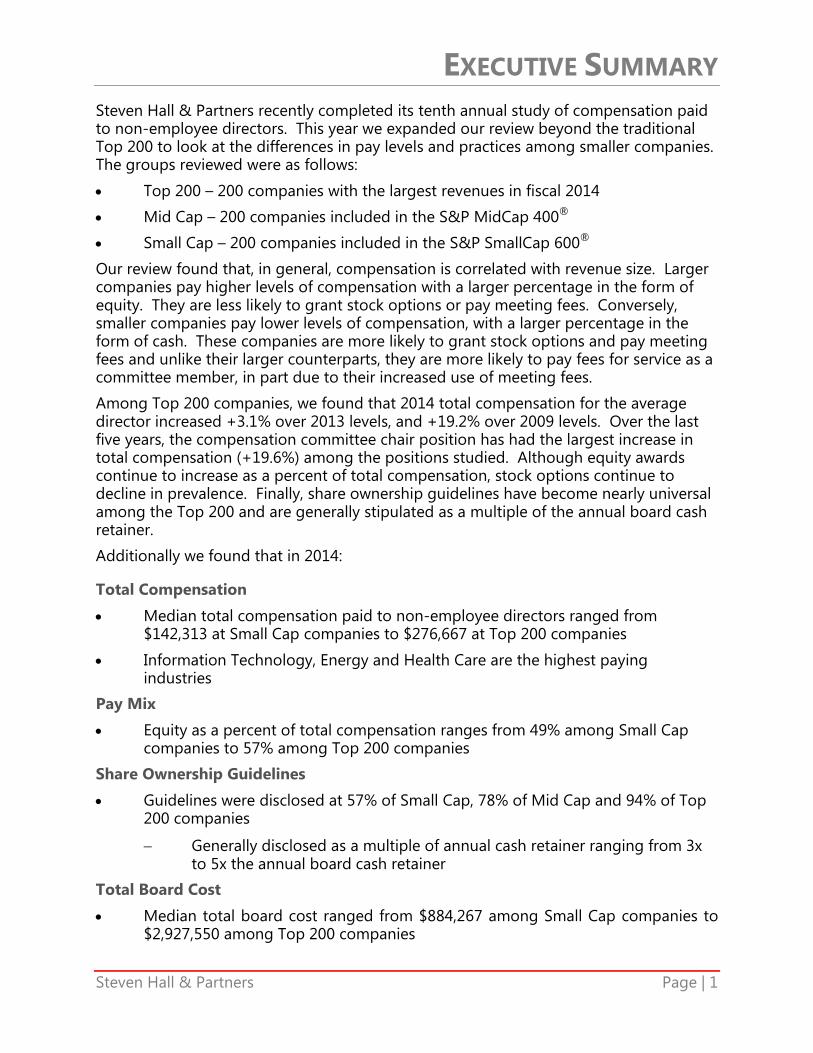
EXECUTIVE SUMMARY
Steven Hall & Partners Page | 1
Steven Hall & Partners recently completed its tenth annual study of compensation paid to non-employee directors. This year we expanded our review beyond the traditional Top 200 to look at the differences in pay levels and practices among smaller companies. The groups reviewed were as follows:
• Top 200 – 200 companies with the largest revenues in fiscal 2014
• Mid Cap – 200 companies included in the S&P MidCap 400®
• Small Cap – 200 companies included in the S&P SmallCap 600®
Our review found that, in general, compensation is correlated with revenue size. Larger companies pay higher levels of compensation with a larger percentage in the form of equity. They are less likely to grant stock options or pay meeting fees. Conversely, smaller companies pay lower levels of compensation, with a larger percentage in the form of cash. These companies are more likely to grant stock options and pay meeting fees and unlike their larger counterparts, they are more likely to pay fees for service as a committee member, in part due to their increased use of meeting fees.
Among Top 200 companies, we found that 2014 total compensation for the average director increased +3.1% over 2013 levels, and +19.2% over 2009 levels. Over the last five years, the compensation committee chair position has had the largest increase in total compensation (+19.6%) among the positions studied. Although equity awards continue to increase as a percent of total compensation, stock options continue to decline in prevalence. Finally, share ownership guidelines have become nearly universal among the Top 200 and are generally stipulated as a multiple of the annual board cash retainer.
Additionally we found that in 2014:
Total Compensation
• Median total compensation paid to non-employee directors ranged from $142,313 at Small Cap companies to $276,667 at Top 200 companies
• Information Technology, Energy and Health Care are the highest paying industries
Pay Mix
• Equity as a percent of total compensation ranges from 49% among Small Cap companies to 57% among Top 200 companies
Share Ownership Guidelines
• Guidelines were disclosed at 57% of Small Cap, 78% of Mid Cap and 94% of Top 200 companies
− Generally disclosed as a multiple of annual cash retainer ranging from 3x to 5x the annual board cash retainer
Total Board Cost
• Median total board cost ranged from $884,267 among Small Cap companies to $2,927,550 among Top 200 companies
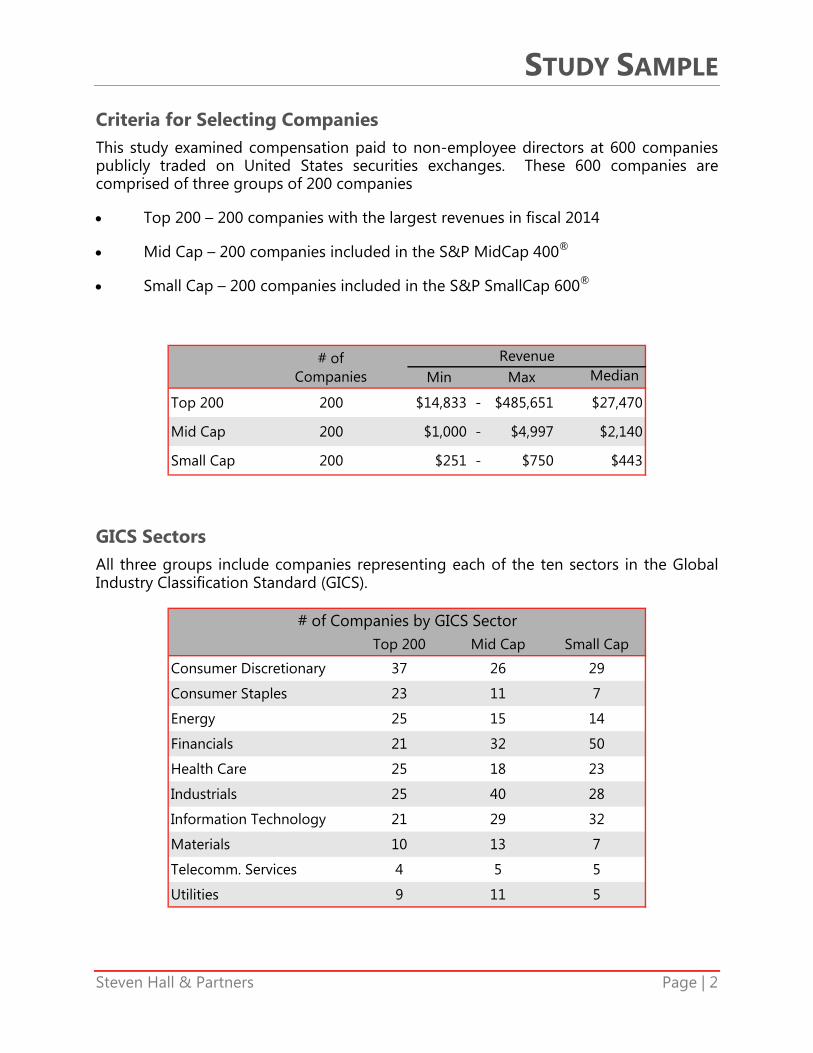
STUDY SAMPLE
Steven Hall & Partners Page | 2
Criteria for Selecting Companies This study examined compensation paid to non-employee directors at 600 companies publicly traded on United States securities exchanges. These 600 companies are comprised of three groups of 200 companies
• Top 200 – 200 companies with the largest revenues in fiscal 2014
• Mid Cap – 200 companies included in the S&P MidCap 400®
• Small Cap – 200 companies included in the S&P SmallCap 600®
GICS Sectors All three groups include companies representing each of the ten sectors in the Global Industry Classification Standard (GICS).
RevenueMin Max Median
Top 200 200 $14,833 - $485,651 $27,470
Mid Cap 200 $1,000 - $4,997 $2,140
Small Cap 200 $251 - $750 $443
# of Companies
# of Companies by GICS SectorTop 200 Mid Cap Small Cap
Consumer Discretionary 37 26 29
Consumer Staples 23 11 7
Energy 25 15 14
Financials 21 32 50
Health Care 25 18 23
Industrials 25 40 28
Information Technology 21 29 32
Materials 10 13 7
Telecomm. Services 4 5 5
Utilities 9 11 5
METHODOLOGY
Steven Hall & Partners Page | 3
Determining Director Compensation The non-employee director compensation data used in this study was derived from proxy statements filed between June 1, 2014 and May 31, 2015.
Components of Director Compensation Reviewed
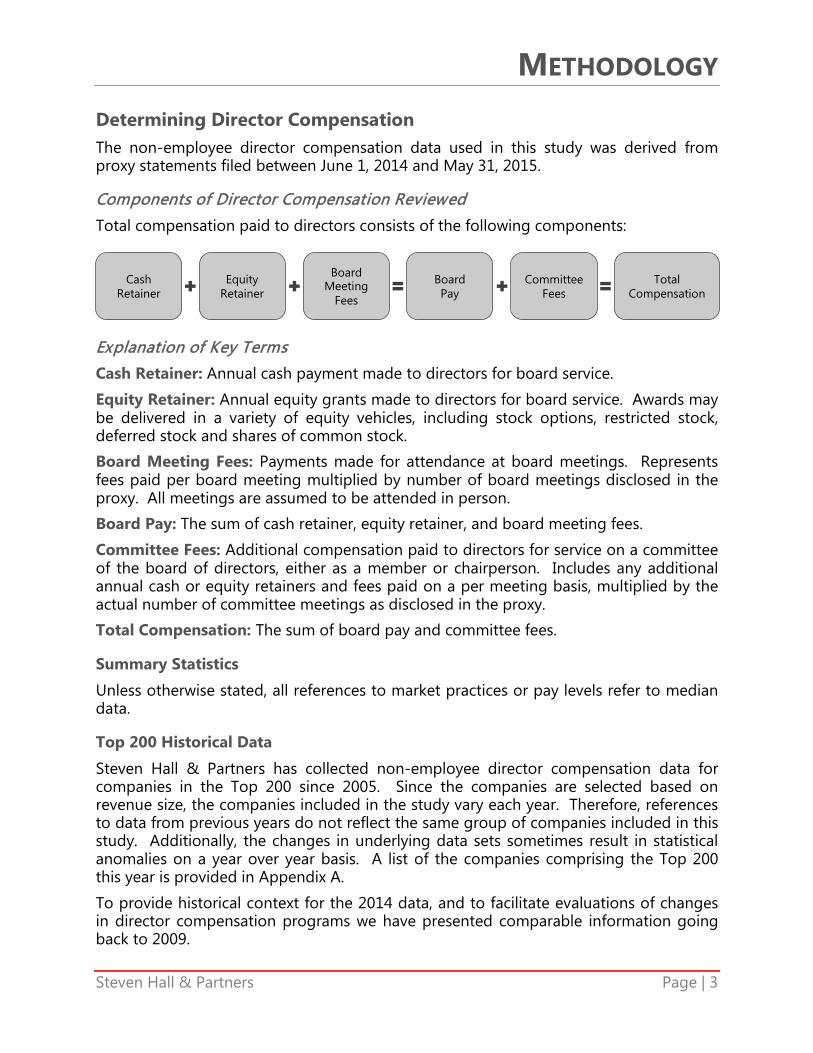
Total compensation paid to directors consists of the following components:
Explanation of Key Terms
Cash Retainer: Annual cash payment made to directors for board service.
Equity Retainer: Annual equity grants made to directors for board service. Awards may be delivered in a variety of equity vehicles, including stock options, restricted stock, deferred stock and shares of common stock.
Board Meeting Fees: Payments made for attendance at board meetings. Represents fees paid per board meeting multiplied by number of board meetings disclosed in the proxy. All meetings are assumed to be attended in person.
Board Pay: The sum of cash retainer, equity retainer, and board meeting fees.
Committee Fees: Additional compensation paid to directors for service on a committee of the board of directors, either as a member or chairperson. Includes any additional annual cash or equity retainers and fees paid on a per meeting basis, multiplied by the actual number of committee meetings as disclosed in the proxy.
Total Compensation: The sum of board pay and committee fees.
Summary Statistics
Unless otherwise stated, all references to market practices or pay levels refer to median data.
Top 200 Historical Data
Steven Hall & Partners has collected non-employee director compensation data for companies in the Top 200 since 2005. Since the companies are selected based on revenue size, the companies included in the study vary each year. Therefore, references to data from previous years do not reflect the same group of companies included in this study. Additionally, the changes in underlying data sets sometimes result in statistical anomalies on a year over year basis. A list of the companies comprising the Top 200 this year is provided in Appendix A.
To provide historical context for the 2014 data, and to facilitate evaluations of changes in director compensation programs we have presented comparable information going back to 2009.
Cash Retainer
Equity Retainer
Board Meeting
Fees Board Pay
Committee Fees
Total Compensation
METHODOLOGY
Steven Hall & Partners Page | 4
Straw Directors
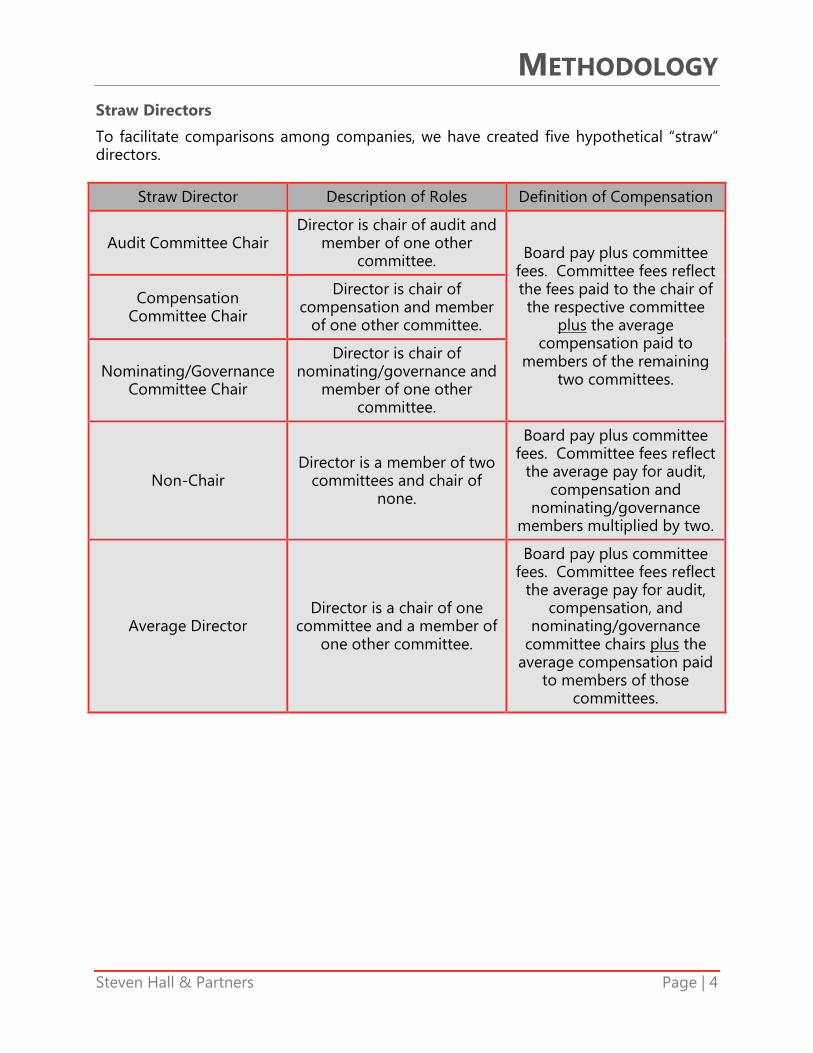
To facilitate comparisons among companies, we have created five hypothetical “straw” directors.
Straw Director Description of Roles Definition of Compensation
Audit Committee Chair Director is chair of audit and
member of one other committee. Board pay plus committee
fees. Committee fees reflect the fees paid to the chair of the respective committee
plus the average compensation paid to
members of the remaining two committees.
Compensation Committee Chair
Director is chair of compensation and member
of one other committee.
Nominating/Governance Committee Chair
Director is chair of nominating/governance and
member of one other committee.
Non-Chair Director is a member of two
committees and chair of none.
Board pay plus committee fees. Committee fees reflect
the average pay for audit, compensation and
nominating/governance members multiplied by two.
Average Director Director is a chair of one
committee and a member of one other committee.
Board pay plus committee fees. Committee fees reflect
the average pay for audit, compensation, and
nominating/governance committee chairs plus the
average compensation paid to members of those
committees.
TRENDS AMONG THE TOP 200
Steven Hall & Partners Page | 5
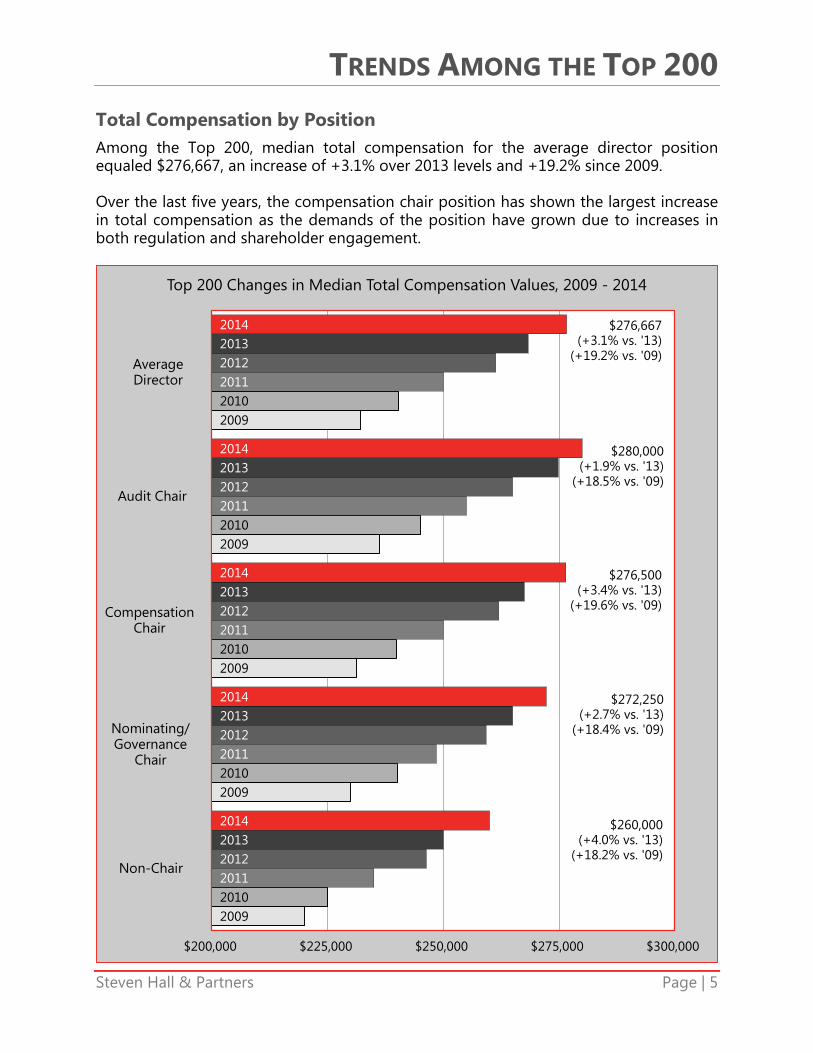
Total Compensation by Position Among the Top 200, median total compensation for the average director position equaled $276,667, an increase of +3.1% over 2013 levels and +19.2% since 2009. Over the last five years, the compensation chair position has shown the largest increase in total compensation as the demands of the position have grown due to increases in both regulation and shareholder engagement.
2009
2009
2009
2009
2009
2010
2010
2010
2010
2010
2011
2011
2011
2011
2011
2012
2012
2012
2012
2012
2013
2013
2013
2013
2013
2014
2014
2014
2014
2014
$200,000 $225,000 $250,000 $275,000 $300,000
Non-Chair
Nominating/Governance
Chair
CompensationChair
Audit Chair
AverageDirector
Top 200 Changes in Median Total Compensation Values, 2009 - 2014
$276,667(+3.1% vs. '13)
(+19.2% vs. '09)
$280,000(+1.9% vs. '13)
(+18.5% vs. '09)
$276,500(+3.4% vs. '13)
(+19.6% vs. '09)
$272,250(+2.7% vs. '13)
(+18.4% vs. '09)
$260,000(+4.0% vs. '13)
(+18.2% vs. '09)
TRENDS AMONG THE TOP 200
Steven Hall & Partners Page | 6
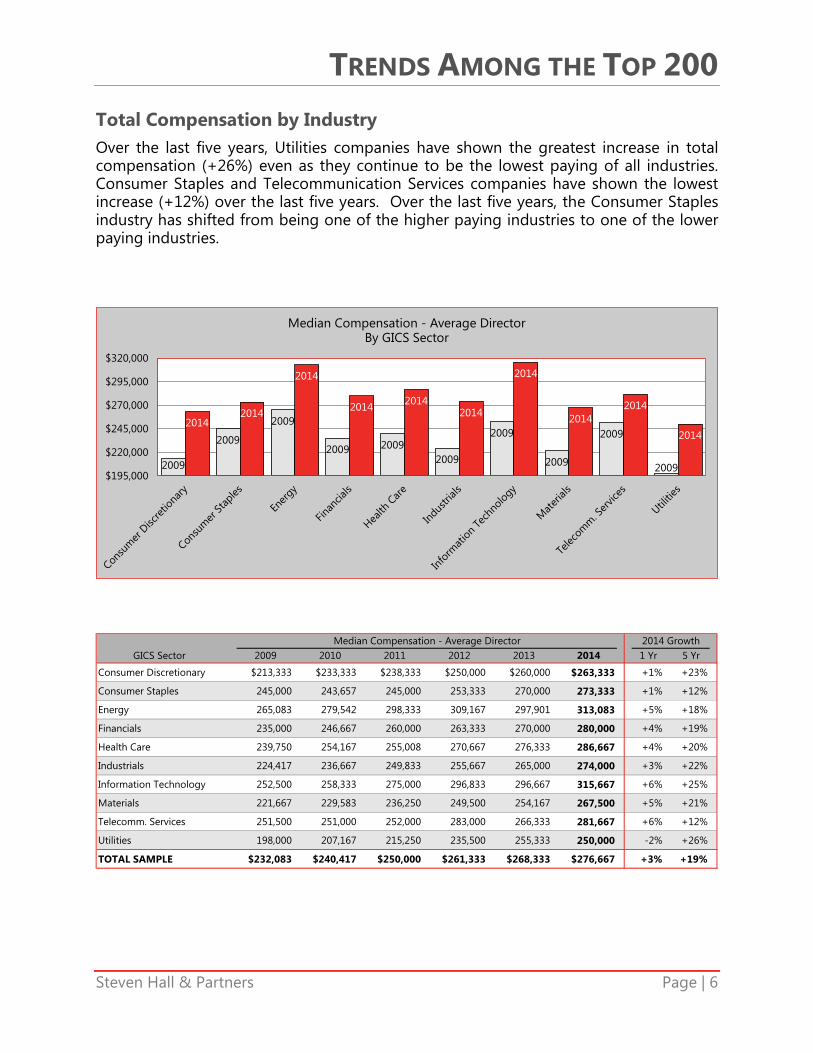
Total Compensation by Industry Over the last five years, Utilities companies have shown the greatest increase in total compensation (+26%) even as they continue to be the lowest paying of all industries. Consumer Staples and Telecommunication Services companies have shown the lowest increase (+12%) over the last five years. Over the last five years, the Consumer Staples industry has shifted from being one of the higher paying industries to one of the lower paying industries.
2009
2009
2009
2009 20092009
2009
2009
2009
2009
20142014
2014
20142014
2014
2014
20142014
2014
$195,000
$220,000
$245,000
$270,000
$295,000
$320,000
Median Compensation - Average DirectorBy GICS Sector
Median Compensation - Average Director 2014 GrowthGICS Sector 2009 2010 2011 2012 2013 2014 1 Yr 5 Yr
Consumer Discretionary $213,333 $233,333 $238,333 $250,000 $260,000 $263,333 +1% +23%
Consumer Staples 245,000 243,657 245,000 253,333 270,000 273,333 +1% +12%
Energy 265,083 279,542 298,333 309,167 297,901 313,083 +5% +18%
Financials 235,000 246,667 260,000 263,333 270,000 280,000 +4% +19%
Health Care 239,750 254,167 255,008 270,667 276,333 286,667 +4% +20%
Industrials 224,417 236,667 249,833 255,667 265,000 274,000 +3% +22%
Information Technology 252,500 258,333 275,000 296,833 296,667 315,667 +6% +25%
Materials 221,667 229,583 236,250 249,500 254,167 267,500 +5% +21%
Telecomm. Services 251,500 251,000 252,000 283,000 266,333 281,667 +6% +12%
Utilities 198,000 207,167 215,250 235,500 255,333 250,000 -2% +26%
TOTAL SAMPLE $232,083 $240,417 $250,000 $261,333 $268,333 $276,667 +3% +19%
TRENDS AMONG THE TOP 200
Steven Hall & Partners Page | 7
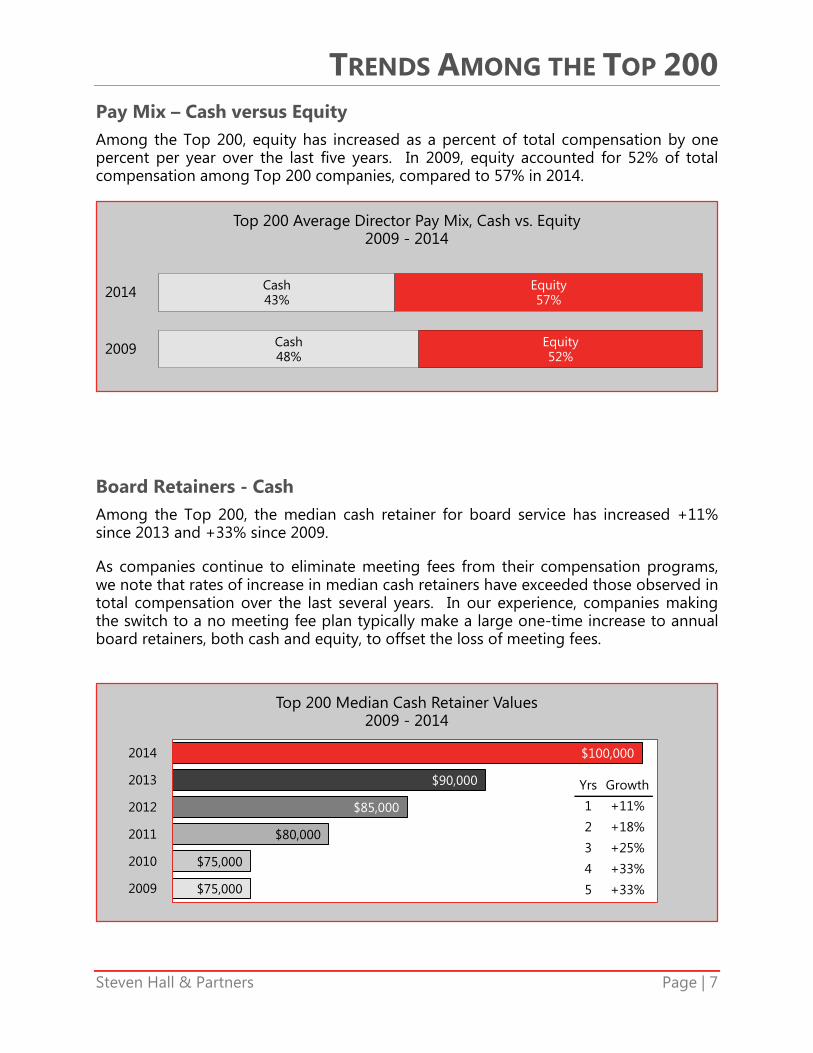
Pay Mix – Cash versus Equity Among the Top 200, equity has increased as a percent of total compensation by one percent per year over the last five years. In 2009, equity accounted for 52% of total compensation among Top 200 companies, compared to 57% in 2014.
Board Retainers - Cash Among the Top 200, the median cash retainer for board service has increased +11% since 2013 and +33% since 2009.
As companies continue to eliminate meeting fees from their compensation programs, we note that rates of increase in median cash retainers have exceeded those observed in total compensation over the last several years. In our experience, companies making the switch to a no meeting fee plan typically make a large one-time increase to annual board retainers, both cash and equity, to offset the loss of meeting fees.
Cash48%
Cash43%
Equity52%
Equity57%
2009
2014
Top 200 Average Director Pay Mix, Cash vs. Equity2009 - 2014
$75,000
$75,000
$80,000
$85,000
$90,000
$100,000
2009
2010
2011
2012
2013
2014
Top 200 Median Cash Retainer Values2009 - 2014
Yrs Growth
1 +11%
2 +18%
3 +25%
4 +33%
5 +33%
TRENDS AMONG THE TOP 200
Steven Hall & Partners Page | 8
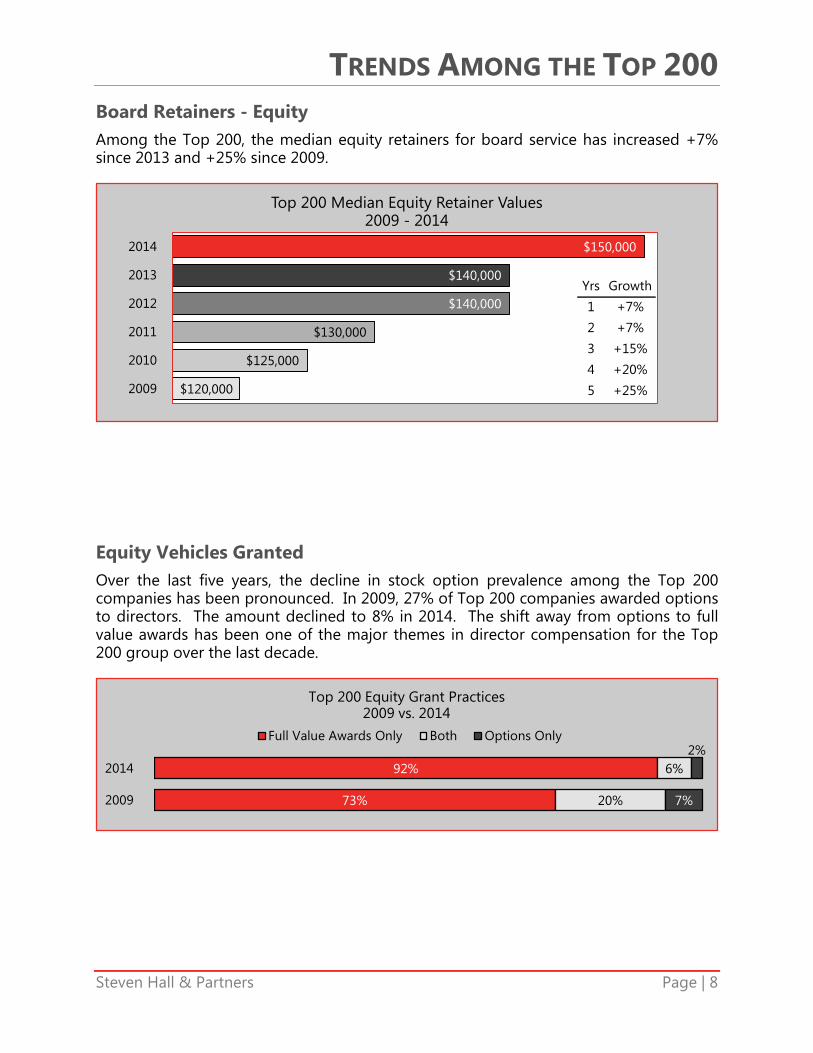
Board Retainers - Equity Among the Top 200, the median equity retainers for board service has increased +7% since 2013 and +25% since 2009.
Equity Vehicles Granted Over the last five years, the decline in stock option prevalence among the Top 200 companies has been pronounced. In 2009, 27% of Top 200 companies awarded options to directors. The amount declined to 8% in 2014. The shift away from options to full value awards has been one of the major themes in director compensation for the Top 200 group over the last decade.
$120,000
$125,000
$130,000
$140,000
$140,000
$150,000
2009
2010
2011
2012
2013
2014
Top 200 Median Equity Retainer Values2009 - 2014
73%
92%
20%
6%
7%
2%
2009
2014
Top 200 Equity Grant Practices2009 vs. 2014
Full Value Awards Only Both Options Only
Yrs Growth
1 +7%
2 +7%
3 +15%
4 +20%
5 +25%
TOTAL COMPENSATION
Steven Hall & Partners Page | 9
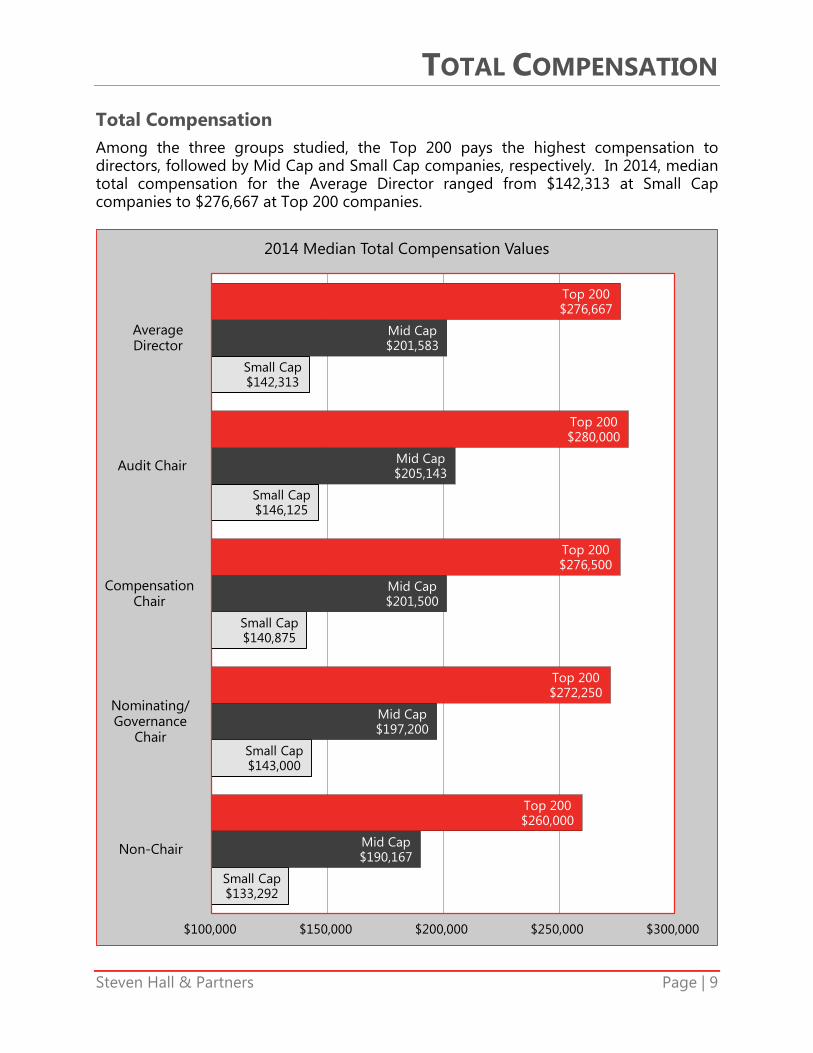
Total Compensation Among the three groups studied, the Top 200 pays the highest compensation to directors, followed by Mid Cap and Small Cap companies, respectively. In 2014, median total compensation for the Average Director ranged from $142,313 at Small Cap companies to $276,667 at Top 200 companies.
Small Cap$133,292
Small Cap$143,000
Small Cap$140,875
Small Cap$146,125
Small Cap$142,313
Mid Cap$190,167
Mid Cap$197,200
Mid Cap$201,500
Mid Cap$205,143
Mid Cap$201,583
Top 200$260,000
Top 200$272,250
Top 200$276,500
Top 200$280,000
Top 200$276,667
$100,000 $150,000 $200,000 $250,000 $300,000
Non-Chair
Nominating/Governance
Chair
CompensationChair
Audit Chair
AverageDirector
2014 Median Total Compensation Values
TOTAL COMPENSATION
Steven Hall & Partners Page | 10
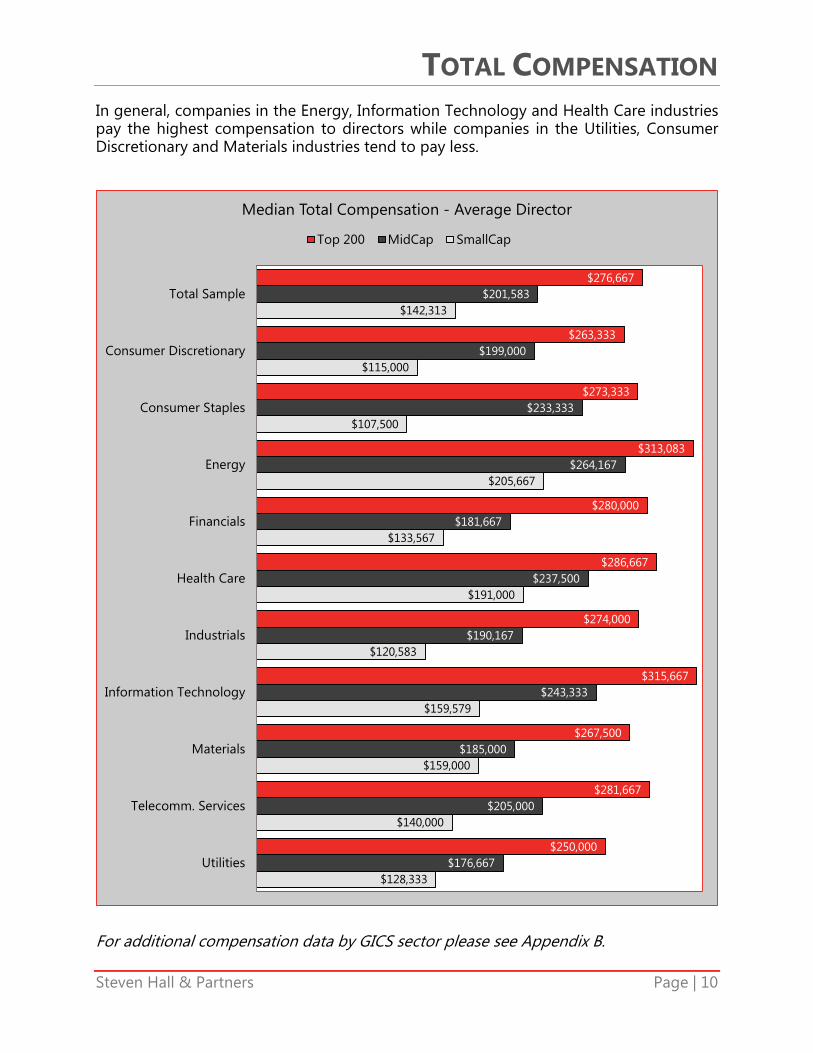
In general, companies in the Energy, Information Technology and Health Care industries pay the highest compensation to directors while companies in the Utilities, Consumer Discretionary and Materials industries tend to pay less.
For additional compensation data by GICS sector please see Appendix B.
$276,667
$263,333
$273,333
$313,083
$280,000
$286,667
$274,000
$315,667
$267,500
$281,667
$250,000
$201,583
$199,000
$233,333
$264,167
$181,667
$237,500
$190,167
$243,333
$185,000
$205,000
$176,667
$142,313
$115,000
$107,500
$205,667
$133,567
$191,000
$120,583
$159,579
$159,000
$140,000
$128,333
Total Sample
Consumer Discretionary
Consumer Staples
Energy
Financials
Health Care
Industrials
Information Technology
Materials
Telecomm. Services
Utilities
Median Total Compensation - Average Director
Top 200 MidCap SmallCap
PAY MIX
Steven Hall & Partners Page | 11
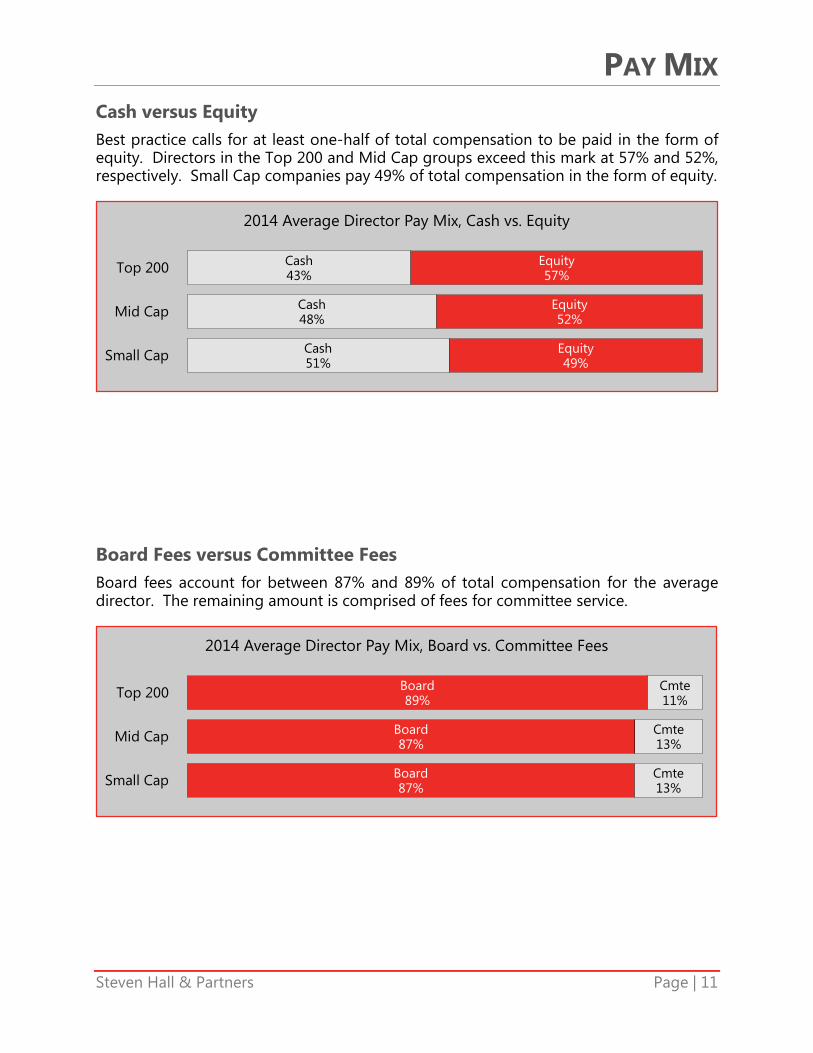
Cash versus Equity Best practice calls for at least one-half of total compensation to be paid in the form of equity. Directors in the Top 200 and Mid Cap groups exceed this mark at 57% and 52%, respectively. Small Cap companies pay 49% of total compensation in the form of equity.
Board Fees versus Committee Fees Board fees account for between 87% and 89% of total compensation for the average director. The remaining amount is comprised of fees for committee service.
Cash51%
Cash48%
Cash43%
Equity49%
Equity52%
Equity57%
Small Cap
Mid Cap
Top 200
2014 Average Director Pay Mix, Cash vs. Equity
Board87%
Board87%
Board89%
Cmte13%
Cmte13%
Cmte11%
Small Cap
Mid Cap
Top 200
2014 Average Director Pay Mix, Board vs. Committee Fees
BOARD RETAINERS
Steven Hall & Partners Page | 12
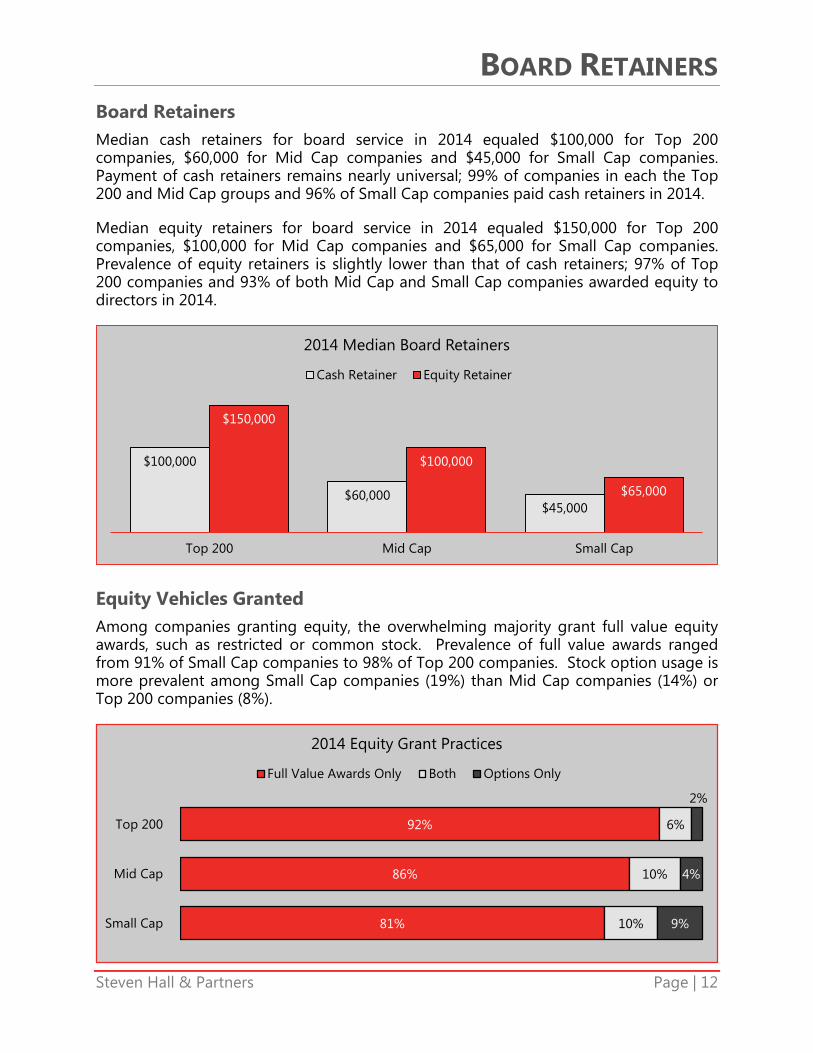
Board Retainers Median cash retainers for board service in 2014 equaled $100,000 for Top 200 companies, $60,000 for Mid Cap companies and $45,000 for Small Cap companies. Payment of cash retainers remains nearly universal; 99% of companies in each the Top 200 and Mid Cap groups and 96% of Small Cap companies paid cash retainers in 2014.
Median equity retainers for board service in 2014 equaled $150,000 for Top 200 companies, $100,000 for Mid Cap companies and $65,000 for Small Cap companies. Prevalence of equity retainers is slightly lower than that of cash retainers; 97% of Top 200 companies and 93% of both Mid Cap and Small Cap companies awarded equity to directors in 2014.
Equity Vehicles Granted Among companies granting equity, the overwhelming majority grant full value equity awards, such as restricted or common stock. Prevalence of full value awards ranged from 91% of Small Cap companies to 98% of Top 200 companies. Stock option usage is more prevalent among Small Cap companies (19%) than Mid Cap companies (14%) or Top 200 companies (8%).
$100,000
$60,000$45,000
$150,000
$100,000
$65,000
Top 200 Mid Cap Small Cap
2014 Median Board Retainers
Cash Retainer Equity Retainer
81%
86%
92%
10%
10%
6%
9%
4%
2%
Small Cap
Mid Cap
Top 200
2014 Equity Grant Practices
Full Value Awards Only Both Options Only
BOARD RETAINERS
Steven Hall & Partners Page | 13
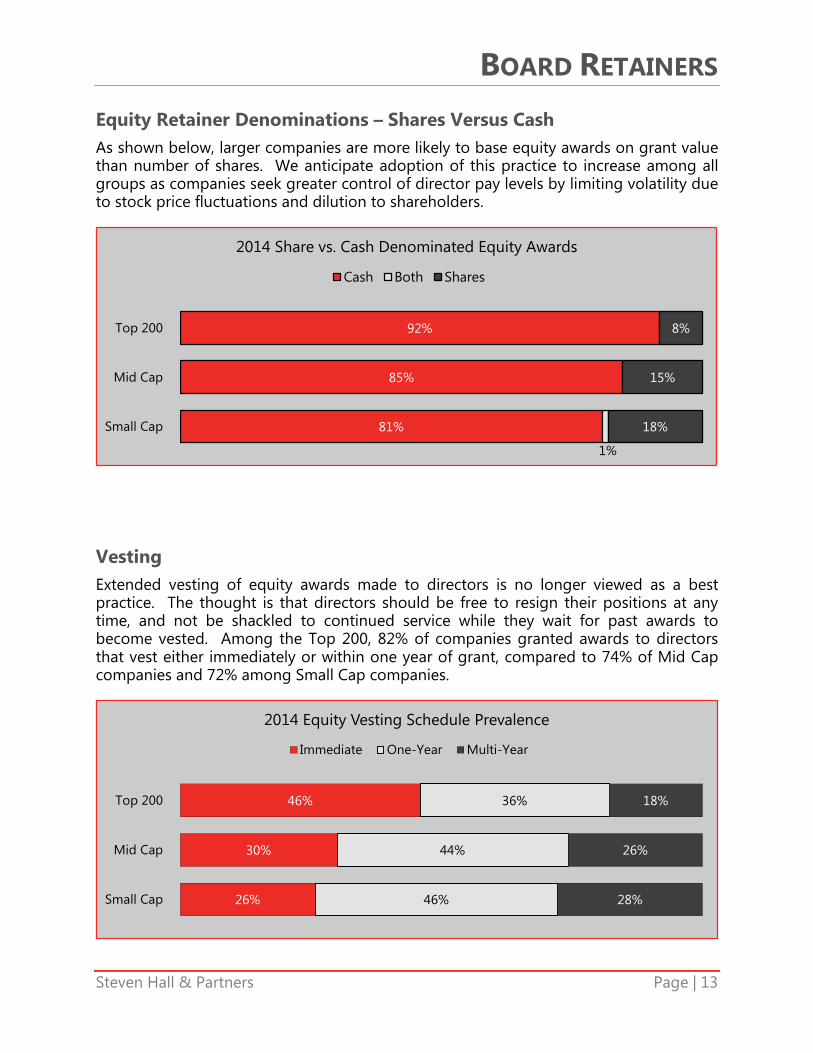
Equity Retainer Denominations – Shares Versus Cash As shown below, larger companies are more likely to base equity awards on grant value than number of shares. We anticipate adoption of this practice to increase among all groups as companies seek greater control of director pay levels by limiting volatility due to stock price fluctuations and dilution to shareholders.
Vesting Extended vesting of equity awards made to directors is no longer viewed as a best practice. The thought is that directors should be free to resign their positions at any time, and not be shackled to continued service while they wait for past awards to become vested. Among the Top 200, 82% of companies granted awards to directors that vest either immediately or within one year of grant, compared to 74% of Mid Cap companies and 72% among Small Cap companies.
81%
85%
92%
1%
18%
15%
8%
Small Cap
Mid Cap
Top 200
2014 Share vs. Cash Denominated Equity Awards
Cash Both Shares
26%
30%
46%
46%
44%
36%
28%
26%
18%
Small Cap
Mid Cap
Top 200
2014 Equity Vesting Schedule Prevalence
Immediate One-Year Multi-Year
MEETING FEES
Steven Hall & Partners Page | 14
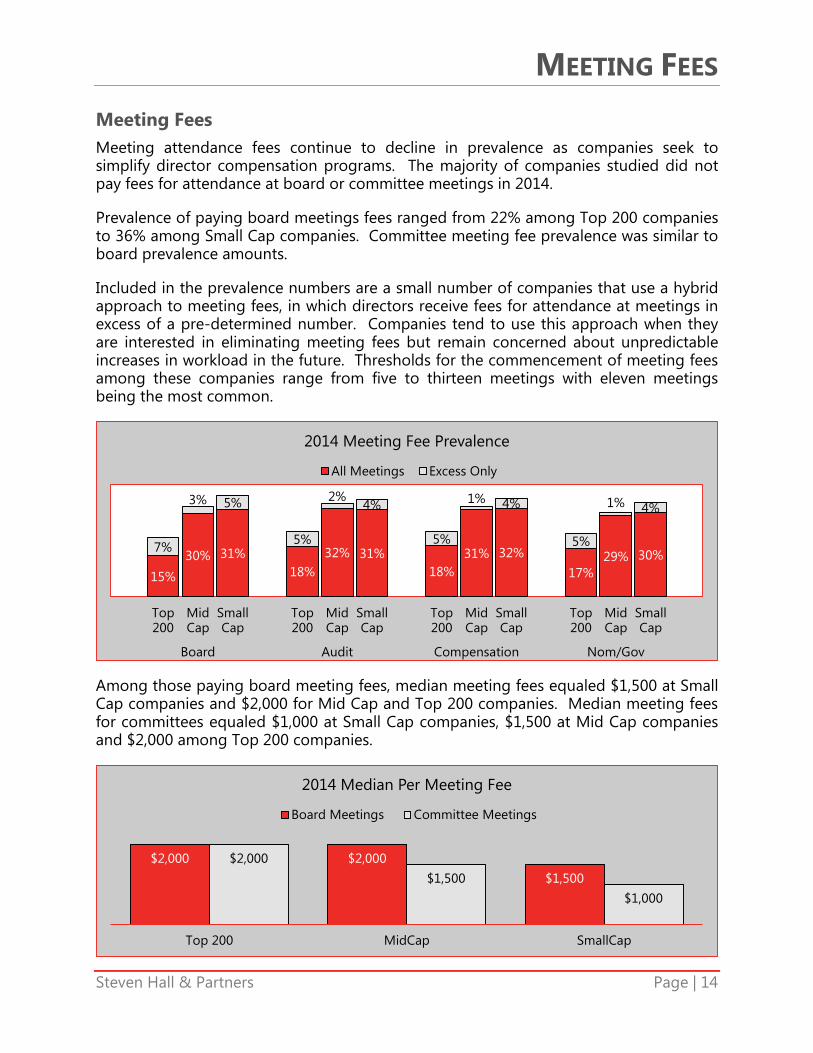
Meeting Fees Meeting attendance fees continue to decline in prevalence as companies seek to simplify director compensation programs. The majority of companies studied did not pay fees for attendance at board or committee meetings in 2014.
Prevalence of paying board meetings fees ranged from 22% among Top 200 companies to 36% among Small Cap companies. Committee meeting fee prevalence was similar to board prevalence amounts.
Included in the prevalence numbers are a small number of companies that use a hybrid approach to meeting fees, in which directors receive fees for attendance at meetings in excess of a pre-determined number. Companies tend to use this approach when they are interested in eliminating meeting fees but remain concerned about unpredictable increases in workload in the future. Thresholds for the commencement of meeting fees among these companies range from five to thirteen meetings with eleven meetings being the most common.
Among those paying board meeting fees, median meeting fees equaled $1,500 at Small Cap companies and $2,000 for Mid Cap and Top 200 companies. Median meeting fees for committees equaled $1,000 at Small Cap companies, $1,500 at Mid Cap companies and $2,000 among Top 200 companies.
15%
30% 31%18%
32% 31%18%
31% 32%
17%29% 30%
7%
3% 5%
5%
2%4%
5%
1% 4%
5%
1% 4%
Top200
MidCap
SmallCap
Top200
MidCap
SmallCap
Top200
MidCap
SmallCap
Top200
MidCap
SmallCap
Board Audit Compensation Nom/Gov
2014 Meeting Fee Prevalence
All Meetings Excess Only
$2,000 $2,000
$1,500
$2,000
$1,500
$1,000
Top 200 MidCap SmallCap
2014 Median Per Meeting Fee
Board Meetings Committee Meetings
COMMITTEE FEES
Steven Hall & Partners Page | 15
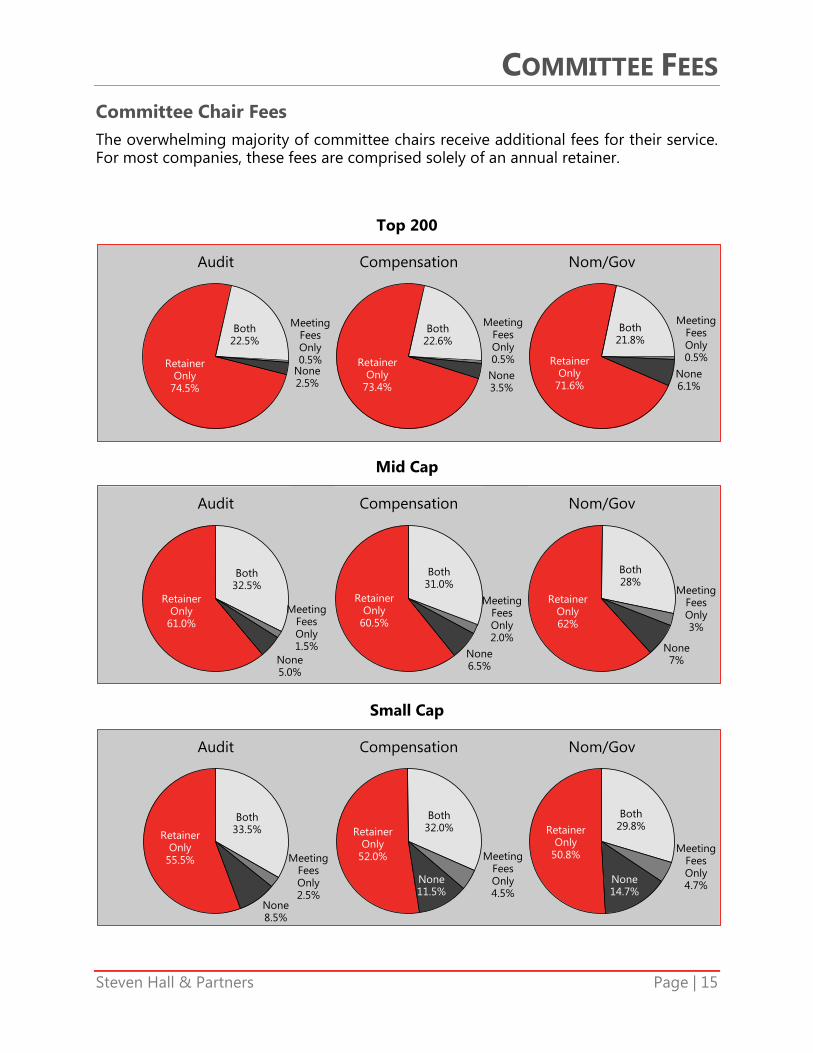
Committee Chair Fees The overwhelming majority of committee chairs receive additional fees for their service. For most companies, these fees are comprised solely of an annual retainer.
Top 200
Mid Cap
Small Cap
Retainer Only
71.6%
Both21.8%
Meeting Fees Only0.5%
None6.1%
Nom/Gov
Retainer Only
73.4%
Both22.6%
Meeting Fees Only0.5%
None3.5%
Compensation
Retainer Only
74.5%
Both22.5%
Meeting Fees Only0.5%
None2.5%
Audit
Retainer Only62%
Both28%
Meeting Fees Only3%
None7%
Nom/Gov
Retainer Only
60.5%
Both31.0%
Meeting Fees Only2.0%
None6.5%
Compensation
Retainer Only
61.0%
Both32.5%
Meeting Fees Only1.5%
None5.0%
Audit
Retainer Only
50.8%
Both29.8%
Meeting Fees Only4.7%None
14.7%
Nom/Gov
Retainer Only
52.0%
Both32.0%
Meeting Fees Only4.5%
None11.5%
Compensation
Retainer Only
55.5%
Both33.5%
Meeting Fees Only2.5%
None8.5%
Audit
COMMITTEE FEES
Steven Hall & Partners Page | 16
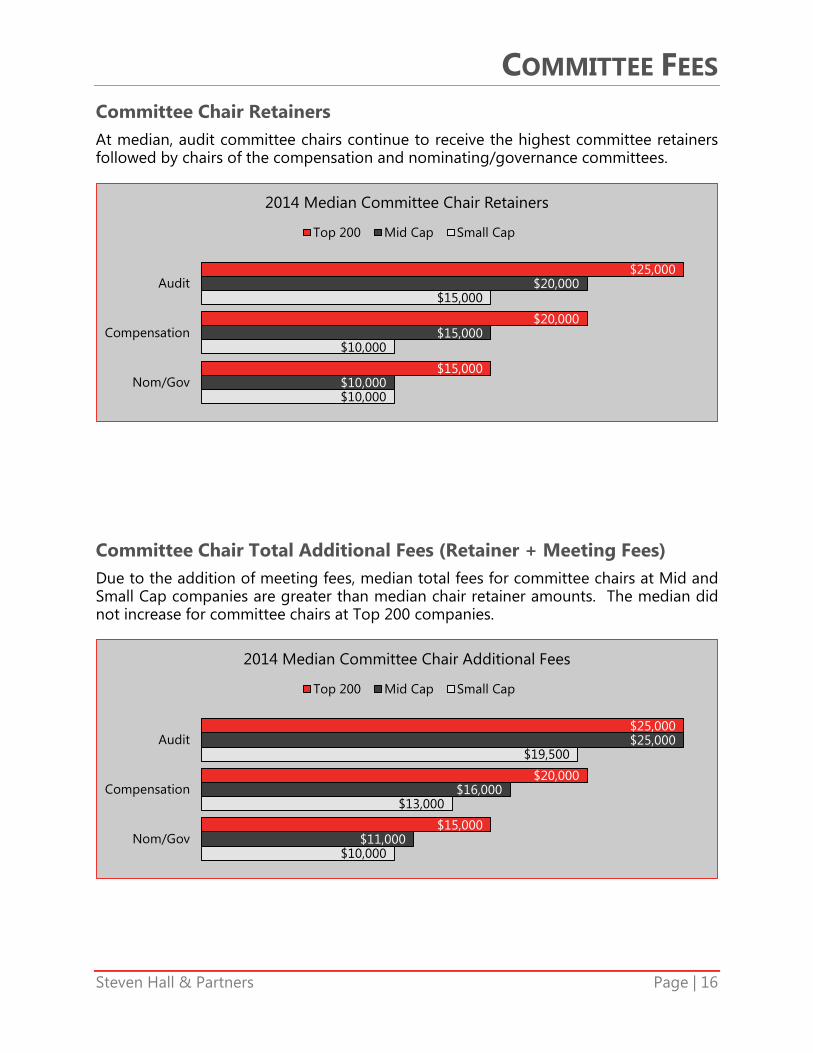
Committee Chair Retainers At median, audit committee chairs continue to receive the highest committee retainers followed by chairs of the compensation and nominating/governance committees.
Committee Chair Total Additional Fees (Retainer + Meeting Fees) Due to the addition of meeting fees, median total fees for committee chairs at Mid and Small Cap companies are greater than median chair retainer amounts. The median did not increase for committee chairs at Top 200 companies.
$25,000
$20,000
$15,000
$20,000
$15,000
$10,000
$15,000
$10,000
$10,000
Audit
Compensation
Nom/Gov
2014 Median Committee Chair Retainers
Top 200 Mid Cap Small Cap
$25,000
$20,000
$15,000
$25,000
$16,000
$11,000
$19,500
$13,000
$10,000
Audit
Compensation
Nom/Gov
2014 Median Committee Chair Additional Fees
Top 200 Mid Cap Small Cap
COMMITTEE FEES
Steven Hall & Partners Page | 17
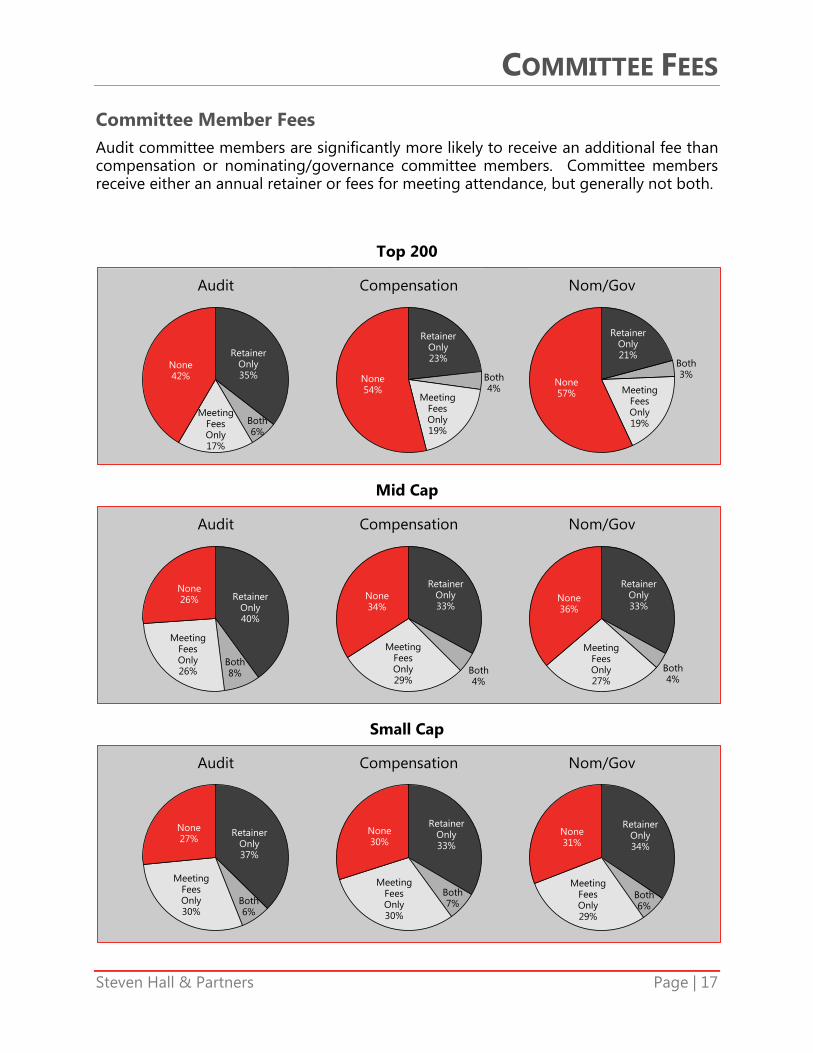
Committee Member Fees Audit committee members are significantly more likely to receive an additional fee than compensation or nominating/governance committee members. Committee members receive either an annual retainer or fees for meeting attendance, but generally not both.
Top 200
Mid Cap
Small Cap
Retainer Only35%
Both6%
Meeting Fees Only17%
None42%
Audit
Retainer Only21%
Both3%
Meeting Fees Only19%
None57%
Nom/Gov
Retainer Only23%
Both4%
Meeting Fees Only19%
None54%
Compensation
Retainer Only40%
Both8%
Meeting Fees Only26%
None26%
Audit
Retainer Only33%
Both4%
Meeting Fees Only27%
None36%
Nom/Gov
Retainer Only33%
Both4%
Meeting Fees Only29%
None34%
Compensation
Retainer Only37%
Both6%
Meeting Fees Only30%
None27%
Audit
Retainer Only34%
Both6%
Meeting Fees Only29%
None31%
Nom/Gov
Retainer Only33%
Both7%
Meeting Fees Only30%
None30%
Compensation
COMMITTEE FEES
Steven Hall & Partners Page | 18
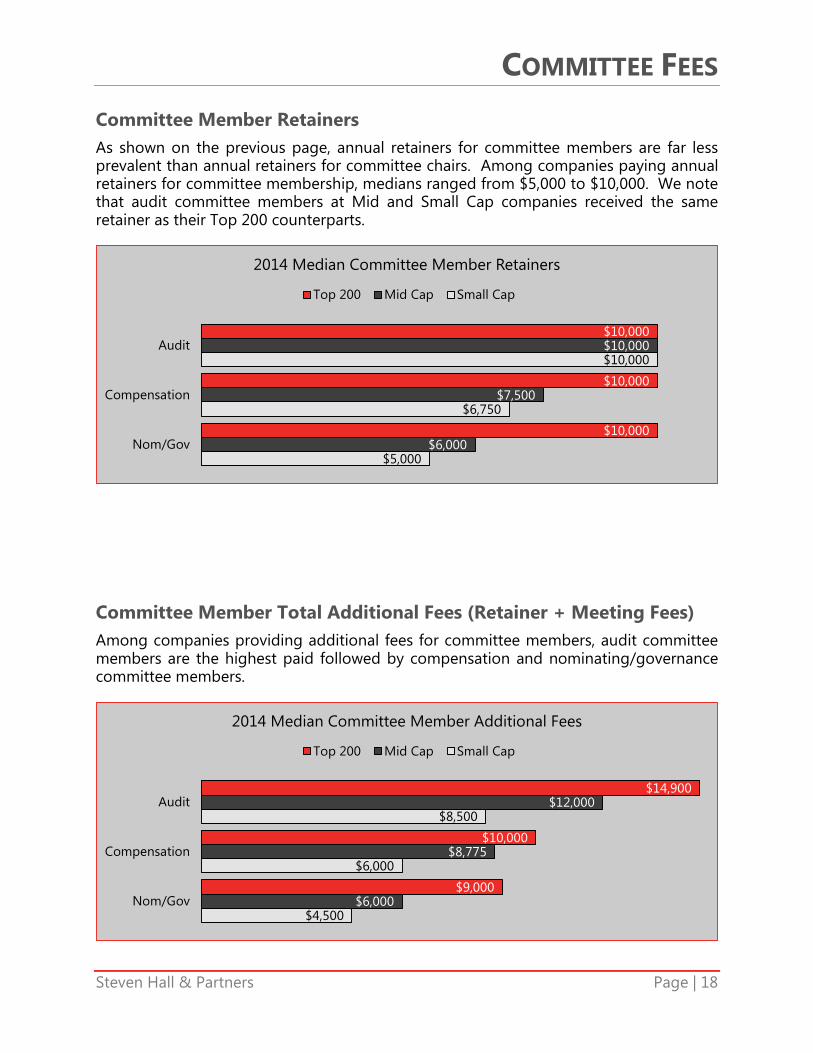
Committee Member Retainers As shown on the previous page, annual retainers for committee members are far less prevalent than annual retainers for committee chairs. Among companies paying annual retainers for committee membership, medians ranged from $5,000 to $10,000. We note that audit committee members at Mid and Small Cap companies received the same retainer as their Top 200 counterparts.
Committee Member Total Additional Fees (Retainer + Meeting Fees) Among companies providing additional fees for committee members, audit committee members are the highest paid followed by compensation and nominating/governance committee members.
$10,000
$10,000
$10,000
$10,000
$7,500
$6,000
$10,000
$6,750
$5,000
Audit
Compensation
Nom/Gov
2014 Median Committee Member Retainers
Top 200 Mid Cap Small Cap
$14,900
$10,000
$9,000
$12,000
$8,775
$6,000
$8,500
$6,000
$4,500
Audit
Compensation
Nom/Gov
2014 Median Committee Member Additional Fees
Top 200 Mid Cap Small Cap
BOARD LEADERSHIP
Steven Hall & Partners Page | 19
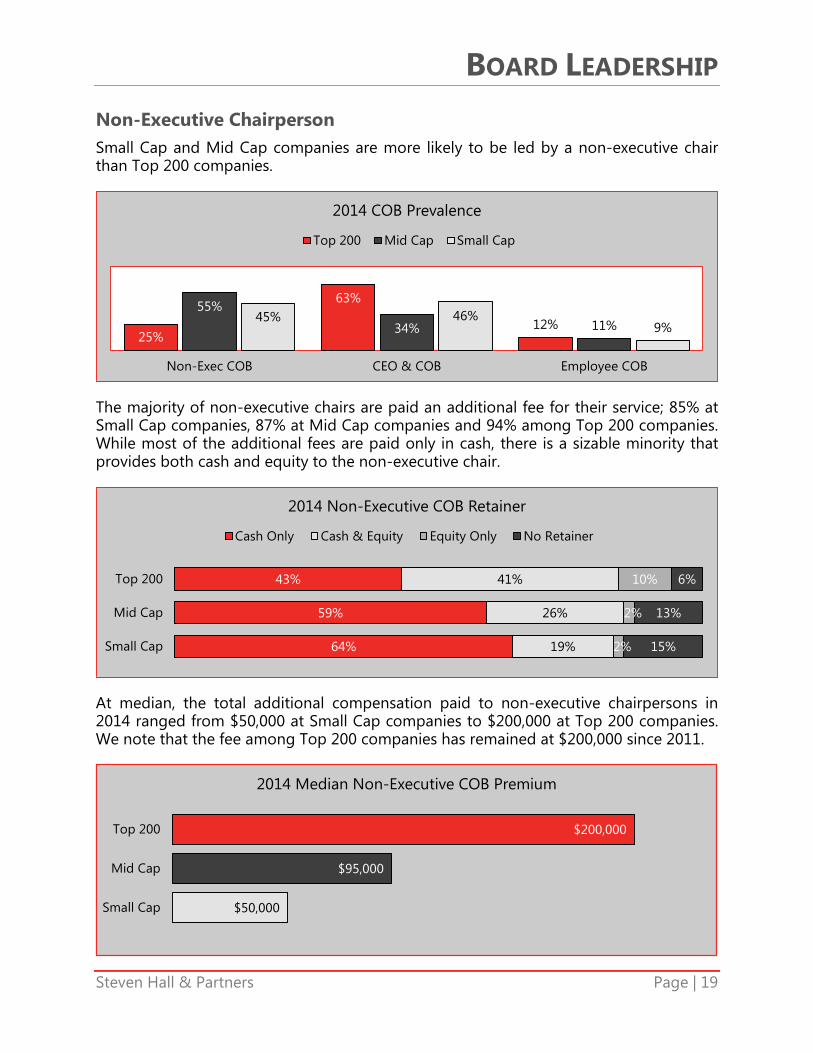
Non-Executive Chairperson Small Cap and Mid Cap companies are more likely to be led by a non-executive chair than Top 200 companies.
The majority of non-executive chairs are paid an additional fee for their service; 85% at Small Cap companies, 87% at Mid Cap companies and 94% among Top 200 companies. While most of the additional fees are paid only in cash, there is a sizable minority that provides both cash and equity to the non-executive chair.
At median, the total additional compensation paid to non-executive chairpersons in 2014 ranged from $50,000 at Small Cap companies to $200,000 at Top 200 companies. We note that the fee among Top 200 companies has remained at $200,000 since 2011.
25%
63%
12%55%
34% 11%45% 46%
9%
Non-Exec COB CEO & COB Employee COB
2014 COB Prevalence
Top 200 Mid Cap Small Cap
43%
59%
64%
41%
26%
19%
10%
2%
2%
6%
13%
15%
Top 200
Mid Cap
Small Cap
2014 Non-Executive COB Retainer
Cash Only Cash & Equity Equity Only No Retainer
$200,000
$95,000
$50,000
Top 200
Mid Cap
Small Cap
2014 Median Non-Executive COB Premium
BOARD LEADERSHIP
Steven Hall & Partners Page | 20
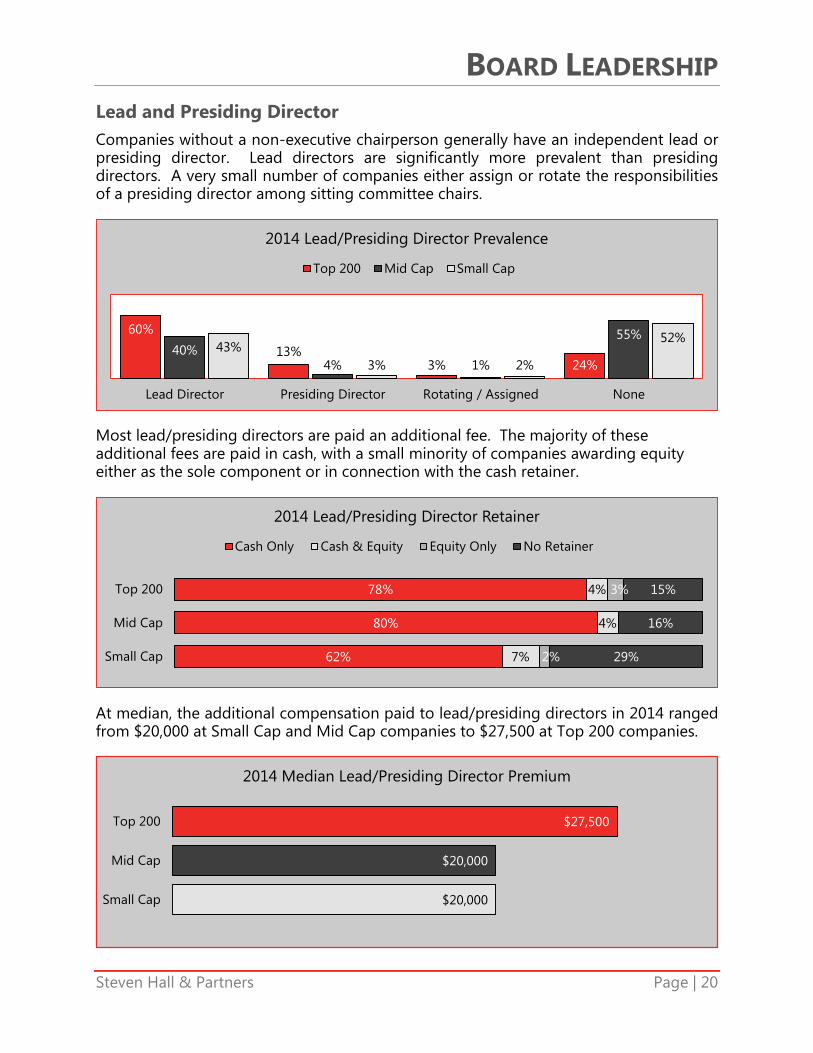
Lead and Presiding Director Companies without a non-executive chairperson generally have an independent lead or presiding director. Lead directors are significantly more prevalent than presiding directors. A very small number of companies either assign or rotate the responsibilities of a presiding director among sitting committee chairs.
Most lead/presiding directors are paid an additional fee. The majority of these additional fees are paid in cash, with a small minority of companies awarding equity either as the sole component or in connection with the cash retainer.
At median, the additional compensation paid to lead/presiding directors in 2014 ranged from $20,000 at Small Cap and Mid Cap companies to $27,500 at Top 200 companies.
60%
13%3% 24%
40%4% 1%
55%43%
3% 2%
52%
Lead Director Presiding Director Rotating / Assigned None
2014 Lead/Presiding Director Prevalence
Top 200 Mid Cap Small Cap
78%
80%
62%
4%
4%
7%
3%
2%
15%
16%
29%
Top 200
Mid Cap
Small Cap
2014 Lead/Presiding Director Retainer
Cash Only Cash & Equity Equity Only No Retainer
$27,500
$20,000
$20,000
Top 200
Mid Cap
Small Cap
2014 Median Lead/Presiding Director Premium
SHARE OWNERSHIP AND RETENTION GUIDELINES
Steven Hall & Partners Page | 21
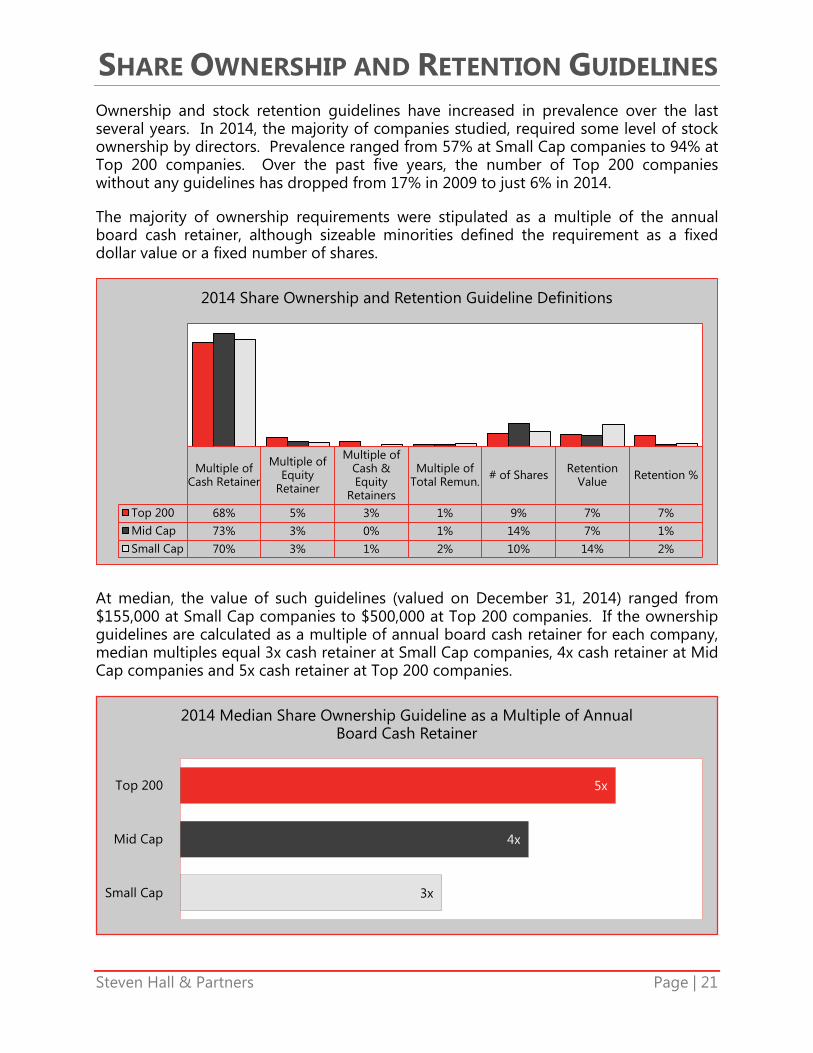
Ownership and stock retention guidelines have increased in prevalence over the last several years. In 2014, the majority of companies studied, required some level of stock ownership by directors. Prevalence ranged from 57% at Small Cap companies to 94% at Top 200 companies. Over the past five years, the number of Top 200 companies without any guidelines has dropped from 17% in 2009 to just 6% in 2014.
The majority of ownership requirements were stipulated as a multiple of the annual board cash retainer, although sizeable minorities defined the requirement as a fixed dollar value or a fixed number of shares.
At median, the value of such guidelines (valued on December 31, 2014) ranged from $155,000 at Small Cap companies to $500,000 at Top 200 companies. If the ownership guidelines are calculated as a multiple of annual board cash retainer for each company, median multiples equal 3x cash retainer at Small Cap companies, 4x cash retainer at Mid Cap companies and 5x cash retainer at Top 200 companies.
Multiple ofCash Retainer
Multiple ofEquity
Retainer
Multiple ofCash &Equity
Retainers
Multiple ofTotal Remun. # of Shares Retention
Value Retention %
Top 200 68% 5% 3% 1% 9% 7% 7%
Mid Cap 73% 3% 0% 1% 14% 7% 1%
Small Cap 70% 3% 1% 2% 10% 14% 2%
2014 Share Ownership and Retention Guideline Definitions
5x
4x
3x
Top 200
Mid Cap
Small Cap
2014 Median Share Ownership Guideline as a Multiple of Annual Board Cash Retainer
TOTAL BOARD COST
Steven Hall & Partners Page | 22
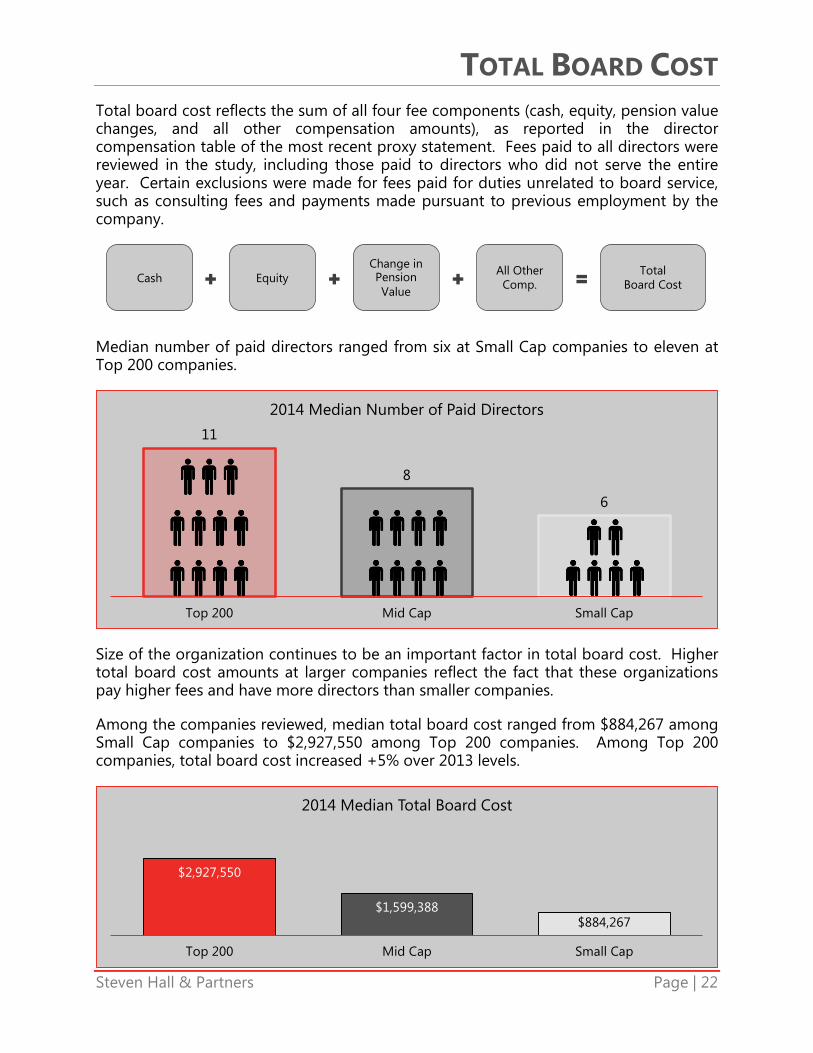
Total board cost reflects the sum of all four fee components (cash, equity, pension value changes, and all other compensation amounts), as reported in the director compensation table of the most recent proxy statement. Fees paid to all directors were reviewed in the study, including those paid to directors who did not serve the entire year. Certain exclusions were made for fees paid for duties unrelated to board service, such as consulting fees and payments made pursuant to previous employment by the company.
Median number of paid directors ranged from six at Small Cap companies to eleven at Top 200 companies.
Size of the organization continues to be an important factor in total board cost. Higher total board cost amounts at larger companies reflect the fact that these organizations pay higher fees and have more directors than smaller companies.
Among the companies reviewed, median total board cost ranged from $884,267 among Small Cap companies to $2,927,550 among Top 200 companies. Among Top 200 companies, total board cost increased +5% over 2013 levels.
11
8
6
Top 200 Mid Cap Small Cap
2014 Median Number of Paid Directors
$2,927,550
$1,599,388$884,267
Top 200 Mid Cap Small Cap
2014 Median Total Board Cost
Cash Equity Change in Pension Value
All Other Comp.
Total Board Cost
TOTAL BOARD COST
Steven Hall & Partners Page | 23
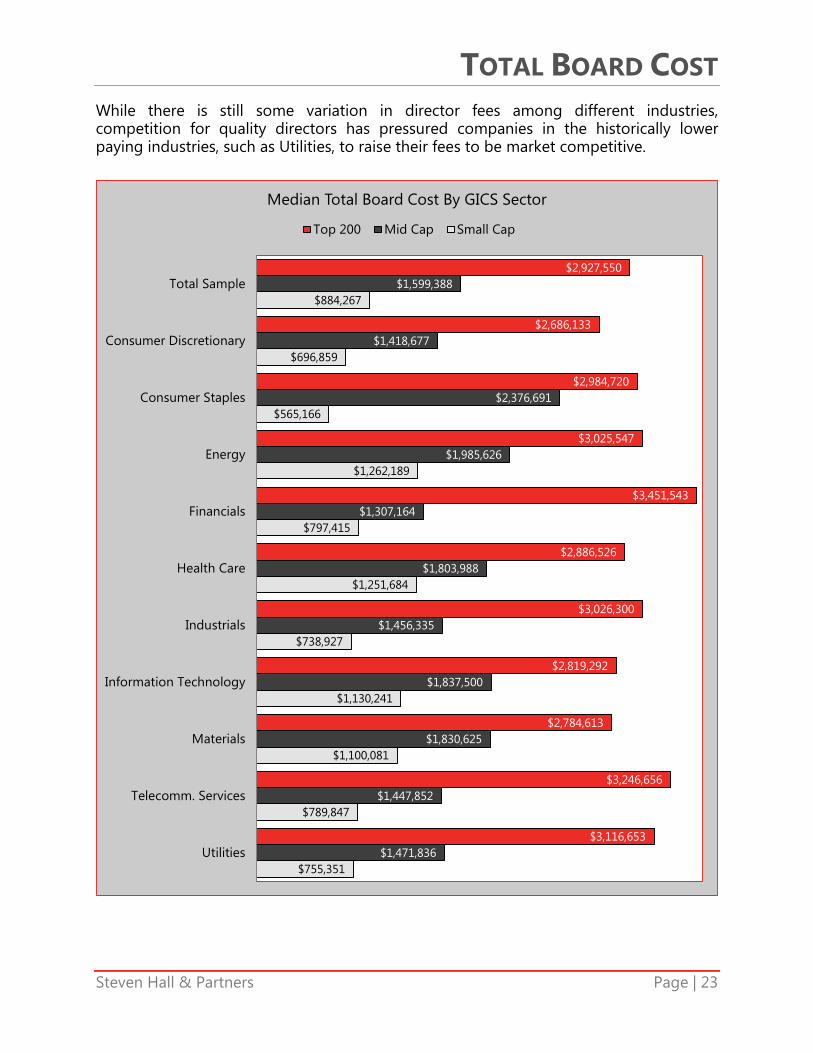
While there is still some variation in director fees among different industries, competition for quality directors has pressured companies in the historically lower paying industries, such as Utilities, to raise their fees to be market competitive.
$2,927,550
$2,686,133
$2,984,720
$3,025,547
$3,451,543
$2,886,526
$3,026,300
$2,819,292
$2,784,613
$3,246,656
$3,116,653
$1,599,388
$1,418,677
$2,376,691
$1,985,626
$1,307,164
$1,803,988
$1,456,335
$1,837,500
$1,830,625
$1,447,852
$1,471,836
$884,267
$696,859
$565,166
$1,262,189
$797,415
$1,251,684
$738,927
$1,130,241
$1,100,081
$789,847
$755,351
Total Sample
Consumer Discretionary
Consumer Staples
Energy
Financials
Health Care
Industrials
Information Technology
Materials
Telecomm. Services
Utilities
Median Total Board Cost By GICS Sector
Top 200 Mid Cap Small Cap
CONCLUSION
Steven Hall & Partners Page | 24
What to expect for 2016:
• Modest increases (+3-5%) in director compensation levels
− The majority of companies review director compensation programs annually to ensure that the program remains competitive. This approach also facilitates the ability to make modest increases when needed, thus avoiding big increases which might invite unwanted scrutiny from outside constituencies
• Increased scrutiny on director pay and governance practices
− While the media has historically focused on the perceived excesses in executive compensation, we find that there has been an increased focus on director pay levels
− Institutional Shareholder Services (ISS) has begun including a relative director pay assessment to its governance risk scoring system
• Increase in share ownership guideline prevalence and guideline value
− Companies without formal guidelines will continue to adopt formal ownership guidelines for directors
− Guideline values will increase as both a dollar amount and as a multiple of annual cash retainer reflecting the desire for directors to have significant equity holdings
• Continued decline in meeting fee prevalence
− Meeting fee use will continue to decline as companies move to retainer-only programs that offer greater simplification and ease the administrative burdens associated with director compensation programs
Things to consider when conducting an annual review of director compensation:
• Is the current director compensation program competitive with regards to compensation levels and mix of cash and equity?
− Does it allow the company to attract and retain high quality director candidates?
− Are modifications to the director compensation program sustainable, appropriate and reflective of projected market increases and company growth?
− Is the program’s structure aligned with the current best practice of delivering at least half of total value to directors in the form of equity?
• How will modifications to the director compensation program affect total board cost?
As always, we welcome the opportunity to further discuss this study or any specific comments or questions you may have regarding your current or contemplated program.
APPENDIX A
Steven Hall & Partners Page | 25
Amazon.com, Inc. Lowe's Cos., Inc.
Aramark Macy's, Inc.
Autonation, Inc. Mcdonald's Corp.
Best Buy Co., Inc. Murphy USA, Inc.
Carnival Corp. Nike, Inc.
Comcast Corp. Office Depot, Inc.
Delphi Automotive Plc Omnicom Group, Inc.
DIRECTV Penske Automotive Group, Inc.
Dollar General Corp. Sears Holdings Corp.
Ford Motor Co. Staples, Inc.
Gap, Inc. Starbucks Corp.
General Motors Co. Target Corp.
Genuine Parts Co. Time Warner Cable, Inc.
Goodyear Tire & Rubber Co. Time Warner, Inc.
Home Depot, Inc. TJX Cos, Inc.
Johnson Controls, Inc. Twenty-First Century Fox, Inc.
Kohl's Corp. Walt Disney Co.
Lear Corp. Whirlpool Corp.
Liberty Global Plc
Altria Group, Inc. Mondelez International, Inc.
Archer-Daniels-Midland Co. PepsiCo, Inc.
Bunge Ltd. Philip Morris International, Inc.
Coca-Cola Co. Procter & Gamble Co.
Colgate-Palmolive Co. Publix Super Markets, Inc.
Conagra Foods, Inc. Rite Aid Corp.
Costco Wholesale Corp. SUPERVALU, Inc.
CVS Health Corp. Sysco Corp.
General Mills, Inc. Tyson Foods, Inc.
Kimberly-Clark Corp. Walgreens Boots Alliance, Inc.
Kraft Foods Group, Inc. Wal-Mart Stores, Inc.
Kroger Co.
Anadarko Petroleum Corp. National Oilwell Varco, Inc.
Baker Hughes, Inc. Occidental Petroleum Corp.
Chesapeake Energy Corp. PBF Energy, Inc.
Chevron Corp. Phillips 66
ConocoPhillips Plains All American Pipeline LP
Devon Energy Corp. Schlumberger Ltd.
Energy Transfer Partners LP Sunoco Logistics Partners LP
EOG Resources, Inc. Tesoro Corp.
Exxon Mobil Corp. Valero Energy Corp.
Halliburton Co. Weatherford International Plc
Hollyfrontier Corp. Western Refining, Inc.
Kinder Morgan, Inc. World Fuel Services Corp.
Marathon Petroleum Corp.
Ace Ltd. Hartford Financial Services Group, Inc.
Aflac, Inc. JPMorgan Chase & Co.
Allstate Corp. Metlife, Inc.
American Express Co. Morgan Stanley
American International Group, Inc. PNC Financial Services Group, Inc.
Bank of America Corp. Progressive Corp.
Bank Of New York Mellon Corp. Prudential Financial, Inc.
Berkshire Hathaway, Inc. Travelers Cos, Inc.
Capital One Financial Corp. U.S. Bancorp.
Citigroup, Inc. Wells Fargo & Co.
Goldman Sachs Group, Inc.
Financials
Consumer Staples
Energy
Top 200 Companies Studied
Consumer Discretionary
APPENDIX A
Steven Hall & Partners Page | 26
Abbott Laboratories Express Scripts Holding Co.
Abbvie, Inc. Gilead Sciences, Inc.
Aetna, Inc. HCA Holdings, Inc.
Amerisourcebergen Corp. Humana, Inc.
Amgen, Inc. Johnson & Johnson
Anthem, Inc. McKesson Corp.
Baxter International, Inc. Medtronic Plc
Bristol-Myers Squibb Co. Merck & Co., Inc.
Cardinal Health, Inc. Pfizer, Inc.
Centene Corp. Tenet Healthcare Corp.
Cigna Corp. Thermo Fisher Scientific, Inc.
Community Health Systems, Inc. UnitedHealth Group, Inc.
Eli Lilly & Co
3M Co. General Electric Co.
American Airlines Group, Inc. Honeywell International, Inc.
Boeing Co. Lockheed Martin Corp.
Caterpillar, Inc. ManpowerGroup, Inc.
Cummins, Inc. Northrop Grumman Corp.
Danaher Corp. PACCAR, Inc.
Deere & Co. Raytheon Co.
Delta Air Lines, Inc. Southwest Airlines Co.
Eaton Corp. Plc Union Pacific Corp.
Emerson Electric Co. United Continental Holdings, Inc.
FedEx Corp. United Parcel Service, Inc.
Fluor Corp. United Technologies Corp.
General Dynamics Corp.
Accenture Plc Intel Corp.
Apple, Inc. International Business Machines Corp.
Arrow Electronics, Inc. Jabil Circuit, Inc.
Avnet, Inc. Micron Technology, Inc.
Cisco Systems, Inc. Microsoft Corp.
eBay, Inc. Oracle Corp.
EMC Corp. QUALCOMM, Inc.
Flextronics International Ltd. Tech Data Corp.
Google, Inc. Western Digital Corp.
Hewlett-Packard Co. Xerox Corp.
Ingram Micro, Inc.
Alcoa, Inc. LyondellBasell Industries NV
Dow Chemical Co. Monsanto Co.
Ei Du Pont De Nemours & Co. Nucor Corp.
Freeport-Mcmoran, Inc. PPG Industries, Inc.
International Paper Co. United States Steel Corp.
AT&T, Inc. T-Mobile Us, Inc.
Centurylink, Inc. Verizon Communications, Inc.
AES Corp. NextEra Energy, Inc.
American Electric Power Co., Inc. NRG Energy, Inc.
Duke Energy Corp. PG&E Corp.
Exelon Corp. Southern Co.
FirstEnergy Corp.
Utilities
Information Technology
Materials
Telecomm. Services
Health Care
Industrials
Top 200 Companies Studied
APPENDIX A
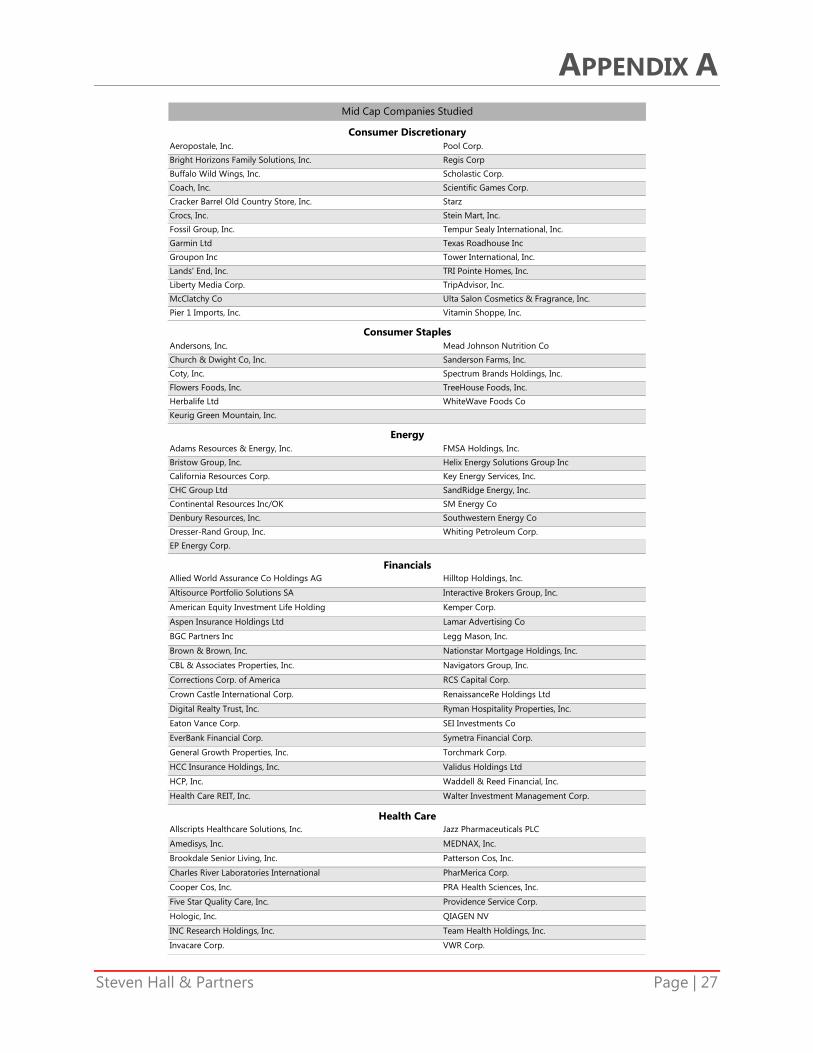
Steven Hall & Partners Page | 27
Aeropostale, Inc. Pool Corp.
Bright Horizons Family Solutions, Inc. Regis Corp
Buffalo Wild Wings, Inc. Scholastic Corp.
Coach, Inc. Scientific Games Corp.
Cracker Barrel Old Country Store, Inc. Starz
Crocs, Inc. Stein Mart, Inc.
Fossil Group, Inc. Tempur Sealy International, Inc.
Garmin Ltd Texas Roadhouse Inc
Groupon Inc Tower International, Inc.
Lands' End, Inc. TRI Pointe Homes, Inc.
Liberty Media Corp. TripAdvisor, Inc.
McClatchy Co Ulta Salon Cosmetics & Fragrance, Inc.
Pier 1 Imports, Inc. Vitamin Shoppe, Inc.
Andersons, Inc. Mead Johnson Nutrition Co
Church & Dwight Co, Inc. Sanderson Farms, Inc.
Coty, Inc. Spectrum Brands Holdings, Inc.
Flowers Foods, Inc. TreeHouse Foods, Inc.
Herbalife Ltd WhiteWave Foods Co
Keurig Green Mountain, Inc.
Adams Resources & Energy, Inc. FMSA Holdings, Inc.
Bristow Group, Inc. Helix Energy Solutions Group Inc
California Resources Corp. Key Energy Services, Inc.
CHC Group Ltd SandRidge Energy, Inc.
Continental Resources Inc/OK SM Energy Co
Denbury Resources, Inc. Southwestern Energy Co
Dresser-Rand Group, Inc. Whiting Petroleum Corp.
EP Energy Corp.
Allied World Assurance Co Holdings AG Hilltop Holdings, Inc.
Altisource Portfolio Solutions SA Interactive Brokers Group, Inc.
American Equity Investment Life Holding Kemper Corp.
Aspen Insurance Holdings Ltd Lamar Advertising Co
BGC Partners Inc Legg Mason, Inc.
Brown & Brown, Inc. Nationstar Mortgage Holdings, Inc.
CBL & Associates Properties, Inc. Navigators Group, Inc.
Corrections Corp. of America RCS Capital Corp.
Crown Castle International Corp. RenaissanceRe Holdings Ltd
Digital Realty Trust, Inc. Ryman Hospitality Properties, Inc.
Eaton Vance Corp. SEI Investments Co
EverBank Financial Corp. Symetra Financial Corp.
General Growth Properties, Inc. Torchmark Corp.
HCC Insurance Holdings, Inc. Validus Holdings Ltd
HCP, Inc. Waddell & Reed Financial, Inc.
Health Care REIT, Inc. Walter Investment Management Corp.
Allscripts Healthcare Solutions, Inc. Jazz Pharmaceuticals PLC
Amedisys, Inc. MEDNAX, Inc.
Brookdale Senior Living, Inc. Patterson Cos, Inc.
Charles River Laboratories International PharMerica Corp.
Cooper Cos, Inc. PRA Health Sciences, Inc.
Five Star Quality Care, Inc. Providence Service Corp.
Hologic, Inc. QIAGEN NV
INC Research Holdings, Inc. Team Health Holdings, Inc.
Invacare Corp. VWR Corp.
Financials
Health Care
Mid Cap Companies Studied
Consumer Discretionary
Consumer Staples
Energy
APPENDIX A
Steven Hall & Partners Page | 28
AAR Corp. KAR Auction Services, Inc.
ACCO Brands Corp. Kirby Corp.
Aegion Corp. Knight Transportation, Inc.
Applied Industrial Technologies, Inc. Meritor, Inc.
Beacon Roofing Supply, Inc. MSC Industrial Direct Co, Inc.
Cenveo, Inc. Nortek, Inc.
Cubic Corp. On Assignment, Inc.
Dun & Bradstreet Corp. Roper Industries, Inc.
DXP Enterprises, Inc. Rush Enterprises, Inc.
Dycom Industries, Inc. Spirit Airlines, Inc.
Encore Wire Corp. Timken Co
GATX Corp. Towers Watson & Co
Graco, Inc. Universal Forest Products Inc
Griffon Corp. Universal Truckload Services, Inc.
H&E Equipment Services, Inc. USG Corp.
IHS, Inc. Verisk Analytics, Inc.
InnerWorkings, Inc. WABCO Holdings, Inc.
Insperity, Inc. Wabtec Corp.
Interface, Inc. West Corp.
Kansas City Southern Woodward, Inc.
Autodesk, Inc. Knowles Corp.
Avago Technologies Ltd NETGEAR, Inc.
Belden, Inc. Nuance Communications, Inc.
Blackhawk Network Holdings, Inc. ON Semiconductor Corp.
Cardtronics, Inc. Plexus Corp.
Ciena Corp. Sabre Corp.
Diebold, Inc. ScanSource, Inc.
ePlus Inc Science Applications International Corp.
Finisar Corp. Synopsys, Inc.
First Solar, Inc. Take-Two Interactive Software, Inc.
Gartner, Inc. Trimble Navigation Ltd
IAC/InterActiveCorp. TTM Technologies, Inc.
Intuit, Inc. VeriSign, Inc.
Itron, Inc. Vishay Intertechnology, Inc.
KLA-Tencor Corp.
AptarGroup, Inc. Kraton Performance Polymers, Inc.
Axiall Corp. Olympic Steel, Inc.
Bemis Co, Inc. Silgan Holdings, Inc.
Boise Cascade Co Tronox Ltd
Cabot Corp. Walter Energy, Inc.
Carpenter Technology Corp. Worthington Industries, Inc.
Greif, Inc.
Cincinnati Bell, Inc. SBA Communications Corp.
Frontier Communications Corp. United States Cellular Corp.
IDT Corp.
ALLETE, Inc. Questar Corp
American Water Works Co, Inc. Southwest Gas Corp.
Avista Corp. UIL Holdings Corp.
Dynegy Inc Vectren Corp.
MDU Resources Group, Inc. Wisconsin Energy Corp.
Pepco Holdings, Inc.
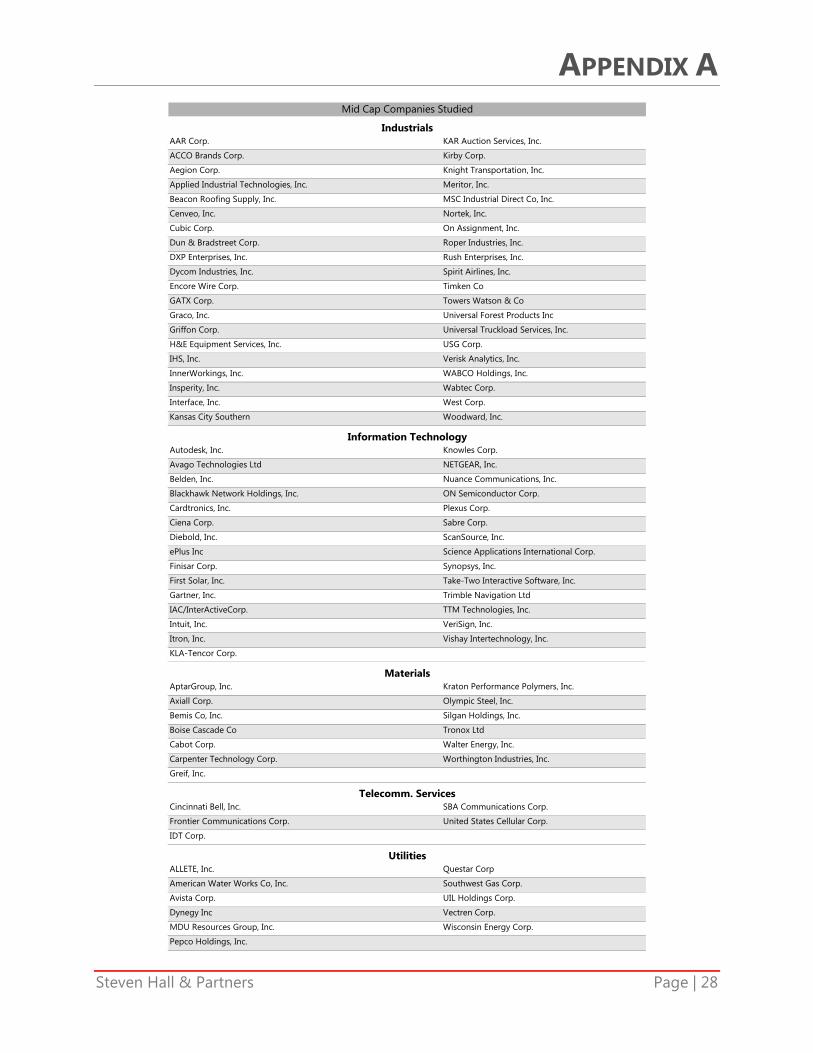
Materials
Telecomm. Services
Utilities
Mid Cap Companies Studied
Industrials
Information Technology
APPENDIX A
Steven Hall & Partners Page | 29
AH Belo Corp. Kirkland's, Inc.
American Public Education, Inc. Krispy Kreme Doughnuts, Inc.
bebe stores, Inc. Lifetime Brands, Inc.
Central European Media Enterprises Ltd. Nautilus, Inc.
Crown Media Holdings Inc Potbelly Corp.
Culp, Inc. Salem Media Group Inc
Dixie Group, Inc. SFX Entertainment Inc
Entercom Communications Corp Superior Industries International, Inc.
EVINE Live, Inc. Tile Shop Holdings, Inc.
Fiesta Restaurant Group, Inc. Townsquare Media, Inc.
Francesca's Holdings Corp. Universal Electronics, Inc.
Grand Canyon Education, Inc. Universal Technical Institute, Inc.
Harte-Hanks, Inc. Vera Bradley, Inc.
Installed Building Products, Inc. Vince Holding Corp
International Speedway Corp.
Farmer Bros Co Natural Grocers by Vitamin Cottage, Inc.
Inter Parfums, Inc. Tootsie Roll Industries, Inc.
Landec Corp. WD-40 Co
Medifast, Inc.
Approach Resources Inc Parsley Energy, Inc.
Bonanza Creek Energy, Inc. Resolute Energy Corp
Carrizo Oil & Gas, Inc. REX American Resources Corp.
Clayton Williams Energy, Inc. Rice Energy Inc
Era Group, Inc. RigNet, Inc.
Gulfport Energy Corp. Triangle Petroleum Corp.
Magnum Hunter Resources Corp. Vertex Energy, Inc.
Alexandria Real Estate Equities, Inc. Investors Real Estate Trust
Altisource Residential Corp. iStar Financial, Inc.
American Capital Agency Corp. Kilroy Realty Corp.
American Homes 4 Rent Kite Realty Group Trust
AV Homes, Inc. MB Financial, Inc.
BancFirst Corp. Medical Properties Trust, Inc.
Cathay General BanCorp. National Interstate Corp.
Cohen & Steers, Inc. National Western Life Insurance Co
Colony Capital, Inc. New York Mortgage Trust, Inc.
Donegal Group, Inc. Northwest Bancshares, Inc.
Douglas Emmett Inc Paramount Group, Inc.
DuPont Fabros Technology, Inc. Park National Corp
EPR Properties Potlatch Corp.
FBL Financial Group, Inc. PrivateBancorp., Inc.
Federal Realty Investment Trust Provident Financial Services, Inc.
FNB Corp. RAIT Financial Trust
FXCM, Inc. Regency Centers Corp.
Global Indemnity PLC Renasant Corp.
Greenhill & Co, Inc. Summit Hotel Properties, Inc.
HCI Group, Inc. Texas Capital Bancshares, Inc.
HFF, Inc. TFS Financial Corp.
HomeStreet, Inc. Two Harbors Investment Corp.
Howard Hughes Corp. United Community Banks, Inc.
Independence Holding Co Universal Insurance Holdings, Inc.
Investment Technology Group, Inc. Walker & Dunlop, Inc.
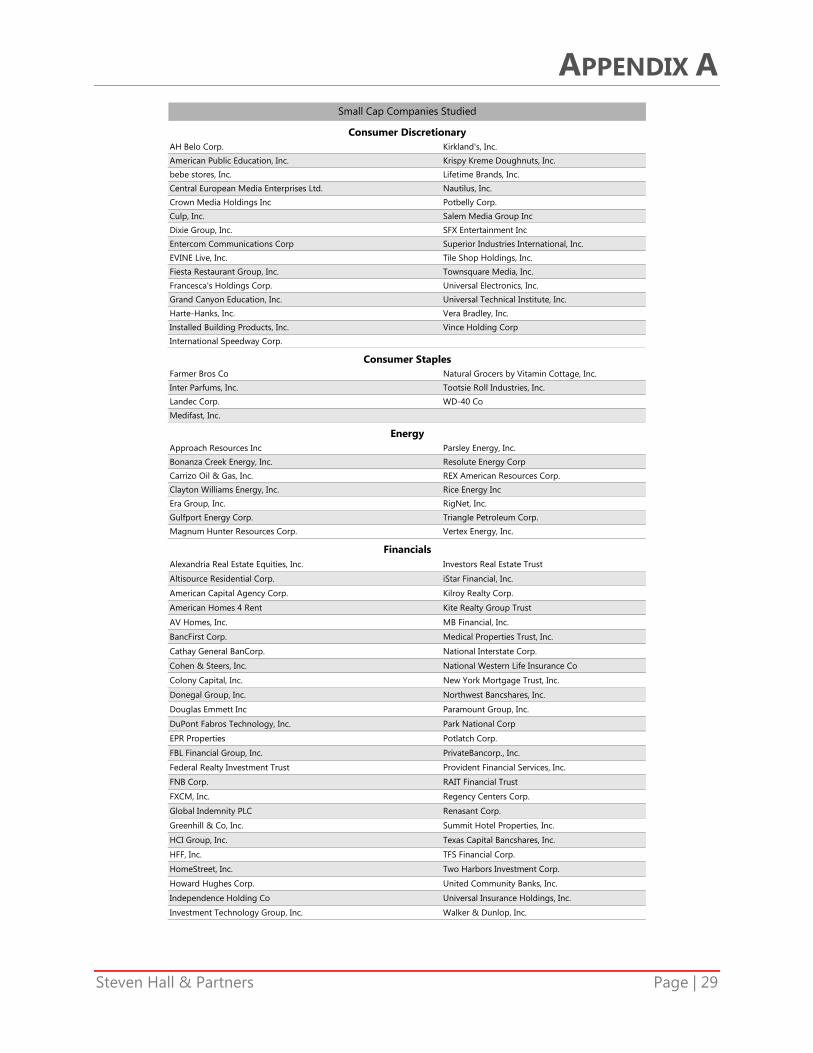
Financials
Small Cap Companies Studied
Consumer Discretionary
Consumer Staples
Energy
APPENDIX A
Steven Hall & Partners Page | 30
Aceto Corp. ICU Medical, Inc.
Acorda Therapeutics, Inc. LHC Group, Inc.
Alliance HealthCare Services, Inc. MedAssets, Inc.
Almost Family, Inc. Medicines Co
AngioDynamics, Inc. Medidata Solutions, Inc.
Cambrex Corp. Omnicell, Inc.
Cepheid Prestige Brands Holdings, Inc.
CONMED Corp. RadNet, Inc.
CorVel Corp. RTI Surgical, Inc.
Cross Country Healthcare, Inc. Sagent Pharmaceuticals, Inc.
Emergent Biosolutions, Inc. Veeva Systems, Inc.
Globus Medical, Inc.
AAON, Inc. Marten Transport Ltd.
Aerovironment, Inc. Miller Industries, Inc./TN
Air Transport Services Group, Inc. Mobile Mini, Inc.
Ameresco, Inc. Neff Corp.
Astronics Corp. PAM Transportation Services Inc
Barrett Business Services, Inc. Polypore International, Inc.
Continental Building Products Inc Powell Industries, Inc.
CRA International, Inc. Power Solutions International, Inc.
Ducommun, Inc. RBC Bearings, Inc.
Erickson, Inc. Team, Inc.
FreightCar America, Inc. Thermon Group Holdings, Inc.
Hill International, Inc. VSE Corp.
Insteel Industries, Inc. WageWorks, Inc.
LMI Aerospace, Inc. Xerium Technologies, Inc.
ADTRAN, Inc. Millennial Media, Inc.
Blackbaud, Inc. Monolithic Power Systems, Inc.
Cirrus Logic, Inc. MTS Systems Corp.
Cornerstone OnDemand, Inc. NetSuite, Inc.
CoStar Group, Inc. Oclaro, Inc.
CTS Corp. Perficient, Inc.
Daktronics, Inc. Rofin-Sinar Technologies, Inc.
Emulex Corp. Rosetta Stone, Inc.
EnerNOC, Inc. ShoreTel, Inc.
Envestnet, Inc. Sonus Networks Inc
EPAM Systems, Inc. Ultimate Software Group, Inc.
Fabrinet Ultra Clean Holdings, Inc.
Harmonic, Inc. Virtusa Corp.
Intralinks Holdings, Inc. Vishay Precision Group, Inc.
IXYS Corp. WebMD Health Corp.
Lattice Semiconductor Corp. Zillow Group, Inc.
American Vanguard Corp. Myers Industries, Inc.
Balchem Corp. US Concrete, Inc.
Hecla Mining Co Wausau Paper Corp.
Horsehead Holding Corp.
Cogent Communications Holdings, Inc. Iridium Communications, Inc.
Consolidated Communications Holdings, Inc. NTELOS Holdings Corp.
Hawaiian Telcom Holdco, Inc.
Atlantic Power Corp. MGE Energy, Inc.
California Water Service Group NRG Yield, Inc.
Empire District Electric Co
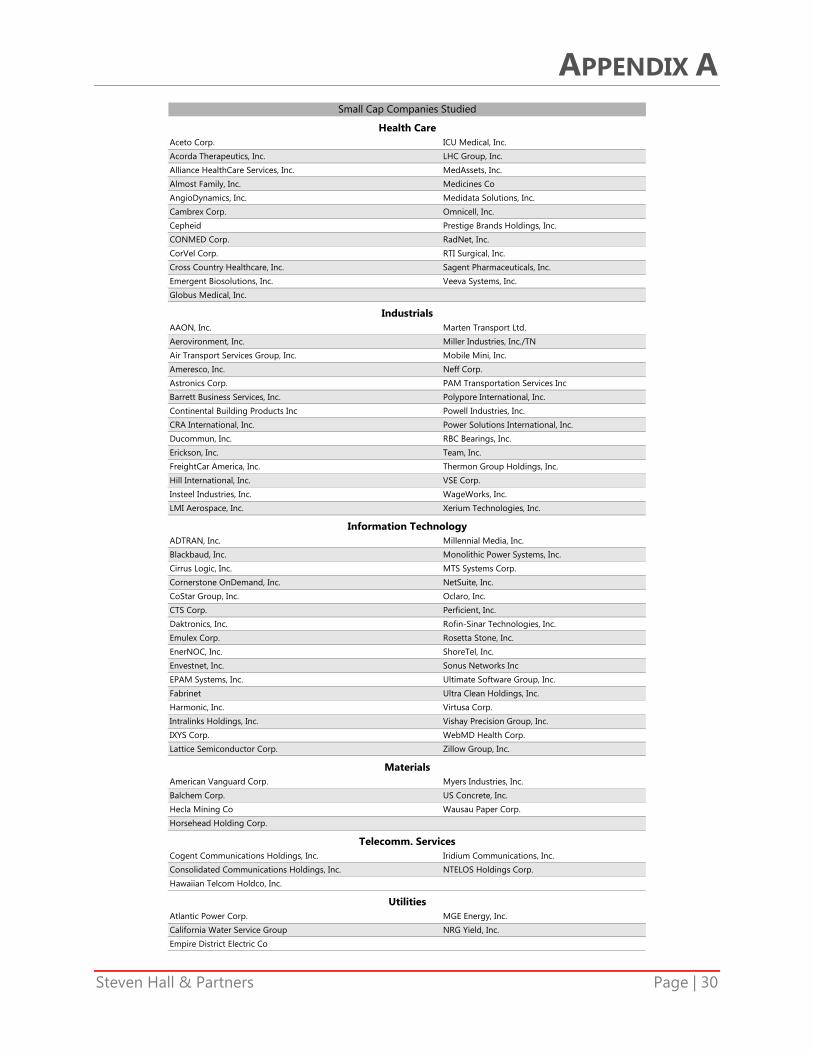
Materials
Telecomm. Services
Utilities
Health Care
Small Cap Companies Studied
Industrials
Information Technology

APPENDIX B
Steven Hall & Partners Page | 31
2014 Director CompensationMedian Board of Director Fees
Top Mid Small200 Cap Cap
Sample Size# CompaniesRevenues ($ million)
Board Fees
Cash RetainerPrevalence
Equity RetainerPrevalence
Meeting Fee*Prevalence
Committee Fees
Audit Committee
Chair Retainer*Prevalence
Member Retainer*Prevalence
Meeting Fee*Prevalence
Compensation Committee
Chair Retainer*Prevalence
Member Retainer*Prevalence
Meeting Fee*Prevalence
Nominating / Governance Committee
Chair Retainer*Prevalence
Member Retainer*Prevalence
Meeting Fee*Prevalence
Total Compensation
Average Director
Cash / Equity 43% / 57% 48% / 52% 51% / 49%
Audit Chair
Cash / Equity 46% / 54% 51% / 49% 53% / 47%
Compensation Chair
Cash / Equity 45% / 55% 50% / 50% 52% / 48%
Nom / Gov Chair
Cash / Equity 44% / 56% 48% / 52% 50% / 50%
Non-Chair
Cash / Equity 42% / 58% 47% / 53% 50% / 50%
* Represents median of non-zero values.
$205,143
$201,500
$197,200
$190,167
$2,000 $1,50025% 25%
$201,583
$260,000
$272,250
$276,500
$280,000
$276,667
$10,000 $6,00024% 37%
$15,000 $10,00093% 91%
$2,000 $1,50023% 33%
$10,000 $7,50027% 38%
$20,000 $15,00096% 92%
$150,000
33%
$2,000
93%
$100,000
$1,50034%23%
$2,000
42%
$10,000
97%
93%
$1,50038%
$15,00089%
200$443
$45,00096%
$65,000
$60,000
200 200
$20,00094%
$25,000
$2,140
99%
$27,470
21%
$2,000
97%
99%
$100,000
$10,00048%
$10,00044%
40%
$1,00036%
$10,000
$143,000
$133,292
85%
$6,750
$142,313
$146,125
$140,875
$5,00041%
$1,00025%
$1,00037%
$10,00081%

APPENDIX B
Steven Hall & Partners Page | 32
GICS Sector: Consumer Discretionary2014 Median Board of Director Fees
Top Mid Small200 Cap Cap
Sample Size# CompaniesRevenues ($ million)
Board Fees
Cash RetainerPrevalence
Equity RetainerPrevalence
Meeting Fee*Prevalence
Committee Fees
Audit Committee
Chair Retainer*Prevalence
Member Retainer*Prevalence
Meeting Fee*Prevalence
Compensation Committee
Chair Retainer*Prevalence
Member Retainer*Prevalence
Meeting Fee*Prevalence
Nominating / Governance Committee
Chair Retainer*Prevalence
Member Retainer*Prevalence
Meeting Fee*Prevalence
Total Compensation
Average Director
Cash / Equity 43% / 57% 54% / 46% 55% / 45%
Audit Chair
Cash / Equity 45% / 55% 56% / 44% 57% / 43%
Compensation Chair
Cash / Equity 44% / 56% 55% / 45% 56% / 44%
Nom / Gov Chair
Cash / Equity 44% / 56% 54% / 46% 55% / 45%
Non-Chair
Cash / Equity 41% / 59% 53% / 47% 54% / 46%
* Represents median of non-zero values.
$1,830
$245,000 $186,000
$265,000 $199,750
$260,000 $187,500
$263,333 $199,000
$265,000 $196,875
$2,000 $1,500
$15,000 $10,00086%
$118,750
$8,000 $7,50024% 42%
$3,75028%
19% 23%
$1,12528%
$115,000
85%
$8,75072%
$1,00031%
$1,500
$15,00089% 96%
$10,00076%
22% 23%
$10,000 $10,00024% 46%
$140,000
31%
$5,50028%
83%
19% 19% 34%
$13,750$25,000 $20,00092% 96%
$100,00097%
$20,000
37 26$22,812
$115,000
$111,125
$90,000 $65,00097% 100%
90%88%
29$416
$50,000100%
$50,000
$103,500
$1,500 $2,000
$8,00031%
$10,000 $15,00030% 50%
$1,850 $1,50022% 23%
$1,000
$1,500
$1,850

APPENDIX B
Steven Hall & Partners Page | 33
GICS Sector: Consumer Staples2014 Median Board of Director Fees
Top Mid Small200 Cap Cap
Sample Size# CompaniesRevenues ($ million)
Board Fees
Cash RetainerPrevalence
Equity RetainerPrevalence
Meeting Fee*Prevalence
Committee Fees
Audit Committee
Chair Retainer*Prevalence
Member Retainer*Prevalence
Meeting Fee*Prevalence
Compensation Committee
Chair Retainer*Prevalence
Member Retainer*Prevalence
Meeting Fee*Prevalence
Nominating / Governance Committee
Chair Retainer*Prevalence
Member Retainer*Prevalence
Meeting Fee*Prevalence
Total Compensation
Average Director
Cash / Equity 41% / 59% 52% / 48% 61% / 39%
Audit Chair
Cash / Equity 43% / 57% 54% / 46% 63% / 37%
Compensation Chair
Cash / Equity 42% / 58% 53% / 47% 60% / 40%
Nom / Gov Chair
Cash / Equity 42% / 58% 54% / 46% 50% / 50%
Non-Chair
Cash / Equity 39% / 61% 51% / 49% 60% / 40%
* Represents median of non-zero values.
$4,409
$256,923 $220,469
$275,000 $235,000
$270,128 $230,026
$273,333 $233,333
$275,000 $235,000
$1,000 $2,000
$15,000 $10,00091%
$110,000
$6,200 $5,00017% 27%
$4,50029%
9% 36%
$2,00014%
$107,500
91%
$9,00029%
$2,15029%
$2,000
$15,00096% 91%
$10,00057%
9% 36%
$6,200 $5,00017% 27%
$165,000
14%
$5,00043%
71%
9% 27% 43%
$16,000$20,000 $17,50096% 100%
$120,00096%
$20,000
23 11$37,580
$108,750
$111,750
$90,000 $95,000100% 100%
86%91%
7$499
$37,00086%
$50,000
$100,000
$1,000 $2,000
$8,00071%
$10,000 $6,25035% 36%
$1,000 $2,5009% 36%
$2,500
$2,000
$1,000

APPENDIX B
Steven Hall & Partners Page | 34
GICS Sector: Energy2014 Median Board of Director Fees
Top Mid Small200 Cap Cap
Sample Size# CompaniesRevenues ($ million)
Board Fees
Cash RetainerPrevalence
Equity RetainerPrevalence
Meeting Fee*Prevalence
Committee Fees
Audit Committee
Chair Retainer*Prevalence
Member Retainer*Prevalence
Meeting Fee*Prevalence
Compensation Committee
Chair Retainer*Prevalence
Member Retainer*Prevalence
Meeting Fee*Prevalence
Nominating / Governance Committee
Chair Retainer*Prevalence
Member Retainer*Prevalence
Meeting Fee*Prevalence
Total Compensation
Average Director
Cash / Equity 42% / 58% 46% / 54% 50% / 50%
Audit Chair
Cash / Equity 43% / 57% 48% / 52% 51% / 49%
Compensation Chair
Cash / Equity 43% / 57% 47% / 53% 51% / 49%
Nom / Gov Chair
Cash / Equity 42% / 58% 46% / 54% 51% / 49%
Non-Chair
Cash / Equity 41% / 59% 45% / 55% 49% / 51%
* Represents median of non-zero values.
$2,419
$300,000 $250,000
$310,000 $265,000
$310,000 $261,250
$313,083 $264,167
$315,000 $265,000
$2,000 $1,500
$15,000 $10,00080%
$210,000
$10,000 $5,00028% 40%
$12,22814%
20% 27%
$1,00079%
$205,667
93%
$10,00079%
$1,00079%
$1,500
$15,00092% 93%
$10,00079%
24% 27%
$7,500 $5,25040% 40%
$175,000
79%
$24,19814%
86%
20% 27% 71%
$15,000$20,000 $19,37592% 93%
$150,00096%
$15,000
25 15$24,551
$203,750
$203,250
$100,000 $75,000100% 100%
86%87%
14$382
$50,000100%
$122,835
$194,000
$2,000 $1,500
$35,79614%
$10,000 $10,00048% 47%
$1,750 $1,50024% 27%
$1,000
$1,750
$1,750

APPENDIX B
Steven Hall & Partners Page | 35
GICS Sector: Financials2014 Median Board of Director Fees
Top Mid Small200 Cap Cap
Sample Size# CompaniesRevenues ($ million)
Board Fees
Cash RetainerPrevalence
Equity RetainerPrevalence
Meeting Fee*Prevalence
Committee Fees
Audit Committee
Chair Retainer*Prevalence
Member Retainer*Prevalence
Meeting Fee*Prevalence
Compensation Committee
Chair Retainer*Prevalence
Member Retainer*Prevalence
Meeting Fee*Prevalence
Nominating / Governance Committee
Chair Retainer*Prevalence
Member Retainer*Prevalence
Meeting Fee*Prevalence
Total Compensation
Average Director
Cash / Equity 43% / 57% 59% / 41% 59% / 41%
Audit Chair
Cash / Equity 46% / 54% 62% / 38% 62% / 38%
Compensation Chair
Cash / Equity 42% / 58% 60% / 40% 61% / 39%
Nom / Gov Chair
Cash / Equity 45% / 55% 59% / 41% 59% / 41%
Non-Chair
Cash / Equity 41% / 59% 58% / 42% 58% / 42%
* Represents median of non-zero values.
$1,713
$260,000 $165,000
$285,000 $180,000
$275,000 $176,000
$280,000 $181,667
$285,000 $187,500
$1,750 $2,000
$20,000 $10,00095%
$136,150
$10,000 $6,25024% 25%
$5,00038%
10% 41%
$1,00026%
$133,567
78%
$10,00074%
$1,00036%
$1,500
$15,00095% 91%
$10,00084%
10% 47%
$10,000 $7,50024% 28%
$150,000
36%
$6,50038%
90%
14% 53% 26%
$15,000$30,000 $25,000100% 94%
$73,73290%
$25,000
21 32$35,999
$134,400
$138,150
$90,000 $60,00090% 100%
88%84%
50$401
$50,00096%
$50,000
$123,817
$1,500 $2,000
$10,00042%
$10,000 $10,00048% 63%
$1,885 $1,75010% 50%
$1,000
$1,500
$1,750

APPENDIX B
Steven Hall & Partners Page | 36
GICS Sector: Health Care2014 Median Board of Director Fees
Top Mid Small200 Cap Cap
Sample Size# CompaniesRevenues ($ million)
Board Fees
Cash RetainerPrevalence
Equity RetainerPrevalence
Meeting Fee*Prevalence
Committee Fees
Audit Committee
Chair Retainer*Prevalence
Member Retainer*Prevalence
Meeting Fee*Prevalence
Compensation Committee
Chair Retainer*Prevalence
Member Retainer*Prevalence
Meeting Fee*Prevalence
Nominating / Governance Committee
Chair Retainer*Prevalence
Member Retainer*Prevalence
Meeting Fee*Prevalence
Total Compensation
Average Director
Cash / Equity 43% / 57% 42% / 58% 40% / 60%
Audit Chair
Cash / Equity 45% / 55% 44% / 56% 43% / 57%
Compensation Chair
Cash / Equity 44% / 56% 43% / 57% 41% / 59%
Nom / Gov Chair
Cash / Equity 43% / 57% 43% / 57% 40% / 60%
Non-Chair
Cash / Equity 41% / 59% 41% / 59% 39% / 61%
* Represents median of non-zero values.
$1,470
$273,333 $227,500
$285,000 $235,000
$285,000 $235,000
$286,667 $237,500
$287,000 $243,750
$2,000 $1,750
$15,000 $10,000100%
$197,500
$10,000 $5,50028% 44%
$6,50052%
20% 33%
$1,25035%
$191,000
89%
$10,00091%
$1,25035%
$1,750
$15,000100% 89%
$15,00091%
20% 33%
$10,000 $10,00028% 44%
$155,000
35%
$9,50061%
100%
16% 33% 39%
$24,000$20,000 $20,000100% 94%
$127,500100%
$15,000
25 18$34,914
$188,500
$187,000
$100,000 $60,000100% 100%
96%94%
23$470
$45,00096%
$101,017
$181,000
$2,000 $2,000
$12,50065%
$10,000 $10,00048% 61%
$2,000 $1,75020% 33%
$1,500
$2,000
$2,000
APPENDIX B
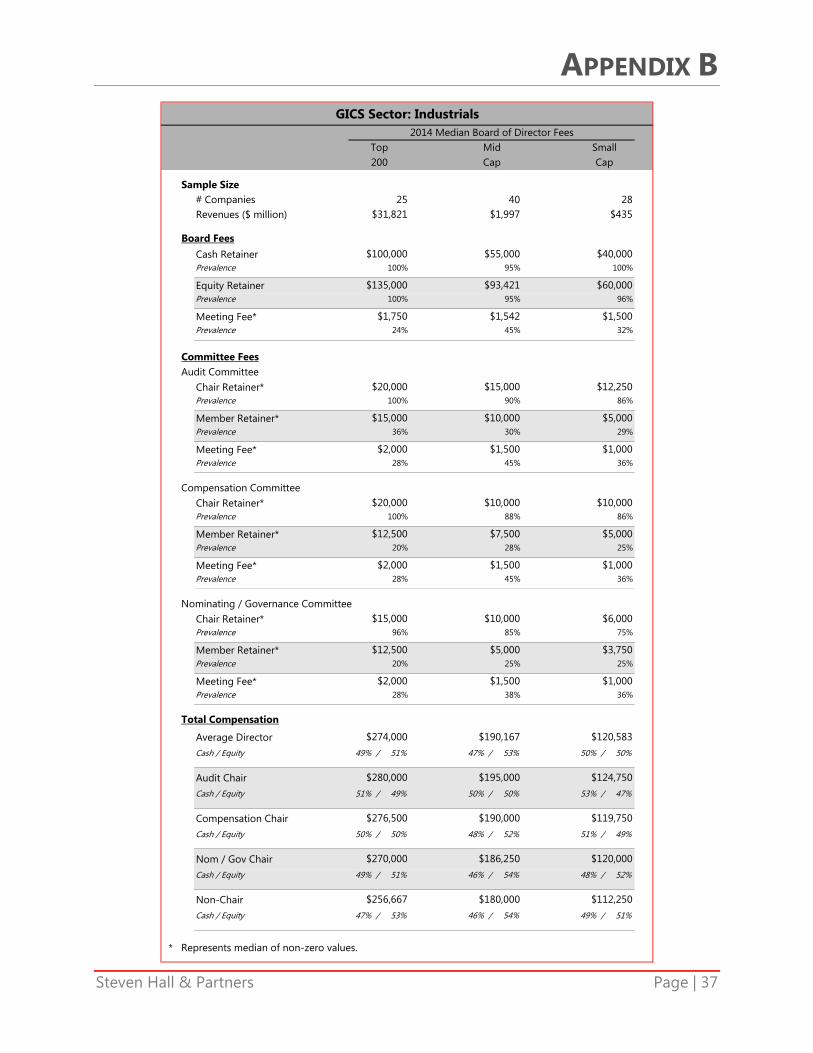
Steven Hall & Partners Page | 37
GICS Sector: Industrials2014 Median Board of Director Fees
Top Mid Small200 Cap Cap
Sample Size# CompaniesRevenues ($ million)
Board Fees
Cash RetainerPrevalence
Equity RetainerPrevalence
Meeting Fee*Prevalence
Committee Fees
Audit Committee
Chair Retainer*Prevalence
Member Retainer*Prevalence
Meeting Fee*Prevalence
Compensation Committee
Chair Retainer*Prevalence
Member Retainer*Prevalence
Meeting Fee*Prevalence
Nominating / Governance Committee
Chair Retainer*Prevalence
Member Retainer*Prevalence
Meeting Fee*Prevalence
Total Compensation
Average Director
Cash / Equity 49% / 51% 47% / 53% 50% / 50%
Audit Chair
Cash / Equity 51% / 49% 50% / 50% 53% / 47%
Compensation Chair
Cash / Equity 50% / 50% 48% / 52% 51% / 49%
Nom / Gov Chair
Cash / Equity 49% / 51% 46% / 54% 48% / 52%
Non-Chair
Cash / Equity 47% / 53% 46% / 54% 49% / 51%
* Represents median of non-zero values.
$1,997
$256,667 $180,000
$276,500 $190,000
$270,000 $186,250
$274,000 $190,167
$280,000 $195,000
$2,000 $1,500
$15,000 $10,00096%
$124,750
$12,500 $5,00020% 25%
$3,75025%
28% 38%
$1,00036%
$120,583
85%
$6,00075%
$1,00036%
$1,500
$10,000100% 88%
$10,00086%
28% 45%
$12,500 $7,50020% 28%
$135,000
36%
$5,00025%
86%
24% 45% 32%
$12,250$20,000 $15,000100% 90%
$93,421100%
$20,000
25 40$31,821
$119,750
$120,000
$100,000 $55,000100% 95%
96%95%
28$435
$40,000100%
$60,000
$112,250
$1,750 $1,542
$5,00029%
$15,000 $10,00036% 30%
$2,000 $1,50028% 45%
$1,000
$1,500
$2,000

APPENDIX B
Steven Hall & Partners Page | 38
GICS Sector: Information Technology2014 Median Board of Director Fees
Top Mid Small200 Cap Cap
Sample Size# CompaniesRevenues ($ million)
Board Fees
Cash RetainerPrevalence
Equity RetainerPrevalence
Meeting Fee*Prevalence
Committee Fees
Audit Committee
Chair Retainer*Prevalence
Member Retainer*Prevalence
Meeting Fee*Prevalence
Compensation Committee
Chair Retainer*Prevalence
Member Retainer*Prevalence
Meeting Fee*Prevalence
Nominating / Governance Committee
Chair Retainer*Prevalence
Member Retainer*Prevalence
Meeting Fee*Prevalence
Total Compensation
Average Director
Cash / Equity 37% / 63% 36% / 64% 39% / 61%
Audit Chair
Cash / Equity 40% / 60% 39% / 61% 42% / 58%
Compensation Chair
Cash / Equity 39% / 61% 37% / 63% 40% / 60%
Nom / Gov Chair
Cash / Equity 38% / 62% 36% / 64% 39% / 61%
Non-Chair
Cash / Equity 36% / 64% 35% / 65% 38% / 62%
* Represents median of non-zero values.
$2,351
$295,667 $233,333
$314,000 $241,250
$305,000 $240,000
$315,667 $243,333
$324,000 $256,000
$1,750 $1,000
$15,000 $10,00095%
$166,250
$7,500 $6,50033% 59%
$5,00075%
29% 14%
$1,12519%
$159,579
86%
$10,00094%
$1,12519%
$1,000
$16,75095% 90%
$11,00097%
29% 14%
$10,000 $9,50043% 62%
$187,510
19%
$6,47575%
97%
19% 14% 34%
$20,000$25,000 $25,000100% 90%
$135,000100%
$20,000
21 29$27,671
$156,695
$156,125
$85,000 $60,000100% 100%
100%100%
32$440
$40,00091%
$100,000
$150,667
$2,500 $1,000
$10,00075%
$13,750 $11,50057% 69%
$1,750 $1,00029% 17%
$1,375
$2,000
$1,750

APPENDIX B
Steven Hall & Partners Page | 39
GICS Sector: Materials2014 Median Board of Director Fees
Top Mid Small200 Cap Cap
Sample Size# CompaniesRevenues ($ million)
Board Fees
Cash RetainerPrevalence
Equity RetainerPrevalence
Meeting Fee*Prevalence
Committee Fees
Audit Committee
Chair Retainer*Prevalence
Member Retainer*Prevalence
Meeting Fee*Prevalence
Compensation Committee
Chair Retainer*Prevalence
Member Retainer*Prevalence
Meeting Fee*Prevalence
Nominating / Governance Committee
Chair Retainer*Prevalence
Member Retainer*Prevalence
Meeting Fee*Prevalence
Total Compensation
Average Director
Cash / Equity 52% / 48% 49% / 51% 54% / 46%
Audit Chair
Cash / Equity 54% / 46% 52% / 48% 56% / 44%
Compensation Chair
Cash / Equity 53% / 47% 50% / 50% 55% / 45%
Nom / Gov Chair
Cash / Equity 53% / 47% 48% / 52% 54% / 46%
Non-Chair
Cash / Equity 50% / 50% 47% / 53% 52% / 48%
* Represents median of non-zero values.
$3,126
$248,667 $170,000
$267,750 $180,000
$266,000 $182,375
$267,500 $185,000
$268,750 $198,000
$3,000 $1,500
$18,250 $10,000100%
$161,000
$10,000 $7,00030% 31%
$9,00029%
10% 23%
$1,00057%
$159,000
92%
$11,00086%
$1,00057%
$1,500
$14,000100% 100%
$15,000100%
10% 31%
$10,000 $7,25030% 31%
$132,500
57%
$10,00043%
100%
10% 31% 57%
$15,000$25,000 $18,000100% 100%
$90,00090%
$20,000
10 13$22,528
$160,000
$155,000
$107,500 $70,000100% 100%
100%100%
7$501
$50,000100%
$61,000
$145,000
$3,000 $1,500
$10,00043%
$13,750 $12,00060% 38%
$3,000 $1,50010% 31%
$1,000
$2,000
$3,000

APPENDIX B
Steven Hall & Partners Page | 40
GICS Sector: Telecomm. Services2014 Median Board of Director Fees
Top Mid Small200 Cap Cap
Sample Size# CompaniesRevenues ($ million)
Board Fees
Cash RetainerPrevalence
Equity RetainerPrevalence
Meeting Fee*Prevalence
Committee Fees
Audit Committee
Chair Retainer*Prevalence
Member Retainer*Prevalence
Meeting Fee*Prevalence
Compensation Committee
Chair Retainer*Prevalence
Member Retainer*Prevalence
Meeting Fee*Prevalence
Nominating / Governance Committee
Chair Retainer*Prevalence
Member Retainer*Prevalence
Meeting Fee*Prevalence
Total Compensation
Average Director
Cash / Equity 46% / 54% 51% / 49% 40% / 60%
Audit Chair
Cash / Equity 50% / 50% 53% / 47% 42% / 58%
Compensation Chair
Cash / Equity 48% / 52% 52% / 48% 37% / 63%
Nom / Gov Chair
Cash / Equity 46% / 54% 49% / 51% 37% / 63%
Non-Chair
Cash / Equity 44% / 56% 50% / 50% 39% / 61%
* Represents median of non-zero values.
$1,652
$257,667 $185,000
$281,000 $205,000
$271,000 $184,250
$281,667 $205,000
$295,500 $210,000
$2,000 ---
$15,000 $15,000100%
$140,000
--- $10,0000% 20%
$3,75020%
100% 0%
$1,12540%
$140,000
60%
$10,00060%
$1,12540%
$1,750
$16,500100% 80%
$10,00040%
100% 20%
--- $8,5000% 40%
$150,000
40%
---0%
60%
100% 20% 60%
$15,000$25,000 $23,500100% 80%
$80,000100%
$25,000
4 5$78,322
$132,625
$139,500
$97,500 $75,000100% 100%
100%100%
5$409
$50,00080%
$62,000
$133,250
$2,000 $1,750
$7,50020%
--- $13,0000% 40%
$2,000 $1,750100% 20%
$1,125
$1,250
$2,000

APPENDIX B
Steven Hall & Partners Page | 41
GICS Sector: Utilities2014 Median Board of Director Fees
Top Mid Small200 Cap Cap
Sample Size# CompaniesRevenues ($ million)
Board Fees
Cash RetainerPrevalence
Equity RetainerPrevalence
Meeting Fee*Prevalence
Committee Fees
Audit Committee
Chair Retainer*Prevalence
Member Retainer*Prevalence
Meeting Fee*Prevalence
Compensation Committee
Chair Retainer*Prevalence
Member Retainer*Prevalence
Meeting Fee*Prevalence
Nominating / Governance Committee
Chair Retainer*Prevalence
Member Retainer*Prevalence
Meeting Fee*Prevalence
Total Compensation
Average Director
Cash / Equity 48% / 52% 49% / 51% 59% / 41%
Audit Chair
Cash / Equity 52% / 48% 51% / 49% 61% / 39%
Compensation Chair
Cash / Equity 49% / 51% 51% / 49% 60% / 40%
Nom / Gov Chair
Cash / Equity 49% / 51% 50% / 50% 59% / 41%
Non-Chair
Cash / Equity 46% / 54% 47% / 53% 57% / 43%
* Represents median of non-zero values.
$2,497
$225,000 $162,333
$245,000 $177,000
$245,000 $172,000
$250,000 $176,667
$263,000 $180,000
$2,000 $1,575
$15,000 $10,00089%
$135,000
$15,000 $6,25011% 18%
---0%
56% 36%
$1,50060%
$128,333
100%
$7,50040%
$1,50060%
$1,575
$12,000100% 100%
$8,75080%
56% 36%
$12,500 $8,75022% 18%
$123,750
60%
---0%
80%
67% 36% 60%
$12,250$25,000 $15,000100% 100%
$90,000100%
$15,000
9 11$17,090
$130,000
$127,500
$80,000 $68,000100% 100%
100%100%
5$597
$60,000100%
$55,000
$120,000
$2,000 $1,575
---0%
$15,000 $9,50033% 18%
$2,000 $1,57556% 36%
$1,500
$1,500
$2,000
About Steven Hall & Partners
Steven Hall & Partners is an independent compensation consulting firm, specializing exclusively in the areas of executive compensation, board compensation, non-profit compensation and related governance issues. By focusing solely on this critical and complex segment of the human resources arena, we are able to provide our clients with the highest quality expertise and best counsel available on a practical basis. For more information, please visit www.shallpartners.com and follow us on Twitter @SHallPartners.
Contacting Steven Hall & Partners
This publication is provided by Steven Hall & Partners as a service to clients and colleagues. The information contained in this publication should not be construed as legal, tax or accounting advice. We can assist with the development and/or modification of director compensation programs and related corporate governance policies. If you have not received this publication directly from us, you may obtain a copy of any past or future related publications by contacting us at 212-488-5400 or [email protected].