Embed Size (px)
Citation preview

Thursday, April 23, 2015 2:00PM EDT
2015 data update Canadians

Agenda • Introductions and Housekeeping • 2015 Changes in Canadians • 2015 Data Update • What’s Coming • Questions
2

Teresa Sinopoli Director, Product Management
Today’s presenters
3
Sean Howard Senior Research Associate, Custom Research
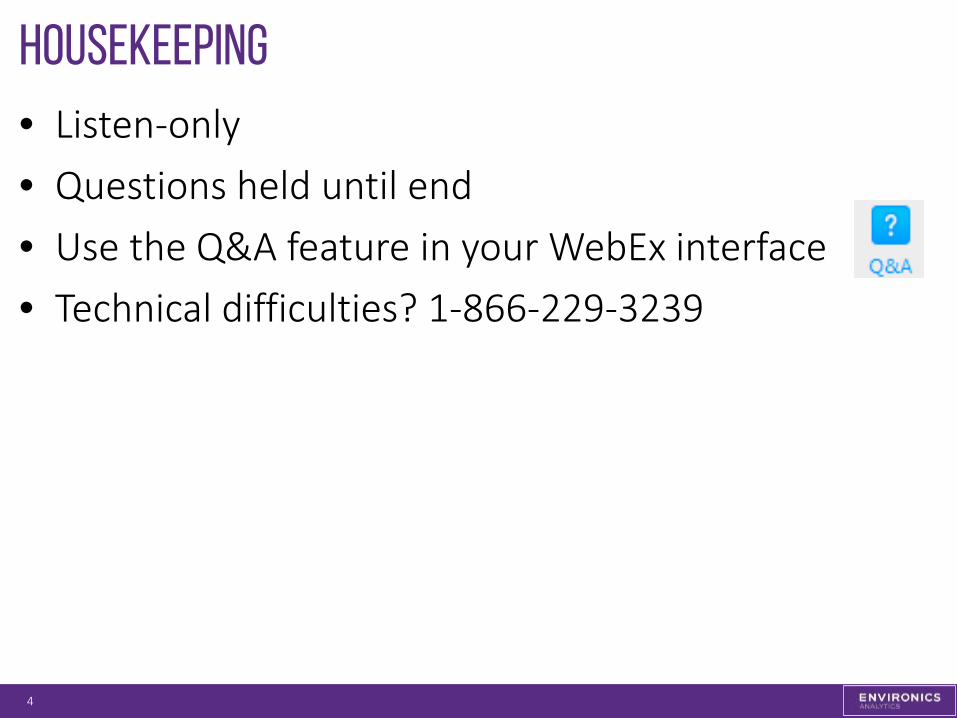
housekeeping • Listen-only • Questions held until end • Use the Q&A feature in your WebEx interface • Technical difficulties? 1-866-229-3239
4
5
2015 Changes in Canadians
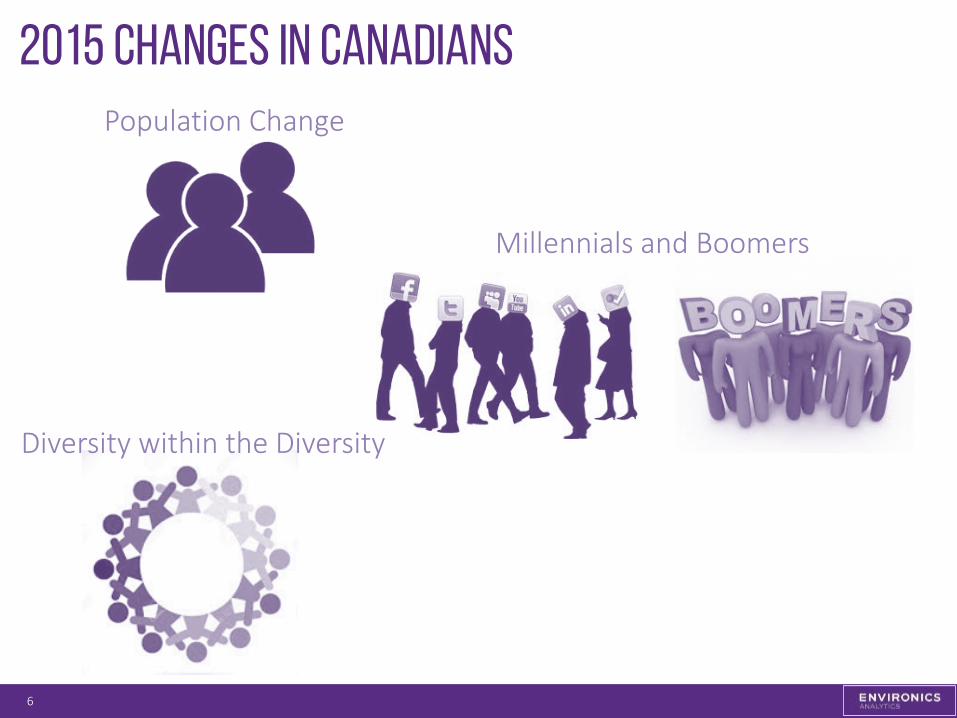
2015 Changes in Canadians
6
Population Change
Millennials and Boomers
Diversity within the Diversity
Population Change trends
• Population change above 1% per year until the 2016 to 2018 time frame
• Main reason for slowdown in population growth is aging population – The oldest Boomers are entering their 70s, death rates for 70+ are declining but
not fast enough to maintain current growth rates – With Millennials coming into their 30s, birth rates are expected to stabilize – Current immigration policies will hold immigration rates constant into the future
• Western provinces, especially Alberta and Saskatchewan, are growing faster than the
rest of Canada – Combination of attracting more immigrants and internal migrants – Younger population leading to a mini-baby boom
• Atlantic provinces stagnating
– Oldest region in the country – Low birth rates
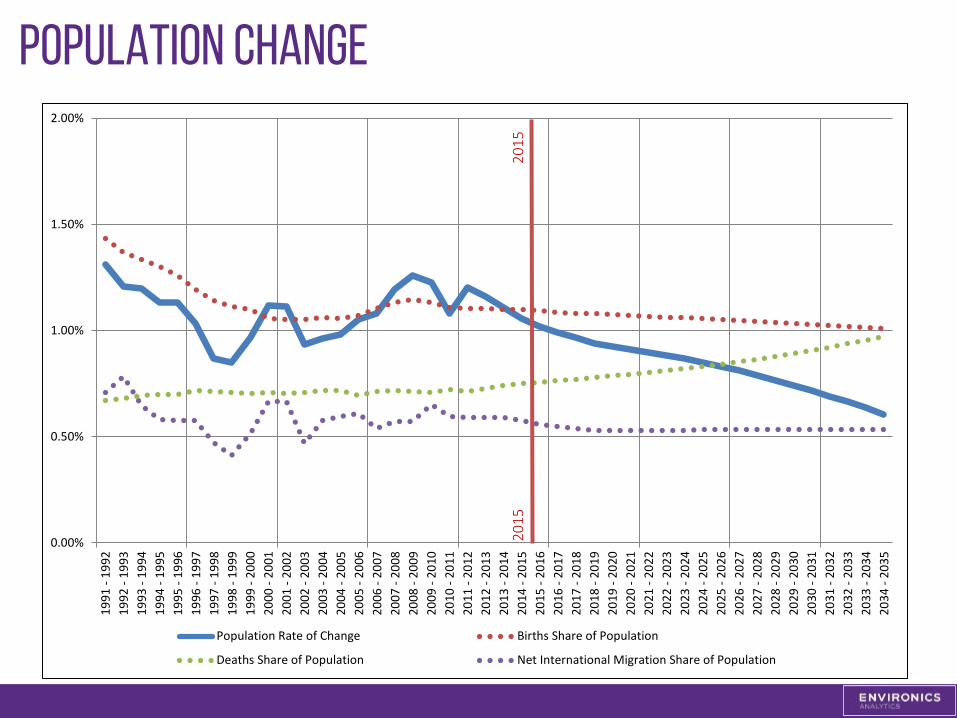
Population Change
0.00%
0.50%
1.00%
1.50%
2.00%19
91 -
1992
1992
- 19
9319
93 -
1994
1994
- 19
9519
95 -
1996
1996
- 19
9719
97 -
1998
1998
- 19
9919
99 -
2000
2000
- 20
0120
01 -
2002
2002
- 20
0320
03 -
2004
2004
- 20
0520
05 -
2006
2006
- 20
0720
07 -
2008
2008
- 20
0920
09 -
2010
2010
- 20
1120
11 -
2012
2012
- 20
1320
13 -
2014
2014
- 20
1520
15 -
2016
2016
- 20
1720
17 -
2018
2018
- 20
1920
19 -
2020
2020
- 20
2120
21 -
2022
2022
- 20
2320
23 -
2024
2024
- 20
2520
25 -
2026
2026
- 20
2720
27 -
2028
2028
- 20
2920
29 -
2030
2030
- 20
3120
31 -
2032
2032
- 20
3320
33 -
2034
2034
- 20
35
Population Rate of Change Births Share of Population
Deaths Share of Population Net International Migration Share of Population
2015
20
15
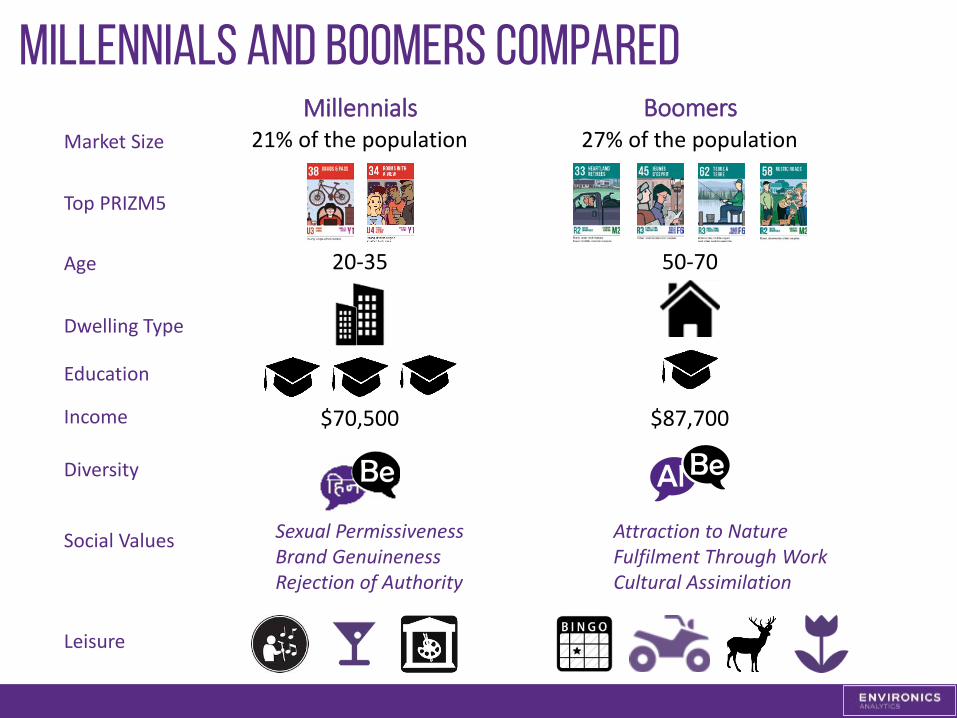
Millennials and Boomers Compared Millennials Boomers
Age 20-35 50-70
Dwelling Type
Education
Diversity
Income
Top PRIZM5
Social Values
Leisure
$70,500 $87,700
Market Size 21% of the population 27% of the population
Sexual Permissiveness Brand Genuineness Rejection of Authority
Attraction to Nature Fulfilment Through Work Cultural Assimilation
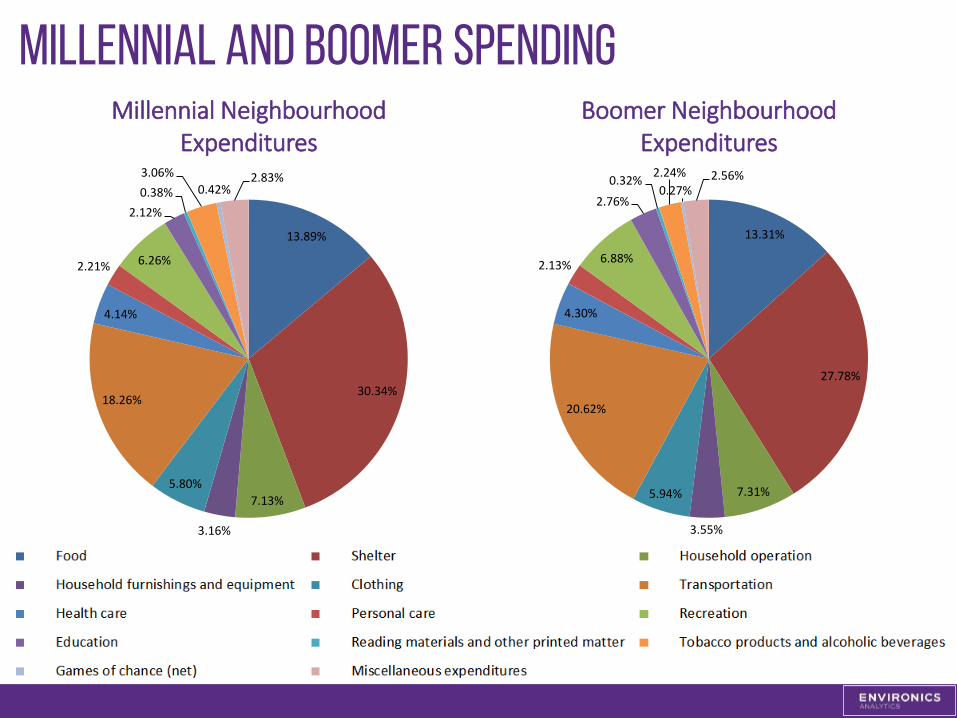
Millennial and Boomer spending
13.31%
27.78%
7.31%
3.55%
5.94%
20.62%
4.30%
2.13% 6.88%
2.76%
0.32% 2.24% 0.27%
2.56%
Boomer Neighbourhood Expenditures
13.89%
30.34%
7.13%
3.16%
5.80%
18.26%
4.14%
2.21% 6.26%
2.12% 0.38% 3.06%
0.42% 2.83%
Millennial Neighbourhood Expenditures
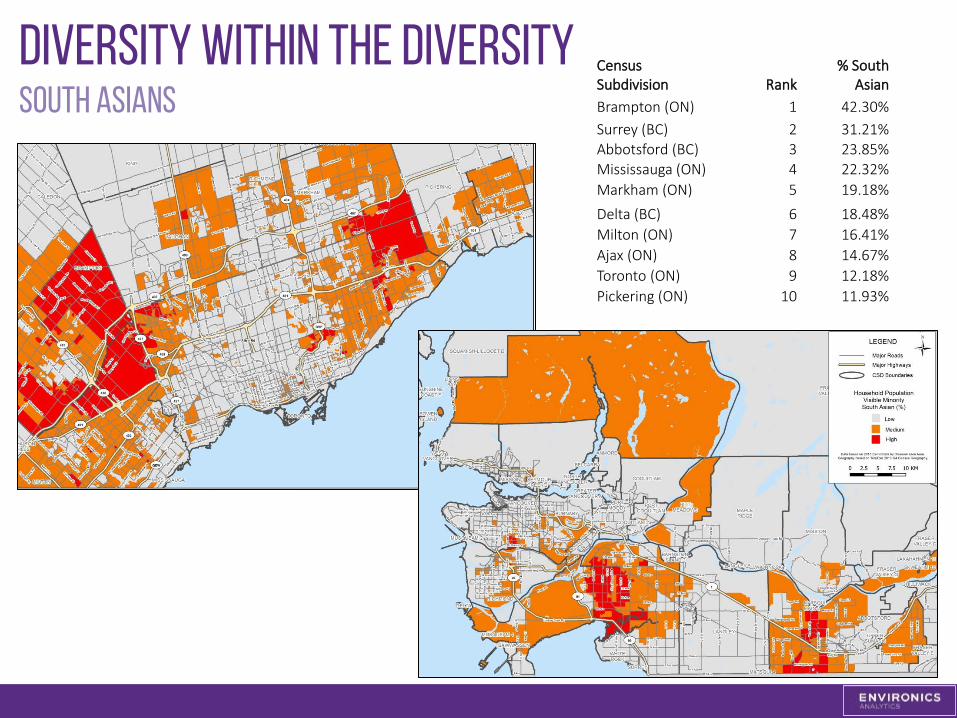
Diversity within the Diversity South asians
Census Subdivision Rank
% South Asian
Brampton (ON) 1 42.30% Surrey (BC) 2 31.21% Abbotsford (BC) 3 23.85% Mississauga (ON) 4 22.32% Markham (ON) 5 19.18% Delta (BC) 6 18.48% Milton (ON) 7 16.41% Ajax (ON) 8 14.67% Toronto (ON) 9 12.18% Pickering (ON) 10 11.93%
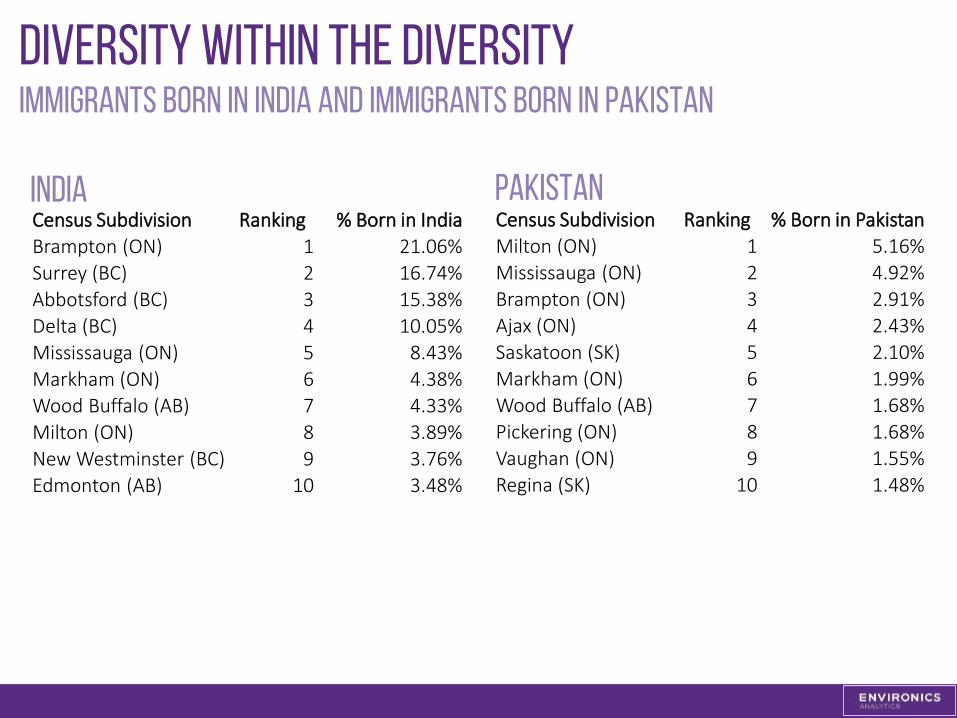
Diversity within the Diversity Immigrants born in India and Immigrants born in Pakistan
Census Subdivision Ranking % Born in India Brampton (ON) 1 21.06% Surrey (BC) 2 16.74% Abbotsford (BC) 3 15.38% Delta (BC) 4 10.05% Mississauga (ON) 5 8.43% Markham (ON) 6 4.38% Wood Buffalo (AB) 7 4.33% Milton (ON) 8 3.89% New Westminster (BC) 9 3.76% Edmonton (AB) 10 3.48%
Census Subdivision Ranking % Born in Pakistan Milton (ON) 1 5.16% Mississauga (ON) 2 4.92% Brampton (ON) 3 2.91% Ajax (ON) 4 2.43% Saskatoon (SK) 5 2.10% Markham (ON) 6 1.99% Wood Buffalo (AB) 7 1.68% Pickering (ON) 8 1.68% Vaughan (ON) 9 1.55% Regina (SK) 10 1.48%
Pakistan India
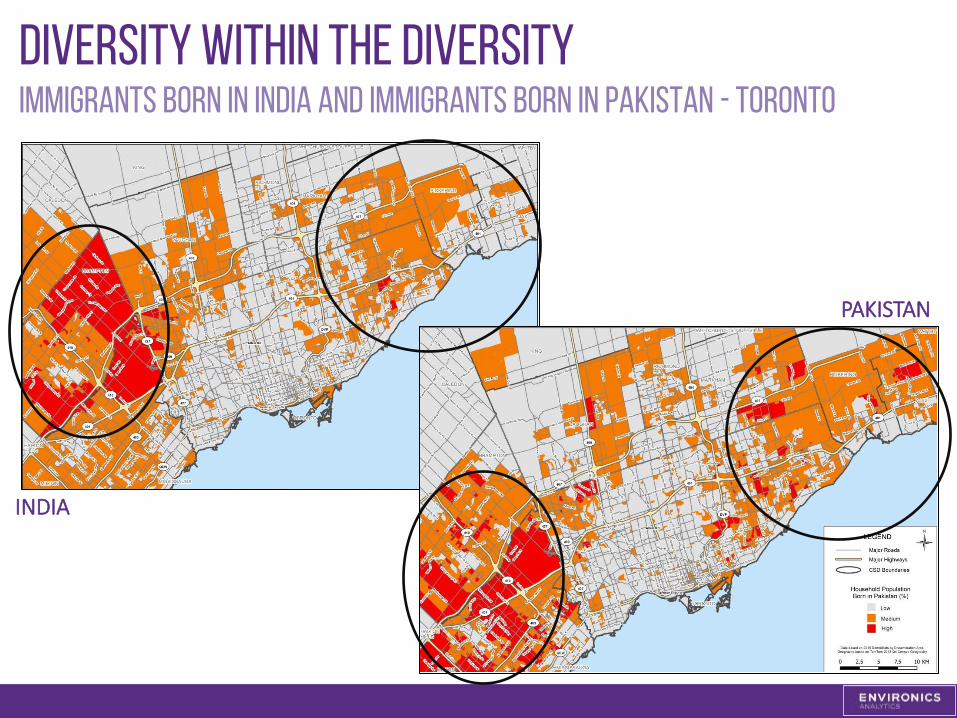
Diversity within the Diversity Immigrants born in India and Immigrants born in Pakistan - toronto
INDIA
PAKISTAN
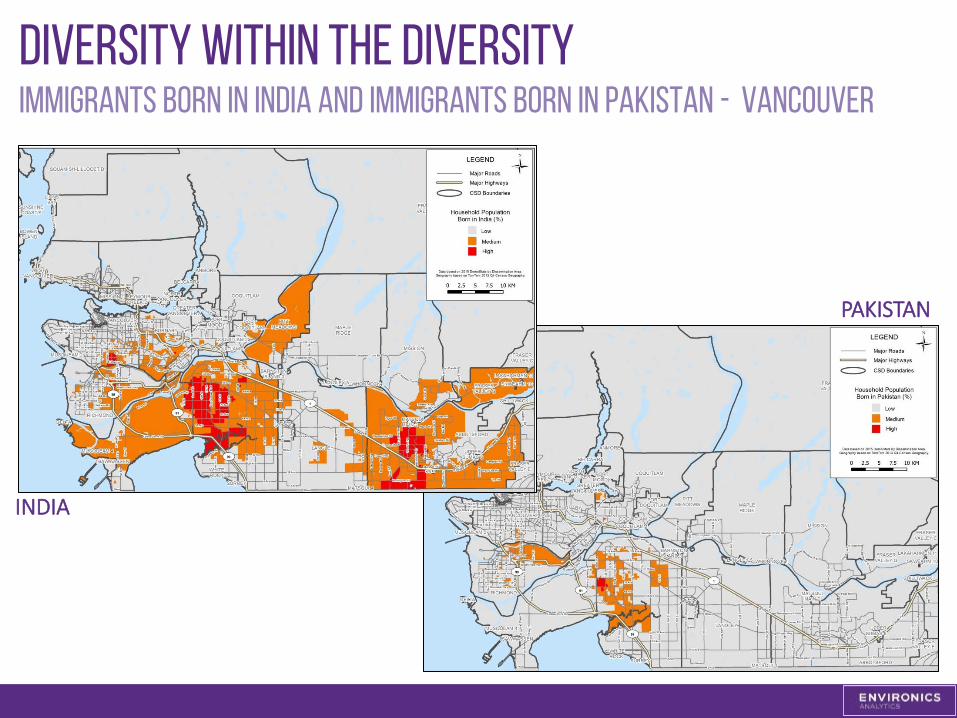
Diversity within the Diversity Immigrants born in India and Immigrants born in Pakistan - vancouver
INDIA
PAKISTAN

15
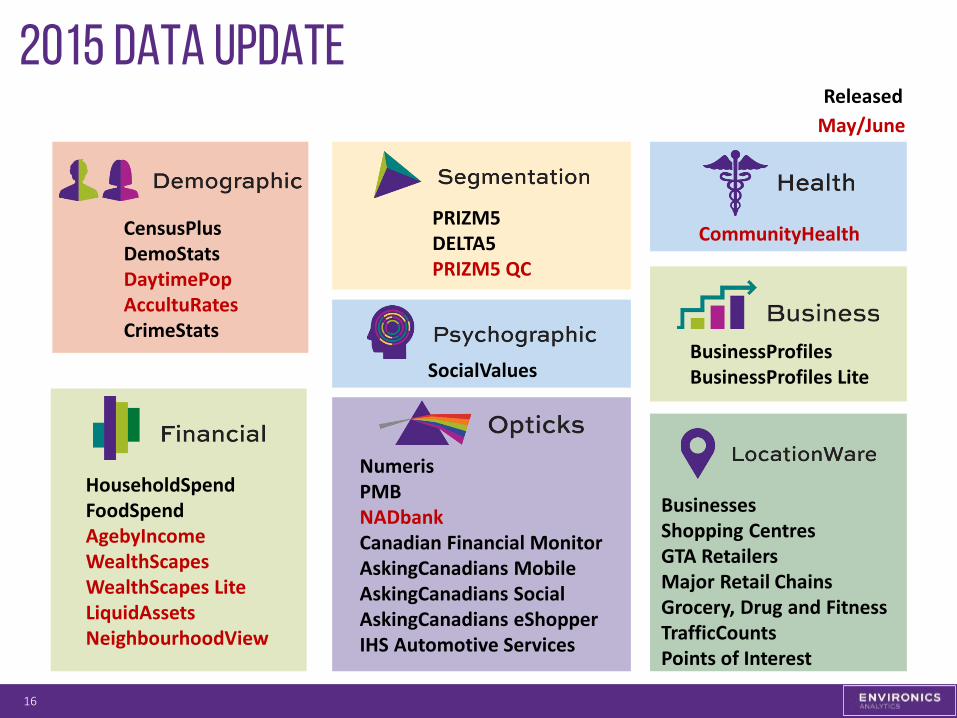
2015 data update
2015 data update
16
CensusPlus DemoStats DaytimePop AccultuRates CrimeStats
HouseholdSpend FoodSpend AgebyIncome WealthScapes WealthScapes Lite LiquidAssets NeighbourhoodView
PRIZM5 DELTA5 PRIZM5 QC
Numeris PMB NADbank Canadian Financial Monitor AskingCanadians Mobile AskingCanadians Social AskingCanadians eShopper IHS Automotive Services
SocialValues
CommunityHealth
Businesses Shopping Centres GTA Retailers Major Retail Chains Grocery, Drug and Fitness TrafficCounts Points of Interest
BusinessProfiles BusinessProfiles Lite
Released May/June
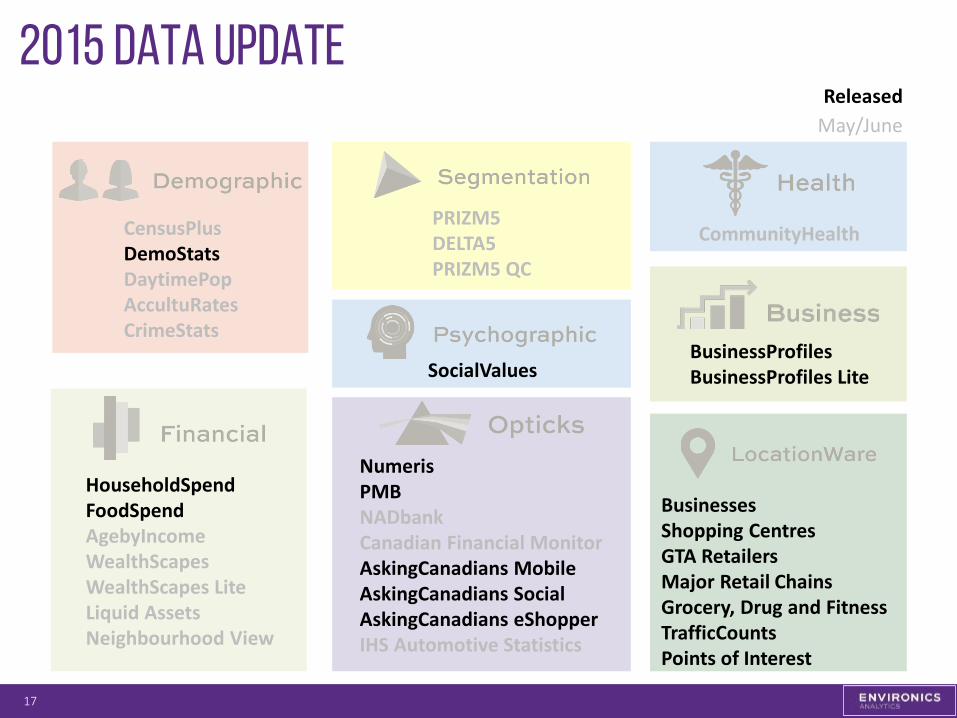
2015 data update
17
CensusPlus DemoStats DaytimePop AccultuRates CrimeStats
HouseholdSpend FoodSpend AgebyIncome WealthScapes WealthScapes Lite Liquid Assets Neighbourhood View
PRIZM5 DELTA5 PRIZM5 QC
Numeris PMB NADbank Canadian Financial Monitor AskingCanadians Mobile AskingCanadians Social AskingCanadians eShopper IHS Automotive Statistics
SocialValues
CommunityHealth
Businesses Shopping Centres GTA Retailers Major Retail Chains Grocery, Drug and Fitness TrafficCounts Points of Interest
BusinessProfiles BusinessProfiles Lite
Released May/June
2015 data update
18
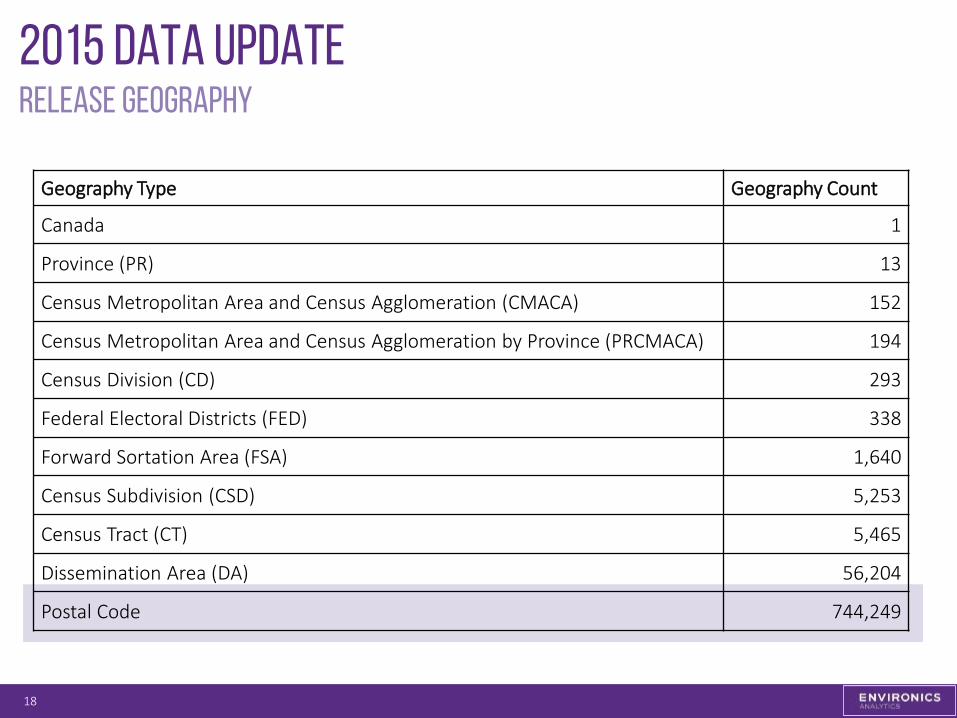
Release Geography
Geography Type Geography Count
Canada 1
Province (PR) 13
Census Metropolitan Area and Census Agglomeration (CMACA) 152
Census Metropolitan Area and Census Agglomeration by Province (PRCMACA) 194
Census Division (CD) 293
Federal Electoral Districts (FED) 338
Forward Sortation Area (FSA) 1,640
Census Subdivision (CSD) 5,253
Census Tract (CT) 5,465
Dissemination Area (DA) 56,204
Postal Code 744,249
demographic
19
DemoStats
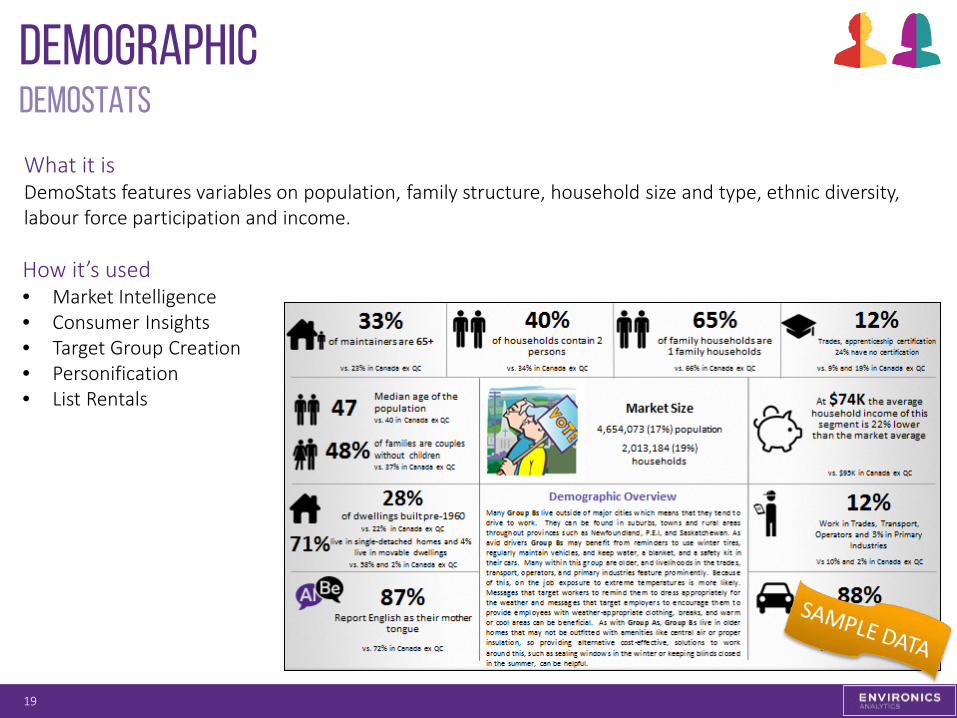
What it is DemoStats features variables on population, family structure, household size and type, ethnic diversity, labour force participation and income. How it’s used • Market Intelligence • Consumer Insights • Target Group Creation • Personification • List Rentals
demographic
20
DemoStats details
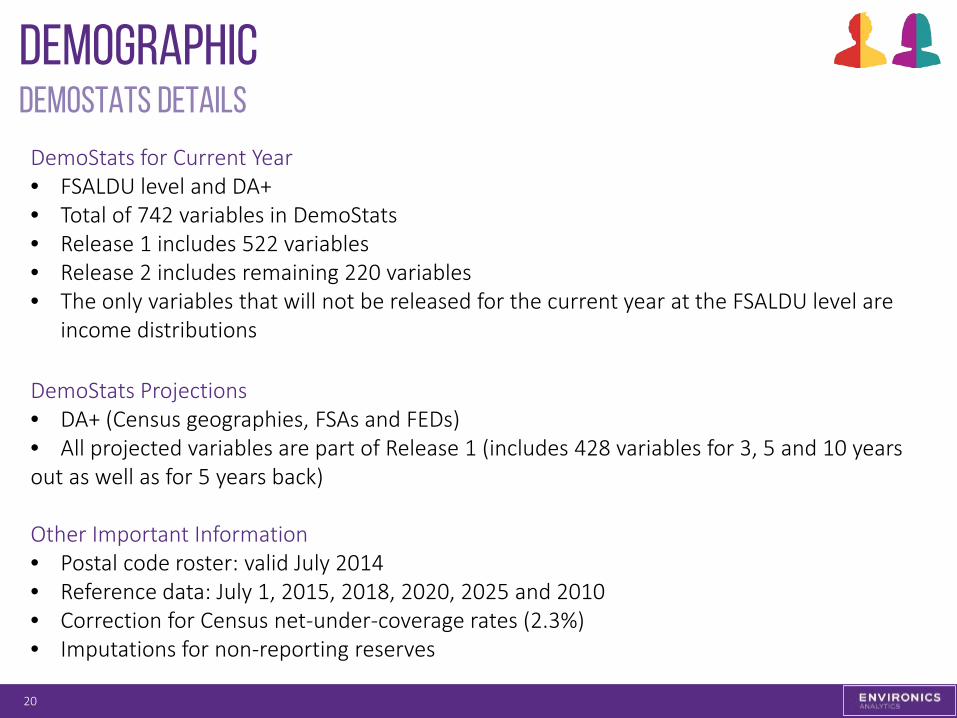
DemoStats for Current Year • FSALDU level and DA+ • Total of 742 variables in DemoStats • Release 1 includes 522 variables • Release 2 includes remaining 220 variables • The only variables that will not be released for the current year at the FSALDU level are
income distributions DemoStats Projections • DA+ (Census geographies, FSAs and FEDs) • All projected variables are part of Release 1 (includes 428 variables for 3, 5 and 10 years out as well as for 5 years back)
Other Important Information • Postal code roster: valid July 2014 • Reference data: July 1, 2015, 2018, 2020, 2025 and 2010 • Correction for Census net-under-coverage rates (2.3%) • Imputations for non-reporting reserves
demographic
21
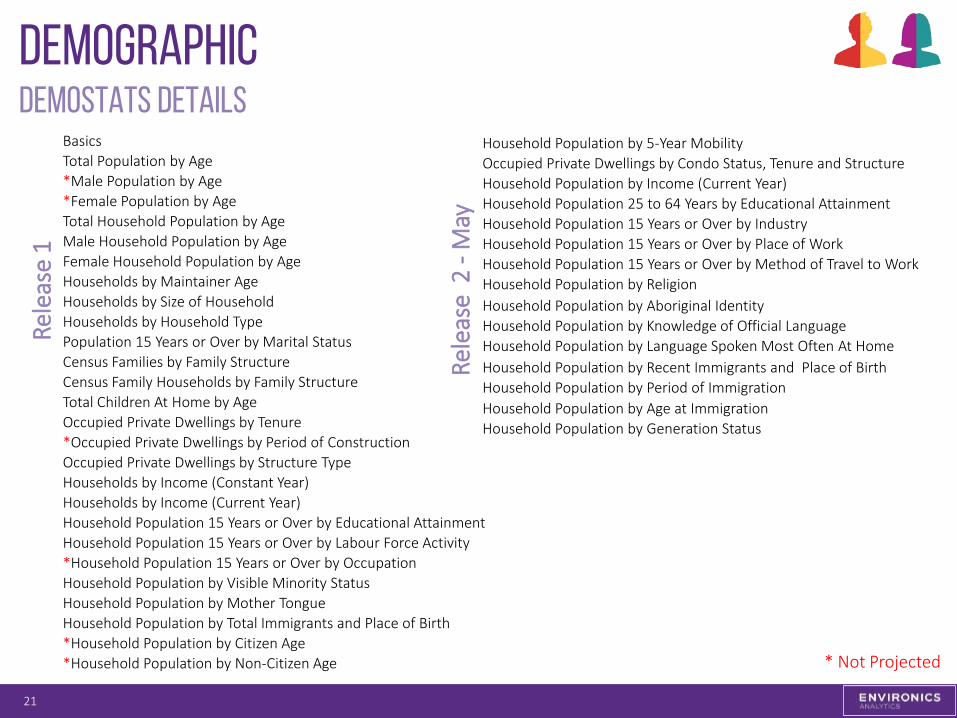
DemoStats details Basics Total Population by Age *Male Population by Age *Female Population by Age Total Household Population by Age Male Household Population by Age Female Household Population by Age Households by Maintainer Age Households by Size of Household Households by Household Type Population 15 Years or Over by Marital Status Census Families by Family Structure Census Family Households by Family Structure Total Children At Home by Age Occupied Private Dwellings by Tenure *Occupied Private Dwellings by Period of Construction Occupied Private Dwellings by Structure Type Households by Income (Constant Year) Households by Income (Current Year) Household Population 15 Years or Over by Educational Attainment Household Population 15 Years or Over by Labour Force Activity *Household Population 15 Years or Over by Occupation Household Population by Visible Minority Status Household Population by Mother Tongue Household Population by Total Immigrants and Place of Birth *Household Population by Citizen Age *Household Population by Non-Citizen Age
Household Population by 5-Year Mobility Occupied Private Dwellings by Condo Status, Tenure and Structure Household Population by Income (Current Year) Household Population 25 to 64 Years by Educational Attainment Household Population 15 Years or Over by Industry Household Population 15 Years or Over by Place of Work Household Population 15 Years or Over by Method of Travel to Work Household Population by Religion Household Population by Aboriginal Identity Household Population by Knowledge of Official Language Household Population by Language Spoken Most Often At Home Household Population by Recent Immigrants and Place of Birth Household Population by Period of Immigration Household Population by Age at Immigration Household Population by Generation Status
* Not Projected
Rele
ase
1
Rele
ase
2 -
May
demographic
22
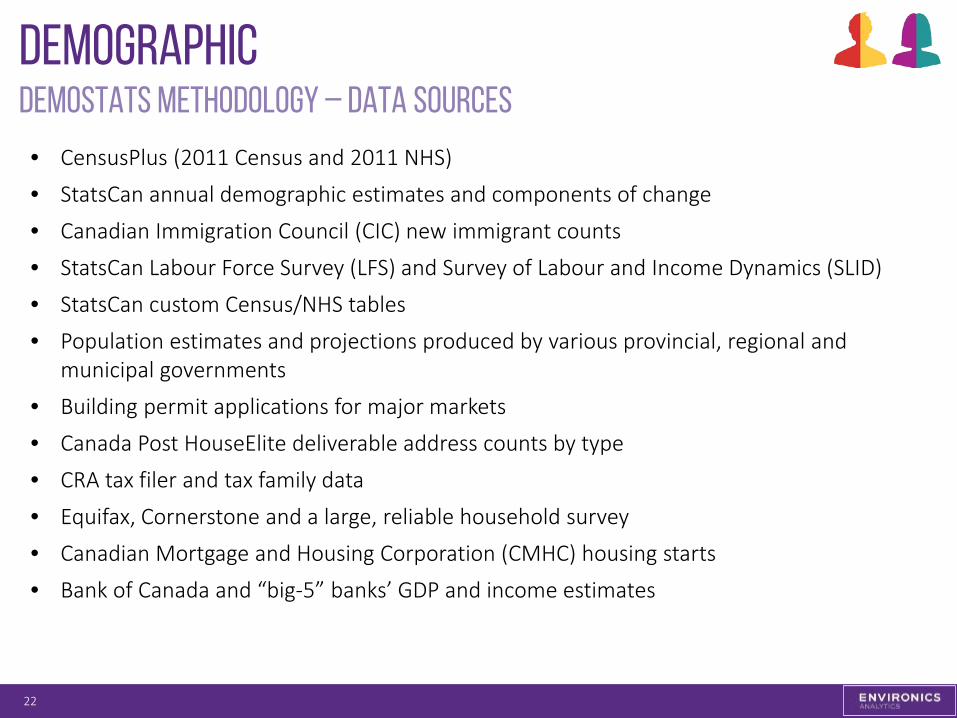
DemoStats methodology – data sources
• CensusPlus (2011 Census and 2011 NHS)
• StatsCan annual demographic estimates and components of change
• Canadian Immigration Council (CIC) new immigrant counts
• StatsCan Labour Force Survey (LFS) and Survey of Labour and Income Dynamics (SLID)
• StatsCan custom Census/NHS tables
• Population estimates and projections produced by various provincial, regional and municipal governments
• Building permit applications for major markets
• Canada Post HouseElite deliverable address counts by type
• CRA tax filer and tax family data
• Equifax, Cornerstone and a large, reliable household survey
• Canadian Mortgage and Housing Corporation (CMHC) housing starts
• Bank of Canada and “big-5” banks’ GDP and income estimates
demographic
23
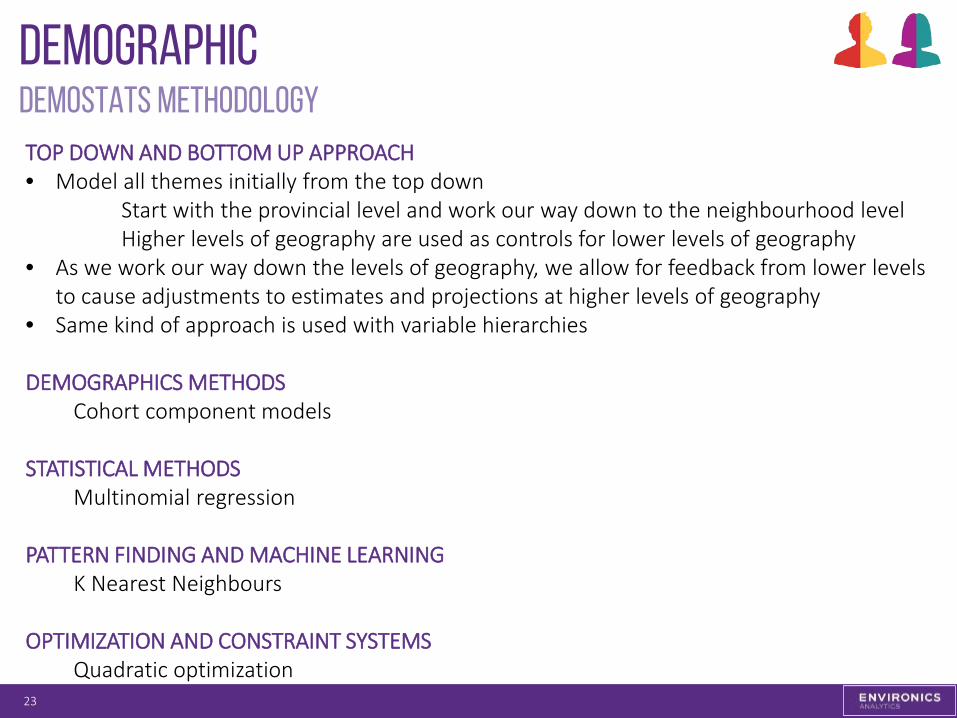
DemoStats methodology TOP DOWN AND BOTTOM UP APPROACH • Model all themes initially from the top down
Start with the provincial level and work our way down to the neighbourhood level Higher levels of geography are used as controls for lower levels of geography
• As we work our way down the levels of geography, we allow for feedback from lower levels to cause adjustments to estimates and projections at higher levels of geography
• Same kind of approach is used with variable hierarchies DEMOGRAPHICS METHODS
Cohort component models STATISTICAL METHODS
Multinomial regression PATTERN FINDING AND MACHINE LEARNING
K Nearest Neighbours OPTIMIZATION AND CONSTRAINT SYSTEMS
Quadratic optimization
demographic
24
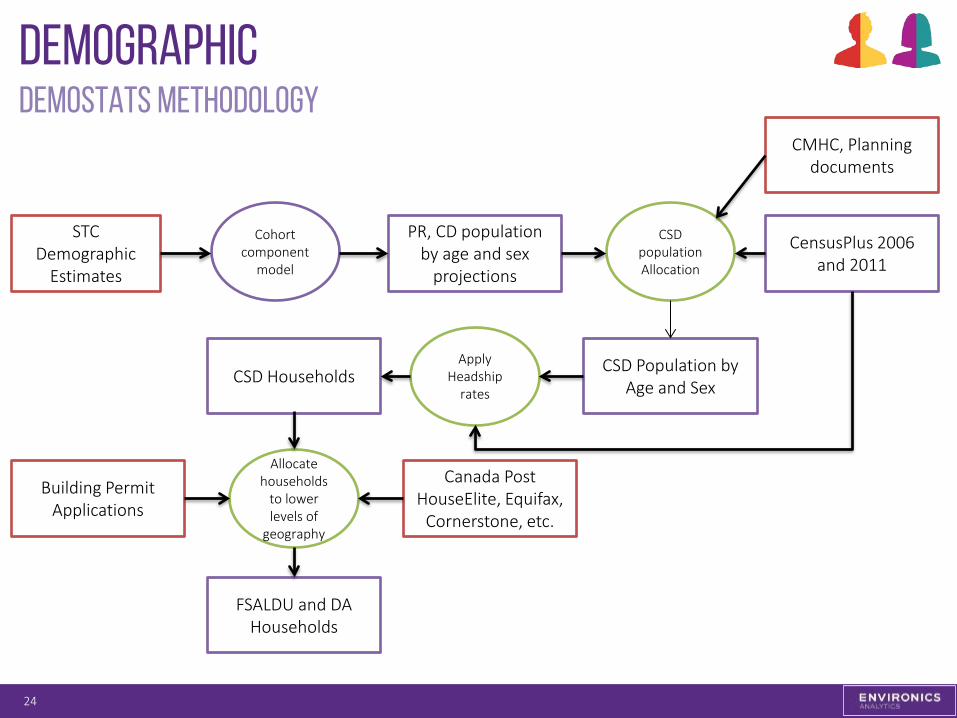
DemoStats methodology
STC Demographic
Estimates
Cohort component
model
PR, CD population by age and sex
projections
CensusPlus 2006 and 2011
CSD population Allocation
CSD Population by Age and Sex
Apply Headship
rates CSD Households
Building Permit Applications
CMHC, Planning documents
Allocate households
to lower levels of
geography
FSALDU and DA Households
Canada Post HouseElite, Equifax,
Cornerstone, etc.
demographic
25
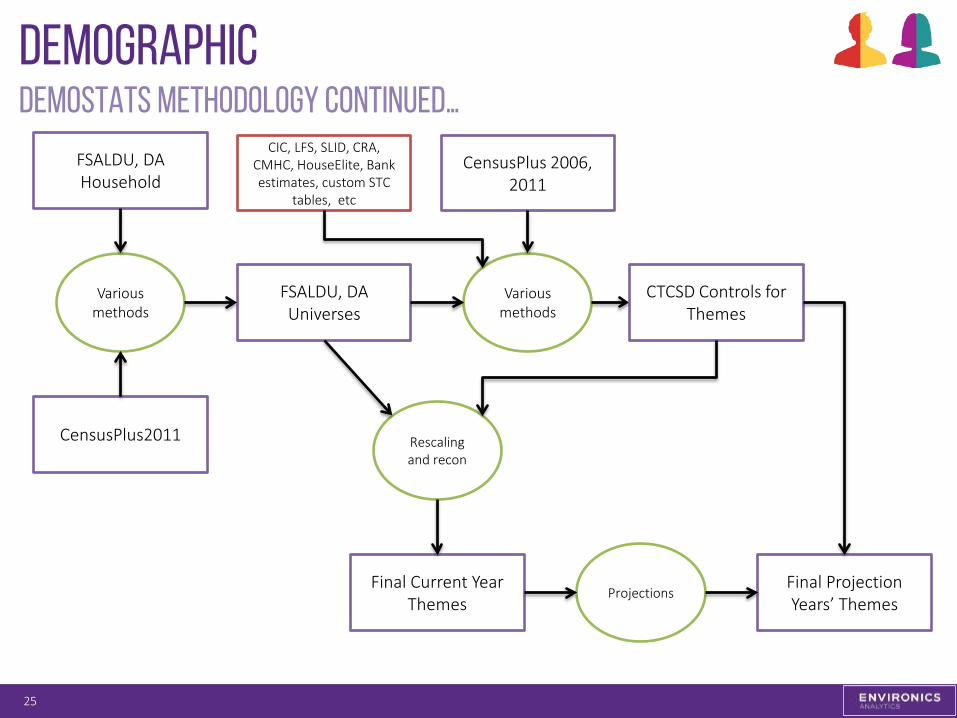
DemoStats methodology Continued…
Various methods
FSALDU, DA Household
FSALDU, DA Universes
CensusPlus2011
CIC, LFS, SLID, CRA, CMHC, HouseElite, Bank estimates, custom STC
tables, etc
CensusPlus 2006, 2011
Various methods
CTCSD Controls for Themes
Rescaling and recon
Final Current Year Themes
Projections Final Projection Years’ Themes
financial
26
Householdspend and foodspend
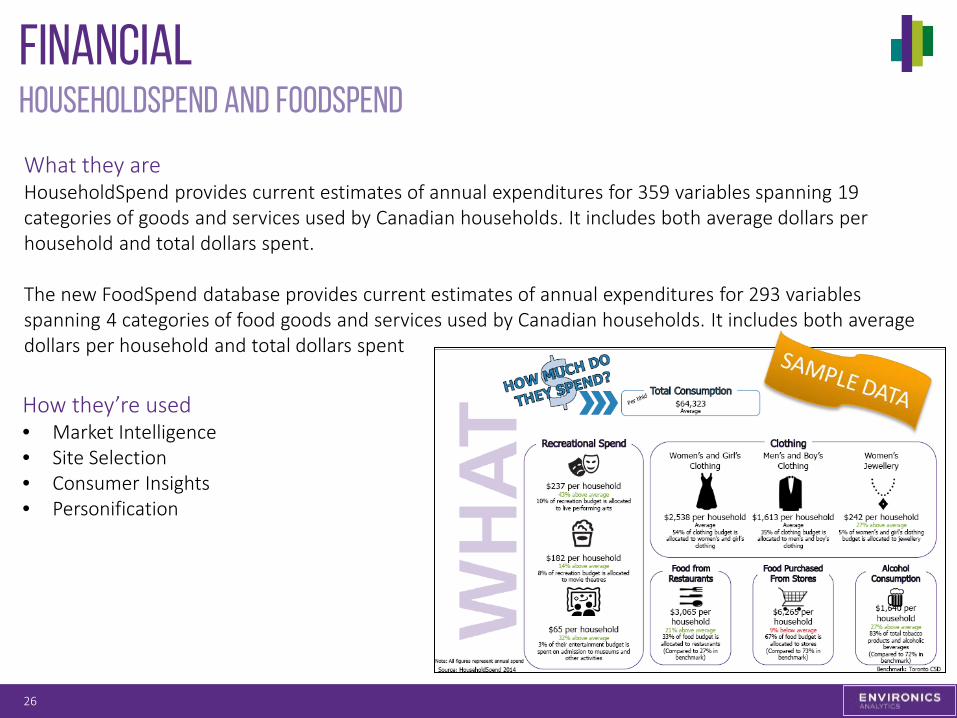
What they are HouseholdSpend provides current estimates of annual expenditures for 359 variables spanning 19 categories of goods and services used by Canadian households. It includes both average dollars per household and total dollars spent.
The new FoodSpend database provides current estimates of annual expenditures for 293 variables spanning 4 categories of food goods and services used by Canadian households. It includes both average dollars per household and total dollars spent
How they’re used • Market Intelligence • Site Selection • Consumer Insights • Personification
financial
27
Householdspend and foodspend methodology
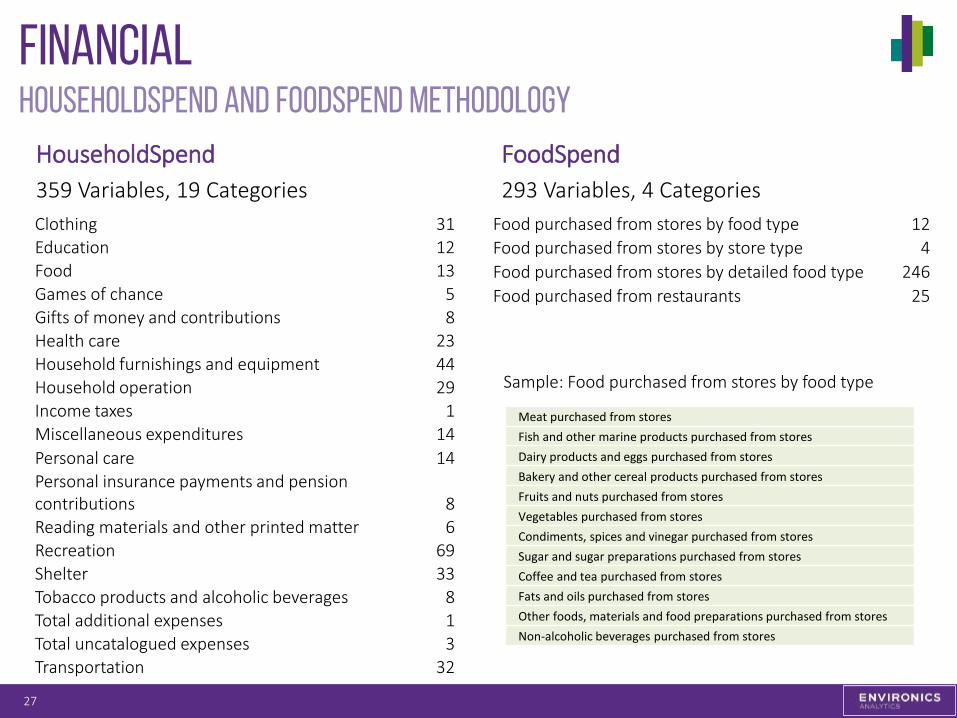
HouseholdSpend 359 Variables, 19 Categories
Clothing 31 Education 12 Food 13 Games of chance 5 Gifts of money and contributions 8 Health care 23 Household furnishings and equipment 44 Household operation 29 Income taxes 1 Miscellaneous expenditures 14 Personal care 14 Personal insurance payments and pension contributions 8 Reading materials and other printed matter 6 Recreation 69 Shelter 33 Tobacco products and alcoholic beverages 8 Total additional expenses 1 Total uncatalogued expenses 3 Transportation 32
FoodSpend 293 Variables, 4 Categories
Food purchased from stores by food type 12 Food purchased from stores by store type 4 Food purchased from stores by detailed food type 246 Food purchased from restaurants 25
Meat purchased from stores Fish and other marine products purchased from stores Dairy products and eggs purchased from stores Bakery and other cereal products purchased from stores Fruits and nuts purchased from stores Vegetables purchased from stores Condiments, spices and vinegar purchased from stores Sugar and sugar preparations purchased from stores Coffee and tea purchased from stores Fats and oils purchased from stores Other foods, materials and food preparations purchased from stores Non-alcoholic beverages purchased from stores
Sample: Food purchased from stores by food type
financial
28
Householdspend and foodspend methodology
• Initial coefficient estimates are modelled to the postal code level using the most recently available public-use micro-files (PUMFs) for the StatsCan Survey of Household Spending (SHS) and Food Expenditure Survey
• Modelled using state-of-the-art pattern finding and machine learning techniques
• Coefficient estimates are rolled out against current year aggregate household income data from DemoStats
• Aggregate expenditure dollars are reconciled with provincial SHS statistics released in January of 2015

29
Psychographic & opticks
psychographic
07/04/2015 30
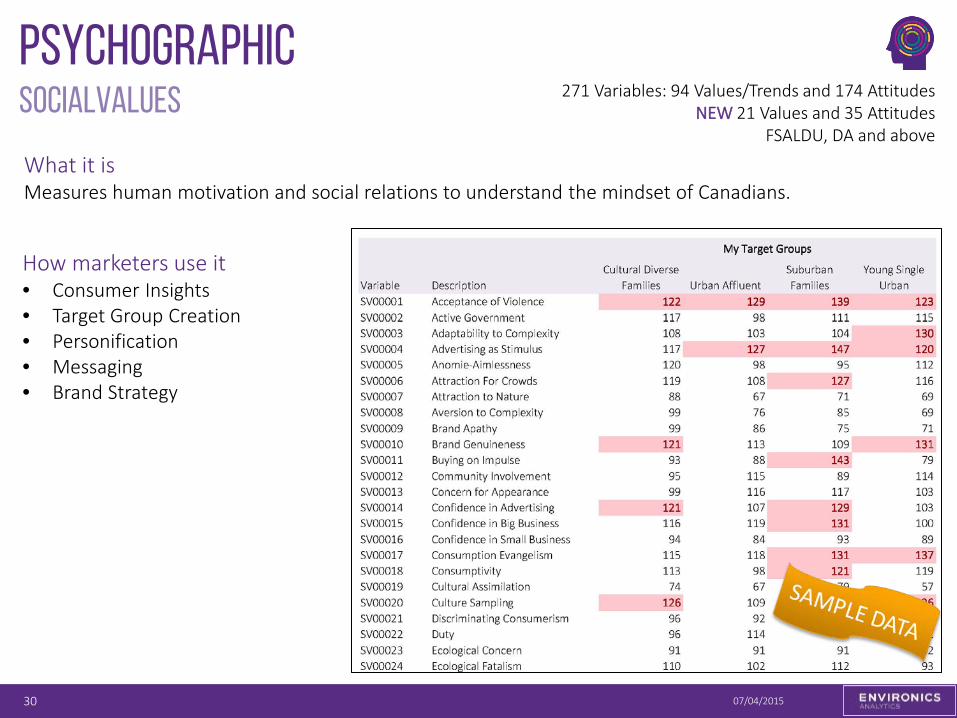
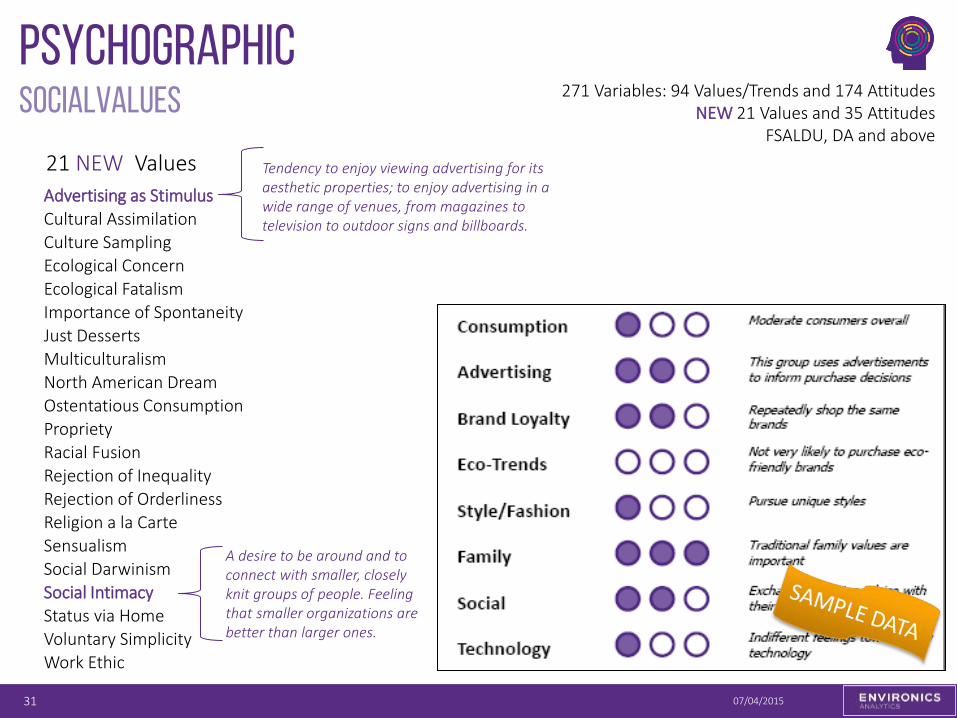
SocialValues 271 Variables: 94 Values/Trends and 174 Attitudes NEW 21 Values and 35 Attitudes
FSALDU, DA and above
What it is Measures human motivation and social relations to understand the mindset of Canadians.
How marketers use it • Consumer Insights • Target Group Creation • Personification • Messaging • Brand Strategy
psychographic
07/04/2015 31
Advertising as Stimulus Cultural Assimilation Culture Sampling Ecological Concern Ecological Fatalism Importance of Spontaneity Just Desserts Multiculturalism North American Dream Ostentatious Consumption Propriety Racial Fusion Rejection of Inequality Rejection of Orderliness Religion a la Carte Sensualism Social Darwinism Social Intimacy Status via Home Voluntary Simplicity Work Ethic
21 NEW Values
SocialValues
A desire to be around and to connect with smaller, closely knit groups of people. Feeling that smaller organizations are better than larger ones.
Tendency to enjoy viewing advertising for its aesthetic properties; to enjoy advertising in a wide range of venues, from magazines to television to outdoor signs and billboards.
271 Variables: 94 Values/Trends and 174 Attitudes NEW 21 Values and 35 Attitudes
FSALDU, DA and above
OPticks
07/04/2015 32
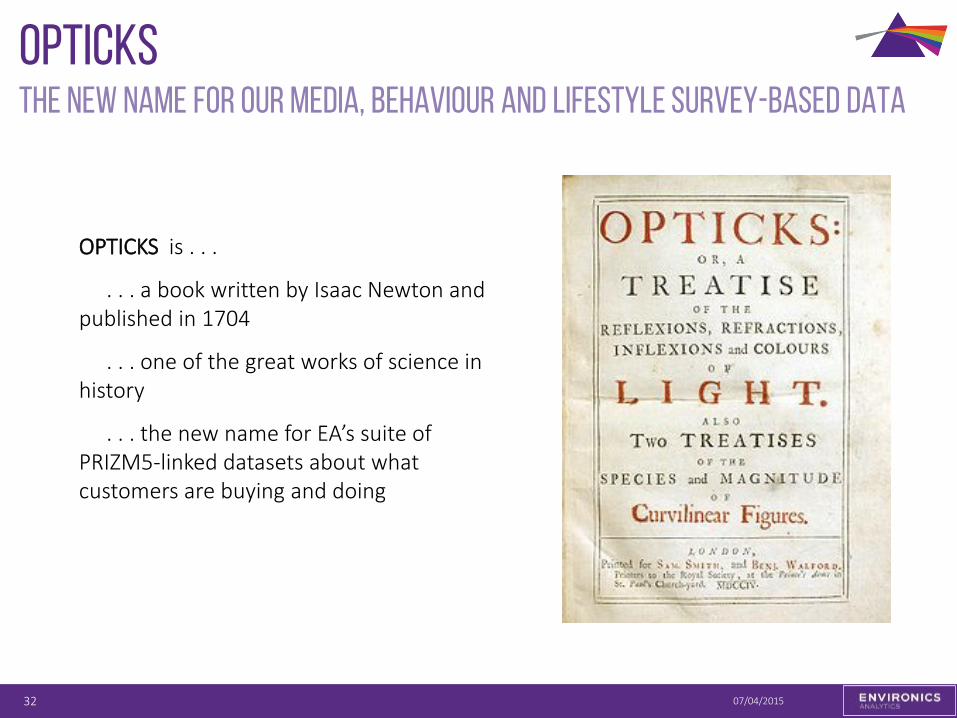
OPTICKS is . . .
. . . a book written by Isaac Newton and published in 1704
. . . one of the great works of science in history
. . . the new name for EA’s suite of PRIZM5-linked datasets about what customers are buying and doing
the new name for our Media, Behaviour and Lifestyle Survey-based Data
OPticks
07/04/2015 33
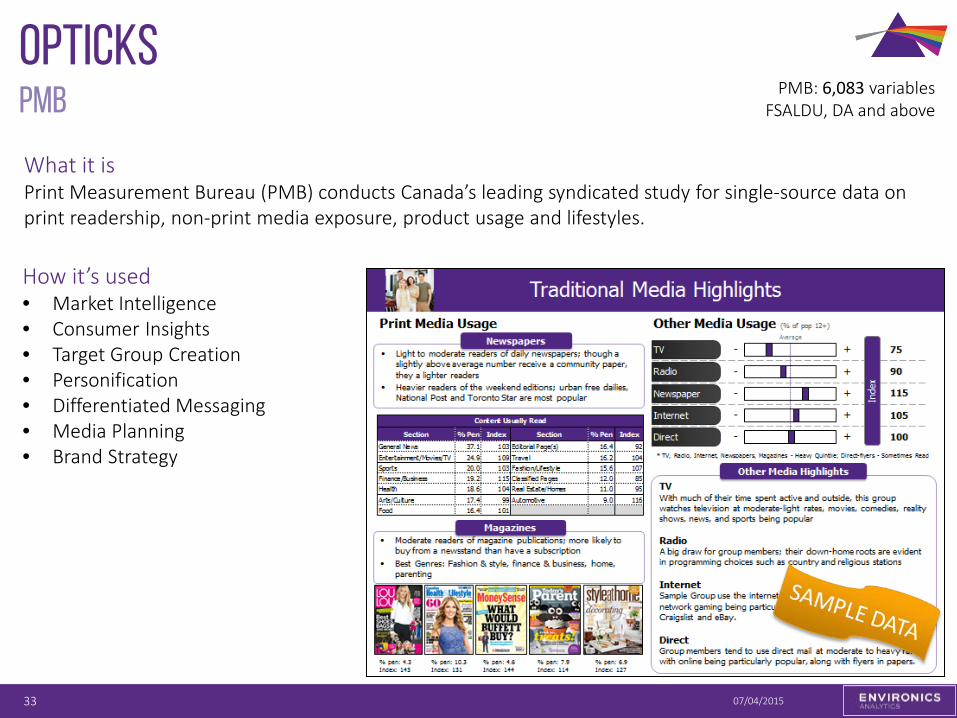
What it is Print Measurement Bureau (PMB) conducts Canada’s leading syndicated study for single-source data on print readership, non-print media exposure, product usage and lifestyles.
PMB PMB: 6,083 variables FSALDU, DA and above
How it’s used • Market Intelligence • Consumer Insights • Target Group Creation • Personification • Differentiated Messaging • Media Planning • Brand Strategy
OPticks
07/04/2015 34
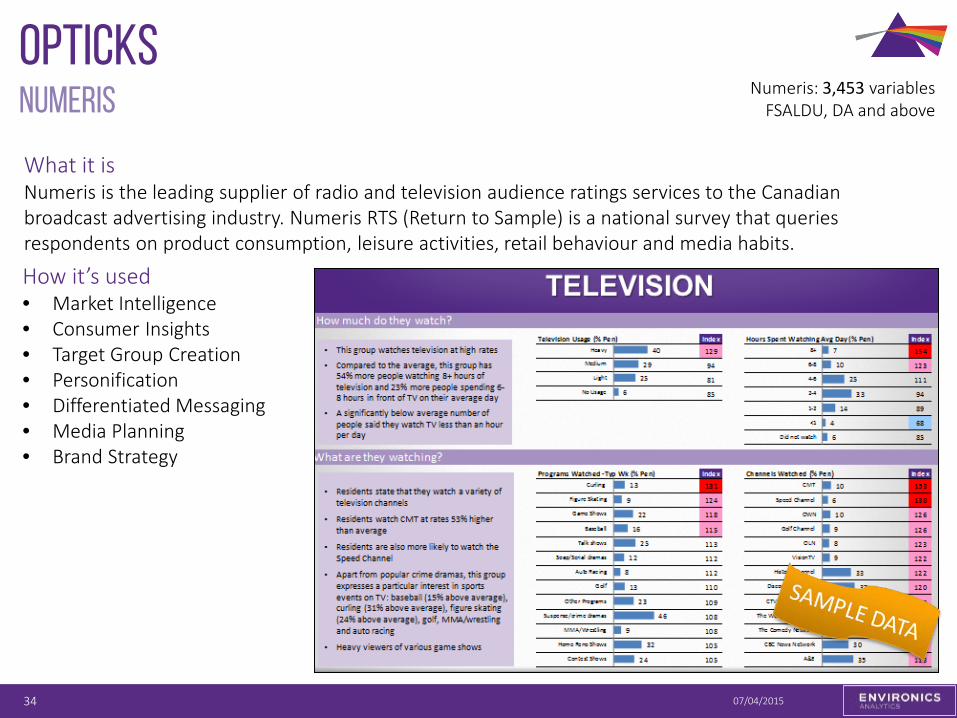
What it is Numeris is the leading supplier of radio and television audience ratings services to the Canadian broadcast advertising industry. Numeris RTS (Return to Sample) is a national survey that queries respondents on product consumption, leisure activities, retail behaviour and media habits.
numeris Numeris: 3,453 variables FSALDU, DA and above
How it’s used • Market Intelligence • Consumer Insights • Target Group Creation • Personification • Differentiated Messaging • Media Planning • Brand Strategy
OPticks
07/04/2015 35
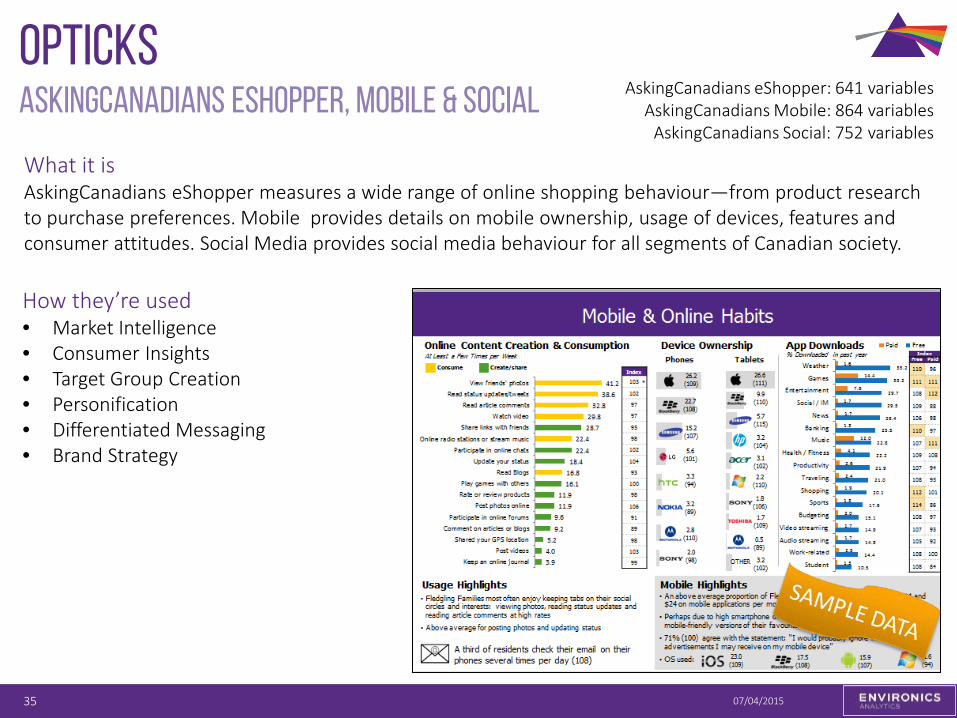
AskingCanadians eShopper: 641 variables AskingCanadians Mobile: 864 variables
AskingCanadians Social: 752 variables
What it is AskingCanadians eShopper measures a wide range of online shopping behaviour—from product research to purchase preferences. Mobile provides details on mobile ownership, usage of devices, features and consumer attitudes. Social Media provides social media behaviour for all segments of Canadian society.
Askingcanadians eshopper, mobile & social
How they’re used • Market Intelligence • Consumer Insights • Target Group Creation • Personification • Differentiated Messaging • Brand Strategy

36
Businesses
Business profiles
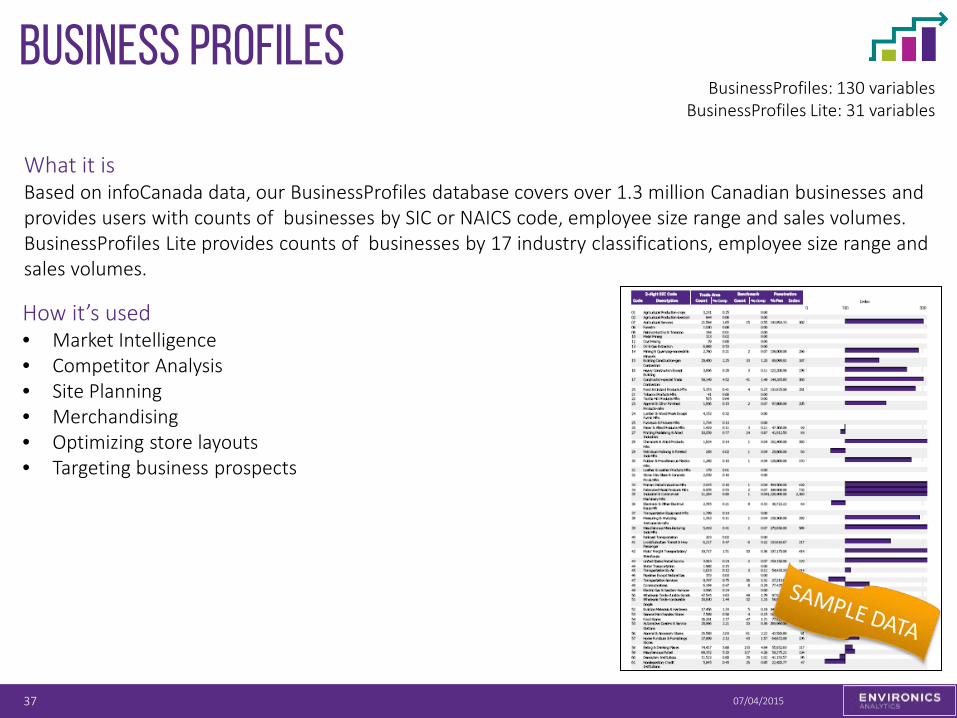
07/04/2015 37
How it’s used • Market Intelligence • Competitor Analysis • Site Planning • Merchandising • Optimizing store layouts • Targeting business prospects
BusinessProfiles: 130 variables BusinessProfiles Lite: 31 variables
What it is Based on infoCanada data, our BusinessProfiles database covers over 1.3 million Canadian businesses and provides users with counts of businesses by SIC or NAICS code, employee size range and sales volumes. BusinessProfiles Lite provides counts of businesses by 17 industry classifications, employee size range and sales volumes.
locationware
07/04/2015 38
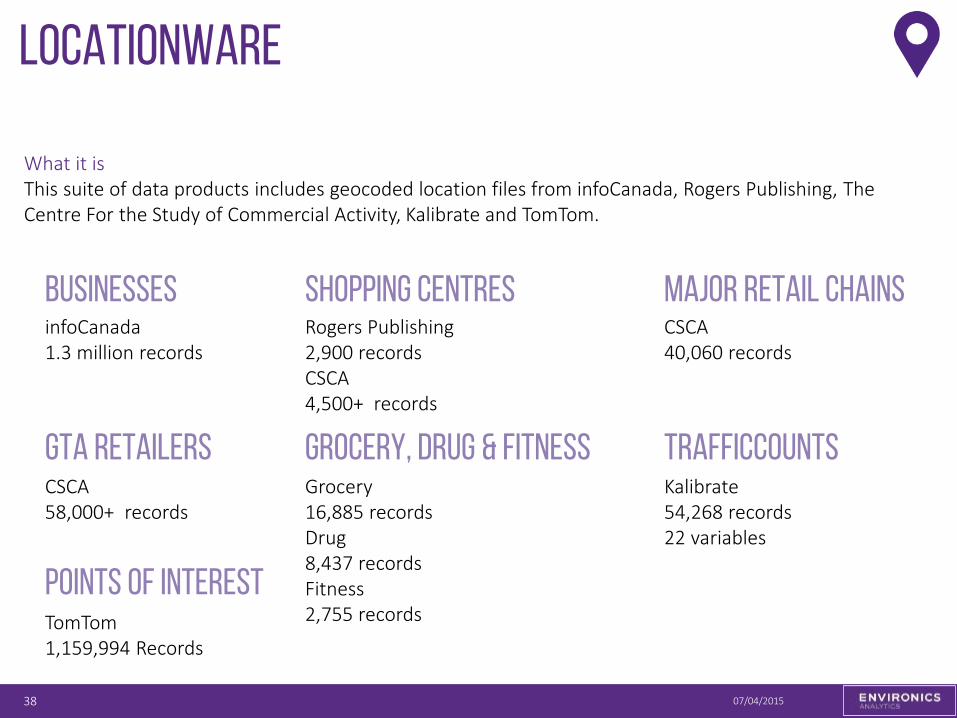
What it is This suite of data products includes geocoded location files from infoCanada, Rogers Publishing, The Centre For the Study of Commercial Activity, Kalibrate and TomTom.
businesses Shopping centres
GTA retailers
Major retail chains
Grocery, drug & fitness
Points of interest
infoCanada 1.3 million records
Rogers Publishing 2,900 records CSCA 4,500+ records
CSCA 40,060 records
CSCA 58,000+ records
Grocery 16,885 records Drug 8,437 records Fitness 2,755 records
TomTom 1,159,994 Records
Trafficcounts Kalibrate 54,268 records 22 variables

39
What’s coming
What’s coming
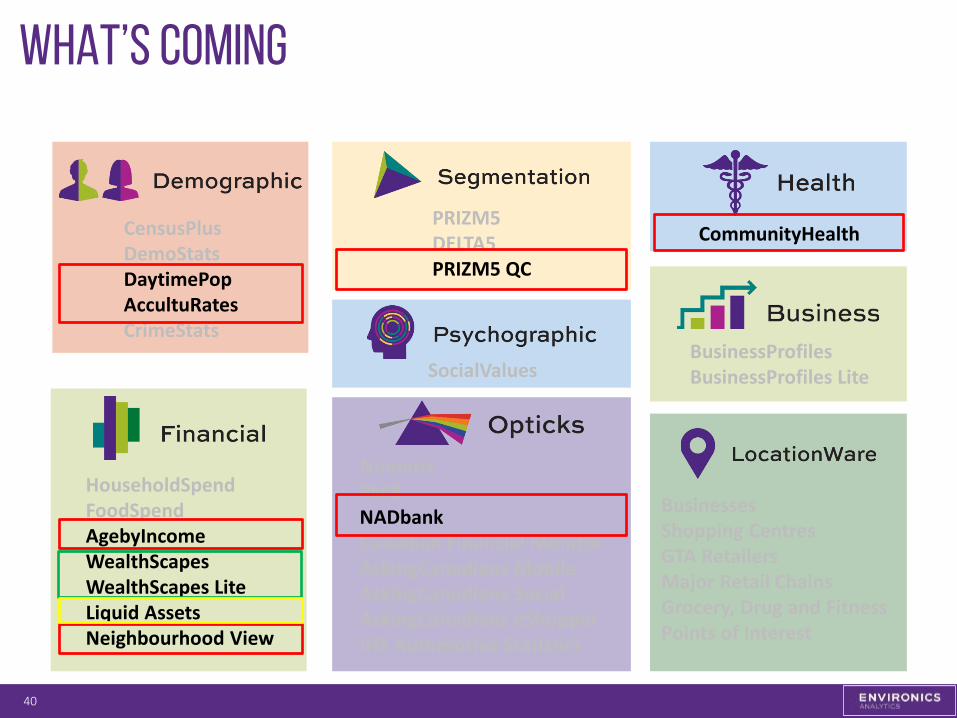
40
CensusPlus DemoStats DaytimePop AccultuRates CrimeStats
HouseholdSpend FoodSpend AgebyIncome WealthScapes WealthScapes Lite Liquid Assets Neighbourhood View
PRIZM5 DELTA5 PRIZM5 QC
Numeris PMB NADbank Canadian Financial Monitor AskingCanadians Mobile AskingCanadians Social AskingCanadians eShopper IHS Automotive Statistics
SocialValues
CommunityHealth
Businesses Shopping Centres GTA Retailers Major Retail Chains Grocery, Drug and Fitness Points of Interest
BusinessProfiles BusinessProfiles Lite
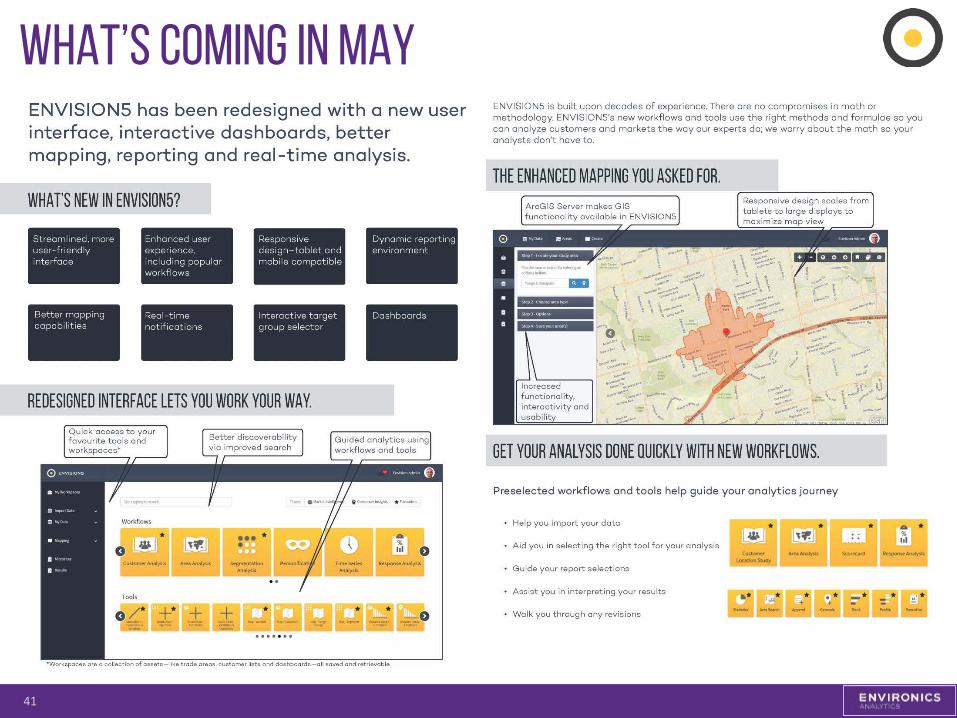
What’s coming in may
41

environicsanalytics.ca
Training Videos visit: environicsanalytics.ca/watch
NEW
questions?
Teresa Sinopoli | Director of Product Management [email protected] Direct - 647.259.2816