Embed Size (px)
DESCRIPTION
This report provides a glimpse into Elwood’s strengths, organizational stability, engagement in the industry, and commitment to continuing success and also contains detailed analysis and recommendations about employment trends like willingness to commute, availability of workers by wage bracket, choosing appropriate education hiring requirements, the Affordable Care Act, and more. Please contact [email protected] with questions, comments, or requests for free hardcopies of the report.
Citation preview

2015Annual
ReportCOMPANY & TALENT

COMPANY REPORTPage 6 Executive Leadership
Page 8 2014 Financial Performance
Page 12 Elwood Staffing at a Glance
Page 16 Did You Know?
TALENT REPORTPage 19 Profile of a Typical Elwood Applicant
Page 20 Old Habits Die Hard: Recruiting Today’s Workers
Page 22 Your Best Turnover Deterrent? Measuring Employee Loyalty
Page 24 Distance (Doesn’t) Make the Heart Grow Fonder: Find the Right Recruiting Radius
Page 26 Is There a Payoff in Paying Less?
Page 28 One School of Thought: Educational Requirements and Hiring
Page 30 The Affordable Care Act: The Compliance Landscape
TABLE OF CONTENTS
1
2
Mark S. ElwoodChief Executive Officer
Thank you for making Elwood Staffing® the company it is today. Whether you rely on us for talent or we work together to support local or state workforce initiatives, you are the reason for our success, our growth, and our excitement for the future.
I am proud to introduce our first annual Company & Talent Report. As a private company, this is a significant step as, for the first time, we can provide those outside our organization with a glimpse into Elwood’s strengths, organizational stability, engagement in the industry, and commitment to continuing success.
For the past few years, we’ve been talking about our next milestone—reaching $1 billion in annual
revenue. Last year, we set a goal to reach that milestone by the end of 2015, and we’re working hard to make that happen. Yet we know it will require a series of initiatives—more than sales alone—to propel us forward. Achieving our goal is dependent on our ability to produce visionary ideas, effectively manage projects, and design solutions that meet true business needs and wants, sparking growth, furthering differentiation, and solidifying relationships.
One of these initiatives—the impetus behind this report—is to establish Elwood as a purveyor of workforce intelligence, and that means sharing our knowledge with everyone around us. Our proprietary database, a repository of client activity and talent information, provides valuable insight into local and
national workforce trends as well as best practices. After more than 30 years of sharing this type of consultative information on a smaller scale, this report provides the means to distribute our intelligence to a broader audience.
I hope our findings spur discussion within your organization and help you make actionable changes. After all, better information leads to better decisions, which leads to better workplaces, better opportunities, and better communities.
Thanks for your continued support of Elwood Staffing.
A LETTER FROM THE CEO
3

4

COMPANY REPORT
5
Mike is responsible for the company’s sales division, with a strong focus on sales management and new market development. Previously with TRI Staffing for eight years, he joined the company as senior vice president upon its acquisition by Elwood Staffing in 2006.
MIKE STOCKARDExecutive Vice President
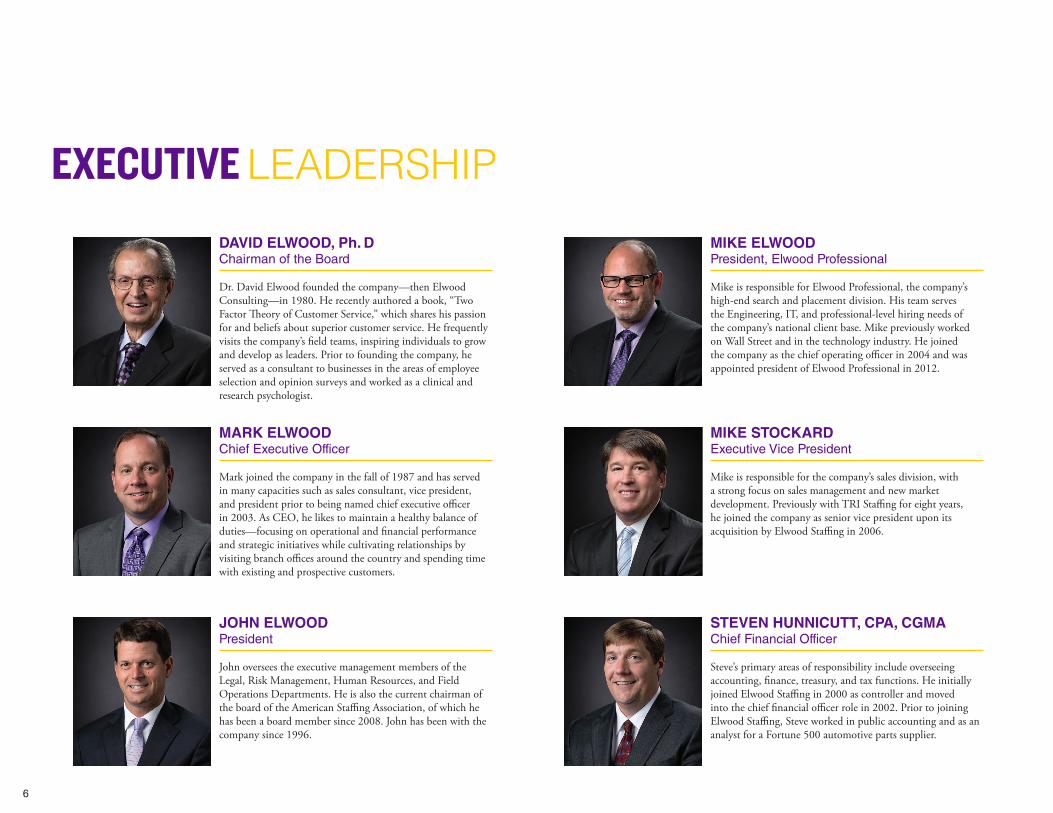
Dr. David Elwood founded the company—then Elwood Consulting—in 1980. He recently authored a book, “Two Factor Theory of Customer Service,” which shares his passion for and beliefs about superior customer service. He frequently visits the company’s field teams, inspiring individuals to grow and develop as leaders. Prior to founding the company, he served as a consultant to businesses in the areas of employee selection and opinion surveys and worked as a clinical and research psychologist.
DAVID ELWOOD, Ph. DChairman of the Board
Mark joined the company in the fall of 1987 and has served in many capacities such as sales consultant, vice president, and president prior to being named chief executive officer in 2003. As CEO, he likes to maintain a healthy balance of duties—focusing on operational and financial performance and strategic initiatives while cultivating relationships by visiting branch offices around the country and spending time with existing and prospective customers.
MARK ELWOODChief Executive Officer
John oversees the executive management members of the Legal, Risk Management, Human Resources, and Field Operations Departments. He is also the current chairman of the board of the American Staffing Association, of which he has been a board member since 2008. John has been with the company since 1996.
JOHN ELWOODPresident
Mike is responsible for Elwood Professional, the company’s high-end search and placement division. His team serves the Engineering, IT, and professional-level hiring needs of the company’s national client base. Mike previously worked on Wall Street and in the technology industry. He joined the company as the chief operating officer in 2004 and was appointed president of Elwood Professional in 2012.
MIKE ELWOOD President, Elwood Professional
Steve’s primary areas of responsibility include overseeing accounting, finance, treasury, and tax functions. He initially joined Elwood Staffing in 2000 as controller and moved into the chief financial officer role in 2002. Prior to joining Elwood Staffing, Steve worked in public accounting and as an analyst for a Fortune 500 automotive parts supplier.
STEVEN HUNNICUTT, CPA, CGMA Chief Financial Officer
EXECUTIVE LEADERSHIP
6
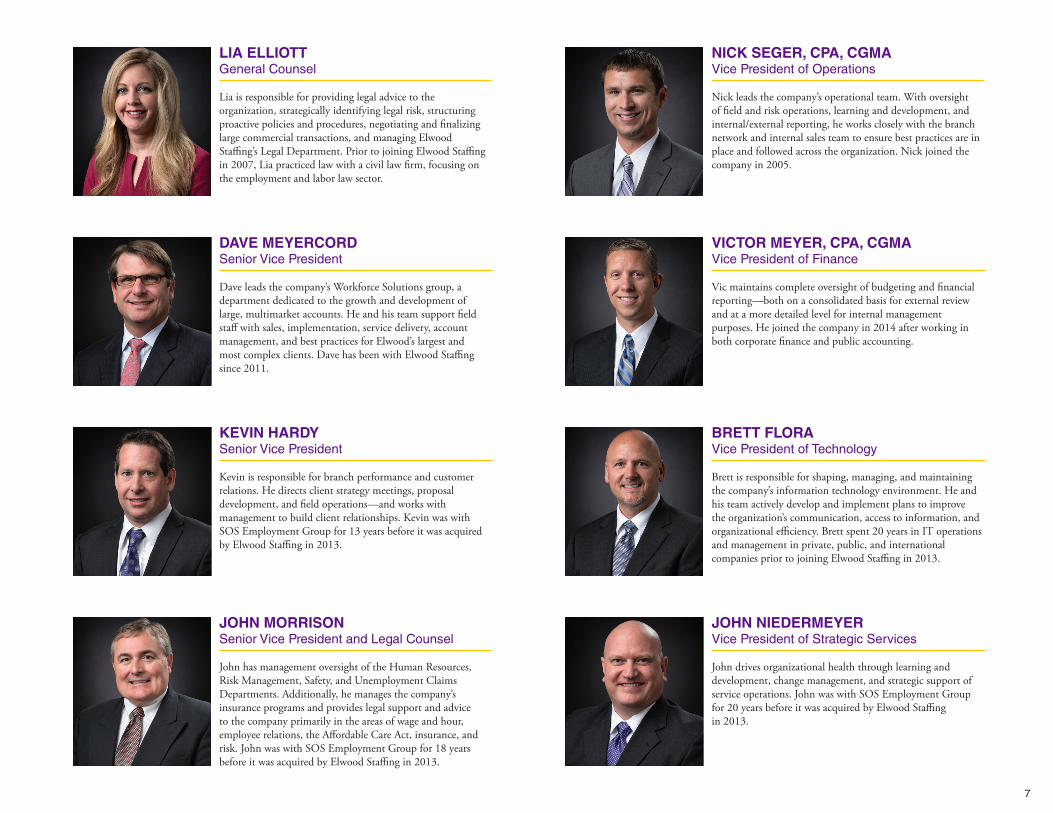
Lia is responsible for providing legal advice to the organization, strategically identifying legal risk, structuring proactive policies and procedures, negotiating and finalizing large commercial transactions, and managing Elwood Staffing’s Legal Department. Prior to joining Elwood Staffing in 2007, Lia practiced law with a civil law firm, focusing on the employment and labor law sector.
LIA ELLIOTTGeneral Counsel
Vic maintains complete oversight of budgeting and financial reporting—both on a consolidated basis for external review and at a more detailed level for internal management purposes. He joined the company in 2014 after working in both corporate finance and public accounting.
VICTOR MEYER, CPA, CGMAVice President of Finance
Dave leads the company’s Workforce Solutions group, a department dedicated to the growth and development of large, multimarket accounts. He and his team support field staff with sales, implementation, service delivery, account management, and best practices for Elwood’s largest and most complex clients. Dave has been with Elwood Staffing since 2011.
DAVE MEYERCORDSenior Vice President
John has management oversight of the Human Resources, Risk Management, Safety, and Unemployment Claims Departments. Additionally, he manages the company’s insurance programs and provides legal support and advice to the company primarily in the areas of wage and hour, employee relations, the Affordable Care Act, insurance, and risk. John was with SOS Employment Group for 18 years before it was acquired by Elwood Staffing in 2013.
JOHN MORRISONSenior Vice President and Legal Counsel
Brett is responsible for shaping, managing, and maintaining the company’s information technology environment. He and his team actively develop and implement plans to improve the organization’s communication, access to information, and organizational efficiency. Brett spent 20 years in IT operations and management in private, public, and international companies prior to joining Elwood Staffing in 2013.
BRETT FLORAVice President of Technology
Kevin is responsible for branch performance and customer relations. He directs client strategy meetings, proposal development, and field operations—and works with management to build client relationships. Kevin was with SOS Employment Group for 13 years before it was acquired by Elwood Staffing in 2013.
KEVIN HARDY Senior Vice President
Nick leads the company’s operational team. With oversight of field and risk operations, learning and development, and internal/external reporting, he works closely with the branch network and internal sales team to ensure best practices are in place and followed across the organization. Nick joined the company in 2005.
NICK SEGER, CPA, CGMAVice President of Operations
John drives organizational health through learning and development, change management, and strategic support of service operations. John was with SOS Employment Group for 20 years before it was acquired by Elwood Staffing in 2013.
JOHN NIEDERMEYERVice President of Strategic Services
7

8
As a successful staffing partner, we must not only meet the staffing needs of our customers and associates, but also operate in a manner that ensures ongoing financial viability. We achieve this objective by properly managing risk exposure, continually implementing efficiency improvements, and complying with all regulatory requirements. The result is a strong balance sheet coupled with consistent year-over-year growth.
2014 FINANCIAL PERFORMANCE

9
REVENUE1
Elwood finished 2014 with revenue of $885 million, which represents year-over-year growth of 9.5%. Acquisitions accounted for 1.9% of the growth, and the remaining 7.6% was the result of organic expansion.
REVENUE $ in millions
REVENUE BY GEOGRAPHY 2014
Our revenue comes from a diversified mix of industries and geographies as illustrated in the adjacent charts. This diversity leads to greater stability that benefits both Elwood and our customers. Additionally, our growing geographic footprint enables us to better serve customers with multiple worksites.
REVENUE BY INDUSTRY 2014
1Results for 2011, 2012, and 2013 are shown pro forma to include the February 2013 acquisition of SOS Staffing Services, Inc.

MARGINS AND OPERATING COSTSMargins declined slightly during 2014 as pressure from a tightening labor market increased the cost to recruit and retain qualified associates. A portion of the increased costs was offset by efficiency improvements in other areas. By leveraging technology and streamlining operational processes, Elwood has been able to reduce operating costs as a percentage of revenue for four consecutive years.
Our customers directly benefit from the operating efficiencies Elwood is able to achieve. Elwood’s operating costs compare favorably to competitors’2, which is reflected in the price our customers pay.
10
OPERATING COSTS BY CATEGORY FOR 2014OPERATING COSTS AS % OF REVENUE
MARGIN & OPERATING COSTS AS % OF REVENUE

ASSETS AND LIQUIDITYTotal assets increased to $170 million for the year ended December 2014 against total liabilities of $76 million. Elwood’s current ratio grew from 2.2 to 2.5 during 2014. This growth in assets and liquidity is a reflection of Elwood’s commitment to conservatively managing assets to preserve our ability to meet financial obligations.
11
CURRENT RATIO
TOTAL ASSETS $ in millions
COMPLIANCEElwood is committed to operating in full compliance with all laws. To ensure we are complying with financial requirements, we engage the services of independent experts. Our financial statements are audited annually by the CPA firm of Blue & Co. LLC. Income tax returns are prepared by the CPA firm of Grant Thornton LLP.
2Competitors consist of published results for Adecco, Kelly Services, Manpower, Randstad, and TrueBlue.
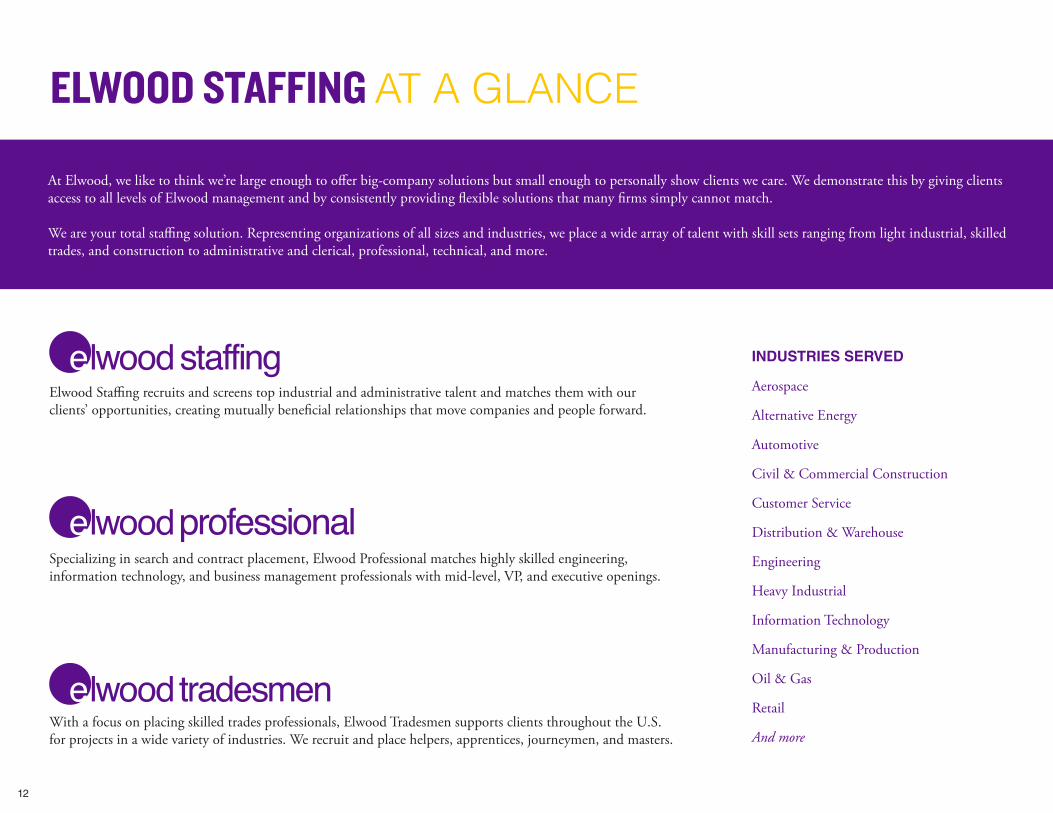
At Elwood, we like to think we’re large enough to offer big-company solutions but small enough to personally show clients we care. We demonstrate this by giving clients access to all levels of Elwood management and by consistently providing flexible solutions that many firms simply cannot match.
We are your total staffing solution. Representing organizations of all sizes and industries, we place a wide array of talent with skill sets ranging from light industrial, skilled trades, and construction to administrative and clerical, professional, technical, and more.
12
Elwood Staffing recruits and screens top industrial and administrative talent and matches them with our clients’ opportunities, creating mutually beneficial relationships that move companies and people forward.
Specializing in search and contract placement, Elwood Professional matches highly skilled engineering, information technology, and business management professionals with mid-level, VP, and executive openings.
With a focus on placing skilled trades professionals, Elwood Tradesmen supports clients throughout the U.S. for projects in a wide variety of industries. We recruit and place helpers, apprentices, journeymen, and masters.
ELWOOD STAFFING AT A GLANCE
INDUSTRIES SERVED
Aerospace
Alternative Energy
Automotive
Civil & Commercial Construction
Customer Service
Distribution & Warehouse
Engineering
Heavy Industrial
Information Technology
Manufacturing & Production
Oil & Gas
Retail
And more
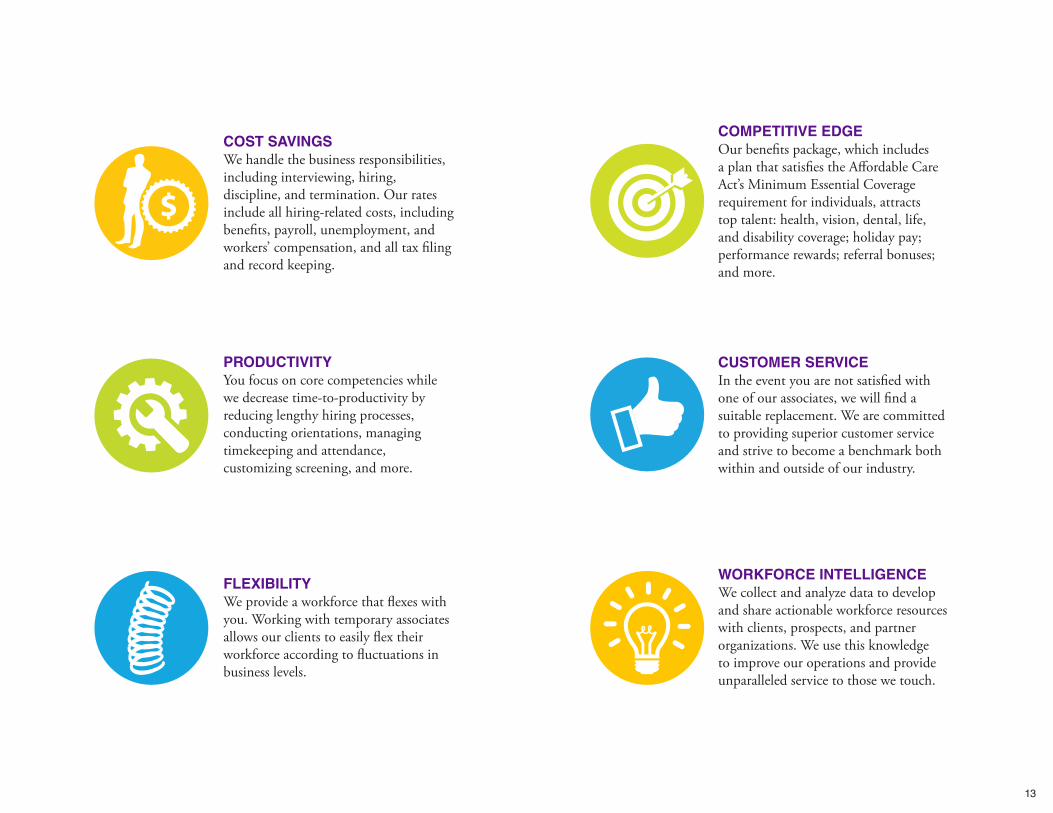
COST SAVINGSWe handle the business responsibilities, including interviewing, hiring, discipline, and termination. Our rates include all hiring-related costs, including benefits, payroll, unemployment, and workers’ compensation, and all tax filing and record keeping.
13
FLEXIBILITYWe provide a workforce that flexes with you. Working with temporary associates allows our clients to easily flex their workforce according to fluctuations in business levels.
COMPETITIVE EDGEOur benefits package, which includes a plan that satisfies the Affordable Care Act’s Minimum Essential Coverage requirement for individuals, attracts top talent: health, vision, dental, life, and disability coverage; holiday pay; performance rewards; referral bonuses; and more.
PRODUCTIVITYYou focus on core competencies while we decrease time-to-productivity by reducing lengthy hiring processes, conducting orientations, managing timekeeping and attendance, customizing screening, and more.
CUSTOMER SERVICEIn the event you are not satisfied with one of our associates, we will find a suitable replacement. We are committed to providing superior customer service and strive to become a benchmark both within and outside of our industry.
WORKFORCE INTELLIGENCEWe collect and analyze data to develop and share actionable workforce resources with clients, prospects, and partner organizations. We use this knowledge to improve our operations and provide unparalleled service to those we touch.

29,000TEMPORARY ASSOCIATES EMPLOYED DAILY............................................
1,000INTERNAL EMPLOYEES
NEARLY
NEARLY
.........................
6,000+CLIENTS SERVED ANNUALLY............................
#11U.S. INDUSTRIAL STAFFING COMPANY*
LARGEST......................................
180+ ACROSS OUR SERVICE & DELIVERY FOOTPRINT
BRANCHES 70+ON-SITES.................................................
25U.S. STAFFING COMPANY*
TOP LARGEST.........................
*Ranking from 2014 Staffing Industry Analysts published statistics
ELWOOD STAFFING AT A GLANCE
14
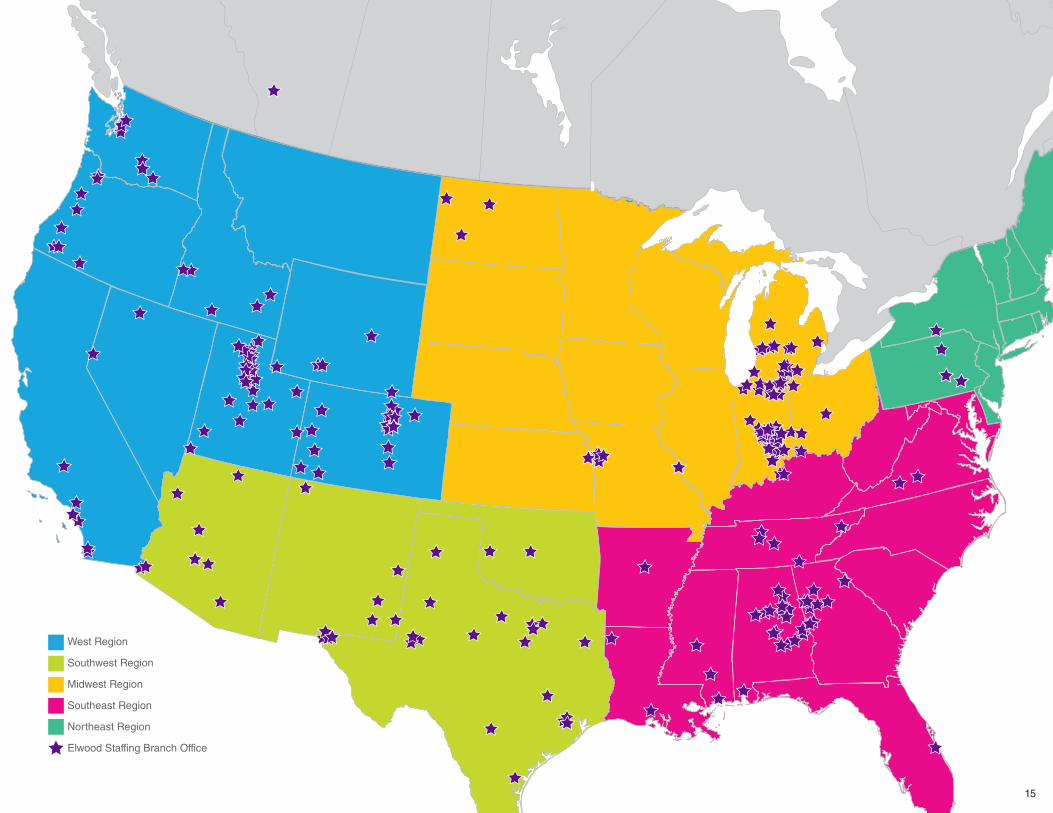
West Region
Southwest Region
Midwest Region
Southeast Region
Northeast Region
Elwood Staffing Branch Office
15

16
President John Elwood serves as chairman of the board of directors of the American Staffing Association (ASA) for the 2015 term year. Coupled with his personal passion for influencing the industry, John’s commitment to ASA places Elwood among an elite group of companies at the very forefront of industry research, legislation, and learning. This positions
us to better serve our associates, employees, and clients because we have direct and immediate access to the latest information, ensuring we make sound recommendations and employ the best business practices.
John has served on ASA’s board since 2008, most
recently as the first vice chairman. The ASA board of directors represents leadership from the nation’s top staffing organizations, a balanced mix of national and independent companies, and is the largest professional association for the staffing industry, as well as its leading voice in government and to the media and the public.
2014 was a good year for company founder and Chairman of the Board Dr. David L. Elwood, who released his first book, “Two Factor Theory of Customer Service,” in January and was separately honored by his alma mater, Olivet Nazarene University, in October with a building dedication and new leadership program both taking his name.
Elwood Staffing was named to Inavero’s Best of Staffing® Client and Best of Staffing® Talent lists for 2014. Presented in partnership with CareerBuilder, Best of Staffing is the nation’s only award that recognizes staffing firms that receive remarkable reviews from their clients and the people for whom they find jobs (employed talent). Fewer than 2% of North American staffing firms receive the Best of Staffing Award for service excellence, and fewer still earn the distinction to be on both the Client and Talent lists.
Upon completion of a rigorous survey process, participating companies are awarded a Net Promoter ScoreSM (NPS®) which, in essence, is a numeric indicator of customer satisfaction and loyalty—customers most likely to promote a company’s services to others.
Overall, both surveys saw a 20% response rate. Based on 1,561 client responses, Elwood received an NPS of 55.8%—significantly higher than the industry average of 8%. On the talent side, based on 4,690 responses, we earned an NPS of 51.1%—up greatly from the industry average of 33%.
John Elwood ELECTED CHAIRMAN of ASA Board of Directors
Founder David L. Elwood RELEASES CUSTOMER SERVICE BOOK, Honored by Alma Mater
Elwood HONORED BY INAVERO Best of Staffing® Program
Dr. Elwood’s book offers insight into his research and beliefs on customer service, much of which influences and shapes Elwood Staffing as an organization as it strives to become a national benchmark for superior customer service.
The dedication of the David L. Elwood Center for Student Success and new leadership program came as a complete surprise to Dr. Elwood, who holds Olivet close to his heart and describes the university as a place where his faith and values were firmly established. The Elwood family’s direct investment in the future of Olivet students serves as a way to honor Dr. Elwood’s love of lifelong learning and commitment to formal education.
DID YOU KNOW?

TALENT REPORT
17

18
We hope you find a lot of valuable information in this book. Because, of course, that’s the point. But, if we can impress one important thing upon you, it’s this: We use this data, too.
And, while we are happy to share, this book only scratches the surface of our workforce intelligence and capabilities.
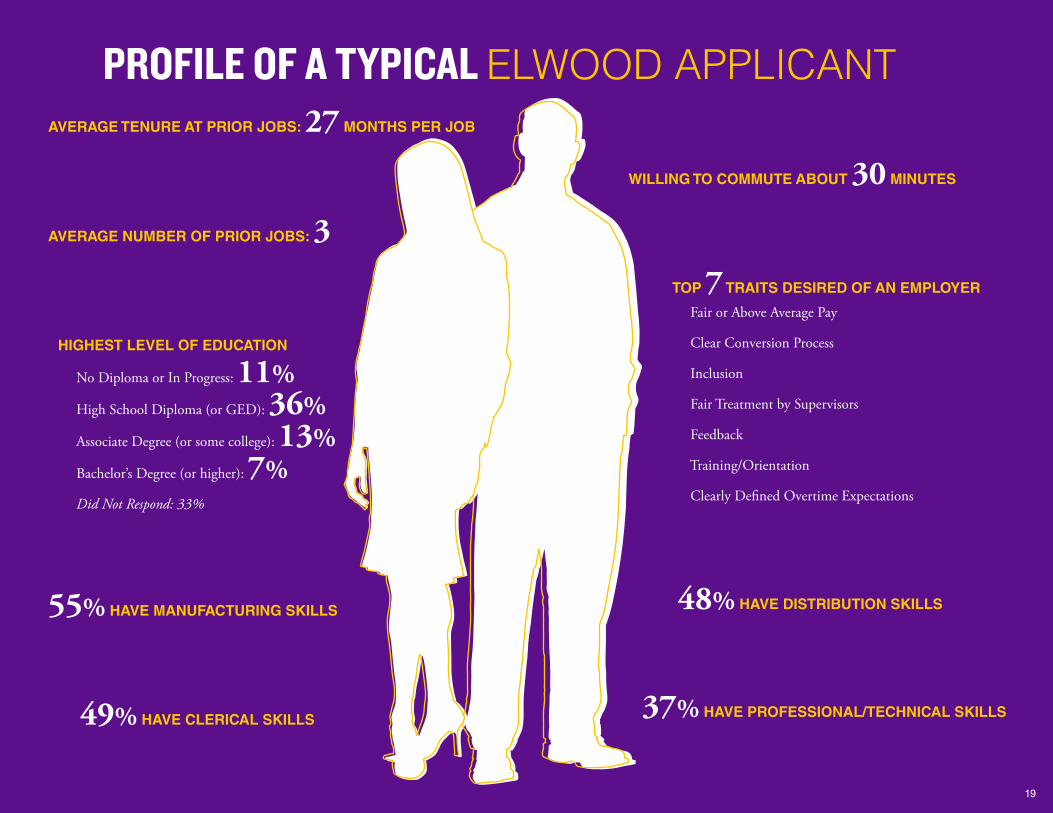
PROFILE OF A TYPICAL ELWOOD APPLICANT
WILLING TO COMMUTE ABOUT 30 MINUTES
37% HAVE PROFESSIONAL/TECHNICAL SKILLS
48% HAVE DISTRIBUTION SKILLS
AVERAGE TENURE AT PRIOR JOBS: 27 MONTHS PER JOB
TOP 7 TRAITS DESIRED OF AN EMPLOYER
Fair or Above Average Pay
Clear Conversion Process
Inclusion
Fair Treatment by Supervisors
Feedback
Training/Orientation
Clearly Defined Overtime Expectations
19
AVERAGE NUMBER OF PRIOR JOBS: 3
HIGHEST LEVEL OF EDUCATION
No Diploma or In Progress: 11% High School Diploma (or GED): 36%
Associate Degree (or some college): 13%
Bachelor’s Degree (or higher): 7% Did Not Respond: 33%
55% HAVE MANUFACTURING SKILLS
49% HAVE CLERICAL SKILLS
20
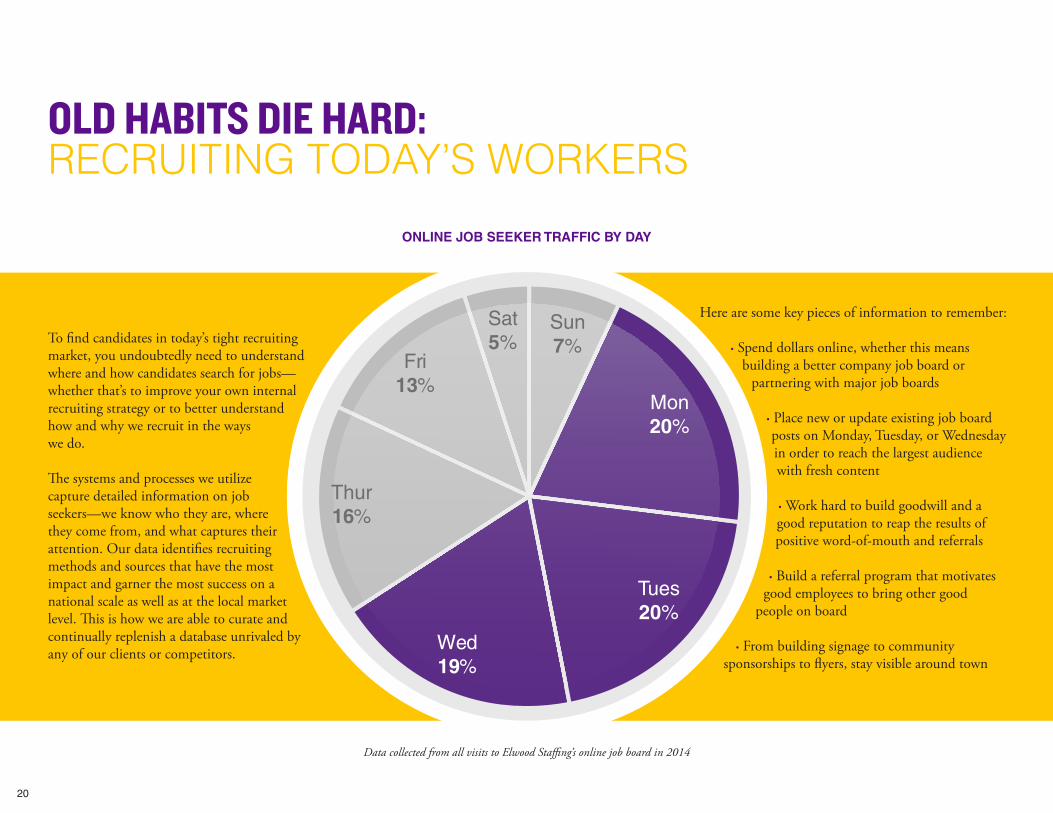
To find candidates in today’s tight recruiting market, you undoubtedly need to understand where and how candidates search for jobs—whether that’s to improve your own internal recruiting strategy or to better understand how and why we recruit in the ways we do.
The systems and processes we utilize capture detailed information on job seekers—we know who they are, where they come from, and what captures their attention. Our data identifies recruiting methods and sources that have the most impact and garner the most success on a national scale as well as at the local market level. This is how we are able to curate and continually replenish a database unrivaled by any of our clients or competitors.
OLD HABITS DIE HARD:RECRUITING TODAY’S WORKERS
Sun7%
Mon20%
Tues20%
Wed19%
Thur16%
Fri13%
Sat5%
ONLINE JOB SEEKER TRAFFIC BY DAY
Here are some key pieces of information to remember:
· Spend dollars online, whether this means building a better company job board or
partnering with major job boards
· Place new or update existing job board posts on Monday, Tuesday, or Wednesday in order to reach the largest audience with fresh content
· Work hard to build goodwill and a good reputation to reap the results of positive word-of-mouth and referrals
· Build a referral program that motivates good employees to bring other good
people on board
· From building signage to community sponsorships to flyers, stay visible around town
Data collected from all visits to Elwood Staffing’s online job board in 2014
SOCIAL MEDIA: THEY’RE ONLINE. ARE YOU?
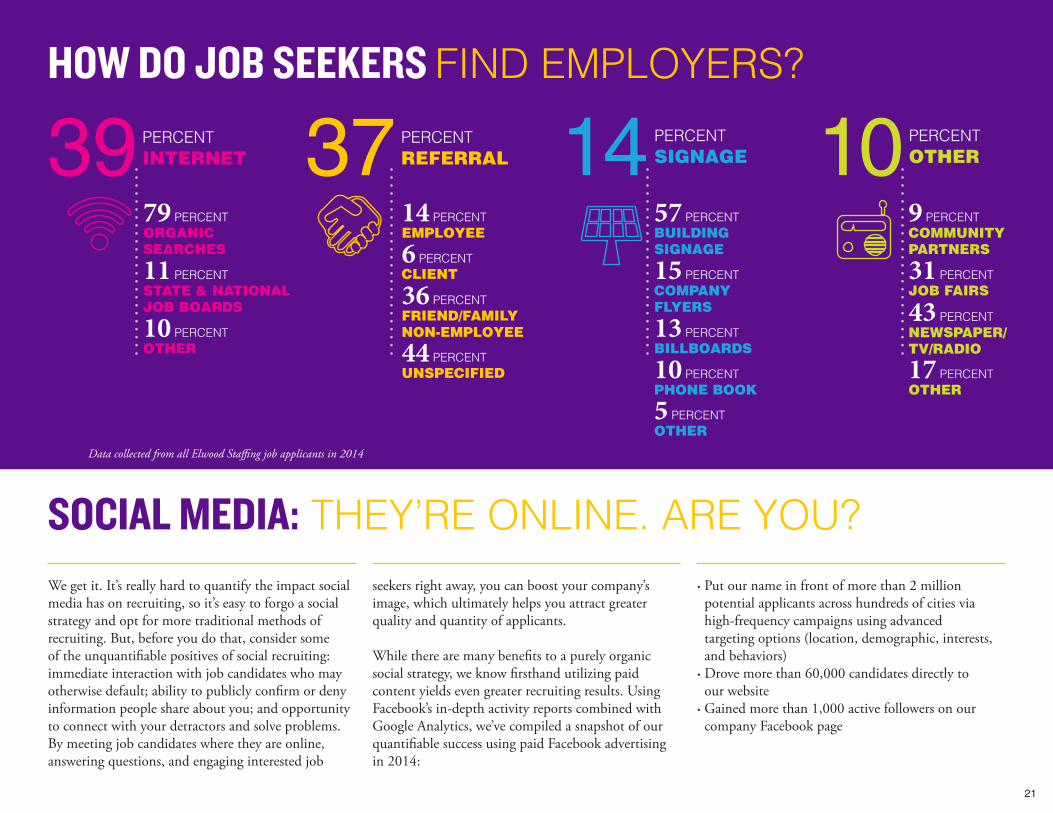
Data collected from all Elwood Staffing job applicants in 2014
HOW DO JOB SEEKERS FIND EMPLOYERS?
39 PERCENTINTERNET
79 PERCENTORGANICSEARCHES
11 PERCENTSTATE & NATIONAL JOB BOARDS
10 PERCENTOTHER
14 PERCENTEMPLOYEE
6 PERCENTCLIENT
36 PERCENTFRIEND/FAMILY NON-EMPLOYEE
44 PERCENTUNSPECIFIED
37 PERCENTREFERRAL
57 PERCENTBUILDING SIGNAGE
15 PERCENTCOMPANY FLYERS
13 PERCENTBILLBOARDS
10 PERCENTPHONE BOOK
5 PERCENTOTHER
14 PERCENTSIGNAGE
9 PERCENTCOMMUNITY PARTNERS
31 PERCENTJOB FAIRS
43 PERCENTNEWSPAPER/TV/RADIO
17 PERCENTOTHER
10 PERCENTOTHER
21
We get it. It’s really hard to quantify the impact social media has on recruiting, so it’s easy to forgo a social strategy and opt for more traditional methods of recruiting. But, before you do that, consider some of the unquantifiable positives of social recruiting: immediate interaction with job candidates who may otherwise default; ability to publicly confirm or deny information people share about you; and opportunity to connect with your detractors and solve problems. By meeting job candidates where they are online, answering questions, and engaging interested job
seekers right away, you can boost your company’s image, which ultimately helps you attract greater quality and quantity of applicants. While there are many benefits to a purely organic social strategy, we know firsthand utilizing paid content yields even greater recruiting results. Using Facebook’s in-depth activity reports combined with Google Analytics, we’ve compiled a snapshot of our quantifiable success using paid Facebook advertising in 2014:
· Put our name in front of more than 2 million potential applicants across hundreds of cities via high-frequency campaigns using advanced targeting options (location, demographic, interests, and behaviors)
· Drove more than 60,000 candidates directly to our website
· Gained more than 1,000 active followers on our company Facebook page
YOUR BEST TURNOVER DETERRENT?MEASURING EMPLOYEE LOYALTY
It’s no mystery, especially if you’ve already scanned the articles and data in this report, that today’s workforce is in the driver’s seat. Job loyalty is low, and workers know they have options. According to a study commissioned by MTV1, 50% of Millennials say they would rather not have a job than have a work arrangement they dislike. Couple this with the fact that 24% of companies report difficulties filling open jobs2, and it becomes clear that measuring employee loyalty and satisfaction is crucial to long-term organizational health.
Enter the mighty employee NPS®! Elwood Staffing, along with leaders like Apple and Symantec, has embraced an increasingly popular employee engagement measurement tool called the employee Net Promoter SystemSM or eNPS3. Similar to the Net Promoter SystemSM, which measures consumer loyalty, eNPS begins with one question that effectively identifies how happy and engaged your employees are with...YOU! After all, as an employer, it’s unrealistic to expect your customers to be loyal to and engaged with your company if your employees aren’t loyal and engaged first!
Ready to create a legion of raving fans? Here’s how:
ASK THE QUESTION!It can be as simple as making this the first question on your next employee survey: On a scale of zero to ten, how likely is it that you would recommend this company as a place to work? But to get the most bang for your buck, we recommend adding one to two follow-up questions asking employees to explain their rating—this will help you identify what you’re doing right and what areas need improvement. In general, the fewer survey questions, the higher number of respondents—and the more often you can survey. And if you’re seeking honest feedback, ensure anonymity.
22
eNPSscore
% of Promoters(9s and 10s)
% of Detractors(0 through 6s)
DETRACTORS
0 1 2 3 4 5 6 7 8 9 10
PASSIVES PROMOTERS
1Hillhouse, Allison. “Consumer Insights: MTV’s ‘No Collar Workers’.”Blog.Viacom. Viacom, 4 Oct. 2012. Web. 9 June 20142 NFIB:(http://www.nfib.com/surveys/small-business-economic-trends/): Percentage of Firms With Positions Not Able to Fill Right Now: 24% (©National Federation of Independent Business Research Foundation)3Net Promoter® and NPS® are registered trademarks and Net Promoter SystemSM and Net Promoter ScoreSM are trademarks of Bain & Company, Inc., Fred Reichheld and Satmetrix Systems, Inc.
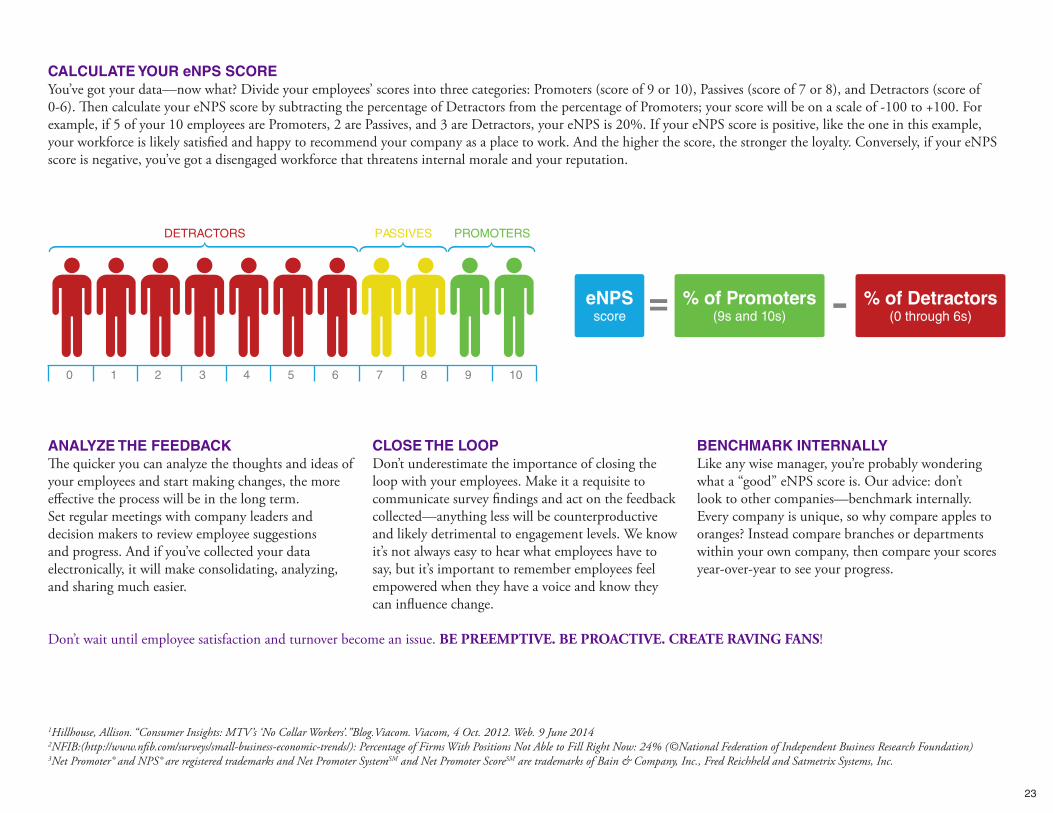
CALCULATE YOUR eNPS SCOREYou’ve got your data—now what? Divide your employees’ scores into three categories: Promoters (score of 9 or 10), Passives (score of 7 or 8), and Detractors (score of 0-6). Then calculate your eNPS score by subtracting the percentage of Detractors from the percentage of Promoters; your score will be on a scale of -100 to +100. For example, if 5 of your 10 employees are Promoters, 2 are Passives, and 3 are Detractors, your eNPS is 20%. If your eNPS score is positive, like the one in this example, your workforce is likely satisfied and happy to recommend your company as a place to work. And the higher the score, the stronger the loyalty. Conversely, if your eNPS score is negative, you’ve got a disengaged workforce that threatens internal morale and your reputation.
ANALYZE THE FEEDBACKThe quicker you can analyze the thoughts and ideas of your employees and start making changes, the more effective the process will be in the long term. Set regular meetings with company leaders and decision makers to review employee suggestions and progress. And if you’ve collected your data electronically, it will make consolidating, analyzing, and sharing much easier.
CLOSE THE LOOPDon’t underestimate the importance of closing the loop with your employees. Make it a requisite to communicate survey findings and act on the feedback collected—anything less will be counterproductive and likely detrimental to engagement levels. We know it’s not always easy to hear what employees have to say, but it’s important to remember employees feel empowered when they have a voice and know they can influence change.
BENCHMARK INTERNALLYLike any wise manager, you’re probably wondering what a “good” eNPS score is. Our advice: don’t look to other companies—benchmark internally. Every company is unique, so why compare apples to oranges? Instead compare branches or departments within your own company, then compare your scores year-over-year to see your progress.
Don’t wait until employee satisfaction and turnover become an issue. BE PREEMPTIVE. BE PROACTIVE. CREATE RAVING FANS!
23

In a tight recruiting market, it is easy to continually expand your recruiting radius in an effort to attract more candidates. But, that’s not always the right decision. At a certain point, you will start to see diminishing returns on your efforts. We tapped into our database to find out how long candidates are willing to commute for a job and what factors impact their decision.
Candidates seeking job opportunities in the energy industries (alternative and oil & gas) typically indicate a willingness to commute longer distances. We believe there are two reasons for this: 1) workers in the oil & gas industry generally work longer shifts on fewer days or partially relocate to the job site with financial assistance or paid housing; 2) workers in the alternative energy industry typically feel more passionate about the positive social and environmental impact of their work and are, in turn, willing to commute farther to find jobs in the industry.
DISTANCE (DOESN’T) MAKE THE HEART GROW FONDER:FIND THE RIGHT RECRUITING RADIUS
WILLINGNESS TO COMMUTE BY SECTOR (ONE WAY)
24
27minutes
59minutes
50minutes
32minutes
61minutes
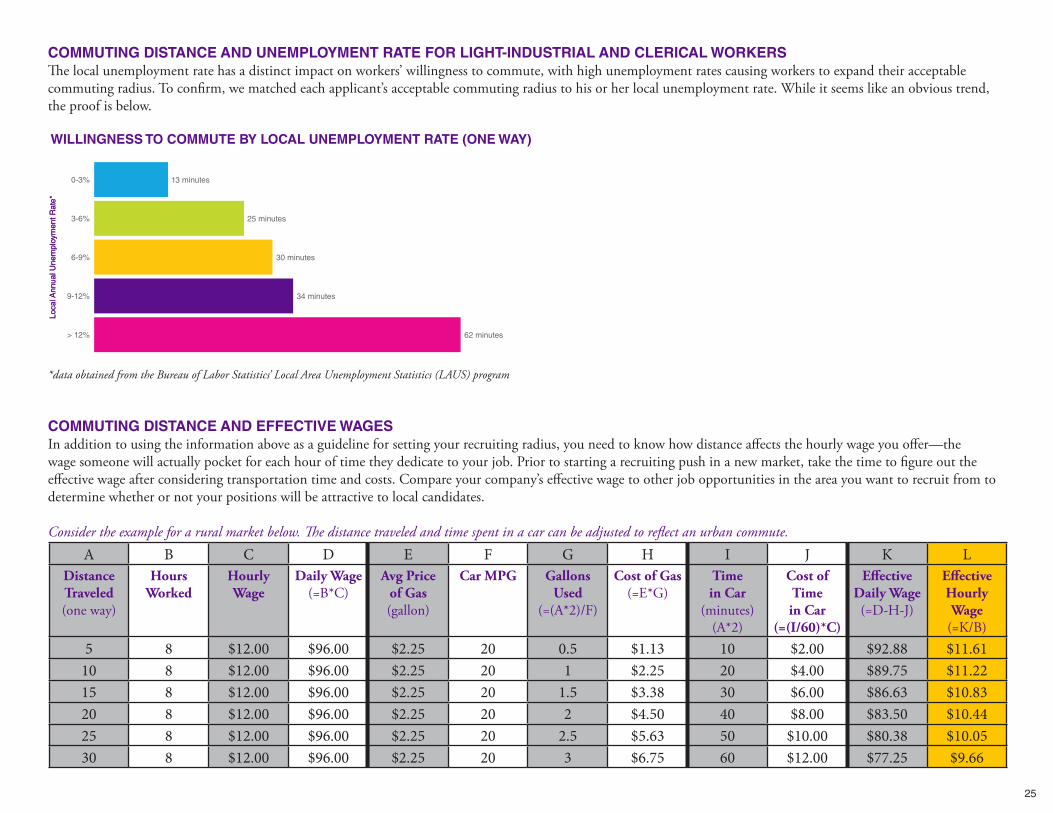
COMMUTING DISTANCE AND UNEMPLOYMENT RATE FOR LIGHT-INDUSTRIAL AND CLERICAL WORKERSThe local unemployment rate has a distinct impact on workers’ willingness to commute, with high unemployment rates causing workers to expand their acceptable commuting radius. To confirm, we matched each applicant’s acceptable commuting radius to his or her local unemployment rate. While it seems like an obvious trend, the proof is below.
WILLINGNESS TO COMMUTE BY LOCAL UNEMPLOYMENT RATE (ONE WAY)
*data obtained from the Bureau of Labor Statistics’ Local Area Unemployment Statistics (LAUS) program
COMMUTING DISTANCE AND EFFECTIVE WAGESIn addition to using the information above as a guideline for setting your recruiting radius, you need to know how distance affects the hourly wage you offer—the wage someone will actually pocket for each hour of time they dedicate to your job. Prior to starting a recruiting push in a new market, take the time to figure out the effective wage after considering transportation time and costs. Compare your company’s effective wage to other job opportunities in the area you want to recruit from to determine whether or not your positions will be attractive to local candidates.
Consider the example for a rural market below. The distance traveled and time spent in a car can be adjusted to reflect an urban commute.
A B C D E F G H I J K LDistance Traveled (one way)
Hours Worked
Hourly Wage
Daily Wage (=B*C)
Avg Price of Gas (gallon)
Car MPG Gallons Used
(=(A*2)/F)
Cost of Gas (=E*G)
Time in Car
(minutes) (A*2)
Cost of Time in Car
(=(I/60)*C)
Effective Daily Wage (=D-H-J)
Effective Hourly Wage
(=K/B)5 8 $12.00 $96.00 $2.25 20 0.5 $1.13 10 $2.00 $92.88 $11.6110 8 $12.00 $96.00 $2.25 20 1 $2.25 20 $4.00 $89.75 $11.2215 8 $12.00 $96.00 $2.25 20 1.5 $3.38 30 $6.00 $86.63 $10.8320 8 $12.00 $96.00 $2.25 20 2 $4.50 40 $8.00 $83.50 $10.4425 8 $12.00 $96.00 $2.25 20 2.5 $5.63 50 $10.00 $80.38 $10.0530 8 $12.00 $96.00 $2.25 20 3 $6.75 60 $12.00 $77.25 $9.66
25
Loca
l Ann
ual U
nem
ploy
men
t Rat
e*

IS THERE A PAYOFF IN PAYING LESS?
The wages you pay are a big deal—to both you and your employees. They likely represent one of your largest expenses and the largest source of income for your employees. It’s important to find the right balance between paying wages that allow you to attract and retain talent without compromising your ability to maintain profits. In a separate study in late 2014, we analyzed a sample of our associate pool to understand just how large an impact wages have on no-show rates and replenishment needs by assessing the overfill and turnover rates of our industrial workers in different wage categories. In all but one category, paying less meant greater overfill needs and higher instances of turnover.
Intrigued, we dove further and looked at the percentage of workers willing to work in each wage category; because, of course, the availability of workers impacts how much trouble building overfill and replenishing turnover really are. In an employer’s market—like that during the recession—finding workers is easy and the costs of building overfill or replenishing turnover are lower than in a job seeker’s market—like we’re in today—when candidate availability is low.
Finding a happy medium between the wages you offer and the availability of the talent you seek and their likeliness to stick around is critical to success.
NUMBER OF WORKERS DISPATCHED TO ENSURE 100-PERSON ARRIVAL TURNOVER AS A % OF AVERAGE DAILY EMPLOYMENT
26
People who showed up People who didn’t show up

Minimum Wage
+ $0.75 + $1.50 + $2.25 + $3.00 + $3.75 + $4.50 + $5.25 + $6.00 + >$6.01
33%21%
10%
58%79% 85% 87% 92% 94% 100%
+ $1.50+ $0.75Minimum Wage
+ $2.25 + $3.00 + $3.75 + $4.50 + $5.25 + $6.00 + >$6.01
36%29%9%
59%81% 87% 88% 93% 95% 100%
+ $1.50+ $0.75Minimum Wage
+ $2.25 + $3.00 + $3.75 + $4.50 + $5.25 + $6.00 + >$6.01
43%32%
17%
59%74% 78% 81% 86% 89% 100%
+ $1.50+ $0.75Minimum Wage
+ $2.25 + $3.00 + $3.75 + $4.50 + $5.25 + $6.00 + >$6.01
9%6%3%19% 24% 26% 35% 45%
74%100%
+ $1.50+ $0.75Minimum Wage
+ $2.25 + $3.00 + $3.75 + $4.50 + $5.25 + $6.00 + >$6.01
39%28%
7%
56%69% 73% 76% 81% 84%
100%
Here’s how the availability of talent shakes out in each region. Candidates are broken out by the minimum acceptable wage reported on their application—the absolute lowest wage for which they are willing to work. Use this data as a guide when setting your pay rates. While lower wages have an immediate and obvious impact on your bottom line, consider the costs and challenges associated with finding and hiring the necessary workers to ensure your facility meets production demands.
AVAILABILITY OF INDUSTRIAL WORKERS BY MINIMUM ACCEPTABLE WAGE1
MIDWEST NORTHEAST
27
1To account for variances in local minimum wages we analyzed applicant responses to the question “What is your minimum acceptable wage?” by positive variance from their local minimum wage. Any response less than the local minimum wage was discarded.
SOUTHEAST
WEST
SOUTHWEST
29.20%
33.10%
37.70%
20.80%
23.50%
55.70%
No diploma or degree indicated
Successful Quit Terminated
At least HSD/GED
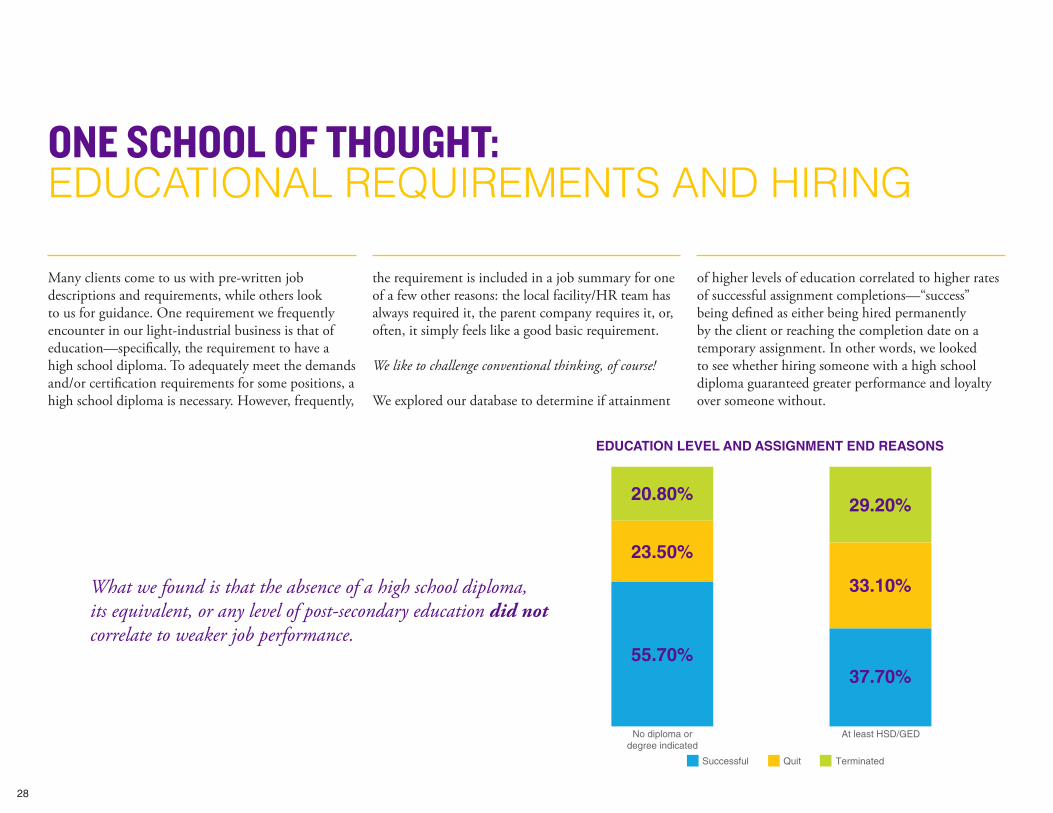
Many clients come to us with pre-written job descriptions and requirements, while others look to us for guidance. One requirement we frequently encounter in our light-industrial business is that of education—specifically, the requirement to have a high school diploma. To adequately meet the demands and/or certification requirements for some positions, a high school diploma is necessary. However, frequently,
the requirement is included in a job summary for one of a few other reasons: the local facility/HR team has always required it, the parent company requires it, or, often, it simply feels like a good basic requirement.
We like to challenge conventional thinking, of course!
We explored our database to determine if attainment
of higher levels of education correlated to higher rates of successful assignment completions—“success” being defined as either being hired permanently by the client or reaching the completion date on a temporary assignment. In other words, we looked to see whether hiring someone with a high school diploma guaranteed greater performance and loyalty over someone without.
ONE SCHOOL OF THOUGHT:EDUCATIONAL REQUIREMENTS AND HIRING
What we found is that the absence of a high school diploma, its equivalent, or any level of post-secondary education did not correlate to weaker job performance.
EDUCATION LEVEL AND ASSIGNMENT END REASONS
28
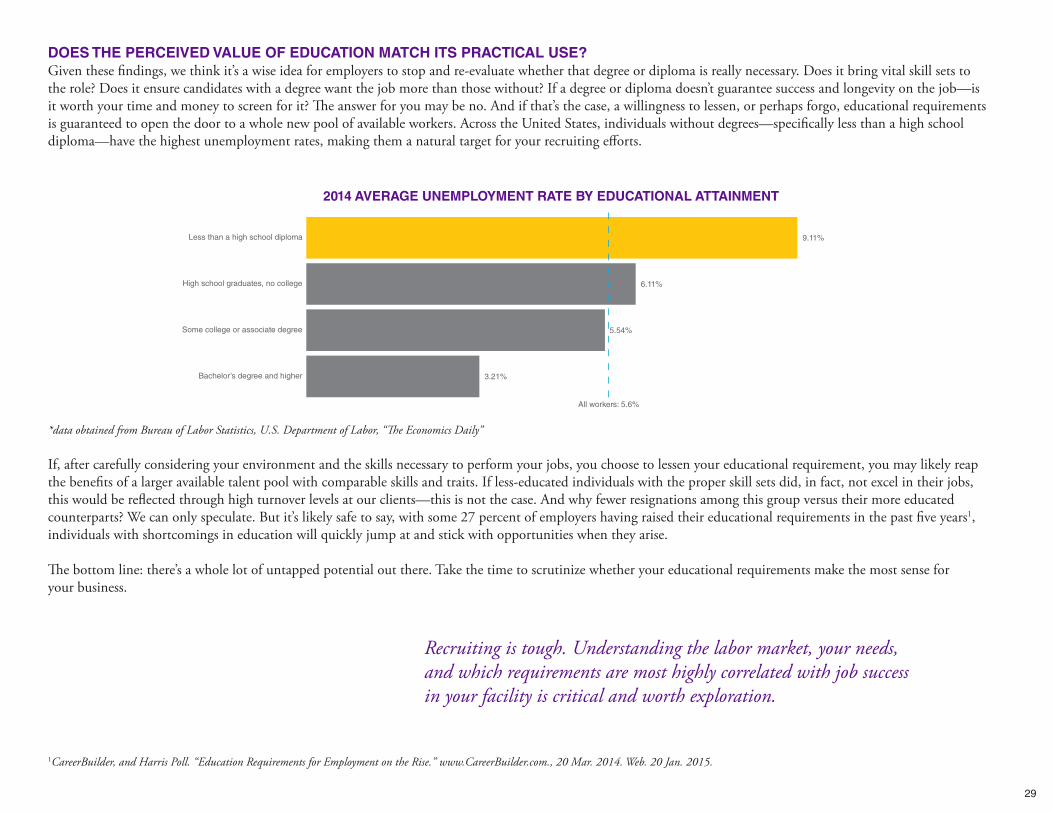
DOES THE PERCEIVED VALUE OF EDUCATION MATCH ITS PRACTICAL USE?Given these findings, we think it’s a wise idea for employers to stop and re-evaluate whether that degree or diploma is really necessary. Does it bring vital skill sets to the role? Does it ensure candidates with a degree want the job more than those without? If a degree or diploma doesn’t guarantee success and longevity on the job—is it worth your time and money to screen for it? The answer for you may be no. And if that’s the case, a willingness to lessen, or perhaps forgo, educational requirements is guaranteed to open the door to a whole new pool of available workers. Across the United States, individuals without degrees—specifically less than a high school diploma—have the highest unemployment rates, making them a natural target for your recruiting efforts.
*data obtained from Bureau of Labor Statistics, U.S. Department of Labor, “The Economics Daily”
If, after carefully considering your environment and the skills necessary to perform your jobs, you choose to lessen your educational requirement, you may likely reap the benefits of a larger available talent pool with comparable skills and traits. If less-educated individuals with the proper skill sets did, in fact, not excel in their jobs, this would be reflected through high turnover levels at our clients—this is not the case. And why fewer resignations among this group versus their more educated counterparts? We can only speculate. But it’s likely safe to say, with some 27 percent of employers having raised their educational requirements in the past five years1, individuals with shortcomings in education will quickly jump at and stick with opportunities when they arise.
The bottom line: there’s a whole lot of untapped potential out there. Take the time to scrutinize whether your educational requirements make the most sense for your business.
2014 AVERAGE UNEMPLOYMENT RATE BY EDUCATIONAL ATTAINMENT
29
Recruiting is tough. Understanding the labor market, your needs, and which requirements are most highly correlated with job success in your facility is critical and worth exploration.
1CareerBuilder, and Harris Poll. “Education Requirements for Employment on the Rise.” www.CareerBuilder.com., 20 Mar. 2014. Web. 20 Jan. 2015.
INTRODUCTIONCharacterizing the Affordable Care Act (ACA) compliance landscape for employers as a journey into the unknown is not unreasonable. Taking it one step further, it is also not unreasonable to say that for staffing firms the journey started in a bit of fog. While the road ahead clears somewhat for all, a bit of the unknown still remains. As we prepare for 2015 and beyond, we would like to share an overview of the current ACA landscape as well as Elwood Staffing’s compliance strategy.
THE COMPLIANCE LANDSCAPEAlthough the regulatory landscape is clearer, there are currently items under consideration that impact or will impact compliance. Most recently, the Departments of Treasury and Health & Human Services announced that Minimum Value plans that fail to provide substantial coverage for inpatient hospitalization services or for physician services (or for both) will not qualify as Minimum Value. This change is anticipated to be made in 2015, providing transition relief to those companies that relied on previous guidance and established their plans prior to November 4, 2014. The departments will allow these plans, which must have effective dates no later than March 1, 2015, to meet Minimum Value until the end of the plan year. Employers with these plans in
place—and the employees covered under them—will experience disruption as they are phased out of ACA-compliance.
As predicted, the mid-term elections brought Republicans into power in the Senate and increased the party’s majority in the House. Previous to this election cycle, there were numerous attempts to repeal the ACA in the House, none of which were successful. Although refinements are likely, most experts agree that the law is here to stay. With estimates of over 13 million Americans to be covered through the exchanges in 2015, and with President Obama’s veto power, repeal is highly unlikely. Relying on the political climate in Washington to limit or avoid compliance with ACA requirements would be a foolhardy approach.
That being said, the Supreme Court will hear a case that could have a more significant impact than the mid-term elections. The Court agreed in early November of 2014 to hear a new challenge to the ACA. A decision in King v. Burwell will resolve the question of whether the Internal Revenue Service may extend tax-credit subsidies to coverage purchased through federal exchanges. The plaintiffs in this case challenged the legality of an IRS rule authorizing tax credits for the purchase of health insurance through
the federally-operated exchanges. If the plaintiffs prevail in this case, millions of people receiving subsidies would become ineligible for them, thereby destabilizing the law and, some argue, potentially dooming it. Oral arguments in this case will be heard in the spring with an opinion expected by the end of June. Again, undue reliance on a decision by the Supreme Court to limit or avoid compliance is not advisable.
Although the IRS provided transition relief in 2014, 2015 marks the beginning of the employer mandate for reporting health plan coverage information. Health coverage providers will also begin filing 2015 information returns with the IRS and furnishing statements to individuals to report coverage information in 2016. The IRS released drafts of these forms in July of 2014 to help stakeholders, including employers, tax professionals, and software providers, prepare for the new reporting provisions. Draft instructions relating to the forms were also posted to IRS.gov. If you’re at risk of non-compliance, now is a good time to begin planning your compliance strategy with respect to these new reporting requirements. Information regarding employer reporting requirements can be accessed online1.
THE AFFORDABLE CARE ACT:THE COMPLIANCE LANDSCAPE
30

31
OUR APPROACHRegardless of the results of the 2014 mid-term elections and a potential Supreme Court decision that could further muddy the ACA waters, we are responsibly preparing for its continued implementation and are committed to compliance—both in letter and in spirit.
We will continue to treat our temporary associates as our common law employees with respect to the ACA. While we will treat all temporary associates as our employees for purposes of the ACA, there may be some circumstances where a client would be considered a common law employer or may be otherwise liable under the ACA. If a client usurps all employer responsibilities with respect to a temporary associate, then it may be considered the common law employer. If a client is using a temporary service merely to avoid liability under the ACA, ACA-related liability may be created.
In May of 2014, we rolled out a variety of benefit options for our temporary associates that include a plan to satisfy the ACA’s Minimum Essential Coverage requirements. Our associates who elect to enroll in this option are able to avoid the penalty assessed under the ACA to individuals without Minimum Essential Coverage. In addition, we offer an indemnity-style medical benefit option along with dental and vision coverage. Critical illness, accident, and universal life insurance are also included in our new benefits program. We are committed to maintaining a robust benefit offering for our associates and believe it is a sound business strategy.
Elwood Staffing also evaluated potential coverage options that meet the ACA’s Minimum Value requirements; however, the cost of this level of coverage is currently too high for the employee compared to its benefits. Coupled with the aforementioned government declaration, which states Minimum Value plans that do not offer hospital benefits will be considered non-compliant, we are in a holding pattern with respect to this type of coverage. However, we remain open to this option as we believe that the insurance industry will make adjustments to product offerings that may provide alternative, cost-effective solutions in the future.
Finally, Elwood Staffing is a long-standing member of the American Staffing Association (ASA), the U.S. staffing industry’s national trade organization. As such, and as set forth in the ASA’s Statement of Principles, Elwood Staffing is dedicated to the legal and ethical management of U.S. workers. Elwood Staffing has and will continue to work diligently to help our clients implement legitimate contingent workforce solutions that meet the spirit and intent of the ACA.
1http://www.irs.gov/uac/Questions-and-Answers-on-Information-Reporting-by-Health-Coverage-Providers-Section-6055
The information herein is intended only for general purposes. Nothing contained or expressed herein is intended to or shall be construed as legal advice, and no attorney-client relationship is formed. If you have questions about any law, statute, regulation, or requirement expressly or implicitly referenced, contact legal counsel of your choice.
All information is proprietary and confidential.
DOLLARS AND SENSE | WAGE AND BENEFITS REPORT
This series of annual reports contains wage and benefits data for clerical and production workers in manufacturing, distribution, and oil & gas facilities throughout the U.S. Unlike other resources that report average wages, Dollars and Sense focuses on starting wages. This unique approach allows us to paint a more accurate picture of actual wage offerings, as our data is protected from the influence of accrued wage raises.
RECENT WHITE PAPERS
Becoming an Employer of ChoiceCan You Afford to Pay Minimum Wage?Flexibility: The Art of Bending Without BreakingEmployee Retention: When Traditional Benefits Aren’t EnoughBenefits 2014: Standing out in a Candidate’s MarketA Ticking Time-Bomb, No More: Executive-Sponsored Mentorships Can Help Your CompanyEmployee Engagement: The Antidote to Turnover
To request additional copies of this report or any resource listed above, please contact [email protected]
32
For this and more workforce intelligence, visit the BUSINESS RESOURCE CENTER at www.elwoodstaffing.com.


CORPORATE HEADQUARTERS 4111 Central AvenueColumbus, IN 47203
812.372.6200


![2015 Talent-Spot General Company Intro 060116 [Repaired]](https://img.pdfslide.us/doc/110x75/58a75d691a28ab217e8b53e7/2015-talent-spot-general-company-intro-060116-repaired.jpg)