Embed Size (px)
Citation preview

2015 CALIFORNIA ECONOMIC & MARKET OUTLOOK
March 11, 2015Palm Springs AOR
Leslie Appleton-Young, Chief Economist
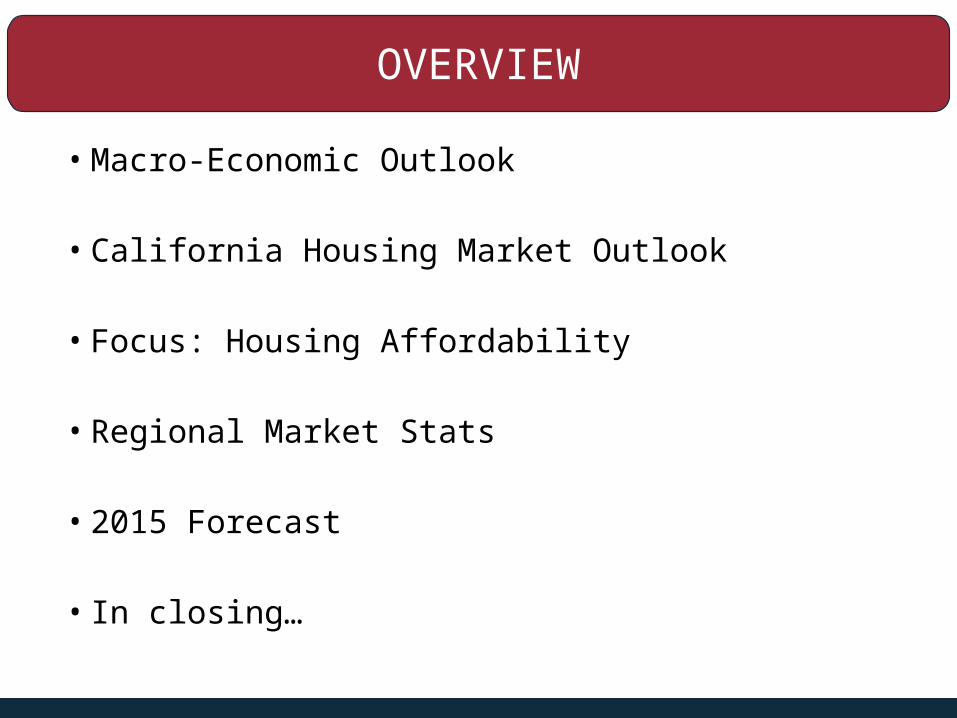
OVERVIEW
• Macro-Economic Outlook
• California Housing Market Outlook
• Focus: Housing Affordability
• Regional Market Stats
• 2015 Forecast
• In closing…

ECONOMIC OUTLOOK
2005
2007
2009
2011
2013
Q2-10
Q4-10
Q2-11
Q4-11
Q2-12
Q4-12
Q2-13
Q4-13
Q2-14
Q4-14
-4%
-3%
-2%
-1%
0%
1%
2%
3%
4%
5%
6%
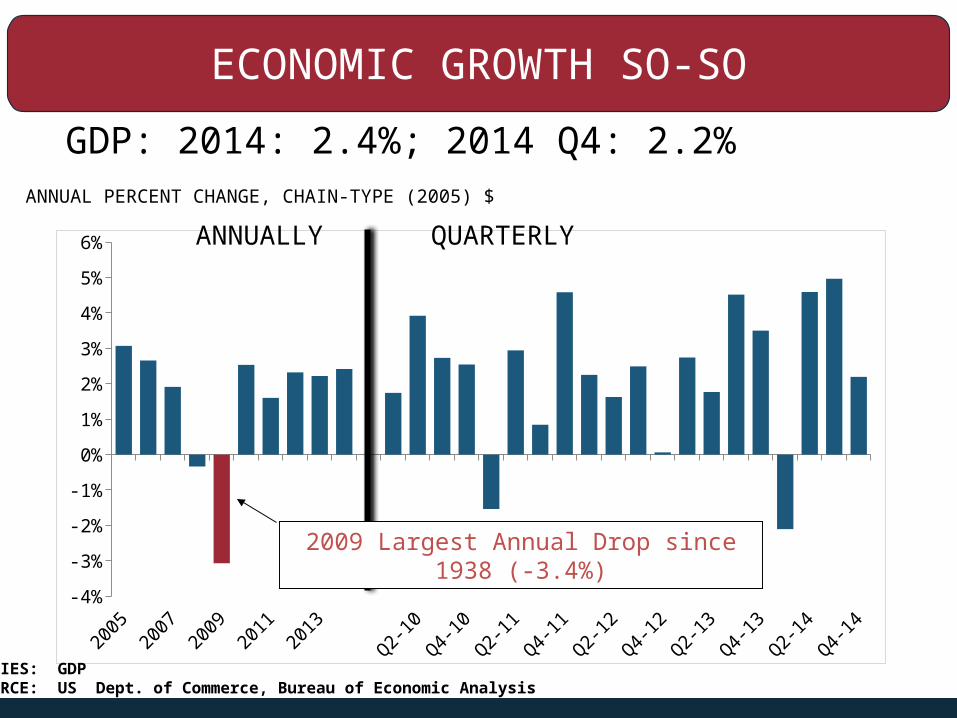
ECONOMIC GROWTH SO-SO
GDP: 2014: 2.4%; 2014 Q4: 2.2% ANNUAL PERCENT CHANGE, CHAIN-TYPE (2005) $
ANNUALLY QUARTERLY
2009 Largest Annual Drop since 1938 (-3.4%)
SERIES: GDPSOURCE: US Dept. of Commerce, Bureau of Economic Analysis
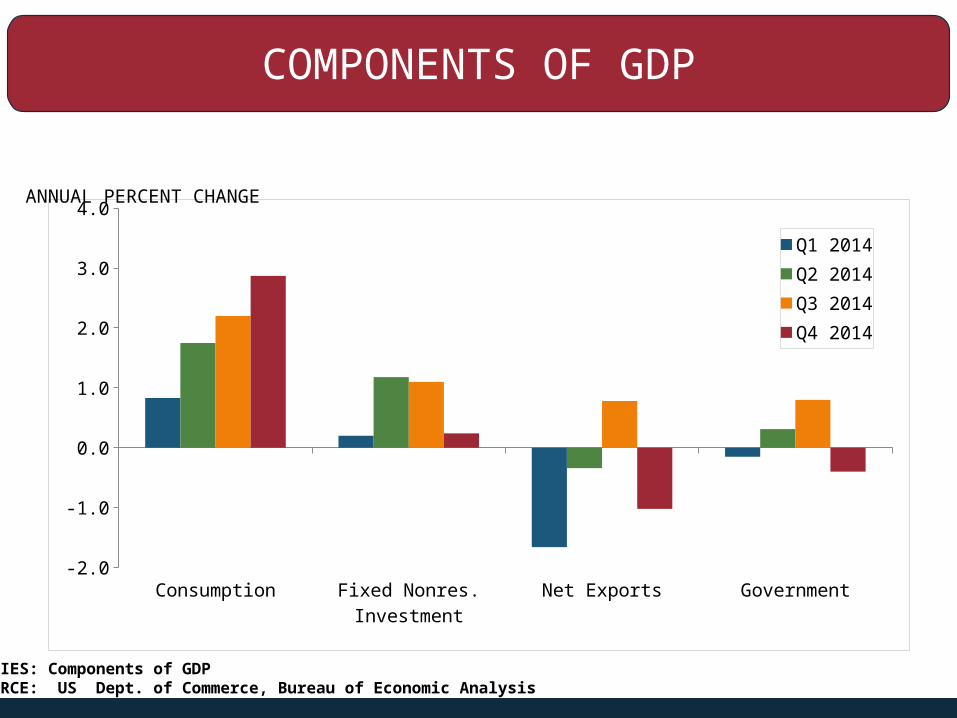
SERIES: Components of GDPSOURCE: US Dept. of Commerce, Bureau of Economic Analysis
COMPONENTS OF GDP
Consumption Fixed Nonres. Investment
Net Exports Government-2.0
-1.0
0.0
1.0
2.0
3.0
4.0
Q1 2014
Q2 2014
ANNUAL PERCENT CHANGE
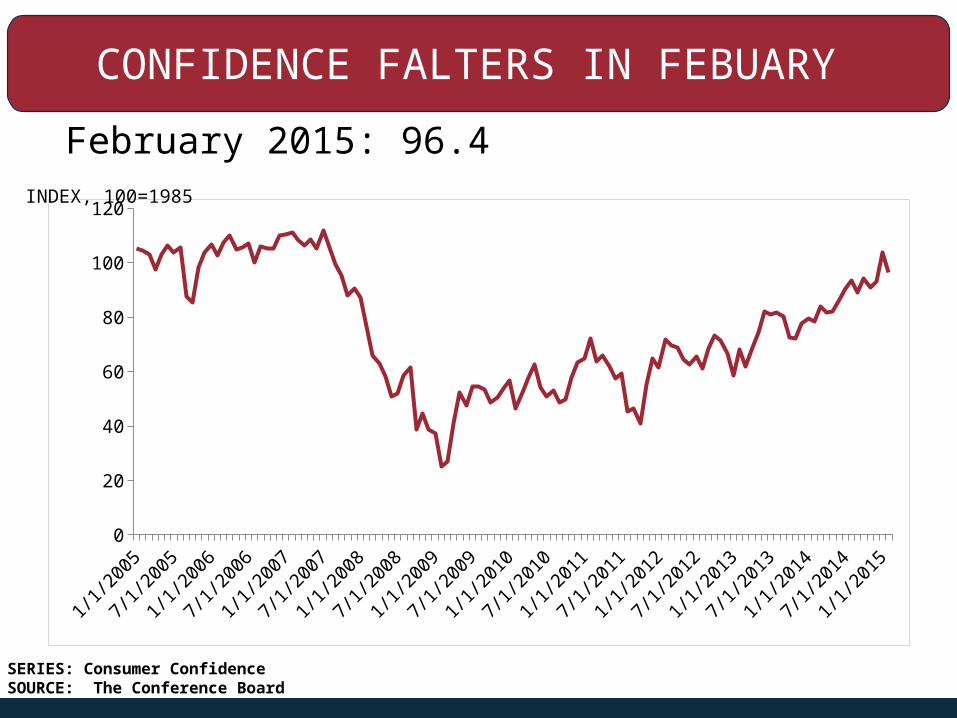
CONFIDENCE FALTERS IN FEBUARY
February 2015: 96.4
Jan-
05
Jul-0
5
Jan-
06
Jul-0
6
Jan-
07
Jul-0
7
Jan-
08
Jul-0
8
Jan-
09
Jul-0
9
Jan-
10
Jul-1
0
Jan-
11
Jul-1
1
Jan-
12
Jul-1
2
Jan-
13
Jul-1
3
Jan-
14
Jul-1
4
Jan-
150
20
40
60
80
100
120INDEX, 100=1985
SERIES: Consumer ConfidenceSOURCE: The Conference Board
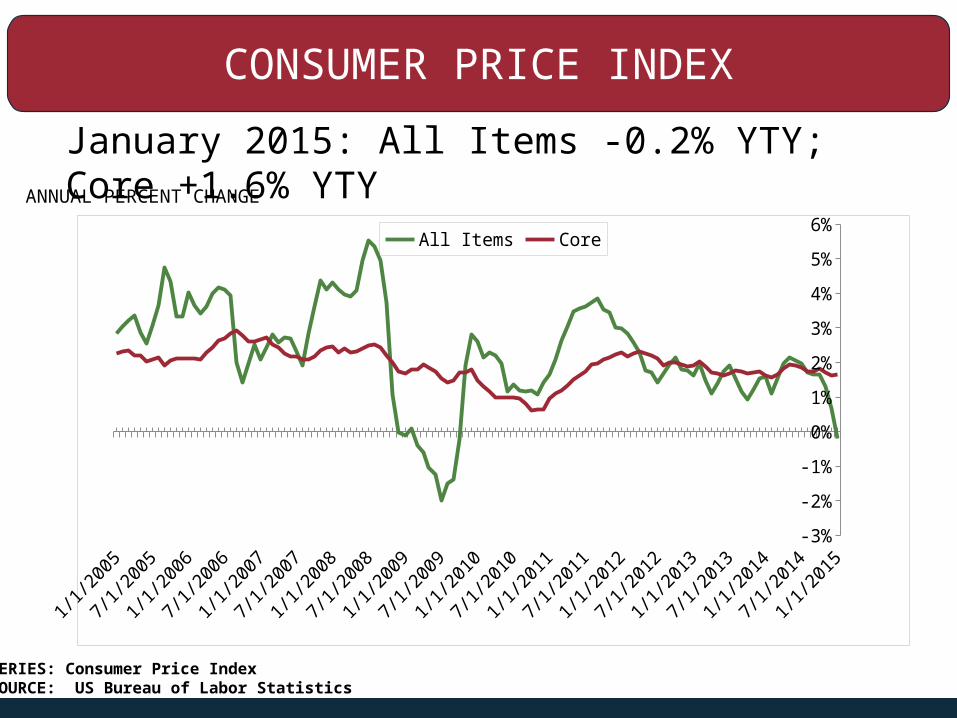
CONSUMER PRICE INDEX
January 2015: All Items -0.2% YTY; Core +1.6% YTY
Jan-
05
Jul-0
5
Jan-
06
Jul-0
6
Jan-
07
Jul-0
7
Jan-
08
Jul-0
8
Jan-
09
Jul-0
9
Jan-
10
Jul-1
0
Jan-
11
Jul-1
1
Jan-
12
Jul-1
2
Jan-
13
Jul-1
3
Jan-
14
Jul-1
4
Jan-
15-3%
-2%
-1%
0%
1%
2%
3%
4%
5%
6% All Items Core
ANNUAL PERCENT CHANGE
SERIES: Consumer Price IndexSOURCE: US Bureau of Labor Statistics
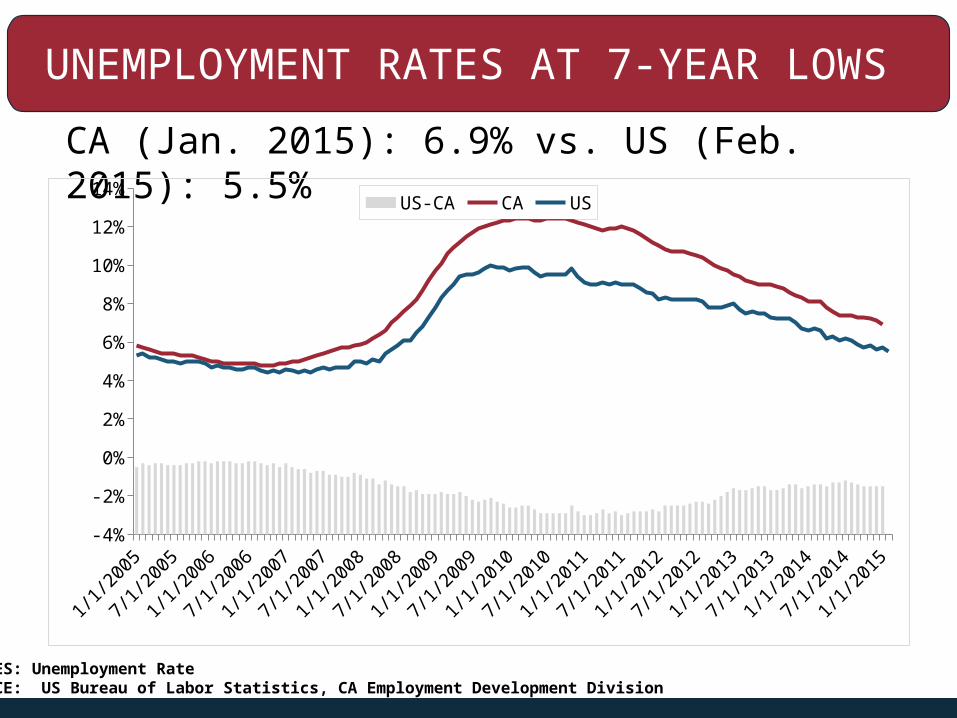
UNEMPLOYMENT RATES AT 7-YEAR LOWS
CA (Jan. 2015): 6.9% vs. US (Feb. 2015): 5.5%
Jan-
05
Jul-0
5
Jan-
06
Jul-0
6
Jan-
07
Jul-0
7
Jan-
08
Jul-0
8
Jan-
09
Jul-0
9
Jan-
10
Jul-1
0
Jan-
11
Jul-1
1
Jan-
12
Jul-1
2
Jan-
13
Jul-1
3
Jan-
14
Jul-1
4
Jan-
15-4%
-2%
0%
2%
4%
6%
8%
10%
12%
14% US-CA CA US
SERIES: Unemployment RateSOURCE: US Bureau of Labor Statistics, CA Employment Development Division
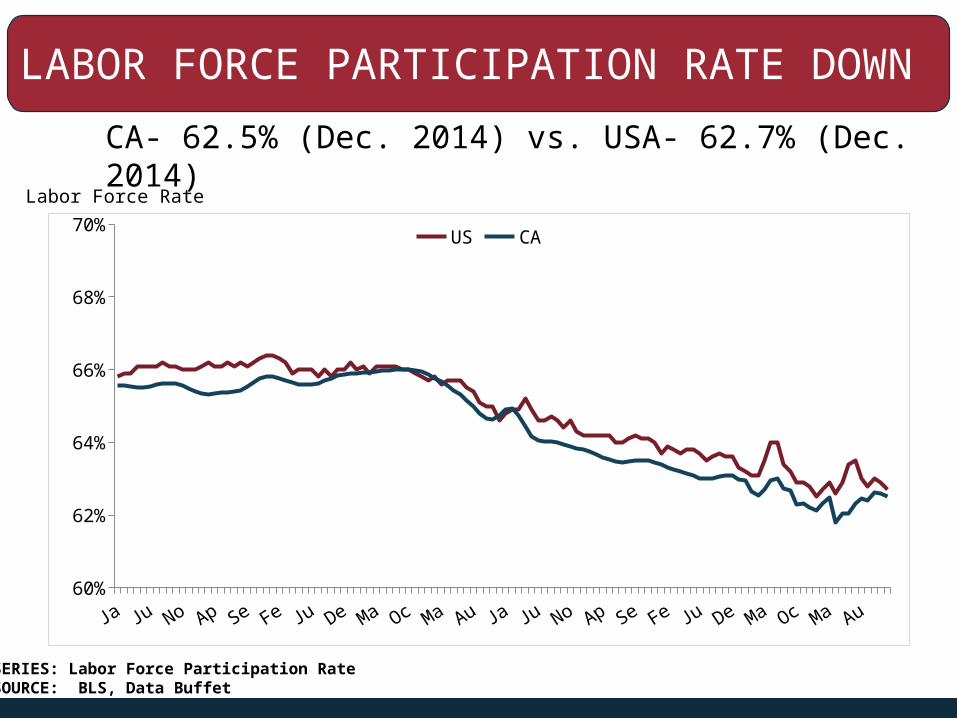
LABOR FORCE PARTICIPATION RATE DOWN
CA- 62.5% (Dec. 2014) vs. USA- 62.7% (Dec. 2014)
60%
62%
64%
66%
68%
70% US CA
Labor Force Rate
SERIES: Labor Force Participation RateSOURCE: BLS, Data Buffet
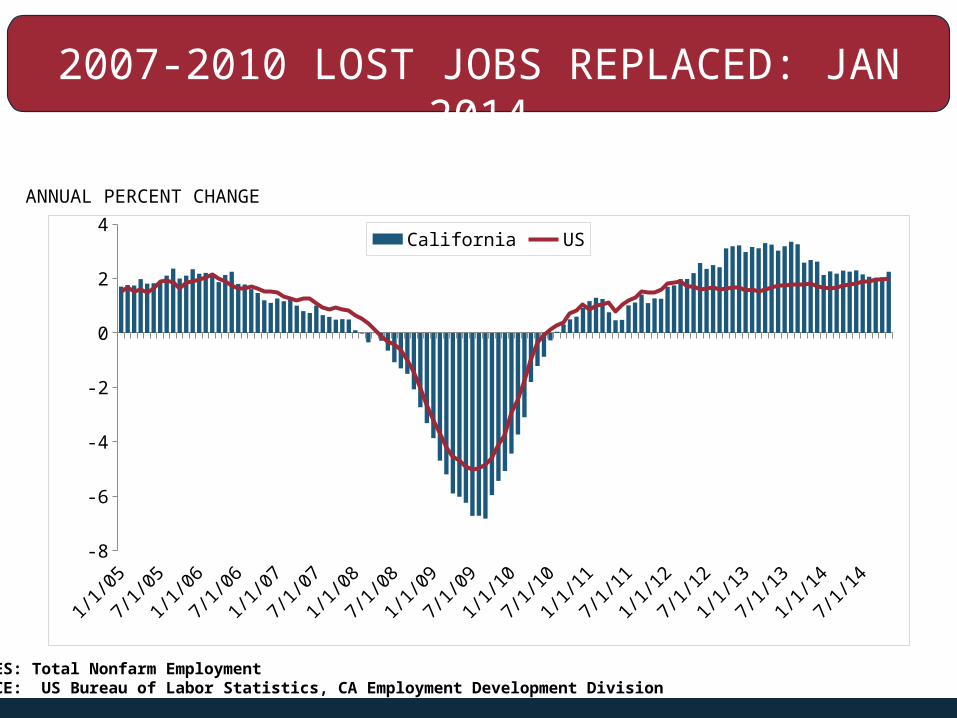
2007-2010 LOST JOBS REPLACED: JAN 2014
Jan-
05
Jul-0
5
Jan-
06
Jul-0
6
Jan-
07
Jul-0
7
Jan-
08
Jul-0
8
Jan-
09
Jul-0
9
Jan-
10
Jul-1
0
Jan-
11
Jul-1
1
Jan-
12
Jul-1
2
Jan-
13
Jul-1
3
Jan-
14
Jul-1
4-8
-6
-4
-2
0
2
4 California US
ANNUAL PERCENT CHANGE
SERIES: Total Nonfarm EmploymentSOURCE: US Bureau of Labor Statistics, CA Employment Development Division
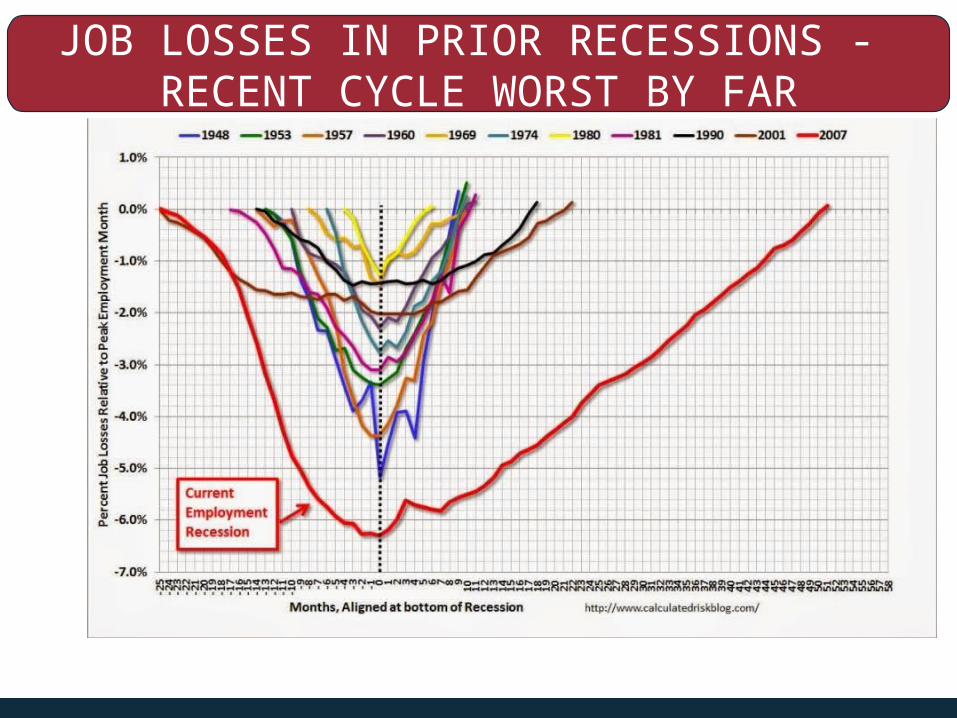
JOB LOSSES IN PRIOR RECESSIONS - RECENT CYCLE WORST BY FAR
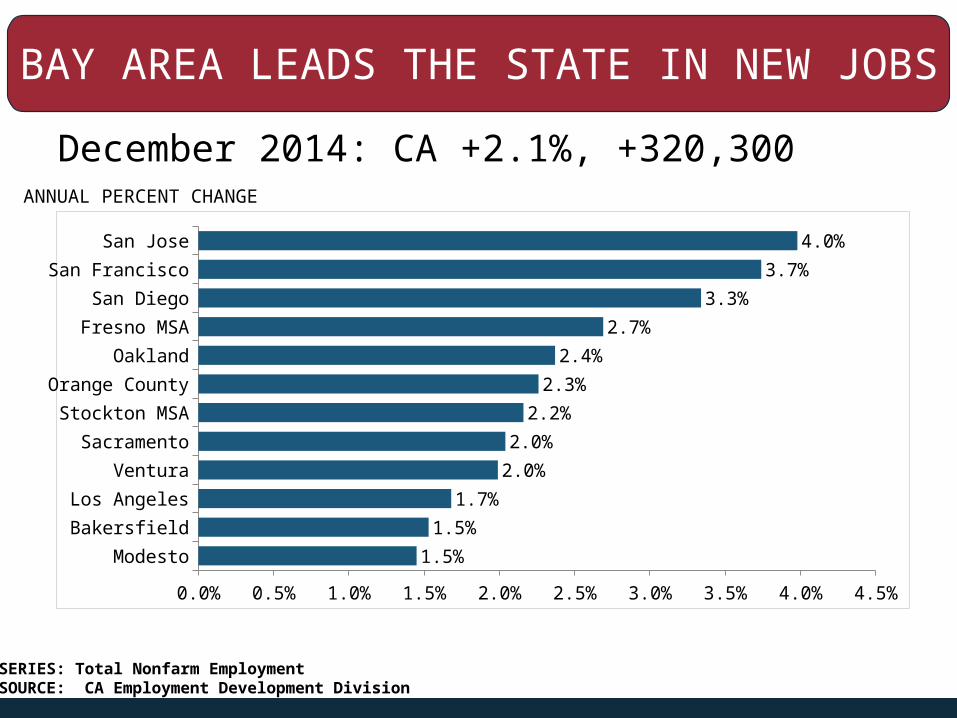
BAY AREA LEADS THE STATE IN NEW JOBS
Modesto
Los Angeles
Sacramento
Orange County
Fresno MSA
San Francisco
0.0% 0.5% 1.0% 1.5% 2.0% 2.5% 3.0% 3.5% 4.0% 4.5%
1.5%
1.5%
1.7%
2.0%
2.0%
2.2%
2.3%
2.4%
2.7%
3.3%
3.7%
4.0%
SERIES: Total Nonfarm Employment SOURCE: CA Employment Development Division
ANNUAL PERCENT CHANGE
December 2014: CA +2.1%, +320,300
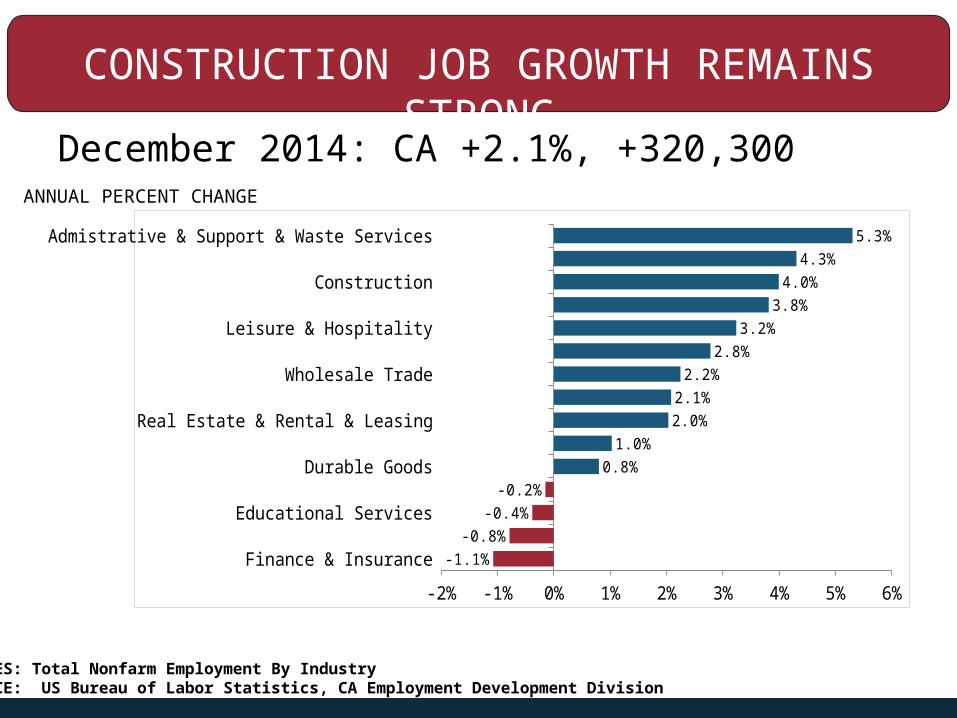
CONSTRUCTION JOB GROWTH REMAINS STRONG
Finance & InsuranceNondurable Goods
Educational ServicesGovernment
Durable GoodsRetail Trade
Real Estate & Rental & LeasingTransportation, Warehousing & Utilities
Wholesale TradeInformation
Leisure & HospitalityHealth Care & Social Assistance
ConstructionProfessional, Scientific & Technical Services
Admistrative & Support & Waste Services
-2% -1% 0% 1% 2% 3% 4% 5% 6%
-1.1%-0.8%
-0.4%-0.2%
0.8%1.0%
2.0%2.1%
2.2%2.8%
3.2%3.8%
4.0%4.3%
5.3%
SERIES: Total Nonfarm Employment By IndustrySOURCE: US Bureau of Labor Statistics, CA Employment Development Division
December 2014: CA +2.1%, +320,300ANNUAL PERCENT CHANGE
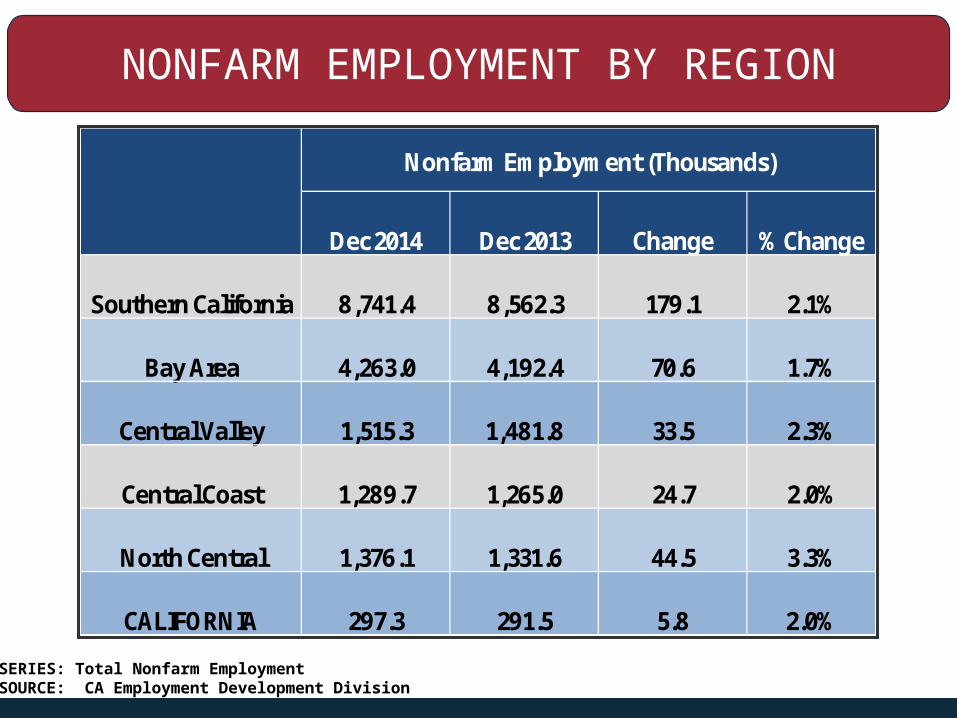
NONFARM EMPLOYMENT BY REGION
Dec 2014 Dec 2013 Change % Change
Southern California 8,741.4 8,562.3 179.1 2.1%
Bay Area 4,263.0 4,192.4 70.6 1.7%
Central Valley 1,515.3 1,481.8 33.5 2.3%
Central Coast 1,289.7 1,265.0 24.7 2.0%
North Central 1,376.1 1,331.6 44.5 3.3%
CALIFORNIA 297.3 291.5 5.8 2.0%
Nonfarm Employment (Thousands)
SERIES: Total Nonfarm EmploymentSOURCE: CA Employment Development Division
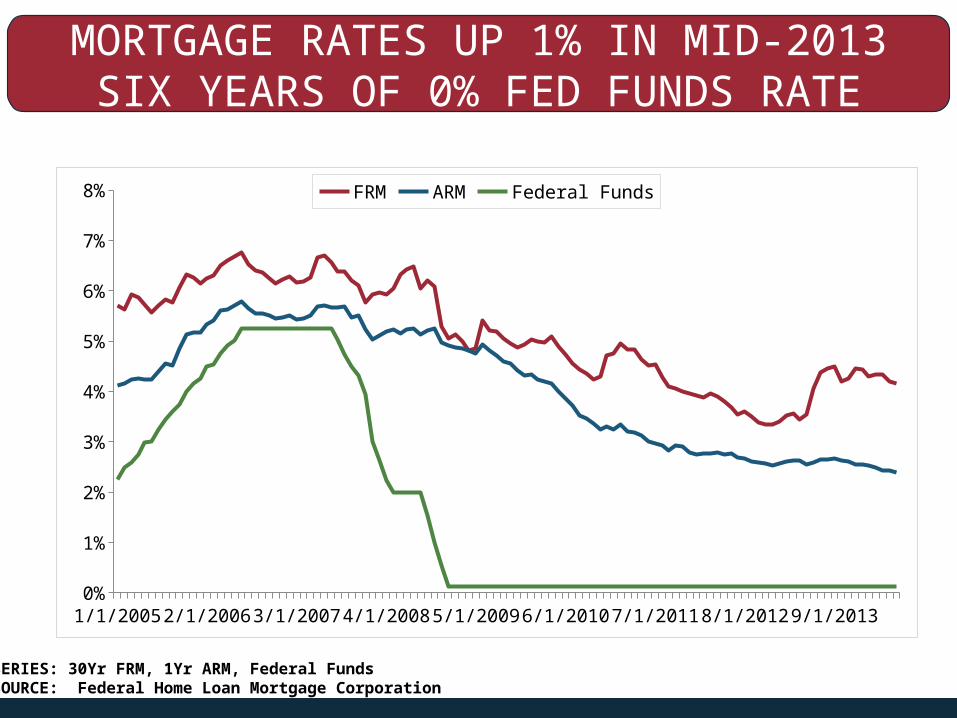
MORTGAGE RATES UP 1% IN MID-2013SIX YEARS OF 0% FED FUNDS RATE
Jan-05 Dec-05 Nov-06 Oct-07 Sep-08 Aug-09 Jul-10 Jun-11 May-12 Apr-13 Mar-140%
1%
2%
3%
4%
5%
6%
7%
8% FRM ARM Federal Funds
SERIES: 30Yr FRM, 1Yr ARM, Federal FundsSOURCE: Federal Home Loan Mortgage Corporation
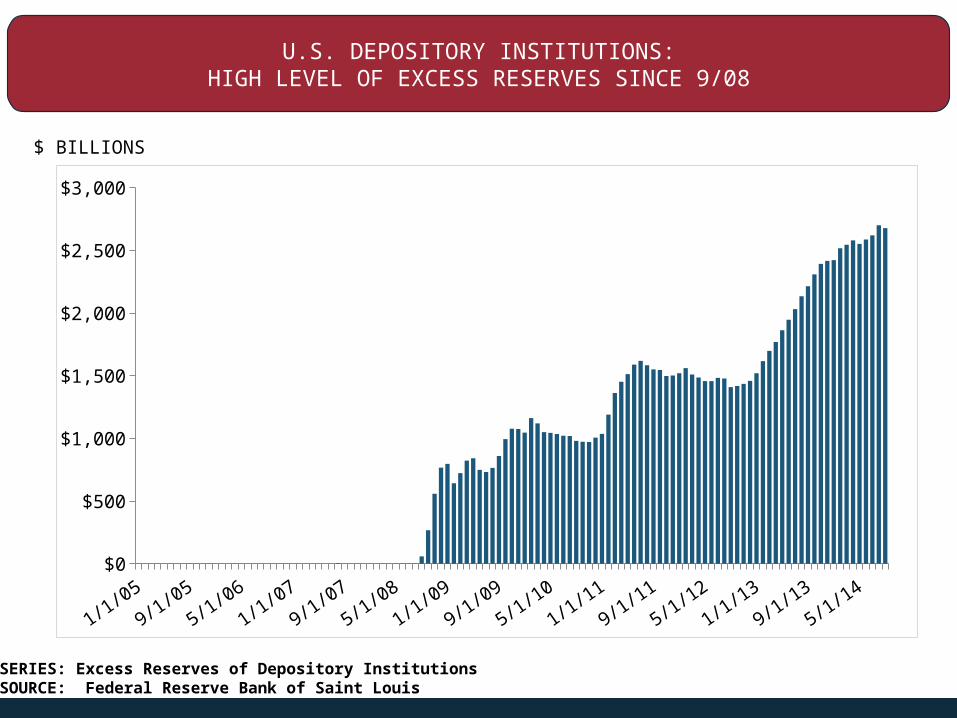
U.S. DEPOSITORY INSTITUTIONS:HIGH LEVEL OF EXCESS RESERVES SINCE 9/08
Jan-05Jul-0
5
Jan-06Jul-0
6
Jan-07Jul-0
7
Jan-08Jul-0
8
Jan-09Jul-0
9
Jan-10Jul-1
0
Jan-11Jul-1
1
Jan-12Jul-1
2
Jan-13Jul-1
3
Jan-14Jul-1
4$0
$500
$1,000
$1,500
$2,000
$2,500
$3,000
SERIES: Excess Reserves of Depository Institutions SOURCE: Federal Reserve Bank of Saint Louis
$ BILLIONS
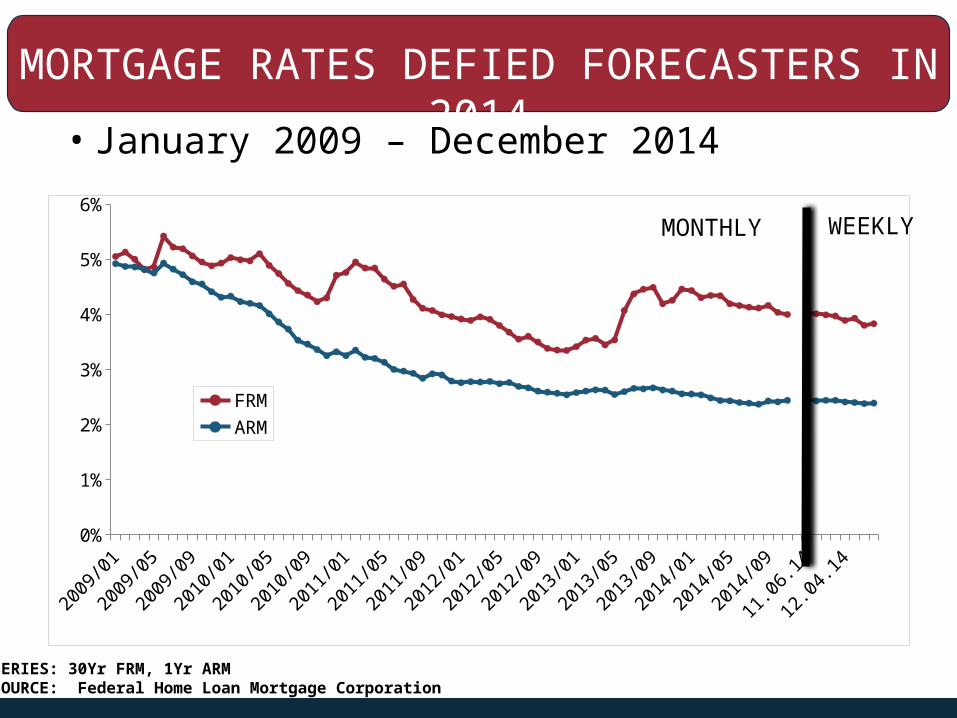
MORTGAGE RATES DEFIED FORECASTERS IN 2014
• January 2009 – December 2014
2009
/01
2009
/05
2009
/09
2010
/01
2010
/05
2010
/09
2011
/01
2011
/05
2011
/09
2012
/01
2012
/05
2012
/09
2013
/01
2013
/05
2013
/09
2014
/01
2014
/05
2014
/09
11.0
6.14
12.0
4.14
0%
1%
2%
3%
4%
5%
6%
FRMARM
MONTHLY WEEKLY
SERIES: 30Yr FRM, 1Yr ARMSOURCE: Federal Home Loan Mortgage Corporation
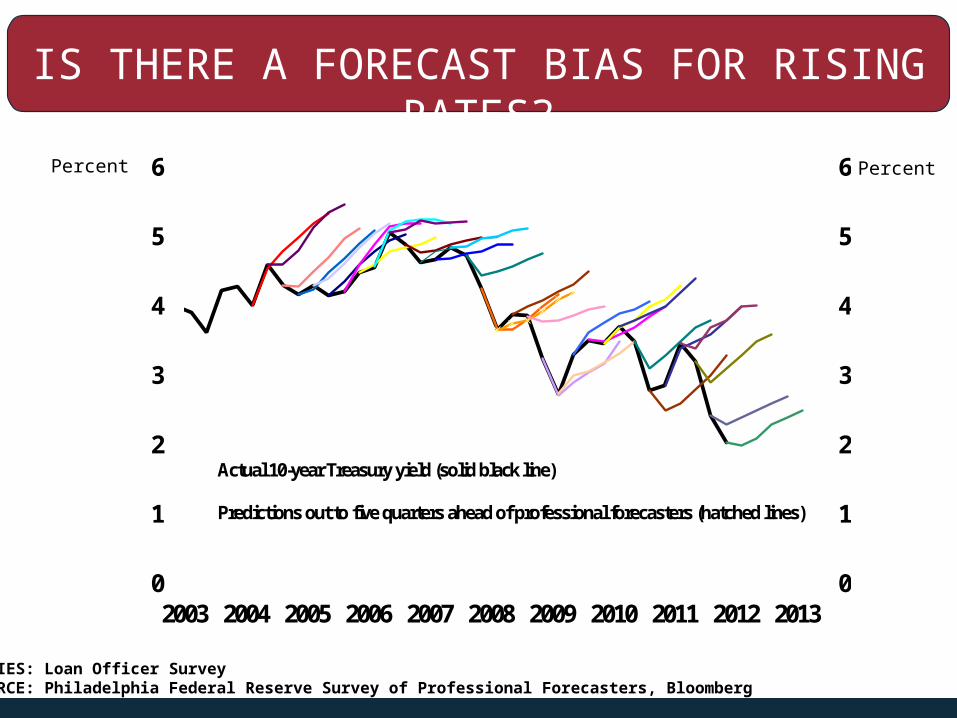
IS THERE A FORECAST BIAS FOR RISING RATES?
Percent
0
1
2
3
4
5
6
0
1
2
3
4
5
6
2003 2004 2005 2006 2007 2008 2009 2010 2011 2012 2013
Actual 10-year Treasury yield (solid black line)
Predictions out to five quarters ahead of professional forecasters (hatched lines)
Percent
SERIES: Loan Officer SurveySOURCE: Philadelphia Federal Reserve Survey of Professional Forecasters, Bloomberg
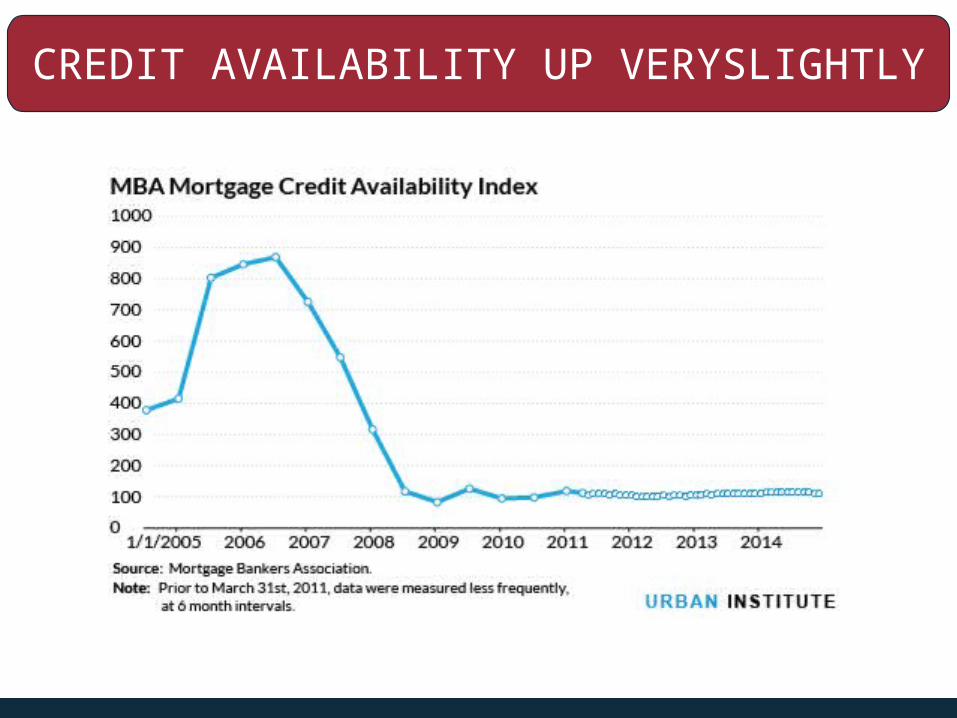
CREDIT AVAILABILITY UP VERYSLIGHTLY

CALIFORNIA HOUSING MARKET OUTLOOK
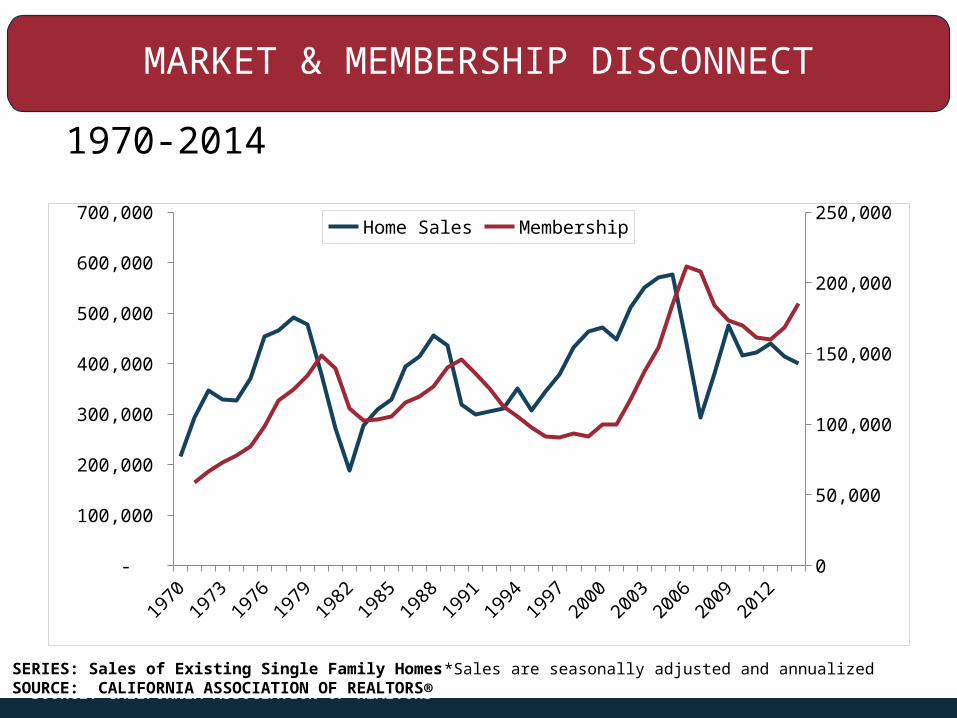
MARKET & MEMBERSHIP DISCONNECT
1970-2014
SOURCE: CALIFORNIA ASSOCIATION OF REALTORS®
1970
1973
1976
1979
1982
1985
1988
1991
1994
1997
2000
2003
2006
2009
2012
-
100,000
200,000
300,000
400,000
500,000
600,000
700,000
0
50,000
100,000
150,000
200,000
250,000Home Sales Membership
*Sales are seasonally adjusted and annualized SERIES: Sales of Existing Single Family HomesSOURCE: CALIFORNIA ASSOCIATION OF REALTORS®
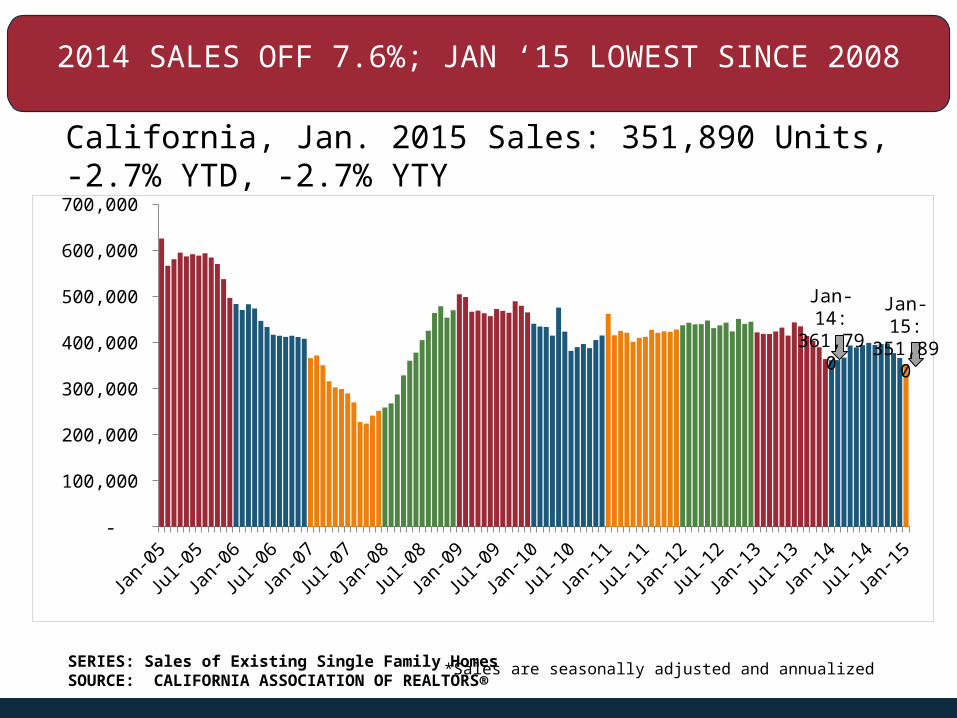
2014 SALES OFF 7.6%; JAN ‘15 LOWEST SINCE 2008
California, Jan. 2015 Sales: 351,890 Units, -2.7% YTD, -2.7% YTY
Jan-
05
Jul-0
5
Jan-
06
Jul-0
6
Jan-
07
Jul-0
7
Jan-
08
Jul-0
8
Jan-
09
Jul-0
9
Jan-
10
Jul-1
0
Jan-
11
Jul-1
1
Jan-
12
Jul-1
2
Jan-
13
Jul-1
3
Jan-
14
Jul-1
4
Jan-
15 -
100,000
200,000
300,000
400,000
500,000
600,000
700,000
*Sales are seasonally adjusted and annualized SERIES: Sales of Existing Single Family HomesSOURCE: CALIFORNIA ASSOCIATION OF REALTORS®
Jan-15: 351,89
0
Jan-14: 361,79
0
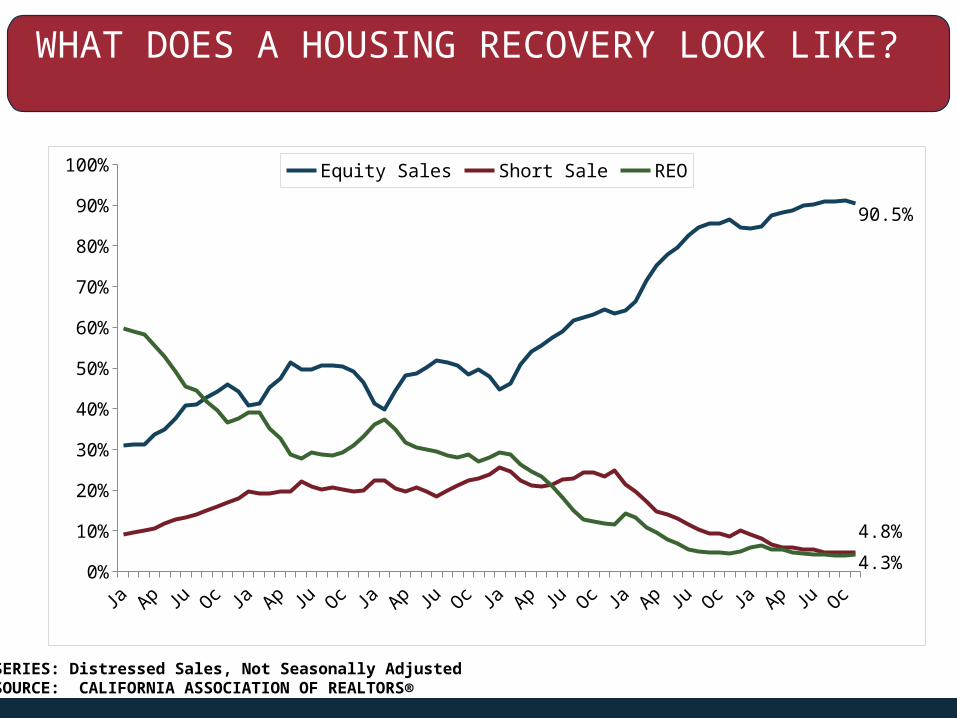
WHAT DOES A HOUSING RECOVERY LOOK LIKE?
Jan-
09
Apr-0
9
Jul-0
9
Oct-0
9
Jan-
10
Apr-1
0
Jul-1
0
Oct-1
0
Jan-
11
Apr-1
1
Jul-1
1
Oct-1
1
Jan-
12
Apr-1
2
Jul-1
2
Oct-1
2
Jan-
13
Apr-1
3
Jul-1
3
Oct-1
3
Jan-
14
Apr-1
4
Jul-1
4
Oct-1
40%
10%
20%
30%
40%
50%
60%
70%
80%
90%
100%
90.5%
4.8%
4.3%
Equity Sales Short Sale REO
SERIES: Distressed Sales, Not Seasonally AdjustedSOURCE: CALIFORNIA ASSOCIATION OF REALTORS®
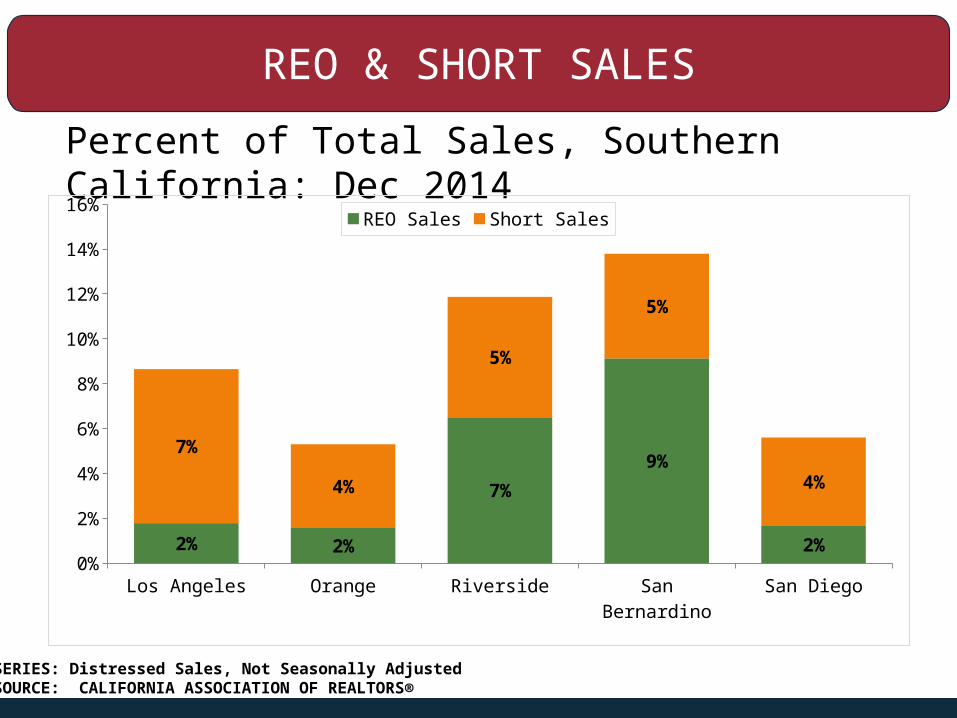
REO & SHORT SALES
Percent of Total Sales, Southern California: Dec 2014
Los Angeles Orange Riverside San Bernardino
San Diego0%
2%
4%
6%
8%
10%
12%
14%
16%
2% 2%
7%
9%
2%
7%
4%
5%
5%
4%
REO Sales Short Sales
SERIES: Distressed Sales, Not Seasonally AdjustedSOURCE: CALIFORNIA ASSOCIATION OF REALTORS®
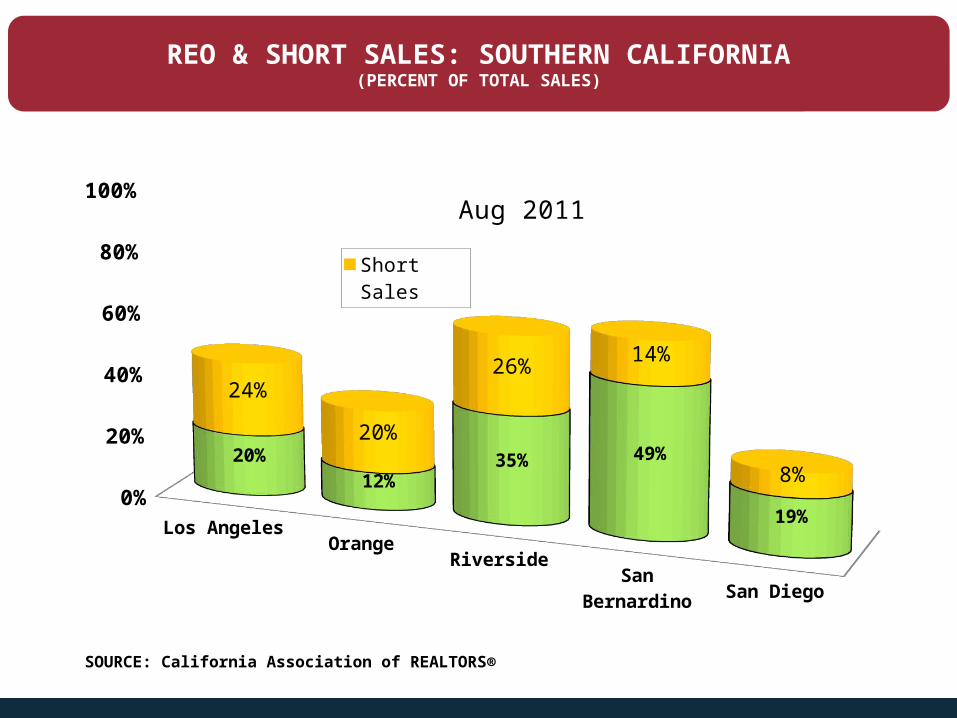
SOURCE: California Association of REALTORS®
REO & SHORT SALES: SOUTHERN CALIFORNIA(PERCENT OF TOTAL SALES)
Los AngelesOrange
RiversideSan
Bernardino San Diego
0%
20%
40%
60%
80%
100%
20%12%
35% 49%
19%
24%
20%
26%14%
8%
Aug 2011
Short SalesREO Sales
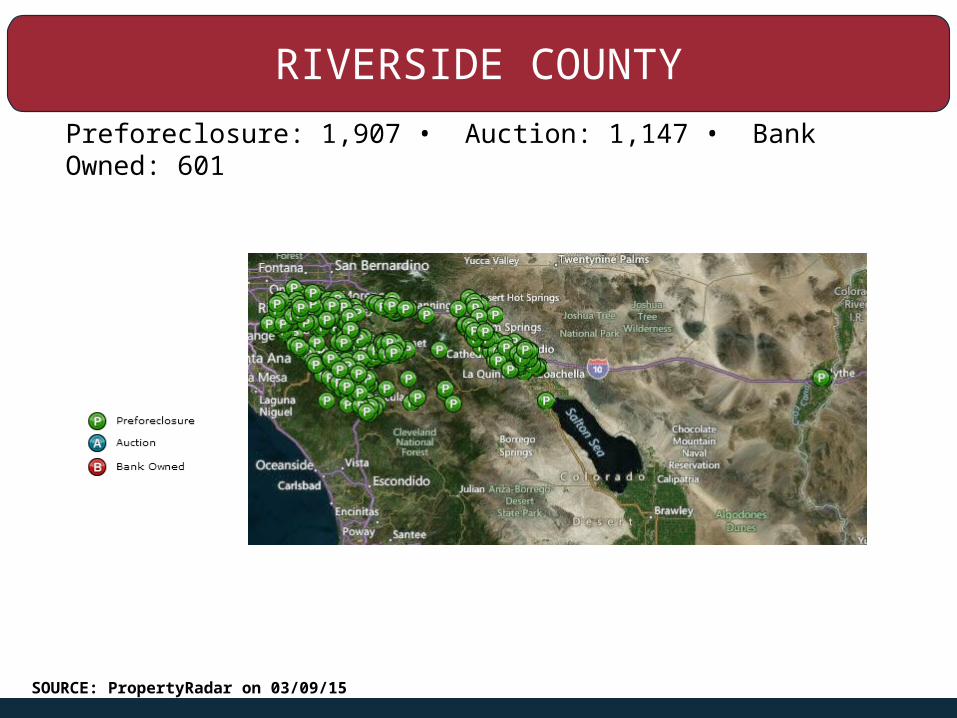
RIVERSIDE COUNTY
Preforeclosure: 1,907 • Auction: 1,147 • Bank Owned: 601
SOURCE: PropertyRadar on 03/09/15
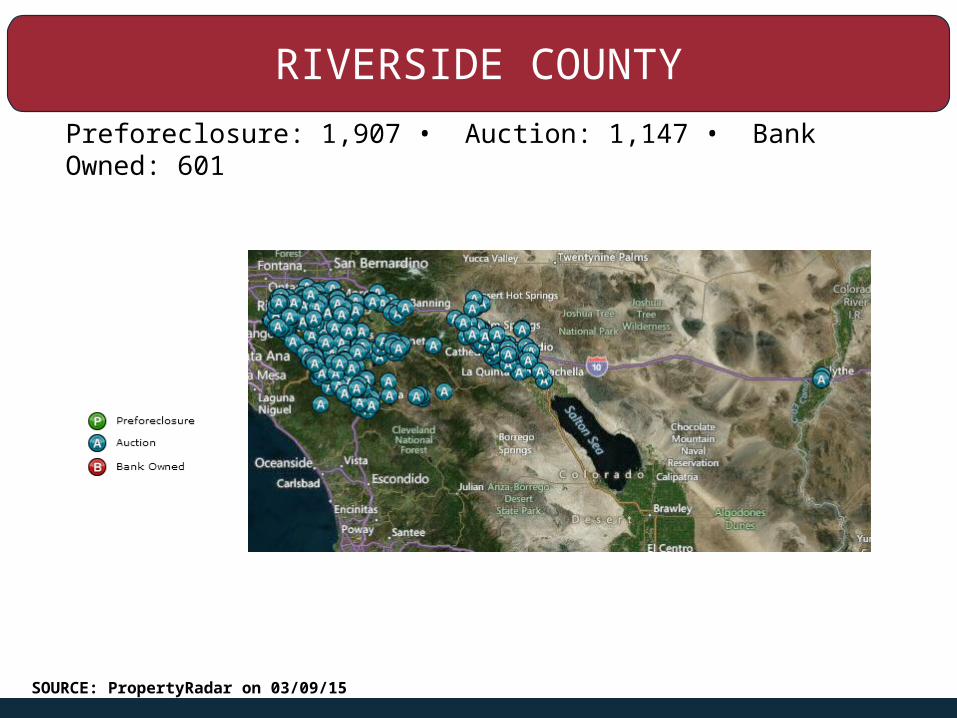
RIVERSIDE COUNTY
Preforeclosure: 1,907 • Auction: 1,147 • Bank Owned: 601
SOURCE: PropertyRadar on 03/09/15
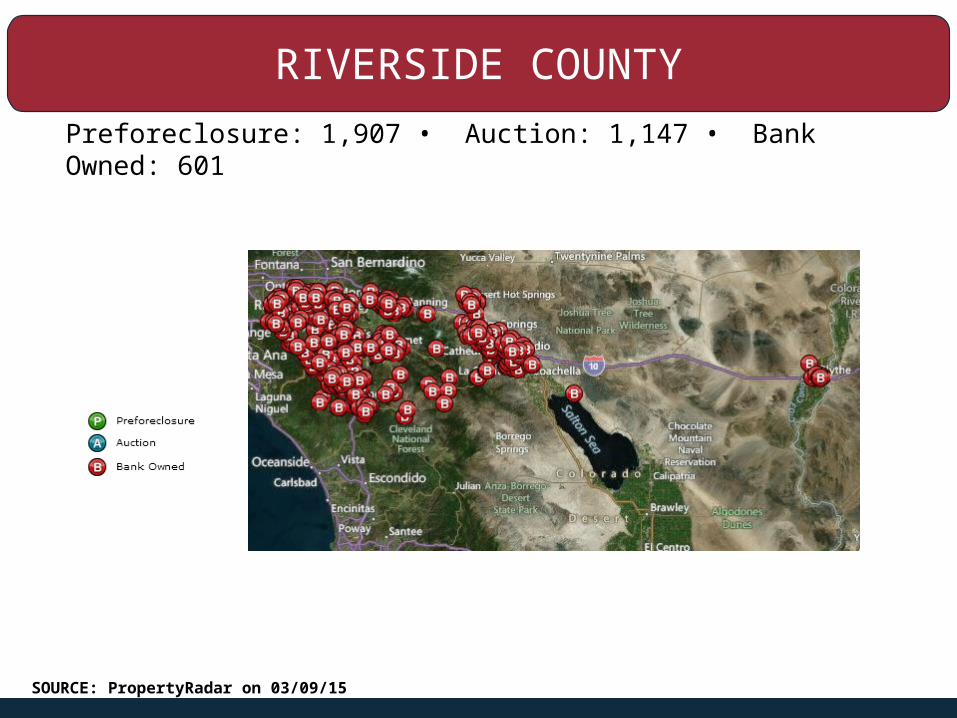
RIVERSIDE COUNTY
Preforeclosure: 1,907 • Auction: 1,147 • Bank Owned: 601
SOURCE: PropertyRadar on 03/09/15
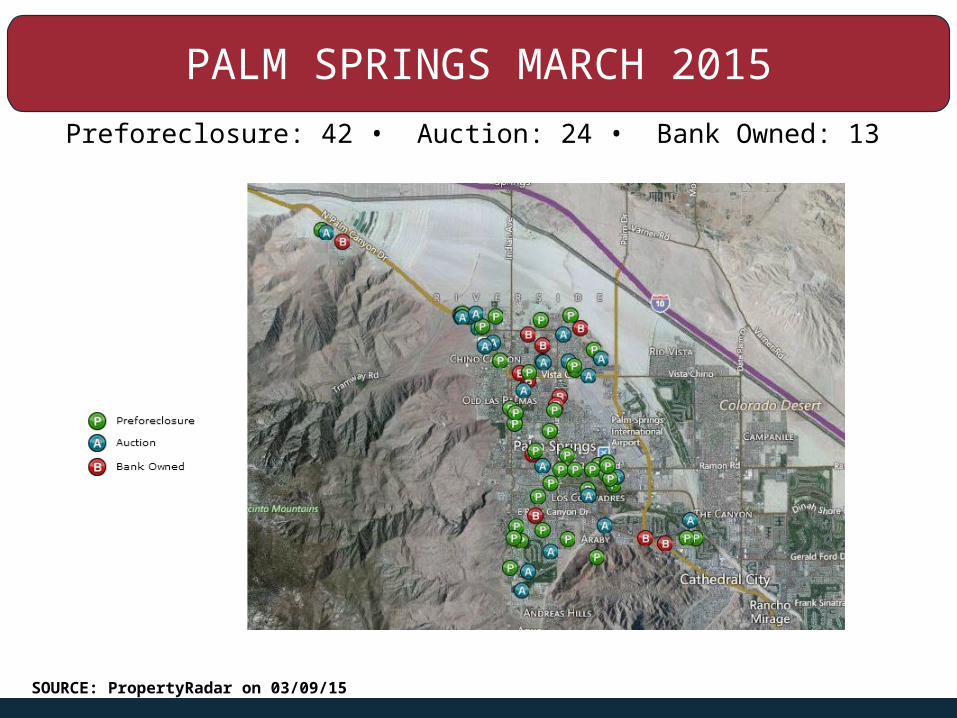
PALM SPRINGS MARCH 2015
Preforeclosure: 42 • Auction: 24 • Bank Owned: 13
SOURCE: PropertyRadar on 03/09/15
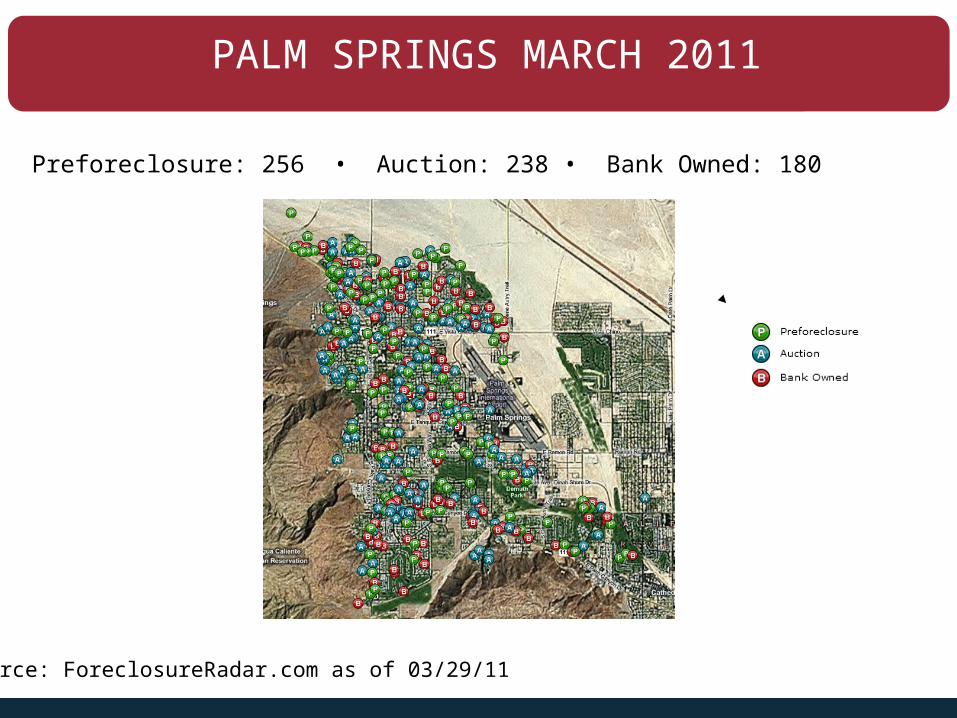
PALM SPRINGS MARCH 2011
Source: ForeclosureRadar.com as of 03/29/11
Preforeclosure: 256 • Auction: 238 • Bank Owned: 180
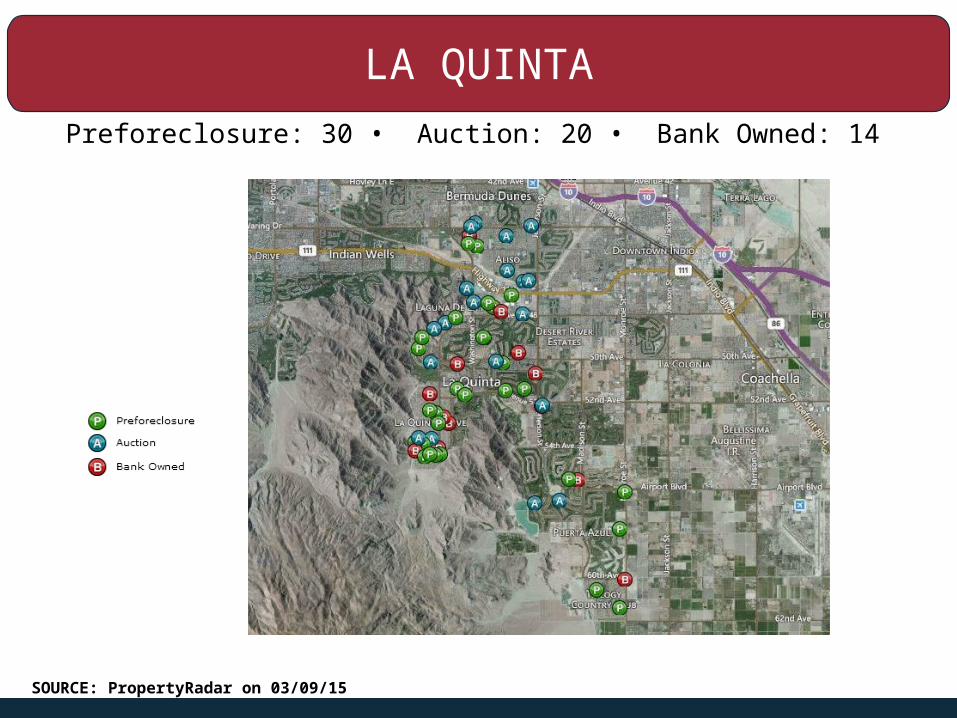
LA QUINTA
Preforeclosure: 30 • Auction: 20 • Bank Owned: 14
SOURCE: PropertyRadar on 03/09/15
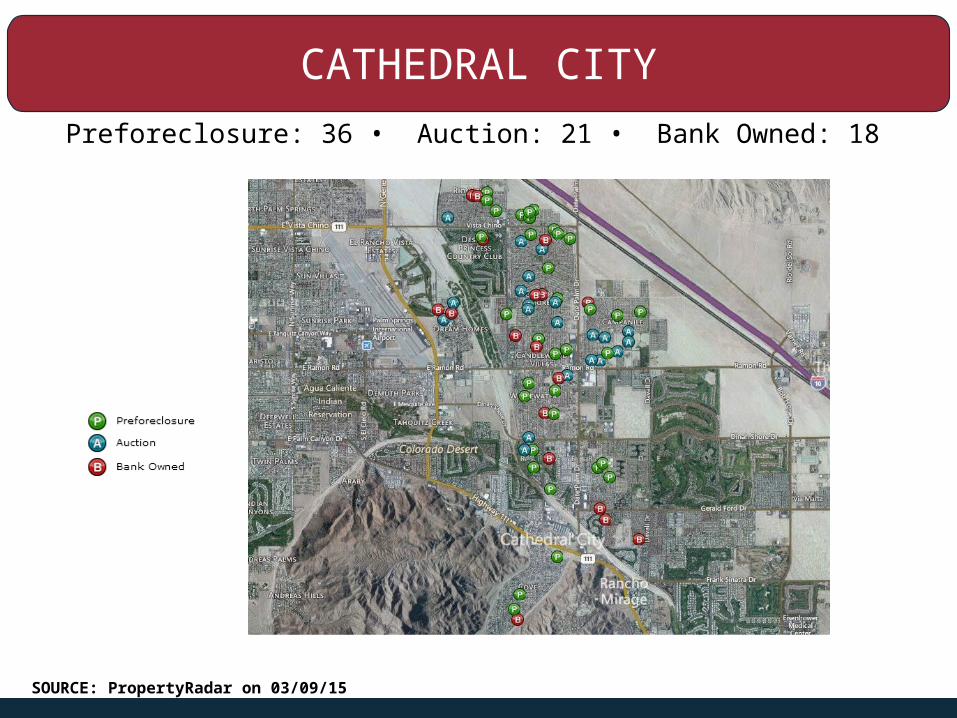
CATHEDRAL CITY
Preforeclosure: 36 • Auction: 21 • Bank Owned: 18
SOURCE: PropertyRadar on 03/09/15
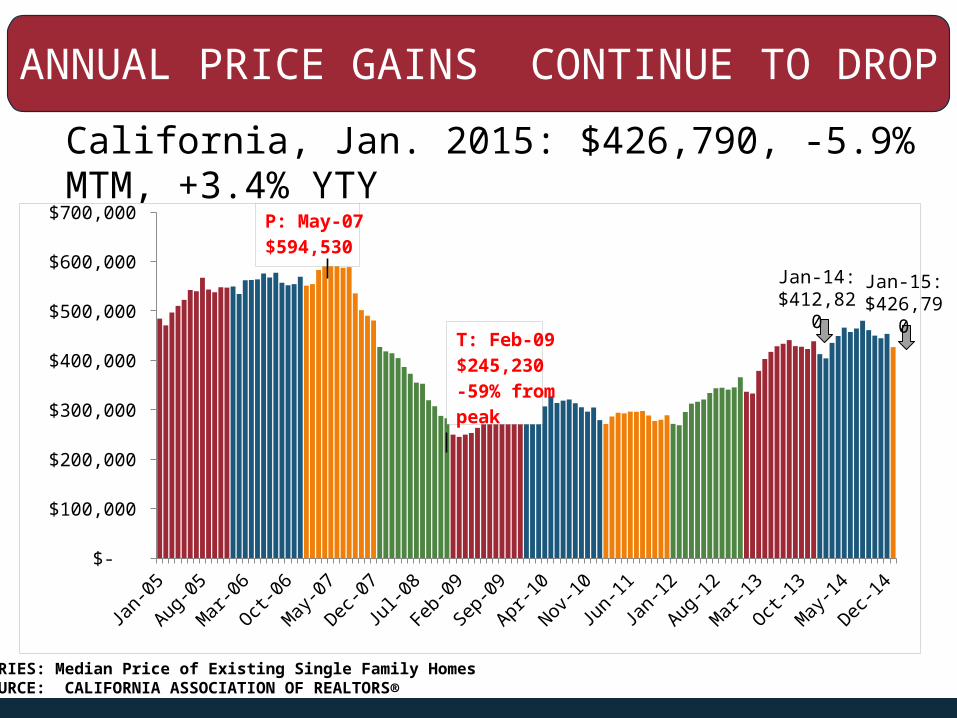
ANNUAL PRICE GAINS CONTINUE TO DROP
California, Jan. 2015: $426,790, -5.9% MTM, +3.4% YTY
Jan-
05
Jul-0
5
Jan-
06
Jul-0
6
Jan-
07
Jul-0
7
Jan-
08
Jul-0
8
Jan-
09
Jul-0
9
Jan-
10
Jul-1
0
Jan-
11
Jul-1
1
Jan-
12
Jul-1
2
Jan-
13
Jul-1
3
Jan-
14
Jul-1
4
Jan-
15 $-
$100,000
$200,000
$300,000
$400,000
$500,000
$600,000
$700,000 P: May-07$594,530
T: Feb-09$245,230-59% frompeak
SERIES: Median Price of Existing Single Family HomesSOURCE: CALIFORNIA ASSOCIATION OF REALTORS®
Jan-15: $426,79
0
Jan-14: $412,82
0
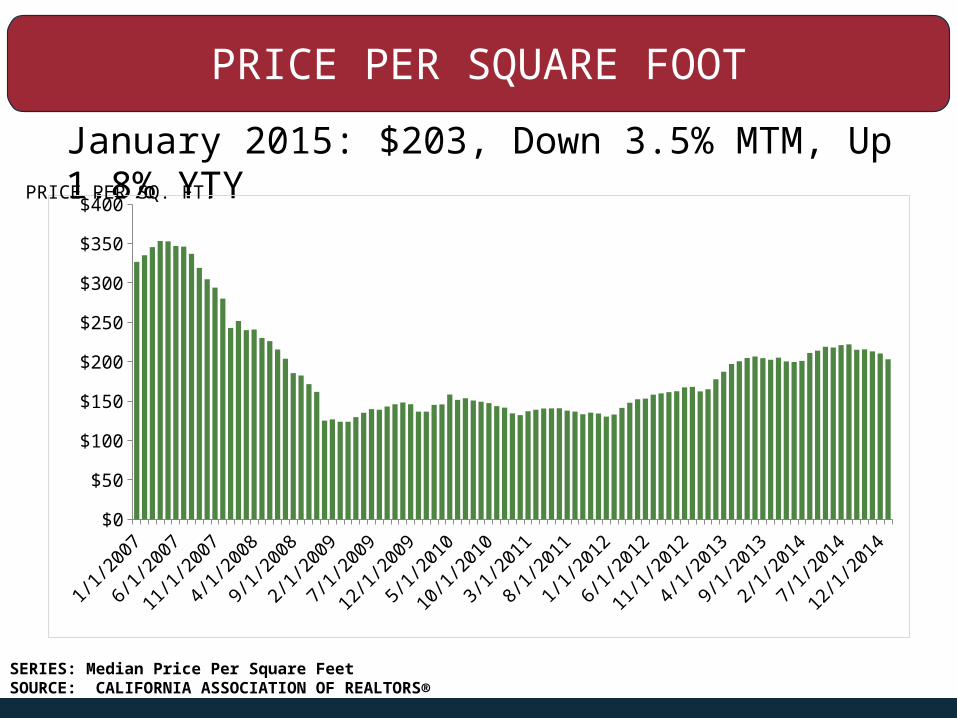
PRICE PER SQUARE FOOT
January 2015: $203, Down 3.5% MTM, Up 1.8% YTY
Jan-
07
Jul-0
7
Jan-
08
Jul-0
8
Jan-
09
Jul-0
9
Jan-
10
Jul-1
0
Jan-
11
Jul-1
1
Jan-
12
Jul-1
2
Jan-
13
Jul-1
3
Jan-
14
Jul-1
4
Jan-
15$0
$50
$100
$150
$200
$250
$300
$350
$400PRICE PER SQ. FT.
SERIES: Median Price Per Square FeetSOURCE: CALIFORNIA ASSOCIATION OF REALTORS®
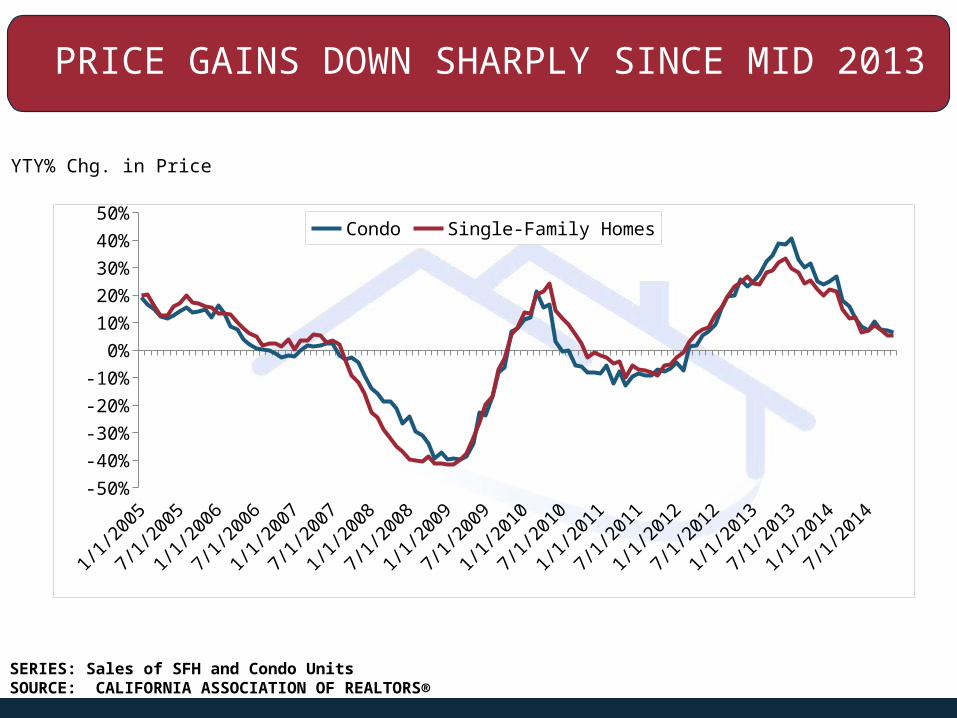
PRICE GAINS DOWN SHARPLY SINCE MID 2013
Jan-
05
Jul-0
5
Jan-
06
Jul-0
6
Jan-
07
Jul-0
7
Jan-
08
Jul-0
8
Jan-
09
Jul-0
9
Jan-
10
Jul-1
0
Jan-
11
Jul-1
1
Jan-
12
Jul-1
2
Jan-
13
Jul-1
3
Jan-
14
Jul-1
4-50%
-40%
-30%
-20%
-10%
0%
10%
20%
30%
40%
50% Condo Single-Family Homes
SERIES: Sales of SFH and Condo UnitsSOURCE: CALIFORNIA ASSOCIATION OF REALTORS®
YTY% Chg. in Price
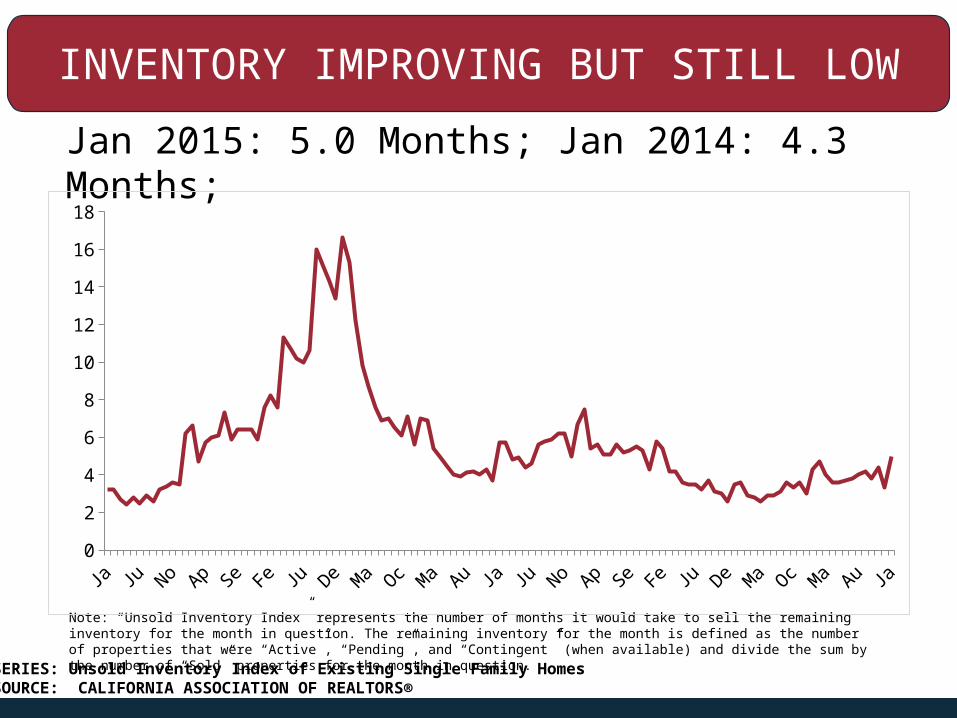
INVENTORY IMPROVING BUT STILL LOW
Jan 2015: 5.0 Months; Jan 2014: 4.3 Months;
Note: “Unsold Inventory Index” represents the number of months it would take to sell the remaining inventory for the month in question. The remaining inventory for the month is defined as the number of properties that were “Active”, “Pending”, and “Contingent” (when available) and divide the sum by the number of “Sold” properties for the month in question.
0
2
4
6
8
10
12
14
16
18
SERIES: Unsold Inventory Index of Existing Single Family HomesSOURCE: CALIFORNIA ASSOCIATION OF REALTORS®
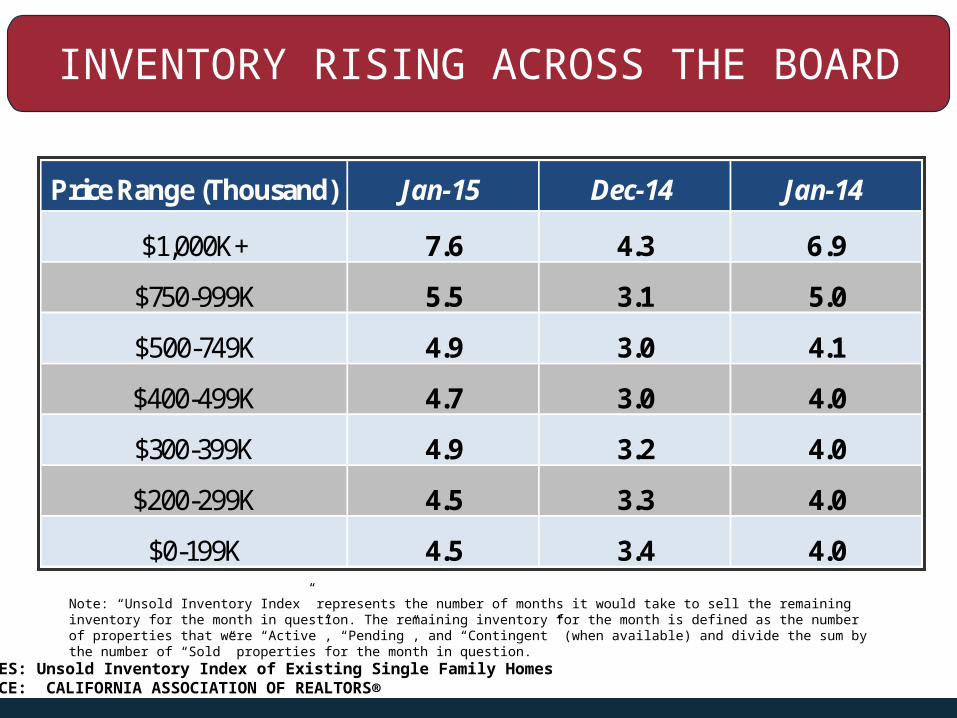
INVENTORY RISING ACROSS THE BOARD
Note: “Unsold Inventory Index” represents the number of months it would take to sell the remaining inventory for the month in question. The remaining inventory for the month is defined as the number of properties that were “Active”, “Pending”, and “Contingent” (when available) and divide the sum by the number of “Sold” properties for the month in question.
Price Range (Thousand) Jan-15 Dec-14 Jan-14
$1,000K+ 7.6 4.3 6.9
$750-999K 5.5 3.1 5.0
$500-749K 4.9 3.0 4.1
$400-499K 4.7 3.0 4.0
$300-399K 4.9 3.2 4.0
$200-299K 4.5 3.3 4.0
$0-199K 4.5 3.4 4.0
SERIES: Unsold Inventory Index of Existing Single Family HomesSOURCE: CALIFORNIA ASSOCIATION OF REALTORS®
WHERE IS THE INVENTORY?
– Investors renting instead of flipping– Mortgage Lock-In Effect– Where will I go?– Foreclosure pipeline is dry – New construction recovering but LOW– Off- MLS (aka “pocket’) listings not being
counted in listing stats

REGIONAL & LOCAL HOUSING MARKETS

RIVERSIDE COUNTY
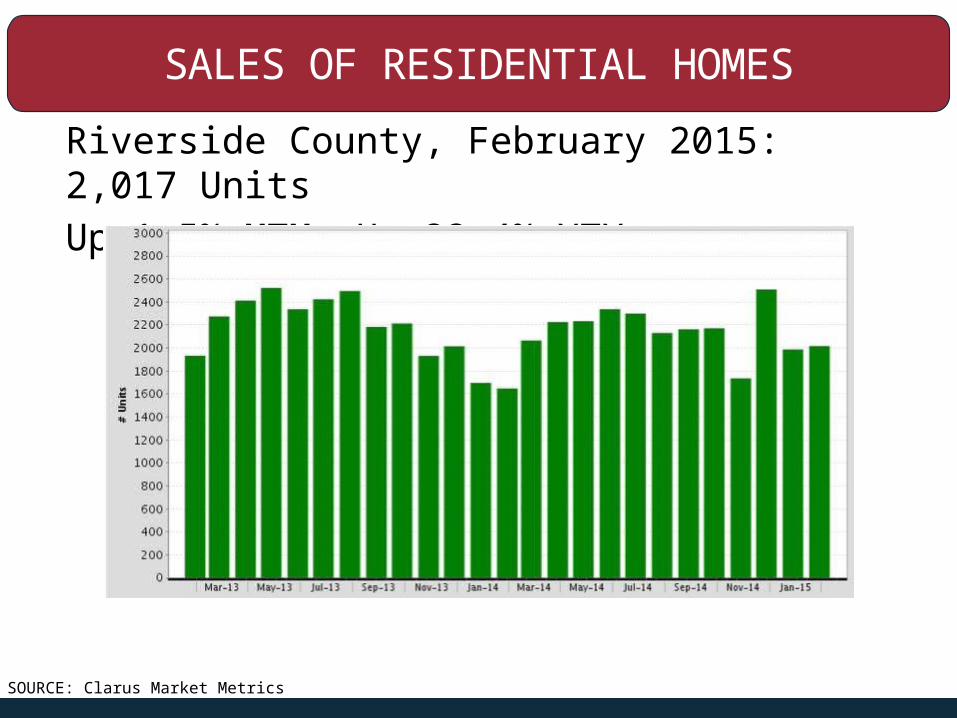
SALES OF RESIDENTIAL HOMES
Riverside County, February 2015: 2,017 Units Up 1.5% MTM, Up 22.4% YTY
SOURCE: Clarus Market Metrics
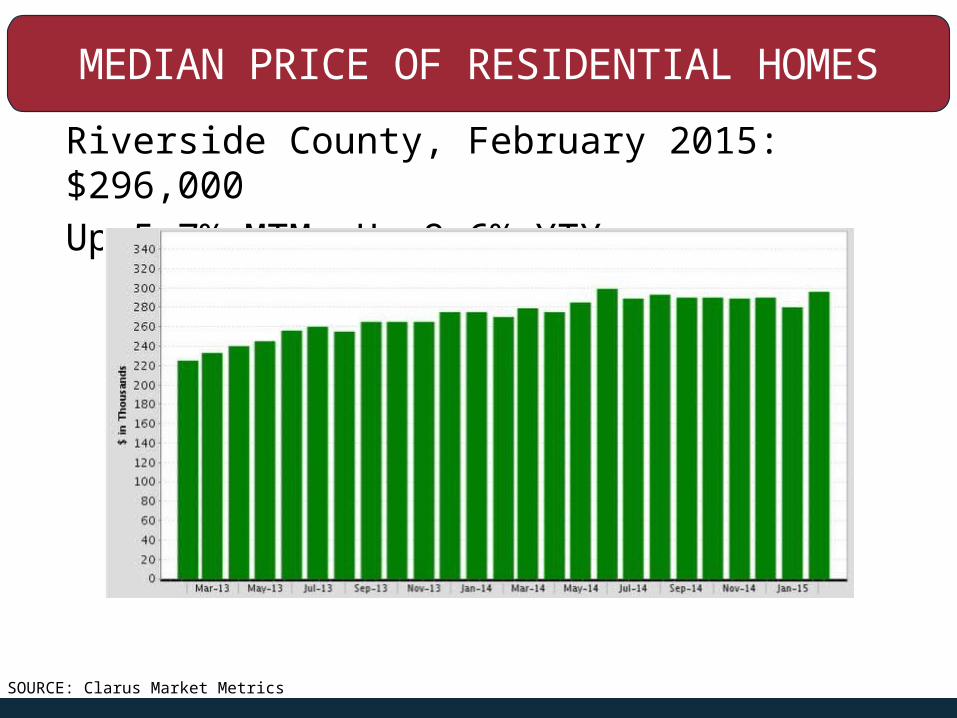
MEDIAN PRICE OF RESIDENTIAL HOMES
Riverside County, February 2015: $296,000Up 5.7% MTM, Up 9.6% YTY
SOURCE: Clarus Market Metrics
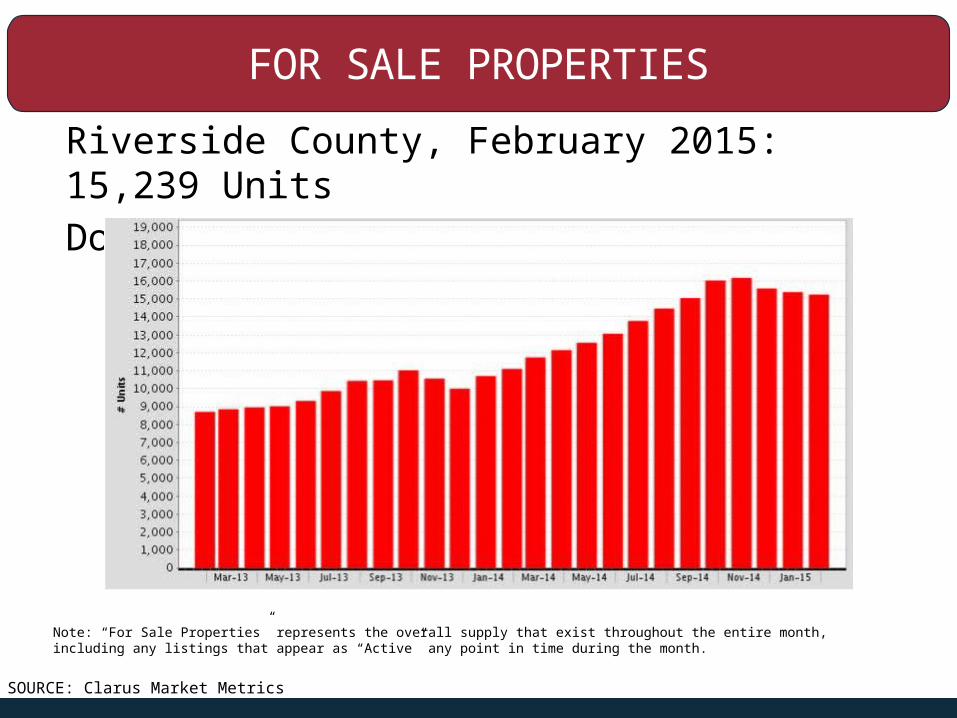
FOR SALE PROPERTIES
Riverside County, February 2015: 15,239 Units Down 0.9% MTM, Up 37.4% YTY
SOURCE: Clarus Market Metrics
Note: “For Sale Properties” represents the overall supply that exist throughout the entire month, including any listings that appear as “Active” any point in time during the month.
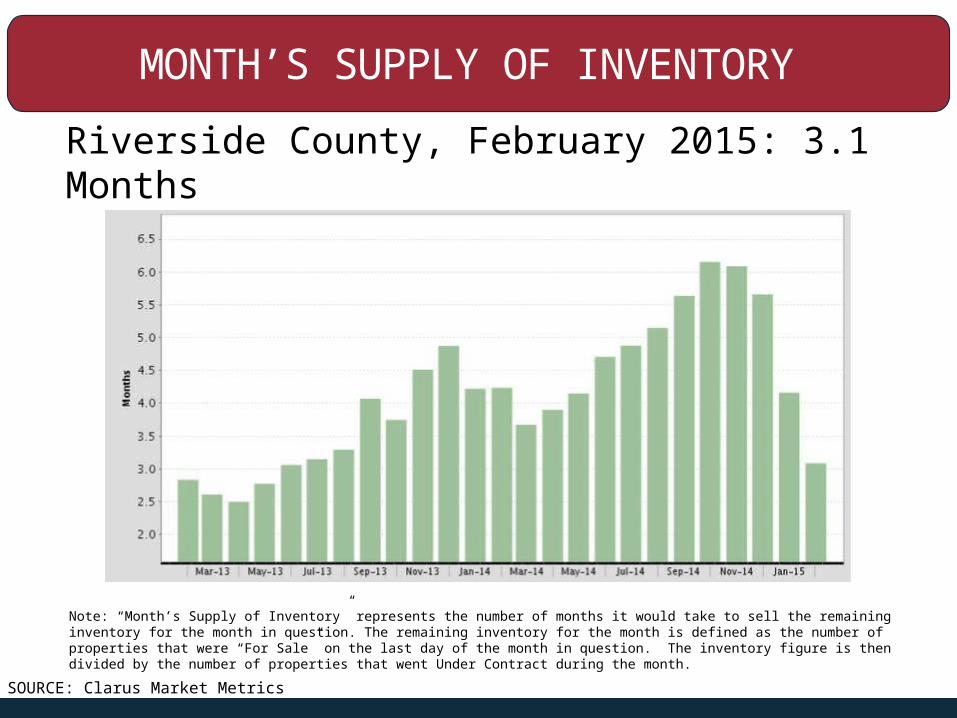
MONTH’S SUPPLY OF INVENTORY
Riverside County, February 2015: 3.1 Months
SOURCE: Clarus Market Metrics
Note: “Month’s Supply of Inventory” represents the number of months it would take to sell the remaining inventory for the month in question. The remaining inventory for the month is defined as the number of properties that were “For Sale” on the last day of the month in question. The inventory figure is then divided by the number of properties that went Under Contract during the month.

PALM SPRINGS
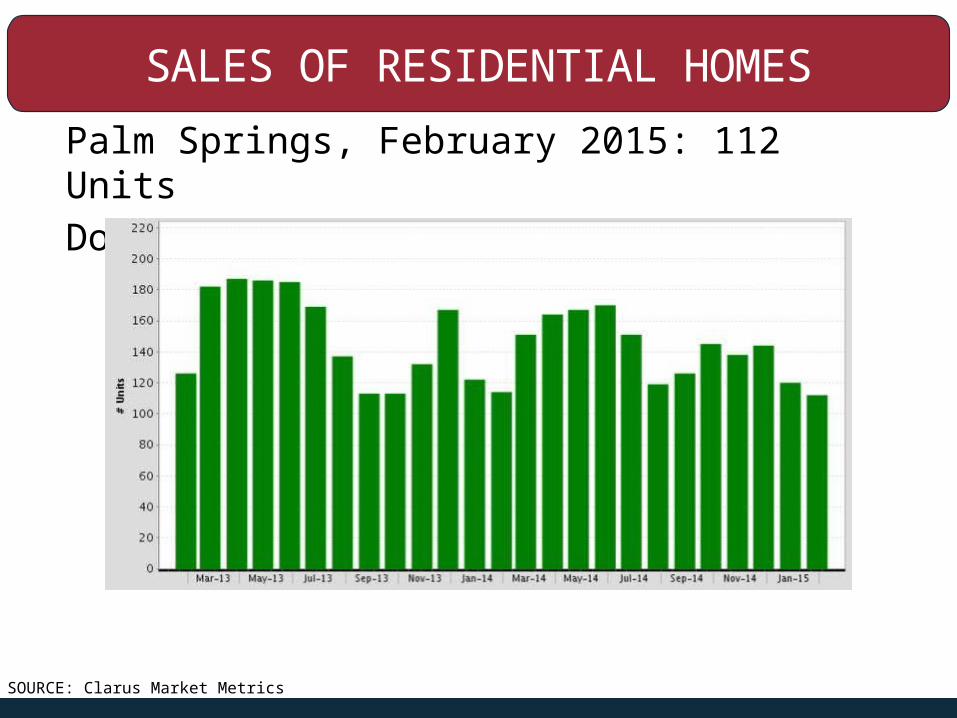
SALES OF RESIDENTIAL HOMES
Palm Springs, February 2015: 112 Units Down 6.7% MTM, Down 1.8% YTY
SOURCE: Clarus Market Metrics
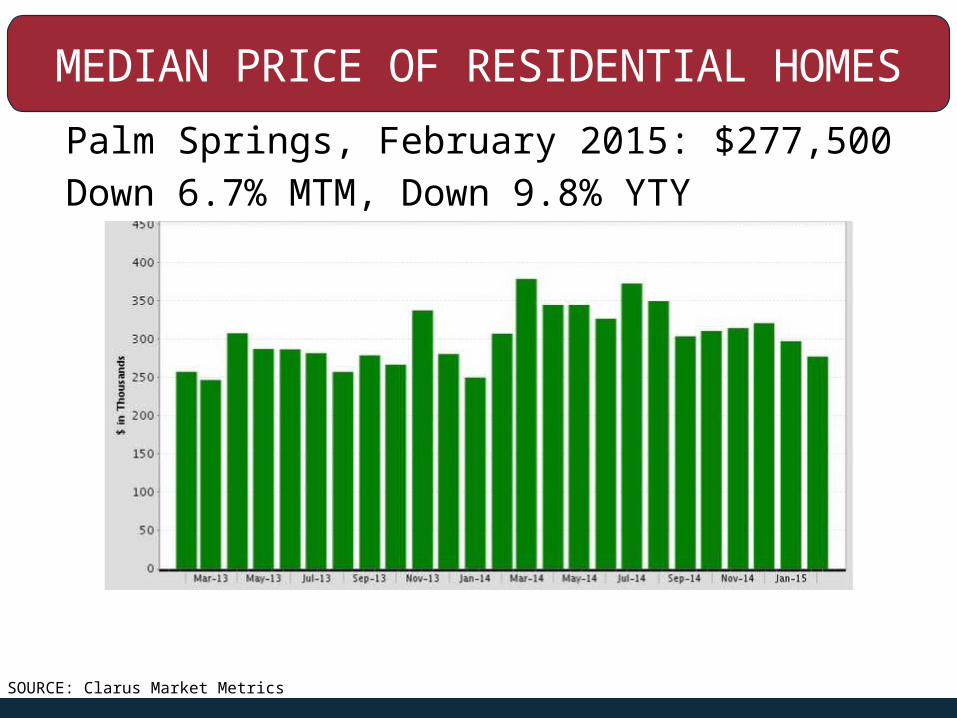
MEDIAN PRICE OF RESIDENTIAL HOMES
Palm Springs, February 2015: $277,500Down 6.7% MTM, Down 9.8% YTY
SOURCE: Clarus Market Metrics
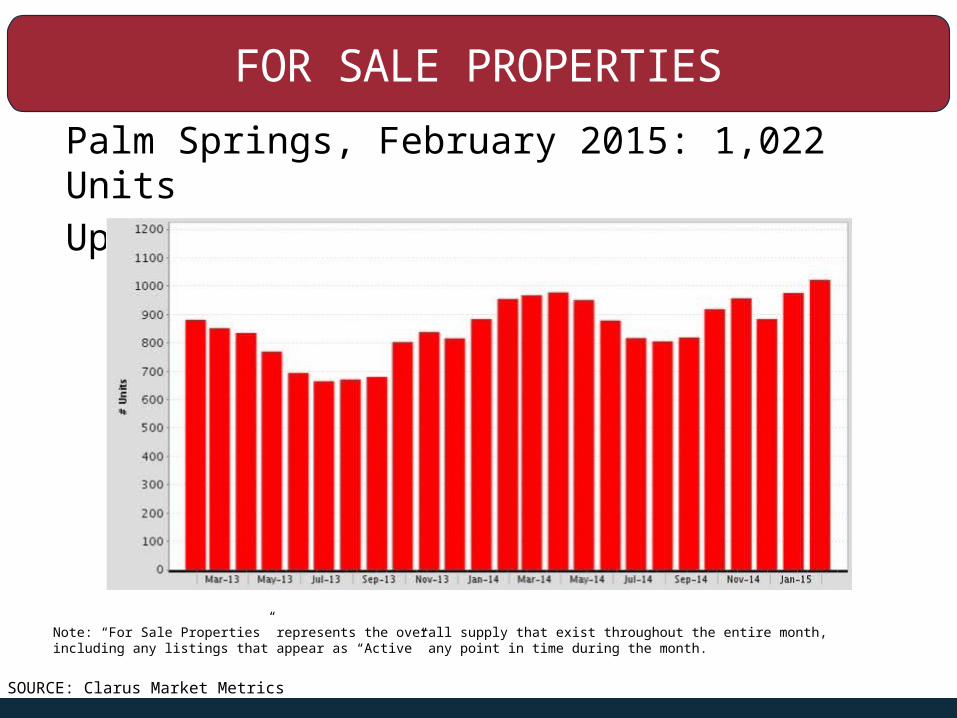
FOR SALE PROPERTIES
Palm Springs, February 2015: 1,022 UnitsUp 4.7% MTM, Up 7.0% YTY
Note: “For Sale Properties” represents the overall supply that exist throughout the entire month, including any listings that appear as “Active” any point in time during the month.
SOURCE: Clarus Market Metrics
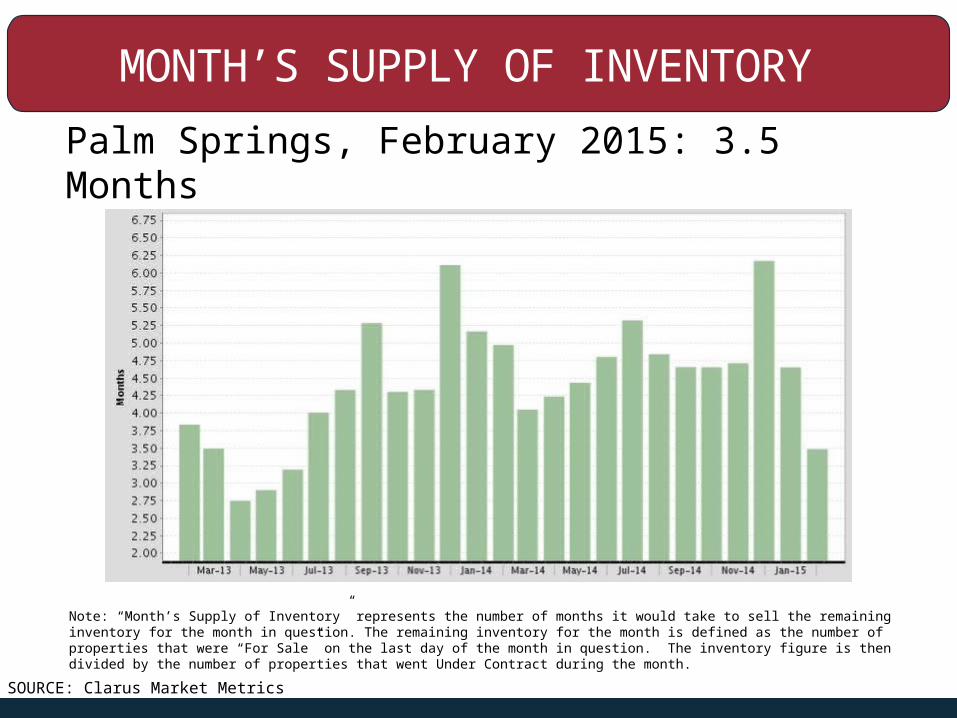
MONTH’S SUPPLY OF INVENTORY
Palm Springs, February 2015: 3.5 Months
Note: “Month’s Supply of Inventory” represents the number of months it would take to sell the remaining inventory for the month in question. The remaining inventory for the month is defined as the number of properties that were “For Sale” on the last day of the month in question. The inventory figure is then divided by the number of properties that went Under Contract during the month.
SOURCE: Clarus Market Metrics

LA QUINTA
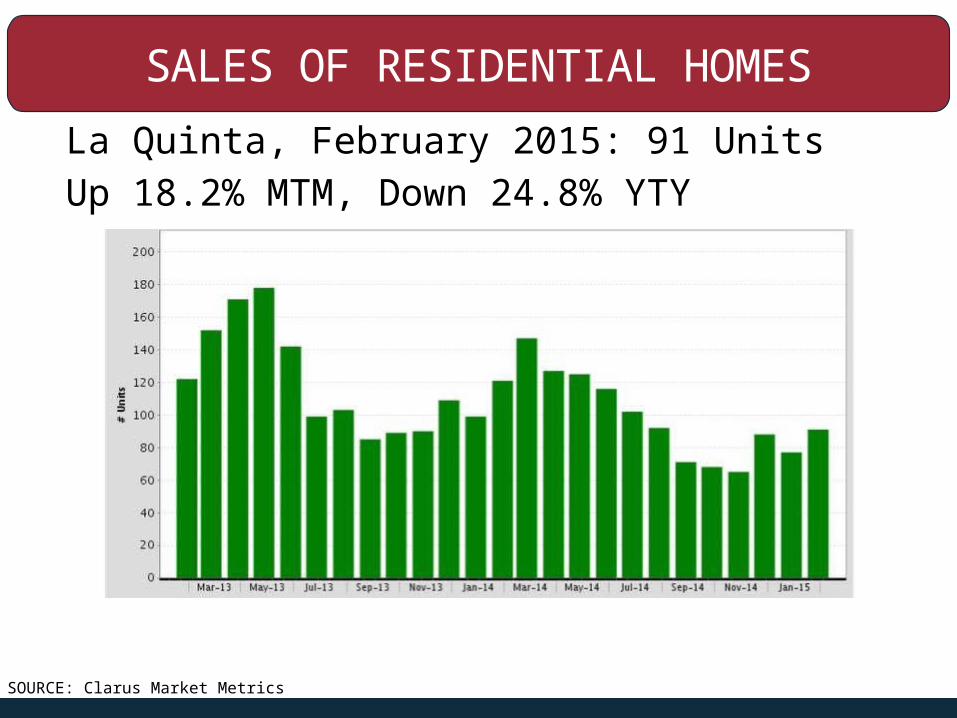
SALES OF RESIDENTIAL HOMES
La Quinta, February 2015: 91 Units Up 18.2% MTM, Down 24.8% YTY
SOURCE: Clarus Market Metrics
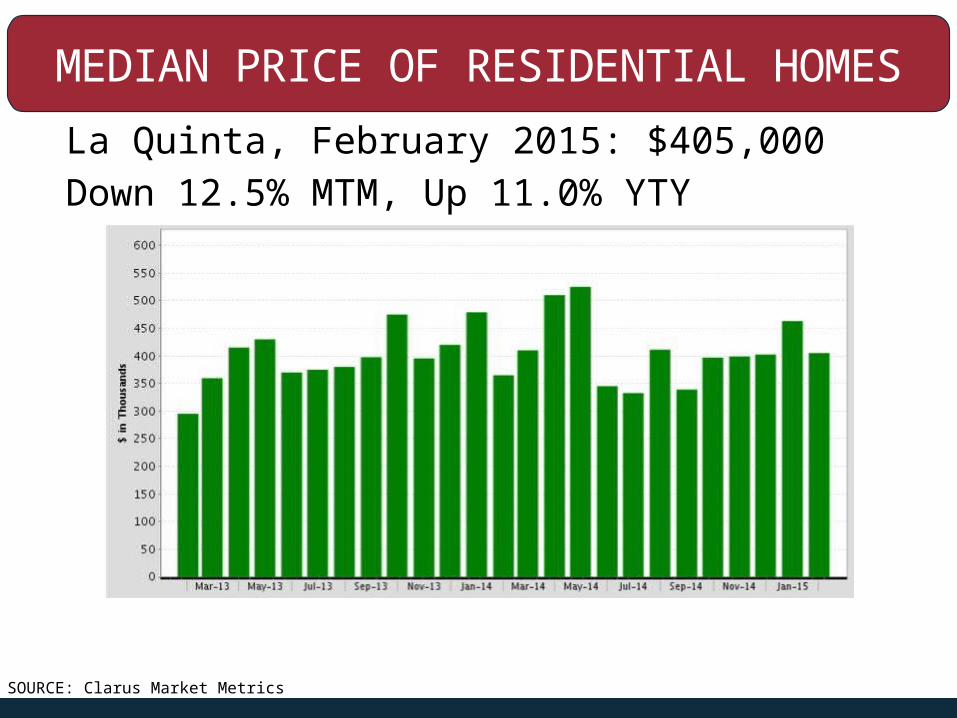
MEDIAN PRICE OF RESIDENTIAL HOMES
La Quinta, February 2015: $405,000Down 12.5% MTM, Up 11.0% YTY
SOURCE: Clarus Market Metrics
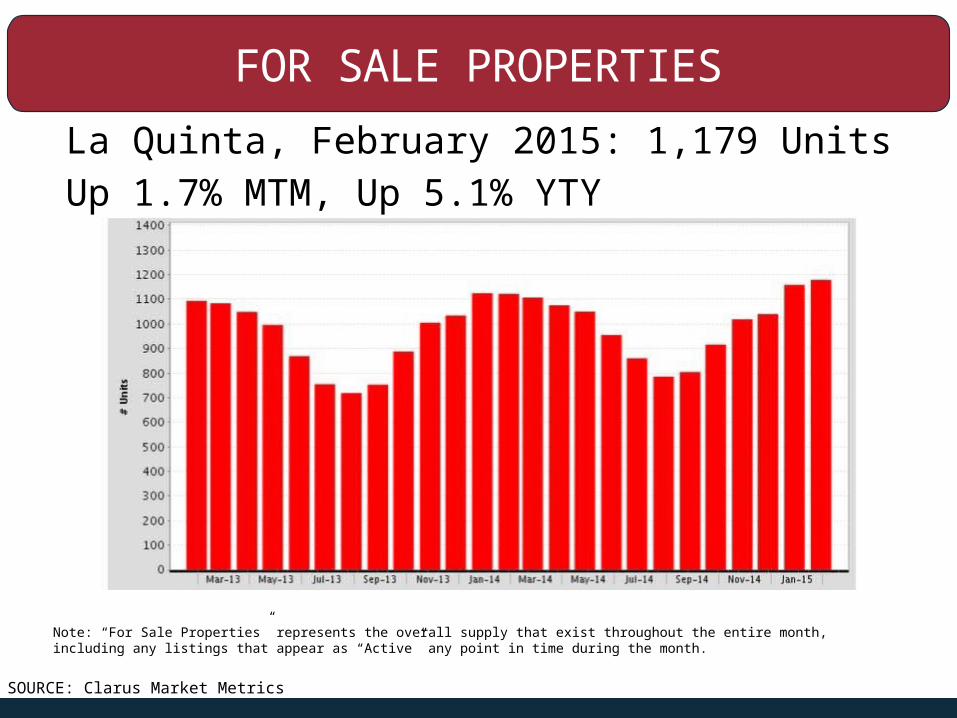
FOR SALE PROPERTIES
La Quinta, February 2015: 1,179 UnitsUp 1.7% MTM, Up 5.1% YTY
SOURCE: Clarus Market Metrics
Note: “For Sale Properties” represents the overall supply that exist throughout the entire month, including any listings that appear as “Active” any point in time during the month.
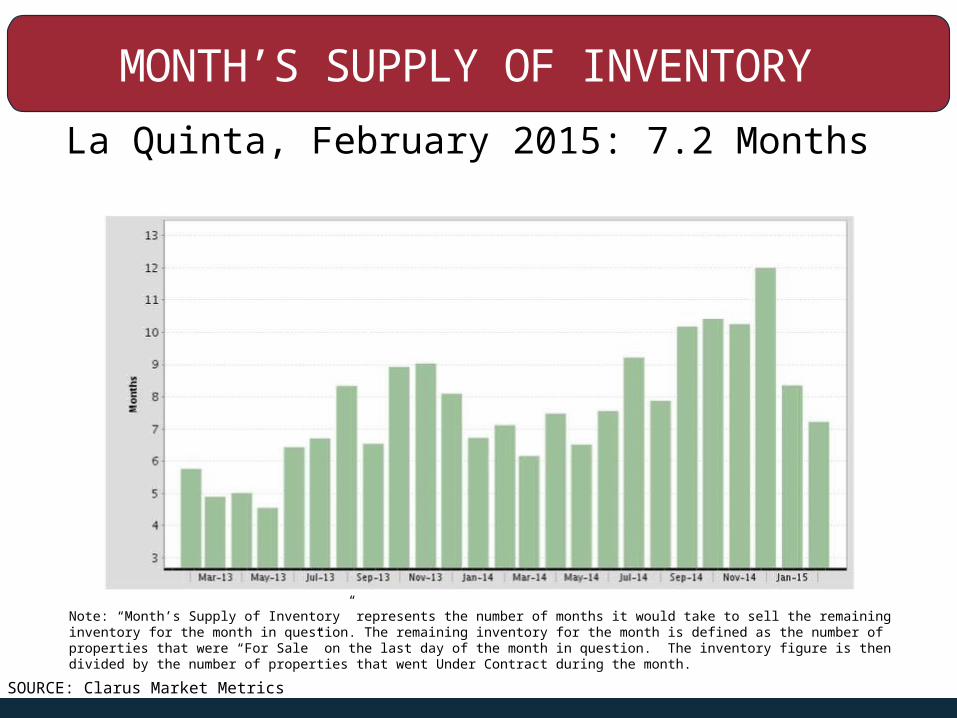
MONTH’S SUPPLY OF INVENTORY
La Quinta, February 2015: 7.2 Months
Note: “Month’s Supply of Inventory” represents the number of months it would take to sell the remaining inventory for the month in question. The remaining inventory for the month is defined as the number of properties that were “For Sale” on the last day of the month in question. The inventory figure is then divided by the number of properties that went Under Contract during the month.
SOURCE: Clarus Market Metrics

CATHEDRAL CITY
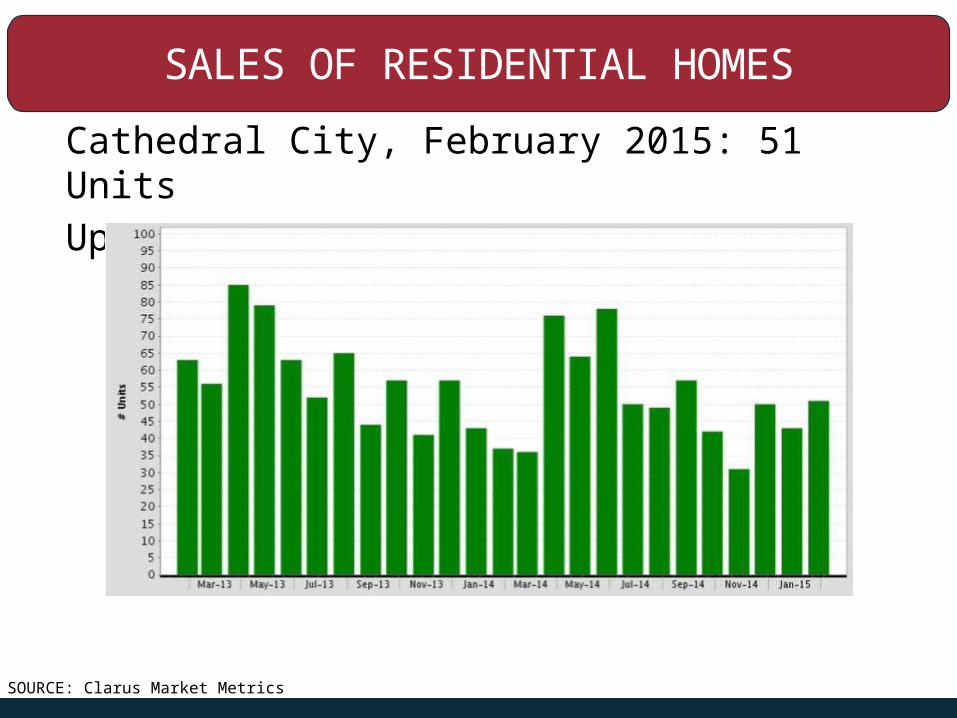
SALES OF RESIDENTIAL HOMES
Cathedral City, February 2015: 51 Units Up 18.6% MTM, Up 37.8% YTY
SOURCE: Clarus Market Metrics
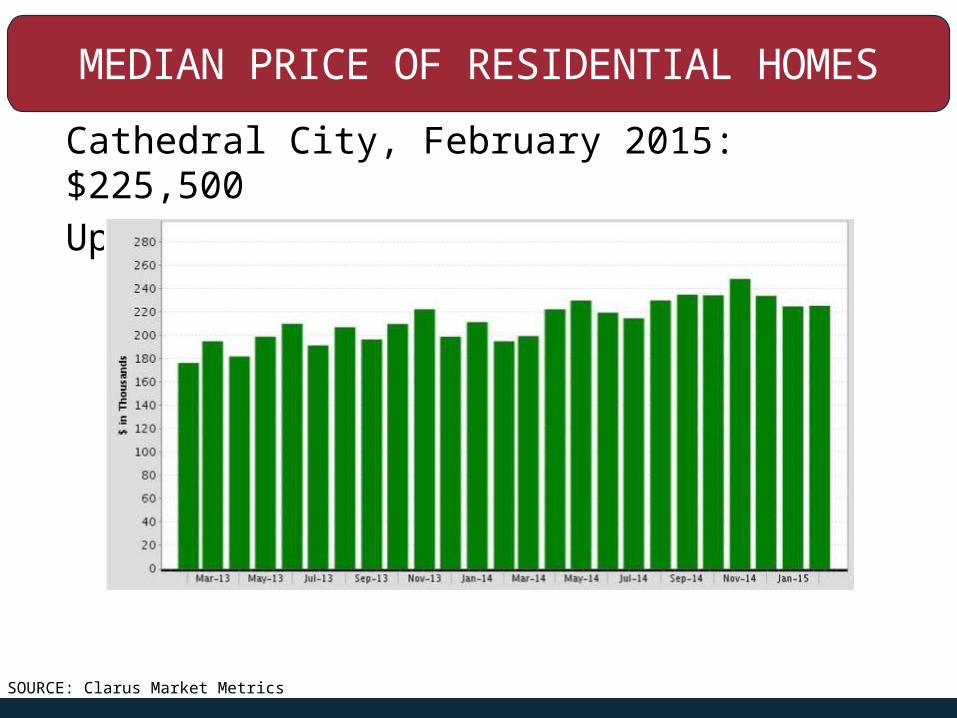
MEDIAN PRICE OF RESIDENTIAL HOMES
Cathedral City, February 2015: $225,500Up 0.2% MTM, Up 15.6% YTY
SOURCE: Clarus Market Metrics
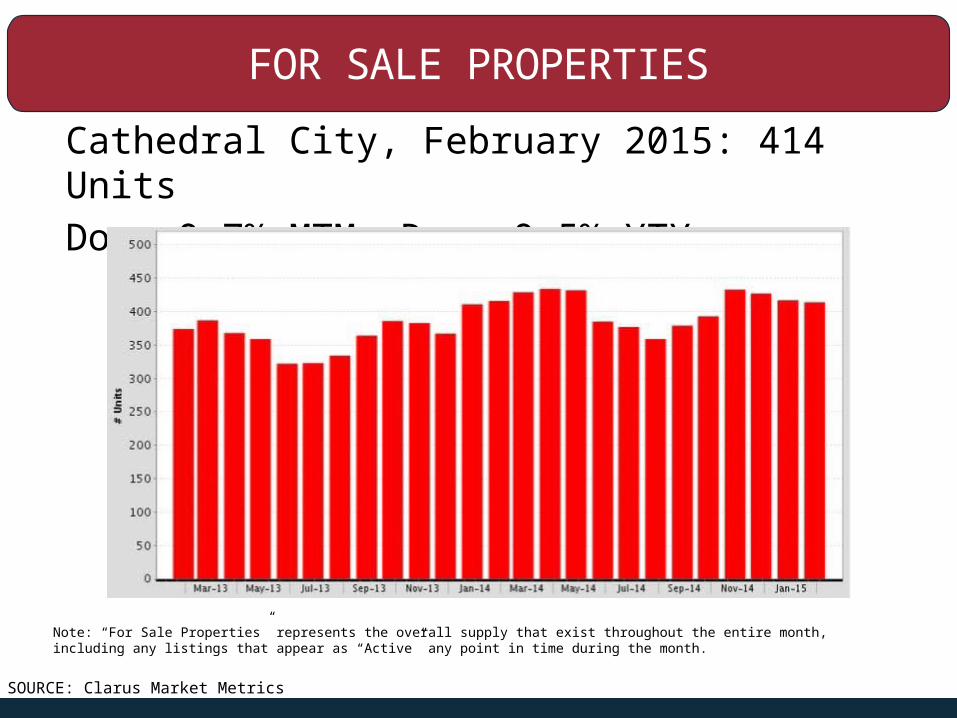
FOR SALE PROPERTIES
Cathedral City, February 2015: 414 Units Down 0.7% MTM, Down 0.5% YTY
SOURCE: Clarus Market Metrics
Note: “For Sale Properties” represents the overall supply that exist throughout the entire month, including any listings that appear as “Active” any point in time during the month.
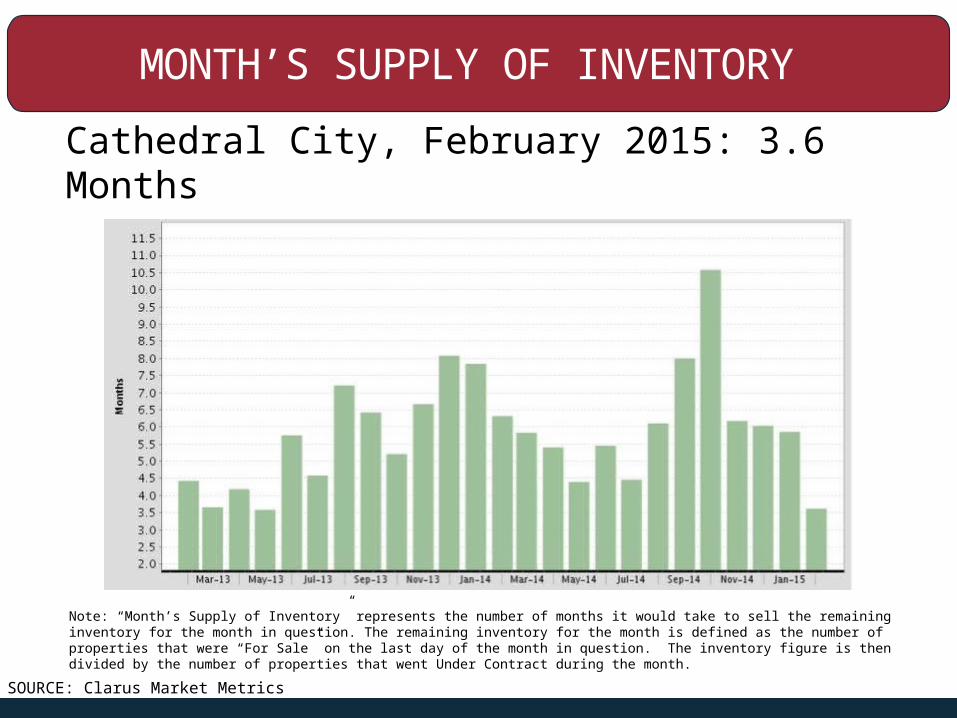
MONTH’S SUPPLY OF INVENTORY
Cathedral City, February 2015: 3.6 Months
SOURCE: Clarus Market Metrics
Note: “Month’s Supply of Inventory” represents the number of months it would take to sell the remaining inventory for the month in question. The remaining inventory for the month is defined as the number of properties that were “For Sale” on the last day of the month in question. The inventory figure is then divided by the number of properties that went Under Contract during the month.
ANNUAL HOUSING MARKET SURVEY:
2014 FINDINGS
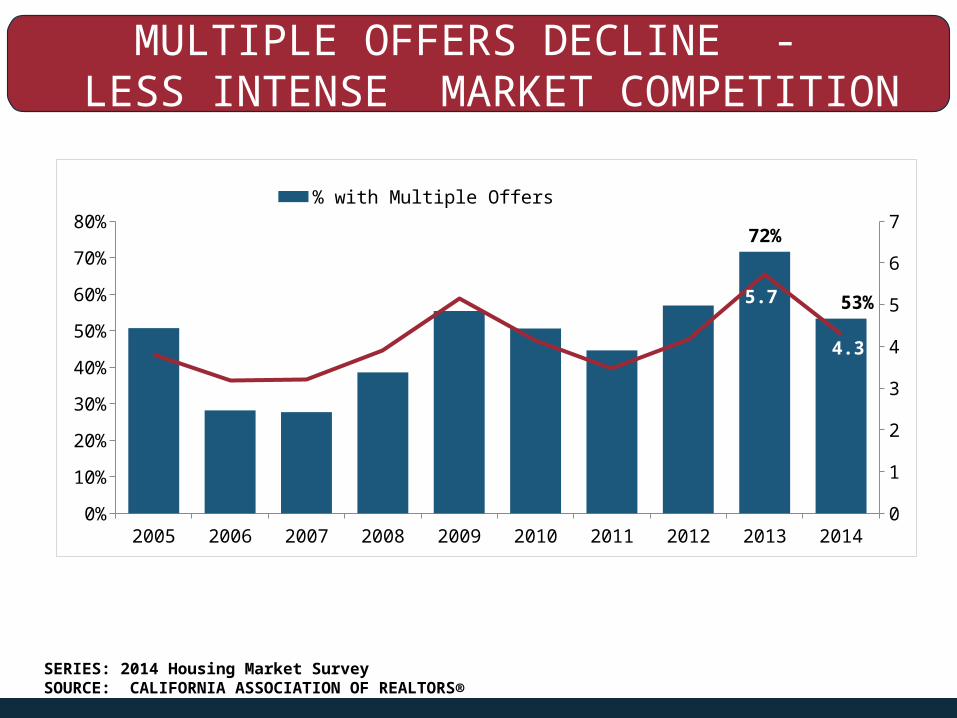
MULTIPLE OFFERS DECLINE - LESS INTENSE MARKET COMPETITION
AFTER PEAKING IN 2013
2005 2006 2007 2008 2009 2010 2011 2012 2013 20140%
10%
20%
30%
40%
50%
60%
70%
80%
0
1
2
3
4
5
6
772%
53%5.7
4.3
% with Multiple Offers# of Multiple offers (Average)
SERIES: 2014 Housing Market SurveySOURCE: CALIFORNIA ASSOCIATION OF REALTORS®
2005 2006 2007 2008 2009 2010 2011 2012 2013 20140%
10%
20%
30%
40%
50%
60%
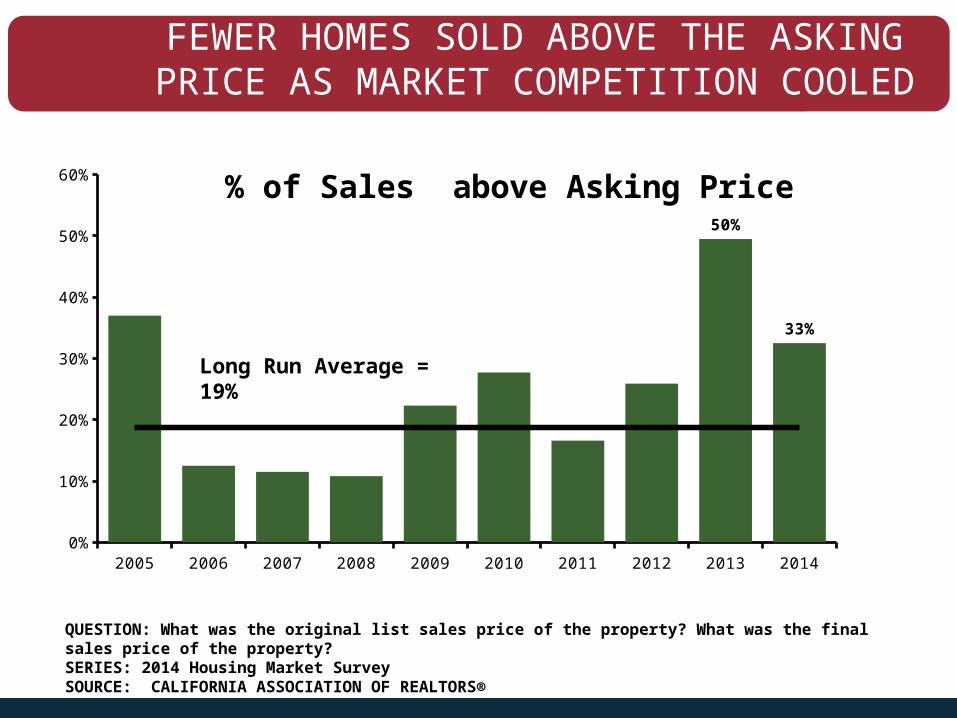
50%
33%
% of Sales above Asking Price
Long Run Average = 19%
FEWER HOMES SOLD ABOVE THE ASKING PRICE AS MARKET COMPETITION COOLED IN
2014
QUESTION: What was the original list sales price of the property? What was the final sales price of the property? SERIES: 2014 Housing Market SurveySOURCE: CALIFORNIA ASSOCIATION OF REALTORS®
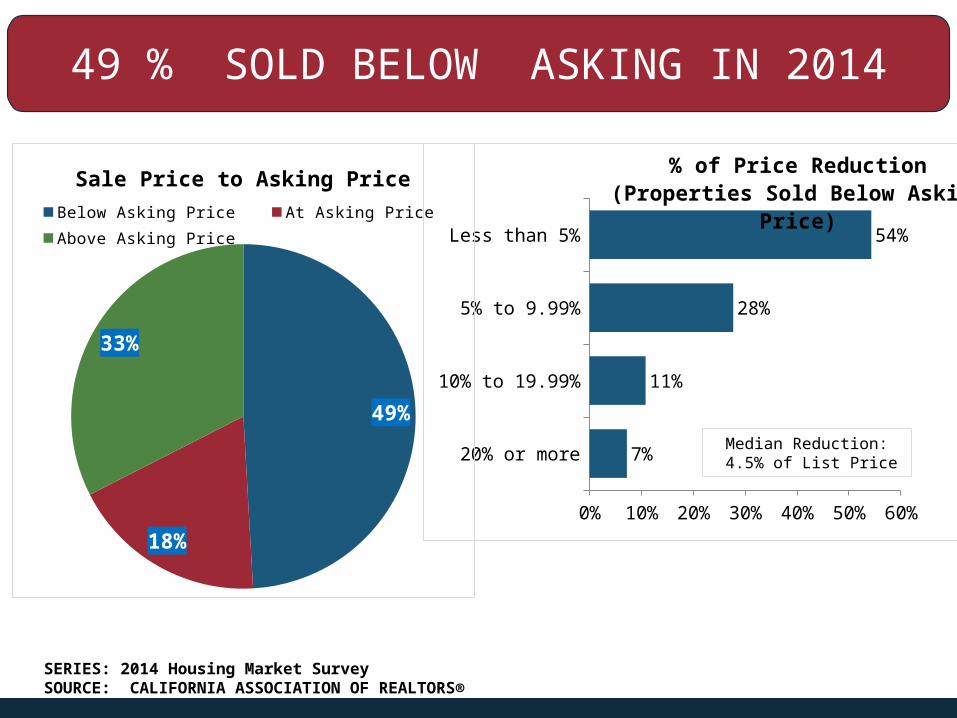
49 % SOLD BELOW ASKING IN 2014
20% or more
10% to 19.99%
5% to 9.99%
Less than 5%
0% 10% 20% 30% 40% 50% 60%
7%
11%
28%
54%
% of Price Reduction(Properties Sold Below Asking Price)
49%
18%
33%
Sale Price to Asking Price
Below Asking Price At Asking Price
Above Asking Price
SERIES: 2014 Housing Market SurveySOURCE: CALIFORNIA ASSOCIATION OF REALTORS®
Median Reduction: 4.5% of List Price
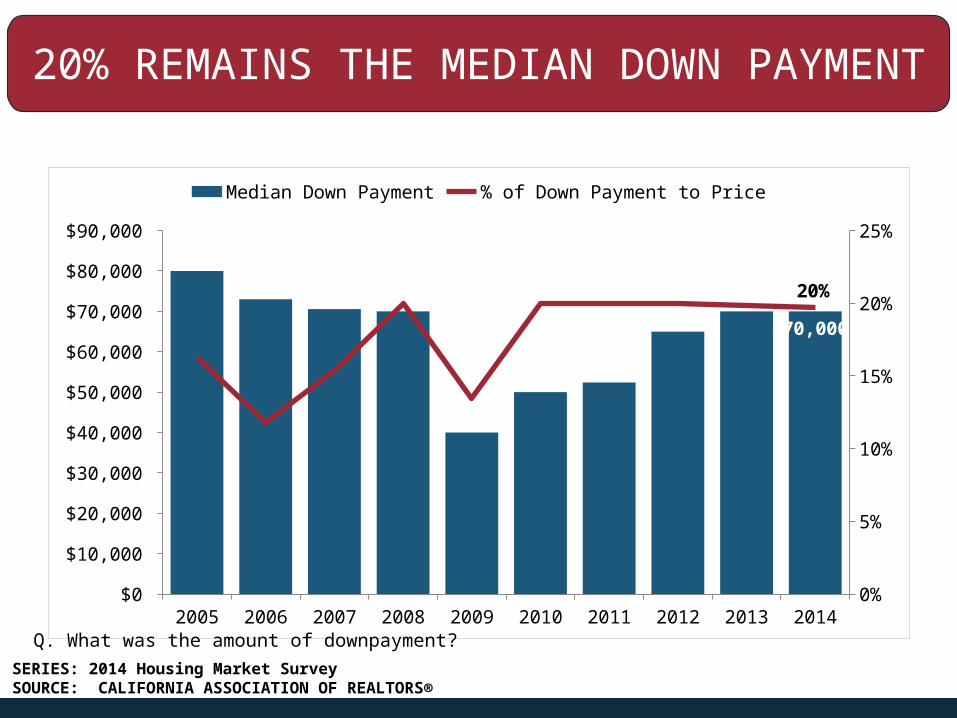
2005 2006 2007 2008 2009 2010 2011 2012 2013 2014$0
$10,000
$20,000
$30,000
$40,000
$50,000
$60,000
$70,000
$80,000
$90,000
0%
5%
10%
15%
20%
25%
$70,000
20%
Median Down Payment % of Down Payment to Price
Q. What was the amount of downpayment?
20% REMAINS THE MEDIAN DOWN PAYMENT
SERIES: 2014 Housing Market SurveySOURCE: CALIFORNIA ASSOCIATION OF REALTORS®
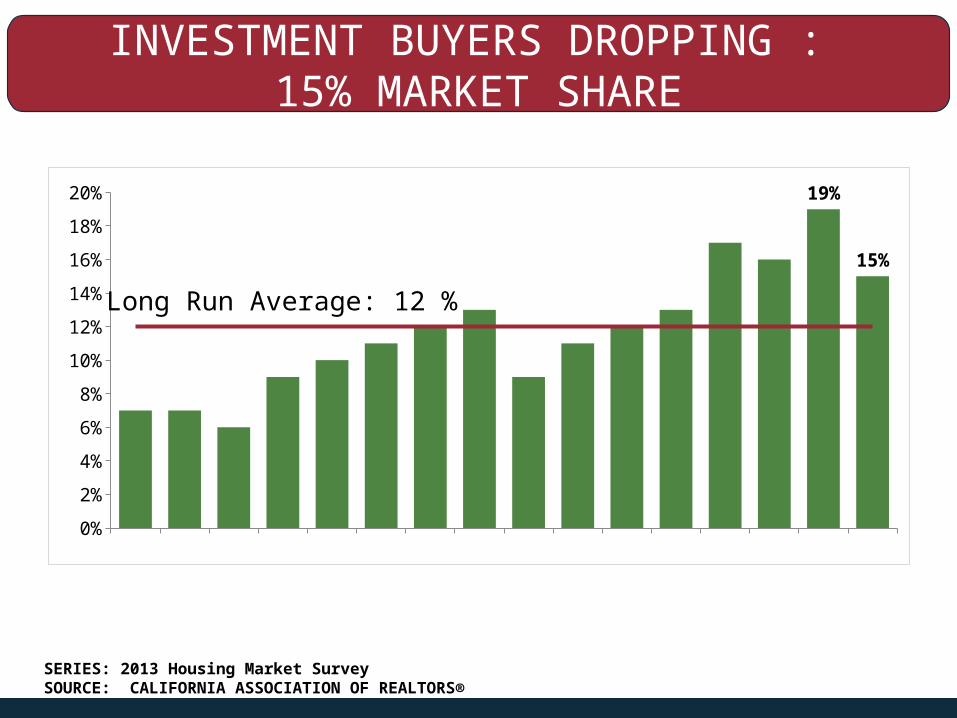
INVESTMENT BUYERS DROPPING : 15% MARKET SHARE
19992000200120022003200420052006200720082009201020112012201320140%
2%
4%
6%
8%
10%
12%
14%
16%
18%
20% 19%
15%
Long Run Average: 12 %
SERIES: 2013 Housing Market SurveySOURCE: CALIFORNIA ASSOCIATION OF REALTORS®
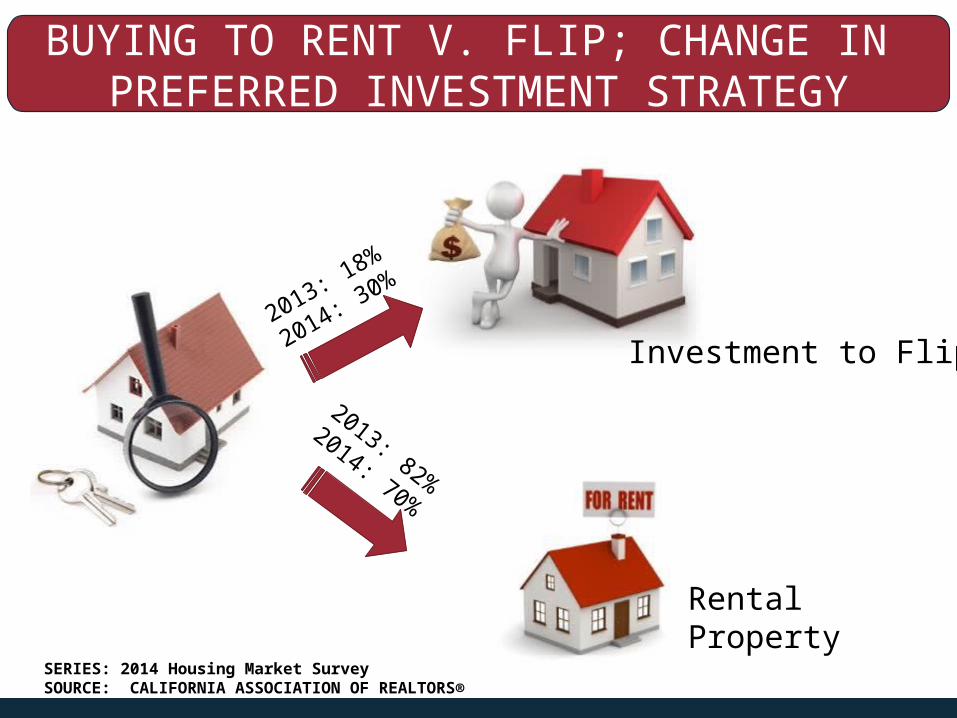
BUYING TO RENT V. FLIP; CHANGE IN PREFERRED INVESTMENT STRATEGY
2013: 18%
2014: 30%
2013: 82%
2014: 70%
Investment to Flip
Rental Property
SERIES: 2014 Housing Market SurveySOURCE: CALIFORNIA ASSOCIATION OF REALTORS®

Property Management & Investment Section
Provides residential and small multi-family property management professionals with:
E-newsletter with the latest legal, market and industry newsSpecial discountsNetworking opportunities and more
Annual
subscripti
on only
$39
Join TODAY! http://www.car.org/members/pmi/
.

HOUSING AFFORDABILITY:CRISIS BREWING
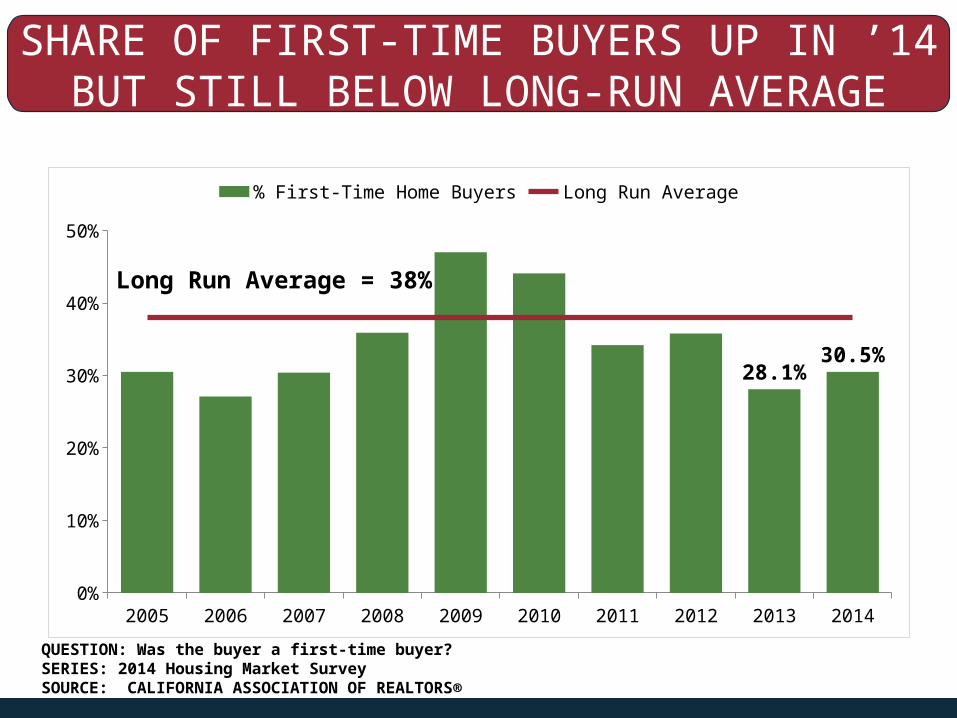
SHARE OF FIRST-TIME BUYERS UP IN ’14 BUT STILL BELOW LONG-RUN AVERAGE
2005 2006 2007 2008 2009 2010 2011 2012 2013 20140%
10%
20%
30%
40%
50%
28.1%30.5%
% First-Time Home Buyers Long Run Average
Long Run Average = 38%
QUESTION: Was the buyer a first-time buyer?SERIES: 2014 Housing Market SurveySOURCE: CALIFORNIA ASSOCIATION OF REALTORS®
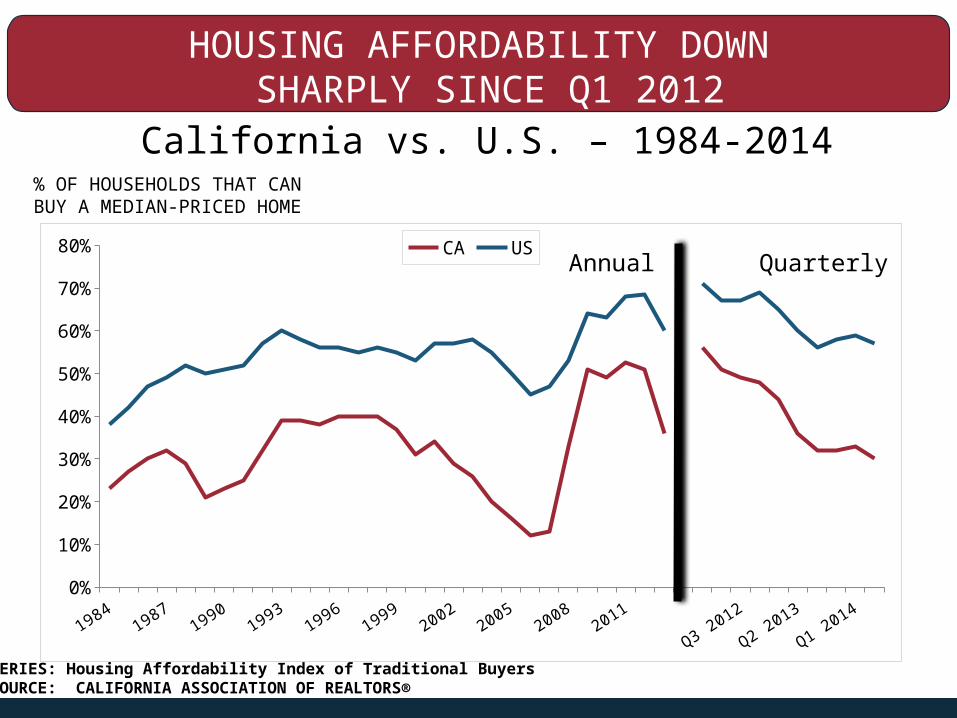
HOUSING AFFORDABILITY DOWN SHARPLY SINCE Q1 2012
California vs. U.S. – 1984-2014% OF HOUSEHOLDS THAT CAN BUY A MEDIAN-PRICED HOME
SERIES: Housing Affordability Index of Traditional BuyersSOURCE: CALIFORNIA ASSOCIATION OF REALTORS®
19841986
19881990
19921994
19961998
20002002
20042006
20082010
2012
Q2 2012
Q4 2012
Q2 2013
Q4 2013
Q2 20140%
10%
20%
30%
40%
50%
60%
70%
80% CA USAnnual Quarterly
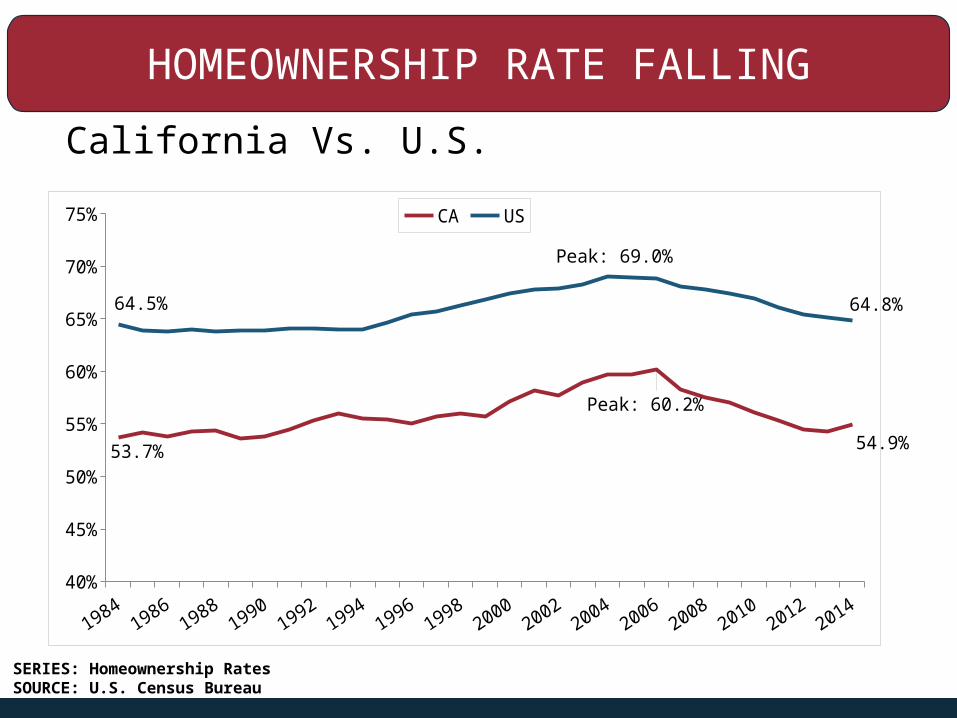
HOMEOWNERSHIP RATE FALLING
California Vs. U.S.
40%
45%
50%
55%
60%
65%
70%
75%
53.7%
Peak: 60.2%
54.9%
64.5%
Peak: 69.0%
64.8%
CA US
SERIES: Homeownership RatesSOURCE: U.S. Census Bureau
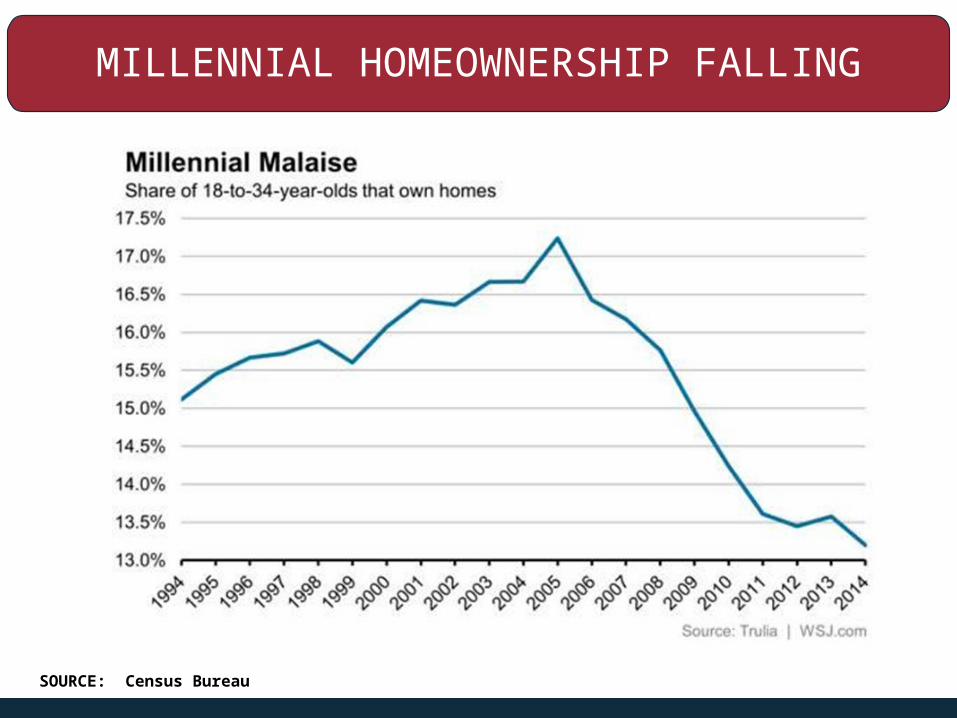
MILLENNIAL HOMEOWNERSHIP FALLING
SOURCE: Census Bureau
1970
1972
1974
1976
1978
1980
1982
1984
1986
1988
1990
1992
1994
1996
1998
2000
2002
2004
2006
2008
2010
2012
2014
P $-
$100,000
$200,000
$300,000
$400,000
$500,000
$600,000 California US
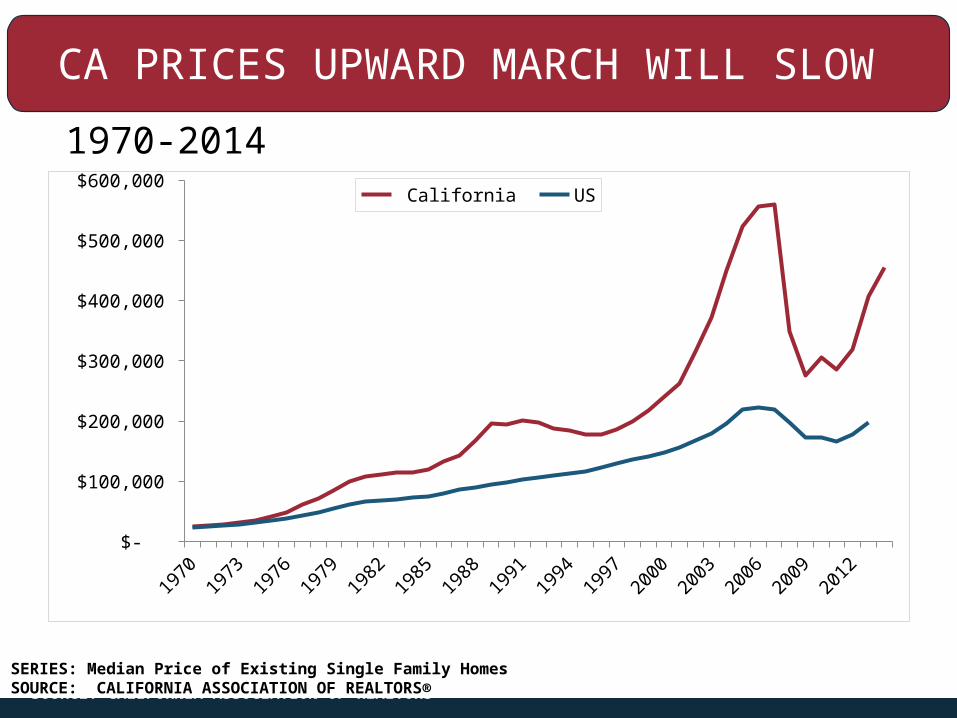
CA PRICES UPWARD MARCH WILL SLOW
1970-2014
SOURCE: CALIFORNIA ASSOCIATION OF REALTORS®
SERIES: Median Price of Existing Single Family HomesSOURCE: CALIFORNIA ASSOCIATION OF REALTORS®
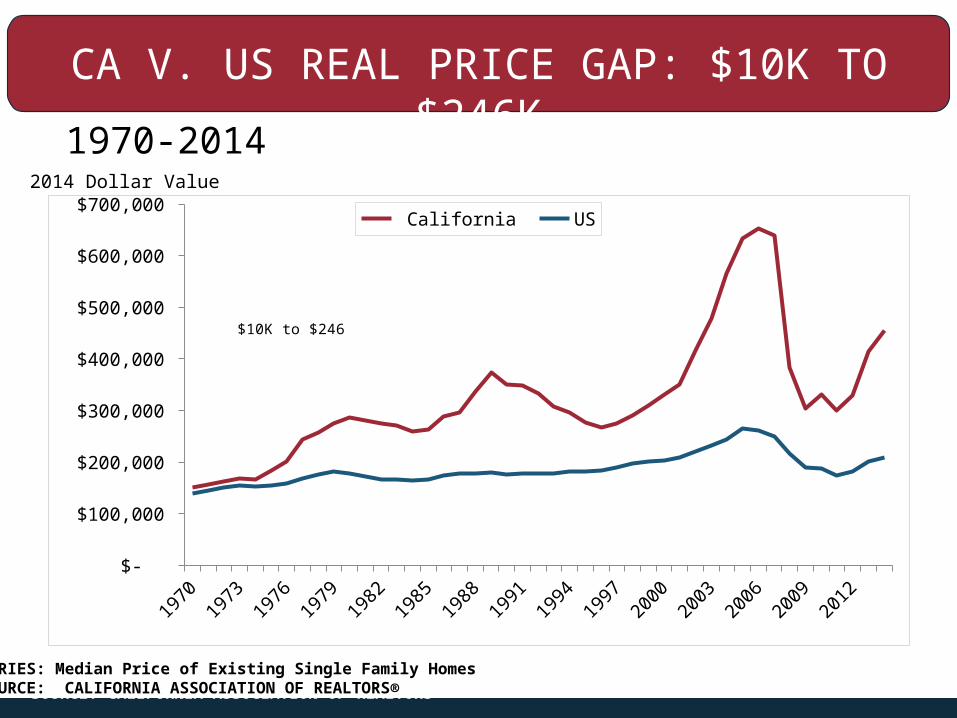
CA V. US REAL PRICE GAP: $10K TO $246K
1970-2014
SOURCE: CALIFORNIA ASSOCIATION OF REALTORS®
1970
1972
1974
1976
1978
1980
1982
1984
1986
1988
1990
1992
1994
1996
1998
2000
2002
2004
2006
2008
2010
2012
2014
p $-
$100,000
$200,000
$300,000
$400,000
$500,000
$600,000
$700,000 California US
$10K to $246
SERIES: Median Price of Existing Single Family HomesSOURCE: CALIFORNIA ASSOCIATION OF REALTORS®
2014 Dollar Value
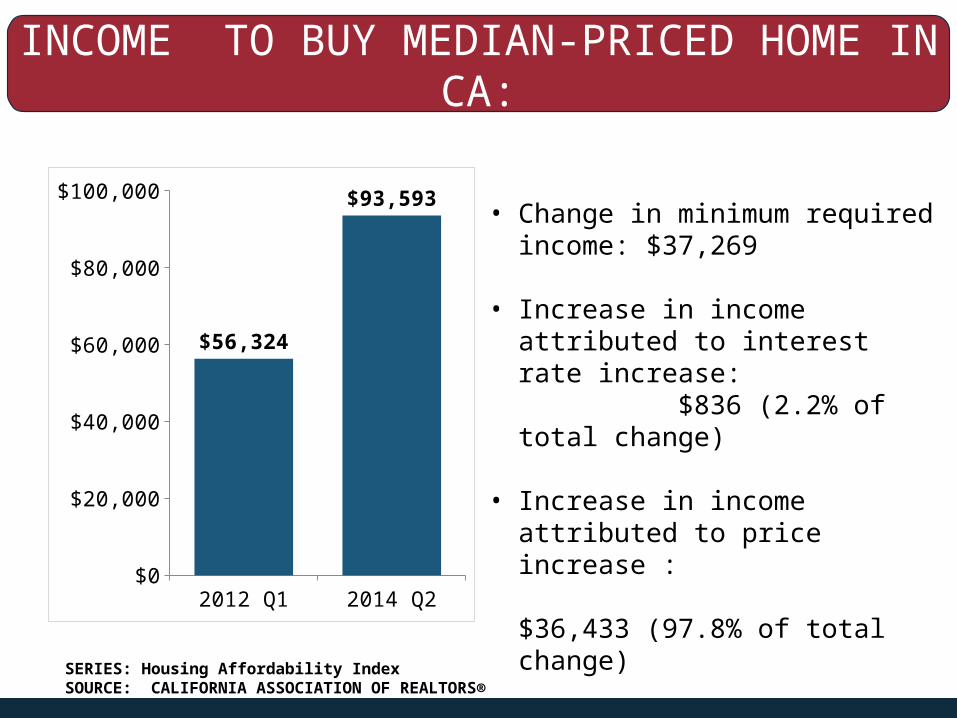
INCOME TO BUY MEDIAN-PRICED HOME IN CA:
UP SHARPLY IN TWO
2012 Q1 2014 Q2$0
$20,000
$40,000
$60,000
$80,000
$100,000
$56,324
$93,593• Change in minimum required income:
$37,269
• Increase in income attributed to interest rate increase: $836 (2.2% of total change)
• Increase in income attributed to price increase : $36,433 (97.8% of total change)
SERIES: Housing Affordability IndexSOURCE: CALIFORNIA ASSOCIATION OF REALTORS®
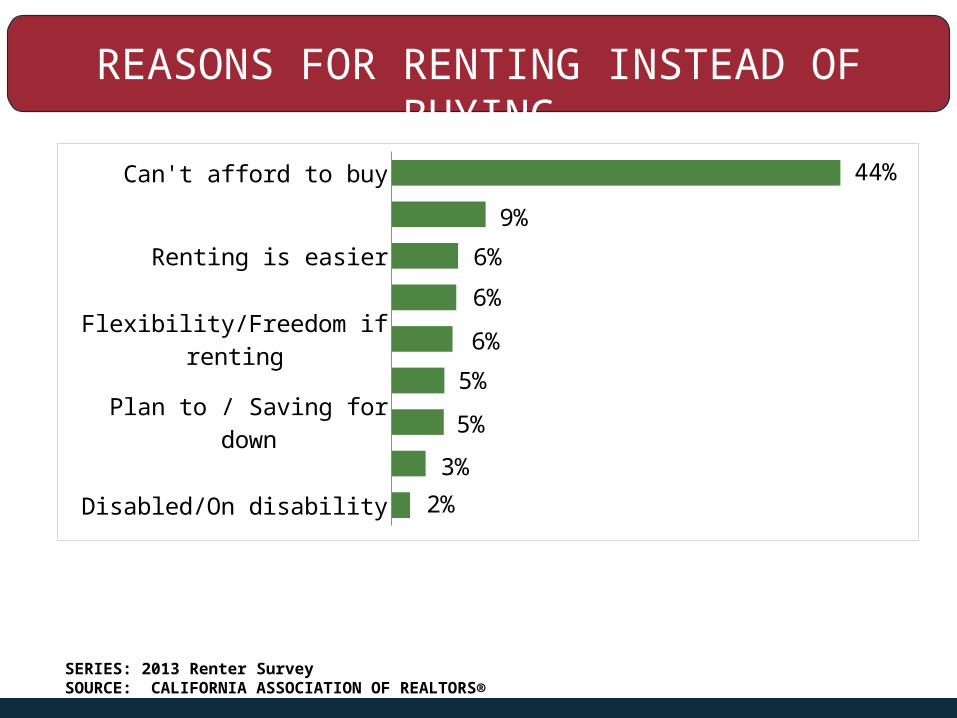
REASONS FOR RENTING INSTEAD OF BUYING
Can't afford to buy
Renting is easier
Flexibility/Freedom if renting
Plan to / Saving for down
Disabled/On disability
44%
9%
6%
6%
6%
5%
5%
3%
2%
SERIES: 2013 Renter SurveySOURCE: CALIFORNIA ASSOCIATION OF REALTORS®
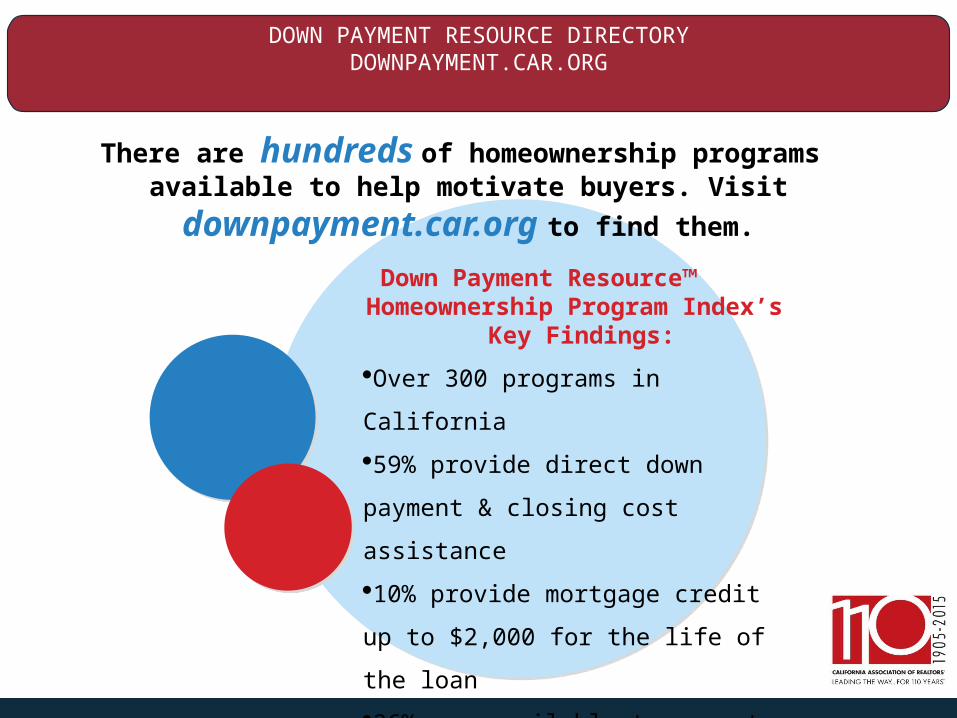
DOWN PAYMENT RESOURCE DIRECTORYDOWNPAYMENT.CAR.ORG
Down Payment Resource™ Homeownership Program
Index’s Key Findings:
·Over 300 programs in California
·59% provide direct down payment
& closing cost assistance
·10% provide mortgage credit up
to $2,000 for the life of the loan
·26% are available to repeat
buyers
There are hundreds of homeownership programs available to help motivate buyers. Visit
downpayment.car.org to find them.
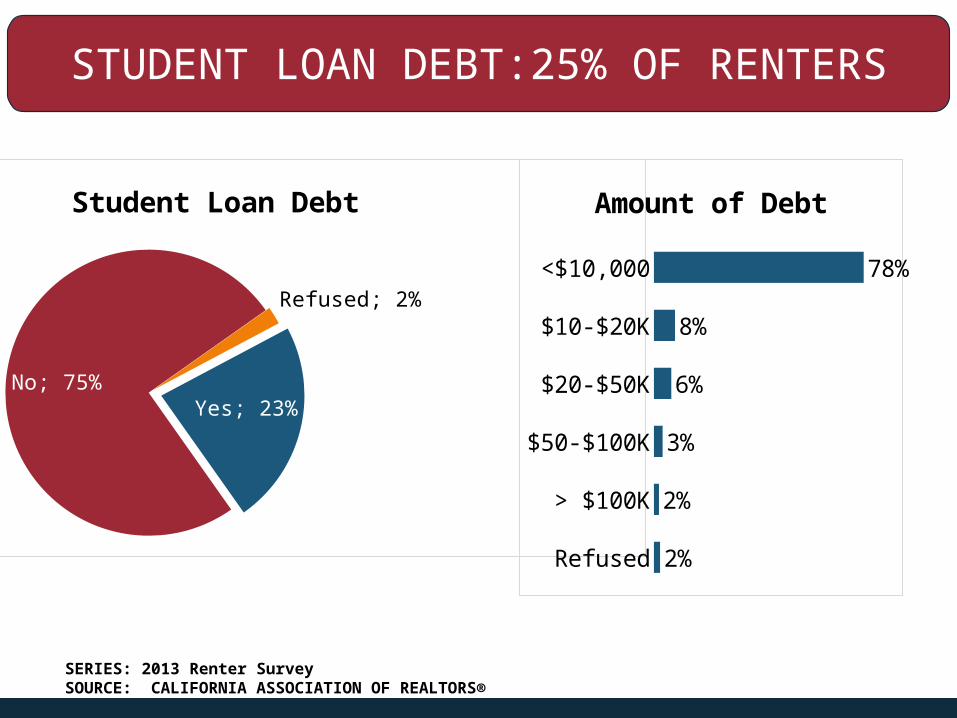
STUDENT LOAN DEBT:25% OF RENTERS
Yes; 23%No; 75%
Refused; 2%
Student Loan Debt
SERIES: 2013 Renter SurveySOURCE: CALIFORNIA ASSOCIATION OF REALTORS®
<$10,000
$10-$20K
$20-$50K
$50-$100K
> $100K
Refused
78%
8%
6%
3%
2%
2%
Amount of Debt
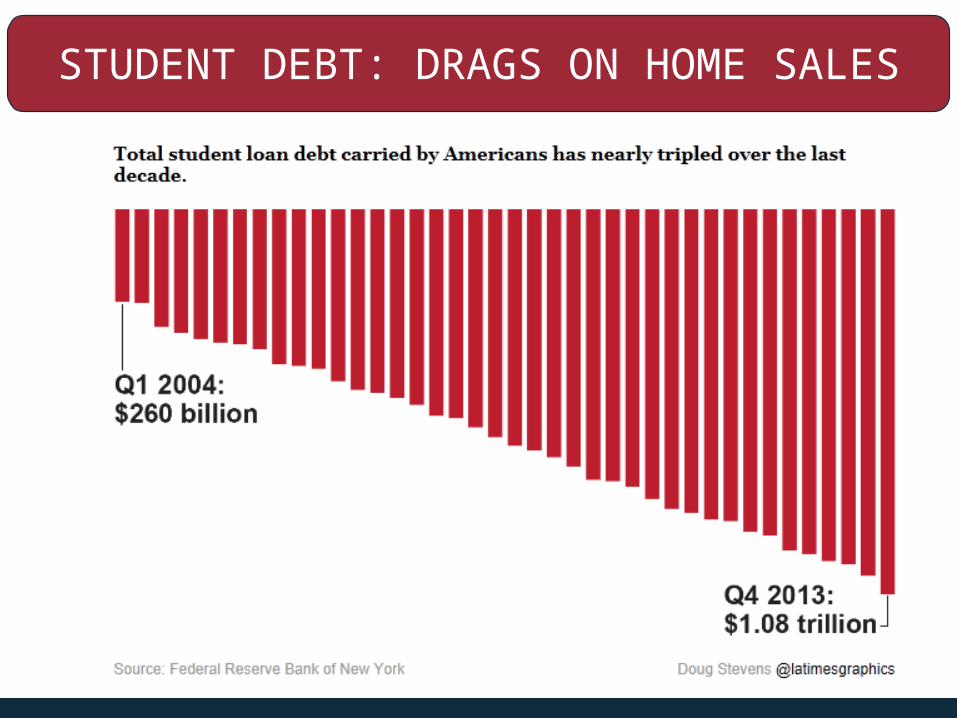
STUDENT DEBT: DRAGS ON HOME SALES
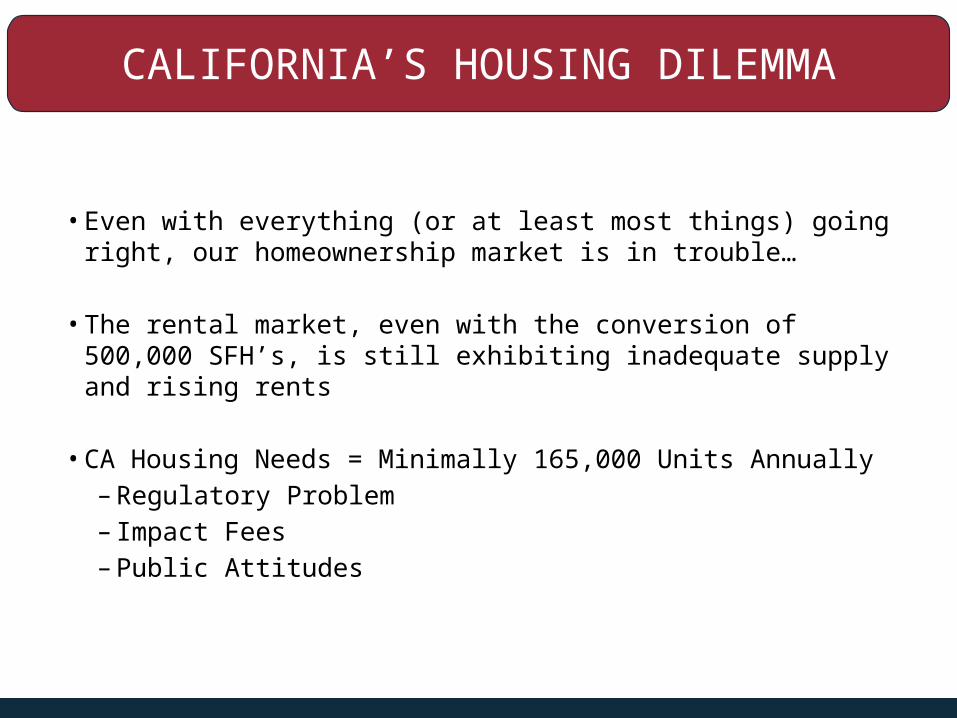
CALIFORNIA’S HOUSING DILEMMA
• Even with everything (or at least most things) going right, our homeownership market is in trouble…
• The rental market, even with the conversion of 500,000 SFH’s, is still exhibiting inadequate supply and rising rents
• CA Housing Needs = Minimally 165,000 Units Annually– Regulatory Problem– Impact Fees– Public Attitudes
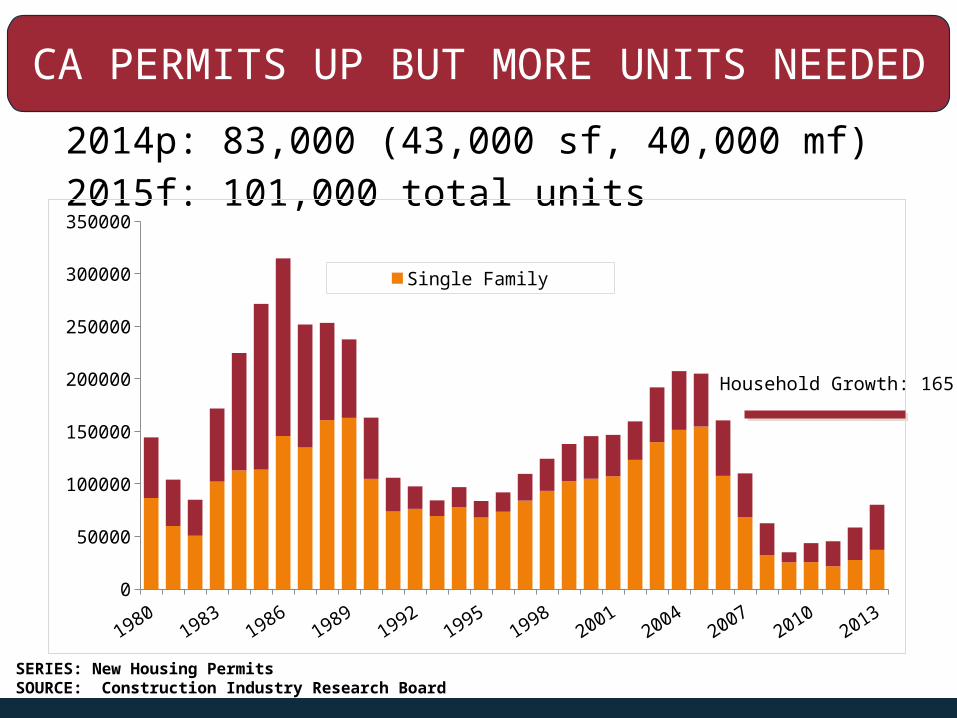
CA PERMITS UP BUT MORE UNITS NEEDED
2014p: 83,000 (43,000 sf, 40,000 mf)2015f: 101,000 total units
SERIES: New Housing PermitsSOURCE: Construction Industry Research Board
0
50000
100000
150000
200000
250000
300000
350000
Single Family Multi-Family
Household Growth: 165,000/yr

2015 FORECAST
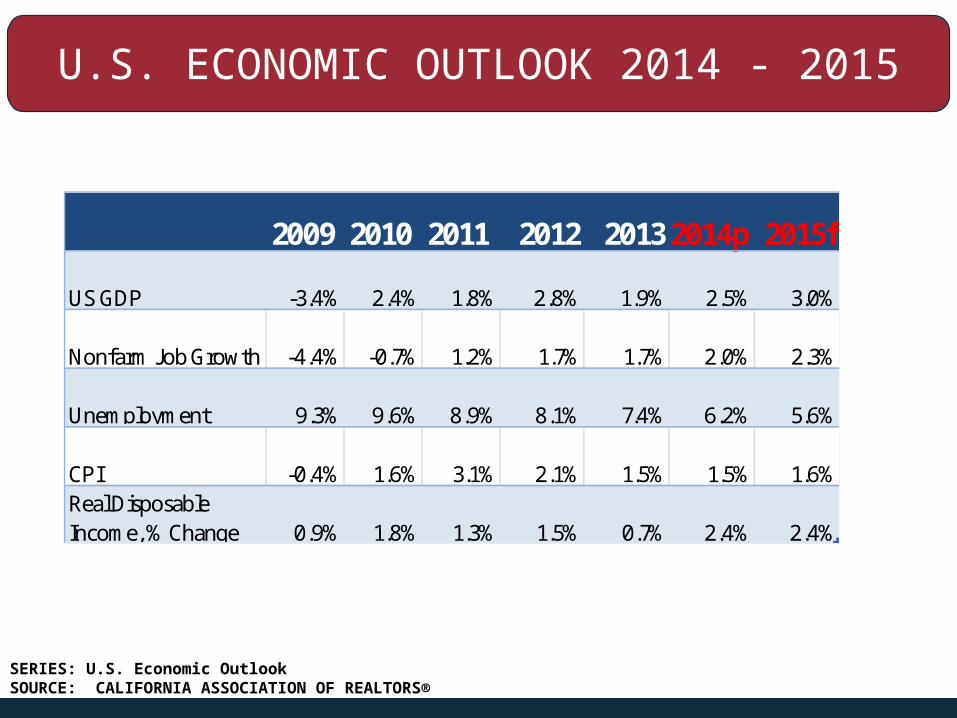
U.S. ECONOMIC OUTLOOK 2014 - 2015
2009 2010 2011 2012 20132014p 2015f
US GDP -3.4% 2.4% 1.8% 2.8% 1.9% 2.5% 3.0%
Nonfarm Job Growth -4.4% -0.7% 1.2% 1.7% 1.7% 2.0% 2.3%
Unemployment 9.3% 9.6% 8.9% 8.1% 7.4% 6.2% 5.6%
CPI -0.4% 1.6% 3.1% 2.1% 1.5% 1.5% 1.6%Real Disposable Income, % Change 0.9% 1.8% 1.3% 1.5% 0.7% 2.4% 2.4%
SERIES: U.S. Economic OutlookSOURCE: CALIFORNIA ASSOCIATION OF REALTORS®
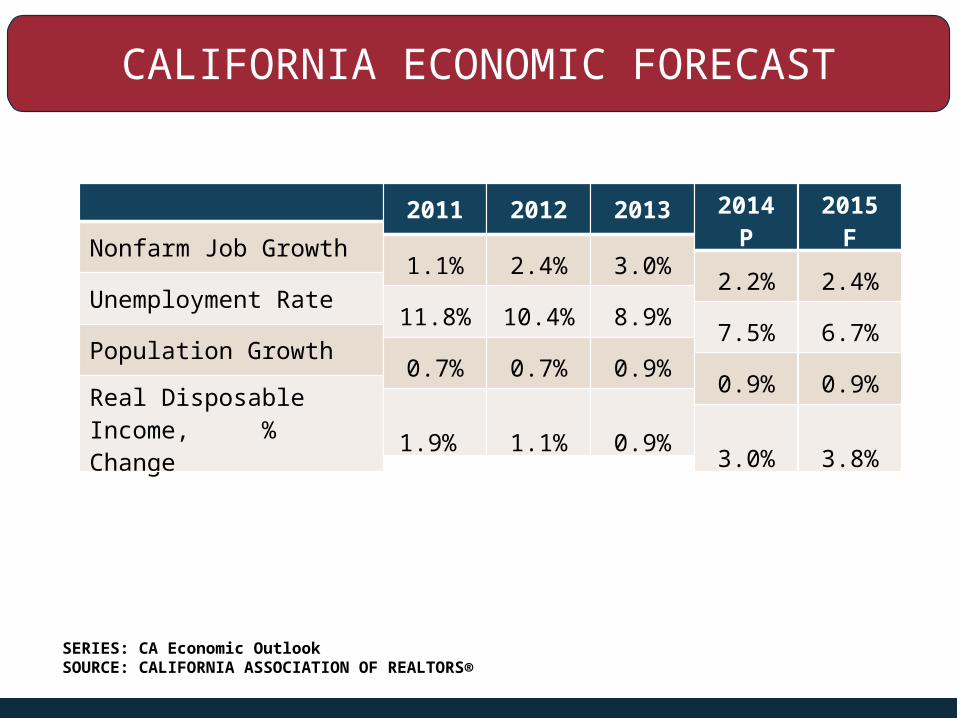
CALIFORNIA ECONOMIC FORECAST
SERIES: CA Economic OutlookSOURCE: CALIFORNIA ASSOCIATION OF REALTORS®
Nonfarm Job Growth
Unemployment Rate
Population Growth
Real Disposable Income, % Change
2011
1.1%
11.8%
0.7%
1.9%
2012
2.4%
10.4%
0.7%
1.1%
2013
3.0%
8.9%
0.9%
0.9%
2014 P
2.2%
7.5%
0.9%
3.0%
2015 F
2.4%
6.7%
0.9%
3.8%
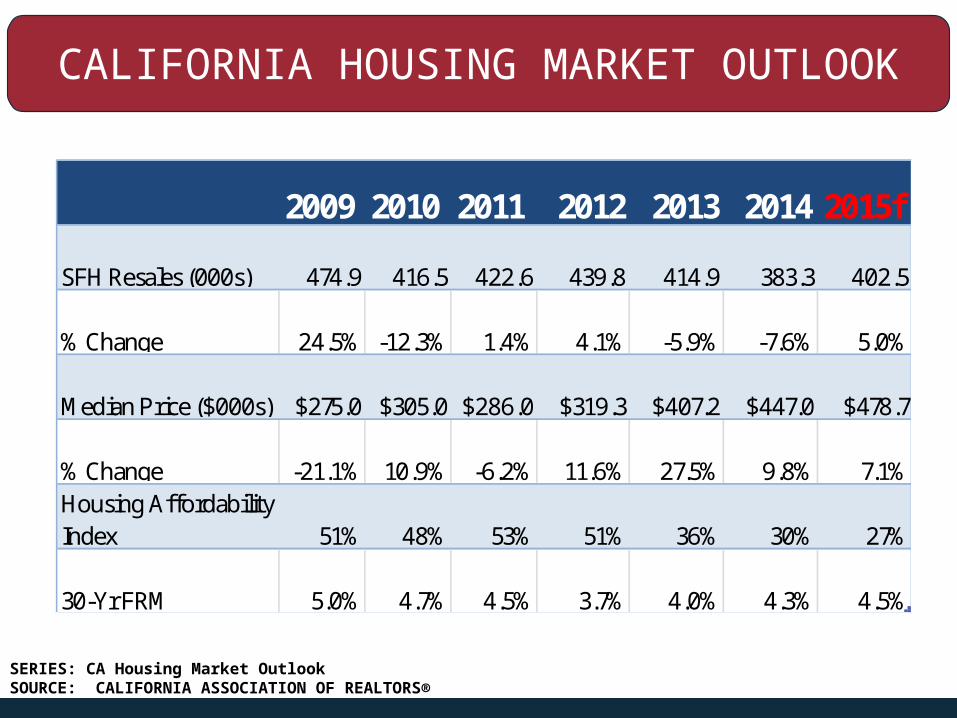
CALIFORNIA HOUSING MARKET OUTLOOK
2009 2010 2011 2012 2013 20142015f
SFH Resales (000s) 474.9 416.5 422.6 439.8 414.9 383.3 402.5
% Change 24.5% -12.3% 1.4% 4.1% -5.9% -7.6% 5.0%
Median Price ($000s) $275.0 $305.0 $286.0 $319.3 $407.2 $447.0 $478.7
% Change -21.1% 10.9% -6.2% 11.6% 27.5% 9.8% 7.1%Housing Affordability Index 51% 48% 53% 51% 36% 30% 27%
30-Yr FRM 5.0% 4.7% 4.5% 3.7% 4.0% 4.3% 4.5%
SERIES: CA Housing Market OutlookSOURCE: CALIFORNIA ASSOCIATION OF REALTORS®
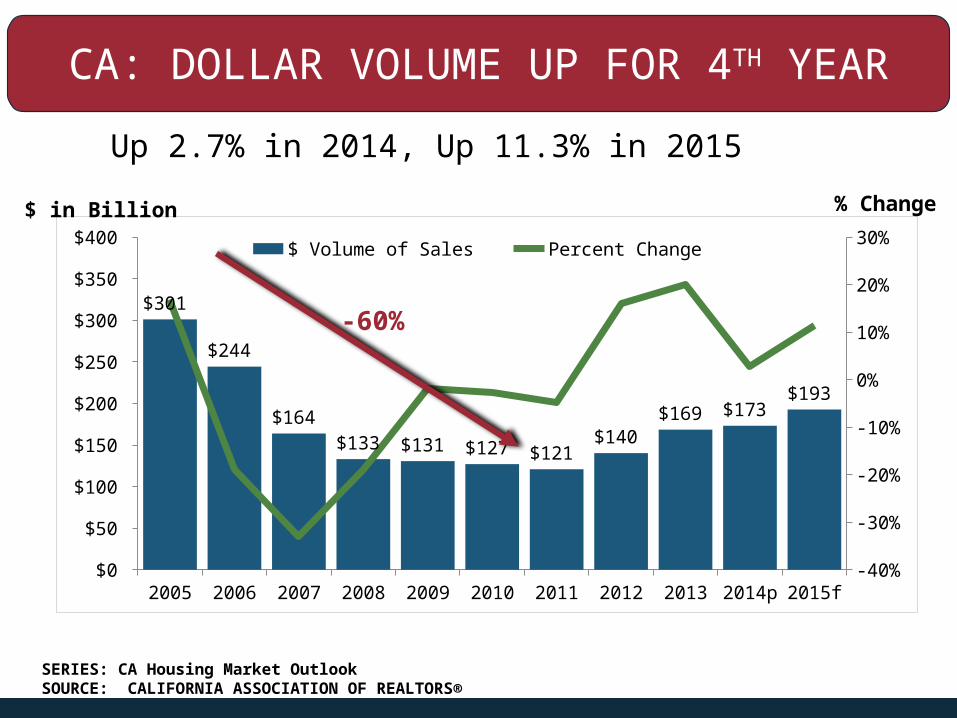
CA: DOLLAR VOLUME UP FOR 4TH YEAR
2005 2006 2007 2008 2009 2010 2011 2012 2013 2014p 2015f$0
$50
$100
$150
$200
$250
$300
$350
$400
-40%
-30%
-20%
-10%
0%
10%
20%
30%
$301
$244
$164 $133 $131 $127 $121
$140 $169 $173
$193
$ Volume of Sales Percent Change
% Change$ in Billion
-60%
SERIES: CA Housing Market OutlookSOURCE: CALIFORNIA ASSOCIATION OF REALTORS®
Up 2.7% in 2014, Up 11.3% in 2015

INTERNATIONAL BUYERSMAKE THEIR MARK
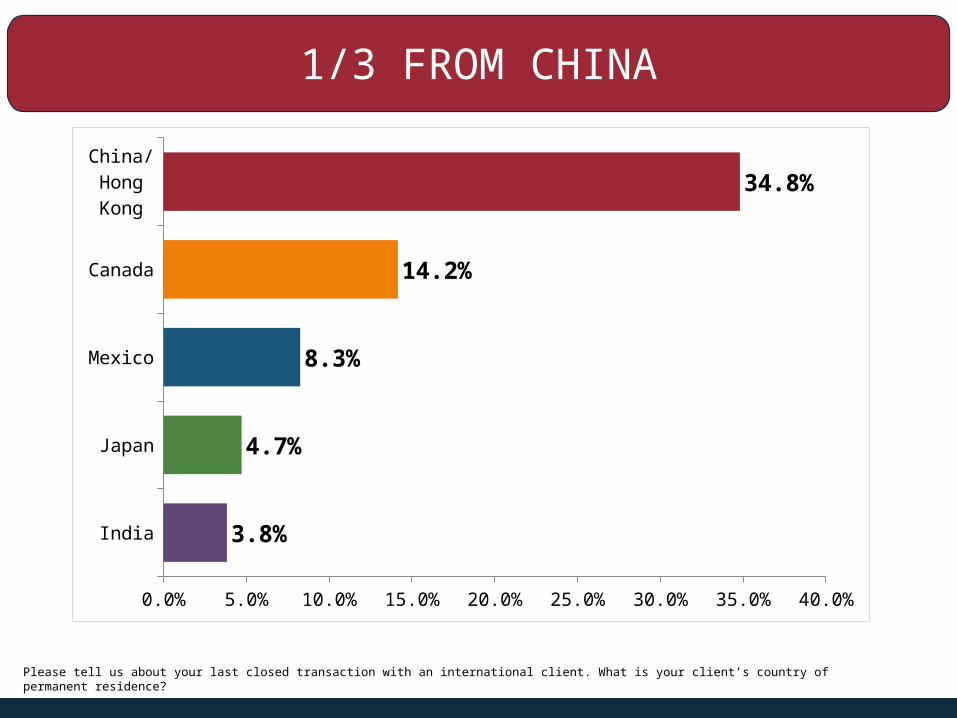
1/3 FROM CHINA
Please tell us about your last closed transaction with an international client. What is your client’s country of permanent residence?
India
Japan
Mexico
Canada
China/Hong Kong
0.0% 5.0% 10.0% 15.0% 20.0% 25.0% 30.0% 35.0% 40.0%
3.8%
4.7%
8.3%
14.2%
34.8%
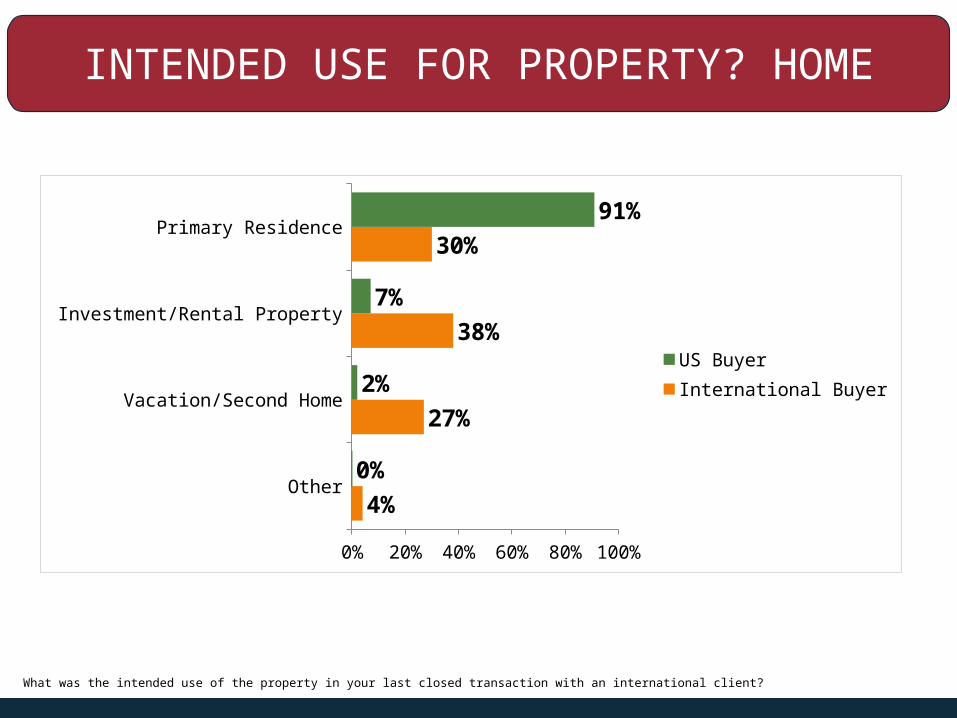
INTENDED USE FOR PROPERTY? HOME
Other
Vacation/Second Home
Investment/Rental Property
Primary Residence
0% 20% 40% 60% 80% 100%
4%
27%
38%
30%
0%
2%
7%
91%
US BuyerInternational Buyer
What was the intended use of the property in your last closed transaction with an international client?
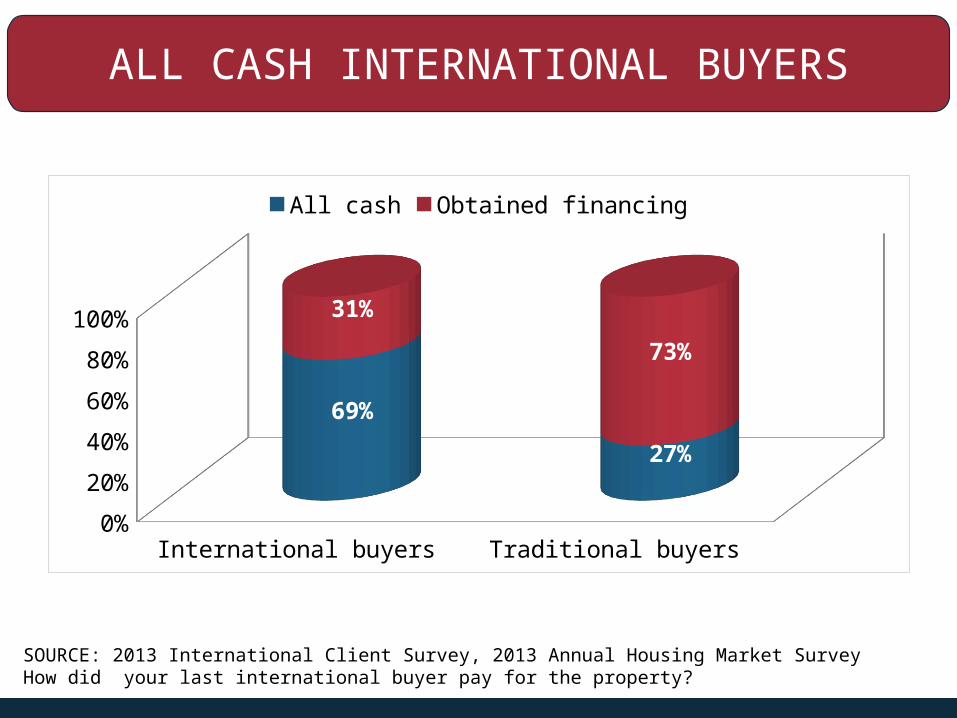
ALL CASH INTERNATIONAL BUYERS
International buyers Traditional buyers0%
20%
40%
60%
80%
100%
69%
27%
31%
73%
All cash Obtained financing
SOURCE: 2013 International Client Survey, 2013 Annual Housing Market SurveyHow did your last international buyer pay for the property?

MILLENNIALS: TOMORROW’S HOME OWNERS?
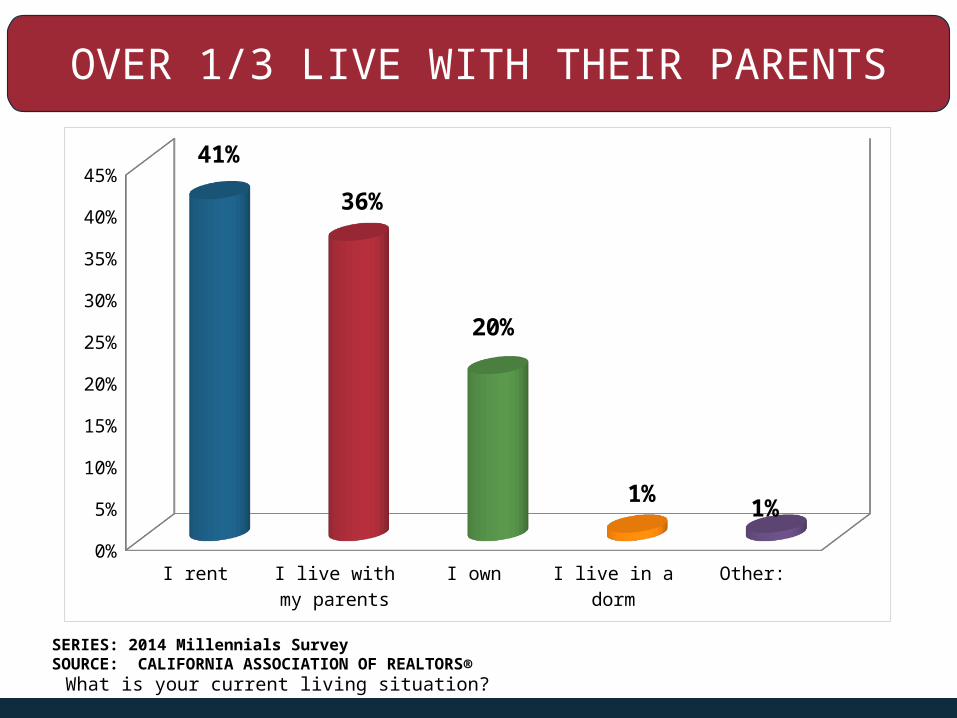
OVER 1/3 LIVE WITH THEIR PARENTS
What is your current living situation?
I rent I live with my parents
I own I live in a dorm
Other:0%
5%
10%
15%
20%
25%
30%
35%
40%
45%41%
36%
20%
1%1%
SERIES: 2014 Millennials SurveySOURCE: CALIFORNIA ASSOCIATION OF REALTORS®
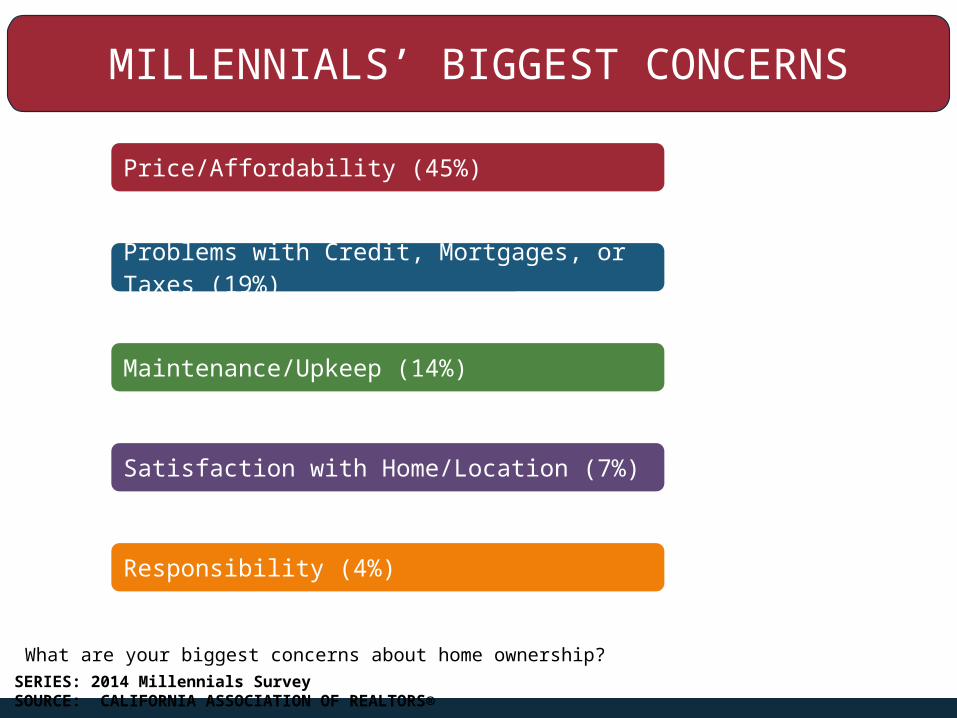
MILLENNIALS’ BIGGEST CONCERNS
What are your biggest concerns about home ownership?
Price/Affordability (45%)
Problems with Credit, Mortgages, or Taxes (19%)
Maintenance/Upkeep (14%)
Satisfaction with Home/Location (7%)
Responsibility (4%)
SERIES: 2014 Millennials SurveySOURCE: CALIFORNIA ASSOCIATION OF REALTORS®
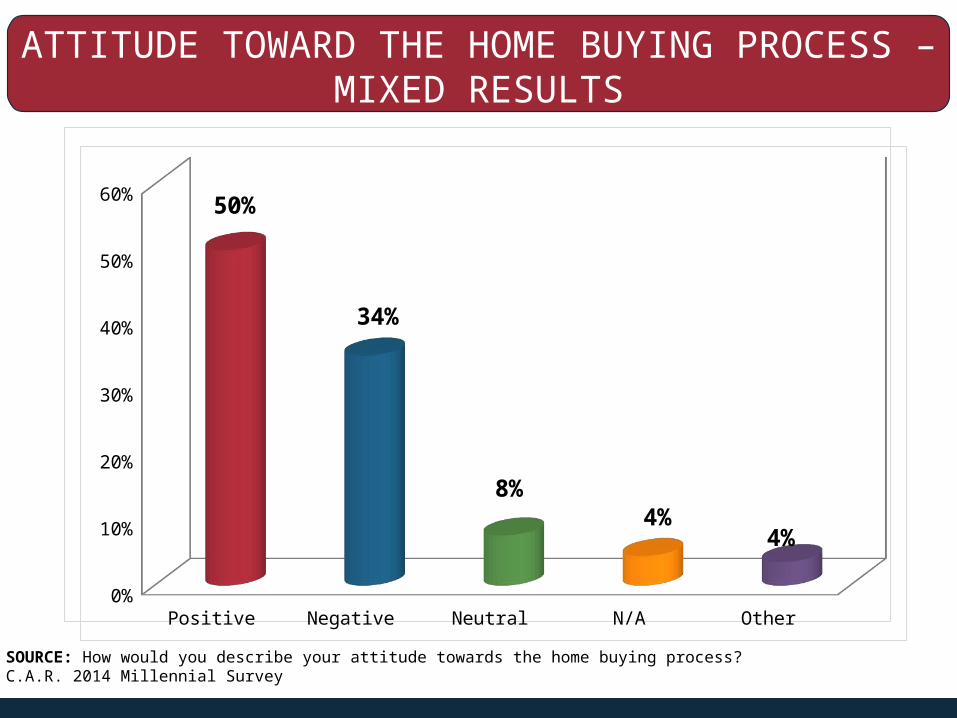
ATTITUDE TOWARD THE HOME BUYING PROCESS – MIXED RESULTS
SOURCE: How would you describe your attitude towards the home buying process?C.A.R. 2014 Millennial Survey
Positive Negative Neutral N/A Other0%
10%
20%
30%
40%
50%
60%50%
34%
8%4%
4%
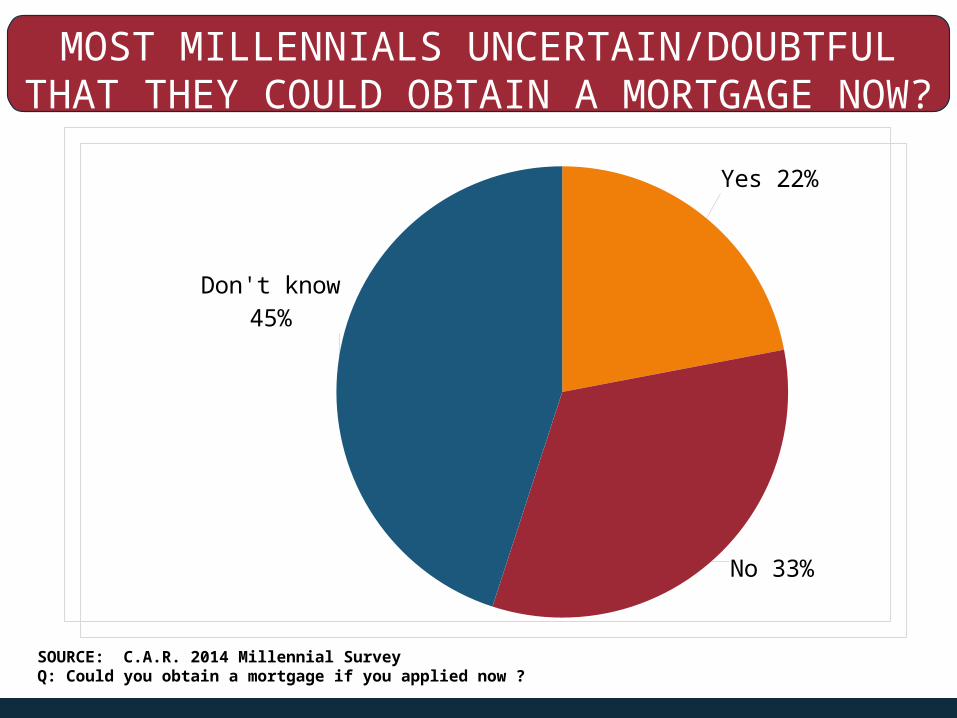
MOST MILLENNIALS UNCERTAIN/DOUBTFUL THAT THEY COULD OBTAIN A MORTGAGE
NOW?AMILLENNIAL ETHNICITY
SOURCE: C.A.R. 2014 Millennial SurveyQ: Could you obtain a mortgage if you applied now ?
Yes 22%
No 33%
Don't know 45%
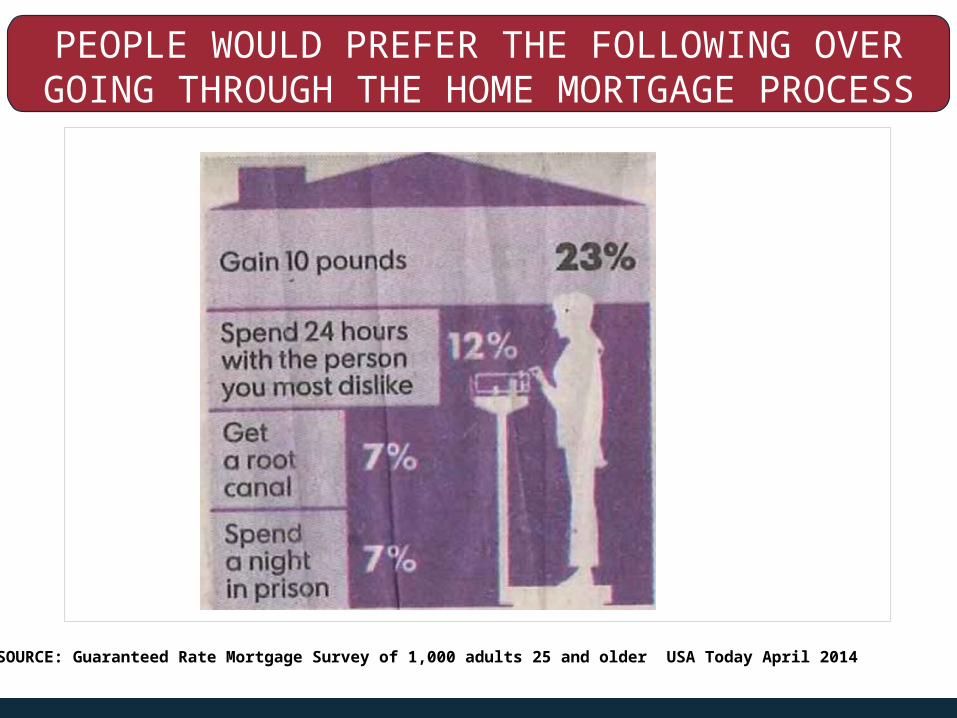
PEOPLE WOULD PREFER THE FOLLOWING OVER GOING THROUGH THE HOME MORTGAGE
PROCESS AGAIN:
SOURCE: Guaranteed Rate Mortgage Survey of 1,000 adults 25 and older USA Today April 2014

THE MIRACLE OF FLIGHT
• https://www.youtube.com/watch?v=b3dYS7PcAG4
• http://www.cc.com/video-clips/1myllo/stand-up-louis-ck--the-miracle-of-flight

STAY CONNECTED WITH RESEARCH
CARResearchGroup
CARResearchInfo
On.car.org/CARResearch
Housingmatters.car.org

THANK YOU!
www.car.org/[email protected]
This presentation can be found on www.car.org/marketdata
Speeches & Presentations