Embed Size (px)
Citation preview

18 T H A N N U A L L A T I N A M E R I C A
C O N F E R E N C E
L O N D O N S E P T E M B E R 1 4 - 1 6 , 2 0 1 5
2015

O V E R V I E W
01
2

O V E R V I E W 1 . 1
SONDA IS THE LEADING LATIN AMERICAN-
OWNED IT SERVICES PROVIDER
Founded in 1974 and headquartered in Santiago, Chile
Presence in 10 countries in the region with main
operations in Chile, Brazil and Mexico
• Revenues derived from multi-year contracts and
recurring revenue
• Most of solutions have countercyclical characteristics
Diversified blue-chip client base
• Revenues derived from multi-year contracts and
recurring revenue
• Most of solutions have countercyclical characteristics
Integrated one-stop shop business model
• Comprehensive IT offering
• Partnerships with worldwide leading
technology suppliers
Key financial metrics (2014)
• Revenues : US$ 1,447.8 mm 1
• EBITDA : US$ 213.9 mm 1
• Net Debt / EBITDA: 0.1x
Revenue Breakdown (2014)
EBITDA Breakdown (2014)
1 Financial data translated to US$ using the end of period exchange rate for 2014 $606.75 CLP/USD 2 OPLA includes : Argentina, Colombia, Costa Rica, Ecuador, Perú, Panamá and Uruguay
IT Services56%
Software Applications
8%
Platforms36%
Chile41%
Brazil31%
Mexico11%
OPLA²17%
IT Services53%
Software Applications
25%
Platforms22%
Chile35%
Brazil44%
Mexico8%
OPLA²13%
3

S U C C E S F U L G R O W T H H I S T O R Y 1 . 2
1974
SONDA Foundation in
association with COPEC
1974 – 1983
• Joint Venture with Digital
Equipment Corp.
• First full outsourcing services
contract
• Applications for pension funds
• Applications for health insurance
providers
• Banking industry applications
• First large systems integration
project
• Launching of our first ERP
1984 – 2005
International Expansion
• Peru (1984) and Argentina (1986)
• Ecuador (1990) and Uruguay (1994)
• Traffic lights control system in
Santiago and São Paulo
• Solutions for pensions funds in
Argentina and Peru
• Banking projects in Indonesia,
Thailand and Taiwan
• Colombia (2000)
• Mobile telephony projects in Brazil,
Argentina and Paraguay
• Brazil (2002), Costa Rica (2003) and
Mexico (2004)
• New Chilean identification system
(Chilean Civil Registry)
2006 - 2013
Regional Consolidation
• IPO (2006)
• Payment solution for Santiago’s public transportation system (Transantiago)
• Livestock traceability (Uruguay and Colombia)
• Web -based solution for government procurement (Chile, Colombia, Argentina, Panama)
• Acquisitions (2006-2009): Qualita in Mexico, Procwork in Brazil and Red Colombia in
Colombia
• Acquisitions (2010): Softeam, Telsinc and Kaizen in Brazil, NextiraOne in Mexico and Ceitech
in Argentina
• Corporate Cloud Computing
• Acquisition of Quintec in Chile (2011)
• Payment solution for Ciudad de Panama’s public transportation system (Metrobus)
• Acquisitions (2012): Pars and Elucid in Brazil
• New Headquarter and Datacenter in Brazil
• (2013): Opening of new TIER III Certified - Mega Datacenter
in Chile
2014 • Acquisition of CTIS in Brazil.
• Successful placement of corporate bonds (CLP$36,300 million).
• SONDA receives the highest CISCO qualification for Cloud services and
communications.
• SONDA will provide a system to collect passenger fares for the Panama city subway,
winning a ten year concession worth US$12.2 million.
• SONDA is recognized as the main sales channel for HP servers in Latin America.
• CEEE awards SONDA with the contract to support the expansion and modernization
of the electrical system in the State of Rio Grande do Sul in Brazil.
• The Chilean Uniformed Police renew their personal computers using the Managed
Device Service from SONDA.
• SONDA is integrated into the Cisco Intercloud network. 4

SONDA IS FOCUSED ON
SATISFYING CUSTOMERS’
BUSINESS NEEDS…
IT
IMPLEMENTATION
LIFE CYCLE
V A L U E P R O P O S I T I O N 1 . 3
01 IT Business
Strategy
02 IT Solution
Design
03 Infrastructure
Supply
04 System
Integration
05 Operation and
Maintenance

I T I N D U S T R Y I N L A T A M
02

L A T I N A M E R I C A, O N E O F T H E F A S T E S T G R O W I N G R E G I O N S
I N T H E W O R D 2 . 1
• In Latin America, IT spending as a percentage
of GDP is between 1.0% and 2.6%.
• In developed economies, IT spending as a
percentage of GDP is over 2.6% and can reach
up to 3.9%.
• The gap between the two markets has been
reduced in recent years, due to higher IT
spending growth in Latin America.
IT Spending as a Percentage of GDP
(December 2014)
Sources:
World Bank GDP Ranking
The Goldman Sachs Group, Inc. Global Investment Research.Latin America: Technology, April 16,2014 7
BrazilMexico
Chile
Colombia
ArgentinaRussia
IndiaChina
United StatesCanada
South Korea
Japan
Australia
-
10,000
20,000
30,000
40,000
50,000
60,000
70,000
0.0% 0.5% 1.0% 1.5% 2.0% 2.5% 3.0% 3.5% 4.0% 4.5%G
DP
per
cap
ita
(US
$ m
ill)
IT Spending/GDP

C O M P A N Y H I G H L I G H T S
03
8

C O M P A N Y H I G H L I G H T S 3 . 1
9

L E A D I N G L A T I N - A M E R I C A N I T S E R V I C E S C O M P A N Y 3 . 2
The one-stop shop for IT Services in Latin America
• Integrated solutions servicing clients at all stages of the
IT adoption lifecycle
Long-standing presence in the region, focusing on long-term
relationships with corporate clients
Presence in 10 countries and over 4,500 cities under
coverage
• 4th largest provider of IT services in Latin America
behind main global players
• Local competitors generally lack pan-regional presence
Strong positioning in Chile and increasing share in the rest of
the region, particularly in Brazil
• Leader in Chile with ~15% market share in IT Services
• Integrated regional services network, strongly position
SONDA to take advantage of the expansion of the
Latin American IT market
Further consolidation in the region by acquiring and
successfully integrating new acquisitions
SONDA is the largest Latin American-owned IT services provider
10

P R E S E N C E I N A G R O W I N G A N D U N D E R P E N E T R A T E D M A R K E T 3 . 3
SONDA OPERATES IN A GROWING REGION WITH LOW RISK
GDP Growth (%)1
2014 Inflation Rate (%) 1
1Source: IMF 2Others LatAm Includes Argentina, Colombia, Costa Rica, Ecuador, Peru, Panama and Uruguay. 3Western Europe includes France, Germany, Italy, Netherlands, Spain and United Kingdom.
3
4
11
3.8% 3.3%
2.0%
5.2%
1.4%0.3%
3.7%
2.1%
3.6% 3.9%
2.2%1.7%
Chile Brazil Mexico Others Latam US & Canada WesternEurope
2006-2014 2015-2020e
3.6%
5.5%
4.2%5.1%
1.9% 2.0%3.0%
4.9%
3.0% 3.5%2.1%
1.4%
Chile Brazil Mexico Others Latam US & Canada WesternEurope
2006-2014 2015-2020e

D I V E R S I F I E D B L U E – C H I P C O S T U M E R B A S E 3 . 4
BASIS FOR A SOLID AND STABLE REVENUE STREAM
Client focus on blue-chip companies
• Large and medium size companies
• Regional clients
Long term relationship with clients
• Multiple contracts with clients that average 3 years
• Significant cross-selling
• ~60% of revenues derived from multi-year contracts
and recurring revenue
• Solutions with countercyclical characteristics
Client, industry and geographic diversification
• More than 5,000 clients throughout the region
• 10 largest clients represent ~20% of consolidated
revenue1
• No contracted service represents more than ~4.0% of
revenue1
• No significant industry concentration
• Balanced geographical revenue mix, with exposure to
all sizeable economies in Latam
Some of our Blue-Chip Clients
Revenue Breakdown (December 31, 2014)
By Industry By Country Retail17%
Financial13%
Manufacturing16%Public Sector
6%
Telecom9%
Utilities5%
Healthcare2%
Others32% Chile
35%
Brazil 44%
Mexico 8%
OPLA 13%
1 December, 2014
12

I N T E G R A T E D O N E – S T O P S H O P B U S I N E S S M O D E L 3 . 5
• Unparallel capacity to deliver IT services through all the
region
• Independent IT services provider with no restrains to offer
the best technological solution available
• World-Class credentials
World-Leading IT Partners
Regional alliances with the principal global technology vendors
• Access to latest technology products
• International best practices
• Platform products serve as a base to provide other higher value-
added services and to develop long-term client relationships
Wide Range of Products and Services
Strategic Consulting
IT Consulting
BPO / ASP
IT Outsourcing
Systems Integration
Business Solutions
Product Engineering
Software Engineering
Application Maintenance
Application Development
Less Focused More focused
13
Source: SONDA

Organic Growth
29%
Acquisitions71%
Organic Growth
36%
Acquisitions64%
$ 374.135 $ 445.481
$ 592.819 $ 681.191 $ 672.288
$ 878.455
2009 2010 2011 2012 2013 2014
O P P O R T U N I T Y T O C O N T I N U E G R O W I N G 3 . 6
SUCCESFULL TRIENNIAL INVESTMENTS PLANS EXECUTED IN THE PAST
Since 2007, SONDA has invested around US$360 mm in Capex for organic growth and approx. US$ 600 mm in acquisitions
Sonda’s Triennial Investmen Plans
US$
700mm US$
448mm² US$
277mm¹
Note: Financial data translated to US$ using the end of period exchange rate for 2014 $606.75 CLP/USD 1 Represents the amount of investment executed between 2007 and 2009. 2 Represents the amount of investment executed from 2010 to 2012.
³ Note: Figures for 2006-2009 are under local GAAP, while figures since 2010 are under IFRS.
2007 – 2009 2010 – 2012 2013 – 2015
Triennial plans have had a
key role in boosting
SONDA’s growth pace
Organic Growth
48%Acquisitions
52%
14

Year Target Country Focus / Rationale EV/Sales
2007 Brazil Establish solid footprint in Brazil
0.9 x Become a relevant regional SAP integrator
2008 Colombia Establish solid footprint in Colombia
0.4 x Boost IT services
2010
Brazil Strengthen position in Brazil
0.6 x Expand offerings of virtualization, communication and cloud computing services
Brazil Expand offerings of virtualization, communication and cloud computing services 0.4 x
Mexico Strengthen position in Mexico
n.a Expand offerings of virtualization, communication and cloud computing services
Brazil Enhance offerings of fiscal solutions 0.9 x
Argentina Increase presence in Argentina in IT infrastructure support
0.4 x Enhance geographic coverage
2011 Pan-regional
Strengthen position in Chile and Colombia
0.7 x Complement current offering
Boost access to a growing regional retail industry
2012 Brazil Strengthen solutions offering for engineering and design industry in LatAm 0.7 x
Brazil Enhance regional offering of solutions for the utilities industry 1.1 x
2014
Brazil
Expertise in the public sector 0.4 x
Strengthen position in Brazil
O P P O R T U N I T Y T O C O N T I N U E G R O W I N G 3 . 7
CLEAR M&A STRATEGY, BACKED BY SOLID EXECUTION
• Clear strategic rationale of increasing client base and enhancing IT offering
• Wide knowledge of the IT market and successful experience in acquiring and integrating IT companies
• 30+ companies or businesses acquired since 1974, including eleven companies for a total of approx. US$600 mm, since
the IPO in 2006
15

Organic Growth 29%
Acquisitions 71%
O P P O R T U N I T Y T O C O N T I N U E G R O W I N G 3 . 8
2013-2015 TRIENNIAL INVESTMENT PLAN OF US$700 MILLION
To continue developing SONDA’s strategy of profitable growth, while maintaining a solid and stable financial
position and taking advantage of growth opportunities in the IT industry in the region
• Focus in medium and large size companies with a wide multi-
brand offering approach
• Implement new Integration and IT Outsourcing solutions
• Boost services with high value-added
• Target high growth IT spending industries in the region
• Increase wallet-share with strategic clients with high IT spending
Organic Growth
Inorganic Growth
• Focus in LatAm with emphasis in Brazil, Mexico and Colombia,
and opportunistic approach in other regions
• Enhance the client base, strengthen offerings and accelerate
business growth
• Wide knowledge of the IT market and successful experience in
acquiring and integrating IT companies
US$
700mm
2013-2015 Capex Breakdown
16

S O L I D T R A C K R E C O R D O F F I N A N C I A L P E R F O R M A N C E 3 . 9
Solid growth on the back of stable margins …
• SONDA has been profitable every year since it was founded in 1974
• The Company has been able to maintain strong growth throughout the years
Note: Financial data translated to US$ using the end of period exchange rate for 2014 : 606.75 CLP/USD.
$ 308$ 442
$ 704$ 617
$ 734
$ 977
$ 1,123 $ 1,108
$ 1,448
2006 2007 2008 2009 2010 2011 2012 2013 2014
$ 54
$ 80
$ 121 $ 113$ 127
$ 151
$ 193 $ 188
$ 214
2006 2007 2008 2009 2010 2011 2012 2013 2014
17

S O L I D T R A C K R E C O R D O F F I N A N C I A L P E R F O R M A N C E 3 . 10
…coupled with profitability, low leverage and steady dividend payout ratio
Note: Financial data translated to US$ using the end of period exchange rate for 2014 606,75CLP/USD 1 Cash and cash equivalents for the calculation of Net Debt to EBITDA do not include short term investments. 2 SONDA’s dividend policy since 2009 has been based on a 50% payout ratio. Dividends are paid in 2 semi-annual installments.
52 55 67 75
109
78
2009 2010 2011 2012 2013 2014
-0.4
0.81.0
0.4
-0.7
0.1
2009 2010 2011 2012 2013 2014
22
139109
184
49
155.2
2009 2010 2011 2012 2013 2014
50% 50% 50% 50% 50% 50%
2009 2010 2011 2012 2013 2014
18

E X P E R I E N C E D M A N A G E M E N T T E A M B A C K E D B Y A S T R O N G
B O A R D W I T H S O L I D C O R P O R A T E G O V E R N A N C E 3 . 11
HIGH STANDARDS OF CORPORATE GOVERNANCE
• 4 Independent Directors out of a board of 9 members
• Entire board is elected every three years; cumulative voting is permitted for the election of directors
Name Position Years at
Education SONDA Industry
Raúl Vejar CEO 33 33 Electronic Engineer
Rafael Osorio CFO 34 34 Industrial Engineer
Eduardo Borba CEO SONDA Brazil 7 20 BA,Systems Analyst
Raúl Sapunar CEO SONDA CHILE 31 31 Electrical Engineer
Guido Camacho CEO SONDA Mexico 9 37 Electronic Engineer
José Orlandini Service Division Manager 30 33 Electrical Engineer
Alberto Merino Commercial Development
Manager 27 27 Electrical Engineer
Rodrigo Peña Planning and IR Officer 11 22 MBA, Civil Engineer
Name Selected Background
Mario Pavón
(Chairman)
Director of I-Med, other SONDA affiliates and non-
profit org.
Pablo Navarro
(Vice President) Director of Banco Internacional, Multicaja and others
Christian Samsing Director of Banco Internacional
Former CEO of Corpbanca
Jaime Pacheco Held various executive positions at Oracle Chile from
1997 to 2009
Rosario Navarro
Director of TICs for Education in Fundación Chile and
Chairwoman of “Docente al Día”, a learning platform
for teachers.
Juan Antonio Guzmán Chairman of Clínica Indisa, Former Chairman of
Cementos Polpaico, Former Ministry of Education
Mateo Budinich Diez Executive Director of Conicyt, Former Director of
Cámara de Comercio Chileno Americana
Hernán Marió Lores Director of VTR and Mining Companies, Former CEO
and CFO of Entel
Francisco Gutierrez Director of Forus, SM SAAM S.A. and Echeverría
Izquierdo
19

F I N A N C I A L R E V I E W
04
20

$ 76,976
$ 91,663
$ 117,348 $ 114,047
$ 129,761
$ 58,833 $ 58,928
17.3% 15.5% 17.2% 17.0% 14.8% 15.1% 13.7%
2010 2011 2012 2013 2014 1H14 1H15
EBITDA EBITDA Margin
$ 445,481
$ 592,819
$ 681,191 $ 672,288
$ 878,455
$ 390,330$ 429,056
2010 2011 2012 2013 2014 1H14 1H15
4 . 1 R E V E N U E A N D E B I T D A
Consolidated revenue CAGR of 18,5% from 2010 to 2014, which has been accompanied by a CAGR of 13,9% in EBITDA
Consolidated Revenue (CLP$ million) Consolidated EBITDA (CLP$ million)
+9.9% +0.2%
21

$ 246,172
$ 339,840
$ 375,152$ 375,739
$ 568,526
$ 242,919$ 265,258
11.7% 10.4%13.6% 14.9% 13.5% 14.3% 12.1%
2010 2011 2012 2013 2014 1H14 1H15Revenue EBITDA Margin
4 . 2 R E V E N U E A N D E B I T D A M A R G I N
Chile Revenue (CLP$ millions) Ex-Chile Revenue (CLP$ millions)
$ 199,309
$ 252,979
$ 306,039$ 296,549
$ 309,929
$ 147,411$ 163,797
24.2% 22.3% 21.6% 19.6% 17.0% 16.4% 16.4%
2010 2011 2012 2013 2014 1H14 1H15
Revenue EBITDA Margin
+11.1% +9.2%
22

$ 43,891
$ 62,728
$ 84,553$ 90,134
$ 111,678
$ 52,958 $ 51,364
9.1% 9.2% 12.2%19.2% 20.0% 21.1%
14.8%
2010 2011 2012 2013 2014 1H14 1H15
Revenue EBITDA Margin
$ 37,960
$ 68,729$ 60,734
$ 68,052$ 73,529
$ 30,900 $ 33,177
12.9% 12.6% 15.8% 16.0% 19.0% 18.1% 17.2%
2010 2011 2012 2013 2014 1H14 1H15
Revenue EBITDA Margin
$ 164,322
$ 208,383$ 229,866$ 217,553
$ 383,319
$ 159,061$ 180,717
12.1% 10.0%13.6% 12.8% 10.6% 11.2% 10.4%
2010 2011 2012 2013 2014 1H14 1H15
Revenue EBITDA Margin
4.3. R E V E N U E A N D E B I T D A M A R G I N
Brazil Revenue (CLP$ millions) OPLA Revenue (CLP$ millions) Mexico Revenue (CLP$ millions)
+13.6%
+7.4%
-3.0%
23

A P P E N D I X
05
24
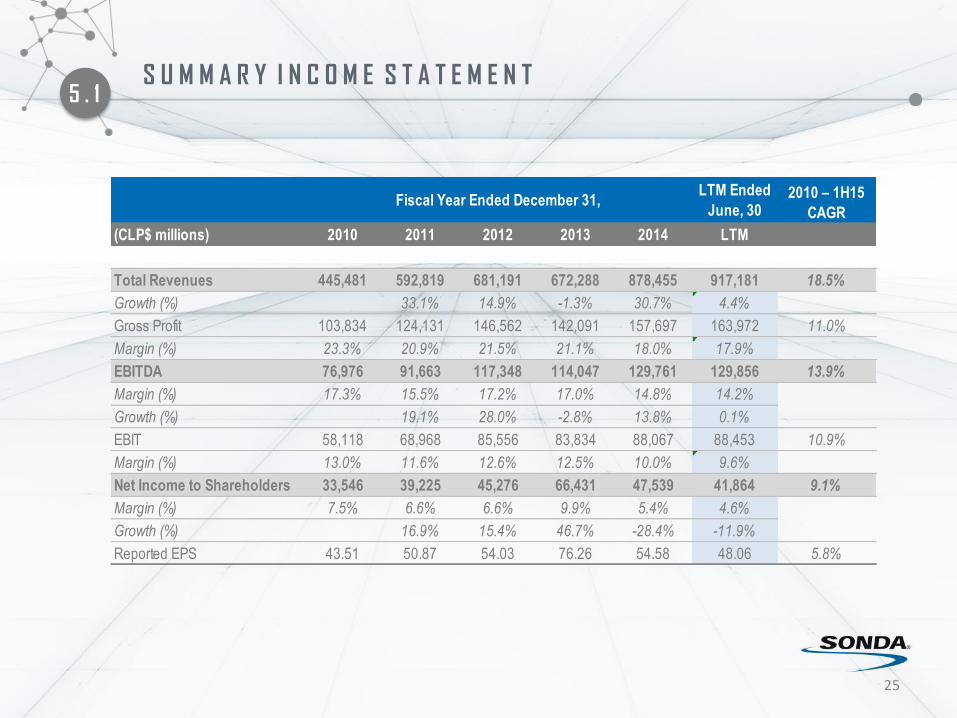
5 . 1 S U M M A R Y I N C O M E S T A T E M E N T
25
(CLP$ millions) 2010 2011 2012 2013 2014 LTM
Total Revenues 445,481 592,819 681,191 672,288 878,455 917,181 18.5%
Growth (%) 33.1% 14.9% -1.3% 30.7% 4.4%
Gross Profit 103,834 124,131 146,562 142,091 157,697 163,972 11.0%
Margin (%) 23.3% 20.9% 21.5% 21.1% 18.0% 17.9%
EBITDA 76,976 91,663 117,348 114,047 129,761 129,856 13.9%
Margin (%) 17.3% 15.5% 17.2% 17.0% 14.8% 14.2%
Growth (%) 19.1% 28.0% -2.8% 13.8% 0.1%
EBIT 58,118 68,968 85,556 83,834 88,067 88,453 10.9%
Margin (%) 13.0% 11.6% 12.6% 12.5% 10.0% 9.6%
Net Income to Shareholders 33,546 39,225 45,276 66,431 47,539 41,864 9.1%
Margin (%) 7.5% 6.6% 6.6% 9.9% 5.4% 4.6%
Growth (%) 16.9% 15.4% 46.7% -28.4% -11.9%
Reported EPS 43.51 50.87 54.03 76.26 54.58 48.06 5.8%
2010 – 1H15
CAGR
LTM Ended
June, 30Fiscal Year Ended December 31,

5 . 2 S U M M A R Y B A L A N C E S H E E T
26
June 30,
(CLP$ millions) 2010 2011 2012 2013 2014 2015
Cash and Equivalents 24,981 32,936 61,310 170,861 75,846 61,212
Short-term Investments 61,675 1,402 6,595 5,093 5,789 3,270
Current Accounts Receivable 122,878 177,839 173,321 145,287 226,319 219,400
PP&E 59,137 76,950 89,113 91,242 99,613 97,713
Goodwill 128,006 149,617 194,560 183,977 258,613 240,459
Other Assets 110,313 138,032 168,610 145,518 175,061 173,268
Total Assets 506,989 576,776 693,509 741,977 841,242 795,323
Current Accounts Payable 56,354 88,314 99,255 103,404 131,169 127,961
TotalDebt 86,970 123,892 105,523 94,117 98,592 94,125
Other Liabilities 68,770 55,250 90,223 69,083 108,924 86,232
Total Liabilities 212,094 267,455 295,001 266,604 338,686 308,318
Minority Interest 3,569 4,109 4,737 5,347 5,920 6,596
Common Equity 291,326 305,212 393,771 470,025 496,636 480,409
Total Liabilities and Equity 506,989 576,776 693,509 741,977 841,242 795,323
Fiscal Year Ended December 31,

5 . 3 S U M M A R Y C A S H F L O W S T A T E M E N T
27
(CLP$ millions) 2010 2011 2012 2013 2014 2015
Net Cash Flows from (Used in) Operating
Activities58,646 33,447 89,656 93,720 66,784 17,201
Capex (65,085) (58,263) (96,538) (25,829) (94,152) (17,541)
Other (47,216) 41,416 750 35,994 37,390 3,159
Net Cash Flows from (Used in) Investing
Activities(112,300) (16,847) (95,788) 10,165 (56,763) (14,382)
Dividends Paid (19,161) (20,576) (21,252) (26,921) (33,527) (11,957)
Interest Paid (2,722) (3,019) (4,821) (1,754) (4,110) (1,642)
Other (9,662) 15,204 67,807 33,001 (65,801) (3,980)
Net Cash Flows from (Used in) Financing
Activities(31,544) (8,391) 41,734 4,326 (103,438) (17,579)
Effect of Exchange Rate Changes on Cash
and Cash Equivalents(1,431) (254) (7,227) 1,340 (1,600) (2,617)
Net Increase (Decrease) in Cash and Cash
Equivalents(86,630) 7,955 28,374 109,551 (95,016) (17,378)
Fiscal Year Ended December 31, June, 30

6 . 0 C O N T A C T I N F O R M A T I O N
Phone (56-2) 2 657 53 02
Teatinos 500,
Santiago, CHILE
www.SONDA.com
28