Embed Size (px)
Citation preview

2015 Auto Contracts Wrap-Up
Kristin Dziczek, Director, Labor & Industry, Center for Automotive Research
Federal Reserve Bank of Chicago
23rd Annual Automotive Outlook Symposium
3 June 2016
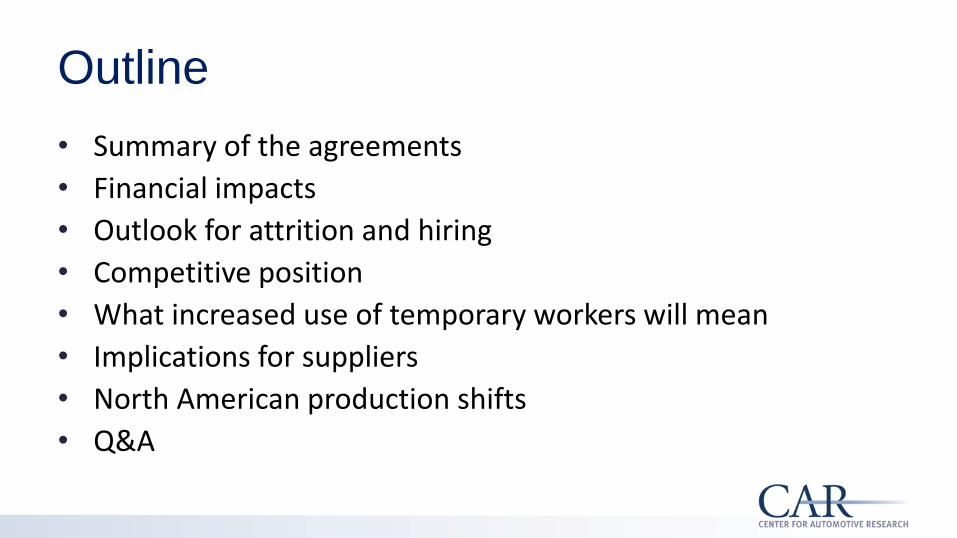
Outline
• Summary of the agreements
• Financial impacts
• Outlook for attrition and hiring
• Competitive position
• What increased use of temporary workers will mean
• Implications for suppliers
• North American production shifts
• Q&A
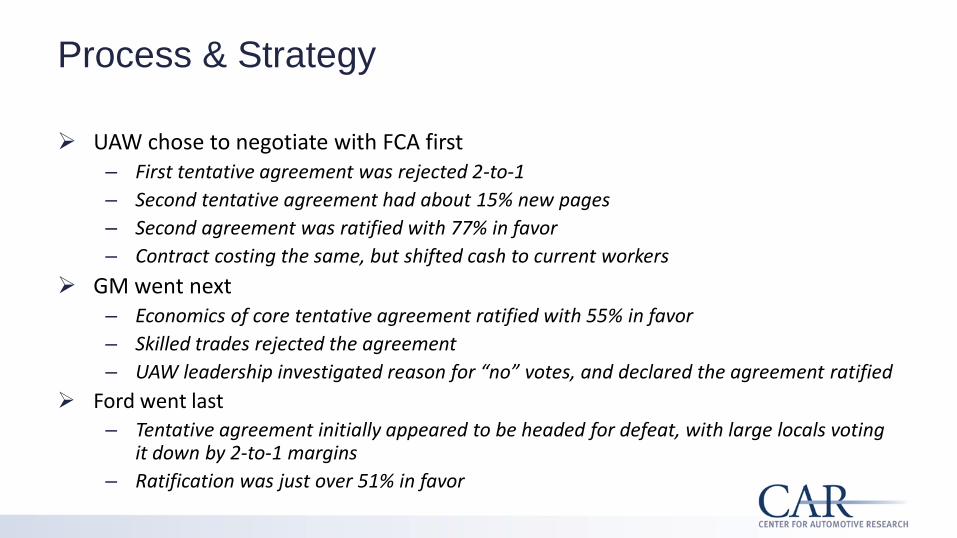
Process & Strategy
UAW chose to negotiate with FCA first – First tentative agreement was rejected 2-to-1
– Second tentative agreement had about 15% new pages
– Second agreement was ratified with 77% in favor
– Contract costing the same, but shifted cash to current workers
GM went next – Economics of core tentative agreement ratified with 55% in favor
– Skilled trades rejected the agreement
– UAW leadership investigated reason for “no” votes, and declared the agreement ratified
Ford went last
– Tentative agreement initially appeared to be headed for defeat, with large locals voting it down by 2-to-1 margins
– Ratification was just over 51% in favor

New 2015 UAW Contract Summary
Signing Bonus $3,000 for “in progression” workers $4,000 for legacy workers
$8,500, with $1,500 “pull-ahead” profit sharing $2,000 for temporary workers
$8,000 for permanent workers $2,000 for temps >90 days at signing
Wages <2007:3%, 4% lump, 3%, 4% lump 2007-2015: 8-year grow-in to $29 >2015: 4-to-8 year grow-ins to $25
<2007:3%, 4% lump, 3%, 4% lump 2007-2015: 8-year grow-in to $29 >2015: 4-to-8 year grow-ins to $25
<2007: 3%, 4% lump, 3%, 4% lump 2007-2015: 7-year grow-in to $29 >2015 4-to-8 year grow-ins to $25
Jobs +103; $3.4B potential total investment
+8,500 new &/or secured; $9B investment
+3,300 created & retained; $1.9B new+$6.4B announced=$8.3B
Retirement Incentives
$25K targeted $70K, tilted toward production $60K for 4,000 retirement eligible production workers
Profit-Sharing $800 for each margin point > 2% $1/$1 Million once margin >2% $12K cap removed
$1,000/$1 Billion once margin >2%
Retirees $1,000 vehicle voucher (one-time) $250/year for retirees; $125/year for surviving spouses
$500 gift card (one-time)
Other Bonuses
$0-1,500 annual quality bonus $1K-5K one-time for World Class Mfg
4 $1,500 annual inflation protection 4 $250 annual competitiveness bonus
4 $1K annual performance bonuses 4 $500 annual quality bonuses
Health Care No change to worker contribution; maintained distinction between traditional and in-progression plans
No changes to worker contribution; same plan for traditional & in-progression Health care plan for temp workers
No changes to worker contribution; same plan for traditional & in-progression Health care plan for temp workers

Wage Rates Under 2015 UAW-FCA Contract V2.0
Hired <2007 2007-2015 Hired >2015
Skilled Trades 2015: $33.69 2017: $34.70
n/a
Production
2015: $29.36 2017: $30.24
$17-29.94* over 8 years
$17-22.50 over 4 years
Mopar $17-29.76 over 8 years $17-25 over 8 years
Axle $16.25-19.86 over 4 years $16.25-19.86 over 4 years
Temporary workers Team member maximum rate $17-22 over 4 years $15.78-19.28 over 4 years

Wage Rates Under 2015 UAW-GM Contract
Hired <2007 2007-2015 Hired >2015
Skilled Trades 2015: $33.99 2017: $35.01
Production Group B 2015: $29.98 2017: $30.88
$17-29.94* over 7 years $17-28 over 7 years
Production Group C (CCA, etc.)
2015: $28.89 2017: $29.76
$17-29.76 over 4 years $17-25 over 8 years
GMCH $16.85-19.26 over 4 years plus
3% in 2016, 2017, 2018 and 3.7% in 2019 for those at top rate $16.25-19.86 over 4 years
Temporary workers $17-22 over 4 years $15.78-19.28 over 4 years

Wage Rates Under 2015 UAW-Ford Contract
Hired <2007 2007-2015 Hired >2015
Skilled Trades 2015: $33.79 2017: $34.81
Production 2015: $29.78 2017: $30.67
$17-29.75* over 8 years $17-28 over 8 years
Rawsonville, Sterling, Woodhaven
$16.25-19.86 over 4 years plus three 3% annual raises and
one 3.7% raise (2019) for those who reach $19.86 $16.25-19.86 over 4 years
Temporary workers $17-22 over 4 years $15.78-19.28 over 4 years
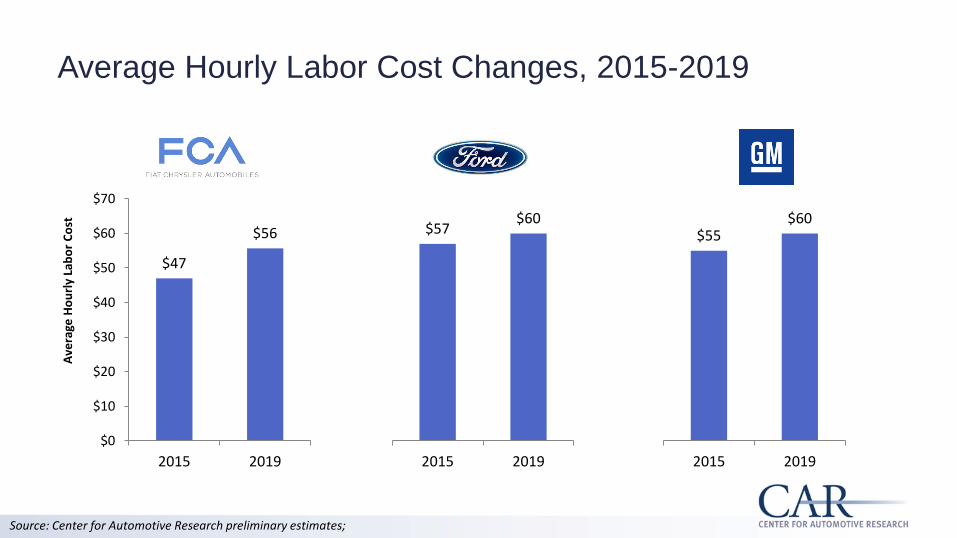
Average Hourly Labor Cost Changes, 2015-2019
$47
$56
$0
$10
$20
$30
$40
$50
$60
$70
2015 2019
Ave
rage
Ho
url
y La
bo
r C
ost
$57 $60
2015 2019
$55 $60
2015 2019
Source: Center for Automotive Research preliminary estimates;
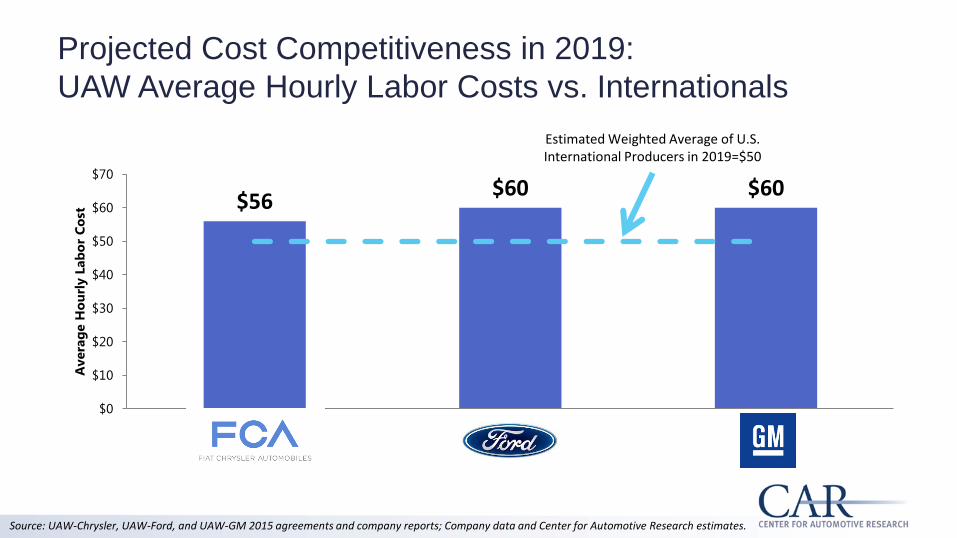
Projected Cost Competitiveness in 2019:
UAW Average Hourly Labor Costs vs. Internationals
$56 $60 $60
$0
$10
$20
$30
$40
$50
$60
$70
Avera
ge H
ou
rly L
ab
or
Co
st
Estimated Weighted Average of U.S. International Producers in 2019=$50
Source: UAW-Chrysler, UAW-Ford, and UAW-GM 2015 agreements and company reports; Company data and Center for Automotive Research estimates.
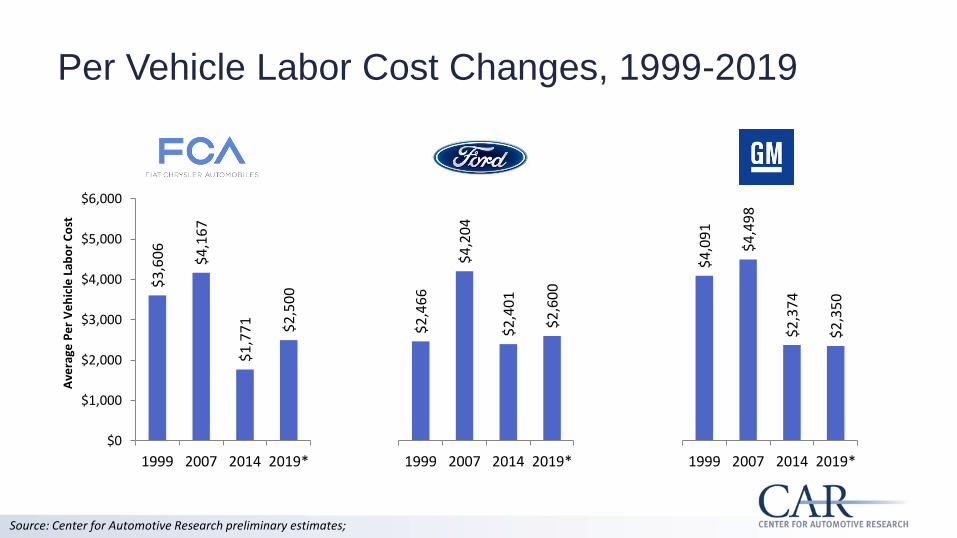
Per Vehicle Labor Cost Changes, 1999-2019
$3
,60
6
$4
,16
7
$1
,77
1
$2
,50
0
$0
$1,000
$2,000
$3,000
$4,000
$5,000
$6,000
1999 2007 2014 2019*
Ave
rage
Pe
r V
eh
icle
Lab
or
Co
st
$2
,46
6
$4
,20
4
$2
,40
1
$2
,60
0
1999 2007 2014 2019*
$4
,09
1
$4
,49
8
$2
,37
4
$2
,35
0
1999 2007 2014 2019*
Source: Center for Automotive Research preliminary estimates;
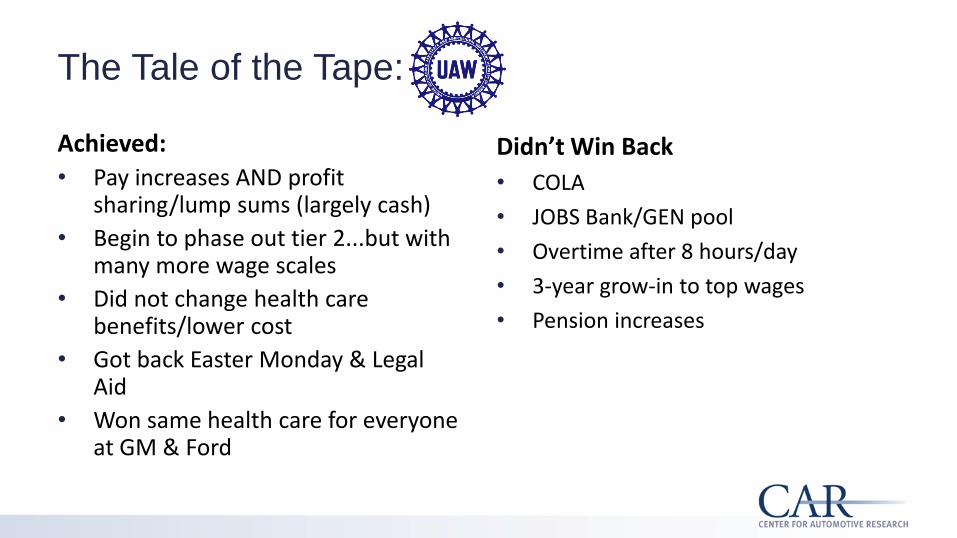
The Tale of the Tape:
Achieved:
• Pay increases AND profit sharing/lump sums (largely cash)
• Begin to phase out tier 2...but with many more wage scales
• Did not change health care benefits/lower cost
• Got back Easter Monday & Legal Aid
• Won same health care for everyone at GM & Ford
Didn’t Win Back
• COLA
• JOBS Bank/GEN pool
• Overtime after 8 hours/day
• 3-year grow-in to top wages
• Pension increases

For the Automakers:
• Most of the cost of the contract is cash
– Therefore up for grabs in 2019 depending on the market
• Still have lower wage scales for new hires
• Companies can adjust production in a downturn and can layoff excess employees at lower cost than last major downturn
• Overall contract cost does not rise as much as it has in pre-2009 contracts

Hiring will outpace overall employment
growth due to technology/skill needs
and demographic factors.

One-third of U.S. Motor Vehicle & Parts Employees
Currently Are or Will Soon Be Eligible to Retire.
0
50
100
150
200
250
300
350
16 to 19 years 20 to 24 years 25 to 34 years 35 to 44 years 45 to 54 years 55 to 64 years 65 years andover
Tota
l Em
plo
yees
, Th
ou
san
ds
Source: U.S. Bureau of the Census, Current Population Survey 2014

Attrition & Hiring
• FCA
– Targeted retirement incentives will yield not much more than normal attrition
– Product movement/retooling will mean shuffling existing workers more than hiring new ones (net employment change=+103)
• Ford
– Retirement incentive tilted toward production; possible to clear out roughly 6,500 legacy workers over four year contract
– Largely replacement hiring, with some growth (8,500 jobs “created/retained”)
• GM
– Retirement incentive aimed at clearing 4,000 retirement-eligible in early 2016; hitting a demographic bubble, and retirement attrition could be as high as 5 to 6%/year
– Largely replacement hiring (3,300 jobs “created/retained”)

Increased Use of Temporary Workers
• FCA and GM currently use temps for 5-10% of annual hours worked; Ford for <1% • Temps can be used for:
– Generally long-term, but no more than 3 days/week • Absentee replacement • Monday/Friday
– Short-term supplemental employees • Vacation/Leave replacements • Launch/Increased Production (3rd shifts) • Attrition program transition • Other similar supplemental manpower needs
• New temps will be paid the former entry-level scale ($15.78-19.28/hour), and will be used to balance higher wages/bonuses paid to current workers

UAW Skilled Trades Classifications Were
Consolidated Over The Past 3-4 Contracts
Source: UAW-FCA 2015 Agreement

The UAW and D3 Automakers Are Adding Apprentices
and Changing Their Processes
• New apprentice eligibility process targeted to be in place Q1 2016
• Promised investments “could result in” +1200 apprenticeships
• Implementing a new online apprenticeship application
• Plans to add +1300 trades; +400 new apprentices (first 200 in 2016)
• Plans to add 150 apprentices during 2016 (with a pledge of continued growth through length of the agreement)

IMPLICATIONS IN
SUPPLIER SECTOR

At the Bargaining Convention...
From UAW 2015 Special Bargaining Convention Proposed Resolutions

Another Reason Expectations Ran High...

Negotiations
Timeline: Is This the New
Normal?
Contract Openers
TA
TA
TA
TA
33%
77%
55%
51%

Supplier Negotiations Have Hit Some Rough Spots
GM, Fiat Chrysler plants impacted by Nexteer strike Melissa Burden, and Michael Wayland, DetroitNews 1:47 p.m. EST December 9, 2015

SHIFTING PRODUCTION IN
NORTH AMERICA

U.S. Share of North American Production is
Shrinking.
15.4
12.9
8.8
12.2 13.5
15.8 16.5
17.4 18.1
19.3 19.7 19.9 19.7 19.7
10.8
8.7
5.7
7.7 8.7
10.3 11.1 11.7 11.9 12.1 12.2 12.2 11.8 11.5
70%
67% 65%
64% 64% 65% 67% 67%
66%
63% 62% 61%
60% 58%
50%
55%
60%
65%
70%
75%
80%
0
2
4
6
8
10
12
14
16
18
202
00
7
20
08
20
09
20
10
20
11
20
12
20
13
20
14
20
15
20
16
20
17
20
18
20
19
20
20
Veh
icle
Pro
du
ctio
n (
Mill
ion
s)
NA Prodution US Production US Share of NA
Source: Ward’s Automotive, CAR 2015
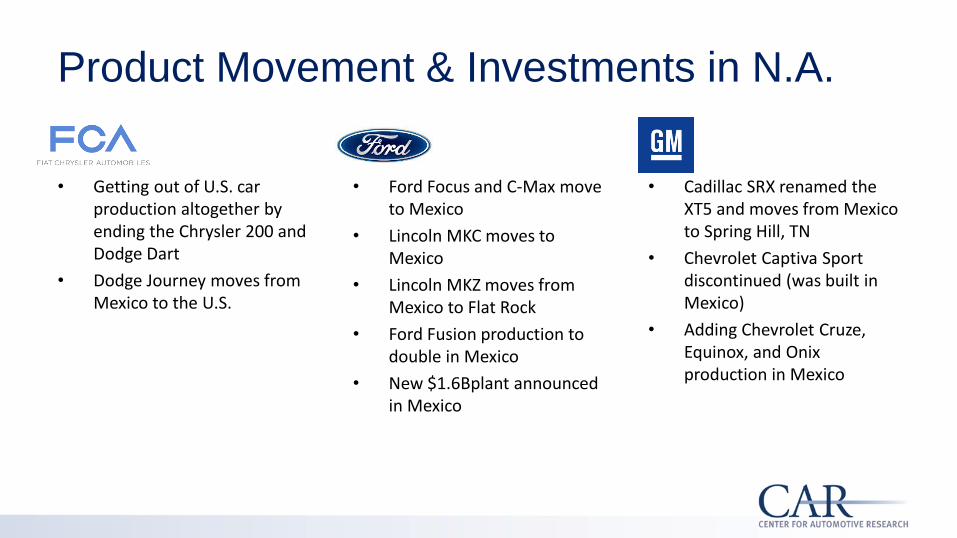
Product Movement & Investments in N.A.
FCA
• Getting out of U.S. car production altogether by ending the Chrysler 200 and Dodge Dart
• Dodge Journey moves from Mexico to the U.S.
Ford
• Ford Focus and C-Max move to Mexico
• Lincoln MKC moves to Mexico
• Lincoln MKZ moves from Mexico to Flat Rock
• Ford Fusion production to double in Mexico
• New $1.6Bplant announced in Mexico
GM
• Cadillac SRX renamed the XT5 and moves from Mexico to Spring Hill, TN
• Chevrolet Captiva Sport discontinued (was built in Mexico)
• Adding Chevrolet Cruze, Equinox, and Onix production in Mexico

Total Ford, GM, and Fiat-Chrysler Production in North America,
by Country: 2012-2015 Actual, 2016-2022 Forecast
5,405,632 6,004,113
1,515,578 1,131,988
1,441,246
2,522,564
0
2,000,000
4,000,000
6,000,000
8,000,000
10,000,000
12,000,000
2012 2013 2014 2015 2016 2017 2018 2019 2020 2021 2022
Ve
hic
le P
rod
uct
ion
United States Canada Mexico
Source: LMC Automotive

Mexican Automotive Wages are One-Eighth to One-Fifth
the Wages Paid to U.S. Hourly Auto & Parts Workers
5.64
2.47 $0
$5
$10
$15
$20
$25
$30
20
07
20
08
20
09
20
10
20
11
20
12
20
13
Motor Vehicles Parts
27.83
19.91
$0
$5
$10
$15
$20
$25
$30
20
07
20
08
20
09
20
10
20
11
20
12
20
13
20
14
U.S
. D
ollars
/Ho
ur
Motor Vehicles Parts
Average Hourly Wages for Production and Non-Supervisory Workers in Motor Vehicle and Parts, 2007-2014
Sources: U.S. Department of Labor, Bureau of Labor Statistics; Mexico National Institute of Statistics and Geography (INEGI: Instituto Nacional de Estadística y Geografía)

Some Vehicles Made in Mexico

Mexico Has Become a Global Export Base for
Autos and Parts
13 FTAs, 44 Countries North American Free Trade
Agreement (NAFTA)
Colombia - Mexico
Costa Rica - Mexico
European Union - Mexico
Nicaragua - Mexico
Chile - Mexico
EFTA - Mexico
Israel - Mexico
Northern Triangle - Mexico
Uruguay - Mexico
Japan - Mexico
Peru - Mexico
Central America – Mexico

Mexican Production and Exports
In 2013, Mexico produced more than 1.7 million light vehicles and 1.1 million heavy-duty vehicles
In 2016, Mexico will become the 7th largest vehicle producer in the world
Mexico now produces roughly 20 percent of the light vehicles in North America
Mexico has captured 8 of the last 9 announced new assembly plants on the continent since 2011
Manufactured goods constitute 80 percent of Mexico’s exports
2014 was a record year for Mexican automotive exports, and 2015 looks like it will again set a record
0.0
1.0
2.0
3.0
4.0
5.0
6.0
7.02
00
7
20
08
20
09
20
10
20
11
20
12
20
13
20
14
20
15
20
16
20
17
20
18
20
19
20
20
20
21
20
22
MIl
lion
s o
f U
nit
s
Mexican Production and Forecast
Mexican Production Capacity
31 Source: LMC and U.S. ITA
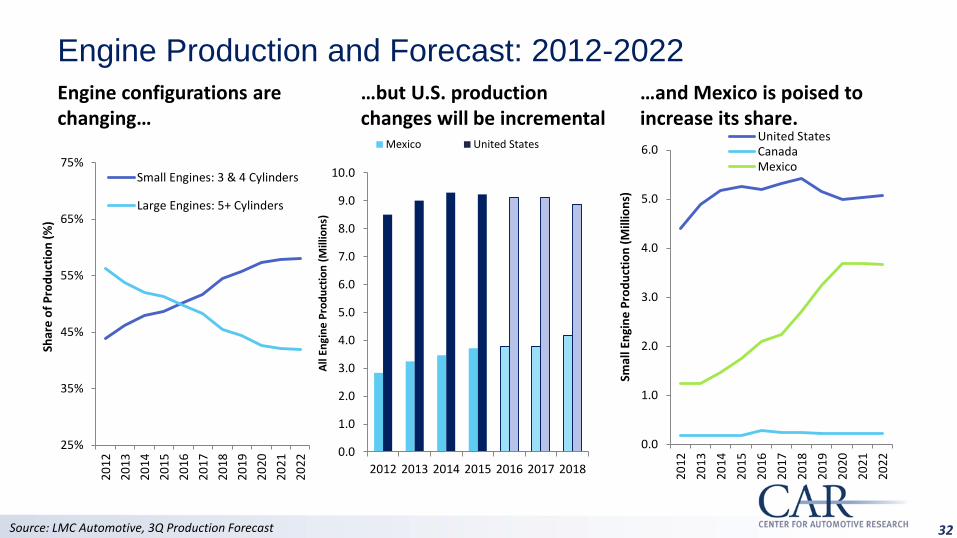
Engine Production and Forecast: 2012-2022
0.0
1.0
2.0
3.0
4.0
5.0
6.0
20
12
20
13
20
14
20
15
20
16
20
17
20
18
20
19
20
20
20
21
20
22
Smal
l En
gin
e P
rod
uct
ion
(M
illio
ns)
United StatesCanadaMexico
25%
35%
45%
55%
65%
75%
20
12
20
13
20
14
20
15
20
16
20
17
20
18
20
19
20
20
20
21
20
22
Shar
e o
f P
rod
uct
ion
(%
)
Small Engines: 3 & 4 Cylinders
Large Engines: 5+ Cylinders
0.0
1.0
2.0
3.0
4.0
5.0
6.0
7.0
8.0
9.0
10.0
2012 2013 2014 2015 2016 2017 2018
All
Engi
ne
Pro
du
ctio
n (
Mill
ion
s)
Mexico United States
Engine configurations are changing…
…and Mexico is poised to increase its share.
…but U.S. production changes will be incremental
Source: LMC Automotive, 3Q Production Forecast 32

Automaker Investment Announcements, Jan - Dec 2015
Canada $1.5 billion
United States
$29.3 billion
Mexico $4.5 billion
Total North
America: $35.3 billion
33 Source: CAR “Book of Deals”
Note: U.S. and North American totals include 2015 UAW contract commitments

A Big Question?