Embed Size (px)
Citation preview
2015 ANNUAL RESULTS
2 March 2016 - Paris
SOMMAIRE
2015 ANNUAL RESULTS 2
INTRODUCTION
STRATEGIC POSITIONING - REMINDER
OPERATIONAL PERFORMANCE: 2015 RESULTS AND OUTLOOK
FRANCE
MAURITIUS
BRAZIL
FINANCIAL RESULTS 2015
OUTLOOK
APPENDICES
1.
2.
3.
4.
5.
6.
3
7
13
33
43
50
3.1
3.2
3.3
14
25
28
32015 ANNUAL RESULTS
INTRODUCTION1.
3
2015 : A FAVOURABLE GEOPOLITICAL CONTEXT
4
● Albioma's strategy validated
● COP21: Proactive reduction in the use of fossil fuels
● French law on energy transition : 2020 target in the French overseas territories - Albioma is a major player
● Sugar-cane producing countries have grown increasingly aware of the importance of bagasse in the overall electricity equation (Brazil, Thailand, Cuba, etc.)
● Solar power is gradually achieving grid parity
● Plummeting coal and oil prices
2015 ANNUAL RESULTS
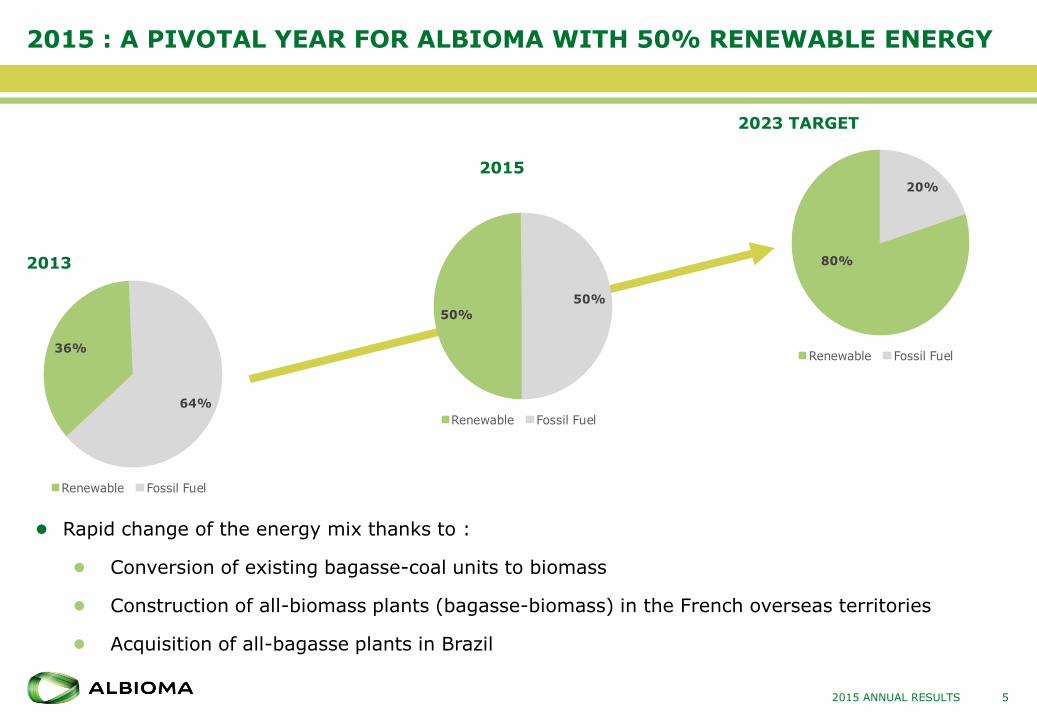
2015 : A PIVOTAL YEAR FOR ALBIOMA WITH 50% RENEWABLE ENERGY
2015 ANNUAL RESULTS
2013
2023 TARGET
2015
● Rapid change of the energy mix thanks to :
● Conversion of existing bagasse-coal units to biomass
● Construction of all-biomass plants (bagasse-biomass) in the French overseas territories
● Acquisition of all-bagasse plants in Brazil
5
36%
64%
Renewable Fossil Fuel
50%
50%
Renewable Fossil Fuel
80%
20%
Renewable Fossil Fuel
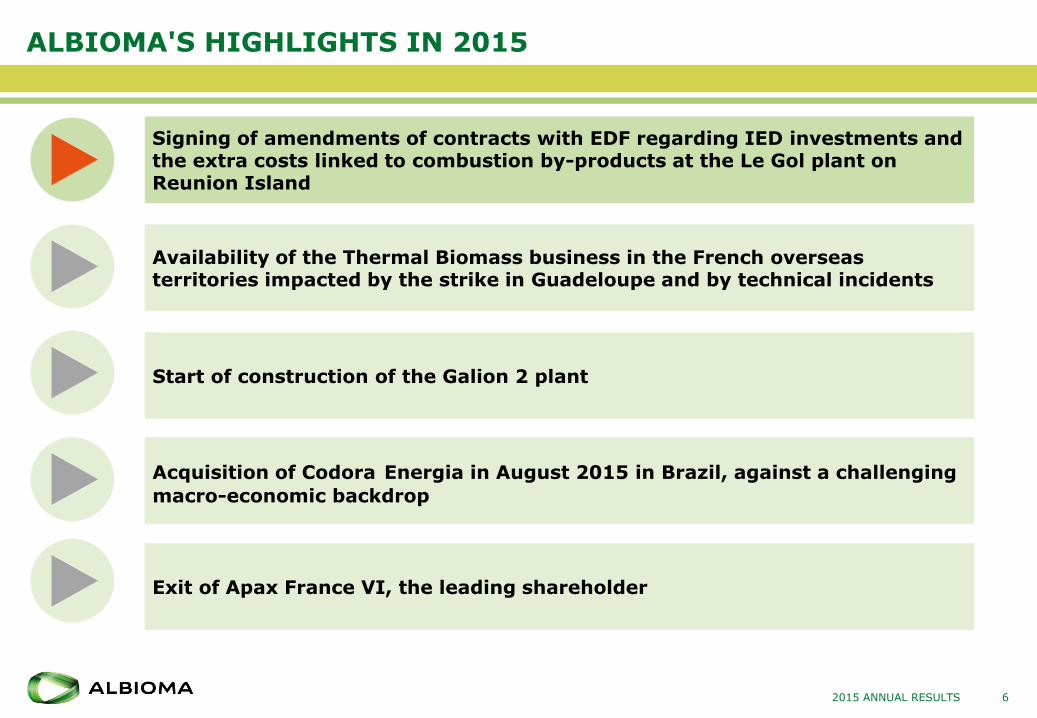
ALBIOMA'S HIGHLIGHTS IN 2015
2015 ANNUAL RESULTS
Exit of Apax France VI, the leading shareholder
Signing of amendments of contracts with EDF regarding IED investments and the extra costs linked to combustion by-products at the Le Gol plant on Reunion Island
Availability of the Thermal Biomass business in the French overseas territories impacted by the strike in Guadeloupe and by technical incidents
Acquisition of Codora Energia in August 2015 in Brazil, against a challenging
macro-economic backdrop
6
Start of construction of the Galion 2 plant
2015 ANNUAL RESULTS 7
STRATEGIC POSITIONING - REMINDER2.
7
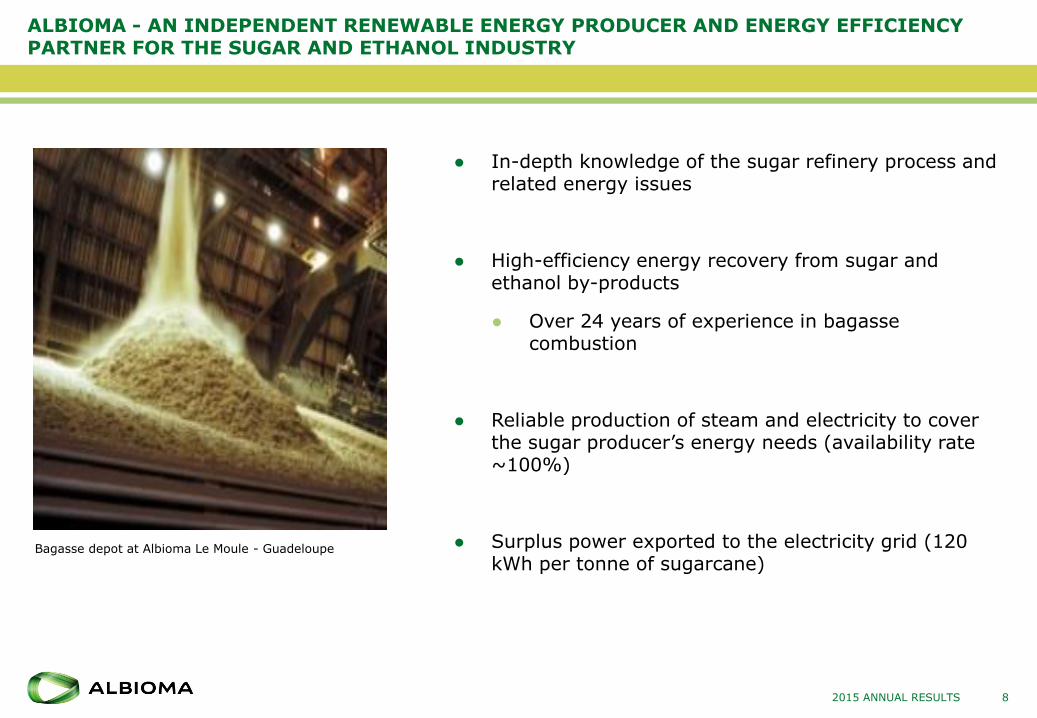
ALBIOMA - AN INDEPENDENT RENEWABLE ENERGY PRODUCER AND ENERGY EFFICIENCY PARTNER FOR THE SUGAR AND ETHANOL INDUSTRY
● In-depth knowledge of the sugar refinery process and related energy issues
● High-efficiency energy recovery from sugar and ethanol by-products
● Over 24 years of experience in bagasse combustion
● Reliable production of steam and electricity to cover the sugar producer’s energy needs (availability rate ~100%)
● Surplus power exported to the electricity grid (120 kWh per tonne of sugarcane)
2015 ANNUAL RESULTS
Bagasse depot at Albioma Le Moule - Guadeloupe
8
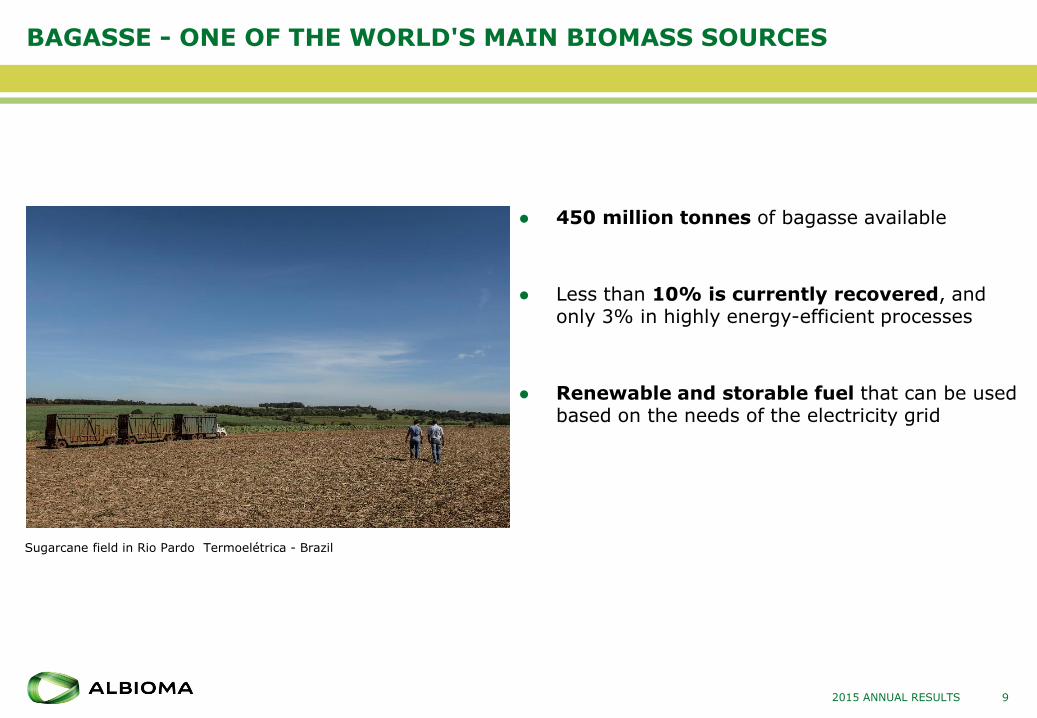
BAGASSE - ONE OF THE WORLD'S MAIN BIOMASS SOURCES
● 450 million tonnes of bagasse available
● Less than 10% is currently recovered, and only 3% in highly energy-efficient processes
● Renewable and storable fuel that can be used based on the needs of the electricity grid
2015 ANNUAL RESULTS
Sugarcane field in Rio Pardo Termoelétrica - Brazil
9
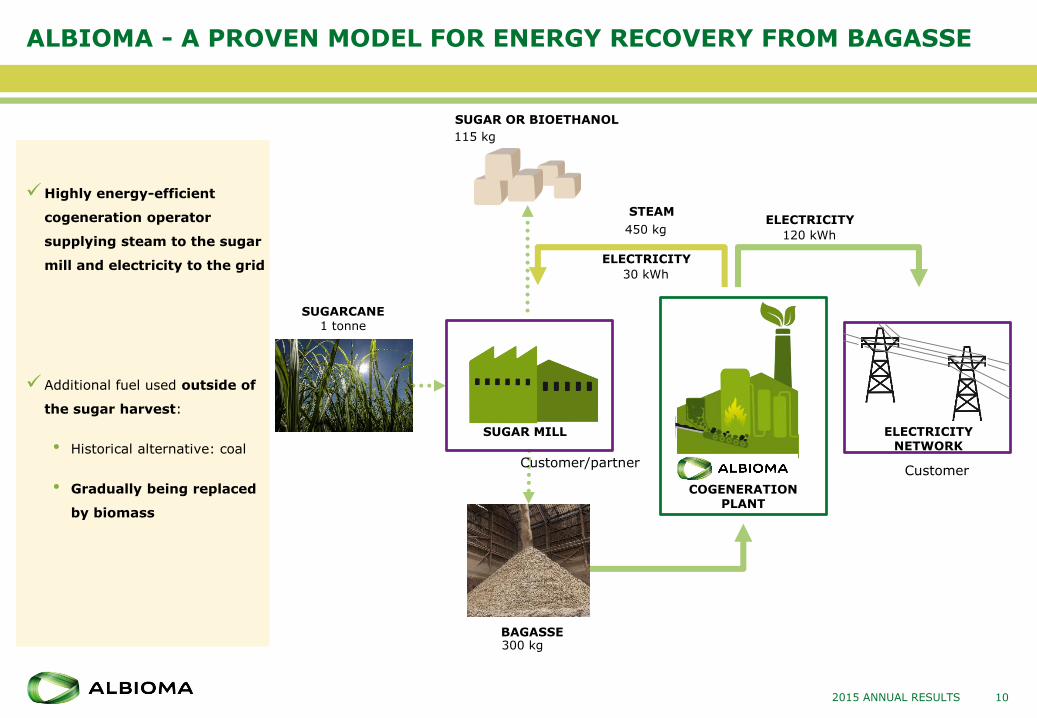
30 kWh
ALBIOMA - A PROVEN MODEL FOR ENERGY RECOVERY FROM BAGASSE
Highly energy-efficient
cogeneration operator
supplying steam to the sugar
mill and electricity to the grid
Additional fuel used outside of
the sugar harvest:
• Historical alternative: coal
• Gradually being replaced
by biomass
2015 ANNUAL RESULTS
STEAM
ELECTRICITY NETWORK
BAGASSE
SUGAR OR BIOETHANOL
SUGARCANE1 tonne
ELECTRICITY
450 kg
115 kg
300 kg
COGENERATION PLANT
ELECTRICITY
120 kWh
SUGAR MILL
Customer/partnerCustomer
10
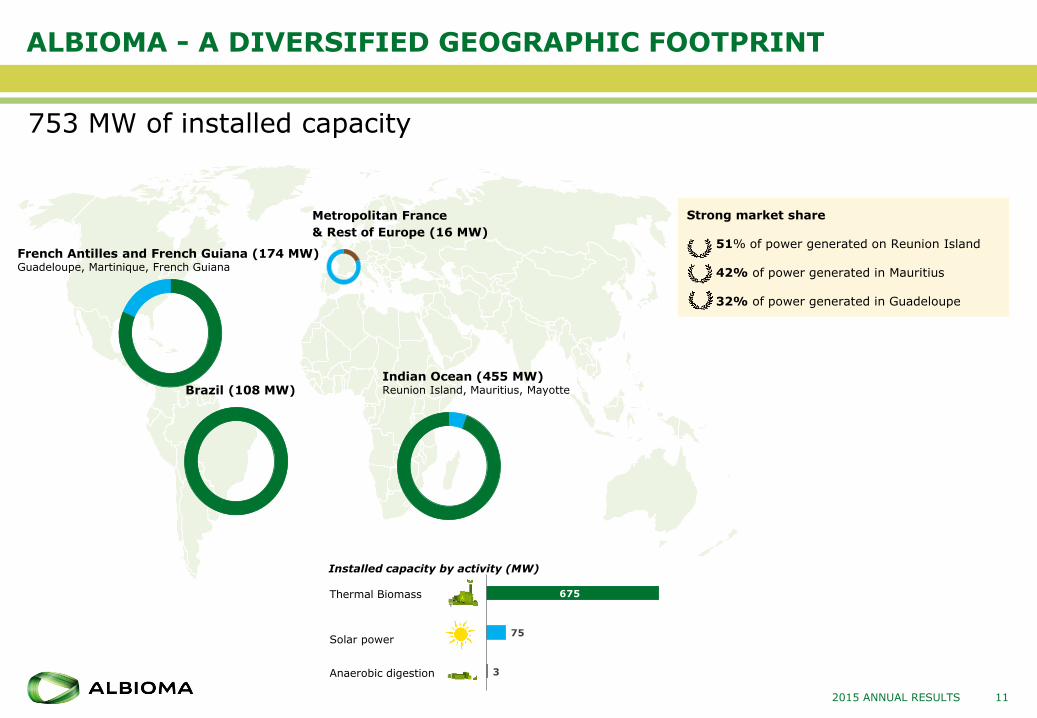
ALBIOMA - A DIVERSIFIED GEOGRAPHIC FOOTPRINT
11
753 MW of installed capacity
Anaerobic digestion
Solar power
Thermal Biomass
Installed capacity by activity (MW)
Strong market share
51% of power generated on Reunion Island
42% of power generated in Mauritius
32% of power generated in Guadeloupe
Indian Ocean (455 MW)Reunion Island, Mauritius, Mayotte
Metropolitan France
& Rest of Europe (16 MW)
French Antilles and French Guiana (174 MW)Guadeloupe, Martinique, French Guiana
Brazil (108 MW)
2015 ANNUAL RESULTS
3
75
675
1
2
3
ALBIOMA'S INTERNATIONALISATION CRITERIA
122015 ANNUAL RESULTS
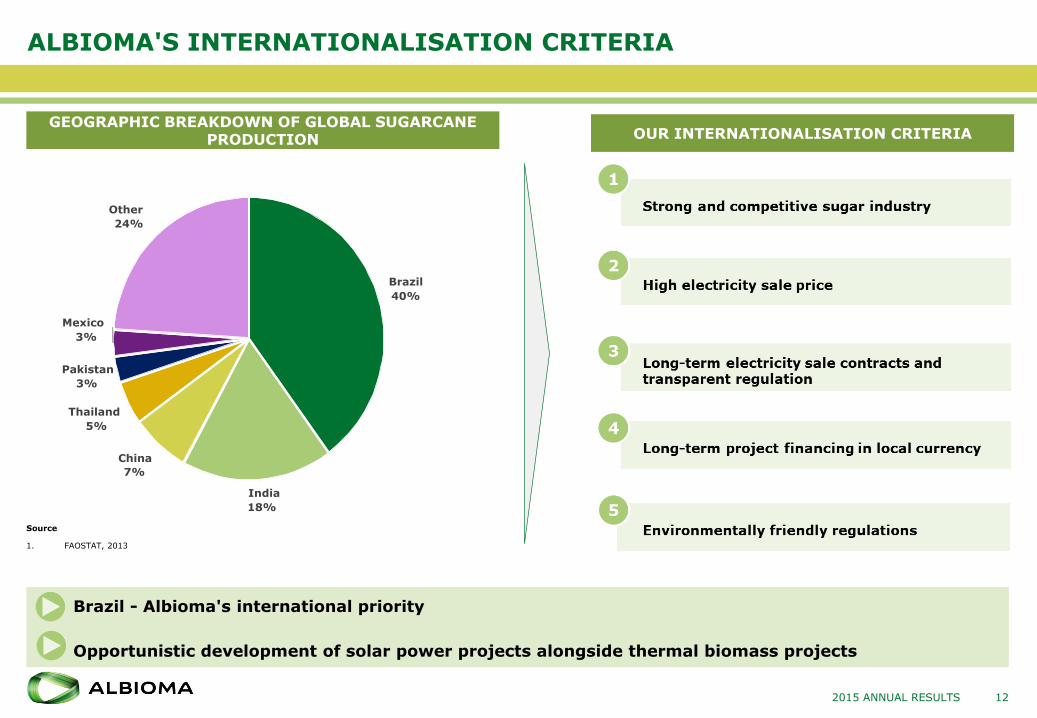
OUR INTERNATIONALISATION CRITERIAGEOGRAPHIC BREAKDOWN OF GLOBAL SUGARCANE
PRODUCTION
Source
1. FAOSTAT, 2013
● Brazil - Albioma's international priority
● Opportunistic development of solar power projects alongside thermal biomass projects
Brazil
40%
India
18%
China
7%
Thailand
5%
Pakistan
3%
Mexico
3%
Other
24%
2015 ANNUAL RESULTS 13
OPERATIONAL PERFORMANCE: 2015 RESULTS AND OUTLOOK3.
13

2015 ANNUAL RESULTS 14
France3.1
14
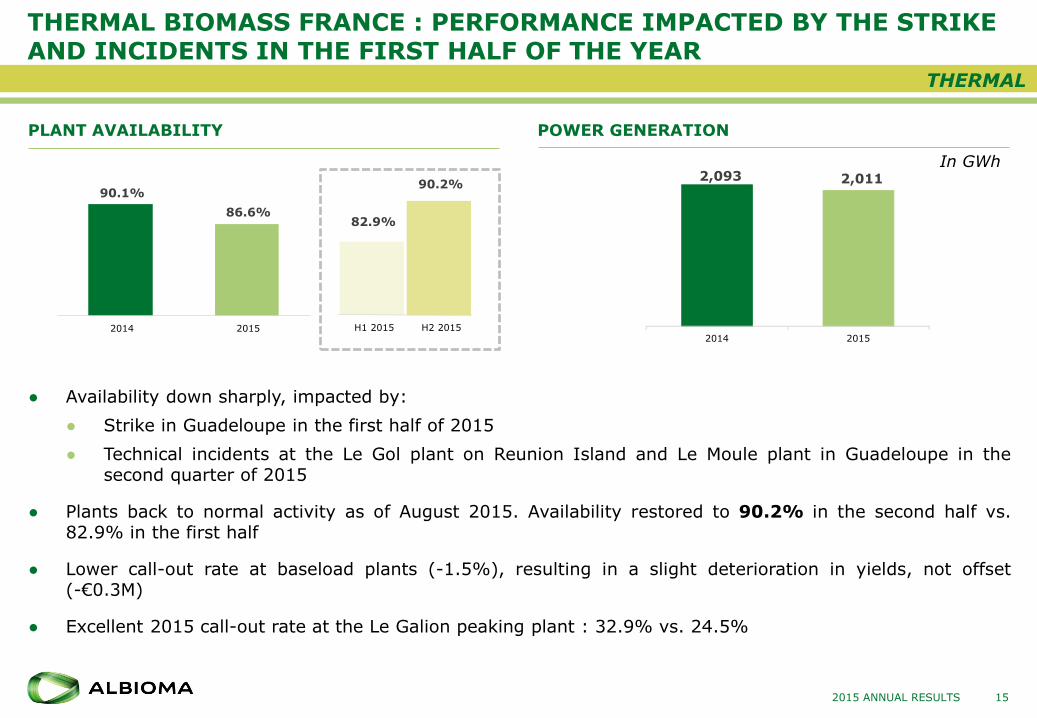
THERMAL BIOMASS FRANCE : PERFORMANCE IMPACTED BY THE STRIKE AND INCIDENTS IN THE FIRST HALF OF THE YEAR
PLANT AVAILABILITY POWER GENERATION
● Availability down sharply, impacted by:
● Strike in Guadeloupe in the first half of 2015
● Technical incidents at the Le Gol plant on Reunion Island and Le Moule plant in Guadeloupe in thesecond quarter of 2015
● Plants back to normal activity as of August 2015. Availability restored to 90.2% in the second half vs.82.9% in the first half
● Lower call-out rate at baseload plants (-1.5%), resulting in a slight deterioration in yields, not offset(-€0.3M)
● Excellent 2015 call-out rate at the Le Galion peaking plant : 32.9% vs. 24.5%
2015 ANNUAL RESULTS 15
THERMAL
In GWh
90.1%
86.6%
2014 2015
82.9%
90.2%
H1 2015 H2 2015
2,093 2,011
2014 2015
TECHNICAL PERFORMANCE AND PREVENTIVE MAINTENANCE
16
Action deployed following the technical incidents of 2015
● Turbines
● Safety audit conducted by Bureau Veritas covering the turbine generators at all thermal power plants
● Review of the preventive maintenance plan specific to turbines
● Drafting of operating instructions/emergency procedures
● Changes to the programs that manage automatic boiler shutdowns in the event of turbine generator overspeed
● Preventive maintenance
● Review of the stock of strategic spare parts to limit downtime: additional €4 million over 3 years
● Annual outage programmes planned around the Group's Maintenance Master Plan
● Analysis of criticality and repeatability of unplanned outages
2015 ANNUAL RESULTS
THERMAL
● Target confirmed : 90%-92% availability
SIGNING OF AMENDMENTS TO CONTRACTS
17
In 2015, requests submitted to EDF for a price adjustment in accordance with contractual clauses
● Treating atmospheric emissions
● EU Industrial Emissions Directive (IED) to come into force by 1 January 2020 at the latest
● Total investment of €200 million over five years for nine production units
● Signing of the first two amendments : Albioma Le Gol plant on Reunion Island (ALG-B and ALG-A)
– Investment of €26 million and €55 million; pre-tax ROCE of 11%
– Completion of work in the second half of 2016 for ALG-B and by 2018 for ALG-A
● One similar project under review in 2016 (Albioma Bois Rouge)
● Combustion by-products and reduction of liquid effluents
● French Ministerial Order of 28 May 2013, extra costs linked in particular to preparing, processing, transport and storage of combustion by-products
● Amendments to the Albioma Le Gol contract
● One similar project under review in 2016 (Albioma Bois Rouge)
2015 ANNUAL RESULTS
THERMAL
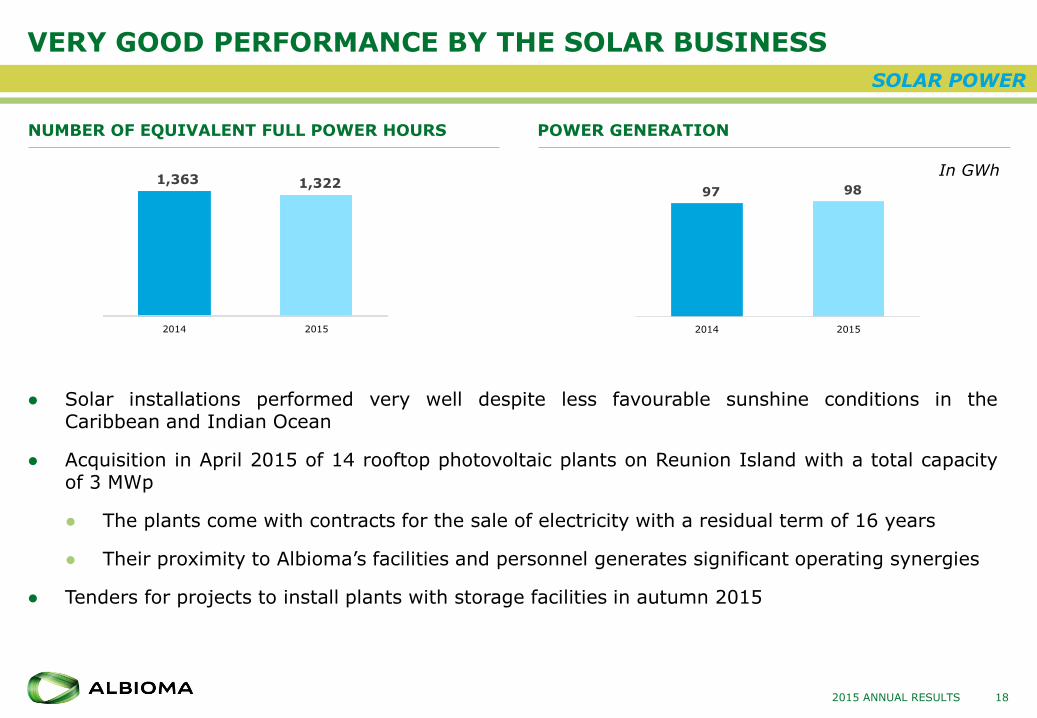
97 98
2014 2015
VERY GOOD PERFORMANCE BY THE SOLAR BUSINESS
NUMBER OF EQUIVALENT FULL POWER HOURS POWER GENERATION
● Solar installations performed very well despite less favourable sunshine conditions in theCaribbean and Indian Ocean
● Acquisition in April 2015 of 14 rooftop photovoltaic plants on Reunion Island with a total capacityof 3 MWp
● The plants come with contracts for the sale of electricity with a residual term of 16 years
● Their proximity to Albioma’s facilities and personnel generates significant operating synergies
● Tenders for projects to install plants with storage facilities in autumn 2015
2015 ANNUAL RESULTS
In GWh
18
SOLAR POWER
1,363 1,322
2014 2015
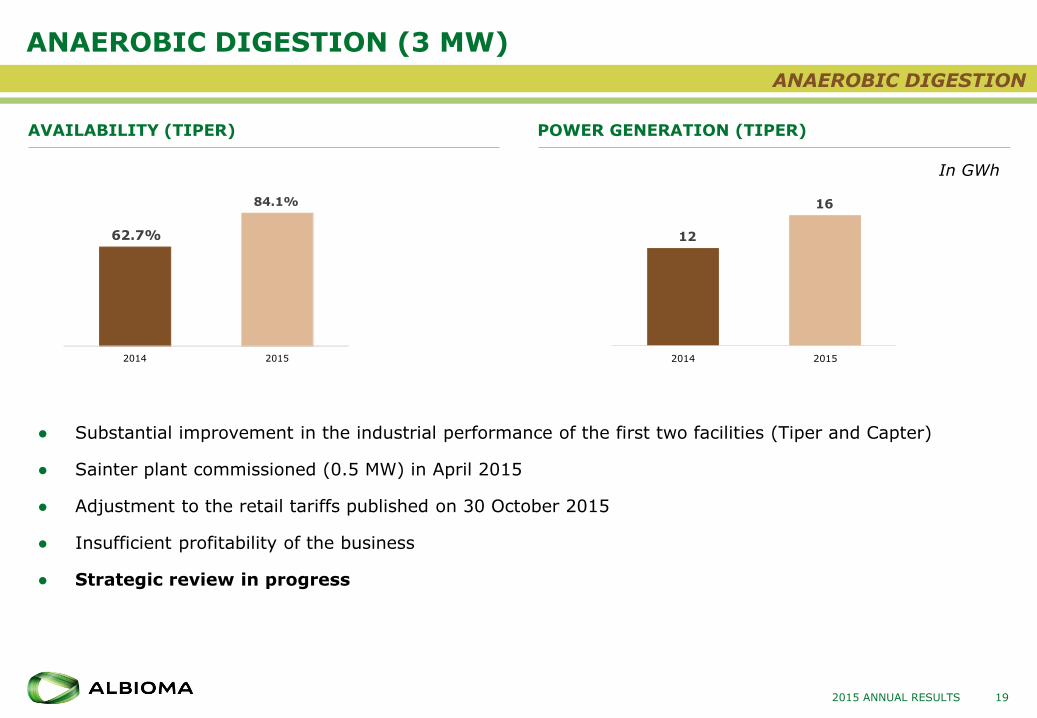
ANAEROBIC DIGESTION (3 MW)
2015 ANNUAL RESULTS
AVAILABILITY (TIPER) POWER GENERATION (TIPER)
● Substantial improvement in the industrial performance of the first two facilities (Tiper and Capter)
● Sainter plant commissioned (0.5 MW) in April 2015
● Adjustment to the retail tariffs published on 30 October 2015
● Insufficient profitability of the business
● Strategic review in progress
In GWh
12
16
2014 2015
19
ANAEROBIC DIGESTION
62.7%
84.1%
2014 2015
20
Good growth prospects in the French overseas territories
2015 ANNUAL RESULTS
LAW ON ENERGY TRANSITION IN THE FRENCH OVERSEAS TERRITORIES
21
Multi-year Energy Programme (MEP) for the period ending in 2023, customised for each French overseas department
● Multi-year Energy Programme (MEP) established for two successive five-year periods, except the first which covers 2016-2018 then 2019-2023
First programme approved by the end of 2015 (for Corsica, with others pending)
● Separate MEP for Non-Interconnected Zones (NIZ) (particularly Guadeloupe, French Guiana, Martinique, Mayotte, Reunion Island)
● Including a specific development plan for biomass
● Renewable energy target of 50% by 2020
● Objective of achieving energy autonomy by 2030
● After the enactment of MEPs, Albioma started negotiations with EDF on the conditions for reflecting the economic impact of these changes in existing contracts to purchase electricity
2015 ANNUAL RESULTS
10%
33%
3%
26%
1%
17%
6%
27%
0%
10%
20%
30%
40%
50%
60%
70%
2013 2023 2013 2023 2013 2023 2013 2023
Reunion Island Guadeloupe Martinique Total French overseasdepartments
Share of electricity from renewable sources
38%
60%
18%
40%
6%
21%
24%
44%
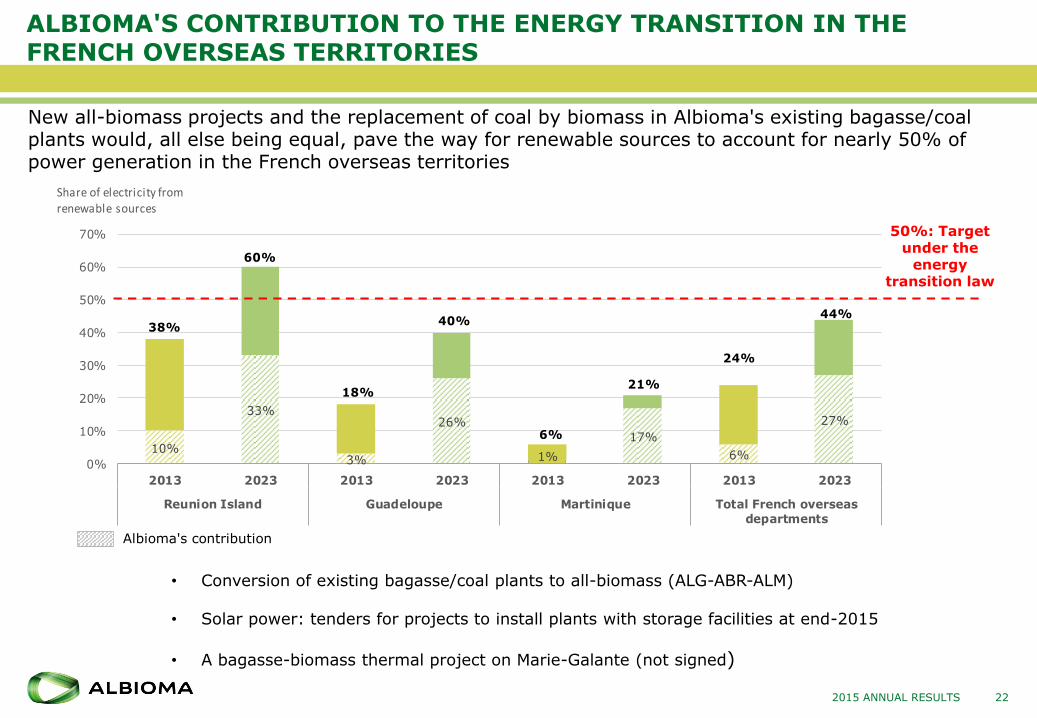
ALBIOMA'S CONTRIBUTION TO THE ENERGY TRANSITION IN THE FRENCH OVERSEAS TERRITORIES
New all-biomass projects and the replacement of coal by biomass in Albioma's existing bagasse/coal plants would, all else being equal, pave the way for renewable sources to account for nearly 50% of power generation in the French overseas territories
50%: Target under the
energy transition law
2015 ANNUAL RESULTS 22
• Conversion of existing bagasse/coal plants to all-biomass (ALG-ABR-ALM)
• Solar power: tenders for projects to install plants with storage facilities at end-2015
• A bagasse-biomass thermal project on Marie-Galante (not signed)
Albioma's contribution
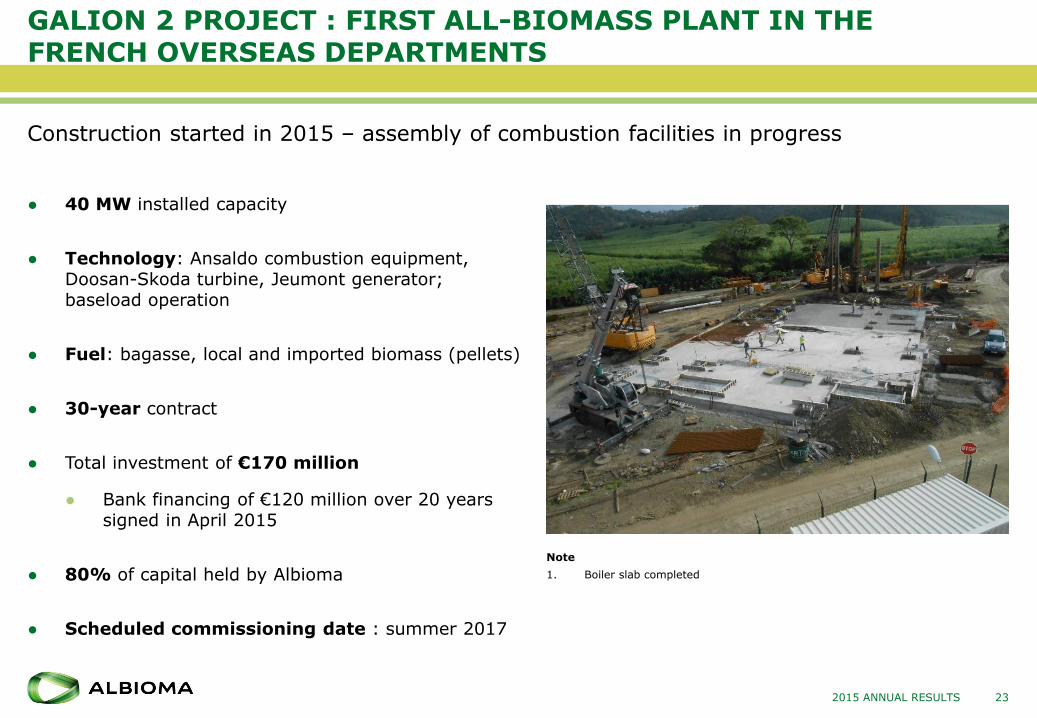
GALION 2 PROJECT : FIRST ALL-BIOMASS PLANT IN THE FRENCH OVERSEAS DEPARTMENTS
23
Construction started in 2015 – assembly of combustion facilities in progress
● 40 MW installed capacity
● Technology: Ansaldo combustion equipment, Doosan-Skoda turbine, Jeumont generator; baseload operation
● Fuel: bagasse, local and imported biomass (pellets)
● 30-year contract
● Total investment of €170 million
● Bank financing of €120 million over 20 years signed in April 2015
● 80% of capital held by Albioma
● Scheduled commissioning date : summer 2017
2015 ANNUAL RESULTS
Note
1. Boiler slab completed
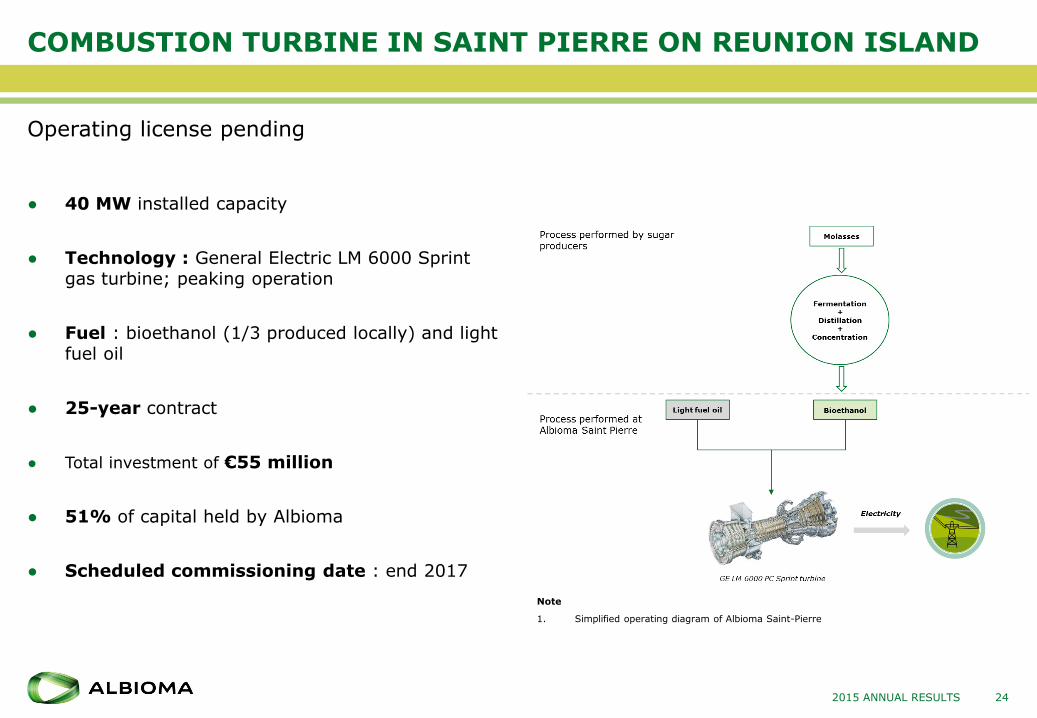
COMBUSTION TURBINE IN SAINT PIERRE ON REUNION ISLAND
24
Operating license pending
● 40 MW installed capacity
● Technology : General Electric LM 6000 Sprint gas turbine; peaking operation
● Fuel : bioethanol (1/3 produced locally) and light fuel oil
● 25-year contract
● Total investment of €55 million
● 51% of capital held by Albioma
● Scheduled commissioning date : end 2017
2015 ANNUAL RESULTS
Note
1. Simplified operating diagram of Albioma Saint-Pierre
2015 ANNUAL RESULTS 25
Mauritius3.2
25
EXCELLENT PERFORMANCE OF PLANTS IN MAURITIUS
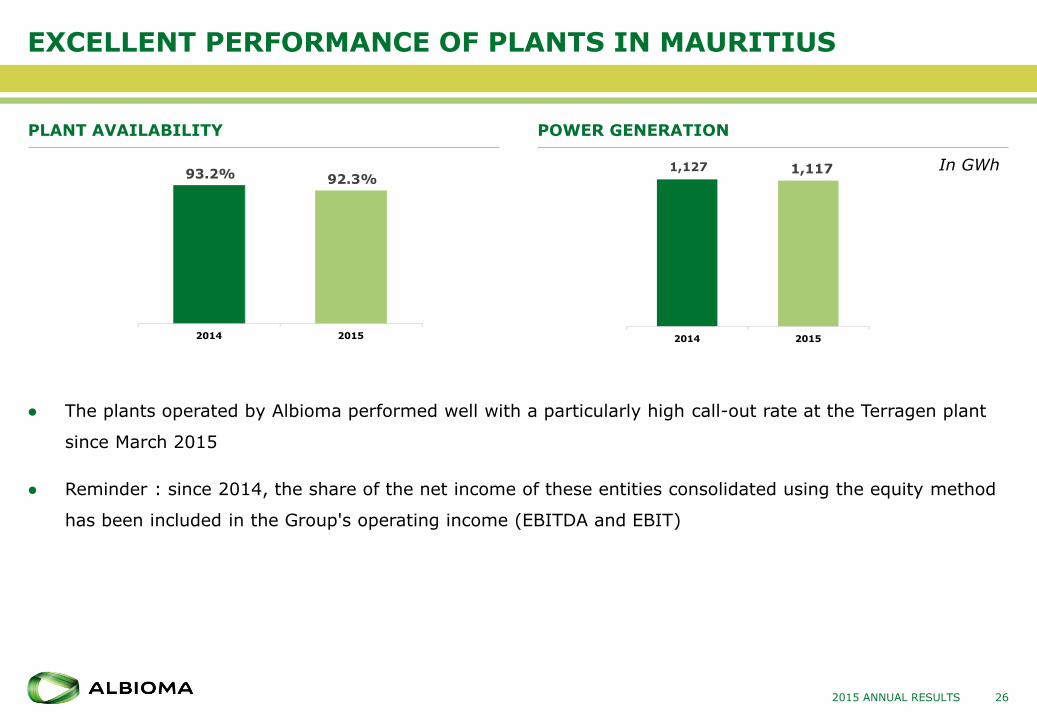
PLANT AVAILABILITY POWER GENERATION
● The plants operated by Albioma performed well with a particularly high call-out rate at the Terragen plant
since March 2015
● Reminder : since 2014, the share of the net income of these entities consolidated using the equity method
has been included in the Group's operating income (EBITDA and EBIT)
2015 ANNUAL RESULTS
In GWh
26
93.2% 92.3%
2014 2015
1,127 1,117
2014 2015
INNOVATIVE PROJECTS BEING CONDUCTED WITH OUR SUGAR PRODUCER PARTNERS
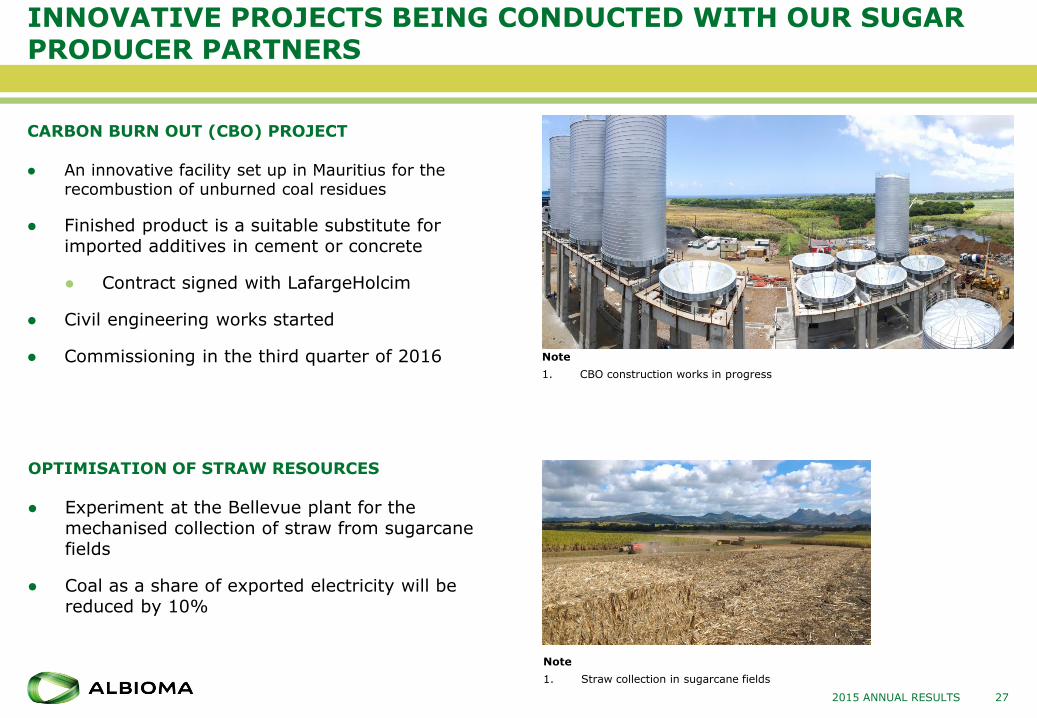
CARBON BURN OUT (CBO) PROJECT
● An innovative facility set up in Mauritius for the recombustion of unburned coal residues
● Finished product is a suitable substitute for imported additives in cement or concrete
● Contract signed with LafargeHolcim
● Civil engineering works started
● Commissioning in the third quarter of 2016
27
OPTIMISATION OF STRAW RESOURCES
● Experiment at the Bellevue plant for the mechanised collection of straw from sugarcane fields
● Coal as a share of exported electricity will be reduced by 10%
2015 ANNUAL RESULTS
Note
1. CBO construction works in progress
Note
1. Straw collection in sugarcane fields
2015 ANNUAL RESULTS 28
Brazil3.3
28
A CHALLENGING MACRO-ECONOMIC CLIMATE
2015 ANNUAL RESULTS
● A brutal recession...
● Brazilian growth: -3.8% in 2015
● Inflation: +10.7%
● Interest rate ups sharply: SELIC at 14.25% at end 2015
● Depreciation of the Real: BRL4.21 to EUR 1 at 31 Dec. 2015 vs. BRL3.25 to EUR 1 at 31 Dec. 2014
● ….impacting energy prices and especially the spot price…
● Regulatory ceiling lowered from 822 BRL/MWh to 388 BRL/MWh in January 2015
● Spot price fell in the second half of 2015 from 370 BRL/MWh in June to 116 BRL/MWh in December
● ….however the long-term outlook remains positive
● Renewed competitiveness due to currency devaluation
● The need to build additional power generating capacity remains unchanged
29
RIO PARDO TERMOELÉTRICA AND CODORA ENERGIA
30
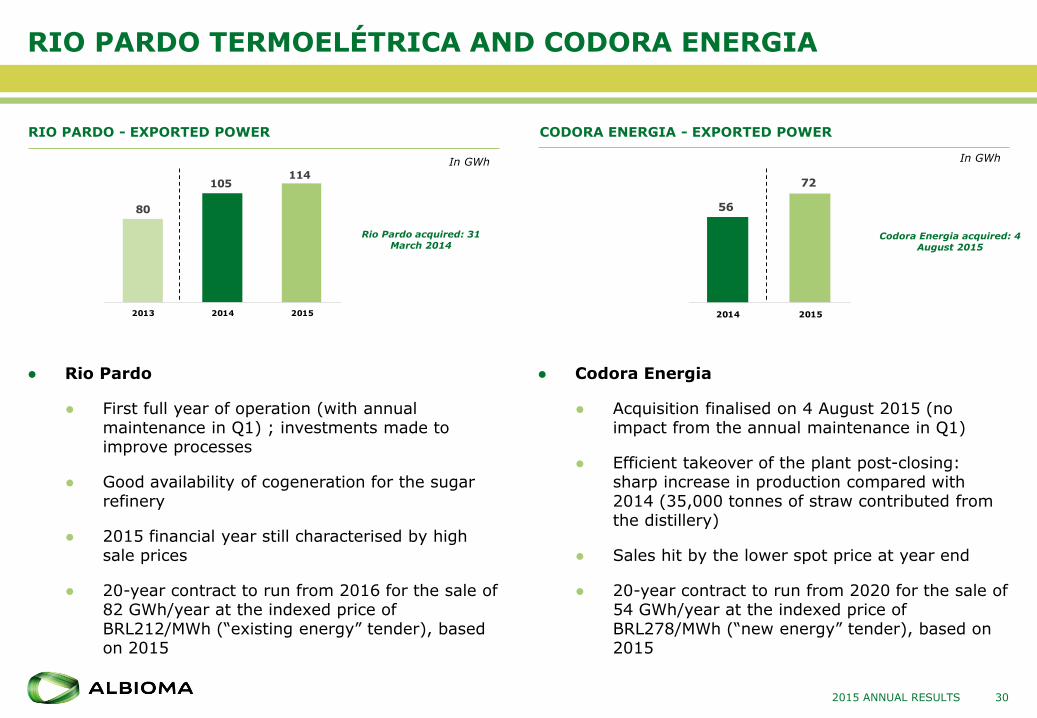
● Rio Pardo
● First full year of operation (with annual maintenance in Q1) ; investments made to improve processes
● Good availability of cogeneration for the sugar refinery
● 2015 financial year still characterised by high sale prices
● 20-year contract to run from 2016 for the sale of 82 GWh/year at the indexed price of BRL212/MWh (“existing energy” tender), based on 2015
● Codora Energia
● Acquisition finalised on 4 August 2015 (no impact from the annual maintenance in Q1)
● Efficient takeover of the plant post-closing: sharp increase in production compared with 2014 (35,000 tonnes of straw contributed from the distillery)
● Sales hit by the lower spot price at year end
● 20-year contract to run from 2020 for the sale of 54 GWh/year at the indexed price of BRL278/MWh (“new energy” tender), based on 2015
2015 ANNUAL RESULTS
RIO PARDO - EXPORTED POWER CODORA ENERGIA - EXPORTED POWER
In GWh
80
105 114
2013 2014 2015
In GWh
Rio Pardo acquired: 31 March 2014
Codora Energia acquired: 4 August 2015
56
72
2014 2015
STRATEGY TO SECURE LONG-TERM SALES CONTINUED
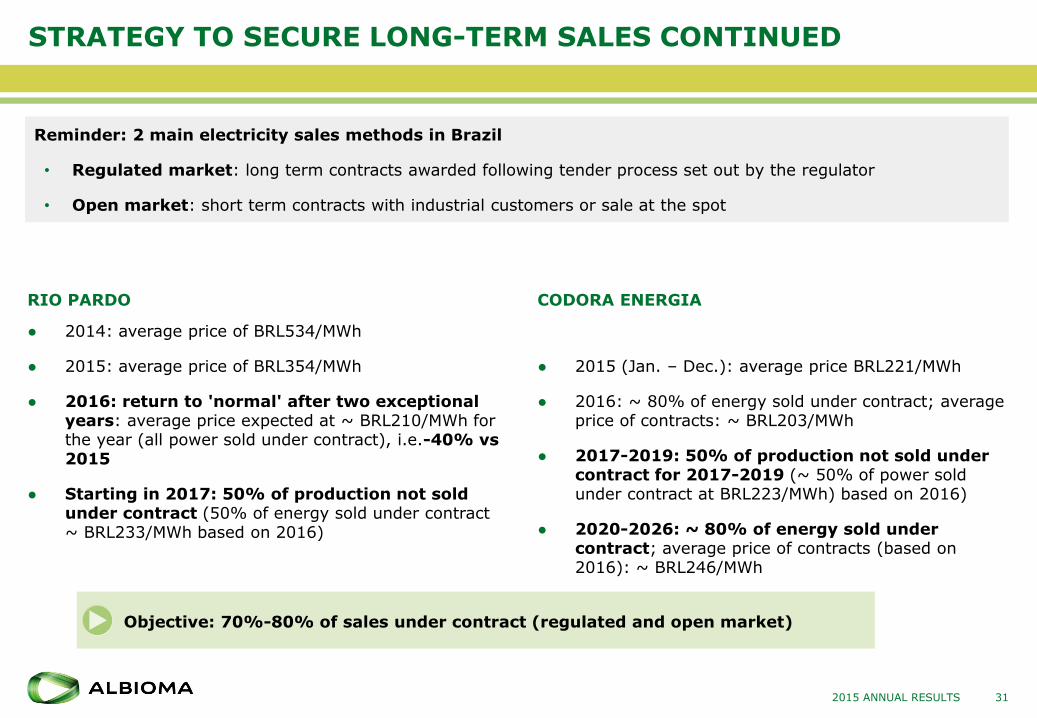
RIO PARDO
● 2014: average price of BRL534/MWh
● 2015: average price of BRL354/MWh
● 2016: return to 'normal' after two exceptional years: average price expected at ~ BRL210/MWh for the year (all power sold under contract), i.e.-40% vs 2015
● Starting in 2017: 50% of production not sold under contract (50% of energy sold under contract ~ BRL233/MWh based on 2016)
CODORA ENERGIA
● 2015 (Jan. – Dec.): average price BRL221/MWh
● 2016: ~ 80% of energy sold under contract; average price of contracts: ~ BRL203/MWh
● 2017-2019: 50% of production not sold under contract for 2017-2019 (~ 50% of power sold under contract at BRL223/MWh) based on 2016)
● 2020-2026: ~ 80% of energy sold under contract; average price of contracts (based on 2016): ~ BRL246/MWh
312015 ANNUAL RESULTS
● Objective: 70%-80% of sales under contract (regulated and open market)
Reminder: 2 main electricity sales methods in Brazil
• Regulated market: long term contracts awarded following tender process set out by the regulator
• Open market: short term contracts with industrial customers or sale at the spot
SELECTIVE DEVELOPMENT IN A CHALLENGING ECONOMIC CLIMATE
32
● In the short term (2016)
● Lower contracted energy prices and spot prices (impacting Codora)
● Impact on Codora's full-year of operations (maintenance costs in the first quarter, depreciation/amortisation, financial costs) and ramp-up of the local infrastructure
● High interest rates
● Favourable context for new acquisitions
● Decrease in asset prices stated in Reals
● Sugar producers in need of cash
● Strong need for expertise
● Strict criteria for new projects
● Stringent selection criteria for counterparties
● Secured electricity sales
● Reasonable financing conditions
● Goal of one project every 12 to 18 months and gain of critical size
2015 ANNUAL RESULTS
2015 ANNUAL RESULTS 33
FINANCIAL RESULTS 20154.
33
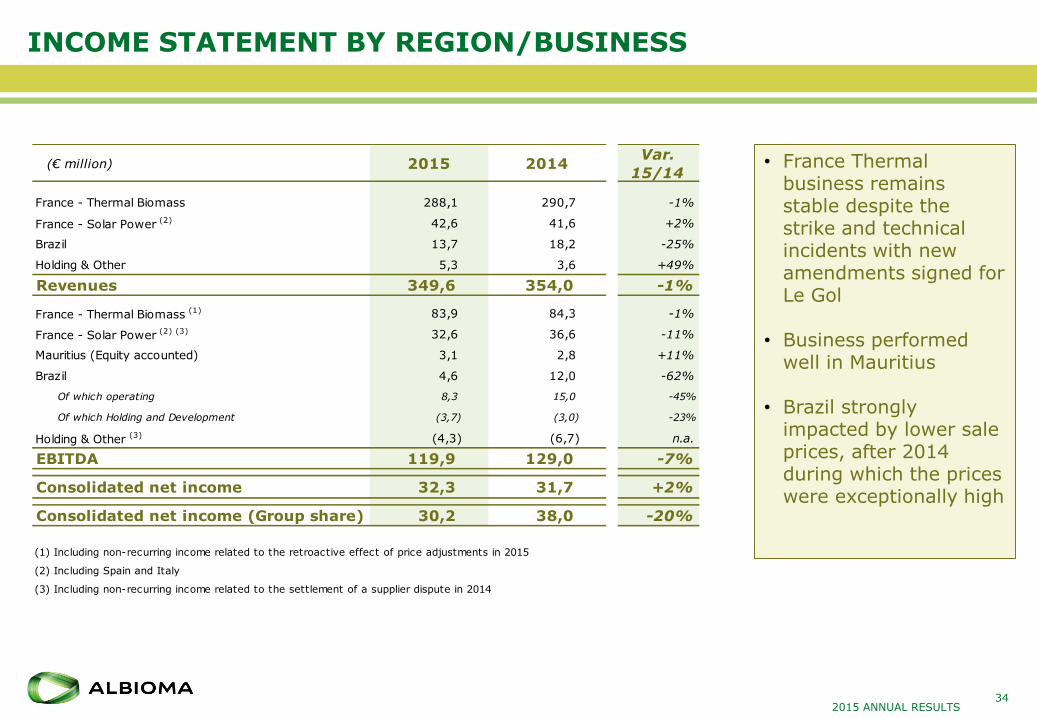
INCOME STATEMENT BY REGION/BUSINESS
342015 ANNUAL RESULTS
• France Thermal business remains stable despite the strike and technical incidents with new amendments signed for Le Gol
• Business performed well in Mauritius
• Brazil strongly impacted by lower sale prices, after 2014 during which the prices were exceptionally high
(€ million) 2015 2014Var.
15/14
France - Thermal Biomass 288,1 290,7 -1%
France - Solar Power (2) 42,6 41,6 +2%
Brazil 13,7 18,2 -25%
Holding & Other 5,3 3,6 +49%
Revenues 349,6 354,0 -1%
France - Thermal Biomass (1) 83,9 84,3 -1%
France - Solar Power (2) (3) 32,6 36,6 -11%
Mauritius (Equity accounted) 3,1 2,8 +11%
Brazil 4,6 12,0 -62%
Of which operating 8,3 15,0 -45%
Of which Holding and Development (3,7) (3,0) -23%
Holding & Other (3) (4,3) (6,7) n.a.
EBITDA 119,9 129,0 -7%
Consolidated net income 32,3 31,7 +2%
Consolidated net income (Group share) 30,2 38,0 -20%
(1) Including non-recurring income related to the retroactive effect of price adjustments in 2015
(2) Including Spain and Italy
(3) Including non-recurring income related to the settlement of a supplier dispute in 2014
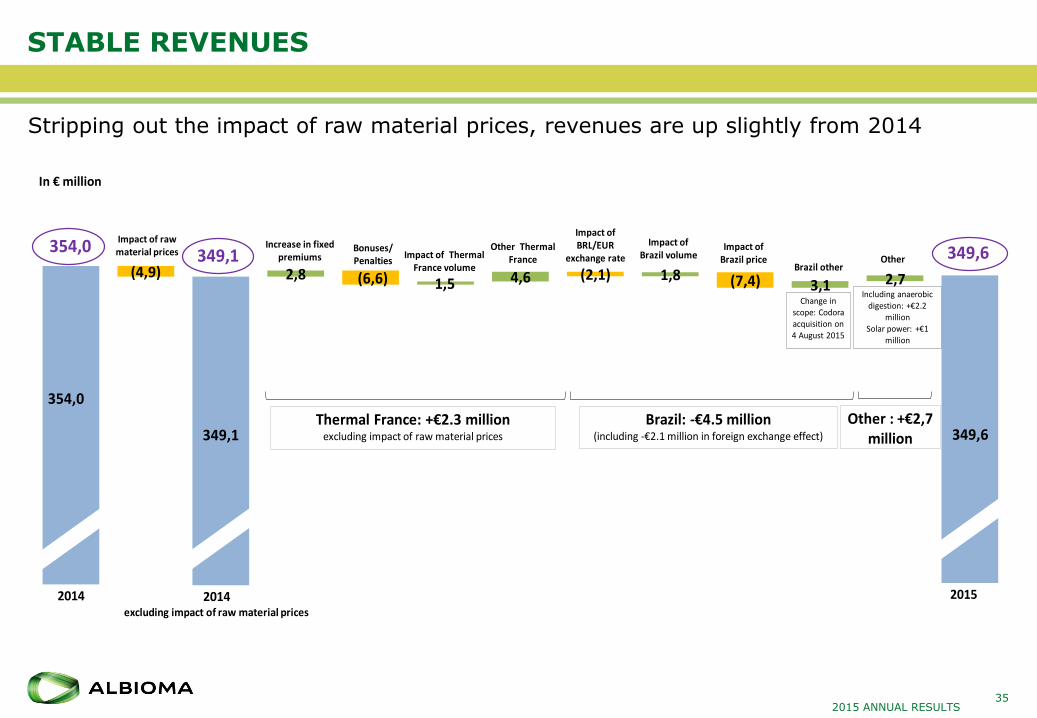
STABLE REVENUES
352015 ANNUAL RESULTS
Stripping out the impact of raw material prices, revenues are up slightly from 2014
354,0
349,1
(4,9) 2,8 (6,6) 1,5 4,6 (2,1) 1,8 (7,4) 3,1 2,7
349,6
T4. 2014 Bonus/Malus/Pénalités Autres effets Thermique France Effet volume Brésil Autres effet Brésil T4. 2015
In € million
2014 2015
354,0 349,6Increase in fixed
premiums Bonuses/Penalties
Impact of Thermal France volume
Other Thermal France
Impact of raw material prices
Brazil other
2014excluding impact of raw material prices
349,1 Other
Impact of BRL/EUR
exchange rate
Including anaerobic digestion: +€2.2
millionSolar power: +€1
million
Change in scope: Codora acquisition on 4 August 2015
Impact of Brazil volume
Impact of Brazil price
Brazil: -€4.5 million(including -€2.1 million in foreign exchange effect)
Thermal France: +€2.3 millionexcluding impact of raw material prices
Other : +€2,7million
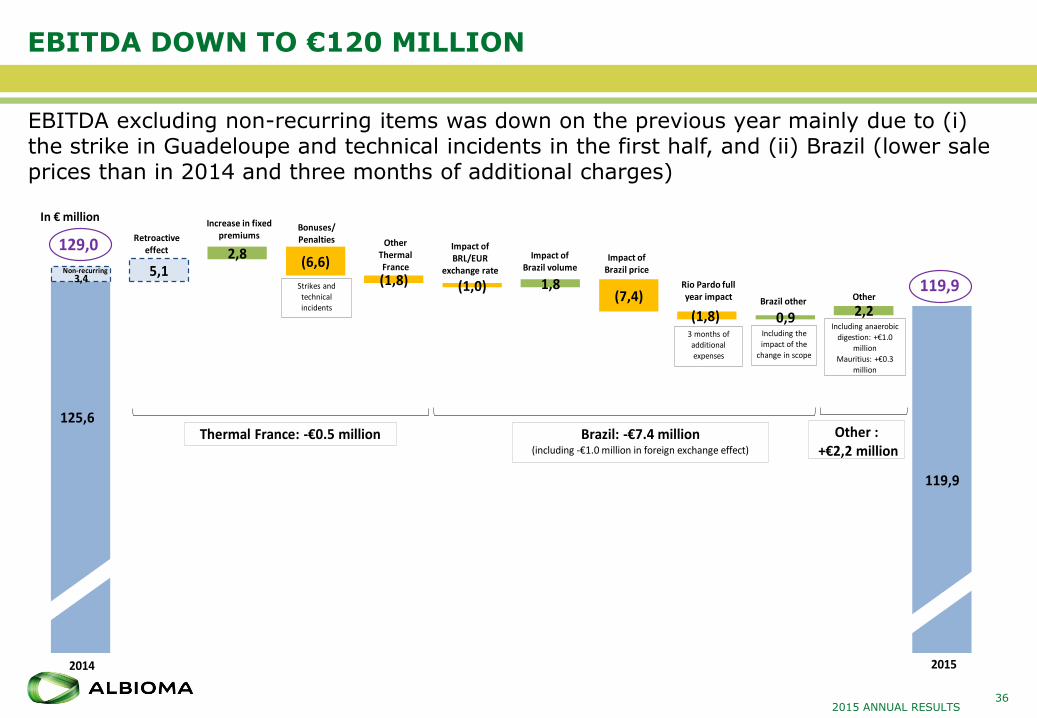
EBITDA DOWN TO €120 MILLION
362015 ANNUAL RESULTS
EBITDA excluding non-recurring items was down on the previous year mainly due to (i) the strike in Guadeloupe and technical incidents in the first half, and (ii) Brazil (lower sale prices than in 2014 and three months of additional charges)
125,6
119,9
3,45,1
2,8(6,6)
(1,8) (1,0) 1,8(7,4)
(1,8) 0,9 2,2
In € million
2014
Impact of Brazil volume
Increase in fixed premiums
Bonuses/Penalties
Non-recurring
Other119,9
129,0
2015
Brazil other
Other Thermal France
Impact of BRL/EUR
exchange rate
Including anaerobic digestion: +€1.0
millionMauritius: +€0.3
million
Retroactive effect
Impact of Brazil price
Thermal France: -€0.5 million Brazil: -€7.4 million(including -€1.0 million in foreign exchange effect)
Rio Pardo full year impact
Including the impact of the
change in scope
Strikes and technical incidents
3 months of additional expenses
Other :+€2,2 million
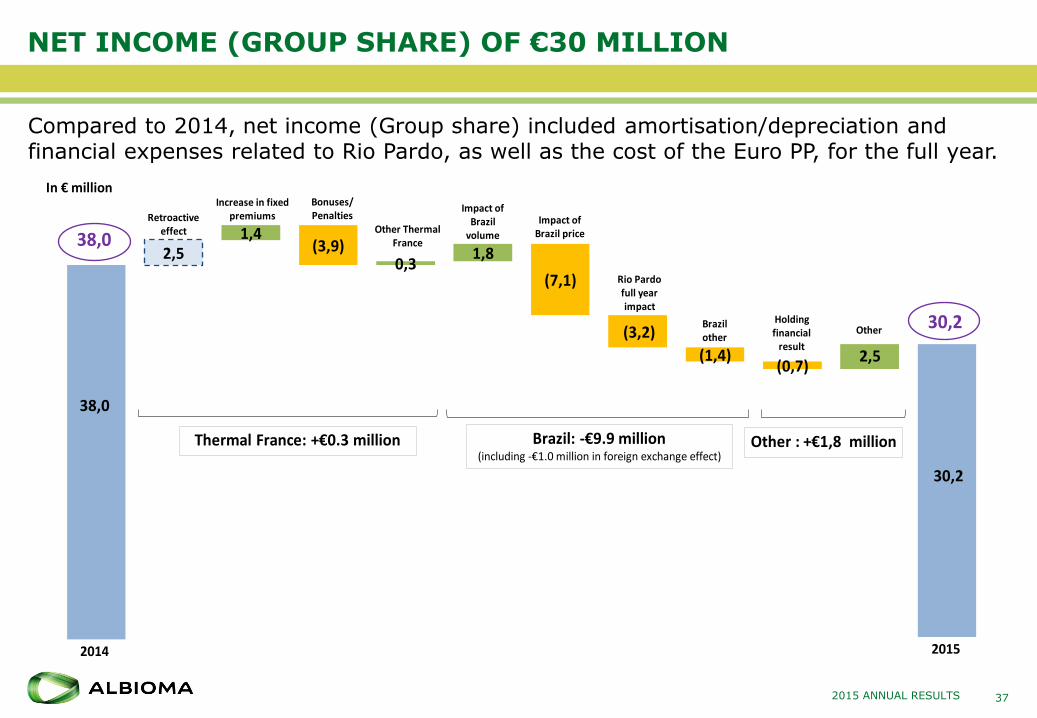
NET INCOME (GROUP SHARE) OF €30 MILLION
372015 ANNUAL RESULTS
Compared to 2014, net income (Group share) included amortisation/depreciation and financial expenses related to Rio Pardo, as well as the cost of the Euro PP, for the full year.
38,0
30,2
2,51,4
(3,9)0,3
1,8
(7,1)
(3,2)
(1,4)(0,7)
2,5
In € million
Rio Pardo full year impact
Increase in fixed premiums
Bonuses/Penalties
38,0
30,2
Other Thermal France
Brazil other
OtherHolding financial
result
2014 2015
Retroactive effect
Impact of Brazil
volume
Impact of Brazil price
Thermal France: +€0.3 million Brazil: -€9.9 million(including -€1.0 million in foreign exchange effect)
Other : +€1,8 million
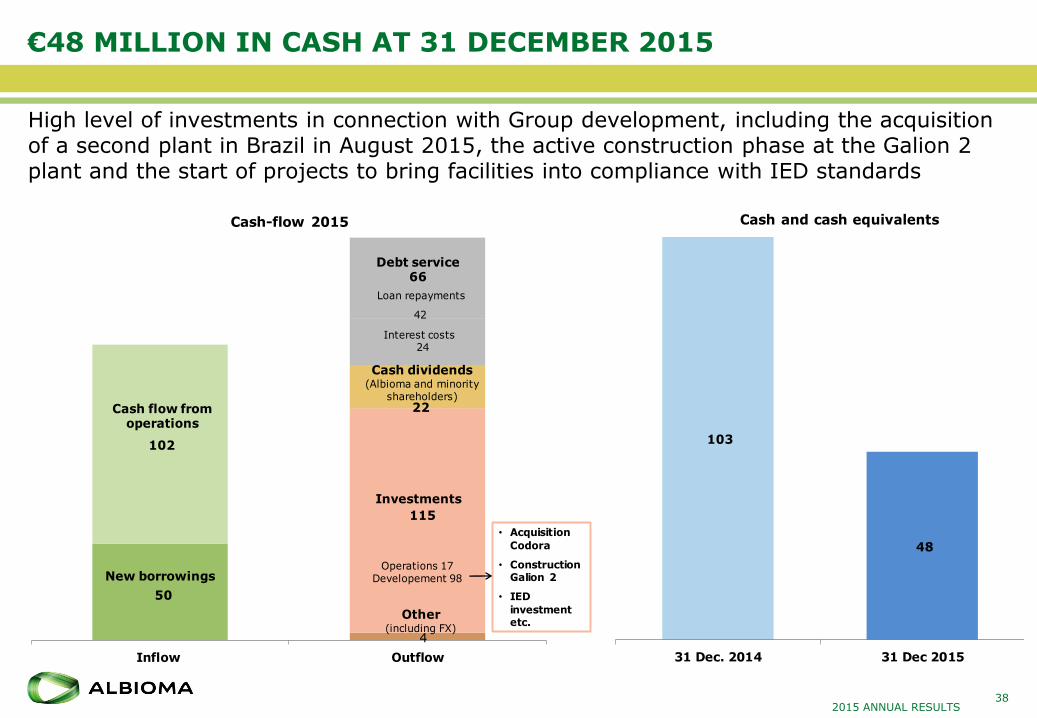
€48 MILLION IN CASH AT 31 DECEMBER 2015
382015 ANNUAL RESULTS
High level of investments in connection with Group development, including the acquisition of a second plant in Brazil in August 2015, the active construction phase at the Galion 2 plant and the start of projects to bring facilities into compliance with IED standards
103
48
31 Dec. 2014 31 Dec 2015
Cash and cash equivalents
4
115
22
50
24
102
42
Inflow Outflow
Cash-flow 2015
Loan repayments
Investments
Cash flow from operations
Interest costs
New borrowings
Debt service66
Operations 17Developement 98
Cash dividends(Albioma and minority
shareholders)
Other (including FX)
• Acquisition
Codora
• ConstructionGalion 2
• IED
investmentetc.
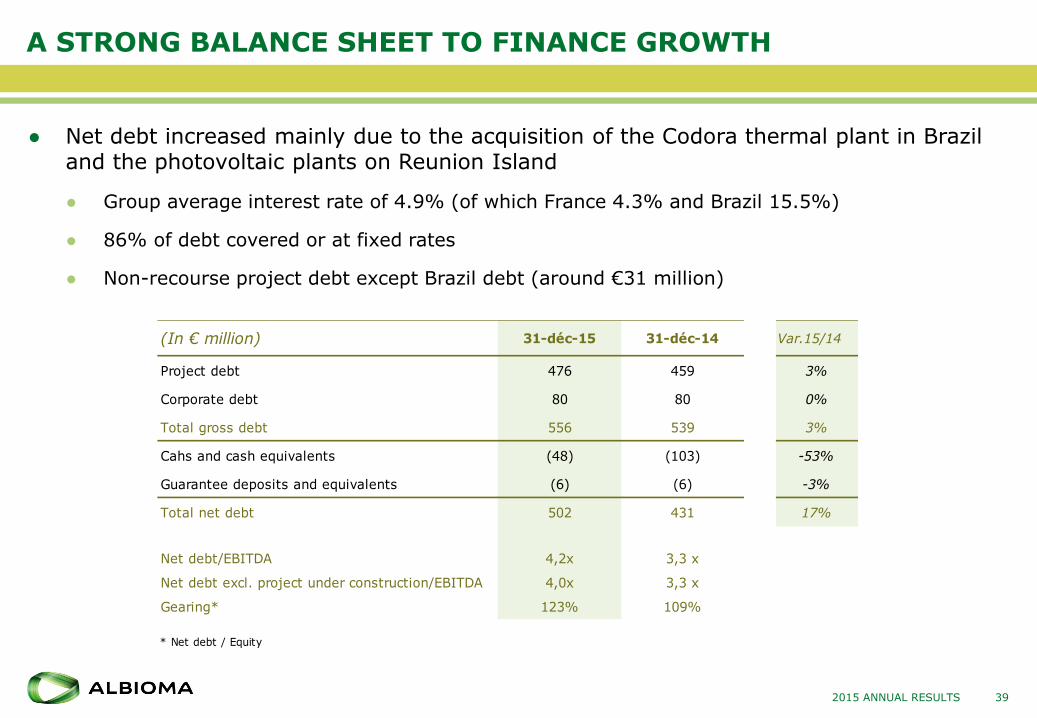
A STRONG BALANCE SHEET TO FINANCE GROWTH
● Net debt increased mainly due to the acquisition of the Codora thermal plant in Brazil and the photovoltaic plants on Reunion Island
● Group average interest rate of 4.9% (of which France 4.3% and Brazil 15.5%)
● 86% of debt covered or at fixed rates
● Non-recourse project debt except Brazil debt (around €31 million)
2015 ANNUAL RESULTS 39
(In € million) 31-déc-15 31-déc-14 Var. 15/14
Project debt 476 459 3%
Corporate debt 80 80 0%
Total gross debt 556 539 3%
Cahs and cash equivalents (48) (103) -53%
Guarantee deposits and equivalents (6) (6) -3%
Total net debt 502 431 17%
Net debt/EBITDA 4,2x 3,3 x
Net debt excl. project under construction/EBITDA 4,0x 3,3 x
Gearing* 123% 109%
* Net debt / Equity
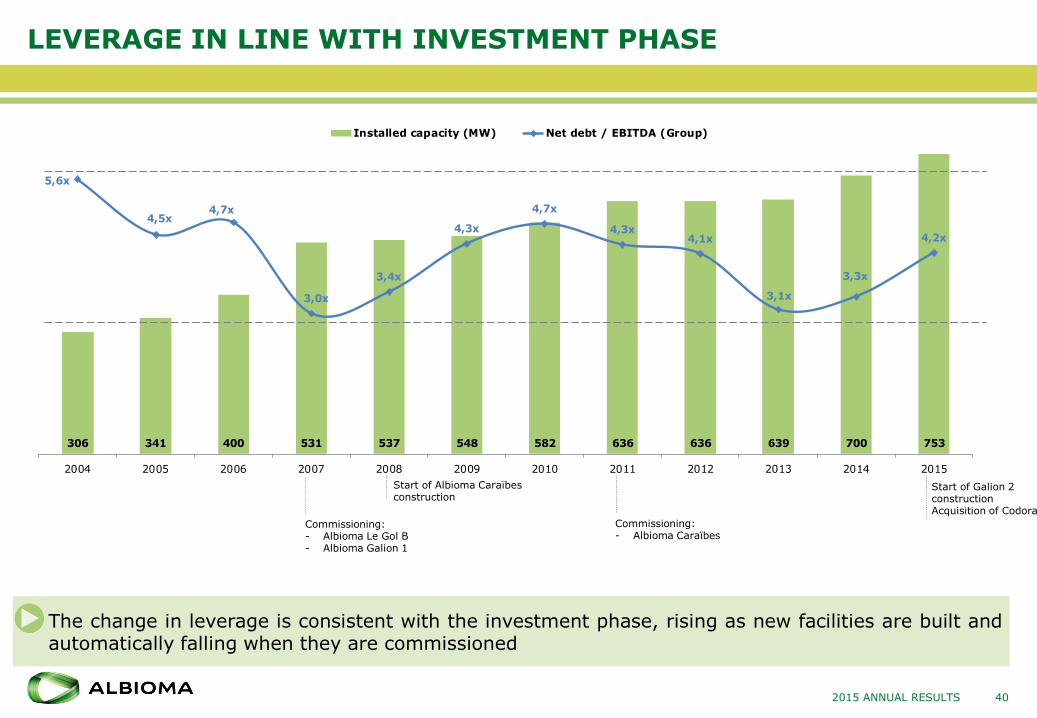
LEVERAGE IN LINE WITH INVESTMENT PHASE
40
306 341 400 531 537 548 582 636 636 639 700 753
5,6x
4,5x4,7x
3,0x
3,4x
4,3x
4,7x
4,3x4,1x
3,1x
3,3x
4,2x
-
1,0x
2,0x
3,0x
4,0x
5,0x
6,0x
2004 2005 2006 2007 2008 2009 2010 2011 2012 2013 2014 2015
Installed capacity (MW) Net debt / EBITDA (Group)
2015 ANNUAL RESULTS
● The change in leverage is consistent with the investment phase, rising as new facilities are built andautomatically falling when they are commissioned
Commissioning:- Albioma Le Gol B- Albioma Galion 1
Commissioning:- Albioma Caraïbes
Start of Galion 2 constructionAcquisition of Codora
Start of Albioma Caraïbes construction
LONG-TERM DEBT ADAPTED TO BUSINESS PROFILE
2015 ANNUAL RESULTS 41
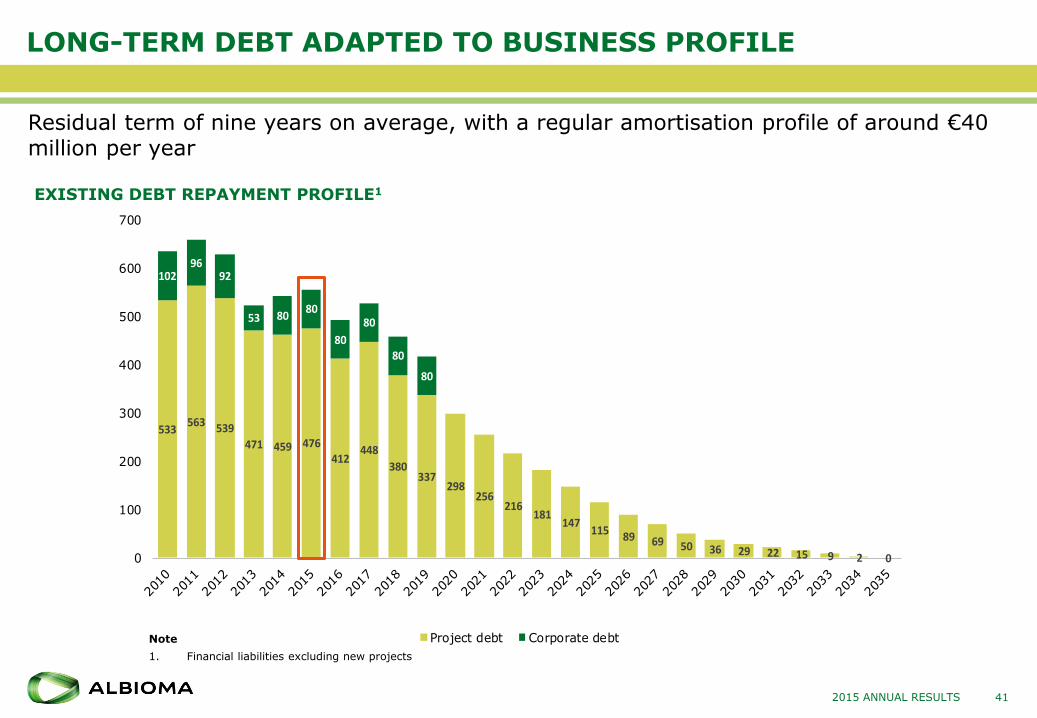
Residual term of nine years on average, with a regular amortisation profile of around €40 million per year
533563 539
471 459 476412
448
380337
298256
216181
147115 89 69 50 36 29 22 15 9 2 0
10296
92
53 8080
80
80
80
80
0
0
100
200
300
400
500
600
700
Project debt Corporate debtNote
1. Financial liabilities excluding new projects
EXISTING DEBT REPAYMENT PROFILE1
2016 OBJECTIVES
2015 ANNUAL RESULTS 42
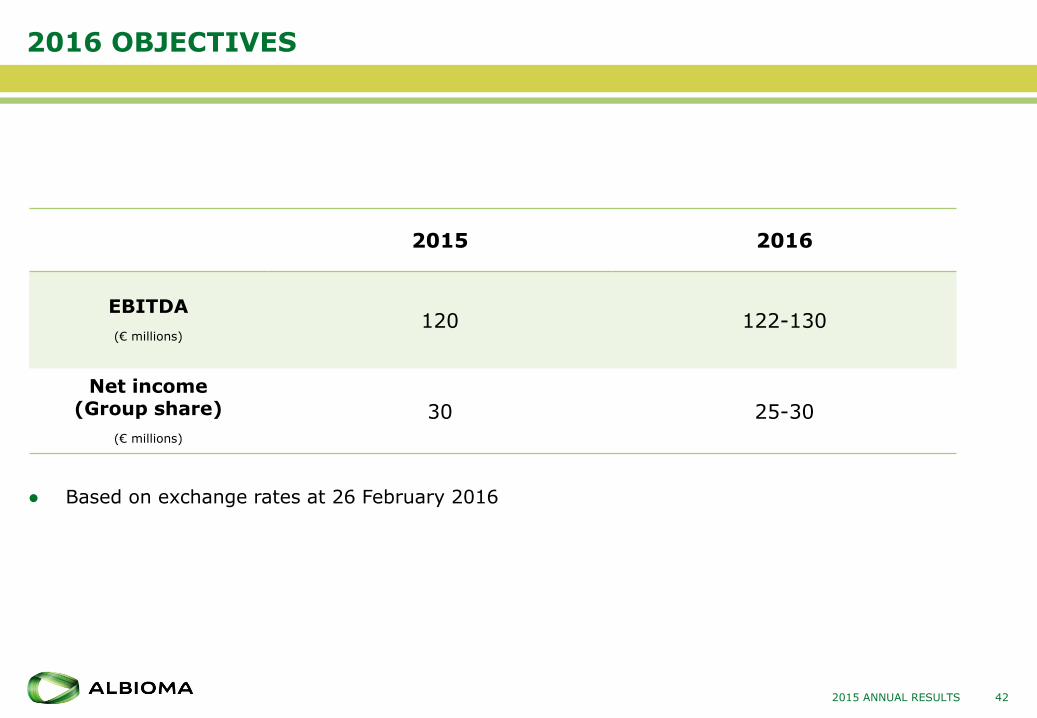
2015 2016
EBITDA
(€ millions)120 122-130
Net income (Group share)
(€ millions)
30 25-30
● Based on exchange rates at 26 February 2016
2015 ANNUAL RESULTS 43
OUTLOOK5.
43
CHANGE IN GOVERNANCE
442015 ANNUAL RESULTS
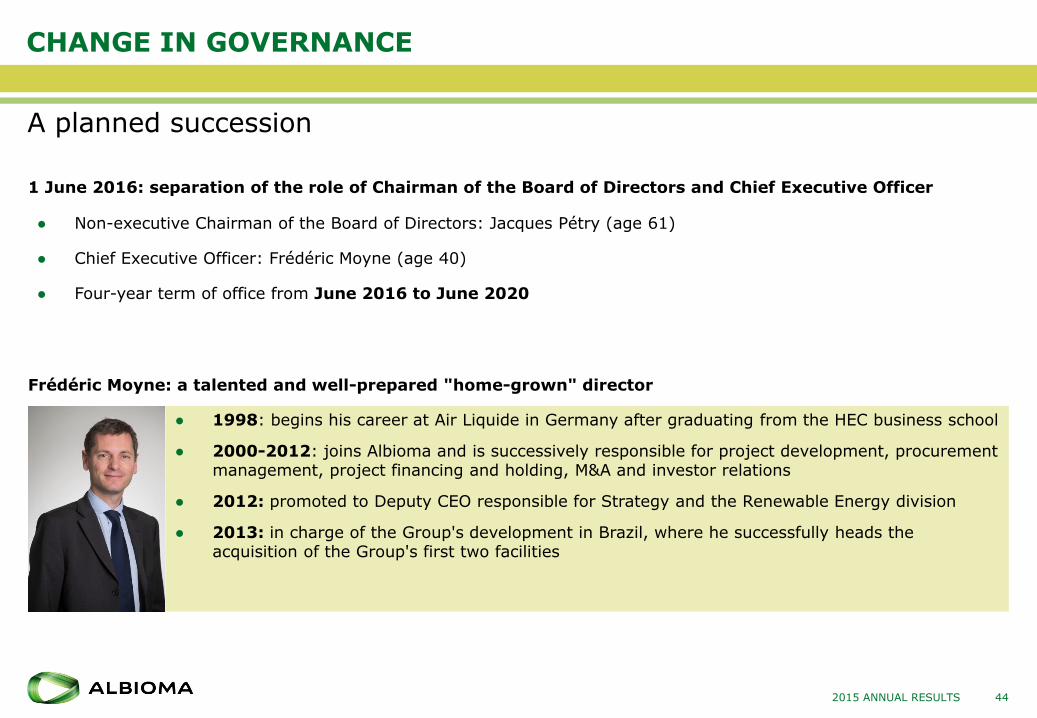
A planned succession
● Non-executive Chairman of the Board of Directors: Jacques Pétry (age 61)
● Chief Executive Officer: Frédéric Moyne (age 40)
● Four-year term of office from June 2016 to June 2020
● 1998: begins his career at Air Liquide in Germany after graduating from the HEC business school
● 2000-2012: joins Albioma and is successively responsible for project development, procurement management, project financing and holding, M&A and investor relations
● 2012: promoted to Deputy CEO responsible for Strategy and the Renewable Energy division
● 2013: in charge of the Group's development in Brazil, where he successfully heads the acquisition of the Group's first two facilities
1 June 2016: separation of the role of Chairman of the Board of Directors and Chief Executive Officer
Frédéric Moyne: a talented and well-prepared "home-grown" director
CHANGE IN GOVERNANCE
452015 ANNUAL RESULTS
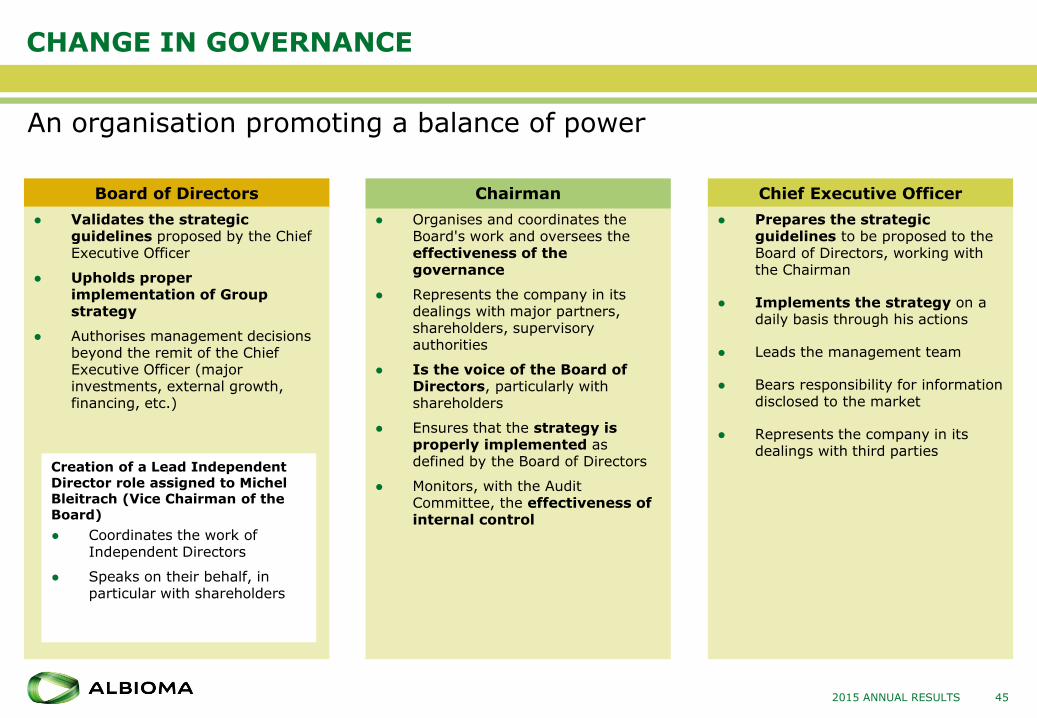
An organisation promoting a balance of power
● Organises and coordinates the Board's work and oversees the effectiveness of the governance
● Represents the company in its dealings with major partners, shareholders, supervisory authorities
● Is the voice of the Board of Directors, particularly with shareholders
● Ensures that the strategy is properly implemented as defined by the Board of Directors
● Monitors, with the Audit Committee, the effectiveness of internal control
Chairman Chief Executive OfficerBoard of Directors
● Prepares the strategic guidelines to be proposed to the Board of Directors, working with the Chairman
● Implements the strategy on a daily basis through his actions
● Leads the management team
● Bears responsibility for information disclosed to the market
● Represents the company in its dealings with third parties
● Validates the strategic guidelines proposed by the Chief Executive Officer
● Upholds proper implementation of Group strategy
● Authorises management decisions beyond the remit of the Chief Executive Officer (major investments, external growth, financing, etc.)
Creation of a Lead Independent Director role assigned to Michel Bleitrach (Vice Chairman of the Board)
● Coordinates the work of Independent Directors
● Speaks on their behalf, in particular with shareholders
SHAREHOLDING EVOLUTION
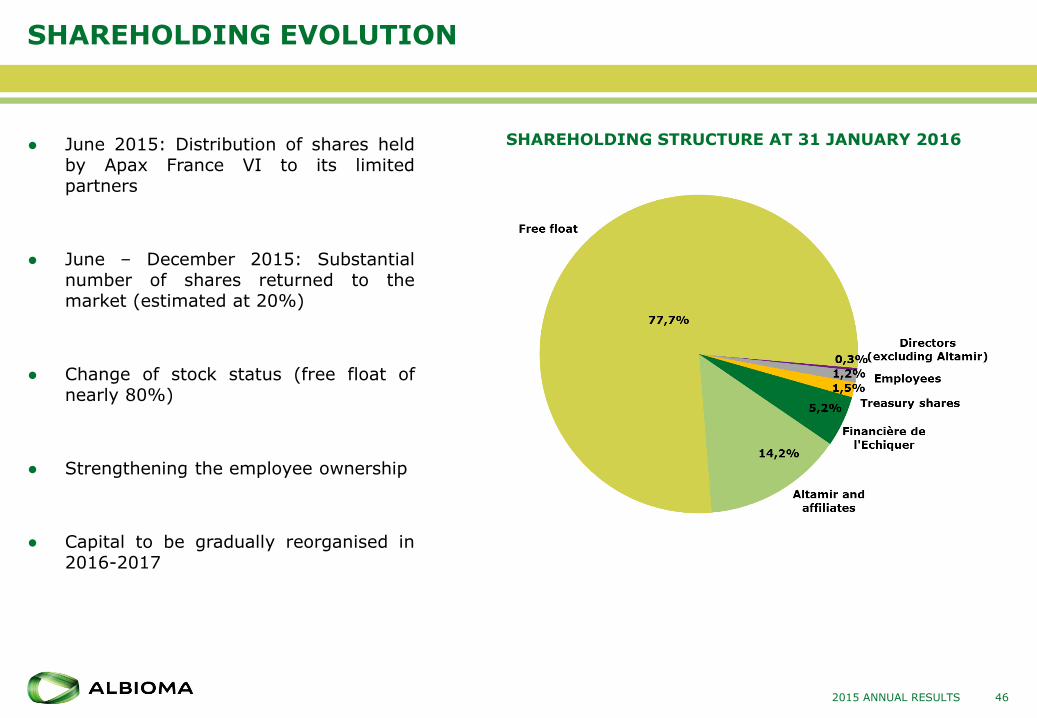
● June 2015: Distribution of shares heldby Apax France VI to its limitedpartners
● June – December 2015: Substantialnumber of shares returned to themarket (estimated at 20%)
● Change of stock status (free float ofnearly 80%)
● Strengthening the employee ownership
● Capital to be gradually reorganised in2016-2017
SHAREHOLDING STRUCTURE AT 31 JANUARY 2016
462015 ANNUAL RESULTS
2013-2023 INVESTMENT PLAN FOR GROWTH
47
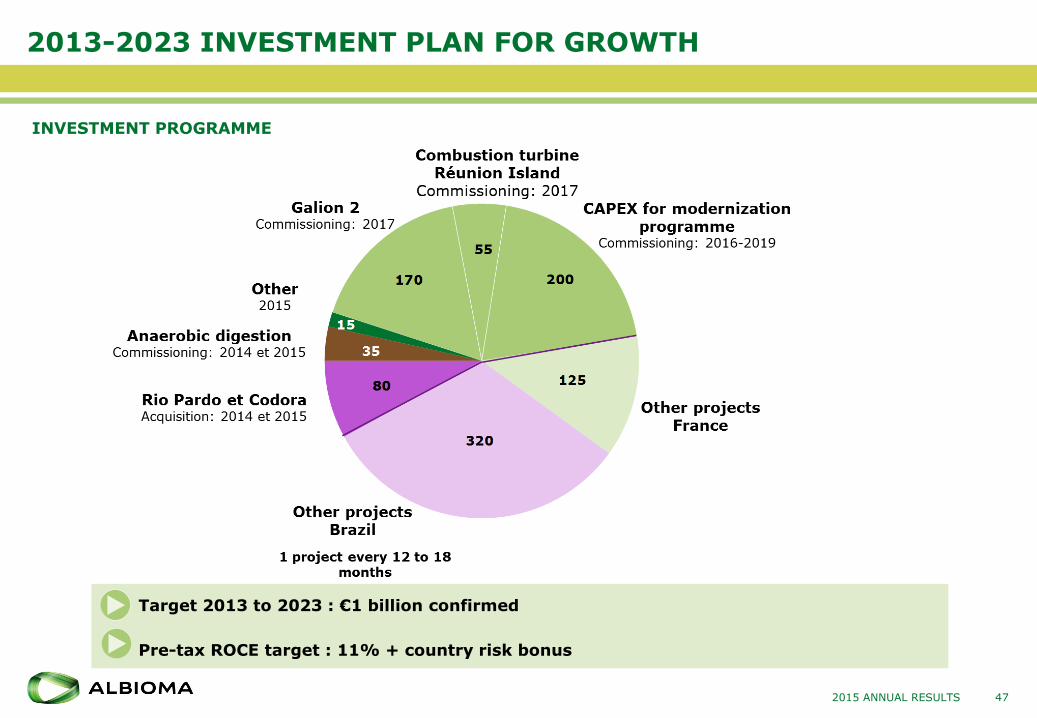
INVESTMENT PROGRAMME
2015 ANNUAL RESULTS
● Target 2013 to 2023 : €1 billion confirmed
● Pre-tax ROCE target : 11% + country risk bonus
ALBIOMA: A HYBRID GROWTH AND YIELD STOCK
● Sustain and double the industrial assets base between 2013 and 2023
● Objective to double net income (Group share) in 10 years (baseline 2013)
● Confirmation of the dividend distribution policy: 50% of net income (Group share), excluding non-recurring items
2015 ANNUAL RESULTS
Proposal to distribute a dividend for the 2015 financial year: €0.57 per share
● Payable 100% in cash or 50% in cash and 50% in Albioma shares
48
ALBIOMA
=
THERMAL BIOMASS
+
SOLAR POWER
QUALITY ASSETS GENERATING HIGH RECURRING CASH FLOWS
= STRENGTH
CREATING VALUE FROM BIOMASS, A RESOURCE OF THE FUTURE
= GROWTH
A ROBUST INDUSTRIAL AND FINANCIAL MODEL
= PROFITABILITY
2015 ANNUAL RESULTS 50
APPENDICES6.
50
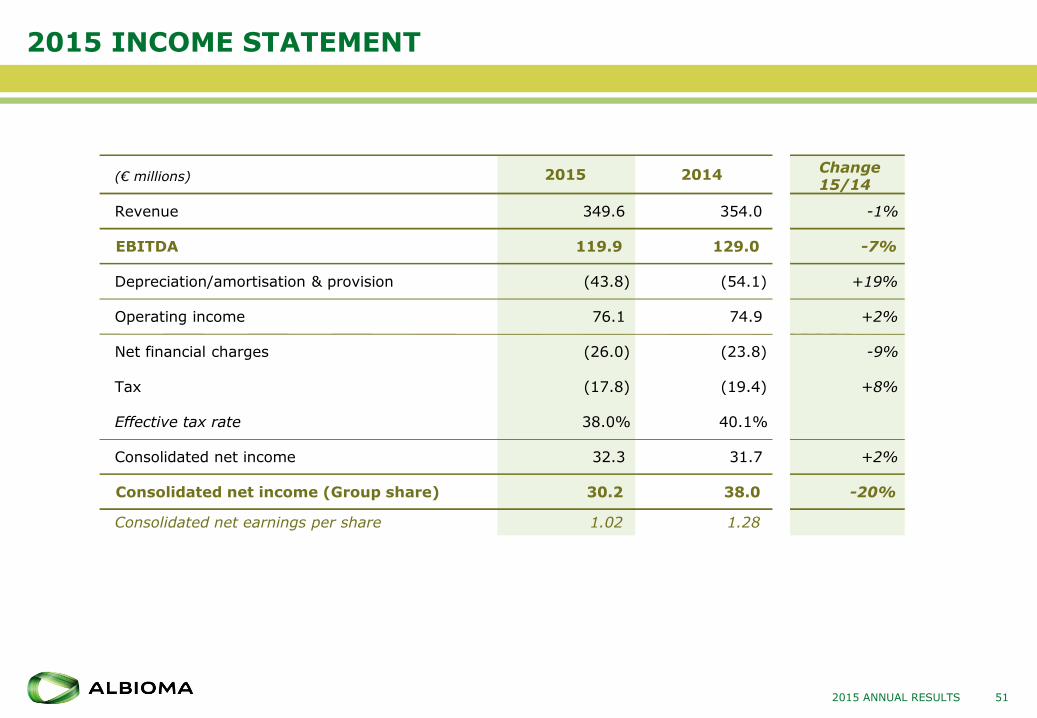
2015 INCOME STATEMENT
512015 ANNUAL RESULTS
(€ millions) 2015 2014Change15/14
Revenue 349.6 354.0 -1%
EBITDA 119.9 129.0 -7%
Depreciation/amortisation & provision (43.8) (54.1) +19%
Operating income 76.1 74.9 +2%
Net financial charges (26.0) (23.8) -9%
Tax (17.8) (19.4) +8%
Effective tax rate 38.0% 40.1%
Consolidated net income 32.3 31.7 +2%
Consolidated net income (Group share) 30.2 38.0 -20%
Consolidated net earnings per share 1.02 1.28
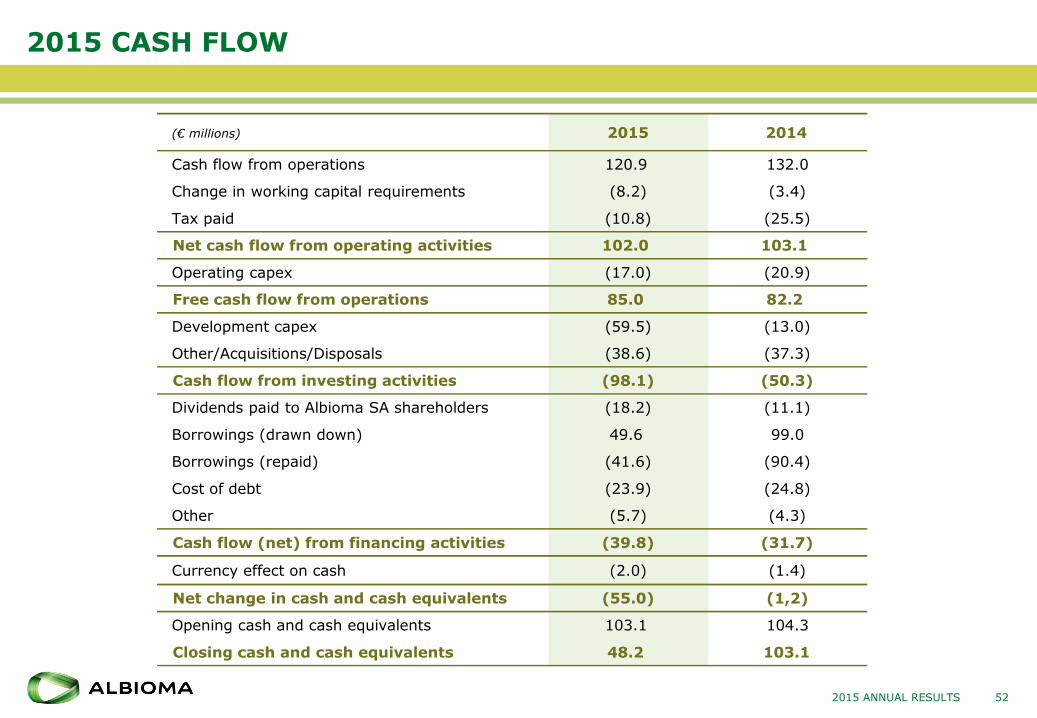
2015 CASH FLOW
522015 ANNUAL RESULTS
(€ millions) 2015 2014
Cash flow from operations 120.9 132.0
Change in working capital requirements (8.2) (3.4)
Tax paid (10.8) (25.5)
Net cash flow from operating activities 102.0 103.1
Operating capex (17.0) (20.9)
Free cash flow from operations 85.0 82.2
Development capex (59.5) (13.0)
Other/Acquisitions/Disposals (38.6) (37.3)
Cash flow from investing activities (98.1) (50.3)
Dividends paid to Albioma SA shareholders (18.2) (11.1)
Borrowings (drawn down) 49.6 99.0
Borrowings (repaid) (41.6) (90.4)
Cost of debt (23.9) (24.8)
Other (5.7) (4.3)
Cash flow (net) from financing activities (39.8) (31.7)
Currency effect on cash (2.0) (1.4)
Net change in cash and cash equivalents (55.0) (1,2)
Opening cash and cash equivalents 103.1 104.3
Closing cash and cash equivalents 48.2 103.1
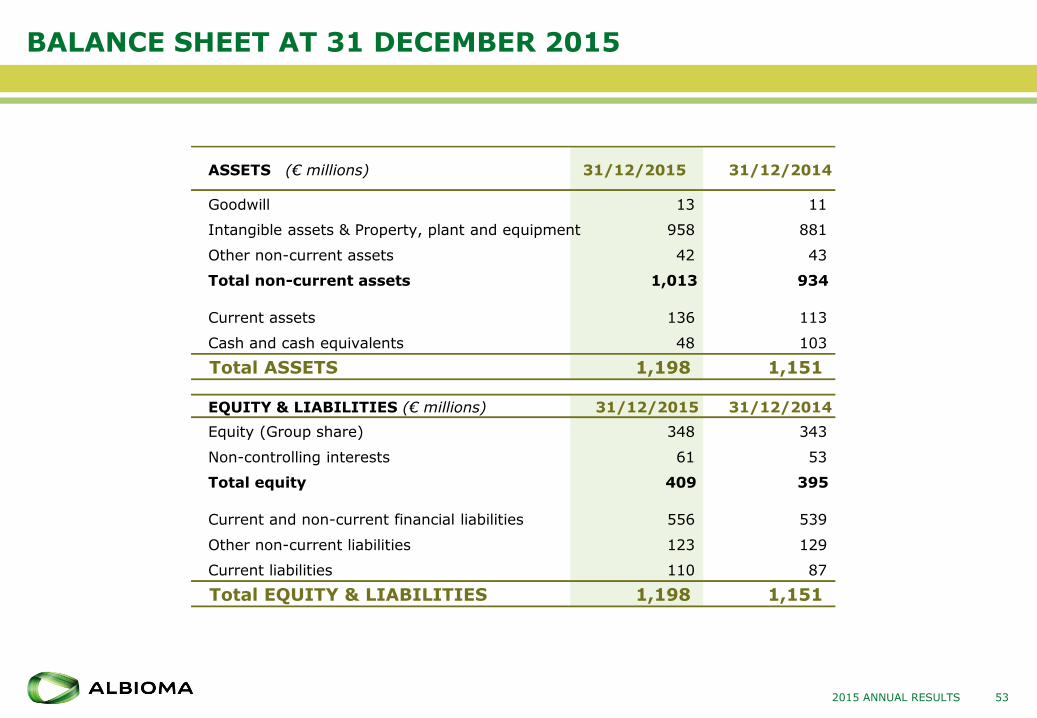
BALANCE SHEET AT 31 DECEMBER 2015
532015 ANNUAL RESULTS
ASSETS (€ millions) 31/12/2015 31/12/2014
Goodwill 13 11
Intangible assets & Property, plant and equipment 958 881
Other non-current assets 42 43
Total non-current assets 1,013 934
Current assets 136 113
Cash and cash equivalents 48 103
Total ASSETS 1,198 1,151
EQUITY & LIABILITIES (€ millions) 31/12/2015 31/12/2014
Equity (Group share) 348 343
Non-controlling interests 61 53
Total equity 409 395
Current and non-current financial liabilities 556 539
Other non-current liabilities 123 129
Current liabilities 110 87
Total EQUITY & LIABILITIES 1,198 1,151
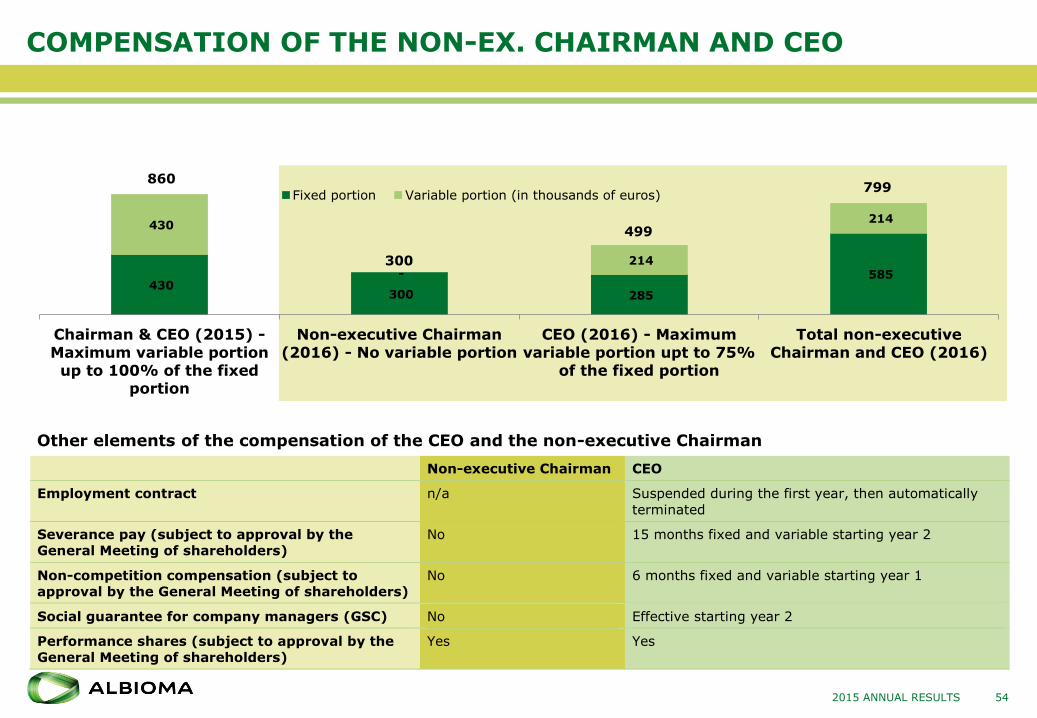
COMPENSATION OF THE NON-EX. CHAIRMAN AND CEO
54
Other elements of the compensation of the CEO and the non-executive Chairman
2015 ANNUAL RESULTS
Non-executive Chairman CEO
Employment contract n/a Suspended during the first year, then automatically
terminated
Severance pay (subject to approval by the
General Meeting of shareholders)
No 15 months fixed and variable starting year 2
Non-competition compensation (subject to
approval by the General Meeting of shareholders)
No 6 months fixed and variable starting year 1
Social guarantee for company managers (GSC) No Effective starting year 2
Performance shares (subject to approval by the
General Meeting of shareholders)
Yes Yes
430 300 285
585
430
-214
214
Chairman & CEO (2015) -
Maximum variable portionup to 100% of the fixed
portion
Non-executive Chairman
(2016) - No variable portion
CEO (2016) - Maximum
variable portion upt to 75%of the fixed portion
Total non-executive
Chairman and CEO (2016)
Fixed portion Variable portion (in thousands of euros)
860799
499
300