Embed Size (px)
Citation preview
2015 Annual ReportForm 10-K
Proxy Statement
2015 Annual ReportForm 10-K
Proxy Statement
Building a Strong America®
MDU Resources Group, Inc.
We are a member of the S&P MidCap 400 index. We provide value-added natural resource products and related services that are essential to energy and transportation infrastructure, including regulated utilities, pipeline and midstream, construction materials and services and a diesel refinery.
MDU Resources Group, Inc. 1
Highlights
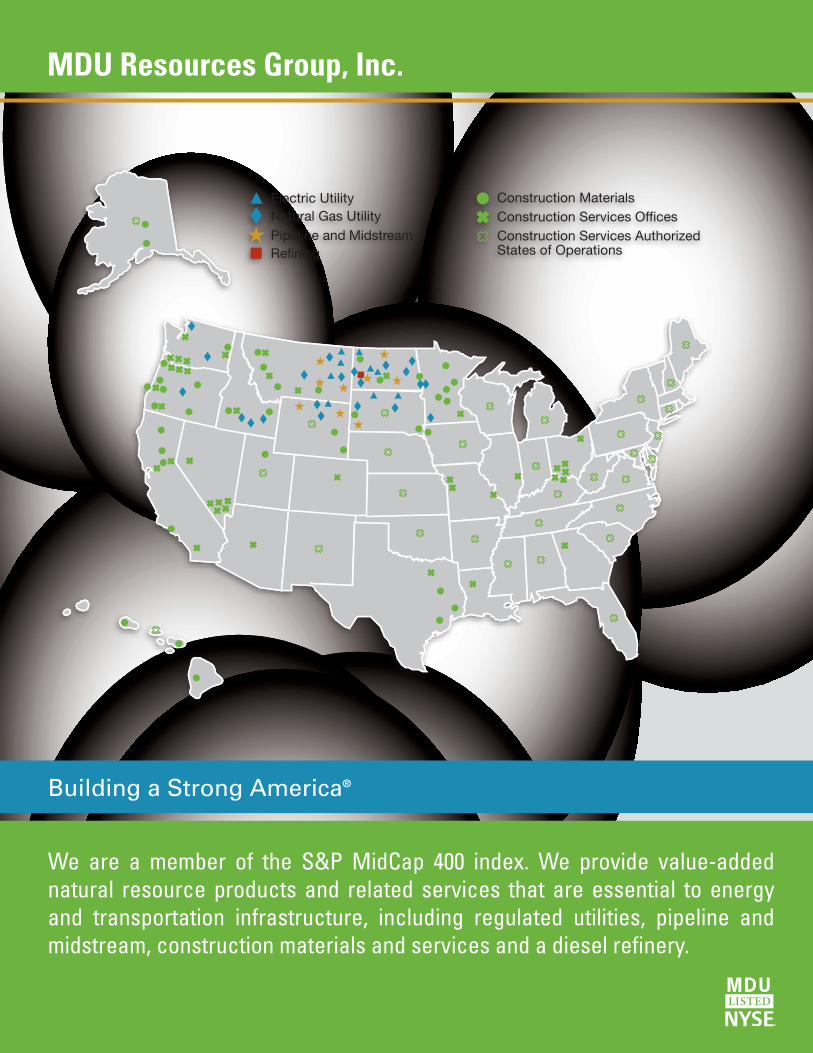
Note: The company, in addition to presenting its earnings information in conformity with Generally Accepted Accounting Principles, has provided non-GAAP earnings data that reflect adjustments, all after taxes, to exclude: an exploration and production loss of $787.6 million in 2015 and earnings of $97.3 million in 2014, natural gas gathering asset impairments of $10.6 million in 2015, the company’s portion of additional startup costs at Dakota Prairie Refining of $2.0 million in 2015, a multiemployer pension plan withdrawal liability of $1.5 million in 2015 and $8.4 million in 2014, an underperforming, non-strategic asset loss of $1.4 million in 2015, and earnings from discontinued operations of $3.1 million in 2014 related to other operations. The company believes these non-GAAP financial measures are useful to investors because the items excluded are not indicative of the company’s continuing operating results. Also, the company’s management uses these non-GAAP financial measures as indicators for planning and forecasting future periods. The presentation of this additional information is not meant to be considered a substitute for financial measures prepared in accordance with GAAP.Forward-looking statements: This Annual Report contains forward-looking statements within the meaning of section 21E of the Securities Exchange Act of 1934. Forward-looking statements should be read with the cautionary statements and important factors included in Part I, Forward-Looking Statements and Item 1A — Risk Factors of the company’s 2015 Form 10-K. Forward-looking statements are all statements other than statements of historical fact, including without limitation those statements that are identified by the words anticipates, estimates, expects, intends, plans, predicts and similar expressions.
Dividends (per common share)We have paid dividends uninterrupted for 78 years.
Total Shareholder Returns (as of December 31, 2015)
Capitalization Ratios
A disciplined strategy for debt management has kept our balance sheet strong.
Debt
Equity
Years ended December 31, 2015 2014
(In millions, where applicable)
Operating revenues $ 4,191.5 $ 4,114.9Operating income $ 254.1 $ 319.4Earnings (loss) on common stock $ (623.1) $ 297.5 Adjustments net of tax: Exploration and production business 787.6 (97.3) Other adjustments 15.5 5.3Adjusted earnings $ 180.0 $ 205.5Earnings (loss) per share $ (3.20) $ 1.55Adjusted earnings per share $ .92 $ 1.07Dividends declared per common share $ .7350 $ .7150Weighted average common shares outstanding – diluted 195.0 192.6Total assets $ 6,628 $ 7,832Total equity $ 2,521 $ 3,250Total debt $ 1,917 $ 2,094Capitalization ratios: Total equity 56.8% 60.8% Total debt 43.2 39.2 100% 100%Price/earnings from continuing operations ratio (12 months ended) 23.8x 24.7xBook value per common share $ 12.83 $ 16.66Market value as a percent of book value 142.8% 141.1%Employees 8,689 8,451
0.0
0.1
0.2
0.3
0.4
0.5
0.6
0.7
0.8
20152014201320122011
$.66 $.68 $.70 $.72 $.74
0
20
40
60
80
100DEBT
EQUITY
20152014201320122011
43%
57%
34%
66%
40%
60%
40%
60%
39%
61%
20 year10 year5 year3 year1 year
-19%
-2%
1% 1%
9%
0.0
0.1
0.2
0.3
0.4
0.5
0.6
0.7
0.8
20152014201320122011
$.66 $.68 $.70 $.72 $.74
0
20
40
60
80
100DEBT
EQUITY
20152014201320122011
43%
57%
34%
66%
40%
60%
40%
60%
39%
61%
20 year10 year5 year3 year1 year
-19%
-2%
1% 1%
9%
0.0
0.1
0.2
0.3
0.4
0.5
0.6
0.7
0.8
20152014201320122011
$.66 $.68 $.70 $.72 $.74
0
20
40
60
80
100DEBT
EQUITY
20152014201320122011
43%
57%
34%
66%
40%
60%
40%
60%
39%
61%
20 year10 year5 year3 year1 year
-19%
-2%
1% 1%
9%
MDU Resources Group, Inc.2
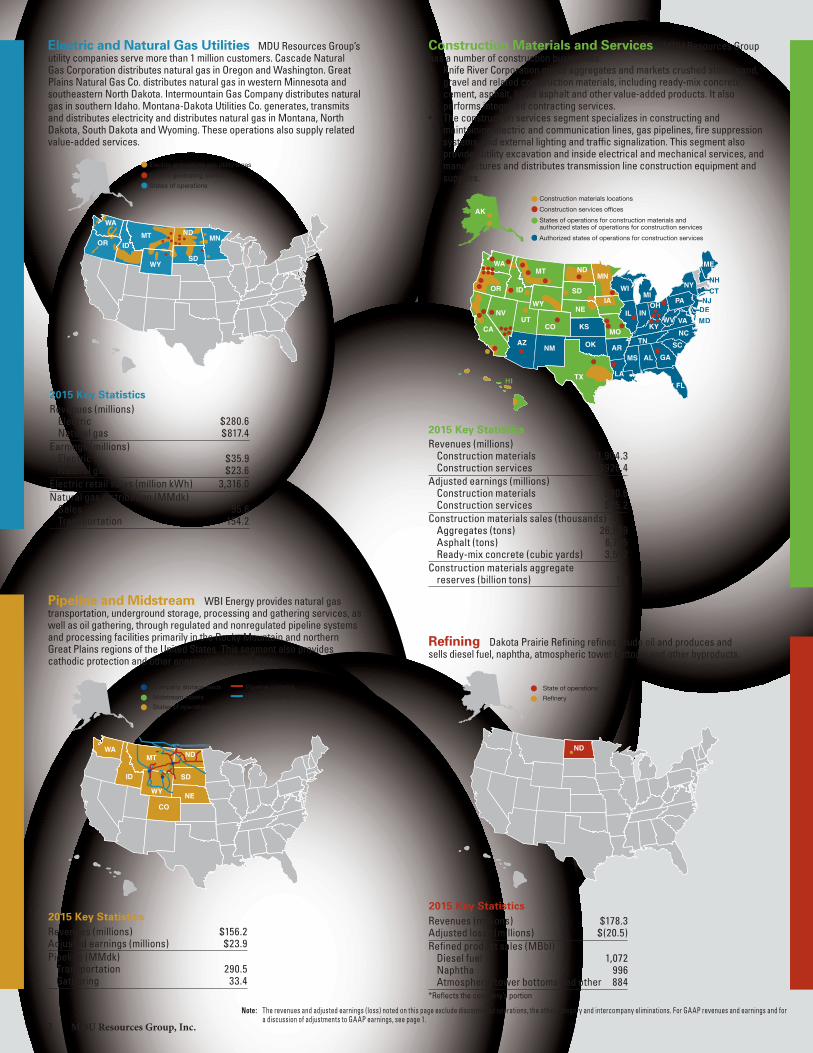
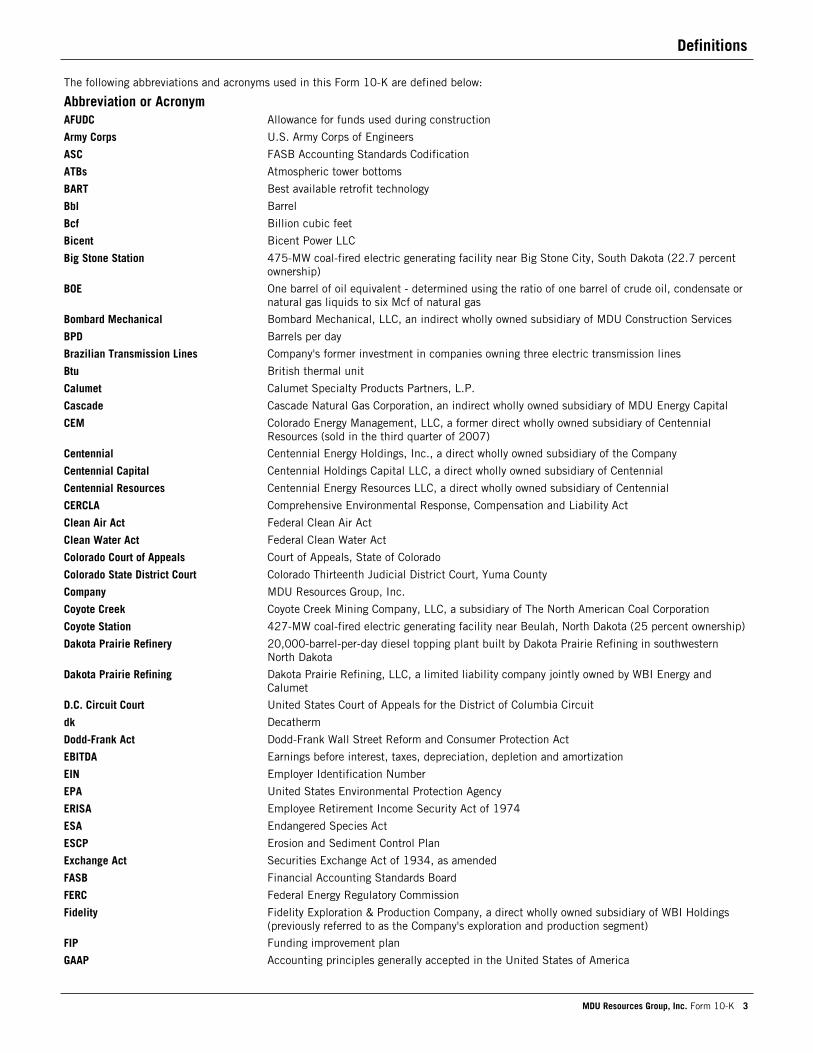
Electric and Natural Gas Utilities MDU Resources Group’s utility companies serve more than 1 million customers. Cascade Natural Gas Corporation distributes natural gas in Oregon and Washington. Great Plains Natural Gas Co. distributes natural gas in western Minnesota and southeastern North Dakota. Intermountain Gas Company distributes natural gas in southern Idaho. Montana-Dakota Utilities Co. generates, transmits and distributes electricity and distributes natural gas in Montana, North Dakota, South Dakota and Wyoming. These operations also supply related value-added services.
2015 Key Statistics2015 Key Statistics
2015 Key Statistics
Note: The revenues and adjusted earnings (loss) noted on this page exclude discontinued operations, the other category and intercompany eliminations. For GAAP revenues and earnings and for a discussion of adjustments to GAAP earnings, see page 1.
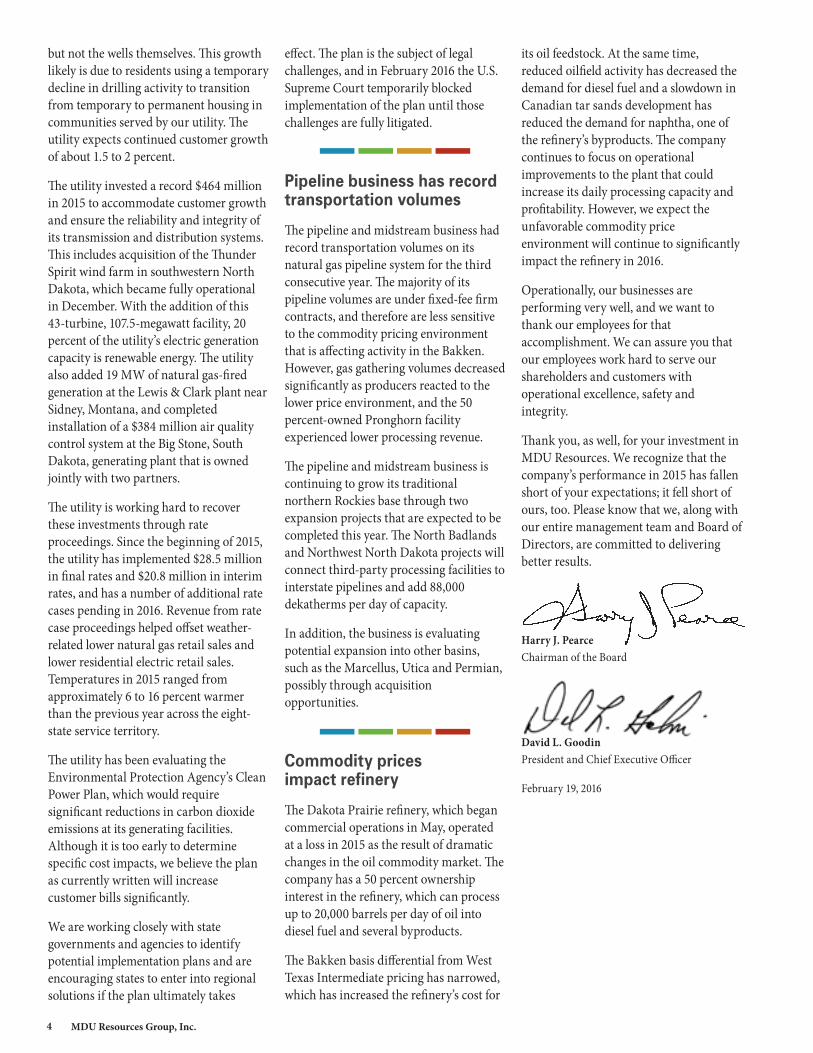
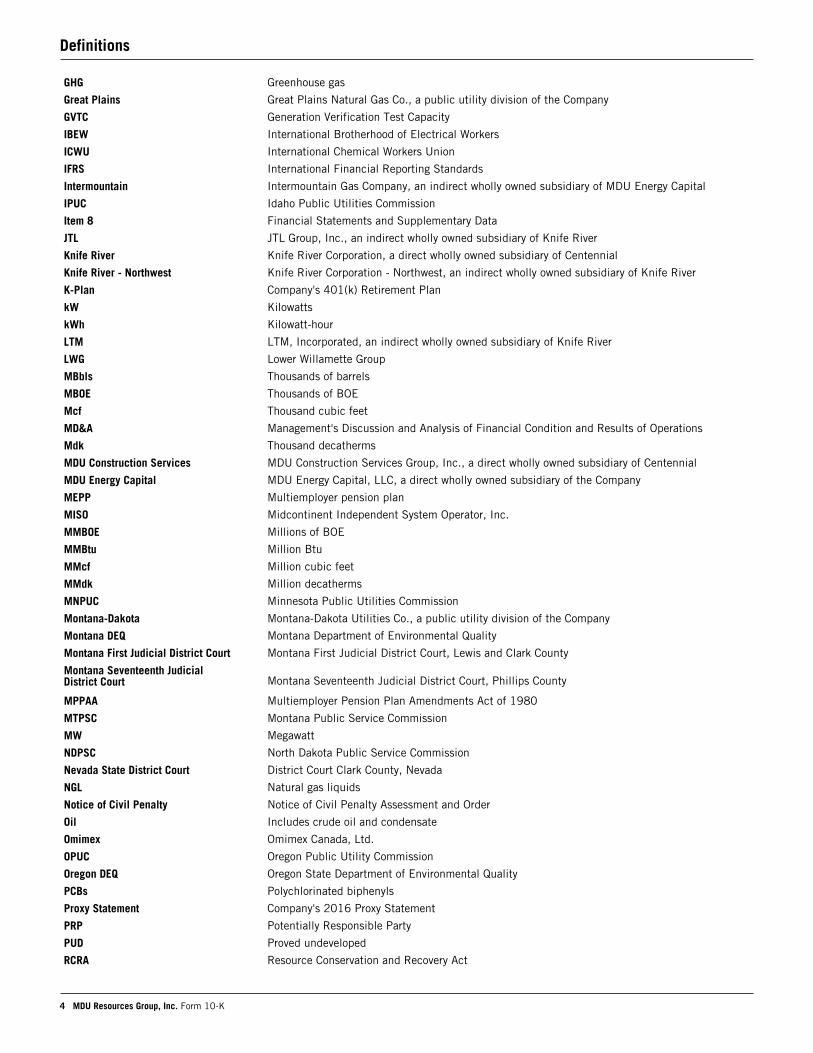
Pipeline and Midstream WBI Energy provides natural gas transportation, underground storage, processing and gathering services, as well as oil gathering, through regulated and nonregulated pipeline systems and processing facilities primarily in the Rocky Mountain and northern Great Plains regions of the United States. This segment also provides cathodic protection and other energy-related services.
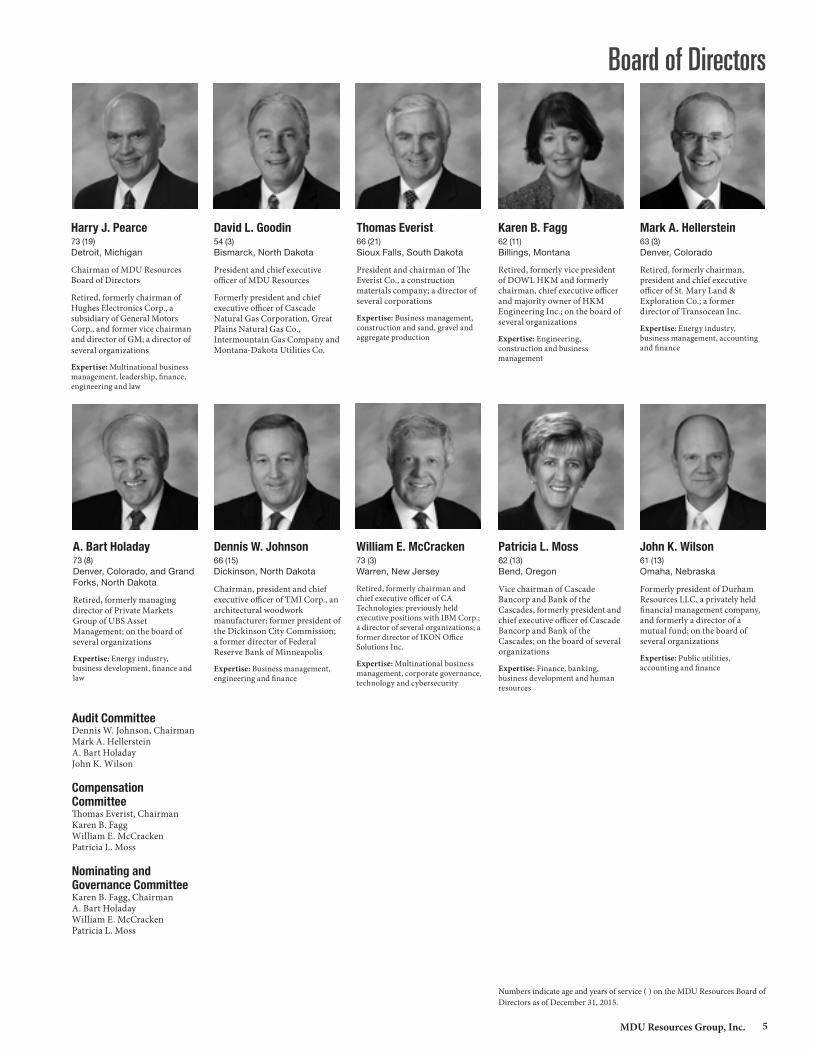
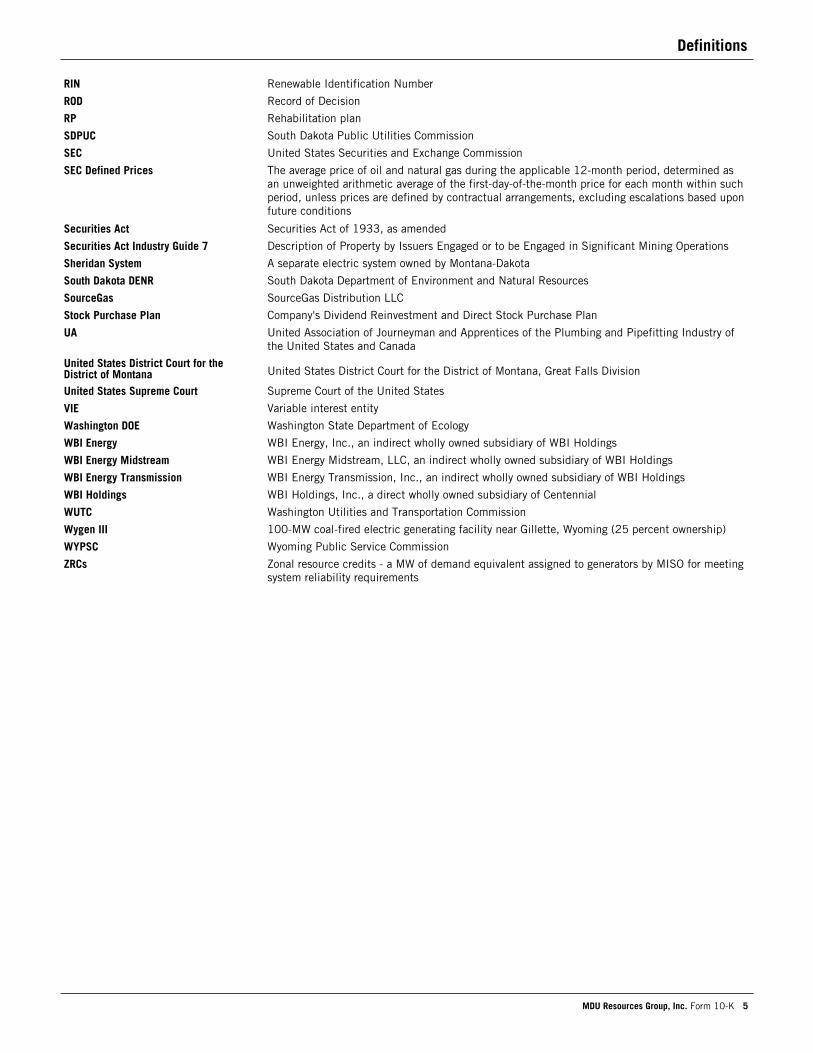
Refining Dakota Prairie Refining refines crude oil and produces and sells diesel fuel, naphtha, atmospheric tower bottoms and other byproducts.
Revenues (millions) $156.2Adjusted earnings (millions) $23.9Pipeline (MMdk) Transportation 290.5 Gathering 33.4
Revenues (millions) $178.3Adjusted loss* (millions) $(20.5)Refined product sales (MBbl) Diesel fuel 1,072 Naphtha 996 Atmospheric tower bottoms and other 884*Reflects the company’s portion
SD
MTID
WY
ORND
MN
WA
Electric and natural gas utility areas
Electric generating stations
States of operations
NE
SD
MT
ID
WY
CO
WAND
Company storage fields
Midstream assets
States of operations
Pipeline systems
Interconnecting pipelines
ND
State of operations
Refinery
NE
SD
MT
ID
HI
WY
COUT
NV
CA
OR
WA
AZNM
NDMN
IA
MO
AR
LA
TN
MS
NC
VAWVKY
INOH
PA NJCT
NY
ME
AL GA
FL
SC
IL
MIWI
KS
OK
TX
NH
AK
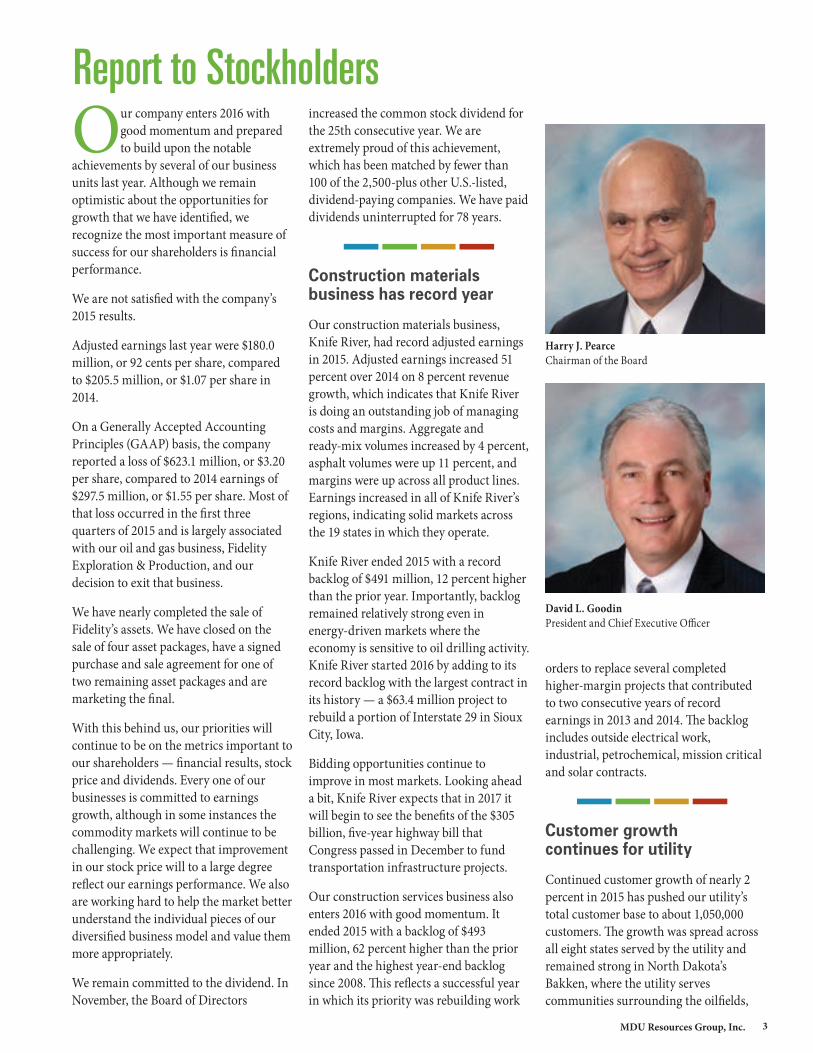
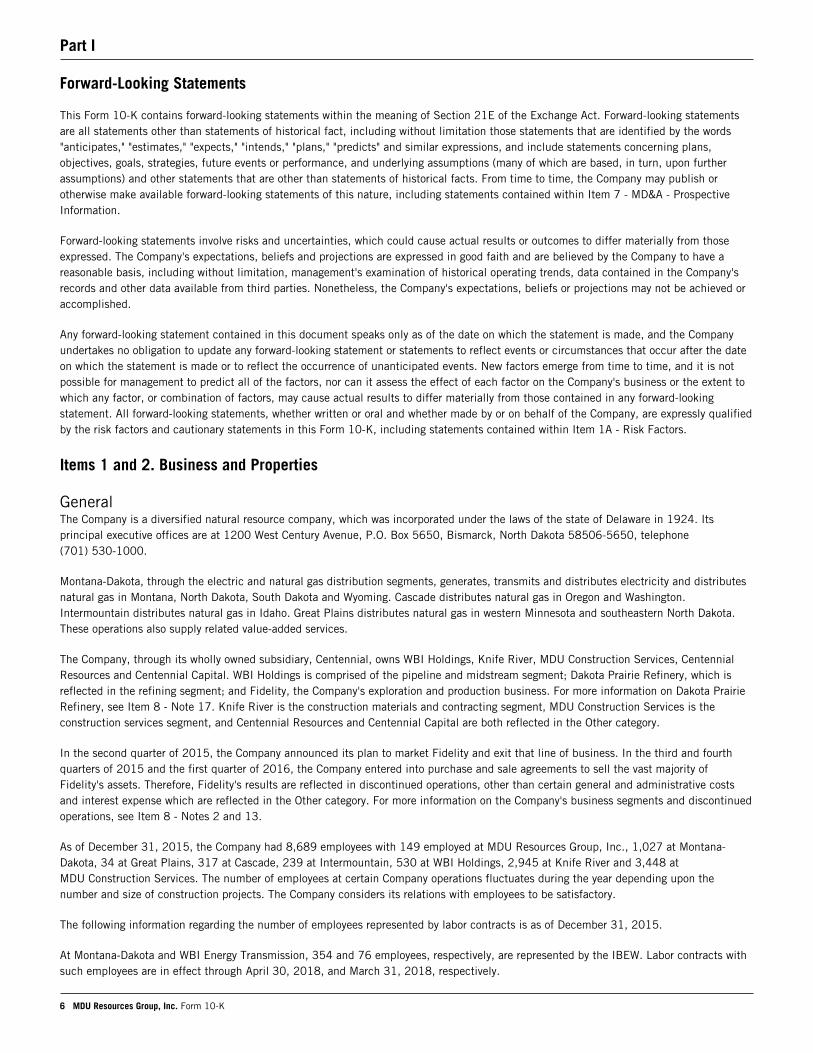
Construction materials locations
Construction services offices
States of operations for construction materials and authorized states of operations for construction services
Authorized states of operations for construction services
2015 Key StatisticsRevenues (millions) Electric $280.6 Natural gas $817.4Earnings (millions) Electric $35.9 Natural gas $23.6Electric retail sales (million kWh) 3,316.0Natural gas distribution (MMdk) Sales 95.6 Transportation 154.2
Revenues (millions) Construction materials $1,904.3 Construction services $926.4Adjusted earnings (millions) Construction materials $90.6 Construction services $25.2Construction materials sales (thousands) Aggregates (tons) 26,959 Asphalt (tons) 6,705 Ready-mix concrete (cubic yards) 3,592Construction materials aggregate reserves (billion tons) 1.0
Construction Materials and Services MDU Resources Group has a number of construction businesses.• Knife River Corporation mines aggregates and markets crushed stone, sand,
gravel and related construction materials, including ready-mix concrete, cement, asphalt, liquid asphalt and other value-added products. It also performs integrated contracting services.
• The construction services segment specializes in constructing and maintaining electric and communication lines, gas pipelines, fire suppression systems, and external lighting and traffic signalization. This segment also provides utility excavation and inside electrical and mechanical services, and manufactures and distributes transmission line construction equipment and supplies.
MDU Resources Group, Inc.2
3MDU Resources Group, Inc.
David L. GoodinPresident and Chief Executive Officer
Harry J. PearceChairman of the Board
Report to StockholdersOur company enters 2016 with
good momentum and prepared to build upon the notable
achievements by several of our business units last year. Although we remain optimistic about the opportunities for growth that we have identified, we recognize the most important measure of success for our shareholders is financial performance.
We are not satisfied with the company’s 2015 results.
Adjusted earnings last year were $180.0 million, or 92 cents per share, compared to $205.5 million, or $1.07 per share in 2014.
On a Generally Accepted Accounting Principles (GAAP) basis, the company reported a loss of $623.1 million, or $3.20 per share, compared to 2014 earnings of $297.5 million, or $1.55 per share. Most of that loss occurred in the first three quarters of 2015 and is largely associated with our oil and gas business, Fidelity Exploration & Production, and our decision to exit that business.
We have nearly completed the sale of Fidelity’s assets. We have closed on the sale of four asset packages, have a signed purchase and sale agreement for one of two remaining asset packages and are marketing the final.
With this behind us, our priorities will continue to be on the metrics important to our shareholders — financial results, stock price and dividends. Every one of our businesses is committed to earnings growth, although in some instances the commodity markets will continue to be challenging. We expect that improvement in our stock price will to a large degree reflect our earnings performance. We also are working hard to help the market better understand the individual pieces of our diversified business model and value them more appropriately.
We remain committed to the dividend. In November, the Board of Directors
increased the common stock dividend for the 25th consecutive year. We are extremely proud of this achievement, which has been matched by fewer than 100 of the 2,500-plus other U.S.-listed, dividend-paying companies. We have paid dividends uninterrupted for 78 years.
Construction materials business has record year
Our construction materials business, Knife River, had record adjusted earnings in 2015. Adjusted earnings increased 51 percent over 2014 on 8 percent revenue growth, which indicates that Knife River is doing an outstanding job of managing costs and margins. Aggregate and ready-mix volumes increased by 4 percent, asphalt volumes were up 11 percent, and margins were up across all product lines. Earnings increased in all of Knife River’s regions, indicating solid markets across the 19 states in which they operate.
Knife River ended 2015 with a record backlog of $491 million, 12 percent higher than the prior year. Importantly, backlog remained relatively strong even in energy-driven markets where the economy is sensitive to oil drilling activity. Knife River started 2016 by adding to its record backlog with the largest contract in its history — a $63.4 million project to rebuild a portion of Interstate 29 in Sioux City, Iowa.
Bidding opportunities continue to improve in most markets. Looking ahead a bit, Knife River expects that in 2017 it will begin to see the benefits of the $305 billion, five-year highway bill that Congress passed in December to fund transportation infrastructure projects.
Our construction services business also enters 2016 with good momentum. It ended 2015 with a backlog of $493 million, 62 percent higher than the prior year and the highest year-end backlog since 2008. This reflects a successful year in which its priority was rebuilding work
orders to replace several completed higher-margin projects that contributed to two consecutive years of record earnings in 2013 and 2014. The backlog includes outside electrical work, industrial, petrochemical, mission critical and solar contracts.
Customer growth continues for utility
Continued customer growth of nearly 2 percent in 2015 has pushed our utility’s total customer base to about 1,050,000 customers. The growth was spread across all eight states served by the utility and remained strong in North Dakota’s Bakken, where the utility serves communities surrounding the oilfields,
MDU Resources Group, Inc.4
but not the wells themselves. This growth likely is due to residents using a temporary decline in drilling activity to transition from temporary to permanent housing in communities served by our utility. The utility expects continued customer growth of about 1.5 to 2 percent.
The utility invested a record $464 million in 2015 to accommodate customer growth and ensure the reliability and integrity of its transmission and distribution systems. This includes acquisition of the Thunder Spirit wind farm in southwestern North Dakota, which became fully operational in December. With the addition of this 43-turbine, 107.5-megawatt facility, 20 percent of the utility’s electric generation capacity is renewable energy. The utility also added 19 MW of natural gas-fired generation at the Lewis & Clark plant near Sidney, Montana, and completed installation of a $384 million air quality control system at the Big Stone, South Dakota, generating plant that is owned jointly with two partners.
The utility is working hard to recover these investments through rate proceedings. Since the beginning of 2015, the utility has implemented $28.5 million in final rates and $20.8 million in interim rates, and has a number of additional rate cases pending in 2016. Revenue from rate case proceedings helped offset weather-related lower natural gas retail sales and lower residential electric retail sales. Temperatures in 2015 ranged from approximately 6 to 16 percent warmer than the previous year across the eight-state service territory.
The utility has been evaluating the Environmental Protection Agency’s Clean Power Plan, which would require significant reductions in carbon dioxide emissions at its generating facilities. Although it is too early to determine specific cost impacts, we believe the plan as currently written will increase customer bills significantly.
We are working closely with state governments and agencies to identify potential implementation plans and are encouraging states to enter into regional solutions if the plan ultimately takes
effect. The plan is the subject of legal challenges, and in February 2016 the U.S. Supreme Court temporarily blocked implementation of the plan until those challenges are fully litigated.
Pipeline business has record transportation volumes
The pipeline and midstream business had record transportation volumes on its natural gas pipeline system for the third consecutive year. The majority of its pipeline volumes are under fixed-fee firm contracts, and therefore are less sensitive to the commodity pricing environment that is affecting activity in the Bakken. However, gas gathering volumes decreased significantly as producers reacted to the lower price environment, and the 50 percent-owned Pronghorn facility experienced lower processing revenue.
The pipeline and midstream business is continuing to grow its traditional northern Rockies base through two expansion projects that are expected to be completed this year. The North Badlands and Northwest North Dakota projects will connect third-party processing facilities to interstate pipelines and add 88,000 dekatherms per day of capacity.
In addition, the business is evaluating potential expansion into other basins, such as the Marcellus, Utica and Permian, possibly through acquisition opportunities.
Commodity prices impact refinery
The Dakota Prairie refinery, which began commercial operations in May, operated at a loss in 2015 as the result of dramatic changes in the oil commodity market. The company has a 50 percent ownership interest in the refinery, which can process up to 20,000 barrels per day of oil into diesel fuel and several byproducts.
The Bakken basis differential from West Texas Intermediate pricing has narrowed, which has increased the refinery’s cost for
its oil feedstock. At the same time, reduced oilfield activity has decreased the demand for diesel fuel and a slowdown in Canadian tar sands development has reduced the demand for naphtha, one of the refinery’s byproducts. The company continues to focus on operational improvements to the plant that could increase its daily processing capacity and profitability. However, we expect the unfavorable commodity price environment will continue to significantly impact the refinery in 2016.
Operationally, our businesses are performing very well, and we want to thank our employees for that accomplishment. We can assure you that our employees work hard to serve our shareholders and customers with operational excellence, safety and integrity.
Thank you, as well, for your investment in MDU Resources. We recognize that the company’s performance in 2015 has fallen short of your expectations; it fell short of ours, too. Please know that we, along with our entire management team and Board of Directors, are committed to delivering better results.
Harry J. Pearce Chairman of the Board
David L. Goodin President and Chief Executive Officer
February 19, 2016
MDU Resources Group, Inc. 5
Board of Directors
Numbers indicate age and years of service ( ) on the MDU Resources Board of Directors as of December 31, 2015.
Audit CommitteeDennis W. Johnson, ChairmanMark A. HellersteinA. Bart HoladayJohn K. Wilson
Compensation CommitteeThomas Everist, ChairmanKaren B. FaggWilliam E. McCrackenPatricia L. Moss
Nominating and Governance CommitteeKaren B. Fagg, ChairmanA. Bart HoladayWilliam E. McCrackenPatricia L. Moss
Harry J. Pearce73 (19)Detroit, Michigan
Chairman of MDU Resources Board of Directors
Retired, formerly chairman of Hughes Electronics Corp., a subsidiary of General Motors Corp., and former vice chairman and director of GM; a director of several organizations
Expertise: Multinational business management, leadership, finance, engineering and law
David L. Goodin54 (3)Bismarck, North Dakota
President and chief executive officer of MDU Resources
Formerly president and chief executive officer of Cascade Natural Gas Corporation, Great Plains Natural Gas Co., Intermountain Gas Company and Montana-Dakota Utilities Co.
Thomas Everist66 (21)Sioux Falls, South Dakota
President and chairman of The Everist Co., a construction materials company; a director of several corporations
Expertise: Business management, construction and sand, gravel and aggregate production
Karen B. Fagg62 (11)Billings, Montana
Retired, formerly vice president of DOWL HKM and formerly chairman, chief executive officer and majority owner of HKM Engineering Inc.; on the board of several organizations
Expertise: Engineering, construction and business management
A. Bart Holaday73 (8)Denver, Colorado, and Grand Forks, North Dakota
Retired, formerly managing director of Private Markets Group of UBS Asset Management; on the board of several organizations
Expertise: Energy industry, business development, finance and law
Mark A. Hellerstein 63 (3)Denver, Colorado
Retired, formerly chairman, president and chief executive officer of St. Mary Land & Exploration Co.; a former director of Transocean Inc.
Expertise: Energy industry, business management, accounting and finance
Patricia L. Moss62 (13)Bend, Oregon
Vice chairman of Cascade Bancorp and Bank of the Cascades, formerly president and chief executive officer of Cascade Bancorp and Bank of the Cascades; on the board of several organizations
Expertise: Finance, banking, business development and human resources
William E. McCracken73 (3)Warren, New Jersey
Retired, formerly chairman and chief executive officer of CA Technologies; previously held executive positions with IBM Corp.; a director of several organizations; a former director of IKON Office Solutions Inc.
Expertise: Multinational business management, corporate governance, technology and cybersecurity
John K. Wilson61 (13)Omaha, Nebraska
Formerly president of Durham Resources LLC, a privately held financial management company, and formerly a director of a mutual fund; on the board of several organizations
Expertise: Public utilities, accounting and finance
Dennis W. Johnson66 (15)Dickinson, North Dakota
Chairman, president and chief executive officer of TMI Corp., an architectural woodwork manufacturer; former president of the Dickinson City Commission; a former director of Federal Reserve Bank of Minneapolis
Expertise: Business management, engineering and finance

MDU Resources Group, Inc.6
Corporate Management
Numbers indicate age and years of service ( ) as of December 31, 2015.
Other Corporate and Senior Company OfficersNathan W. Ring, 40 (15)Vice President, Controller and Chief Accounting Officer of MDU Resources
Jason L. Vollmer, 38 (11)Treasurer and Director of Cash and Risk Management of MDU Resources
David L. Goodin54 (33)
President and Chief Executive Officer of MDU Resources
Serves on the company’s Board of Directors and as chairman of the board of all major subsidiary companies; formerly president and chief executive officer of Cascade Natural Gas Corporation, Great Plains Natural Gas Co., Intermountain Gas Company and Montana-Dakota Utilities Co.
Martin A. Fritz51 (1)
President and Chief Executive Officer of WBI Holdings, Inc.
Formerly an executive with a natural gas production and midstream company
Dennis L. Haider63 (38)
Executive Vice President of Business Development of MDU Resources
Formerly executive vice president of marketing, gas supply and business development of Cascade Natural Gas Corporation, Great Plains Natural Gas Co., Intermountain Gas Company and Montana-Dakota Utilities Co.
Anne M. Jones52 (34)
Vice President of Human Resources of MDU Resources
Formerly vice president of human resources, customer service and safety of Cascade Natural Gas Corporation, Great Plains Natural Gas Co., Intermountain Gas Company and Montana-Dakota Utilities Co.
David C. Barney60 (30)
President and Chief Executive Officer of Knife River Corporation
Formerly held executive and management positions with Knife River
Nicole A. Kivisto42 (21)
President and Chief Executive Officer of Cascade Natural Gas Corporation, Great Plains Natural Gas Co., Intermountain Gas Company and Montana-Dakota Utilities Co.
Formerly vice president of operations of Great Plains Natural Gas and Montana-Dakota Utilities
Daniel S. Kunz62 (12)
General Counsel and Secretary of MDU Resources
Serves as general counsel and secretary of all major subsidiary companies; formerly associate general counsel and assistant secretary of MDU Resources
Doran N. Schwartz46 (11)
Vice President and Chief Financial Officer of MDU Resources
Serves as the senior financial officer and member of the board of directors of all major subsidiary companies; formerly chief accounting officer of MDU Resources
Jeffrey S. Thiede53 (12)
President and Chief Executive Officer of MDU Construction Services Group, Inc.
Formerly held executive and management positions with MDU Construction Services Group
Cynthia J. Norland61 (32)
Vice President of Administration of MDU Resources
Formerly associate general counsel of MDU Resources
Management ChangesMartin A. Fritz was hired as president and chief executive officer of WBI Holdings, Inc., effective July 20, 2015. He replaces Steven L. Bietz, who retired July 17, 2015.
Anne M. Jones was named vice president of human resources of MDU Resources, effective January 1, 2016. She replaces Mark A. Del Vecchio, who resigned October 20, 2015.
Daniel S. Kuntz was named general counsel and secretary of MDU Resources, effective January 9, 2016. He replaces Paul K. Sandness, who retired January 8, 2016.
Patrick L. O’Bryan resigned from his position as president and chief executive officer of Fidelity Exploration & Production Company, effective February 29, 2016.
MDU Resources Group, Inc. 7
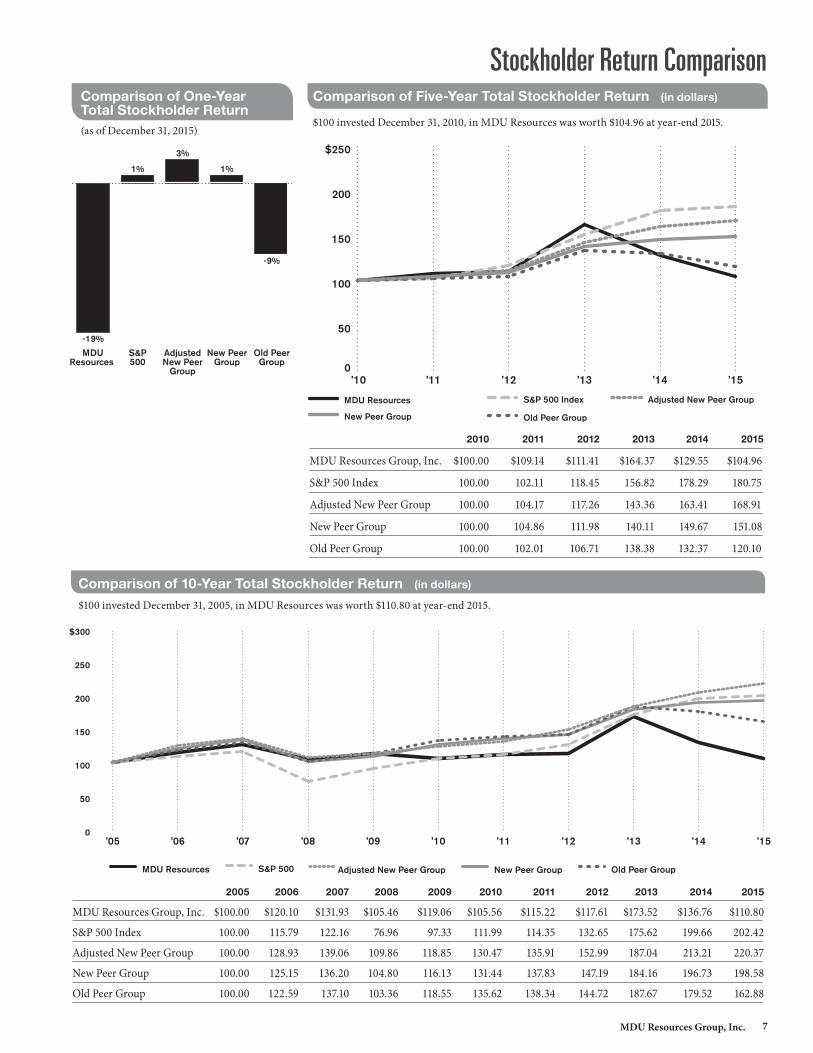
Comparison of One-Year Total Stockholder Return(as of December 31, 2015)
Comparison of Five-Year Total Stockholder Return (in dollars)
$100 invested December 31, 2010, in MDU Resources was worth $104.96 at year-end 2015.
2010 2011 2012 2013 2014 2015
MDU Resources Group, Inc. $100.00 $109.14 $111.41 $164.37 $129.55 $104.96
S&P 500 Index 100.00 102.11 118.45 156.82 178.29 180.75
Adjusted New Peer Group 100.00 104.17 117.26 143.36 163.41 168.91
New Peer Group 100.00 104.86 111.98 140.11 149.67 151.08
Old Peer Group 100.00 102.01 106.71 138.38 132.37 120.10
Stockholder Return Comparison
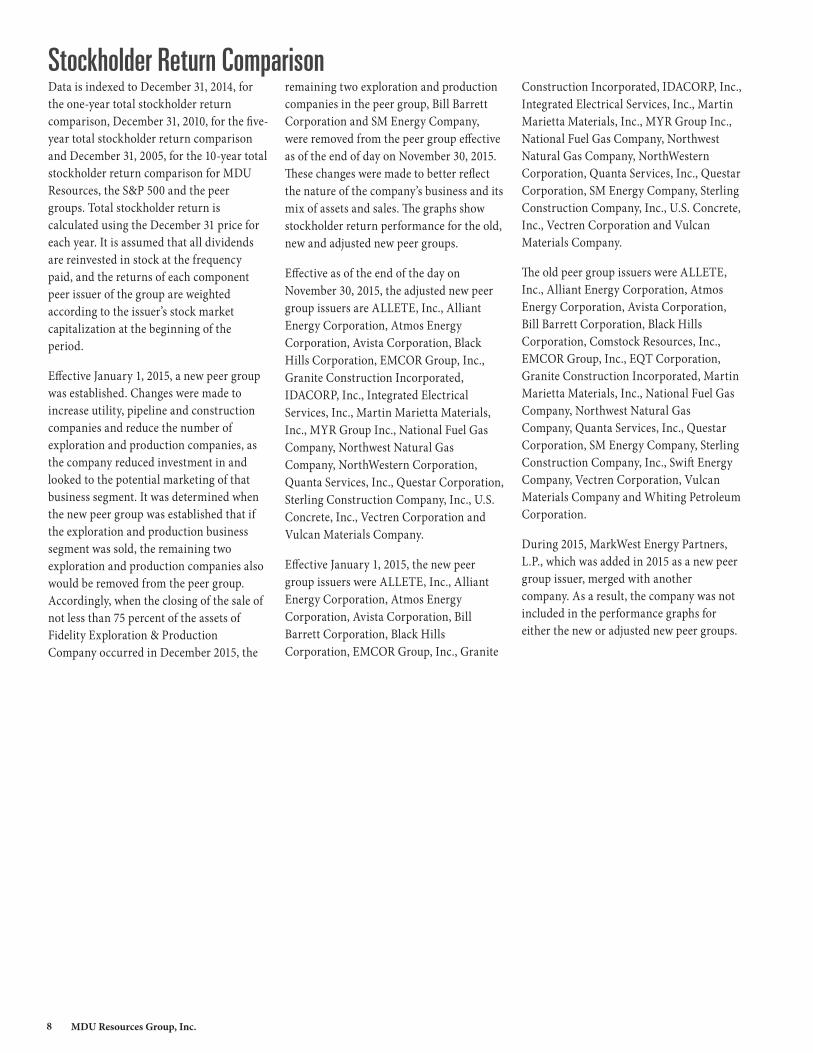
Comparison of 10-Year Total Stockholder Return (in dollars)
$100 invested December 31, 2005, in MDU Resources was worth $110.80 at year-end 2015.
2005 2006 2007 2008 2009 2010 2011 2012 2013 2014 2015
MDU Resources Group, Inc. $100.00 $120.10 $131.93 $105.46 $119.06 $105.56 $115.22 $117.61 $173.52 $136.76 $110.80
S&P 500 Index 100.00 115.79 122.16 76.96 97.33 111.99 114.35 132.65 175.62 199.66 202.42
Adjusted New Peer Group 100.00 128.93 139.06 109.86 118.85 130.47 135.91 152.99 187.04 213.21 220.37
New Peer Group 100.00 125.15 136.20 104.80 116.13 131.44 137.83 147.19 184.16 196.73 198.58
Old Peer Group 100.00 122.59 137.10 103.36 118.55 135.62 138.34 144.72 187.67 179.52 162.88
0
50
100
150
200
250Old Peer Group
New Peer Group
S&P 500 Index
MDU Resources Group, Inc.
20132012201120102009
0
50
100
150
200
$250
Old Peer GroupNew Peer Group
S&P 500 Index Adjusted New Peer GroupMDU Resources
’15’14’13’12’11’10
0
50
100
150
200
250
300Old Peer Group
New Peer Group
S&P 500
MDU Resources
20142013201220112010200920082007200620052004
0
50
100
150
200
250
$300
’15’14’13’12’11’10’09’08’07’06’05
Old Peer GroupNew Peer GroupAdjusted New Peer GroupS&P 500MDU Resources
Old PeerGroup
AdjustedNew Peer
Group
New PeerGroup
S&P500
MDUResources
-19%
1%
3%
1%
-9%
MDU Resources Group, Inc.8
Stockholder Return ComparisonData is indexed to December 31, 2014, for the one-year total stockholder return comparison, December 31, 2010, for the five-year total stockholder return comparison and December 31, 2005, for the 10-year total stockholder return comparison for MDU Resources, the S&P 500 and the peer groups. Total stockholder return is calculated using the December 31 price for each year. It is assumed that all dividends are reinvested in stock at the frequency paid, and the returns of each component peer issuer of the group are weighted according to the issuer’s stock market capitalization at the beginning of the period.
Effective January 1, 2015, a new peer group was established. Changes were made to increase utility, pipeline and construction companies and reduce the number of exploration and production companies, as the company reduced investment in and looked to the potential marketing of that business segment. It was determined when the new peer group was established that if the exploration and production business segment was sold, the remaining two exploration and production companies also would be removed from the peer group. Accordingly, when the closing of the sale of not less than 75 percent of the assets of Fidelity Exploration & Production Company occurred in December 2015, the
remaining two exploration and production companies in the peer group, Bill Barrett Corporation and SM Energy Company, were removed from the peer group effective as of the end of day on November 30, 2015. These changes were made to better reflect the nature of the company’s business and its mix of assets and sales. The graphs show stockholder return performance for the old, new and adjusted new peer groups.
Effective as of the end of the day on November 30, 2015, the adjusted new peer group issuers are ALLETE, Inc., Alliant Energy Corporation, Atmos Energy Corporation, Avista Corporation, Black Hills Corporation, EMCOR Group, Inc., Granite Construction Incorporated, IDACORP, Inc., Integrated Electrical Services, Inc., Martin Marietta Materials, Inc., MYR Group Inc., National Fuel Gas Company, Northwest Natural Gas Company, NorthWestern Corporation, Quanta Services, Inc., Questar Corporation, Sterling Construction Company, Inc., U.S. Concrete, Inc., Vectren Corporation and Vulcan Materials Company.
Effective January 1, 2015, the new peer group issuers were ALLETE, Inc., Alliant Energy Corporation, Atmos Energy Corporation, Avista Corporation, Bill Barrett Corporation, Black Hills Corporation, EMCOR Group, Inc., Granite
Construction Incorporated, IDACORP, Inc., Integrated Electrical Services, Inc., Martin Marietta Materials, Inc., MYR Group Inc., National Fuel Gas Company, Northwest Natural Gas Company, NorthWestern Corporation, Quanta Services, Inc., Questar Corporation, SM Energy Company, Sterling Construction Company, Inc., U.S. Concrete, Inc., Vectren Corporation and Vulcan Materials Company.
The old peer group issuers were ALLETE, Inc., Alliant Energy Corporation, Atmos Energy Corporation, Avista Corporation, Bill Barrett Corporation, Black Hills Corporation, Comstock Resources, Inc., EMCOR Group, Inc., EQT Corporation, Granite Construction Incorporated, Martin Marietta Materials, Inc., National Fuel Gas Company, Northwest Natural Gas Company, Quanta Services, Inc., Questar Corporation, SM Energy Company, Sterling Construction Company, Inc., Swift Energy Company, Vectren Corporation, Vulcan Materials Company and Whiting Petroleum Corporation.
During 2015, MarkWest Energy Partners, L.P., which was added in 2015 as a new peer group issuer, merged with another company. As a result, the company was not included in the performance graphs for either the new or adjusted new peer groups.
UNITED STATES SECURITIES AND EXCHANGE COMMISSIONWASHINGTON, D.C. 20549
FORM 10-K ANNUAL REPORT PURSUANT TO SECTION 13 OR 15(d) OF THE SECURITIES EXCHANGE ACT OF 1934
For the fiscal year ended December 31, 2015
OR
TRANSITION REPORT PURSUANT TO SECTION 13 OR 15(d) OF THE SECURITIES EXCHANGE ACT OF 1934For the transition period from _____________ to ______________
Commission file number 1-3480
MDU RESOURCES GROUP, INC.(Exact name of registrant as specified in its charter)
Delaware 41-0423660(State or other jurisdiction ofincorporation or organization)
(I.R.S. Employer Identification No.)
1200 West Century AvenueP.O. Box 5650
Bismarck, North Dakota 58506-5650(Address of principal executive offices)
(Zip Code)
(701) 530-1000(Registrant's telephone number, including area code)
Securities registered pursuant to Section 12(b) of the Act:
Title of each class Name of each exchange on which registered
Common Stock, par value $1.00 New York Stock Exchange
Securities registered pursuant to Section 12(g) of the Act:
Preferred Stock, par value $100(Title of Class)
Indicate by check mark if the registrant is a well-known seasoned issuer, as defined in Rule 405 of the Securities Act. Yes No .
Indicate by check mark if the registrant is not required to file reports pursuant to Section 13 or Section 15(d) of the Exchange Act. Yes No .
Indicate by check mark whether the registrant (1) has filed all reports required to be filed by Section 13 or 15(d) of the Securities Exchange Act of 1934 during the preceding 12 months (or for such shorter period that the registrant was required to file such reports), and (2) has been subject to such filing requirements for the past 90 days. Yes No .
Indicate by check mark whether the registrant has submitted electronically and posted on its corporate Web site, if any, every Interactive Data File required to be submitted and posted pursuant to Rule 405 of Regulation S-T during the preceding 12 months (or for such shorter period that the registrant was required to submit and post such files). Yes No .
Indicate by check mark if disclosure of delinquent filers pursuant to Item 405 of Regulation S-K is not contained herein, and will not be contained, to the best of the registrant's knowledge, in definitive proxy or information statements incorporated by reference in Part III of this Form 10-K or any amendment to this Form 10-K.
Indicate by check mark whether the registrant is a large accelerated filer, an accelerated filer, a non-accelerated filer, or a smaller reporting company. See the definitions of "large accelerated filer," "accelerated filer" and "smaller reporting company" in Rule 12b-2 of the Exchange Act (Check one):
Large accelerated filer Accelerated filer
Non-accelerated filer (Do not check if a smaller reporting company) Smaller reporting company
Indicate by check mark whether the registrant is a shell company (as defined in Rule 12b-2 of the Act). Yes No .
State the aggregate market value of the voting common stock held by nonaffiliates of the registrant as of June 30, 2015: $3,805,857,581.
Indicate the number of shares outstanding of each of the registrant's classes of common stock, as of February 11, 2016: 195,265,744 shares.
DOCUMENTS INCORPORATED BY REFERENCEPortions of the registrant's 2016 Proxy Statement are incorporated by reference in Part III, Items 10, 11, 12, 13 and 14 of this Report.
Contents
2 MDU Resources Group, Inc. Form 10-K
Part I
Forward-Looking Statements . . . . . . . . . . . . . . . . . . . . . . . . . . . . . . . . . . . . . . . . . . . . . . . . . . . . . . . . .
Items 1 and 2 Business and Properties . . . . . . . . . . . . . . . . . . . . . . . . . . . . . . . . . . . . . . . . . . . . . . . . .
General . . . . . . . . . . . . . . . . . . . . . . . . . . . . . . . . . . . . . . . . . . . . . . . . . . . . . . . . . . . . . . .
Electric . . . . . . . . . . . . . . . . . . . . . . . . . . . . . . . . . . . . . . . . . . . . . . . . . . . . . . . . . . . . . . .
Natural Gas Distribution . . . . . . . . . . . . . . . . . . . . . . . . . . . . . . . . . . . . . . . . . . . . . . . . . . . .
Pipeline and Midstream . . . . . . . . . . . . . . . . . . . . . . . . . . . . . . . . . . . . . . . . . . . . . . . . . . . .
Construction Materials and Contracting . . . . . . . . . . . . . . . . . . . . . . . . . . . . . . . . . . . . . . . . .
Construction Services . . . . . . . . . . . . . . . . . . . . . . . . . . . . . . . . . . . . . . . . . . . . . . . . . . . . .
Refining . . . . . . . . . . . . . . . . . . . . . . . . . . . . . . . . . . . . . . . . . . . . . . . . . . . . . . . . . . . . . . .
Discontinued Operations . . . . . . . . . . . . . . . . . . . . . . . . . . . . . . . . . . . . . . . . . . . . . . . . . . .
Item 1A Risk Factors . . . . . . . . . . . . . . . . . . . . . . . . . . . . . . . . . . . . . . . . . . . . . . . . . . . . . . . . . . . .
Item 1B Unresolved Staff Comments . . . . . . . . . . . . . . . . . . . . . . . . . . . . . . . . . . . . . . . . . . . . . . . . .
Item 3 Legal Proceedings . . . . . . . . . . . . . . . . . . . . . . . . . . . . . . . . . . . . . . . . . . . . . . . . . . . . . . . .
Item 4 Mine Safety Disclosures . . . . . . . . . . . . . . . . . . . . . . . . . . . . . . . . . . . . . . . . . . . . . . . . . . . .
Part II
Item 5 Market for the Registrant's Common Equity,Related Stockholder Matters and Issuer Purchases of Equity Securities . . . . . . . . . . . . . . . . . .
Item 6 Selected Financial Data . . . . . . . . . . . . . . . . . . . . . . . . . . . . . . . . . . . . . . . . . . . . . . . . . . . .
Item 7 Management's Discussion and Analysis ofFinancial Condition and Results of Operations . . . . . . . . . . . . . . . . . . . . . . . . . . . . . . . . . . . .
Item 7A Quantitative and Qualitative Disclosures About Market Risk . . . . . . . . . . . . . . . . . . . . . . . . . . .
Item 8 Financial Statements and Supplementary Data . . . . . . . . . . . . . . . . . . . . . . . . . . . . . . . . . . . .
Item 9 Changes in and Disagreements With Accountantson Accounting and Financial Disclosure . . . . . . . . . . . . . . . . . . . . . . . . . . . . . . . . . . . . . . . . .
Item 9A Controls and Procedures. . . . . . . . . . . . . . . . . . . . . . . . . . . . . . . . . . . . . . . . . . . . . . . . . . . .
Item 9B Other Information . . . . . . . . . . . . . . . . . . . . . . . . . . . . . . . . . . . . . . . . . . . . . . . . . . . . . . . .
Part III
Item 10 Directors, Executive Officers and Corporate Governance . . . . . . . . . . . . . . . . . . . . . . . . . . . . .
Item 11 Executive Compensation . . . . . . . . . . . . . . . . . . . . . . . . . . . . . . . . . . . . . . . . . . . . . . . . . . .
Item 12 Security Ownership of Certain Beneficial Ownersand Management and Related Stockholder Matters . . . . . . . . . . . . . . . . . . . . . . . . . . . . . . . . .
Item 13 Certain Relationships and Related Transactions, and Director Independence . . . . . . . . . . . . . . .
Item 14 Principal Accountant Fees and Services . . . . . . . . . . . . . . . . . . . . . . . . . . . . . . . . . . . . . . . . .
Part IV
Item 15 Exhibits and Financial Statement Schedules . . . . . . . . . . . . . . . . . . . . . . . . . . . . . . . . . . . . .
Signatures . . . . . . . . . . . . . . . . . . . . . . . . . . . . . . . . . . . . . . . . . . . . . . . . . . . . . . . . . . . . . . . . . . . . .
Exhibits
6
6
6
7
11
13
14
17
17
18
18
24
24
24
25
26
28
47
48
106
106
106
107
107
107
107
107
108
115
Definitions
MDU Resources Group, Inc. Form 10-K 3
The following abbreviations and acronyms used in this Form 10-K are defined below:
Abbreviation or AcronymAFUDC Allowance for funds used during construction
Army Corps U.S. Army Corps of Engineers
ASC FASB Accounting Standards Codification
ATBs Atmospheric tower bottoms
BART Best available retrofit technology
Bbl Barrel
Bcf Billion cubic feet
Bicent Bicent Power LLC
Big Stone Station 475-MW coal-fired electric generating facility near Big Stone City, South Dakota (22.7 percentownership)
BOE One barrel of oil equivalent - determined using the ratio of one barrel of crude oil, condensate ornatural gas liquids to six Mcf of natural gas
Bombard Mechanical Bombard Mechanical, LLC, an indirect wholly owned subsidiary of MDU Construction Services
BPD Barrels per day
Brazilian Transmission Lines Company's former investment in companies owning three electric transmission lines
Btu British thermal unit
Calumet Calumet Specialty Products Partners, L.P.
Cascade Cascade Natural Gas Corporation, an indirect wholly owned subsidiary of MDU Energy Capital
CEM Colorado Energy Management, LLC, a former direct wholly owned subsidiary of CentennialResources (sold in the third quarter of 2007)
Centennial Centennial Energy Holdings, Inc., a direct wholly owned subsidiary of the Company
Centennial Capital Centennial Holdings Capital LLC, a direct wholly owned subsidiary of Centennial
Centennial Resources Centennial Energy Resources LLC, a direct wholly owned subsidiary of Centennial
CERCLA Comprehensive Environmental Response, Compensation and Liability Act
Clean Air Act Federal Clean Air Act
Clean Water Act Federal Clean Water Act
Colorado Court of Appeals Court of Appeals, State of Colorado
Colorado State District Court Colorado Thirteenth Judicial District Court, Yuma County
Company MDU Resources Group, Inc.
Coyote Creek Coyote Creek Mining Company, LLC, a subsidiary of The North American Coal Corporation
Coyote Station 427-MW coal-fired electric generating facility near Beulah, North Dakota (25 percent ownership)
Dakota Prairie Refinery 20,000-barrel-per-day diesel topping plant built by Dakota Prairie Refining in southwesternNorth Dakota
Dakota Prairie Refining Dakota Prairie Refining, LLC, a limited liability company jointly owned by WBI Energy andCalumet
D.C. Circuit Court United States Court of Appeals for the District of Columbia Circuit
dk Decatherm
Dodd-Frank Act Dodd-Frank Wall Street Reform and Consumer Protection Act
EBITDA Earnings before interest, taxes, depreciation, depletion and amortization
EIN Employer Identification Number
EPA United States Environmental Protection Agency
ERISA Employee Retirement Income Security Act of 1974
ESA Endangered Species Act
ESCP Erosion and Sediment Control Plan
Exchange Act Securities Exchange Act of 1934, as amended
FASB Financial Accounting Standards Board
FERC Federal Energy Regulatory Commission
Fidelity Fidelity Exploration & Production Company, a direct wholly owned subsidiary of WBI Holdings(previously referred to as the Company's exploration and production segment)
FIP Funding improvement plan
GAAP Accounting principles generally accepted in the United States of America
Definitions
4 MDU Resources Group, Inc. Form 10-K
GHG Greenhouse gas
Great Plains Great Plains Natural Gas Co., a public utility division of the Company
GVTC Generation Verification Test Capacity
IBEW International Brotherhood of Electrical Workers
ICWU International Chemical Workers Union
IFRS International Financial Reporting Standards
Intermountain Intermountain Gas Company, an indirect wholly owned subsidiary of MDU Energy Capital
IPUC Idaho Public Utilities Commission
Item 8 Financial Statements and Supplementary Data
JTL JTL Group, Inc., an indirect wholly owned subsidiary of Knife River
Knife River Knife River Corporation, a direct wholly owned subsidiary of Centennial
Knife River - Northwest Knife River Corporation - Northwest, an indirect wholly owned subsidiary of Knife River
K-Plan Company's 401(k) Retirement Plan
kW Kilowatts
kWh Kilowatt-hour
LTM LTM, Incorporated, an indirect wholly owned subsidiary of Knife River
LWG Lower Willamette Group
MBbls Thousands of barrels
MBOE Thousands of BOE
Mcf Thousand cubic feet
MD&A Management's Discussion and Analysis of Financial Condition and Results of Operations
Mdk Thousand decatherms
MDU Construction Services MDU Construction Services Group, Inc., a direct wholly owned subsidiary of Centennial
MDU Energy Capital MDU Energy Capital, LLC, a direct wholly owned subsidiary of the Company
MEPP Multiemployer pension plan
MISO Midcontinent Independent System Operator, Inc.
MMBOE Millions of BOE
MMBtu Million Btu
MMcf Million cubic feet
MMdk Million decatherms
MNPUC Minnesota Public Utilities Commission
Montana-Dakota Montana-Dakota Utilities Co., a public utility division of the Company
Montana DEQ Montana Department of Environmental Quality
Montana First Judicial District Court Montana First Judicial District Court, Lewis and Clark County
Montana Seventeenth Judicial District Court Montana Seventeenth Judicial District Court, Phillips County
MPPAA Multiemployer Pension Plan Amendments Act of 1980
MTPSC Montana Public Service Commission
MW Megawatt
NDPSC North Dakota Public Service Commission
Nevada State District Court District Court Clark County, Nevada
NGL Natural gas liquids
Notice of Civil Penalty Notice of Civil Penalty Assessment and Order
Oil Includes crude oil and condensate
Omimex Omimex Canada, Ltd.
OPUC Oregon Public Utility Commission
Oregon DEQ Oregon State Department of Environmental Quality
PCBs Polychlorinated biphenyls
Proxy Statement Company's 2016 Proxy Statement
PRP Potentially Responsible Party
PUD Proved undeveloped
RCRA Resource Conservation and Recovery Act
Definitions
MDU Resources Group, Inc. Form 10-K 5
RIN Renewable Identification Number
ROD Record of Decision
RP Rehabilitation plan
SDPUC South Dakota Public Utilities Commission
SEC United States Securities and Exchange Commission
SEC Defined Prices The average price of oil and natural gas during the applicable 12-month period, determined asan unweighted arithmetic average of the first-day-of-the-month price for each month within suchperiod, unless prices are defined by contractual arrangements, excluding escalations based uponfuture conditions
Securities Act Securities Act of 1933, as amended
Securities Act Industry Guide 7 Description of Property by Issuers Engaged or to be Engaged in Significant Mining Operations
Sheridan System A separate electric system owned by Montana-Dakota
South Dakota DENR South Dakota Department of Environment and Natural Resources
SourceGas SourceGas Distribution LLC
Stock Purchase Plan Company's Dividend Reinvestment and Direct Stock Purchase Plan
UA United Association of Journeyman and Apprentices of the Plumbing and Pipefitting Industry ofthe United States and Canada
United States District Court for theDistrict of Montana United States District Court for the District of Montana, Great Falls Division
United States Supreme Court Supreme Court of the United States
VIE Variable interest entity
Washington DOE Washington State Department of Ecology
WBI Energy WBI Energy, Inc., an indirect wholly owned subsidiary of WBI Holdings
WBI Energy Midstream WBI Energy Midstream, LLC, an indirect wholly owned subsidiary of WBI Holdings
WBI Energy Transmission WBI Energy Transmission, Inc., an indirect wholly owned subsidiary of WBI Holdings
WBI Holdings WBI Holdings, Inc., a direct wholly owned subsidiary of Centennial
WUTC Washington Utilities and Transportation Commission
Wygen III 100-MW coal-fired electric generating facility near Gillette, Wyoming (25 percent ownership)
WYPSC Wyoming Public Service Commission
ZRCs Zonal resource credits - a MW of demand equivalent assigned to generators by MISO for meetingsystem reliability requirements
Part I
6 MDU Resources Group, Inc. Form 10-K
Forward-Looking Statements
This Form 10-K contains forward-looking statements within the meaning of Section 21E of the Exchange Act. Forward-looking statements are all statements other than statements of historical fact, including without limitation those statements that are identified by the words "anticipates," "estimates," "expects," "intends," "plans," "predicts" and similar expressions, and include statements concerning plans, objectives, goals, strategies, future events or performance, and underlying assumptions (many of which are based, in turn, upon further assumptions) and other statements that are other than statements of historical facts. From time to time, the Company may publish or otherwise make available forward-looking statements of this nature, including statements contained within Item 7 - MD&A - Prospective Information.
Forward-looking statements involve risks and uncertainties, which could cause actual results or outcomes to differ materially from those expressed. The Company's expectations, beliefs and projections are expressed in good faith and are believed by the Company to have a reasonable basis, including without limitation, management's examination of historical operating trends, data contained in the Company's records and other data available from third parties. Nonetheless, the Company's expectations, beliefs or projections may not be achieved or accomplished.
Any forward-looking statement contained in this document speaks only as of the date on which the statement is made, and the Company undertakes no obligation to update any forward-looking statement or statements to reflect events or circumstances that occur after the date on which the statement is made or to reflect the occurrence of unanticipated events. New factors emerge from time to time, and it is not possible for management to predict all of the factors, nor can it assess the effect of each factor on the Company's business or the extent to which any factor, or combination of factors, may cause actual results to differ materially from those contained in any forward-looking statement. All forward-looking statements, whether written or oral and whether made by or on behalf of the Company, are expressly qualified by the risk factors and cautionary statements in this Form 10-K, including statements contained within Item 1A - Risk Factors.
Items 1 and 2. Business and Properties
GeneralThe Company is a diversified natural resource company, which was incorporated under the laws of the state of Delaware in 1924. Its principal executive offices are at 1200 West Century Avenue, P.O. Box 5650, Bismarck, North Dakota 58506-5650, telephone (701) 530-1000.
Montana-Dakota, through the electric and natural gas distribution segments, generates, transmits and distributes electricity and distributes natural gas in Montana, North Dakota, South Dakota and Wyoming. Cascade distributes natural gas in Oregon and Washington. Intermountain distributes natural gas in Idaho. Great Plains distributes natural gas in western Minnesota and southeastern North Dakota. These operations also supply related value-added services.
The Company, through its wholly owned subsidiary, Centennial, owns WBI Holdings, Knife River, MDU Construction Services, Centennial Resources and Centennial Capital. WBI Holdings is comprised of the pipeline and midstream segment; Dakota Prairie Refinery, which is reflected in the refining segment; and Fidelity, the Company's exploration and production business. For more information on Dakota Prairie Refinery, see Item 8 - Note 17. Knife River is the construction materials and contracting segment, MDU Construction Services is the construction services segment, and Centennial Resources and Centennial Capital are both reflected in the Other category.
In the second quarter of 2015, the Company announced its plan to market Fidelity and exit that line of business. In the third and fourth quarters of 2015 and the first quarter of 2016, the Company entered into purchase and sale agreements to sell the vast majority of Fidelity's assets. Therefore, Fidelity's results are reflected in discontinued operations, other than certain general and administrative costs and interest expense which are reflected in the Other category. For more information on the Company's business segments and discontinued operations, see Item 8 - Notes 2 and 13.
As of December 31, 2015, the Company had 8,689 employees with 149 employed at MDU Resources Group, Inc., 1,027 at Montana-Dakota, 34 at Great Plains, 317 at Cascade, 239 at Intermountain, 530 at WBI Holdings, 2,945 at Knife River and 3,448 at MDU Construction Services. The number of employees at certain Company operations fluctuates during the year depending upon the number and size of construction projects. The Company considers its relations with employees to be satisfactory.
The following information regarding the number of employees represented by labor contracts is as of December 31, 2015.
At Montana-Dakota and WBI Energy Transmission, 354 and 76 employees, respectively, are represented by the IBEW. Labor contracts with such employees are in effect through April 30, 2018, and March 31, 2018, respectively.
Part I
MDU Resources Group, Inc. Form 10-K 7
At Cascade, 179 employees are represented by the ICWU. The labor contract with the field operations group is effective through April 1, 2018.
At Intermountain, 126 employees are represented by the UA. Labor contracts with such employees are in effect through September 30, 2016.
Knife River operates under 43 labor contracts that represent 455 of its construction materials employees. Knife River is in negotiations on four of its labor contracts.
MDU Construction Services has 155 labor contracts representing the majority of its employees.
The majority of the labor contracts contain provisions that prohibit work stoppages or strikes and provide for binding arbitration dispute resolution in the event of an extended disagreement.
The Company's principal properties, which are of varying ages and are of different construction types, are generally in good condition, are well maintained and are generally suitable and adequate for the purposes for which they are used.
The financial results and data applicable to each of the Company's business segments, as well as their financing requirements, are set forth in Item 7 - MD&A and Item 8 - Note 13 and Supplementary Financial Information.
The operations of the Company and certain of its subsidiaries are subject to federal, state and local laws and regulations providing for air, water and solid waste pollution control; state facility-siting regulations; zoning and planning regulations of certain state and local authorities; federal health and safety regulations and state hazard communication standards. The Company believes that it is in substantial compliance with these regulations, except as to what may be ultimately determined with regard to items discussed in Environmental matters in Item 8 - Note 17. There are no pending CERCLA actions for any of the Company's properties, other than the Portland, Oregon, Harbor Superfund Site and the Bremerton Gasworks Superfund Site.
The Company produces GHG emissions primarily from its fossil fuel electric generating facilities, as well as from natural gas pipeline and storage systems, operations of equipment and fleet vehicles, and refining activities. GHG emissions also result from customer use of natural gas for heating and other uses. As interest in reductions in GHG emissions has grown, the Company has developed renewable generation with lower or no GHG emissions. Governmental legislative and regulatory initiatives regarding environmental and energy policy are continuously evolving and could negatively impact the Company's operations and financial results. Until legislation and regulation are finalized, the impact of these measures cannot be accurately predicted. The Company will continue to monitor legislative and regulatory activity related to environmental and energy policy initiatives. Disclosure regarding specific environmental matters applicable to each of the Company's businesses is set forth under each business description later. In addition, for a discussion of the Company's risks related to environmental laws and regulations, see Item 1A - Risk Factors.
This annual report on Form 10-K, the Company's quarterly reports on Form 10-Q and current reports on Form 8-K, and any amendments to those reports filed or furnished pursuant to Section 13(a) or 15(d) of the Exchange Act are available free of charge through the Company's Web site as soon as reasonably practicable after the Company has electronically filed such reports with, or furnished such reports to, the SEC. The Company's Web site address is www.mdu.com. The information available on the Company's Web site is not part of this annual report on Form 10-K.
ElectricGeneral Montana-Dakota provides electric service at retail, serving more than 142,000 residential, commercial, industrial and municipal customers in 177 communities and adjacent rural areas as of December 31, 2015. The principal properties owned by Montana-Dakota for use in its electric operations include interests in 13 electric generating facilities and three small portable diesel generators, as further described under System Supply, System Demand and Competition, approximately 3,100 and 5,000 miles of transmission and distribution lines, respectively, and 73 transmission and 318 distribution substations. Montana-Dakota has obtained and holds, or is in the process of renewing, valid and existing franchises authorizing it to conduct its electric operations in all of the municipalities it serves where such franchises are required. Montana-Dakota intends to protect its service area and seek renewal of all expiring franchises. At December 31, 2015, Montana-Dakota's net electric plant investment was $1.3 billion.
The percentage of Montana-Dakota's 2015 retail electric utility operating revenues by jurisdiction is as follows: North Dakota - 65 percent; Montana - 21 percent; Wyoming - 9 percent; and South Dakota - 5 percent. Retail electric rates, service, accounting and certain security issuances are subject to regulation by the NDPSC, MTPSC, SDPUC and WYPSC. The interstate transmission and wholesale electric power operations of Montana-Dakota also are subject to regulation by the FERC under provisions of the Federal Power Act, as are interconnections with other utilities and power generators, the issuance of securities, accounting and other matters.
Part I
8 MDU Resources Group, Inc. Form 10-K
Through MISO, Montana-Dakota has access to wholesale energy, ancillary services and capacity markets for its integrated system. MISO is a regional transmission organization responsible for operational control of the transmission systems of its members. MISO provides security center operations, tariff administration and operates day-ahead and real-time energy markets, ancillary services and capacity markets. As a member of MISO, Montana-Dakota's generation is sold into the MISO energy market and its energy needs are purchased from that market.
System Supply, System Demand and Competition Through an interconnected electric system, Montana-Dakota serves markets in portions of western North Dakota, including Bismarck, Mandan, Dickinson, Williston and Watford City; eastern Montana, including Sidney, Glendive and Miles City; and northern South Dakota, including Mobridge. The maximum electric peak demand experienced to date attributable to Montana-Dakota's sales to retail customers on the interconnected system was 611,542 kW in August 2015. Montana-Dakota's latest forecast for its interconnected system indicates that its annual peak will continue to occur during the summer and the sales growth rate through 2020 will approximate three percent annually. The interconnected system consists of 12 electric generating facilities and three small portable diesel generators, which have an aggregate nameplate rating attributable to Montana-Dakota's interest of 704,143 kW and total net ZRCs of 513.2 in 2015. ZRCs are a MW of demand equivalent measure and are allocated to individual generators to meet planning reserve margin requirements within MISO. For 2015, Montana-Dakota's total ZRCs, including its firm purchase power contracts, were 547.3. Montana-Dakota's planning reserve margin requirement within MISO was 547.3 for 2015. Montana-Dakota's interconnected system electric generating capability includes four steam-turbine generating units using coal for fuel, three combustion turbine peaking stations, three wind electric generating facilities, a reciprocating internal combustion engine, a heat recovery electric generating facility and three small portable diesel generators.
In December 2015, construction was completed on a wind farm consisting of 43 wind turbines totaling 107.5 MW of electric generation. On December 30, 2015, Montana-Dakota purchased the wind farm from Thunder Spirit Wind, LLC, at a total cost of approximately $214 million including purchase price, internal costs and AFUDC with approximately $55 million already funded in 2014. The project began commercial operation in the fourth quarter of 2015. The generation interconnects at Montana-Dakota's substation near Hettinger, North Dakota. Montana-Dakota completed construction and commissioning of an 18.7 MW reciprocating internal combustion engine electric generation project at the existing Lewis & Clark generating facility in Sidney, Montana in December of 2015. Additional energy will be purchased as needed, or if more economical, from the MISO market. In 2015, Montana-Dakota purchased approximately 47 percent of its net kWh needs for its interconnected system through the MISO market.
Through the Sheridan System, Montana-Dakota serves Sheridan, Wyoming, and neighboring communities. The maximum peak demand experienced to date attributable to Montana-Dakota sales to retail customers on that system was approximately 61,501 kW in July 2012. Montana-Dakota has a power supply contract with Black Hills Power, Inc. to purchase up to 49,000 kW of capacity annually through December 31, 2016. Wygen III serves a portion of the needs of its Sheridan-area customers.
Part I
MDU Resources Group, Inc. Form 10-K 9
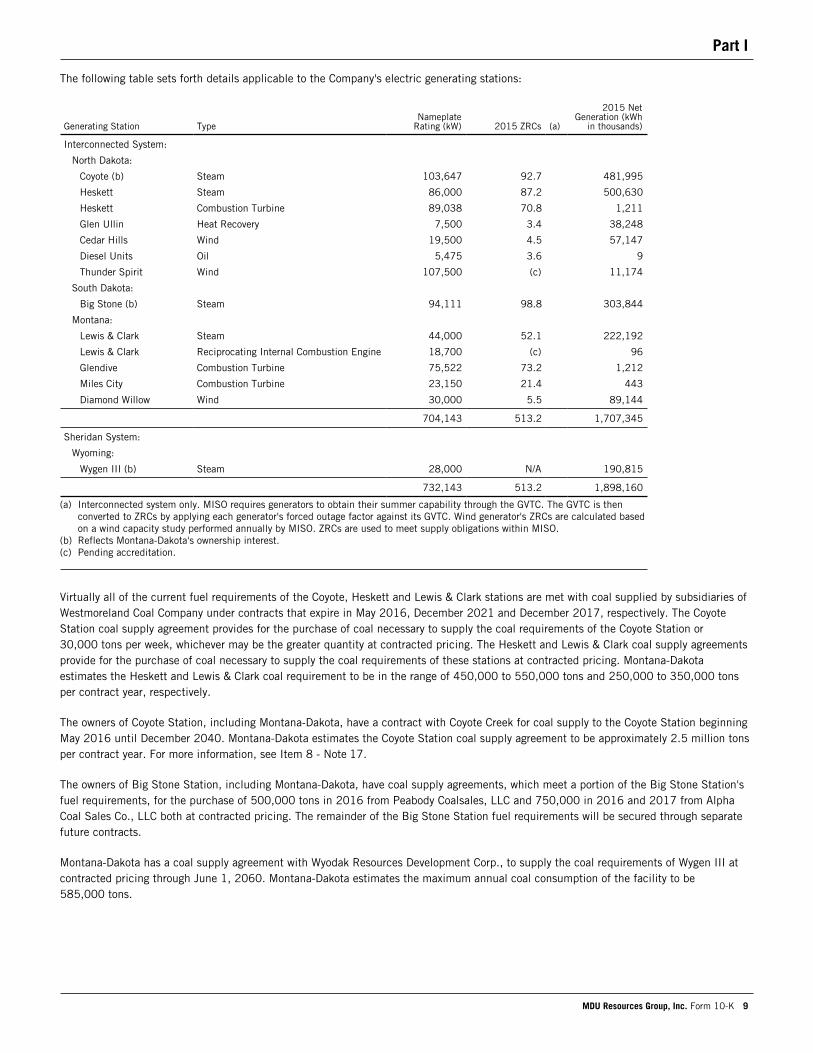
The following table sets forth details applicable to the Company's electric generating stations:
Generating Station TypeNameplate
Rating (kW) 2015 ZRCs (a)
2015 NetGeneration (kWh
in thousands)
Interconnected System:
North Dakota:
Coyote (b) Steam 103,647 92.7 481,995
Heskett Steam 86,000 87.2 500,630
Heskett Combustion Turbine 89,038 70.8 1,211
Glen Ullin Heat Recovery 7,500 3.4 38,248
Cedar Hills Wind 19,500 4.5 57,147
Diesel Units Oil 5,475 3.6 9
Thunder Spirit Wind 107,500 (c) 11,174
South Dakota:
Big Stone (b) Steam 94,111 98.8 303,844
Montana:
Lewis & Clark Steam 44,000 52.1 222,192
Lewis & Clark Reciprocating Internal Combustion Engine 18,700 (c) 96
Glendive Combustion Turbine 75,522 73.2 1,212
Miles City Combustion Turbine 23,150 21.4 443
Diamond Willow Wind 30,000 5.5 89,144
704,143 513.2 1,707,345
Sheridan System:
Wyoming:
Wygen III (b) Steam 28,000 N/A 190,815
732,143 513.2 1,898,160
(a) Interconnected system only. MISO requires generators to obtain their summer capability through the GVTC. The GVTC is then converted to ZRCs by applying each generator's forced outage factor against its GVTC. Wind generator's ZRCs are calculated based on a wind capacity study performed annually by MISO. ZRCs are used to meet supply obligations within MISO.
(b) Reflects Montana-Dakota's ownership interest.(c) Pending accreditation.
Virtually all of the current fuel requirements of the Coyote, Heskett and Lewis & Clark stations are met with coal supplied by subsidiaries of Westmoreland Coal Company under contracts that expire in May 2016, December 2021 and December 2017, respectively. The Coyote Station coal supply agreement provides for the purchase of coal necessary to supply the coal requirements of the Coyote Station or 30,000 tons per week, whichever may be the greater quantity at contracted pricing. The Heskett and Lewis & Clark coal supply agreements provide for the purchase of coal necessary to supply the coal requirements of these stations at contracted pricing. Montana-Dakota estimates the Heskett and Lewis & Clark coal requirement to be in the range of 450,000 to 550,000 tons and 250,000 to 350,000 tons per contract year, respectively.
The owners of Coyote Station, including Montana-Dakota, have a contract with Coyote Creek for coal supply to the Coyote Station beginning May 2016 until December 2040. Montana-Dakota estimates the Coyote Station coal supply agreement to be approximately 2.5 million tons per contract year. For more information, see Item 8 - Note 17.
The owners of Big Stone Station, including Montana-Dakota, have coal supply agreements, which meet a portion of the Big Stone Station's fuel requirements, for the purchase of 500,000 tons in 2016 from Peabody Coalsales, LLC and 750,000 in 2016 and 2017 from Alpha Coal Sales Co., LLC both at contracted pricing. The remainder of the Big Stone Station fuel requirements will be secured through separate future contracts.
Montana-Dakota has a coal supply agreement with Wyodak Resources Development Corp., to supply the coal requirements of Wygen III at contracted pricing through June 1, 2060. Montana-Dakota estimates the maximum annual coal consumption of the facility to be 585,000 tons.
Part I
10 MDU Resources Group, Inc. Form 10-K
The average cost of coal purchased, including freight, at Montana-Dakota's electric generating stations (including the Big Stone, Coyote and Wygen III stations) was as follows:
Years ended December 31, 2015 2014 2013
Average cost of coal per MMBtu $ 1.75 $ 1.74 $ 1.73
Average cost of coal per ton $ 25.41 $ 25.11 $ 25.32
Montana-Dakota expects that it has secured adequate capacity available through existing baseload generating stations, renewable generation, turbine peaking stations, demand reduction programs and firm contracts to meet the peak customer demand requirements of its customers through mid-2017. Future capacity that is needed to replace contracts and meet system growth requirements is expected to be met by constructing new generation resources, or acquiring additional capacity through power purchase contracts or the MISO capacity auction. For more information regarding potential power generation projects, see Item 7 - MD&A - Prospective Information - Electric and natural gas distribution.
Montana-Dakota has major interconnections with its neighboring utilities and considers these interconnections adequate for coordinated planning, emergency assistance, exchange of capacity and energy and power supply reliability.
Montana-Dakota is subject to competition in varying degrees, in certain areas, from rural electric cooperatives, on-site generators, co-generators and municipally owned systems. In addition, competition in varying degrees exists between electricity and alternative forms of energy such as natural gas.
Regulatory Matters and Revenues Subject to Refund In North Dakota, Montana-Dakota reflects monthly increases or decreases in fuel and purchased power costs (including demand charges) and is deferring those electric fuel and purchased power costs that are greater or less than amounts presently being recovered through its existing rate schedules. In Montana, a monthly Fuel and Purchased Power Tracking Adjustment mechanism allows Montana-Dakota to reflect 90 percent of the increases or decreases in fuel and purchased power costs (including demand charges) and Montana-Dakota is deferring 90 percent of costs that are greater or less than amounts presently being recovered through its existing rate schedules. A fuel adjustment clause contained in South Dakota jurisdictional electric rate schedules allows Montana-Dakota to reflect monthly increases or decreases in fuel and purchased power costs (excluding demand charges). In Wyoming, an annual Electric Power Supply Cost Adjustment mechanism allows Montana-Dakota to reflect increases or decreases in purchased power costs (including demand charges but excluding increases or decreases from base coal price) related to power supply and Montana-Dakota is deferring costs that are greater or less than amounts presently being recovered through its existing rate schedules. Such orders generally provide that these amounts are recoverable or refundable through rate adjustments which are filed annually. For more information, see Item 8 - Note 4.
In North Dakota, Montana-Dakota recovers in rates the costs associated with environmental upgrades at Big Stone Station and Lewis & Clark Station. Montana-Dakota will maintain a tracker account until all costs are recovered or until the associated costs are reflected in base rates as a part of a general rate case.
In North Dakota, Montana-Dakota has the ability to recover the costs associated with new generation through a rider mechanism. Montana-Dakota will utilize this rider mechanism for new generation until such time as the costs and investment are included in base rates. For the Thunder Spirit Wind project, Montana-Dakota implemented a renewable resource cost adjustment rider. Montana-Dakota also has in place in North Dakota a transmission tracker to recover transmission costs from its regional transmission operator, MISO. The tracking mechanism has an annual true-up.
For more information on regulatory matters, see Item 8 - Note 16.
Environmental Matters Montana-Dakota's electric operations are subject to federal, state and local laws and regulations providing for air, water and solid waste pollution control; state facility-siting regulations; zoning and planning regulations of certain state and local authorities; federal health and safety regulations; and state hazard communication standards. Montana-Dakota believes it is in substantial compliance with these regulations.
Montana-Dakota's electric generating facilities have Title V Operating Permits, under the Clean Air Act, issued by the states in which they operate. Each of these permits has a five-year life. Near the expiration of these permits, renewal applications are submitted. Permits continue in force beyond the expiration date, provided the application for renewal is submitted by the required date, usually six months prior to expiration. The Title V Operating Permit renewal application for Big Stone Station was submitted timely to the South Dakota DENR in November 2013. Big Stone Station continues to operate under conditions of the Title V Operating Permit issued by the South Dakota DENR in June 2009. It is expected that a final renewed permit will be issued in 2016 with the completion of the BART air quality control system. Wygen III is allowed to operate under the facility's construction permit until the Title V Operating Permit is issued by the Wyoming
Part I
MDU Resources Group, Inc. Form 10-K 11
Department of Environmental Quality. The Title V Operating Permit application for Wygen III was submitted timely in January 2011, with the permit expected to be issued in 2016. The Title V Operating Permit renewal application for Lewis & Clark Station was submitted timely in February 2014 to the Montana DEQ and the permit was issued July 2015. The Title V Operating Permit renewal application for Heskett Station was submitted timely in August 2014 to the North Dakota Department of Health and the permit was issued July 2015. The Title V Operating Permits for the Miles City and Glendive stations expire in August 2016, and the renewal applications are expected to be submitted to the Montana DEQ in early 2016.
State water discharge permits issued under the requirements of the Clean Water Act are maintained for power production facilities on the Yellowstone and Missouri rivers. These permits also have five-year lives. Montana-Dakota renews these permits as necessary prior to expiration. Other permits held by these facilities may include an initial siting permit, which is typically a one-time, preconstruction permit issued by the state; state permits to dispose of combustion by-products; state authorizations to withdraw water for operations; and Army Corps permits to construct water intake structures. Montana-Dakota's Army Corps permits grant one-time permission to construct and do not require renewal. Other permit terms vary and the permits are renewed as necessary.
Montana-Dakota's electric operations are conditionally exempt small-quantity hazardous waste generators and subject only to minimum regulation under the RCRA. Montana-Dakota routinely handles PCBs from its electric operations in accordance with federal requirements. PCB storage areas are registered with the EPA as required.
Montana-Dakota incurred $46.0 million of environmental capital expenditures in 2015, largely for the installation of a BART air quality control system at the Big Stone Station. Environmental capital expenditures are estimated to be $14.8 million, $4.1 million and $2.8 million in 2016, 2017 and 2018, respectively. Projects for 2016 through 2018 include sulfur-dioxide, nitrogen oxide and mercury and non-mercury metals emission control equipment installation and anticipated costs for coal ash disposal at electric generating stations. Montana-Dakota's capital and operational expenditures could also be affected in a variety of ways by future air emission regulations and coal ash management requirements, including the Clean Power Plan rule published by the EPA in October 2015. Montana-Dakota is evaluating the Clean Power Plan, which requires existing fossil fuel-fired electric generation facilities to reduce carbon dioxide emissions. It is unknown at this time what each state will require for emissions limits or reductions from each of Montana-Dakota's owned and jointly owned fossil fuel-fired electric generating units. Compliance costs will become clearer as final state plans are completed and submitted to the EPA by September 2018. On February 9, 2016, the United States Supreme Court granted an application for a stay of the Clean Power Plan pending disposition of the applicants' petition for review in the D.C. Circuit Court and disposition of the applicants' petition for a writ of certiorari if such a writ is sought. Montana-Dakota has not included estimates for capital expenditures in 2016 through 2018 for the potential compliance requirements of the Clean Power Plan.
Natural Gas DistributionGeneral The Company's natural gas distribution operations consist of Montana-Dakota, Great Plains, Cascade and Intermountain, which sell natural gas at retail, serving over 906,000 residential, commercial and industrial customers in 334 communities and adjacent rural areas across eight states as of December 31, 2015, and provide natural gas transportation services to certain customers on the Company's systems. These services are provided through distribution systems aggregating approximately 19,100 miles. The natural gas distribution operations have obtained and hold, or are in the process of renewing, valid and existing franchises authorizing them to conduct their natural gas operations in all of the municipalities they serve where such franchises are required. These operations intend to protect their service areas and seek renewal of all expiring franchises. At December 31, 2015, the natural gas distribution operations' net natural gas distribution plant investment was $1.3 billion.
The percentage of the natural gas distribution operations' 2015 natural gas utility operating sales revenues by jurisdiction is as follows: Idaho - 32 percent; Washington - 26 percent; North Dakota - 15 percent; Montana - 8 percent; Oregon - 8 percent; South Dakota - 6 percent; Minnesota - 3 percent; and Wyoming - 2 percent. The natural gas distribution operations are subject to regulation by the IPUC, MNPUC, MTPSC, NDPSC, OPUC, SDPUC, WUTC and WYPSC regarding retail rates, service, accounting and certain security issuances.
System Supply, System Demand and Competition The natural gas distribution operations serve retail natural gas markets, consisting principally of residential and firm commercial space and water heating users, in portions of Idaho, including Boise, Nampa, Twin Falls, Pocatello and Idaho Falls; western Minnesota, including Fergus Falls, Marshall and Crookston; eastern Montana, including Billings, Glendive and Miles City; North Dakota, including Bismarck, Mandan, Dickinson, Wahpeton, Williston, Watford City, Minot and Jamestown; central and eastern Oregon, including Bend, Pendleton, Ontario and Baker City; western and north-central South Dakota, including Rapid City, Pierre, Spearfish and Mobridge; western, southeastern and south-central Washington, including Bellingham, Bremerton, Longview, Aberdeen, Wenatchee/Moses Lake, Mount Vernon, Tri-Cities, Walla Walla and Yakima; and northern Wyoming, including Sheridan and Lovell. These markets are highly seasonal and sales volumes depend largely on the weather, the effects of which are mitigated in certain jurisdictions by a weather normalization mechanism discussed in Regulatory Matters. In addition to the residential and commercial sales, the utilities transport natural gas for larger commercial and industrial customers who purchase their own supply of natural gas.
Part I
12 MDU Resources Group, Inc. Form 10-K
Competition in varying degrees exists between natural gas and other fuels and forms of energy. The natural gas distribution operations have established various natural gas transportation service rates for their distribution businesses to retain interruptible commercial and industrial loads. These services have enhanced the natural gas distribution operations' competitive posture with alternative fuels, although certain customers have bypassed the distribution systems by directly accessing transmission pipelines within close proximity. These bypasses did not have a material effect on results of operations.
The natural gas distribution operations and various distribution transportation customers obtain their system requirements directly from producers, processors and marketers. The Company's purchased natural gas is supplied by a portfolio of contracts specifying market-based pricing and is transported under transportation agreements with WBI Energy Transmission, Northern Border Pipeline Company, Northwest Pipeline GP, Northern Natural Gas, Gas Transmission Northwest LLC, Northwestern Energy, Viking Gas Transmission Company, Westcoast Energy Inc., Ruby Pipeline LLC, Foothills Pipe Lines Ltd. and NOVA Gas Transmission Ltd. The natural gas distribution operations have contracts for storage services to provide gas supply during the winter heating season and to meet peak day demand with various storage providers, including WBI Energy Transmission, Questar Pipeline Company, Northwest Pipeline GP and Northern Natural Gas. In addition, certain of the operations have entered into natural gas supply management agreements with various parties. Demand for natural gas, which is a widely traded commodity, has historically been sensitive to seasonal heating and industrial load requirements as well as changes in market price. The natural gas distribution operations believe that, based on current and projected domestic and regional supplies of natural gas and the pipeline transmission network currently available through their suppliers and pipeline service providers, supplies are adequate to meet their system natural gas requirements for the next decade.
Regulatory Matters The natural gas distribution operations' retail natural gas rate schedules contain clauses permitting adjustments in rates based upon changes in natural gas commodity, transportation and storage costs. Current tariffs allow for recovery or refunds of under- or over-recovered gas costs through rate adjustments which are filed annually.
Montana-Dakota's North Dakota and South Dakota natural gas tariffs contain weather normalization mechanisms applicable to certain firm customers that adjust the distribution delivery charge revenues to reflect weather fluctuations during the November 1 through May 1 billing periods.
On December 28, 2015, the OPUC approved an extension of Cascade's decoupling mechanism until January 1, 2020, with an agreement that Cascade would initiate a review of the mechanism by September 30, 2019. Cascade also has an earnings sharing mechanism with respect to its Oregon jurisdictional operations as required by the OPUC.
For more information on regulatory matters, see Item 8 - Note 16.
Environmental Matters The natural gas distribution operations are subject to federal, state and local environmental, facility-siting, zoning and planning laws and regulations. The natural gas distribution operations believe they are in substantial compliance with those regulations.
The Company's natural gas distribution operations are conditionally exempt small-quantity hazardous waste generators and subject only to minimum regulation under the RCRA. Certain locations of the natural gas distribution operations routinely handle PCBs from their natural gas operations in accordance with federal requirements. PCB storage areas are registered with the EPA as required. Capital and operational expenditures for natural gas distribution operations could be affected in a variety of ways by potential new GHG legislation or regulation. In particular, such legislation or regulation would likely increase capital expenditures for energy efficiency and conservation programs and operational costs associated with GHG emissions compliance. Natural gas distribution operations expect to recover the operational and capital expenditures for GHG regulatory compliance in rates consistent with the recovery of other reasonable costs of complying with environmental laws and regulations.
The natural gas distribution operations did not incur any material environmental expenditures in 2015. Except as to what may be ultimately determined with regard to the issues described later, the natural gas distribution operations do not expect to incur any material capital expenditures related to environmental compliance with current laws and regulations through 2018.
Montana-Dakota has had an economic interest in four historic manufactured gas plants and Great Plains has had an economic interest in one historic manufactured gas plant within their service territories. Montana-Dakota is investigating a former manufactured gas plant in Montana and is planning an investigation of a former manufactured gas plant in North Dakota. Montana-Dakota will seek recovery in its natural gas rates charged to customers for any remediation costs incurred for these sites. None of the remaining former manufactured gas plant sites of Montana-Dakota or Great Plains are being actively investigated. Cascade has had an economic interest in nine former manufactured gas plants within its service territory. Cascade has been involved in the investigation and remediation of three manufactured gas plants in Washington and Oregon. See Item 8 - Note 17 for a further discussion of these three manufactured gas plants. To the extent these claims are not covered by insurance, Cascade will seek recovery through the OPUC and WUTC of remediation costs in its natural gas rates charged to customers.
Part I
MDU Resources Group, Inc. Form 10-K 13
Pipeline and MidstreamGeneral WBI Energy owns and operates both regulated and nonregulated businesses. The regulated business of this segment, WBI Energy Transmission, owns and operates approximately 4,000 miles of transmission, gathering and storage lines in Montana, North Dakota, South Dakota and Wyoming. Three underground storage fields in Montana and Wyoming provide storage services to local distribution companies, producers, natural gas marketers and others, and serve to enhance system deliverability. Its system is strategically located near five natural gas producing basins, making natural gas supplies available to its transportation and storage customers. The system has 13 interconnecting points with other pipeline facilities allowing for the receipt and/or delivery of natural gas to and from other regions of the country and from Canada. Under the Natural Gas Act, as amended, WBI Energy Transmission is subject to the jurisdiction of the FERC regarding certificate, rate, service and accounting matters, and at December 31, 2015, its net plant investment was $363.4 million.
The nonregulated business of this segment owns and operates gathering facilities in Montana and Wyoming. In 2015, the Company sold its gathering facilities in Colorado. It also owns a 50 percent undivided interest in the Pronghorn assets located in western North Dakota, which include a natural gas processing plant, both oil and gas gathering pipelines, an oil storage terminal and an oil pipeline. In total, facilities include approximately 800 miles of operated field gathering lines, some of which interconnect with WBI Energy's regulated pipeline system. The nonregulated business provides natural gas and oil gathering services, natural gas processing and a variety of other energy-related services, including cathodic protection, water hauling, contract compression operations, measurement services, and energy efficiency product sales and installation services to large end-users.
A majority of its pipeline and midstream business is transacted in the northern Great Plains and Rocky Mountain regions of the United States.
For information regarding natural gas gathering operations litigation, see Item 8 - Note 17.
System Supply, System Demand and Competition Natural gas supplies emanate from traditional and nontraditional production activities in the region and from off-system supply sources. While certain traditional regional supply sources are in various stages of decline, incremental supply from nontraditional sources have been developed which has helped support WBI Energy Transmission's supply needs. This includes new natural gas supply associated with the continued development of the Bakken area in Montana and North Dakota. In addition, off-system supply sources are available through the Company's interconnections with other pipeline systems. WBI Energy Transmission expects to facilitate the movement of these supplies by making available its transportation and storage services. WBI Energy Transmission will continue to look for opportunities to increase transportation, gathering and storage services through system expansion and/or other pipeline interconnections or enhancements that could provide substantial future benefits.
WBI Energy Transmission's underground natural gas storage facilities have a certificated storage capacity of approximately 353 Bcf, including 193 Bcf of working gas capacity, 85 Bcf of cushion gas and 75 Bcf of native gas. These storage facilities enable customers to purchase natural gas at more uniform daily volumes throughout the year and meet winter peak requirements.
WBI Energy Transmission competes with several pipelines for its customers' transportation, storage and gathering business and at times may discount rates in an effort to retain market share. However, the strategic location of its system near five natural gas producing basins and the availability of underground storage and gathering services, along with interconnections with other pipelines, serve to enhance its competitive position.
Although certain of WBI Energy Transmission's firm customers, including its largest firm customer Montana-Dakota, serve relatively secure residential and commercial end-users, they generally all have some price-sensitive end-users that could switch to alternate fuels.
WBI Energy Transmission transports substantially all of Montana-Dakota's natural gas, primarily utilizing firm transportation agreements, which for 2015 represented 43 percent of WBI Energy Transmission's subscribed firm transportation contract demand. The majority of the firm transportation agreements with Montana-Dakota expire in June 2017. In addition, Montana-Dakota has contracts with WBI Energy Transmission to provide firm storage services to facilitate meeting Montana-Dakota's winter peak requirements expiring in July 2035.
The nonregulated business competes with several midstream companies for existing customers, the expansion of its systems and the installation of new systems. Its strong position in the fields in which it operates, its focus on customer service and the variety of services it offers, along with its interconnection with various other pipelines, serve to enhance its competitive position.
Environmental Matters The pipeline and midstream operations are generally subject to federal, state and local environmental, facility-siting, zoning and planning laws and regulations. The Company believes it is in substantial compliance with those regulations.
Ongoing operations are subject to the Clean Air Act, the Clean Water Act, the RCRA and other state and federal regulations. Administration of many provisions of these laws has been delegated to the states where WBI Energy and its subsidiaries operate. Permit terms vary and all
Part I
14 MDU Resources Group, Inc. Form 10-K
permits carry operational compliance conditions. Some permits require annual renewal, some have terms ranging from one to five years and others have no expiration date. Permits are renewed and modified, as necessary, based on defined permit expiration dates, operational demand and/or regulatory changes.
Detailed environmental assessments and/or environmental impact statements as required by the National Environmental Policy Act are included in the FERC's environmental review process for both the construction and abandonment of WBI Energy Transmission's natural gas transmission pipelines, compressor stations and storage facilities.
The pipeline and midstream operations did not incur any material environmental expenditures in 2015 and do not expect to incur any material capital expenditures related to environmental compliance with current laws and regulations through 2018.
Construction Materials and ContractingGeneral Knife River operates construction materials and contracting businesses headquartered in Alaska, California, Hawaii, Idaho, Iowa, Minnesota, Montana, North Dakota, Oregon, Texas, Washington and Wyoming. These operations mine, process and sell construction aggregates (crushed stone, sand and gravel); produce and sell asphalt mix and supply ready-mixed concrete for use in most types of construction, including roads, freeways and bridges, as well as homes, schools, shopping centers, office buildings and industrial parks. Although not common to all locations, other products include the sale of cement, liquid asphalt for various commercial and roadway applications, various finished concrete products and other building materials and related contracting services.
For information regarding construction materials litigation, see Item 8 - Note 17.
The construction materials business had approximately $491 million in backlog at December 31, 2015, compared to $438 million at December 31, 2014. The Company anticipates that a significant amount of the current backlog will be completed during 2016.
Competition Knife River's construction materials products are marketed under highly competitive conditions. Price is the principal competitive force to which these products are subject, with service, quality, delivery time and proximity to the customer also being significant factors. The number and size of competitors varies in each of Knife River's principal market areas and product lines.
The demand for construction materials products is significantly influenced by the cyclical nature of the construction industry in general. In addition, construction materials activity in certain locations may be seasonal in nature due to the effects of weather. The key economic factors affecting product demand are changes in the level of local, state and federal governmental spending, general economic conditions within the market area that influence both the commercial and residential sectors, and prevailing interest rates.
Knife River is not dependent on any single customer or group of customers for sales of its products and services, the loss of which would have a material adverse effect on its construction materials businesses.
Reserve Information Aggregate reserve estimates are calculated based on the best available data. This data is collected from drill holes and other subsurface investigations, as well as investigations of surface features such as mine high walls and other exposures of the aggregate reserves. Mine plans, production history and geologic data also are utilized to estimate reserve quantities. Most acquisitions are made of mature businesses with established reserves, as distinguished from exploratory-type properties.
Estimates are based on analyses of the data described above by experienced internal mining engineers, operating personnel and geologists. Property setbacks and other regulatory restrictions and limitations are identified to determine the total area available for mining. Data described previously are used to calculate the thickness of aggregate materials to be recovered. Topography associated with alluvial sand and gravel deposits is typically flat and volumes of these materials are calculated by applying the thickness of the resource over the areas available for mining. Volumes are then converted to tons by using an appropriate conversion factor. Typically, 1.5 tons per cubic yard in the ground is used for sand and gravel deposits.
Topography associated with the hard rock reserves is typically much more diverse. Therefore, using available data, a final topography map is created and computer software is utilized to compute the volumes between the existing and final topographies. Volumes are then converted to tons by using an appropriate conversion factor. Typically, 2 tons per cubic yard in the ground is used for hard rock quarries.
Estimated reserves are probable reserves as defined in Securities Act Industry Guide 7. Remaining reserves are based on estimates of volumes that can be economically extracted and sold to meet current market and product applications. The reserve estimates include only salable tonnage and thus exclude waste materials that are generated in the crushing and processing phases of the operation. Approximately 955 million tons of the 1.0 billion tons of aggregate reserves are permitted reserves. The remaining reserves are on properties that are expected to be permitted for mining under current regulatory requirements. The data used to calculate the remaining reserves may require revisions in the future to account for changes in customer requirements and unknown geological occurrences. The years remaining
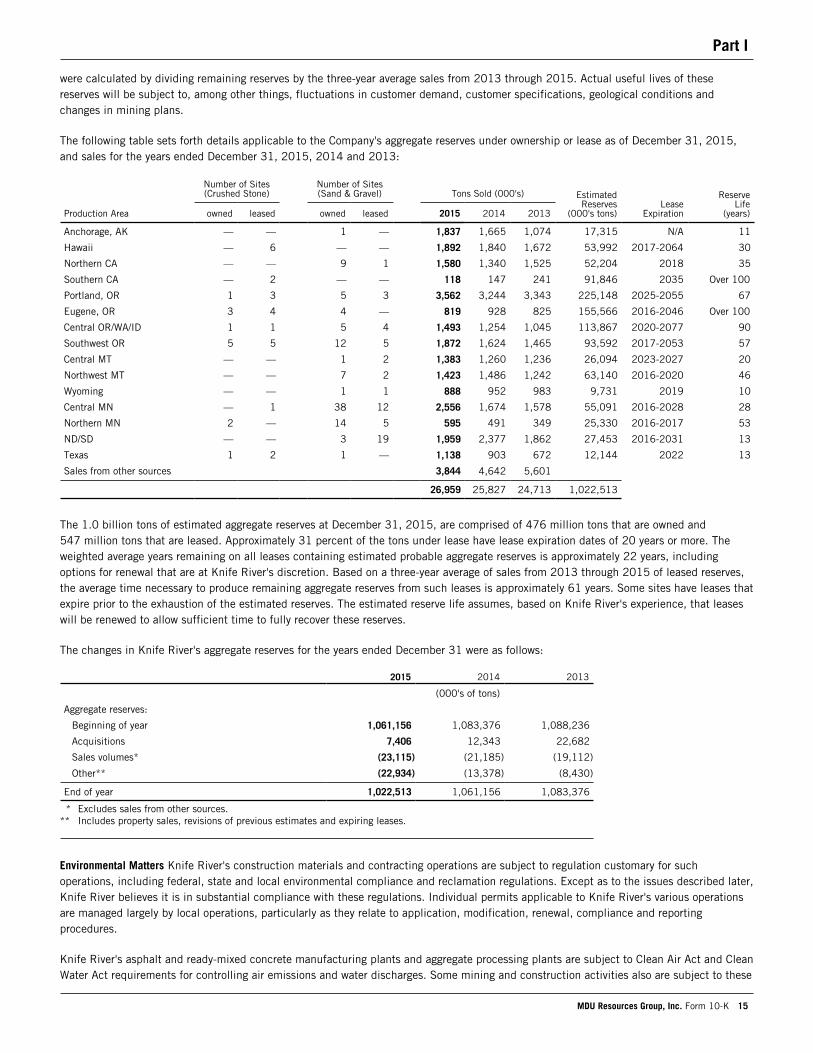
Part I
MDU Resources Group, Inc. Form 10-K 15
were calculated by dividing remaining reserves by the three-year average sales from 2013 through 2015. Actual useful lives of these reserves will be subject to, among other things, fluctuations in customer demand, customer specifications, geological conditions and changes in mining plans.
The following table sets forth details applicable to the Company's aggregate reserves under ownership or lease as of December 31, 2015, and sales for the years ended December 31, 2015, 2014 and 2013:
Number of Sites(Crushed Stone)
Number of Sites(Sand & Gravel) Tons Sold (000's) Estimated
Reserves(000's tons)
LeaseExpiration
ReserveLife
(years)Production Area owned leased owned leased 2015 2014 2013
Anchorage, AK — — 1 — 1,837 1,665 1,074 17,315 N/A 11
Hawaii — 6 — — 1,892 1,840 1,672 53,992 2017-2064 30
Northern CA — — 9 1 1,580 1,340 1,525 52,204 2018 35
Southern CA — 2 — — 118 147 241 91,846 2035 Over 100
Portland, OR 1 3 5 3 3,562 3,244 3,343 225,148 2025-2055 67
Eugene, OR 3 4 4 — 819 928 825 155,566 2016-2046 Over 100
Central OR/WA/ID 1 1 5 4 1,493 1,254 1,045 113,867 2020-2077 90
Southwest OR 5 5 12 5 1,872 1,624 1,465 93,592 2017-2053 57
Central MT — — 1 2 1,383 1,260 1,236 26,094 2023-2027 20
Northwest MT — — 7 2 1,423 1,486 1,242 63,140 2016-2020 46
Wyoming — — 1 1 888 952 983 9,731 2019 10
Central MN — 1 38 12 2,556 1,674 1,578 55,091 2016-2028 28
Northern MN 2 — 14 5 595 491 349 25,330 2016-2017 53
ND/SD — — 3 19 1,959 2,377 1,862 27,453 2016-2031 13
Texas 1 2 1 — 1,138 903 672 12,144 2022 13
Sales from other sources 3,844 4,642 5,601
26,959 25,827 24,713 1,022,513
The 1.0 billion tons of estimated aggregate reserves at December 31, 2015, are comprised of 476 million tons that are owned and 547 million tons that are leased. Approximately 31 percent of the tons under lease have lease expiration dates of 20 years or more. The weighted average years remaining on all leases containing estimated probable aggregate reserves is approximately 22 years, including options for renewal that are at Knife River's discretion. Based on a three-year average of sales from 2013 through 2015 of leased reserves, the average time necessary to produce remaining aggregate reserves from such leases is approximately 61 years. Some sites have leases that expire prior to the exhaustion of the estimated reserves. The estimated reserve life assumes, based on Knife River's experience, that leases will be renewed to allow sufficient time to fully recover these reserves.
The changes in Knife River's aggregate reserves for the years ended December 31 were as follows:
2015 2014 2013
(000's of tons)
Aggregate reserves:
Beginning of year 1,061,156 1,083,376 1,088,236
Acquisitions 7,406 12,343 22,682
Sales volumes* (23,115) (21,185) (19,112)
Other** (22,934) (13,378) (8,430)
End of year 1,022,513 1,061,156 1,083,376
* Excludes sales from other sources.** Includes property sales, revisions of previous estimates and expiring leases.
Environmental Matters Knife River's construction materials and contracting operations are subject to regulation customary for such operations, including federal, state and local environmental compliance and reclamation regulations. Except as to the issues described later, Knife River believes it is in substantial compliance with these regulations. Individual permits applicable to Knife River's various operations are managed largely by local operations, particularly as they relate to application, modification, renewal, compliance and reporting procedures.
Knife River's asphalt and ready-mixed concrete manufacturing plants and aggregate processing plants are subject to Clean Air Act and Clean Water Act requirements for controlling air emissions and water discharges. Some mining and construction activities also are subject to these
Part I
16 MDU Resources Group, Inc. Form 10-K
laws. In most of the states where Knife River operates, these regulatory programs have been delegated to state and local regulatory authorities. Knife River's facilities also are subject to the RCRA as it applies to the management of hazardous wastes and underground storage tank systems. These programs also have generally been delegated to the state and local authorities in the states where Knife River operates. Knife River's facilities must comply with requirements for managing wastes and underground storage tank systems.
Some Knife River activities are directly regulated by federal agencies. For example, certain in-water mining operations are subject to provisions of the Clean Water Act that are administered by the Army Corps. Knife River operates several such operations, including gravel bar skimming and dredging operations, and Knife River has the associated permits as required. The expiration dates of these permits vary, with five years generally being the longest term.
Knife River's operations also are occasionally subject to the ESA. For example, land use regulations often require environmental studies, including wildlife studies, before a permit may be granted for a new or expanded mining facility or an asphalt or concrete plant. If endangered species or their habitats are identified, ESA requirements for protection, mitigation or avoidance apply. Endangered species protection requirements are usually included as part of land use permit conditions. Typical conditions include avoidance, setbacks, restrictions on operations during certain times of the breeding or rearing season, and construction or purchase of mitigation habitat. Knife River's operations also are subject to state and federal cultural resources protection laws when new areas are disturbed for mining operations or processing plants. Land use permit applications generally require that areas proposed for mining or other surface disturbances be surveyed for cultural resources. If any are identified, they must be protected or managed in accordance with regulatory agency requirements.
The most comprehensive environmental permit requirements are usually associated with new mining operations, although requirements vary widely from state to state and even within states. In some areas, land use regulations and associated permitting requirements are minimal. However, some states and local jurisdictions have very demanding requirements for permitting new mines. Environmental impact reports are sometimes required before a mining permit application can even be considered for approval. These reports can take up to several years to complete. The report can include projected impacts of the proposed project on air and water quality, wildlife, noise levels, traffic, scenic vistas and other environmental factors. The reports generally include suggested actions to mitigate the projected adverse impacts.
Provisions for public hearings and public comments are usually included in land use permit application review procedures in the counties where Knife River operates. After taking into account environmental, mine plan and reclamation information provided by the permittee as well as comments from the public and other regulatory agencies, the local authority approves or denies the permit application. Denial is rare, but land use permits often include conditions that must be addressed by the permittee. Conditions may include property line setbacks, reclamation requirements, environmental monitoring and reporting, operating hour restrictions, financial guarantees for reclamation, and other requirements intended to protect the environment or address concerns submitted by the public or other regulatory agencies.
Knife River has been successful in obtaining mining and other land use permit approvals so sufficient permitted reserves are available to support its operations. For mining operations, this often requires considerable advanced planning to ensure sufficient time is available to complete the permitting process before the newly permitted aggregate reserve is needed to support Knife River's operations.
Knife River's Gascoyne surface coal mine last produced coal in 1995 but continues to be subject to reclamation requirements of the Surface Mining Control and Reclamation Act, as well as the North Dakota Surface Mining Act. Portions of the Gascoyne Mine remain under reclamation bond until the 10-year revegetation liability period has expired. A portion of the original permit has been released from bond and additional areas are currently in the process of having the bond released. Knife River's intention is to request bond release as soon as it is deemed possible.
Knife River did not incur any material environmental expenditures in 2015 and, except as to what may be ultimately determined with regard to the issues described later, Knife River does not expect to incur any material expenditures related to environmental compliance with current laws and regulations through 2018.
In December 2000, Knife River - Northwest was named by the EPA as a PRP in connection with the cleanup of a commercial property site, acquired by Knife River - Northwest in 1999, and part of the Portland, Oregon, Harbor Superfund Site. For more information, see Item 8 - Note 17.
In October 2015, the Oregon DEQ issued a Notice of Civil Penalty to LTM asserting violations of Oregon water quality statues and rules at a site in Coos County. For more information, see Item 8 - Note 17.
Mine Safety The Dodd-Frank Act requires disclosure of certain mine safety information. For more information, see Item 4 - Mine Safety Disclosures.
Part I
MDU Resources Group, Inc. Form 10-K 17
Construction ServicesGeneral MDU Construction Services provides utility construction services specializing in constructing and maintaining electric and communication lines, gas pipelines, fire suppression systems, and external lighting and traffic signalization. This segment also provides utility excavation and inside electrical and mechanical services, and manufactures and distributes transmission line construction equipment and other supplies. These services are provided to utilities and large manufacturing, commercial, industrial, institutional and government customers.
For information regarding construction services litigation, see Item 8 - Note 17.
Construction and maintenance crews are active year round. However, activity in certain locations may be seasonal in nature due to the effects of weather.
MDU Construction Services operates a fleet of owned and leased trucks and trailers, support vehicles and specialty construction equipment, such as backhoes, excavators, trenchers, generators, boring machines and cranes. In addition, as of December 31, 2015, MDU Construction Services owned or leased facilities in 17 states. This space is used for offices, equipment yards, warehousing, storage and vehicle shops.
MDU Construction Services' backlog is comprised of the uncompleted portion of services to be performed under job-specific contracts. The backlog at December 31, 2015, was approximately $493 million compared to $305 million at December 31, 2014. MDU Construction Services expects to complete a significant amount of this backlog during 2016. Due to the nature of its contractual arrangements, in many instances MDU Construction Services' customers are not committed to the specific volumes of services to be purchased under a contract, but rather MDU Construction Services is committed to perform these services if and to the extent requested by the customer. Therefore, there can be no assurance as to the customers' requirements during a particular period or that such estimates at any point in time are predictive of future revenues.
MDU Construction Services works with the National Electrical Contractors Association, the IBEW and other trade associations on hiring and recruiting a qualified workforce.
Competition MDU Construction Services operates in a highly competitive business environment. Most of MDU Construction Services' work is obtained on the basis of competitive bids or by negotiation of either cost-plus or fixed-price contracts. The workforce and equipment are highly mobile, providing greater flexibility in the size and location of MDU Construction Services' market area. Competition is based primarily on price and reputation for quality, safety and reliability. The size and location of the services provided, as well as the state of the economy, will be factors in the number of competitors that MDU Construction Services will encounter on any particular project. MDU Construction Services believes that the diversification of the services it provides, the markets it serves throughout the United States and the management of its workforce will enable it to effectively operate in this competitive environment.
Utilities and independent contractors represent the largest customer base for this segment. Accordingly, utility and subcontract work accounts for a significant portion of the work performed by MDU Construction Services and the amount of construction contracts is dependent to a certain extent on the level and timing of maintenance and construction programs undertaken by customers. MDU Construction Services relies on repeat customers and strives to maintain successful long-term relationships with these customers.
Environmental Matters MDU Construction Services' operations are subject to regulation customary for the industry, including federal, state and local environmental compliance. MDU Construction Services believes it is in substantial compliance with these regulations.
The nature of MDU Construction Services' operations is such that few, if any, environmental permits are required. Operational convenience supports the use of petroleum storage tanks in several locations, which are permitted under state programs authorized by the EPA. MDU Construction Services has no ongoing remediation related to releases from petroleum storage tanks. MDU Construction Services' operations are conditionally exempt small-quantity waste generators, subject to minimal regulation under the RCRA. Federal permits for specific construction and maintenance jobs that may require these permits are typically obtained by the hiring entity, and not by MDU Construction Services.
MDU Construction Services did not incur any material environmental expenditures in 2015 and does not expect to incur any material capital expenditures related to environmental compliance with current laws and regulations through 2018.
RefiningGeneral WBI Energy, in conjunction with Calumet, formed Dakota Prairie Refining, to develop, build and operate Dakota Prairie Refinery. The refinery is designed as a 20,000-barrel-per-day facility located in the Bakken region in Stark County in western North Dakota.
Part I
18 MDU Resources Group, Inc. Form 10-K
Construction of the refinery was completed in March 2015 and the refinery began commercial operations in May 2015. The refinery processes Bakken crude oil into diesel, naphtha, ATBs and other by-products.
System Supply, System Demand and Competition Bakken crude oil is supplied to the refinery via a pipeline interconnect with the Belle Fourche Pipeline and a portion is trucked to the refinery from wells near the refinery. Crude oil contracts are generally secured on a month-to-month basis. Dakota Prairie Refining believes that adequate supplies of crude oil will continue to be available; however, more challenging to secure due to the slowdown in drilling activity in the Bakken region.
The refinery sells diesel fuel at the refinery rack to diesel wholesalers. Naphtha is railed to Canada and sold to third parties primarily for use as a diluent for tar sands production. ATBs are railed and sold to other facilities for further processing.
Dakota Prairie Refining's competitors include a number of large, integrated refiners with greater flexibility in responding to or absorbing market changes. Dakota Prairie Refining obtains all of its crude oil from third-party sources and competes with other purchasers in the local market area for these supplies. The availability and cost of crude oil, as well as the demand for and prices of the products the refining operations produce, are heavily influenced by global, as well as regional, supply and demand dynamics. Major competitors for the sale of Dakota Prairie Refining's refined products include other refineries both in the state and in the surrounding states that produce similar products.
Environmental Matters Refinery operations are subject to numerous federal, state and local laws regulating the discharge of substances into the environment or otherwise relating to the protection of the environment. Permits are required under these laws for the operation of refineries, pipelines and related refining operations facilities, and these permits are subject to revocation, modification and renewal. Compliance with applicable environmental laws, regulations and permits will continue to have an impact on refining operations, results of operations, and capital requirements. Dakota Prairie Refining believes that its current operations are in substantial compliance with applicable federal, state and local environmental laws, regulations and permits.
Dakota Prairie Refining's operations and many of the products it manufactures are subject to certain requirements of the Clean Air Act as well as related state and local laws and regulations. The EPA has the authority under the Clean Air Act to modify the formulation of the refined transportation fuel products Dakota Prairie Refining manufactures in order to limit the emissions associated with their final use. In addition, in 2014, the EPA published a proposed rule that proposes amendments to refinery standards already in effect: the National Emission Standards for Hazardous Air Pollutants from Petroleum. The proposed rule would also amend emission requirements under the existing Petroleum Refinery New Source Performance Standard. The Energy Policy Act of 2005 and the Energy Independence and Security Act of 2007 prescribe certain percentages of renewable fuels (e.g., ethanol and biofuels) that, where required by the Renewable Fuel Standard, must be blended into the refining operations' produced diesel or that requirement may be satisfied by purchasing RINs. For more information on RINs, see Item 8 - Note 6. Dakota Prairie Refining's operations are also subject to the Clean Water Act, the Federal Safe Drinking Water Act and comparable state and local requirements. The Clean Water Act, the Federal Safe Drinking Water Act and analogous laws prohibit any discharge into surface waters, ground waters, injection wells and publicly owned treatment works except in conformance with legal authorization, such as pre-treatment permits and National Pollutant Discharge Elimination System permits, issued by federal, state and local governmental agencies. National Pollutant Discharge Elimination System permits and analogous water discharge permits are valid for a maximum of five years and must be renewed.
Compliance with current and future environmental regulations is not expected to require material capital expenditures through 2018.
Discontinued OperationsGeneral Discontinued operations includes the results of Fidelity other than certain general and administrative costs and interest expense. In the third and fourth quarters of 2015 and the first quarter of 2016, the Company entered into purchase and sale agreements to sell the vast majority of Fidelity's assets, comprising greater than 93 percent of total production for 2014. The completion of the majority of these sales occurred in the fourth quarter of 2015 and the Company continues to market the remaining assets of Fidelity. For more information on discontinued operations, see Item 8 - Note 2 and Supplementary Financial Information.
For information regarding litigation from discontinued operations, see Item 8 - Note 17.
Item 1A. Risk Factors
The Company's business and financial results are subject to a number of risks and uncertainties, including those set forth below and in other documents that it files with the SEC. The factors and the other matters discussed herein are important factors that could cause actual results or outcomes for the Company to differ materially from those discussed in the forward-looking statements included elsewhere in this document.
Part I
MDU Resources Group, Inc. Form 10-K 19
Economic RisksThe Company's pipeline and midstream and refining businesses are dependent on factors, including commodity prices and commodity price basis differentials/crack spreads, that are subject to various external influences that cannot be controlled.
These factors include: fluctuations in oil, NGL and natural gas production and prices; fluctuations in commodity price basis differentials/crack spreads; domestic and foreign supplies of oil, NGL and natural gas; political and economic conditions in oil producing countries; actions of the Organization of Petroleum Exporting Countries; and other risks incidental to the development and operations of oil and natural gas processing plants, pipeline systems and the refinery. Continued prolonged depressed prices for oil, NGL and natural gas could impede the growth of our pipeline and midstream business, and could negatively affect the results of operations, cash flows and asset values of the Company's pipeline and midstream and refining businesses.
The regulatory approval, permitting, construction, startup and/or operation of power generation facilities may involve unanticipated events or delays that could negatively impact the Company's business and its results of operations and cash flows.
The construction, startup and operation of power generation facilities involve many risks, which may include: delays; breakdown or failure of equipment; inability to obtain required governmental permits and approvals; inability to complete financing; inability to negotiate acceptable equipment acquisition, construction, fuel supply, off-take, transmission, transportation or other material agreements; changes in markets and market prices for power; cost increases and overruns; the risk of performance below expected levels of output or efficiency; and the inability to obtain full cost recovery in regulated rates. Such unanticipated events could negatively impact the Company's business, its results of operations and cash flows.
The operation of Dakota Prairie Refinery may involve events that could negatively impact the Company's business, its results of operations, cash flows and asset values.
The operation of Dakota Prairie Refinery involves many risks, which may include: breakdown or failure of the equipment and systems; inability to operate within environmental permit parameters; inability to produce refined products to required specifications; inability to obtain crude oil supply; inability to effectively manage distribution channels; changes in markets and market prices for crude oil and refined products; operating cost increases; and the inability of Dakota Prairie Refinery to fund its operations from its operating cash flows, by obtaining third-party financing or through capital contributions from Calumet or WBI Energy; as well as the risk of performance below expected levels of output or efficiency. Such events, as well as continued operating losses at Dakota Prairie Refinery, could negatively impact the Company's business, its results of operations, cash flows and asset values.
Economic volatility, including volatility in North Dakota's Bakken region, affects the Company's operations, as well as the demand for its products and services and the value of its investments and investment returns including its pension and other postretirement benefit plans, and may have a negative impact on the Company's future revenues and cash flows.
The global demand and price volatility for natural resources, interest rate changes, governmental budget constraints and the ongoing threat of terrorism can create volatility in the financial markets. Unfavorable economic conditions can negatively affect the level of public and private expenditures on projects and the timing of these projects which, in turn, can negatively affect the demand for the Company's products and services, primarily at the Company's construction businesses. The level of demand for construction products and services could be adversely impacted by the economic conditions in the industries the Company serves, as well as in the economy in general. State and federal budget issues may negatively affect the funding available for infrastructure spending. The ability of the Company's electric and natural gas distribution businesses to grow service territory and customer base is affected by the economic environments of the markets served. This economic volatility could have a material adverse effect on the Company's results of operations, cash flows and asset values.
Changing market conditions could negatively affect the market value of assets held in the Company's pension and other postretirement benefit plans and may increase the amount and accelerate the timing of required funding contributions.
The Company relies on financing sources and capital markets. Access to these markets may be adversely affected by factors beyond the Company's control. If the Company is unable to obtain economic financing in the future, the Company's ability to execute its business plans, make capital expenditures or pursue acquisitions that the Company may otherwise rely on for future growth could be impaired. As a result, the market value of the Company's common stock may be adversely affected. If the Company issues a substantial amount of common stock it could have a dilutive effect on its existing shareholders.
The Company relies on access to short-term borrowings, including the issuance of commercial paper, long-term capital markets and asset sales as sources of liquidity for capital requirements not satisfied by its cash flow from operations. If the Company is not able to access capital at competitive rates, the ability to implement its business plans may be adversely affected. Market disruptions or a downgrade of the
Part I
20 MDU Resources Group, Inc. Form 10-K
Company's credit ratings may increase the cost of borrowing or adversely affect its ability to access one or more financial markets. Such disruptions could include:
• A severe prolonged economic downturn
• The bankruptcy of unrelated industry leaders in the same line of business
• Deterioration in capital market conditions
• Turmoil in the financial services industry
• Volatility in commodity prices
• Terrorist attacks
• Cyber attacks
Economic turmoil, market disruptions and volatility in the securities trading markets, as well as other factors including changes in the Company's results of operations, financial position and prospects, may adversely affect the market price of the Company's common stock.
The Company currently has a shelf registration statement on file with the SEC, under which the Company may issue and sell any combination of common stock and debt securities. The issuance of a substantial amount of the Company's common stock, whether sold pursuant to the registration statement, issued in connection with an acquisition or otherwise, or the perception that such an issuance could occur, may adversely affect the market price of the Company's common stock.
The Company is exposed to credit risk and the risk of loss resulting from the nonpayment and/or nonperformance by the Company's customers and counterparties.
If the Company's customers or counterparties were to experience financial difficulties or file for bankruptcy, the Company could experience difficulty in collecting receivables. The nonpayment and/or nonperformance by the Company's customers and counterparties could have a negative impact on the Company's results of operations and cash flows.
The backlogs at the Company's construction materials and contracting and construction services businesses are subject to delay or cancellation and may not be realized.
Backlog consists of the uncompleted portion of services to be performed under job-specific contracts. Contracts are subject to delay, default or cancellation and the contracts in the Company's backlog are subject to changes in the scope of services to be provided as well as adjustments to the costs relating to the applicable contracts. Backlog may also be affected by project delays or cancellations resulting from weather conditions, external market factors and economic factors beyond the Company's control. Accordingly, there is no assurance that backlog will be realized.
Environmental and Regulatory RisksThe Company's operations are subject to environmental laws and regulations that may increase costs of operations, impact or limit business plans, or expose the Company to environmental liabilities.
The Company is subject to environmental laws and regulations affecting many aspects of its operations, including air quality, water quality, waste management and other environmental considerations. These laws and regulations can increase capital, operating and other costs, cause delays as a result of litigation and administrative proceedings, and create compliance, remediation, containment, monitoring and reporting obligations, particularly relating to electric generation operations and oil and natural gas processing. These laws and regulations generally require the Company to obtain and comply with a wide variety of environmental licenses, permits, inspections and other approvals. Although the Company strives to comply with all applicable environmental laws and regulations, public and private entities and private individuals may interpret the Company's legal or regulatory requirements differently and seek injunctive relief or other remedies against the Company. The Company cannot predict the outcome (financial or operational) of any such litigation or administrative proceedings.
Existing environmental laws and regulations may be revised and new laws and regulations seeking to protect the environment may be adopted or become applicable to the Company. These laws and regulations could require the Company to limit the use or output of certain facilities, restrict the use of certain fuels, retire and replace certain facilities, install pollution controls, remediate environmental impacts, remove or reduce environmental hazards, or forego or limit the development of resources. Revised or new laws and regulations that increase compliance costs or restrict operations, particularly if costs are not fully recoverable from customers, could have a material adverse effect on the Company's results of operations and cash flows.
On April 17, 2015, the EPA published a final rule, under the RCRA, for coal combustion residuals that regulates coal ash as a solid waste and not a hazardous waste. The rule requires ground water and location restriction evaluations be conducted by October 2017 at ash
Part I
MDU Resources Group, Inc. Form 10-K 21
impoundments and landfills not located at coal mines. In 2015, one ash impoundment at Lewis & Clark Station was replaced with a new concrete basin. Additional site and groundwater analyses may identify the need to upgrade or close additional impoundments or the Company may need to install replacement ash management systems. The cost of replacement ash impoundments or landfills may be material. If these costs are not fully recoverable from customers, they could have a material adverse effect on the Company's results of operations and cash flows.
On August 15, 2014, the EPA published a final rule under Section 316(b) of the Clean Water Act, establishing requirements for water intake structures at existing steam electric generating facilities. The purpose of the rule is to reduce impingement and entrainment of fish and other aquatic organisms at cooling water intake structures. The majority of the Company's electric generating facilities are either not subject to the rule or have completed studies that project compliance expenditures are not material. The Lewis & Clark Station will complete a study that will be submitted to the Montana DEQ by July 31, 2019, to be used in determining any required controls. It is unknown at this time what controls may be required or if compliance costs will be material. The installation schedule for any required controls would be established with the permitting agency after the study is completed.
Initiatives to reduce GHG emissions could adversely impact the Company's operations.
Concern that GHG emissions are contributing to global climate change has led to international, federal and state legislative and regulatory proposals to reduce or mitigate the effects of GHG emissions. On October 23, 2015, the EPA published the final rule establishing carbon dioxide emission limits for new, reconstructed and modified coal-fired steam electric generating units. In this same rule, the EPA established carbon dioxide emission limits for new and reconstructed base load and non-base load stationary combustion turbines. At this time, the EPA has determined not to establish emission limits for modified stationary combustion turbines and has withdrawn the proposed rule emission standards for modified stationary combustion turbines. New coal-fired generating units must comply with an emission standard of 1,400 pounds of carbon dioxide per MW hour gross, equivalent to a super critical pulverized coal unit capturing about 20 percent of its carbon dioxide emissions. Unless carbon capture and storage technology becomes available and cost effective, no new coal-fired electric generating facilities are projected to be constructed. Limits for reconstructed and modified coal-fired generating units may preclude reconstruction or modification depending on the facility. New and reconstructed base load stationary natural gas-fired combustion turbines must comply with an emission standard of 1,000 pounds of carbon dioxide per MW hour gross which should be achievable, but could limit operating at higher load levels, depending on the unit. For newly constructed and reconstructed non-base load (peaking) natural gas-fired stationary combustion turbines, the EPA has established a heat input-based emission standard of 120 pounds of carbon dioxide per MMBtu.
On October 23, 2015, the EPA published the final Clean Power Plan rule which requires existing fossil fuel-fired electric generation facilities to reduce carbon dioxide emissions. By September 6, 2016, states must either submit to the EPA a request for an extension to submit a final state plan by September 6, 2018, or submit a final plan. The state plan must demonstrate how emissions reductions will be achieved and include emission limits in the form of an annual emission cap or an emission rate that will be applied to each individual fossil fuel-fired electric generating facility starting in 2022. Emissions limits become more stringent from 2022 to 2030, with the 2030 emission limits applying thereafter. It is unknown at this time what each state will require for emissions limits or reductions from each of Montana-Dakota's owned and jointly owned fossil fuel-fired electric generating units. Compliance costs will become clearer as final state plans are completed and submitted to the EPA by September 6, 2018. On February 9, 2016, the United States Supreme Court granted an application for a stay of the Clean Power Plan pending disposition of the applicants' petition for review in the D.C. Circuit Court and disposition of the applicants' petition for a writ of certiorari if such a writ is sought.
The Company’s primary GHG emission is carbon dioxide from fossil fuels combustion at Montana-Dakota's electric generating facilities, particularly its coal-fired facilities. Approximately 50 percent of Montana-Dakota's owned generating capacity and approximately 90 percent of the electricity it generated in 2015 was from coal-fired facilities.
On January 14, 2015, President Obama announced a goal to reduce methane emissions from the oil and natural gas industry by 40 to 45 percent below 2012 levels by 2025. On September 18, 2015, the EPA published a proposed rule on standards for methane and GHG emissions from new and modified sources within the oil and natural gas industry, with a final rule expected in 2016. The rule, as proposed, would require emission reductions and work practices for sources such as gathering and boosting stations, and transmission and storage compressor stations. The president will continue to evaluate further methods of methane reduction including additional leak detection controls and emission reporting, enhanced venting and flaring requirements for sources on public lands, and upgrades to existing natural gas transmission and distribution infrastructure. It is unknown at this time how the Company will be impacted or if compliance costs will be material.
On January 6, 2016, the Washington DOE issued the proposed Clean Air Rule, a rule requiring reductions of carbon dioxide emissions from various industries, including carbon dioxide emissions resulting from the combustion of natural gas supplied to end-use customers by natural gas distribution companies, such as Cascade. The rule requires reductions in carbon dioxide emissions resulting from the
Part I
22 MDU Resources Group, Inc. Form 10-K
combustion of natural gas Cascade supplies to the majority of its customers. In 2017, the rule requires Cascade to hold carbon dioxide emissions to a baseline, equal to the average emissions in 2012 to 2016. Beginning in 2018, annual carbon dioxide emissions would be reduced by an additional one and two-thirds percent of the baseline from the previous year's emissions. Washington DOE proposes compliance to be achieved through emissions credit purchases using existing trading markets or by funding end-use energy efficiency projects that would reduce natural gas usage, increasing the operating costs for Cascade. If Cascade could not receive timely and full recovery of compliance costs from its customers, such costs could adversely impact the results of its operations.
There also may be new treaties, legislation or regulations to reduce GHG emissions that could affect Montana-Dakota's electric utility operations by requiring additional energy conservation efforts or renewable energy sources, as well as other mandates that could significantly increase capital expenditures and operating costs. If Montana-Dakota does not receive timely and full recovery of GHG emission compliance costs from its customers, then such costs could adversely impact the results of its operations.
In addition to Montana-Dakota's electric generation operations, the GHG emissions from the Company's other operations are monitored, analyzed and reported as required by applicable laws and regulations. The Company monitors GHG regulations and the potential for GHG regulations to impact operations.
Due to the uncertain availability of technologies to control GHG emissions and the unknown obligations that potential GHG emission legislation or regulations may create, the Company cannot determine the potential financial impact on its operations.
The Company is subject to government regulations that may delay and/or have a negative impact on its business and its results of operations and cash flows. Statutory and regulatory requirements also may limit another party's ability to acquire the Company or impose conditions on an acquisition of or by the Company.
The Company is subject to regulation or governmental actions by federal, state and local regulatory agencies with respect to, among other things, allowed rates of return and recovery of investment and cost, financing, rate structures, health care coverage and cost, taxes, franchises and recovery of purchased power and purchased gas costs. These governmental regulations significantly influence the Company's operating environment and may affect its ability to recover costs from its customers. The Company is unable to predict the impact on operating results from the future regulatory activities of any of these agencies. Changes in regulations or the imposition of additional regulations could have an adverse impact on the Company's results of operations and cash flows. Approval from a number of federal and state regulatory agencies would need to be obtained by any potential acquirer of the Company as well as for acquisitions by the Company. The approval process could be lengthy and the outcome uncertain.
Other RisksWeather conditions can adversely affect the Company's operations, and revenues and cash flows.
The Company's results of operations can be affected by changes in the weather. Weather conditions influence the demand for electricity and natural gas, affect the price of energy commodities, affect the ability to perform services at the construction materials and contracting and construction services businesses and affect ongoing operation and maintenance and construction activities for the pipeline and midstream and refining businesses. In addition, severe weather can be destructive, causing outages, and/or property damage, which could require additional costs to be incurred. As a result, adverse weather conditions could negatively affect the Company's results of operations, financial position and cash flows.
Competition exists in all of the Company's businesses.
All of the Company's businesses are subject to competition. Construction services' competition is based primarily on price and reputation for quality, safety and reliability. Construction materials products are marketed under highly competitive conditions and are subject to such competitive forces as price, service, delivery time and proximity to the customer. The electric utility and natural gas industries also are experiencing increased competitive pressures as a result of consumer demands, technological advances and other factors. The pipeline and midstream business competes with several pipelines for access to natural gas supplies and gathering, transportation and storage business. The refining business competes with larger and more diverse refineries that may be better positioned to withstand volatile industry and pricing conditions. Competition could negatively affect the Company's results of operations, financial position and cash flows.
The Company could be subject to limitations on its ability to pay dividends.
The Company depends on earnings from its divisions and dividends from its subsidiaries to pay dividends on its common stock. Regulatory, contractual and legal limitations, as well as capital requirements and the Company's financial performance or cash flows, could limit the earnings of the Company's divisions and subsidiaries which, in turn, could restrict the Company's ability to pay dividends on its common stock and adversely affect the Company's stock price.
Part I
MDU Resources Group, Inc. Form 10-K 23
Cost increases related to obligations under MEPPs could have a material negative effect on the Company's results of operations and cash flows.
Various operating subsidiaries of the Company participate in approximately 85 MEPPs for employees represented by certain unions. The Company is required to make contributions to these plans in amounts established under numerous collective bargaining agreements between the operating subsidiaries and those unions.
The Company may be obligated to increase its contributions to underfunded plans that are classified as being in endangered, seriously endangered or critical status as defined by the Pension Protection Act of 2006. Plans classified as being in one of these statuses are required to adopt RPs or FIPs to improve their funded status through increased contributions, reduced benefits or a combination of the two. Based on available information, the Company believes that approximately 40 percent of the MEPPs to which it contributes are currently in endangered, seriously endangered or critical status.
The Company may also be required to increase its contributions to MEPPs where the other participating employers in such plans withdraw from the plan and are not able to contribute an amount sufficient to fund the unfunded liabilities associated with their participants in the plans. The amount and timing of any increase in the Company's required contributions to MEPPs may also depend upon one or more of the following factors including the outcome of collective bargaining, actions taken by trustees who manage the plans, actions taken by the plans' other participating employers, the industry for which contributions are made, future determinations that additional plans reach endangered, seriously endangered or critical status, government regulations and the actual return on assets held in the plans, among others. The Company may experience increased operating expenses as a result of the required contributions to MEPPs, which may have a material adverse effect on the Company's results of operations, financial position or cash flows.
In addition, pursuant to ERISA, as amended by MPPAA, the Company could incur a partial or complete withdrawal liability upon withdrawing from a plan, exiting a market in which it does business with a union workforce or upon termination of a plan to the extent these plans are underfunded.
On September 24, 2014, Knife River provided notice to the plan administrator of one of the MEPPs to which it is a participating employer that it was withdrawing from that plan effective October 26, 2014. The plan administrator will determine Knife River’s withdrawal liability, which the Company currently estimates at approximately $16.4 million (approximately $9.8 million after tax). The assessed withdrawal liability for this plan may be significantly different from the current estimate.
The Company's operations may be negatively impacted by cyber attacks or acts of terrorism.
The Company operates in industries that require continual operation of sophisticated information technology systems and network infrastructure. While the Company has developed procedures and processes that are designed to strengthen and protect these systems, they may be vulnerable to failures or unauthorized access due to hacking, theft, sabotage, viruses, acts of terrorism, acts of war or other causes. If the technology systems were to fail or be breached and these systems were not recovered in a timely manner, the Company's operational systems and infrastructure, such as the Company's electric generation, transmission and distribution facilities and its oil and natural gas processing facilities, storage and pipeline systems, may be unable to fulfill critical business functions, including an inability to produce or distribute some part of our energy services and other products and the provision of service to customers. Such disruption could result in decreased revenues and/or significant remediation costs which could have a material adverse effect on the Company's results of operations, financial position and cash flows. Additionally, because generation, transmission systems and gas pipelines are part of an interconnected system with other operators, a disruption elsewhere in the system could negatively impact the Company's business.
The Company's business requires access to sensitive customer, employee, shareholder and Company data in the ordinary course of business. Despite the Company's implementation of security measures, a failure or breach of a security system could compromise sensitive and confidential information and data. Such an event could result in negative publicity and reputational harm, remediation costs and possible legal claims and fines which could adversely affect the Company's financial results, notwithstanding the purchase of cyber risk insurance. The Company's third-party service providers that perform critical business functions or have access to sensitive and confidential information and data may also be vulnerable to security breaches and other risks that could have an adverse effect on the Company.
While the Company has completed the sale of the majority of Fidelity's assets and is currently marketing the remaining assets of Fidelity, there is no assurance that a sale of the remaining marketed assets will be successful, and Fidelity may continue to be subject to potential liabilities relating to the sold assets arising from events prior to sale.
As part of the Company’s corporate strategy, it sold the majority of its Fidelity assets, and is currently marketing the remaining assets and will exit that line of business. Such a disposition of the remaining assets is subject to various risks, including: the purchase and sale agreements may be terminated prior to closing as a result of the due diligence process or due to inability of the purchasers to obtain financing; suitable purchasers may not be available or willing to purchase the remaining assets on terms and conditions acceptable to the
Part I
24 MDU Resources Group, Inc. Form 10-K
Company; the agreements pursuant to which the Company divests the assets may contain continuing indemnification obligations; the Company may incur costs in connection with the marketing and sale of the assets; there could be tax consequences dependent on the nature of the sale; and the Company may be required to record additional fair value impairment charges that could have an adverse effect on the Company’s financial condition. Fidelity will also continue to be subject to potential liabilities, either directly or through indemnification of buyers, for potential liabilities relating to the sold assets arising from events prior to sale.
Other factors that could impact the Company's businesses.
The following are other factors that should be considered for a better understanding of the financial condition of the Company. These other factors may impact the Company's financial results in future periods.
• Acquisition, disposal and impairments of assets or facilities
• Changes in operation, performance and construction of plant facilities or other assets
• Changes in present or prospective generation
• The ability to obtain adequate and timely cost recovery for the Company's regulated operations through regulatory proceedings
• The availability of economic expansion or development opportunities
• Population growth rates and demographic patterns
• Market demand for, available supplies of, and/or costs of, energy- and construction-related products and services
• The cyclical nature of large construction projects at certain operations
• Changes in tax rates or policies
• Unanticipated project delays or changes in project costs, including related energy costs
• Unanticipated changes in operating expenses or capital expenditures
• Labor negotiations or disputes
• Inability of contract counterparties to meet their contractual obligations
• Changes in accounting principles and/or the application of such principles to the Company
• Changes in technology
• Changes in legal or regulatory proceedings
• The ability to effectively integrate the operations and the internal controls of acquired companies
• The ability to attract and retain skilled labor and key personnel
• Increases in employee and retiree benefit costs and funding requirements
Item 1B. Unresolved Staff Comments
The Company has no unresolved comments with the SEC.
Item 3. Legal Proceedings
For information regarding legal proceedings, see Item 8 - Note 17, which is incorporated herein by reference.
Item 4. Mine Safety Disclosures
For information regarding mine safety violations or other regulatory matters required by Section 1503(a) of the Dodd-Frank Act and Item 104 of Regulation S-K, see Exhibit 95 to this Form 10-K, which is incorporated herein by reference.
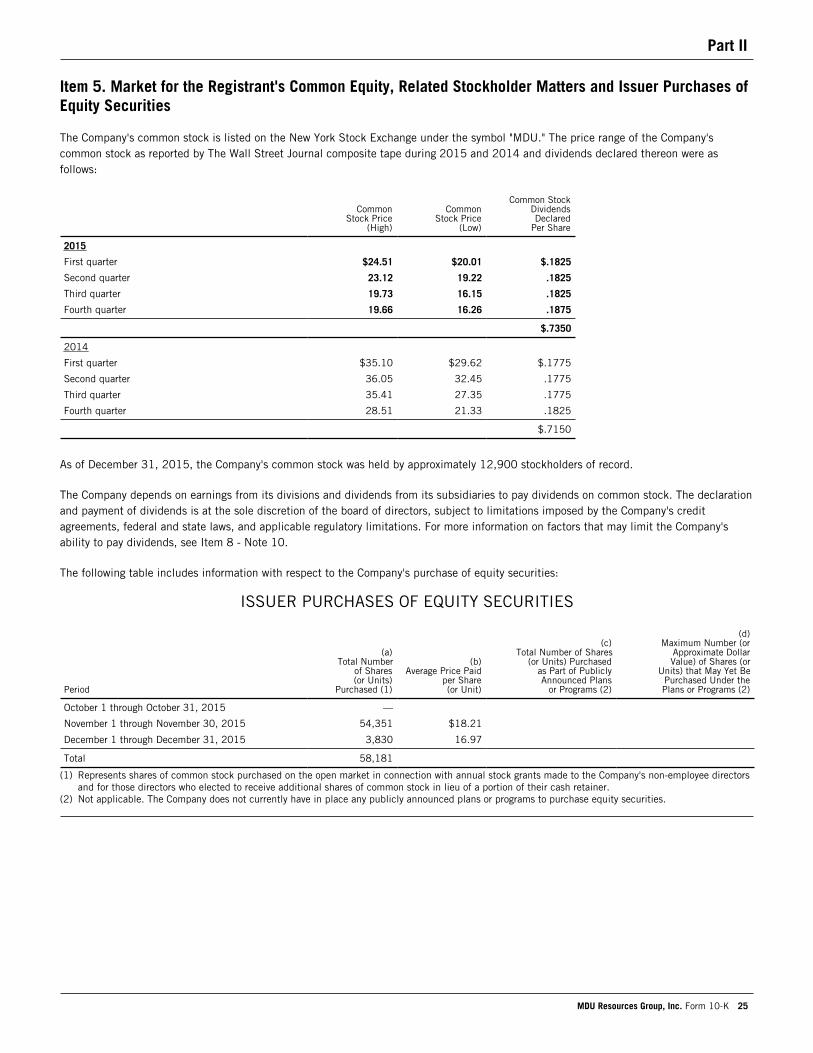
Part II
MDU Resources Group, Inc. Form 10-K 25
Item 5. Market for the Registrant's Common Equity, Related Stockholder Matters and Issuer Purchases of Equity Securities
The Company's common stock is listed on the New York Stock Exchange under the symbol "MDU." The price range of the Company's common stock as reported by The Wall Street Journal composite tape during 2015 and 2014 and dividends declared thereon were as follows:
Common
Stock Price(High)
CommonStock Price
(Low)
Common Stock DividendsDeclared
Per Share
2015
First quarter $24.51 $20.01 $.1825
Second quarter 23.12 19.22 .1825
Third quarter 19.73 16.15 .1825
Fourth quarter 19.66 16.26 .1875
$.7350
2014
First quarter $35.10 $29.62 $.1775
Second quarter 36.05 32.45 .1775
Third quarter 35.41 27.35 .1775
Fourth quarter 28.51 21.33 .1825
$.7150
As of December 31, 2015, the Company's common stock was held by approximately 12,900 stockholders of record.
The Company depends on earnings from its divisions and dividends from its subsidiaries to pay dividends on common stock. The declaration and payment of dividends is at the sole discretion of the board of directors, subject to limitations imposed by the Company's credit agreements, federal and state laws, and applicable regulatory limitations. For more information on factors that may limit the Company's ability to pay dividends, see Item 8 - Note 10.
The following table includes information with respect to the Company's purchase of equity securities:
ISSUER PURCHASES OF EQUITY SECURITIES
Period
(a)Total Number
of Shares(or Units)
Purchased (1)
(b) Average Price Paid
per Share(or Unit)
(c)Total Number of Shares
(or Units) Purchasedas Part of PubliclyAnnounced Plans
or Programs (2)
(d)Maximum Number (or
Approximate Dollar Value) of Shares (or
Units) that May Yet BePurchased Under thePlans or Programs (2)
October 1 through October 31, 2015 —
November 1 through November 30, 2015 54,351 $18.21
December 1 through December 31, 2015 3,830 16.97
Total 58,181
(1) Represents shares of common stock purchased on the open market in connection with annual stock grants made to the Company's non-employee directors and for those directors who elected to receive additional shares of common stock in lieu of a portion of their cash retainer.
(2) Not applicable. The Company does not currently have in place any publicly announced plans or programs to purchase equity securities.
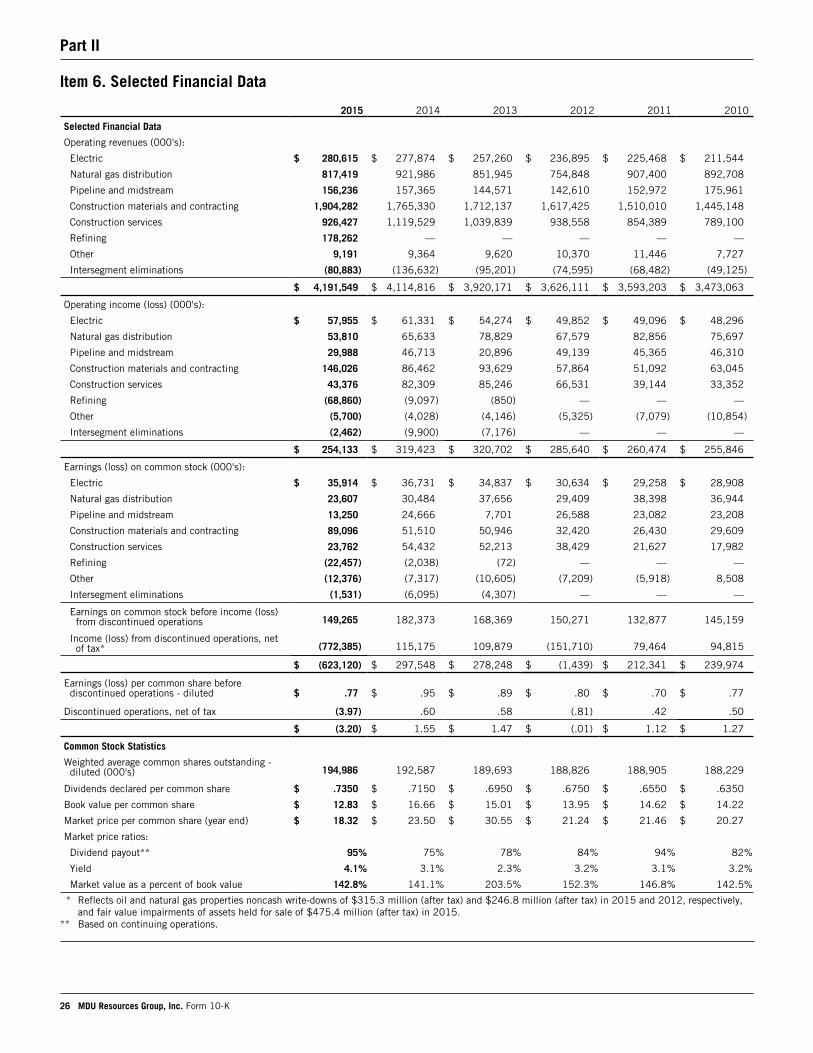
Part II
26 MDU Resources Group, Inc. Form 10-K
Item 6. Selected Financial Data
2015 2014 2013 2012 2011 2010
Selected Financial Data
Operating revenues (000's):
Electric $ 280,615 $ 277,874 $ 257,260 $ 236,895 $ 225,468 $ 211,544
Natural gas distribution 817,419 921,986 851,945 754,848 907,400 892,708
Pipeline and midstream 156,236 157,365 144,571 142,610 152,972 175,961
Construction materials and contracting 1,904,282 1,765,330 1,712,137 1,617,425 1,510,010 1,445,148
Construction services 926,427 1,119,529 1,039,839 938,558 854,389 789,100
Refining 178,262 — — — — —
Other 9,191 9,364 9,620 10,370 11,446 7,727
Intersegment eliminations (80,883) (136,632) (95,201) (74,595) (68,482) (49,125)
$ 4,191,549 $ 4,114,816 $ 3,920,171 $ 3,626,111 $ 3,593,203 $ 3,473,063
Operating income (loss) (000's):
Electric $ 57,955 $ 61,331 $ 54,274 $ 49,852 $ 49,096 $ 48,296
Natural gas distribution 53,810 65,633 78,829 67,579 82,856 75,697
Pipeline and midstream 29,988 46,713 20,896 49,139 45,365 46,310
Construction materials and contracting 146,026 86,462 93,629 57,864 51,092 63,045
Construction services 43,376 82,309 85,246 66,531 39,144 33,352
Refining (68,860) (9,097) (850) — — —
Other (5,700) (4,028) (4,146) (5,325) (7,079) (10,854)
Intersegment eliminations (2,462) (9,900) (7,176) — — —
$ 254,133 $ 319,423 $ 320,702 $ 285,640 $ 260,474 $ 255,846
Earnings (loss) on common stock (000's):
Electric $ 35,914 $ 36,731 $ 34,837 $ 30,634 $ 29,258 $ 28,908
Natural gas distribution 23,607 30,484 37,656 29,409 38,398 36,944
Pipeline and midstream 13,250 24,666 7,701 26,588 23,082 23,208
Construction materials and contracting 89,096 51,510 50,946 32,420 26,430 29,609
Construction services 23,762 54,432 52,213 38,429 21,627 17,982
Refining (22,457) (2,038) (72) — — —
Other (12,376) (7,317) (10,605) (7,209) (5,918) 8,508
Intersegment eliminations (1,531) (6,095) (4,307) — — —
Earnings on common stock before income (loss)from discontinued operations 149,265 182,373 168,369 150,271 132,877 145,159
Income (loss) from discontinued operations, netof tax* (772,385) 115,175 109,879 (151,710) 79,464 94,815
$ (623,120) $ 297,548 $ 278,248 $ (1,439) $ 212,341 $ 239,974
Earnings (loss) per common share beforediscontinued operations - diluted $ .77 $ .95 $ .89 $ .80 $ .70 $ .77
Discontinued operations, net of tax (3.97) .60 .58 (.81) .42 .50
$ (3.20) $ 1.55 $ 1.47 $ (.01) $ 1.12 $ 1.27
Common Stock Statistics
Weighted average common shares outstanding -diluted (000's) 194,986 192,587 189,693 188,826 188,905 188,229
Dividends declared per common share $ .7350 $ .7150 $ .6950 $ .6750 $ .6550 $ .6350
Book value per common share $ 12.83 $ 16.66 $ 15.01 $ 13.95 $ 14.62 $ 14.22
Market price per common share (year end) $ 18.32 $ 23.50 $ 30.55 $ 21.24 $ 21.46 $ 20.27
Market price ratios:
Dividend payout** 95% 75% 78% 84% 94% 82%
Yield 4.1% 3.1% 2.3% 3.2% 3.1% 3.2%
Market value as a percent of book value 142.8% 141.1% 203.5% 152.3% 146.8% 142.5%
* Reflects oil and natural gas properties noncash write-downs of $315.3 million (after tax) and $246.8 million (after tax) in 2015 and 2012, respectively, and fair value impairments of assets held for sale of $475.4 million (after tax) in 2015.
** Based on continuing operations.
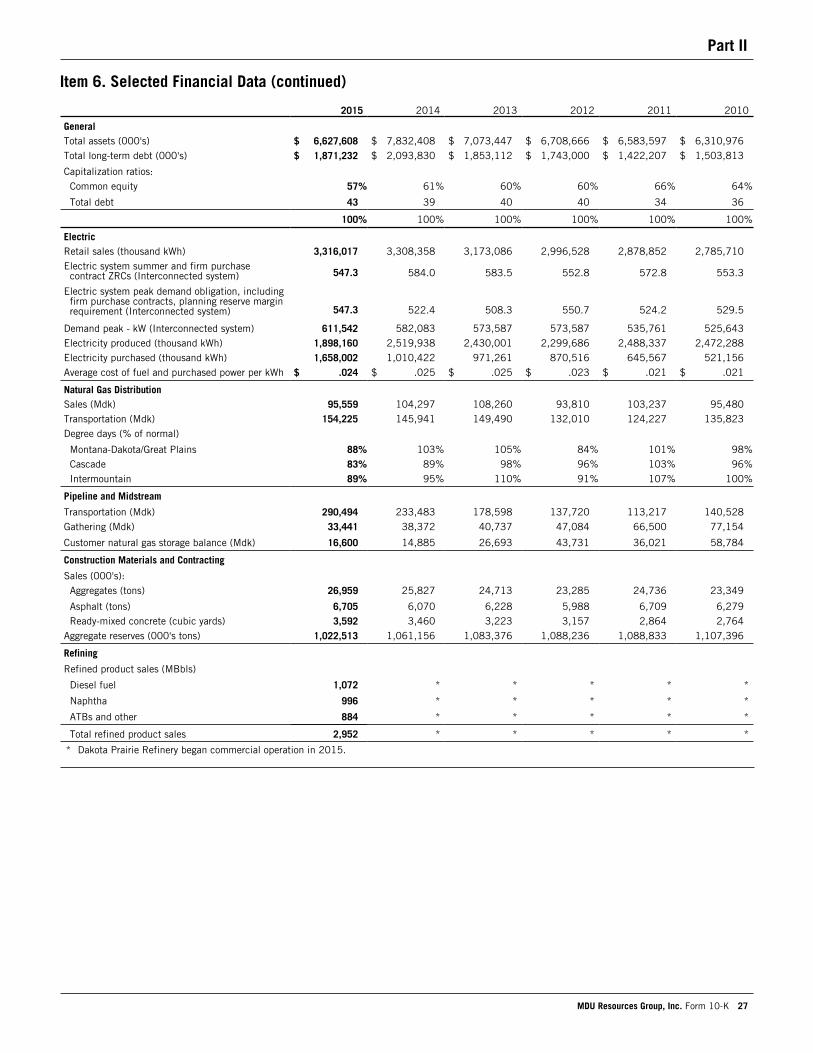
Part II
MDU Resources Group, Inc. Form 10-K 27
Item 6. Selected Financial Data (continued)
2015 2014 2013 2012 2011 2010
GeneralTotal assets (000's) $ 6,627,608 $ 7,832,408 $ 7,073,447 $ 6,708,666 $ 6,583,597 $ 6,310,976Total long-term debt (000's) $ 1,871,232 $ 2,093,830 $ 1,853,112 $ 1,743,000 $ 1,422,207 $ 1,503,813
Capitalization ratios:Common equity 57% 61% 60% 60% 66% 64%
Total debt 43 39 40 40 34 36
100% 100% 100% 100% 100% 100%
ElectricRetail sales (thousand kWh) 3,316,017 3,308,358 3,173,086 2,996,528 2,878,852 2,785,710Electric system summer and firm purchasecontract ZRCs (Interconnected system) 547.3 584.0 583.5 552.8 572.8 553.3
Electric system peak demand obligation, includingfirm purchase contracts, planning reserve marginrequirement (Interconnected system) 547.3 522.4 508.3 550.7 524.2 529.5
Demand peak - kW (Interconnected system) 611,542 582,083 573,587 573,587 535,761 525,643Electricity produced (thousand kWh) 1,898,160 2,519,938 2,430,001 2,299,686 2,488,337 2,472,288Electricity purchased (thousand kWh) 1,658,002 1,010,422 971,261 870,516 645,567 521,156Average cost of fuel and purchased power per kWh $ .024 $ .025 $ .025 $ .023 $ .021 $ .021
Natural Gas DistributionSales (Mdk) 95,559 104,297 108,260 93,810 103,237 95,480Transportation (Mdk) 154,225 145,941 149,490 132,010 124,227 135,823Degree days (% of normal)
Montana-Dakota/Great Plains 88% 103% 105% 84% 101% 98%Cascade 83% 89% 98% 96% 103% 96%Intermountain 89% 95% 110% 91% 107% 100%
Pipeline and Midstream
Transportation (Mdk) 290,494 233,483 178,598 137,720 113,217 140,528Gathering (Mdk) 33,441 38,372 40,737 47,084 66,500 77,154
Customer natural gas storage balance (Mdk) 16,600 14,885 26,693 43,731 36,021 58,784
Construction Materials and Contracting
Sales (000's):Aggregates (tons) 26,959 25,827 24,713 23,285 24,736 23,349
Asphalt (tons) 6,705 6,070 6,228 5,988 6,709 6,279Ready-mixed concrete (cubic yards) 3,592 3,460 3,223 3,157 2,864 2,764
Aggregate reserves (000's tons) 1,022,513 1,061,156 1,083,376 1,088,236 1,088,833 1,107,396
Refining
Refined product sales (MBbls)
Diesel fuel 1,072 * * * * *
Naphtha 996 * * * * *
ATBs and other 884 * * * * *
Total refined product sales 2,952 * * * * *
* Dakota Prairie Refinery began commercial operation in 2015.
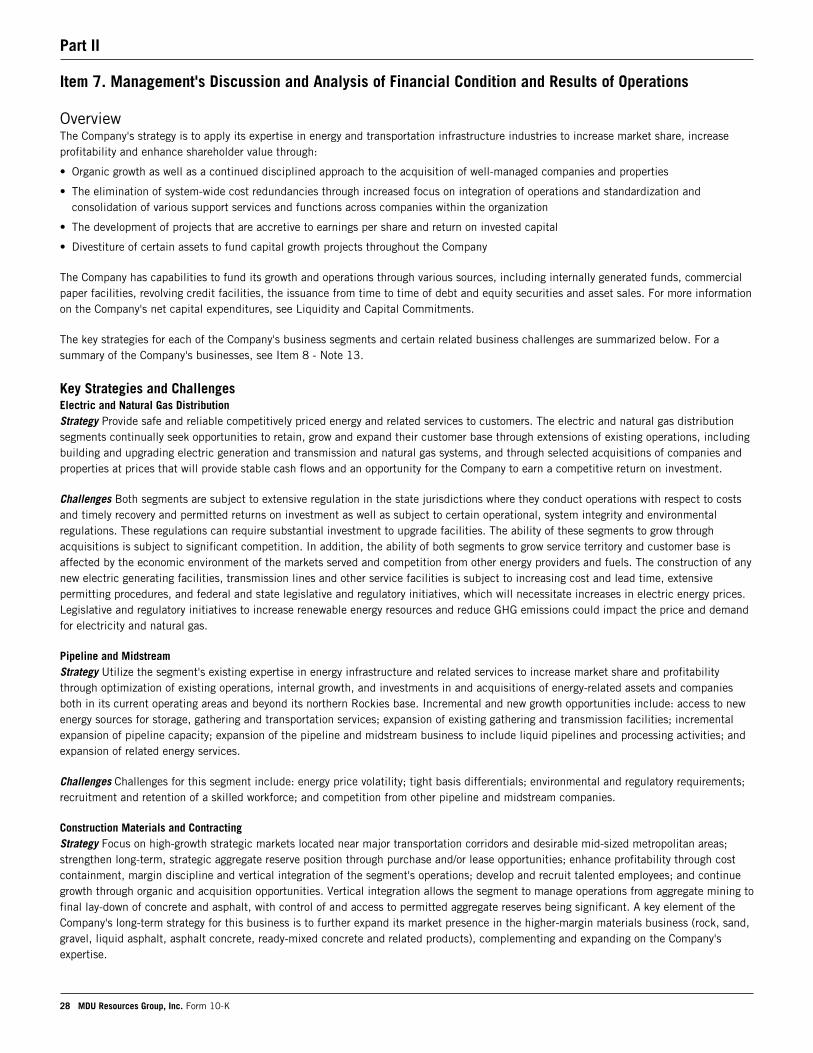
Part II
28 MDU Resources Group, Inc. Form 10-K
Item 7. Management's Discussion and Analysis of Financial Condition and Results of Operations
OverviewThe Company's strategy is to apply its expertise in energy and transportation infrastructure industries to increase market share, increase profitability and enhance shareholder value through:
• Organic growth as well as a continued disciplined approach to the acquisition of well-managed companies and properties
• The elimination of system-wide cost redundancies through increased focus on integration of operations and standardization and consolidation of various support services and functions across companies within the organization
• The development of projects that are accretive to earnings per share and return on invested capital
• Divestiture of certain assets to fund capital growth projects throughout the Company
The Company has capabilities to fund its growth and operations through various sources, including internally generated funds, commercial paper facilities, revolving credit facilities, the issuance from time to time of debt and equity securities and asset sales. For more information on the Company's net capital expenditures, see Liquidity and Capital Commitments.
The key strategies for each of the Company's business segments and certain related business challenges are summarized below. For a summary of the Company's businesses, see Item 8 - Note 13.
Key Strategies and ChallengesElectric and Natural Gas DistributionStrategy Provide safe and reliable competitively priced energy and related services to customers. The electric and natural gas distribution segments continually seek opportunities to retain, grow and expand their customer base through extensions of existing operations, including building and upgrading electric generation and transmission and natural gas systems, and through selected acquisitions of companies and properties at prices that will provide stable cash flows and an opportunity for the Company to earn a competitive return on investment.
Challenges Both segments are subject to extensive regulation in the state jurisdictions where they conduct operations with respect to costs and timely recovery and permitted returns on investment as well as subject to certain operational, system integrity and environmental regulations. These regulations can require substantial investment to upgrade facilities. The ability of these segments to grow through acquisitions is subject to significant competition. In addition, the ability of both segments to grow service territory and customer base is affected by the economic environment of the markets served and competition from other energy providers and fuels. The construction of any new electric generating facilities, transmission lines and other service facilities is subject to increasing cost and lead time, extensive permitting procedures, and federal and state legislative and regulatory initiatives, which will necessitate increases in electric energy prices. Legislative and regulatory initiatives to increase renewable energy resources and reduce GHG emissions could impact the price and demand for electricity and natural gas.
Pipeline and MidstreamStrategy Utilize the segment's existing expertise in energy infrastructure and related services to increase market share and profitability through optimization of existing operations, internal growth, and investments in and acquisitions of energy-related assets and companies both in its current operating areas and beyond its northern Rockies base. Incremental and new growth opportunities include: access to new energy sources for storage, gathering and transportation services; expansion of existing gathering and transmission facilities; incremental expansion of pipeline capacity; expansion of the pipeline and midstream business to include liquid pipelines and processing activities; and expansion of related energy services.
Challenges Challenges for this segment include: energy price volatility; tight basis differentials; environmental and regulatory requirements; recruitment and retention of a skilled workforce; and competition from other pipeline and midstream companies.
Construction Materials and ContractingStrategy Focus on high-growth strategic markets located near major transportation corridors and desirable mid-sized metropolitan areas; strengthen long-term, strategic aggregate reserve position through purchase and/or lease opportunities; enhance profitability through cost containment, margin discipline and vertical integration of the segment's operations; develop and recruit talented employees; and continue growth through organic and acquisition opportunities. Vertical integration allows the segment to manage operations from aggregate mining to final lay-down of concrete and asphalt, with control of and access to permitted aggregate reserves being significant. A key element of the Company's long-term strategy for this business is to further expand its market presence in the higher-margin materials business (rock, sand, gravel, liquid asphalt, asphalt concrete, ready-mixed concrete and related products), complementing and expanding on the Company's expertise.
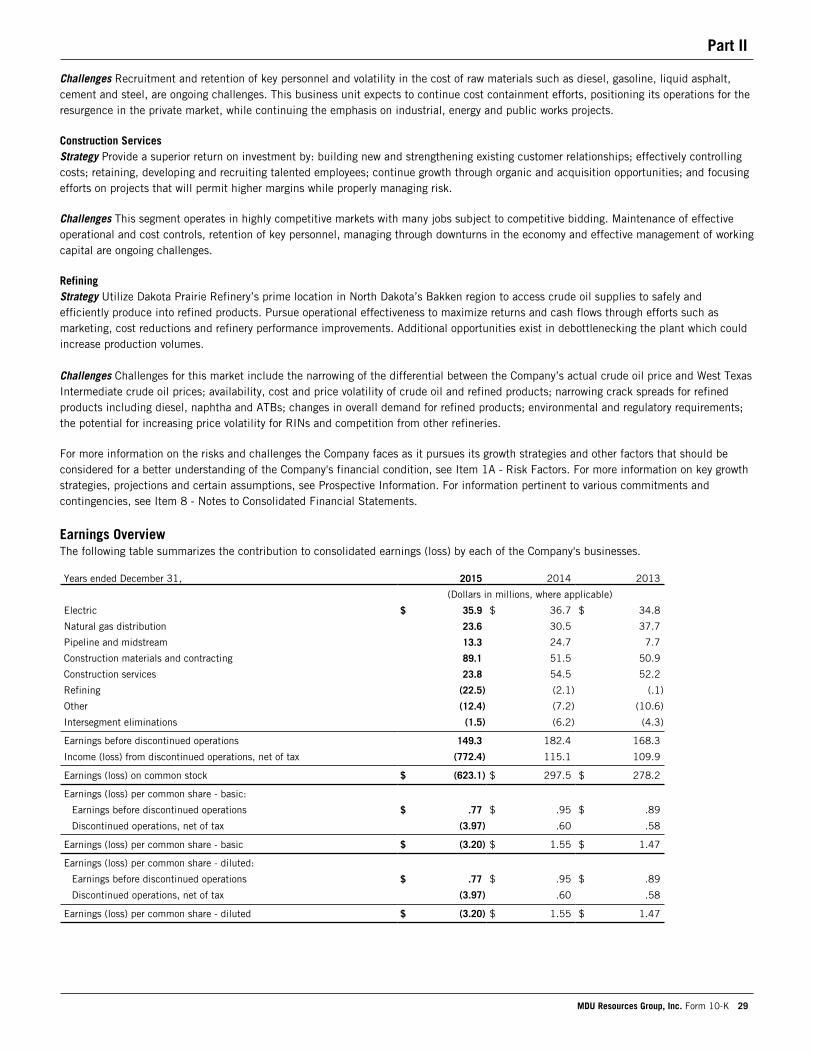
Part II
MDU Resources Group, Inc. Form 10-K 29
Challenges Recruitment and retention of key personnel and volatility in the cost of raw materials such as diesel, gasoline, liquid asphalt, cement and steel, are ongoing challenges. This business unit expects to continue cost containment efforts, positioning its operations for the resurgence in the private market, while continuing the emphasis on industrial, energy and public works projects.
Construction ServicesStrategy Provide a superior return on investment by: building new and strengthening existing customer relationships; effectively controlling costs; retaining, developing and recruiting talented employees; continue growth through organic and acquisition opportunities; and focusing efforts on projects that will permit higher margins while properly managing risk.
Challenges This segment operates in highly competitive markets with many jobs subject to competitive bidding. Maintenance of effective operational and cost controls, retention of key personnel, managing through downturns in the economy and effective management of working capital are ongoing challenges.
RefiningStrategy Utilize Dakota Prairie Refinery’s prime location in North Dakota’s Bakken region to access crude oil supplies to safely and efficiently produce into refined products. Pursue operational effectiveness to maximize returns and cash flows through efforts such as marketing, cost reductions and refinery performance improvements. Additional opportunities exist in debottlenecking the plant which could increase production volumes.
Challenges Challenges for this market include the narrowing of the differential between the Company’s actual crude oil price and West Texas Intermediate crude oil prices; availability, cost and price volatility of crude oil and refined products; narrowing crack spreads for refined products including diesel, naphtha and ATBs; changes in overall demand for refined products; environmental and regulatory requirements; the potential for increasing price volatility for RINs and competition from other refineries.
For more information on the risks and challenges the Company faces as it pursues its growth strategies and other factors that should be considered for a better understanding of the Company's financial condition, see Item 1A - Risk Factors. For more information on key growth strategies, projections and certain assumptions, see Prospective Information. For information pertinent to various commitments and contingencies, see Item 8 - Notes to Consolidated Financial Statements.
Earnings OverviewThe following table summarizes the contribution to consolidated earnings (loss) by each of the Company's businesses.
Years ended December 31, 2015 2014 2013
(Dollars in millions, where applicable)
Electric $ 35.9 $ 36.7 $ 34.8
Natural gas distribution 23.6 30.5 37.7
Pipeline and midstream 13.3 24.7 7.7
Construction materials and contracting 89.1 51.5 50.9
Construction services 23.8 54.5 52.2
Refining (22.5) (2.1) (.1)
Other (12.4) (7.2) (10.6)
Intersegment eliminations (1.5) (6.2) (4.3)
Earnings before discontinued operations 149.3 182.4 168.3
Income (loss) from discontinued operations, net of tax (772.4) 115.1 109.9
Earnings (loss) on common stock $ (623.1) $ 297.5 $ 278.2
Earnings (loss) per common share - basic:
Earnings before discontinued operations $ .77 $ .95 $ .89
Discontinued operations, net of tax (3.97) .60 .58
Earnings (loss) per common share - basic $ (3.20) $ 1.55 $ 1.47
Earnings (loss) per common share - diluted:
Earnings before discontinued operations $ .77 $ .95 $ .89
Discontinued operations, net of tax (3.97) .60 .58
Earnings (loss) per common share - diluted $ (3.20) $ 1.55 $ 1.47
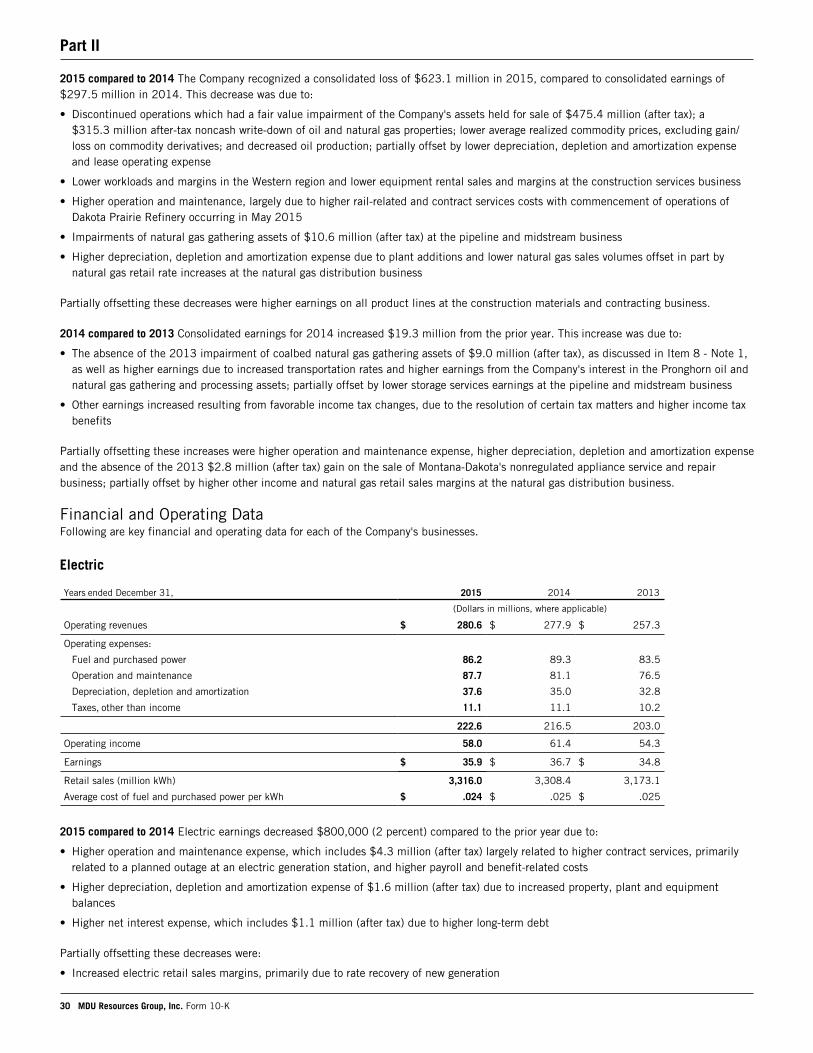
Part II
30 MDU Resources Group, Inc. Form 10-K
2015 compared to 2014 The Company recognized a consolidated loss of $623.1 million in 2015, compared to consolidated earnings of $297.5 million in 2014. This decrease was due to:
• Discontinued operations which had a fair value impairment of the Company's assets held for sale of $475.4 million (after tax); a $315.3 million after-tax noncash write-down of oil and natural gas properties; lower average realized commodity prices, excluding gain/loss on commodity derivatives; and decreased oil production; partially offset by lower depreciation, depletion and amortization expense and lease operating expense
• Lower workloads and margins in the Western region and lower equipment rental sales and margins at the construction services business
• Higher operation and maintenance, largely due to higher rail-related and contract services costs with commencement of operations of Dakota Prairie Refinery occurring in May 2015
• Impairments of natural gas gathering assets of $10.6 million (after tax) at the pipeline and midstream business
• Higher depreciation, depletion and amortization expense due to plant additions and lower natural gas sales volumes offset in part by natural gas retail rate increases at the natural gas distribution business
Partially offsetting these decreases were higher earnings on all product lines at the construction materials and contracting business.
2014 compared to 2013 Consolidated earnings for 2014 increased $19.3 million from the prior year. This increase was due to:
• The absence of the 2013 impairment of coalbed natural gas gathering assets of $9.0 million (after tax), as discussed in Item 8 - Note 1, as well as higher earnings due to increased transportation rates and higher earnings from the Company's interest in the Pronghorn oil and natural gas gathering and processing assets; partially offset by lower storage services earnings at the pipeline and midstream business
• Other earnings increased resulting from favorable income tax changes, due to the resolution of certain tax matters and higher income tax benefits
Partially offsetting these increases were higher operation and maintenance expense, higher depreciation, depletion and amortization expense and the absence of the 2013 $2.8 million (after tax) gain on the sale of Montana-Dakota's nonregulated appliance service and repair business; partially offset by higher other income and natural gas retail sales margins at the natural gas distribution business.
Financial and Operating DataFollowing are key financial and operating data for each of the Company's businesses.
Electric
Years ended December 31, 2015 2014 2013
(Dollars in millions, where applicable)
Operating revenues $ 280.6 $ 277.9 $ 257.3
Operating expenses:
Fuel and purchased power 86.2 89.3 83.5
Operation and maintenance 87.7 81.1 76.5
Depreciation, depletion and amortization 37.6 35.0 32.8
Taxes, other than income 11.1 11.1 10.2
222.6 216.5 203.0
Operating income 58.0 61.4 54.3
Earnings $ 35.9 $ 36.7 $ 34.8
Retail sales (million kWh) 3,316.0 3,308.4 3,173.1
Average cost of fuel and purchased power per kWh $ .024 $ .025 $ .025
2015 compared to 2014 Electric earnings decreased $800,000 (2 percent) compared to the prior year due to:
• Higher operation and maintenance expense, which includes $4.3 million (after tax) largely related to higher contract services, primarily related to a planned outage at an electric generation station, and higher payroll and benefit-related costs
• Higher depreciation, depletion and amortization expense of $1.6 million (after tax) due to increased property, plant and equipment balances
• Higher net interest expense, which includes $1.1 million (after tax) due to higher long-term debt
Partially offsetting these decreases were:
• Increased electric retail sales margins, primarily due to rate recovery of new generation
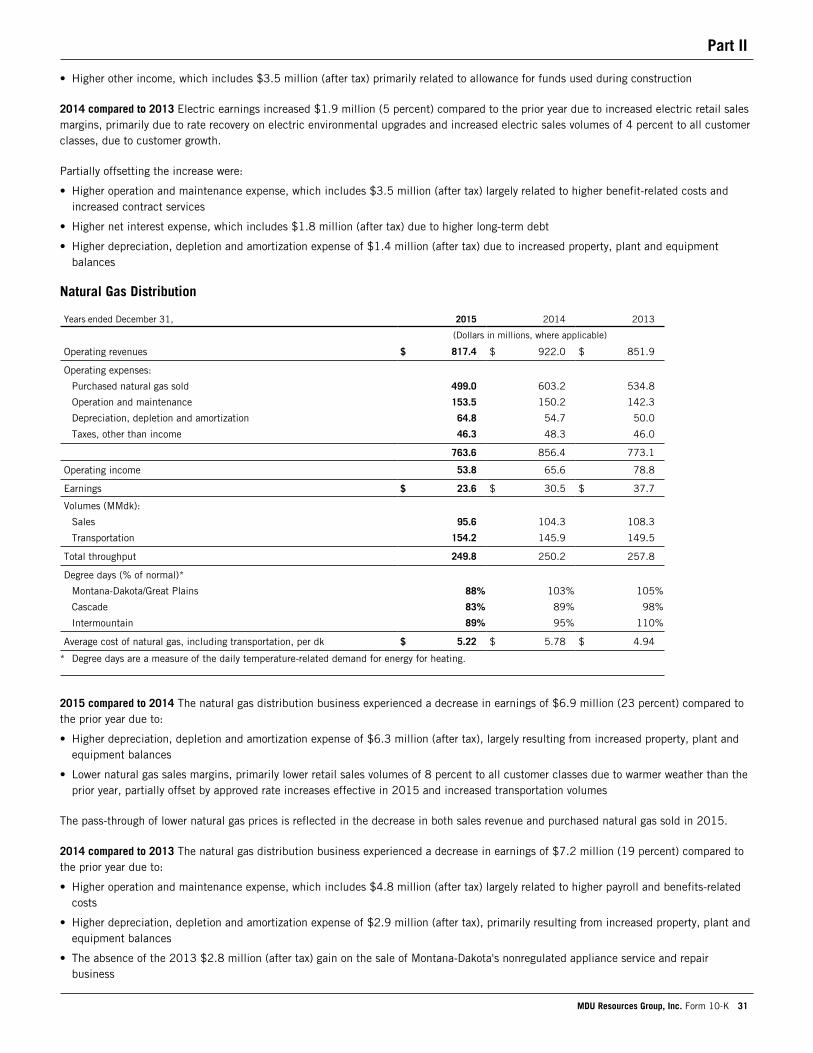
Part II
MDU Resources Group, Inc. Form 10-K 31
• Higher other income, which includes $3.5 million (after tax) primarily related to allowance for funds used during construction
2014 compared to 2013 Electric earnings increased $1.9 million (5 percent) compared to the prior year due to increased electric retail sales margins, primarily due to rate recovery on electric environmental upgrades and increased electric sales volumes of 4 percent to all customer classes, due to customer growth.
Partially offsetting the increase were:
• Higher operation and maintenance expense, which includes $3.5 million (after tax) largely related to higher benefit-related costs and increased contract services
• Higher net interest expense, which includes $1.8 million (after tax) due to higher long-term debt
• Higher depreciation, depletion and amortization expense of $1.4 million (after tax) due to increased property, plant and equipment balances
Natural Gas Distribution
Years ended December 31, 2015 2014 2013
(Dollars in millions, where applicable)
Operating revenues $ 817.4 $ 922.0 $ 851.9
Operating expenses:
Purchased natural gas sold 499.0 603.2 534.8
Operation and maintenance 153.5 150.2 142.3
Depreciation, depletion and amortization 64.8 54.7 50.0
Taxes, other than income 46.3 48.3 46.0
763.6 856.4 773.1
Operating income 53.8 65.6 78.8
Earnings $ 23.6 $ 30.5 $ 37.7
Volumes (MMdk):
Sales 95.6 104.3 108.3
Transportation 154.2 145.9 149.5
Total throughput 249.8 250.2 257.8
Degree days (% of normal)*
Montana-Dakota/Great Plains 88% 103% 105%
Cascade 83% 89% 98%
Intermountain 89% 95% 110%
Average cost of natural gas, including transportation, per dk $ 5.22 $ 5.78 $ 4.94
* Degree days are a measure of the daily temperature-related demand for energy for heating.
2015 compared to 2014 The natural gas distribution business experienced a decrease in earnings of $6.9 million (23 percent) compared to the prior year due to:
• Higher depreciation, depletion and amortization expense of $6.3 million (after tax), largely resulting from increased property, plant and equipment balances
• Lower natural gas sales margins, primarily lower retail sales volumes of 8 percent to all customer classes due to warmer weather than the prior year, partially offset by approved rate increases effective in 2015 and increased transportation volumes
The pass-through of lower natural gas prices is reflected in the decrease in both sales revenue and purchased natural gas sold in 2015.
2014 compared to 2013 The natural gas distribution business experienced a decrease in earnings of $7.2 million (19 percent) compared to the prior year due to:
• Higher operation and maintenance expense, which includes $4.8 million (after tax) largely related to higher payroll and benefits-related costs
• Higher depreciation, depletion and amortization expense of $2.9 million (after tax), primarily resulting from increased property, plant and equipment balances
• The absence of the 2013 $2.8 million (after tax) gain on the sale of Montana-Dakota's nonregulated appliance service and repair business
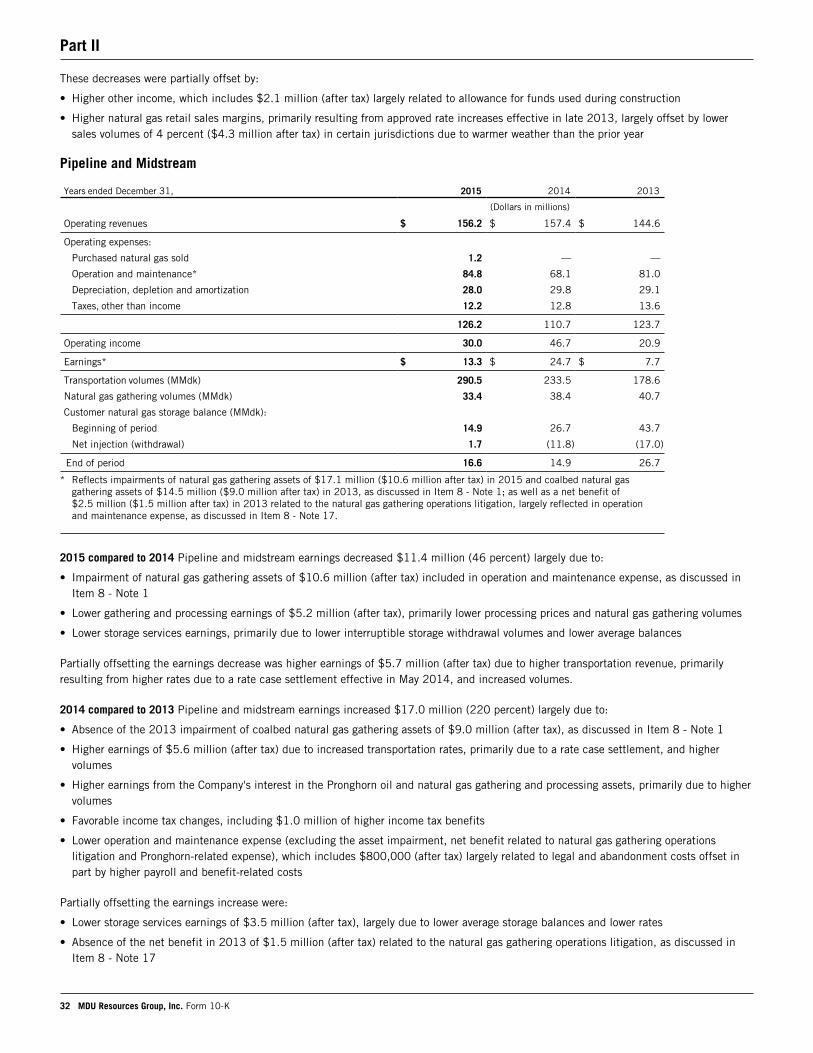
Part II
32 MDU Resources Group, Inc. Form 10-K
These decreases were partially offset by:
• Higher other income, which includes $2.1 million (after tax) largely related to allowance for funds used during construction
• Higher natural gas retail sales margins, primarily resulting from approved rate increases effective in late 2013, largely offset by lower sales volumes of 4 percent ($4.3 million after tax) in certain jurisdictions due to warmer weather than the prior year
Pipeline and Midstream
Years ended December 31, 2015 2014 2013
(Dollars in millions)
Operating revenues $ 156.2 $ 157.4 $ 144.6
Operating expenses:
Purchased natural gas sold 1.2 — —
Operation and maintenance* 84.8 68.1 81.0
Depreciation, depletion and amortization 28.0 29.8 29.1
Taxes, other than income 12.2 12.8 13.6
126.2 110.7 123.7
Operating income 30.0 46.7 20.9
Earnings* $ 13.3 $ 24.7 $ 7.7
Transportation volumes (MMdk) 290.5 233.5 178.6
Natural gas gathering volumes (MMdk) 33.4 38.4 40.7
Customer natural gas storage balance (MMdk):
Beginning of period 14.9 26.7 43.7
Net injection (withdrawal) 1.7 (11.8) (17.0)
End of period 16.6 14.9 26.7
* Reflects impairments of natural gas gathering assets of $17.1 million ($10.6 million after tax) in 2015 and coalbed natural gas gathering assets of $14.5 million ($9.0 million after tax) in 2013, as discussed in Item 8 - Note 1; as well as a net benefit of $2.5 million ($1.5 million after tax) in 2013 related to the natural gas gathering operations litigation, largely reflected in operation and maintenance expense, as discussed in Item 8 - Note 17.
2015 compared to 2014 Pipeline and midstream earnings decreased $11.4 million (46 percent) largely due to:
• Impairment of natural gas gathering assets of $10.6 million (after tax) included in operation and maintenance expense, as discussed in Item 8 - Note 1
• Lower gathering and processing earnings of $5.2 million (after tax), primarily lower processing prices and natural gas gathering volumes
• Lower storage services earnings, primarily due to lower interruptible storage withdrawal volumes and lower average balances
Partially offsetting the earnings decrease was higher earnings of $5.7 million (after tax) due to higher transportation revenue, primarily resulting from higher rates due to a rate case settlement effective in May 2014, and increased volumes.
2014 compared to 2013 Pipeline and midstream earnings increased $17.0 million (220 percent) largely due to:
• Absence of the 2013 impairment of coalbed natural gas gathering assets of $9.0 million (after tax), as discussed in Item 8 - Note 1
• Higher earnings of $5.6 million (after tax) due to increased transportation rates, primarily due to a rate case settlement, and higher volumes
• Higher earnings from the Company's interest in the Pronghorn oil and natural gas gathering and processing assets, primarily due to higher volumes
• Favorable income tax changes, including $1.0 million of higher income tax benefits
• Lower operation and maintenance expense (excluding the asset impairment, net benefit related to natural gas gathering operations litigation and Pronghorn-related expense), which includes $800,000 (after tax) largely related to legal and abandonment costs offset in part by higher payroll and benefit-related costs
Partially offsetting the earnings increase were:
• Lower storage services earnings of $3.5 million (after tax), largely due to lower average storage balances and lower rates
• Absence of the net benefit in 2013 of $1.5 million (after tax) related to the natural gas gathering operations litigation, as discussed in Item 8 - Note 17
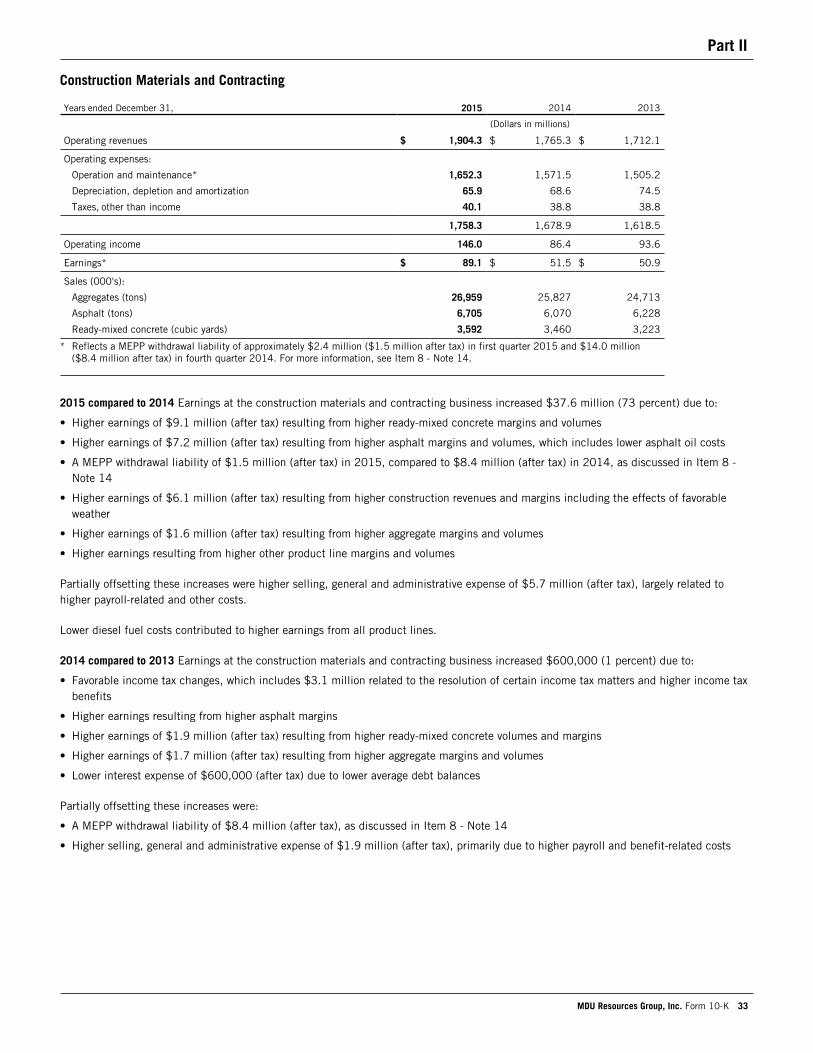
Part II
MDU Resources Group, Inc. Form 10-K 33
Construction Materials and Contracting
Years ended December 31, 2015 2014 2013
(Dollars in millions)
Operating revenues $ 1,904.3 $ 1,765.3 $ 1,712.1
Operating expenses:
Operation and maintenance* 1,652.3 1,571.5 1,505.2
Depreciation, depletion and amortization 65.9 68.6 74.5
Taxes, other than income 40.1 38.8 38.8
1,758.3 1,678.9 1,618.5
Operating income 146.0 86.4 93.6
Earnings* $ 89.1 $ 51.5 $ 50.9
Sales (000's):
Aggregates (tons) 26,959 25,827 24,713
Asphalt (tons) 6,705 6,070 6,228
Ready-mixed concrete (cubic yards) 3,592 3,460 3,223
* Reflects a MEPP withdrawal liability of approximately $2.4 million ($1.5 million after tax) in first quarter 2015 and $14.0 million ($8.4 million after tax) in fourth quarter 2014. For more information, see Item 8 - Note 14.
2015 compared to 2014 Earnings at the construction materials and contracting business increased $37.6 million (73 percent) due to:
• Higher earnings of $9.1 million (after tax) resulting from higher ready-mixed concrete margins and volumes
• Higher earnings of $7.2 million (after tax) resulting from higher asphalt margins and volumes, which includes lower asphalt oil costs
• A MEPP withdrawal liability of $1.5 million (after tax) in 2015, compared to $8.4 million (after tax) in 2014, as discussed in Item 8 - Note 14
• Higher earnings of $6.1 million (after tax) resulting from higher construction revenues and margins including the effects of favorable weather
• Higher earnings of $1.6 million (after tax) resulting from higher aggregate margins and volumes
• Higher earnings resulting from higher other product line margins and volumes
Partially offsetting these increases were higher selling, general and administrative expense of $5.7 million (after tax), largely related to higher payroll-related and other costs.
Lower diesel fuel costs contributed to higher earnings from all product lines.
2014 compared to 2013 Earnings at the construction materials and contracting business increased $600,000 (1 percent) due to:
• Favorable income tax changes, which includes $3.1 million related to the resolution of certain income tax matters and higher income tax benefits
• Higher earnings resulting from higher asphalt margins
• Higher earnings of $1.9 million (after tax) resulting from higher ready-mixed concrete volumes and margins
• Higher earnings of $1.7 million (after tax) resulting from higher aggregate margins and volumes
• Lower interest expense of $600,000 (after tax) due to lower average debt balances
Partially offsetting these increases were:
• A MEPP withdrawal liability of $8.4 million (after tax), as discussed in Item 8 - Note 14
• Higher selling, general and administrative expense of $1.9 million (after tax), primarily due to higher payroll and benefit-related costs
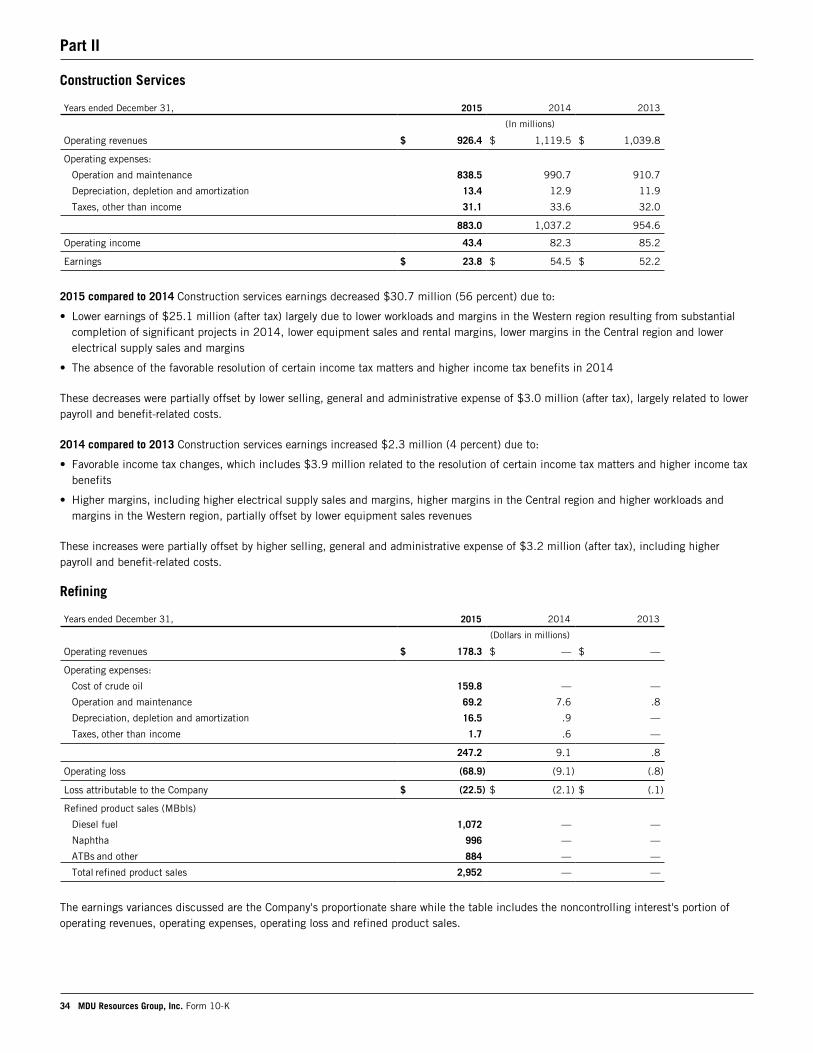
Part II
34 MDU Resources Group, Inc. Form 10-K
Construction Services
Years ended December 31, 2015 2014 2013
(In millions)
Operating revenues $ 926.4 $ 1,119.5 $ 1,039.8
Operating expenses:
Operation and maintenance 838.5 990.7 910.7
Depreciation, depletion and amortization 13.4 12.9 11.9
Taxes, other than income 31.1 33.6 32.0
883.0 1,037.2 954.6
Operating income 43.4 82.3 85.2
Earnings $ 23.8 $ 54.5 $ 52.2
2015 compared to 2014 Construction services earnings decreased $30.7 million (56 percent) due to:
• Lower earnings of $25.1 million (after tax) largely due to lower workloads and margins in the Western region resulting from substantial completion of significant projects in 2014, lower equipment sales and rental margins, lower margins in the Central region and lower electrical supply sales and margins
• The absence of the favorable resolution of certain income tax matters and higher income tax benefits in 2014
These decreases were partially offset by lower selling, general and administrative expense of $3.0 million (after tax), largely related to lower payroll and benefit-related costs.
2014 compared to 2013 Construction services earnings increased $2.3 million (4 percent) due to:
• Favorable income tax changes, which includes $3.9 million related to the resolution of certain income tax matters and higher income tax benefits
• Higher margins, including higher electrical supply sales and margins, higher margins in the Central region and higher workloads and margins in the Western region, partially offset by lower equipment sales revenues
These increases were partially offset by higher selling, general and administrative expense of $3.2 million (after tax), including higher payroll and benefit-related costs.
Refining
Years ended December 31, 2015 2014 2013
(Dollars in millions)
Operating revenues $ 178.3 $ — $ —
Operating expenses:
Cost of crude oil 159.8 — —
Operation and maintenance 69.2 7.6 .8
Depreciation, depletion and amortization 16.5 .9 —
Taxes, other than income 1.7 .6 —
247.2 9.1 .8
Operating loss (68.9) (9.1) (.8)
Loss attributable to the Company $ (22.5) $ (2.1) $ (.1)
Refined product sales (MBbls)
Diesel fuel 1,072 — —
Naphtha 996 — —
ATBs and other 884 — —
Total refined product sales 2,952 — —
The earnings variances discussed are the Company's proportionate share while the table includes the noncontrolling interest's portion of operating revenues, operating expenses, operating loss and refined product sales.
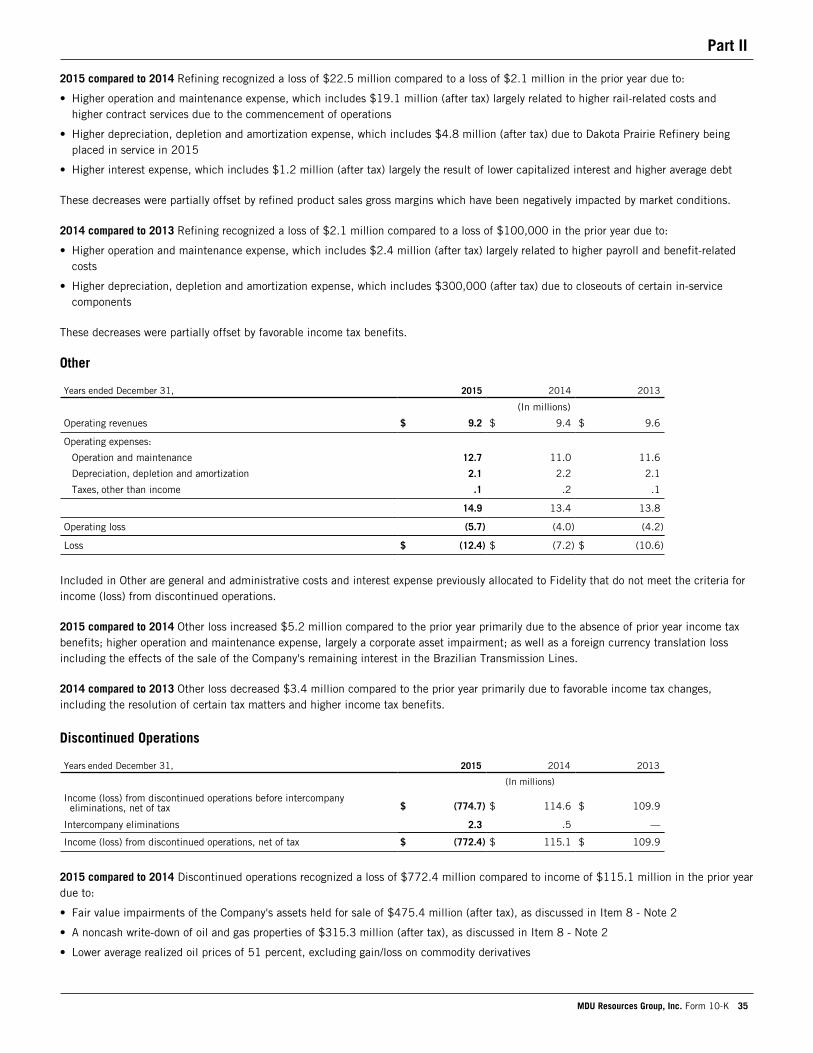
Part II
MDU Resources Group, Inc. Form 10-K 35
2015 compared to 2014 Refining recognized a loss of $22.5 million compared to a loss of $2.1 million in the prior year due to:
• Higher operation and maintenance expense, which includes $19.1 million (after tax) largely related to higher rail-related costs and higher contract services due to the commencement of operations
• Higher depreciation, depletion and amortization expense, which includes $4.8 million (after tax) due to Dakota Prairie Refinery being placed in service in 2015
• Higher interest expense, which includes $1.2 million (after tax) largely the result of lower capitalized interest and higher average debt
These decreases were partially offset by refined product sales gross margins which have been negatively impacted by market conditions.
2014 compared to 2013 Refining recognized a loss of $2.1 million compared to a loss of $100,000 in the prior year due to:
• Higher operation and maintenance expense, which includes $2.4 million (after tax) largely related to higher payroll and benefit-related costs
• Higher depreciation, depletion and amortization expense, which includes $300,000 (after tax) due to closeouts of certain in-service components
These decreases were partially offset by favorable income tax benefits.
Other
Years ended December 31, 2015 2014 2013
(In millions)
Operating revenues $ 9.2 $ 9.4 $ 9.6
Operating expenses:
Operation and maintenance 12.7 11.0 11.6
Depreciation, depletion and amortization 2.1 2.2 2.1
Taxes, other than income .1 .2 .1
14.9 13.4 13.8
Operating loss (5.7) (4.0) (4.2)
Loss $ (12.4) $ (7.2) $ (10.6)
Included in Other are general and administrative costs and interest expense previously allocated to Fidelity that do not meet the criteria for income (loss) from discontinued operations.
2015 compared to 2014 Other loss increased $5.2 million compared to the prior year primarily due to the absence of prior year income tax benefits; higher operation and maintenance expense, largely a corporate asset impairment; as well as a foreign currency translation loss including the effects of the sale of the Company's remaining interest in the Brazilian Transmission Lines.
2014 compared to 2013 Other loss decreased $3.4 million compared to the prior year primarily due to favorable income tax changes, including the resolution of certain tax matters and higher income tax benefits.
Discontinued Operations
Years ended December 31, 2015 2014 2013
(In millions)
Income (loss) from discontinued operations before intercompanyeliminations, net of tax $ (774.7) $ 114.6 $ 109.9
Intercompany eliminations 2.3 .5 —
Income (loss) from discontinued operations, net of tax $ (772.4) $ 115.1 $ 109.9
2015 compared to 2014 Discontinued operations recognized a loss of $772.4 million compared to income of $115.1 million in the prior year due to:
• Fair value impairments of the Company's assets held for sale of $475.4 million (after tax), as discussed in Item 8 - Note 2
• A noncash write-down of oil and gas properties of $315.3 million (after tax), as discussed in Item 8 - Note 2
• Lower average realized oil prices of 51 percent, excluding gain/loss on commodity derivatives
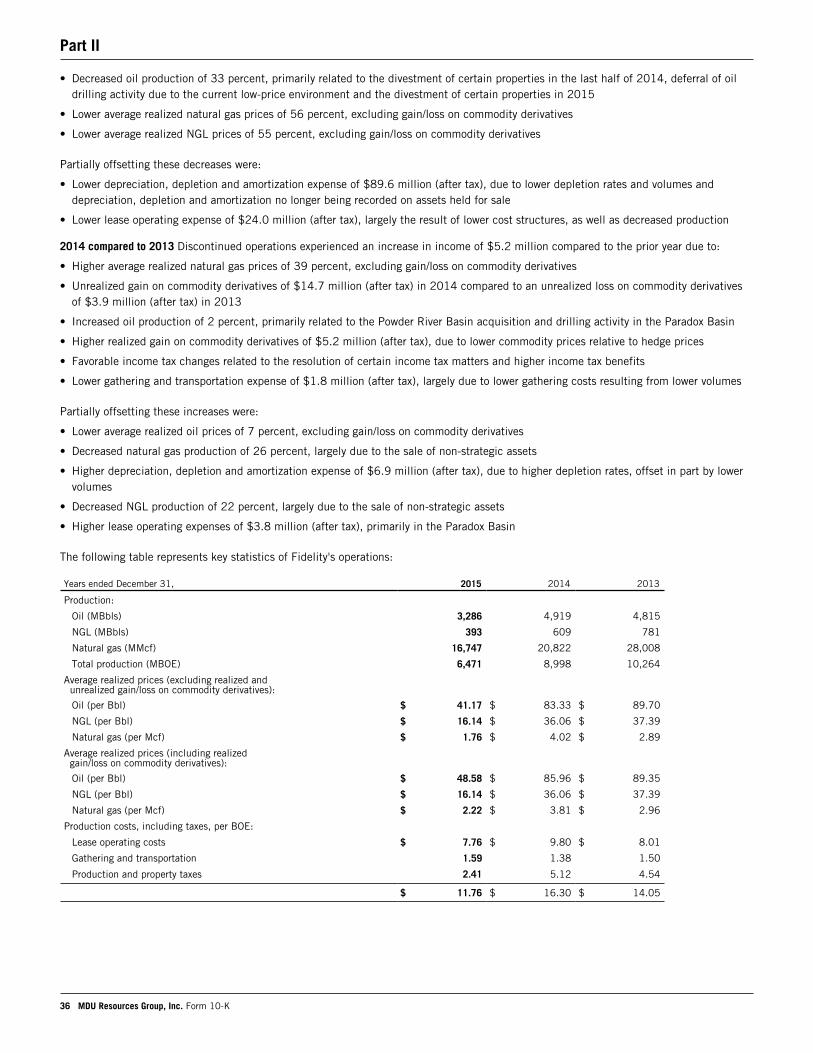
Part II
36 MDU Resources Group, Inc. Form 10-K
• Decreased oil production of 33 percent, primarily related to the divestment of certain properties in the last half of 2014, deferral of oil drilling activity due to the current low-price environment and the divestment of certain properties in 2015
• Lower average realized natural gas prices of 56 percent, excluding gain/loss on commodity derivatives
• Lower average realized NGL prices of 55 percent, excluding gain/loss on commodity derivatives
Partially offsetting these decreases were:
• Lower depreciation, depletion and amortization expense of $89.6 million (after tax), due to lower depletion rates and volumes and depreciation, depletion and amortization no longer being recorded on assets held for sale
• Lower lease operating expense of $24.0 million (after tax), largely the result of lower cost structures, as well as decreased production
2014 compared to 2013 Discontinued operations experienced an increase in income of $5.2 million compared to the prior year due to:
• Higher average realized natural gas prices of 39 percent, excluding gain/loss on commodity derivatives
• Unrealized gain on commodity derivatives of $14.7 million (after tax) in 2014 compared to an unrealized loss on commodity derivatives of $3.9 million (after tax) in 2013
• Increased oil production of 2 percent, primarily related to the Powder River Basin acquisition and drilling activity in the Paradox Basin
• Higher realized gain on commodity derivatives of $5.2 million (after tax), due to lower commodity prices relative to hedge prices
• Favorable income tax changes related to the resolution of certain income tax matters and higher income tax benefits
• Lower gathering and transportation expense of $1.8 million (after tax), largely due to lower gathering costs resulting from lower volumes
Partially offsetting these increases were:
• Lower average realized oil prices of 7 percent, excluding gain/loss on commodity derivatives
• Decreased natural gas production of 26 percent, largely due to the sale of non-strategic assets
• Higher depreciation, depletion and amortization expense of $6.9 million (after tax), due to higher depletion rates, offset in part by lower volumes
• Decreased NGL production of 22 percent, largely due to the sale of non-strategic assets
• Higher lease operating expenses of $3.8 million (after tax), primarily in the Paradox Basin
The following table represents key statistics of Fidelity's operations:
Years ended December 31, 2015 2014 2013
Production:
Oil (MBbls) 3,286 4,919 4,815
NGL (MBbls) 393 609 781
Natural gas (MMcf) 16,747 20,822 28,008
Total production (MBOE) 6,471 8,998 10,264
Average realized prices (excluding realized andunrealized gain/loss on commodity derivatives):
Oil (per Bbl) $ 41.17 $ 83.33 $ 89.70
NGL (per Bbl) $ 16.14 $ 36.06 $ 37.39
Natural gas (per Mcf) $ 1.76 $ 4.02 $ 2.89
Average realized prices (including realizedgain/loss on commodity derivatives):
Oil (per Bbl) $ 48.58 $ 85.96 $ 89.35
NGL (per Bbl) $ 16.14 $ 36.06 $ 37.39
Natural gas (per Mcf) $ 2.22 $ 3.81 $ 2.96
Production costs, including taxes, per BOE:
Lease operating costs $ 7.76 $ 9.80 $ 8.01
Gathering and transportation 1.59 1.38 1.50
Production and property taxes 2.41 5.12 4.54
$ 11.76 $ 16.30 $ 14.05
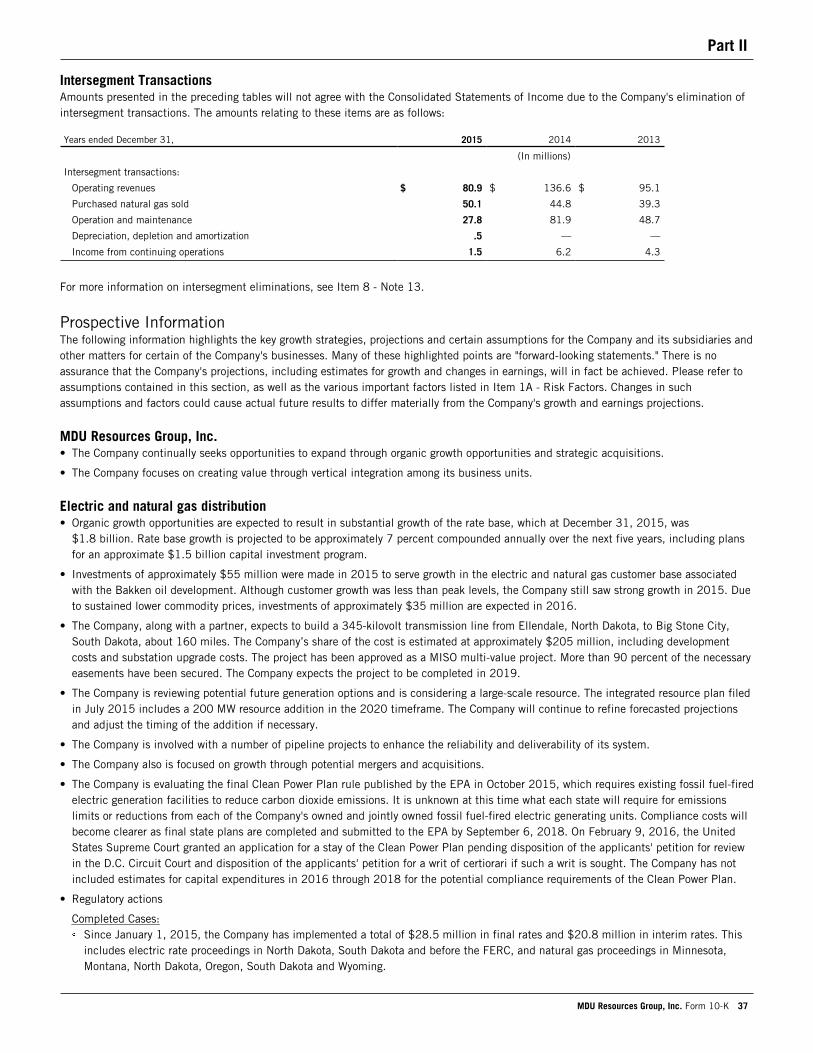
Part II
MDU Resources Group, Inc. Form 10-K 37
Intersegment TransactionsAmounts presented in the preceding tables will not agree with the Consolidated Statements of Income due to the Company's elimination of intersegment transactions. The amounts relating to these items are as follows:
Years ended December 31, 2015 2014 2013
(In millions)
Intersegment transactions:
Operating revenues $ 80.9 $ 136.6 $ 95.1
Purchased natural gas sold 50.1 44.8 39.3
Operation and maintenance 27.8 81.9 48.7
Depreciation, depletion and amortization .5 — —
Income from continuing operations 1.5 6.2 4.3
For more information on intersegment eliminations, see Item 8 - Note 13.
Prospective InformationThe following information highlights the key growth strategies, projections and certain assumptions for the Company and its subsidiaries and other matters for certain of the Company's businesses. Many of these highlighted points are "forward-looking statements." There is no assurance that the Company's projections, including estimates for growth and changes in earnings, will in fact be achieved. Please refer to assumptions contained in this section, as well as the various important factors listed in Item 1A - Risk Factors. Changes in such assumptions and factors could cause actual future results to differ materially from the Company's growth and earnings projections.
MDU Resources Group, Inc.• The Company continually seeks opportunities to expand through organic growth opportunities and strategic acquisitions.
• The Company focuses on creating value through vertical integration among its business units.
Electric and natural gas distribution• Organic growth opportunities are expected to result in substantial growth of the rate base, which at December 31, 2015, was
$1.8 billion. Rate base growth is projected to be approximately 7 percent compounded annually over the next five years, including plans for an approximate $1.5 billion capital investment program.
• Investments of approximately $55 million were made in 2015 to serve growth in the electric and natural gas customer base associated with the Bakken oil development. Although customer growth was less than peak levels, the Company still saw strong growth in 2015. Due to sustained lower commodity prices, investments of approximately $35 million are expected in 2016.
• The Company, along with a partner, expects to build a 345-kilovolt transmission line from Ellendale, North Dakota, to Big Stone City, South Dakota, about 160 miles. The Company’s share of the cost is estimated at approximately $205 million, including development costs and substation upgrade costs. The project has been approved as a MISO multi-value project. More than 90 percent of the necessary easements have been secured. The Company expects the project to be completed in 2019.
• The Company is reviewing potential future generation options and is considering a large-scale resource. The integrated resource plan filed in July 2015 includes a 200 MW resource addition in the 2020 timeframe. The Company will continue to refine forecasted projections and adjust the timing of the addition if necessary.
• The Company is involved with a number of pipeline projects to enhance the reliability and deliverability of its system.
• The Company also is focused on growth through potential mergers and acquisitions.
• The Company is evaluating the final Clean Power Plan rule published by the EPA in October 2015, which requires existing fossil fuel-fired electric generation facilities to reduce carbon dioxide emissions. It is unknown at this time what each state will require for emissions limits or reductions from each of the Company's owned and jointly owned fossil fuel-fired electric generating units. Compliance costs will become clearer as final state plans are completed and submitted to the EPA by September 6, 2018. On February 9, 2016, the United States Supreme Court granted an application for a stay of the Clean Power Plan pending disposition of the applicants' petition for review in the D.C. Circuit Court and disposition of the applicants' petition for a writ of certiorari if such a writ is sought. The Company has not included estimates for capital expenditures in 2016 through 2018 for the potential compliance requirements of the Clean Power Plan.
• Regulatory actions
Completed Cases:Since January 1, 2015, the Company has implemented a total of $28.5 million in final rates and $20.8 million in interim rates. This includes electric rate proceedings in North Dakota, South Dakota and before the FERC, and natural gas proceedings in Minnesota, Montana, North Dakota, Oregon, South Dakota and Wyoming.
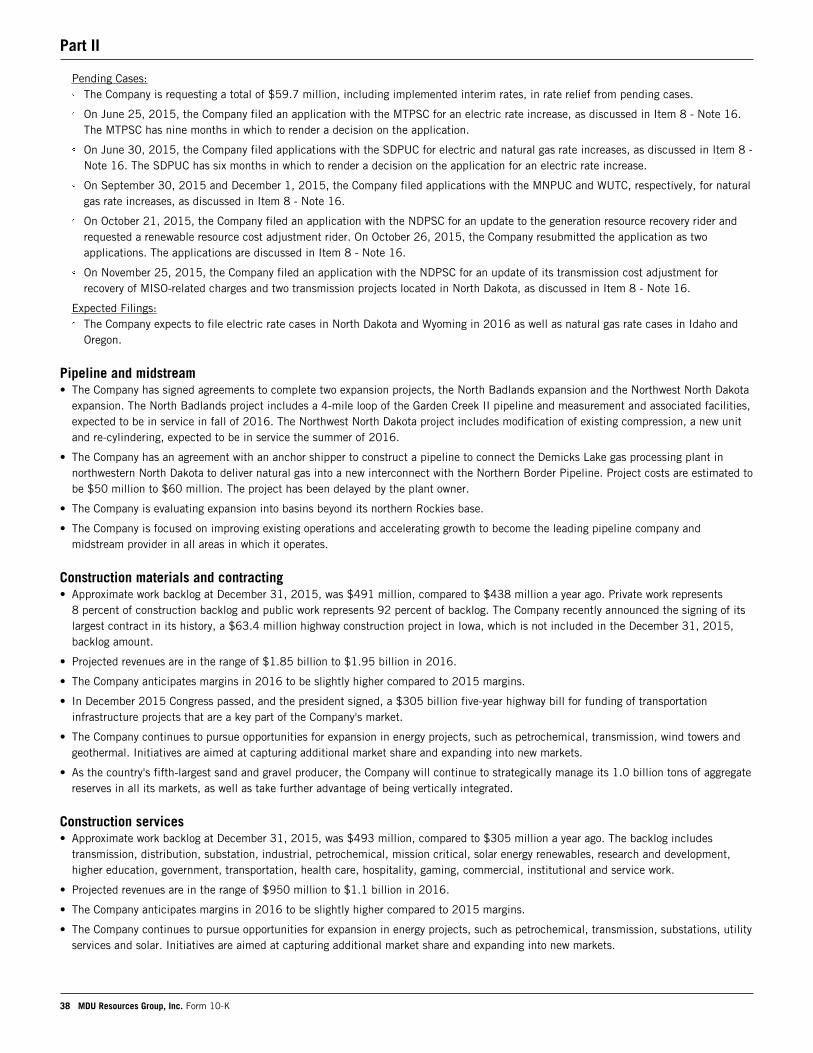
Part II
38 MDU Resources Group, Inc. Form 10-K
Pending Cases:The Company is requesting a total of $59.7 million, including implemented interim rates, in rate relief from pending cases.
On June 25, 2015, the Company filed an application with the MTPSC for an electric rate increase, as discussed in Item 8 - Note 16. The MTPSC has nine months in which to render a decision on the application.
On June 30, 2015, the Company filed applications with the SDPUC for electric and natural gas rate increases, as discussed in Item 8 - Note 16. The SDPUC has six months in which to render a decision on the application for an electric rate increase.
On September 30, 2015 and December 1, 2015, the Company filed applications with the MNPUC and WUTC, respectively, for natural gas rate increases, as discussed in Item 8 - Note 16.
On October 21, 2015, the Company filed an application with the NDPSC for an update to the generation resource recovery rider and requested a renewable resource cost adjustment rider. On October 26, 2015, the Company resubmitted the application as two applications. The applications are discussed in Item 8 - Note 16.
On November 25, 2015, the Company filed an application with the NDPSC for an update of its transmission cost adjustment for recovery of MISO-related charges and two transmission projects located in North Dakota, as discussed in Item 8 - Note 16.
Expected Filings:The Company expects to file electric rate cases in North Dakota and Wyoming in 2016 as well as natural gas rate cases in Idaho and Oregon.
Pipeline and midstream• The Company has signed agreements to complete two expansion projects, the North Badlands expansion and the Northwest North Dakota
expansion. The North Badlands project includes a 4-mile loop of the Garden Creek II pipeline and measurement and associated facilities, expected to be in service in fall of 2016. The Northwest North Dakota project includes modification of existing compression, a new unit and re-cylindering, expected to be in service the summer of 2016.
• The Company has an agreement with an anchor shipper to construct a pipeline to connect the Demicks Lake gas processing plant in northwestern North Dakota to deliver natural gas into a new interconnect with the Northern Border Pipeline. Project costs are estimated to be $50 million to $60 million. The project has been delayed by the plant owner.
• The Company is evaluating expansion into basins beyond its northern Rockies base.
• The Company is focused on improving existing operations and accelerating growth to become the leading pipeline company and midstream provider in all areas in which it operates.
Construction materials and contracting• Approximate work backlog at December 31, 2015, was $491 million, compared to $438 million a year ago. Private work represents
8 percent of construction backlog and public work represents 92 percent of backlog. The Company recently announced the signing of its largest contract in its history, a $63.4 million highway construction project in Iowa, which is not included in the December 31, 2015, backlog amount.
• Projected revenues are in the range of $1.85 billion to $1.95 billion in 2016.
• The Company anticipates margins in 2016 to be slightly higher compared to 2015 margins.
• In December 2015 Congress passed, and the president signed, a $305 billion five-year highway bill for funding of transportation infrastructure projects that are a key part of the Company's market.
• The Company continues to pursue opportunities for expansion in energy projects, such as petrochemical, transmission, wind towers and geothermal. Initiatives are aimed at capturing additional market share and expanding into new markets.
• As the country's fifth-largest sand and gravel producer, the Company will continue to strategically manage its 1.0 billion tons of aggregate reserves in all its markets, as well as take further advantage of being vertically integrated.
Construction services• Approximate work backlog at December 31, 2015, was $493 million, compared to $305 million a year ago. The backlog includes
transmission, distribution, substation, industrial, petrochemical, mission critical, solar energy renewables, research and development, higher education, government, transportation, health care, hospitality, gaming, commercial, institutional and service work.
• Projected revenues are in the range of $950 million to $1.1 billion in 2016.
• The Company anticipates margins in 2016 to be slightly higher compared to 2015 margins.
• The Company continues to pursue opportunities for expansion in energy projects, such as petrochemical, transmission, substations, utility services and solar. Initiatives are aimed at capturing additional market share and expanding into new markets.
Part II
MDU Resources Group, Inc. Form 10-K 39
• As the eighth-largest specialty contractor, the Company continues to pursue opportunities for expansion and execute initiatives in current and new markets that align with the Company's expertise, resources and strategic growth plan.
Refining• Dakota Prairie Refinery processes Bakken crude oil into diesel, which is marketed within the Bakken region. Other by-products, naphtha
and ATBs, are transported to other areas. The production slate includes approximately 7,000 - 8,000 BPD of diesel, 5,500 - 6,500 BPD of naphtha and 4,500 - 5,500 BPD of ATBs. Work continues to increase the daily oil processing capacity of the plant.
• Company crude oil purchases for the intake have been at a discount to West Texas Intermediate. However, this discount, or differential, has been much narrower than anticipated because of market conditions in the Bakken.
• Diesel is sold locally at the refinery rack and Dakota Prairie Refinery posts a daily price based on market conditions. Dakota Prairie Refinery's posted diesel prices were in the $40 to $75 per barrel range, with an average $58.65 per barrel, during fourth quarter 2015.
• Naphtha is being railed into Canada to be used as a diluent for tar sands production and is tied to C5 pricing differentials to West Texas Intermediate. Naphtha prices ranged from $35 to $45 per barrel in the fourth quarter of 2015.
New Accounting StandardsFor information regarding new accounting standards, see Item 8 - Note 1, which is incorporated herein by reference.
Critical Accounting Policies Involving Significant EstimatesThe Company has prepared its financial statements in conformity with GAAP. The preparation of these financial statements requires management to make estimates and assumptions that affect the reported amounts of assets and liabilities, and disclosure of contingent assets and liabilities, at the date of the financial statements as well as the reported amounts of revenues and expenses during the reporting period. The Company's significant accounting policies are discussed in Item 8 - Note 1.
Estimates are used for items such as impairment testing of assets held for sale, long-lived assets, goodwill and oil and natural gas properties; fair values of acquired assets and liabilities under the acquisition method of accounting; aggregate reserves; property depreciable lives; tax provisions; uncollectible accounts; environmental and other loss contingencies; accumulated provision for revenues subject to refund; costs on construction contracts; unbilled revenues; actuarially determined benefit costs; asset retirement obligations; and the valuation of stock-based compensation. The Company's critical accounting policies are subject to judgments and uncertainties that affect the application of such policies. As discussed below, the Company's financial position or results of operations may be materially different when reported under different conditions or when using different assumptions in the application of such policies.
As additional information becomes available, or actual amounts are determinable, the recorded estimates are revised. Consequently, operating results can be affected by revisions to prior accounting estimates. The following critical accounting policies involve significant judgments and estimates.
Oil and natural gas propertiesEstimates of proved reserves are prepared in accordance with guidelines established by the industry and the SEC. The estimates are arrived at using actual historical wellhead production trends and/or standard reservoir engineering methods utilizing available geological, geophysical, engineering and economic data. The extent, quality and reliability of this data can vary. Other factors used in the reserve estimates are prices, market differentials, estimates of well operating and future development costs, and timing of operations. These estimates are refined as new information becomes available.
As these estimates change, calculated proved reserves may change. Prior to the oil and natural gas properties being classified as held for sale, changes in proved reserve quantities impacted the Company's depreciation, depletion and amortization expense since the Company used the units-of-production method to amortize its oil and natural gas properties. Historically, the proved reserves were used as the basis for the disclosures in Item 8 - Supplementary Financial Information and were the underlying basis of the "ceiling test" for the Company's oil and natural gas properties while those properties were classified as held for use.
Historically, the Company used the full-cost method of accounting for its exploration and production activities. Prior to the oil and natural gas properties being classified as held for sale, capitalized costs were subject to a "ceiling test" that limited such costs to the aggregate of the present value of future net cash flows from proved reserves discounted at 10 percent, as mandated under the rules of the SEC, plus the cost of unproved properties not subject to amortization, plus the effects of cash flow hedges, less applicable income taxes. Proved reserves and associated future cash flows were determined based on SEC Defined Prices and excluded cash flows associated with asset retirement obligations that had been accrued on the balance sheet. Judgments and assumptions were made when estimating and valuing proved reserves.
Part II
40 MDU Resources Group, Inc. Form 10-K
In the second quarter of 2015, the Company announced its plan to market Fidelity and exit that line of business. The assets and liabilities were classified as held for sale and evaluated for impairment based on estimated fair value less cost to sell, as discussed later under Impairment testing of assets held for sale.
Impairment testing of assets held for saleThe Company evaluates disposal groups classified as held for sale based on the lower of carrying value or fair value less cost to sell. The Company performed a fair value assessment of the assets and liabilities classified as held for sale. In the second quarter of 2015, the estimated fair value was determined using the income and the market approaches. The income approach was determined by using the present value of future estimated cash flows. The income approach considered management’s views on current operating measures as well as assumptions pertaining to market forces in the oil and gas industry including estimated reserves, estimated prices, market differentials, estimates of well operating and future development costs and timing of operations. The estimated cash flows were discounted using a rate believed to be consistent with those used by principal market participants. The market approach was provided by a third party and based on market transactions involving similar interests in oil and natural gas properties. In the third quarter of 2015, the estimated fair value of Fidelity was determined by agreed upon pricing in the purchase and sale agreements for the assets subject to the agreements, the majority of which closed during the fourth quarter of 2015, including customary purchase price adjustments. The values received in the bid proposals were lower than originally anticipated due to lower commodity prices than those projected in the second quarter of 2015. For those assets for which a purchase and sale agreement had not been entered into, which the Company is continuing to market, the fair value was determined based on the market approach utilizing multiples based on similar interests in oil and natural gas properties, as the Company believes this was the most relevant measure of fair value for these assets. In the fourth quarter of 2015, the fair value assessment was determined using the market approach based on purchase and sale agreements, one of which has been signed and one of which the Company is currently negotiating.
Unforeseen events and changes in circumstances and market conditions and material differences in the value of the assets held for sale due to changes in estimates of future cash flows could negatively affect the estimated fair value of Fidelity and result in additional impairment charges. Various factors, including oil and natural gas prices, market differentials and changes in estimates of reserve quantities could result in future impairments of the Company's assets held for sale.
There is risk involved when determining the fair value of assets, as there may be unforeseen events and changes in circumstances and market conditions that have a material impact on the estimated amount and timing of future cash flows. In addition, the fair value of the assets could be different using different estimates and assumptions in the valuation techniques used.
The Company believes its estimates used in calculating the fair value of its assets held for sale are reasonable based on the information that is known when the estimates are made.
Impairment of long-lived assets and intangiblesThe Company reviews the carrying values of its long-lived assets and intangibles, excluding assets held for sale and oil and natural gas properties, whenever events or changes in circumstances indicate that such carrying values may not be recoverable and at least annually for goodwill.
Goodwill The Company performs its goodwill impairment testing annually in the fourth quarter. In addition, the test is performed on an interim basis whenever events or circumstances indicate that the carrying amount of goodwill may not be recoverable. Examples of such events or circumstances may include a significant adverse change in business climate, weakness in an industry in which the Company's reporting units operate or recent significant cash or operating losses with expectations that those losses will continue.
The goodwill impairment test is a two-step process performed at the reporting unit level. The Company has determined that the reporting units for its goodwill impairment test are its operating segments, or components of an operating segment, that constitute a business for which discrete financial information is available and for which segment management regularly reviews the operating results. For more information on the Company's operating segments, see Item 8 - Note 13. The first step of the impairment test involves comparing the fair value of each reporting unit to its carrying value. If the fair value of a reporting unit exceeds its carrying value, the test is complete and no impairment is recorded. If the fair value of a reporting unit is less than its carrying value, step two of the test is performed to determine the amount of impairment loss, if any. The impairment is computed by comparing the implied fair value of the reporting unit's goodwill to the carrying value of that goodwill. If the carrying value is greater than the implied fair value, an impairment loss must be recorded. For the years ended December 31, 2015, 2014, and 2013, there were no significant impairment losses recorded. At December 31, 2015, the fair value substantially exceeded the carrying value at all reporting units.
Determining the fair value of a reporting unit requires judgment and the use of significant estimates which include assumptions about the Company's future revenue, profitability and cash flows, amount and timing of estimated capital expenditures, inflation rates, weighted
Part II
MDU Resources Group, Inc. Form 10-K 41
average cost of capital, operational plans, and current and future economic conditions, among others. The fair value of each reporting unit is determined using a weighted combination of income and market approaches. The Company uses a discounted cash flow methodology for its income approach. Under the income approach, the discounted cash flow model determines fair value based on the present value of projected cash flows over a specified period and a residual value related to future cash flows beyond the projection period. Both values are discounted using a rate which reflects the best estimate of the weighted average cost of capital at each reporting unit. The weighted average cost of capital, which varies by reporting unit and is in the range of 5 percent to 9 percent, and a long-term growth rate projection of approximately 3 percent were utilized in the goodwill impairment test performed in the fourth quarter of 2015. Under the market approach, the Company estimates fair value using multiples derived from comparable sales transactions and enterprise value to EBITDA for comparative peer companies for each respective reporting unit. These multiples are applied to operating data for each reporting unit to arrive at an indication of fair value. In addition, the Company adds a reasonable control premium when calculating the fair value utilizing the peer multiples, which is estimated as the premium that would be received in a sale in an orderly transaction between market participants. The Company believes that the estimates and assumptions used in its impairment assessments are reasonable and based on available market information, but variations in any of the assumptions could result in materially different calculations of fair value and determinations of whether or not an impairment is indicated.
Long-Lived Assets Unforeseen events and changes in circumstances and market conditions and material differences in the value of long-lived assets and intangibles due to changes in estimates of future cash flows could negatively affect the fair value of the Company's assets and result in an impairment charge. If an impairment indicator exists for tangible and intangible assets, excluding goodwill, the asset group held and used is tested for recoverability by comparing an estimate of undiscounted future cash flows attributable to the assets compared to the carrying value of the assets. If impairment has occurred, the amount of the impairment recognized is determined by estimating the fair value of the assets and recording a loss if the carrying value is greater than the fair value.
There is risk involved when determining the fair value of assets, tangible and intangible, as there may be unforeseen events and changes in circumstances and market conditions that have a material impact on the estimated amount and timing of future cash flows. In addition, the fair value of the asset could be different using different estimates and assumptions in the valuation techniques used.
The Company believes its estimates used in calculating the fair value of long-lived assets, including goodwill and identifiable intangibles, are reasonable based on the information that is known when the estimates are made.
Revenue recognitionRevenue is recognized when the earnings process is complete, as evidenced by an agreement between the customer and the Company, when delivery has occurred or services have been rendered, when the fee is fixed or determinable and when collection is reasonably assured. The recognition of revenue requires the Company to make estimates and assumptions that affect the reported amounts of revenue. Critical estimates related to the recognition of revenue include costs on construction contracts under the percentage-of-completion method.
The Company recognizes construction contract revenue from fixed-price and modified fixed-price construction contracts at its construction businesses using the percentage-of-completion method, measured by the percentage of costs incurred to date to estimated total costs for each contract. This method depends largely on the ability to make reasonably dependable estimates related to the extent of progress toward completion of the contract, contract revenues and contract costs. Inasmuch as contract prices are generally set before the work is performed, the estimates pertaining to every project could contain significant unknown risks such as volatile labor, material and fuel costs, weather delays, adverse project site conditions, unforeseen actions by regulatory agencies, performance by subcontractors, job management and relations with project owners. Changes in estimates could have a material effect on the Company's results of operations, financial position and cash flows.
Several factors are evaluated in determining the bid price for contract work. These include, but are not limited to, the complexities of the job, past history performing similar types of work, seasonal weather patterns, competition and market conditions, job site conditions, work force safety, reputation of the project owner, availability of labor, materials and fuel, project location and project completion dates. As a project commences, estimates are continually monitored and revised as information becomes available and actual costs and conditions surrounding the job become known. If a loss is anticipated on a contract, the loss is immediately recognized.
The Company believes its estimates surrounding percentage-of-completion accounting are reasonable based on the information that is known when the estimates are made. The Company has contract administration, accounting and management control systems in place that allow its estimates to be updated and monitored on a regular basis. Because of the many factors that are evaluated in determining bid prices, it is inherent that the Company's estimates have changed in the past and will continually change in the future as new information becomes available for each job. There were no material changes in contract estimates at the individual contract level in 2015.
Part II
42 MDU Resources Group, Inc. Form 10-K
Pension and other postretirement benefitsThe Company has noncontributory defined benefit pension plans and other postretirement benefit plans for certain eligible employees. Various actuarial assumptions are used in calculating the benefit expense (income) and liability (asset) related to these plans. Costs of providing pension and other postretirement benefits bear the risk of change, as they are dependent upon numerous factors based on assumptions of future conditions.
The Company makes various assumptions when determining plan costs, including the current discount rates and the expected long-term return on plan assets, the rate of compensation increases, actuarially determined mortality data, and health care cost trend rates. In selecting the expected long-term return on plan assets, which is considered to be one of the key variables in determining benefit expense or income, the Company considers historical returns, current market conditions and expected future market trends, including changes in interest rates and equity and bond market performance. Another key variable in determining benefit expense or income is the discount rate. In selecting the discount rate, the Company matches forecasted future cash flows of the pension and postretirement plans to a yield curve which consists of a hypothetical portfolio of high-quality corporate bonds with varying maturity dates, as well as other factors, as a basis. The Company's pension and other postretirement benefit plan assets are primarily made up of equity and fixed-income investments. Fluctuations in actual equity and bond market returns as well as changes in general interest rates may result in increased or decreased pension and other postretirement benefit costs in the future. Management estimates the rate of compensation increase based on long-term assumed wage increases and the health care cost trend rates are determined by historical and future trends. The Company estimates that a 50 basis point decrease in the discount rate or in the expected return on plan assets would each increase expense by less than $1.3 million (after tax) for the year ended December 31, 2015.
The Company believes the estimates made for its pension and other postretirement benefits are reasonable based on the information that is known when the estimates are made. These estimates and assumptions are subject to a number of variables and are expected to change in the future. Estimates and assumptions will be affected by changes in the discount rate, the expected long-term return on plan assets, the rate of compensation increase and health care cost trend rates. The Company plans to continue to use its current methodologies to determine plan costs. For more information on the assumptions used in determining plan costs, see Item 8 - Note 14.
Income taxesIncome taxes require significant judgments and estimates including the determination of income tax expense, deferred tax assets and liabilities and, if necessary, any valuation allowances that may be required for deferred tax assets and accruals for uncertain tax positions. The effective income tax rate is subject to variability from period to period as a result of changes in federal and state income tax rates and/or changes in tax laws. In addition, the effective tax rate may be affected by other changes including the allocation of property, payroll and revenues between states. The Company estimates that a one percent change in the effective tax rate would affect the income tax expense by less than $1.9 million for the year ended December 31, 2015.
The Company provides deferred federal and state income taxes on all temporary differences between the book and tax basis of the Company's assets and liabilities. Excess deferred income tax balances associated with the Company's rate-regulated activities have been recorded as a regulatory liability and are included in other liabilities. These regulatory liabilities are expected to be reflected as a reduction in future rates charged to customers in accordance with applicable regulatory procedures.
The Company uses the deferral method of accounting for investment tax credits and amortizes the credits on regulated electric and natural gas distribution plant over various periods that conform to the ratemaking treatment prescribed by the applicable state public service commissions.
Tax positions taken or expected to be taken in an income tax return are evaluated for recognition using a more-likely-than-not threshold, and those tax positions requiring recognition are measured as the largest amount of tax benefit that is greater than 50 percent likely of being realized upon ultimate settlement with a taxing authority. The Company recognizes interest and penalties accrued related to unrecognized tax benefits in income taxes.
Significant federal tax credit carryforwards and federal and state net operating loss carryforwards have been generated. The Company may not be able to utilize all of these carryforwards prior to their expiration. As a result, the Company has recorded valuation allowances for the amounts it may not be able to utilize. Changes in tax regulations or assumptions regarding current and future taxable income could require a change to the estimated valuation allowances in the future resulting in a material impact to the Company's financial position and results of operations. For more information related to federal and state net operating loss carryforwards, see Item 8 - Notes 2 and 12.
The Company believes its estimates surrounding income taxes are reasonable based on the information that is known when the estimates are made.
Part II
MDU Resources Group, Inc. Form 10-K 43
Liquidity and Capital CommitmentsAt December 31, 2015, the Company had cash and cash equivalents of $84.6 million and available capacity of $799.2 million under the outstanding credit facilities of the Company and its subsidiaries. The Company expects to meet its obligations for debt maturing within one year from various sources, including internally generated funds; the Company's credit facilities, as described later; and through the issuance of long-term debt.
Cash flowsOperating activities The changes in cash flows from operating activities generally follow the results of operations as discussed in Financial and Operating Data and also are affected by changes in working capital. Changes in cash flows for discontinued operations are related to the exploration and production business.
Cash flows provided by operating activities in 2015 increased $37.5 million from 2014. The increase was primarily due to lower working capital requirements of $205.7 million, primarily at the natural gas distribution business, largely related to lower natural gas sales and the construction services business, largely due to lower workloads; as well as lower income tax payments. Partially offsetting this increase was lower earnings primarily due to lower commodity prices at the exploration and production business.
Cash flows provided by operating activities in 2014 decreased $150.6 million from 2013. The decrease was primarily due to higher working capital requirements of $106.5 million, primarily at the construction services business. Cash flows from discontinued operations were lower largely due to higher working capital requirements at the exploration and production business.
Investing activities Cash flows used in investing activities in 2015 decreased $521.7 million from 2014 primarily due to lower capital expenditures and higher proceeds from the sale of properties, largely at the exploration and production business.
Cash flows used in investing activities in 2014 increased $121.5 million from 2013 primarily due to higher acquisition-related capital expenditures at the exploration and production business, as well as higher capital expenditures, primarily at the refining business. Partially offsetting the increase in cash flows used in investing activities was higher proceeds from the sale of properties at the exploration and production business.
Financing activities Cash flows used in financing activities was $255.7 million in 2015 compared to cash flows provided by financing activities of $325.2 million in 2014. The change was primarily due to the lower issuance of long-term debt of $260.2 million, higher repayment of long-term debt of $201.2 million and lower issuance of common stock.
Cash flows provided by financing activities in 2014 increased $288.3 million from 2013, primarily due to the issuance of $135.5 million of common stock, as well as higher issuance of long-term debt of $98.2 million, a higher cash contribution of $59.9 million related to the noncontrolling interest and lower repayment of long-term debt of $55.5 million. Partially offsetting this increase were higher dividends paid in 2014 compared to 2013 due to the acceleration of the first quarter 2013 quarterly common stock dividend to 2012.
Defined benefit pension plansThe Company has qualified noncontributory defined benefit pension plans for certain employees. Plan assets consist of investments in equity and fixed-income securities. Various actuarial assumptions are used in calculating the benefit expense (income) and liability (asset) related to the pension plans. Actuarial assumptions include assumptions about the discount rate, expected return on plan assets and rate of future compensation increases as determined by the Company within certain guidelines. At December 31, 2015, the pension plans' accumulated benefit obligations exceeded these plans' assets by approximately $110.3 million. Pretax pension expense reflected in the years ended December 31, 2015, 2014 and 2013, was $2.0 million, $1.1 million and $3.0 million, respectively. The Company's pension expense is currently projected to be approximately $2.5 million to $3.5 million in 2016. Funding for the pension plans is actuarially determined. The minimum required contributions for 2015, 2014 and 2013 were approximately $3.9 million, $10.8 million and $13.2 million, respectively. For more information on the Company's pension plans, see Item 8 - Note 14.
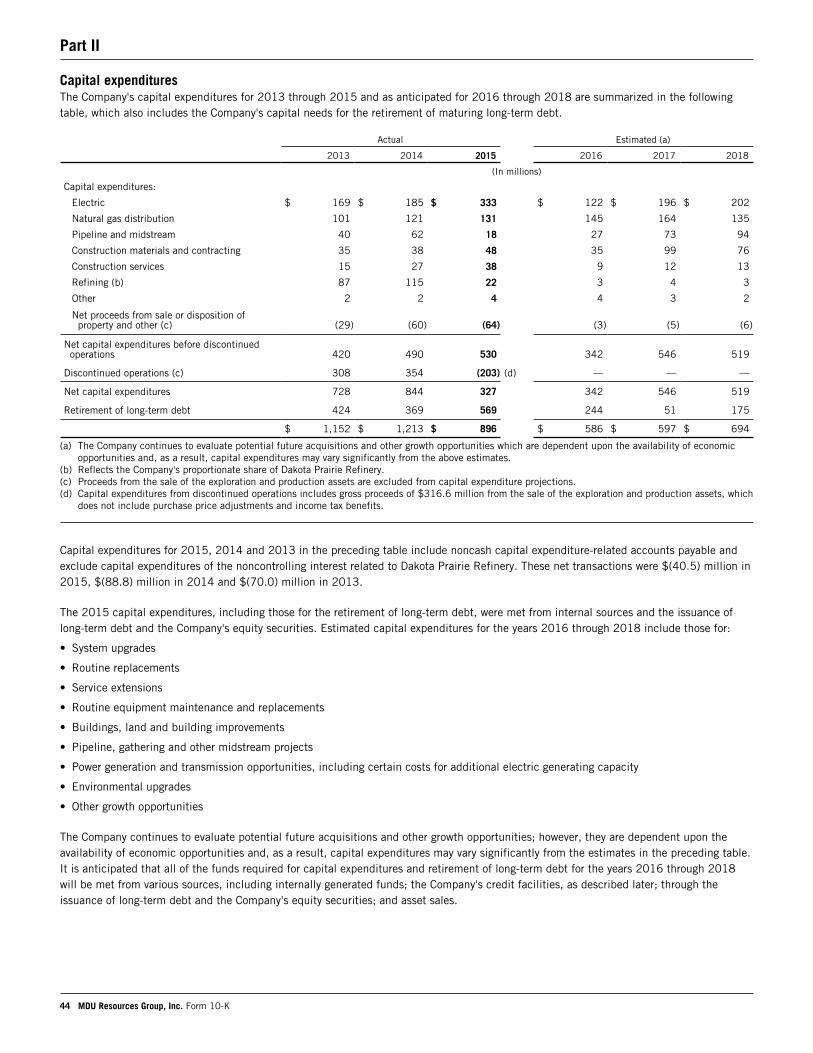
Part II
44 MDU Resources Group, Inc. Form 10-K
Capital expendituresThe Company's capital expenditures for 2013 through 2015 and as anticipated for 2016 through 2018 are summarized in the following table, which also includes the Company's capital needs for the retirement of maturing long-term debt.
Actual Estimated (a)
2013 2014 2015 2016 2017 2018
(In millions)
Capital expenditures:
Electric $ 169 $ 185 $ 333 $ 122 $ 196 $ 202
Natural gas distribution 101 121 131 145 164 135
Pipeline and midstream 40 62 18 27 73 94
Construction materials and contracting 35 38 48 35 99 76
Construction services 15 27 38 9 12 13
Refining (b) 87 115 22 3 4 3
Other 2 2 4 4 3 2
Net proceeds from sale or disposition ofproperty and other (c) (29) (60) (64) (3) (5) (6)
Net capital expenditures before discontinuedoperations 420 490 530 342 546 519
Discontinued operations (c) 308 354 (203) (d) — — —
Net capital expenditures 728 844 327 342 546 519
Retirement of long-term debt 424 369 569 244 51 175
$ 1,152 $ 1,213 $ 896 $ 586 $ 597 $ 694
(a) The Company continues to evaluate potential future acquisitions and other growth opportunities which are dependent upon the availability of economic opportunities and, as a result, capital expenditures may vary significantly from the above estimates.
(b) Reflects the Company's proportionate share of Dakota Prairie Refinery.(c) Proceeds from the sale of the exploration and production assets are excluded from capital expenditure projections.(d) Capital expenditures from discontinued operations includes gross proceeds of $316.6 million from the sale of the exploration and production assets, which
does not include purchase price adjustments and income tax benefits.
Capital expenditures for 2015, 2014 and 2013 in the preceding table include noncash capital expenditure-related accounts payable and exclude capital expenditures of the noncontrolling interest related to Dakota Prairie Refinery. These net transactions were $(40.5) million in 2015, $(88.8) million in 2014 and $(70.0) million in 2013.
The 2015 capital expenditures, including those for the retirement of long-term debt, were met from internal sources and the issuance of long-term debt and the Company's equity securities. Estimated capital expenditures for the years 2016 through 2018 include those for:
• System upgrades
• Routine replacements
• Service extensions
• Routine equipment maintenance and replacements
• Buildings, land and building improvements
• Pipeline, gathering and other midstream projects
• Power generation and transmission opportunities, including certain costs for additional electric generating capacity
• Environmental upgrades
• Other growth opportunities
The Company continues to evaluate potential future acquisitions and other growth opportunities; however, they are dependent upon the availability of economic opportunities and, as a result, capital expenditures may vary significantly from the estimates in the preceding table. It is anticipated that all of the funds required for capital expenditures and retirement of long-term debt for the years 2016 through 2018 will be met from various sources, including internally generated funds; the Company's credit facilities, as described later; through the issuance of long-term debt and the Company's equity securities; and asset sales.
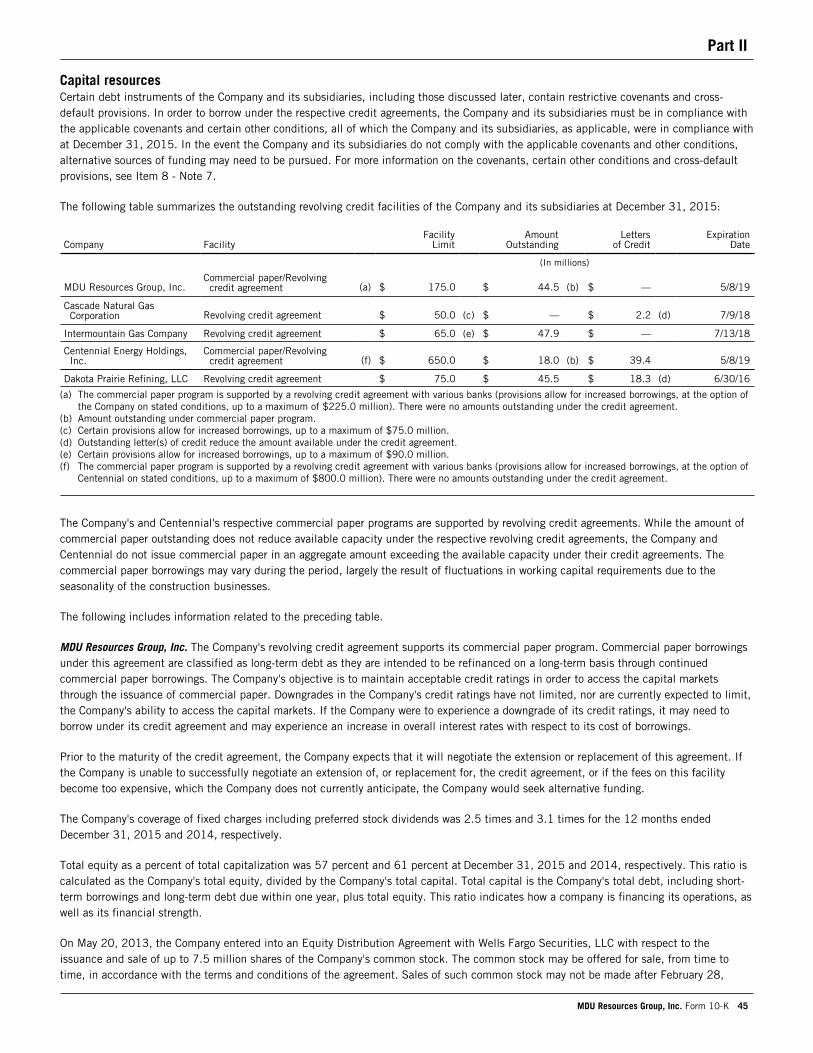
Part II
MDU Resources Group, Inc. Form 10-K 45
Capital resourcesCertain debt instruments of the Company and its subsidiaries, including those discussed later, contain restrictive covenants and cross-default provisions. In order to borrow under the respective credit agreements, the Company and its subsidiaries must be in compliance with the applicable covenants and certain other conditions, all of which the Company and its subsidiaries, as applicable, were in compliance with at December 31, 2015. In the event the Company and its subsidiaries do not comply with the applicable covenants and other conditions, alternative sources of funding may need to be pursued. For more information on the covenants, certain other conditions and cross-default provisions, see Item 8 - Note 7.
The following table summarizes the outstanding revolving credit facilities of the Company and its subsidiaries at December 31, 2015:
Company Facility Facility
Limit Amount
Outstanding Letters
of Credit Expiration
Date
(In millions)
MDU Resources Group, Inc.Commercial paper/Revolvingcredit agreement (a) $ 175.0 $ 44.5 (b) $ — 5/8/19
Cascade Natural GasCorporation Revolving credit agreement $ 50.0 (c) $ — $ 2.2 (d) 7/9/18
Intermountain Gas Company Revolving credit agreement $ 65.0 (e) $ 47.9 $ — 7/13/18
Centennial Energy Holdings,Inc.
Commercial paper/Revolvingcredit agreement (f) $ 650.0 $ 18.0 (b) $ 39.4 5/8/19
Dakota Prairie Refining, LLC Revolving credit agreement $ 75.0 $ 45.5 $ 18.3 (d) 6/30/16
(a) The commercial paper program is supported by a revolving credit agreement with various banks (provisions allow for increased borrowings, at the option of the Company on stated conditions, up to a maximum of $225.0 million). There were no amounts outstanding under the credit agreement.
(b) Amount outstanding under commercial paper program.(c) Certain provisions allow for increased borrowings, up to a maximum of $75.0 million.(d) Outstanding letter(s) of credit reduce the amount available under the credit agreement.(e) Certain provisions allow for increased borrowings, up to a maximum of $90.0 million.(f) The commercial paper program is supported by a revolving credit agreement with various banks (provisions allow for increased borrowings, at the option of
Centennial on stated conditions, up to a maximum of $800.0 million). There were no amounts outstanding under the credit agreement.
The Company's and Centennial's respective commercial paper programs are supported by revolving credit agreements. While the amount of commercial paper outstanding does not reduce available capacity under the respective revolving credit agreements, the Company and Centennial do not issue commercial paper in an aggregate amount exceeding the available capacity under their credit agreements. The commercial paper borrowings may vary during the period, largely the result of fluctuations in working capital requirements due to the seasonality of the construction businesses.
The following includes information related to the preceding table.
MDU Resources Group, Inc. The Company's revolving credit agreement supports its commercial paper program. Commercial paper borrowings under this agreement are classified as long-term debt as they are intended to be refinanced on a long-term basis through continued commercial paper borrowings. The Company's objective is to maintain acceptable credit ratings in order to access the capital markets through the issuance of commercial paper. Downgrades in the Company's credit ratings have not limited, nor are currently expected to limit, the Company's ability to access the capital markets. If the Company were to experience a downgrade of its credit ratings, it may need to borrow under its credit agreement and may experience an increase in overall interest rates with respect to its cost of borrowings.
Prior to the maturity of the credit agreement, the Company expects that it will negotiate the extension or replacement of this agreement. If the Company is unable to successfully negotiate an extension of, or replacement for, the credit agreement, or if the fees on this facility become too expensive, which the Company does not currently anticipate, the Company would seek alternative funding.
The Company's coverage of fixed charges including preferred stock dividends was 2.5 times and 3.1 times for the 12 months ended December 31, 2015 and 2014, respectively.
Total equity as a percent of total capitalization was 57 percent and 61 percent at December 31, 2015 and 2014, respectively. This ratio is calculated as the Company's total equity, divided by the Company's total capital. Total capital is the Company's total debt, including short-term borrowings and long-term debt due within one year, plus total equity. This ratio indicates how a company is financing its operations, as well as its financial strength.
On May 20, 2013, the Company entered into an Equity Distribution Agreement with Wells Fargo Securities, LLC with respect to the issuance and sale of up to 7.5 million shares of the Company's common stock. The common stock may be offered for sale, from time to time, in accordance with the terms and conditions of the agreement. Sales of such common stock may not be made after February 28,
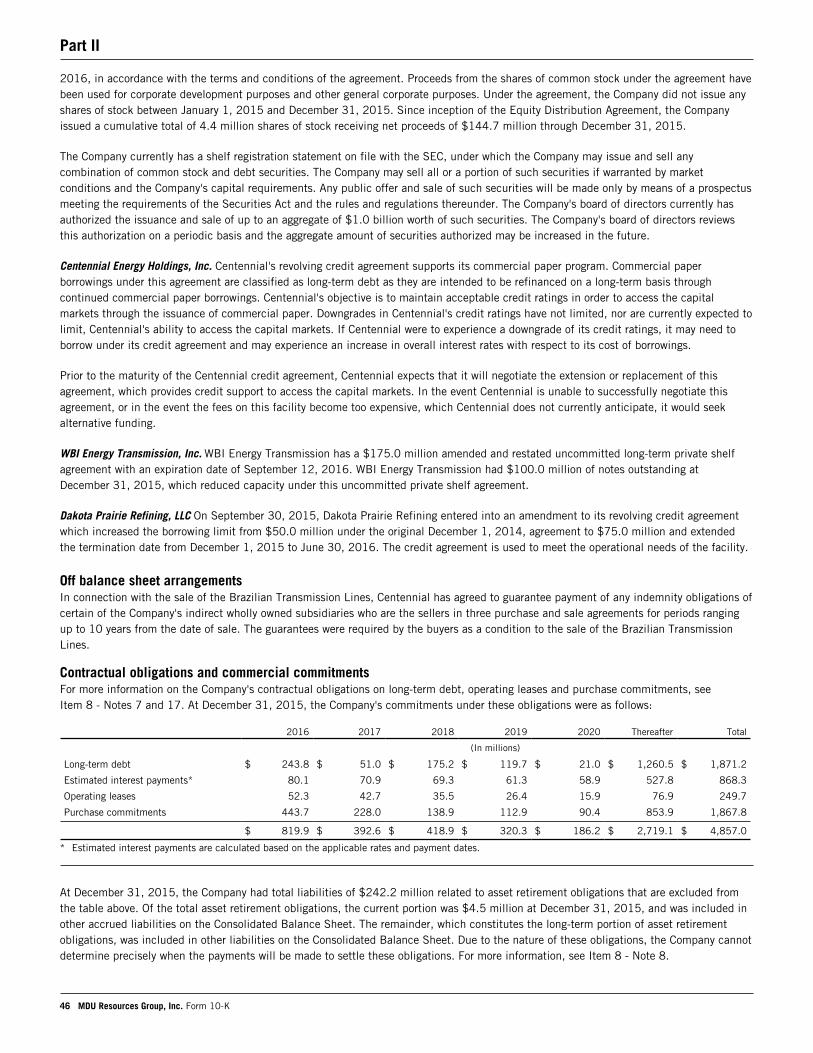
Part II
46 MDU Resources Group, Inc. Form 10-K
2016, in accordance with the terms and conditions of the agreement. Proceeds from the shares of common stock under the agreement have been used for corporate development purposes and other general corporate purposes. Under the agreement, the Company did not issue any shares of stock between January 1, 2015 and December 31, 2015. Since inception of the Equity Distribution Agreement, the Company issued a cumulative total of 4.4 million shares of stock receiving net proceeds of $144.7 million through December 31, 2015.
The Company currently has a shelf registration statement on file with the SEC, under which the Company may issue and sell any combination of common stock and debt securities. The Company may sell all or a portion of such securities if warranted by market conditions and the Company's capital requirements. Any public offer and sale of such securities will be made only by means of a prospectus meeting the requirements of the Securities Act and the rules and regulations thereunder. The Company's board of directors currently has authorized the issuance and sale of up to an aggregate of $1.0 billion worth of such securities. The Company's board of directors reviews this authorization on a periodic basis and the aggregate amount of securities authorized may be increased in the future.
Centennial Energy Holdings, Inc. Centennial's revolving credit agreement supports its commercial paper program. Commercial paper borrowings under this agreement are classified as long-term debt as they are intended to be refinanced on a long-term basis through continued commercial paper borrowings. Centennial's objective is to maintain acceptable credit ratings in order to access the capital markets through the issuance of commercial paper. Downgrades in Centennial's credit ratings have not limited, nor are currently expected to limit, Centennial's ability to access the capital markets. If Centennial were to experience a downgrade of its credit ratings, it may need to borrow under its credit agreement and may experience an increase in overall interest rates with respect to its cost of borrowings.
Prior to the maturity of the Centennial credit agreement, Centennial expects that it will negotiate the extension or replacement of this agreement, which provides credit support to access the capital markets. In the event Centennial is unable to successfully negotiate this agreement, or in the event the fees on this facility become too expensive, which Centennial does not currently anticipate, it would seek alternative funding.
WBI Energy Transmission, Inc. WBI Energy Transmission has a $175.0 million amended and restated uncommitted long-term private shelf agreement with an expiration date of September 12, 2016. WBI Energy Transmission had $100.0 million of notes outstanding at December 31, 2015, which reduced capacity under this uncommitted private shelf agreement.
Dakota Prairie Refining, LLC On September 30, 2015, Dakota Prairie Refining entered into an amendment to its revolving credit agreement which increased the borrowing limit from $50.0 million under the original December 1, 2014, agreement to $75.0 million and extended the termination date from December 1, 2015 to June 30, 2016. The credit agreement is used to meet the operational needs of the facility.
Off balance sheet arrangementsIn connection with the sale of the Brazilian Transmission Lines, Centennial has agreed to guarantee payment of any indemnity obligations of certain of the Company's indirect wholly owned subsidiaries who are the sellers in three purchase and sale agreements for periods ranging up to 10 years from the date of sale. The guarantees were required by the buyers as a condition to the sale of the Brazilian Transmission Lines.
Contractual obligations and commercial commitmentsFor more information on the Company's contractual obligations on long-term debt, operating leases and purchase commitments, see Item 8 - Notes 7 and 17. At December 31, 2015, the Company's commitments under these obligations were as follows:
2016 2017 2018 2019 2020 Thereafter Total
(In millions)
Long-term debt $ 243.8 $ 51.0 $ 175.2 $ 119.7 $ 21.0 $ 1,260.5 $ 1,871.2
Estimated interest payments* 80.1 70.9 69.3 61.3 58.9 527.8 868.3
Operating leases 52.3 42.7 35.5 26.4 15.9 76.9 249.7
Purchase commitments 443.7 228.0 138.9 112.9 90.4 853.9 1,867.8
$ 819.9 $ 392.6 $ 418.9 $ 320.3 $ 186.2 $ 2,719.1 $ 4,857.0
* Estimated interest payments are calculated based on the applicable rates and payment dates.
At December 31, 2015, the Company had total liabilities of $242.2 million related to asset retirement obligations that are excluded from the table above. Of the total asset retirement obligations, the current portion was $4.5 million at December 31, 2015, and was included in other accrued liabilities on the Consolidated Balance Sheet. The remainder, which constitutes the long-term portion of asset retirement obligations, was included in other liabilities on the Consolidated Balance Sheet. Due to the nature of these obligations, the Company cannot determine precisely when the payments will be made to settle these obligations. For more information, see Item 8 - Note 8.
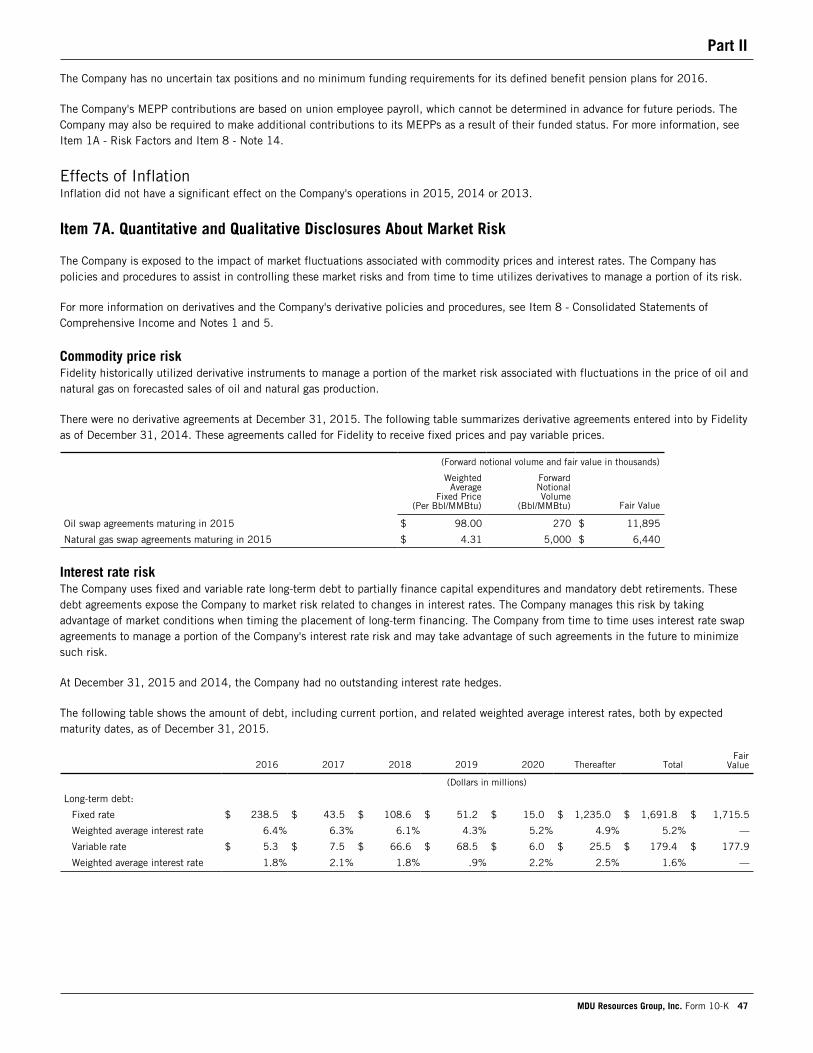
Part II
MDU Resources Group, Inc. Form 10-K 47
The Company has no uncertain tax positions and no minimum funding requirements for its defined benefit pension plans for 2016.
The Company's MEPP contributions are based on union employee payroll, which cannot be determined in advance for future periods. The Company may also be required to make additional contributions to its MEPPs as a result of their funded status. For more information, see Item 1A - Risk Factors and Item 8 - Note 14.
Effects of InflationInflation did not have a significant effect on the Company's operations in 2015, 2014 or 2013.
Item 7A. Quantitative and Qualitative Disclosures About Market Risk
The Company is exposed to the impact of market fluctuations associated with commodity prices and interest rates. The Company has policies and procedures to assist in controlling these market risks and from time to time utilizes derivatives to manage a portion of its risk.
For more information on derivatives and the Company's derivative policies and procedures, see Item 8 - Consolidated Statements of Comprehensive Income and Notes 1 and 5.
Commodity price riskFidelity historically utilized derivative instruments to manage a portion of the market risk associated with fluctuations in the price of oil and natural gas on forecasted sales of oil and natural gas production.
There were no derivative agreements at December 31, 2015. The following table summarizes derivative agreements entered into by Fidelity as of December 31, 2014. These agreements called for Fidelity to receive fixed prices and pay variable prices.
(Forward notional volume and fair value in thousands)
WeightedAverage
Fixed Price(Per Bbl/MMBtu)
ForwardNotionalVolume
(Bbl/MMBtu) Fair Value
Oil swap agreements maturing in 2015 $ 98.00 270 $ 11,895
Natural gas swap agreements maturing in 2015 $ 4.31 5,000 $ 6,440
Interest rate riskThe Company uses fixed and variable rate long-term debt to partially finance capital expenditures and mandatory debt retirements. These debt agreements expose the Company to market risk related to changes in interest rates. The Company manages this risk by taking advantage of market conditions when timing the placement of long-term financing. The Company from time to time uses interest rate swap agreements to manage a portion of the Company's interest rate risk and may take advantage of such agreements in the future to minimize such risk.
At December 31, 2015 and 2014, the Company had no outstanding interest rate hedges.
The following table shows the amount of debt, including current portion, and related weighted average interest rates, both by expected maturity dates, as of December 31, 2015.
2016 2017 2018 2019 2020 Thereafter TotalFair
Value
(Dollars in millions)
Long-term debt:
Fixed rate $ 238.5 $ 43.5 $ 108.6 $ 51.2 $ 15.0 $ 1,235.0 $ 1,691.8 $ 1,715.5
Weighted average interest rate 6.4% 6.3% 6.1% 4.3% 5.2% 4.9% 5.2% —
Variable rate $ 5.3 $ 7.5 $ 66.6 $ 68.5 $ 6.0 $ 25.5 $ 179.4 $ 177.9
Weighted average interest rate 1.8% 2.1% 1.8% .9% 2.2% 2.5% 1.6% —
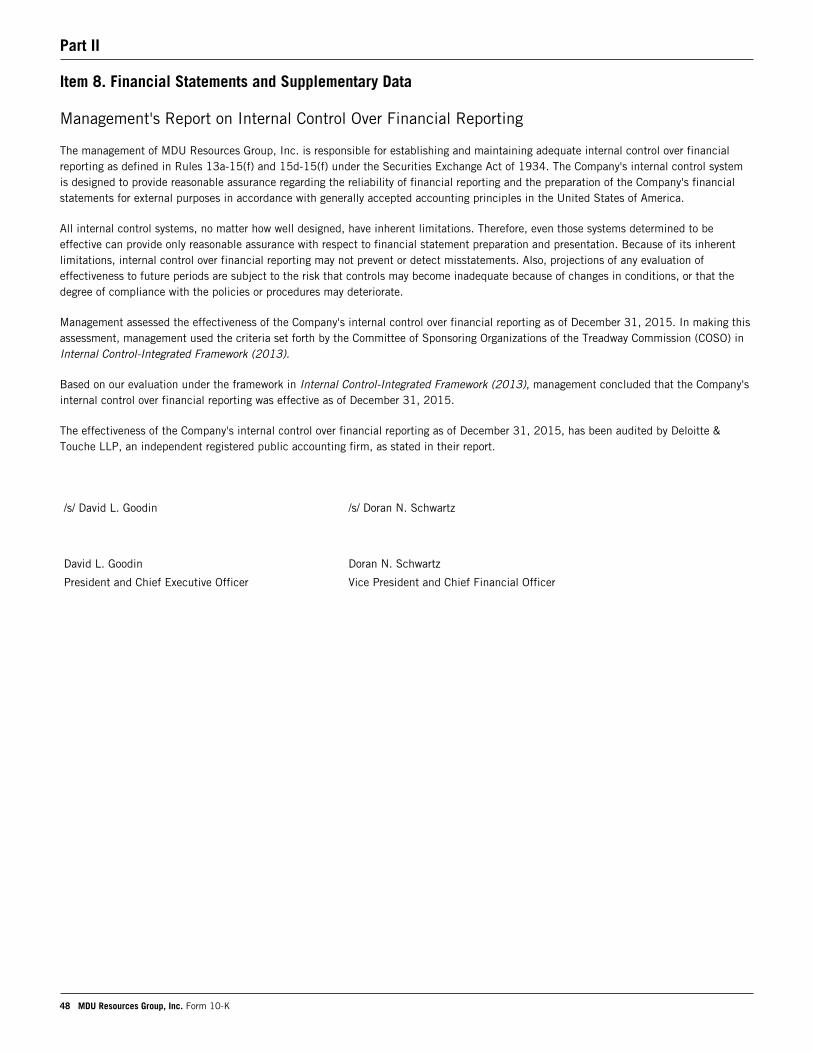
Part II
48 MDU Resources Group, Inc. Form 10-K
Item 8. Financial Statements and Supplementary Data
Management's Report on Internal Control Over Financial Reporting
The management of MDU Resources Group, Inc. is responsible for establishing and maintaining adequate internal control over financial reporting as defined in Rules 13a-15(f) and 15d-15(f) under the Securities Exchange Act of 1934. The Company's internal control system is designed to provide reasonable assurance regarding the reliability of financial reporting and the preparation of the Company's financial statements for external purposes in accordance with generally accepted accounting principles in the United States of America.
All internal control systems, no matter how well designed, have inherent limitations. Therefore, even those systems determined to be effective can provide only reasonable assurance with respect to financial statement preparation and presentation. Because of its inherent limitations, internal control over financial reporting may not prevent or detect misstatements. Also, projections of any evaluation of effectiveness to future periods are subject to the risk that controls may become inadequate because of changes in conditions, or that the degree of compliance with the policies or procedures may deteriorate.
Management assessed the effectiveness of the Company's internal control over financial reporting as of December 31, 2015. In making this assessment, management used the criteria set forth by the Committee of Sponsoring Organizations of the Treadway Commission (COSO) in Internal Control-Integrated Framework (2013).
Based on our evaluation under the framework in Internal Control-Integrated Framework (2013), management concluded that the Company's internal control over financial reporting was effective as of December 31, 2015.
The effectiveness of the Company's internal control over financial reporting as of December 31, 2015, has been audited by Deloitte & Touche LLP, an independent registered public accounting firm, as stated in their report.
/s/ David L. Goodin /s/ Doran N. Schwartz
David L. Goodin Doran N. Schwartz
President and Chief Executive Officer Vice President and Chief Financial Officer
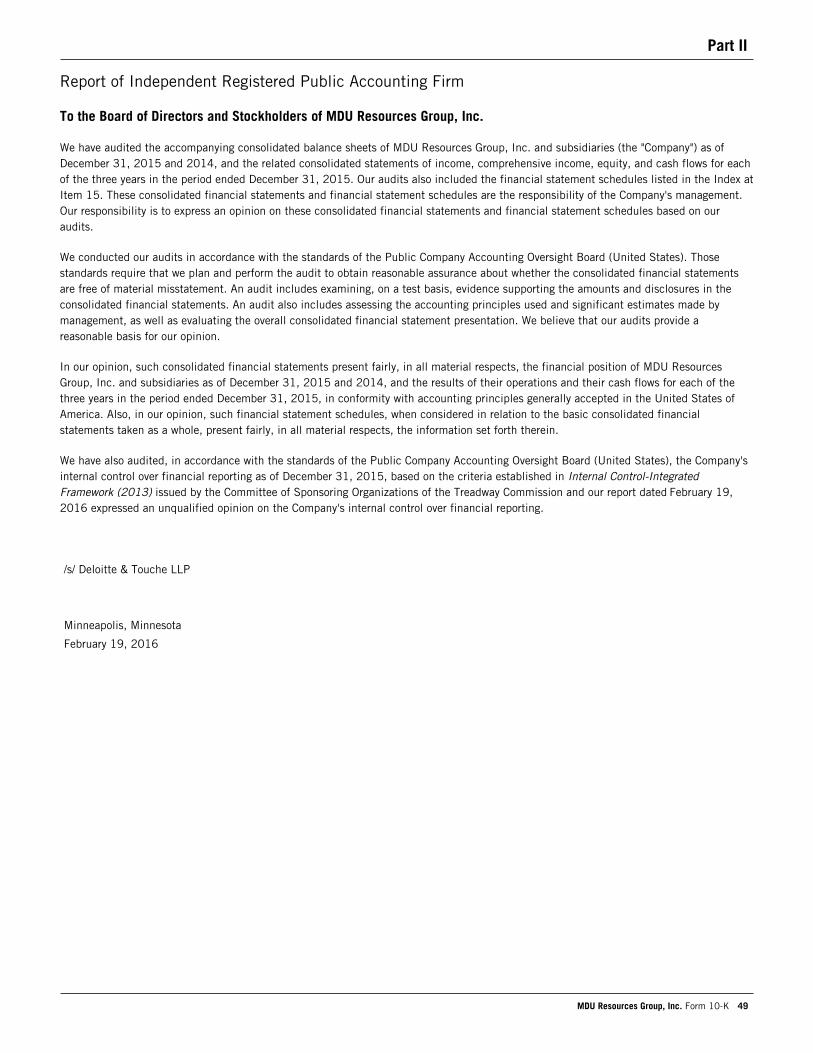
Part II
MDU Resources Group, Inc. Form 10-K 49
Report of Independent Registered Public Accounting Firm
To the Board of Directors and Stockholders of MDU Resources Group, Inc.
We have audited the accompanying consolidated balance sheets of MDU Resources Group, Inc. and subsidiaries (the "Company") as of December 31, 2015 and 2014, and the related consolidated statements of income, comprehensive income, equity, and cash flows for each of the three years in the period ended December 31, 2015. Our audits also included the financial statement schedules listed in the Index at Item 15. These consolidated financial statements and financial statement schedules are the responsibility of the Company's management. Our responsibility is to express an opinion on these consolidated financial statements and financial statement schedules based on our audits.
We conducted our audits in accordance with the standards of the Public Company Accounting Oversight Board (United States). Those standards require that we plan and perform the audit to obtain reasonable assurance about whether the consolidated financial statements are free of material misstatement. An audit includes examining, on a test basis, evidence supporting the amounts and disclosures in the consolidated financial statements. An audit also includes assessing the accounting principles used and significant estimates made by management, as well as evaluating the overall consolidated financial statement presentation. We believe that our audits provide a reasonable basis for our opinion.
In our opinion, such consolidated financial statements present fairly, in all material respects, the financial position of MDU Resources Group, Inc. and subsidiaries as of December 31, 2015 and 2014, and the results of their operations and their cash flows for each of the three years in the period ended December 31, 2015, in conformity with accounting principles generally accepted in the United States of America. Also, in our opinion, such financial statement schedules, when considered in relation to the basic consolidated financial statements taken as a whole, present fairly, in all material respects, the information set forth therein.
We have also audited, in accordance with the standards of the Public Company Accounting Oversight Board (United States), the Company's internal control over financial reporting as of December 31, 2015, based on the criteria established in Internal Control-Integrated Framework (2013) issued by the Committee of Sponsoring Organizations of the Treadway Commission and our report dated February 19, 2016 expressed an unqualified opinion on the Company's internal control over financial reporting.
/s/ Deloitte & Touche LLP
Minneapolis, Minnesota
February 19, 2016
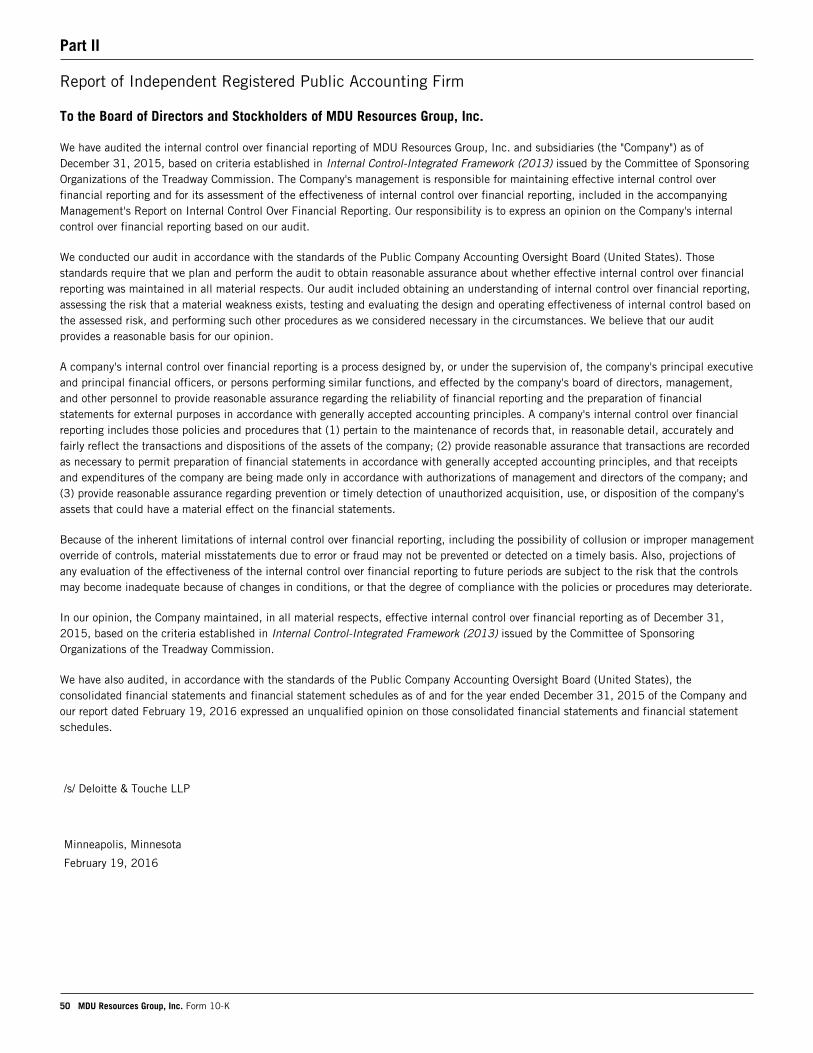
Part II
50 MDU Resources Group, Inc. Form 10-K
Report of Independent Registered Public Accounting Firm
To the Board of Directors and Stockholders of MDU Resources Group, Inc.
We have audited the internal control over financial reporting of MDU Resources Group, Inc. and subsidiaries (the "Company") as of December 31, 2015, based on criteria established in Internal Control-Integrated Framework (2013) issued by the Committee of Sponsoring Organizations of the Treadway Commission. The Company's management is responsible for maintaining effective internal control over financial reporting and for its assessment of the effectiveness of internal control over financial reporting, included in the accompanying Management's Report on Internal Control Over Financial Reporting. Our responsibility is to express an opinion on the Company's internal control over financial reporting based on our audit.
We conducted our audit in accordance with the standards of the Public Company Accounting Oversight Board (United States). Those standards require that we plan and perform the audit to obtain reasonable assurance about whether effective internal control over financial reporting was maintained in all material respects. Our audit included obtaining an understanding of internal control over financial reporting, assessing the risk that a material weakness exists, testing and evaluating the design and operating effectiveness of internal control based on the assessed risk, and performing such other procedures as we considered necessary in the circumstances. We believe that our audit provides a reasonable basis for our opinion.
A company's internal control over financial reporting is a process designed by, or under the supervision of, the company's principal executive and principal financial officers, or persons performing similar functions, and effected by the company's board of directors, management, and other personnel to provide reasonable assurance regarding the reliability of financial reporting and the preparation of financial statements for external purposes in accordance with generally accepted accounting principles. A company's internal control over financial reporting includes those policies and procedures that (1) pertain to the maintenance of records that, in reasonable detail, accurately and fairly reflect the transactions and dispositions of the assets of the company; (2) provide reasonable assurance that transactions are recorded as necessary to permit preparation of financial statements in accordance with generally accepted accounting principles, and that receipts and expenditures of the company are being made only in accordance with authorizations of management and directors of the company; and (3) provide reasonable assurance regarding prevention or timely detection of unauthorized acquisition, use, or disposition of the company's assets that could have a material effect on the financial statements.
Because of the inherent limitations of internal control over financial reporting, including the possibility of collusion or improper management override of controls, material misstatements due to error or fraud may not be prevented or detected on a timely basis. Also, projections of any evaluation of the effectiveness of the internal control over financial reporting to future periods are subject to the risk that the controls may become inadequate because of changes in conditions, or that the degree of compliance with the policies or procedures may deteriorate.
In our opinion, the Company maintained, in all material respects, effective internal control over financial reporting as of December 31, 2015, based on the criteria established in Internal Control-Integrated Framework (2013) issued by the Committee of Sponsoring Organizations of the Treadway Commission.
We have also audited, in accordance with the standards of the Public Company Accounting Oversight Board (United States), the consolidated financial statements and financial statement schedules as of and for the year ended December 31, 2015 of the Company and our report dated February 19, 2016 expressed an unqualified opinion on those consolidated financial statements and financial statement schedules.
/s/ Deloitte & Touche LLP
Minneapolis, Minnesota
February 19, 2016
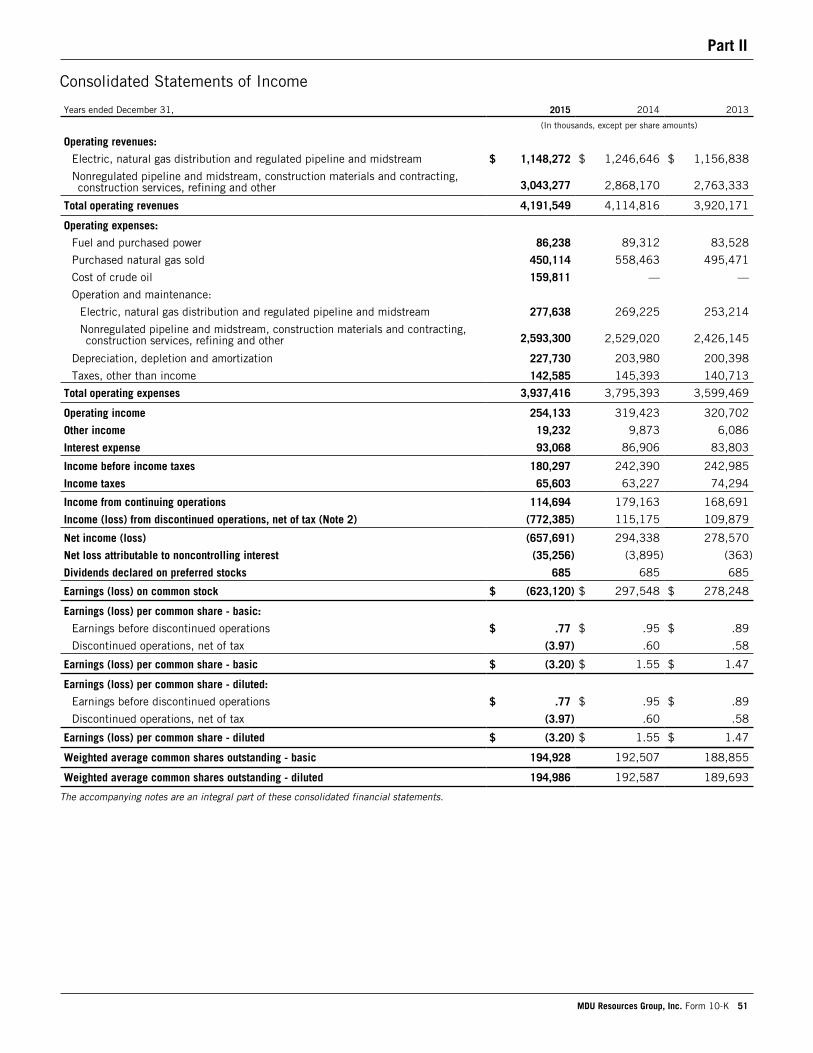
Part II
MDU Resources Group, Inc. Form 10-K 51
Consolidated Statements of Income
Years ended December 31, 2015 2014 2013
(In thousands, except per share amounts)
Operating revenues:
Electric, natural gas distribution and regulated pipeline and midstream $ 1,148,272 $ 1,246,646 $ 1,156,838
Nonregulated pipeline and midstream, construction materials and contracting, construction services, refining and other 3,043,277 2,868,170 2,763,333
Total operating revenues 4,191,549 4,114,816 3,920,171
Operating expenses:
Fuel and purchased power 86,238 89,312 83,528
Purchased natural gas sold 450,114 558,463 495,471
Cost of crude oil 159,811 — —
Operation and maintenance:
Electric, natural gas distribution and regulated pipeline and midstream 277,638 269,225 253,214
Nonregulated pipeline and midstream, construction materials and contracting,construction services, refining and other 2,593,300 2,529,020 2,426,145
Depreciation, depletion and amortization 227,730 203,980 200,398
Taxes, other than income 142,585 145,393 140,713
Total operating expenses 3,937,416 3,795,393 3,599,469
Operating income 254,133 319,423 320,702
Other income 19,232 9,873 6,086
Interest expense 93,068 86,906 83,803
Income before income taxes 180,297 242,390 242,985
Income taxes 65,603 63,227 74,294
Income from continuing operations 114,694 179,163 168,691
Income (loss) from discontinued operations, net of tax (Note 2) (772,385) 115,175 109,879
Net income (loss) (657,691) 294,338 278,570
Net loss attributable to noncontrolling interest (35,256) (3,895) (363)
Dividends declared on preferred stocks 685 685 685
Earnings (loss) on common stock $ (623,120) $ 297,548 $ 278,248
Earnings (loss) per common share - basic:
Earnings before discontinued operations $ .77 $ .95 $ .89
Discontinued operations, net of tax (3.97) .60 .58
Earnings (loss) per common share - basic $ (3.20) $ 1.55 $ 1.47
Earnings (loss) per common share - diluted:
Earnings before discontinued operations $ .77 $ .95 $ .89
Discontinued operations, net of tax (3.97) .60 .58
Earnings (loss) per common share - diluted $ (3.20) $ 1.55 $ 1.47
Weighted average common shares outstanding - basic 194,928 192,507 188,855
Weighted average common shares outstanding - diluted 194,986 192,587 189,693
The accompanying notes are an integral part of these consolidated financial statements.
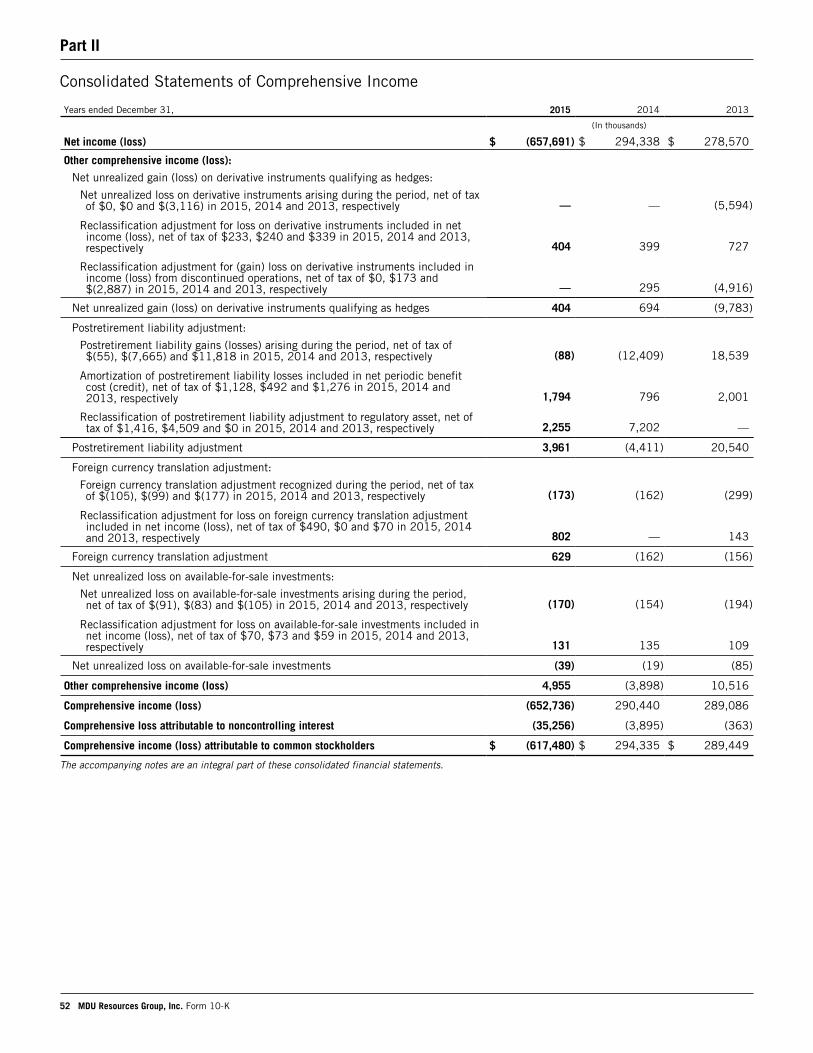
Part II
52 MDU Resources Group, Inc. Form 10-K
Consolidated Statements of Comprehensive Income
Years ended December 31, 2015 2014 2013
(In thousands)
Net income (loss) $ (657,691) $ 294,338 $ 278,570
Other comprehensive income (loss):
Net unrealized gain (loss) on derivative instruments qualifying as hedges:
Net unrealized loss on derivative instruments arising during the period, net of taxof $0, $0 and $(3,116) in 2015, 2014 and 2013, respectively — — (5,594)
Reclassification adjustment for loss on derivative instruments included in netincome (loss), net of tax of $233, $240 and $339 in 2015, 2014 and 2013,respectively 404 399 727
Reclassification adjustment for (gain) loss on derivative instruments included inincome (loss) from discontinued operations, net of tax of $0, $173 and$(2,887) in 2015, 2014 and 2013, respectively — 295 (4,916)
Net unrealized gain (loss) on derivative instruments qualifying as hedges 404 694 (9,783)
Postretirement liability adjustment:
Postretirement liability gains (losses) arising during the period, net of tax of$(55), $(7,665) and $11,818 in 2015, 2014 and 2013, respectively (88) (12,409) 18,539
Amortization of postretirement liability losses included in net periodic benefitcost (credit), net of tax of $1,128, $492 and $1,276 in 2015, 2014 and2013, respectively 1,794 796 2,001
Reclassification of postretirement liability adjustment to regulatory asset, net oftax of $1,416, $4,509 and $0 in 2015, 2014 and 2013, respectively 2,255 7,202 —
Postretirement liability adjustment 3,961 (4,411) 20,540
Foreign currency translation adjustment:
Foreign currency translation adjustment recognized during the period, net of taxof $(105), $(99) and $(177) in 2015, 2014 and 2013, respectively (173) (162) (299)
Reclassification adjustment for loss on foreign currency translation adjustmentincluded in net income (loss), net of tax of $490, $0 and $70 in 2015, 2014and 2013, respectively 802 — 143
Foreign currency translation adjustment 629 (162) (156)
Net unrealized loss on available-for-sale investments:
Net unrealized loss on available-for-sale investments arising during the period,net of tax of $(91), $(83) and $(105) in 2015, 2014 and 2013, respectively (170) (154) (194)
Reclassification adjustment for loss on available-for-sale investments included innet income (loss), net of tax of $70, $73 and $59 in 2015, 2014 and 2013,respectively 131 135 109
Net unrealized loss on available-for-sale investments (39) (19) (85)
Other comprehensive income (loss) 4,955 (3,898) 10,516
Comprehensive income (loss) (652,736) 290,440 289,086
Comprehensive loss attributable to noncontrolling interest (35,256) (3,895) (363)
Comprehensive income (loss) attributable to common stockholders $ (617,480) $ 294,335 $ 289,449
The accompanying notes are an integral part of these consolidated financial statements.
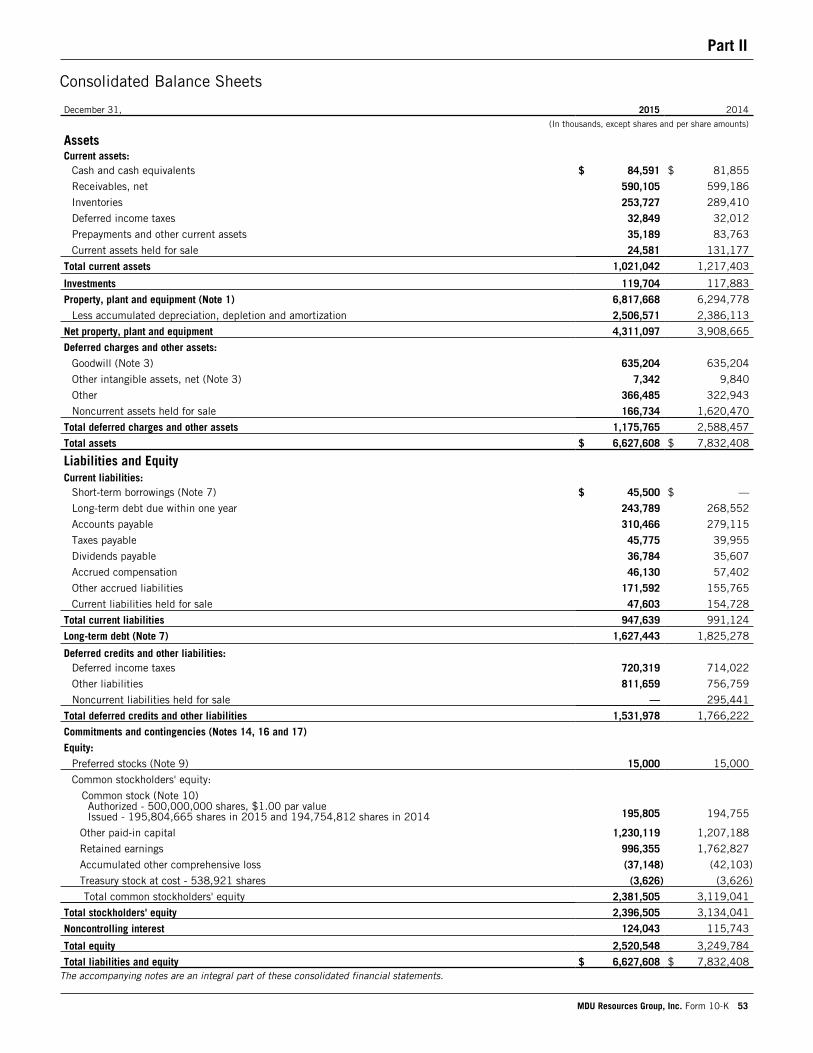
Part II
MDU Resources Group, Inc. Form 10-K 53
Consolidated Balance Sheets
December 31, 2015 2014
(In thousands, except shares and per share amounts)
AssetsCurrent assets:
Cash and cash equivalents $ 84,591 $ 81,855
Receivables, net 590,105 599,186
Inventories 253,727 289,410
Deferred income taxes 32,849 32,012
Prepayments and other current assets 35,189 83,763
Current assets held for sale 24,581 131,177
Total current assets 1,021,042 1,217,403
Investments 119,704 117,883
Property, plant and equipment (Note 1) 6,817,668 6,294,778
Less accumulated depreciation, depletion and amortization 2,506,571 2,386,113
Net property, plant and equipment 4,311,097 3,908,665
Deferred charges and other assets:Goodwill (Note 3) 635,204 635,204
Other intangible assets, net (Note 3) 7,342 9,840
Other 366,485 322,943
Noncurrent assets held for sale 166,734 1,620,470
Total deferred charges and other assets 1,175,765 2,588,457
Total assets $ 6,627,608 $ 7,832,408
Liabilities and Equity
Current liabilities:Short-term borrowings (Note 7) $ 45,500 $ —
Long-term debt due within one year 243,789 268,552
Accounts payable 310,466 279,115
Taxes payable 45,775 39,955
Dividends payable 36,784 35,607
Accrued compensation 46,130 57,402
Other accrued liabilities 171,592 155,765
Current liabilities held for sale 47,603 154,728
Total current liabilities 947,639 991,124
Long-term debt (Note 7) 1,627,443 1,825,278
Deferred credits and other liabilities:Deferred income taxes 720,319 714,022
Other liabilities 811,659 756,759
Noncurrent liabilities held for sale — 295,441
Total deferred credits and other liabilities 1,531,978 1,766,222
Commitments and contingencies (Notes 14, 16 and 17)
Equity:Preferred stocks (Note 9) 15,000 15,000
Common stockholders' equity:
Common stock (Note 10)Authorized - 500,000,000 shares, $1.00 par valueIssued - 195,804,665 shares in 2015 and 194,754,812 shares in 2014 195,805 194,755
Other paid-in capital 1,230,119 1,207,188
Retained earnings 996,355 1,762,827
Accumulated other comprehensive loss (37,148) (42,103)
Treasury stock at cost - 538,921 shares (3,626) (3,626)
Total common stockholders' equity 2,381,505 3,119,041
Total stockholders' equity 2,396,505 3,134,041
Noncontrolling interest 124,043 115,743
Total equity 2,520,548 3,249,784
Total liabilities and equity $ 6,627,608 $ 7,832,408The accompanying notes are an integral part of these consolidated financial statements.
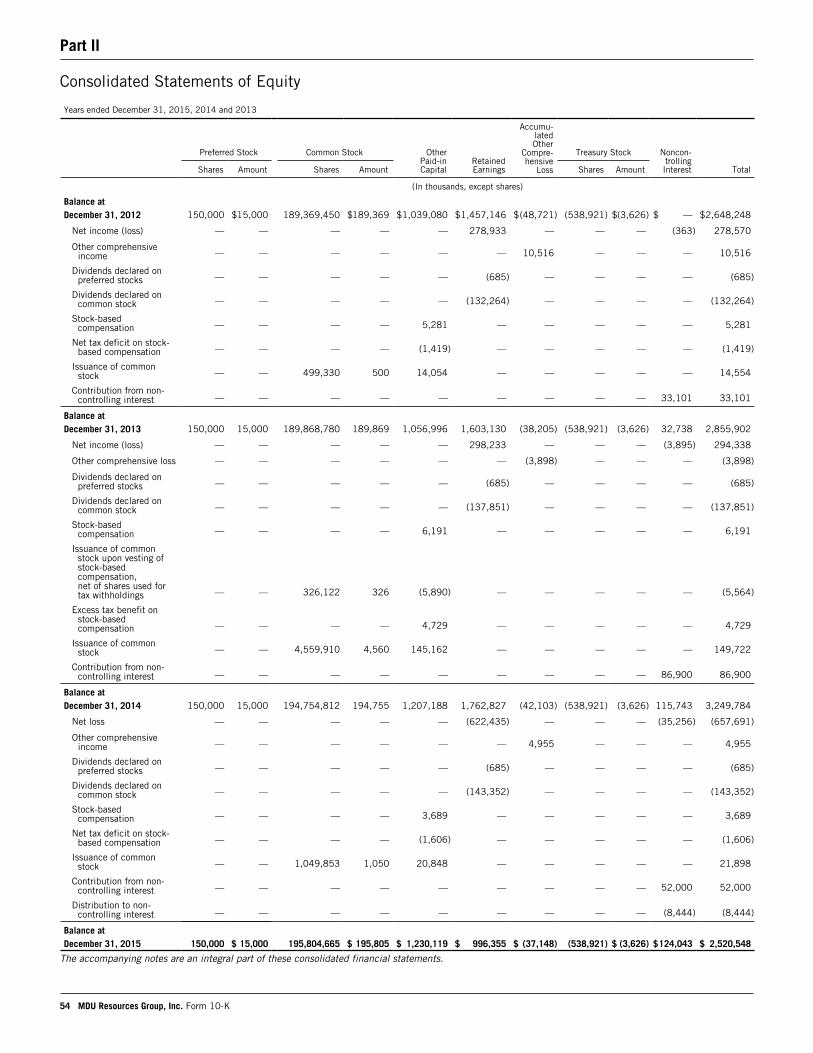
Part II
54 MDU Resources Group, Inc. Form 10-K
Consolidated Statements of Equity
Years ended December 31, 2015, 2014 and 2013
OtherPaid-in Capital
RetainedEarnings
Accumu-latedOther
Compre-hensive
Loss
Noncon-trollingInterest
Preferred Stock Common Stock Treasury Stock
Shares Amount Shares Amount Shares Amount Total
(In thousands, except shares)
Balance atDecember 31, 2012 150,000 $15,000 189,369,450 $189,369 $1,039,080 $1,457,146 $(48,721) (538,921) $(3,626) $ — $2,648,248
Net income (loss) — — — — — 278,933 — — — (363) 278,570
Other comprehensiveincome — — — — — — 10,516 — — — 10,516
Dividends declared onpreferred stocks — — — — — (685) — — — — (685)
Dividends declared oncommon stock — — — — — (132,264) — — — — (132,264)
Stock-basedcompensation — — — — 5,281 — — — — — 5,281
Net tax deficit on stock-based compensation — — — — (1,419) — — — — — (1,419)
Issuance of commonstock — — 499,330 500 14,054 — — — — — 14,554
Contribution from non-controlling interest — — — — — — — — — 33,101 33,101
Balance atDecember 31, 2013 150,000 15,000 189,868,780 189,869 1,056,996 1,603,130 (38,205) (538,921) (3,626) 32,738 2,855,902
Net income (loss) — — — — — 298,233 — — — (3,895) 294,338
Other comprehensive loss — — — — — — (3,898) — — — (3,898)
Dividends declared onpreferred stocks — — — — — (685) — — — — (685)
Dividends declared oncommon stock — — — — — (137,851) — — — — (137,851)
Stock-basedcompensation — — — — 6,191 — — — — — 6,191
Issuance of commonstock upon vesting ofstock-basedcompensation,net of shares used fortax withholdings — — 326,122 326 (5,890) — — — — — (5,564)
Excess tax benefit onstock-basedcompensation — — — — 4,729 — — — — — 4,729
Issuance of commonstock — — 4,559,910 4,560 145,162 — — — — — 149,722
Contribution from non-controlling interest — — — — — — — — — 86,900 86,900
Balance atDecember 31, 2014 150,000 15,000 194,754,812 194,755 1,207,188 1,762,827 (42,103) (538,921) (3,626) 115,743 3,249,784
Net loss — — — — — (622,435) — — — (35,256) (657,691)
Other comprehensiveincome — — — — — — 4,955 — — — 4,955
Dividends declared onpreferred stocks — — — — — (685) — — — — (685)
Dividends declared oncommon stock — — — — — (143,352) — — — — (143,352)
Stock-basedcompensation — — — — 3,689 — — — — — 3,689
Net tax deficit on stock-based compensation — — — — (1,606) — — — — — (1,606)
Issuance of commonstock — — 1,049,853 1,050 20,848 — — — — — 21,898
Contribution from non-controlling interest — — — — — — — — — 52,000 52,000
Distribution to non-controlling interest — — — — — — — — — (8,444) (8,444)
Balance atDecember 31, 2015 150,000 $ 15,000 195,804,665 $ 195,805 $ 1,230,119 $ 996,355 $ (37,148) (538,921) $ (3,626) $124,043 $ 2,520,548
The accompanying notes are an integral part of these consolidated financial statements.
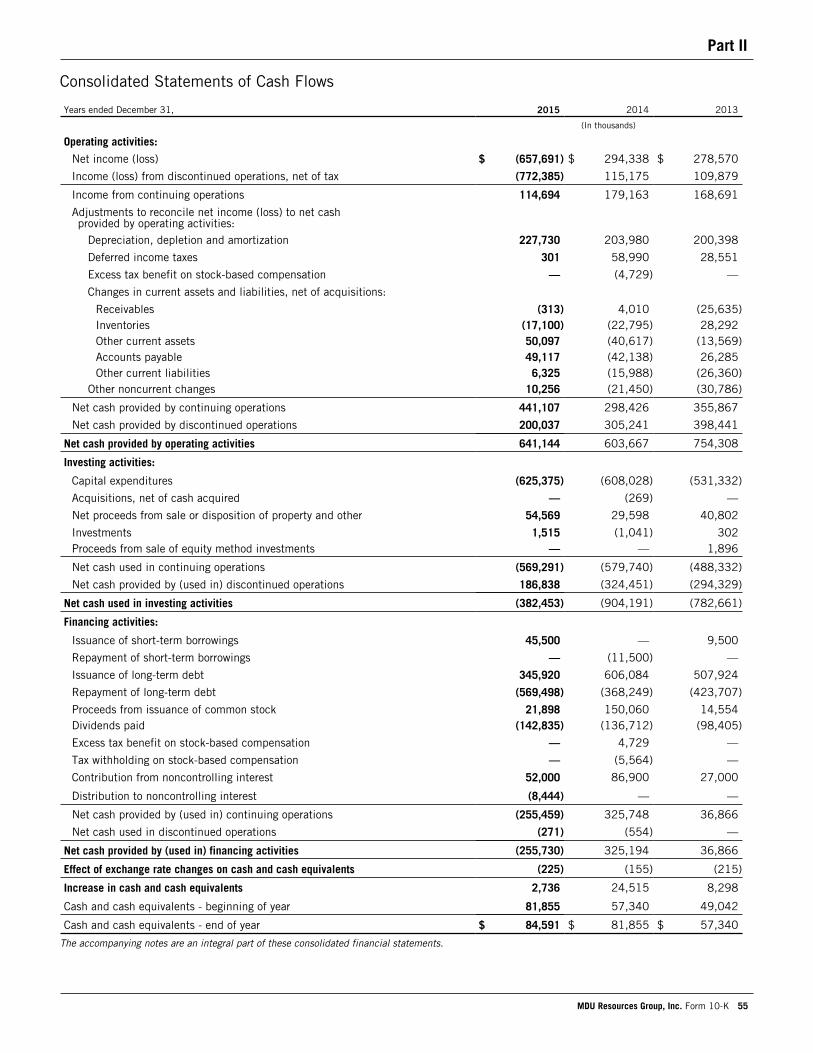
Part II
MDU Resources Group, Inc. Form 10-K 55
Consolidated Statements of Cash Flows
Years ended December 31, 2015 2014 2013
(In thousands)
Operating activities:
Net income (loss) $ (657,691) $ 294,338 $ 278,570
Income (loss) from discontinued operations, net of tax (772,385) 115,175 109,879
Income from continuing operations 114,694 179,163 168,691
Adjustments to reconcile net income (loss) to net cashprovided by operating activities:
Depreciation, depletion and amortization 227,730 203,980 200,398
Deferred income taxes 301 58,990 28,551
Excess tax benefit on stock-based compensation — (4,729) —
Changes in current assets and liabilities, net of acquisitions:
Receivables (313) 4,010 (25,635)Inventories (17,100) (22,795) 28,292Other current assets 50,097 (40,617) (13,569)Accounts payable 49,117 (42,138) 26,285Other current liabilities 6,325 (15,988) (26,360)
Other noncurrent changes 10,256 (21,450) (30,786)
Net cash provided by continuing operations 441,107 298,426 355,867
Net cash provided by discontinued operations 200,037 305,241 398,441
Net cash provided by operating activities 641,144 603,667 754,308
Investing activities:
Capital expenditures (625,375) (608,028) (531,332)
Acquisitions, net of cash acquired — (269) —
Net proceeds from sale or disposition of property and other 54,569 29,598 40,802
Investments 1,515 (1,041) 302Proceeds from sale of equity method investments — — 1,896
Net cash used in continuing operations (569,291) (579,740) (488,332)
Net cash provided by (used in) discontinued operations 186,838 (324,451) (294,329)
Net cash used in investing activities (382,453) (904,191) (782,661)
Financing activities:
Issuance of short-term borrowings 45,500 — 9,500
Repayment of short-term borrowings — (11,500) —
Issuance of long-term debt 345,920 606,084 507,924
Repayment of long-term debt (569,498) (368,249) (423,707)
Proceeds from issuance of common stock 21,898 150,060 14,554Dividends paid (142,835) (136,712) (98,405)
Excess tax benefit on stock-based compensation — 4,729 —
Tax withholding on stock-based compensation — (5,564) —
Contribution from noncontrolling interest 52,000 86,900 27,000
Distribution to noncontrolling interest (8,444) — —
Net cash provided by (used in) continuing operations (255,459) 325,748 36,866
Net cash used in discontinued operations (271) (554) —
Net cash provided by (used in) financing activities (255,730) 325,194 36,866
Effect of exchange rate changes on cash and cash equivalents (225) (155) (215)
Increase in cash and cash equivalents 2,736 24,515 8,298
Cash and cash equivalents - beginning of year 81,855 57,340 49,042
Cash and cash equivalents - end of year $ 84,591 $ 81,855 $ 57,340
The accompanying notes are an integral part of these consolidated financial statements.
Part II
56 MDU Resources Group, Inc. Form 10-K
Notes to Consolidated Financial Statements
Note 1 - Summary of Significant Accounting PoliciesBasis of presentationThe abbreviations and acronyms used throughout are defined following the Notes to Consolidated Financial Statements. The consolidated financial statements of the Company include the accounts of the following businesses: electric, natural gas distribution, pipeline and midstream, construction materials and contracting, construction services, refining and other. The electric and natural gas distribution businesses, as well as a portion of the pipeline and midstream business, are regulated. Construction materials and contracting, construction services, refining and the other businesses, as well as a portion of the pipeline and midstream business, are nonregulated. For further descriptions of the Company's businesses, see Note 13. Intercompany balances and transactions have been eliminated in consolidation, except for certain transactions related to the Company's regulated operations in accordance with GAAP. The statements also include the ownership interests in the assets, liabilities and expenses of jointly owned electric generating facilities.
The Company's regulated businesses are subject to various state and federal agency regulations. The accounting policies followed by these businesses are generally subject to the Uniform System of Accounts of the FERC. These accounting policies differ in some respects from those used by the Company's nonregulated businesses.
The Company's regulated businesses account for certain income and expense items under the provisions of regulatory accounting, which requires these businesses to defer as regulatory assets or liabilities certain items that would have otherwise been reflected as expense or income, respectively, based on the expected regulatory treatment in future rates. The expected recovery or flowback of these deferred items generally is based on specific ratemaking decisions or precedent for each item. Regulatory assets and liabilities are being amortized consistently with the regulatory treatment established by the FERC and the applicable state public service commissions. See Note 4 for more information regarding the nature and amounts of these regulatory deferrals.
Depreciation, depletion and amortization expense is reported separately on the Consolidated Statements of Income and therefore is excluded from the other line items within operating expenses.
Management has also evaluated the impact of events occurring after December 31, 2015, up to the date of issuance of these consolidated financial statements.
In the second quarter of 2015, the Company announced its plan to market Fidelity, previously referred to as the Company's exploration and production segment, and exit that line of business. In the third and fourth quarters of 2015 and the first quarter of 2016, the Company entered into purchase and sale agreements to sell the vast majority of Fidelity's assets, comprising greater than 93 percent of total production for 2014. The Company's consolidated financial statements and accompanying notes for current and prior periods have been restated to present the results of operations of Fidelity as discontinued operations, other than certain general and administrative costs and interest expense which were previously allocated to the former exploration and production segment and do not meet the criteria for income (loss) from discontinued operations. In addition, the assets and liabilities have been treated and classified as held for sale. Unless otherwise indicated, the amounts presented in the accompanying notes to the consolidated financial statements relate to the Company's continuing operations. For more information on discontinued operations, see Note 2.
Cash and cash equivalentsThe Company considers all highly liquid investments purchased with an original maturity of three months or less to be cash equivalents.
Accounts receivable and allowance for doubtful accountsAccounts receivable consists primarily of trade receivables from the sale of goods and services which are recorded at the invoiced amount net of allowance for doubtful accounts, and costs and estimated earnings in excess of billings on uncompleted contracts. For more information, see Percentage-of-completion method in this note. The total balance of receivables past due 90 days or more was $27.8 million and $29.4 million at December 31, 2015 and 2014, respectively.
The allowance for doubtful accounts is determined through a review of past due balances and other specific account data. Account balances are written off when management determines the amounts to be uncollectible. The Company's allowance for doubtful accounts at December 31, 2015 and 2014, was $9.8 million and $9.5 million, respectively.
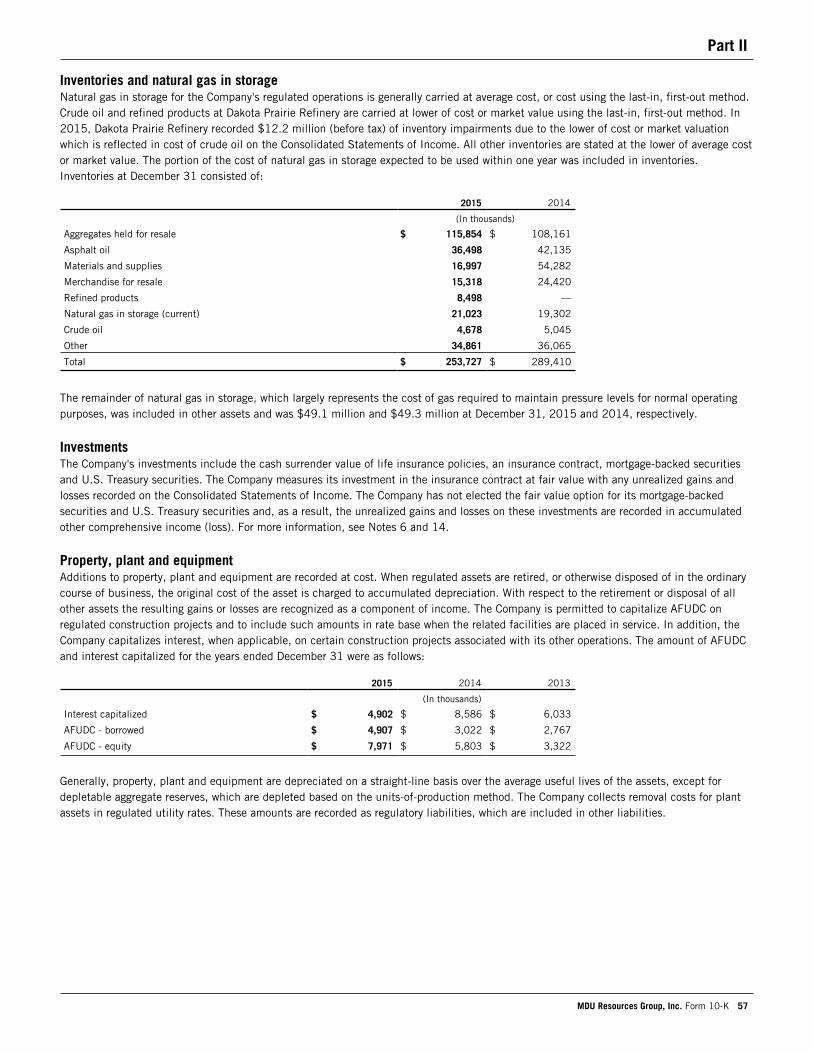
Part II
MDU Resources Group, Inc. Form 10-K 57
Inventories and natural gas in storageNatural gas in storage for the Company's regulated operations is generally carried at average cost, or cost using the last-in, first-out method. Crude oil and refined products at Dakota Prairie Refinery are carried at lower of cost or market value using the last-in, first-out method. In 2015, Dakota Prairie Refinery recorded $12.2 million (before tax) of inventory impairments due to the lower of cost or market valuation which is reflected in cost of crude oil on the Consolidated Statements of Income. All other inventories are stated at the lower of average cost or market value. The portion of the cost of natural gas in storage expected to be used within one year was included in inventories. Inventories at December 31 consisted of:
2015 2014
(In thousands)
Aggregates held for resale $ 115,854 $ 108,161
Asphalt oil 36,498 42,135
Materials and supplies 16,997 54,282
Merchandise for resale 15,318 24,420
Refined products 8,498 —
Natural gas in storage (current) 21,023 19,302
Crude oil 4,678 5,045
Other 34,861 36,065
Total $ 253,727 $ 289,410
The remainder of natural gas in storage, which largely represents the cost of gas required to maintain pressure levels for normal operating purposes, was included in other assets and was $49.1 million and $49.3 million at December 31, 2015 and 2014, respectively.
InvestmentsThe Company's investments include the cash surrender value of life insurance policies, an insurance contract, mortgage-backed securities and U.S. Treasury securities. The Company measures its investment in the insurance contract at fair value with any unrealized gains and losses recorded on the Consolidated Statements of Income. The Company has not elected the fair value option for its mortgage-backed securities and U.S. Treasury securities and, as a result, the unrealized gains and losses on these investments are recorded in accumulated other comprehensive income (loss). For more information, see Notes 6 and 14.
Property, plant and equipmentAdditions to property, plant and equipment are recorded at cost. When regulated assets are retired, or otherwise disposed of in the ordinary course of business, the original cost of the asset is charged to accumulated depreciation. With respect to the retirement or disposal of all other assets the resulting gains or losses are recognized as a component of income. The Company is permitted to capitalize AFUDC on regulated construction projects and to include such amounts in rate base when the related facilities are placed in service. In addition, the Company capitalizes interest, when applicable, on certain construction projects associated with its other operations. The amount of AFUDC and interest capitalized for the years ended December 31 were as follows:
2015 2014 2013
(In thousands)
Interest capitalized $ 4,902 $ 8,586 $ 6,033
AFUDC - borrowed $ 4,907 $ 3,022 $ 2,767
AFUDC - equity $ 7,971 $ 5,803 $ 3,322
Generally, property, plant and equipment are depreciated on a straight-line basis over the average useful lives of the assets, except for depletable aggregate reserves, which are depleted based on the units-of-production method. The Company collects removal costs for plant assets in regulated utility rates. These amounts are recorded as regulatory liabilities, which are included in other liabilities.
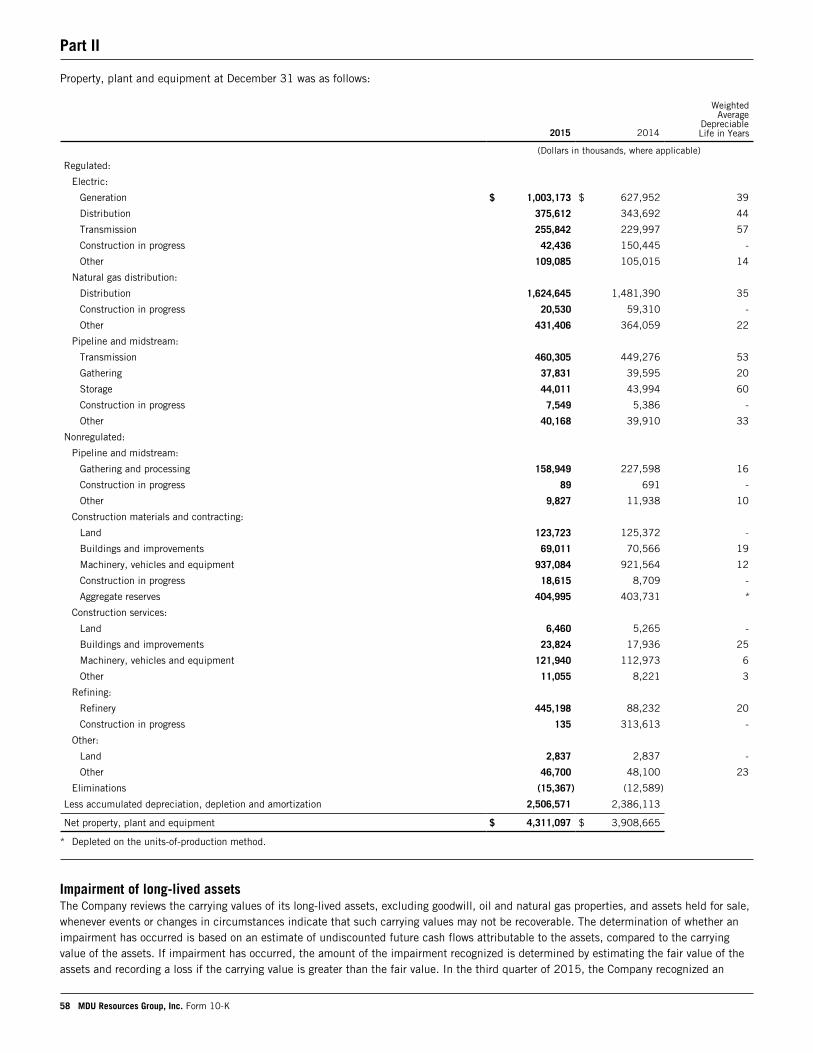
Part II
58 MDU Resources Group, Inc. Form 10-K
Property, plant and equipment at December 31 was as follows:
2015 2014
WeightedAverage
DepreciableLife in Years
(Dollars in thousands, where applicable)
Regulated:
Electric:
Generation $ 1,003,173 $ 627,952 39
Distribution 375,612 343,692 44
Transmission 255,842 229,997 57
Construction in progress 42,436 150,445 -
Other 109,085 105,015 14
Natural gas distribution:
Distribution 1,624,645 1,481,390 35
Construction in progress 20,530 59,310 -
Other 431,406 364,059 22
Pipeline and midstream:
Transmission 460,305 449,276 53
Gathering 37,831 39,595 20
Storage 44,011 43,994 60
Construction in progress 7,549 5,386 -
Other 40,168 39,910 33
Nonregulated:
Pipeline and midstream:
Gathering and processing 158,949 227,598 16
Construction in progress 89 691 -
Other 9,827 11,938 10
Construction materials and contracting:
Land 123,723 125,372 -
Buildings and improvements 69,011 70,566 19
Machinery, vehicles and equipment 937,084 921,564 12
Construction in progress 18,615 8,709 -
Aggregate reserves 404,995 403,731 *
Construction services:
Land 6,460 5,265 -
Buildings and improvements 23,824 17,936 25
Machinery, vehicles and equipment 121,940 112,973 6
Other 11,055 8,221 3
Refining:
Refinery 445,198 88,232 20
Construction in progress 135 313,613 -
Other:
Land 2,837 2,837 -
Other 46,700 48,100 23
Eliminations (15,367) (12,589)
Less accumulated depreciation, depletion and amortization 2,506,571 2,386,113
Net property, plant and equipment $ 4,311,097 $ 3,908,665
* Depleted on the units-of-production method.
Impairment of long-lived assetsThe Company reviews the carrying values of its long-lived assets, excluding goodwill, oil and natural gas properties, and assets held for sale, whenever events or changes in circumstances indicate that such carrying values may not be recoverable. The determination of whether an impairment has occurred is based on an estimate of undiscounted future cash flows attributable to the assets, compared to the carrying value of the assets. If impairment has occurred, the amount of the impairment recognized is determined by estimating the fair value of the assets and recording a loss if the carrying value is greater than the fair value. In the third quarter of 2015, the Company recognized an
Part II
MDU Resources Group, Inc. Form 10-K 59
impairment of $14.1 million (before tax) related to the sale of certain non-strategic natural gas gathering assets that were written down to their estimated fair value that was determined using the market approach. In the second quarters of 2015 and 2013, the Company recognized impairments of $3.0 million (before tax) and $14.5 million (before tax), respectively, related to coalbed natural gas gathering assets located in Wyoming and Montana where there has been a continued decline in natural gas development and production activity largely due to low natural gas prices. The coalbed natural gas gathering assets were written down to their estimated fair value that was determined using the income approach. The impairments are recorded in operation and maintenance expense on the Consolidated Statements of Income. For more information on these nonrecurring fair value measurements, see Note 6.
No significant impairment losses were recorded in 2014. Unforeseen events and changes in circumstances could require the recognition of impairment losses at some future date.
GoodwillGoodwill represents the excess of the purchase price over the fair value of identifiable net tangible and intangible assets acquired in a business combination. Goodwill is required to be tested for impairment annually, which is completed in the fourth quarter, or more frequently if events or changes in circumstances indicate that goodwill may be impaired.
The goodwill impairment test is a two-step process performed at the reporting unit level. The Company has determined that the reporting units for its goodwill impairment test are its operating segments, or components of an operating segment, that constitute a business for which discrete financial information is available and for which segment management regularly reviews the operating results. For more information on the Company's operating segments, see Note 13. The first step of the impairment test involves comparing the fair value of each reporting unit to its carrying value. If the fair value of a reporting unit exceeds its carrying value, the test is complete and no impairment is recorded. If the fair value of a reporting unit is less than its carrying value, step two of the test is performed to determine the amount of impairment loss, if any. The impairment is computed by comparing the implied fair value of the reporting unit's goodwill to the carrying value of that goodwill. If the carrying value is greater than the implied fair value, an impairment loss must be recorded. For the years ended December 31, 2015, 2014 and 2013, there were no significant impairment losses recorded. At December 31, 2015, the fair value substantially exceeded the carrying value at all reporting units.
Determining the fair value of a reporting unit requires judgment and the use of significant estimates which include assumptions about the Company's future revenue, profitability and cash flows, amount and timing of estimated capital expenditures, inflation rates, weighted average cost of capital, operational plans, and current and future economic conditions, among others. The fair value of each reporting unit is determined using a weighted combination of income and market approaches. The Company uses a discounted cash flow methodology for its income approach. Under the income approach, the discounted cash flow model determines fair value based on the present value of projected cash flows over a specified period and a residual value related to future cash flows beyond the projection period. Both values are discounted using a rate which reflects the best estimate of the weighted average cost of capital at each reporting unit. The weighted average cost of capital, which varies by reporting unit and is in the range of 5 percent to 9 percent, and a long-term growth rate projection of approximately 3 percent were utilized in the goodwill impairment test performed in the fourth quarter of 2015. Under the market approach, the Company estimates fair value using multiples derived from comparable sales transactions and enterprise value to EBITDA for comparative peer companies for each respective reporting unit. These multiples are applied to operating data for each reporting unit to arrive at an indication of fair value. In addition, the Company adds a reasonable control premium when calculating the fair value utilizing the peer multiples, which is estimated as the premium that would be received in a sale in an orderly transaction between market participants. The Company believes that the estimates and assumptions used in its impairment assessments are reasonable and based on available market information, but variations in any of the assumptions could result in materially different calculations of fair value and determinations of whether or not an impairment is indicated.
Revenue recognitionRevenue is recognized when the earnings process is complete, as evidenced by an agreement between the customer and the Company, when delivery has occurred or services have been rendered, when the fee is fixed or determinable and when collection is reasonably assured. The Company recognizes utility revenue each month based on the services provided to all utility customers during the month. Accrued unbilled revenue which is included in receivables, net, represents revenues recognized in excess of amounts billed. Accrued unbilled revenue at Montana-Dakota, Cascade and Intermountain was $102.1 million and $99.7 million at December 31, 2015 and 2014, respectively. The Company recognizes construction contract revenue at its construction businesses using the percentage-of-completion method as discussed later. The Company recognizes revenue from exploration and production properties only on that portion of production sold and allocable to the Company's ownership interest in the related properties. The Company recognizes all other revenues when services are rendered or goods are delivered. The Company presents revenues net of taxes collected from customers at the time of sale to be remitted to governmental authorities, including sales and use taxes.
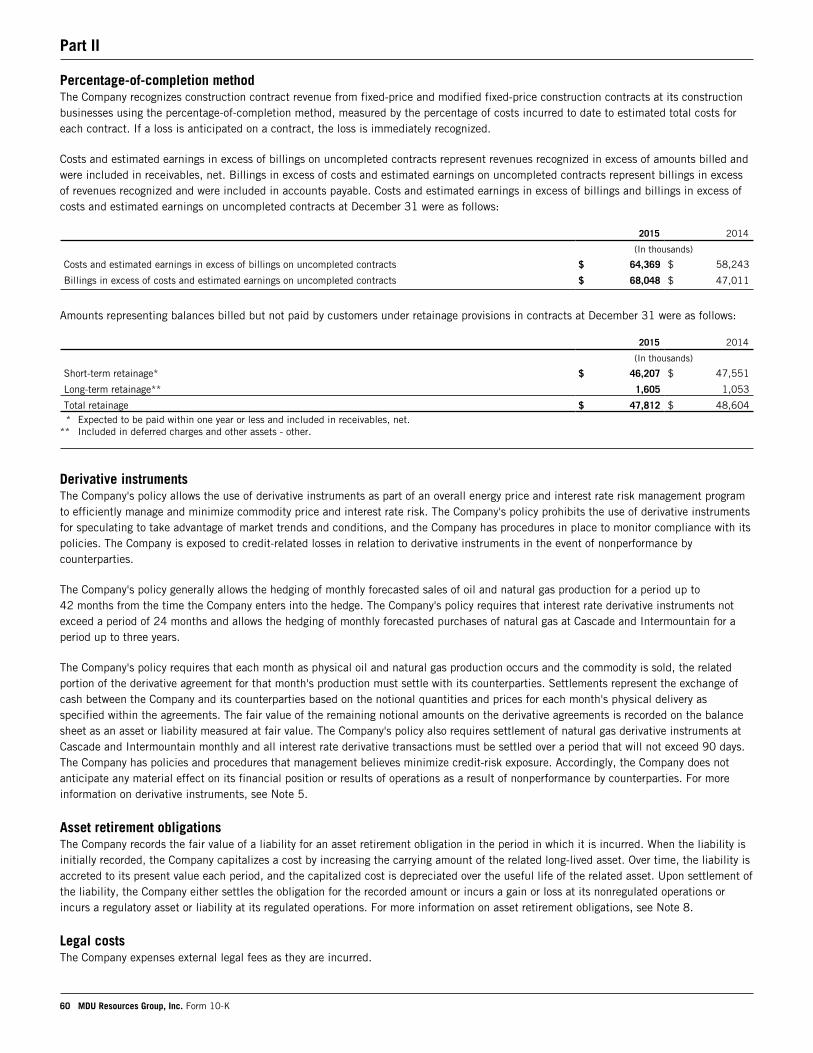
Part II
60 MDU Resources Group, Inc. Form 10-K
Percentage-of-completion method The Company recognizes construction contract revenue from fixed-price and modified fixed-price construction contracts at its construction businesses using the percentage-of-completion method, measured by the percentage of costs incurred to date to estimated total costs for each contract. If a loss is anticipated on a contract, the loss is immediately recognized.
Costs and estimated earnings in excess of billings on uncompleted contracts represent revenues recognized in excess of amounts billed and were included in receivables, net. Billings in excess of costs and estimated earnings on uncompleted contracts represent billings in excess of revenues recognized and were included in accounts payable. Costs and estimated earnings in excess of billings and billings in excess of costs and estimated earnings on uncompleted contracts at December 31 were as follows:
2015 2014
(In thousands)
Costs and estimated earnings in excess of billings on uncompleted contracts $ 64,369 $ 58,243
Billings in excess of costs and estimated earnings on uncompleted contracts $ 68,048 $ 47,011
Amounts representing balances billed but not paid by customers under retainage provisions in contracts at December 31 were as follows:
2015 2014
(In thousands)
Short-term retainage* $ 46,207 $ 47,551
Long-term retainage** 1,605 1,053
Total retainage $ 47,812 $ 48,604* Expected to be paid within one year or less and included in receivables, net.
** Included in deferred charges and other assets - other.
Derivative instrumentsThe Company's policy allows the use of derivative instruments as part of an overall energy price and interest rate risk management program to efficiently manage and minimize commodity price and interest rate risk. The Company's policy prohibits the use of derivative instruments for speculating to take advantage of market trends and conditions, and the Company has procedures in place to monitor compliance with its policies. The Company is exposed to credit-related losses in relation to derivative instruments in the event of nonperformance by counterparties.
The Company's policy generally allows the hedging of monthly forecasted sales of oil and natural gas production for a period up to 42 months from the time the Company enters into the hedge. The Company's policy requires that interest rate derivative instruments not exceed a period of 24 months and allows the hedging of monthly forecasted purchases of natural gas at Cascade and Intermountain for a period up to three years.
The Company's policy requires that each month as physical oil and natural gas production occurs and the commodity is sold, the related portion of the derivative agreement for that month's production must settle with its counterparties. Settlements represent the exchange of cash between the Company and its counterparties based on the notional quantities and prices for each month's physical delivery as specified within the agreements. The fair value of the remaining notional amounts on the derivative agreements is recorded on the balance sheet as an asset or liability measured at fair value. The Company's policy also requires settlement of natural gas derivative instruments at Cascade and Intermountain monthly and all interest rate derivative transactions must be settled over a period that will not exceed 90 days. The Company has policies and procedures that management believes minimize credit-risk exposure. Accordingly, the Company does not anticipate any material effect on its financial position or results of operations as a result of nonperformance by counterparties. For more information on derivative instruments, see Note 5.
Asset retirement obligationsThe Company records the fair value of a liability for an asset retirement obligation in the period in which it is incurred. When the liability is initially recorded, the Company capitalizes a cost by increasing the carrying amount of the related long-lived asset. Over time, the liability is accreted to its present value each period, and the capitalized cost is depreciated over the useful life of the related asset. Upon settlement of the liability, the Company either settles the obligation for the recorded amount or incurs a gain or loss at its nonregulated operations or incurs a regulatory asset or liability at its regulated operations. For more information on asset retirement obligations, see Note 8.
Legal costsThe Company expenses external legal fees as they are incurred.
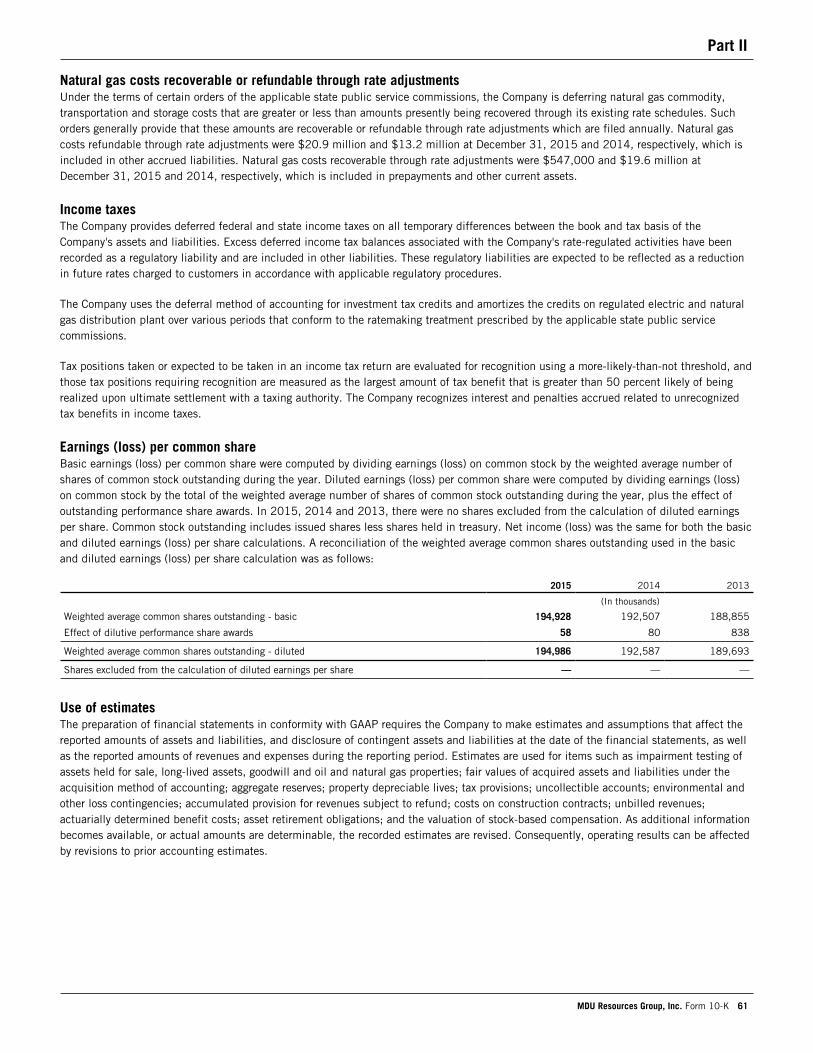
Part II
MDU Resources Group, Inc. Form 10-K 61
Natural gas costs recoverable or refundable through rate adjustmentsUnder the terms of certain orders of the applicable state public service commissions, the Company is deferring natural gas commodity, transportation and storage costs that are greater or less than amounts presently being recovered through its existing rate schedules. Such orders generally provide that these amounts are recoverable or refundable through rate adjustments which are filed annually. Natural gas costs refundable through rate adjustments were $20.9 million and $13.2 million at December 31, 2015 and 2014, respectively, which is included in other accrued liabilities. Natural gas costs recoverable through rate adjustments were $547,000 and $19.6 million at December 31, 2015 and 2014, respectively, which is included in prepayments and other current assets.
Income taxesThe Company provides deferred federal and state income taxes on all temporary differences between the book and tax basis of the Company's assets and liabilities. Excess deferred income tax balances associated with the Company's rate-regulated activities have been recorded as a regulatory liability and are included in other liabilities. These regulatory liabilities are expected to be reflected as a reduction in future rates charged to customers in accordance with applicable regulatory procedures.
The Company uses the deferral method of accounting for investment tax credits and amortizes the credits on regulated electric and natural gas distribution plant over various periods that conform to the ratemaking treatment prescribed by the applicable state public service commissions.
Tax positions taken or expected to be taken in an income tax return are evaluated for recognition using a more-likely-than-not threshold, and those tax positions requiring recognition are measured as the largest amount of tax benefit that is greater than 50 percent likely of being realized upon ultimate settlement with a taxing authority. The Company recognizes interest and penalties accrued related to unrecognized tax benefits in income taxes.
Earnings (loss) per common shareBasic earnings (loss) per common share were computed by dividing earnings (loss) on common stock by the weighted average number of shares of common stock outstanding during the year. Diluted earnings (loss) per common share were computed by dividing earnings (loss) on common stock by the total of the weighted average number of shares of common stock outstanding during the year, plus the effect of outstanding performance share awards. In 2015, 2014 and 2013, there were no shares excluded from the calculation of diluted earnings per share. Common stock outstanding includes issued shares less shares held in treasury. Net income (loss) was the same for both the basic and diluted earnings (loss) per share calculations. A reconciliation of the weighted average common shares outstanding used in the basic and diluted earnings (loss) per share calculation was as follows:
2015 2014 2013
(In thousands)
Weighted average common shares outstanding - basic 194,928 192,507 188,855
Effect of dilutive performance share awards 58 80 838
Weighted average common shares outstanding - diluted 194,986 192,587 189,693
Shares excluded from the calculation of diluted earnings per share — — —
Use of estimatesThe preparation of financial statements in conformity with GAAP requires the Company to make estimates and assumptions that affect the reported amounts of assets and liabilities, and disclosure of contingent assets and liabilities at the date of the financial statements, as well as the reported amounts of revenues and expenses during the reporting period. Estimates are used for items such as impairment testing of assets held for sale, long-lived assets, goodwill and oil and natural gas properties; fair values of acquired assets and liabilities under the acquisition method of accounting; aggregate reserves; property depreciable lives; tax provisions; uncollectible accounts; environmental and other loss contingencies; accumulated provision for revenues subject to refund; costs on construction contracts; unbilled revenues; actuarially determined benefit costs; asset retirement obligations; and the valuation of stock-based compensation. As additional information becomes available, or actual amounts are determinable, the recorded estimates are revised. Consequently, operating results can be affected by revisions to prior accounting estimates.
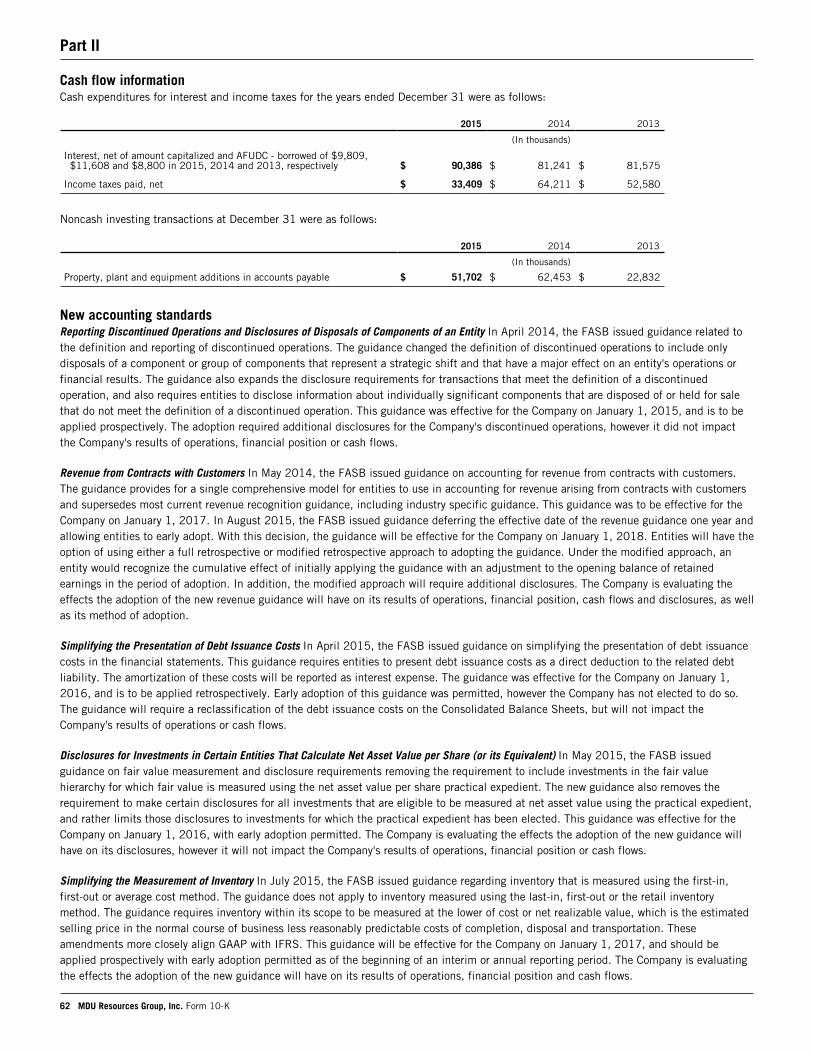
Part II
62 MDU Resources Group, Inc. Form 10-K
Cash flow informationCash expenditures for interest and income taxes for the years ended December 31 were as follows:
2015 2014 2013
(In thousands)
Interest, net of amount capitalized and AFUDC - borrowed of $9,809,$11,608 and $8,800 in 2015, 2014 and 2013, respectively $ 90,386 $ 81,241 $ 81,575
Income taxes paid, net $ 33,409 $ 64,211 $ 52,580
Noncash investing transactions at December 31 were as follows:
2015 2014 2013
(In thousands)
Property, plant and equipment additions in accounts payable $ 51,702 $ 62,453 $ 22,832
New accounting standardsReporting Discontinued Operations and Disclosures of Disposals of Components of an Entity In April 2014, the FASB issued guidance related to the definition and reporting of discontinued operations. The guidance changed the definition of discontinued operations to include only disposals of a component or group of components that represent a strategic shift and that have a major effect on an entity's operations or financial results. The guidance also expands the disclosure requirements for transactions that meet the definition of a discontinued operation, and also requires entities to disclose information about individually significant components that are disposed of or held for sale that do not meet the definition of a discontinued operation. This guidance was effective for the Company on January 1, 2015, and is to be applied prospectively. The adoption required additional disclosures for the Company's discontinued operations, however it did not impact the Company's results of operations, financial position or cash flows.
Revenue from Contracts with Customers In May 2014, the FASB issued guidance on accounting for revenue from contracts with customers. The guidance provides for a single comprehensive model for entities to use in accounting for revenue arising from contracts with customers and supersedes most current revenue recognition guidance, including industry specific guidance. This guidance was to be effective for the Company on January 1, 2017. In August 2015, the FASB issued guidance deferring the effective date of the revenue guidance one year and allowing entities to early adopt. With this decision, the guidance will be effective for the Company on January 1, 2018. Entities will have the option of using either a full retrospective or modified retrospective approach to adopting the guidance. Under the modified approach, an entity would recognize the cumulative effect of initially applying the guidance with an adjustment to the opening balance of retained earnings in the period of adoption. In addition, the modified approach will require additional disclosures. The Company is evaluating the effects the adoption of the new revenue guidance will have on its results of operations, financial position, cash flows and disclosures, as well as its method of adoption.
Simplifying the Presentation of Debt Issuance Costs In April 2015, the FASB issued guidance on simplifying the presentation of debt issuance costs in the financial statements. This guidance requires entities to present debt issuance costs as a direct deduction to the related debt liability. The amortization of these costs will be reported as interest expense. The guidance was effective for the Company on January 1, 2016, and is to be applied retrospectively. Early adoption of this guidance was permitted, however the Company has not elected to do so. The guidance will require a reclassification of the debt issuance costs on the Consolidated Balance Sheets, but will not impact the Company's results of operations or cash flows.
Disclosures for Investments in Certain Entities That Calculate Net Asset Value per Share (or its Equivalent) In May 2015, the FASB issued guidance on fair value measurement and disclosure requirements removing the requirement to include investments in the fair value hierarchy for which fair value is measured using the net asset value per share practical expedient. The new guidance also removes the requirement to make certain disclosures for all investments that are eligible to be measured at net asset value using the practical expedient, and rather limits those disclosures to investments for which the practical expedient has been elected. This guidance was effective for the Company on January 1, 2016, with early adoption permitted. The Company is evaluating the effects the adoption of the new guidance will have on its disclosures, however it will not impact the Company's results of operations, financial position or cash flows.
Simplifying the Measurement of Inventory In July 2015, the FASB issued guidance regarding inventory that is measured using the first-in, first-out or average cost method. The guidance does not apply to inventory measured using the last-in, first-out or the retail inventory method. The guidance requires inventory within its scope to be measured at the lower of cost or net realizable value, which is the estimated selling price in the normal course of business less reasonably predictable costs of completion, disposal and transportation. These amendments more closely align GAAP with IFRS. This guidance will be effective for the Company on January 1, 2017, and should be applied prospectively with early adoption permitted as of the beginning of an interim or annual reporting period. The Company is evaluating the effects the adoption of the new guidance will have on its results of operations, financial position and cash flows.
Part II
MDU Resources Group, Inc. Form 10-K 63
Balance Sheet Classification of Deferred Taxes In November 2015, the FASB issued guidance regarding the classification of deferred taxes on the balance sheet. The guidance will require all deferred tax assets and liabilities to be classified as noncurrent. These amendments will align GAAP with IFRS. This guidance will be effective for the Company on January 1, 2017, with early adoption permitted. Entities will have the option to apply the guidance prospectively, for all deferred tax assets and liabilities, or retrospectively. The Company is evaluating the effects the adoption of the new guidance will have on its financial position and disclosures, however it will not impact the Company's results of operations or cash flows.
Recognition and Measurement of Financial Assets and Financial Liabilities In January 2016, the FASB issued guidance regarding the classification and measurement of financial instruments. The guidance revises the way an entity classifies and measures investments in equity securities, the presentation of certain fair value changes for financial liabilities measured at fair value and amends certain disclosure requirements related to the fair value of financial instruments. This guidance will be effective for the Company on January 1, 2018, with early adoption of certain amendments permitted. The Company is evaluating the effects the adoption of the new guidance will have on its results of operations, financial position, cash flows and disclosures.
Variable interest entitiesThe Company evaluates its arrangements and contracts with other entities to determine if they are VIEs and if so, if the Company is the primary beneficiary. GAAP provides a framework for identifying VIEs and determining when a company should include the assets, liabilities, noncontrolling interest and results of activities of a VIE in its consolidated financial statements.
A VIE should be consolidated if a party with an ownership, contractual or other financial interest in the VIE (a variable interest holder) has the power to direct the VIE's most significant activities and the obligation to absorb losses or right to receive benefits of the VIE that could be significant to the VIE. A variable interest holder that consolidates the VIE is called the primary beneficiary. Upon consolidation, the primary beneficiary generally must initially record all of the VIE's assets, liabilities and noncontrolling interests at fair value and subsequently account for the VIE as if it were consolidated.
The Company's evaluation of whether it qualifies as the primary beneficiary of a VIE involves significant judgments, estimates and assumptions and includes a qualitative analysis of the activities that most significantly impact the VIE's economic performance and whether the Company has the power to direct those activities, the design of the entity, the rights of the parties and the purpose of the arrangement.
Comprehensive income (loss)Comprehensive income (loss) is the sum of net income (loss) as reported and other comprehensive income (loss). The Company's other comprehensive income (loss) resulted from gains (losses) on derivative instruments qualifying as hedges, postretirement liability adjustments, foreign currency translation adjustments and gains (losses) on available-for-sale investments. For more information on derivative instruments, see Note 5.
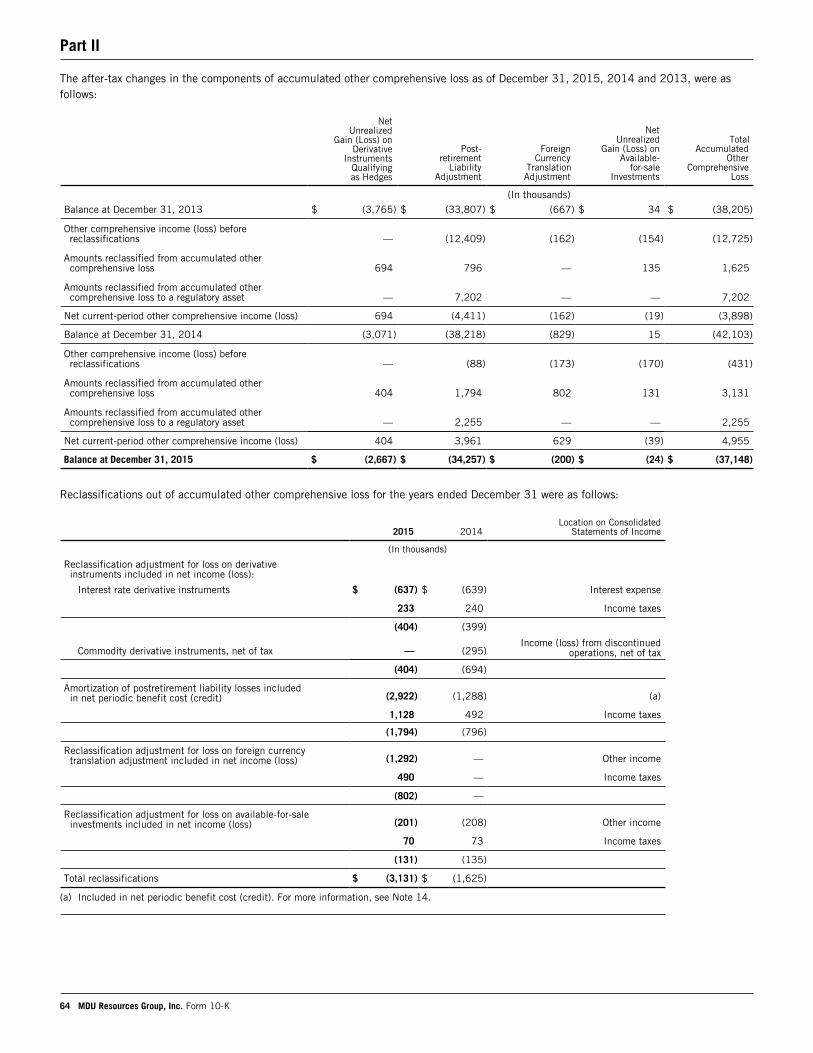
Part II
64 MDU Resources Group, Inc. Form 10-K
The after-tax changes in the components of accumulated other comprehensive loss as of December 31, 2015, 2014 and 2013, were as follows:
NetUnrealized
Gain (Loss) onDerivative
Instruments Qualifyingas Hedges
Post-retirement
LiabilityAdjustment
ForeignCurrency
Translation Adjustment
NetUnrealized
Gain (Loss) onAvailable-
for-saleInvestments
TotalAccumulated
OtherComprehensive
Loss
(In thousands)
Balance at December 31, 2013 $ (3,765) $ (33,807) $ (667) $ 34 $ (38,205)
Other comprehensive income (loss) beforereclassifications — (12,409) (162) (154) (12,725)
Amounts reclassified from accumulated othercomprehensive loss 694 796 — 135 1,625
Amounts reclassified from accumulated othercomprehensive loss to a regulatory asset — 7,202 — — 7,202
Net current-period other comprehensive income (loss) 694 (4,411) (162) (19) (3,898)
Balance at December 31, 2014 (3,071) (38,218) (829) 15 (42,103)
Other comprehensive income (loss) beforereclassifications — (88) (173) (170) (431)
Amounts reclassified from accumulated othercomprehensive loss 404 1,794 802 131 3,131
Amounts reclassified from accumulated othercomprehensive loss to a regulatory asset — 2,255 — — 2,255
Net current-period other comprehensive income (loss) 404 3,961 629 (39) 4,955
Balance at December 31, 2015 $ (2,667) $ (34,257) $ (200) $ (24) $ (37,148)
Reclassifications out of accumulated other comprehensive loss for the years ended December 31 were as follows:
2015 2014Location on Consolidated
Statements of Income
(In thousands)
Reclassification adjustment for loss on derivativeinstruments included in net income (loss):
Interest rate derivative instruments $ (637) $ (639) Interest expense
233 240 Income taxes
(404) (399)
Commodity derivative instruments, net of tax — (295)Income (loss) from discontinued
operations, net of tax
(404) (694)
Amortization of postretirement liability losses includedin net periodic benefit cost (credit) (2,922) (1,288) (a)
1,128 492 Income taxes
(1,794) (796)
Reclassification adjustment for loss on foreign currencytranslation adjustment included in net income (loss) (1,292) — Other income
490 — Income taxes
(802) —
Reclassification adjustment for loss on available-for-saleinvestments included in net income (loss) (201) (208) Other income
70 73 Income taxes
(131) (135)
Total reclassifications $ (3,131) $ (1,625)
(a) Included in net periodic benefit cost (credit). For more information, see Note 14.
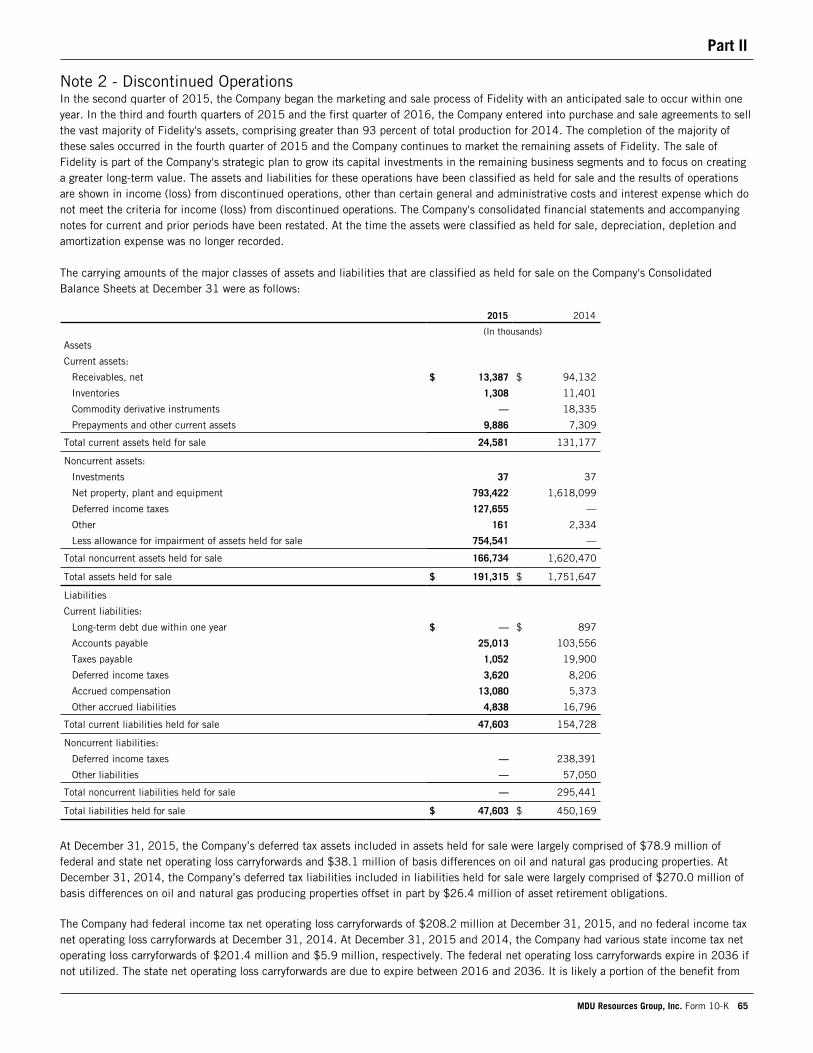
Part II
MDU Resources Group, Inc. Form 10-K 65
Note 2 - Discontinued OperationsIn the second quarter of 2015, the Company began the marketing and sale process of Fidelity with an anticipated sale to occur within one year. In the third and fourth quarters of 2015 and the first quarter of 2016, the Company entered into purchase and sale agreements to sell the vast majority of Fidelity's assets, comprising greater than 93 percent of total production for 2014. The completion of the majority of these sales occurred in the fourth quarter of 2015 and the Company continues to market the remaining assets of Fidelity. The sale of Fidelity is part of the Company's strategic plan to grow its capital investments in the remaining business segments and to focus on creating a greater long-term value. The assets and liabilities for these operations have been classified as held for sale and the results of operations are shown in income (loss) from discontinued operations, other than certain general and administrative costs and interest expense which do not meet the criteria for income (loss) from discontinued operations. The Company's consolidated financial statements and accompanying notes for current and prior periods have been restated. At the time the assets were classified as held for sale, depreciation, depletion and amortization expense was no longer recorded.
The carrying amounts of the major classes of assets and liabilities that are classified as held for sale on the Company's Consolidated Balance Sheets at December 31 were as follows:
2015 2014
(In thousands)
Assets
Current assets:
Receivables, net $ 13,387 $ 94,132
Inventories 1,308 11,401
Commodity derivative instruments — 18,335
Prepayments and other current assets 9,886 7,309
Total current assets held for sale 24,581 131,177
Noncurrent assets:
Investments 37 37
Net property, plant and equipment 793,422 1,618,099
Deferred income taxes 127,655 —
Other 161 2,334
Less allowance for impairment of assets held for sale 754,541 —
Total noncurrent assets held for sale 166,734 1,620,470
Total assets held for sale $ 191,315 $ 1,751,647
Liabilities
Current liabilities:
Long-term debt due within one year $ — $ 897
Accounts payable 25,013 103,556
Taxes payable 1,052 19,900
Deferred income taxes 3,620 8,206
Accrued compensation 13,080 5,373
Other accrued liabilities 4,838 16,796
Total current liabilities held for sale 47,603 154,728
Noncurrent liabilities:
Deferred income taxes — 238,391
Other liabilities — 57,050
Total noncurrent liabilities held for sale — 295,441
Total liabilities held for sale $ 47,603 $ 450,169
At December 31, 2015, the Company’s deferred tax assets included in assets held for sale were largely comprised of $78.9 million of federal and state net operating loss carryforwards and $38.1 million of basis differences on oil and natural gas producing properties. At December 31, 2014, the Company’s deferred tax liabilities included in liabilities held for sale were largely comprised of $270.0 million of basis differences on oil and natural gas producing properties offset in part by $26.4 million of asset retirement obligations.
The Company had federal income tax net operating loss carryforwards of $208.2 million at December 31, 2015, and no federal income tax net operating loss carryforwards at December 31, 2014. At December 31, 2015 and 2014, the Company had various state income tax net operating loss carryforwards of $201.4 million and $5.9 million, respectively. The federal net operating loss carryforwards expire in 2036 if not utilized. The state net operating loss carryforwards are due to expire between 2016 and 2036. It is likely a portion of the benefit from
Part II
66 MDU Resources Group, Inc. Form 10-K
the state carryforwards will not be realized; therefore, valuation allowances of $300,000 and $253,000 have been provided in 2015 and 2014, respectively.
The Company performed a fair value assessment of the assets and liabilities classified as held for sale. In the second quarter of 2015, the estimated fair value was determined using the income and the market approaches. The income approach was determined by using the present value of future estimated cash flows. The income approach considered management’s views on current operating measures as well as assumptions pertaining to market forces in the oil and gas industry including estimated reserves, estimated prices, market differentials, estimates of well operating and future development costs and timing of operations. The estimated cash flows were discounted using a rate believed to be consistent with those used by principal market participants. The market approach was provided by a third party and based on market transactions involving similar interests in oil and natural gas properties. The fair value assessment indicated an impairment based on the carrying value exceeding the estimated fair value, which resulted in the Company writing down Fidelity’s assets at June 30, 2015, and recording an impairment of $400.0 million ($252.0 million after tax) during the second quarter of 2015. In the third quarter of 2015, the estimated fair value of Fidelity was determined by agreed upon pricing in the purchase and sale agreements for the assets subject to the agreements, the majority of which closed during the fourth quarter of 2015, including customary purchase price adjustments. The values received in the bid proposals were lower than originally anticipated due to lower commodity prices than those projected in the second quarter of 2015. For those assets for which a purchase and sale agreement has not been entered into, which the Company is continuing to market, the fair value was determined based on the market approach utilizing multiples based on similar interests in oil and natural gas properties. The fair value assessment indicated an impairment based on the current carrying value exceeding the estimated fair value, which resulted in the Company writing down Fidelity’s assets at September 30, 2015, and recording an impairment of $356.1 million ($224.4 million after tax). In the fourth quarter of 2015, the fair value assessment was determined using the market approach based on purchase and sale agreements, one of which has been signed and one of which the Company is currently negotiating. The estimated fair value exceeded the carrying value and the Company recorded an impairment reversal of $1.6 million ($1.0 million after tax) in the fourth quarter of 2015. The impairments were included in operating expenses from discontinued operations. The estimated fair value of Fidelity's assets have been categorized as Level 3 in the fair value hierarchy.
At December 31, 2015, the Company has accrued liabilities of approximately $2.5 million for estimated transaction costs which will result in future cash expenditures. In addition to the estimated transaction costs, and due in part to the change in plans to sell the assets of Fidelity rather than sell Fidelity as a company, Fidelity incurred and expensed approximately $4.9 million of exit and disposal costs in 2015 and expects to incur an additional $6.1 million of exit and disposal costs in 2016. The exit and disposal costs are associated with severance and other related matters, excluding the office lease expenses discussed in the following paragraph. The majority of these exit and disposal activities are expected to be completed by the end of the second quarter of 2016.
Fidelity is vacating its office space in Denver, Colorado. An amendment of lease has been executed with payments of $4.2 million required under the lease in 2016. A termination payment of $3.3 million was made during the fourth quarter of 2015 and existing office furniture and fixtures will be relinquished to the lessor in 2016.
Unforeseen events and changes in circumstances and market conditions and material differences in the value of the assets held for sale due to changes in estimates of future cash flows could negatively affect the estimated fair value of Fidelity and result in additional impairment charges. Various factors, including oil and natural gas prices, market differentials and changes in estimates of reserve quantities could result in future impairments of the Company's assets held for sale.
Historically, the Company used the full-cost method of accounting for its oil and natural gas production activities. Under this method, all costs incurred in the acquisition, exploration and development of oil and natural gas properties are capitalized and amortized on the units-of-production method based on total proved reserves.
Prior to the oil and natural gas properties being classified as held for sale, capitalized costs were subject to a "ceiling test" that limits such costs to the aggregate of the present value of future net cash flows from proved reserves discounted at 10 percent, as mandated under the rules of the SEC, plus the cost of unproved properties not subject to amortization, plus the effects of cash flow hedges, less applicable income taxes. Proved reserves and associated future cash flows are determined based on SEC Defined Prices and exclude cash outflows associated with asset retirement obligations that have been accrued on the balance sheet. If capitalized costs, less accumulated amortization and related deferred income taxes, exceed the full-cost ceiling at the end of any quarter, a permanent noncash write-down is required to be charged to earnings in that quarter regardless of subsequent price changes.
The Company's capitalized cost under the full-cost method of accounting exceeded the full-cost ceiling at March 31, 2015. SEC Defined Prices, adjusted for market differentials, were used to calculate the ceiling test. Accordingly, the Company was required to write down its oil and natural gas producing properties. The Company recorded a $500.4 million ($315.3 million after tax) noncash write-down in operating expenses from discontinued operations in the first quarter of 2015.
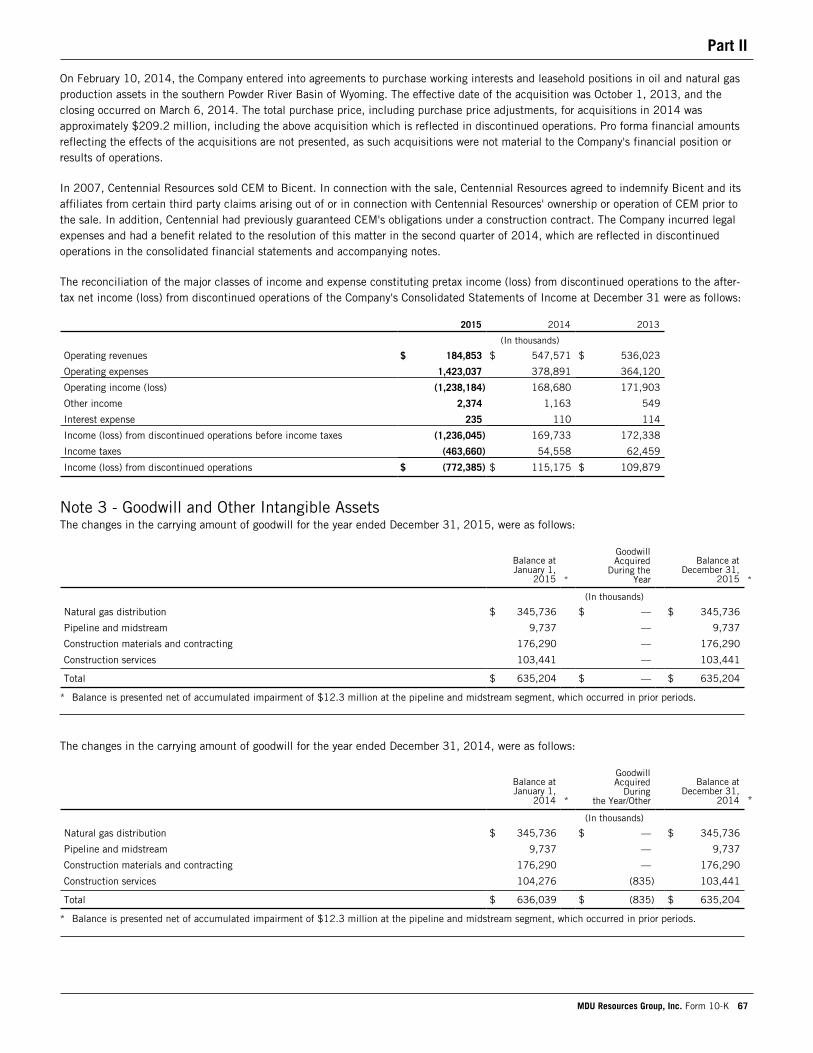
Part II
MDU Resources Group, Inc. Form 10-K 67
On February 10, 2014, the Company entered into agreements to purchase working interests and leasehold positions in oil and natural gas production assets in the southern Powder River Basin of Wyoming. The effective date of the acquisition was October 1, 2013, and the closing occurred on March 6, 2014. The total purchase price, including purchase price adjustments, for acquisitions in 2014 was approximately $209.2 million, including the above acquisition which is reflected in discontinued operations. Pro forma financial amounts reflecting the effects of the acquisitions are not presented, as such acquisitions were not material to the Company's financial position or results of operations.
In 2007, Centennial Resources sold CEM to Bicent. In connection with the sale, Centennial Resources agreed to indemnify Bicent and its affiliates from certain third party claims arising out of or in connection with Centennial Resources' ownership or operation of CEM prior to the sale. In addition, Centennial had previously guaranteed CEM's obligations under a construction contract. The Company incurred legal expenses and had a benefit related to the resolution of this matter in the second quarter of 2014, which are reflected in discontinued operations in the consolidated financial statements and accompanying notes.
The reconciliation of the major classes of income and expense constituting pretax income (loss) from discontinued operations to the after-tax net income (loss) from discontinued operations of the Company's Consolidated Statements of Income at December 31 were as follows:
2015 2014 2013
(In thousands)
Operating revenues $ 184,853 $ 547,571 $ 536,023
Operating expenses 1,423,037 378,891 364,120
Operating income (loss) (1,238,184) 168,680 171,903
Other income 2,374 1,163 549
Interest expense 235 110 114
Income (loss) from discontinued operations before income taxes (1,236,045) 169,733 172,338
Income taxes (463,660) 54,558 62,459
Income (loss) from discontinued operations $ (772,385) $ 115,175 $ 109,879
Note 3 - Goodwill and Other Intangible AssetsThe changes in the carrying amount of goodwill for the year ended December 31, 2015, were as follows:
Balance atJanuary 1,
2015 *
GoodwillAcquired
During theYear
Balance atDecember 31,
2015 *
(In thousands)
Natural gas distribution $ 345,736 $ — $ 345,736
Pipeline and midstream 9,737 — 9,737
Construction materials and contracting 176,290 — 176,290
Construction services 103,441 — 103,441
Total $ 635,204 $ — $ 635,204
* Balance is presented net of accumulated impairment of $12.3 million at the pipeline and midstream segment, which occurred in prior periods.
The changes in the carrying amount of goodwill for the year ended December 31, 2014, were as follows:
Balance atJanuary 1,
2014 *
GoodwillAcquired
Duringthe Year/Other
Balance atDecember 31,
2014 *
(In thousands)
Natural gas distribution $ 345,736 $ — $ 345,736
Pipeline and midstream 9,737 — 9,737
Construction materials and contracting 176,290 — 176,290
Construction services 104,276 (835) 103,441
Total $ 636,039 $ (835) $ 635,204
* Balance is presented net of accumulated impairment of $12.3 million at the pipeline and midstream segment, which occurred in prior periods.
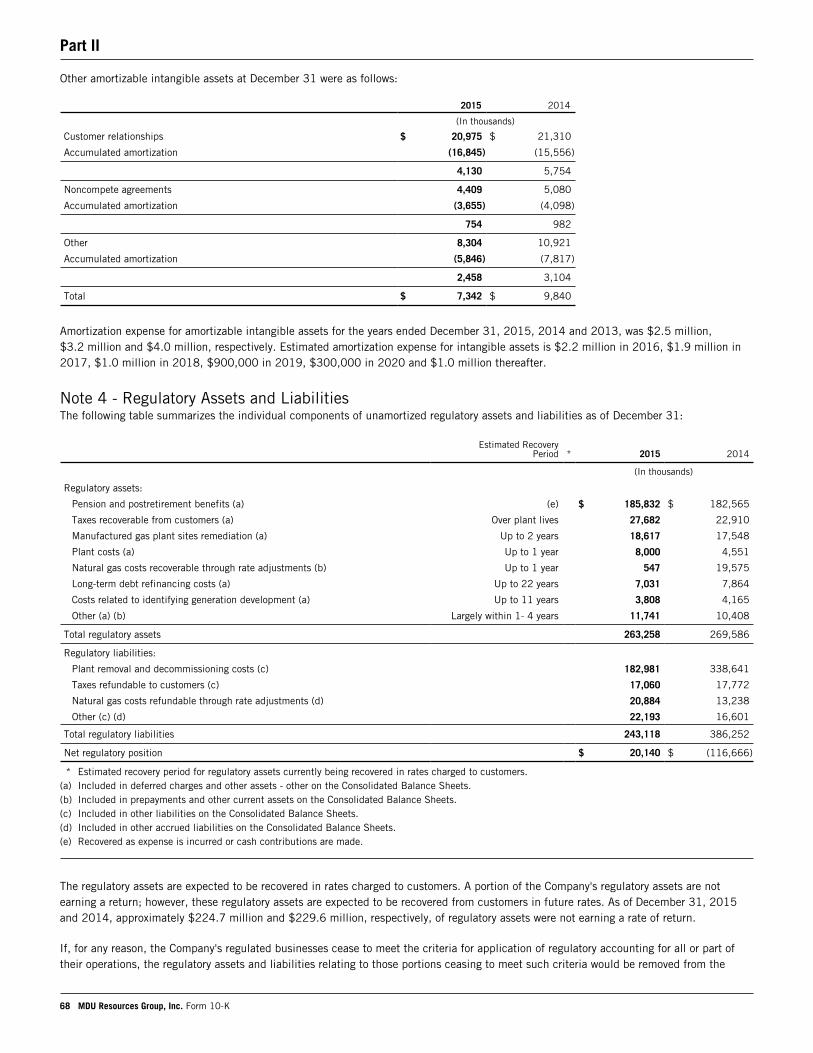
Part II
68 MDU Resources Group, Inc. Form 10-K
Other amortizable intangible assets at December 31 were as follows:
2015 2014
(In thousands)
Customer relationships $ 20,975 $ 21,310
Accumulated amortization (16,845) (15,556)
4,130 5,754
Noncompete agreements 4,409 5,080
Accumulated amortization (3,655) (4,098)
754 982
Other 8,304 10,921
Accumulated amortization (5,846) (7,817)
2,458 3,104
Total $ 7,342 $ 9,840
Amortization expense for amortizable intangible assets for the years ended December 31, 2015, 2014 and 2013, was $2.5 million, $3.2 million and $4.0 million, respectively. Estimated amortization expense for intangible assets is $2.2 million in 2016, $1.9 million in 2017, $1.0 million in 2018, $900,000 in 2019, $300,000 in 2020 and $1.0 million thereafter.
Note 4 - Regulatory Assets and LiabilitiesThe following table summarizes the individual components of unamortized regulatory assets and liabilities as of December 31:
Estimated RecoveryPeriod * 2015 2014
(In thousands)
Regulatory assets:
Pension and postretirement benefits (a) (e) $ 185,832 $ 182,565
Taxes recoverable from customers (a) Over plant lives 27,682 22,910
Manufactured gas plant sites remediation (a) Up to 2 years 18,617 17,548
Plant costs (a) Up to 1 year 8,000 4,551
Natural gas costs recoverable through rate adjustments (b) Up to 1 year 547 19,575
Long-term debt refinancing costs (a) Up to 22 years 7,031 7,864
Costs related to identifying generation development (a) Up to 11 years 3,808 4,165
Other (a) (b) Largely within 1- 4 years 11,741 10,408
Total regulatory assets 263,258 269,586
Regulatory liabilities:
Plant removal and decommissioning costs (c) 182,981 338,641
Taxes refundable to customers (c) 17,060 17,772
Natural gas costs refundable through rate adjustments (d) 20,884 13,238
Other (c) (d) 22,193 16,601
Total regulatory liabilities 243,118 386,252
Net regulatory position $ 20,140 $ (116,666)
* Estimated recovery period for regulatory assets currently being recovered in rates charged to customers.(a) Included in deferred charges and other assets - other on the Consolidated Balance Sheets.(b) Included in prepayments and other current assets on the Consolidated Balance Sheets.(c) Included in other liabilities on the Consolidated Balance Sheets.(d) Included in other accrued liabilities on the Consolidated Balance Sheets.(e) Recovered as expense is incurred or cash contributions are made.
The regulatory assets are expected to be recovered in rates charged to customers. A portion of the Company's regulatory assets are not earning a return; however, these regulatory assets are expected to be recovered from customers in future rates. As of December 31, 2015 and 2014, approximately $224.7 million and $229.6 million, respectively, of regulatory assets were not earning a rate of return.
If, for any reason, the Company's regulated businesses cease to meet the criteria for application of regulatory accounting for all or part of their operations, the regulatory assets and liabilities relating to those portions ceasing to meet such criteria would be removed from the
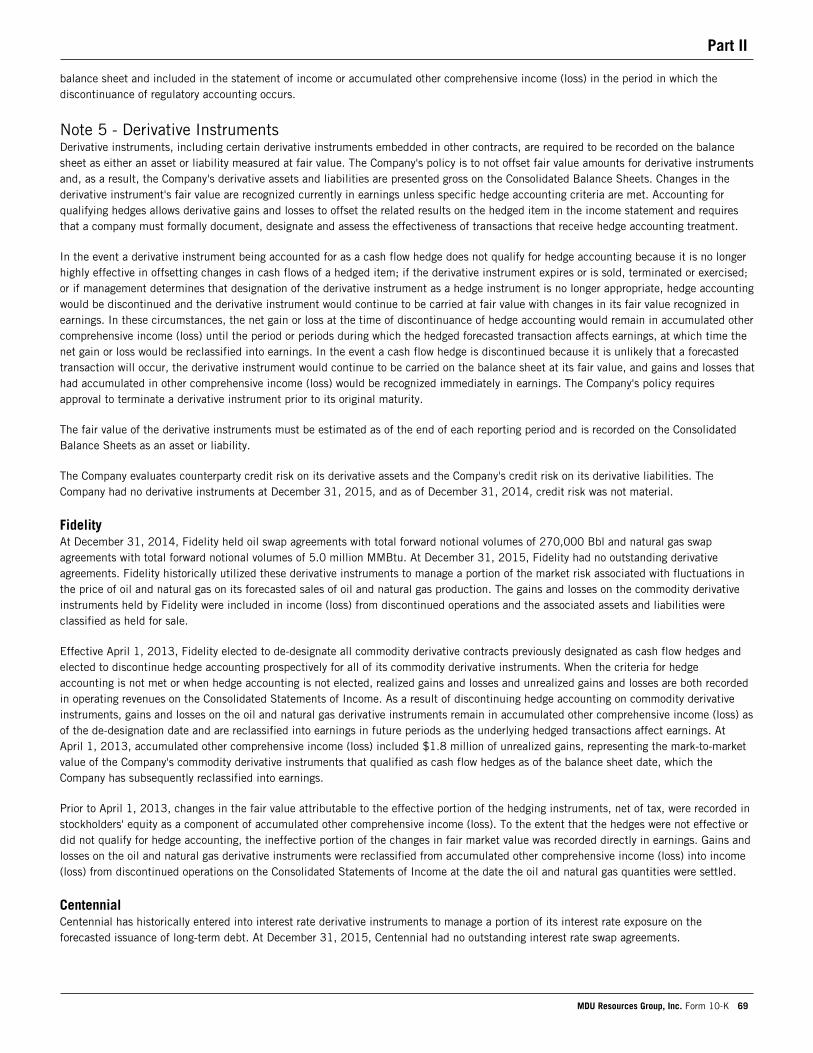
Part II
MDU Resources Group, Inc. Form 10-K 69
balance sheet and included in the statement of income or accumulated other comprehensive income (loss) in the period in which the discontinuance of regulatory accounting occurs.
Note 5 - Derivative InstrumentsDerivative instruments, including certain derivative instruments embedded in other contracts, are required to be recorded on the balance sheet as either an asset or liability measured at fair value. The Company's policy is to not offset fair value amounts for derivative instruments and, as a result, the Company's derivative assets and liabilities are presented gross on the Consolidated Balance Sheets. Changes in the derivative instrument's fair value are recognized currently in earnings unless specific hedge accounting criteria are met. Accounting for qualifying hedges allows derivative gains and losses to offset the related results on the hedged item in the income statement and requires that a company must formally document, designate and assess the effectiveness of transactions that receive hedge accounting treatment.
In the event a derivative instrument being accounted for as a cash flow hedge does not qualify for hedge accounting because it is no longer highly effective in offsetting changes in cash flows of a hedged item; if the derivative instrument expires or is sold, terminated or exercised; or if management determines that designation of the derivative instrument as a hedge instrument is no longer appropriate, hedge accounting would be discontinued and the derivative instrument would continue to be carried at fair value with changes in its fair value recognized in earnings. In these circumstances, the net gain or loss at the time of discontinuance of hedge accounting would remain in accumulated other comprehensive income (loss) until the period or periods during which the hedged forecasted transaction affects earnings, at which time the net gain or loss would be reclassified into earnings. In the event a cash flow hedge is discontinued because it is unlikely that a forecasted transaction will occur, the derivative instrument would continue to be carried on the balance sheet at its fair value, and gains and losses that had accumulated in other comprehensive income (loss) would be recognized immediately in earnings. The Company's policy requires approval to terminate a derivative instrument prior to its original maturity.
The fair value of the derivative instruments must be estimated as of the end of each reporting period and is recorded on the Consolidated Balance Sheets as an asset or liability.
The Company evaluates counterparty credit risk on its derivative assets and the Company's credit risk on its derivative liabilities. The Company had no derivative instruments at December 31, 2015, and as of December 31, 2014, credit risk was not material.
FidelityAt December 31, 2014, Fidelity held oil swap agreements with total forward notional volumes of 270,000 Bbl and natural gas swap agreements with total forward notional volumes of 5.0 million MMBtu. At December 31, 2015, Fidelity had no outstanding derivative agreements. Fidelity historically utilized these derivative instruments to manage a portion of the market risk associated with fluctuations in the price of oil and natural gas on its forecasted sales of oil and natural gas production. The gains and losses on the commodity derivative instruments held by Fidelity were included in income (loss) from discontinued operations and the associated assets and liabilities were classified as held for sale.
Effective April 1, 2013, Fidelity elected to de-designate all commodity derivative contracts previously designated as cash flow hedges and elected to discontinue hedge accounting prospectively for all of its commodity derivative instruments. When the criteria for hedge accounting is not met or when hedge accounting is not elected, realized gains and losses and unrealized gains and losses are both recorded in operating revenues on the Consolidated Statements of Income. As a result of discontinuing hedge accounting on commodity derivative instruments, gains and losses on the oil and natural gas derivative instruments remain in accumulated other comprehensive income (loss) as of the de-designation date and are reclassified into earnings in future periods as the underlying hedged transactions affect earnings. At April 1, 2013, accumulated other comprehensive income (loss) included $1.8 million of unrealized gains, representing the mark-to-market value of the Company's commodity derivative instruments that qualified as cash flow hedges as of the balance sheet date, which the Company has subsequently reclassified into earnings.
Prior to April 1, 2013, changes in the fair value attributable to the effective portion of the hedging instruments, net of tax, were recorded in stockholders' equity as a component of accumulated other comprehensive income (loss). To the extent that the hedges were not effective or did not qualify for hedge accounting, the ineffective portion of the changes in fair market value was recorded directly in earnings. Gains and losses on the oil and natural gas derivative instruments were reclassified from accumulated other comprehensive income (loss) into income (loss) from discontinued operations on the Consolidated Statements of Income at the date the oil and natural gas quantities were settled.
CentennialCentennial has historically entered into interest rate derivative instruments to manage a portion of its interest rate exposure on the forecasted issuance of long-term debt. At December 31, 2015, Centennial had no outstanding interest rate swap agreements.
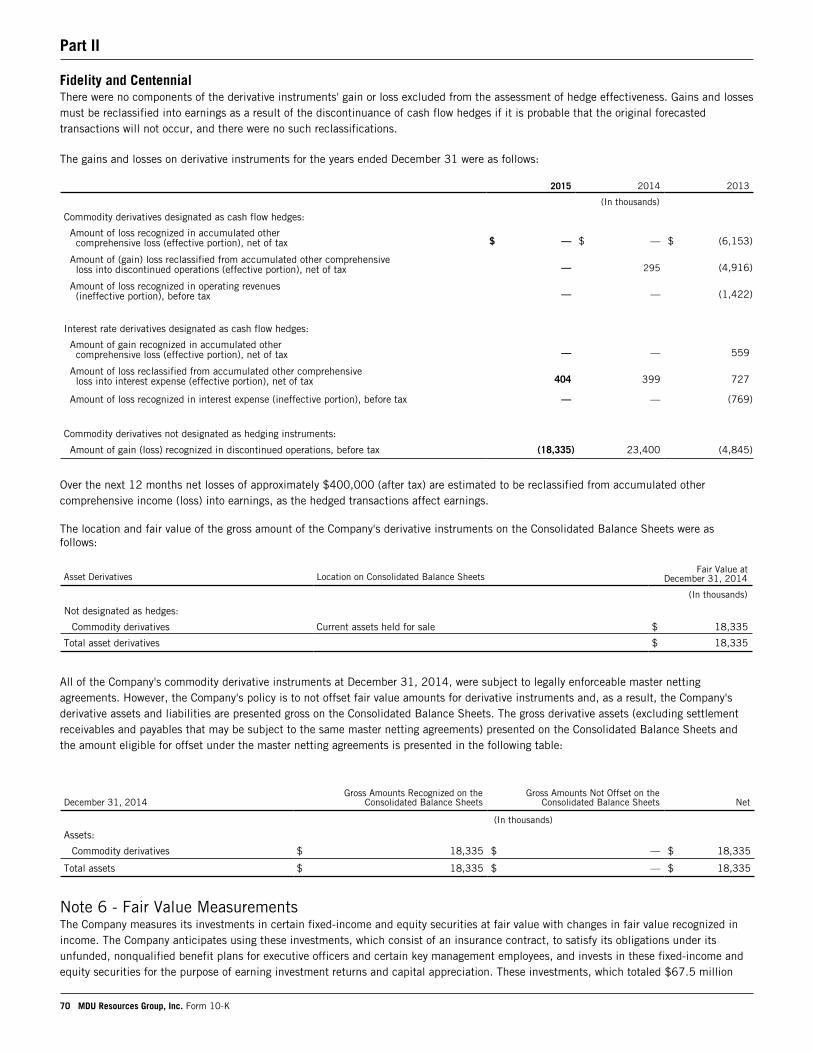
Part II
70 MDU Resources Group, Inc. Form 10-K
Fidelity and CentennialThere were no components of the derivative instruments' gain or loss excluded from the assessment of hedge effectiveness. Gains and losses must be reclassified into earnings as a result of the discontinuance of cash flow hedges if it is probable that the original forecasted transactions will not occur, and there were no such reclassifications.
The gains and losses on derivative instruments for the years ended December 31 were as follows:
2015 2014 2013
(In thousands)
Commodity derivatives designated as cash flow hedges:
Amount of loss recognized in accumulated othercomprehensive loss (effective portion), net of tax $ — $ — $ (6,153)
Amount of (gain) loss reclassified from accumulated other comprehensiveloss into discontinued operations (effective portion), net of tax — 295 (4,916)
Amount of loss recognized in operating revenues(ineffective portion), before tax — — (1,422)
Interest rate derivatives designated as cash flow hedges:
Amount of gain recognized in accumulated othercomprehensive loss (effective portion), net of tax — — 559
Amount of loss reclassified from accumulated other comprehensiveloss into interest expense (effective portion), net of tax 404 399 727
Amount of loss recognized in interest expense (ineffective portion), before tax — — (769)
Commodity derivatives not designated as hedging instruments:
Amount of gain (loss) recognized in discontinued operations, before tax (18,335) 23,400 (4,845)
Over the next 12 months net losses of approximately $400,000 (after tax) are estimated to be reclassified from accumulated other comprehensive income (loss) into earnings, as the hedged transactions affect earnings.
The location and fair value of the gross amount of the Company's derivative instruments on the Consolidated Balance Sheets were as follows:
Asset Derivatives Location on Consolidated Balance SheetsFair Value at
December 31, 2014
(In thousands)
Not designated as hedges:
Commodity derivatives Current assets held for sale $ 18,335
Total asset derivatives $ 18,335
All of the Company's commodity derivative instruments at December 31, 2014, were subject to legally enforceable master netting agreements. However, the Company's policy is to not offset fair value amounts for derivative instruments and, as a result, the Company's derivative assets and liabilities are presented gross on the Consolidated Balance Sheets. The gross derivative assets (excluding settlement receivables and payables that may be subject to the same master netting agreements) presented on the Consolidated Balance Sheets and the amount eligible for offset under the master netting agreements is presented in the following table:
December 31, 2014Gross Amounts Recognized on the
Consolidated Balance SheetsGross Amounts Not Offset on the
Consolidated Balance Sheets Net
(In thousands)
Assets:
Commodity derivatives $ 18,335 $ — $ 18,335
Total assets $ 18,335 $ — $ 18,335
Note 6 - Fair Value MeasurementsThe Company measures its investments in certain fixed-income and equity securities at fair value with changes in fair value recognized in income. The Company anticipates using these investments, which consist of an insurance contract, to satisfy its obligations under its unfunded, nonqualified benefit plans for executive officers and certain key management employees, and invests in these fixed-income and equity securities for the purpose of earning investment returns and capital appreciation. These investments, which totaled $67.5 million
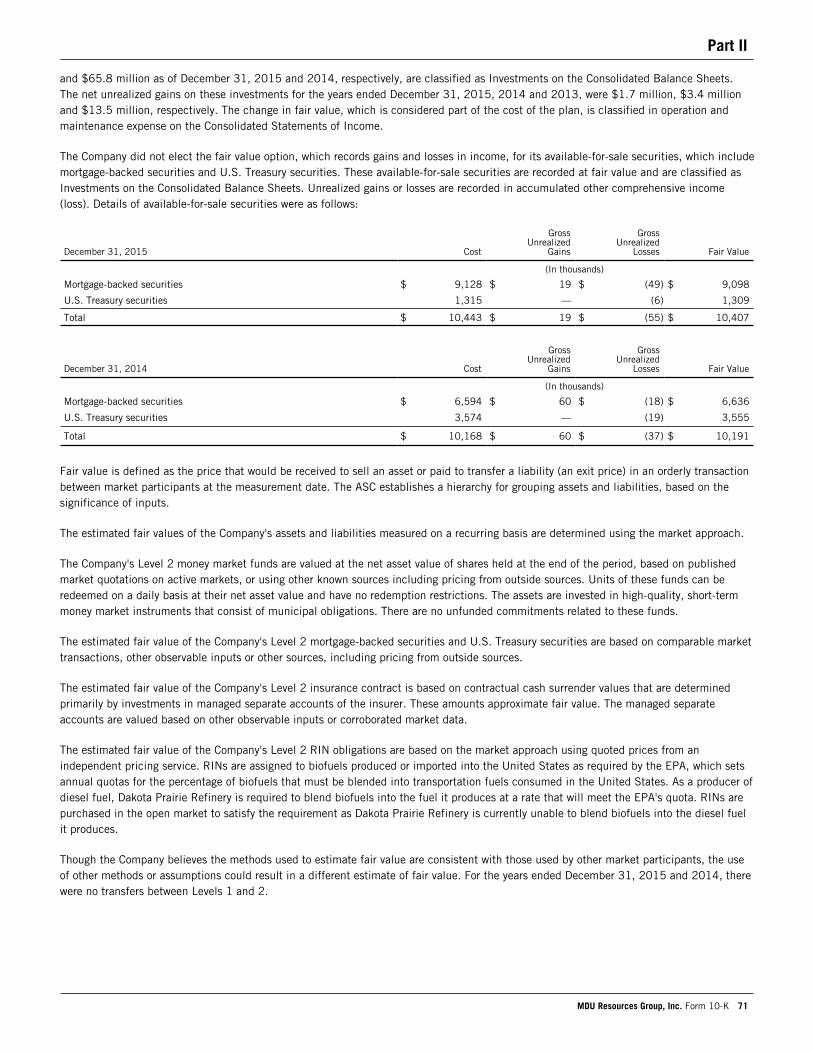
Part II
MDU Resources Group, Inc. Form 10-K 71
and $65.8 million as of December 31, 2015 and 2014, respectively, are classified as Investments on the Consolidated Balance Sheets. The net unrealized gains on these investments for the years ended December 31, 2015, 2014 and 2013, were $1.7 million, $3.4 million and $13.5 million, respectively. The change in fair value, which is considered part of the cost of the plan, is classified in operation and maintenance expense on the Consolidated Statements of Income.
The Company did not elect the fair value option, which records gains and losses in income, for its available-for-sale securities, which include mortgage-backed securities and U.S. Treasury securities. These available-for-sale securities are recorded at fair value and are classified as Investments on the Consolidated Balance Sheets. Unrealized gains or losses are recorded in accumulated other comprehensive income (loss). Details of available-for-sale securities were as follows:
December 31, 2015 Cost
GrossUnrealized
Gains
GrossUnrealized
Losses Fair Value
(In thousands)
Mortgage-backed securities $ 9,128 $ 19 $ (49) $ 9,098
U.S. Treasury securities 1,315 — (6) 1,309
Total $ 10,443 $ 19 $ (55) $ 10,407
December 31, 2014 Cost
GrossUnrealized
Gains
GrossUnrealized
Losses Fair Value
(In thousands)
Mortgage-backed securities $ 6,594 $ 60 $ (18) $ 6,636
U.S. Treasury securities 3,574 — (19) 3,555
Total $ 10,168 $ 60 $ (37) $ 10,191
Fair value is defined as the price that would be received to sell an asset or paid to transfer a liability (an exit price) in an orderly transaction between market participants at the measurement date. The ASC establishes a hierarchy for grouping assets and liabilities, based on the significance of inputs.
The estimated fair values of the Company's assets and liabilities measured on a recurring basis are determined using the market approach.
The Company's Level 2 money market funds are valued at the net asset value of shares held at the end of the period, based on published market quotations on active markets, or using other known sources including pricing from outside sources. Units of these funds can be redeemed on a daily basis at their net asset value and have no redemption restrictions. The assets are invested in high-quality, short-term money market instruments that consist of municipal obligations. There are no unfunded commitments related to these funds.
The estimated fair value of the Company's Level 2 mortgage-backed securities and U.S. Treasury securities are based on comparable market transactions, other observable inputs or other sources, including pricing from outside sources.
The estimated fair value of the Company's Level 2 insurance contract is based on contractual cash surrender values that are determined primarily by investments in managed separate accounts of the insurer. These amounts approximate fair value. The managed separate accounts are valued based on other observable inputs or corroborated market data.
The estimated fair value of the Company's Level 2 RIN obligations are based on the market approach using quoted prices from an independent pricing service. RINs are assigned to biofuels produced or imported into the United States as required by the EPA, which sets annual quotas for the percentage of biofuels that must be blended into transportation fuels consumed in the United States. As a producer of diesel fuel, Dakota Prairie Refinery is required to blend biofuels into the fuel it produces at a rate that will meet the EPA's quota. RINs are purchased in the open market to satisfy the requirement as Dakota Prairie Refinery is currently unable to blend biofuels into the diesel fuel it produces.
Though the Company believes the methods used to estimate fair value are consistent with those used by other market participants, the use of other methods or assumptions could result in a different estimate of fair value. For the years ended December 31, 2015 and 2014, there were no transfers between Levels 1 and 2.
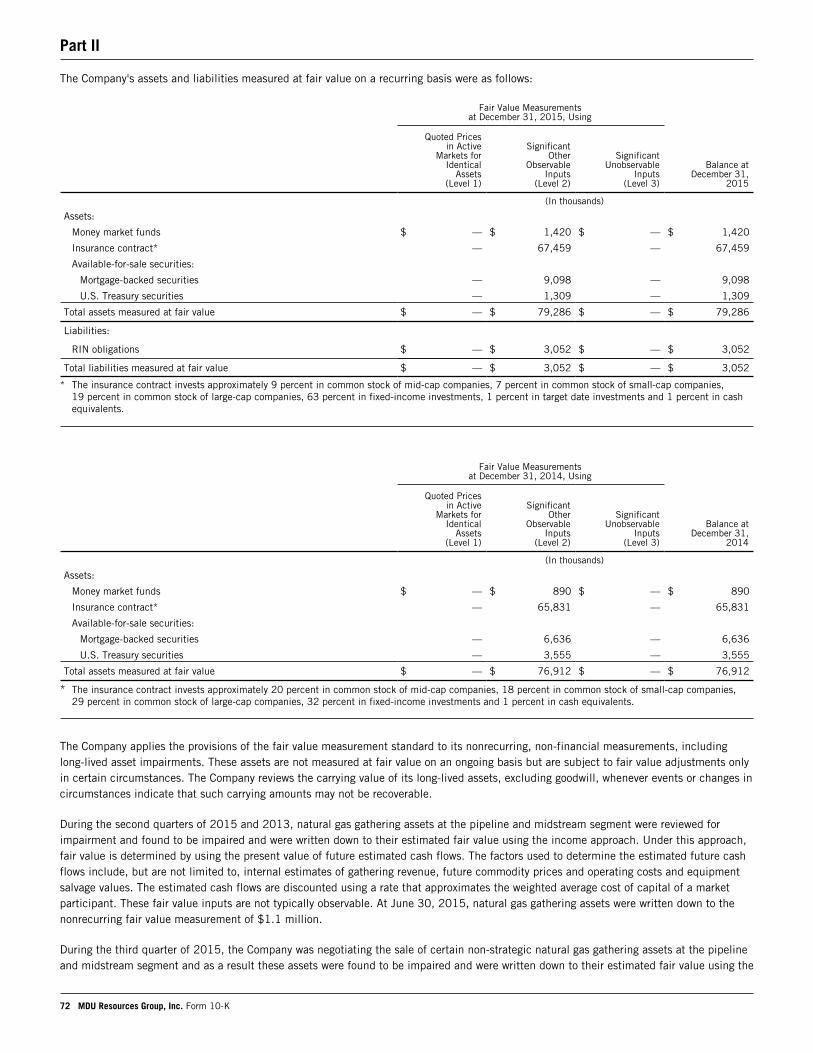
Part II
72 MDU Resources Group, Inc. Form 10-K
The Company's assets and liabilities measured at fair value on a recurring basis were as follows:
Fair Value Measurements
at December 31, 2015, Using
Quoted Pricesin Active
Markets forIdentical
Assets(Level 1)
SignificantOther
ObservableInputs
(Level 2)
SignificantUnobservable
Inputs (Level 3)
Balance atDecember 31,
2015
(In thousands)
Assets:
Money market funds $ — $ 1,420 $ — $ 1,420
Insurance contract* — 67,459 — 67,459
Available-for-sale securities:
Mortgage-backed securities — 9,098 — 9,098
U.S. Treasury securities — 1,309 — 1,309
Total assets measured at fair value $ — $ 79,286 $ — $ 79,286
Liabilities:
RIN obligations $ — $ 3,052 $ — $ 3,052
Total liabilities measured at fair value $ — $ 3,052 $ — $ 3,052
* The insurance contract invests approximately 9 percent in common stock of mid-cap companies, 7 percent in common stock of small-cap companies, 19 percent in common stock of large-cap companies, 63 percent in fixed-income investments, 1 percent in target date investments and 1 percent in cash equivalents.
Fair Value Measurements
at December 31, 2014, Using
Quoted Pricesin Active
Markets forIdentical
Assets (Level 1)
SignificantOther
ObservableInputs
(Level 2)
SignificantUnobservable
Inputs (Level 3)
Balance atDecember 31,
2014
(In thousands)
Assets:
Money market funds $ — $ 890 $ — $ 890
Insurance contract* — 65,831 — 65,831
Available-for-sale securities:
Mortgage-backed securities — 6,636 — 6,636
U.S. Treasury securities — 3,555 — 3,555
Total assets measured at fair value $ — $ 76,912 $ — $ 76,912
* The insurance contract invests approximately 20 percent in common stock of mid-cap companies, 18 percent in common stock of small-cap companies, 29 percent in common stock of large-cap companies, 32 percent in fixed-income investments and 1 percent in cash equivalents.
The Company applies the provisions of the fair value measurement standard to its nonrecurring, non-financial measurements, including long-lived asset impairments. These assets are not measured at fair value on an ongoing basis but are subject to fair value adjustments only in certain circumstances. The Company reviews the carrying value of its long-lived assets, excluding goodwill, whenever events or changes in circumstances indicate that such carrying amounts may not be recoverable.
During the second quarters of 2015 and 2013, natural gas gathering assets at the pipeline and midstream segment were reviewed for impairment and found to be impaired and were written down to their estimated fair value using the income approach. Under this approach, fair value is determined by using the present value of future estimated cash flows. The factors used to determine the estimated future cash flows include, but are not limited to, internal estimates of gathering revenue, future commodity prices and operating costs and equipment salvage values. The estimated cash flows are discounted using a rate that approximates the weighted average cost of capital of a market participant. These fair value inputs are not typically observable. At June 30, 2015, natural gas gathering assets were written down to the nonrecurring fair value measurement of $1.1 million.
During the third quarter of 2015, the Company was negotiating the sale of certain non-strategic natural gas gathering assets at the pipeline and midstream segment and as a result these assets were found to be impaired and were written down to their estimated fair value using the
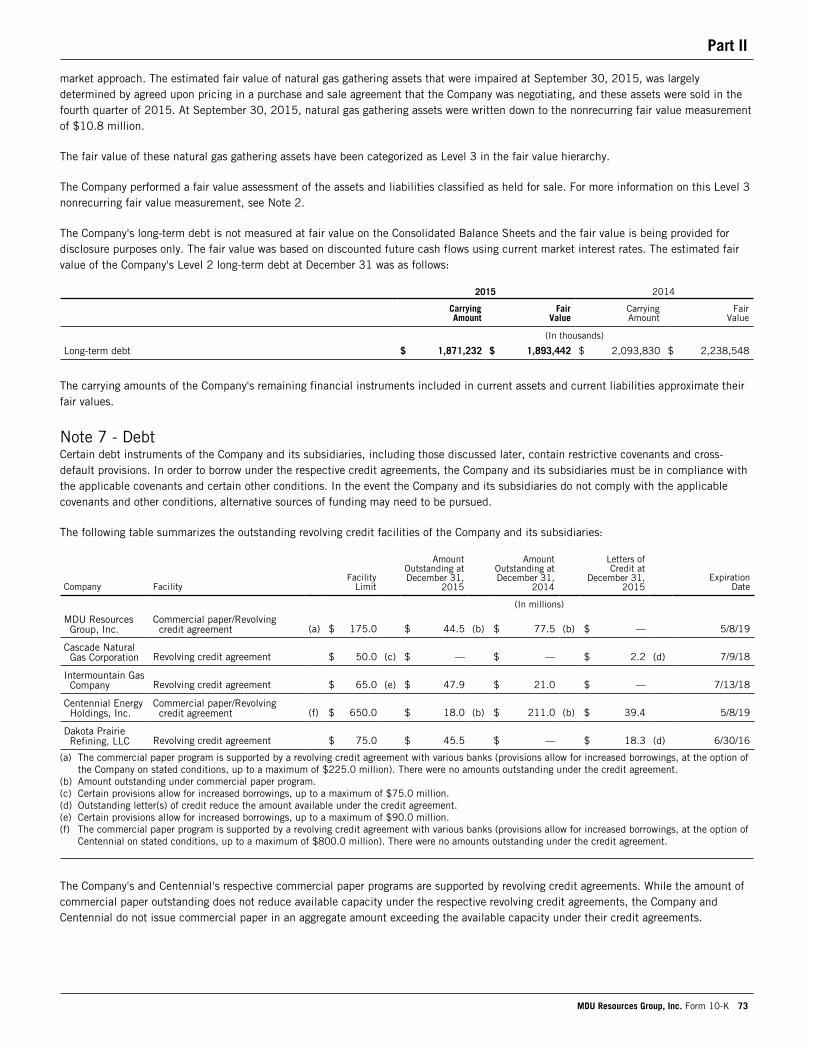
Part II
MDU Resources Group, Inc. Form 10-K 73
market approach. The estimated fair value of natural gas gathering assets that were impaired at September 30, 2015, was largely determined by agreed upon pricing in a purchase and sale agreement that the Company was negotiating, and these assets were sold in the fourth quarter of 2015. At September 30, 2015, natural gas gathering assets were written down to the nonrecurring fair value measurement of $10.8 million.
The fair value of these natural gas gathering assets have been categorized as Level 3 in the fair value hierarchy.
The Company performed a fair value assessment of the assets and liabilities classified as held for sale. For more information on this Level 3 nonrecurring fair value measurement, see Note 2.
The Company's long-term debt is not measured at fair value on the Consolidated Balance Sheets and the fair value is being provided for disclosure purposes only. The fair value was based on discounted future cash flows using current market interest rates. The estimated fair value of the Company's Level 2 long-term debt at December 31 was as follows:
2015 2014
CarryingAmount
FairValue
CarryingAmount
FairValue
(In thousands)
Long-term debt $ 1,871,232 $ 1,893,442 $ 2,093,830 $ 2,238,548
The carrying amounts of the Company's remaining financial instruments included in current assets and current liabilities approximate their fair values.
Note 7 - DebtCertain debt instruments of the Company and its subsidiaries, including those discussed later, contain restrictive covenants and cross-default provisions. In order to borrow under the respective credit agreements, the Company and its subsidiaries must be in compliance with the applicable covenants and certain other conditions. In the event the Company and its subsidiaries do not comply with the applicable covenants and other conditions, alternative sources of funding may need to be pursued.
The following table summarizes the outstanding revolving credit facilities of the Company and its subsidiaries:
Company FacilityFacility
Limit
AmountOutstanding atDecember 31,
2015
Amount Outstanding at December 31,
2014
Letters ofCredit at
December 31, 2015
ExpirationDate
(In millions)
MDU ResourcesGroup, Inc.
Commercial paper/Revolvingcredit agreement (a) $ 175.0 $ 44.5 (b) $ 77.5 (b) $ — 5/8/19
Cascade NaturalGas Corporation Revolving credit agreement $ 50.0 (c) $ — $ — $ 2.2 (d) 7/9/18
Intermountain GasCompany Revolving credit agreement $ 65.0 (e) $ 47.9 $ 21.0 $ — 7/13/18
Centennial EnergyHoldings, Inc.
Commercial paper/Revolvingcredit agreement (f) $ 650.0 $ 18.0 (b) $ 211.0 (b) $ 39.4 5/8/19
Dakota PrairieRefining, LLC Revolving credit agreement $ 75.0 $ 45.5 $ — $ 18.3 (d) 6/30/16
(a) The commercial paper program is supported by a revolving credit agreement with various banks (provisions allow for increased borrowings, at the option of the Company on stated conditions, up to a maximum of $225.0 million). There were no amounts outstanding under the credit agreement.
(b) Amount outstanding under commercial paper program.(c) Certain provisions allow for increased borrowings, up to a maximum of $75.0 million.(d) Outstanding letter(s) of credit reduce the amount available under the credit agreement.(e) Certain provisions allow for increased borrowings, up to a maximum of $90.0 million.(f) The commercial paper program is supported by a revolving credit agreement with various banks (provisions allow for increased borrowings, at the option of
Centennial on stated conditions, up to a maximum of $800.0 million). There were no amounts outstanding under the credit agreement.
The Company's and Centennial's respective commercial paper programs are supported by revolving credit agreements. While the amount of commercial paper outstanding does not reduce available capacity under the respective revolving credit agreements, the Company and Centennial do not issue commercial paper in an aggregate amount exceeding the available capacity under their credit agreements.
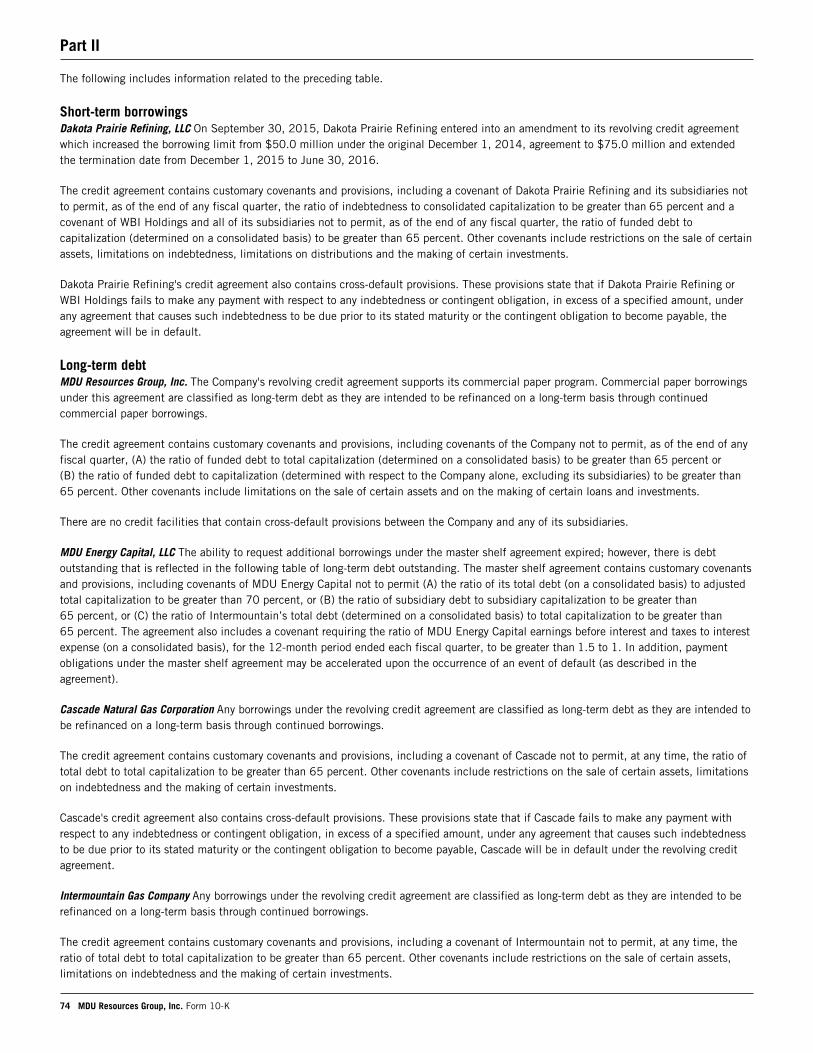
Part II
74 MDU Resources Group, Inc. Form 10-K
The following includes information related to the preceding table.
Short-term borrowingsDakota Prairie Refining, LLC On September 30, 2015, Dakota Prairie Refining entered into an amendment to its revolving credit agreement which increased the borrowing limit from $50.0 million under the original December 1, 2014, agreement to $75.0 million and extended the termination date from December 1, 2015 to June 30, 2016.
The credit agreement contains customary covenants and provisions, including a covenant of Dakota Prairie Refining and its subsidiaries not to permit, as of the end of any fiscal quarter, the ratio of indebtedness to consolidated capitalization to be greater than 65 percent and a covenant of WBI Holdings and all of its subsidiaries not to permit, as of the end of any fiscal quarter, the ratio of funded debt to capitalization (determined on a consolidated basis) to be greater than 65 percent. Other covenants include restrictions on the sale of certain assets, limitations on indebtedness, limitations on distributions and the making of certain investments.
Dakota Prairie Refining's credit agreement also contains cross-default provisions. These provisions state that if Dakota Prairie Refining or WBI Holdings fails to make any payment with respect to any indebtedness or contingent obligation, in excess of a specified amount, under any agreement that causes such indebtedness to be due prior to its stated maturity or the contingent obligation to become payable, the agreement will be in default.
Long-term debtMDU Resources Group, Inc. The Company's revolving credit agreement supports its commercial paper program. Commercial paper borrowings under this agreement are classified as long-term debt as they are intended to be refinanced on a long-term basis through continued commercial paper borrowings.
The credit agreement contains customary covenants and provisions, including covenants of the Company not to permit, as of the end of any fiscal quarter, (A) the ratio of funded debt to total capitalization (determined on a consolidated basis) to be greater than 65 percent or (B) the ratio of funded debt to capitalization (determined with respect to the Company alone, excluding its subsidiaries) to be greater than 65 percent. Other covenants include limitations on the sale of certain assets and on the making of certain loans and investments.
There are no credit facilities that contain cross-default provisions between the Company and any of its subsidiaries.
MDU Energy Capital, LLC The ability to request additional borrowings under the master shelf agreement expired; however, there is debt outstanding that is reflected in the following table of long-term debt outstanding. The master shelf agreement contains customary covenants and provisions, including covenants of MDU Energy Capital not to permit (A) the ratio of its total debt (on a consolidated basis) to adjusted total capitalization to be greater than 70 percent, or (B) the ratio of subsidiary debt to subsidiary capitalization to be greater than 65 percent, or (C) the ratio of Intermountain’s total debt (determined on a consolidated basis) to total capitalization to be greater than 65 percent. The agreement also includes a covenant requiring the ratio of MDU Energy Capital earnings before interest and taxes to interest expense (on a consolidated basis), for the 12-month period ended each fiscal quarter, to be greater than 1.5 to 1. In addition, payment obligations under the master shelf agreement may be accelerated upon the occurrence of an event of default (as described in the agreement).
Cascade Natural Gas Corporation Any borrowings under the revolving credit agreement are classified as long-term debt as they are intended to be refinanced on a long-term basis through continued borrowings.
The credit agreement contains customary covenants and provisions, including a covenant of Cascade not to permit, at any time, the ratio of total debt to total capitalization to be greater than 65 percent. Other covenants include restrictions on the sale of certain assets, limitations on indebtedness and the making of certain investments.
Cascade's credit agreement also contains cross-default provisions. These provisions state that if Cascade fails to make any payment with respect to any indebtedness or contingent obligation, in excess of a specified amount, under any agreement that causes such indebtedness to be due prior to its stated maturity or the contingent obligation to become payable, Cascade will be in default under the revolving credit agreement.
Intermountain Gas Company Any borrowings under the revolving credit agreement are classified as long-term debt as they are intended to be refinanced on a long-term basis through continued borrowings.
The credit agreement contains customary covenants and provisions, including a covenant of Intermountain not to permit, at any time, the ratio of total debt to total capitalization to be greater than 65 percent. Other covenants include restrictions on the sale of certain assets, limitations on indebtedness and the making of certain investments.
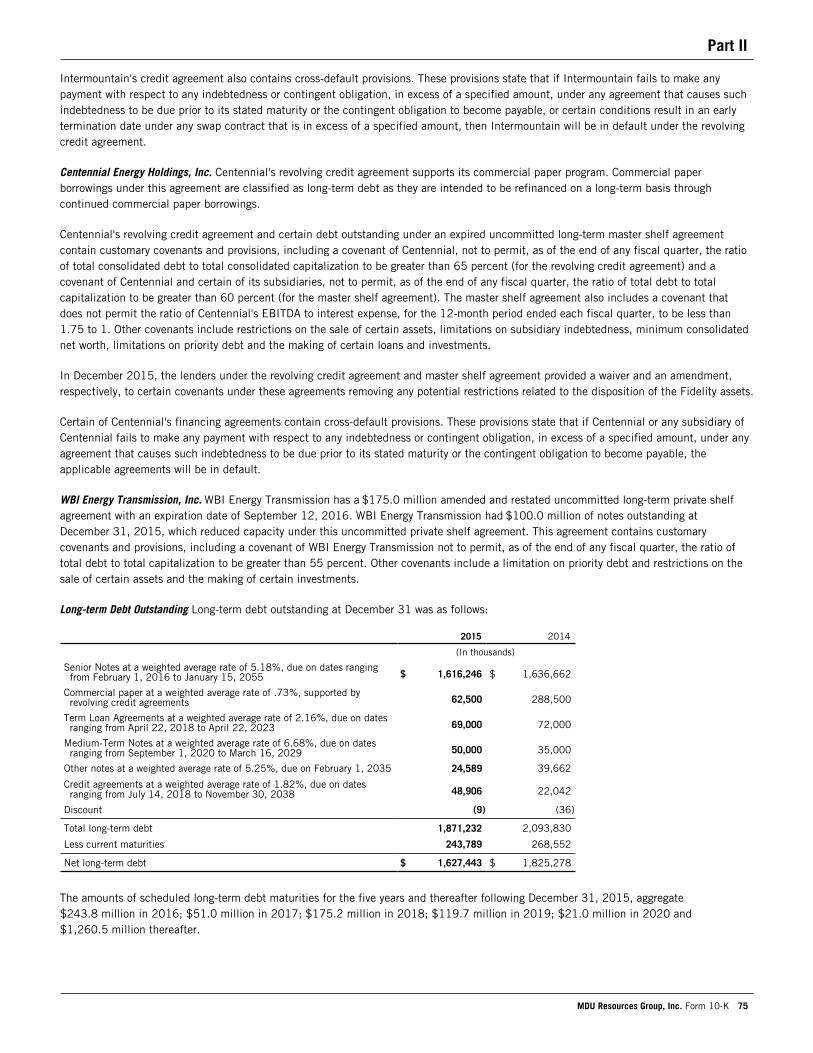
Part II
MDU Resources Group, Inc. Form 10-K 75
Intermountain's credit agreement also contains cross-default provisions. These provisions state that if Intermountain fails to make any payment with respect to any indebtedness or contingent obligation, in excess of a specified amount, under any agreement that causes such indebtedness to be due prior to its stated maturity or the contingent obligation to become payable, or certain conditions result in an early termination date under any swap contract that is in excess of a specified amount, then Intermountain will be in default under the revolving credit agreement.
Centennial Energy Holdings, Inc. Centennial's revolving credit agreement supports its commercial paper program. Commercial paper borrowings under this agreement are classified as long-term debt as they are intended to be refinanced on a long-term basis through continued commercial paper borrowings.
Centennial's revolving credit agreement and certain debt outstanding under an expired uncommitted long-term master shelf agreement contain customary covenants and provisions, including a covenant of Centennial, not to permit, as of the end of any fiscal quarter, the ratio of total consolidated debt to total consolidated capitalization to be greater than 65 percent (for the revolving credit agreement) and a covenant of Centennial and certain of its subsidiaries, not to permit, as of the end of any fiscal quarter, the ratio of total debt to total capitalization to be greater than 60 percent (for the master shelf agreement). The master shelf agreement also includes a covenant that does not permit the ratio of Centennial's EBITDA to interest expense, for the 12-month period ended each fiscal quarter, to be less than 1.75 to 1. Other covenants include restrictions on the sale of certain assets, limitations on subsidiary indebtedness, minimum consolidated net worth, limitations on priority debt and the making of certain loans and investments.
In December 2015, the lenders under the revolving credit agreement and master shelf agreement provided a waiver and an amendment, respectively, to certain covenants under these agreements removing any potential restrictions related to the disposition of the Fidelity assets.
Certain of Centennial's financing agreements contain cross-default provisions. These provisions state that if Centennial or any subsidiary of Centennial fails to make any payment with respect to any indebtedness or contingent obligation, in excess of a specified amount, under any agreement that causes such indebtedness to be due prior to its stated maturity or the contingent obligation to become payable, the applicable agreements will be in default.
WBI Energy Transmission, Inc. WBI Energy Transmission has a $175.0 million amended and restated uncommitted long-term private shelf agreement with an expiration date of September 12, 2016. WBI Energy Transmission had $100.0 million of notes outstanding at December 31, 2015, which reduced capacity under this uncommitted private shelf agreement. This agreement contains customary covenants and provisions, including a covenant of WBI Energy Transmission not to permit, as of the end of any fiscal quarter, the ratio of total debt to total capitalization to be greater than 55 percent. Other covenants include a limitation on priority debt and restrictions on the sale of certain assets and the making of certain investments.
Long-term Debt Outstanding Long-term debt outstanding at December 31 was as follows:
2015 2014
(In thousands)
Senior Notes at a weighted average rate of 5.18%, due on dates rangingfrom February 1, 2016 to January 15, 2055 $ 1,616,246 $ 1,636,662
Commercial paper at a weighted average rate of .73%, supported byrevolving credit agreements 62,500 288,500
Term Loan Agreements at a weighted average rate of 2.16%, due on datesranging from April 22, 2018 to April 22, 2023 69,000 72,000
Medium-Term Notes at a weighted average rate of 6.68%, due on datesranging from September 1, 2020 to March 16, 2029 50,000 35,000
Other notes at a weighted average rate of 5.25%, due on February 1, 2035 24,589 39,662
Credit agreements at a weighted average rate of 1.82%, due on datesranging from July 14, 2018 to November 30, 2038 48,906 22,042
Discount (9) (36)
Total long-term debt 1,871,232 2,093,830
Less current maturities 243,789 268,552
Net long-term debt $ 1,627,443 $ 1,825,278
The amounts of scheduled long-term debt maturities for the five years and thereafter following December 31, 2015, aggregate $243.8 million in 2016; $51.0 million in 2017; $175.2 million in 2018; $119.7 million in 2019; $21.0 million in 2020 and $1,260.5 million thereafter.
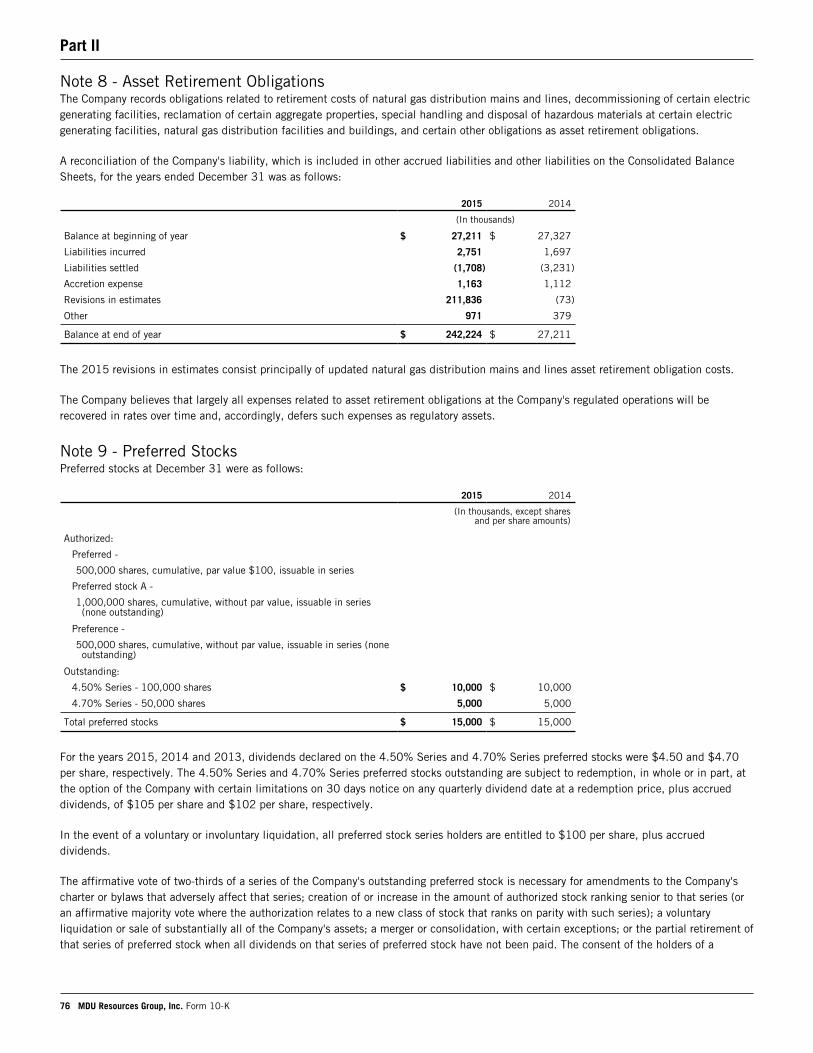
Part II
76 MDU Resources Group, Inc. Form 10-K
Note 8 - Asset Retirement ObligationsThe Company records obligations related to retirement costs of natural gas distribution mains and lines, decommissioning of certain electric generating facilities, reclamation of certain aggregate properties, special handling and disposal of hazardous materials at certain electric generating facilities, natural gas distribution facilities and buildings, and certain other obligations as asset retirement obligations.
A reconciliation of the Company's liability, which is included in other accrued liabilities and other liabilities on the Consolidated Balance Sheets, for the years ended December 31 was as follows:
2015 2014
(In thousands)
Balance at beginning of year $ 27,211 $ 27,327
Liabilities incurred 2,751 1,697
Liabilities settled (1,708) (3,231)
Accretion expense 1,163 1,112
Revisions in estimates 211,836 (73)
Other 971 379
Balance at end of year $ 242,224 $ 27,211
The 2015 revisions in estimates consist principally of updated natural gas distribution mains and lines asset retirement obligation costs.
The Company believes that largely all expenses related to asset retirement obligations at the Company's regulated operations will be recovered in rates over time and, accordingly, defers such expenses as regulatory assets.
Note 9 - Preferred StocksPreferred stocks at December 31 were as follows:
2015 2014
(In thousands, except sharesand per share amounts)
Authorized:
Preferred -
500,000 shares, cumulative, par value $100, issuable in series
Preferred stock A -
1,000,000 shares, cumulative, without par value, issuable in series(none outstanding)
Preference -
500,000 shares, cumulative, without par value, issuable in series (noneoutstanding)
Outstanding:
4.50% Series - 100,000 shares $ 10,000 $ 10,000
4.70% Series - 50,000 shares 5,000 5,000
Total preferred stocks $ 15,000 $ 15,000
For the years 2015, 2014 and 2013, dividends declared on the 4.50% Series and 4.70% Series preferred stocks were $4.50 and $4.70 per share, respectively. The 4.50% Series and 4.70% Series preferred stocks outstanding are subject to redemption, in whole or in part, at the option of the Company with certain limitations on 30 days notice on any quarterly dividend date at a redemption price, plus accrued dividends, of $105 per share and $102 per share, respectively.
In the event of a voluntary or involuntary liquidation, all preferred stock series holders are entitled to $100 per share, plus accrued dividends.
The affirmative vote of two-thirds of a series of the Company's outstanding preferred stock is necessary for amendments to the Company's charter or bylaws that adversely affect that series; creation of or increase in the amount of authorized stock ranking senior to that series (or an affirmative majority vote where the authorization relates to a new class of stock that ranks on parity with such series); a voluntary liquidation or sale of substantially all of the Company's assets; a merger or consolidation, with certain exceptions; or the partial retirement of that series of preferred stock when all dividends on that series of preferred stock have not been paid. The consent of the holders of a
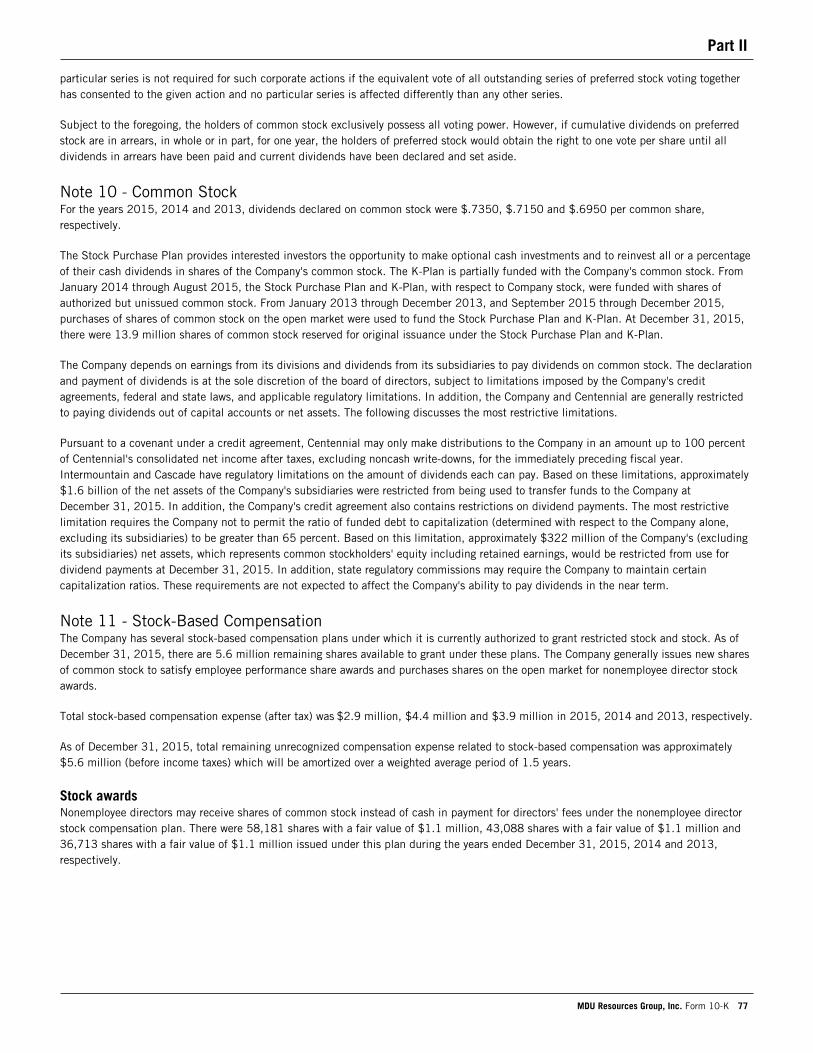
Part II
MDU Resources Group, Inc. Form 10-K 77
particular series is not required for such corporate actions if the equivalent vote of all outstanding series of preferred stock voting together has consented to the given action and no particular series is affected differently than any other series.
Subject to the foregoing, the holders of common stock exclusively possess all voting power. However, if cumulative dividends on preferred stock are in arrears, in whole or in part, for one year, the holders of preferred stock would obtain the right to one vote per share until all dividends in arrears have been paid and current dividends have been declared and set aside.
Note 10 - Common StockFor the years 2015, 2014 and 2013, dividends declared on common stock were $.7350, $.7150 and $.6950 per common share, respectively.
The Stock Purchase Plan provides interested investors the opportunity to make optional cash investments and to reinvest all or a percentage of their cash dividends in shares of the Company's common stock. The K-Plan is partially funded with the Company's common stock. From January 2014 through August 2015, the Stock Purchase Plan and K-Plan, with respect to Company stock, were funded with shares of authorized but unissued common stock. From January 2013 through December 2013, and September 2015 through December 2015, purchases of shares of common stock on the open market were used to fund the Stock Purchase Plan and K-Plan. At December 31, 2015, there were 13.9 million shares of common stock reserved for original issuance under the Stock Purchase Plan and K-Plan.
The Company depends on earnings from its divisions and dividends from its subsidiaries to pay dividends on common stock. The declaration and payment of dividends is at the sole discretion of the board of directors, subject to limitations imposed by the Company's credit agreements, federal and state laws, and applicable regulatory limitations. In addition, the Company and Centennial are generally restricted to paying dividends out of capital accounts or net assets. The following discusses the most restrictive limitations.
Pursuant to a covenant under a credit agreement, Centennial may only make distributions to the Company in an amount up to 100 percent of Centennial's consolidated net income after taxes, excluding noncash write-downs, for the immediately preceding fiscal year. Intermountain and Cascade have regulatory limitations on the amount of dividends each can pay. Based on these limitations, approximately $1.6 billion of the net assets of the Company's subsidiaries were restricted from being used to transfer funds to the Company at December 31, 2015. In addition, the Company's credit agreement also contains restrictions on dividend payments. The most restrictive limitation requires the Company not to permit the ratio of funded debt to capitalization (determined with respect to the Company alone, excluding its subsidiaries) to be greater than 65 percent. Based on this limitation, approximately $322 million of the Company's (excluding its subsidiaries) net assets, which represents common stockholders' equity including retained earnings, would be restricted from use for dividend payments at December 31, 2015. In addition, state regulatory commissions may require the Company to maintain certain capitalization ratios. These requirements are not expected to affect the Company's ability to pay dividends in the near term.
Note 11 - Stock-Based CompensationThe Company has several stock-based compensation plans under which it is currently authorized to grant restricted stock and stock. As of December 31, 2015, there are 5.6 million remaining shares available to grant under these plans. The Company generally issues new shares of common stock to satisfy employee performance share awards and purchases shares on the open market for nonemployee director stock awards.
Total stock-based compensation expense (after tax) was $2.9 million, $4.4 million and $3.9 million in 2015, 2014 and 2013, respectively.
As of December 31, 2015, total remaining unrecognized compensation expense related to stock-based compensation was approximately $5.6 million (before income taxes) which will be amortized over a weighted average period of 1.5 years.
Stock awardsNonemployee directors may receive shares of common stock instead of cash in payment for directors' fees under the nonemployee director stock compensation plan. There were 58,181 shares with a fair value of $1.1 million, 43,088 shares with a fair value of $1.1 million and 36,713 shares with a fair value of $1.1 million issued under this plan during the years ended December 31, 2015, 2014 and 2013, respectively.
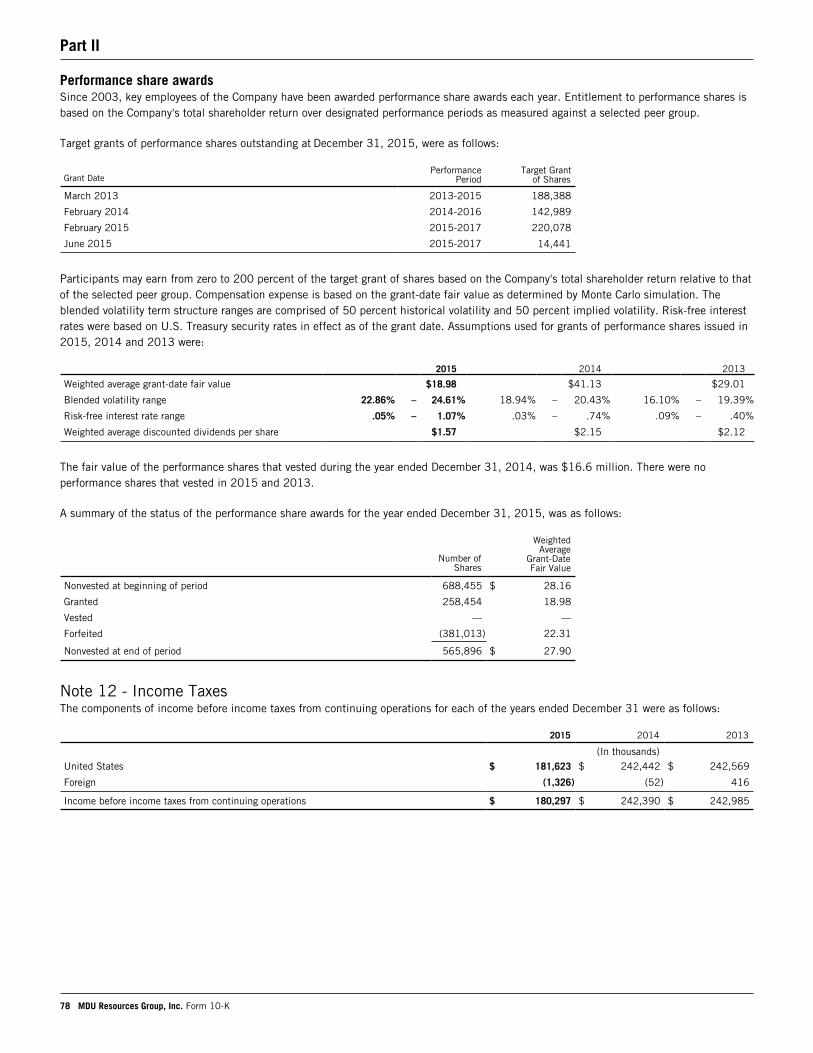
Part II
78 MDU Resources Group, Inc. Form 10-K
Performance share awardsSince 2003, key employees of the Company have been awarded performance share awards each year. Entitlement to performance shares is based on the Company's total shareholder return over designated performance periods as measured against a selected peer group.
Target grants of performance shares outstanding at December 31, 2015, were as follows:
Grant DatePerformance
PeriodTarget Grant
of Shares
March 2013 2013-2015 188,388
February 2014 2014-2016 142,989
February 2015 2015-2017 220,078
June 2015 2015-2017 14,441
Participants may earn from zero to 200 percent of the target grant of shares based on the Company's total shareholder return relative to that of the selected peer group. Compensation expense is based on the grant-date fair value as determined by Monte Carlo simulation. The blended volatility term structure ranges are comprised of 50 percent historical volatility and 50 percent implied volatility. Risk-free interest rates were based on U.S. Treasury security rates in effect as of the grant date. Assumptions used for grants of performance shares issued in 2015, 2014 and 2013 were:
2015 2014 2013
Weighted average grant-date fair value $18.98 $41.13 $29.01
Blended volatility range 22.86% – 24.61% 18.94% – 20.43% 16.10% – 19.39%
Risk-free interest rate range .05% – 1.07% .03% – .74% .09% – .40%
Weighted average discounted dividends per share $1.57 $2.15 $2.12
The fair value of the performance shares that vested during the year ended December 31, 2014, was $16.6 million. There were no performance shares that vested in 2015 and 2013.
A summary of the status of the performance share awards for the year ended December 31, 2015, was as follows:
Number of
Shares
WeightedAverage
Grant-DateFair Value
Nonvested at beginning of period 688,455 $ 28.16
Granted 258,454 18.98
Vested — —
Forfeited (381,013) 22.31
Nonvested at end of period 565,896 $ 27.90
Note 12 - Income TaxesThe components of income before income taxes from continuing operations for each of the years ended December 31 were as follows:
2015 2014 2013
(In thousands)United States $ 181,623 $ 242,442 $ 242,569
Foreign (1,326) (52) 416
Income before income taxes from continuing operations $ 180,297 $ 242,390 $ 242,985
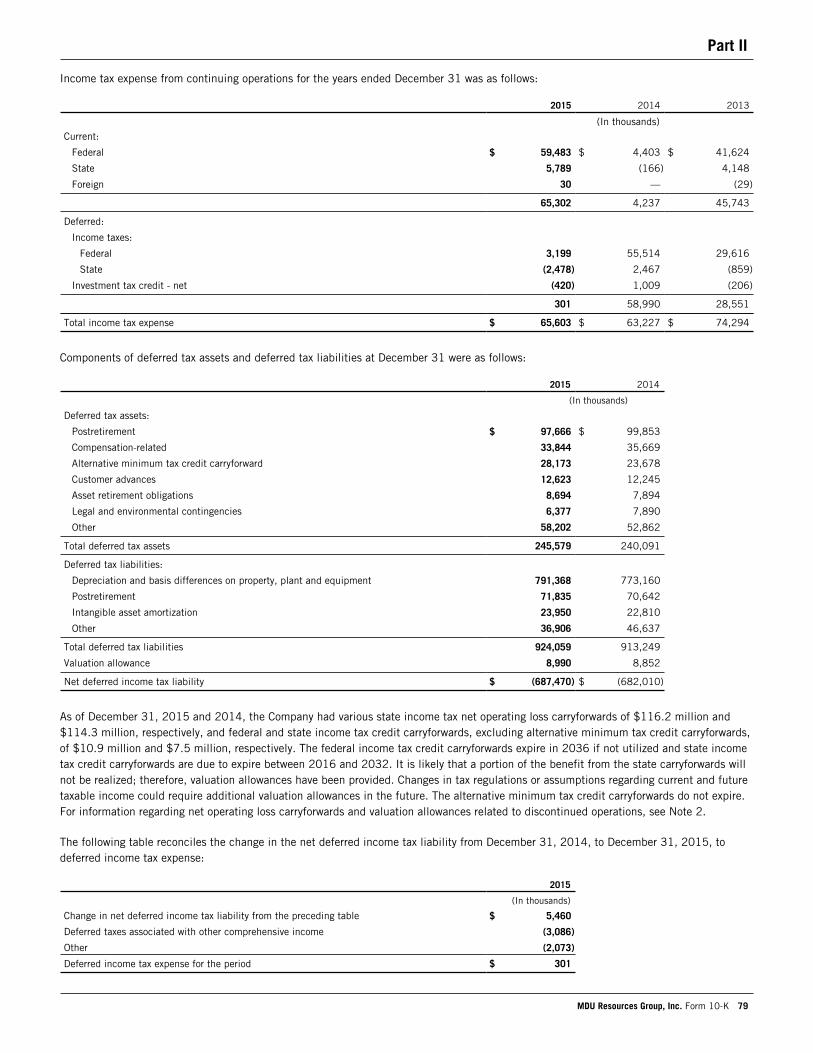
Part II
MDU Resources Group, Inc. Form 10-K 79
Income tax expense from continuing operations for the years ended December 31 was as follows:
2015 2014 2013
(In thousands)Current:
Federal $ 59,483 $ 4,403 $ 41,624
State 5,789 (166) 4,148
Foreign 30 — (29)
65,302 4,237 45,743
Deferred:
Income taxes:
Federal 3,199 55,514 29,616
State (2,478) 2,467 (859)
Investment tax credit - net (420) 1,009 (206)
301 58,990 28,551
Total income tax expense $ 65,603 $ 63,227 $ 74,294
Components of deferred tax assets and deferred tax liabilities at December 31 were as follows:
2015 2014
(In thousands)
Deferred tax assets:
Postretirement $ 97,666 $ 99,853
Compensation-related 33,844 35,669
Alternative minimum tax credit carryforward 28,173 23,678
Customer advances 12,623 12,245
Asset retirement obligations 8,694 7,894
Legal and environmental contingencies 6,377 7,890
Other 58,202 52,862
Total deferred tax assets 245,579 240,091
Deferred tax liabilities:
Depreciation and basis differences on property, plant and equipment 791,368 773,160
Postretirement 71,835 70,642
Intangible asset amortization 23,950 22,810
Other 36,906 46,637
Total deferred tax liabilities 924,059 913,249
Valuation allowance 8,990 8,852
Net deferred income tax liability $ (687,470) $ (682,010)
As of December 31, 2015 and 2014, the Company had various state income tax net operating loss carryforwards of $116.2 million and $114.3 million, respectively, and federal and state income tax credit carryforwards, excluding alternative minimum tax credit carryforwards, of $10.9 million and $7.5 million, respectively. The federal income tax credit carryforwards expire in 2036 if not utilized and state income tax credit carryforwards are due to expire between 2016 and 2032. It is likely that a portion of the benefit from the state carryforwards will not be realized; therefore, valuation allowances have been provided. Changes in tax regulations or assumptions regarding current and future taxable income could require additional valuation allowances in the future. The alternative minimum tax credit carryforwards do not expire. For information regarding net operating loss carryforwards and valuation allowances related to discontinued operations, see Note 2.
The following table reconciles the change in the net deferred income tax liability from December 31, 2014, to December 31, 2015, to deferred income tax expense:
2015
(In thousands)
Change in net deferred income tax liability from the preceding table $ 5,460
Deferred taxes associated with other comprehensive income (3,086)
Other (2,073)
Deferred income tax expense for the period $ 301
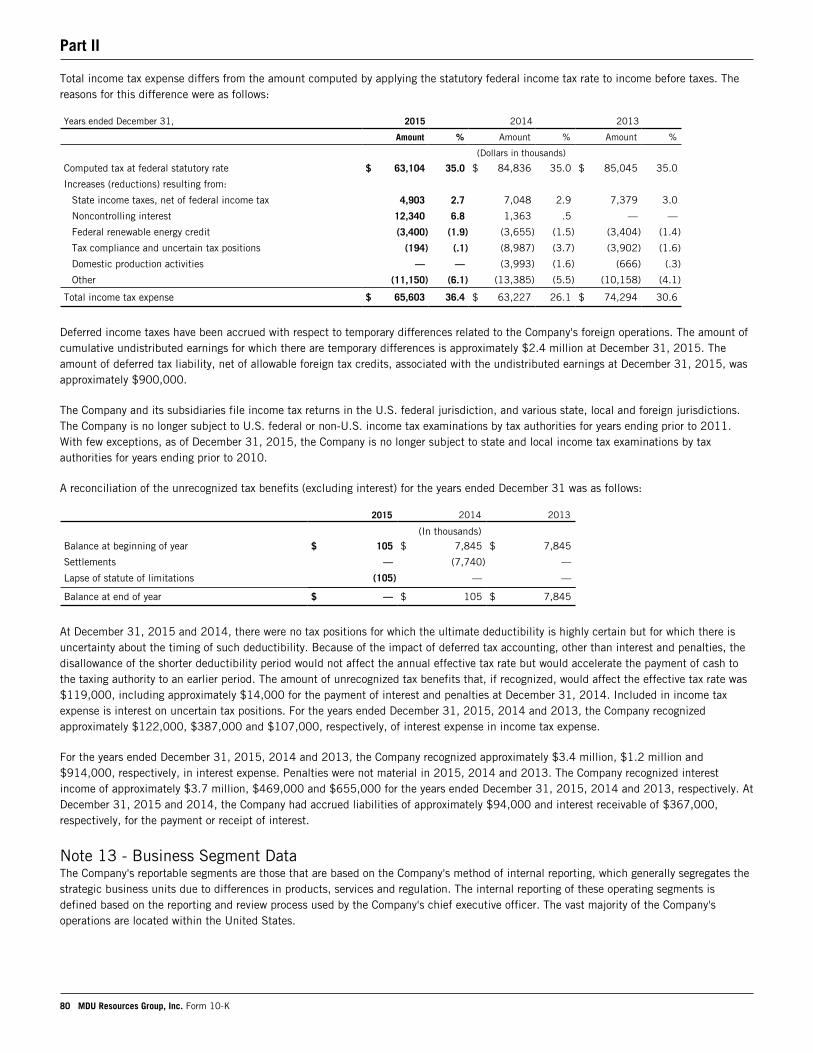
Part II
80 MDU Resources Group, Inc. Form 10-K
Total income tax expense differs from the amount computed by applying the statutory federal income tax rate to income before taxes. The reasons for this difference were as follows:
Years ended December 31, 2015 2014 2013
Amount % Amount % Amount %
(Dollars in thousands)
Computed tax at federal statutory rate $ 63,104 35.0 $ 84,836 35.0 $ 85,045 35.0
Increases (reductions) resulting from:
State income taxes, net of federal income tax 4,903 2.7 7,048 2.9 7,379 3.0
Noncontrolling interest 12,340 6.8 1,363 .5 — —
Federal renewable energy credit (3,400) (1.9) (3,655) (1.5) (3,404) (1.4)
Tax compliance and uncertain tax positions (194) (.1) (8,987) (3.7) (3,902) (1.6)
Domestic production activities — — (3,993) (1.6) (666) (.3)
Other (11,150) (6.1) (13,385) (5.5) (10,158) (4.1)
Total income tax expense $ 65,603 36.4 $ 63,227 26.1 $ 74,294 30.6
Deferred income taxes have been accrued with respect to temporary differences related to the Company's foreign operations. The amount of cumulative undistributed earnings for which there are temporary differences is approximately $2.4 million at December 31, 2015. The amount of deferred tax liability, net of allowable foreign tax credits, associated with the undistributed earnings at December 31, 2015, was approximately $900,000.
The Company and its subsidiaries file income tax returns in the U.S. federal jurisdiction, and various state, local and foreign jurisdictions. The Company is no longer subject to U.S. federal or non-U.S. income tax examinations by tax authorities for years ending prior to 2011. With few exceptions, as of December 31, 2015, the Company is no longer subject to state and local income tax examinations by tax authorities for years ending prior to 2010.
A reconciliation of the unrecognized tax benefits (excluding interest) for the years ended December 31 was as follows:
2015 2014 2013
(In thousands)Balance at beginning of year $ 105 $ 7,845 $ 7,845
Settlements — (7,740) —
Lapse of statute of limitations (105) — —
Balance at end of year $ — $ 105 $ 7,845
At December 31, 2015 and 2014, there were no tax positions for which the ultimate deductibility is highly certain but for which there is uncertainty about the timing of such deductibility. Because of the impact of deferred tax accounting, other than interest and penalties, the disallowance of the shorter deductibility period would not affect the annual effective tax rate but would accelerate the payment of cash to the taxing authority to an earlier period. The amount of unrecognized tax benefits that, if recognized, would affect the effective tax rate was $119,000, including approximately $14,000 for the payment of interest and penalties at December 31, 2014. Included in income tax expense is interest on uncertain tax positions. For the years ended December 31, 2015, 2014 and 2013, the Company recognized approximately $122,000, $387,000 and $107,000, respectively, of interest expense in income tax expense.
For the years ended December 31, 2015, 2014 and 2013, the Company recognized approximately $3.4 million, $1.2 million and $914,000, respectively, in interest expense. Penalties were not material in 2015, 2014 and 2013. The Company recognized interest income of approximately $3.7 million, $469,000 and $655,000 for the years ended December 31, 2015, 2014 and 2013, respectively. At December 31, 2015 and 2014, the Company had accrued liabilities of approximately $94,000 and interest receivable of $367,000, respectively, for the payment or receipt of interest.
Note 13 - Business Segment DataThe Company's reportable segments are those that are based on the Company's method of internal reporting, which generally segregates the strategic business units due to differences in products, services and regulation. The internal reporting of these operating segments is defined based on the reporting and review process used by the Company's chief executive officer. The vast majority of the Company's operations are located within the United States.
Part II
MDU Resources Group, Inc. Form 10-K 81
The electric segment generates, transmits and distributes electricity in Montana, North Dakota, South Dakota and Wyoming. The natural gas distribution segment distributes natural gas in those states as well as in Idaho, Minnesota, Oregon and Washington. These operations also supply related value-added services.
The pipeline and midstream segment provides natural gas transportation, underground storage, processing and gathering services, as well as oil gathering, through regulated and nonregulated pipeline systems and processing facilities primarily in the Rocky Mountain and northern Great Plains regions of the United States.
The construction materials and contracting segment mines aggregates and markets crushed stone, sand, gravel and related construction materials, including ready-mixed concrete, cement, asphalt, liquid asphalt and other value-added products. It also performs integrated contracting services. This segment operates in the central, southern and western United States and Alaska and Hawaii.
The construction services segment provides utility construction services specializing in constructing and maintaining electric and communication lines, gas pipelines, fire suppression systems, and external lighting and traffic signalization. This segment also provides utility excavation and inside electrical and mechanical services, and manufactures and distributes transmission line construction equipment and other supplies.
The refining segment refines crude oil and produces and sells diesel fuel, naphtha, ATBs and other by-products of the production process. The refining segment includes Dakota Prairie Refinery which is jointly owned by WBI Energy and Calumet and is located in southwestern North Dakota, along with WBI Energy's other activity that supports the refinery.
The Other category includes the activities of Centennial Capital, which insures various types of risks as a captive insurer for certain of the Company's subsidiaries. The function of the captive insurer is to fund the deductible layers of the insured companies' general liability, automobile liability and pollution liability coverages. Centennial Capital also owns certain real and personal property. The Other category includes certain general and administrative costs (reflected in operation and maintenance expense) and interest expense which were previously allocated to Fidelity and do not meet the criteria for income (loss) from discontinued operations. The Other category also includes Centennial Resources' former investment in the Brazilian Transmission Lines.
Discontinued operations includes the results of Fidelity other than certain general and administrative costs and interest expense as described above. Fidelity engaged in oil and natural gas development and production activities in the Rocky Mountain and Mid-Continent/Gulf States regions of the United States. In the third and fourth quarters of 2015 and the first quarter of 2016, the Company entered into purchase and sale agreements to sell the vast majority of Fidelity's assets, comprising greater than 93 percent of total production for 2014. The completion of the majority of these sales occurred in the fourth quarter of 2015 and the Company continues to market the remaining assets of Fidelity. Discontinued operations also includes legal expenses and a benefit related to the vacation of an arbitration award in 2014 related to Centennial Resources. For more information on discontinued operations, see Note 2.
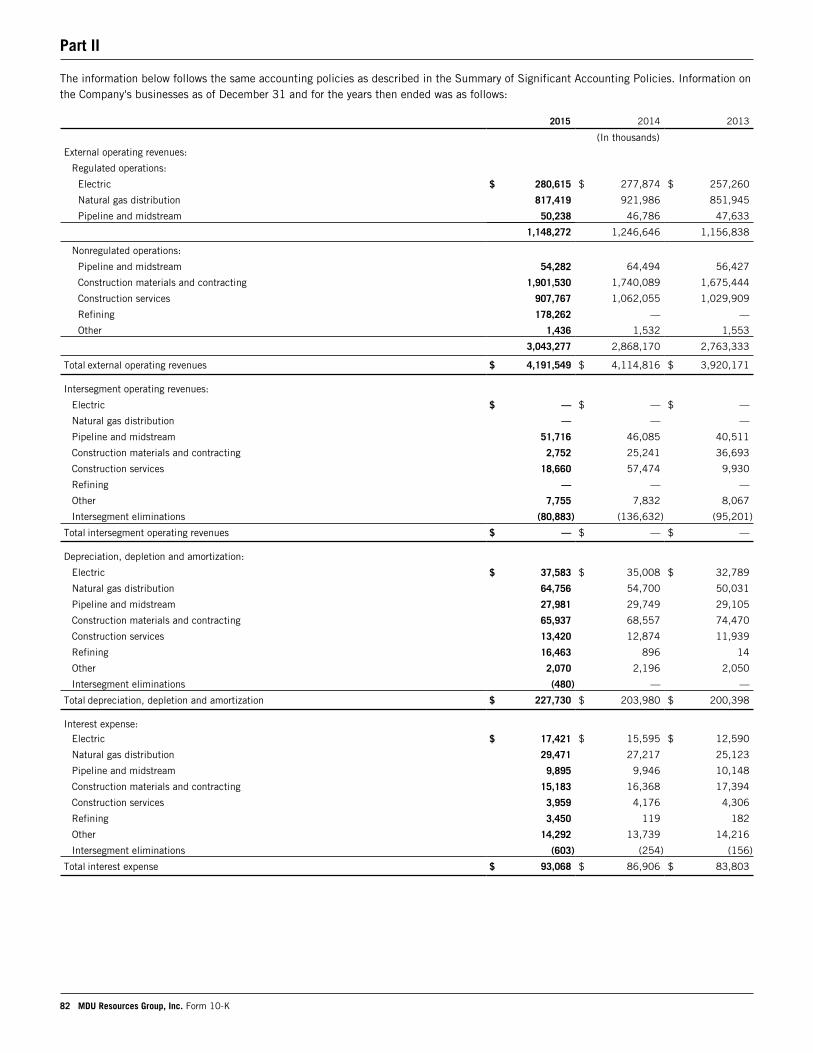
Part II
82 MDU Resources Group, Inc. Form 10-K
The information below follows the same accounting policies as described in the Summary of Significant Accounting Policies. Information on the Company's businesses as of December 31 and for the years then ended was as follows:
2015 2014 2013
(In thousands)External operating revenues:
Regulated operations:
Electric $ 280,615 $ 277,874 $ 257,260
Natural gas distribution 817,419 921,986 851,945
Pipeline and midstream 50,238 46,786 47,633
1,148,272 1,246,646 1,156,838
Nonregulated operations:
Pipeline and midstream 54,282 64,494 56,427
Construction materials and contracting 1,901,530 1,740,089 1,675,444
Construction services 907,767 1,062,055 1,029,909
Refining 178,262 — —
Other 1,436 1,532 1,553
3,043,277 2,868,170 2,763,333
Total external operating revenues $ 4,191,549 $ 4,114,816 $ 3,920,171
Intersegment operating revenues:
Electric $ — $ — $ —
Natural gas distribution — — —
Pipeline and midstream 51,716 46,085 40,511
Construction materials and contracting 2,752 25,241 36,693
Construction services 18,660 57,474 9,930
Refining — — —
Other 7,755 7,832 8,067
Intersegment eliminations (80,883) (136,632) (95,201)
Total intersegment operating revenues $ — $ — $ —
Depreciation, depletion and amortization:
Electric $ 37,583 $ 35,008 $ 32,789
Natural gas distribution 64,756 54,700 50,031
Pipeline and midstream 27,981 29,749 29,105
Construction materials and contracting 65,937 68,557 74,470
Construction services 13,420 12,874 11,939
Refining 16,463 896 14
Other 2,070 2,196 2,050
Intersegment eliminations (480) — —
Total depreciation, depletion and amortization $ 227,730 $ 203,980 $ 200,398
Interest expense:Electric $ 17,421 $ 15,595 $ 12,590
Natural gas distribution 29,471 27,217 25,123
Pipeline and midstream 9,895 9,946 10,148
Construction materials and contracting 15,183 16,368 17,394
Construction services 3,959 4,176 4,306
Refining 3,450 119 182
Other 14,292 13,739 14,216
Intersegment eliminations (603) (254) (156)
Total interest expense $ 93,068 $ 86,906 $ 83,803
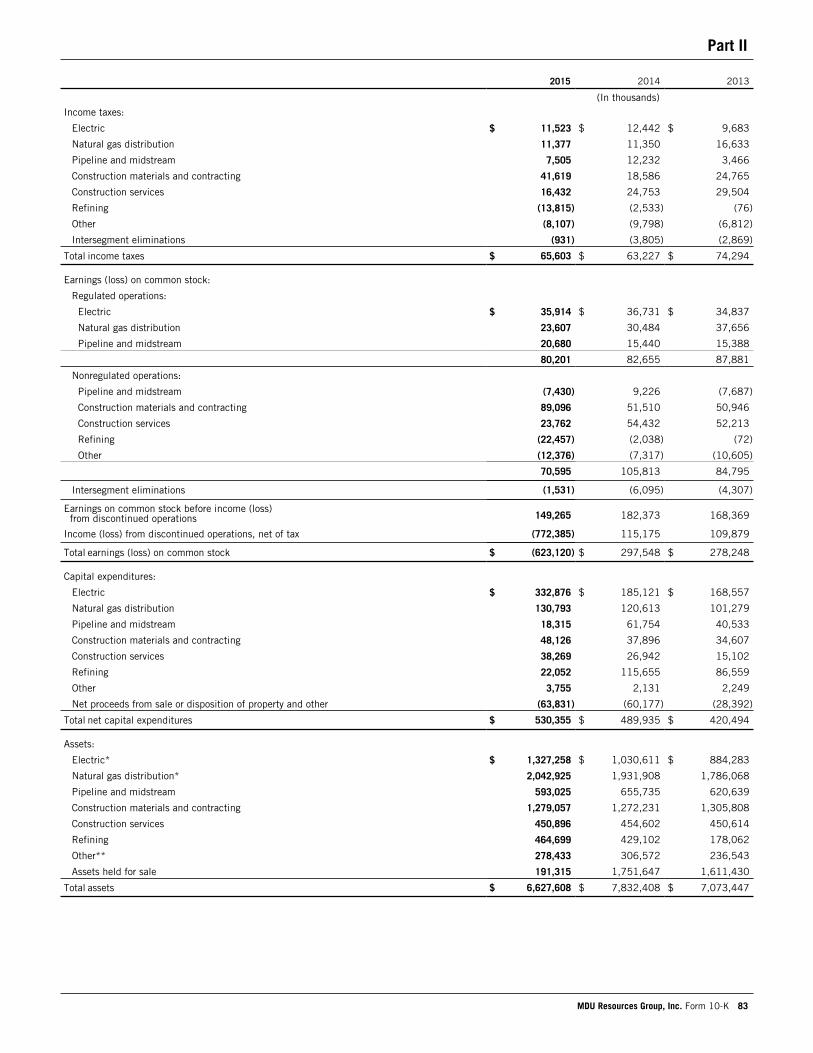
Part II
MDU Resources Group, Inc. Form 10-K 83
2015 2014 2013
(In thousands)Income taxes:
Electric $ 11,523 $ 12,442 $ 9,683
Natural gas distribution 11,377 11,350 16,633
Pipeline and midstream 7,505 12,232 3,466
Construction materials and contracting 41,619 18,586 24,765
Construction services 16,432 24,753 29,504
Refining (13,815) (2,533) (76)
Other (8,107) (9,798) (6,812)
Intersegment eliminations (931) (3,805) (2,869)
Total income taxes $ 65,603 $ 63,227 $ 74,294
Earnings (loss) on common stock:
Regulated operations:
Electric $ 35,914 $ 36,731 $ 34,837
Natural gas distribution 23,607 30,484 37,656
Pipeline and midstream 20,680 15,440 15,388
80,201 82,655 87,881
Nonregulated operations:
Pipeline and midstream (7,430) 9,226 (7,687)
Construction materials and contracting 89,096 51,510 50,946
Construction services 23,762 54,432 52,213
Refining (22,457) (2,038) (72)
Other (12,376) (7,317) (10,605)
70,595 105,813 84,795
Intersegment eliminations (1,531) (6,095) (4,307)
Earnings on common stock before income (loss)from discontinued operations 149,265 182,373 168,369
Income (loss) from discontinued operations, net of tax (772,385) 115,175 109,879
Total earnings (loss) on common stock $ (623,120) $ 297,548 $ 278,248
Capital expenditures:
Electric $ 332,876 $ 185,121 $ 168,557
Natural gas distribution 130,793 120,613 101,279
Pipeline and midstream 18,315 61,754 40,533
Construction materials and contracting 48,126 37,896 34,607
Construction services 38,269 26,942 15,102
Refining 22,052 115,655 86,559
Other 3,755 2,131 2,249
Net proceeds from sale or disposition of property and other (63,831) (60,177) (28,392)
Total net capital expenditures $ 530,355 $ 489,935 $ 420,494
Assets:
Electric* $ 1,327,258 $ 1,030,611 $ 884,283
Natural gas distribution* 2,042,925 1,931,908 1,786,068
Pipeline and midstream 593,025 655,735 620,639
Construction materials and contracting 1,279,057 1,272,231 1,305,808
Construction services 450,896 454,602 450,614
Refining 464,699 429,102 178,062
Other** 278,433 306,572 236,543
Assets held for sale 191,315 1,751,647 1,611,430
Total assets $ 6,627,608 $ 7,832,408 $ 7,073,447
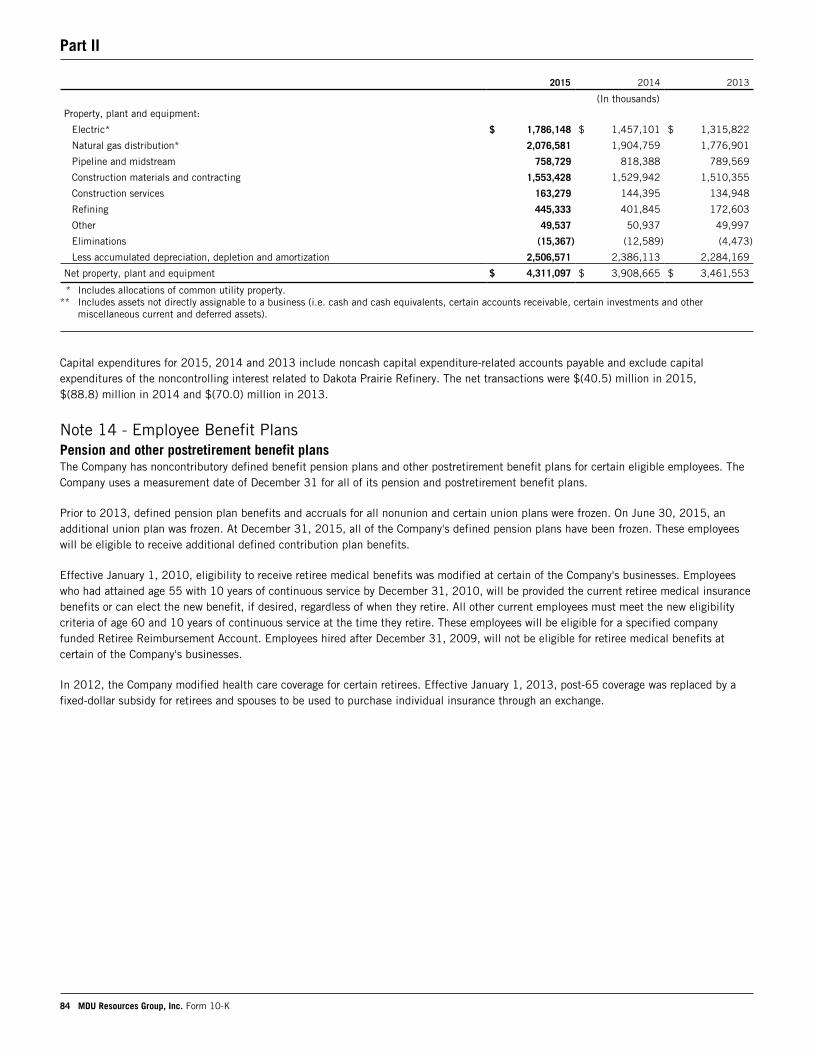
Part II
84 MDU Resources Group, Inc. Form 10-K
2015 2014 2013
(In thousands)Property, plant and equipment:
Electric* $ 1,786,148 $ 1,457,101 $ 1,315,822
Natural gas distribution* 2,076,581 1,904,759 1,776,901
Pipeline and midstream 758,729 818,388 789,569
Construction materials and contracting 1,553,428 1,529,942 1,510,355
Construction services 163,279 144,395 134,948
Refining 445,333 401,845 172,603
Other 49,537 50,937 49,997
Eliminations (15,367) (12,589) (4,473)
Less accumulated depreciation, depletion and amortization 2,506,571 2,386,113 2,284,169
Net property, plant and equipment $ 4,311,097 $ 3,908,665 $ 3,461,553
* Includes allocations of common utility property.** Includes assets not directly assignable to a business (i.e. cash and cash equivalents, certain accounts receivable, certain investments and other
miscellaneous current and deferred assets).
Capital expenditures for 2015, 2014 and 2013 include noncash capital expenditure-related accounts payable and exclude capital expenditures of the noncontrolling interest related to Dakota Prairie Refinery. The net transactions were $(40.5) million in 2015, $(88.8) million in 2014 and $(70.0) million in 2013.
Note 14 - Employee Benefit PlansPension and other postretirement benefit plansThe Company has noncontributory defined benefit pension plans and other postretirement benefit plans for certain eligible employees. The Company uses a measurement date of December 31 for all of its pension and postretirement benefit plans.
Prior to 2013, defined pension plan benefits and accruals for all nonunion and certain union plans were frozen. On June 30, 2015, an additional union plan was frozen. At December 31, 2015, all of the Company's defined pension plans have been frozen. These employees will be eligible to receive additional defined contribution plan benefits.
Effective January 1, 2010, eligibility to receive retiree medical benefits was modified at certain of the Company's businesses. Employees who had attained age 55 with 10 years of continuous service by December 31, 2010, will be provided the current retiree medical insurance benefits or can elect the new benefit, if desired, regardless of when they retire. All other current employees must meet the new eligibility criteria of age 60 and 10 years of continuous service at the time they retire. These employees will be eligible for a specified company funded Retiree Reimbursement Account. Employees hired after December 31, 2009, will not be eligible for retiree medical benefits at certain of the Company's businesses.
In 2012, the Company modified health care coverage for certain retirees. Effective January 1, 2013, post-65 coverage was replaced by a fixed-dollar subsidy for retirees and spouses to be used to purchase individual insurance through an exchange.
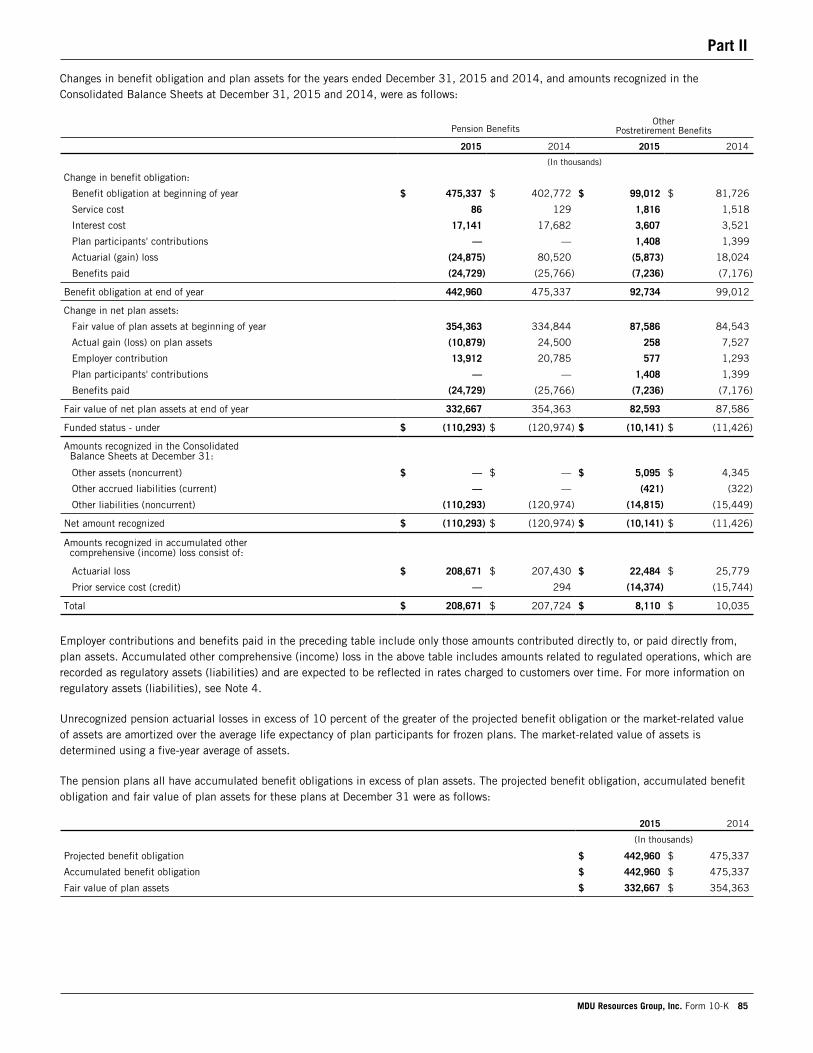
Part II
MDU Resources Group, Inc. Form 10-K 85
Changes in benefit obligation and plan assets for the years ended December 31, 2015 and 2014, and amounts recognized in the Consolidated Balance Sheets at December 31, 2015 and 2014, were as follows:
Pension BenefitsOther
Postretirement Benefits
2015 2014 2015 2014
(In thousands)
Change in benefit obligation:
Benefit obligation at beginning of year $ 475,337 $ 402,772 $ 99,012 $ 81,726
Service cost 86 129 1,816 1,518
Interest cost 17,141 17,682 3,607 3,521
Plan participants' contributions — — 1,408 1,399
Actuarial (gain) loss (24,875) 80,520 (5,873) 18,024
Benefits paid (24,729) (25,766) (7,236) (7,176)
Benefit obligation at end of year 442,960 475,337 92,734 99,012
Change in net plan assets:
Fair value of plan assets at beginning of year 354,363 334,844 87,586 84,543
Actual gain (loss) on plan assets (10,879) 24,500 258 7,527
Employer contribution 13,912 20,785 577 1,293
Plan participants' contributions — — 1,408 1,399
Benefits paid (24,729) (25,766) (7,236) (7,176)
Fair value of net plan assets at end of year 332,667 354,363 82,593 87,586
Funded status - under $ (110,293) $ (120,974) $ (10,141) $ (11,426)
Amounts recognized in the ConsolidatedBalance Sheets at December 31:
Other assets (noncurrent) $ — $ — $ 5,095 $ 4,345
Other accrued liabilities (current) — — (421) (322)
Other liabilities (noncurrent) (110,293) (120,974) (14,815) (15,449)
Net amount recognized $ (110,293) $ (120,974) $ (10,141) $ (11,426)
Amounts recognized in accumulated othercomprehensive (income) loss consist of:
Actuarial loss $ 208,671 $ 207,430 $ 22,484 $ 25,779
Prior service cost (credit) — 294 (14,374) (15,744)
Total $ 208,671 $ 207,724 $ 8,110 $ 10,035
Employer contributions and benefits paid in the preceding table include only those amounts contributed directly to, or paid directly from, plan assets. Accumulated other comprehensive (income) loss in the above table includes amounts related to regulated operations, which are recorded as regulatory assets (liabilities) and are expected to be reflected in rates charged to customers over time. For more information on regulatory assets (liabilities), see Note 4.
Unrecognized pension actuarial losses in excess of 10 percent of the greater of the projected benefit obligation or the market-related value of assets are amortized over the average life expectancy of plan participants for frozen plans. The market-related value of assets is determined using a five-year average of assets.
The pension plans all have accumulated benefit obligations in excess of plan assets. The projected benefit obligation, accumulated benefit obligation and fair value of plan assets for these plans at December 31 were as follows:
2015 2014
(In thousands)
Projected benefit obligation $ 442,960 $ 475,337
Accumulated benefit obligation $ 442,960 $ 475,337
Fair value of plan assets $ 332,667 $ 354,363
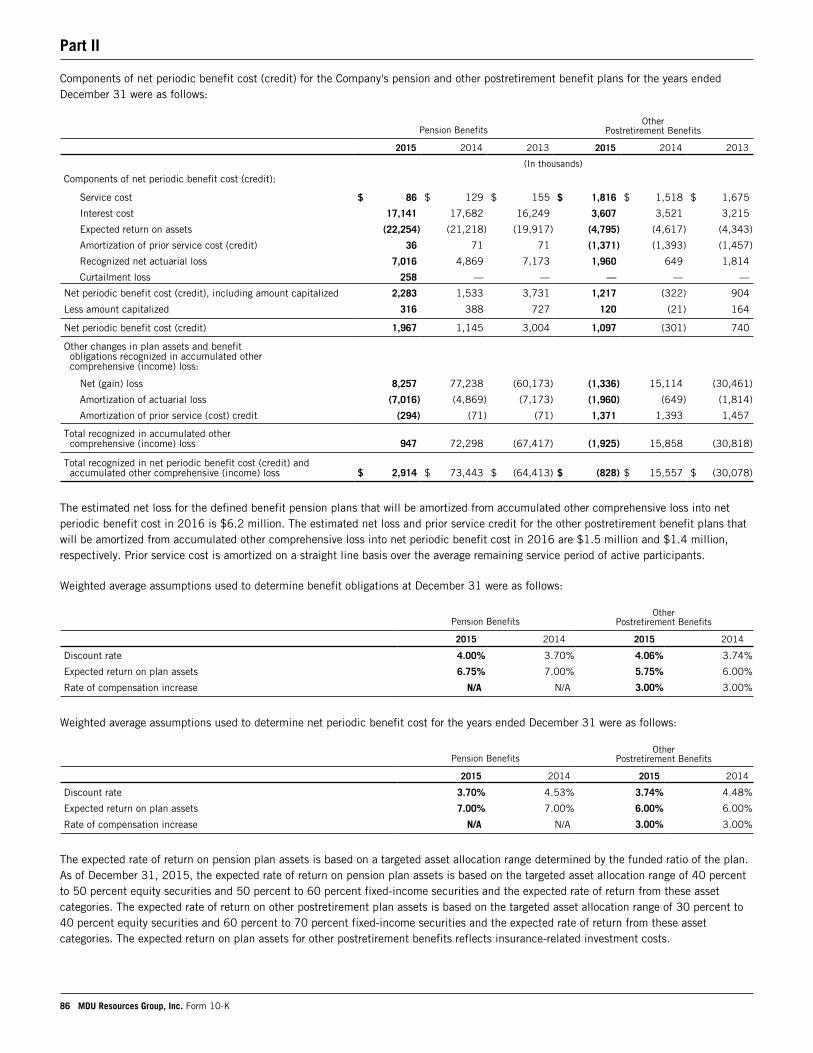
Part II
86 MDU Resources Group, Inc. Form 10-K
Components of net periodic benefit cost (credit) for the Company's pension and other postretirement benefit plans for the years ended December 31 were as follows:
Pension BenefitsOther
Postretirement Benefits
2015 2014 2013 2015 2014 2013
(In thousands)
Components of net periodic benefit cost (credit):
Service cost $ 86 $ 129 $ 155 $ 1,816 $ 1,518 $ 1,675
Interest cost 17,141 17,682 16,249 3,607 3,521 3,215
Expected return on assets (22,254) (21,218) (19,917) (4,795) (4,617) (4,343)
Amortization of prior service cost (credit) 36 71 71 (1,371) (1,393) (1,457)
Recognized net actuarial loss 7,016 4,869 7,173 1,960 649 1,814
Curtailment loss 258 — — — — —
Net periodic benefit cost (credit), including amount capitalized 2,283 1,533 3,731 1,217 (322) 904
Less amount capitalized 316 388 727 120 (21) 164
Net periodic benefit cost (credit) 1,967 1,145 3,004 1,097 (301) 740
Other changes in plan assets and benefitobligations recognized in accumulated othercomprehensive (income) loss:
Net (gain) loss 8,257 77,238 (60,173) (1,336) 15,114 (30,461)
Amortization of actuarial loss (7,016) (4,869) (7,173) (1,960) (649) (1,814)
Amortization of prior service (cost) credit (294) (71) (71) 1,371 1,393 1,457
Total recognized in accumulated othercomprehensive (income) loss 947 72,298 (67,417) (1,925) 15,858 (30,818)
Total recognized in net periodic benefit cost (credit) andaccumulated other comprehensive (income) loss $ 2,914 $ 73,443 $ (64,413) $ (828) $ 15,557 $ (30,078)
The estimated net loss for the defined benefit pension plans that will be amortized from accumulated other comprehensive loss into net periodic benefit cost in 2016 is $6.2 million. The estimated net loss and prior service credit for the other postretirement benefit plans that will be amortized from accumulated other comprehensive loss into net periodic benefit cost in 2016 are $1.5 million and $1.4 million, respectively. Prior service cost is amortized on a straight line basis over the average remaining service period of active participants.
Weighted average assumptions used to determine benefit obligations at December 31 were as follows:
Pension BenefitsOther
Postretirement Benefits
2015 2014 2015 2014
Discount rate 4.00% 3.70% 4.06% 3.74%
Expected return on plan assets 6.75% 7.00% 5.75% 6.00%
Rate of compensation increase N/A N/A 3.00% 3.00%
Weighted average assumptions used to determine net periodic benefit cost for the years ended December 31 were as follows:
Pension BenefitsOther
Postretirement Benefits
2015 2014 2015 2014
Discount rate 3.70% 4.53% 3.74% 4.48%
Expected return on plan assets 7.00% 7.00% 6.00% 6.00%
Rate of compensation increase N/A N/A 3.00% 3.00%
The expected rate of return on pension plan assets is based on a targeted asset allocation range determined by the funded ratio of the plan. As of December 31, 2015, the expected rate of return on pension plan assets is based on the targeted asset allocation range of 40 percent to 50 percent equity securities and 50 percent to 60 percent fixed-income securities and the expected rate of return from these asset categories. The expected rate of return on other postretirement plan assets is based on the targeted asset allocation range of 30 percent to 40 percent equity securities and 60 percent to 70 percent fixed-income securities and the expected rate of return from these asset categories. The expected return on plan assets for other postretirement benefits reflects insurance-related investment costs.
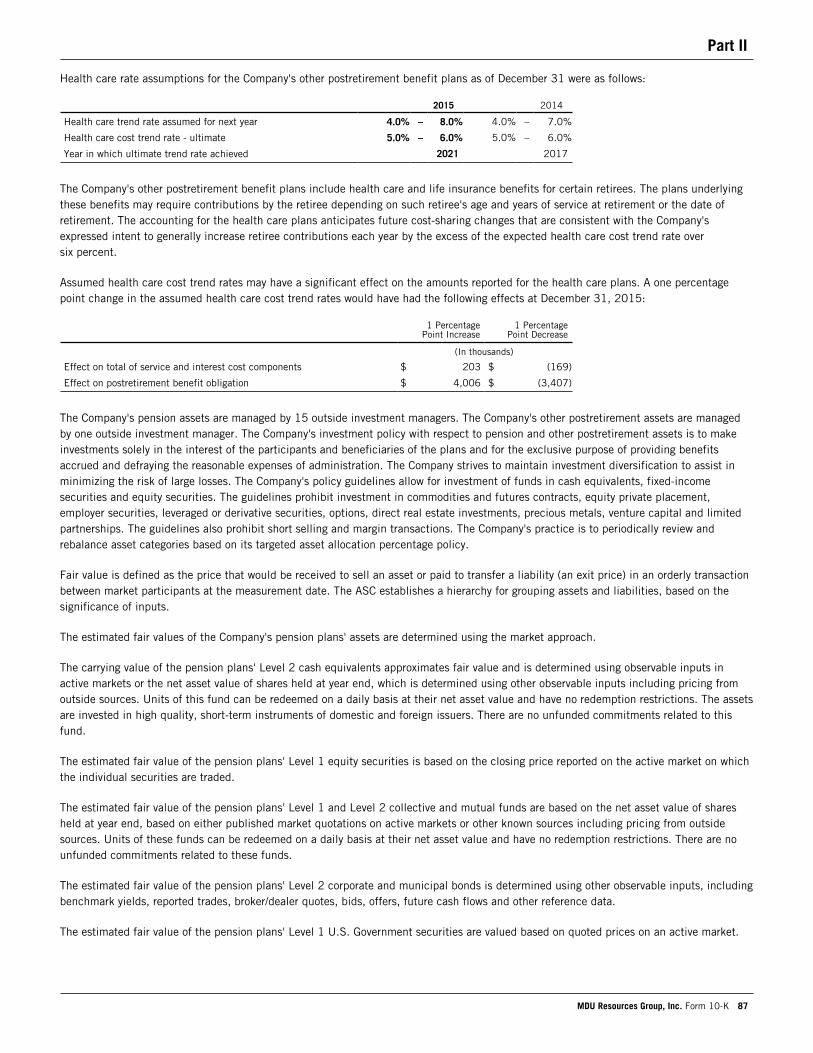
Part II
MDU Resources Group, Inc. Form 10-K 87
Health care rate assumptions for the Company's other postretirement benefit plans as of December 31 were as follows:
2015 2014
Health care trend rate assumed for next year 4.0% – 8.0% 4.0% – 7.0%
Health care cost trend rate - ultimate 5.0% – 6.0% 5.0% – 6.0%
Year in which ultimate trend rate achieved 2021 2017
The Company's other postretirement benefit plans include health care and life insurance benefits for certain retirees. The plans underlying these benefits may require contributions by the retiree depending on such retiree's age and years of service at retirement or the date of retirement. The accounting for the health care plans anticipates future cost-sharing changes that are consistent with the Company's expressed intent to generally increase retiree contributions each year by the excess of the expected health care cost trend rate over six percent.
Assumed health care cost trend rates may have a significant effect on the amounts reported for the health care plans. A one percentage point change in the assumed health care cost trend rates would have had the following effects at December 31, 2015:
1 Percentage
Point Increase1 Percentage
Point Decrease
(In thousands)
Effect on total of service and interest cost components $ 203 $ (169)
Effect on postretirement benefit obligation $ 4,006 $ (3,407)
The Company's pension assets are managed by 15 outside investment managers. The Company's other postretirement assets are managed by one outside investment manager. The Company's investment policy with respect to pension and other postretirement assets is to make investments solely in the interest of the participants and beneficiaries of the plans and for the exclusive purpose of providing benefits accrued and defraying the reasonable expenses of administration. The Company strives to maintain investment diversification to assist in minimizing the risk of large losses. The Company's policy guidelines allow for investment of funds in cash equivalents, fixed-income securities and equity securities. The guidelines prohibit investment in commodities and futures contracts, equity private placement, employer securities, leveraged or derivative securities, options, direct real estate investments, precious metals, venture capital and limited partnerships. The guidelines also prohibit short selling and margin transactions. The Company's practice is to periodically review and rebalance asset categories based on its targeted asset allocation percentage policy.
Fair value is defined as the price that would be received to sell an asset or paid to transfer a liability (an exit price) in an orderly transaction between market participants at the measurement date. The ASC establishes a hierarchy for grouping assets and liabilities, based on the significance of inputs.
The estimated fair values of the Company's pension plans' assets are determined using the market approach.
The carrying value of the pension plans' Level 2 cash equivalents approximates fair value and is determined using observable inputs in active markets or the net asset value of shares held at year end, which is determined using other observable inputs including pricing from outside sources. Units of this fund can be redeemed on a daily basis at their net asset value and have no redemption restrictions. The assets are invested in high quality, short-term instruments of domestic and foreign issuers. There are no unfunded commitments related to this fund.
The estimated fair value of the pension plans' Level 1 equity securities is based on the closing price reported on the active market on which the individual securities are traded.
The estimated fair value of the pension plans' Level 1 and Level 2 collective and mutual funds are based on the net asset value of shares held at year end, based on either published market quotations on active markets or other known sources including pricing from outside sources. Units of these funds can be redeemed on a daily basis at their net asset value and have no redemption restrictions. There are no unfunded commitments related to these funds.
The estimated fair value of the pension plans' Level 2 corporate and municipal bonds is determined using other observable inputs, including benchmark yields, reported trades, broker/dealer quotes, bids, offers, future cash flows and other reference data.
The estimated fair value of the pension plans' Level 1 U.S. Government securities are valued based on quoted prices on an active market.
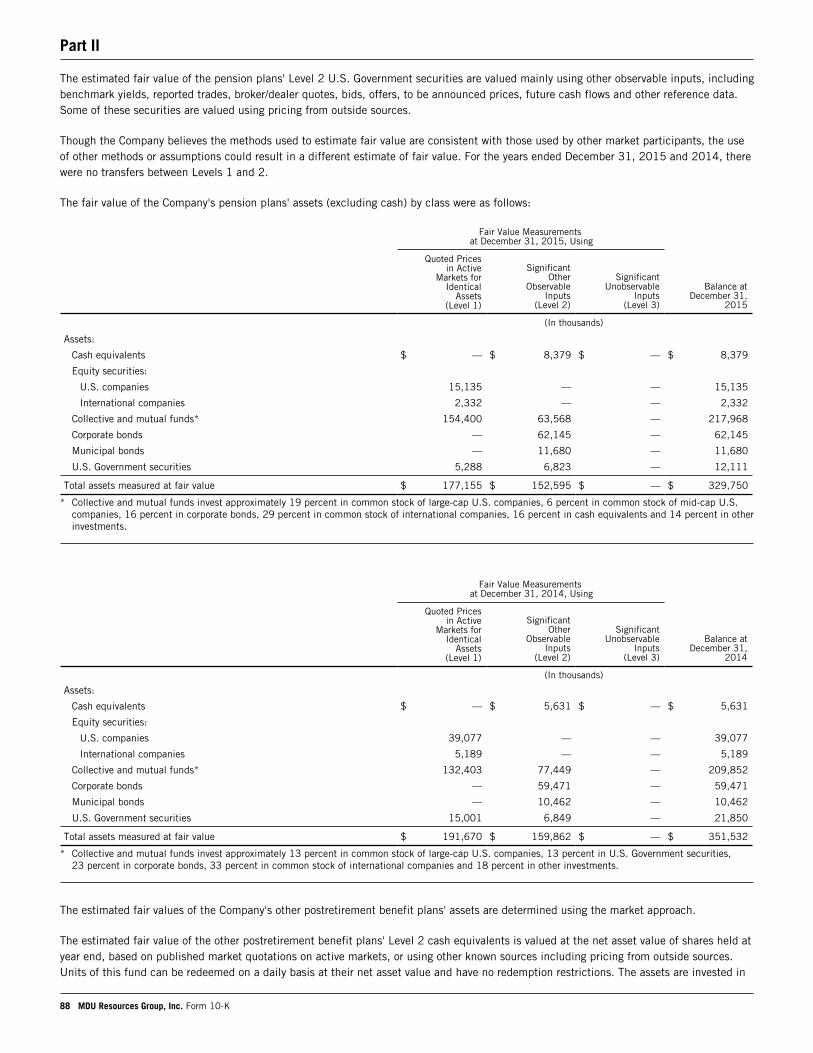
Part II
88 MDU Resources Group, Inc. Form 10-K
The estimated fair value of the pension plans' Level 2 U.S. Government securities are valued mainly using other observable inputs, including benchmark yields, reported trades, broker/dealer quotes, bids, offers, to be announced prices, future cash flows and other reference data. Some of these securities are valued using pricing from outside sources.
Though the Company believes the methods used to estimate fair value are consistent with those used by other market participants, the use of other methods or assumptions could result in a different estimate of fair value. For the years ended December 31, 2015 and 2014, there were no transfers between Levels 1 and 2.
The fair value of the Company's pension plans' assets (excluding cash) by class were as follows:
Fair Value Measurements
at December 31, 2015, Using
Quoted Pricesin Active
Markets forIdentical
Assets (Level 1)
SignificantOther
ObservableInputs
(Level 2)
SignificantUnobservable
Inputs (Level 3)
Balance atDecember 31,
2015
(In thousands)
Assets:
Cash equivalents $ — $ 8,379 $ — $ 8,379
Equity securities:
U.S. companies 15,135 — — 15,135
International companies 2,332 — — 2,332
Collective and mutual funds* 154,400 63,568 — 217,968
Corporate bonds — 62,145 — 62,145
Municipal bonds — 11,680 — 11,680
U.S. Government securities 5,288 6,823 — 12,111
Total assets measured at fair value $ 177,155 $ 152,595 $ — $ 329,750
* Collective and mutual funds invest approximately 19 percent in common stock of large-cap U.S. companies, 6 percent in common stock of mid-cap U.S. companies, 16 percent in corporate bonds, 29 percent in common stock of international companies, 16 percent in cash equivalents and 14 percent in other investments.
Fair Value Measurements
at December 31, 2014, Using
Quoted Pricesin Active
Markets forIdentical
Assets (Level 1)
SignificantOther
ObservableInputs
(Level 2)
SignificantUnobservable
Inputs (Level 3)
Balance atDecember 31,
2014
(In thousands)
Assets:
Cash equivalents $ — $ 5,631 $ — $ 5,631
Equity securities:
U.S. companies 39,077 — — 39,077
International companies 5,189 — — 5,189
Collective and mutual funds* 132,403 77,449 — 209,852
Corporate bonds — 59,471 — 59,471
Municipal bonds — 10,462 — 10,462
U.S. Government securities 15,001 6,849 — 21,850
Total assets measured at fair value $ 191,670 $ 159,862 $ — $ 351,532
* Collective and mutual funds invest approximately 13 percent in common stock of large-cap U.S. companies, 13 percent in U.S. Government securities, 23 percent in corporate bonds, 33 percent in common stock of international companies and 18 percent in other investments.
The estimated fair values of the Company's other postretirement benefit plans' assets are determined using the market approach.
The estimated fair value of the other postretirement benefit plans' Level 2 cash equivalents is valued at the net asset value of shares held at year end, based on published market quotations on active markets, or using other known sources including pricing from outside sources. Units of this fund can be redeemed on a daily basis at their net asset value and have no redemption restrictions. The assets are invested in
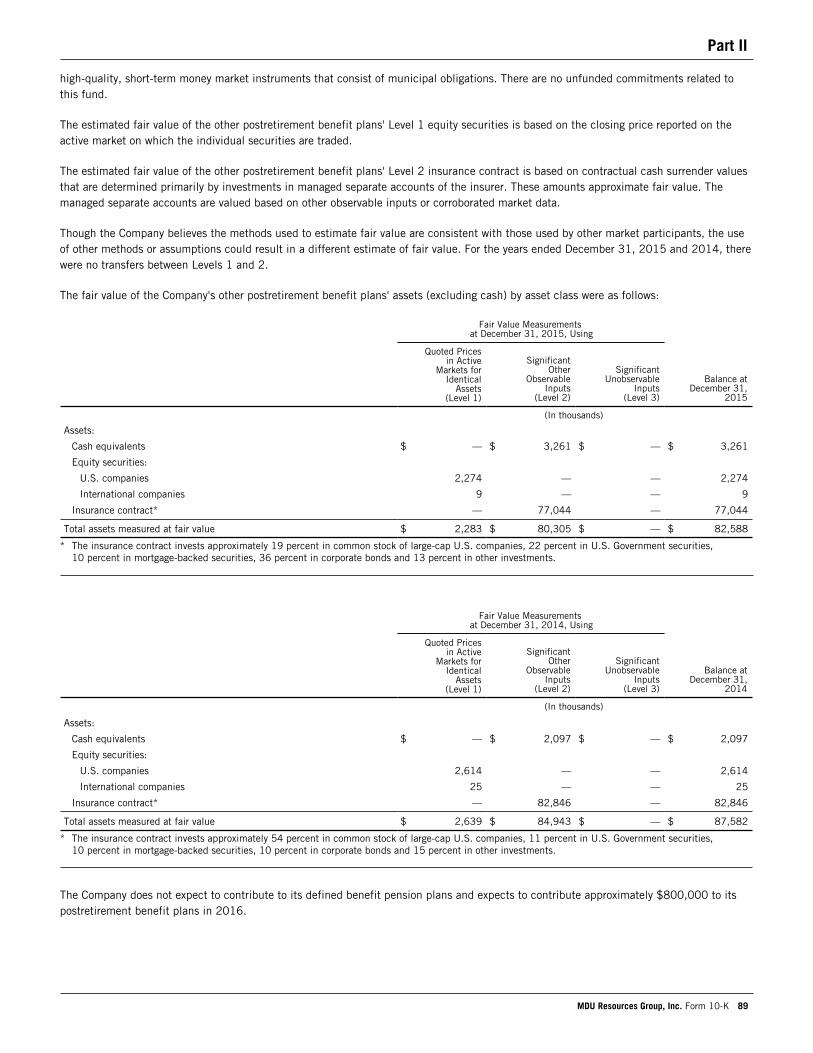
Part II
MDU Resources Group, Inc. Form 10-K 89
high-quality, short-term money market instruments that consist of municipal obligations. There are no unfunded commitments related to this fund.
The estimated fair value of the other postretirement benefit plans' Level 1 equity securities is based on the closing price reported on the active market on which the individual securities are traded.
The estimated fair value of the other postretirement benefit plans' Level 2 insurance contract is based on contractual cash surrender values that are determined primarily by investments in managed separate accounts of the insurer. These amounts approximate fair value. The managed separate accounts are valued based on other observable inputs or corroborated market data.
Though the Company believes the methods used to estimate fair value are consistent with those used by other market participants, the use of other methods or assumptions could result in a different estimate of fair value. For the years ended December 31, 2015 and 2014, there were no transfers between Levels 1 and 2.
The fair value of the Company's other postretirement benefit plans' assets (excluding cash) by asset class were as follows:
Fair Value Measurements
at December 31, 2015, Using
Quoted Pricesin Active
Markets forIdentical
Assets (Level 1)
SignificantOther
ObservableInputs
(Level 2)
SignificantUnobservable
Inputs (Level 3)
Balance atDecember 31,
2015
(In thousands)
Assets:
Cash equivalents $ — $ 3,261 $ — $ 3,261
Equity securities:
U.S. companies 2,274 — — 2,274
International companies 9 — — 9
Insurance contract* — 77,044 — 77,044
Total assets measured at fair value $ 2,283 $ 80,305 $ — $ 82,588
* The insurance contract invests approximately 19 percent in common stock of large-cap U.S. companies, 22 percent in U.S. Government securities, 10 percent in mortgage-backed securities, 36 percent in corporate bonds and 13 percent in other investments.
Fair Value Measurements
at December 31, 2014, Using
Quoted Pricesin Active
Markets forIdentical
Assets (Level 1)
SignificantOther
ObservableInputs
(Level 2)
SignificantUnobservable
Inputs (Level 3)
Balance atDecember 31,
2014
(In thousands)
Assets:
Cash equivalents $ — $ 2,097 $ — $ 2,097
Equity securities:
U.S. companies 2,614 — — 2,614
International companies 25 — — 25
Insurance contract* — 82,846 — 82,846
Total assets measured at fair value $ 2,639 $ 84,943 $ — $ 87,582
* The insurance contract invests approximately 54 percent in common stock of large-cap U.S. companies, 11 percent in U.S. Government securities, 10 percent in mortgage-backed securities, 10 percent in corporate bonds and 15 percent in other investments.
The Company does not expect to contribute to its defined benefit pension plans and expects to contribute approximately $800,000 to its postretirement benefit plans in 2016.
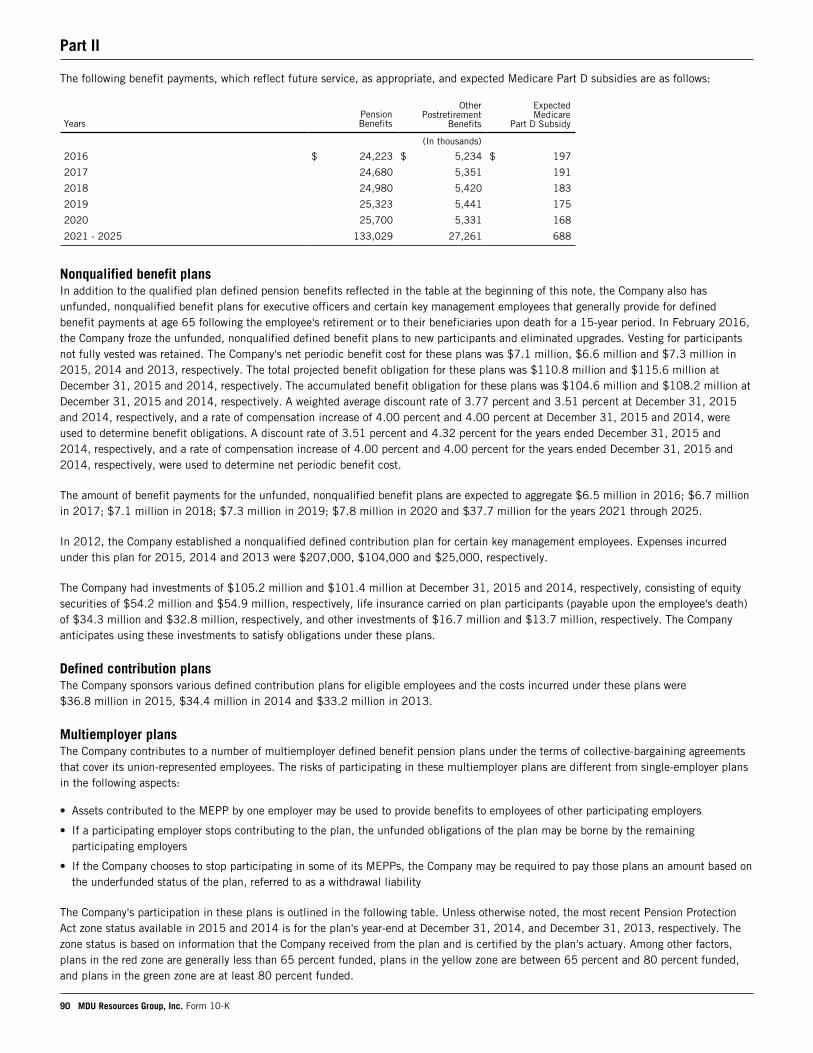
Part II
90 MDU Resources Group, Inc. Form 10-K
The following benefit payments, which reflect future service, as appropriate, and expected Medicare Part D subsidies are as follows:
YearsPensionBenefits
OtherPostretirement
Benefits
ExpectedMedicare
Part D Subsidy
(In thousands)
2016 $ 24,223 $ 5,234 $ 197
2017 24,680 5,351 191
2018 24,980 5,420 183
2019 25,323 5,441 175
2020 25,700 5,331 168
2021 - 2025 133,029 27,261 688
Nonqualified benefit plansIn addition to the qualified plan defined pension benefits reflected in the table at the beginning of this note, the Company also has unfunded, nonqualified benefit plans for executive officers and certain key management employees that generally provide for defined benefit payments at age 65 following the employee's retirement or to their beneficiaries upon death for a 15-year period. In February 2016, the Company froze the unfunded, nonqualified defined benefit plans to new participants and eliminated upgrades. Vesting for participants not fully vested was retained. The Company's net periodic benefit cost for these plans was $7.1 million, $6.6 million and $7.3 million in 2015, 2014 and 2013, respectively. The total projected benefit obligation for these plans was $110.8 million and $115.6 million at December 31, 2015 and 2014, respectively. The accumulated benefit obligation for these plans was $104.6 million and $108.2 million at December 31, 2015 and 2014, respectively. A weighted average discount rate of 3.77 percent and 3.51 percent at December 31, 2015 and 2014, respectively, and a rate of compensation increase of 4.00 percent and 4.00 percent at December 31, 2015 and 2014, were used to determine benefit obligations. A discount rate of 3.51 percent and 4.32 percent for the years ended December 31, 2015 and 2014, respectively, and a rate of compensation increase of 4.00 percent and 4.00 percent for the years ended December 31, 2015 and 2014, respectively, were used to determine net periodic benefit cost.
The amount of benefit payments for the unfunded, nonqualified benefit plans are expected to aggregate $6.5 million in 2016; $6.7 million in 2017; $7.1 million in 2018; $7.3 million in 2019; $7.8 million in 2020 and $37.7 million for the years 2021 through 2025.
In 2012, the Company established a nonqualified defined contribution plan for certain key management employees. Expenses incurred under this plan for 2015, 2014 and 2013 were $207,000, $104,000 and $25,000, respectively.
The Company had investments of $105.2 million and $101.4 million at December 31, 2015 and 2014, respectively, consisting of equity securities of $54.2 million and $54.9 million, respectively, life insurance carried on plan participants (payable upon the employee's death) of $34.3 million and $32.8 million, respectively, and other investments of $16.7 million and $13.7 million, respectively. The Company anticipates using these investments to satisfy obligations under these plans.
Defined contribution plansThe Company sponsors various defined contribution plans for eligible employees and the costs incurred under these plans were $36.8 million in 2015, $34.4 million in 2014 and $33.2 million in 2013.
Multiemployer plansThe Company contributes to a number of multiemployer defined benefit pension plans under the terms of collective-bargaining agreements that cover its union-represented employees. The risks of participating in these multiemployer plans are different from single-employer plans in the following aspects:
• Assets contributed to the MEPP by one employer may be used to provide benefits to employees of other participating employers
• If a participating employer stops contributing to the plan, the unfunded obligations of the plan may be borne by the remaining participating employers
• If the Company chooses to stop participating in some of its MEPPs, the Company may be required to pay those plans an amount based on the underfunded status of the plan, referred to as a withdrawal liability
The Company's participation in these plans is outlined in the following table. Unless otherwise noted, the most recent Pension Protection Act zone status available in 2015 and 2014 is for the plan's year-end at December 31, 2014, and December 31, 2013, respectively. The zone status is based on information that the Company received from the plan and is certified by the plan's actuary. Among other factors, plans in the red zone are generally less than 65 percent funded, plans in the yellow zone are between 65 percent and 80 percent funded, and plans in the green zone are at least 80 percent funded.
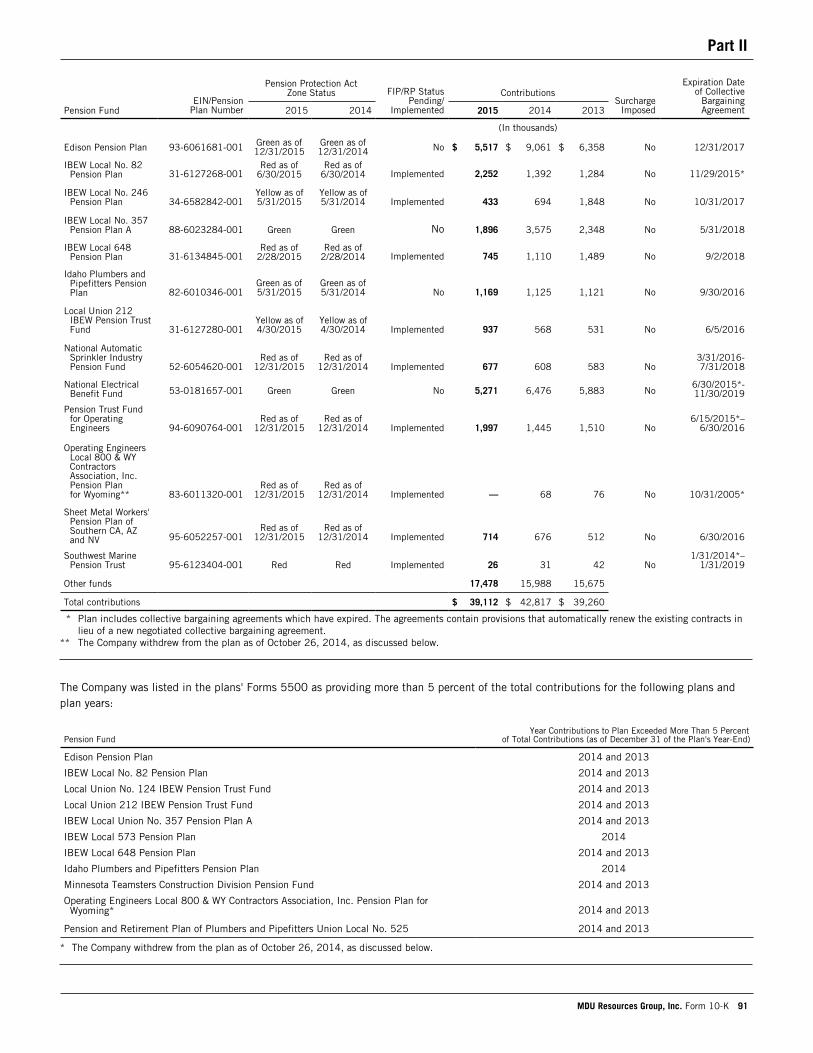
Part II
MDU Resources Group, Inc. Form 10-K 91
EIN/PensionPlan Number
Pension Protection ActZone Status FIP/RP Status
Pending/Implemented
ContributionsSurcharge
Imposed
Expiration Dateof Collective
BargainingAgreementPension Fund 2015 2014 2015 2014 2013
(In thousands)
Edison Pension Plan 93-6061681-001 Green as of 12/31/2015
Green as of 12/31/2014 No $ 5,517 $ 9,061 $ 6,358 No 12/31/2017
IBEW Local No. 82Pension Plan 31-6127268-001
Red as of 6/30/2015
Red as of 6/30/2014 Implemented 2,252 1,392 1,284 No 11/29/2015*
IBEW Local No. 246Pension Plan 34-6582842-001
Yellow as of 5/31/2015
Yellow as of 5/31/2014 Implemented 433 694 1,848 No 10/31/2017
IBEW Local No. 357Pension Plan A 88-6023284-001 Green Green No 1,896 3,575 2,348 No 5/31/2018
IBEW Local 648Pension Plan 31-6134845-001
Red as of 2/28/2015
Red as of 2/28/2014 Implemented 745 1,110 1,489 No 9/2/2018
Idaho Plumbers andPipefitters PensionPlan 82-6010346-001
Green as of 5/31/2015
Green as of 5/31/2014 No 1,169 1,125 1,121 No 9/30/2016
Local Union 212IBEW Pension TrustFund 31-6127280-001
Yellow as of 4/30/2015
Yellow as of 4/30/2014 Implemented 937 568 531 No 6/5/2016
National AutomaticSprinkler IndustryPension Fund 52-6054620-001
Red as of 12/31/2015
Red as of 12/31/2014 Implemented 677 608 583 No
3/31/2016-7/31/2018
National ElectricalBenefit Fund 53-0181657-001 Green Green No 5,271 6,476 5,883 No
6/30/2015*-11/30/2019
Pension Trust Fundfor OperatingEngineers 94-6090764-001
Red as of 12/31/2015
Red as of 12/31/2014 Implemented 1,997 1,445 1,510 No
6/15/2015*–6/30/2016
Operating Engineers Local 800 & WY Contractors Association, Inc. Pension Planfor Wyoming** 83-6011320-001
Red as of 12/31/2015
Red as of 12/31/2014 Implemented — 68 76 No 10/31/2005*
Sheet Metal Workers'Pension Plan ofSouthern CA, AZand NV 95-6052257-001
Red as of 12/31/2015
Red as of 12/31/2014 Implemented 714 676 512 No 6/30/2016
Southwest MarinePension Trust 95-6123404-001 Red Red Implemented 26 31 42 No
1/31/2014*–1/31/2019
Other funds 17,478 15,988 15,675
Total contributions $ 39,112 $ 42,817 $ 39,260
* Plan includes collective bargaining agreements which have expired. The agreements contain provisions that automatically renew the existing contracts in lieu of a new negotiated collective bargaining agreement.
** The Company withdrew from the plan as of October 26, 2014, as discussed below.
The Company was listed in the plans' Forms 5500 as providing more than 5 percent of the total contributions for the following plans and plan years:
Pension FundYear Contributions to Plan Exceeded More Than 5 Percent
of Total Contributions (as of December 31 of the Plan's Year-End)
Edison Pension Plan 2014 and 2013
IBEW Local No. 82 Pension Plan 2014 and 2013
Local Union No. 124 IBEW Pension Trust Fund 2014 and 2013
Local Union 212 IBEW Pension Trust Fund 2014 and 2013
IBEW Local Union No. 357 Pension Plan A 2014 and 2013
IBEW Local 573 Pension Plan 2014
IBEW Local 648 Pension Plan 2014 and 2013
Idaho Plumbers and Pipefitters Pension Plan 2014
Minnesota Teamsters Construction Division Pension Fund 2014 and 2013
Operating Engineers Local 800 & WY Contractors Association, Inc. Pension Plan forWyoming* 2014 and 2013
Pension and Retirement Plan of Plumbers and Pipefitters Union Local No. 525 2014 and 2013
* The Company withdrew from the plan as of October 26, 2014, as discussed below.
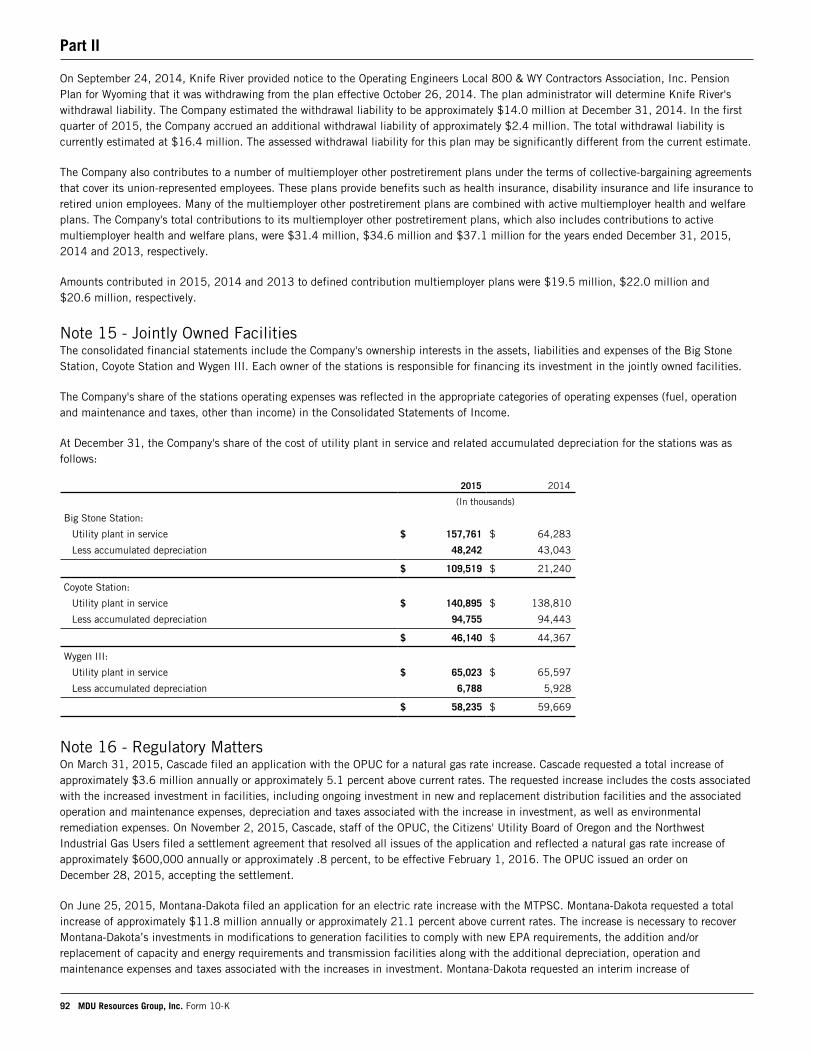
Part II
92 MDU Resources Group, Inc. Form 10-K
On September 24, 2014, Knife River provided notice to the Operating Engineers Local 800 & WY Contractors Association, Inc. Pension Plan for Wyoming that it was withdrawing from the plan effective October 26, 2014. The plan administrator will determine Knife River's withdrawal liability. The Company estimated the withdrawal liability to be approximately $14.0 million at December 31, 2014. In the first quarter of 2015, the Company accrued an additional withdrawal liability of approximately $2.4 million. The total withdrawal liability is currently estimated at $16.4 million. The assessed withdrawal liability for this plan may be significantly different from the current estimate.
The Company also contributes to a number of multiemployer other postretirement plans under the terms of collective-bargaining agreements that cover its union-represented employees. These plans provide benefits such as health insurance, disability insurance and life insurance to retired union employees. Many of the multiemployer other postretirement plans are combined with active multiemployer health and welfare plans. The Company's total contributions to its multiemployer other postretirement plans, which also includes contributions to active multiemployer health and welfare plans, were $31.4 million, $34.6 million and $37.1 million for the years ended December 31, 2015, 2014 and 2013, respectively.
Amounts contributed in 2015, 2014 and 2013 to defined contribution multiemployer plans were $19.5 million, $22.0 million and $20.6 million, respectively.
Note 15 - Jointly Owned FacilitiesThe consolidated financial statements include the Company's ownership interests in the assets, liabilities and expenses of the Big Stone Station, Coyote Station and Wygen III. Each owner of the stations is responsible for financing its investment in the jointly owned facilities.
The Company's share of the stations operating expenses was reflected in the appropriate categories of operating expenses (fuel, operation and maintenance and taxes, other than income) in the Consolidated Statements of Income.
At December 31, the Company's share of the cost of utility plant in service and related accumulated depreciation for the stations was as follows:
2015 2014
(In thousands)
Big Stone Station:
Utility plant in service $ 157,761 $ 64,283
Less accumulated depreciation 48,242 43,043
$ 109,519 $ 21,240
Coyote Station:
Utility plant in service $ 140,895 $ 138,810
Less accumulated depreciation 94,755 94,443
$ 46,140 $ 44,367
Wygen III:
Utility plant in service $ 65,023 $ 65,597
Less accumulated depreciation 6,788 5,928
$ 58,235 $ 59,669
Note 16 - Regulatory Matters On March 31, 2015, Cascade filed an application with the OPUC for a natural gas rate increase. Cascade requested a total increase of approximately $3.6 million annually or approximately 5.1 percent above current rates. The requested increase includes the costs associated with the increased investment in facilities, including ongoing investment in new and replacement distribution facilities and the associated operation and maintenance expenses, depreciation and taxes associated with the increase in investment, as well as environmental remediation expenses. On November 2, 2015, Cascade, staff of the OPUC, the Citizens' Utility Board of Oregon and the Northwest Industrial Gas Users filed a settlement agreement that resolved all issues of the application and reflected a natural gas rate increase of approximately $600,000 annually or approximately .8 percent, to be effective February 1, 2016. The OPUC issued an order on December 28, 2015, accepting the settlement.
On June 25, 2015, Montana-Dakota filed an application for an electric rate increase with the MTPSC. Montana-Dakota requested a total increase of approximately $11.8 million annually or approximately 21.1 percent above current rates. The increase is necessary to recover Montana-Dakota’s investments in modifications to generation facilities to comply with new EPA requirements, the addition and/or replacement of capacity and energy requirements and transmission facilities along with the additional depreciation, operation and maintenance expenses and taxes associated with the increases in investment. Montana-Dakota requested an interim increase of
Part II
MDU Resources Group, Inc. Form 10-K 93
approximately $11.0 million annually. The MTPSC denied the request for interim rates on December 15, 2015. On February 8, 2016, Montana-Dakota and the interveners to the case filed a stipulation and settlement agreement reflecting an annual increase of $3.0 million effective April 1, 2016, and an additional increase of $4.4 million effective April 1, 2017. A technical hearing was held February 9, 2016. This matter is pending before the MTPSC.
On June 30, 2015, Montana-Dakota filed an application with the SDPUC for an electric rate increase. Montana-Dakota requested a total increase of approximately $2.7 million annually or approximately 19.2 percent above current rates. The increase is necessary to recover Montana-Dakota’s investments in modifications to generation facilities to comply with new EPA requirements, the addition and/or replacement of capacity and energy requirements and transmission facilities along with the additional depreciation, operation and maintenance expenses and taxes associated with the increases in investment. This matter is pending before the SDPUC. An interim increase of $2.7 million, subject to refund, was implemented January 1, 2016. A hearing is scheduled for the week of April 11, 2016.
On June 30, 2015, Montana-Dakota filed an application for a natural gas rate increase with the SDPUC. Montana-Dakota requested a total increase of approximately $1.5 million annually or approximately 3.1 percent above current rates. The increase is necessary to recover increased operating expenses along with increased investment in facilities, including the related depreciation expense and taxes, partially offset by an increase in customers and throughput. This matter is pending before the SDPUC. An interim increase of $1.5 million, subject to refund, was implemented January 1, 2016. A hearing is scheduled for April 4, 2016.
On September 1, 2015, and as amended on October 5, 2015, Montana-Dakota submitted an update to its transmission formula rate under the MISO tariff including a revenue requirement for the Company’s multivalue project of $3.8 million, which was effective January 1, 2016.
On September 30, 2015, Great Plains filed an application for a natural gas rate increase with the MNPUC. Great Plains requested a total increase of approximately $1.6 million annually or approximately 6.4 percent above current rates. The increase is necessary to recover increased operating expenses along with increased investment in facilities, including the related depreciation expense and taxes. Great Plains requested an interim increase of $1.5 million or approximately 6.4 percent, subject to refund. The interim request was approved by the MNPUC on November 30, 2015, and was effective with service rendered on and after January 1, 2016. This matter is pending before the MNPUC. A technical hearing is scheduled for April 7 and 8, 2016.
On October 21, 2015, Montana-Dakota filed an application with the NDPSC for an update of an electric generation resource recovery rider and requested a renewable resource cost adjustment rider. Montana-Dakota requested a combined total of approximately $25.3 million with approximately $20.0 million incremental to current rates, to be effective January 1, 2016. This application was resubmitted as two applications on October 26, 2015.
On October 26, 2015, Montana-Dakota filed an application requesting a renewable resource cost adjustment rider of $15.4 million for the recovery of the Thunder Spirit Wind project, placed in service in the fourth quarter of 2015. A settlement was reached with the NDPSC Advocacy Staff whereby Montana-Dakota agreed to a 10.5 percent return on equity on the renewable resource cost adjustment rider, as well as committed to file an electric general rate case no later than September 30, 2016. The renewable resource cost adjustment rider was approved by the NDPSC on January 5, 2016, to be effective January 7, 2016, resulting in an annual increase of $15.1 million on an interim basis pending the determination of the return on equity in the upcoming rate case.
On October 26, 2015, Montana-Dakota filed an application for an update to the electric generation resource recovery rider, which currently includes recovery of Montana-Dakota's investment in the 88-MW simple-cycle natural gas turbine and associated facilities near Mandan, North Dakota. The application proposed to also include the 19 MW of new generation from natural gas-fired internal combustion engines and associated facilities, near Sidney, Montana, placed in service in the fourth quarter of 2015, for a total of $9.9 million or an incremental increase of $4.6 million to be recovered under the rider. On January 25, 2016, Montana-Dakota and the NDPSC Advocacy Staff filed a settlement agreement. If approved by the NDPSC, the settlement would result in an interim increase of $9.7 million or an incremental increase of $4.4 million, subject to refund, a 10.5 percent return on equity and Montana-Dakota would commit to filing an electric general rate case no later than September 30, 2016. A technical hearing on this matter was held on February 4, 2016.
On November 25, 2015, Montana-Dakota filed an application with the NDPSC for an update of its transmission cost adjustment for recovery of MISO-related charges and two transmission projects located in North Dakota, equating to $6.8 million to be collected under the transmission cost adjustment. An update to the transmission cost adjustment was submitted on January 19, 2016, to reflect the provisions of the settlement agreement approved by the NDPSC for the renewable resource cost adjustment rider. An informal hearing with the NDPSC was held January 20, 2016, regarding this matter. The NDPSC approved the filing on February 10, 2016, with rates to be effective February 12, 2016.
On December 1, 2015, Cascade filed an application with the WUTC for a natural gas rate increase. Cascade requested a total increase of approximately $10.5 million annually or approximately 4.2 percent above current rates. The requested increase includes costs associated
Part II
94 MDU Resources Group, Inc. Form 10-K
with increased infrastructure investment and the associated operating expenses. The filing is pending before the WUTC. The natural gas rate increase is expected to be effective November 1, 2016. A hearing on this matter has been scheduled to begin August 2, 2016.
Note 17 - Commitments and ContingenciesThe Company is party to claims and lawsuits arising out of its business and that of its consolidated subsidiaries. The Company accrues a liability for those contingencies when the incurrence of a loss is probable and the amount can be reasonably estimated. If a range of amounts can be reasonably estimated and no amount within the range is a better estimate than any other amount, then the minimum of the range is accrued. The Company does not accrue liabilities when the likelihood that the liability has been incurred is probable but the amount cannot be reasonably estimated or when the liability is believed to be only reasonably possible or remote. For contingencies where an unfavorable outcome is probable or reasonably possible and which are material, the Company discloses the nature of the contingency and, in some circumstances, an estimate of the possible loss. The Company had accrued liabilities of $19.5 million and $27.6 million, which include liabilities held for sale, for contingencies, including litigation, production taxes, royalty claims and environmental matters at December 31, 2015 and 2014, respectively, including amounts that may have been accrued for matters discussed in Litigation and Environmental matters within this note.
LitigationNatural Gas Gathering Operations In January 2010, SourceGas filed an application with the Colorado State District Court to compel WBI Energy Midstream to arbitrate a dispute regarding operating pressures under a natural gas gathering contract on one of WBI Energy Midstream's pipeline gathering systems in Montana. WBI Energy Midstream resisted the application and sought a declaratory order interpreting the gathering contract. In May 2010, the Colorado State District Court granted the application and ordered WBI Energy Midstream into arbitration. In October 2010, the arbitration panel issued an award in favor of SourceGas for approximately $26.6 million. The Colorado Court of Appeals issued a decision on May 24, 2012, reversing the Colorado State District Court order compelling arbitration, vacating the final award and remanding the case to the Colorado State District Court to determine SourceGas's claims and WBI Energy Midstream's counterclaims. WBI Energy Midstream resolved this matter in December 2015 through a settlement that included dismissal of the litigation and payment of an amount that was not material.
In a related matter, Omimex filed a complaint against WBI Energy Midstream in Montana Seventeenth Judicial District Court in July 2010 alleging WBI Energy Midstream breached a separate gathering contract with Omimex as a result of the increased operating pressures demanded by SourceGas on the same natural gas gathering system. In December 2011, Omimex filed an amended complaint alleging WBI Energy Midstream breached obligations to operate its gathering system as a common carrier under United States and Montana law. WBI Energy Midstream removed the action to the United States District Court for the District of Montana. The parties subsequently settled the breach of contract claim and, subject to final determination on liability, stipulated to the damages on the common carrier claim, for amounts that are not material. A trial on the common carrier claim was held during July 2013. On December 9, 2014, the United States District Court for the District of Montana issued an order determining WBI Energy Midstream breached its obligations as a common carrier and ordered judgment in favor of Omimex for the amount of the stipulated damages. WBI Energy Midstream filed an appeal from the United States District Court for the District of Montana's order and judgment.
Exploration and Production During the ordinary course of its business, Fidelity is subject to audit for various production related taxes by certain state and federal tax authorities for varying periods as well as claims for royalty obligations under lease agreements for oil and gas production. Disputes may exist regarding facts and questions of law relating to the tax and royalty obligations.
Construction Materials Until the fall of 2011 when it discontinued active mining operations at the pit, JTL operated the Target Range Gravel Pit in Missoula County, Montana under a 1975 reclamation contract pursuant to the Montana Opencut Mining Act. In September 2009, the Montana DEQ sent a letter asserting JTL was in violation of the Montana Opencut Mining Act by conducting mining operations outside a permitted area. JTL filed a complaint in Montana First Judicial District Court in June 2010, seeking a declaratory order that the reclamation contract is a valid permit under the Montana Opencut Mining Act. The Montana DEQ filed an answer and counterclaim to the complaint in August 2011, alleging JTL was in violation of the Montana Opencut Mining Act and requesting imposition of penalties of not more than $3.7 million plus not more than $5,000 per day from the date of the counterclaim. The Company believes the operation of the Target Range Gravel Pit was conducted under a valid permit; however, the imposition of civil penalties is reasonably possible. The Company filed an application for amendment of its opencut mining permit which JTL expects will be approved by the Montana DEQ in the first half of 2016. The Company intends to resolve the Montana First Judicial District Court litigation through settlement.
Construction Services Bombard Mechanical is a third-party defendant in litigation pending in Nevada State District Court in which the plaintiff claims damages attributable to defects in the construction of a 48 story residential tower built in 2008 for which Bombard Mechanical performed plumbing and mechanical work as a subcontractor. On March 12, 2015, the plaintiff presented cost of repair estimates totaling approximately $21 million for alleged plumbing and mechanical system defects associated in whole or in part with work
Part II
MDU Resources Group, Inc. Form 10-K 95
performed by Bombard Mechanical. Bombard Mechanical is being defended in the action under a policy of insurance subject to a reservation of rights.
The Company also is subject to other litigation, and actual and potential claims in the ordinary course of its business which may include, but are not limited to, matters involving property damage, personal injury, and environmental, contractual, statutory and regulatory obligations. Accruals are based on the best information available but actual losses in future periods are affected by various factors making them uncertain. After taking into account liabilities accrued for the foregoing matters, management believes that the outcomes with respect to the above issues and other probable and reasonably possible losses in excess of the amounts accrued, while uncertain, will not have a material effect upon the Company's financial position, results of operations or cash flows.
Environmental mattersPortland Harbor Site In December 2000, Knife River - Northwest was named by the EPA as a PRP in connection with the cleanup of a riverbed site adjacent to a commercial property site acquired by Knife River - Northwest from Georgia-Pacific West, Inc. in 1999. The riverbed site is part of the Portland, Oregon, Harbor Superfund Site. The EPA wants responsible parties to share in the cleanup of sediment contamination in the Willamette River. To date, costs of the overall remedial investigation and feasibility study of the harbor site are being recorded, and initially paid, through an administrative consent order by the LWG, a group of several entities, which does not include Knife River - Northwest or Georgia-Pacific West, Inc. Investigative costs are indicated to be in excess of $70 million. It is not possible to estimate the cost of a corrective action plan until the remedial investigation and feasibility study have been completed, the EPA has decided on a strategy and a ROD has been published. Corrective action will be taken after the development of a proposed plan and ROD on the harbor site is issued. Knife River - Northwest also received notice in January 2008 that the Portland Harbor Natural Resource Trustee Council intends to perform an injury assessment to natural resources resulting from the release of hazardous substances at the Harbor Superfund Site. The Portland Harbor Natural Resource Trustee Council indicates the injury determination is appropriate to facilitate early settlement of damages and restoration for natural resource injuries. It is not possible to estimate the costs of natural resource damages until an assessment is completed and allocations are undertaken.
Based upon a review of the Portland Harbor sediment contamination evaluation by the Oregon DEQ and other information available, Knife River - Northwest does not believe it is a Responsible Party. In addition, Knife River - Northwest has notified Georgia-Pacific West, Inc., that it intends to seek indemnity for liabilities incurred in relation to the above matters pursuant to the terms of their sale agreement. Knife River - Northwest has entered into an agreement tolling the statute of limitations in connection with the LWG's potential claim for contribution to the costs of the remedial investigation and feasibility study. By letter in March 2009, LWG stated its intent to file suit against Knife River - Northwest and others to recover LWG's investigation costs to the extent Knife River - Northwest cannot demonstrate its non-liability for the contamination or is unwilling to participate in an alternative dispute resolution process that has been established to address the matter. At this time, Knife River - Northwest has agreed to participate in the alternative dispute resolution process.
The Company believes it is not probable that it will incur any material environmental remediation costs or damages in relation to the above referenced administrative action.
Coos County The Oregon DEQ issued a Notice of Civil Penalty to LTM dated October 12, 2015, asserting violations of Oregon water quality statutes and rules resulting from the stockpiling and grading of earthen material during 2014 at a site in Coos County and assessing civil penalties totaling approximately $160,000. The Notice of Civil Penalty alleges violations by causing pollution to an intermittent creek, by conducting activity described in a general National Pollutant Discharge Elimination System permit without applying for coverage under the general permit, by placing the earthen materials in a location where they were likely to escape or be carried into waters of the state, and by failing to submit a revised ESCP where there was a change in the size of the project or the location of the disturbed area. The Notice of Civil Penalty also requires LTM to submit a revised ESCP containing measures to prevent further erosion from entering the intermittent creek and to file a work plan outlining how the earthen material will be permanently stabilized or removed. LTM intends to request a contested case hearing on the Notice of Civil Penalty.
Manufactured Gas Plant Sites There are three claims against Cascade for cleanup of environmental contamination at manufactured gas plant sites operated by Cascade's predecessors.
The first claim is for contamination at a site in Eugene, Oregon which was received in 1995. There are PRPs in addition to Cascade that may be liable for cleanup of the contamination. Some of these PRPs have shared in the investigation costs. It is expected that these and other PRPs will share in the cleanup costs. Several alternatives for cleanup have been identified, with preliminary cost estimates ranging from approximately $500,000 to $11.0 million. The Oregon DEQ released a ROD in January 2015 that selected a remediation alternative for the site as recommended in an earlier staff report. It is not known at this time what share of the cleanup costs will actually be borne by Cascade; however, Cascade anticipates its proportional share could be approximately 50 percent. Cascade has accrued $1.7 million for remediation of this site. In January 2013, the OPUC approved Cascade's application to defer environmental remediation costs at the Eugene
Part II
96 MDU Resources Group, Inc. Form 10-K
site for a period of 12 months starting November 30, 2012. Cascade received orders reauthorizing the deferred accounting for the 12-month periods starting November 30, 2013, December 1, 2014 and December 1, 2015.
The second claim is for contamination at a site in Bremerton, Washington which was received in 1997. A preliminary investigation has found soil and groundwater at the site contain contaminants requiring further investigation and cleanup. The EPA conducted a Targeted Brownfields Assessment of the site and released a report summarizing the results of that assessment in August 2009. The assessment confirms that contaminants have affected soil and groundwater at the site, as well as sediments in the adjacent Port Washington Narrows. Alternative remediation options have been identified with preliminary cost estimates ranging from $340,000 to $6.4 million. Data developed through the assessment and previous investigations indicates the contamination likely derived from multiple, different sources and multiple current and former owners of properties and businesses in the vicinity of the site may be responsible for the contamination. In April 2010, the Washington Department of Ecology issued notice it considered Cascade a PRP for hazardous substances at the site. In May 2012, the EPA added the site to the National Priorities List of Superfund sites. Cascade has entered into an administrative settlement agreement and consent order with the EPA regarding the scope and schedule for a remedial investigation and feasibility study for the site. Cascade has accrued $12.9 million for the remedial investigation, feasibility study and remediation of this site. In April 2010, Cascade filed a petition with the WUTC for authority to defer the costs, which are included in other noncurrent assets, incurred in relation to the environmental remediation of this site until the next general rate case. The WUTC approved the petition in September 2010, subject to conditions set forth in the order.
The third claim is for contamination at a site in Bellingham, Washington. Cascade received notice from a party in May 2008 that Cascade may be a PRP, along with other parties, for contamination from a manufactured gas plant owned by Cascade and its predecessor from about 1946 to 1962. The notice indicates that current estimates to complete investigation and cleanup of the site exceed $8.0 million. Other PRPs have reached an agreed order and work plan with the Washington Department of Ecology for completion of a remedial investigation and feasibility study for the site. A report documenting the initial phase of the remedial investigation was completed in June 2011. There is currently not enough information available to estimate the potential liability to Cascade associated with this claim although Cascade believes its proportional share of any liability will be relatively small in comparison to other PRPs. The plant manufactured gas from coal between approximately 1890 and 1946. In 1946, shortly after Cascade's predecessor acquired the plant, it converted the plant to a propane-air gas facility. There are no documented wastes or by-products resulting from the mixing or distribution of propane-air gas.
Cascade has received notices from and entered into agreement with certain of its insurance carriers that they will participate in defense of Cascade for these contamination claims subject to full and complete reservations of rights and defenses to insurance coverage. To the extent these claims are not covered by insurance, Cascade will seek recovery through the OPUC and WUTC of remediation costs in its natural gas rates charged to customers. The accruals related to these matters are reflected in regulatory assets. For more information, see Note 4.
Operating leasesThe Company leases certain equipment, facilities and land under operating lease agreements. The amounts of annual minimum lease payments due under these leases as of December 31, 2015, were $52.3 million in 2016, $42.7 million in 2017, $35.5 million in 2018, $26.4 million in 2019, $15.9 million in 2020 and $76.9 million thereafter. Rent expense was $65.1 million, $48.5 million and $39.7 million for the years ended December 31, 2015, 2014 and 2013, respectively.
Purchase commitments The Company has entered into various commitments, largely construction, natural gas and coal supply, purchased power, natural gas transportation and storage, and service, shipping and construction materials supply contracts, some of which are subject to variability in volume and price. These commitments range from one to 45 years. The commitments under these contracts as of December 31, 2015, were $443.7 million in 2016, $228.0 million in 2017, $138.9 million in 2018, $112.9 million in 2019, $90.4 million in 2020 and $853.9 million thereafter. These commitments were not reflected in the Company's consolidated financial statements. Amounts purchased under various commitments for the years ended December 31, 2015, 2014 and 2013, were $861.4 million, $925.2 million and $860.5 million, respectively.
GuaranteesIn 2009, multiple sales agreements were signed to sell the Company's ownership interests in the Brazilian Transmission Lines. In connection with the sale, Centennial has agreed to guarantee payment of any indemnity obligations of certain of the Company's indirect wholly owned subsidiaries who are the sellers in three purchase and sale agreements for periods ranging up to 10 years from the date of sale. The guarantees were required by the buyers as a condition to the sale of the Brazilian Transmission Lines.
Certain subsidiaries of the Company have outstanding guarantees to third parties that guarantee the performance of other subsidiaries of the Company. These guarantees are related to construction contracts, insurance deductibles and loss limits, and certain other guarantees. At December 31, 2015, the fixed maximum amounts guaranteed under these agreements aggregated $128.6 million. The amounts of
Part II
MDU Resources Group, Inc. Form 10-K 97
scheduled expiration of the maximum amounts guaranteed under these agreements aggregate $33.1 million in 2016; $35.0 million in 2017; $600,000 in 2018; $54.9 million in 2019; $1.0 million, which is subject to expiration on a specified number of days after the receipt of written notice; and $4.0 million, which has no scheduled maturity date. There were no amounts outstanding under the above guarantees at December 31, 2015. In the event of default under these guarantee obligations, the subsidiary issuing the guarantee for that particular obligation would be required to make payments under its guarantee.
Certain subsidiaries have outstanding letters of credit to third parties related to insurance policies and other agreements, some of which are guaranteed by other subsidiaries of the Company. At December 31, 2015, the fixed maximum amounts guaranteed under these letters of credit aggregated $57.3 million, all of which expire in 2016. The amount outstanding by subsidiaries of the Company under the above letters of credit was $4.1 million and was reflected on the Consolidated Balance Sheet at December 31, 2015. In the event of default under these letter of credit obligations, the subsidiary issuing the letter of credit for that particular obligation would be required to make payments under its letter of credit.
Centennial and WBI Holdings have guaranteed certain debt obligations of Dakota Prairie Refining. For more information, see Variable interest entities in this note.
In addition, Centennial, Knife River and MDU Construction Services have issued guarantees to third parties related to the routine purchase of maintenance items, materials and lease obligations for which no fixed maximum amounts have been specified. These guarantees have no scheduled maturity date. In the event a subsidiary of the Company defaults under these obligations, Centennial, Knife River and MDU Construction Services would be required to make payments under these guarantees. Any amounts outstanding by subsidiaries of the Company for these guarantees were reflected on the Consolidated Balance Sheet at December 31, 2015.
In the normal course of business, Centennial has surety bonds related to construction contracts and reclamation obligations of its subsidiaries. In the event a subsidiary of Centennial does not fulfill a bonded obligation, Centennial would be responsible to the surety bond company for completion of the bonded contract or obligation. A large portion of the surety bonds is expected to expire within the next 12 months; however, Centennial will likely continue to enter into surety bonds for its subsidiaries in the future. As of December 31, 2015, approximately $530.0 million of surety bonds were outstanding, which were not reflected on the Consolidated Balance Sheet.
Variable interest entitiesThe Company evaluates its arrangements and contracts with other entities to determine if they are VIEs and if so, if the Company is the primary beneficiary. For more information, see Note 1.
Dakota Prairie Refining, LLC On February 7, 2013, WBI Energy and Calumet formed a limited liability company, Dakota Prairie Refining, and entered into an operating agreement to develop, build and operate Dakota Prairie Refinery in southwestern North Dakota. WBI Energy and Calumet each have a 50 percent ownership interest in Dakota Prairie Refining. WBI Energy's and Calumet's capital commitments, based on a total project cost of $300 million, under the agreement are $150 million and $75 million, respectively. Capital commitments in excess of $300 million are being shared equally between WBI Energy and Calumet. WBI Energy's and Calumet's cumulative capital contributions, net of distributions, as of December 31, 2015, are $230.4 million and $163.6 million, respectively. Dakota Prairie Refining entered into a term loan for project debt financing of $75 million on April 22, 2013. The operating agreement provides for allocation of profits and losses consistent with ownership interests; however, deductions attributable to project financing debt will be allocated to Calumet. Calumet's future cash distributions from Dakota Prairie Refining will be decreased by the principal and interest to be paid on the project debt, while the cash distributions to WBI Energy will not be decreased. Pursuant to the operating agreement, Centennial agreed to guarantee Dakota Prairie Refining's obligation under the term loan. The net loss attributable to noncontrolling interest on the Consolidated Statements of Income is pretax as Dakota Prairie Refining is a limited liability company.
On September 30, 2015, Dakota Prairie Refining entered into an amendment to its revolving credit agreement which increased the borrowing limit from $50.0 million under the original December 1, 2014, agreement to $75.0 million and extended the termination date from December 1, 2015 to June 30, 2016. Centennial and Calumet have each issued a letter of credit supporting 50 percent of the credit agreement. The credit agreement is used to meet the operational needs of the facility.
Dakota Prairie Refining has been determined to be a VIE, and the Company has determined that it is the primary beneficiary as it has an obligation to absorb losses that could be potentially significant to the VIE through WBI Energy's equity investment and Centennial's guarantee of the third-party term loan. Accordingly, the Company consolidates Dakota Prairie Refining in its financial statements and records a noncontrolling interest for Calumet's ownership interest.
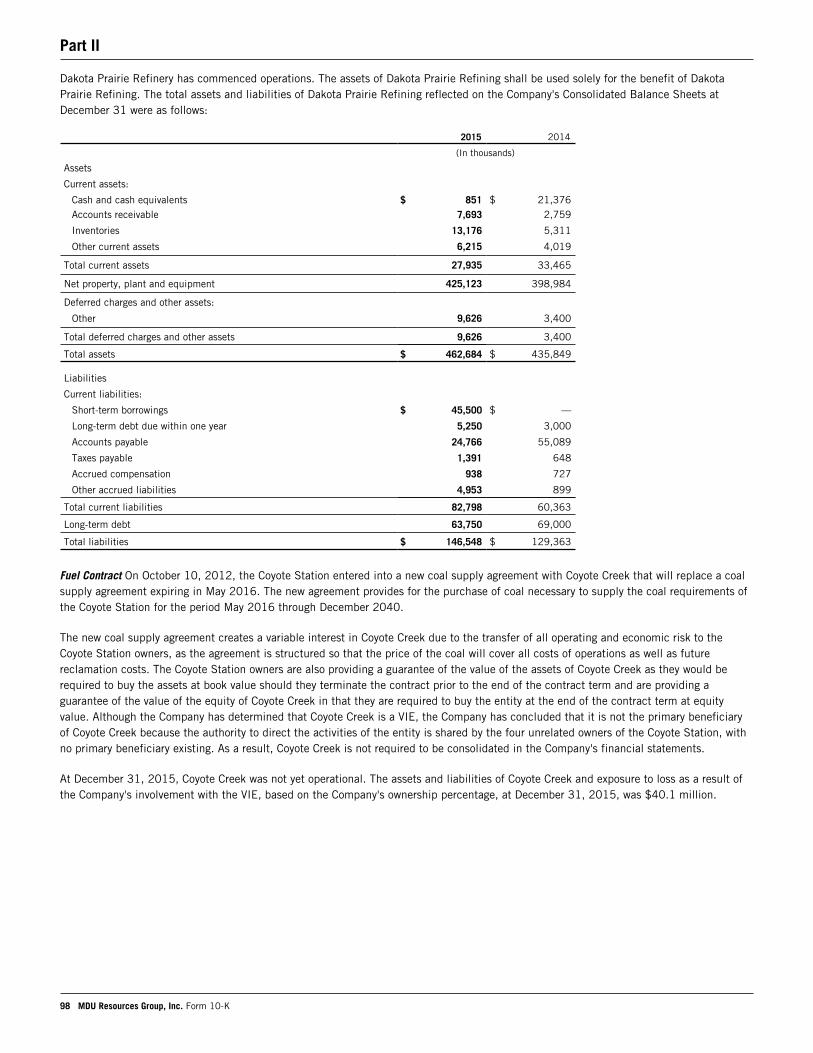
Part II
98 MDU Resources Group, Inc. Form 10-K
Dakota Prairie Refinery has commenced operations. The assets of Dakota Prairie Refining shall be used solely for the benefit of Dakota Prairie Refining. The total assets and liabilities of Dakota Prairie Refining reflected on the Company's Consolidated Balance Sheets at December 31 were as follows:
2015 2014
(In thousands)
Assets
Current assets:
Cash and cash equivalents $ 851 $ 21,376Accounts receivable 7,693 2,759
Inventories 13,176 5,311
Other current assets 6,215 4,019
Total current assets 27,935 33,465
Net property, plant and equipment 425,123 398,984
Deferred charges and other assets:
Other 9,626 3,400
Total deferred charges and other assets 9,626 3,400
Total assets $ 462,684 $ 435,849
Liabilities
Current liabilities:
Short-term borrowings $ 45,500 $ —
Long-term debt due within one year 5,250 3,000
Accounts payable 24,766 55,089
Taxes payable 1,391 648
Accrued compensation 938 727
Other accrued liabilities 4,953 899
Total current liabilities 82,798 60,363
Long-term debt 63,750 69,000
Total liabilities $ 146,548 $ 129,363
Fuel Contract On October 10, 2012, the Coyote Station entered into a new coal supply agreement with Coyote Creek that will replace a coal supply agreement expiring in May 2016. The new agreement provides for the purchase of coal necessary to supply the coal requirements of the Coyote Station for the period May 2016 through December 2040.
The new coal supply agreement creates a variable interest in Coyote Creek due to the transfer of all operating and economic risk to the Coyote Station owners, as the agreement is structured so that the price of the coal will cover all costs of operations as well as future reclamation costs. The Coyote Station owners are also providing a guarantee of the value of the assets of Coyote Creek as they would be required to buy the assets at book value should they terminate the contract prior to the end of the contract term and are providing a guarantee of the value of the equity of Coyote Creek in that they are required to buy the entity at the end of the contract term at equity value. Although the Company has determined that Coyote Creek is a VIE, the Company has concluded that it is not the primary beneficiary of Coyote Creek because the authority to direct the activities of the entity is shared by the four unrelated owners of the Coyote Station, with no primary beneficiary existing. As a result, Coyote Creek is not required to be consolidated in the Company's financial statements.
At December 31, 2015, Coyote Creek was not yet operational. The assets and liabilities of Coyote Creek and exposure to loss as a result of the Company's involvement with the VIE, based on the Company's ownership percentage, at December 31, 2015, was $40.1 million.
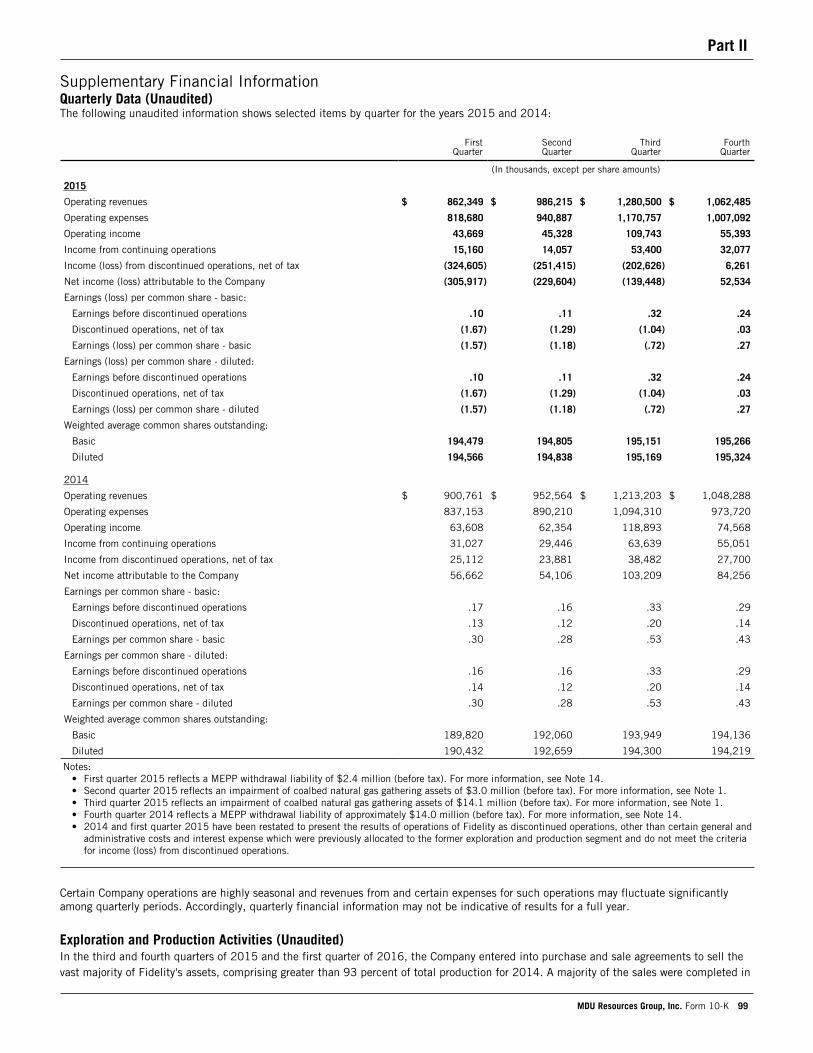
Part II
MDU Resources Group, Inc. Form 10-K 99
Supplementary Financial InformationQuarterly Data (Unaudited)The following unaudited information shows selected items by quarter for the years 2015 and 2014:
First
QuarterSecondQuarter
ThirdQuarter
FourthQuarter
(In thousands, except per share amounts)
2015
Operating revenues $ 862,349 $ 986,215 $ 1,280,500 $ 1,062,485
Operating expenses 818,680 940,887 1,170,757 1,007,092
Operating income 43,669 45,328 109,743 55,393
Income from continuing operations 15,160 14,057 53,400 32,077
Income (loss) from discontinued operations, net of tax (324,605) (251,415) (202,626) 6,261
Net income (loss) attributable to the Company (305,917) (229,604) (139,448) 52,534
Earnings (loss) per common share - basic:
Earnings before discontinued operations .10 .11 .32 .24
Discontinued operations, net of tax (1.67) (1.29) (1.04) .03
Earnings (loss) per common share - basic (1.57) (1.18) (.72) .27
Earnings (loss) per common share - diluted:
Earnings before discontinued operations .10 .11 .32 .24
Discontinued operations, net of tax (1.67) (1.29) (1.04) .03
Earnings (loss) per common share - diluted (1.57) (1.18) (.72) .27
Weighted average common shares outstanding:
Basic 194,479 194,805 195,151 195,266
Diluted 194,566 194,838 195,169 195,324
2014
Operating revenues $ 900,761 $ 952,564 $ 1,213,203 $ 1,048,288
Operating expenses 837,153 890,210 1,094,310 973,720
Operating income 63,608 62,354 118,893 74,568
Income from continuing operations 31,027 29,446 63,639 55,051
Income from discontinued operations, net of tax 25,112 23,881 38,482 27,700
Net income attributable to the Company 56,662 54,106 103,209 84,256
Earnings per common share - basic:
Earnings before discontinued operations .17 .16 .33 .29
Discontinued operations, net of tax .13 .12 .20 .14
Earnings per common share - basic .30 .28 .53 .43
Earnings per common share - diluted:
Earnings before discontinued operations .16 .16 .33 .29
Discontinued operations, net of tax .14 .12 .20 .14
Earnings per common share - diluted .30 .28 .53 .43
Weighted average common shares outstanding:
Basic 189,820 192,060 193,949 194,136
Diluted 190,432 192,659 194,300 194,219
Notes:• First quarter 2015 reflects a MEPP withdrawal liability of $2.4 million (before tax). For more information, see Note 14.• Second quarter 2015 reflects an impairment of coalbed natural gas gathering assets of $3.0 million (before tax). For more information, see Note 1.• Third quarter 2015 reflects an impairment of coalbed natural gas gathering assets of $14.1 million (before tax). For more information, see Note 1.• Fourth quarter 2014 reflects a MEPP withdrawal liability of approximately $14.0 million (before tax). For more information, see Note 14.• 2014 and first quarter 2015 have been restated to present the results of operations of Fidelity as discontinued operations, other than certain general and
administrative costs and interest expense which were previously allocated to the former exploration and production segment and do not meet the criteria for income (loss) from discontinued operations.
Certain Company operations are highly seasonal and revenues from and certain expenses for such operations may fluctuate significantly among quarterly periods. Accordingly, quarterly financial information may not be indicative of results for a full year.
Exploration and Production Activities (Unaudited)In the third and fourth quarters of 2015 and the first quarter of 2016, the Company entered into purchase and sale agreements to sell the vast majority of Fidelity's assets, comprising greater than 93 percent of total production for 2014. A majority of the sales were completed in
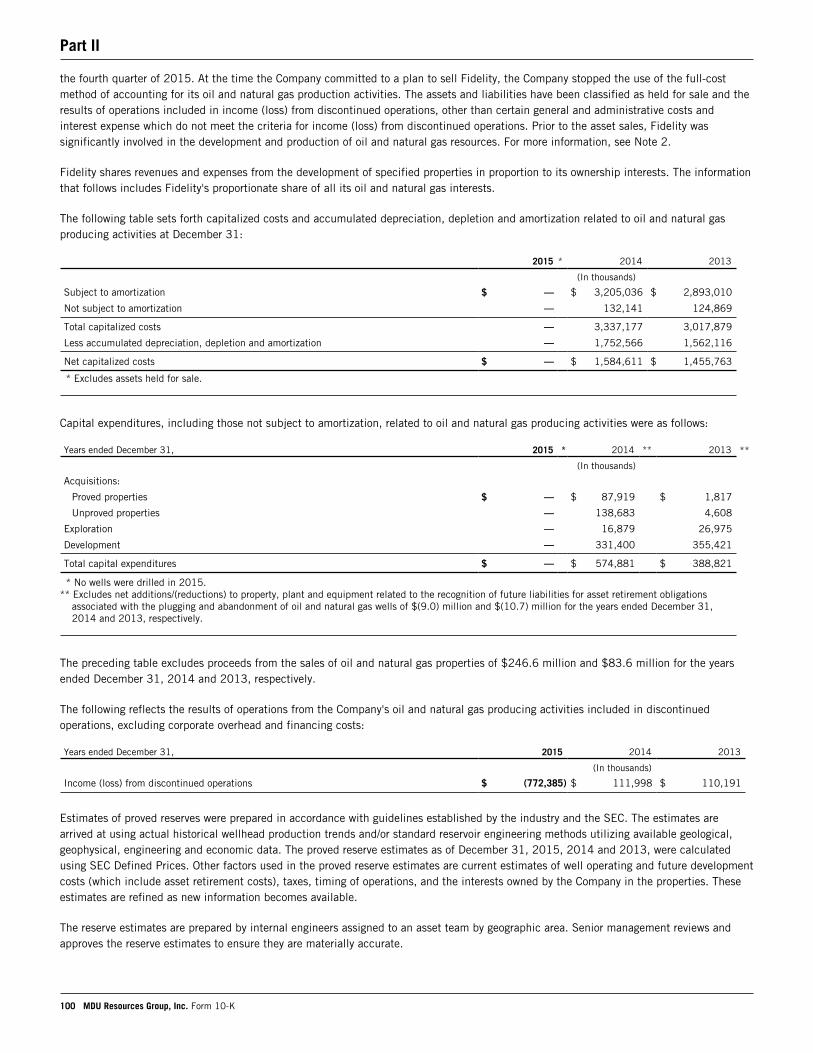
Part II
100 MDU Resources Group, Inc. Form 10-K
the fourth quarter of 2015. At the time the Company committed to a plan to sell Fidelity, the Company stopped the use of the full-cost method of accounting for its oil and natural gas production activities. The assets and liabilities have been classified as held for sale and the results of operations included in income (loss) from discontinued operations, other than certain general and administrative costs and interest expense which do not meet the criteria for income (loss) from discontinued operations. Prior to the asset sales, Fidelity was significantly involved in the development and production of oil and natural gas resources. For more information, see Note 2.
Fidelity shares revenues and expenses from the development of specified properties in proportion to its ownership interests. The information that follows includes Fidelity's proportionate share of all its oil and natural gas interests.
The following table sets forth capitalized costs and accumulated depreciation, depletion and amortization related to oil and natural gas producing activities at December 31:
2015 * 2014 2013
(In thousands)
Subject to amortization $ — $ 3,205,036 $ 2,893,010
Not subject to amortization — 132,141 124,869
Total capitalized costs — 3,337,177 3,017,879
Less accumulated depreciation, depletion and amortization — 1,752,566 1,562,116
Net capitalized costs $ — $ 1,584,611 $ 1,455,763
* Excludes assets held for sale.
Capital expenditures, including those not subject to amortization, related to oil and natural gas producing activities were as follows:
Years ended December 31, 2015 * 2014 ** 2013 **
(In thousands)
Acquisitions:
Proved properties $ — $ 87,919 $ 1,817
Unproved properties — 138,683 4,608
Exploration — 16,879 26,975
Development — 331,400 355,421
Total capital expenditures $ — $ 574,881 $ 388,821
* No wells were drilled in 2015. ** Excludes net additions/(reductions) to property, plant and equipment related to the recognition of future liabilities for asset retirement obligations
associated with the plugging and abandonment of oil and natural gas wells of $(9.0) million and $(10.7) million for the years ended December 31, 2014 and 2013, respectively.
The preceding table excludes proceeds from the sales of oil and natural gas properties of $246.6 million and $83.6 million for the years ended December 31, 2014 and 2013, respectively.
The following reflects the results of operations from the Company's oil and natural gas producing activities included in discontinued operations, excluding corporate overhead and financing costs:
Years ended December 31, 2015 2014 2013
(In thousands)
Income (loss) from discontinued operations $ (772,385) $ 111,998 $ 110,191
Estimates of proved reserves were prepared in accordance with guidelines established by the industry and the SEC. The estimates are arrived at using actual historical wellhead production trends and/or standard reservoir engineering methods utilizing available geological, geophysical, engineering and economic data. The proved reserve estimates as of December 31, 2015, 2014 and 2013, were calculated using SEC Defined Prices. Other factors used in the proved reserve estimates are current estimates of well operating and future development costs (which include asset retirement costs), taxes, timing of operations, and the interests owned by the Company in the properties. These estimates are refined as new information becomes available.
The reserve estimates are prepared by internal engineers assigned to an asset team by geographic area. Senior management reviews and approves the reserve estimates to ensure they are materially accurate.
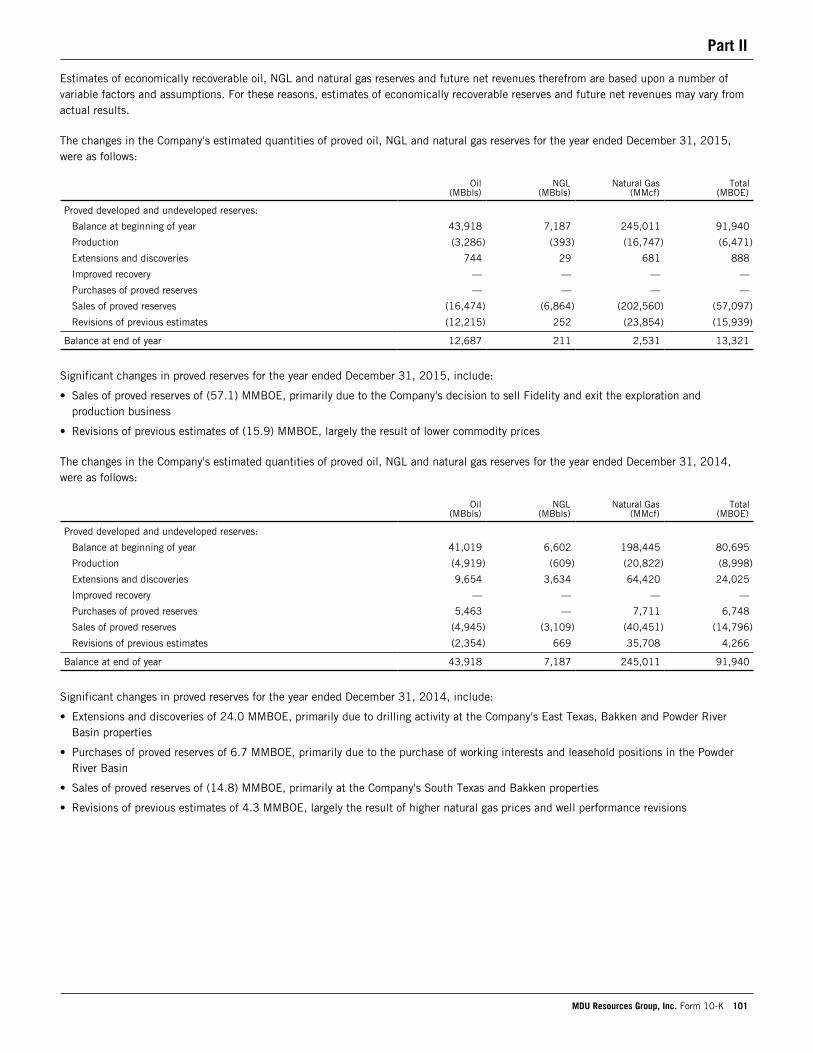
Part II
MDU Resources Group, Inc. Form 10-K 101
Estimates of economically recoverable oil, NGL and natural gas reserves and future net revenues therefrom are based upon a number of variable factors and assumptions. For these reasons, estimates of economically recoverable reserves and future net revenues may vary from actual results.
The changes in the Company's estimated quantities of proved oil, NGL and natural gas reserves for the year ended December 31, 2015, were as follows:
Oil
(MBbls)NGL
(MBbls)Natural Gas
(MMcf)Total
(MBOE)
Proved developed and undeveloped reserves:
Balance at beginning of year 43,918 7,187 245,011 91,940
Production (3,286) (393) (16,747) (6,471)
Extensions and discoveries 744 29 681 888
Improved recovery — — — —
Purchases of proved reserves — — — —
Sales of proved reserves (16,474) (6,864) (202,560) (57,097)
Revisions of previous estimates (12,215) 252 (23,854) (15,939)
Balance at end of year 12,687 211 2,531 13,321
Significant changes in proved reserves for the year ended December 31, 2015, include:
• Sales of proved reserves of (57.1) MMBOE, primarily due to the Company's decision to sell Fidelity and exit the exploration and production business
• Revisions of previous estimates of (15.9) MMBOE, largely the result of lower commodity prices
The changes in the Company's estimated quantities of proved oil, NGL and natural gas reserves for the year ended December 31, 2014, were as follows:
Oil
(MBbls)NGL
(MBbls)Natural Gas
(MMcf)Total
(MBOE)
Proved developed and undeveloped reserves:
Balance at beginning of year 41,019 6,602 198,445 80,695
Production (4,919) (609) (20,822) (8,998)
Extensions and discoveries 9,654 3,634 64,420 24,025
Improved recovery — — — —
Purchases of proved reserves 5,463 — 7,711 6,748
Sales of proved reserves (4,945) (3,109) (40,451) (14,796)
Revisions of previous estimates (2,354) 669 35,708 4,266
Balance at end of year 43,918 7,187 245,011 91,940
Significant changes in proved reserves for the year ended December 31, 2014, include:
• Extensions and discoveries of 24.0 MMBOE, primarily due to drilling activity at the Company's East Texas, Bakken and Powder River Basin properties
• Purchases of proved reserves of 6.7 MMBOE, primarily due to the purchase of working interests and leasehold positions in the Powder River Basin
• Sales of proved reserves of (14.8) MMBOE, primarily at the Company's South Texas and Bakken properties
• Revisions of previous estimates of 4.3 MMBOE, largely the result of higher natural gas prices and well performance revisions
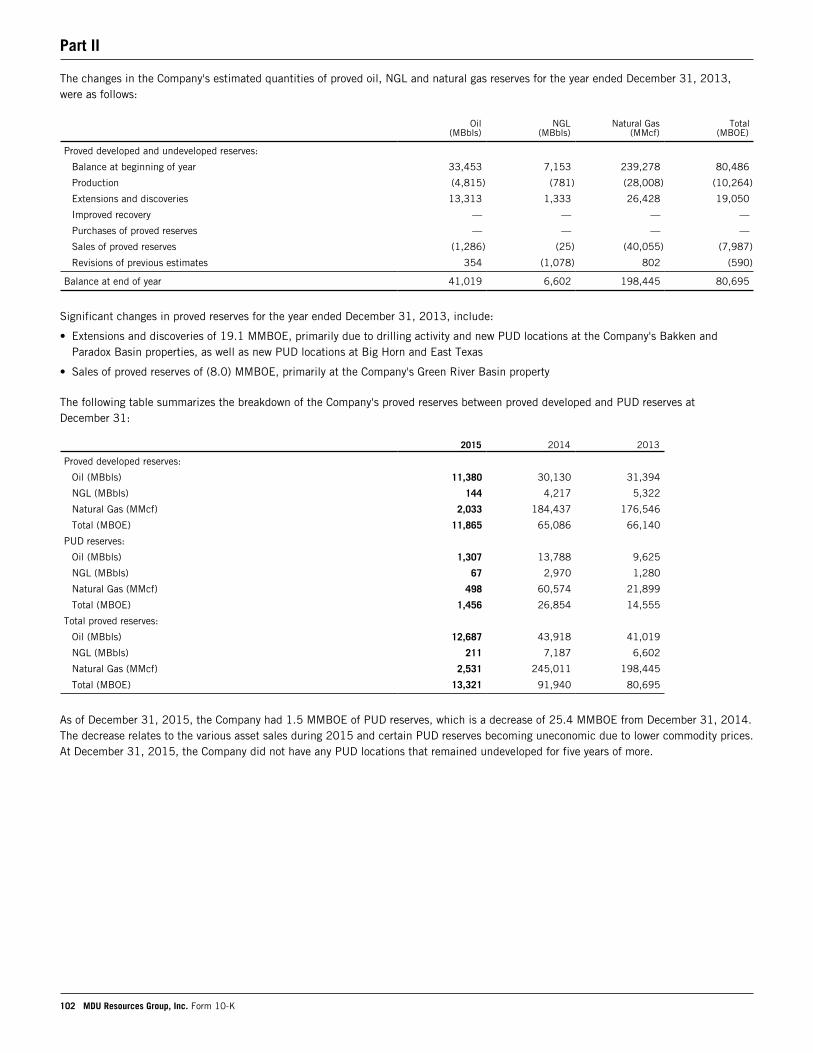
Part II
102 MDU Resources Group, Inc. Form 10-K
The changes in the Company's estimated quantities of proved oil, NGL and natural gas reserves for the year ended December 31, 2013, were as follows:
Oil
(MBbls)NGL
(MBbls)Natural Gas
(MMcf)Total
(MBOE)
Proved developed and undeveloped reserves:
Balance at beginning of year 33,453 7,153 239,278 80,486
Production (4,815) (781) (28,008) (10,264)
Extensions and discoveries 13,313 1,333 26,428 19,050
Improved recovery — — — —
Purchases of proved reserves — — — —
Sales of proved reserves (1,286) (25) (40,055) (7,987)
Revisions of previous estimates 354 (1,078) 802 (590)
Balance at end of year 41,019 6,602 198,445 80,695
Significant changes in proved reserves for the year ended December 31, 2013, include:
• Extensions and discoveries of 19.1 MMBOE, primarily due to drilling activity and new PUD locations at the Company's Bakken and Paradox Basin properties, as well as new PUD locations at Big Horn and East Texas
• Sales of proved reserves of (8.0) MMBOE, primarily at the Company's Green River Basin property
The following table summarizes the breakdown of the Company's proved reserves between proved developed and PUD reserves at December 31:
2015 2014 2013
Proved developed reserves:
Oil (MBbls) 11,380 30,130 31,394
NGL (MBbls) 144 4,217 5,322
Natural Gas (MMcf) 2,033 184,437 176,546
Total (MBOE) 11,865 65,086 66,140
PUD reserves:
Oil (MBbls) 1,307 13,788 9,625
NGL (MBbls) 67 2,970 1,280
Natural Gas (MMcf) 498 60,574 21,899
Total (MBOE) 1,456 26,854 14,555
Total proved reserves:
Oil (MBbls) 12,687 43,918 41,019
NGL (MBbls) 211 7,187 6,602
Natural Gas (MMcf) 2,531 245,011 198,445
Total (MBOE) 13,321 91,940 80,695
As of December 31, 2015, the Company had 1.5 MMBOE of PUD reserves, which is a decrease of 25.4 MMBOE from December 31, 2014. The decrease relates to the various asset sales during 2015 and certain PUD reserves becoming uneconomic due to lower commodity prices. At December 31, 2015, the Company did not have any PUD locations that remained undeveloped for five years of more.
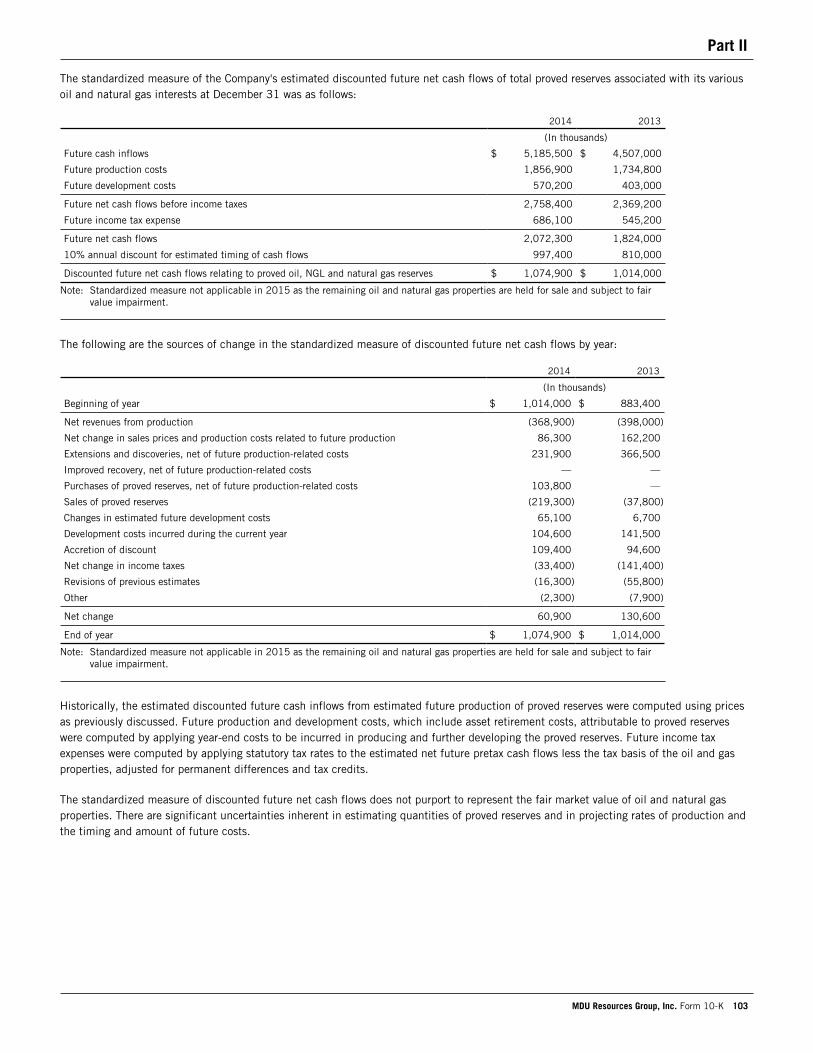
Part II
MDU Resources Group, Inc. Form 10-K 103
The standardized measure of the Company's estimated discounted future net cash flows of total proved reserves associated with its various oil and natural gas interests at December 31 was as follows:
2014 2013
(In thousands)
Future cash inflows $ 5,185,500 $ 4,507,000
Future production costs 1,856,900 1,734,800
Future development costs 570,200 403,000
Future net cash flows before income taxes 2,758,400 2,369,200
Future income tax expense 686,100 545,200
Future net cash flows 2,072,300 1,824,000
10% annual discount for estimated timing of cash flows 997,400 810,000
Discounted future net cash flows relating to proved oil, NGL and natural gas reserves $ 1,074,900 $ 1,014,000
Note: Standardized measure not applicable in 2015 as the remaining oil and natural gas properties are held for sale and subject to fair value impairment.
The following are the sources of change in the standardized measure of discounted future net cash flows by year:
2014 2013
(In thousands)
Beginning of year $ 1,014,000 $ 883,400
Net revenues from production (368,900) (398,000)
Net change in sales prices and production costs related to future production 86,300 162,200
Extensions and discoveries, net of future production-related costs 231,900 366,500
Improved recovery, net of future production-related costs — —
Purchases of proved reserves, net of future production-related costs 103,800 —
Sales of proved reserves (219,300) (37,800)
Changes in estimated future development costs 65,100 6,700
Development costs incurred during the current year 104,600 141,500
Accretion of discount 109,400 94,600
Net change in income taxes (33,400) (141,400)
Revisions of previous estimates (16,300) (55,800)
Other (2,300) (7,900)
Net change 60,900 130,600
End of year $ 1,074,900 $ 1,014,000
Note: Standardized measure not applicable in 2015 as the remaining oil and natural gas properties are held for sale and subject to fair value impairment.
Historically, the estimated discounted future cash inflows from estimated future production of proved reserves were computed using prices as previously discussed. Future production and development costs, which include asset retirement costs, attributable to proved reserves were computed by applying year-end costs to be incurred in producing and further developing the proved reserves. Future income tax expenses were computed by applying statutory tax rates to the estimated net future pretax cash flows less the tax basis of the oil and gas properties, adjusted for permanent differences and tax credits.
The standardized measure of discounted future net cash flows does not purport to represent the fair market value of oil and natural gas properties. There are significant uncertainties inherent in estimating quantities of proved reserves and in projecting rates of production and the timing and amount of future costs.
Part II
104 MDU Resources Group, Inc. Form 10-K
Definitions
The following abbreviations and acronyms used in Notes to Consolidated Financial Statements are defined below:
Abbreviation or AcronymAFUDC Allowance for funds used during construction
ASC FASB Accounting Standards Codification
ATBs Atmospheric tower bottoms
Bbl Barrel
Bicent Bicent Power LLC
Big Stone Station 475-MW coal-fired electric generating facility near Big Stone City, South Dakota (22.7 percentownership)
BOE One barrel of oil equivalent - determined using the ratio of one barrel of crude oil, condensate ornatural gas liquids to six Mcf of natural gas
Bombard Mechanical Bombard Mechanical, LLC, an indirect wholly owned subsidiary of MDU Construction Services
Brazilian Transmission Lines Company's former investment in companies owning three electric transmission lines
Btu British thermal unit
Calumet Calumet Specialty Products Partners, L.P.
Cascade Cascade Natural Gas Corporation, an indirect wholly owned subsidiary of MDU Energy Capital
CEM Colorado Energy Management, LLC, a former direct wholly owned subsidiary of CentennialResources (sold in the third quarter of 2007)
Centennial Centennial Energy Holdings, Inc., a direct wholly owned subsidiary of the Company
Centennial Capital Centennial Holdings Capital LLC, a direct wholly owned subsidiary of Centennial
Centennial Resources Centennial Energy Resources LLC, a direct wholly owned subsidiary of Centennial
Colorado Court of Appeals Court of Appeals, State of Colorado
Colorado State District Court Colorado Thirteenth Judicial District Court, Yuma County
Company MDU Resources Group, Inc.
Coyote Creek Coyote Creek Mining Company, LLC, a subsidiary of The North American Coal Corporation
Coyote Station 427-MW coal-fired electric generating facility near Beulah, North Dakota (25 percent ownership)
Dakota Prairie Refinery 20,000-barrel-per-day diesel topping plant built by Dakota Prairie Refining in southwesternNorth Dakota
Dakota Prairie Refining Dakota Prairie Refining, LLC, a limited liability company jointly owned by WBI Energy andCalumet
EBITDA Earnings before interest, taxes, depreciation, depletion and amortization
EIN Employer Identification Number
EPA United States Environmental Protection Agency
ESCP Erosion and Sediment Control Plan
FASB Financial Accounting Standards Board
FERC Federal Energy Regulatory Commission
Fidelity Fidelity Exploration & Production Company, a direct wholly owned subsidiary of WBI Holdings (previously referred to as the Company's exploration and production segment)
FIP Funding improvement plan
GAAP Accounting principles generally accepted in the United States of America
Great Plains Great Plains Natural Gas Co., a public utility division of the Company
IBEW International Brotherhood of Electrical Workers
IFRS International Financial Reporting Standards
Intermountain Intermountain Gas Company, an indirect wholly owned subsidiary of MDU Energy Capital
JTL JTL Group, Inc., an indirect wholly owned subsidiary of Knife River
Knife River Knife River Corporation, a direct wholly owned subsidiary of Centennial
Knife River - Northwest Knife River Corporation - Northwest, an indirect wholly owned subsidiary of Knife River
K-Plan Company's 401(k) Retirement Plan
LTM LTM, Incorporated, an indirect wholly owned subsidiary of Knife River
LWG Lower Willamette Group
MBbls Thousands of barrels
MBOE Thousands of BOE
Part II
MDU Resources Group, Inc. Form 10-K 105
Mcf Thousand cubic feet
MDU Construction Services MDU Construction Services Group, Inc., a direct wholly owned subsidiary of Centennial
MDU Energy Capital MDU Energy Capital, LLC, a direct wholly owned subsidiary of the Company
MEPP Multiemployer pension plan
MISO Midcontinent Independent System Operator, Inc.
MMBOE Millions of BOE
MMBtu Million Btu
MMcf Million cubic feet
MNPUC Minnesota Public Utilities Commission
Montana-Dakota Montana-Dakota Utilities Co., a public utility division of the Company
Montana DEQ Montana Department of Environmental Quality
Montana First Judicial District Court Montana First Judicial District Court, Lewis and Clark County
Montana Seventeenth JudicialDistrict Court Montana Seventeenth Judicial District Court, Phillips County
MTPSC Montana Public Service Commission
MW Megawatt
NDPSC North Dakota Public Service Commission
Nevada State District Court District Court Clark County, Nevada
NGL Natural gas liquids
Notice of Civil Penalty Notice of Civil Penalty Assessment and Order
Oil Includes crude oil and condensate
Omimex Omimex Canada, Ltd.
OPUC Oregon Public Utility Commission
Oregon DEQ Oregon State Department of Environmental Quality
PRP Potentially Responsible Party
PUD Proved undeveloped
RIN Renewable Identification Number
ROD Record of Decision
RP Rehabilitation plan
SDPUC South Dakota Public Utilities Commission
SEC United States Securities and Exchange Commission
SEC Defined Prices The average price of oil and natural gas during the applicable 12-month period, determined asan unweighted arithmetic average of the first-day-of-the-month price for each month within suchperiod, unless prices are defined by contractual arrangements, excluding escalations based uponfuture conditions
SourceGas SourceGas Distribution LLC
Stock Purchase Plan Company's Dividend Reinvestment and Direct Stock Purchase Plan
United States District Court for the District of Montana United States District Court for the District of Montana, Great Falls Division
VIE Variable interest entity
WBI Energy WBI Energy, Inc., an indirect wholly owned subsidiary of WBI Holdings
WBI Energy Midstream WBI Energy Midstream, LLC, an indirect wholly owned subsidiary of WBI Holdings
WBI Energy Transmission WBI Energy Transmission, Inc., an indirect wholly owned subsidiary of WBI Holdings
WBI Holdings WBI Holdings, Inc., a direct wholly owned subsidiary of Centennial
WUTC Washington Utilities and Transportation Commission
Wygen III 100-MW coal-fired electric generating facility near Gillette, Wyoming (25 percent ownership)
WYPSC Wyoming Public Service Commission
Part II
106 MDU Resources Group, Inc. Form 10-K
Item 9. Changes in and Disagreements With Accountants on Accounting and Financial Disclosure
None.
Item 9A. Controls and Procedures
The following information includes the evaluation of disclosure controls and procedures by the Company's chief executive officer and the chief financial officer, along with any significant changes in internal controls of the Company.
Evaluation of Disclosure Controls and ProceduresThe term "disclosure controls and procedures" is defined in Rules 13a-15(e) and 15d-15(e) under the Exchange Act. The Company's disclosure controls and other procedures are designed to provide reasonable assurance that information required to be disclosed in the reports that the Company files or submits under the Exchange Act is recorded, processed, summarized and reported within the time periods specified in the SEC's rules and forms. The Company's disclosure controls and procedures include controls and procedures designed to provide reasonable assurance that information required to be disclosed is accumulated and communicated to management, including the Company's chief executive officer and chief financial officer, to allow timely decisions regarding required disclosure. The Company's management, with the participation of the Company's chief executive officer and chief financial officer, has evaluated the effectiveness of the Company's disclosure controls and procedures. Based upon that evaluation, the chief executive officer and the chief financial officer have concluded that, as of the end of the period covered by this report, such controls and procedures were effective at a reasonable assurance level.
Changes in Internal ControlsNo change in the Company's internal control over financial reporting (as defined in Rules 13a-15(f) and 15d-15(f) under the Exchange Act) occurred during the quarter ended December 31, 2015, that has materially affected, or is reasonably likely to materially affect, the Company's internal control over financial reporting.
Management's Annual Report on Internal Control Over Financial ReportingThe information required by this item is included in this Form 10-K at Item 8 - Management's Report on Internal Control Over Financial Reporting.
Attestation Report of the Registered Public Accounting FirmThe information required by this item is included in this Form 10-K at Item 8 - Report of Independent Registered Public Accounting Firm.
Item 9B. Other Information
None.
Part III
MDU Resources Group, Inc. Form 10-K 107
Item 10. Directors, Executive Officers and Corporate Governance
The information required by this item is included in the last sentence of the second paragraph under the caption "Item 1. Election of Directors" and under the captions "Item 1. Election of Directors - Director Nominees," "Information Concerning Executive Officers," the first paragraph and the second and third sentences of the second paragraph under "Corporate Governance - Audit Committee," "Corporate Governance - Code of Conduct," the second sentence of the last paragraph under "Corporate Governance - Board Meetings and Committees" and "Section 16(a) Beneficial Ownership Reporting Compliance" in the Proxy Statement, which information is incorporated herein by reference.
Item 11. Executive Compensation
The information required by this item is included under the caption "Executive Compensation" in the Proxy Statement, which information is incorporated herein by reference.
Item 12. Security Ownership of Certain Beneficial Owners and Management and Related Stockholder Matters
The information required by this item is included in the Proxy Statement under the caption "Equity Compensation Plan Information" in Item 2. Approval of the Material Terms of the Performance Goals under the MDU Resources Group, Inc. Long-Term Performance-Based Incentive Plan for Purposes of Internal Revenue Code Section 162(m) and under the caption "Security Ownership", which information is incorporated herein by reference.
Item 13. Certain Relationships and Related Transactions, and Director Independence
The information required by this item is included under the captions "Related Person Transaction Disclosure," "Corporate Governance - Director Independence" and the second sentence of the third paragraph under "Corporate Governance - Board Meetings and Committees" in the Proxy Statement, which information is incorporated herein by reference.
Item 14. Principal Accountant Fees and Services
The information required by this item is included under the caption "Item 3. Ratification of Independent Registered Public Accounting Firm - Accounting and Auditing Matters" in the Proxy Statement, which information is incorporated herein by reference.
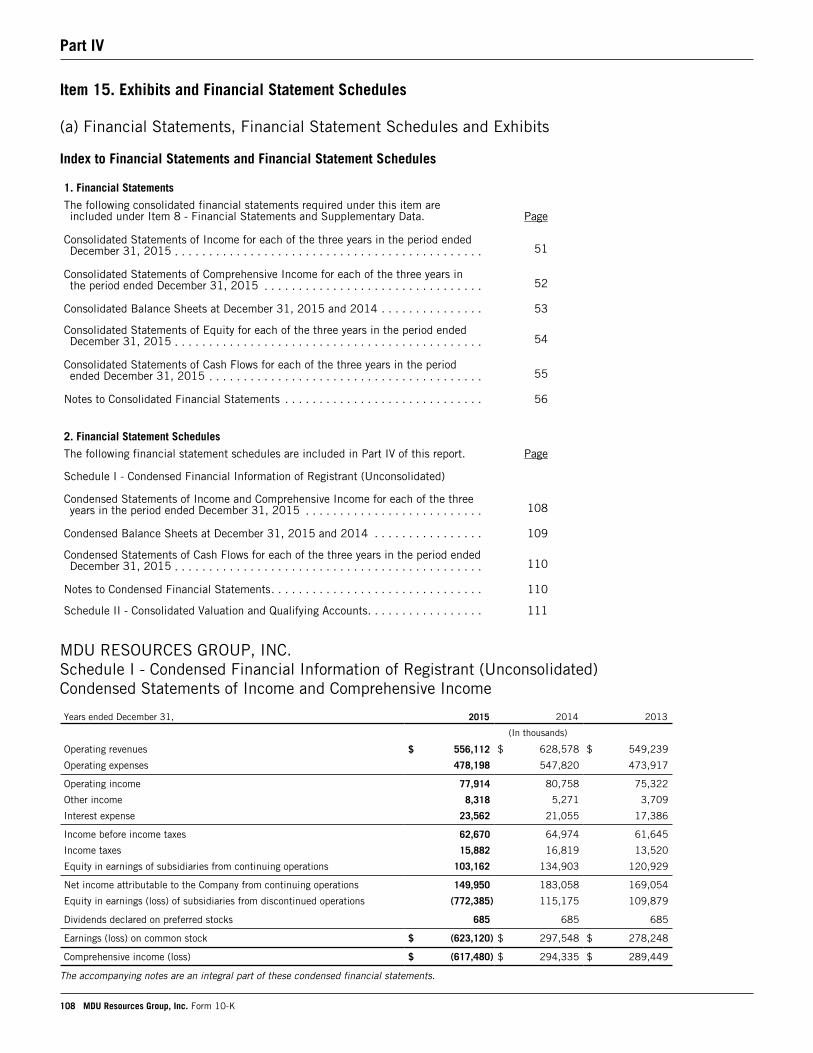
Part IV
108 MDU Resources Group, Inc. Form 10-K
Item 15. Exhibits and Financial Statement Schedules
(a) Financial Statements, Financial Statement Schedules and Exhibits
Index to Financial Statements and Financial Statement Schedules
1. Financial Statements
The following consolidated financial statements required under this item areincluded under Item 8 - Financial Statements and Supplementary Data. Page
Consolidated Statements of Income for each of the three years in the period ended December 31, 2015 . . . . . . . . . . . . . . . . . . . . . . . . . . . . . . . . . . . . . . . . . . . . .
Consolidated Statements of Comprehensive Income for each of the three years in the period ended December 31, 2015 . . . . . . . . . . . . . . . . . . . . . . . . . . . . . . . .
Consolidated Balance Sheets at December 31, 2015 and 2014 . . . . . . . . . . . . . . .
Consolidated Statements of Equity for each of the three years in the period ended December 31, 2015 . . . . . . . . . . . . . . . . . . . . . . . . . . . . . . . . . . . . . . . . . . . . .
Consolidated Statements of Cash Flows for each of the three years in the period ended December 31, 2015 . . . . . . . . . . . . . . . . . . . . . . . . . . . . . . . . . . . . . . . .
Notes to Consolidated Financial Statements . . . . . . . . . . . . . . . . . . . . . . . . . . . . .
2. Financial Statement Schedules
The following financial statement schedules are included in Part IV of this report. Page
Schedule I - Condensed Financial Information of Registrant (Unconsolidated)
Condensed Statements of Income and Comprehensive Income for each of the three years in the period ended December 31, 2015 . . . . . . . . . . . . . . . . . . . . . . . . . .
Condensed Balance Sheets at December 31, 2015 and 2014 . . . . . . . . . . . . . . . .
Condensed Statements of Cash Flows for each of the three years in the period ended December 31, 2015 . . . . . . . . . . . . . . . . . . . . . . . . . . . . . . . . . . . . . . . . . . . . .
Notes to Condensed Financial Statements. . . . . . . . . . . . . . . . . . . . . . . . . . . . . . .
Schedule II - Consolidated Valuation and Qualifying Accounts. . . . . . . . . . . . . . . . .
MDU RESOURCES GROUP, INC.Schedule I - Condensed Financial Information of Registrant (Unconsolidated)Condensed Statements of Income and Comprehensive Income
Years ended December 31, 2015 2014 2013
(In thousands)
Operating revenues $ 556,112 $ 628,578 $ 549,239
Operating expenses 478,198 547,820 473,917
Operating income 77,914 80,758 75,322
Other income 8,318 5,271 3,709
Interest expense 23,562 21,055 17,386
Income before income taxes 62,670 64,974 61,645
Income taxes 15,882 16,819 13,520
Equity in earnings of subsidiaries from continuing operations 103,162 134,903 120,929
Net income attributable to the Company from continuing operations 149,950 183,058 169,054
Equity in earnings (loss) of subsidiaries from discontinued operations (772,385) 115,175 109,879
Dividends declared on preferred stocks 685 685 685
Earnings (loss) on common stock $ (623,120) $ 297,548 $ 278,248
Comprehensive income (loss) $ (617,480) $ 294,335 $ 289,449
The accompanying notes are an integral part of these condensed financial statements.
51
52
53
54
55
56
108
109
110
110
111
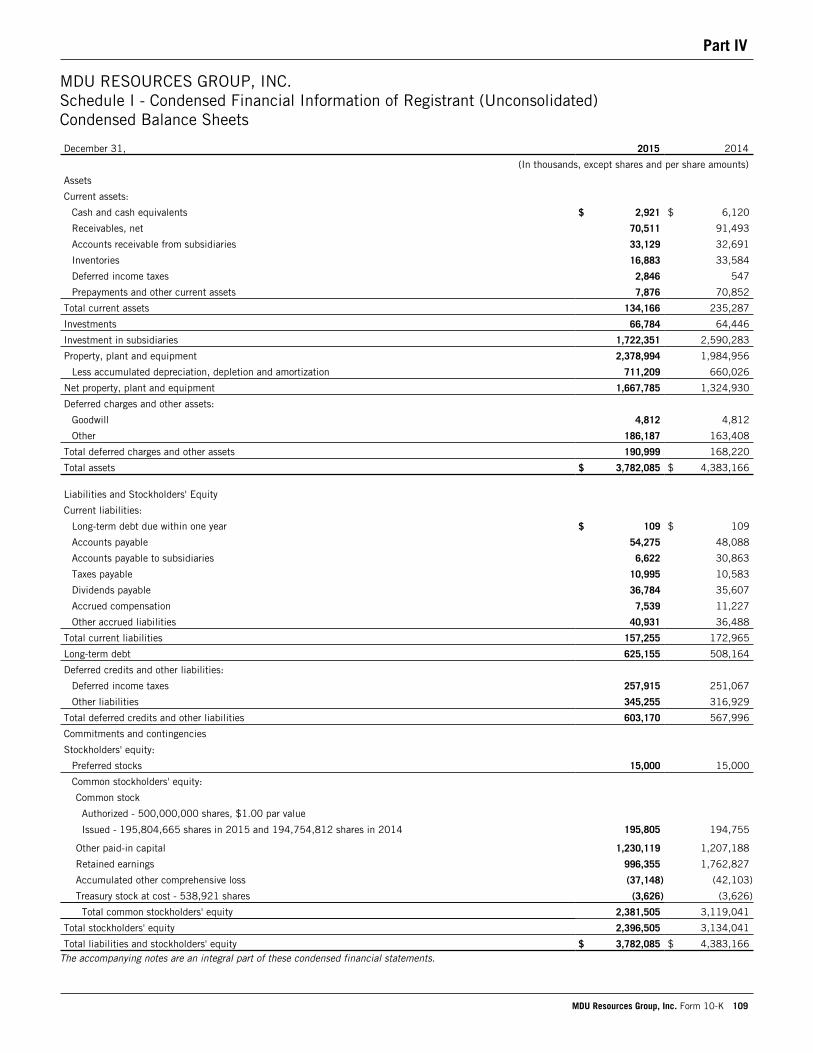
Part IV
MDU Resources Group, Inc. Form 10-K 109
MDU RESOURCES GROUP, INC.Schedule I - Condensed Financial Information of Registrant (Unconsolidated)Condensed Balance Sheets
December 31, 2015 2014
(In thousands, except shares and per share amounts)
Assets
Current assets:
Cash and cash equivalents $ 2,921 $ 6,120
Receivables, net 70,511 91,493
Accounts receivable from subsidiaries 33,129 32,691
Inventories 16,883 33,584
Deferred income taxes 2,846 547
Prepayments and other current assets 7,876 70,852
Total current assets 134,166 235,287
Investments 66,784 64,446
Investment in subsidiaries 1,722,351 2,590,283
Property, plant and equipment 2,378,994 1,984,956
Less accumulated depreciation, depletion and amortization 711,209 660,026
Net property, plant and equipment 1,667,785 1,324,930
Deferred charges and other assets:
Goodwill 4,812 4,812
Other 186,187 163,408
Total deferred charges and other assets 190,999 168,220
Total assets $ 3,782,085 $ 4,383,166
Liabilities and Stockholders' Equity
Current liabilities:
Long-term debt due within one year $ 109 $ 109
Accounts payable 54,275 48,088
Accounts payable to subsidiaries 6,622 30,863
Taxes payable 10,995 10,583
Dividends payable 36,784 35,607
Accrued compensation 7,539 11,227
Other accrued liabilities 40,931 36,488
Total current liabilities 157,255 172,965
Long-term debt 625,155 508,164
Deferred credits and other liabilities:
Deferred income taxes 257,915 251,067
Other liabilities 345,255 316,929
Total deferred credits and other liabilities 603,170 567,996
Commitments and contingencies
Stockholders' equity:
Preferred stocks 15,000 15,000
Common stockholders' equity:
Common stock
Authorized - 500,000,000 shares, $1.00 par value
Issued - 195,804,665 shares in 2015 and 194,754,812 shares in 2014 195,805 194,755
Other paid-in capital 1,230,119 1,207,188
Retained earnings 996,355 1,762,827
Accumulated other comprehensive loss (37,148) (42,103)
Treasury stock at cost - 538,921 shares (3,626) (3,626)
Total common stockholders' equity 2,381,505 3,119,041
Total stockholders' equity 2,396,505 3,134,041
Total liabilities and stockholders' equity $ 3,782,085 $ 4,383,166The accompanying notes are an integral part of these condensed financial statements.
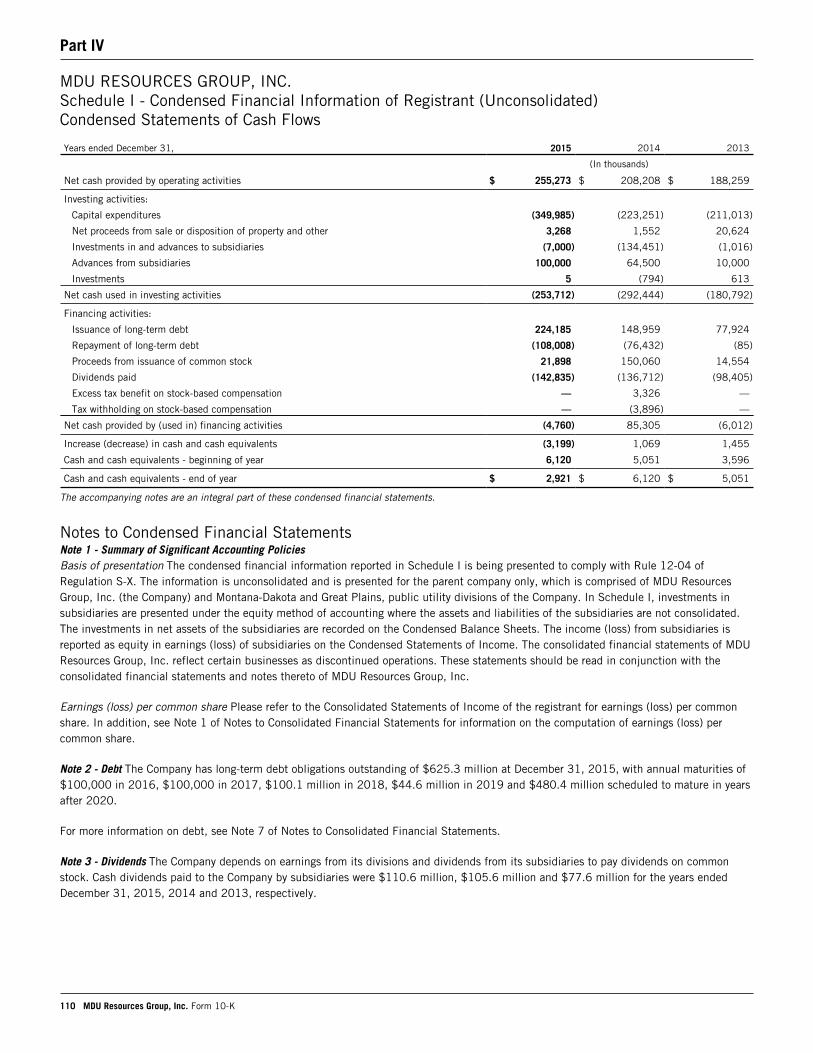
Part IV
110 MDU Resources Group, Inc. Form 10-K
MDU RESOURCES GROUP, INC.Schedule I - Condensed Financial Information of Registrant (Unconsolidated)Condensed Statements of Cash Flows
Years ended December 31, 2015 2014 2013
(In thousands)
Net cash provided by operating activities $ 255,273 $ 208,208 $ 188,259
Investing activities:
Capital expenditures (349,985) (223,251) (211,013)
Net proceeds from sale or disposition of property and other 3,268 1,552 20,624
Investments in and advances to subsidiaries (7,000) (134,451) (1,016)
Advances from subsidiaries 100,000 64,500 10,000
Investments 5 (794) 613
Net cash used in investing activities (253,712) (292,444) (180,792)
Financing activities:
Issuance of long-term debt 224,185 148,959 77,924
Repayment of long-term debt (108,008) (76,432) (85)
Proceeds from issuance of common stock 21,898 150,060 14,554
Dividends paid (142,835) (136,712) (98,405)
Excess tax benefit on stock-based compensation — 3,326 —
Tax withholding on stock-based compensation — (3,896) —
Net cash provided by (used in) financing activities (4,760) 85,305 (6,012)
Increase (decrease) in cash and cash equivalents (3,199) 1,069 1,455
Cash and cash equivalents - beginning of year 6,120 5,051 3,596
Cash and cash equivalents - end of year $ 2,921 $ 6,120 $ 5,051
The accompanying notes are an integral part of these condensed financial statements.
Notes to Condensed Financial StatementsNote 1 - Summary of Significant Accounting PoliciesBasis of presentation The condensed financial information reported in Schedule I is being presented to comply with Rule 12-04 of Regulation S-X. The information is unconsolidated and is presented for the parent company only, which is comprised of MDU Resources Group, Inc. (the Company) and Montana-Dakota and Great Plains, public utility divisions of the Company. In Schedule I, investments in subsidiaries are presented under the equity method of accounting where the assets and liabilities of the subsidiaries are not consolidated. The investments in net assets of the subsidiaries are recorded on the Condensed Balance Sheets. The income (loss) from subsidiaries is reported as equity in earnings (loss) of subsidiaries on the Condensed Statements of Income. The consolidated financial statements of MDU Resources Group, Inc. reflect certain businesses as discontinued operations. These statements should be read in conjunction with the consolidated financial statements and notes thereto of MDU Resources Group, Inc.
Earnings (loss) per common share Please refer to the Consolidated Statements of Income of the registrant for earnings (loss) per common share. In addition, see Note 1 of Notes to Consolidated Financial Statements for information on the computation of earnings (loss) per common share.
Note 2 - Debt The Company has long-term debt obligations outstanding of $625.3 million at December 31, 2015, with annual maturities of $100,000 in 2016, $100,000 in 2017, $100.1 million in 2018, $44.6 million in 2019 and $480.4 million scheduled to mature in years after 2020.
For more information on debt, see Note 7 of Notes to Consolidated Financial Statements.
Note 3 - Dividends The Company depends on earnings from its divisions and dividends from its subsidiaries to pay dividends on common stock. Cash dividends paid to the Company by subsidiaries were $110.6 million, $105.6 million and $77.6 million for the years ended December 31, 2015, 2014 and 2013, respectively.
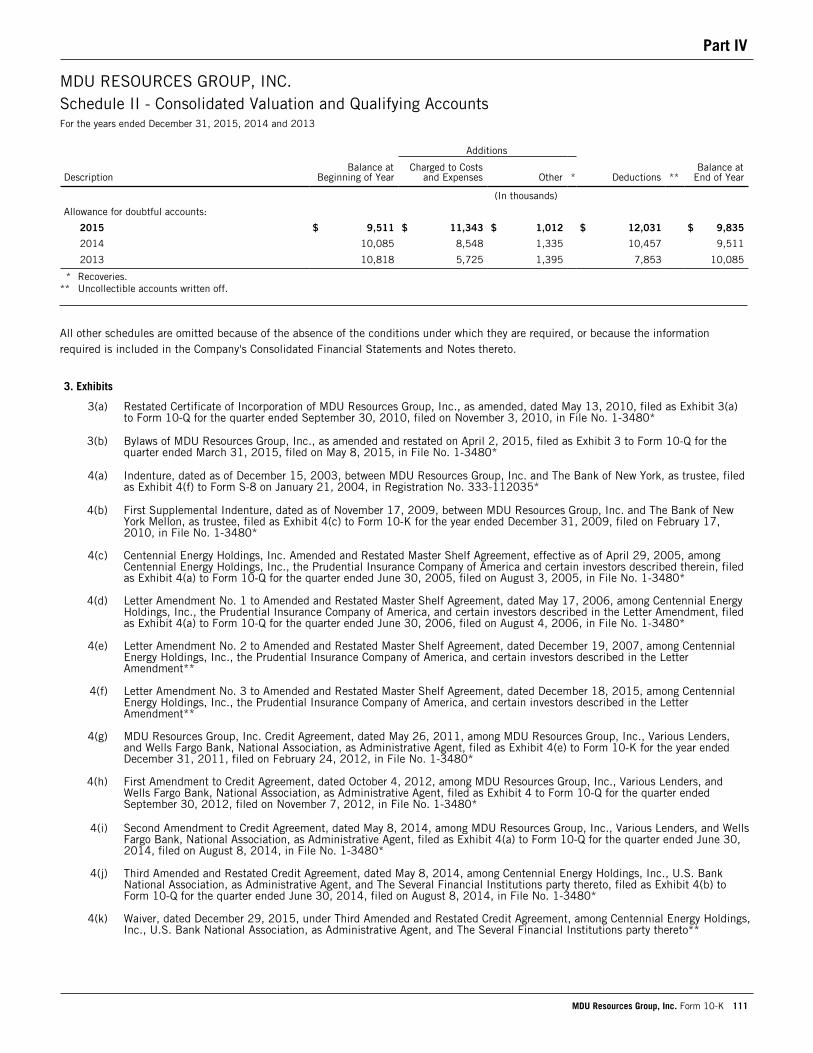
Part IV
MDU Resources Group, Inc. Form 10-K 111
MDU RESOURCES GROUP, INC.Schedule II - Consolidated Valuation and Qualifying AccountsFor the years ended December 31, 2015, 2014 and 2013
Additions
DescriptionBalance at
Beginning of YearCharged to Costs
and Expenses Other * Deductions **Balance at
End of Year
(In thousands)
Allowance for doubtful accounts:
2015 $ 9,511 $ 11,343 $ 1,012 $ 12,031 $ 9,835
2014 10,085 8,548 1,335 10,457 9,511
2013 10,818 5,725 1,395 7,853 10,085
* Recoveries.** Uncollectible accounts written off.
All other schedules are omitted because of the absence of the conditions under which they are required, or because the information required is included in the Company's Consolidated Financial Statements and Notes thereto.
3. Exhibits
3(a) Restated Certificate of Incorporation of MDU Resources Group, Inc., as amended, dated May 13, 2010, filed as Exhibit 3(a)to Form 10-Q for the quarter ended September 30, 2010, filed on November 3, 2010, in File No. 1-3480*
3(b) Bylaws of MDU Resources Group, Inc., as amended and restated on April 2, 2015, filed as Exhibit 3 to Form 10-Q for thequarter ended March 31, 2015, filed on May 8, 2015, in File No. 1-3480*
4(a) Indenture, dated as of December 15, 2003, between MDU Resources Group, Inc. and The Bank of New York, as trustee, filedas Exhibit 4(f) to Form S-8 on January 21, 2004, in Registration No. 333-112035*
4(b) First Supplemental Indenture, dated as of November 17, 2009, between MDU Resources Group, Inc. and The Bank of NewYork Mellon, as trustee, filed as Exhibit 4(c) to Form 10-K for the year ended December 31, 2009, filed on February 17,2010, in File No. 1-3480*
4(c) Centennial Energy Holdings, Inc. Amended and Restated Master Shelf Agreement, effective as of April 29, 2005, amongCentennial Energy Holdings, Inc., the Prudential Insurance Company of America and certain investors described therein, filedas Exhibit 4(a) to Form 10-Q for the quarter ended June 30, 2005, filed on August 3, 2005, in File No. 1-3480*
4(d) Letter Amendment No. 1 to Amended and Restated Master Shelf Agreement, dated May 17, 2006, among Centennial EnergyHoldings, Inc., the Prudential Insurance Company of America, and certain investors described in the Letter Amendment, filedas Exhibit 4(a) to Form 10-Q for the quarter ended June 30, 2006, filed on August 4, 2006, in File No. 1-3480*
4(e) Letter Amendment No. 2 to Amended and Restated Master Shelf Agreement, dated December 19, 2007, among CentennialEnergy Holdings, Inc., the Prudential Insurance Company of America, and certain investors described in the LetterAmendment**
4(f) Letter Amendment No. 3 to Amended and Restated Master Shelf Agreement, dated December 18, 2015, among CentennialEnergy Holdings, Inc., the Prudential Insurance Company of America, and certain investors described in the LetterAmendment**
4(g) MDU Resources Group, Inc. Credit Agreement, dated May 26, 2011, among MDU Resources Group, Inc., Various Lenders,and Wells Fargo Bank, National Association, as Administrative Agent, filed as Exhibit 4(e) to Form 10-K for the year endedDecember 31, 2011, filed on February 24, 2012, in File No. 1-3480*
4(h) First Amendment to Credit Agreement, dated October 4, 2012, among MDU Resources Group, Inc., Various Lenders, andWells Fargo Bank, National Association, as Administrative Agent, filed as Exhibit 4 to Form 10-Q for the quarter endedSeptember 30, 2012, filed on November 7, 2012, in File No. 1-3480*
4(i) Second Amendment to Credit Agreement, dated May 8, 2014, among MDU Resources Group, Inc., Various Lenders, and WellsFargo Bank, National Association, as Administrative Agent, filed as Exhibit 4(a) to Form 10-Q for the quarter ended June 30,2014, filed on August 8, 2014, in File No. 1-3480*
4(j) Third Amended and Restated Credit Agreement, dated May 8, 2014, among Centennial Energy Holdings, Inc., U.S. BankNational Association, as Administrative Agent, and The Several Financial Institutions party thereto, filed as Exhibit 4(b) toForm 10-Q for the quarter ended June 30, 2014, filed on August 8, 2014, in File No. 1-3480*
4(k) Waiver, dated December 29, 2015, under Third Amended and Restated Credit Agreement, among Centennial Energy Holdings,Inc., U.S. Bank National Association, as Administrative Agent, and The Several Financial Institutions party thereto**
Part IV
112 MDU Resources Group, Inc. Form 10-K
4(l) MDU Energy Capital, LLC Master Shelf Agreement, dated as of August 9, 2007, among MDU Energy Capital, LLC, PrudentialInvestment Management, Inc., the Prudential Insurance Company of America and the holders of the notes thereunder, filed asExhibit 4 to Form 8-K dated August 16, 2007, filed on August 16, 2007, in File No. 1-3480*
4(m) Amendment No. 1 to Master Shelf Agreement, dated October 1, 2008, among MDU Energy Capital, LLC, PrudentialInvestment Management, Inc., the Prudential Insurance Company of America, and the holders of the notes thereunder, filed asExhibit 4(b) to Form 10-Q for the quarter ended September 30, 2008, filed on November 5, 2008, in File No. 1-3480*
4(n) Indenture dated as of August 1, 1992, between Cascade Natural Gas Corporation and The Bank of New York relating toMedium-Term Notes, filed by Cascade Natural Gas Corporation as Exhibit 4 to Form 8-K dated August 12, 1992, in FileNo. 1-7196*
4(o) First Supplemental Indenture dated as of October 25, 1993, between Cascade Natural Gas Corporation and The Bank of NewYork relating to Medium-Term Notes and the 7.5% Notes due November 15, 2031, filed by Cascade Natural Gas Corporationas Exhibit 4 to Form 10-Q for the quarter ended June 30, 1993, in File No. 1-7196*
4(p) Second Supplemental Indenture, dated January 25, 2005, between Cascade Natural Gas Corporation and The Bank of NewYork, as trustee, filed by Cascade Natural Gas Corporation as Exhibit 4.1 to Form 8-K dated January 25, 2005, filed onJanuary 26, 2005, in File No. 1-7196*
4(q) Third Supplemental Indenture dated as of March 8, 2007, between Cascade Natural Gas Corporation and The Bank of NewYork Trust Company, N.A., as Successor Trustee, filed by Cascade Natural Gas Corporation as Exhibit 4.1 to Form 8-K datedMarch 8, 2007, filed on March 8, 2007, in File No. 1-7196*
+10(a) Supplemental Income Security Plan, as amended and restated November 12, 2009, filed as Exhibit 10(b) to Form 10-K forthe year ended December 31, 2009, filed on February 17, 2010, in File No. 1-3480*
+10(b) Director Compensation Policy, as amended May 15, 2014, filed as Exhibit 10(b) to Form 10-Q for the quarter ended June 30,2014, filed on August 8, 2014, in File No. 1-3480*
+10(c) Deferred Compensation Plan for Directors, as amended May 15, 2008, filed as Exhibit 10(a) to Form 10-Q for the quarterended June 30, 2008, filed on August 7, 2008, in File No. 1-3480*
+10(d) Non-Employee Director Stock Compensation Plan, as amended May 12, 2011, filed as Exhibit 10(a) to Form 10-Q for thequarter ended June 30, 2011, filed on August 5, 2011, in File No. 1-3480*
+10(e) MDU Resources Group, Inc. Non-Employee Director Long-Term Incentive Compensation Plan, as amended May 17, 2012,filed as Exhibit 10(a) to Form 10-Q for the quarter ended June 30, 2012, filed on August 7, 2012, in File No. 1-3480*
+10(f) MDU Resources Group, Inc. Long-Term Performance-Based Incentive Plan, as amended February 11, 2016**
+10(g) MDU Resources Group, Inc. Executive Incentive Compensation Plan, as amended March 4, 2013, and Rules and Regulations,as amended March 4, 2013, filed as Exhibit 10(a) to Form 10-Q for the quarter ended March 31, 2013, filed on May 7,2013, in File No. 1-3480*
+10(h) Form of Performance Share Award Agreement under the Long-Term Performance-Based Incentive Plan, as amendedNovember 14, 2012, filed as Exhibit 10.1 to Form 8-K dated November 14, 2012, filed on November 20, 2012, in FileNo. 1-3480*
+10(i) Form of Performance Share Award Agreement under the Long-Term Performance-Based Incentive Plan, as amendedFebruary 12, 2014, filed as Exhibit 10(a) to Form 10-Q for the quarter ended March 31, 2014, filed on May 7, 2014, in FileNo. 1-3480*
+10(j) Form of Performance Share Award Agreement under the Long-Term Performance-Based Incentive Plan, as amendedFebruary 11, 2015, filed as Exhibit 10.3 to Form 8-K dated February 11, 2015, filed on February 18, 2015, in FileNo. 1-3480*
+10(k) Form of Annual Incentive Award Agreement under the Long-Term Performance-Based Incentive Plan, as amendedFebruary 11, 2015, filed as Exhibit 10.2 to Form 8-K dated February 11, 2015, filed on February 18, 2015, in FileNo. 1-3480*
+10(l) Form of MDU Resources Group, Inc. Indemnification Agreement for Section 16 Officers and Directors, filed as Exhibit 10.1 toForm 8-K dated May 15, 2014, filed on May 15, 2014, in File No. 1-3480*
+10(m) Form of Amendment No. 1 to Indemnification Agreement, filed as Exhibit 10.2 to Form 8-K dated May 15, 2014, filed onMay 15, 2014, in File No. 1-3480*
+10(n) MDU Resources Group, Inc. Section 16 Officers and Directors with Indemnification Agreements Chart, as of January 9,2016**
+10(o) Employment Letter for J. Kent Wells, dated March 9, 2011, filed as Exhibit 10(v) to Form 10-K for the year endedDecember 31, 2011, filed on February 24, 2012, in File No. 1-3480*
+10(p) MDU Resources Group, Inc. Nonqualified Defined Contribution Plan, as adopted November 17, 2011, filed as Exhibit 10(x) toForm 10-K for the year ended December 31, 2011, filed on February 24, 2012, in File No. 1-3480*
+10(q) MDU Resources Group, Inc. 401(k) Retirement Plan, as restated March 1, 2011, filed as Exhibit 10(a) to Form 10-Q for thequarter ended September 30, 2011, filed on November 4, 2011, in File No. 1-3480*
Part IV
MDU Resources Group, Inc. Form 10-K 113
+10(r) Instrument of Amendment to the MDU Resources Group, Inc. 401(k) Retirement Plan, dated March 29, 2011, filed asExhibit 10(b) to Form 10-Q for the quarter ended March 31, 2011, filed on May 5, 2011, in File No. 1-3480*
+10(s) Instrument of Amendment to the MDU Resources Group, Inc. 401(k) Retirement Plan, dated June 30, 2011, filed asExhibit 10(d) to Form 10-Q for the quarter ended June 30, 2011, filed on August 5, 2011, in File No. 1-3480*
+10(t) Instrument of Amendment to the MDU Resources Group, Inc. 401(k) Retirement Plan, dated September 9, 2011, filed asExhibit 10(b) to Form 10-Q for the quarter ended September 30, 2011, filed on November 4, 2011, in File No. 1-3480*
+10(u) Instrument of Amendment to the MDU Resources Group, Inc. 401(k) Retirement Plan, dated December 29, 2011, filed asExhibit 10(ac) to Form 10-K for the year ended December 31, 2011, filed on February 24, 2012, in File No. 1-3480*
+10(v) Instrument of Amendment to the MDU Resources Group, Inc. 401(k) Retirement Plan, dated May 24, 2012, filed asExhibit 10(b) to Form 10-Q for the quarter ended June 30, 2012, filed on August 7, 2012, in File No. 1-3480*
+10(w) Instrument of Amendment to the MDU Resources Group, Inc. 401(k) Retirement Plan, dated August 29, 2012, filed asExhibit 10(a) to Form 10-Q for the quarter ended September 30, 2012, filed on November 7, 2012, in File No. 1-3480*
+10(x) Instrument of Amendment to the MDU Resources Group, Inc. 401(k) Retirement Plan, dated August 29, 2012, filed asExhibit 10(b) to Form 10-Q for the quarter ended September 30, 2012, filed on November 7, 2012, in File No. 1-3480*
+10(y) Instrument of Amendment to the MDU Resources Group, Inc. 401(k) Retirement Plan, dated December 19, 2012, filed asExhibit 10(z) to Form 10-K for the year ended December 31, 2012, filed on February 28, 2013, in File No. 1-3480*
+10(z) Instrument of Amendment to the MDU Resources Group, Inc. 401(k) Retirement Plan, dated September 9, 2013, filed asExhibit 10(b) to Form 10-Q for the quarter ended September 30, 2013, filed on November 7, 2013, in File No. 1-3480*
+10(aa) Instrument of Amendment to the MDU Resources Group, Inc. 401(k) Retirement Plan, dated September 9, 2013, filed asExhibit 10(c) to Form 10-Q for the quarter ended September 30, 2013, filed on November 7, 2013, in File No. 1-3480*
+10(ab) Instrument of Amendment to the MDU Resources Group, Inc. 401(k) Retirement Plan, dated September 23, 2013, filed asExhibit 10(d) to Form 10-Q for the quarter ended September 30, 2013, filed on November 7, 2013, in File No. 1-3480*
+10(ac) Instrument of Amendment to the MDU Resources Group, Inc. 401(k) Retirement Plan, dated December 31, 2013, filed asExhibit 10(aa) to Form 10-K for the year ended December 31, 2013, filed on February 21, 2014, in File No. 1-3480*
+10(ad) Instrument of Amendment to the MDU Resources Group, Inc. 401(k) Retirement Plan, dated March 13, 2014, filed asExhibit 10(b) to Form 10-Q for the quarter ended March 31, 2014, filed on May 7, 2014, in File No. 1-3480*
+10(ae) Instrument of Amendment to the MDU Resources Group, Inc. 401(k) Retirement Plan, dated June 5, 2014, filed asExhibit 10(a) to Form 10-Q for the quarter ended June 30, 2014, filed on August 8, 2014, in File No. 1-3480*
+10(af) Instrument of Amendment to the MDU Resources Group, Inc. 401(k) Retirement Plan, dated July 7, 2014, filed asExhibit 4.20 to Form S-8, filed on August 26, 2014, in Registration No. 333-198364*
+10(ag) Instrument of Amendment to the MDU Resources Group, Inc. 401(k) Retirement Plan, dated August 18, 2014, filed asExhibit 4.21 to Form S-8, filed on August 26, 2014, in Registration No. 333-198364*
+10(ah) Instrument of Amendment to the MDU Resources Group, Inc. 401(k) Retirement Plan, dated September 30, 2014, filed asExhibit 10(b) to Form 10-Q for the quarter ended September 30, 2014, filed on November 7, 2014, in File No. 1-3480*
+10(ai) Instrument of Amendment to the MDU Resources Group, Inc. 401(k) Retirement Plan, dated November 25, 2014, filed asExhibit 10(ah) to Form 10-K for the year ended December 31, 2014, filed on February 20, 2015, in File No. 1-3480*
+10(aj) Instrument of Amendment to the MDU Resources Group, Inc. 401(k) Retirement Plan, dated December 11, 2014, filed asExhibit 10(ai) to Form 10-K for the year ended December 31, 2014, filed on February 20, 2015, in File No. 1-3480*
+10(ak) Instrument of Amendment to the MDU Resources Group, Inc. 401(k) Retirement Plan, dated December 11, 2014, filed asExhibit 10(aj) to Form 10-K for the year ended December 31, 2014, filed on February 20, 2015, in File No. 1-3480*
+10(al) Instrument of Amendment to the MDU Resources Group, Inc. 401(k) Retirement Plan, dated December 30, 2014, filed asExhibit 10(ak) to Form 10-K for the year ended December 31, 2014, filed on February 20, 2015, in File No. 1-3480*
+10(am) Instrument of Amendment to the MDU Resources Group, Inc. 401(k) Retirement Plan, dated February 17, 2015, filed asExhibit 10(a) to Form 10-Q for the quarter ended March 31, 2015, filed on May 8, 2015, in File No. 1-3480*
+10(an) Instrument of Amendment to the MDU Resources Group, Inc. 401(k) Retirement Plan, dated March 13, 2015, filed asExhibit 10(b) to Form 10-Q for the quarter ended March 31, 2015, filed on May 8, 2015, in File No. 1-3480*
+10(ao) Instrument of Amendment to the MDU Resources Group, Inc. 401(k) Retirement Plan, dated June 30, 2015, filed asExhibit 10(a) to Form 10-Q for the quarter ended June 30, 2015, filed on August 4, 2015, in File No. 1-3480*
+10(ap) Instrument of Amendment to the MDU Resources Group, Inc. 401(k) Retirement Plan, dated November 19, 2015**
+10(aq) Employment Letter for Jeffrey S. Thiede, dated May 16, 2013, filed as Exhibit 10(ab) to Form 10-K for the year endedDecember 31, 2013, filed on February 21, 2014, in File No. 1-3480*
+10(ar) Agreement with J. Kent Wells, dated January 22, 2015, filed as Exhibit 10 to Form 8-K dated January 20, 2015, filed onJanuary 23, 2015, in File No. 1-3480*
Part IV
114 MDU Resources Group, Inc. Form 10-K
+10(as) Waiver and Voluntary Release, dated July 17, 2015, between Steven L. Bietz and WBI Holdings, Inc., filed as Exhibit 10(b) toForm 10-Q for the quarter ended June 30, 2015, filed on August 4, 2015, in File No. 1-3480*
+10(at) Martin A. Fritz Offer Letter, dated July 1, 2015, filed as Exhibit 10.2 to Form 8-K dated June 30, 2015, filed on July 2,2015, in File No. 1-3480*
+10(au) Form of 2015 Annual Incentive Award Agreement for Patrick L. O'Bryan under the Long-Term Performance-Based IncentivePlan, filed as Exhibit 10.1 to Form 8-K/A dated February 18, 2015, filed February 18, 2015, in File No. 1-3480*
+10(av) Patrick L. O'Bryan November 2014 Incentive Opportunity, filed as Exhibit 10.2 to Form 8-K/A dated February 18, 2015, filedon February 18, 2015, in File No. 1-3480*
+10(aw) Patrick L. O'Bryan Sales Bonus Incentive Award Opportunity granted May 13, 2015**
+10(ax) David C. Barney 2015 Additional Annual Incentive Award Opportunity under the Long-Term Performance-Based Incentive Plangranted February 12, 2015**
12 Computation of Ratio of Earnings to Fixed Charges and Combined Fixed Charges and Preferred Stock Dividends**
21 Subsidiaries of MDU Resources Group, Inc.**
23 Consent of Independent Registered Public Accounting Firm**
31(a) Certification of Chief Executive Officer filed pursuant to Section 302 of the Sarbanes-Oxley Act of 2002**
31(b) Certification of Chief Financial Officer filed pursuant to Section 302 of the Sarbanes-Oxley Act of 2002**
32 Certification of Chief Executive Officer and Chief Financial Officer furnished pursuant to 18 U.S.C. Section 1350, as adoptedpursuant to Section 906 of the Sarbanes-Oxley Act of 2002**
95 Mine Safety Disclosures**
99(a) Equity Distribution Agreement entered into between MDU Resources Group, Inc. and Wells Fargo Securities, LLC, filed asExhibit 1 to Form 8-K dated May 20, 2013, filed on May 20, 2013, in File No. 1-3480*
99(b) First Amendment to Equity Distribution Agreement, dated December 2, 2013, entered into between MDU Resources Group,Inc. and Wells Fargo Securities, LLC, filed as Exhibit 99(c) to Form 10-K for the year ended December 31, 2013, filed onFebruary 21, 2014, in File No. 1-3480*
101 The following materials from MDU Resources Group, Inc.'s Annual Report on Form 10-K for the year ended December 31,2015, formatted in XBRL (eXtensible Business Reporting Language): (i) the Consolidated Statements of Income, (ii) theConsolidated Statements of Comprehensive Income, (iii) the Consolidated Balance Sheets, (iv) the Consolidated Statements ofEquity, (v) the Consolidated Statements of Cash Flows, (vi) the Notes to Consolidated Financial Statements, tagged insummary and detail, (vii) Schedule I - Condensed Financial Information of Registrant, tagged in summary and detail and (viii)Schedule II - Consolidated Valuation and Qualifying Accounts, tagged in summary and detail
* Incorporated herein by reference as indicated.
** Filed herewith.
+ Management contract, compensatory plan or arrangement.
MDU Resources Group, Inc. agrees to furnish to the SEC upon request any instrument with respect to long-term debt that MDU Resources Group, Inc. hasnot filed as an exhibit pursuant to the exemption provided by Item 601(b)(4)(iii)(A) of Regulation S-K.
Part IV
MDU Resources Group, Inc. Form 10-K 115
SignaturesPursuant to the requirements of Section 13 or 15(d) of the Securities Exchange Act of 1934, the registrant has duly caused this report to be signed on its behalf by the undersigned, thereunto duly authorized.
MDU Resources Group, Inc.
Date: February 19, 2016 By: /s/ David L. Goodin
David L. Goodin(President and Chief Executive Officer)
Pursuant to the requirements of the Securities Exchange Act of 1934, this report has been signed below by the following persons on behalf of the registrant in the capacities and on the date indicated.
Signature Title Date
/s/ David L. Goodin Chief Executive Officer and Director February 19, 2016
David L. Goodin(President and Chief Executive Officer)
/s/ Doran N. Schwartz Chief Financial Officer February 19, 2016
Doran N. Schwartz(Vice President and Chief Financial Officer)
/s/ Nathan W. Ring Chief Accounting Officer February 19, 2016
Nathan W. Ring
(Vice President, Controller and Chief Accounting Officer)
/s/ Harry J. Pearce Director February 19, 2016
Harry J. Pearce(Chairman of the Board)
/s/ Thomas Everist Director February 19, 2016
Thomas Everist
/s/ Karen B. Fagg Director February 19, 2016
Karen B. Fagg
/s/ Mark A. Hellerstein Director February 19, 2016
Mark A. Hellerstein
/s/ A. Bart Holaday Director February 19, 2016
A. Bart Holaday
/s/ Dennis W. Johnson Director February 19, 2016
Dennis W. Johnson
/s/ William E. McCracken Director February 19, 2016
William E. McCracken
/s/ Patricia L. Moss Director February 19, 2016
Patricia L. Moss
/s/ John K. Wilson Director February 19, 2016
John K. Wilson
March 16, 2016
To Our Stockholders:
Please join us for the 2016 Annual Meeting of Stockholders. The meeting will be held on Tuesday, April 26, 2016, at 11:00 a.m.,Central Daylight Saving Time, at 909 Airport Road, Bismarck, North Dakota.
The formal matters are described in the accompanying Notice of Annual Meeting of Stockholders and Proxy Statement. We alsowill have a brief report on current matters of interest. Lunch will be served following the meeting.
We were pleased with the stockholder response for the 2015 Annual Meeting at which 89.82 percent of the common stock wasrepresented in person or by proxy. We hope for an even greater representation at the 2016 meeting.
You may vote your shares by telephone, by the Internet, or by returning the enclosed proxy card. Representation of your shares atthe meeting is very important. We urge you to submit your proxy promptly.
Brokers may not vote your shares on three of the four matters to be presented if you have not given your broker specificinstructions as to how to vote. Please be sure to give specific voting instructions to your broker so your vote can be counted.
All stockholders who find it convenient to do so are cordially invited and urged to attend the meeting in person. Registeredstockholders will receive a request for admission ticket(s) with their proxy card that can be completed and returned to us postage-free. Stockholders whose shares are held in the name of a bank or broker will not receive a request for admission ticket(s). Theyshould, instead: (1) call (701) 530-1000 to request an admission ticket(s), (2) obtain a statement from their bank or brokershowing proof of stock ownership as of March 1, 2016, and (3) present their admission ticket(s), the stock ownership statement, andphoto identification, such as a driver’s license, at the annual meeting. Directions to the meeting will be included with your admissionticket.
I hope you will find it possible to attend the meeting.
Sincerely yours,
David L. Goodin
MDU Resources Group, Inc. Proxy Statement

MDU RESOURCES GROUP, INC. 1200 West Century Avenue
Mailing Address: P.O. Box 5650
Bismarck, North Dakota 58506-5650 (701) 530-1000
NOTICE OF ANNUAL MEETING OF STOCKHOLDERS TO BE HELD APRIL 26, 2016
Important Notice Regarding the Availability of Proxy Materials for the Stockholder Meeting to be Held on April 26, 2016
The 2016 Notice of Annual Meeting and Proxy Statement and 2015 Annual Report to Stockholders are available at www.mdu.com/proxymaterials.
March 16, 2016
NOTICE IS HEREBY GIVEN that the Annual Meeting of Stockholders of MDU Resources Group, Inc. will be held at 909 Airport Road,Bismarck, North Dakota, on Tuesday, April 26, 2016, at 11:00 a.m., Central Daylight Saving Time, for the following purposes:
(1) Election of ten directors nominated by the board of directors for one-year terms;
(2) Approval of the material terms of the performance goals under the MDU Resources Group, Inc. Long-Term Performance-BasedIncentive Plan for purposes of Internal Revenue Code Section 162(m);
(3) Ratification of the appointment of Deloitte & Touche LLP as the company’s independent registered public accounting firm for2016;
(4) Approval, on a non-binding advisory basis, of the compensation of the company’s named executive officers; and
(5) Transaction of any other business that may properly come before the meeting or any adjournment(s) thereof.
The board of directors has set the close of business on March 1, 2016, as the record date for the determination of common stockholderswho will be entitled to notice of, and to vote at, the meeting and any adjournment(s) thereof.
All stockholders who find it convenient to do so are cordially invited and urged to attend the meeting in person. Registered stockholderswill receive a request for admission ticket(s) with their proxy card that can be completed and returned to us postage-free. Stockholderswhose shares are held in the name of a bank or broker will not receive a request for admission ticket(s). They should, instead: (1) call(701) 530-1000 to request an admission ticket(s), (2) obtain a statement from their bank or broker showing proof of stock ownership as ofMarch 1, 2016, and (3) present their admission ticket(s), the stock ownership statement, and photo identification, such as a driver’slicense, at the annual meeting. Directions to the meeting will be included with your admission ticket. We look forward to seeing you.
By order of the Board of Directors,
Daniel S. Kuntz
Secretary
Proxy Statement
MDU Resources Group, Inc. Proxy Statement
Page
Notice of Annual Meeting of Stockholders
Proxy Statement . . . . . . . . . . . . . . . . . . . . . . . . . . . . . . . . . . . . . . . . . . . . . . . . . . . . . . . . . . . . . . . . . . . . . . . . . . . . . . . . . . 1
Voting Information . . . . . . . . . . . . . . . . . . . . . . . . . . . . . . . . . . . . . . . . . . . . . . . . . . . . . . . . . . . . . . . . . . . . . . . . . . . . . 1
Item 1. Election of Directors . . . . . . . . . . . . . . . . . . . . . . . . . . . . . . . . . . . . . . . . . . . . . . . . . . . . . . . . . . . . . . . . . . . . . . 3
Director Nominees . . . . . . . . . . . . . . . . . . . . . . . . . . . . . . . . . . . . . . . . . . . . . . . . . . . . . . . . . . . . . . . . . . . . . . . . . 3
Item 2. Approval of the Material Terms of the Performance Goals under the MDU Resources Group, Inc. Long-TermPerformance-Based Incentive Plan for Purposes of Internal Revenue Code Section 162(m). . . . . . . . . . . . . . . . . . . . . . . . . . 10
Item 3. Ratification of Independent Registered Public Accounting Firm . . . . . . . . . . . . . . . . . . . . . . . . . . . . . . . . . . . . . . . 15
Accounting and Auditing Matters . . . . . . . . . . . . . . . . . . . . . . . . . . . . . . . . . . . . . . . . . . . . . . . . . . . . . . . . . . . . . . . 16
Item 4. Approval, on a Non-Binding Advisory Basis, of the Compensation of the Company’s Named Executive Officers . . . . . . 17
Executive Compensation. . . . . . . . . . . . . . . . . . . . . . . . . . . . . . . . . . . . . . . . . . . . . . . . . . . . . . . . . . . . . . . . . . . . . . . . . 18
Compensation Discussion and Analysis . . . . . . . . . . . . . . . . . . . . . . . . . . . . . . . . . . . . . . . . . . . . . . . . . . . . . . . . . . . 18
Compensation Committee Report . . . . . . . . . . . . . . . . . . . . . . . . . . . . . . . . . . . . . . . . . . . . . . . . . . . . . . . . . . . . . . . 37
Summary Compensation Table for 2015 . . . . . . . . . . . . . . . . . . . . . . . . . . . . . . . . . . . . . . . . . . . . . . . . . . . . . . . . . . 38
Grants of Plan-Based Awards in 2015. . . . . . . . . . . . . . . . . . . . . . . . . . . . . . . . . . . . . . . . . . . . . . . . . . . . . . . . . . . . 39
Outstanding Equity Awards at Fiscal Year-End 2015 . . . . . . . . . . . . . . . . . . . . . . . . . . . . . . . . . . . . . . . . . . . . . . . . . 45
Pension Benefits for 2015. . . . . . . . . . . . . . . . . . . . . . . . . . . . . . . . . . . . . . . . . . . . . . . . . . . . . . . . . . . . . . . . . . . . 46
Nonqualified Deferred Compensation for 2015 . . . . . . . . . . . . . . . . . . . . . . . . . . . . . . . . . . . . . . . . . . . . . . . . . . . . . 49
Potential Payments upon Termination or Change of Control . . . . . . . . . . . . . . . . . . . . . . . . . . . . . . . . . . . . . . . . . . . . . 50
Director Compensation for 2015 . . . . . . . . . . . . . . . . . . . . . . . . . . . . . . . . . . . . . . . . . . . . . . . . . . . . . . . . . . . . . . . 55
Information Concerning Executive Officers . . . . . . . . . . . . . . . . . . . . . . . . . . . . . . . . . . . . . . . . . . . . . . . . . . . . . . . . . . . . 58
Security Ownership . . . . . . . . . . . . . . . . . . . . . . . . . . . . . . . . . . . . . . . . . . . . . . . . . . . . . . . . . . . . . . . . . . . . . . . . . . . . 60
Related Person Transaction Disclosure . . . . . . . . . . . . . . . . . . . . . . . . . . . . . . . . . . . . . . . . . . . . . . . . . . . . . . . . . . . . . . . 62
Corporate Governance . . . . . . . . . . . . . . . . . . . . . . . . . . . . . . . . . . . . . . . . . . . . . . . . . . . . . . . . . . . . . . . . . . . . . . . . . . 62
Section 16(a) Beneficial Ownership Reporting Compliance . . . . . . . . . . . . . . . . . . . . . . . . . . . . . . . . . . . . . . . . . . . . . . . . 69
Conduct of Meeting; Adjournment . . . . . . . . . . . . . . . . . . . . . . . . . . . . . . . . . . . . . . . . . . . . . . . . . . . . . . . . . . . . . . . . . . 69
Other Business . . . . . . . . . . . . . . . . . . . . . . . . . . . . . . . . . . . . . . . . . . . . . . . . . . . . . . . . . . . . . . . . . . . . . . . . . . . . . . . 69
Shared Address Stockholders . . . . . . . . . . . . . . . . . . . . . . . . . . . . . . . . . . . . . . . . . . . . . . . . . . . . . . . . . . . . . . . . . . . . . 69
2017 Annual Meeting of Stockholders . . . . . . . . . . . . . . . . . . . . . . . . . . . . . . . . . . . . . . . . . . . . . . . . . . . . . . . . . . . . . . . 69
Exhibit A - MDU Resources Group, Inc. Long-Term Performance-Based Incentive Plan . . . . . . . . . . . . . . . . . . . . . . . . . . . . . . . . A-1
Exhibit B - Companies that Participated in the Compensation Surveys used by Towers Watson . . . . . . . . . . . . . . . . . . . . . . . . . . . B-1
Proxy Statement
MDU Resources Group, Inc. Proxy Statement
PROXY STATEMENT
The board of directors of MDU Resources Group, Inc. is furnishing this proxy statement beginning March 16, 2016, to solicit your proxy foruse at our annual meeting of stockholders on April 26, 2016, and any adjournment(s) thereof. We are soliciting proxies principally by mail,but directors, officers, and employees of MDU Resources Group, Inc. or its subsidiaries may solicit proxies personally, by telephone or byelectronic media, without compensation other than their regular compensation. Okapi Partners LLC additionally will solicit proxies forapproximately $8,000 plus out-of-pocket expenses. We will pay the cost of soliciting your proxy and reimburse brokers and others forforwarding proxy materials to you.
The Securities and Exchange Commission’s e-proxy rules allow companies to post their proxy materials on the Internet and provide only aNotice of Internet Availability of Proxy Materials to stockholders as an alternative to mailing full sets of proxy materials except upon request.For 2016, we have elected to use the Securities and Exchange Commission’s full set delivery option, which means that while we are postingour proxy materials online, we are also mailing a full set of our proxy materials to our stockholders. We believe that mailing a full set of proxymaterials will help ensure that a majority of outstanding shares of our common stock are present in person or represented by proxy at ourmeeting. We also hope to help maximize stockholder participation. Therefore, even if you previously consented to receiving your proxymaterials electronically, you will receive a full set of proxy materials in the mail for this year’s annual meeting. However, we will continue toevaluate the option of providing only a Notice of Internet Availability of Proxy Materials to some or all of our stockholders in the future.
VOTING INFORMATION
Who may vote? You may vote if you owned shares of our common stock at the close of business on March 1, 2016. You may vote each sharethat you owned on that date on each matter presented at the meeting and any adjournment(s) thereof. As of March 1, 2016, we had195,304,376 shares of common stock outstanding entitled to one vote per share.
What am I voting on? You are voting on:
• election of ten directors nominated by the board of directors for one-year terms
• approval of the material terms of the performance goals under the MDU Resources Group, Inc. Long-Term Performance-Based IncentivePlan for purposes of Internal Revenue Code Section 162(m)
• ratification of the appointment of Deloitte & Touche LLP as the company’s independent registered public accounting firm for 2016
• approval, on a non-binding advisory basis, of the compensation of the company’s named executive officers and
• any other business that is properly brought before the meeting or any adjournment(s) thereof.
What vote is required to pass an item of business? A majority of our outstanding shares of common stock entitled to vote must be present inperson or represented by proxy to hold the meeting.
If you hold shares through an account with a bank or broker, the bank or broker may vote your shares on some matters even if you do notprovide voting instructions. Brokerage firms have the authority under the New York Stock Exchange rules to vote shares on certain matterswhen their customers do not provide voting instructions. However, on other matters, when the brokerage firm has not received votinginstructions from its customers, the brokerage firm cannot vote the shares on those matters and a “broker non-vote” occurs. This means thatbrokers may not vote your shares on items 1, 2, and 4 if you have not given your broker specific instructions as to how to vote. Please be sure togive specific voting instructions to your broker so your vote can be counted.
Item 1 – Election of DirectorsA majority of votes cast is required to elect a director in an uncontested election. A majority of votes cast means the number of votes cast“for” a director’s election must exceed the number of votes cast “against” the director’s election. “Abstentions” and “broker non-votes” donot count as votes cast “for” or “against” the director’s election. In a contested election, which is an election in which the number ofnominees for director exceeds the number of directors to be elected, directors will be elected by a plurality of the votes cast. If a nomineebecomes unavailable for any reason or if a vacancy should occur before the election, which we do not anticipate, the proxies may vote yourshares in their discretion for another person nominated by the board.
Proxy Statement
MDU Resources Group, Inc. Proxy Statement 1
Our policy on majority voting for directors contained in our corporate governance guidelines requires any proposed nominee for re-election asa director to tender to the board, prior to nomination, his or her irrevocable resignation from the board that will be effective, in anuncontested election of directors only, upon:
• receipt of a greater number of votes “against” than votes “for” election at our annual meeting of stockholders and
• acceptance of such resignation by the board of directors.
Following certification of the stockholder vote, the nominating and governance committee will promptly recommend to the board whether ornot to accept the tendered resignation. The board will act on the nominating and governance committee’s recommendation no later than 90days following the date of the annual meeting.
Item 2 - Approval of the Material Terms of the Performance Goals under the MDU Resources Group, Inc. Long-TermPerformance-Based Incentive Plan for Purposes of Internal Revenue Code Section 162(m)For purposes of Internal Revenue Code Section 162(m), approval of Item 2 requires a majority of votes cast to be in favor of approval.Broker non-vote shares and abstentions will not count as votes cast.
Item 3 – Ratification of the Appointment of Deloitte & Touche LLP as the Company’s Independent Registered Public AccountingFirm for 2016 Approval of Item 3 requires the affirmative vote of a majority of our common stock present in person or represented by proxy at the meetingand entitled to vote on the item. Abstentions will count as votes “against” the item.
Item 4 – Approval, on a Non-Binding Advisory Basis, of the Compensation of the Company’s Named Executive OfficersApproval of Item 4 requires the affirmative vote of a majority of our common stock present in person or represented by proxy at the meetingand entitled to vote on the item. Abstentions will count as votes “against” the item. Broker non-vote shares are not entitled to vote on theitem and, therefore, are not counted in the vote.
Unless you specify otherwise when you submit your proxy, the proxies will vote your shares of common stock “for” all directors nominated bythe board of directors and “for” items 2, 3, and 4.
How do I vote? If you are a stockholder of record, you may vote by:
• calling the toll free telephone number on the enclosed proxy card
• using the Internet as described on the enclosed proxy card or
• returning the enclosed proxy card in the envelope provided.
If you are a beneficial owner, you must provide voting instructions to your bank, broker, or other nominee to ensure your shares are voted asyou would like. You should follow their instructions.
You may also vote in person at the meeting. However, if you are the beneficial owner of the shares, you must obtain a legal proxy from yourbank or broker and present it at the meeting. A legal proxy identifies you, states the number of shares you own, and gives you the right tovote those shares. Without a legal proxy we cannot identify you as the beneficial owner of the shares or know how many shares you have tovote.
Can I change my vote? Yes.
If you are a beneficial owner, such as where your shares are held of record by a bank, broker, or other nominee, you may change your vote byproviding later dated voting instructions to your bank, broker, or other nominee in accordance with their procedures or by obtaining a legalproxy and voting in person at the meeting, as set forth above.
If you are a stockholder of record, you may revoke your proxy and change your vote by:
• submitting a written revocation to the corporate secretary before the meeting
• submitting a proxy bearing a later date to the corporate secretary before the meeting or
• voting in person at the meeting.
Proxy Statement
2 MDU Resources Group, Inc. Proxy Statement
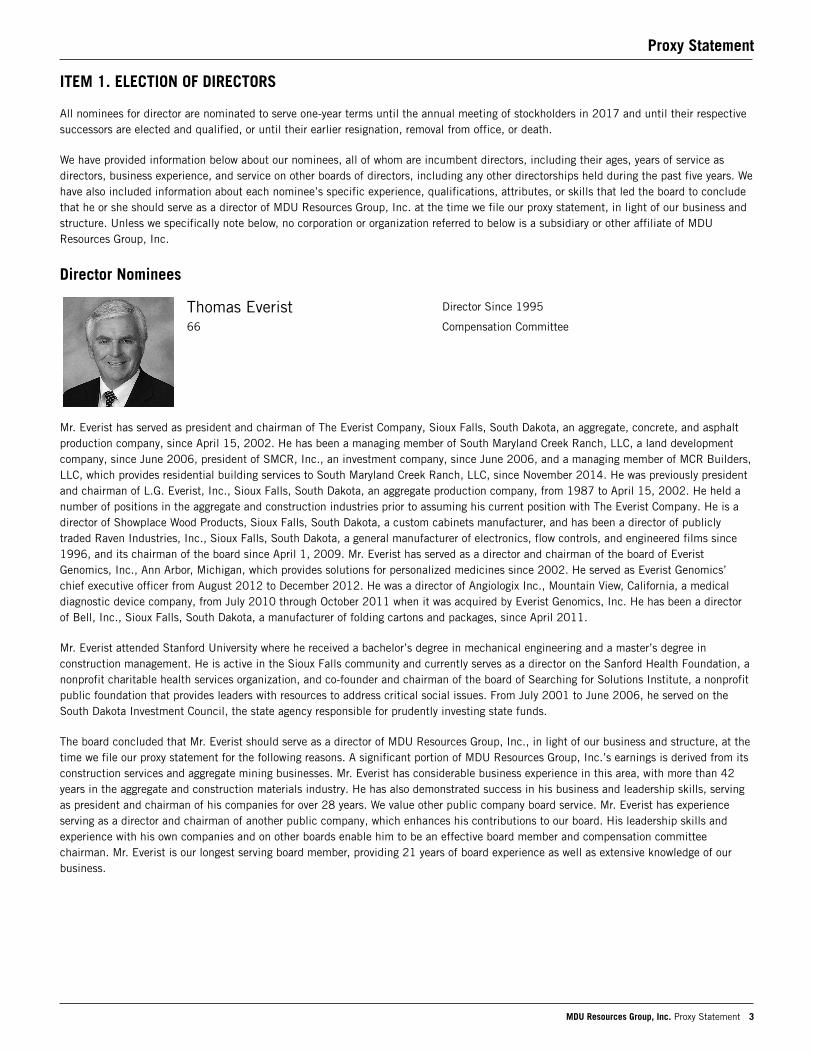
ITEM 1. ELECTION OF DIRECTORS
All nominees for director are nominated to serve one-year terms until the annual meeting of stockholders in 2017 and until their respectivesuccessors are elected and qualified, or until their earlier resignation, removal from office, or death.
We have provided information below about our nominees, all of whom are incumbent directors, including their ages, years of service asdirectors, business experience, and service on other boards of directors, including any other directorships held during the past five years. Wehave also included information about each nominee’s specific experience, qualifications, attributes, or skills that led the board to concludethat he or she should serve as a director of MDU Resources Group, Inc. at the time we file our proxy statement, in light of our business andstructure. Unless we specifically note below, no corporation or organization referred to below is a subsidiary or other affiliate of MDUResources Group, Inc.
Director Nominees
Thomas Everist Director Since 1995
66 Compensation Committee
Mr. Everist has served as president and chairman of The Everist Company, Sioux Falls, South Dakota, an aggregate, concrete, and asphaltproduction company, since April 15, 2002. He has been a managing member of South Maryland Creek Ranch, LLC, a land developmentcompany, since June 2006, president of SMCR, Inc., an investment company, since June 2006, and a managing member of MCR Builders,LLC, which provides residential building services to South Maryland Creek Ranch, LLC, since November 2014. He was previously presidentand chairman of L.G. Everist, Inc., Sioux Falls, South Dakota, an aggregate production company, from 1987 to April 15, 2002. He held anumber of positions in the aggregate and construction industries prior to assuming his current position with The Everist Company. He is adirector of Showplace Wood Products, Sioux Falls, South Dakota, a custom cabinets manufacturer, and has been a director of publiclytraded Raven Industries, Inc., Sioux Falls, South Dakota, a general manufacturer of electronics, flow controls, and engineered films since1996, and its chairman of the board since April 1, 2009. Mr. Everist has served as a director and chairman of the board of EveristGenomics, Inc., Ann Arbor, Michigan, which provides solutions for personalized medicines since 2002. He served as Everist Genomics’chief executive officer from August 2012 to December 2012. He was a director of Angiologix Inc., Mountain View, California, a medicaldiagnostic device company, from July 2010 through October 2011 when it was acquired by Everist Genomics, Inc. He has been a directorof Bell, Inc., Sioux Falls, South Dakota, a manufacturer of folding cartons and packages, since April 2011.
Mr. Everist attended Stanford University where he received a bachelor’s degree in mechanical engineering and a master’s degree inconstruction management. He is active in the Sioux Falls community and currently serves as a director on the Sanford Health Foundation, anonprofit charitable health services organization, and co-founder and chairman of the board of Searching for Solutions Institute, a nonprofitpublic foundation that provides leaders with resources to address critical social issues. From July 2001 to June 2006, he served on theSouth Dakota Investment Council, the state agency responsible for prudently investing state funds.
The board concluded that Mr. Everist should serve as a director of MDU Resources Group, Inc., in light of our business and structure, at thetime we file our proxy statement for the following reasons. A significant portion of MDU Resources Group, Inc.’s earnings is derived from itsconstruction services and aggregate mining businesses. Mr. Everist has considerable business experience in this area, with more than 42years in the aggregate and construction materials industry. He has also demonstrated success in his business and leadership skills, servingas president and chairman of his companies for over 28 years. We value other public company board service. Mr. Everist has experienceserving as a director and chairman of another public company, which enhances his contributions to our board. His leadership skills andexperience with his own companies and on other boards enable him to be an effective board member and compensation committeechairman. Mr. Everist is our longest serving board member, providing 21 years of board experience as well as extensive knowledge of ourbusiness.
Proxy Statement
MDU Resources Group, Inc. Proxy Statement 3
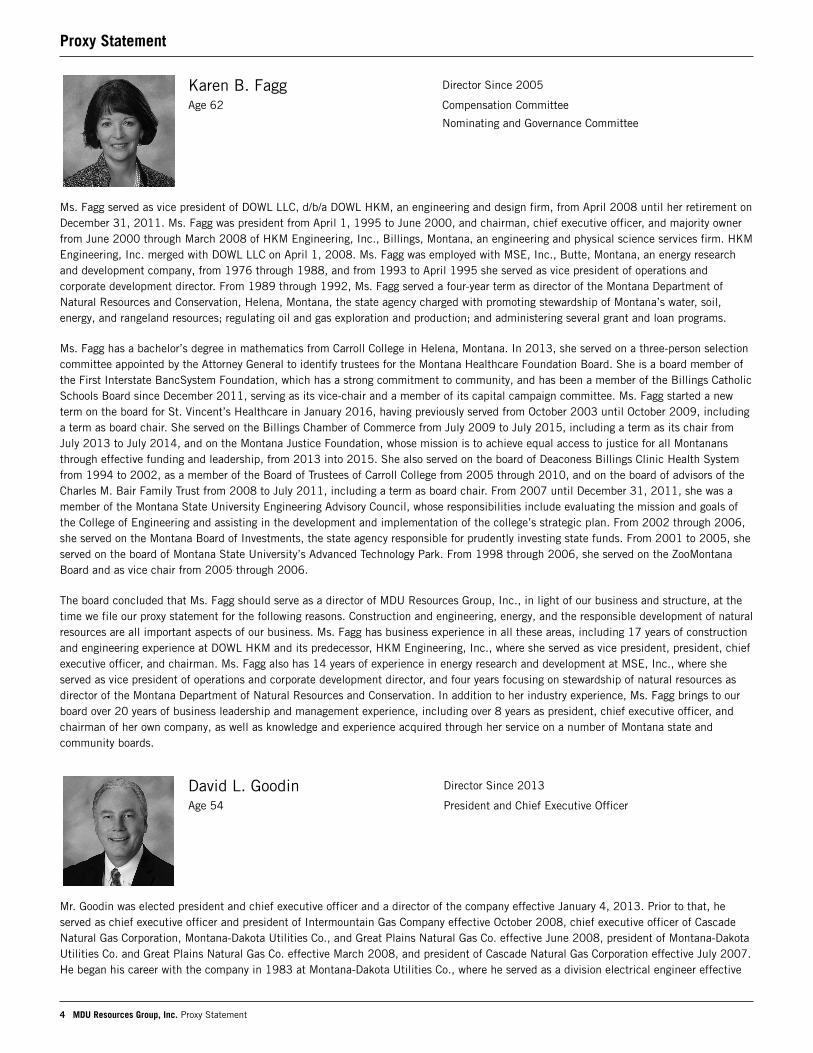
Karen B. Fagg Director Since 2005
Age 62 Compensation Committee
Nominating and Governance Committee
Ms. Fagg served as vice president of DOWL LLC, d/b/a DOWL HKM, an engineering and design firm, from April 2008 until her retirement onDecember 31, 2011. Ms. Fagg was president from April 1, 1995 to June 2000, and chairman, chief executive officer, and majority ownerfrom June 2000 through March 2008 of HKM Engineering, Inc., Billings, Montana, an engineering and physical science services firm. HKMEngineering, Inc. merged with DOWL LLC on April 1, 2008. Ms. Fagg was employed with MSE, Inc., Butte, Montana, an energy researchand development company, from 1976 through 1988, and from 1993 to April 1995 she served as vice president of operations andcorporate development director. From 1989 through 1992, Ms. Fagg served a four-year term as director of the Montana Department ofNatural Resources and Conservation, Helena, Montana, the state agency charged with promoting stewardship of Montana’s water, soil,energy, and rangeland resources; regulating oil and gas exploration and production; and administering several grant and loan programs.
Ms. Fagg has a bachelor’s degree in mathematics from Carroll College in Helena, Montana. In 2013, she served on a three-person selectioncommittee appointed by the Attorney General to identify trustees for the Montana Healthcare Foundation Board. She is a board member ofthe First Interstate BancSystem Foundation, which has a strong commitment to community, and has been a member of the Billings CatholicSchools Board since December 2011, serving as its vice-chair and a member of its capital campaign committee. Ms. Fagg started a newterm on the board for St. Vincent’s Healthcare in January 2016, having previously served from October 2003 until October 2009, includinga term as board chair. She served on the Billings Chamber of Commerce from July 2009 to July 2015, including a term as its chair fromJuly 2013 to July 2014, and on the Montana Justice Foundation, whose mission is to achieve equal access to justice for all Montanansthrough effective funding and leadership, from 2013 into 2015. She also served on the board of Deaconess Billings Clinic Health Systemfrom 1994 to 2002, as a member of the Board of Trustees of Carroll College from 2005 through 2010, and on the board of advisors of theCharles M. Bair Family Trust from 2008 to July 2011, including a term as board chair. From 2007 until December 31, 2011, she was amember of the Montana State University Engineering Advisory Council, whose responsibilities include evaluating the mission and goals ofthe College of Engineering and assisting in the development and implementation of the college’s strategic plan. From 2002 through 2006,she served on the Montana Board of Investments, the state agency responsible for prudently investing state funds. From 2001 to 2005, sheserved on the board of Montana State University’s Advanced Technology Park. From 1998 through 2006, she served on the ZooMontanaBoard and as vice chair from 2005 through 2006.
The board concluded that Ms. Fagg should serve as a director of MDU Resources Group, Inc., in light of our business and structure, at thetime we file our proxy statement for the following reasons. Construction and engineering, energy, and the responsible development of naturalresources are all important aspects of our business. Ms. Fagg has business experience in all these areas, including 17 years of constructionand engineering experience at DOWL HKM and its predecessor, HKM Engineering, Inc., where she served as vice president, president, chiefexecutive officer, and chairman. Ms. Fagg also has 14 years of experience in energy research and development at MSE, Inc., where sheserved as vice president of operations and corporate development director, and four years focusing on stewardship of natural resources asdirector of the Montana Department of Natural Resources and Conservation. In addition to her industry experience, Ms. Fagg brings to ourboard over 20 years of business leadership and management experience, including over 8 years as president, chief executive officer, andchairman of her own company, as well as knowledge and experience acquired through her service on a number of Montana state andcommunity boards.
David L. Goodin Director Since 2013
Age 54 President and Chief Executive Officer
Mr. Goodin was elected president and chief executive officer and a director of the company effective January 4, 2013. Prior to that, heserved as chief executive officer and president of Intermountain Gas Company effective October 2008, chief executive officer of CascadeNatural Gas Corporation, Montana-Dakota Utilities Co., and Great Plains Natural Gas Co. effective June 2008, president of Montana-DakotaUtilities Co. and Great Plains Natural Gas Co. effective March 2008, and president of Cascade Natural Gas Corporation effective July 2007.He began his career with the company in 1983 at Montana-Dakota Utilities Co., where he served as a division electrical engineer effective
Proxy Statement
4 MDU Resources Group, Inc. Proxy Statement
May 1983, division electric superintendent effective February 1989, electric systems supervisor effective August 1993, electric systemsmanager effective April 1999, vice president-operations effective January 2000, and executive vice president-operations and acquisitionseffective January 2007. He additionally serves as an executive officer and as chairman of the company’s principal subsidiaries, and of themanaging committees of Montana-Dakota Utilities Co. and Great Plains Natural Gas Co.
Mr. Goodin has a bachelor of science degree in electrical and electronics engineering from North Dakota State University, a masters inbusiness administration from the University of North Dakota, and has completed the Advanced Management Program at Harvard School ofBusiness. Mr. Goodin is a registered professional engineer in North Dakota. He is a member of the U.S. Bancorp Western North DakotaAdvisory Board. Mr. Goodin is involved in numerous civic organizations, including serving on the board of directors of Sanford Bismarck, anintegrated health system dedicated to the work of health and healing, Sanford Living Center, and the North Dakota State University AlumniAssociation. He also serves on the Board of Trustees for the Missouri Valley YMCA, the Bismarck State College Foundation, and theUniversity of Mary. He is a past board member of several industry associations, including the American Gas Association, the Edison ElectricInstitute, the North Central Electric Association, the Midwest ENERGY Association, and the North Dakota Lignite Council. Mr. Goodinreceived the University of Mary Entrepreneurship Award in 2009.
The board concluded that Mr. Goodin should serve as a director of MDU Resources Group, Inc., in light of our business and structure, at thetime we file our proxy statement for the following reasons. As chief executive officer of MDU Resources Group, Inc., Mr. Goodin is the onlyofficer of the company on our board. With over 32 years of significant, hands-on experience at our company, Mr. Goodin’s long history anddeep knowledge and understanding of MDU Resources Group, Inc., its operating companies, and its lines of business bring continuity to theboard. Mr. Goodin has demonstrated his leadership abilities and his commitment to our company through his long service to the company,including as chief executive officer and president of the four utility companies. He demonstrated strong leadership skills in integratingCascade Natural Gas Corporation and Intermountain Gas Company while meeting and exceeding profitability goals. The board’s unanimouselection of Mr. Goodin to serve as our president and chief executive officer in January 2013 was in recognition of the board’s belief that hehas the strategic vision, operational experience, passion, and values to lead the future growth of the company. The board believes thesecharacteristics make him well-suited to serve on our board, particularly in this challenging economic environment.
Mark A. Hellerstein Director Since 2013
Age 63 Audit Committee
Mr. Hellerstein was chief executive officer of St. Mary Land & Exploration Company (now SM Energy Company), an energy company engagedin the acquisition, exploration, development, and production of crude oil, natural gas, and natural gas liquids, from 1995 until February2007; he was president from 1992 until June 2006 and executive vice president and chief financial officer from 1991 until 1992. He wasfirst elected to the board of St. Mary in 1992 and served as chairman of the board from 2002 until May 2009. Prior to joining St. Mary,from 1980 to 1991 Mr. Hellerstein’s career included positions as chief financial officer of CoCa Mines Inc., which mined and extractedminerals from lands previously held by the public through the Bureau of Land Management; American Golf Corporation, which manages andowns golf courses in the United States; and Worldwide Energy Corporation, an oil and gas acquisition, exploration, development, andproduction company with operations in the United States and Canada. Mr. Hellerstein served on the board of directors of Transocean Inc., aleading provider of offshore drilling services for oil and gas wells, from December 2006 to November 2007.
Mr. Hellerstein’s leadership has been recognized with induction into the Rocky Mountain Oil and Gas Hall of Fame, and Ernst & Youngnamed Mr. Hellerstein both Rocky Mountain and National Entrepreneur of the Year in 2005 and 2006, respectively. He graduated numberone in his class with a bachelor’s degree in accounting from the University of Colorado. Mr. Hellerstein is a certified public accountant(CPA), on inactive status. He received the Elijah Watts Sells Gold Medal award for achieving the highest score in the United States on theNovember 1974 CPA exam out of 38,000 participants. Mr. Hellerstein has served on the board for Community Resources Inc. sinceSeptember 2013, which is a nonprofit organization that brings programs into the Denver Public Schools to enhance education. He served asa board director on the Denver Children’s Advocacy Center (Center) from August 2006 until December 2011, including as chairman for thelast three years, and continues to participate in and fund the Center’s Safe from the Start Program. The Center’s mission is to provide acontinuum of care for traumatized children and their families.
The board concluded that Mr. Hellerstein should serve as a director of MDU Resources Group, Inc., in light of our business and structure, atthe time we file our proxy statement for the following reasons. Mr. Hellerstein has extensive business experience, recognized excellence, anddemonstrated success and leadership, including in the energy industry, as a result of his 17 years of senior management experience and
Proxy Statement
MDU Resources Group, Inc. Proxy Statement 5
service as board chairman of St. Mary. His skills and experience enable him to contribute independent insight into the company’s businessand operations and the economic environment and long-term strategic issues the company faces. As a certified public accountant, oninactive status, with extensive financial experience as a result of his employment as chief financial officer with several companies, includingpublic companies, Mr. Hellerstein contributes significant finance and accounting knowledge to our board and audit committee. His financialexpertise assists the board in its oversight of the company’s financial reporting and financial risk management functions, and supports hisservice on the audit committee. His service on the board of two publicly traded companies has provided him substantial insight intogovernance matters, which enhances his contributions to our board. Mr. Hellerstein also brings to the board his knowledge of local, state,and regional issues involving the Rocky Mountain region where we have important operations.
A. Bart Holaday Director Since 2008
Age 73 Audit Committee
Nominating and Governance Committee
Mr. Holaday headed the Private Markets Group of UBS Asset Management and its predecessor entities for 15 years prior to his retirement in2001, during which time he managed more than $19 billion in investments. Prior to that he was vice president and principal of the InnoVenVenture Capital Group, a venture capital investment firm. He was founder and president of Tenax Oil and Gas Corporation, an onshore GulfCoast exploration and production company, from 1980 through 1982. He has four years of senior management experience with Gulf OilCorporation, a global energy and petrochemical company, and eight years of senior management experience with the federal government,including the Department of Defense, Department of the Interior, and the Federal Energy Administration. He is currently the president andowner of Dakota Renewable Energy Fund, LLC, which invests in small companies in North Dakota. He is a member of the investmentadvisory board of Commons Capital LLC, a venture capital firm; is a director of Hull Investments, LLC, a private entity that combinesnonprofit activities and investments; serves on the Board of Trustees for the University of Jamestown; is a member of the board of directorsof Adams Street Partners, LLC, a private equity investment firm, Alerus Financial, a financial services company, the United States Air ForceAcademy Endowment (former chairman), the Falcon Foundation (director and former vice president), which provides scholarships to AirForce Academy applicants, the Center for Innovation Foundation at the University of North Dakota (trustee and former chairman), andDiscover Goodwill of southern and western Colorado, a nonprofit organization providing job training, placement, and retention programs forpeople transitioning from welfare to work; and is chairman and chief executive officer of the Dakota Foundation, a nonprofit foundation thatfosters social entrepreneurship. He is a past member of the board of directors of the University of North Dakota Foundation, NationalVenture Capital Association, Walden University, and the U.S. Securities and Exchange Commission advisory committee on the regulation ofcapital markets, and is a past member of the board of trustees for The Colorado Springs Child Nursery Centers Foundation, a nonprofitorganization that supports the operations of Early Connections Learning Centers, a nonprofit child care organization in Colorado.
Mr. Holaday has a bachelor’s degree in engineering sciences from the U.S. Air Force Academy. He was a Rhodes Scholar, earning abachelor’s degree and a master’s degree in politics, philosophy, and economics from Oxford University. He also earned a law degree fromGeorge Washington Law School and is a Chartered Financial Analyst. In 2005, he was awarded an honorary Doctor of Letters from theUniversity of North Dakota.
The board concluded that Mr. Holaday should serve as a director of MDU Resources Group, Inc., in light of our business and structure, atthe time we file our proxy statement for the following reasons. Mr. Holaday has extensive business knowledge and experience and hasdemonstrated success and leadership, including in the energy and financial management industries. He founded and served as president ofTenax Oil and Gas Corporation. He has four years experience in senior management with Gulf Oil Corporation and 15 years of experiencemanaging private equity investments, as the head of the Private Markets Group of UBS Asset Management and its predecessororganizations. Mr. Holaday brings to the board extensive finance and investment experience, as well as business development skills acquiredthrough his work at UBS Asset Management, Tenax Oil and Gas Corporation, Gulf Oil Corporation, and several private equity investmentfirms. This enhances the knowledge of the board and provides useful insights and guidance to management in connection not only with ourenergy related businesses, but with all of our businesses. His significant experience in finance supports his service on the audit committee.
Proxy Statement
6 MDU Resources Group, Inc. Proxy Statement
Dennis W. Johnson Director Since 2001
Age 66 Audit Committee
Mr. Johnson is chairman, president, and chief executive officer of TMI Corporation, and chairman and chief executive officer of TMISystems Design Corporation, TMI Transport Corporation, and TMI Storage Systems Corporation, all of Dickinson, North Dakota,manufacturers of casework and architectural woodwork. He has been employed at TMI since 1974 serving as president or chief executiveofficer since 1982. Mr. Johnson served as president of the Dickinson City Commission for fifteen years. He served as a director of theFederal Reserve Bank of Minneapolis from 1993 through 1998. He is a past member and chairman of the Theodore Roosevelt MedoraFoundation.
Mr. Johnson has a bachelor of science degree in electrical and electronics engineering, as well as a master of science degree in industrialengineering from North Dakota State University. He has served on numerous industry, state, and community boards, including the NorthDakota Workforce Development Council (chairperson), the Decorative Laminate Products Association, the North Dakota TechnologyCorporation, St. Joseph Hospital Life Care Foundation, St. John Evangelical Lutheran Church, Dickinson State University Foundation, theexecutive operations committee of the University of Mary Harold Schafer Leadership Center, the Dickinson United Way, and the businessadvisory council of the Steffes Corporation, a metal manufacturing and engineering firm. He also served on North Dakota Governor Sinner’sEducation Action Commission, the North Dakota Job Service Advisory Council, the North Dakota State University President’s AdvisoryCouncil, North Dakota Governor Schafer’s Transition Team, and chaired North Dakota Governor Hoeven’s Transition Team. He has receivednumerous awards, including the 1991 Regional Small Business Person of the Year Award and the Greater North Dakotan Award.
The board concluded that Mr. Johnson should serve as a director of MDU Resources Group, Inc., in light of our business and structure, atthe time we file our proxy statement for the following reasons. Mr. Johnson has over 41 years of experience in business management,manufacturing, and finance, and has demonstrated his success in these areas, holding positions as chairman, president, and chief executiveofficer of TMI for 34 years, as well as through his prior service as a director of the Federal Reserve Bank of Minneapolis. His financeexperience and leadership skills enable him to make valuable contributions to our audit committee, which he has chaired for twelve years.As a result of his service on a number of state and local organizations in North Dakota, Mr. Johnson has significant knowledge of local,state, and regional issues involving North Dakota, a state where we have significant operations and assets.
William E. McCracken Director Since 2013
Age 73 Compensation Committee
Nominating and Governance Committee
Mr. McCracken served as chief executive officer of CA, Inc., one of the world’s largest information technology management softwarecompanies, from January 2010 until January 7, 2013, after which he served as executive adviser to the new chief executive officer untilMarch 31, 2013, and after that as a consultant to the company until December 31, 2013. Mr. McCracken was a director of CA, Inc. fromMay 2005 until January 7, 2013, serving as non-executive chairman of the board from June 2007 to September 2009, interim executivechairman from September 2009 to January 2010, and executive chairman from January 2010 to May 2010. He is president of ExecutiveConsulting Group, LLC, a general business consulting firm, since 2002. During his 36-year career with International Business MachinesCorporation, a manufacturer of information processing products and a technology, software, and networking systems manufacturer anddeveloper, Mr. McCracken held a number of executive positions, including general manager of IBM printing systems division from 1998 to2001, general manager of marketing, sales, and distribution for IBM PC Company from 1994 to 1998, and president of IBM’s EMEA andAsia Pacific PC Company from 1993 to 1994. From 1995 to 2001, he served on IBM’s Chairman’s Worldwide Management Council, agroup of the top 30 executives at IBM. Mr. McCracken was a director of IKON Office Solutions, Inc., a provider of document managementsystems and services, from 2003 to 2008, where he served on its audit committee, compensation committee, and strategy committee atvarious points in time during his tenure as a director.
Proxy Statement
MDU Resources Group, Inc. Proxy Statement 7
Mr. McCracken has a bachelor of science degree in physics and mathematics from Shippensburg University. He has served on the board ofthe National Association of Corporate Directors (NACD), a nonprofit membership organization for corporate board members, since 2010, andwas named by the NACD as one of the top 100 most influential people in the boardroom in 2009. He served on that organization’s 2009blue ribbon commission on risk governance, co-chaired its blue ribbon commission on board diversity in 2012, and co-chaired its blueribbon commission on the board and long-term value creation in 2015. He is chair of the advisory board of the Millstein Center for GlobalMarkets and Corporate Ownership at Columbia University where he has been a member since 2013 and has been the New York chairman ofthe Chairmen’s Forum since 2011. He is board chairman of Lutheran Social Ministries of New Jersey, a charitable organization thatprovides adoption, assisted living, counseling, and immigration and refugee services, and is a former board member of PENCIL, a nonprofitorganization that partners businesses with public schools.
The board concluded that Mr. McCracken should serve as a director of MDU Resources Group, Inc., in light of our business and structure, atthe time we file our proxy statement for the following reasons. Mr. McCracken has extensive executive leadership experience and significantexperience in information technology and cybersecurity through his tenure at CA, Inc. and IBM. This experience coupled with his service asthe chair or a member of the board of other public companies and the NACD will enable him to provide insight into the operations,challenges, and complex issues our company is facing in today’s environment and to make significant contributions to the board’s oversightof operational risk management functions and corporate governance.
Patricia L. Moss Director Since 2003
Age 62 Compensation Committee
Nominating and Governance Committee
Ms. Moss served as the president and chief executive officer of Cascade Bancorp, a financial holding company in Bend, Oregon, from 1998to January 3, 2012. She served as the chief executive officer of Cascade Bancorp’s principal subsidiary, Bank of the Cascades, from 1998to January 3, 2012, serving also as president from 1998 to 2003. From 1987 to 1998, Ms. Moss served as chief operating officer, chieffinancial officer, and corporate secretary of Cascade Bancorp. Ms. Moss has been a director of Cascade Bancorp and Bank of the Cascadessince 1993 and was elected vice chair of both boards effective January 3, 2012. Ms. Moss also serves as chair of the Bank of the CascadesFoundation Inc., co-chairs the Oregon Growth Board, a state board created to improve access to capital and create private-publicpartnerships, and serves on the Board of Trustees for the Aquila Tax Free Trust of Oregon, a mutual fund created especially for the benefit ofOregon residents.
Ms. Moss graduated magna cum laude with a bachelor of science degree in business administration from Linfield College in Oregon and didmaster’s studies at Portland State University. She received commercial banking school certification at the ABA Commercial Banking Schoolat the University of Oklahoma. She served as a director of the Oregon Investment Fund Advisory Council, a state-sponsored program toencourage the growth of small businesses within Oregon; Oregon Business Council, whose mission is to mobilize business leaders tocontribute to Oregon’s quality of life and economic prosperity; the Cascades Campus Advisory Board of the Oregon State University; theNorth Pacific Group, Inc., a wholesale distributor of building materials, industrial and hardwood products, and other specialty products;Clear Choice Health Plans Inc., a multi-state insurance company; and the St. Charles Medical Center. She also served on the City of Bend’sJuniper Ridge management advisory board.
The board concluded that Ms. Moss should serve as a director of MDU Resources Group, Inc., in light of our business and structure, at thetime we file our proxy statement for the following reasons. A significant portion of MDU Resources Group, Inc.’s utility, constructionservices, and contracting operations are located in the Pacific Northwest. Ms. Moss has first-hand business experience and knowledge of thePacific Northwest economy and local, state, and regional issues through her executive positions at Cascade Bancorp and Bank of theCascades, where she gained over 30 years of experience. Ms. Moss provides to our board her experience in finance and banking, as well asher experience in business development through her work at Cascade Bancorp and on the Oregon Investment Fund Advisory Council, theOregon Business Council, and the Oregon Growth Board. This business experience demonstrates her leadership abilities and success in thefinance and banking industry. Ms. Moss has 18 years of experience as a certified senior professional in human resources, which makes herwell-suited for our compensation committee.
Proxy Statement
8 MDU Resources Group, Inc. Proxy Statement
Harry J. Pearce Director Since 1997
Age 73 Chairman of the Board
Mr. Pearce was elected chairman of the board of the company on August 17, 2006. Prior to that, he served as lead director effectiveFebruary 15, 2001, and was vice chairman of the board from November 16, 2000 until February 15, 2001. Mr. Pearce was a director andserved on the audit, finance, compensation, and excellence committees of Marriott International, Inc., a major hotel chain, from 1995 toMay 2015. He also was a director of Nortel Networks Corporation, a global telecommunications company, from January 11, 2005 toAugust 10, 2009, serving as chairman of the board from June 29, 2005. He retired on December 19, 2003, as chairman of HughesElectronics Corporation, a General Motors Corporation subsidiary and provider of digital television entertainment, broadband satellitenetwork, and global video and data broadcasting. He had served as a director of Hughes Electronics since 1992. Mr. Pearce was vicechairman and a director of General Motors Corporation, one of the world’s largest automakers, from January 1, 1996 to May 31, 2001, andwas general counsel from 1987 to 1994. He served on the President’s Council on Sustainable Development and co-chaired the President’sCommission on the United States Postal Service. Prior to joining General Motors, he was a senior partner in the Pearce & Durick law firm inBismarck, North Dakota. Mr. Pearce is a director of the United States Air Force Academy Endowment and a trustee of NorthwesternUniversity. He is a Fellow of the American College of Trial Lawyers and a member of the International Society of Barristers. He has served asa chairman or director on the boards of numerous nonprofit organizations, including as chairman of the Board of Visitors of the U.S. AirForce Academy, chairman of the U.S. Air Force Academy Sabre Society, chairman of the National Defense University Foundation, andchairman of the Marrow Foundation. Mr. Pearce received a bachelor’s degree in engineering sciences from the U.S. Air Force Academy anda juris doctor degree from Northwestern University’s School of Law. He received an honorary degree of Doctor of Laws from NorthwesternUniversity and an honorary degree of Doctor of Engineering from Rose Hulman Institute of Technology.
The board concluded that Mr. Pearce should serve as a director of MDU Resources Group, Inc., in light of our business and structure, at thetime we file our proxy statement for the following reasons. MDU Resources Group, Inc. values public company leadership and the experiencedirectors gain through such leadership. Mr. Pearce is recognized nationally as a business leader and for his business acumen. He hasmultinational business management experience and proven leadership skills through his position as vice chairman at General MotorsCorporation, as well as through his extensive service on the boards of large public companies, including Marriott International, Inc., HughesElectronics Corporation, where he was chairman, and Nortel Networks Corporation, where he also was chairman. He also brings to our boardhis long experience as a practicing attorney. In addition, Mr. Pearce has focused on corporate governance issues and was the founding chairof Yale University’s Chairmen’s Forum, an organization comprised of non-executive chairmen of publicly traded companies. Participants inthe Chairmen’s Forum discussed ways to enhance the accountability of corporations to owners and promote a deeper understanding ofindependent board leadership and effective practices of board chairmanship. The board also believes that Mr. Pearce’s values andcommitment to excellence make him well-suited to serve as chairman of our board.
John K. Wilson Director Since 2003
Age 61 Audit Committee
Mr. Wilson was president of Durham Resources, LLC, a privately held financial management company, in Omaha, Nebraska, from 1994 toDecember 31, 2008. He previously was president of Great Plains Energy Corp., a public utility holding company and an affiliate of DurhamResources, LLC, from 1994 to July 1, 2000. He was vice president of Great Plains Natural Gas Co., an affiliate company of DurhamResources, LLC, until July 1, 2000. The company bought Great Plains Energy Corp. and Great Plains Natural Gas Co. on July 1, 2000.Mr. Wilson also served as president of the Durham Foundation. He is presently a director of HDR, Inc., an international architecture andengineering firm; a director of Tetrad Corporation, a privately held investment company; and an executive director of the Robert B.Daugherty Foundation, all located in Omaha, Nebraska. Mr. Wilson formerly served as a director of Bridges Investment Fund, a mutual fund;a director of the Greater Omaha Chamber of Commerce; on the advisory board of U.S. Bank NA Omaha; and on the advisory board ofDuncan Aviation, an aircraft service provider, headquartered in Lincoln, Nebraska.
Proxy Statement
MDU Resources Group, Inc. Proxy Statement 9
Mr. Wilson is a certified public accountant, on inactive status. He received his bachelor’s degree in business administration, cum laude,from the University of Nebraska – Omaha. During his career, he was an audit manager at Peat, Marwick, Mitchell (now known as KPMG),controller for Great Plains Natural Gas Co., and chief financial officer and treasurer for all Durham Resources entities.
The board concluded that Mr. Wilson should serve as a director of MDU Resources Group, Inc., in light of our business and structure, at thetime we file our proxy statement for the following reasons. Mr. Wilson has an extensive background in finance and accounting, as well asextensive experience with mergers and acquisitions, through his education and work experience at a major accounting firm and his laterpositions as controller and vice president of Great Plains Natural Gas Co., president of Great Plains Energy Corp., and president, chieffinancial officer, and treasurer for Durham Resources, LLC and all Durham Resources entities. The electric and natural gas utility businesswas our core business when our company was founded in 1924. That business now operates through four utilities: Montana-Dakota UtilitiesCo., Great Plains Natural Gas Co., Cascade Natural Gas Corporation, and Intermountain Gas Company. Mr. Wilson is our only non-employeedirector with direct experience in this area through his prior positions at Great Plains Natural Gas Co. and Great Plains Energy Corp. Inaddition, Mr. Wilson’s extensive finance and accounting experience make him well-suited for our audit committee.
The board of directors recommends a vote “for” each nominee.
A majority of votes cast is required to elect a director in an uncontested election. A majority of votes cast means the number of votes cast“for” a director’s election must exceed the number of votes cast “against” the director’s election. “Abstentions” and “broker non-votes” donot count as votes cast “for” or “against” the director’s election. In a contested election, which is an election in which the number ofnominees for director exceeds the number of directors to be elected and which we do not anticipate, directors will be elected by a pluralityof the votes cast.
Unless you specify otherwise when you submit your proxy, the proxies will vote your shares of common stock “for” all directors nominated bythe board of directors. If a nominee becomes unavailable for any reason or if a vacancy should occur before the election, which we do notanticipate, the proxies will vote your shares in their discretion for another person nominated by the board.
Our policy on majority voting for directors contained in our corporate governance guidelines requires any proposed nominee for re-election asa director to tender to the board, prior to nomination, his or her irrevocable resignation from the board that will be effective, in anuncontested election of directors only, upon:
• receipt of a greater number of votes “against” than votes “for” election at our annual meeting of stockholders and
• acceptance of such resignation by the board of directors.
Following certification of the stockholder vote, the nominating and governance committee will promptly recommend to the board whether ornot to accept the tendered resignation. The board will act on the nominating and governance committee’s recommendation no later than 90days following the date of the annual meeting.
Brokers may not vote your shares on the election of directors if you have not given your broker specific instructions as to how to vote. Please besure to give specific voting instructions to your broker so that your vote can be counted.
ITEM 2. APPROVAL OF THE MATERIAL TERMS OF THE PERFORMANCE GOALS UNDER THE MDU RESOURCESGROUP, INC. LONG-TERM PERFORMANCE-BASED INCENTIVE PLAN FOR PURPOSES OF INTERNAL REVENUECODE SECTION 162(m)
The board of directors recommends that stockholders approve the material terms of the performance goals under the MDU Resources Group,Inc. Long-Term Performance-Based Incentive Plan to preserve our ability to deduct compensation associated with future performance-basedincentive awards to be made under the plan.
Section 162(m) of the Internal Revenue Code of 1986, as amended, places a limit of $1,000,000 on the amount we may deduct in anyone year for compensation paid to our “covered employees.” A covered employee means a person specified in Section 162(m), whichgenerally includes our chief executive officer and each of our other three most highly-compensated executive officers other than our chieffinancial officer.
There is an exception to this limit for certain performance-based compensation, and awards made pursuant to the plan may constituteperformance-based compensation not subject to the deductibility limitation of Internal Revenue Code Section 162(m). To qualify for thisexception, the stockholders must approve, every five years, the material terms of the performance goals of the plan under which
Proxy Statement
10 MDU Resources Group, Inc. Proxy Statement
compensation will be paid. Stockholders last approved the goals for the plan in 2011, and, therefore, the board is submitting the plan’sperformance goals for approval at the 2016 annual meeting of stockholders.
The board of directors amended the plan on November 12, 2015 to:
• include the following new performance goals: cash flow from operations (dollar target or as % of revenue), gross margin or gross profit(dollar target or as % of revenue), operations and maintenance expense (dollar target or as % of revenue), general and administrativeexpense (dollar target or as % of revenue), total operating expense (dollar target or as % of revenue), pretax income (dollar target or as %of revenue), earnings before interest, taxes, depreciation and amortization or “EBITDA” (dollar target or as % of revenue), earnings beforeinterest and taxes or “EBIT” (dollar target or as % of revenue), earnings, return on invested capital, return on assets, return on net assets,working capital as percentage of revenue, days sales outstanding/accounts receivable turnover, and current ratio
• modify the operating income goal to: operating income (dollar target or as % of revenue)
• remove the following performance goals: oil and/or gas production (growth, value and costs) and oil and/or gas reserves (including proved,probable and possible reserves and growth, value and costs) and finding or development costs and
• add that performance goals may be measured on an individual basis and reflect individual performance or a relative comparison ofindividual performance.
The board of directors further amended the plan on February 11, 2016 to provide that if the company is required to prepare an accountingrestatement due to material noncompliance with any financial reporting requirements under the securities laws, the company or thecompensation committee may, or shall if required, take action to recover incentive-based compensation from specific executive officers inaccordance with our Guidelines for Repayment of Incentives Due to Accounting Restatements, as they may be amended or substituted fromtime to time, and in accordance with applicable law and applicable rules of the Securities and Exchange Commission and the New YorkStock Exchange.
The material terms of the performance goals are (i) eligibility and participation, (ii) the business criteria on which the performance goals arebased, and (iii) maximum awards under the plan, which we describe further below.
Eligibility and ParticipationAll officers and key employees of the company and its subsidiaries, including employees who are members of the board, as determined bythe compensation committee, are eligible to participate in the plan. The approximate number of employees who are currently eligible toparticipate in the plan is 40.
Performance GoalsThe compensation committee establishes the performance goals, which will be based on one or more of the following measures: sales orrevenues, earnings per share, shareholder return and/or value, funds from operations, cash flow from operations (dollar target or as % ofrevenue), gross margin or gross profit (dollar target or as % of revenue), operations and maintenance expense (dollar target or as % ofrevenue), general and administrative expense (dollar target or as % of revenue), total operating expense (dollar target or as % of revenue),operating income (dollar target or as % of revenue), pretax income (dollar target or as % of revenue), earnings before interest, taxes,depreciation and amortization or “EBITDA” (dollar target or as % of revenue), earnings before interest and taxes or “EBIT” (dollar target oras % of revenue), gross income, net income, cash flow, earnings, return on equity, return on invested capital, return on assets, return on netassets, working capital as percentage of revenue, days sales outstanding/accounts receivable turnover, current ratio, capital efficiency,operating ratios, stock price, enterprise value, company value, asset value growth, net asset value, shareholders’ equity, dividends, customersatisfaction, accomplishment of mergers, acquisitions, dispositions or similar extraordinary business transactions, safety, sustainability,profit returns and margins, financial return ratios, and market performance. Performance goals may be measured solely on a corporate,subsidiary, business unit or individual basis, or a combination of the foregoing. Performance goals may reflect absolute entity or individualperformance or a relative comparison of entity or individual performance to the performance of a peer group of entities or other externalmeasure.
Maximum Awards under the PlanAwards under the plan may be made in the form of restricted stock, performance units, performance shares, and any other type of awardpermitted under article 8 of the plan. The board of directors amended the plan on November 17, 2011 to remove stock options and stockappreciation grants from the types of awards that may be granted under the plan.
Proxy Statement
MDU Resources Group, Inc. Proxy Statement 11
Subject to adjustment pursuant to the anti-dilution provisions in the plan, (i) the total number of shares of restricted stock intended toqualify as performance-based compensation that may be granted in any calendar year to any covered employee shall not exceed 2,250,000shares, (ii) the total number of performance shares or performance units that may be granted in any calendar year to any covered employeeshall not exceed 2,250,000 performance shares or performance units, as the case may be, (iii) the total number of shares that are intendedto qualify as performance-based compensation granted pursuant to article 8 of the plan in any calendar year to any covered employee shallnot exceed 2,250,000 shares, (iv) the total cash award that is intended to qualify as performance-based compensation that may be paidpursuant to article 8 of the plan in any calendar year to any covered employee shall not exceed $6,000,000, and (v) the aggregate numberof dividend equivalents that are intended to qualify as performance-based compensation that a covered employee may receive in anycalendar year shall not exceed $6,000,000.
The other material features of the plan are described below, and the complete text of the plan is attached to this proxy statement asExhibit A.
Purpose of the PlanThe purpose of the plan is to promote the success and enhance the value of the company by linking the personal interests of officers andkey employees to those of our stockholders and customers. The plan is further intended to provide flexibility in our ability to motivate,attract, and retain the services of participants upon whose judgment, interest, and special effort the successful conduct of our operationslargely depends.
Effective Date and DurationThe plan was initially approved by the board of directors on February 7, 1997, and first became effective upon approval by stockholders atthe annual meeting on April 22, 1997. The plan will remain in effect, subject to the right of the board of directors to terminate the plan atany time, until all shares subject to the plan have been issued.
Amendment, Modification, and TerminationThe board may, at any time and from time to time, alter, amend, suspend, or terminate the plan, in whole or in part, provided that noamendment will be made without stockholder approval if the amendment would (i) increase the total number of shares that may be issuedunder the plan, (ii) materially modify the requirements for participation in the plan, or (iii) materially increase the benefits accruing toparticipants under the plan.
Administration of the PlanThe plan is administered by the compensation committee or by any other committee appointed by the board of directors. Subject to theterms of the plan, the committee has full power under the plan to determine persons to receive awards, the size and type of awards, andtheir terms. The committee may amend outstanding awards subject to restrictions stated in the plan.
Shares Subject to the PlanWhen it originally became effective in 1997, the plan authorized the issuance of up to 1,200,000 shares of MDU Resources Group, Inc.common stock. In 2001, the stockholders approved an amendment to increase the number of shares that could be issued under the plan by4,000,000 shares. On February 17, 2005, the Board of Directors amended the plan to reduce the number of shares that could be issued by2,000,000 shares. As of February 11, 2016, after giving effect to stock splits and awards pursuant to the plan, 4,393,865 shares remainavailable for issuance under the plan, excluding 699,562 outstanding target level performance share awards granted in 2014, 2015, and2016.
Shares underlying lapsed or forfeited restricted stock awards are not treated as having been issued under the plan. Shares withheld from anaward to satisfy tax withholding obligations are counted as shares issued under the plan. Shares that are potentially deliverable under anaward that expires or is canceled, forfeited, settled in cash, or otherwise settled without the delivery of shares are not treated as having beenissued under the plan.
Shares issued under the plan may be authorized but unissued shares of common stock, treasury stock, or shares purchased on the openmarket.
In the event of any equity restructuring such as a stock dividend, stock split, spinoff, rights offering, or recapitalization through a large,nonrecurring cash dividend, the committee will cause an equitable adjustment to be made (i) in the number and kind of shares that may bedelivered under the plan, (ii) in the individual limitations set forth in the plan, and (iii) with respect to outstanding awards, in the number
Proxy Statement
12 MDU Resources Group, Inc. Proxy Statement
and kind of shares subject to outstanding awards, price of shares subject to outstanding awards, any performance goals relating to shares,the market price of shares, or per-share results, and other terms and conditions of outstanding awards, in the case of (i), (ii), and (iii) toprevent dilution or enlargement of rights. In the event of any other change in corporate capitalization, such as a merger, consolidation, orliquidation, the committee may, in its sole discretion, cause an equitable adjustment as described in the foregoing sentence to be made, toprevent dilution or enlargement of rights. The number of shares subject to any award will always be rounded down to a whole number whenadjustments are made pursuant to these provisions of the plan. Adjustments made by the committee pursuant to these provisions are final,binding, and conclusive.
Types of Awards under the PlanFollowing is a general description of the types of awards that the compensation committee may make under the plan. The compensationcommittee will determine the terms and conditions of awards on a grant-by-grant basis, subject to limitations contained in the plan.
Restricted Stock. Restricted stock may be granted in such amounts and subject to such terms and conditions as determined by thecommittee, including time-based or performance-based vesting restrictions. The committee may establish performance goals, as describedabove, for restricted stock.
Participants holding restricted stock may exercise full voting rights with respect to those shares during the restricted period and, subject tothe committee’s right to determine otherwise at the time of grant, will receive regular cash dividends. All other distributions paid withrespect to the restricted stock will be credited subject to the same restrictions on transferability and forfeitability as the shares of restrictedstock with respect to which they were paid.
Performance Units and Performance Shares. Performance units and performance shares may be granted in the amounts and subject to suchterms and conditions as determined by the committee. The committee will set performance goals, which, depending on the extent to whichthey are met during the performance periods established by the committee, will determine the number and/or value of performance units/shares that will be paid out to participants. Dividend equivalents may also be granted.
Participants will receive payment of the value of performance units/shares earned after the end of the performance period. Payment ofperformance units/shares will be made in cash and/or shares of common stock which have an aggregate fair market value equal to the valueof the earned performance units/shares at the end of the applicable performance period, in such combination as the committee determines.Shares may be granted subject to any restrictions deemed appropriate by the committee.
Other Awards. The committee may make other awards which may include, without limitation, the grant of shares of common stock basedupon attainment of performance goals established by the committee, the payment of shares in lieu of cash, the payment of cash based onattainment of performance goals, and the payment of shares in lieu of cash under our other incentive or bonus programs.
Minimum Vesting RequirementsUnder the plan, the minimum vesting period for full value awards, which are awards pursuant to which shares may be issued that have noperformance-based vesting characteristics, is three years. Vesting may occur ratably each month, quarter, or anniversary of the grant date.The minimum vesting period for full value awards with performance-based vesting characteristics is at least one year. The committee doesnot have discretion to accelerate vesting of full value awards except in the event of a change in control of the company or similartransaction, or the death, disability, or termination of employment of a participant. The committee may grant a “de minimis” number of fullvalue awards that have a shorter vesting period. For this purpose, “de minimis” means 331,279 shares, subject to adjustment pursuant tothe anti-dilution provisions in the plan.
Termination of EmploymentEach award agreement will set forth the participant’s rights with respect to each award following termination of employment.
TransferabilityExcept as otherwise determined by the committee and set forth in the award agreement and subject to the provisions of the plan, awards ofrestricted stock and performance units/performance shares may not be sold, transferred, pledged, assigned, or otherwise alienated orhypothecated, other than by will or by the laws of descent and distribution, and a participant’s rights with respect to such shares or unitsshall be exercisable only by the participant or the participant’s legal representative during his or her lifetime.
Proxy Statement
MDU Resources Group, Inc. Proxy Statement 13
Change in ControlUpon a change in control, as defined below:
• any restriction periods and restrictions imposed on restricted stock or awards granted pursuant to article 8 of the plan, if not performance-based, will be deemed to have expired, and such restricted stock or awards will become immediately vested in full and
• the target payout opportunity attainable under all outstanding awards of performance units, performance shares, and other awards grantedpursuant to article 8 of the plan, if performance-based, will be deemed to have been fully earned for the entire performance period(s) asof the effective date of the change in control and will be paid out promptly in shares or cash pursuant to the terms of the awardagreement, or in the absence of such designation, as the committee shall determine.
The plan defines “change in control” as:
• the acquisition by an individual, entity, or group of 20% or more of our outstanding common stock
• a change in a majority of our board of directors since April 22, 1997 without the approval of a majority of the board members as ofApril 22, 1997, or whose election was approved by such board members
• consummation of a merger or similar transaction or sale of all or substantially all of our assets, unless our stockholders immediately priorto the transaction beneficially own more than 60% of the outstanding common stock and voting power of the resulting corporation insubstantially the same proportions as before the merger, no person owns 20% or more of the resulting corporation’s outstanding commonstock or voting power except for any such ownership that existed before the merger and at least a majority of the board of the resultingcorporation is comprised of our directors or
• stockholder approval of our liquidation or dissolution.
Accounting RestatementsThe plan provides that if the company is required to prepare an accounting restatement due to material noncompliance with any financialreporting requirements under the securities laws, the company or the compensation committee may, or shall if required, take action torecover incentive-based compensation from specific executive officers in accordance with our Guidelines for Repayment of Incentives Due toAccounting Restatements, as they may be amended or substituted from time to time, and in accordance with applicable law and applicablerules of the Securities and Exchange Commission and the New York Stock Exchange.
Section 409ATo the extent applicable, it is intended that the plan and any awards made under the plan comply with the requirements of Internal RevenueCode Section 409A. Any provision that would cause the plan or any award to fail to satisfy Section 409A will have no force or effect untilamended to comply with Section 409A, which amendment may be retroactive to the extent permitted by Section 409A.
Award InformationIt is not possible at this time to determine awards that will be made in the future pursuant to the plan.
Proxy Statement
14 MDU Resources Group, Inc. Proxy Statement
Equity Compensation Plan Information
The following table includes information as of December 31, 2015, with respect to our equity compensation plans:
Plan Category
(a)Number of securities
to be issued uponexercise of
outstanding options,warrants and rights
(b)Weighted averageexercise price of
outstanding options,warrants and rights
(c)Number of securities
remaining available forfuture issuance under
equity compensation plans(excluding securities
reflected in column (a))
Equity compensation plans approved by stockholders 1 565,8962
—3
5,018,1784,5
Equity compensation plans not approved by stockholders N/A N/A N/A1
Consists of the Non-Employee Director Long-Term Incentive Compensation Plan, the Long-Term Performance-Based Incentive Plan, and the Non-EmployeeDirector Stock Compensation Plan.
2 Consists of performance shares.
3 No weighted average exercise price is shown for the performance shares.4
357,757 shares remain available for future issuance under the Non-Employee Director Long-Term Incentive Compensation Plan in connection with grantsof restricted stock, performance units, performance shares, or other equity-based awards. 4,585,932 shares remain available for future issuance underthe Long-Term Performance-Based Incentive Plan in connection with grants of restricted stock, performance units, performance shares, or other equity-based awards.
5This amount also includes 74,489 shares available for issuance under the Non-Employee Director Stock Compensation Plan. Under this plan, in additionto a cash retainer, non-employee directors are awarded shares equal in value to $110,000 annually. A non-employee director may acquire additionalshares under the plan in lieu of receiving the cash portion of the director’s retainer or fees.
The board of directors believes that it is in the best interests of the company and our stockholders to receive the full income tax deductionfor performance-based compensation paid under the plan. The board is therefore asking the stockholders to approve, for purposes of Section162(m), the material terms of the performance goals as set forth above. The plan will remain in effect if the stockholders do not approve thematerial terms of the performance goals, and failure to obtain stockholder approval will not affect the rights of participants under the plan orunder any outstanding award agreements.
The board of directors recommends a vote “for” this proposal.
For purposes of Internal Revenue Code Section 162(m), approval requires a majority of the votes cast to be in favor of approval. Broker non-vote shares and abstentions will not count as votes cast.
ITEM 3. RATIFICATION OF INDEPENDENT REGISTERED PUBLIC ACCOUNTING FIRM
The audit committee at its February 2016 meeting appointed Deloitte & Touche LLP as our independent registered public accounting firmfor fiscal year 2016. The board of directors concurred with the audit committee’s decision. Deloitte & Touche LLP has served as ourindependent registered public accounting firm since fiscal year 2002.
Although your ratification vote will not affect the appointment or retention of Deloitte & Touche LLP for 2016, the audit committee willconsider your vote in determining its appointment of our independent registered public accounting firm for the next fiscal year. The auditcommittee, in appointing our independent registered public accounting firm, reserves the right, in its sole discretion, to change anappointment at any time during a fiscal year if it determines that such a change would be in our best interests.
A representative of Deloitte & Touche LLP will be present at the annual meeting and will be available to respond to appropriate questions.We do not anticipate that the representative will make a prepared statement at the meeting; however, he or she will be free to do so if he orshe chooses.
The board of directors recommends a vote “for” the ratification of Deloitte & Touche LLP as our independent registered public accounting firm for 2016.
Proxy Statement
MDU Resources Group, Inc. Proxy Statement 15
Ratification of the appointment of Deloitte & Touche LLP as our independent registered public accounting firm for 2016 requires theaffirmative vote of a majority of our common stock present in person or represented by proxy at the meeting and entitled to vote on theproposal. Abstentions will count as votes against this proposal.
Accounting and Auditing Matters
FeesThe following table summarizes the aggregate fees that our independent registered public accounting firm, Deloitte & Touche LLP, billed oris expected to bill us for professional services rendered for 2015 and 2014:
2015 2014 *
Audit Feesa $ 2,755,400 $ 3,126,140Audit-Related Feesb 437,979 45,925Tax Feesc 36,400 24,300All Other Feesd 47,569 100,527Total Feese $ 3,277,348 $ 3,296,892
Ratio of Tax and All Other Fees to Audit and Audit-Related Fees 2.6 % 3.9 %
* The 2014 amounts were adjusted from amounts shown in the 2015 proxy statement to reflect actual amounts.
a Audit fees for 2015 and 2014 consisted of fees for services rendered for the audit of our annual financial statements, reviews of quarterlyfinancial statements, subsidiary, statutory and regulatory audits, compliance with loan covenants, agreed upon procedures associated withthe annual submission of financial assurance to the North Dakota Department of Health, the issuance of comfort letters relating to a salesagency agreement and offering of common stock (2014 only), filing Form S-3 and S-8 registration statements (2014 only), and the auditof financial statements for Fidelity Exploration & Production Company (2014 only). Audit fees for 2014 include $31,280 for the financialstatement audit of Dakota Prairie Refining, LLC. These fees are paid by Dakota Prairie Refining, but are included in this table becauseDakota Prairie Refining is considered a variable interest entity with respect to MDU Resources and consolidated in its financialstatements.
b Audit-related fees for 2015 and 2014 are associated with accounting research assistance, agreed upon procedures associated report forKnife River Corporation’s JTL Group, Inc. (Wyoming) (2015 only), due diligence work associated with a potential acquisition (2015 only),and technical accounting consultation regarding discontinued and continuing operations (2014 only).
c Tax fees for 2015 and 2014 include the preparation of federal and state tax returns for Dakota Prairie Refining, LLC. The fees associatedwith Dakota Prairie Refining are paid by Dakota Prairie Refining, but are included in this table because Dakota Prairie Refining isconsidered a variable interest entity with respect to MDU Resources and is consolidated in its financial statements.
d All other fees for 2015 and 2014 are associated with a cost segregation study and research on R&D credits, in each case for DakotaPrairie Refining, LLC. The fees associated with Dakota Prairie Refining are paid by Dakota Prairie Refining, but are included in this tablebecause Dakota Prairie Refining is considered a variable interest entity with respect to MDU Resources and consolidated in its financialstatements.
e Total fees reported above include out-of-pocket expenses related to the services provided of $382,965 for 2015 and $420,732 for 2014.
Pre-Approval PolicyThe audit committee pre-approved all services Deloitte & Touche LLP performed in 2015 in accordance with the pre-approval policy andprocedures the audit committee adopted at its August 12, 2003 meeting. This policy is designed to achieve the continued independence ofDeloitte & Touche LLP and to assist in our compliance with Sections 201 and 202 of the Sarbanes-Oxley Act of 2002 and related rules ofthe Securities and Exchange Commission.
The policy defines the permitted services in each of the audit, audit-related, tax, and all other services categories, as well as prohibitedservices. The pre-approval policy requires management to submit annually for approval to the audit committee a service plan describing thescope of work and anticipated cost associated with each category of service. At each regular audit committee meeting, management reportson services performed by Deloitte & Touche LLP and the fees paid or accrued through the end of the quarter preceding the meeting.Management may submit requests for additional permitted services before the next scheduled audit committee meeting to the designatedmember of the audit committee, Dennis W. Johnson, for approval. The designated member updates the audit committee at the next regularlyscheduled meeting regarding any services that he approved during the interim period. At each regular audit committee meeting,management may submit to the audit committee for approval a supplement to the service plan containing any request for additionalpermitted services.
Proxy Statement
16 MDU Resources Group, Inc. Proxy Statement
In addition, prior to approving any request for audit-related, tax, or all other services of more than $50,000, Deloitte & Touche LLP willprovide a statement setting forth the reasons why rendering of the proposed services does not compromise Deloitte & Touche LLP’sindependence. This description and statement by Deloitte & Touche LLP may be incorporated into the service plan or included as an exhibitthereto or may be delivered in a separate written statement.
ITEM 4. APPROVAL, ON A NON-BINDING ADVISORY BASIS, OF THE COMPENSATION OF THE COMPANY’SNAMED EXECUTIVE OFFICERS
In accordance with Section 14A of the Securities Exchange Act of 1934 and Rule 14a-21(a), we are asking our stockholders to approve, ina separate advisory vote, the compensation of our named executive officers as disclosed in this proxy statement pursuant to Item 402 ofRegulation S-K. As discussed in the Compensation Discussion and Analysis, our compensation committee and board of directors believethat our current executive compensation program directly links compensation of our named executive officers to our financial performanceand aligns the interests of our named executive officers with those of our stockholders. Our compensation committee and board of directorsalso believe that our executive compensation program provides our named executive officers with a balanced compensation package thatincludes an appropriate base salary along with competitive annual and long-term incentive compensation targets. These incentive programsare designed to reward our named executive officers on both an annual and long-term basis if they attain specified goals.
Our overall compensation program and philosophy is built on a foundation of these guiding principles:
• we pay for performance, with over 50% of our 2015 total target direct compensation for our named executive officers in the form ofincentive compensation
• we assess the relationship between our named executive officers’ pay and performance on key financial metrics - revenue, profit, returnon invested capital, and stockholder return - in comparison to our performance graph peer group
• we review competitive compensation data for our named executive officers, to the extent available, and incorporate internal equity in thefinal determination of target compensation levels
• we determine annual performance incentives based on financial criteria that are important to stockholder value, including earnings,earnings per share, and return on invested capital and
• we determine long-term performance incentives based on total stockholder return relative to our performance graph peer group.
We are asking our stockholders to indicate their approval of our named executive officer compensation as disclosed in this proxy statement,including the Compensation Discussion and Analysis, the executive compensation tables, and narrative discussion. This vote is not intendedto address any specific item of compensation, but rather the overall compensation of our named executive officers for 2015. Accordingly,the following resolution is submitted for stockholder vote at the 2016 annual meeting:
“RESOLVED, that the compensation paid to the company’s named executive officers, as disclosed pursuant to Item 402 ofRegulation S-K, including the Compensation Discussion and Analysis, compensation tables, and narrative discussion of this proxystatement, is hereby approved.”
As this is an advisory vote, the results will not be binding on the company, the board of directors, or the compensation committee and willnot require us to take any action. The final decision on the compensation of our named executive officers remains with our compensationcommittee and our board of directors, although our board and compensation committee will consider the outcome of this vote when makingfuture compensation decisions. As the board of directors determined at its meeting in May 2011, we will provide our stockholders with theopportunity to vote on our named executive officer compensation at every annual meeting until the next required vote on the frequency ofstockholder votes on named executive officer compensation. The next required vote on frequency will occur at the 2017 annual meeting ofstockholders.
The board of directors recommends a vote “for” the approval, on a non-binding advisory basis, of the compensation of our named executive officers, as disclosed in this proxy statement.
Approval of the compensation of our named executive officers requires the affirmative vote of a majority of our common stock present inperson or represented by proxy at the meeting and entitled to vote on the proposal. Abstentions will count as votes against this proposal.Broker non-vote shares are not entitled to vote on this proposal and, therefore, are not counted in the vote.
Proxy Statement
MDU Resources Group, Inc. Proxy Statement 17
EXECUTIVE COMPENSATION
Compensation Discussion and Analysis
The following Compensation Discussion and Analysis may contain statements regarding corporate performance targets and goals. Thesetargets and goals are disclosed in the limited context of our compensation programs and should not be understood to be statements ofmanagement’s expectations or estimates of results or other guidance. We specifically caution investors not to apply these statements toother contexts.
Executive Summary
Named Executive OfficersOur named executive officers for 2015 were:
• David L. Goodin, president and chief executive officer of MDU Resources Group, Inc.
• Doran N. Schwartz, vice president and chief financial officer
• David C. Barney, president and chief executive officer of our construction materials and contracting segment, Knife River Corporation;Mr. Barney was not a named executive officer in 2014
• Jeffrey S. Thiede, president and chief executive officer of our construction services business segment, MDU Construction Services Group,Inc.
• Patrick L. O’Bryan, president and chief executive officer of our exploration and production business segment, Fidelity Exploration &Production Company; Mr. O’Bryan was not a named executive officer in 2014. Substantially all of the assets of Fidelity were sold during2015, and it is no longer considered a business segment. Mr. O’Bryan resigned his position effective February 29, 2016, and
• Steven L. Bietz, former president and chief executive officer of our pipeline and energy services segment, WBI Holdings, Inc., which isthe parent company of WBI Energy, Inc. and WBI Energy Services, Inc.; Mr. Bietz retired effective July 17, 2015.
Key Financial Results for 2015Consolidated GAAP earnings in 2015 were $(623.1) million, or $(3.20) per share, compared to earnings of $297.5 million, or $1.55 pershare, in 2014.
Our total stockholder return for 2015 was (19.0)%, as compared to (21.2)% for 2014. Our average annual total stockholder return for thefive-year period ended December 31, 2015 was 1.0%, compared to 2.8% for the five-year period ended December 31, 2014.
Total Realized Pay Compared to Total Compensation from the Summary Compensation Table The compensation committee believes total realized pay, the actual remuneration received by the named executive, is equally as importantas total compensation as presented in the Summary Compensation Table. Total realized pay reflects the compensation actually earned,which can differ substantially from total compensation as presented in the Summary Compensation Table.
Total compensation as presented in the Summary Compensation Table contains estimated values of grants of performance shares based onmultiple assumptions that may or may not come to fruition. Total realized pay does not include the value of performance shares at grant butrather includes their value only if they vest and then at the level they are actually earned. The Summary Compensation Table also shows anyincrease in pension value, which may result in large part from changes in the valuation assumptions and discount rates used for calculation.Total realized pay excludes the change in pension value and above-market earnings on nonqualified deferred compensation because:
• an increase in pension value can result in a much higher number reported as total compensation in the Summary Compensation Table
• when pension value decreases, as it did for 2015 due to the use of a higher discount rate, the negative value does not reduce totalcompensation as reported in the Summary Compensation Table and
• Supplemental Income Security Plan benefits depend partially on continued employment for some of the named executive officers.
Proxy Statement
18 MDU Resources Group, Inc. Proxy Statement
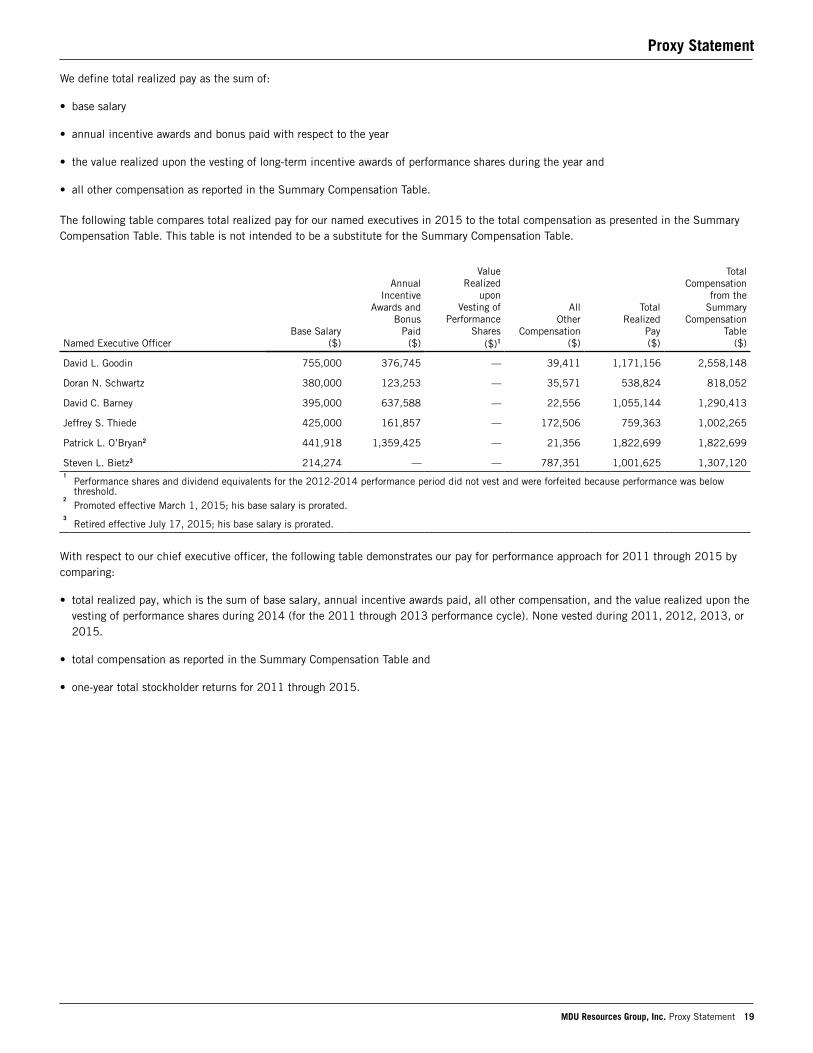
We define total realized pay as the sum of:
• base salary
• annual incentive awards and bonus paid with respect to the year
• the value realized upon the vesting of long-term incentive awards of performance shares during the year and
• all other compensation as reported in the Summary Compensation Table.
The following table compares total realized pay for our named executives in 2015 to the total compensation as presented in the SummaryCompensation Table. This table is not intended to be a substitute for the Summary Compensation Table.
Named Executive OfficerBase Salary
($)
AnnualIncentive
Awards andBonus
Paid($)
Value Realized
upon Vesting of
Performance Shares
($)1
AllOther
Compensation($)
TotalRealized
Pay($)
TotalCompensation
from theSummary
CompensationTable
($)
David L. Goodin 755,000 376,745 — 39,411 1,171,156 2,558,148
Doran N. Schwartz 380,000 123,253 — 35,571 538,824 818,052
David C. Barney 395,000 637,588 — 22,556 1,055,144 1,290,413
Jeffrey S. Thiede 425,000 161,857 — 172,506 759,363 1,002,265
Patrick L. O’Bryan2 441,918 1,359,425 — 21,356 1,822,699 1,822,699
Steven L. Bietz3 214,274 — — 787,351 1,001,625 1,307,1201
Performance shares and dividend equivalents for the 2012-2014 performance period did not vest and were forfeited because performance was belowthreshold.
2Promoted effective March 1, 2015; his base salary is prorated.
3Retired effective July 17, 2015; his base salary is prorated.
With respect to our chief executive officer, the following table demonstrates our pay for performance approach for 2011 through 2015 bycomparing:
• total realized pay, which is the sum of base salary, annual incentive awards paid, all other compensation, and the value realized upon thevesting of performance shares during 2014 (for the 2011 through 2013 performance cycle). None vested during 2011, 2012, 2013, or2015.
• total compensation as reported in the Summary Compensation Table and
• one-year total stockholder returns for 2011 through 2015.
Proxy Statement
MDU Resources Group, Inc. Proxy Statement 19
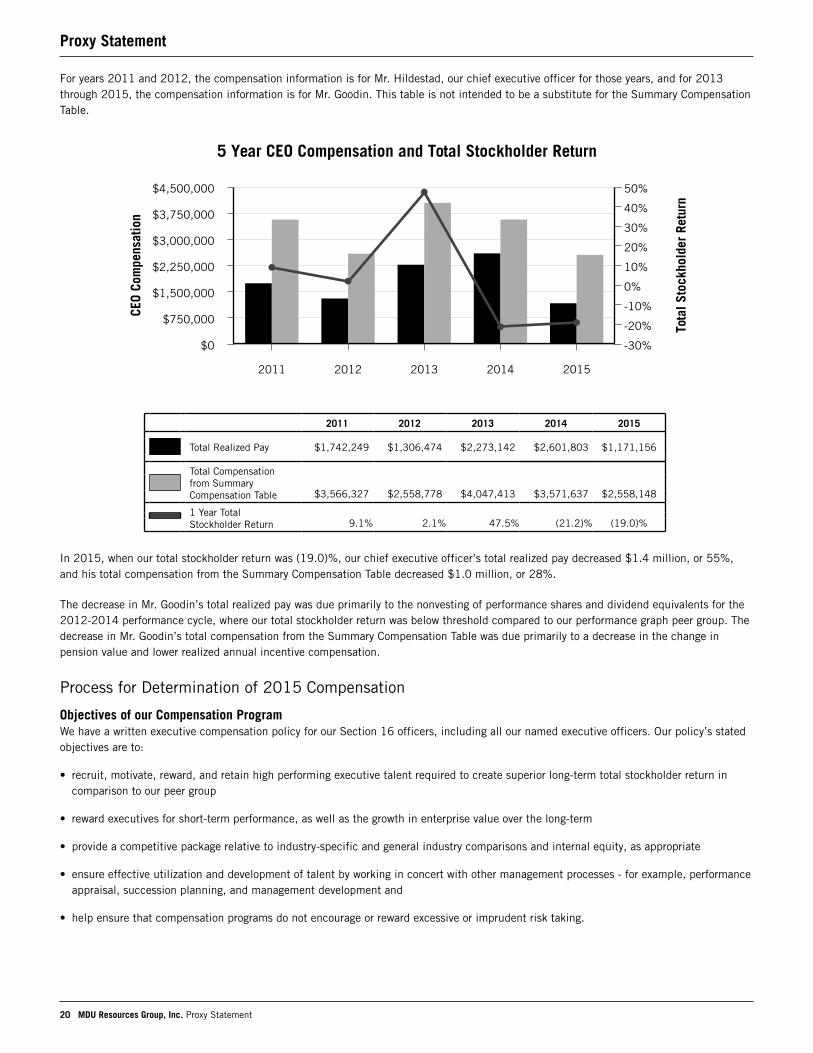
For years 2011 and 2012, the compensation information is for Mr. Hildestad, our chief executive officer for those years, and for 2013through 2015, the compensation information is for Mr. Goodin. This table is not intended to be a substitute for the Summary CompensationTable.
5 Year CEO Compensation and Total Stockholder Return
$4,500,000
$3,750,000
$3,000,000
$2,250,000
$1,500,000
$750,000
$0
CEO
Com
pens
atio
n
50%
40%
30%
20%
10%
0%
-10%
-20%
-30%
Tota
lSto
ckho
lder
Retu
rn
2011 2012 2013 2014 2015
2011 2012 2013 2014 2015
Total Realized Pay $1,742,249 $1,306,474 $2,273,142 $2,601,803 $1,171,156
Total Compensationfrom SummaryCompensation Table $3,566,327 $2,558,778 $4,047,413 $3,571,637 $2,558,148
1 Year Total Stockholder Return 9.1% 2.1% 47.5% (21.2)% (19.0)%
In 2015, when our total stockholder return was (19.0)%, our chief executive officer’s total realized pay decreased $1.4 million, or 55%,and his total compensation from the Summary Compensation Table decreased $1.0 million, or 28%.
The decrease in Mr. Goodin’s total realized pay was due primarily to the nonvesting of performance shares and dividend equivalents for the2012-2014 performance cycle, where our total stockholder return was below threshold compared to our performance graph peer group. Thedecrease in Mr. Goodin’s total compensation from the Summary Compensation Table was due primarily to a decrease in the change inpension value and lower realized annual incentive compensation.
Process for Determination of 2015 Compensation
Objectives of our Compensation Program We have a written executive compensation policy for our Section 16 officers, including all our named executive officers. Our policy’s statedobjectives are to:
• recruit, motivate, reward, and retain high performing executive talent required to create superior long-term total stockholder return incomparison to our peer group
• reward executives for short-term performance, as well as the growth in enterprise value over the long-term
• provide a competitive package relative to industry-specific and general industry comparisons and internal equity, as appropriate
• ensure effective utilization and development of talent by working in concert with other management processes - for example, performanceappraisal, succession planning, and management development and
• help ensure that compensation programs do not encourage or reward excessive or imprudent risk taking.
Proxy Statement
20 MDU Resources Group, Inc. Proxy Statement
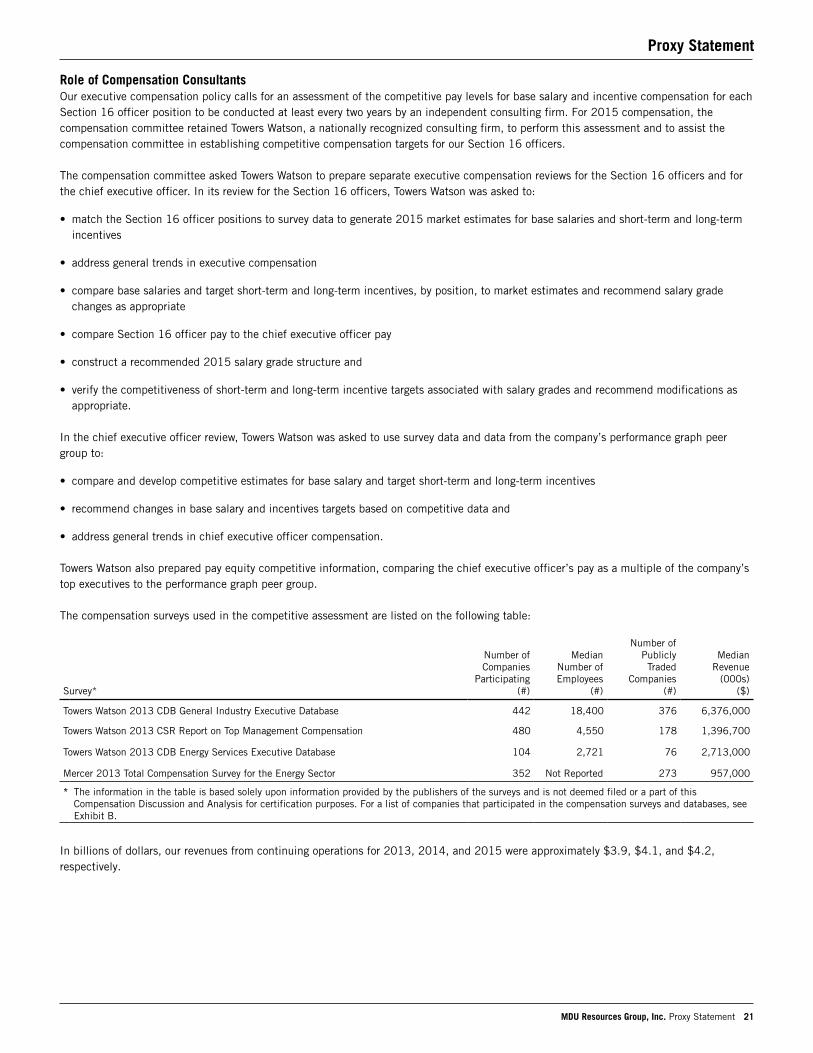
Role of Compensation ConsultantsOur executive compensation policy calls for an assessment of the competitive pay levels for base salary and incentive compensation for eachSection 16 officer position to be conducted at least every two years by an independent consulting firm. For 2015 compensation, thecompensation committee retained Towers Watson, a nationally recognized consulting firm, to perform this assessment and to assist thecompensation committee in establishing competitive compensation targets for our Section 16 officers.
The compensation committee asked Towers Watson to prepare separate executive compensation reviews for the Section 16 officers and forthe chief executive officer. In its review for the Section 16 officers, Towers Watson was asked to:
• match the Section 16 officer positions to survey data to generate 2015 market estimates for base salaries and short-term and long-termincentives
• address general trends in executive compensation
• compare base salaries and target short-term and long-term incentives, by position, to market estimates and recommend salary gradechanges as appropriate
• compare Section 16 officer pay to the chief executive officer pay
• construct a recommended 2015 salary grade structure and
• verify the competitiveness of short-term and long-term incentive targets associated with salary grades and recommend modifications asappropriate.
In the chief executive officer review, Towers Watson was asked to use survey data and data from the company’s performance graph peergroup to:
• compare and develop competitive estimates for base salary and target short-term and long-term incentives
• recommend changes in base salary and incentives targets based on competitive data and
• address general trends in chief executive officer compensation.
Towers Watson also prepared pay equity competitive information, comparing the chief executive officer’s pay as a multiple of the company’stop executives to the performance graph peer group.
The compensation surveys used in the competitive assessment are listed on the following table:
Survey*
Number ofCompanies
Participating (#)
MedianNumber of Employees
(#)
Number ofPubliclyTraded
Companies (#)
Median Revenue
(000s) ($)
Towers Watson 2013 CDB General Industry Executive Database 442 18,400 376 6,376,000
Towers Watson 2013 CSR Report on Top Management Compensation 480 4,550 178 1,396,700
Towers Watson 2013 CDB Energy Services Executive Database 104 2,721 76 2,713,000
Mercer 2013 Total Compensation Survey for the Energy Sector 352 Not Reported 273 957,000
* The information in the table is based solely upon information provided by the publishers of the surveys and is not deemed filed or a part of thisCompensation Discussion and Analysis for certification purposes. For a list of companies that participated in the compensation surveys and databases, seeExhibit B.
In billions of dollars, our revenues from continuing operations for 2013, 2014, and 2015 were approximately $3.9, $4.1, and $4.2,respectively.
Proxy Statement
MDU Resources Group, Inc. Proxy Statement 21
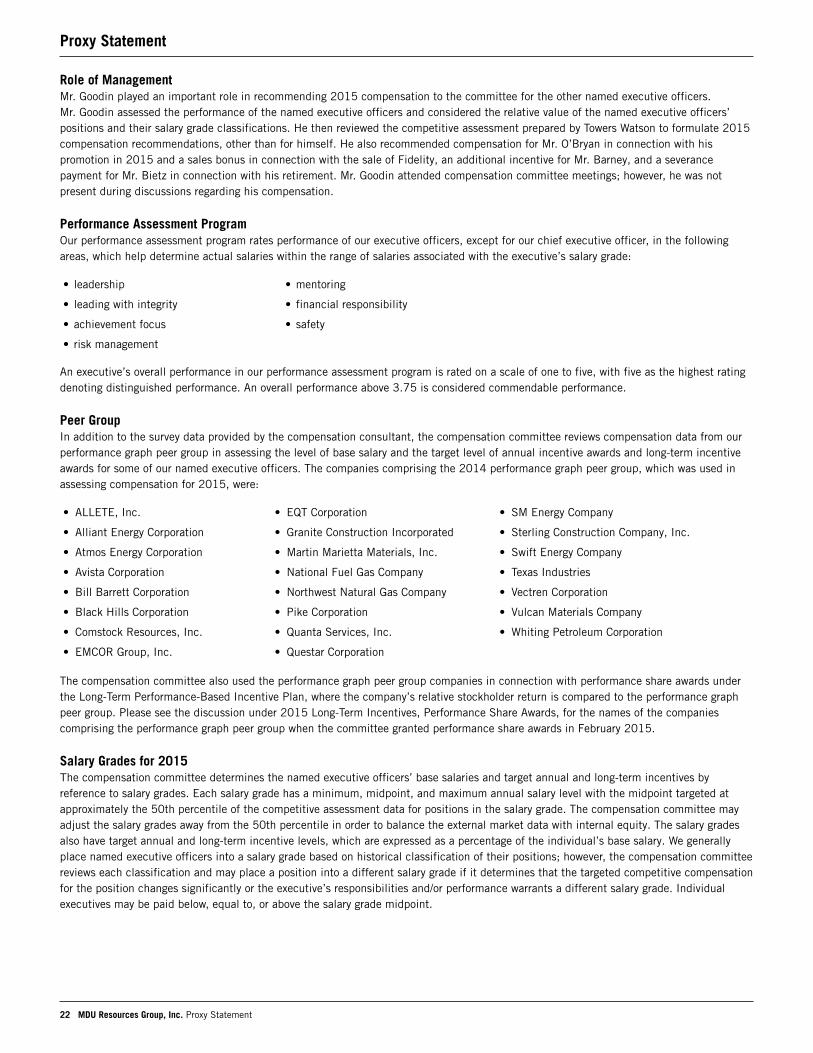
Role of ManagementMr. Goodin played an important role in recommending 2015 compensation to the committee for the other named executive officers.Mr. Goodin assessed the performance of the named executive officers and considered the relative value of the named executive officers’positions and their salary grade classifications. He then reviewed the competitive assessment prepared by Towers Watson to formulate 2015compensation recommendations, other than for himself. He also recommended compensation for Mr. O’Bryan in connection with hispromotion in 2015 and a sales bonus in connection with the sale of Fidelity, an additional incentive for Mr. Barney, and a severancepayment for Mr. Bietz in connection with his retirement. Mr. Goodin attended compensation committee meetings; however, he was notpresent during discussions regarding his compensation.
Performance Assessment Program Our performance assessment program rates performance of our executive officers, except for our chief executive officer, in the followingareas, which help determine actual salaries within the range of salaries associated with the executive’s salary grade:
• leadership • mentoring
• leading with integrity • financial responsibility
• achievement focus • safety
• risk management
An executive’s overall performance in our performance assessment program is rated on a scale of one to five, with five as the highest ratingdenoting distinguished performance. An overall performance above 3.75 is considered commendable performance.
Peer GroupIn addition to the survey data provided by the compensation consultant, the compensation committee reviews compensation data from ourperformance graph peer group in assessing the level of base salary and the target level of annual incentive awards and long-term incentiveawards for some of our named executive officers. The companies comprising the 2014 performance graph peer group, which was used inassessing compensation for 2015, were:
• ALLETE, Inc. • EQT Corporation • SM Energy Company
• Alliant Energy Corporation • Granite Construction Incorporated • Sterling Construction Company, Inc.
• Atmos Energy Corporation • Martin Marietta Materials, Inc. • Swift Energy Company
• Avista Corporation • National Fuel Gas Company • Texas Industries
• Bill Barrett Corporation • Northwest Natural Gas Company • Vectren Corporation
• Black Hills Corporation • Pike Corporation • Vulcan Materials Company
• Comstock Resources, Inc. • Quanta Services, Inc. • Whiting Petroleum Corporation
• EMCOR Group, Inc. • Questar Corporation
The compensation committee also used the performance graph peer group companies in connection with performance share awards underthe Long-Term Performance-Based Incentive Plan, where the company’s relative stockholder return is compared to the performance graphpeer group. Please see the discussion under 2015 Long-Term Incentives, Performance Share Awards, for the names of the companiescomprising the performance graph peer group when the committee granted performance share awards in February 2015.
Salary Grades for 2015The compensation committee determines the named executive officers’ base salaries and target annual and long-term incentives byreference to salary grades. Each salary grade has a minimum, midpoint, and maximum annual salary level with the midpoint targeted atapproximately the 50th percentile of the competitive assessment data for positions in the salary grade. The compensation committee mayadjust the salary grades away from the 50th percentile in order to balance the external market data with internal equity. The salary gradesalso have target annual and long-term incentive levels, which are expressed as a percentage of the individual’s base salary. We generallyplace named executive officers into a salary grade based on historical classification of their positions; however, the compensation committeereviews each classification and may place a position into a different salary grade if it determines that the targeted competitive compensationfor the position changes significantly or the executive’s responsibilities and/or performance warrants a different salary grade. Individualexecutives may be paid below, equal to, or above the salary grade midpoint.
Proxy Statement
22 MDU Resources Group, Inc. Proxy Statement
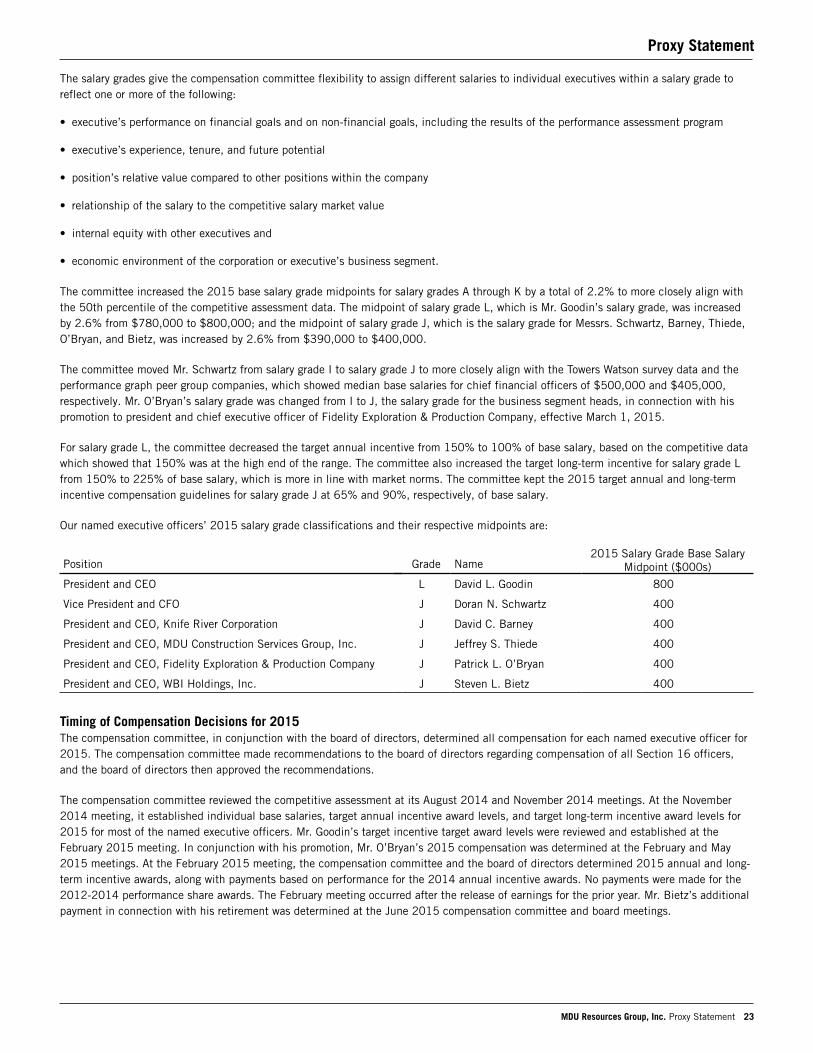
The salary grades give the compensation committee flexibility to assign different salaries to individual executives within a salary grade toreflect one or more of the following:
• executive’s performance on financial goals and on non-financial goals, including the results of the performance assessment program
• executive’s experience, tenure, and future potential
• position’s relative value compared to other positions within the company
• relationship of the salary to the competitive salary market value
• internal equity with other executives and
• economic environment of the corporation or executive’s business segment.
The committee increased the 2015 base salary grade midpoints for salary grades A through K by a total of 2.2% to more closely align withthe 50th percentile of the competitive assessment data. The midpoint of salary grade L, which is Mr. Goodin’s salary grade, was increasedby 2.6% from $780,000 to $800,000; and the midpoint of salary grade J, which is the salary grade for Messrs. Schwartz, Barney, Thiede,O’Bryan, and Bietz, was increased by 2.6% from $390,000 to $400,000.
The committee moved Mr. Schwartz from salary grade I to salary grade J to more closely align with the Towers Watson survey data and theperformance graph peer group companies, which showed median base salaries for chief financial officers of $500,000 and $405,000,respectively. Mr. O’Bryan’s salary grade was changed from I to J, the salary grade for the business segment heads, in connection with hispromotion to president and chief executive officer of Fidelity Exploration & Production Company, effective March 1, 2015.
For salary grade L, the committee decreased the target annual incentive from 150% to 100% of base salary, based on the competitive datawhich showed that 150% was at the high end of the range. The committee also increased the target long-term incentive for salary grade Lfrom 150% to 225% of base salary, which is more in line with market norms. The committee kept the 2015 target annual and long-termincentive compensation guidelines for salary grade J at 65% and 90%, respectively, of base salary.
Our named executive officers’ 2015 salary grade classifications and their respective midpoints are:
2015 Salary Grade Base SalaryMidpoint ($000s)Position Grade Name
President and CEO L David L. Goodin 800
Vice President and CFO J Doran N. Schwartz 400
President and CEO, Knife River Corporation J David C. Barney 400
President and CEO, MDU Construction Services Group, Inc. J Jeffrey S. Thiede 400
President and CEO, Fidelity Exploration & Production Company J Patrick L. O’Bryan 400
President and CEO, WBI Holdings, Inc. J Steven L. Bietz 400
Timing of Compensation Decisions for 2015The compensation committee, in conjunction with the board of directors, determined all compensation for each named executive officer for2015. The compensation committee made recommendations to the board of directors regarding compensation of all Section 16 officers,and the board of directors then approved the recommendations.
The compensation committee reviewed the competitive assessment at its August 2014 and November 2014 meetings. At the November2014 meeting, it established individual base salaries, target annual incentive award levels, and target long-term incentive award levels for2015 for most of the named executive officers. Mr. Goodin’s target incentive target award levels were reviewed and established at theFebruary 2015 meeting. In conjunction with his promotion, Mr. O’Bryan’s 2015 compensation was determined at the February and May2015 meetings. At the February 2015 meeting, the compensation committee and the board of directors determined 2015 annual and long-term incentive awards, along with payments based on performance for the 2014 annual incentive awards. No payments were made for the2012-2014 performance share awards. The February meeting occurred after the release of earnings for the prior year. Mr. Bietz’s additionalpayment in connection with his retirement was determined at the June 2015 compensation committee and board meetings.
Proxy Statement
MDU Resources Group, Inc. Proxy Statement 23
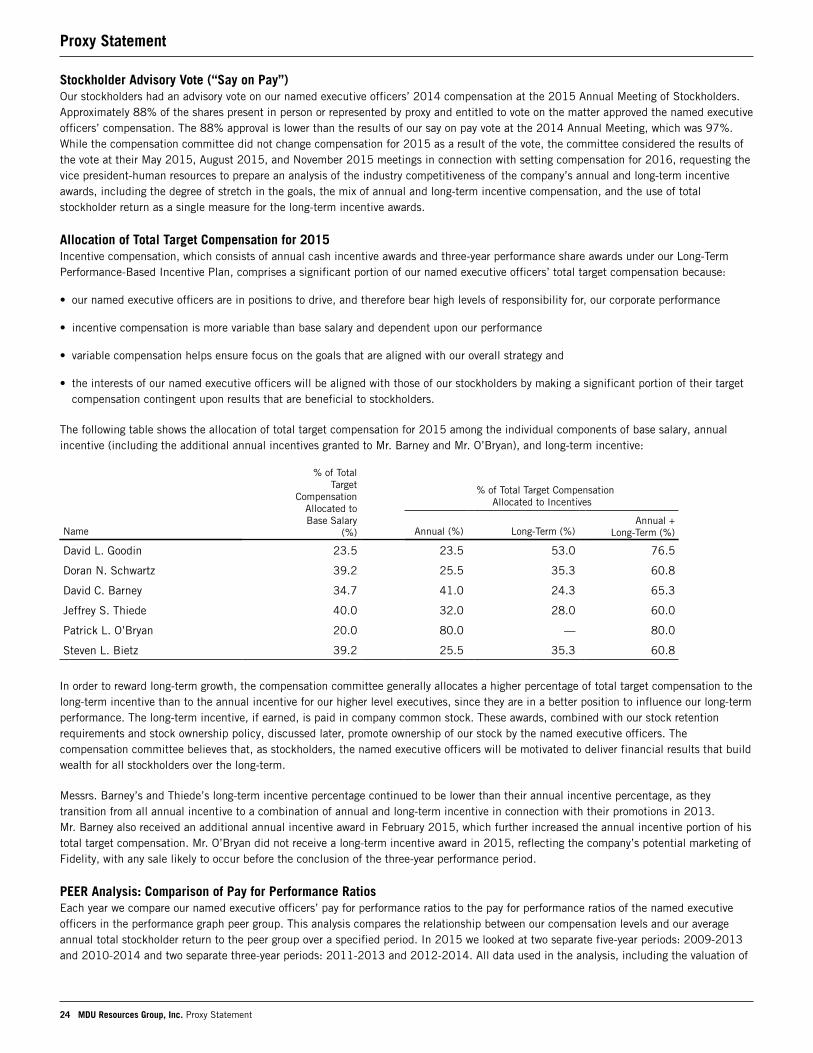
Stockholder Advisory Vote (“Say on Pay”)Our stockholders had an advisory vote on our named executive officers’ 2014 compensation at the 2015 Annual Meeting of Stockholders.Approximately 88% of the shares present in person or represented by proxy and entitled to vote on the matter approved the named executiveofficers’ compensation. The 88% approval is lower than the results of our say on pay vote at the 2014 Annual Meeting, which was 97%.While the compensation committee did not change compensation for 2015 as a result of the vote, the committee considered the results ofthe vote at their May 2015, August 2015, and November 2015 meetings in connection with setting compensation for 2016, requesting thevice president-human resources to prepare an analysis of the industry competitiveness of the company’s annual and long-term incentiveawards, including the degree of stretch in the goals, the mix of annual and long-term incentive compensation, and the use of totalstockholder return as a single measure for the long-term incentive awards.
Allocation of Total Target Compensation for 2015 Incentive compensation, which consists of annual cash incentive awards and three-year performance share awards under our Long-TermPerformance-Based Incentive Plan, comprises a significant portion of our named executive officers’ total target compensation because:
• our named executive officers are in positions to drive, and therefore bear high levels of responsibility for, our corporate performance
• incentive compensation is more variable than base salary and dependent upon our performance
• variable compensation helps ensure focus on the goals that are aligned with our overall strategy and
• the interests of our named executive officers will be aligned with those of our stockholders by making a significant portion of their targetcompensation contingent upon results that are beneficial to stockholders.
The following table shows the allocation of total target compensation for 2015 among the individual components of base salary, annualincentive (including the additional annual incentives granted to Mr. Barney and Mr. O’Bryan), and long-term incentive:
Name
% of TotalTarget
CompensationAllocated toBase Salary
(%)
% of Total Target Compensation Allocated to Incentives
Annual (%) Long-Term (%)Annual +
Long-Term (%)
David L. Goodin 23.5 23.5 53.0 76.5
Doran N. Schwartz 39.2 25.5 35.3 60.8
David C. Barney 34.7 41.0 24.3 65.3
Jeffrey S. Thiede 40.0 32.0 28.0 60.0
Patrick L. O’Bryan 20.0 80.0 — 80.0
Steven L. Bietz 39.2 25.5 35.3 60.8
In order to reward long-term growth, the compensation committee generally allocates a higher percentage of total target compensation to thelong-term incentive than to the annual incentive for our higher level executives, since they are in a better position to influence our long-termperformance. The long-term incentive, if earned, is paid in company common stock. These awards, combined with our stock retentionrequirements and stock ownership policy, discussed later, promote ownership of our stock by the named executive officers. Thecompensation committee believes that, as stockholders, the named executive officers will be motivated to deliver financial results that buildwealth for all stockholders over the long-term.
Messrs. Barney’s and Thiede’s long-term incentive percentage continued to be lower than their annual incentive percentage, as theytransition from all annual incentive to a combination of annual and long-term incentive in connection with their promotions in 2013.Mr. Barney also received an additional annual incentive award in February 2015, which further increased the annual incentive portion of histotal target compensation. Mr. O’Bryan did not receive a long-term incentive award in 2015, reflecting the company’s potential marketing ofFidelity, with any sale likely to occur before the conclusion of the three-year performance period.
PEER Analysis: Comparison of Pay for Performance RatiosEach year we compare our named executive officers’ pay for performance ratios to the pay for performance ratios of the named executiveofficers in the performance graph peer group. This analysis compares the relationship between our compensation levels and our averageannual total stockholder return to the peer group over a specified period. In 2015 we looked at two separate five-year periods: 2009-2013and 2010-2014 and two separate three-year periods: 2011-2013 and 2012-2014. All data used in the analysis, including the valuation of
Proxy Statement
24 MDU Resources Group, Inc. Proxy Statement
long-term incentives and calculation of stockholder return, were compiled by Equilar, Inc., an independent service provider, based on eachcompany’s annual filings for its data collection.
This analysis consisted of dividing what we paid our named executive officers for the period by our average annual total stockholder returnfor the same period to yield our pay ratio. For this comparison, we used the 2015 performance graph peer group companies. Our pay ratiowas then compared to the pay ratio of the companies in the performance graph peer group, which was calculated by dividing total directcompensation for all the peer group executives by the sum of each company’s average annual total stockholder return for the same period.The average annual stockholder return is the geometric mean for the period.
For the five-year period 2009 through 2013, we paid our named executives approximately $4.9 million per point of shareholder return,while the peer group companies paid their named executives approximately $4.1 million per point of shareholder return. For the five-yearperiod 2010 through 2014, we paid our named executives approximately $15.8 million per point of shareholder return, reflecting a largedecrease in our total stockholder return, while the peer group companies paid their named executives approximately $5.6 million per pointof shareholder return. The three-year periods resulted in a comparison of $1.7 million for the company versus $2.4 million for the peergroup for 2011-2013 and a comparison of $4.8 million for the company versus $1.9 million for the peer group for 2012-2014. Thecompensation committee believes that the analysis continues to serve a useful purpose in its annual review of compensation for the namedexecutives.
2015 Compensation for Our Named Executive Officers
Base Salaries, Total Annual Compensation, and Total Direct Compensation
David L. GoodinFor 2015, the compensation committee gave Mr. Goodin, our president and chief executive officer, a 10.2% increase, raising his salaryfrom $685,000 to $755,000, or 94% of the midpoint of salary grade L. The committee noted that the $755,000 was above the mediansalary of $726,000 for the chief executive officers from the performance graph peer companies and below the market average salary of$910,000 for the chief executive officers from the salary survey data, both as noted in the competitive assessment. The committee believedthe 10.2% increase was appropriate in recognition of favorable return on invested capital results compared to the performance graph peersfor the twelve months ended June 30, 2014 and results on succession planning and leadership development. The committee also believedit was appropriate to move Mr. Goodin’s 2015 base salary closer to the competitive reference point. The committee established Mr. Goodin’s2015 target total annual cash compensation at $1,510,000, a reduction from his 2014 target of $1,712,500. Mr. Goodin’s 2015 targettotal annual cash was above the median total cash compensation of $1,385,000 paid to chief executive officers from the performancegraph peer companies and below the median total cash compensation of $1,865,000 paid to chief executive officers from the salary surveydata, both as noted in the competitive assessment. From a total direct compensation perspective, the committee established a target of$3,208,750, which was aligned with the competitive reference point of $3,291,000 for the performance graph peer group and below thecompetitive reference point of $4,665,000 for the salary survey companies.
Doran N. SchwartzAs discussed above, the committee changed the salary grade of Mr. Schwartz, our vice president and chief financial officer, from I to J andincreased his base salary 5.6%, from $360,000 to $380,000, or 95% of the midpoint of salary grade J. Combined with his target annualand long-term incentive, this would result in target total annual compensation of 70.1% and target total direct compensation of 60.4% ofthe competitive market data at the 50th percentile. The compensation committee’s rationale for the increase was in recognition of his:
• leadership positions in the sale of company common stock under the at-the-market equity program, debt financings for the company andfinancings for the Dakota Prairie Refinery and
• relatively low salary compared to the chief financial officers of performance graph peer companies.
David C. BarneyFor 2015, the compensation committee gave Mr. Barney, president and chief executive officer of Knife River Corporation, a 3.9% increasein base salary, raising his salary from $380,000 to $395,000 or 99% of the midpoint of salary grade J. Combined with his target annualand long-term incentives, along with an additional annual incentive (cash flow), this would result in target total annual compensation of121.3% and target total direct compensation of 93.2% of the competitive salary survey data at the 50th percentile. The compensationcommittee’s rationale for the increase was in recognition of:
Proxy Statement
MDU Resources Group, Inc. Proxy Statement 25
• his results in managing Knife River Corporation, moving it closer to meeting or exceeding its weighted average cost of capital
• his credible leadership and
• his respect by Knife River Corporation employees.
Jeffrey S. ThiedeFor 2015, the compensation committee gave Mr. Thiede, president and chief executive officer of MDU Construction Services Group, Inc., a6.3% increase in base salary, raising his annual salary from $400,000 to $425,000, or 106% of the midpoint of salary grade J. Combinedwith his target annual and long-term incentives, this would result in target total annual compensation of 115.9% and target total directcompensation of 95.7% of the competitive salary survey data at the 50th percentile. The committee believed the 6.3% salary increase wasappropriate in recognition of his strong leadership and continued delivery of outstanding results and the accomplishments in unifying MDUConstruction Services Group, Inc. under his leadership.
Patrick L. O’BryanIn establishing Mr. O’Bryan’s compensation, the committee reviewed the pay arrangements of chief operating officers of publicly tradedcompanies with revenues of $250 million to $1.5 billion in four SIC codes in the oil and gas business, as compiled by Equilar. Thesecompanies are listed in Exhibit B. The committee changed Mr. O’Bryan’s salary grade from I to J and increased his salary from $400,000 to$450,000, effective March 1, 2015, in connection with his promotion to president and chief executive officer of Fidelity Exploration &Production Company. His salary was set at 112.5% of the midpoint of salary grade J. Combined with his target annual incentive and his twoadditional annual incentives (retention and sales bonus incentives), this would result in target total compensation of $2.24 million or140.1% of total target direct compensation of $1.6 million as shown in the Equilar data. The committee believed that Mr. O’Bryan’sinvolvement in the Fidelity sales process would likely bring significant incremental value and recognized the importance of keepingMr. O’Bryan incentivized to remain with the company and lead a successful sales effort.
Steven L. BietzFor 2015, the compensation committee gave Mr. Bietz, president and chief executive officer of WBI Holdings, Inc. until his retirement inJuly 2015, a 3.9% increase, raising his salary from $380,000 to $395,000, or 99% of the midpoint of salary grade J. Combined with histarget annual and long-term incentives, this would result in target total annual compensation of 100.3% and target total directcompensation of 91.6% of the competitive salary survey data at the 50th percentile. The compensation committee’s rationale for theincrease was in recognition of the earnings growth at WBI Energy, Inc. under Mr. Bietz’s leadership.
Annual Incentives
2015 Annual IncentivesThe committee granted regular annual incentives to the executive officers in February 2015, as it has in prior years, and also during 2015granted or approved additional annual incentives for Mr. Barney and Mr. O’Bryan. In the following sections, we discuss the regular annualincentives, with the additional incentives discussed separately under “Additional Annual Incentives.”
What the Performance Measures Are and Why We Chose Them The compensation committee develops and reviews financial and other corporate performance measures to help ensure that compensationto the executives reflects the success of their respective business segment and/or the corporation, as well as the value provided to ourstockholders.
The compensation committee believes earnings, earnings per share, and return on invested capital are very good measurements in assessinga business segment’s performance and the company’s performance from a financial perspective, because:
• earnings and earnings per share are generally accepted accounting principle measurements and are key drivers of stockholder return overthe long-term and
• return on invested capital measures how efficiently and effectively management deploys capital, where sustained returns on investedcapital in excess of a business segment’s cost of capital create value for our stockholders.
As in prior years, the compensation committee selected allocated earnings per share and return on invested capital for the pipeline andenergy services segment, the electric and natural gas distribution segments, and the construction materials and contracting segment toensure those chief executive officers’ annual incentive payments are closely aligned to criteria promoting long-term growth in stockholderreturn. We establish these targets in connection with our annual financial planning process, where we assess the economic environment,competitive outlook, industry trends, and company specific conditions to set projections of results. The compensation committee evaluatesthe projected results and uses this evaluation to establish the incentive plan performance targets based upon recommendations of the chief
Proxy Statement
26 MDU Resources Group, Inc. Proxy Statement
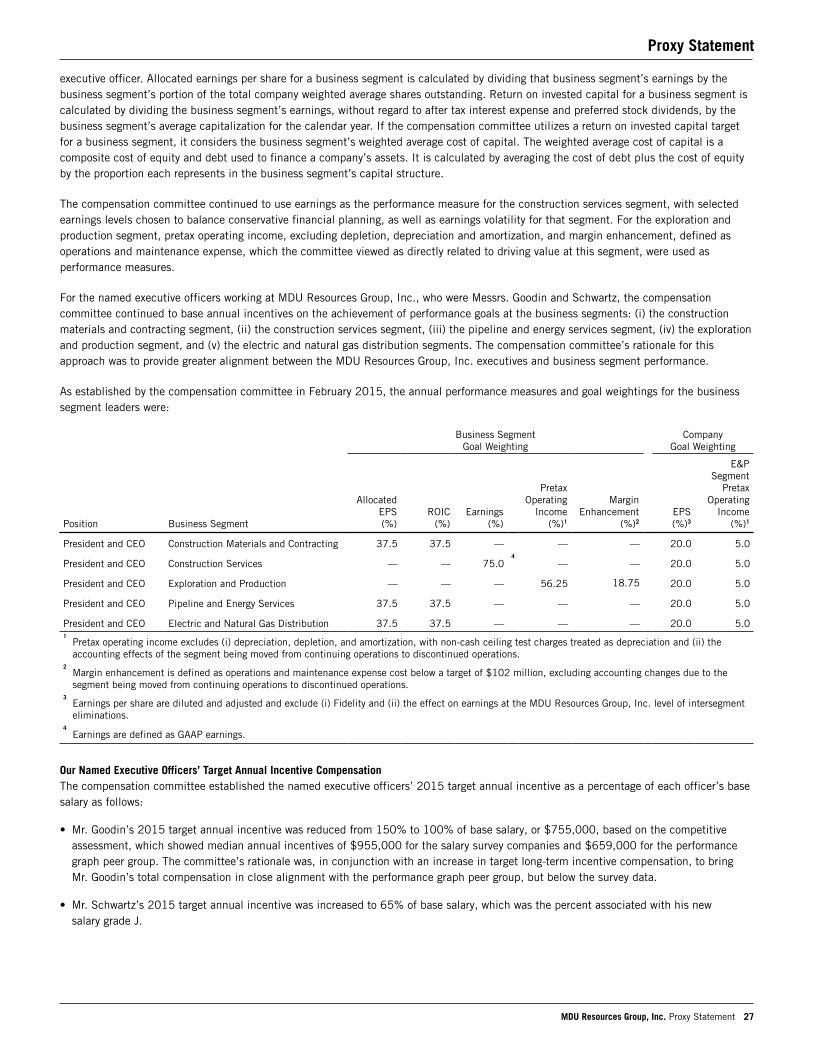
executive officer. Allocated earnings per share for a business segment is calculated by dividing that business segment’s earnings by thebusiness segment’s portion of the total company weighted average shares outstanding. Return on invested capital for a business segment iscalculated by dividing the business segment’s earnings, without regard to after tax interest expense and preferred stock dividends, by thebusiness segment’s average capitalization for the calendar year. If the compensation committee utilizes a return on invested capital targetfor a business segment, it considers the business segment’s weighted average cost of capital. The weighted average cost of capital is acomposite cost of equity and debt used to finance a company’s assets. It is calculated by averaging the cost of debt plus the cost of equityby the proportion each represents in the business segment’s capital structure.
The compensation committee continued to use earnings as the performance measure for the construction services segment, with selectedearnings levels chosen to balance conservative financial planning, as well as earnings volatility for that segment. For the exploration andproduction segment, pretax operating income, excluding depletion, depreciation and amortization, and margin enhancement, defined asoperations and maintenance expense, which the committee viewed as directly related to driving value at this segment, were used asperformance measures.
For the named executive officers working at MDU Resources Group, Inc., who were Messrs. Goodin and Schwartz, the compensationcommittee continued to base annual incentives on the achievement of performance goals at the business segments: (i) the constructionmaterials and contracting segment, (ii) the construction services segment, (iii) the pipeline and energy services segment, (iv) the explorationand production segment, and (v) the electric and natural gas distribution segments. The compensation committee’s rationale for thisapproach was to provide greater alignment between the MDU Resources Group, Inc. executives and business segment performance.
As established by the compensation committee in February 2015, the annual performance measures and goal weightings for the businesssegment leaders were:
Position Business Segment
Business Segment Goal Weighting
CompanyGoal Weighting
AllocatedEPS(%)
ROIC(%)
Earnings(%)
PretaxOperating
Income(%)1
MarginEnhancement
(%)2EPS(%)3
E&PSegment
PretaxOperating
Income(%)1
President and CEO Construction Materials and Contracting 37.5 37.5 — — — 20.0 5.0
President and CEO Construction Services — — 75.04
— — 20.0 5.0
President and CEO Exploration and Production — — — 56.25 18.75 20.0 5.0
President and CEO Pipeline and Energy Services 37.5 37.5 — — — 20.0 5.0
President and CEO Electric and Natural Gas Distribution 37.5 37.5 — — — 20.0 5.01
Pretax operating income excludes (i) depreciation, depletion, and amortization, with non-cash ceiling test charges treated as depreciation and (ii) theaccounting effects of the segment being moved from continuing operations to discontinued operations.
2Margin enhancement is defined as operations and maintenance expense cost below a target of $102 million, excluding accounting changes due to thesegment being moved from continuing operations to discontinued operations.
3Earnings per share are diluted and adjusted and exclude (i) Fidelity and (ii) the effect on earnings at the MDU Resources Group, Inc. level of intersegmenteliminations.
4Earnings are defined as GAAP earnings.
Our Named Executive Officers’ Target Annual Incentive CompensationThe compensation committee established the named executive officers’ 2015 target annual incentive as a percentage of each officer’s basesalary as follows:
• Mr. Goodin’s 2015 target annual incentive was reduced from 150% to 100% of base salary, or $755,000, based on the competitiveassessment, which showed median annual incentives of $955,000 for the salary survey companies and $659,000 for the performancegraph peer group. The committee’s rationale was, in conjunction with an increase in target long-term incentive compensation, to bringMr. Goodin’s total compensation in close alignment with the performance graph peer group, but below the survey data.
• Mr. Schwartz’s 2015 target annual incentive was increased to 65% of base salary, which was the percent associated with his newsalary grade J.
Proxy Statement
MDU Resources Group, Inc. Proxy Statement 27
• Mr. Barney’s 2015 target annual incentive was set at 80% of base salary, a decrease from 85% of base salary in 2014. The decreasewas part of the committee’s plan to reduce his annual target incentive to 65% of base salary, the target annual incentive associatedwith salary grade J, by 2017, while increasing his long-term incentive target to the guideline for his salary grade over the same timeperiod.
• Mr. Thiede’s 2015 target incentive was also decreased from 85% to 80% of base salary, continuing the transition of his incentivecompensation from what it had been prior to his promotion in 2013 to having a target equal to those of other salary grade Jparticipants by 2017.
• Mr. O’Bryan’s 2015 target incentive was increased from 75% to 200% of base salary in order to compensate him for not receiving along-term incentive award in 2015 and
• Mr. Bietz’s 2015 target incentive was unchanged at 65% of base salary, which was consistent with the percent associated with hissalary grade.
Company Goals Applicable to All ExecutivesAs in prior years, the compensation committee established an MDU Resources Group, Inc. goal applicable to all executives that comprised25% of the annual incentive award. However, for 2015, in light of the potential marketing of Fidelity, the compensation committee dividedthis goal into two components:
• MDU Resources Group, Inc. Component
◦ comprised of all business segments except Fidelity
◦ constituted 20% of the annual incentive, reduced from 25% in prior years
◦ based on diluted adjusted earnings per share, excluding Fidelity
◦ excludes the effect on earnings at the company level of intersegment eliminations, the effect on other business segments and on MDUResources Group, Inc. of Fidelity becoming a discontinued operation for accounting purposes for 2015, and the income statementimpact of a loss on a board-approved asset sale or disposition other than Fidelity
◦ payout could range from no payment if results were below 85% level of $0.95 to a 200% payout if results were $1.29 or higher
◦ target set at $1.12, as adjusted, below 2014 target of $1.48 and below adjusted 2014 results of $1.50 to reflect continued solidexecution in all business segments, significant investments in our electric and natural gas distribution, and the exclusion of Fidelity.
Earnings per share for 2015 were, on a GAAP basis, $(3.20) and, on an adjusted basis excluding Fidelity and as described above, were$0.85, which was below the threshold amount for payment. The payment on this component was 0.0% of target.
• Fidelity Exploration & Production Company Component
◦ comprised of Fidelity
◦ constituted 5% of the annual incentive
◦ based on pretax operating income excluding depreciation, depletion, and amortization
◦ target set at $106 million for the year to reflect anticipated production, planned capital expenditures, and operations and maintenanceexpense
◦ payout could range from no payment if results were below 80% of target or $84.8 million to a 200% payout if results were $127.2million or higher for the year
◦ a sale of Fidelity during 2015 would trigger a prorated payment on earned incentives measured in cumulative monthly results versuscumulative monthly goals.
Because over 75% of the assets of Fidelity were sold prior to December 31, 2015, the target of $106 million was adjusted, based on thecumulative monthly results, to $99.7 million. The 2015 results on the Fidelity goal were $96.5 million, equating to a 86.6% of targetpayment on this component.
Proxy Statement
28 MDU Resources Group, Inc. Proxy Statement
Construction Materials and Contracting Segment Earnings Per Share and Return on Invested Capital GoalsFor Mr. Barney, 75% of the 2015 award opportunity was based on allocated earnings per share and return on invested capital, equallyweighted. The committee set the 2015 allocated earnings per share target at $0.94, which was higher than the 2014 target of $0.83 andactual results of $0.79, to reflect anticipated higher margins, partially offset by reduced backlog and flat material sales. The committee setthe 2015 return on invested capital target at 7.2%, higher than the 2014 target of 6.3% and the 2014 actual results of 6.2%, due tohigher anticipated earnings. Payout could range from no payment if the results were below the 70% of target or $0.66 earnings per shareand 5.0% return on invested capital to a 200% payout if:
• 2015 allocated earnings per share for the segment were at or above the 115% of target or $1.08 and
• 2015 return on invested capital was at or above 115% of target or 8.3%.
The construction materials and contracting segment’s 2015 earnings per share and return on invested capital were 150% and 144.4% oftheir respective 2015 targets, equating to 200% and 200%, respectively, of the target amount attributable to those components, whichcoupled with MDU Resources Group, Inc.’s component being 0.0% of target and the Fidelity component being 86.6% of target, resulted ina 2015 annual incentive payment for Mr. Barney of $487,588 or 154.3% of target.
Construction Services Segment Earnings GoalFor Mr. Thiede, the committee retained its approach from 2014, where 75% of his annual incentive award opportunity was based on theconstruction services segment’s 2015 GAAP earnings. Target earnings levels were selected to balance the difficulty in forecasting, as well asearnings volatility for that segment. Specifically, target earnings of $26 million would be needed to meet the weighted average cost ofcapital, and earnings of $54.5 million, the result necessary to trigger payment of the maximum award, would be needed to drive a return oninvested capital of approximately 15%. The committee felt these increased earnings levels from the 2014 target were appropriate given thatthey were above the business segment’s 2015 projected weighted average cost of capital. Payout could range from no payment if the resultswere below the 85% of target earnings (increased from 70% in 2014 to be consistent with other business segment heads) or $22.1 millionto 200% (reduced from 250% in 2014 to be consistent with other business segment heads) of the target amount if the results were at orabove $54.5 million.
The construction services segment’s 2015 earnings were $23.8 million, equating to a 57.7% payment on the segment’s earningscomponent, which coupled with MDU Resources Group, Inc.’s earnings per share being 0.0% of target and the Fidelity component being86.6% of target, resulted in a 2015 annual incentive payment for Mr. Thiede of $161,857 or 47.6% of target.
Exploration and Production Segment Pretax Operating Income and Margin Enhancement GoalsFor 2015, the compensation committee changed the goal for the exploration and production segment from a single earnings as adjustedgoal to two goals: pretax operating income and margin enhancement.
For Mr. O’Bryan, 56.25% of his 2015 award opportunity was based on the exploration and production segment’s pretax operating income,excluding (i) depreciation, depletion, and amortization, with non-cash ceiling test charges treated as depreciation and (ii) accounting effectsof the segment being moved from continuing operations to discontinued operations. The committee set the exploration and productionsegment’s 2015 pretax operating income target at $106 million for the year reflecting anticipated production, operations and maintenanceexpense, and planned capital expenditures. Payout could range from no payment if 2015 pretax operating income was below the 80% levelof target or $84.8 million to a 200% payout if the segment’s 2015 pretax operating income was at or above the 120% level or $127.2million for the year.
Because over 75% of the assets of Fidelity were sold prior to December 31, 2015, the target of $106 million was adjusted, based on thecumulative monthly results, to $99.7 million. The segment’s 2015 pretax operating income was $96.5 million equating to a 86.6%payment on this component.
Margin enhancement was used for 18.75% of Mr. O’Bryan’s award opportunity, with margin enhancement defined as operations andmaintenance expense below a target of $102 million for the year. Payout could range from no payment if 2015 margin enhancement washigher than the 100% level of $102 million to a 200% payout if 2015 margin enhancement was equal to or less than the 92.5% level oftarget or $94.4 million for the year.
Because over 75% of the assets of Fidelity were sold prior to December 31, 2015, the target of $102 million was adjusted, based on thecumulative monthly results, to $95.4 million. The segment’s 2015 operations and maintenance expense was $91.1 million equating to a160.1% payment on this component.
Proxy Statement
MDU Resources Group, Inc. Proxy Statement 29
Mr. O’Bryan was required to remain employed by Fidelity until the time of sale in order to receive payment. Since most of Fidelity was soldprior to December 31, 2015, and Mr. O’Bryan remained employed through that date, when coupled with MDU Resources Group, Inc.’searnings per share being 0.0% of target and the Fidelity component being 86.6% of target, this resulted in a 2015 annual incentivepayment for Mr. O’Bryan of $747,000 or 83.0% of target.
Pipeline and Energy Services Segment Earnings Per Share, Return on Invested Capital, and Safety GoalsFor Mr. Bietz, 75% of his 2015 award opportunity was based on the pipeline and energy service segment’s allocated earnings per share andtarget return on invested capital, equally weighted. For 2015, the committee set the pipeline and energy service segment’s allocatedearnings per share target at $1.64 and return on invested capital target at 5.6%. The 2015 earnings per share target was higher than the2014 target of $0.98 and 2014 actual of $1.36, reflecting expected higher earnings due to the operation of the Dakota Prairie Refinery andthe full impact of the 2014 rate case, partially offset by anticipated lower prices at the Pronghorn facility and higher operations andmaintenance expense. For the same reasons, the 2015 return on invested capital target of 5.6% was set higher than the 2014 target of3.9% and the 2014 actual results of 5.1%. Payout could range from no payment if the results were below the 85% of target or $1.39earnings per share and 4.8% return on invested capital to a 200% payout if:
• the 2015 allocated earnings per share for the segment were at or above the 115% of target or $1.89 and
• the 2015 return on invested capital was at or above the 115% of target or 6.4%.
Mr. Bietz also had five individual goals relating to safety results with each goal that was not met reducing the annual incentive award by 1%.The five individual goals were:
• each established local safety committee will conduct eight meetings per year
• each established local safety committee must conduct four site assessments per year
• 90% (increased from 85%) or more of motor vehicle accidents and personal injuries must be reported by the end of the next business day
• achieve the targeted vehicle accident incident rate of 1.75 (decreased from 1.85) or less and
• achieve the targeted personal injury incident rate of 1.85 (decreased from 2.1) or less.
Results at the pipeline and energy services segment (before adjustment for the five safety goals) were negative on 2015 allocated earningsper share and return on invested capital, equating to 0.0% and 0.0%, respectively, of the target amount attributable to those components.These results, coupled with MDU Resources Group, Inc.’s earnings per share being 0.0% of target, the Fidelity component being 86.6% oftarget, and four of the five safety goals being met, resulted in 4.3% of the total annual incentive award target being met. Because of hisretirement in July 2015, Mr. Bietz did not receive payment of his annual incentive.
Electric and Natural Gas Distribution Segments Earnings Per Share and Return on Invested Capital GoalsFor the electric and natural gas distribution segments, 75% of the 2015 award opportunity was based on allocated earnings per share andtarget return on invested capital, equally weighted. The committee set the 2015 target for allocated earnings per share at $1.26, which wasbelow the 2014 target of $1.30 but higher than the 2014 actual results of $1.16, to reflect expected higher earnings, partially offset byexpected higher operations and maintenance expense and higher depreciation costs. The committee set the 2015 return on invested capitaltarget at 5.3%, which was lower than the 2014 target level of 5.7% and equal to the 2014 actual results, to reflect higher invested capitalin 2015 with incremental earnings associated with these investments not being fully realized until after 2015. The 2015 return on investedcapital target was above the segment’s projected 2015 weighted average cost of capital. Payout could range from no payment if theallocated earnings per share and return on invested capital results were below the 85% of target or $1.07 earnings per share and 4.5%return on invested capital, respectively, to a 200% payout if:
• the 2015 allocated earnings per share for the segment were at or above the 115% of target or $1.45 and
• the 2015 return on invested capital was at or above the 115% of target or 6.1%.
The electric and natural gas distribution segments’ 2015 earnings per share and return on invested capital were less than 85% of theirrespective 2015 targets, equating to 0.0% and 0.0%, respectively, of the target amount attributable to those components. These results,coupled with MDU Resources Group, Inc.’s earnings per share being 0.0% of target and the Fidelity component being 86.6% of target, ledto overall results for these segments of 4.3% of the 2015 target annual incentive award.
Proxy Statement
30 MDU Resources Group, Inc. Proxy Statement
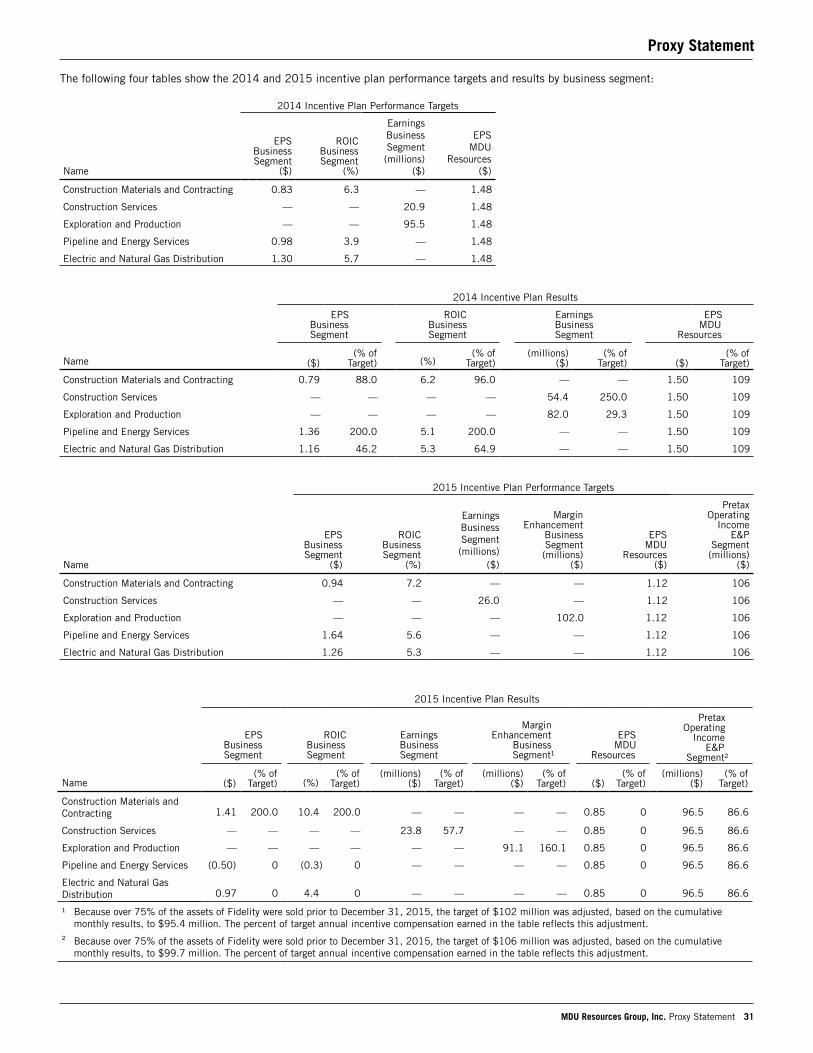
The following four tables show the 2014 and 2015 incentive plan performance targets and results by business segment:
2014 Incentive Plan Performance Targets
Name
EPSBusinessSegment
($)
ROICBusinessSegment
(%)
EarningsBusinessSegment (millions)
($)
EPSMDU
Resources($)
Construction Materials and Contracting 0.83 6.3 — 1.48
Construction Services — — 20.9 1.48
Exploration and Production — — 95.5 1.48
Pipeline and Energy Services 0.98 3.9 — 1.48
Electric and Natural Gas Distribution 1.30 5.7 — 1.48
2014 Incentive Plan Results
EPS Business Segment
ROIC Business Segment
Earnings Business Segment
EPS MDUResources
Name ($)(% of
Target) (%)(% of
Target)(millions)
($)(% of
Target) ($)(% of
Target)
Construction Materials and Contracting 0.79 88.0 6.2 96.0 — — 1.50 109
Construction Services — — — — 54.4 250.0 1.50 109
Exploration and Production — — — — 82.0 29.3 1.50 109
Pipeline and Energy Services 1.36 200.0 5.1 200.0 — — 1.50 109
Electric and Natural Gas Distribution 1.16 46.2 5.3 64.9 — — 1.50 109
2015 Incentive Plan Performance Targets
Name
EPSBusinessSegment
($)
ROIC BusinessSegment
(%)
EarningsBusinessSegment(millions)
($)
MarginEnhancement
BusinessSegment(millions)
($)
EPS MDU
Resources ($)
Pretax Operating
IncomeE&P
Segment (millions)
($)
Construction Materials and Contracting 0.94 7.2 — — 1.12 106
Construction Services — — 26.0 — 1.12 106
Exploration and Production — — — 102.0 1.12 106
Pipeline and Energy Services 1.64 5.6 — — 1.12 106
Electric and Natural Gas Distribution 1.26 5.3 — — 1.12 106
2015 Incentive Plan Results
EPS Business Segment
ROIC Business Segment
EarningsBusiness Segment
MarginEnhancement Business
Segment¹
EPS MDUResources
Pretax Operating Income E&P
Segment²
Name ($)(% of
Target) (%)(% of
Target)(millions)
($)(% of
Target)(millions)
($)(% of
Target) ($)(% of
Target)(millions)
($)(% of
Target)
Construction Materials andContracting 1.41 200.0 10.4 200.0 — — — — 0.85 0 96.5 86.6
Construction Services — — — — 23.8 57.7 — — 0.85 0 96.5 86.6
Exploration and Production — — — — — — 91.1 160.1 0.85 0 96.5 86.6
Pipeline and Energy Services (0.50) 0 (0.3) 0 — — — — 0.85 0 96.5 86.6
Electric and Natural GasDistribution 0.97 0 4.4 0 — — — — 0.85 0 96.5 86.6
¹ Because over 75% of the assets of Fidelity were sold prior to December 31, 2015, the target of $102 million was adjusted, based on the cumulativemonthly results, to $95.4 million. The percent of target annual incentive compensation earned in the table reflects this adjustment.
² Because over 75% of the assets of Fidelity were sold prior to December 31, 2015, the target of $106 million was adjusted, based on the cumulativemonthly results, to $99.7 million. The percent of target annual incentive compensation earned in the table reflects this adjustment.
Proxy Statement
MDU Resources Group, Inc. Proxy Statement 31
Messrs. Goodin’s and Schwartz’s 2015 annual incentives were earned at 49.9% of target based on the following:
Column APercentage of
Annual IncentiveTarget Achieved
Column B Percentage of
Average Invested Capital Column A x Column B
Construction Materials and Contracting 154.3% 19.6% 30.2%
Construction Services 47.6% 6.9% 3.3%
Exploration and Production 83.0% 16.8% 13.9%
Pipeline and Energy Services 4.3% 13.1% 0.6%
Electric and Natural Gas Distribution 4.3% 43.6% 1.9%
Total (Payout Percentage) 49.9%
Additional Annual Incentives Mr. Barney received an additional annual incentive opportunity of $150,000 tied to the construction materials and contracting segment’soperating cash flow. The committee granted this award to provide an extra focus on cash flow management, where Mr. Barney’s successwould help fund growth opportunities at other business segments. Payment would be made only if the goal was met or exceeded, withoutany scaling of payment for results above or below the target. The committee set operating cash flow of $109.2 million as the goal, excludingthe effect of acquisitions or dispositions approved by the board of directors. The 2015 results were $154.1 million resulting in a payment of$150,000 to Mr. Barney.
Mr. O’Bryan had two additional annual incentive opportunities. He received a cash retention award opportunity in November 2014 before hispromotion, where he would receive $150,000 if he remained an active full-time employee of Fidelity through December 31, 2015 andmaintained a performance rating of “meets expectations” or higher during 2015. He also was granted in May 2015 a sales bonus incentiveof 0.075% of the sale price of Fidelity, plus an award equal to six months’ salary of $225,000. The committee believed that Mr. O’Bryan’sinvolvement in the Fidelity sales process would likely bring significant incremental value and recognized the importance of keepingMr. O’Bryan incentivized to remain with the company and lead a successful sales effort. Mr. O’Bryan received the cash retention award of$150,000 and the sales bonus incentive of $237,425, plus the six months’ salary.
The table below lists each named executive officer’s 2015 base salary, target annual incentive percentage, and the annual (regular andadditional) incentives earned.
Name
2015Base
Salary(000s)
($)
2015Target
AnnualIncentive
(%)
2015Annual
IncentiveEarned
2015 Additional
Annual Incentives
Earned(000s)
($)(% of Target)(000s)
($)
David L. Goodin 755.0 100.0 49.9 376.7
Doran N. Schwartz 380.0 65.0 49.9 123.3
David C. Barney 395.0 80.0 154.3 487.6 150.0
Jeffrey S. Thiede 425.0 80.0 47.6 161.9
Patrick L. O’Bryan 450.0 200.0 83.0 747.0 612.41
Steven L. Bietz2 395.0 65.01
Consists of $150,000 cash retention award, $237,425 sales bonus, and $225,000 salary.2
Because of his retirement in July 2015, Mr. Bietz did not receive payment of his annual incentive.
Deferral of Annual Incentive Compensation We provide executives the opportunity to defer receipt of earned annual incentives. If an executive chooses to defer his or her annualincentive, we will credit the deferral with interest at a rate determined by the compensation committee. For 2015, the committee chose touse the average of (i) the number that results from adding the daily Moody’s U.S. Long-Term Corporate Bond Yield Average for “A” ratedcompanies as of the last day of each month for the 12-month period ending October 31 and dividing by 12, and (ii) the number that resultsfrom adding the daily Moody’s U.S. Long-Term Corporate Bond Yield Average for “Baa” rated companies as of the last day of each month forthe 12-month period ending October 31 and dividing by 12. This resulted in an interest rate of 4.66%. The compensation committee’sreasons for using this approach recognized:
Proxy Statement
32 MDU Resources Group, Inc. Proxy Statement
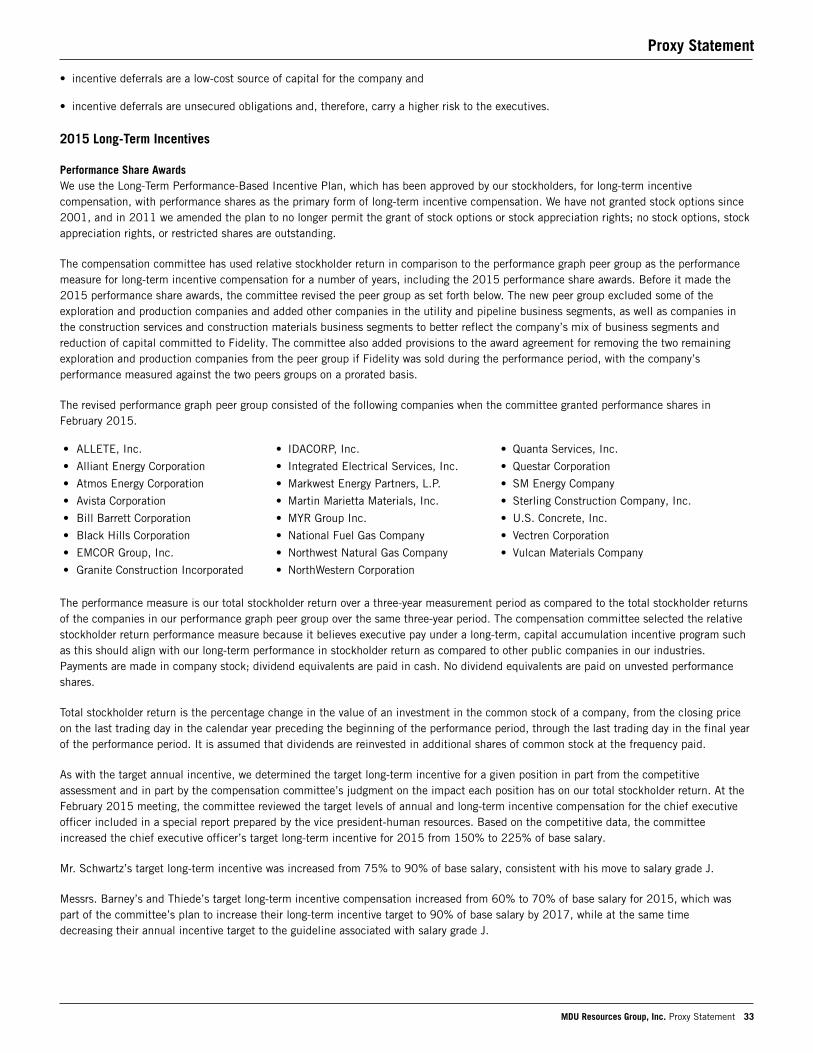
• incentive deferrals are a low-cost source of capital for the company and
• incentive deferrals are unsecured obligations and, therefore, carry a higher risk to the executives.
2015 Long-Term Incentives
Performance Share AwardsWe use the Long-Term Performance-Based Incentive Plan, which has been approved by our stockholders, for long-term incentivecompensation, with performance shares as the primary form of long-term incentive compensation. We have not granted stock options since2001, and in 2011 we amended the plan to no longer permit the grant of stock options or stock appreciation rights; no stock options, stockappreciation rights, or restricted shares are outstanding.
The compensation committee has used relative stockholder return in comparison to the performance graph peer group as the performancemeasure for long-term incentive compensation for a number of years, including the 2015 performance share awards. Before it made the2015 performance share awards, the committee revised the peer group as set forth below. The new peer group excluded some of theexploration and production companies and added other companies in the utility and pipeline business segments, as well as companies inthe construction services and construction materials business segments to better reflect the company’s mix of business segments andreduction of capital committed to Fidelity. The committee also added provisions to the award agreement for removing the two remainingexploration and production companies from the peer group if Fidelity was sold during the performance period, with the company’sperformance measured against the two peers groups on a prorated basis.
The revised performance graph peer group consisted of the following companies when the committee granted performance shares inFebruary 2015.
• ALLETE, Inc. • IDACORP, Inc. • Quanta Services, Inc.
• Alliant Energy Corporation • Integrated Electrical Services, Inc. • Questar Corporation
• Atmos Energy Corporation • Markwest Energy Partners, L.P. • SM Energy Company
• Avista Corporation • Martin Marietta Materials, Inc. • Sterling Construction Company, Inc.
• Bill Barrett Corporation • MYR Group Inc. • U.S. Concrete, Inc.
• Black Hills Corporation • National Fuel Gas Company • Vectren Corporation
• EMCOR Group, Inc. • Northwest Natural Gas Company • Vulcan Materials Company
• Granite Construction Incorporated • NorthWestern Corporation
The performance measure is our total stockholder return over a three-year measurement period as compared to the total stockholder returnsof the companies in our performance graph peer group over the same three-year period. The compensation committee selected the relativestockholder return performance measure because it believes executive pay under a long-term, capital accumulation incentive program suchas this should align with our long-term performance in stockholder return as compared to other public companies in our industries.Payments are made in company stock; dividend equivalents are paid in cash. No dividend equivalents are paid on unvested performanceshares.
Total stockholder return is the percentage change in the value of an investment in the common stock of a company, from the closing priceon the last trading day in the calendar year preceding the beginning of the performance period, through the last trading day in the final yearof the performance period. It is assumed that dividends are reinvested in additional shares of common stock at the frequency paid.
As with the target annual incentive, we determined the target long-term incentive for a given position in part from the competitiveassessment and in part by the compensation committee’s judgment on the impact each position has on our total stockholder return. At theFebruary 2015 meeting, the committee reviewed the target levels of annual and long-term incentive compensation for the chief executiveofficer included in a special report prepared by the vice president-human resources. Based on the competitive data, the committeeincreased the chief executive officer’s target long-term incentive for 2015 from 150% to 225% of base salary.
Mr. Schwartz’s target long-term incentive was increased from 75% to 90% of base salary, consistent with his move to salary grade J.
Messrs. Barney’s and Thiede’s target long-term incentive compensation increased from 60% to 70% of base salary for 2015, which waspart of the committee’s plan to increase their long-term incentive target to 90% of base salary by 2017, while at the same timedecreasing their annual incentive target to the guideline associated with salary grade J.
Proxy Statement
MDU Resources Group, Inc. Proxy Statement 33
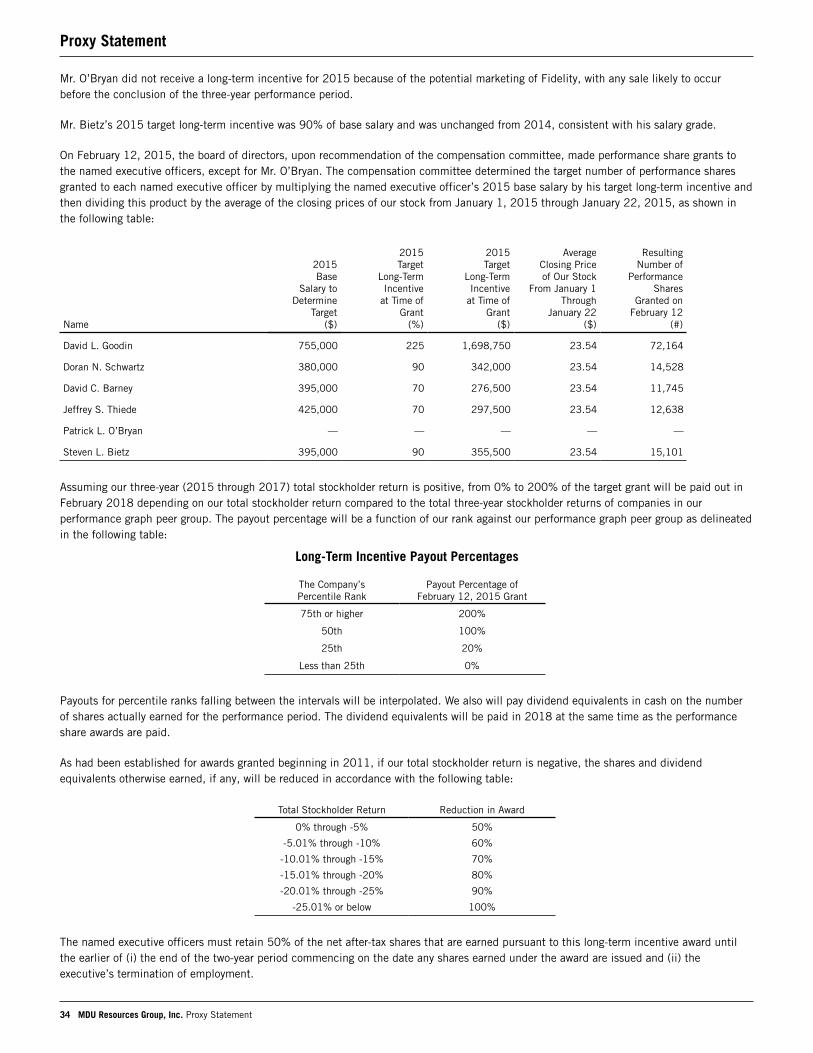
Mr. O’Bryan did not receive a long-term incentive for 2015 because of the potential marketing of Fidelity, with any sale likely to occurbefore the conclusion of the three-year performance period.
Mr. Bietz’s 2015 target long-term incentive was 90% of base salary and was unchanged from 2014, consistent with his salary grade.
On February 12, 2015, the board of directors, upon recommendation of the compensation committee, made performance share grants tothe named executive officers, except for Mr. O’Bryan. The compensation committee determined the target number of performance sharesgranted to each named executive officer by multiplying the named executive officer’s 2015 base salary by his target long-term incentive andthen dividing this product by the average of the closing prices of our stock from January 1, 2015 through January 22, 2015, as shown inthe following table:
Name
2015Base
Salary toDetermine
Target($)
2015Target
Long-TermIncentive
at Time of Grant
(%)
2015 Target
Long-Term Incentive
at Time of Grant
($)
Average Closing Price of Our Stock
From January 1 Through
January 22 ($)
ResultingNumber of
PerformanceShares
Granted onFebruary 12
(#)
David L. Goodin 755,000 225 1,698,750 23.54 72,164
Doran N. Schwartz 380,000 90 342,000 23.54 14,528
David C. Barney 395,000 70 276,500 23.54 11,745
Jeffrey S. Thiede 425,000 70 297,500 23.54 12,638
Patrick L. O’Bryan — — — — —
Steven L. Bietz 395,000 90 355,500 23.54 15,101
Assuming our three-year (2015 through 2017) total stockholder return is positive, from 0% to 200% of the target grant will be paid out inFebruary 2018 depending on our total stockholder return compared to the total three-year stockholder returns of companies in ourperformance graph peer group. The payout percentage will be a function of our rank against our performance graph peer group as delineatedin the following table:
Long-Term Incentive Payout Percentages
The Company’sPercentile Rank
Payout Percentage of February 12, 2015 Grant
75th or higher 200%
50th 100%
25th 20%
Less than 25th 0%
Payouts for percentile ranks falling between the intervals will be interpolated. We also will pay dividend equivalents in cash on the numberof shares actually earned for the performance period. The dividend equivalents will be paid in 2018 at the same time as the performanceshare awards are paid.
As had been established for awards granted beginning in 2011, if our total stockholder return is negative, the shares and dividendequivalents otherwise earned, if any, will be reduced in accordance with the following table:
Total Stockholder Return Reduction in Award
0% through -5% 50%
-5.01% through -10% 60%
-10.01% through -15% 70%
-15.01% through -20% 80%
-20.01% through -25% 90%
-25.01% or below 100%
The named executive officers must retain 50% of the net after-tax shares that are earned pursuant to this long-term incentive award untilthe earlier of (i) the end of the two-year period commencing on the date any shares earned under the award are issued and (ii) theexecutive’s termination of employment.
Proxy Statement
34 MDU Resources Group, Inc. Proxy Statement
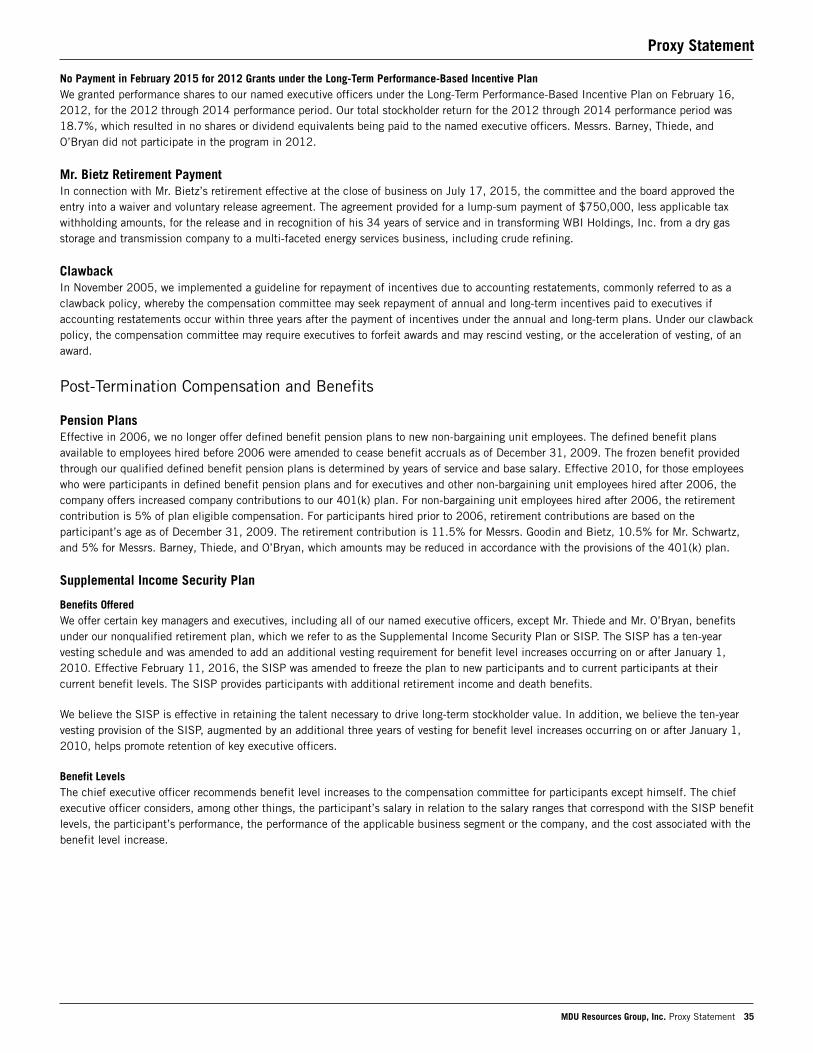
No Payment in February 2015 for 2012 Grants under the Long-Term Performance-Based Incentive PlanWe granted performance shares to our named executive officers under the Long-Term Performance-Based Incentive Plan on February 16,2012, for the 2012 through 2014 performance period. Our total stockholder return for the 2012 through 2014 performance period was18.7%, which resulted in no shares or dividend equivalents being paid to the named executive officers. Messrs. Barney, Thiede, andO’Bryan did not participate in the program in 2012.
Mr. Bietz Retirement Payment In connection with Mr. Bietz’s retirement effective at the close of business on July 17, 2015, the committee and the board approved theentry into a waiver and voluntary release agreement. The agreement provided for a lump-sum payment of $750,000, less applicable taxwithholding amounts, for the release and in recognition of his 34 years of service and in transforming WBI Holdings, Inc. from a dry gasstorage and transmission company to a multi-faceted energy services business, including crude refining.
Clawback In November 2005, we implemented a guideline for repayment of incentives due to accounting restatements, commonly referred to as aclawback policy, whereby the compensation committee may seek repayment of annual and long-term incentives paid to executives ifaccounting restatements occur within three years after the payment of incentives under the annual and long-term plans. Under our clawbackpolicy, the compensation committee may require executives to forfeit awards and may rescind vesting, or the acceleration of vesting, of anaward.
Post-Termination Compensation and Benefits
Pension PlansEffective in 2006, we no longer offer defined benefit pension plans to new non-bargaining unit employees. The defined benefit plansavailable to employees hired before 2006 were amended to cease benefit accruals as of December 31, 2009. The frozen benefit providedthrough our qualified defined benefit pension plans is determined by years of service and base salary. Effective 2010, for those employeeswho were participants in defined benefit pension plans and for executives and other non-bargaining unit employees hired after 2006, thecompany offers increased company contributions to our 401(k) plan. For non-bargaining unit employees hired after 2006, the retirementcontribution is 5% of plan eligible compensation. For participants hired prior to 2006, retirement contributions are based on theparticipant’s age as of December 31, 2009. The retirement contribution is 11.5% for Messrs. Goodin and Bietz, 10.5% for Mr. Schwartz,and 5% for Messrs. Barney, Thiede, and O’Bryan, which amounts may be reduced in accordance with the provisions of the 401(k) plan.
Supplemental Income Security Plan
Benefits OfferedWe offer certain key managers and executives, including all of our named executive officers, except Mr. Thiede and Mr. O’Bryan, benefitsunder our nonqualified retirement plan, which we refer to as the Supplemental Income Security Plan or SISP. The SISP has a ten-yearvesting schedule and was amended to add an additional vesting requirement for benefit level increases occurring on or after January 1,2010. Effective February 11, 2016, the SISP was amended to freeze the plan to new participants and to current participants at theircurrent benefit levels. The SISP provides participants with additional retirement income and death benefits.
We believe the SISP is effective in retaining the talent necessary to drive long-term stockholder value. In addition, we believe the ten-yearvesting provision of the SISP, augmented by an additional three years of vesting for benefit level increases occurring on or after January 1,2010, helps promote retention of key executive officers.
Benefit LevelsThe chief executive officer recommends benefit level increases to the compensation committee for participants except himself. The chiefexecutive officer considers, among other things, the participant’s salary in relation to the salary ranges that correspond with the SISP benefitlevels, the participant’s performance, the performance of the applicable business segment or the company, and the cost associated with thebenefit level increase.
Proxy Statement
MDU Resources Group, Inc. Proxy Statement 35
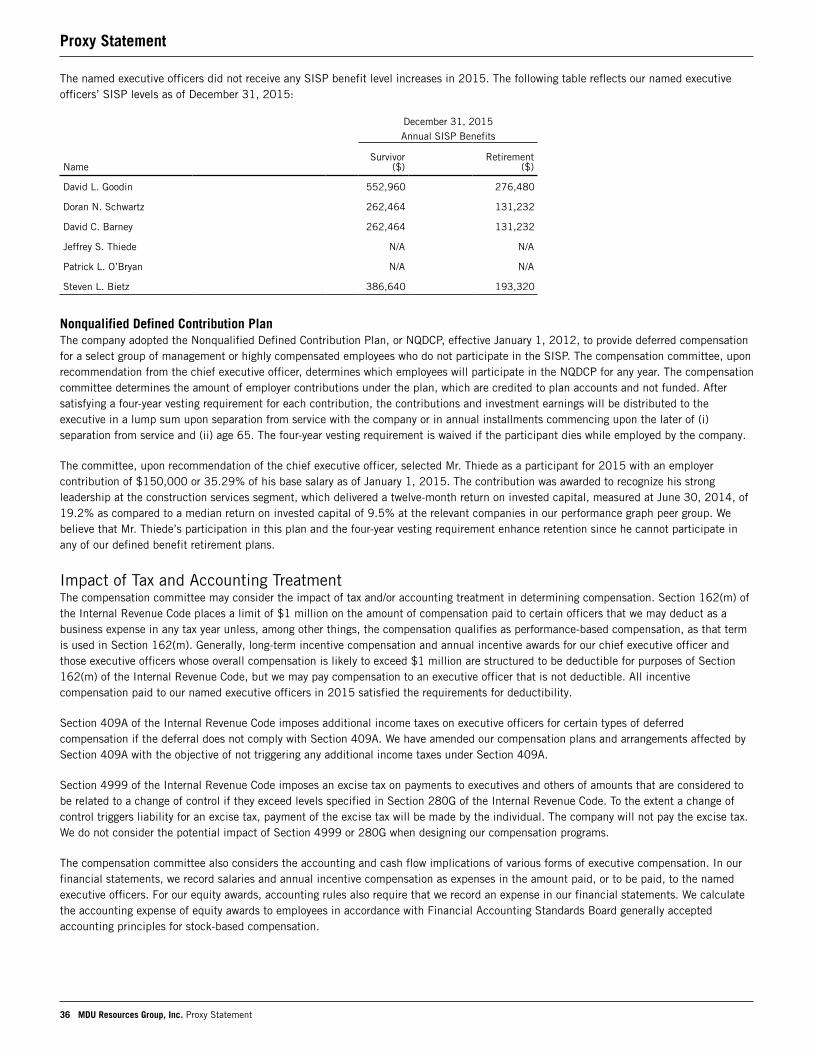
The named executive officers did not receive any SISP benefit level increases in 2015. The following table reflects our named executiveofficers’ SISP levels as of December 31, 2015:
December 31, 2015Annual SISP Benefits
NameSurvivor
($)Retirement
($)
David L. Goodin 552,960 276,480
Doran N. Schwartz 262,464 131,232
David C. Barney 262,464 131,232
Jeffrey S. Thiede N/A N/A
Patrick L. O’Bryan N/A N/A
Steven L. Bietz 386,640 193,320
Nonqualified Defined Contribution PlanThe company adopted the Nonqualified Defined Contribution Plan, or NQDCP, effective January 1, 2012, to provide deferred compensationfor a select group of management or highly compensated employees who do not participate in the SISP. The compensation committee, uponrecommendation from the chief executive officer, determines which employees will participate in the NQDCP for any year. The compensationcommittee determines the amount of employer contributions under the plan, which are credited to plan accounts and not funded. Aftersatisfying a four-year vesting requirement for each contribution, the contributions and investment earnings will be distributed to theexecutive in a lump sum upon separation from service with the company or in annual installments commencing upon the later of (i)separation from service and (ii) age 65. The four-year vesting requirement is waived if the participant dies while employed by the company.
The committee, upon recommendation of the chief executive officer, selected Mr. Thiede as a participant for 2015 with an employercontribution of $150,000 or 35.29% of his base salary as of January 1, 2015. The contribution was awarded to recognize his strongleadership at the construction services segment, which delivered a twelve-month return on invested capital, measured at June 30, 2014, of19.2% as compared to a median return on invested capital of 9.5% at the relevant companies in our performance graph peer group. Webelieve that Mr. Thiede’s participation in this plan and the four-year vesting requirement enhance retention since he cannot participate inany of our defined benefit retirement plans.
Impact of Tax and Accounting TreatmentThe compensation committee may consider the impact of tax and/or accounting treatment in determining compensation. Section 162(m) ofthe Internal Revenue Code places a limit of $1 million on the amount of compensation paid to certain officers that we may deduct as abusiness expense in any tax year unless, among other things, the compensation qualifies as performance-based compensation, as that termis used in Section 162(m). Generally, long-term incentive compensation and annual incentive awards for our chief executive officer andthose executive officers whose overall compensation is likely to exceed $1 million are structured to be deductible for purposes of Section162(m) of the Internal Revenue Code, but we may pay compensation to an executive officer that is not deductible. All incentivecompensation paid to our named executive officers in 2015 satisfied the requirements for deductibility.
Section 409A of the Internal Revenue Code imposes additional income taxes on executive officers for certain types of deferredcompensation if the deferral does not comply with Section 409A. We have amended our compensation plans and arrangements affected bySection 409A with the objective of not triggering any additional income taxes under Section 409A.
Section 4999 of the Internal Revenue Code imposes an excise tax on payments to executives and others of amounts that are considered tobe related to a change of control if they exceed levels specified in Section 280G of the Internal Revenue Code. To the extent a change ofcontrol triggers liability for an excise tax, payment of the excise tax will be made by the individual. The company will not pay the excise tax.We do not consider the potential impact of Section 4999 or 280G when designing our compensation programs.
The compensation committee also considers the accounting and cash flow implications of various forms of executive compensation. In ourfinancial statements, we record salaries and annual incentive compensation as expenses in the amount paid, or to be paid, to the namedexecutive officers. For our equity awards, accounting rules also require that we record an expense in our financial statements. We calculatethe accounting expense of equity awards to employees in accordance with Financial Accounting Standards Board generally acceptedaccounting principles for stock-based compensation.
Proxy Statement
36 MDU Resources Group, Inc. Proxy Statement
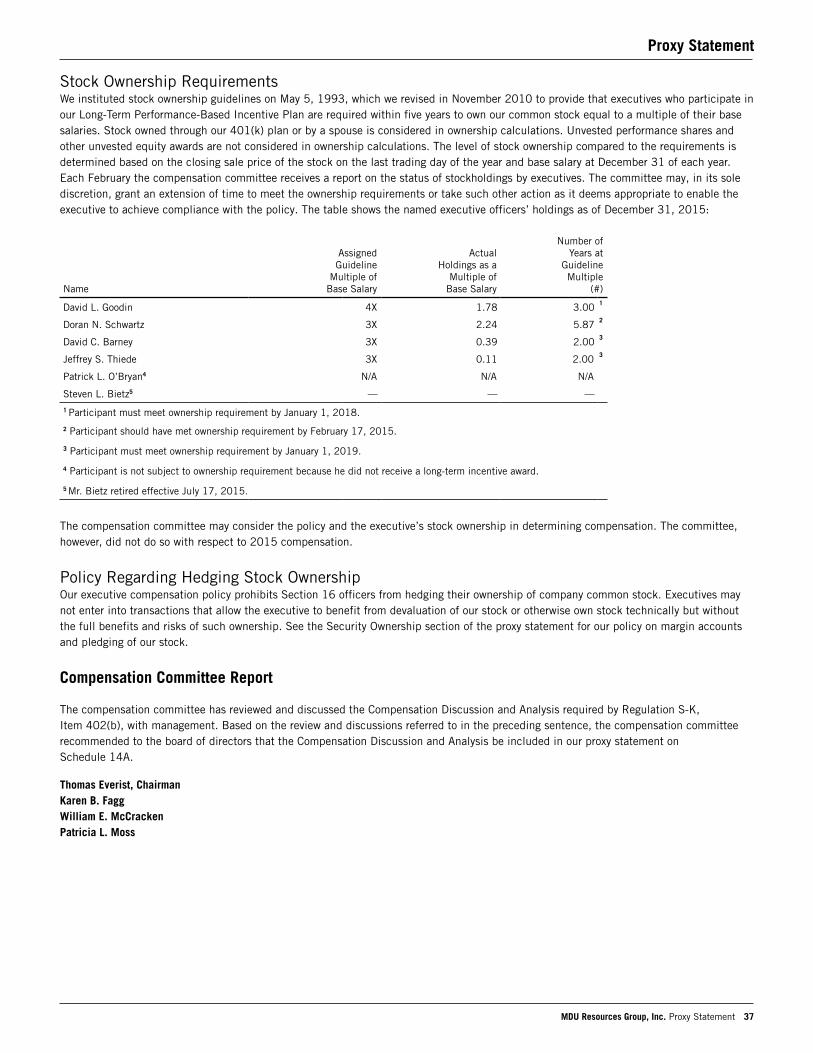
Stock Ownership RequirementsWe instituted stock ownership guidelines on May 5, 1993, which we revised in November 2010 to provide that executives who participate inour Long-Term Performance-Based Incentive Plan are required within five years to own our common stock equal to a multiple of their basesalaries. Stock owned through our 401(k) plan or by a spouse is considered in ownership calculations. Unvested performance shares andother unvested equity awards are not considered in ownership calculations. The level of stock ownership compared to the requirements isdetermined based on the closing sale price of the stock on the last trading day of the year and base salary at December 31 of each year.Each February the compensation committee receives a report on the status of stockholdings by executives. The committee may, in its solediscretion, grant an extension of time to meet the ownership requirements or take such other action as it deems appropriate to enable theexecutive to achieve compliance with the policy. The table shows the named executive officers’ holdings as of December 31, 2015:
Name
Assigned Guideline
Multiple of Base Salary
Actual Holdings as a
Multiple of Base Salary
Number of Years at
Guideline Multiple
(#)
David L. Goodin 4X 1.78 3.00 1
Doran N. Schwartz 3X 2.24 5.87 2
David C. Barney 3X 0.39 2.00 3
Jeffrey S. Thiede 3X 0.11 2.00 3
Patrick L. O’Bryan4 N/A N/A N/A
Steven L. Bietz5 — — —
1 Participant must meet ownership requirement by January 1, 2018.
2 Participant should have met ownership requirement by February 17, 2015.
3 Participant must meet ownership requirement by January 1, 2019.
4 Participant is not subject to ownership requirement because he did not receive a long-term incentive award.
5 Mr. Bietz retired effective July 17, 2015.
The compensation committee may consider the policy and the executive’s stock ownership in determining compensation. The committee,however, did not do so with respect to 2015 compensation.
Policy Regarding Hedging Stock OwnershipOur executive compensation policy prohibits Section 16 officers from hedging their ownership of company common stock. Executives maynot enter into transactions that allow the executive to benefit from devaluation of our stock or otherwise own stock technically but withoutthe full benefits and risks of such ownership. See the Security Ownership section of the proxy statement for our policy on margin accountsand pledging of our stock.
Compensation Committee Report
The compensation committee has reviewed and discussed the Compensation Discussion and Analysis required by Regulation S-K,Item 402(b), with management. Based on the review and discussions referred to in the preceding sentence, the compensation committeerecommended to the board of directors that the Compensation Discussion and Analysis be included in our proxy statement onSchedule 14A.
Thomas Everist, ChairmanKaren B. Fagg William E. McCrackenPatricia L. Moss
Proxy Statement
MDU Resources Group, Inc. Proxy Statement 37
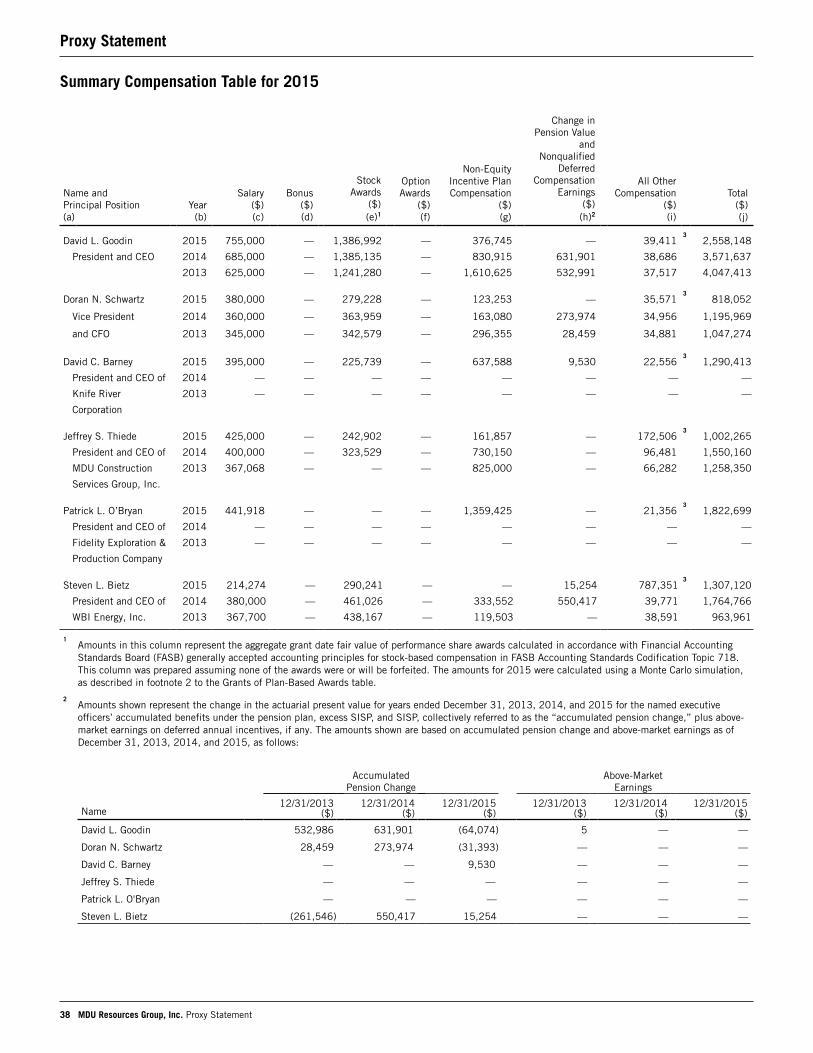
Summary Compensation Table for 2015
AccumulatedPension Change
Above-Market Earnings
Name12/31/2013
($)12/31/2014
($)12/31/2015
($)12/31/2013
($)12/31/2014
($)12/31/2015
($)
David L. Goodin 532,986 631,901 (64,074) 5 — —
Doran N. Schwartz 28,459 273,974 (31,393) — — —
David C. Barney — — 9,530 — — —
Jeffrey S. Thiede — — — — — —
Patrick L. O'Bryan — — — — — —
Steven L. Bietz (261,546) 550,417 15,254 — — —
Name and Principal Position (a)
Year (b)
Salary ($) (c)
Bonus ($) (d)
Stock Awards
($) (e)1
Option Awards
($) (f)
Non-Equity Incentive Plan Compensation
($) (g)
Change in Pension Value
and Nonqualified
Deferred Compensation
Earnings ($) (h)2
All Other Compensation
($) (i)
Total ($) (j)
David L. Goodin 2015 755,000 — 1,386,992 — 376,745 — 39,4113
2,558,148
President and CEO 2014 685,000 — 1,385,135 — 830,915 631,901 38,686 3,571,637
2013 625,000 — 1,241,280 — 1,610,625 532,991 37,517 4,047,413
Doran N. Schwartz 2015 380,000 — 279,228 — 123,253 — 35,5713
818,052
Vice President 2014 360,000 — 363,959 — 163,080 273,974 34,956 1,195,969
and CFO 2013 345,000 — 342,579 — 296,355 28,459 34,881 1,047,274
David C. Barney 2015 395,000 — 225,739 — 637,588 9,530 22,5563
1,290,413
President and CEO of 2014 — — — — — — — —
Knife River 2013 — — — — — — — —
Corporation
Jeffrey S. Thiede 2015 425,000 — 242,902 — 161,857 — 172,5063
1,002,265
President and CEO of 2014 400,000 — 323,529 — 730,150 — 96,481 1,550,160
MDU Construction 2013 367,068 — — — 825,000 — 66,282 1,258,350
Services Group, Inc.
Patrick L. O’Bryan 2015 441,918 — — — 1,359,425 — 21,3563
1,822,699
President and CEO of 2014 — — — — — — — —
Fidelity Exploration & 2013 — — — — — — — —
Production Company
Steven L. Bietz 2015 214,274 — 290,241 — — 15,254 787,3513
1,307,120
President and CEO of 2014 380,000 — 461,026 — 333,552 550,417 39,771 1,764,766
WBI Energy, Inc. 2013 367,700 — 438,167 — 119,503 — 38,591 963,961
1Amounts in this column represent the aggregate grant date fair value of performance share awards calculated in accordance with Financial AccountingStandards Board (FASB) generally accepted accounting principles for stock-based compensation in FASB Accounting Standards Codification Topic 718.This column was prepared assuming none of the awards were or will be forfeited. The amounts for 2015 were calculated using a Monte Carlo simulation,as described in footnote 2 to the Grants of Plan-Based Awards table.
2Amounts shown represent the change in the actuarial present value for years ended December 31, 2013, 2014, and 2015 for the named executiveofficers’ accumulated benefits under the pension plan, excess SISP, and SISP, collectively referred to as the “accumulated pension change,” plus above-market earnings on deferred annual incentives, if any. The amounts shown are based on accumulated pension change and above-market earnings as ofDecember 31, 2013, 2014, and 2015, as follows:
Proxy Statement
38 MDU Resources Group, Inc. Proxy Statement
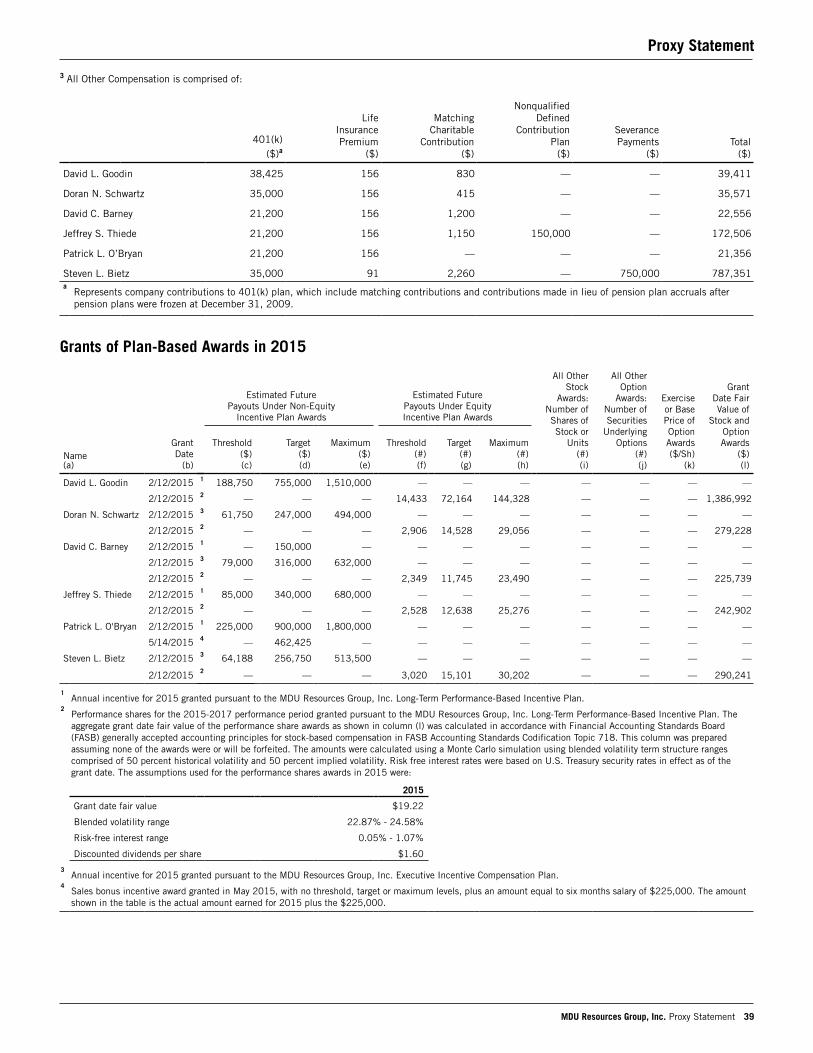
3 All Other Compensation is comprised of:
401(k) ($)a
Life Insurance Premium
($)
Matching Charitable
Contribution ($)
Nonqualified Defined
Contribution Plan
($)
SeverancePayments
($)Total
($)
David L. Goodin 38,425 156 830 — — 39,411
Doran N. Schwartz 35,000 156 415 — — 35,571
David C. Barney 21,200 156 1,200 — — 22,556
Jeffrey S. Thiede 21,200 156 1,150 150,000 — 172,506
Patrick L. O’Bryan 21,200 156 — — — 21,356
Steven L. Bietz 35,000 91 2,260 — 750,000 787,351a
Represents company contributions to 401(k) plan, which include matching contributions and contributions made in lieu of pension plan accruals afterpension plans were frozen at December 31, 2009.
Grants of Plan-Based Awards in 2015
Estimated Future Payouts Under Non-Equity
Incentive Plan Awards
Estimated Future Payouts Under Equity Incentive Plan Awards
All Other Stock
Awards: Number of Shares of Stock or
Units (#) (i)
All Other Option
Awards: Number of Securities
Underlying Options
(#) (j)
Exercise or Base Price of Option Awards ($/Sh)
(k)
Grant Date Fair Value of
Stock and Option Awards
($) (l)
Name (a)
Grant Date
(b)
Threshold ($) (c)
Target ($) (d)
Maximum ($) (e)
Threshold (#) (f)
Target (#) (g)
Maximum (#) (h)
David L. Goodin 2/12/2015 1 188,750 755,000 1,510,000 — — — — — — —
2/12/2015 2 — — — 14,433 72,164 144,328 — — — 1,386,992
Doran N. Schwartz 2/12/2015 3 61,750 247,000 494,000 — — — — — — —
2/12/2015 2 — — — 2,906 14,528 29,056 — — — 279,228
David C. Barney 2/12/2015 1 — 150,000 — — — — — — — —
2/12/2015 3 79,000 316,000 632,000 — — — — — — —
2/12/2015 2 — — — 2,349 11,745 23,490 — — — 225,739
Jeffrey S. Thiede 2/12/2015 1 85,000 340,000 680,000 — — — — — — —
2/12/2015 2 — — — 2,528 12,638 25,276 — — — 242,902
Patrick L. O'Bryan 2/12/2015 1 225,000 900,000 1,800,000 — — — — — — —
5/14/2015 4 — 462,425 — — — — — — — —
Steven L. Bietz 2/12/2015 3 64,188 256,750 513,500 — — — — — — —
2/12/2015 2 — — — 3,020 15,101 30,202 — — — 290,241
1Annual incentive for 2015 granted pursuant to the MDU Resources Group, Inc. Long-Term Performance-Based Incentive Plan.
2Performance shares for the 2015-2017 performance period granted pursuant to the MDU Resources Group, Inc. Long-Term Performance-Based Incentive Plan. Theaggregate grant date fair value of the performance share awards as shown in column (l) was calculated in accordance with Financial Accounting Standards Board(FASB) generally accepted accounting principles for stock-based compensation in FASB Accounting Standards Codification Topic 718. This column was preparedassuming none of the awards were or will be forfeited. The amounts were calculated using a Monte Carlo simulation using blended volatility term structure rangescomprised of 50 percent historical volatility and 50 percent implied volatility. Risk free interest rates were based on U.S. Treasury security rates in effect as of thegrant date. The assumptions used for the performance shares awards in 2015 were:
2015
Grant date fair value $19.22
Blended volatility range 22.87% - 24.58%
Risk-free interest range 0.05% - 1.07%
Discounted dividends per share $1.60
3Annual incentive for 2015 granted pursuant to the MDU Resources Group, Inc. Executive Incentive Compensation Plan.
4Sales bonus incentive award granted in May 2015, with no threshold, target or maximum levels, plus an amount equal to six months salary of $225,000. The amountshown in the table is the actual amount earned for 2015 plus the $225,000.
Proxy Statement
MDU Resources Group, Inc. Proxy Statement 39
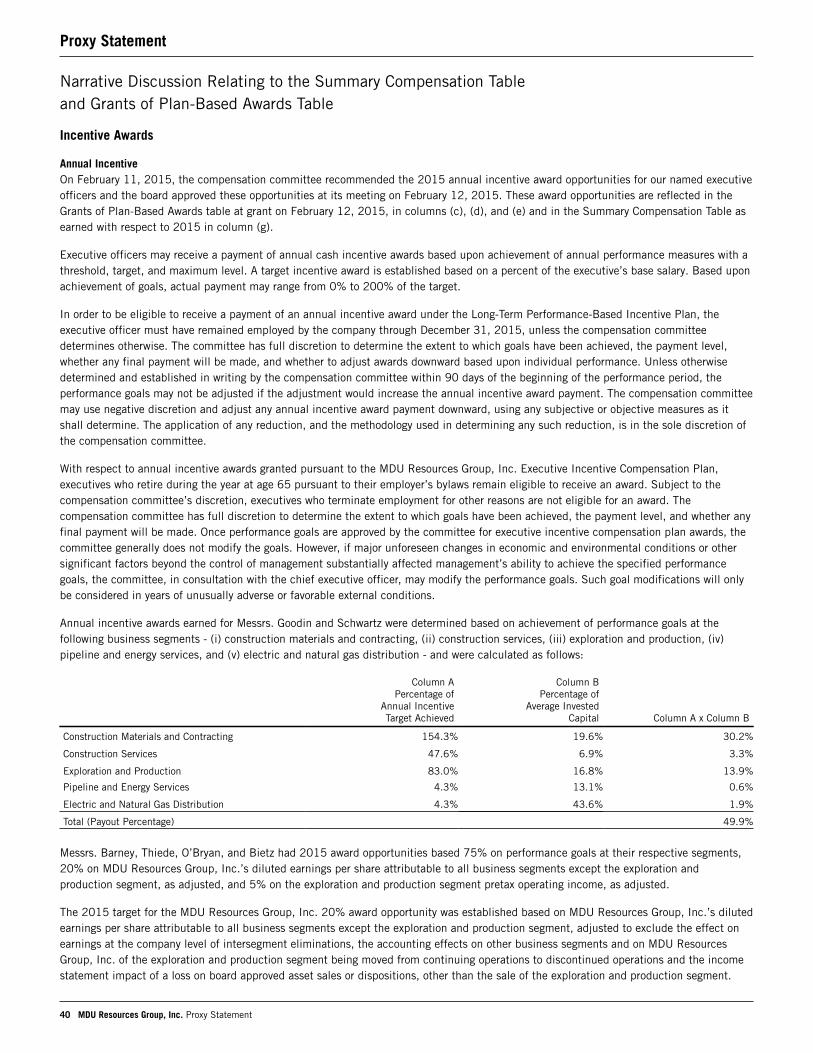
Narrative Discussion Relating to the Summary Compensation Table and Grants of Plan-Based Awards Table
Incentive Awards
Annual IncentiveOn February 11, 2015, the compensation committee recommended the 2015 annual incentive award opportunities for our named executiveofficers and the board approved these opportunities at its meeting on February 12, 2015. These award opportunities are reflected in theGrants of Plan-Based Awards table at grant on February 12, 2015, in columns (c), (d), and (e) and in the Summary Compensation Table asearned with respect to 2015 in column (g).
Executive officers may receive a payment of annual cash incentive awards based upon achievement of annual performance measures with athreshold, target, and maximum level. A target incentive award is established based on a percent of the executive’s base salary. Based uponachievement of goals, actual payment may range from 0% to 200% of the target.
In order to be eligible to receive a payment of an annual incentive award under the Long-Term Performance-Based Incentive Plan, theexecutive officer must have remained employed by the company through December 31, 2015, unless the compensation committeedetermines otherwise. The committee has full discretion to determine the extent to which goals have been achieved, the payment level,whether any final payment will be made, and whether to adjust awards downward based upon individual performance. Unless otherwisedetermined and established in writing by the compensation committee within 90 days of the beginning of the performance period, theperformance goals may not be adjusted if the adjustment would increase the annual incentive award payment. The compensation committeemay use negative discretion and adjust any annual incentive award payment downward, using any subjective or objective measures as itshall determine. The application of any reduction, and the methodology used in determining any such reduction, is in the sole discretion ofthe compensation committee.
With respect to annual incentive awards granted pursuant to the MDU Resources Group, Inc. Executive Incentive Compensation Plan,executives who retire during the year at age 65 pursuant to their employer’s bylaws remain eligible to receive an award. Subject to thecompensation committee’s discretion, executives who terminate employment for other reasons are not eligible for an award. Thecompensation committee has full discretion to determine the extent to which goals have been achieved, the payment level, and whether anyfinal payment will be made. Once performance goals are approved by the committee for executive incentive compensation plan awards, thecommittee generally does not modify the goals. However, if major unforeseen changes in economic and environmental conditions or othersignificant factors beyond the control of management substantially affected management’s ability to achieve the specified performancegoals, the committee, in consultation with the chief executive officer, may modify the performance goals. Such goal modifications will onlybe considered in years of unusually adverse or favorable external conditions.
Annual incentive awards earned for Messrs. Goodin and Schwartz were determined based on achievement of performance goals at thefollowing business segments - (i) construction materials and contracting, (ii) construction services, (iii) exploration and production, (iv)pipeline and energy services, and (v) electric and natural gas distribution - and were calculated as follows:
Column APercentage of
Annual IncentiveTarget Achieved
Column BPercentage of
Average InvestedCapital Column A x Column B
Construction Materials and Contracting 154.3% 19.6% 30.2%
Construction Services 47.6% 6.9% 3.3%
Exploration and Production 83.0% 16.8% 13.9%
Pipeline and Energy Services 4.3% 13.1% 0.6%
Electric and Natural Gas Distribution 4.3% 43.6% 1.9%
Total (Payout Percentage) 49.9%
Messrs. Barney, Thiede, O’Bryan, and Bietz had 2015 award opportunities based 75% on performance goals at their respective segments,20% on MDU Resources Group, Inc.’s diluted earnings per share attributable to all business segments except the exploration andproduction segment, as adjusted, and 5% on the exploration and production segment pretax operating income, as adjusted.
The 2015 target for the MDU Resources Group, Inc. 20% award opportunity was established based on MDU Resources Group, Inc.’s dilutedearnings per share attributable to all business segments except the exploration and production segment, adjusted to exclude the effect onearnings at the company level of intersegment eliminations, the accounting effects on other business segments and on MDU ResourcesGroup, Inc. of the exploration and production segment being moved from continuing operations to discontinued operations and the incomestatement impact of a loss on board approved asset sales or dispositions, other than the sale of the exploration and production segment.
Proxy Statement
40 MDU Resources Group, Inc. Proxy Statement
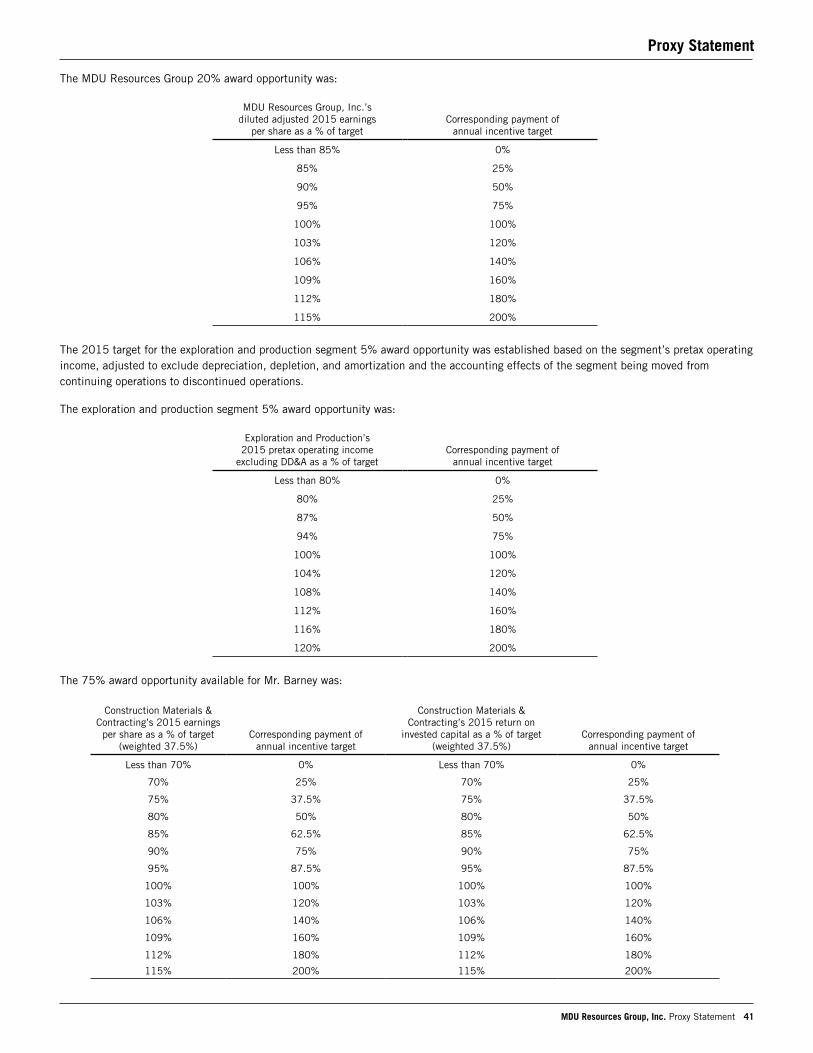
The MDU Resources Group 20% award opportunity was:
MDU Resources Group, Inc.’s diluted adjusted 2015 earnings
per share as a % of targetCorresponding payment of
annual incentive target
Less than 85% 0%
85% 25%
90% 50%
95% 75%
100% 100%
103% 120%
106% 140%
109% 160%
112% 180%
115% 200%
The 2015 target for the exploration and production segment 5% award opportunity was established based on the segment’s pretax operatingincome, adjusted to exclude depreciation, depletion, and amortization and the accounting effects of the segment being moved fromcontinuing operations to discontinued operations.
The exploration and production segment 5% award opportunity was:
Exploration and Production’s 2015 pretax operating income
excluding DD&A as a % of targetCorresponding payment of
annual incentive target
Less than 80% 0%
80% 25%
87% 50%
94% 75%
100% 100%
104% 120%
108% 140%
112% 160%
116% 180%
120% 200%
The 75% award opportunity available for Mr. Barney was:
Construction Materials &Contracting’s 2015 earnings
per share as a % of target(weighted 37.5%)
Corresponding payment of annual incentive target
Construction Materials &Contracting’s 2015 return on
invested capital as a % of target(weighted 37.5%)
Corresponding payment of annual incentive target
Less than 70% 0% Less than 70% 0%
70% 25% 70% 25%
75% 37.5% 75% 37.5%
80% 50% 80% 50%
85% 62.5% 85% 62.5%
90% 75% 90% 75%
95% 87.5% 95% 87.5%
100% 100% 100% 100%
103% 120% 103% 120%
106% 140% 106% 140%
109% 160% 109% 160%
112% 180% 112% 180%
115% 200% 115% 200%
Proxy Statement
MDU Resources Group, Inc. Proxy Statement 41
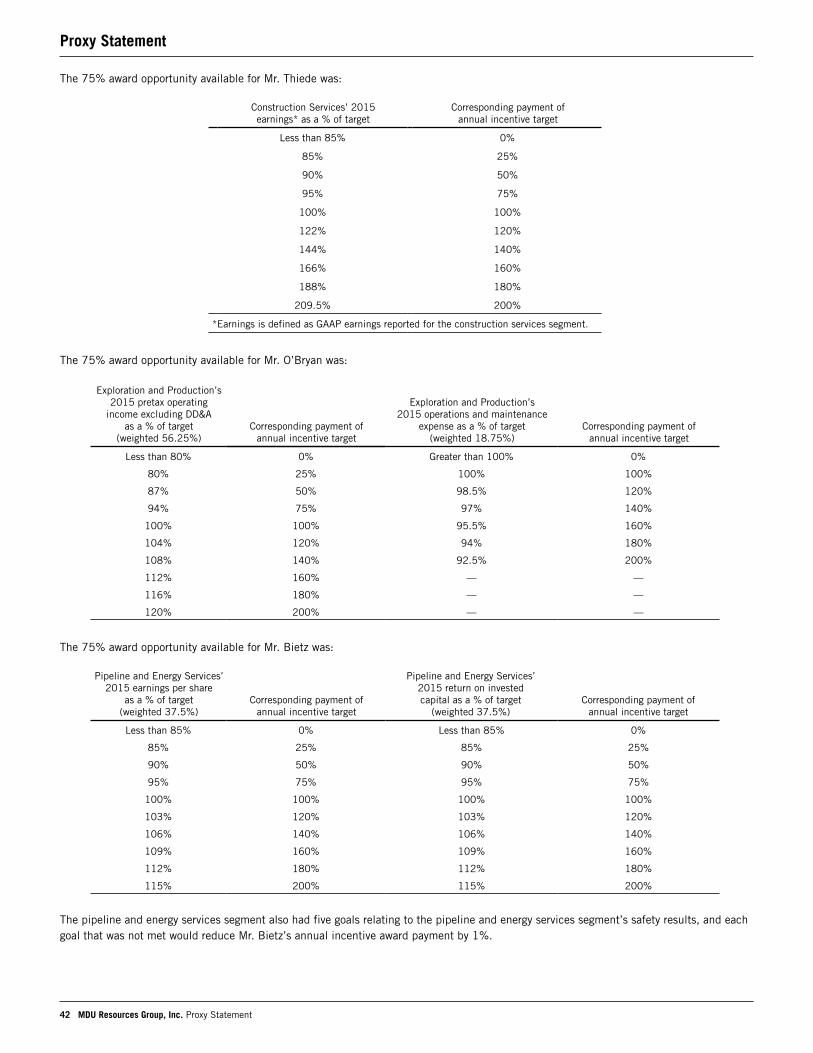
The 75% award opportunity available for Mr. Thiede was:
Construction Services’ 2015 earnings* as a % of target
Corresponding payment of annual incentive target
Less than 85% 0%
85% 25%
90% 50%
95% 75%
100% 100%
122% 120%
144% 140%
166% 160%
188% 180%
209.5% 200%
*Earnings is defined as GAAP earnings reported for the construction services segment.
The 75% award opportunity available for Mr. O’Bryan was:
Exploration and Production’s2015 pretax operating
income excluding DD&A as a % of target
(weighted 56.25%)Corresponding payment of
annual incentive target
Exploration and Production’s 2015 operations and maintenance
expense as a % of target (weighted 18.75%)
Corresponding payment of annual incentive target
Less than 80% 0% Greater than 100% 0%
80% 25% 100% 100%
87% 50% 98.5% 120%
94% 75% 97% 140%
100% 100% 95.5% 160%
104% 120% 94% 180%
108% 140% 92.5% 200%
112% 160% — —
116% 180% — —
120% 200% — —
The 75% award opportunity available for Mr. Bietz was:
Pipeline and Energy Services’ 2015 earnings per share
as a % of target (weighted 37.5%)
Corresponding payment of annual incentive target
Pipeline and Energy Services’ 2015 return on invested capital as a % of target
(weighted 37.5%)Corresponding payment of
annual incentive target
Less than 85% 0% Less than 85% 0%
85% 25% 85% 25%
90% 50% 90% 50%
95% 75% 95% 75%
100% 100% 100% 100%
103% 120% 103% 120%
106% 140% 106% 140%
109% 160% 109% 160%
112% 180% 112% 180%
115% 200% 115% 200%
The pipeline and energy services segment also had five goals relating to the pipeline and energy services segment’s safety results, and eachgoal that was not met would reduce Mr. Bietz’s annual incentive award payment by 1%.
Proxy Statement
42 MDU Resources Group, Inc. Proxy Statement
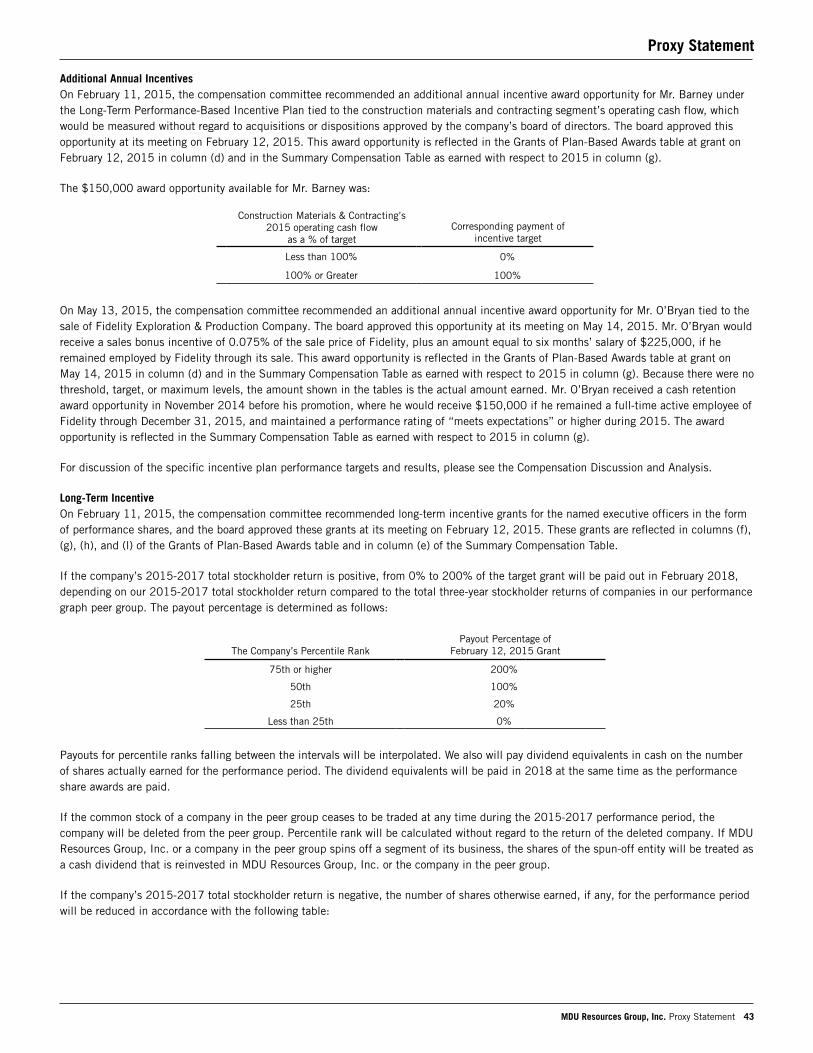
Additional Annual IncentivesOn February 11, 2015, the compensation committee recommended an additional annual incentive award opportunity for Mr. Barney underthe Long-Term Performance-Based Incentive Plan tied to the construction materials and contracting segment’s operating cash flow, whichwould be measured without regard to acquisitions or dispositions approved by the company’s board of directors. The board approved thisopportunity at its meeting on February 12, 2015. This award opportunity is reflected in the Grants of Plan-Based Awards table at grant onFebruary 12, 2015 in column (d) and in the Summary Compensation Table as earned with respect to 2015 in column (g).
The $150,000 award opportunity available for Mr. Barney was:
Construction Materials & Contracting’s2015 operating cash flow
as a % of targetCorresponding payment of
incentive target
Less than 100% 0%
100% or Greater 100%
On May 13, 2015, the compensation committee recommended an additional annual incentive award opportunity for Mr. O’Bryan tied to thesale of Fidelity Exploration & Production Company. The board approved this opportunity at its meeting on May 14, 2015. Mr. O’Bryan wouldreceive a sales bonus incentive of 0.075% of the sale price of Fidelity, plus an amount equal to six months’ salary of $225,000, if heremained employed by Fidelity through its sale. This award opportunity is reflected in the Grants of Plan-Based Awards table at grant onMay 14, 2015 in column (d) and in the Summary Compensation Table as earned with respect to 2015 in column (g). Because there were nothreshold, target, or maximum levels, the amount shown in the tables is the actual amount earned. Mr. O’Bryan received a cash retentionaward opportunity in November 2014 before his promotion, where he would receive $150,000 if he remained a full-time active employee ofFidelity through December 31, 2015, and maintained a performance rating of “meets expectations” or higher during 2015. The awardopportunity is reflected in the Summary Compensation Table as earned with respect to 2015 in column (g).
For discussion of the specific incentive plan performance targets and results, please see the Compensation Discussion and Analysis.
Long-Term IncentiveOn February 11, 2015, the compensation committee recommended long-term incentive grants for the named executive officers in the formof performance shares, and the board approved these grants at its meeting on February 12, 2015. These grants are reflected in columns (f),(g), (h), and (l) of the Grants of Plan-Based Awards table and in column (e) of the Summary Compensation Table.
If the company’s 2015-2017 total stockholder return is positive, from 0% to 200% of the target grant will be paid out in February 2018,depending on our 2015-2017 total stockholder return compared to the total three-year stockholder returns of companies in our performancegraph peer group. The payout percentage is determined as follows:
The Company’s Percentile RankPayout Percentage of
February 12, 2015 Grant
75th or higher 200%
50th 100%
25th 20%
Less than 25th 0%
Payouts for percentile ranks falling between the intervals will be interpolated. We also will pay dividend equivalents in cash on the numberof shares actually earned for the performance period. The dividend equivalents will be paid in 2018 at the same time as the performanceshare awards are paid.
If the common stock of a company in the peer group ceases to be traded at any time during the 2015-2017 performance period, thecompany will be deleted from the peer group. Percentile rank will be calculated without regard to the return of the deleted company. If MDUResources Group, Inc. or a company in the peer group spins off a segment of its business, the shares of the spun-off entity will be treated asa cash dividend that is reinvested in MDU Resources Group, Inc. or the company in the peer group.
If the company’s 2015-2017 total stockholder return is negative, the number of shares otherwise earned, if any, for the performance periodwill be reduced in accordance with the following table:
Proxy Statement
MDU Resources Group, Inc. Proxy Statement 43
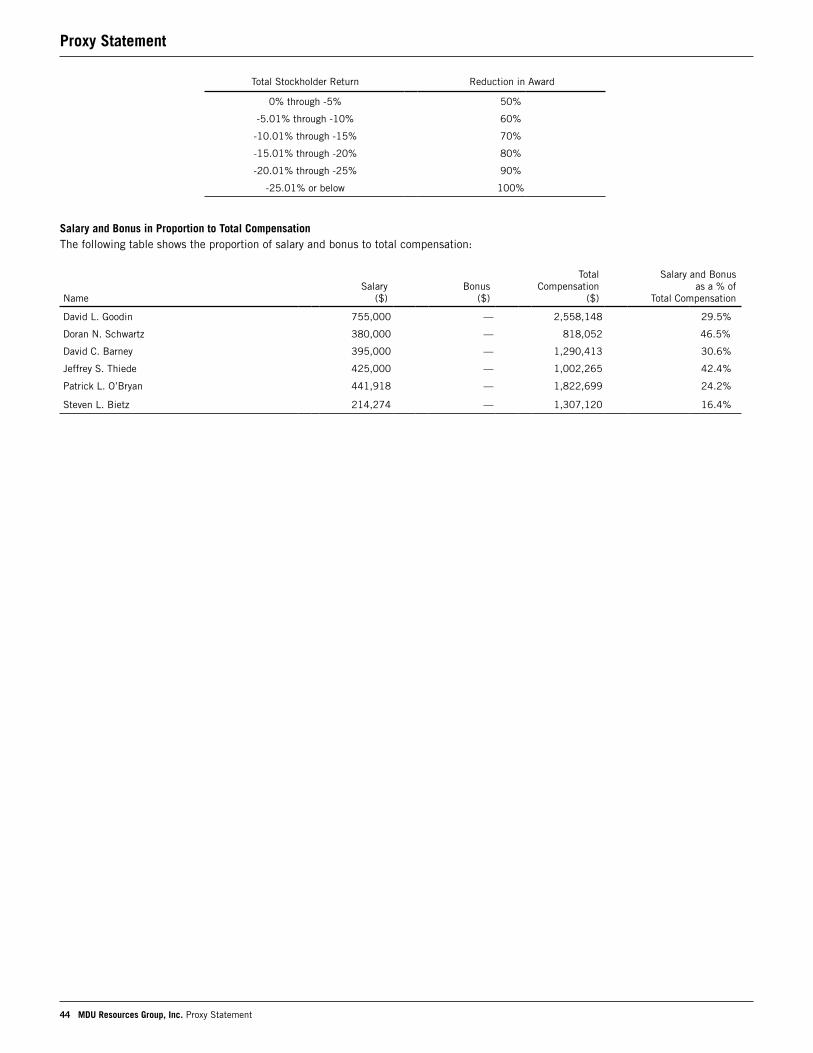
Total Stockholder Return Reduction in Award
0% through -5% 50%
-5.01% through -10% 60%
-10.01% through -15% 70%
-15.01% through -20% 80%
-20.01% through -25% 90%
-25.01% or below 100%
Salary and Bonus in Proportion to Total CompensationThe following table shows the proportion of salary and bonus to total compensation:
NameSalary
($)Bonus
($)
Total Compensation
($)
Salary and Bonus as a % of
Total Compensation
David L. Goodin 755,000 — 2,558,148 29.5%
Doran N. Schwartz 380,000 — 818,052 46.5%
David C. Barney 395,000 — 1,290,413 30.6%
Jeffrey S. Thiede 425,000 — 1,002,265 42.4%
Patrick L. O’Bryan 441,918 — 1,822,699 24.2%
Steven L. Bietz 214,274 — 1,307,120 16.4%
Proxy Statement
44 MDU Resources Group, Inc. Proxy Statement
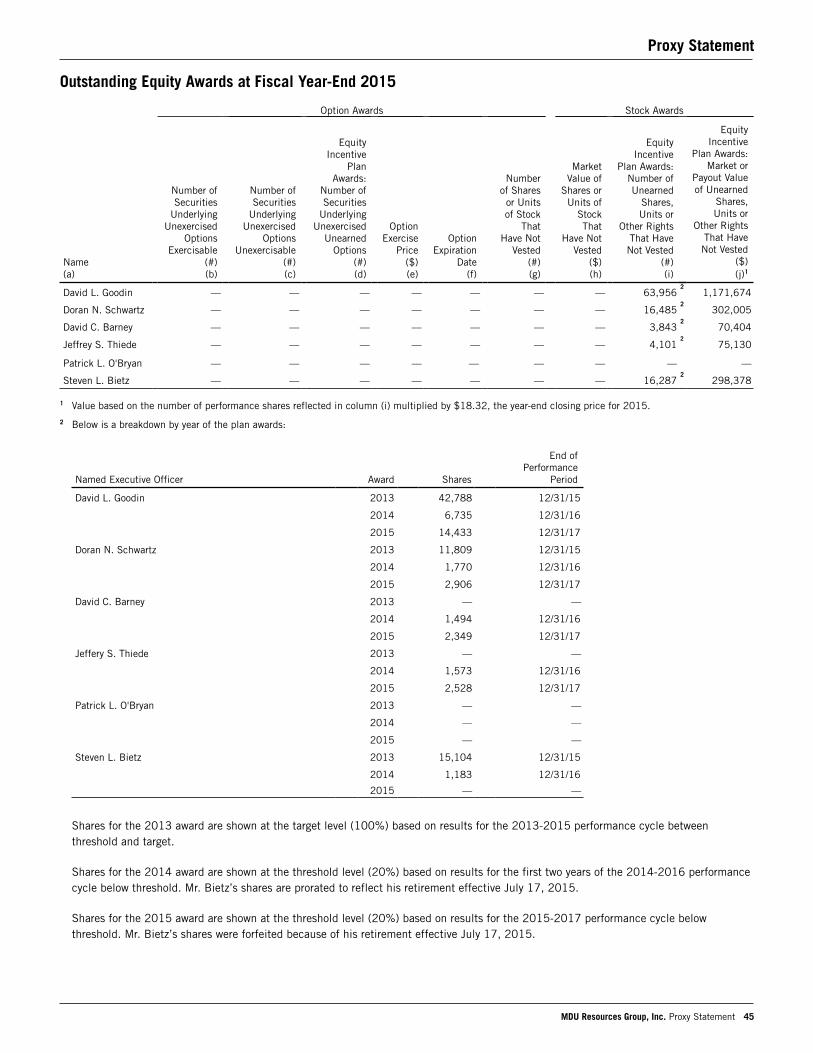
Outstanding Equity Awards at Fiscal Year-End 2015
1 Value based on the number of performance shares reflected in column (i) multiplied by $18.32, the year-end closing price for 2015.
2 Below is a breakdown by year of the plan awards:
Shares for the 2013 award are shown at the target level (100%) based on results for the 2013-2015 performance cycle betweenthreshold and target.
Shares for the 2014 award are shown at the threshold level (20%) based on results for the first two years of the 2014-2016 performancecycle below threshold. Mr. Bietz’s shares are prorated to reflect his retirement effective July 17, 2015.
Shares for the 2015 award are shown at the threshold level (20%) based on results for the 2015-2017 performance cycle belowthreshold. Mr. Bietz’s shares were forfeited because of his retirement effective July 17, 2015.
Named Executive Officer Award Shares
End of Performance
Period
David L. Goodin 2013 42,788 12/31/15
2014 6,735 12/31/16
2015 14,433 12/31/17
Doran N. Schwartz 2013 11,809 12/31/15
2014 1,770 12/31/16
2015 2,906 12/31/17
David C. Barney 2013 — —
2014 1,494 12/31/16
2015 2,349 12/31/17
Jeffery S. Thiede 2013 — —
2014 1,573 12/31/16
2015 2,528 12/31/17
Patrick L. O'Bryan 2013 — —
2014 — —
2015 — —
Steven L. Bietz 2013 15,104 12/31/15
2014 1,183 12/31/16
2015 — —
Option Awards Stock Awards
Name (a)
Number of Securities
Underlying Unexercised
Options Exercisable
(#) (b)
Number of Securities
Underlying Unexercised
Options Unexercisable
(#) (c)
Equity Incentive
PlanAwards:
Number of Securities
Underlying Unexercised
Unearned Options
(#) (d)
Option Exercise
Price ($) (e)
Option Expiration
Date (f)
Number of Shares
or Units of Stock
That Have Not
Vested (#) (g)
Market Value of
Shares or Units of
Stock That
Have Not Vested
($) (h)
Equity Incentive
Plan Awards: Number of Unearned
Shares, Units or
Other Rights That Have Not Vested
(#) (i)
EquityIncentive
Plan Awards: Market or
Payout Value of Unearned
Shares, Units or
Other Rights That Have Not Vested
($) (j)1
David L. Goodin — — — — — — — 63,9562
1,171,674
Doran N. Schwartz — — — — — — — 16,4852
302,005
David C. Barney — — — — — — — 3,8432
70,404
Jeffrey S. Thiede — — — — — — — 4,1012
75,130
Patrick L. O'Bryan — — — — — — — — —
Steven L. Bietz — — — — — — — 16,2872
298,378
Proxy Statement
MDU Resources Group, Inc. Proxy Statement 45
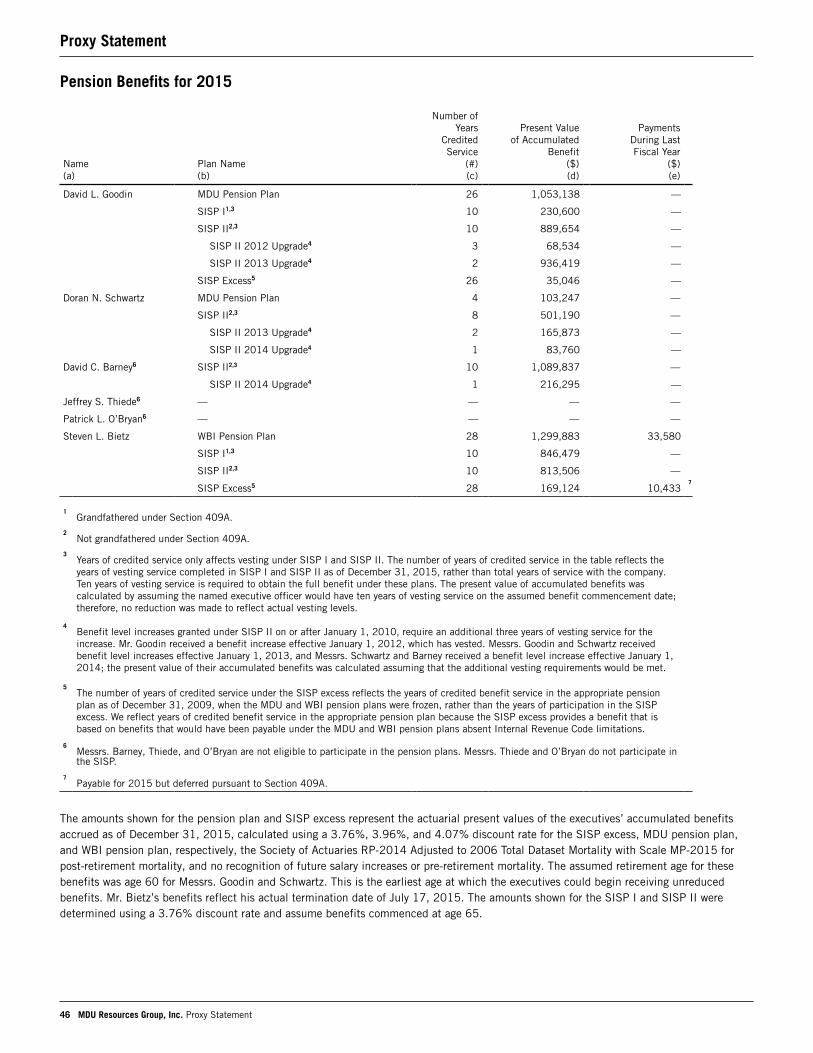
Pension Benefits for 2015
Name (a)
Plan Name (b)
Number of Years
Credited Service
(#) (c)
Present Value of Accumulated
Benefit ($) (d)
Payments During Last Fiscal Year
($) (e)
David L. Goodin MDU Pension Plan 26 1,053,138 —
SISP I1,3 10 230,600 —
SISP II2,3 10 889,654 —
SISP II 2012 Upgrade4 3 68,534 —
SISP II 2013 Upgrade4 2 936,419 —
SISP Excess5 26 35,046 —
Doran N. Schwartz MDU Pension Plan 4 103,247 —
SISP II2,3 8 501,190 —
SISP II 2013 Upgrade4 2 165,873 —
SISP II 2014 Upgrade4 1 83,760 —
David C. Barney6 SISP II2,3 10 1,089,837 —
SISP II 2014 Upgrade4 1 216,295 —
Jeffrey S. Thiede6 — — — —
Patrick L. O’Bryan6 — — — —
Steven L. Bietz WBI Pension Plan 28 1,299,883 33,580
SISP I1,3 10 846,479 —
SISP II2,3 10 813,506 —
SISP Excess5 28 169,124 10,4337
1Grandfathered under Section 409A.
2Not grandfathered under Section 409A.
3Years of credited service only affects vesting under SISP I and SISP II. The number of years of credited service in the table reflects theyears of vesting service completed in SISP I and SISP II as of December 31, 2015, rather than total years of service with the company.Ten years of vesting service is required to obtain the full benefit under these plans. The present value of accumulated benefits wascalculated by assuming the named executive officer would have ten years of vesting service on the assumed benefit commencement date;therefore, no reduction was made to reflect actual vesting levels.
4Benefit level increases granted under SISP II on or after January 1, 2010, require an additional three years of vesting service for theincrease. Mr. Goodin received a benefit increase effective January 1, 2012, which has vested. Messrs. Goodin and Schwartz receivedbenefit level increases effective January 1, 2013, and Messrs. Schwartz and Barney received a benefit level increase effective January 1,2014; the present value of their accumulated benefits was calculated assuming that the additional vesting requirements would be met.
5The number of years of credited service under the SISP excess reflects the years of credited benefit service in the appropriate pensionplan as of December 31, 2009, when the MDU and WBI pension plans were frozen, rather than the years of participation in the SISPexcess. We reflect years of credited benefit service in the appropriate pension plan because the SISP excess provides a benefit that isbased on benefits that would have been payable under the MDU and WBI pension plans absent Internal Revenue Code limitations.
6Messrs. Barney, Thiede, and O’Bryan are not eligible to participate in the pension plans. Messrs. Thiede and O’Bryan do not participate inthe SISP.
7Payable for 2015 but deferred pursuant to Section 409A.
The amounts shown for the pension plan and SISP excess represent the actuarial present values of the executives’ accumulated benefitsaccrued as of December 31, 2015, calculated using a 3.76%, 3.96%, and 4.07% discount rate for the SISP excess, MDU pension plan,and WBI pension plan, respectively, the Society of Actuaries RP-2014 Adjusted to 2006 Total Dataset Mortality with Scale MP-2015 forpost-retirement mortality, and no recognition of future salary increases or pre-retirement mortality. The assumed retirement age for thesebenefits was age 60 for Messrs. Goodin and Schwartz. This is the earliest age at which the executives could begin receiving unreducedbenefits. Mr. Bietz’s benefits reflect his actual termination date of July 17, 2015. The amounts shown for the SISP I and SISP II weredetermined using a 3.76% discount rate and assume benefits commenced at age 65.
Proxy Statement
46 MDU Resources Group, Inc. Proxy Statement
Pension PlanMessrs. Goodin and Schwartz participate in the MDU Resources Group, Inc. Pension Plan for Non-Bargaining Unit Employees, which werefer to as the MDU pension plan. Mr. Bietz participates in the Williston Basin Interstate Pipeline Company Pension Plan, which we refer toas the WBI pension plan. Pension benefits under the pension plans are based on the participant’s average annual salary over the 60consecutive month period in which the participant received the highest annual salary during the participant’s final 10 years of service. Forthis purpose, only a participant’s salary is considered; incentives and other forms of compensation are not included. Benefits are determinedby multiplying (1) the participant’s years of credited service by (2) the sum of (a) the average annual salary up to the social securityintegration level times 1.1% and (b) the average annual salary over the social security integration level times 1.45%. The maximum years ofservice recognized when determining benefits under the pension plans is 35. Pension plan benefits are not reduced for social securitybenefits.
Both of the pension plans were amended to cease benefit accruals as of December 31, 2009, meaning the normal retirement benefit willnot change. The years of credited service in the table reflect the named executive officers’ years of credited service as of December 31,2009.
To receive unreduced retirement benefits under the pension plans, participants must either remain employed until age 60 or elect to defercommencement of benefits until age 60. Participants whose employment terminates between the ages of 55 and 60, with 5 years of serviceunder the pension plans, are eligible for early retirement benefits. Early retirement benefits are determined by reducing the normalretirement benefit by 0.25% per month for each month before age 60. If a participant’s employment terminates before age 55, the samereduction applies for each month the termination occurs before age 62, with the reduction capped at 21%.
Benefits for single participants under the pension plans are paid as straight life annuities, and benefits for married participants are paid asactuarially reduced annuities with a survivor benefit for spouses, unless participants choose otherwise. Participants hired before January 1,2004, who terminate employment before age 55, may elect to receive their benefits in a lump sum. Mr. Goodin would have been eligible fora lump sum if he had retired on December 31, 2015.
The Internal Revenue Code limits the amounts paid under the pension plans and the amount of compensation recognized when determiningbenefits. In 2009, when the pension plans were frozen, the maximum annual benefit payable under the pension plans was $195,000 andthe maximum amount of compensation recognized when determining benefits was $245,000.
Supplemental Income Security Plan We also offer select key managers and executives benefits under our defined benefit nonqualified retirement plan, which we refer to as theSupplemental Income Security Plan or SISP. Messrs. Goodin, Schwartz, Barney, and Bietz participate in the SISP. Benefits under the SISPconsist of:
• a supplemental retirement benefit intended to augment the retirement income provided under the pension plans – we refer to this benefitas the regular SISP benefit
• an excess retirement benefit relating to Internal Revenue Code limitations on retirement benefits provided under the pension plans – werefer to this benefit as the SISP excess benefit and
• death benefits – we refer to these benefits as the SISP death benefit.
SISP benefits are forfeited if the participant’s employment is terminated for cause.
Regular SISP Benefits and Death BenefitsRegular SISP benefits and death benefits are determined by reference to one of two schedules attached to the SISP – the original scheduleor the amended schedule. Our compensation committee, after receiving recommendations from our chief executive officer, determines thelevel at which participants are placed in the schedules. A participant’s placement is generally, but not always, determined by reference tothe participant’s annual base salary. Benefit levels in the amended schedule, which became effective on January 1, 2010, are 20% lowerthan the benefit levels in the original schedule. The amended schedule applies to new participants and participants who receive a benefitlevel increase on or after January 1, 2010. None of the named executive officers received a benefit level increase on or after January 1,2015. Effective February 11, 2016, the SISP was amended to freeze the plan to new participants and to current participants at theircurrent benefit levels.
Participants can elect to receive (1) the regular SISP benefit only, (2) the SISP death benefit only, or (3) a combination of both. Regardlessof the participant’s election, if the participant dies before the regular SISP benefit would commence, only the SISP death benefit is
Proxy Statement
MDU Resources Group, Inc. Proxy Statement 47
provided. If the participant elects to receive both a regular SISP benefit and a SISP death benefit, each of the benefits is reducedproportionately.
The regular SISP benefits reflected in the table above are based on the assumption that the participant elects to receive only the regularSISP benefit. The present values of the SISP death benefits that would be provided if the named executive officers had died onDecember 31, 2015, prior to the commencement of regular SISP benefits, are reflected in the table that appears in the section entitled“Potential Payments upon Termination or Change of Control.”
Regular SISP benefits that were vested as of December 31, 2004, and were grandfathered under Section 409A of the Internal RevenueCode remain subject to SISP provisions then in effect, which we refer to as SISP I benefits. Regular SISP benefits that are subject toSection 409A of the Internal Revenue Code, which we refer to as SISP II benefits, are governed by amended provisions intended to complywith Section 409A. Participants generally have more discretion with respect to the distributions of their SISP I benefits.
The time and manner in which the regular SISP benefits are paid depend on a variety of factors, including the time and form of benefitelected by the participant and whether the benefits are SISP I or SISP II benefits. Unless the participant elects otherwise, the SISP Ibenefits are paid over 180 months, with benefits commencing when the participant attains age 65 or, if later, when the participant retires.The SISP II benefits commence when the participant attains age 65 or, if later, when the participant retires, subject to a six-month delay ifthe participant is subject to the provisions of Section 409A of the Internal Revenue Code that require delayed commencement of thesetypes of retirement benefits. The SISP II benefits are paid over 180 months or, if commencement of payments is delayed for six months,173 months. If the commencement of benefits is delayed for six months, the first payment includes the payments that would have beenpaid during the six-month period plus interest equal to one-half of the annual prime interest rate on the participant’s last date ofemployment. If the participant dies after the regular SISP benefits have begun but before receipt of all of the regular SISP benefits, theremaining payments are made to the participant’s designated beneficiary.
Rather than receiving their regular SISP I benefits in equal monthly installments over 15 years commencing at age 65, participants canelect a different form and time of commencement of their SISP I benefits. Participants can elect to defer commencement of the regularSISP I benefits. If this is elected, the participant retains the right to receive a monthly SISP death benefit if death occurs prior to thecommencement of the regular SISP I benefit.
Participants also can elect to receive their SISP I benefits in one of three actuarially equivalent forms – a life annuity, 100% joint andsurvivor annuity, or a joint and two-thirds joint and survivor annuity, provided that the cost of providing these actuarial equivalent forms ofbenefits does not exceed the cost of providing the normal form of benefit. Neither the election to receive an actuarially equivalent benefitnor the administrator’s right to pay the regular SISP benefit in the form of an actuarially equivalent lump sum are available with respect toSISP II benefits.
To promote retention, the regular SISP benefits are subject to the following 10-year vesting schedule:
• 0% vesting for less than 3 years of participation
• 20% vesting for 3 years of participation
• 40% vesting for 4 years of participation and
• an additional 10% vesting for each additional year of participation up to 100% vesting for 10 years of participation.
There is an additional vesting requirement on benefit level increases for the regular SISP benefit granted on or after January 1, 2010. Therequirement applies only to the increased benefit level. The increased benefit vests after the later of three additional years of participationin the SISP or the end of the regular vesting schedule described above. The additional three-year vesting requirement for benefit levelincreases is prorated for participants who are officers, attain age 65, and, pursuant to the company’s bylaws, are required to retire prior tothe end of the additional vesting period as follows:
• 33% of the increase vests for participants required to retire at least one year but less than two years after the increase is granted and
• 66% of the increase vests for participants required to retire at least two years but less than three years after the increase is granted.
The benefit level increases of participants who attain age 65 and are required to retire pursuant to the company’s bylaws will be furtherreduced to the extent the participants are not fully vested in their regular SISP benefit under the 10-year vesting schedule described above.The additional vesting period associated with a benefit level increase may be waived by the compensation committee.
Proxy Statement
48 MDU Resources Group, Inc. Proxy Statement
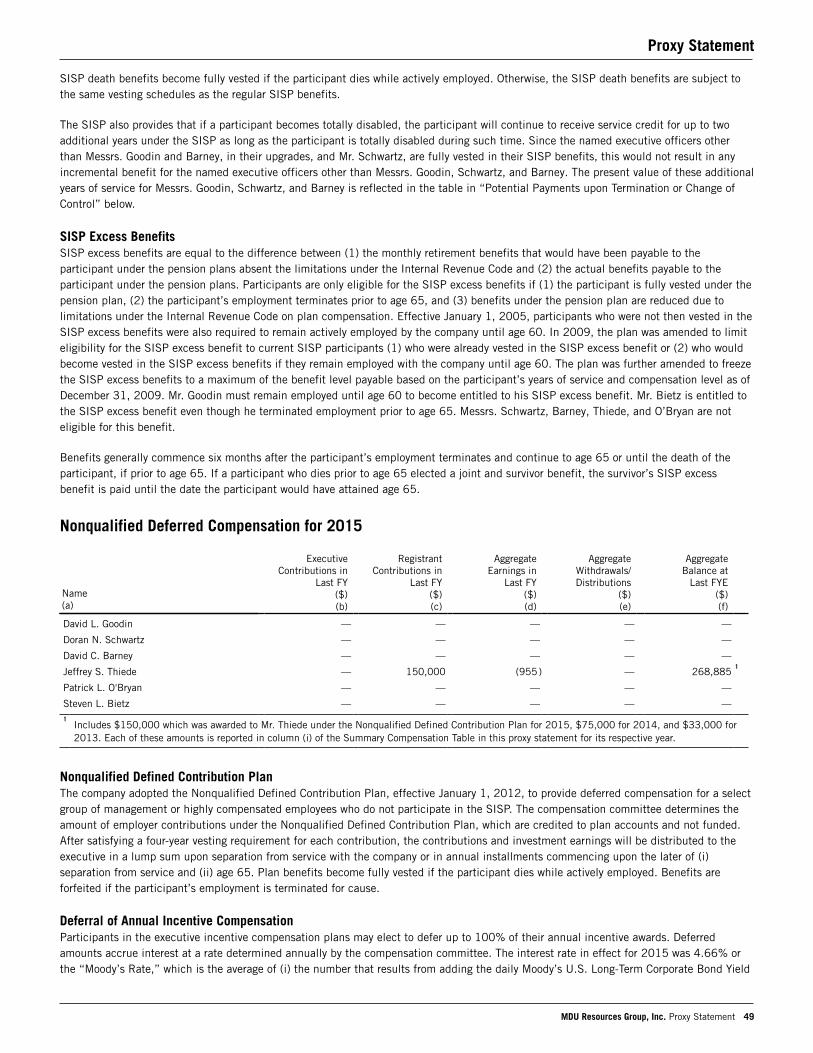
SISP death benefits become fully vested if the participant dies while actively employed. Otherwise, the SISP death benefits are subject tothe same vesting schedules as the regular SISP benefits.
The SISP also provides that if a participant becomes totally disabled, the participant will continue to receive service credit for up to twoadditional years under the SISP as long as the participant is totally disabled during such time. Since the named executive officers otherthan Messrs. Goodin and Barney, in their upgrades, and Mr. Schwartz, are fully vested in their SISP benefits, this would not result in anyincremental benefit for the named executive officers other than Messrs. Goodin, Schwartz, and Barney. The present value of these additionalyears of service for Messrs. Goodin, Schwartz, and Barney is reflected in the table in “Potential Payments upon Termination or Change ofControl” below.
SISP Excess BenefitsSISP excess benefits are equal to the difference between (1) the monthly retirement benefits that would have been payable to theparticipant under the pension plans absent the limitations under the Internal Revenue Code and (2) the actual benefits payable to theparticipant under the pension plans. Participants are only eligible for the SISP excess benefits if (1) the participant is fully vested under thepension plan, (2) the participant’s employment terminates prior to age 65, and (3) benefits under the pension plan are reduced due tolimitations under the Internal Revenue Code on plan compensation. Effective January 1, 2005, participants who were not then vested in theSISP excess benefits were also required to remain actively employed by the company until age 60. In 2009, the plan was amended to limiteligibility for the SISP excess benefit to current SISP participants (1) who were already vested in the SISP excess benefit or (2) who wouldbecome vested in the SISP excess benefits if they remain employed with the company until age 60. The plan was further amended to freezethe SISP excess benefits to a maximum of the benefit level payable based on the participant’s years of service and compensation level as ofDecember 31, 2009. Mr. Goodin must remain employed until age 60 to become entitled to his SISP excess benefit. Mr. Bietz is entitled tothe SISP excess benefit even though he terminated employment prior to age 65. Messrs. Schwartz, Barney, Thiede, and O’Bryan are noteligible for this benefit.
Benefits generally commence six months after the participant’s employment terminates and continue to age 65 or until the death of theparticipant, if prior to age 65. If a participant who dies prior to age 65 elected a joint and survivor benefit, the survivor’s SISP excessbenefit is paid until the date the participant would have attained age 65.
Nonqualified Deferred Compensation for 2015
Name (a)
Executive Contributions in
Last FY ($)(b)
RegistrantContributions in
Last FY($)(c)
AggregateEarnings in
Last FY($)(d)
AggregateWithdrawals/Distributions
($)(e)
AggregateBalance at
Last FYE($)(f)
David L. Goodin — — — — —
Doran N. Schwartz — — — — —
David C. Barney — — — — —
Jeffrey S. Thiede — 150,000 (955) — 268,8851
Patrick L. O'Bryan — — — — —
Steven L. Bietz — — — — —1
Includes $150,000 which was awarded to Mr. Thiede under the Nonqualified Defined Contribution Plan for 2015, $75,000 for 2014, and $33,000 for2013. Each of these amounts is reported in column (i) of the Summary Compensation Table in this proxy statement for its respective year.
Nonqualified Defined Contribution PlanThe company adopted the Nonqualified Defined Contribution Plan, effective January 1, 2012, to provide deferred compensation for a selectgroup of management or highly compensated employees who do not participate in the SISP. The compensation committee determines theamount of employer contributions under the Nonqualified Defined Contribution Plan, which are credited to plan accounts and not funded.After satisfying a four-year vesting requirement for each contribution, the contributions and investment earnings will be distributed to theexecutive in a lump sum upon separation from service with the company or in annual installments commencing upon the later of (i)separation from service and (ii) age 65. Plan benefits become fully vested if the participant dies while actively employed. Benefits areforfeited if the participant’s employment is terminated for cause.
Deferral of Annual Incentive CompensationParticipants in the executive incentive compensation plans may elect to defer up to 100% of their annual incentive awards. Deferredamounts accrue interest at a rate determined annually by the compensation committee. The interest rate in effect for 2015 was 4.66% orthe “Moody’s Rate,” which is the average of (i) the number that results from adding the daily Moody’s U.S. Long-Term Corporate Bond Yield
Proxy Statement
MDU Resources Group, Inc. Proxy Statement 49
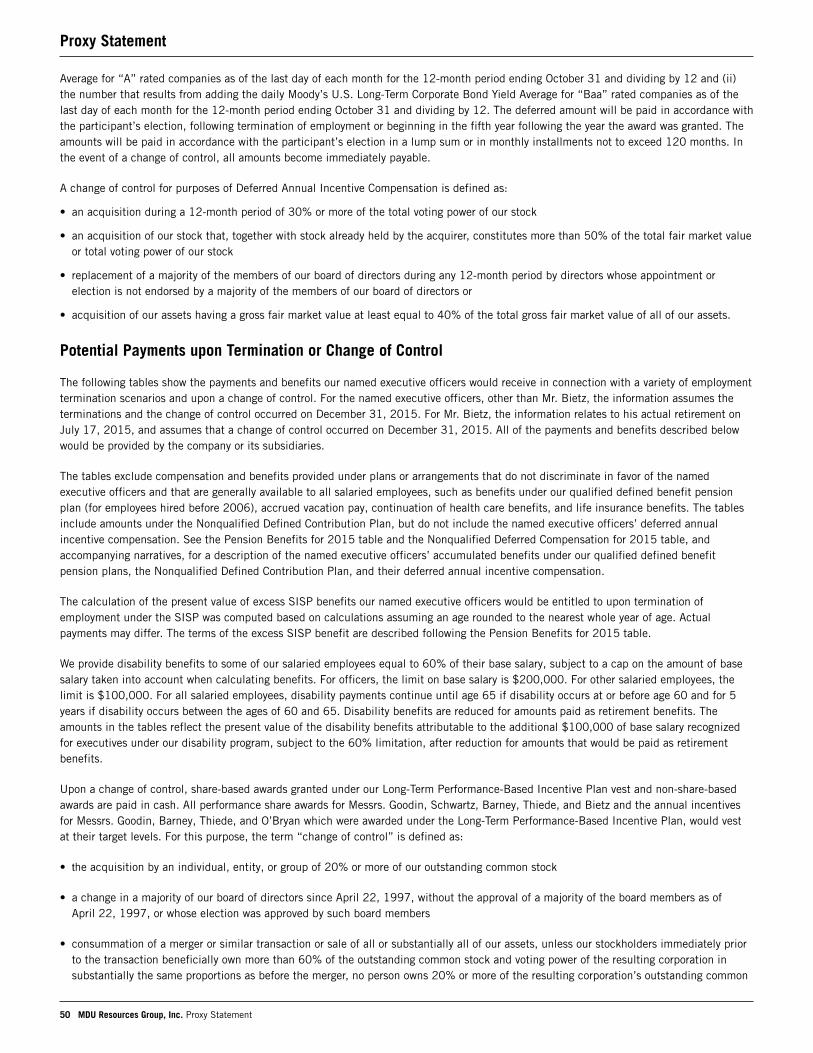
Average for “A” rated companies as of the last day of each month for the 12-month period ending October 31 and dividing by 12 and (ii)the number that results from adding the daily Moody’s U.S. Long-Term Corporate Bond Yield Average for “Baa” rated companies as of thelast day of each month for the 12-month period ending October 31 and dividing by 12. The deferred amount will be paid in accordance withthe participant’s election, following termination of employment or beginning in the fifth year following the year the award was granted. Theamounts will be paid in accordance with the participant’s election in a lump sum or in monthly installments not to exceed 120 months. Inthe event of a change of control, all amounts become immediately payable.
A change of control for purposes of Deferred Annual Incentive Compensation is defined as:
• an acquisition during a 12-month period of 30% or more of the total voting power of our stock
• an acquisition of our stock that, together with stock already held by the acquirer, constitutes more than 50% of the total fair market valueor total voting power of our stock
• replacement of a majority of the members of our board of directors during any 12-month period by directors whose appointment orelection is not endorsed by a majority of the members of our board of directors or
• acquisition of our assets having a gross fair market value at least equal to 40% of the total gross fair market value of all of our assets.
Potential Payments upon Termination or Change of Control
The following tables show the payments and benefits our named executive officers would receive in connection with a variety of employmenttermination scenarios and upon a change of control. For the named executive officers, other than Mr. Bietz, the information assumes theterminations and the change of control occurred on December 31, 2015. For Mr. Bietz, the information relates to his actual retirement onJuly 17, 2015, and assumes that a change of control occurred on December 31, 2015. All of the payments and benefits described belowwould be provided by the company or its subsidiaries.
The tables exclude compensation and benefits provided under plans or arrangements that do not discriminate in favor of the namedexecutive officers and that are generally available to all salaried employees, such as benefits under our qualified defined benefit pensionplan (for employees hired before 2006), accrued vacation pay, continuation of health care benefits, and life insurance benefits. The tablesinclude amounts under the Nonqualified Defined Contribution Plan, but do not include the named executive officers’ deferred annualincentive compensation. See the Pension Benefits for 2015 table and the Nonqualified Deferred Compensation for 2015 table, andaccompanying narratives, for a description of the named executive officers’ accumulated benefits under our qualified defined benefitpension plans, the Nonqualified Defined Contribution Plan, and their deferred annual incentive compensation.
The calculation of the present value of excess SISP benefits our named executive officers would be entitled to upon termination ofemployment under the SISP was computed based on calculations assuming an age rounded to the nearest whole year of age. Actualpayments may differ. The terms of the excess SISP benefit are described following the Pension Benefits for 2015 table.
We provide disability benefits to some of our salaried employees equal to 60% of their base salary, subject to a cap on the amount of basesalary taken into account when calculating benefits. For officers, the limit on base salary is $200,000. For other salaried employees, thelimit is $100,000. For all salaried employees, disability payments continue until age 65 if disability occurs at or before age 60 and for 5years if disability occurs between the ages of 60 and 65. Disability benefits are reduced for amounts paid as retirement benefits. Theamounts in the tables reflect the present value of the disability benefits attributable to the additional $100,000 of base salary recognizedfor executives under our disability program, subject to the 60% limitation, after reduction for amounts that would be paid as retirementbenefits.
Upon a change of control, share-based awards granted under our Long-Term Performance-Based Incentive Plan vest and non-share-basedawards are paid in cash. All performance share awards for Messrs. Goodin, Schwartz, Barney, Thiede, and Bietz and the annual incentivesfor Messrs. Goodin, Barney, Thiede, and O’Bryan which were awarded under the Long-Term Performance-Based Incentive Plan, would vestat their target levels. For this purpose, the term “change of control” is defined as:
• the acquisition by an individual, entity, or group of 20% or more of our outstanding common stock
• a change in a majority of our board of directors since April 22, 1997, without the approval of a majority of the board members as ofApril 22, 1997, or whose election was approved by such board members
• consummation of a merger or similar transaction or sale of all or substantially all of our assets, unless our stockholders immediately priorto the transaction beneficially own more than 60% of the outstanding common stock and voting power of the resulting corporation insubstantially the same proportions as before the merger, no person owns 20% or more of the resulting corporation’s outstanding common
Proxy Statement
50 MDU Resources Group, Inc. Proxy Statement
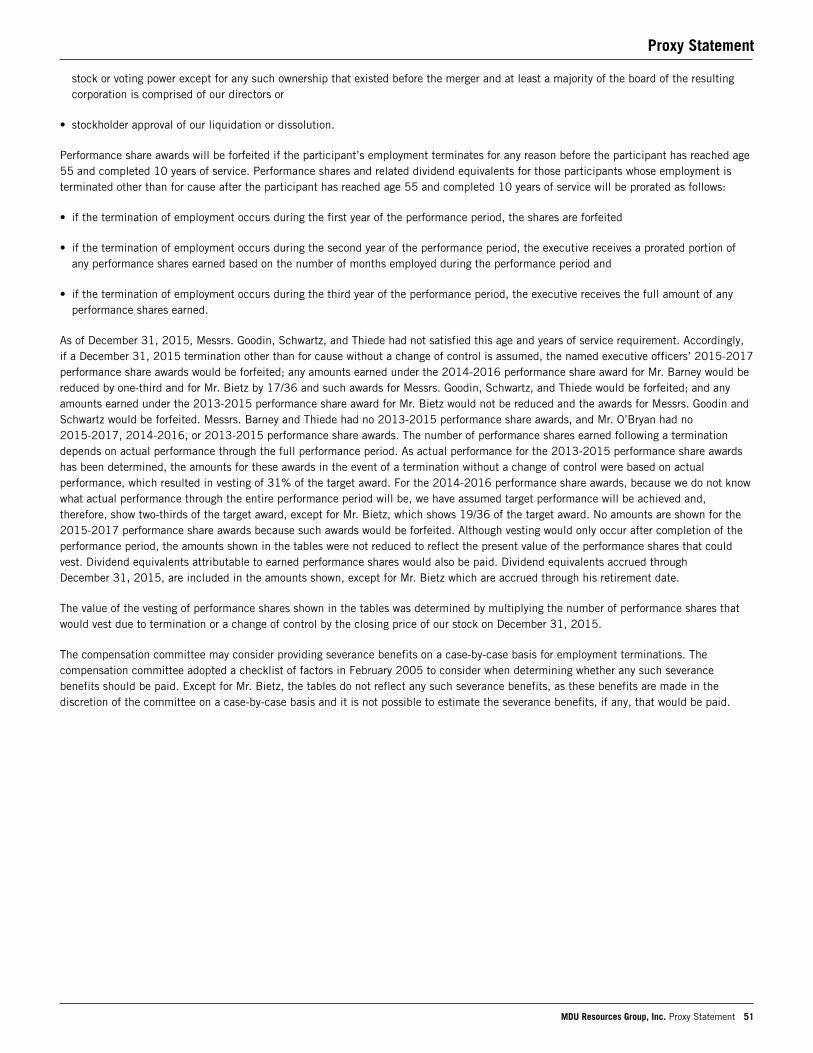
stock or voting power except for any such ownership that existed before the merger and at least a majority of the board of the resultingcorporation is comprised of our directors or
• stockholder approval of our liquidation or dissolution.
Performance share awards will be forfeited if the participant’s employment terminates for any reason before the participant has reached age55 and completed 10 years of service. Performance shares and related dividend equivalents for those participants whose employment isterminated other than for cause after the participant has reached age 55 and completed 10 years of service will be prorated as follows:
• if the termination of employment occurs during the first year of the performance period, the shares are forfeited
• if the termination of employment occurs during the second year of the performance period, the executive receives a prorated portion ofany performance shares earned based on the number of months employed during the performance period and
• if the termination of employment occurs during the third year of the performance period, the executive receives the full amount of anyperformance shares earned.
As of December 31, 2015, Messrs. Goodin, Schwartz, and Thiede had not satisfied this age and years of service requirement. Accordingly,if a December 31, 2015 termination other than for cause without a change of control is assumed, the named executive officers’ 2015-2017performance share awards would be forfeited; any amounts earned under the 2014-2016 performance share award for Mr. Barney would bereduced by one-third and for Mr. Bietz by 17/36 and such awards for Messrs. Goodin, Schwartz, and Thiede would be forfeited; and anyamounts earned under the 2013-2015 performance share award for Mr. Bietz would not be reduced and the awards for Messrs. Goodin andSchwartz would be forfeited. Messrs. Barney and Thiede had no 2013-2015 performance share awards, and Mr. O’Bryan had no2015-2017, 2014-2016, or 2013-2015 performance share awards. The number of performance shares earned following a terminationdepends on actual performance through the full performance period. As actual performance for the 2013-2015 performance share awardshas been determined, the amounts for these awards in the event of a termination without a change of control were based on actualperformance, which resulted in vesting of 31% of the target award. For the 2014-2016 performance share awards, because we do not knowwhat actual performance through the entire performance period will be, we have assumed target performance will be achieved and,therefore, show two-thirds of the target award, except for Mr. Bietz, which shows 19/36 of the target award. No amounts are shown for the2015-2017 performance share awards because such awards would be forfeited. Although vesting would only occur after completion of theperformance period, the amounts shown in the tables were not reduced to reflect the present value of the performance shares that couldvest. Dividend equivalents attributable to earned performance shares would also be paid. Dividend equivalents accrued throughDecember 31, 2015, are included in the amounts shown, except for Mr. Bietz which are accrued through his retirement date.
The value of the vesting of performance shares shown in the tables was determined by multiplying the number of performance shares thatwould vest due to termination or a change of control by the closing price of our stock on December 31, 2015.
The compensation committee may consider providing severance benefits on a case-by-case basis for employment terminations. Thecompensation committee adopted a checklist of factors in February 2005 to consider when determining whether any such severancebenefits should be paid. Except for Mr. Bietz, the tables do not reflect any such severance benefits, as these benefits are made in thediscretion of the committee on a case-by-case basis and it is not possible to estimate the severance benefits, if any, that would be paid.
Proxy Statement
MDU Resources Group, Inc. Proxy Statement 51
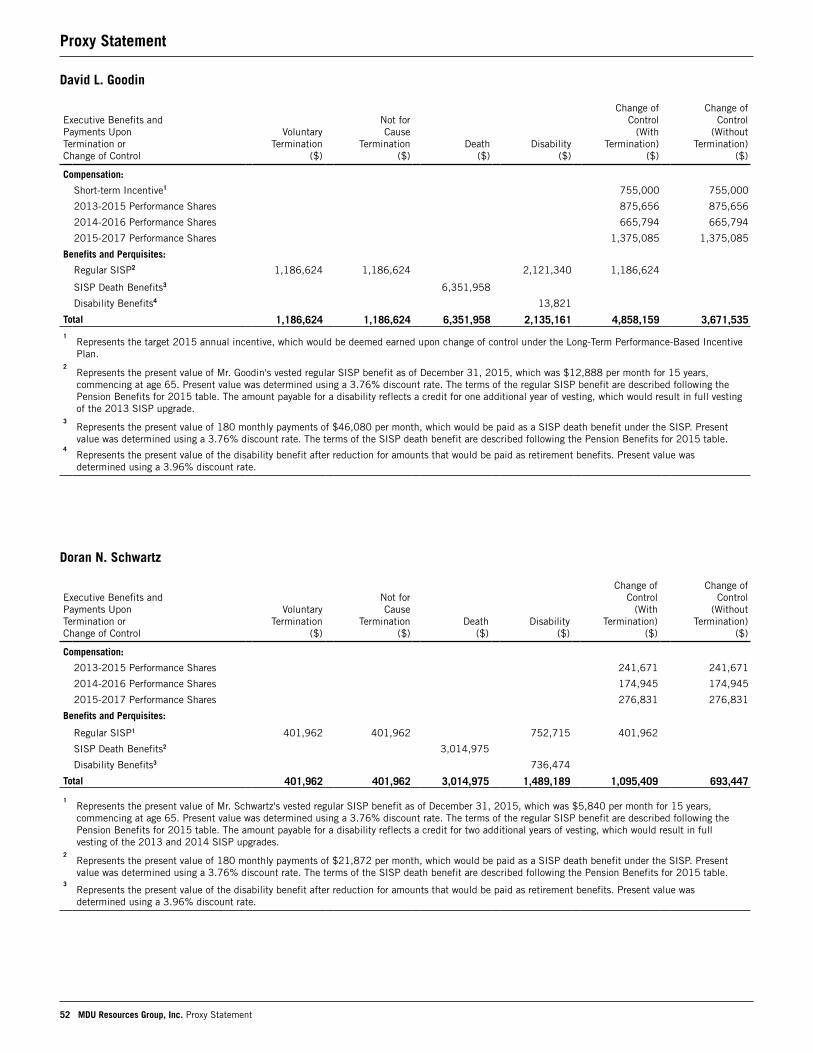
David L. Goodin
Doran N. Schwartz
Executive Benefits and Payments Upon Termination or Change of Control
Voluntary Termination
($)
Not for Cause
Termination ($)
Death ($)
Disability ($)
Change of Control
(WithTermination)
($)
Change of Control
(Without Termination)
($)
Compensation:
2013-2015 Performance Shares 241,671 241,671
2014-2016 Performance Shares 174,945 174,945
2015-2017 Performance Shares 276,831 276,831
Benefits and Perquisites:
Regular SISP1 401,962 401,962 752,715 401,962
SISP Death Benefits2 3,014,975
Disability Benefits3 736,474
Total 401,962 401,962 3,014,975 1,489,189 1,095,409 693,447
1Represents the present value of Mr. Schwartz's vested regular SISP benefit as of December 31, 2015, which was $5,840 per month for 15 years,commencing at age 65. Present value was determined using a 3.76% discount rate. The terms of the regular SISP benefit are described following thePension Benefits for 2015 table. The amount payable for a disability reflects a credit for two additional years of vesting, which would result in fullvesting of the 2013 and 2014 SISP upgrades.
2Represents the present value of 180 monthly payments of $21,872 per month, which would be paid as a SISP death benefit under the SISP. Presentvalue was determined using a 3.76% discount rate. The terms of the SISP death benefit are described following the Pension Benefits for 2015 table.
3Represents the present value of the disability benefit after reduction for amounts that would be paid as retirement benefits. Present value wasdetermined using a 3.96% discount rate.
Executive Benefits and Payments Upon Termination or Change of Control
Voluntary Termination
($)
Not for Cause
Termination ($)
Death ($)
Disability ($)
Change of Control
(WithTermination)
($)
Change of Control
(Without Termination)
($)
Compensation:
Short-term Incentive1 755,000 755,000
2013-2015 Performance Shares 875,656 875,656
2014-2016 Performance Shares 665,794 665,794
2015-2017 Performance Shares 1,375,085 1,375,085
Benefits and Perquisites:
Regular SISP2 1,186,624 1,186,624 2,121,340 1,186,624
SISP Death Benefits3 6,351,958
Disability Benefits4 13,821
Total 1,186,624 1,186,624 6,351,958 2,135,161 4,858,159 3,671,5351
Represents the target 2015 annual incentive, which would be deemed earned upon change of control under the Long-Term Performance-Based IncentivePlan.
2Represents the present value of Mr. Goodin's vested regular SISP benefit as of December 31, 2015, which was $12,888 per month for 15 years,commencing at age 65. Present value was determined using a 3.76% discount rate. The terms of the regular SISP benefit are described following thePension Benefits for 2015 table. The amount payable for a disability reflects a credit for one additional year of vesting, which would result in full vestingof the 2013 SISP upgrade.
3Represents the present value of 180 monthly payments of $46,080 per month, which would be paid as a SISP death benefit under the SISP. Presentvalue was determined using a 3.76% discount rate. The terms of the SISP death benefit are described following the Pension Benefits for 2015 table.
4Represents the present value of the disability benefit after reduction for amounts that would be paid as retirement benefits. Present value wasdetermined using a 3.96% discount rate.
Proxy Statement
52 MDU Resources Group, Inc. Proxy Statement
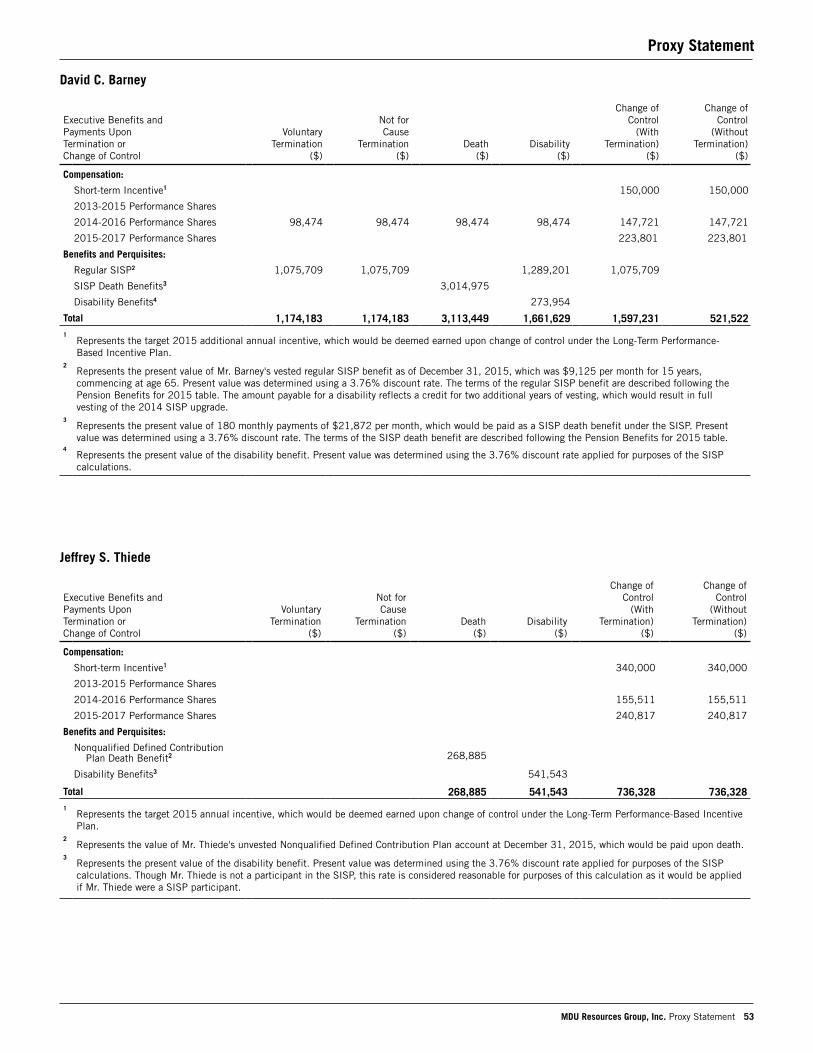
David C. Barney
Jeffrey S. Thiede
Executive Benefits and Payments Upon Termination or Change of Control
Voluntary Termination
($)
Not for Cause
Termination ($)
Death ($)
Disability ($)
Change of Control
(WithTermination)
($)
Change of Control
(Without Termination)
($)
Compensation:
Short-term Incentive1 340,000 340,000
2013-2015 Performance Shares
2014-2016 Performance Shares 155,511 155,511
2015-2017 Performance Shares 240,817 240,817
Benefits and Perquisites:
Nonqualified Defined ContributionPlan Death Benefit2 268,885
Disability Benefits3 541,543
Total 268,885 541,543 736,328 736,3281
Represents the target 2015 annual incentive, which would be deemed earned upon change of control under the Long-Term Performance-Based IncentivePlan.
2Represents the value of Mr. Thiede's unvested Nonqualified Defined Contribution Plan account at December 31, 2015, which would be paid upon death.
3Represents the present value of the disability benefit. Present value was determined using the 3.76% discount rate applied for purposes of the SISPcalculations. Though Mr. Thiede is not a participant in the SISP, this rate is considered reasonable for purposes of this calculation as it would be appliedif Mr. Thiede were a SISP participant.
Executive Benefits and Payments Upon Termination or Change of Control
Voluntary Termination
($)
Not for Cause
Termination ($)
Death ($)
Disability ($)
Change of Control
(With Termination)
($)
Change of Control
(Without Termination)
($)
Compensation:
Short-term Incentive1 150,000 150,000
2013-2015 Performance Shares
2014-2016 Performance Shares 98,474 98,474 98,474 98,474 147,721 147,721
2015-2017 Performance Shares 223,801 223,801
Benefits and Perquisites:
Regular SISP2 1,075,709 1,075,709 1,289,201 1,075,709
SISP Death Benefits3 3,014,975
Disability Benefits4 273,954
Total 1,174,183 1,174,183 3,113,449 1,661,629 1,597,231 521,5221
Represents the target 2015 additional annual incentive, which would be deemed earned upon change of control under the Long-Term Performance-Based Incentive Plan.
2Represents the present value of Mr. Barney's vested regular SISP benefit as of December 31, 2015, which was $9,125 per month for 15 years,commencing at age 65. Present value was determined using a 3.76% discount rate. The terms of the regular SISP benefit are described following thePension Benefits for 2015 table. The amount payable for a disability reflects a credit for two additional years of vesting, which would result in fullvesting of the 2014 SISP upgrade.
3Represents the present value of 180 monthly payments of $21,872 per month, which would be paid as a SISP death benefit under the SISP. Presentvalue was determined using a 3.76% discount rate. The terms of the SISP death benefit are described following the Pension Benefits for 2015 table.
4Represents the present value of the disability benefit. Present value was determined using the 3.76% discount rate applied for purposes of the SISPcalculations.
Proxy Statement
MDU Resources Group, Inc. Proxy Statement 53
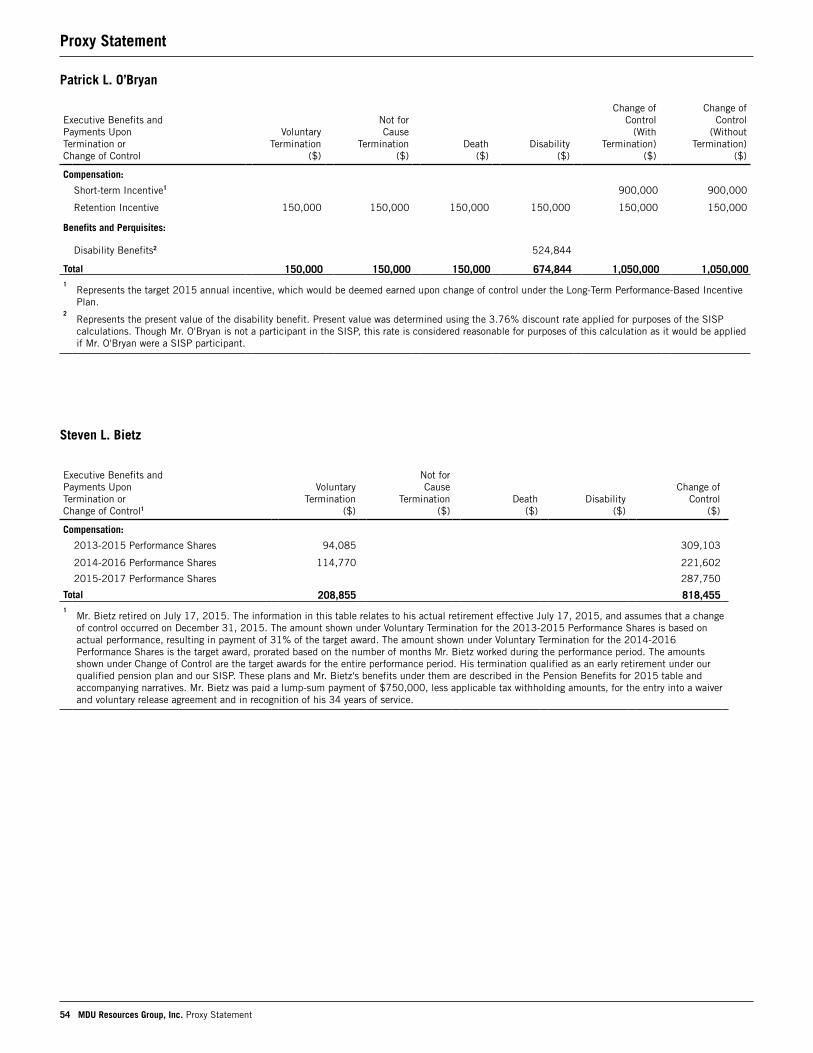
Patrick L. O’Bryan
Steven L. Bietz
Executive Benefits and Payments Upon Termination or Change of Control
Voluntary Termination
($)
Not for Cause
Termination ($)
Death ($)
Disability ($)
Change of Control
(With Termination)
($)
Change of Control
(Without Termination)
($)
Compensation:
Short-term Incentive1 900,000 900,000
Retention Incentive 150,000 150,000 150,000 150,000 150,000 150,000
Benefits and Perquisites:
Disability Benefits2 524,844
Total 150,000 150,000 150,000 674,844 1,050,000 1,050,0001
Represents the target 2015 annual incentive, which would be deemed earned upon change of control under the Long-Term Performance-Based IncentivePlan.
2Represents the present value of the disability benefit. Present value was determined using the 3.76% discount rate applied for purposes of the SISPcalculations. Though Mr. O'Bryan is not a participant in the SISP, this rate is considered reasonable for purposes of this calculation as it would be appliedif Mr. O'Bryan were a SISP participant.
Executive Benefits and Payments Upon Termination or Change of Control1
Voluntary Termination
($)
Not for Cause
Termination ($)
Death ($)
Disability ($)
Change of Control
($)
Compensation:
2013-2015 Performance Shares 94,085 309,103
2014-2016 Performance Shares 114,770 221,602
2015-2017 Performance Shares 287,750
Total 208,855 818,4551
Mr. Bietz retired on July 17, 2015. The information in this table relates to his actual retirement effective July 17, 2015, and assumes that a changeof control occurred on December 31, 2015. The amount shown under Voluntary Termination for the 2013-2015 Performance Shares is based onactual performance, resulting in payment of 31% of the target award. The amount shown under Voluntary Termination for the 2014-2016Performance Shares is the target award, prorated based on the number of months Mr. Bietz worked during the performance period. The amountsshown under Change of Control are the target awards for the entire performance period. His termination qualified as an early retirement under ourqualified pension plan and our SISP. These plans and Mr. Bietz's benefits under them are described in the Pension Benefits for 2015 table andaccompanying narratives. Mr. Bietz was paid a lump-sum payment of $750,000, less applicable tax withholding amounts, for the entry into a waiverand voluntary release agreement and in recognition of his 34 years of service.
Proxy Statement
54 MDU Resources Group, Inc. Proxy Statement
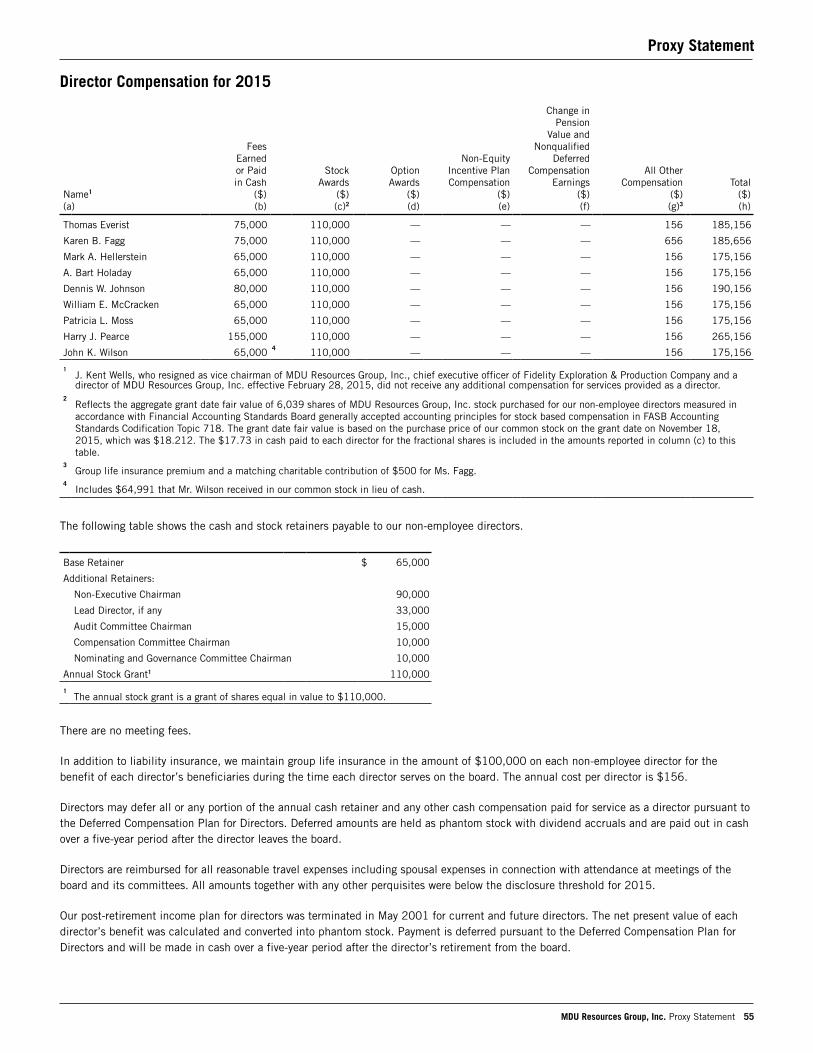
Director Compensation for 2015
The following table shows the cash and stock retainers payable to our non-employee directors.
Base Retainer $ 65,000
Additional Retainers:
Non-Executive Chairman 90,000
Lead Director, if any 33,000
Audit Committee Chairman 15,000
Compensation Committee Chairman 10,000
Nominating and Governance Committee Chairman 10,000
Annual Stock Grant1 110,000
1The annual stock grant is a grant of shares equal in value to $110,000.
There are no meeting fees.
In addition to liability insurance, we maintain group life insurance in the amount of $100,000 on each non-employee director for thebenefit of each director’s beneficiaries during the time each director serves on the board. The annual cost per director is $156.
Directors may defer all or any portion of the annual cash retainer and any other cash compensation paid for service as a director pursuant tothe Deferred Compensation Plan for Directors. Deferred amounts are held as phantom stock with dividend accruals and are paid out in cashover a five-year period after the director leaves the board.
Directors are reimbursed for all reasonable travel expenses including spousal expenses in connection with attendance at meetings of theboard and its committees. All amounts together with any other perquisites were below the disclosure threshold for 2015.
Our post-retirement income plan for directors was terminated in May 2001 for current and future directors. The net present value of eachdirector’s benefit was calculated and converted into phantom stock. Payment is deferred pursuant to the Deferred Compensation Plan forDirectors and will be made in cash over a five-year period after the director’s retirement from the board.
Name1 (a)
FeesEarnedor Paid in Cash
($) (b)
StockAwards
($)(c)2
OptionAwards
($)(d)
Non-Equity Incentive Plan Compensation
($) (e)
Change in Pension
Value and Nonqualified
Deferred Compensation
Earnings ($) (f)
All Other Compensation
($) (g)3
Total ($) (h)
Thomas Everist 75,000 110,000 — — — 156 185,156
Karen B. Fagg 75,000 110,000 — — — 656 185,656
Mark A. Hellerstein 65,000 110,000 — — — 156 175,156
A. Bart Holaday 65,000 110,000 — — — 156 175,156
Dennis W. Johnson 80,000 110,000 — — — 156 190,156
William E. McCracken 65,000 110,000 — — — 156 175,156
Patricia L. Moss 65,000 110,000 — — — 156 175,156
Harry J. Pearce 155,000 110,000 — — — 156 265,156
John K. Wilson 65,000 4 110,000 — — — 156 175,156
1J. Kent Wells, who resigned as vice chairman of MDU Resources Group, Inc., chief executive officer of Fidelity Exploration & Production Company and adirector of MDU Resources Group, Inc. effective February 28, 2015, did not receive any additional compensation for services provided as a director.
2Reflects the aggregate grant date fair value of 6,039 shares of MDU Resources Group, Inc. stock purchased for our non-employee directors measured inaccordance with Financial Accounting Standards Board generally accepted accounting principles for stock based compensation in FASB AccountingStandards Codification Topic 718. The grant date fair value is based on the purchase price of our common stock on the grant date on November 18,2015, which was $18.212. The $17.73 in cash paid to each director for the fractional shares is included in the amounts reported in column (c) to thistable.
3Group life insurance premium and a matching charitable contribution of $500 for Ms. Fagg.
4Includes $64,991 that Mr. Wilson received in our common stock in lieu of cash.
Proxy Statement
MDU Resources Group, Inc. Proxy Statement 55
Our director stock ownership policy contained in our corporate governance guidelines requires each director to own our common stock equalin value to five times the director’s annual cash base retainer. Shares acquired through purchases on the open market and participation inour director stock plans will be considered in ownership calculations as will ownership of our common stock by a spouse. A director isallowed five years commencing January 1 of the year following the year of that director’s initial election to the board to meet therequirements. The level of common stock ownership is monitored with an annual report made to the compensation committee of the board.For stock ownership, please see “Security Ownership.”
Narrative Disclosure of our Compensation Policies and Practices as They Relate to Risk ManagementThe human resources department has conducted an assessment of the risks arising from our compensation policies and practices for allemployees and concluded that none of these risks is reasonably likely to have a material adverse effect on the company. Based on thehuman resources department’s assessment and taking into account information received from the risk identification process, seniormanagement and our management policy committee concluded that risks arising from our compensation policies and practices for allemployees are not reasonably likely to have a material adverse effect on the company. After review and discussion with senior management,the compensation committee concurred with this assessment.
As part of its assessment of the risks arising from our compensation policies and practices for all employees, the human resourcesdepartment identified the principal areas of risk faced by the company that may be affected by our compensation policies and practices forall employees, including any risks resulting from our operating businesses’ compensation policies and practices. In assessing the risksarising from our compensation policies and practices, the human resources department identified the following practices designed toprevent excessive risk taking:
Business management and governance practices
• risk management is a specific performance competency included in the annual performance assessment of Section 16 officers
• board oversight on capital expenditure and operating plans that promotes careful consideration of financial assumptions
• limitation on business acquisitions without board approval
• employee integrity training programs and anonymous reporting systems
• quarterly risk assessment reports at audit committee meetings and
• prohibitions on holding company stock in an account that is subject to a margin call, pledging company stock as collateral for a loan, andhedging of company stock by Section 16 officers and directors.
Executive compensation practices
• active compensation committee review of executive compensation, including comparison of executive compensation to total stockholderreturn ratio to the ratio for the performance graph peer group (PEER Analysis)
• the initial determination of a position’s salary grade to be at or near the 50th percentile of base salaries paid to similar positions at peergroup companies and/or relevant industry companies
• consideration of peer group and/or relevant industry practices to establish appropriate compensation target amounts
• a balanced compensation mix of fixed salary and annual and long-term incentives tied to the company’s financial performance
• use of interpolation for annual and long-term incentive awards to avoid payout cliffs
• negative discretion to adjust any annual or long-term incentive award payment downward
• use of caps on annual incentive awards (maximum of 200% of target) and long-term incentive stock grant awards (200% target)
• clawback availability on incentive payments in the event of a financial restatement
• use of performance shares, rather than stock options or stock appreciation rights, as the equity component of incentive compensation
Proxy Statement
56 MDU Resources Group, Inc. Proxy Statement
• use of performance shares with a relative total stockholder return performance goal and mandatory reduction in award if total stockholderreturn is negative
• use of three-year performance periods to discourage short-term risk-taking
• substantive incentive goals measured primarily by return on invested capital, earnings, and earnings per share criteria, which encouragebalanced performance and are important to stockholders
• use of financial performance metrics that are readily monitored and reviewed
• regular review of the appropriateness of the companies in the performance graph peer group
• stock ownership requirements for the board and for executives receiving long-term incentive awards under the MDU Resources Group, Inc.Long-Term Performance-Based Incentive Plan
• mandatory holding periods for 50% of any net after-tax shares earned under long-term incentive awards granted in 2011 and thereafterand
• use of independent consultants in establishing pay targets at least biennially.
Proxy Statement
MDU Resources Group, Inc. Proxy Statement 57
INFORMATION CONCERNING EXECUTIVE OFFICERS
At the first annual meeting of the board after the annual meeting of stockholders, our board of directors elects our executive officers, whoserve until their successors are chosen and qualify. A majority of our board of directors may remove any executive officer at any time.Information concerning our executive officers, including their ages as of December 31, 2015, present corporate positions, and businessexperience, is as follows:
Name Age Present Corporate Position and Business Experience
David L. Goodin 54 Mr. Goodin was elected president and chief executive officer of the company and a directoreffective January 4, 2013. For more information about Mr. Goodin, see “Item 1. Election ofDirectors.”
David C. Barney 60 Mr. Barney was elected president and chief executive officer of Knife River Corporation effectiveApril 30, 2013; president effective January 1, 2012; and president of its western area operationseffective October 2008. Prior to that, he was manager of its Northern California region effectiveJuly 2005 and became president of Concrete, Inc. in 1996. He joined Concrete, Inc. in 1986 andheld numerous positions of increasing responsibility before it was acquired by Knife RiverCorporation in September 1993.
Martin A. Fritz 51 Mr. Fritz was elected president and chief executive officer of WBI Holdings, Inc. effective July 20,2015. Prior to joining WBI Holdings, Inc., he had his own energy consulting firm, Fritz Consulting,from February 2014 to July 2015, where he provided strategy, operations, business development,and business brokerage services. Prior to that, Mr. Fritz was employed by EQT Corporation inpositions of increasing responsibility, most recently serving as its executive vice presidentmidstream operations, land and construction from 2013 through January 2014 and vice presidentEQT and president EQT midstream operations from 2008 to 2013.
Dennis L. Haider 63 Mr. Haider was elected executive vice president-business development effective June 1, 2013.Prior to that, he was executive vice president-business development and gas supply of Montana-Dakota Utilities Co., Great Plains Natural Gas Co., Cascade Natural Gas Corporation, andIntermountain Gas Company from January 1, 2012 to May 31, 2013; executive vice president-regulatory, gas supply, and business development of Cascade Natural Gas Corporation andIntermountain Gas Company from October 1, 2010 to December 31, 2011, and of Montana-Dakota Utilities Co. and Great Plains Natural Gas Co. from October 1, 2008 to December 31,2011; and executive vice president-business development and gas supply of Montana-DakotaUtilities Co. and Great Plains Natural Gas Co. from August 1, 2005 to September 30, 2008. Hejoined Montana-Dakota Utilities Co. in 1978 and held numerous positions of increasingresponsibility.
Anne M. Jones 52 Ms. Jones was elected vice president-human resources effective January 1, 2016. Prior to that,she was vice president-human resources, customer service, and safety at Montana-Dakota UtilitiesCo., Great Plains Natural Gas Co., Cascade Natural Gas Corporation, and Intermountain GasCompany effective July 1, 2013; director of human resources for Montana-Dakota Utilities Co. andGreat Plains Natural Gas Co. effective June 2008; and manager of organizational learning anddevelopment effective February 2003. Ms. Jones joined Montana-Dakota Utilities Co. in 1982 andheld numerous positions of increasing responsibility.
Nicole A. Kivisto 42 Ms. Kivisto was elected president and chief executive officer of Montana-Dakota Utilities Co.,Great Plains Natural Gas Co., Cascade Natural Gas Corporation, and Intermountain Gas Companyeffective January 9, 2015. Prior to that, she was vice president of operations for Montana-DakotaUtilities Co. and Great Plains Natural Gas Co. effective January 3, 2014; vice president, controllerand chief accounting officer for the company effective February 17, 2010; controller effectiveDecember 1, 2005; financial analyst IV in the Corporate Planning Department effective May2003; financial and investor relations analyst in the Investor Relations Department effective May2000; and financial analyst in the Corporate Accounting Department effective July 1995.
Daniel S. Kuntz 62 Mr. Kuntz was elected general counsel and secretary effective January 9, 2016. Mr. Kuntz joinedthe company in June 2004 as a senior attorney. He then became associate general counsel inApril 2007 and added assistant secretary to his title in August 2007. Prior to joining the company,Mr. Kuntz was an associate and partner at Zuger, Kirmis & Smith Law firm.
Proxy Statement
58 MDU Resources Group, Inc. Proxy Statement
Cynthia J. Norland 61 Ms. Norland was elected vice president-administration effective July 16, 2007. Prior to that, shewas the assistant vice president-administration effective January 17, 2007; associate generalcounsel in the Legal Department effective March 6, 2004; and senior attorney in the LegalDepartment effective June 1, 1995.
Nathan W. Ring 40 Mr. Ring was elected vice president, controller and chief accounting officer effective January 3,2014. Prior to that, he was treasurer and controller for MDU Construction Services Group, Inc.since September 2012 and was its controller from June 2012 until September 2012. Prior to that,he served as assistant controller of D S S Company, a subsidiary of Knife River Corporation, fromMarch 2009 to June 2012 and as controller of another Knife River Corporation subsidiary, HapTaylor & Sons, Inc. doing business as Norm’s Utility Contractor, Inc., from March 2007 to March2009. He joined MDU Resources Group, Inc. in 2001 as a tax analyst.
Doran N. Schwartz 46 Mr. Schwartz was elected vice president and chief financial officer effective February 17, 2010.Prior to that, he was vice president and chief accounting officer effective March 1, 2006; andassistant vice president-special projects effective September 6, 2005. He was director ofmembership rewards for American Express, a financial services company, from November 2004 toAugust 1, 2005; audit manager for Deloitte & Touche, an audit and professional services company,from June 2002 to November 2004; and audit manager/senior for Arthur Andersen, an audit andprofessional services company, from December 1997 to June 2002.
Jeffrey S. Thiede 53 Mr. Thiede was elected president and chief executive officer of MDU Construction Services Group,Inc. effective April 30, 2013, and president effective January 1, 2012. Prior to that, he waspresident of Capital Electric Construction Company, Inc. effective July 2006, and president ofOregon Electric Construction, Inc. effective October 2004. Prior to joining the company,Mr. Thiede was a project director for DPR Construction and worked in the field as an insidewireman.
Jason L. Vollmer 38 Mr. Vollmer was elected treasurer and director of cash and risk management effectiveNovember 29, 2014. Mr. Vollmer joined the company effective October 17, 2005, as a financialanalyst II. He then became financial analyst III effective January 1, 2007, and financial analyst IVeffective February 2, 2009. Effective April 11, 2011, he became manager of treasury services,cash and risk management until June 30, 2014 when he became assistant treasurer of CentennialEnergy Holdings, Inc. and manager of treasury services and risk management.
Proxy Statement
MDU Resources Group, Inc. Proxy Statement 59
SECURITY OWNERSHIP
The table below sets forth the number of shares of our capital stock that each director and each nominee for director, each named executiveofficer, and all directors and executive officers as a group owned beneficially as of December 31, 2015.
Name
Common SharesBeneficially
Owned1
SharesHeld by Family
Members2Percentof Class
DeferredDirector Fees
Held asPhantom
Stock3
David C. Barney 8,338 4,5 687 *
Steven L. Bietz 73,849 5,6 565 *
Thomas Everist 1,149,572 7 * 31,952
Karen B. Fagg 55,465 *
David L. Goodin 73,462 5,8 8,859 *
Mark A. Hellerstein 11,880 * 5,691
A. Bart Holaday 57,025 * 5,691
Dennis W. Johnson 74,511 9 163 *
William E. McCracken 11,880 *
Patricia L. Moss 75,957 *
Patrick O’Bryan —
Harry J. Pearce 231,999 * 52,536
Doran N. Schwartz 46,496 5,10 1,300 *
Jeffrey S. Thiede 2,580 5 *
John K. Wilson 112,786 *
All directors and executive officers as a group (23 in number) 2,186,977 12,828 1.1 95,870
* Less than one percent of the class.1
“Beneficial ownership” means the sole or shared power to vote, or to direct the voting of, a security, or investment power with respect to a security.2
These shares are included in the “Common Shares Beneficially Owned” column.3
These shares are not included in the “Common Shares Beneficially Owned” column. Directors may defer all or a portion of their cash compensationpursuant to the Deferred Compensation Plan for Directors. Deferred amounts are held as phantom stock with dividend accruals and are paid out in cashover a five-year period after the director leaves the board.
4The total includes 687 shares owned by Mr. Barney’s wife.
5Includes full shares allocated to the officer’s account in our 401(k) retirement plan.
6Mr. Bietz disclaims all beneficial ownership of the 565 shares owned by his father.
7Includes 1,070,000 shares of common stock acquired through the sale of Connolly-Pacific to us.
8The total includes 8,859 shares owned by Mr. Goodin’s wife.
9Mr. Johnson disclaims all beneficial ownership of the 163 shares owned by his wife.
10The total includes 1,300 shares owned by Mr. Schwartz’s wife.
We prohibit our directors and executive officers from hedging their ownership of company common stock. They may not enter intotransactions that allow them to benefit from devaluation of our stock or otherwise own stock technically but without the full benefits andrisks of such ownership.
Directors, executive officers, and related persons are prohibited from holding our common stock in a margin account, with certainexceptions, or pledging company securities as collateral for a loan. Company common stock may be held in a margin brokerage account onlyif the stock is explicitly excluded from any margin, pledge, or security provisions of the customer agreement. Company common stock maybe held in a cash account, which is a brokerage account that does not allow any extension of credit on securities. “Related person” meansan executive officer’s or director’s spouse, minor child, and any person (other than a tenant or domestic employee) sharing the household ofa director or executive officer, as well as any entities over which a director or executive officer exercises control.
Proxy Statement
60 MDU Resources Group, Inc. Proxy Statement
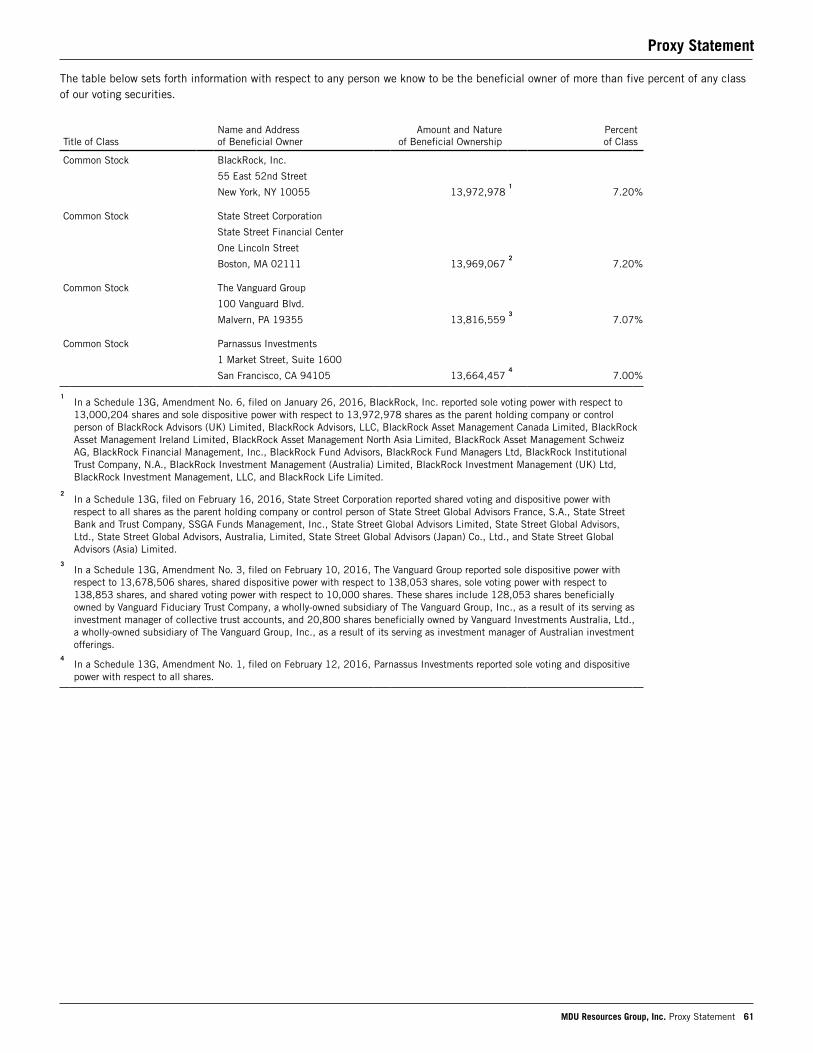
The table below sets forth information with respect to any person we know to be the beneficial owner of more than five percent of any classof our voting securities.
Title of ClassName and Addressof Beneficial Owner
Amount and Natureof Beneficial Ownership
Percentof Class
Common Stock BlackRock, Inc.
55 East 52nd Street
New York, NY 10055 13,972,9781
7.20%
Common Stock State Street Corporation
State Street Financial Center
One Lincoln Street
Boston, MA 02111 13,969,0672
7.20%
Common Stock The Vanguard Group
100 Vanguard Blvd.
Malvern, PA 19355 13,816,5593
7.07%
Common Stock Parnassus Investments
1 Market Street, Suite 1600
San Francisco, CA 94105 13,664,4574
7.00%
1In a Schedule 13G, Amendment No. 6, filed on January 26, 2016, BlackRock, Inc. reported sole voting power with respect to13,000,204 shares and sole dispositive power with respect to 13,972,978 shares as the parent holding company or controlperson of BlackRock Advisors (UK) Limited, BlackRock Advisors, LLC, BlackRock Asset Management Canada Limited, BlackRockAsset Management Ireland Limited, BlackRock Asset Management North Asia Limited, BlackRock Asset Management SchweizAG, BlackRock Financial Management, Inc., BlackRock Fund Advisors, BlackRock Fund Managers Ltd, BlackRock InstitutionalTrust Company, N.A., BlackRock Investment Management (Australia) Limited, BlackRock Investment Management (UK) Ltd,BlackRock Investment Management, LLC, and BlackRock Life Limited.
2In a Schedule 13G, filed on February 16, 2016, State Street Corporation reported shared voting and dispositive power withrespect to all shares as the parent holding company or control person of State Street Global Advisors France, S.A., State StreetBank and Trust Company, SSGA Funds Management, Inc., State Street Global Advisors Limited, State Street Global Advisors,Ltd., State Street Global Advisors, Australia, Limited, State Street Global Advisors (Japan) Co., Ltd., and State Street GlobalAdvisors (Asia) Limited.
3In a Schedule 13G, Amendment No. 3, filed on February 10, 2016, The Vanguard Group reported sole dispositive power withrespect to 13,678,506 shares, shared dispositive power with respect to 138,053 shares, sole voting power with respect to138,853 shares, and shared voting power with respect to 10,000 shares. These shares include 128,053 shares beneficiallyowned by Vanguard Fiduciary Trust Company, a wholly-owned subsidiary of The Vanguard Group, Inc., as a result of its serving asinvestment manager of collective trust accounts, and 20,800 shares beneficially owned by Vanguard Investments Australia, Ltd.,a wholly-owned subsidiary of The Vanguard Group, Inc., as a result of its serving as investment manager of Australian investmentofferings.
4In a Schedule 13G, Amendment No. 1, filed on February 12, 2016, Parnassus Investments reported sole voting and dispositivepower with respect to all shares.
Proxy Statement
MDU Resources Group, Inc. Proxy Statement 61
RELATED PERSON TRANSACTION DISCLOSURE
The board of directors has adopted a policy for the review of related person transactions. This policy is contained in our corporategovernance guidelines, which are posted on our website at http://www.mdu.com/docs/default-source/governance/corporategovernanceguidelines.pdf. The audit committee reviews any transaction, arrangement or relationship, or series thereof:
• in which we are or will be a participant
• the amount involved exceeds $120,000 and
• a related person has or will have a material interest.
The purpose of this review is to determine whether this transaction is in the best interests of the company.
Related persons are directors, director nominees, executive officers, holders of 5% or more of our voting stock, and their immediate familymembers. Related persons are required promptly to report to our general counsel all proposed or existing related person transactions inwhich they are involved.
If our general counsel determines that the transaction may be required to be disclosed under the Securities and Exchange Commission’srules, the general counsel furnishes the information to the chairman of the audit committee. After its review, the committee makes adetermination or a recommendation to the board and officers of the company with respect to the related person transaction. Upon receipt ofthe committee’s recommendation, the board of directors or officers, as the case may be, take such action as they deem appropriate in lightof their responsibilities under applicable laws and regulations.
CORPORATE GOVERNANCE
Director Independence
The board of directors has adopted guidelines on director independence that are included in our corporate governance guidelines, which areavailable for review on our corporate website at http://www.mdu.com/docs/default-source/governance/corporategovernanceguidelines.pdf. Theboard of directors has determined that current directors Thomas Everist, Karen B. Fagg, Mark A. Hellerstein, A. Bart Holaday, Dennis W.Johnson, William E. McCracken, Patricia L. Moss, Harry J. Pearce, and John K. Wilson:
• have no material relationship with us and
• are independent in accordance with our director independence guidelines and the New York Stock Exchange listing standards.
In determining director independence, the board of directors reviewed and considered information about any transactions, relationships, andarrangements between the independent directors and their immediate family members and affiliated entities on the one hand, and thecompany and its affiliates on the other, and in particular the following transactions, relationships, and arrangements:
• Business relationships with entities with which a director is affiliated: Agreements and/or payments between the City of Dickinson, NorthDakota, where Dennis Johnson served as president of the city board of commissioners until his resignation effective October 31, 2015,and (i) Dakota Prairie Refining, LLC, a limited liability company jointly owned by WBI Energy, Inc., an indirect wholly-owned subsidiary ofthe company, and Calumet Specialty Products Partners, L.P., relating to the supply of industrial water and treatment of waste water, (ii)Montana-Dakota Utilities Co. for utility services, and (iii) Knife River Corporation for street improvements and underground utilities.
• Charitable contributions by the MDU Resources Foundation (Foundation) to nonprofit organizations, where a director, or a director’sspouse, serves or has served as a director, chair, or vice chair of the board of trustees, trustee or member of the organization or relatedentity: Charitable contributions by the Foundation to Sanford Health Foundation, Billings Catholic Schools Foundation, the DenverChildren’s Advocacy Center, Community Resources Inc., the University of North Dakota Foundation, the University of Jamestown and itsfoundation, and the St. Charles Foundation. None of the contributions made to any of these nonprofit entities during the last three fiscalyears exceeded in any single year the greater of $1 million or 2% of the relevant entity’s consolidated gross revenues.
Proxy Statement
62 MDU Resources Group, Inc. Proxy Statement
Director Resignation Upon Change of Job Responsibility
Our corporate governance guidelines require a director to tender his or her resignation after a material change in job responsibility. In 2015,no directors submitted resignations under this requirement.
Board Evaluation
Our corporate governance guidelines provide that the board of directors, in coordination with the nominating and governance committee, willannually review and evaluate the performance and functioning of the board and its committees. In 2015, the board engaged an externalconsultant to conduct the annual evaluation which included interviews with individual board members and considered various topics relatingto the board and committees, including board composition and culture, strategy and performance measures, risk monitoring and crisiscontrol, succession planning, and stakeholder involvement. The results of the evaluations were reviewed and discussed in executive sessionsof the committees and the board of directors.
Code of Conduct
We have a code of conduct and ethics, which we refer to as the Leading With Integrity Guide, which applies to all employees, directors, andofficers.
We intend to satisfy our disclosure obligations regarding:
• amendments to, or waivers of, any provision of the code of conduct that applies to our principal executive officer, principal financialofficer, and principal accounting officer and that relates to any element of the code of ethics definition in Regulation S-K, Item 406(b)and
• waivers of the code of conduct for our directors or executive officers, as required by New York Stock Exchange listing standards
by posting such information on our website at http://www.mdu.com/docs/default-source/governance/leadingwithintegrity.pdf.
Board Leadership Structure and Board’s Role in Risk Oversight
The board separated the positions of chairman of the board and chief executive officer in 2006 and elected Harry J. Pearce, a non-employeeindependent director, as its chairman. Separating these positions allows the chief executive officer to focus on the full-time job of runningour business, while allowing the chairman of the board to lead the board in its fundamental role of providing advice to and independentoversight of management. The board believes this structure recognizes the time, effort, and energy the chief executive officer is required todevote to the position in the current business environment, as well as the commitment required to serve as the chairman, particularly as theboard’s oversight responsibilities continue to grow and demand more time and attention. The fundamental role of the board of directors is toprovide oversight of the management of the company in good faith and in the best interests of the company and its stockholders. Having anindependent chairman is a means to ensure the chief executive officer is accountable for managing the company in close alignment with theinterests of stockholders. An independent chairman avoids the conflicts of interest that arise when the chairman and chief executive officerpositions are combined and more effectively manages relationships between the board and the chief executive officer. An independentchairman is in a better position to encourage frank and lively discussions and to assure that the company has adequately assessed allappropriate business risks before adopting its final business plans and strategies. Our bylaws and corporate governance guidelines requirethat our chairman be independent. The board believes that having separate positions and having an independent outside director serve aschairman is the appropriate leadership structure for the company and demonstrates our commitment to good corporate governance.
Risk is inherent with every business, and how well a business manages risk can ultimately determine its success. We face a number of risks,including economic risks, environmental and regulatory risks, and others, such as the impact of competition, weather conditions, limitationson our ability to pay dividends, pension plan obligations, cyber attacks or acts of terrorism, and our ability to sell all of the assets of ourexploration and production business and potential liabilities relating to sold assets arising from events prior to sale. Management isresponsible for the day-to-day management of risks the company faces, while the board, as a whole and through its committees, hasresponsibility for the oversight of risk management. In its risk oversight role, the board of directors has the responsibility to satisfy itself thatthe risk management processes designed and implemented by management are adequate and functioning as designed.
The board believes establishing the right “tone at the top” and full and open communication between management and the board ofdirectors are essential for effective risk management and oversight. Our chairman meets regularly with our president and chief executiveofficer and other senior officers to discuss strategy and risks facing the company. Senior management attends the quarterly board meetingsand is available to address any questions or concerns raised by the board on risk management-related and any other matters. Each quarter,
Proxy Statement
MDU Resources Group, Inc. Proxy Statement 63
the board of directors receives presentations from senior management on strategic matters involving our operations. The board holdsstrategic planning sessions with senior management to discuss strategies, key challenges, and risks and opportunities for the company.
While the board is ultimately responsible for risk oversight at our company, our three board committees assist the board in fulfilling itsoversight responsibilities in certain areas of risk. The audit committee assists the board in fulfilling its oversight responsibilities with respectto risk management in a general manner and specifically in the areas of financial reporting, internal controls and compliance with legal andregulatory requirements, and, in accordance with New York Stock Exchange requirements, discusses policies with respect to risk assessmentand risk management and their adequacy and effectiveness. Risk assessment reports are regularly provided by management to the auditcommittee or the full board. This opens the opportunity for discussions about areas where the company may have material risk exposure,steps taken to manage such exposure, and the company’s risk tolerance in relation to company strategy. The audit committee reportsregularly to the board of directors on the company’s management of risks in the audit committee’s areas of responsibility. The compensationcommittee assists the board in fulfilling its oversight responsibilities with respect to the management of risks arising from our compensationpolicies and programs. The nominating and governance committee assists the board in fulfilling its oversight responsibilities with respect tothe management of risks associated with board organization, membership and structure, succession planning for our directors and executiveofficers, and corporate governance.
Board Meetings and Committees
During 2015, the board of directors held 12 meetings. Each director attended at least 75% of the combined total meetings of the boardand the committees on which the director served during 2015. Director attendance at our annual meeting of stockholders is left to thediscretion of each director. Three directors attended our 2015 annual meeting of stockholders. In November 2015, the board of directorsadopted a resolution that attendance at the annual meeting by each director is encouraged.
Harry J. Pearce was elected non-employee chairman of the board on August 17, 2006, and previously served as lead director fromFebruary 15, 2001 to August 17, 2006. He presides at the executive session of the non-employee directors held in connection with eachregularly scheduled quarterly board of directors meeting. The non-employee directors also meet in executive session with the chief executiveofficer at each regularly scheduled quarterly board of directors meeting. All of our non-employee directors are independent directors.
The board has a standing audit committee, compensation committee, and nominating and governance committee. These committees arecomposed entirely of independent directors.
The audit, compensation, and nominating and governance committees have charters, which are available for review on our website athttp://www.mdu.com/integrity/governance/board-charters-and-committees. Our corporate governance guidelines are available at http://www.mdu.com/docs/default-source/governance/corporategovernanceguidelines.pdf, and our Leading With Integrity Guide is also onour website at http://www.mdu.com/docs/default-source/governance/leadingwithintegrity.pdf.
Nominating and Governance Committee
The nominating and governance committee met three times during 2015. The committee members are Karen B. Fagg, chair, A. BartHoladay, William E. McCracken, and Patricia L. Moss.
The nominating and governance committee provides recommendations to the board with respect to:
• board organization, membership, and function
• committee structure and membership
• succession planning for our executive management and directors and
• corporate governance guidelines applicable to us.
The nominating and governance committee assists the board in overseeing the management of risks in the committee’s areas ofresponsibility.
The committee identifies individuals qualified to become directors and recommends to the board the nominees for director for the nextannual meeting of stockholders. The committee also identifies and recommends to the board individuals qualified to become our principalofficers and the nominees for membership on each board committee. The committee oversees the evaluation of the board and management.
Proxy Statement
64 MDU Resources Group, Inc. Proxy Statement
In identifying nominees for director, the committee consults with board members, our management, consultants, and other individuals likelyto possess an understanding of our business and knowledge concerning suitable director candidates.
Our corporate governance guidelines include our policy on consideration of director candidates recommended to us. We will considercandidates that our stockholders recommend. Stockholders may submit director candidate recommendations to the nominating andgovernance committee chairman in care of the secretary at MDU Resources Group, Inc., P.O. Box 5650, Bismarck, ND 58506-5650. Pleaseinclude the following information:
• the candidate’s name, age, business address, residence address, and telephone number
• the candidate’s principal occupation
• the class and number of shares of our stock owned by the candidate
• a description of the candidate’s qualifications to be a director
• whether the candidate would be an independent director and
• any other information you believe is relevant with respect to the recommendation.
These guidelines provide information to stockholders who wish to recommend candidates for director for consideration by the nominatingand governance committee. Stockholders who wish to actually nominate persons for election to our board at an annual meeting ofstockholders must follow the procedures set forth in section 2.08 of our bylaws. You may obtain a copy of the bylaws by writing to thesecretary of MDU Resources Group, Inc. at the address above. Our bylaws are also available on our website at http://www.mdu.com/integrity/governance/guidelines-and-bylaws. See also the section entitled “2017 Annual Meeting of Stockholders” later in the proxy statement.
There are no differences in the manner by which the committee evaluates director candidates recommended by stockholders and thoserecommended by other sources.
In evaluating director candidates, the committee considers an individual’s:
• background, character, and experience, including experience relative to our company’s lines of business
• skills and experience which complement the skills and experience of current board members
• success in the individual’s chosen field of endeavor
• skill in the areas of accounting and financial management, banking, general management, human resources, marketing, operations,public affairs, law, technology, and operations abroad
• background in publicly traded companies
• geographic area of residence
• diversity of business and professional experience, skills, gender, and ethnic background, as appropriate in light of the current compositionand needs of the board
• independence, including any affiliation or relationship with other groups, organizations, or entities and
• prior and future compliance with applicable law and all applicable corporate governance, code of conduct and ethics, conflict of interest,corporate opportunities, confidentiality, stock ownership and trading policies, and our other policies and guidelines.
In addition, our bylaws contain requirements that a person must meet in order to qualify for service as a director.
As indicated above, when identifying nominees to serve as director, the nominating and governance committee will consider candidates withdiverse business and professional experience, skills, gender, and ethnic background, as appropriate, in light of the current composition andneeds of the board. The nominating and governance committee assesses the effectiveness of this policy annually in connection with thenomination of directors for election at the annual meeting of stockholders. The composition of the current board reflects diversity inbusiness and professional experience, skills, and gender.
Proxy Statement
MDU Resources Group, Inc. Proxy Statement 65
The committee generally will hire an outside firm to perform a background check on potential nominees.
Audit Committee
The audit committee is a separately-designated standing committee established in accordance with Section 3(a)(58)(A) of the SecuritiesExchange Act of 1934.
The audit committee met eight times during 2015. The audit committee members are Dennis W. Johnson, chair, Mark A. Hellerstein,A. Bart Holaday, and John K. Wilson. The board of directors has determined that Messrs. Johnson, Hellerstein, Holaday, and Wilson are“audit committee financial experts” as defined by Securities and Exchange Commission regulations and meet the independence standardfor audit committee members under our director independence guidelines, the New York Stock Exchange listing standards, and Securitiesand Exchange Commission rules.
The audit committee assists the board of directors in fulfilling its oversight responsibilities to the stockholders and serves as acommunication link among the board, management, the independent registered public accounting firm, and the internal auditors. The auditcommittee:
• assists the board’s oversight of
◦ the integrity of our financial statements and system of internal controls
◦ the company’s compliance with legal and regulatory requirements
◦ the independent registered public accounting firm’s qualifications and independence
◦ the performance of our internal audit function and independent registered public accounting firm and
◦ management of risk in the audit committee’s areas of responsibility and
• arranges for the preparation of and approves the report that Securities and Exchange Commission rules require we include in our annualproxy statement.
Audit Committee Report
In connection with our financial statements for the year ended December 31, 2015, the audit committee has (1) reviewed anddiscussed the audited financial statements with management; (2) discussed with the independent registered public accountingfirm (the “Auditors”) the matters required to be discussed by Public Company Accounting Oversight Board Auditing Standard No.16, Communications with Audit Committees; and (3) received the written disclosures and the letter from the Auditors required byapplicable requirements of the Public Company Accounting Oversight Board regarding the Auditors’ communications with theaudit committee concerning independence, and has discussed with the Auditors their independence.
Based on the review and discussions referred to in items (1) through (3) of the above paragraph, the audit committeerecommended to the board of directors that the audited financial statements be included in our Annual Report on Form 10-K forthe year ended December 31, 2015, for filing with the Securities and Exchange Commission.
Dennis W. Johnson, Chairman
Mark A. Hellerstein
A. Bart Holaday
John K. Wilson
Proxy Statement
66 MDU Resources Group, Inc. Proxy Statement
Compensation Committee
The compensation committee met six times during 2015. The compensation committee members are Thomas Everist, chair, Karen B. Fagg,William E. McCracken, and Patricia L. Moss.
The compensation committee’s responsibilities, as set forth in its charter, include:
• review and recommend changes to the board regarding executive compensation policies for directors and executives
• evaluate the chief executive officer’s performance and, either as a committee or together with other independent directors as directed bythe board, determine his or her compensation
• recommend to the board the compensation of our other Section 16 officers and directors
• establish goals, make awards, review performance and determine, or recommend to the board, awards earned under our annual and long-term incentive compensation plans
• review and discuss with management the Compensation Discussion and Analysis and based upon such review and discussion, determinewhether to recommend to the board that the Compensation Discussion and Analysis be included in our proxy statement and/or our AnnualReport on Form 10-K
• arrange for the preparation of and approve the compensation committee report to be included in our proxy statement and/or AnnualReport on Form 10-K
• assist the board in overseeing the management of risk in the committee’s areas of responsibility and
• appoint, compensate, and oversee the work of any compensation consultant, legal counsel or other adviser retained by the compensationcommittee.
The compensation committee and the board of directors have sole and direct responsibility for determining compensation for our Section 16officers and directors. The compensation committee makes recommendations to the board regarding compensation of all Section 16officers, and the board then acts on the recommendations. The compensation committee and the board may not delegate their authority.They may, however, use recommendations from outside consultants, the chief executive officer, and the human resources department. Thechief executive officer, the vice president-human resources, and general counsel regularly attend compensation committee meetings. Thecommittee meets in executive session as needed. The committee’s practice has been to retain a compensation consultant every other year toconduct a competitive analysis on executive compensation. The competitive analysis is conducted internally in the other years. Thecommittee did not retain a compensation consultant in 2015 to prepare a competitive assessment for 2016 compensation for our Section16 officers.
The processes and procedures for consideration and determination of compensation of the Section 16 officers are discussed in theCompensation Discussion and Analysis. The role of our executive officers in determining or recommending compensation for our Section 16officers is also discussed in the Compensation Discussion and Analysis.
During 2015, the vice president-human resources and the human resources department prepared the 2016 competitive assessmentcovering our Section 16 officers. The vice president-human resources and the human resources department also worked with the chiefexecutive officer to:
• recommend salary grade midpoints, base salaries, annual and long-term incentive targets, benefit level increases under our SupplementalIncome Security Plan, and employer contributions under our Nonqualified Defined Contribution Plan for our executive officers other thanthe chief executive officer and the vice president-human resources
• review recommended base salary grades, salary increases, and annual and long-term incentive targets submitted by executive officers forofficers reporting to them for reasonableness and alignment with company or business segment objectives
• review and update annual and long-term incentive programs
• construct a recommended 2016 salary grade structure and
• verify the competitiveness of short-term and long-term incentive targets associated with salary grades, the industry competitiveness of theincentive awards threshold, target and maximum award levels and the degree of stretch in the goals, the mix of annual and long-term
Proxy Statement
MDU Resources Group, Inc. Proxy Statement 67
compensation, and the use of total shareholder return as a single measure for long-term incentive and recommend modifications asappropriate.
Mr. Goodin recommended compensation for Patrick L. O’Bryan in connection with his promotion and Fidelity sales bonus incentive and forSteven L. Bietz in connection with his retirement. This is further discussed in the Compensation Discussion and Analysis contained herein.
The compensation committee has sole authority to retain or obtain the advice of compensation consultants, legal counsel or other advisersto assist in consideration of the compensation of the chief executive officer, the other Section 16 officers, and the board of directors. Thecommittee is directly responsible for the appointment, compensation and oversight of the work of any adviser retained by the committee.Prior to retaining an adviser and annually, the committee will consider all factors relevant to the adviser’s independence from management.The compensation committee charter requires the committee’s pre-approval of the engagement of the committee’s compensationconsultants by the company for any other purpose. The compensation committee authorized the company to participate in compensationand employee benefits surveys sponsored by Towers Watson in 2015.
Annually the compensation committee conducts an assessment of any potential conflicts of interest raised by the work of any compensationconsultant to determine if any conflict exists and how such conflict should be addressed. The compensation committee requested andreceived information from its compensation consultant, Towers Watson, to assist the committee in determining whether Towers Watson’swork raised any conflict of interest. The compensation committee has reviewed Towers Watson’s responses to its request and determinedthat the work of Towers Watson did not raise any conflict of interest in 2015.
The board of directors determines compensation for our non-employee directors based upon recommendations from the compensationcommittee. The compensation committee’s practice has been to retain a compensation consultant every other year to conduct a competitiveanalysis on director compensation.
In an engagement letter dated March 10, 2015, and signed by the chairman of the compensation committee, the compensation committeeretained Towers Watson to prepare the 2015 compensation review for the board of directors. In its review of board of director compensation,Towers Watson was asked to:
• identify market trends relative to director compensation
• report on the competitive position of our director compensation program as compared to our performance graph peer group
• recommend alternatives for our board of directors to consider and
• review the performance graph peer group companies to identify practices relating to director recruitment.
At its May 2015 meeting, the committee reviewed the report by Towers Watson on director compensation competitiveness, considering bothlevel and design. The Towers Watson report focused on broad-based Fortune 500 market trends and the then current peer group consistingof 23 companies. The report noted that for Fortune 500 companies, median total director compensation increased nine percent over the lasttwo years. The report noted that the median total director compensation of the 23 peer group companies is $178,800 compared to thecompany’s typical director total compensation of $175,000. The company’s cash compensation approximates the 25th percentile, whereasthe equity compensation is just above the median. Nonexecutive chairman of the board fees for the peer group range between $80,000 and$135,000. The company pays additional compensation of $90,000 for this position. The report indicated additional compensation forcommittee chairs is generally between $5,000 and $15,000 which varies by committee. The company’s additional retainers for committeechairs are $10,000 for the Compensation Committee and Nominating and Governance Committee, and $15,000 for the Audit Committeewhich aligned with market practices. The company’s vice president-human resources provided additional information at the meeting fromthe National Association of Corporate Directors 2014-2015 Director Compensation Report. The report noted that for 2014 the mediandirect compensation for all large companies (having revenues of $2.5 billion to $10 billion) was $214,283, for all size utilities was$165,907, for all size energy companies was $244,167, and for all size material companies was $170,249. After considering the reports,the compensation committee recommended, and the board of directors approved, no change to the current annual cash base retainer of$65,000, $110,000 equity grant, committee chair retainers, and additional retainer for the nonexecutive chairman of the board.
Stockholder Communications
Stockholders and other interested parties who wish to contact the board of directors or an individual director, including our non-employeechairman or non-employee directors as a group, should address a communication in care of the secretary at MDU Resources Group, Inc.,P.O. Box 5650, Bismarck, ND 58506-5650. The secretary will forward all communications.
Proxy Statement
68 MDU Resources Group, Inc. Proxy Statement
SECTION 16(a) BENEFICIAL OWNERSHIP REPORTING COMPLIANCE
Section 16 of the Securities Exchange Act of 1934, as amended, requires that officers, directors, and holders of more than 10% of ourcommon stock file reports of their trading in our equity securities with the Securities and Exchange Commission. Based solely on a review ofForms 3, 4, and 5 and any amendments to these forms furnished to us during and with respect to 2015 or written representations that noForms 5 were required, we believe that all such reports were timely filed.
CONDUCT OF MEETING; ADJOURNMENT
The chairman of the board has broad responsibility and authority to conduct the annual meeting in an orderly and timely manner. Inaddition, our bylaws provide that the meeting may be adjourned from time to time by the chairman of the meeting regardless of whether aquorum is present.
OTHER BUSINESS
Neither the board of directors nor management intends to bring before the meeting any business other than the matters referred to in thenotice of annual meeting and this proxy statement. We have not been informed that any other matter will be presented at the meeting byothers. However, if any other matters are properly brought before the annual meeting, or any adjournment(s) thereof, your proxies includediscretionary authority for the persons named in the enclosed proxy to vote or act on such matters in their discretion.
SHARED ADDRESS STOCKHOLDERS
In accordance with a notice sent to eligible stockholders who share a single address, we are sending only one annual report to stockholdersand one proxy statement to that address unless we received instructions to the contrary from any stockholder at that address. This practice,known as “householding,” is designed to reduce our printing and postage costs. However, if a stockholder of record wishes to receive aseparate annual report to stockholders and proxy statement in the future, he or she may contact the office of the treasurer at MDUResources Group, Inc., P.O. Box 5650, Bismarck, ND 58506-5650, Telephone Number: (701) 530-1000. Eligible stockholders of recordwho receive multiple copies of our annual report to stockholders and proxy statement can request householding by contacting us in the samemanner. Stockholders who own shares through a bank, broker, or other nominee can request householding by contacting the nominee.
We hereby undertake to deliver promptly, upon written or oral request, a separate copy of the annual report to stockholders and proxystatement to a stockholder at a shared address to which a single copy of the document was delivered.
2017 ANNUAL MEETING OF STOCKHOLDERS
Director Nominations: Our bylaws provide that director nominations may be made only (i) at any meeting of stockholders, by or at thedirection of the board or (ii) at an annual meeting of stockholders, by a stockholder of record, as provided in the bylaws, who is entitled tovote upon the election of directors and who has complied with the procedures established by the bylaws. For a nomination to be properlybrought before an annual meeting by a stockholder, the stockholder intending to make the nomination must have given timely and propernotice of the nomination in writing to the corporate secretary in accordance with and containing all information, including the completedquestionnaire, provided for in the bylaws. To be timely, such notice must be delivered or mailed to the corporate secretary and received atour principal executive offices not later than the close of business on the 90th day prior to the first anniversary of the preceding year’sannual meeting of stockholders. For purposes of our annual meeting of stockholders expected to be held April 25, 2017, any stockholderwho wishes to submit a nomination must submit the required notice to the corporate secretary not later than the close of business onJanuary 26, 2017.
Other Meeting Business: Our bylaws also provide that business, other than director nominations, may be properly brought before (i) anymeeting of stockholders, by or at the direction of the board or (ii) an annual meeting of stockholders, by a stockholder of record, as providedin the bylaws, who is entitled to vote upon the election of directors and the proposal and who has complied with the procedures establishedby the bylaws. For business to be properly brought before an annual meeting by a stockholder (other than director nominations which aredescribed above), the stockholder must have given timely and proper notice of such business in writing to the corporate secretary, inaccordance with and containing all information provided for in the bylaws and such business must be a proper matter for stockholder actionunder the General Corporation Law of Delaware. To be timely, such notice must be delivered or mailed to the corporate secretary andreceived at our principal executive offices not later than the close of business on the 90th day prior to the first anniversary of the precedingyear’s annual meeting of stockholders. For purposes of our annual meeting of stockholders expected to be held April 25, 2017, any
Proxy Statement
MDU Resources Group, Inc. Proxy Statement 69
stockholder who wishes to bring business before the meeting (other than director nominations which are described above) must submit therequired notice to the corporate secretary not later than the close of business on January 26, 2017.
Discretionary Voting: Rule 14a-4 of the Securities and Exchange Commission’s proxy rules allows us to use discretionary voting authority tovote on matters coming before an annual stockholders’ meeting if we do not have notice of the matter at least 45 days before theanniversary date on which we first mailed our proxy materials for the prior year’s annual stockholders’ meeting or the date specified by anadvance notice provision in our bylaws. Our bylaws contain an advance notice provision that we have described above. For our annualmeeting of stockholders expected to be held on April 25, 2017, stockholders must submit such written notice to the corporate secretary notlater than the close of business on January 26, 2017.
Stockholder Proposals: The requirements we describe above are separate from and in addition to the Securities and Exchange Commission’srequirements that a stockholder must meet to have a stockholder proposal included in our proxy statement pursuant to Rule 14a-8 underthe Exchange Act. For purposes of our annual meeting of stockholders expected to be held on April 25, 2017, any stockholder who wishesto submit a proposal for inclusion in our proxy materials must submit such proposal to the corporate secretary on or before November 16,2016.
Bylaw Copies: You may obtain a copy of the full text of the bylaw provisions discussed above by writing to the corporate secretary. Our bylawsare also available on our website at: http://www.mdu.com/integrity/governance/guidelines-and-bylaws.
We will make available to our stockholders to whom we furnish this proxy statement a copy of our Annual Report on Form 10-K, excluding exhibits,for the year ended December 31, 2015, which is required to be filed with the Securities and Exchange Commission. You may obtain a copy, withoutcharge, upon written or oral request to the Office of the Treasurer of MDU Resources Group, Inc., 1200 West Century Avenue, Mailing Address:P.O. Box 5650, Bismarck, ND 58506-5650, Telephone Number: (701) 530-1000. You may also access our Annual Report on Form 10-K through ourwebsite at www.mdu.com.
By order of the Board of Directors,
Daniel S. Kuntz
Secretary
March 16, 2016
Proxy Statement
70 MDU Resources Group, Inc. Proxy Statement
EXHIBIT A
MDU RESOURCES GROUP, INC. LONG-TERM PERFORMANCE-BASED INCENTIVE PLAN
Article 1. Establishment, Purpose and Duration
1.1 Establishment of the Plan. MDU Resources Group, Inc., a Delaware corporation (hereinafter referred to as the “Company”),hereby establishes an incentive compensation plan to be known as the “MDU Resources Group, Inc. Long-Term Performance-Based Incentive Plan” (hereinafter referred to as the “Plan”), as set forth in this document. The Plan permits the grant ofRestricted Stock, Performance Units, Performance Shares and other awards.
The Plan first became effective when approved by the stockholders at the annual meeting on April 22, 1997. The Plan, asamended, became effective on April 25, 2006 when approved by the stockholders at the 2006 annual meeting. The Plan shallremain in effect as provided in Section 1.3 herein.
1.2 Purpose of the Plan. The purpose of the Plan is to promote the success and enhance the value of the Company by linking thepersonal interests of Participants to those of Company stockholders and customers.
The Plan is further intended to provide flexibility to the Company in its ability to motivate, attract and retain the services ofParticipants upon whose judgment, interest and special effort the successful conduct of its operations is largely dependent.
1.3 Duration of the Plan. The Plan shall remain in effect, subject to the right of the Board of Directors to terminate the Plan at anytime pursuant to Article 13 herein, until all Shares subject to it shall have been purchased or acquired according to the Plan’sprovisions.
Article 2. Definitions
Whenever used in the Plan, the following terms shall have the meanings set forth below and, when such meaning is intended, the initialletter of the word is capitalized:
2.1 ”Award” means, individually or collectively, a grant under the Plan of Restricted Stock, Performance Units, Performance Shares orany other type of award permitted under Article 8 of the Plan.
2.2 ”Award Agreement” means an agreement entered into by each Participant and the Company, setting forth the terms and provisionsapplicable to an Award granted to a Participant under the Plan.
2.3 ”Board” or “Board of Directors” means the Board of Directors of the Company.
2.4 A “Change in Control” shall mean:
(a) The acquisition by any individual, entity or group (within the meaning of Section 13(d)(3) or 14(d)(2) of the SecuritiesExchange Act of 1934, as amended (the “Exchange Act”)) (a “Person”) of beneficial ownership (within the meaning of Rule13d-3 promulgated under the Exchange Act) of 20% or more of either (i) the then outstanding shares of common stock of theCompany (the “Outstanding Company Common Stock”) or (ii) the combined voting power of the then outstanding voting securitiesof the Company entitled to vote generally in the election of directors (the “Outstanding Company Voting Securities”); provided,however, that for purposes of this subsection (a), the following acquisitions shall not constitute a Change in Control: (i) anyacquisition directly from the Company, (ii) any acquisition by the Company, (iii) any acquisition by any employee benefit plan (orrelated trust) sponsored or maintained by the Company or any corporation controlled by the Company or (iv) any acquisition by anycorporation pursuant to a transaction which complies with clauses (i), (ii) and (iii) of subsection (c) of this Section 2.4; or
(b) Individuals who, as of April 22, 1997, which is the effective date of the Plan, constitute the Board (the “Incumbent Board”)cease for any reason to constitute at least a majority of the Board; provided, however, that any individual becoming a directorsubsequent to the date hereof whose election, or nomination for election by the Company’s shareholders, was approved by a voteof at least a majority of the directors then comprising the Incumbent Board shall be considered as though such individual were amember of the Incumbent Board, but excluding, for this purpose, any such individual whose initial assumption of office occurs asa result of an actual or threatened election contest with respect to the election or removal of directors or other actual or threatenedsolicitation of proxies or consents by or on behalf of a Person other than the Board; or
Proxy Statement
MDU Resources Group, Inc. Proxy Statement A-1
(c) Consummation of a reorganization, merger or consolidation or sale or other disposition of all or substantially all of the assetsof the Company (a “Business Combination”), in each case, unless, following such Business Combination, (i) all or substantially allof the individuals and entities who were the beneficial owners, respectively, of the Outstanding Company Common Stock andOutstanding Company Voting Securities immediately prior to such Business Combination beneficially own, directly or indirectly,more than 60% of, respectively, the then outstanding shares of common stock and the combined voting power of the thenoutstanding voting securities entitled to vote generally in the election of directors, as the case may be, of the corporation resultingfrom such Business Combination (including, without limitation, a corporation which as a result of such transaction owns theCompany or all or substantially all of the Company’s assets either directly or through one or more subsidiaries) in substantially thesame proportions as their ownership immediately prior to such Business Combination of the Outstanding Company Common Stockand Outstanding Company Voting Securities, as the case may be, (ii) no Person (excluding any corporation resulting from suchBusiness Combination or any employee benefit plan (or related trust) of the Company or such corporation resulting from suchBusiness Combination) beneficially owns, directly or indirectly, 20% or more of, respectively, the then outstanding shares ofcommon stock of the corporation resulting from such Business Combination or the combined voting power of the then outstandingvoting securities of such corporation except to the extent that such ownership existed prior to the Business Combination and (iii) atleast a majority of the members of the board of directors of the corporation resulting from such Business Combination weremembers of the Incumbent Board at the time of the execution of the initial agreement, or of the action of the Board, providing forsuch Business Combination; or
(d) Approval by the shareholders of the Company of a complete liquidation or dissolution of the Company.
For avoidance of doubt, unless otherwise determined by the Board, the sale of a subsidiary, operating entity or business unit of the Companyshall not constitute a Change in Control for purposes of this Agreement.
2.5 ”Code” means the Internal Revenue Code of 1986, as amended from time to time.
2.6 ”Committee” means the Committee, as specified in Article 3, appointed by the Board to administer the Plan with respect toAwards.
2.7 ”Company” means MDU Resources Group, Inc., a Delaware corporation, or any successor thereto as provided in Article 16 herein.
2.8 ”Covered Employee” means any Participant who would be considered a “Covered Employee” for purposes of Section 162(m) ofthe Code.
2.9 ”Director” means any individual who is a member of the Board of Directors of the Company.
2.10 ”Disability” means “permanent and total disability” as defined under Section 22(e)(3)of the Code.
2.11 ”Dividend Equivalent” means, with respect to Shares subject to an Award, a right to be paid an amount equal to dividendsdeclared on an equal number of outstanding Shares.
2.12 ”Eligible Employee” means an Employee who is eligible to participate in the Plan, as set forth in Section 5.1 herein.
2.13 ”Employee” means any full-time or regularly-scheduled part-time employee of the Company or of the Company’s Subsidiaries, whois not covered by any collective bargaining agreement to which the Company or any of its Subsidiaries is a party. Directors who arenot otherwise employed by the Company shall not be considered Employees for purposes of the Plan. For purposes of the Plan,transfer of employment of a Participant between the Company and any one of its Subsidiaries (or between Subsidiaries) shall notbe deemed a termination of employment.
2.14 ”Exchange Act” means the Securities Exchange Act of 1934, as amended from time to time, or any successor act thereto.
2.15 ”Fair Market Value” shall mean the average of the high and low sale prices as reported in the consolidated transaction reportingsystem or, if there is no such sale on the relevant date, then on the last previous day on which a sale was reported.
2.16 ”Full Value Award” means an Award pursuant to which Shares may be issued.
2.17 ”Participant” means an Employee of the Company who has outstanding an Award granted under the Plan.
Proxy Statement
A-2 MDU Resources Group, Inc. Proxy Statement
2.18 “Performance Goals” means the performance goals established by the Committee, which shall be based on one or more of thefollowing measures: sales or revenues, earnings per share, shareholder return and/or value, funds from operations, cash flow fromoperations (dollar target or as % of revenue), gross margin or gross profit (dollar target or as % of revenue), operations andmaintenance expense (dollar target or as % of revenue), general and administrative expense (dollar target or as % of revenue),total operating expense (dollar target or as % of revenue), operating income (dollar target or as % of revenue), pretax income(dollar target or as % of revenue), earnings before interest, taxes, depreciation and amortization or “EBITDA” (dollar target or as %of revenue), earnings before interest and taxes or “EBIT” (dollar target or as % of revenue), gross income, net income, cash flow,earnings, return on equity, return on invested capital, return on assets, return on net assets, working capital as percentage ofrevenue, days sales outstanding/accounts receivable turnover, current ratio, capital efficiency, operating ratios, stock price,enterprise value, company value, asset value growth, net asset value, shareholders’ equity, dividends, customer satisfaction,accomplishment of mergers, acquisitions, dispositions or similar extraordinary business transactions, safety, sustainability, profitreturns and margins, financial return ratios, and market performance. Performance goals may be measured solely on a corporate,subsidiary, business unit or individual basis, or a combination thereof. Performance goals may reflect absolute entity or individualperformance or a relative comparison of entity or individual performance to the performance of a peer group of entities or otherexternal measure.
2.19 ”Performance Unit” means an Award granted to an Employee, as described in Article 7 herein.
2.20 ”Performance Share” means an Award granted to an Employee, as described in Article 7 herein.
2.21 ”Period of Restriction” means the period during which the transfer of Restricted Stock is limited in some way, as provided inArticle 6 herein.
2.22 ”Person” shall have the meaning ascribed to such term in Section 3(a)(9) of the Exchange Act, as used in Sections 13(d) and 14(d) thereof, including usage in the definition of a “group” in Section 13(d) thereof.
2.23 ”Qualified Restricted Stock” means an Award of Restricted Stock designated as Qualified Restricted Stock by the Committee atthe time of grant and intended to qualify for the exemption from the limitation on deductibility imposed by Section 162(m) of theCode that is set forth in Section 162(m)(4)(C).
2.24 ”Restricted Stock” means an Award of Shares granted to a Participant pursuant to Article 6 herein.
2.25 ”Shares” means the shares of common stock of the Company.
2.26 ”Subsidiary” means any corporation that is a “subsidiary corporation” of the Company as that term is defined in Section 424(f) ofthe Code.
Article 3. Administration
3.1 The Committee. The Plan shall be administered by the Compensation Committee of the Board, or by any other Committeeappointed by the Board. The members of the Committee shall be appointed from time to time by, and shall serve at the discretionof, the Board of Directors.
3.2 Authority of the Committee. The Committee shall have full power except as limited by law, the Articles of Incorporation and theBylaws of the Company, subject to such other restricting limitations or directions as may be imposed by the Board and subject tothe provisions herein, to determine the size and types of Awards; to determine the terms and conditions of such Awards in amanner consistent with the Plan; to construe and interpret the Plan and any agreement or instrument entered into under the Plan;to establish, amend or waive rules and regulations for the Plan’s administration; and (subject to the provisions of Article 13herein) to amend the terms and conditions of any outstanding Award. Further, the Committee shall make all other determinationswhich may be necessary or advisable for the administration of the Plan. As permitted by law, the Committee may delegate itsauthorities as identified hereunder.
3.3 Restrictions on Share Transferability. The Committee may impose such restrictions on any Shares acquired pursuant to Awardsunder the Plan as it may deem advisable, including, without limitation, restrictions to comply with applicable Federal securitieslaws, with the requirements of any stock exchange or market upon which such Shares are then listed and/or traded and with anyblue sky or state securities laws applicable to such Shares.
Proxy Statement
MDU Resources Group, Inc. Proxy Statement A-3
3.4 Approval. The Board or the Committee shall approve all Awards made under the Plan and all elections made by Participants, priorto their effective date, to the extent necessary to comply with Rule 16b-3 under the Exchange Act.
3.5 Decisions Binding. All determinations and decisions made by the Committee pursuant to the provisions of the Plan and all relatedorders or resolutions of the Board shall be final, conclusive and binding on all persons, including the Company, its stockholders,Employees, Participants and their estates and beneficiaries.
3.6 Costs. The Company shall pay all costs of administration of the Plan.
Article 4. Shares Subject to the Plan
4.1 Number of Shares. Subject to Section 4.2 herein, the maximum number of Shares that may be issued pursuant to Awards underthe Plan shall be 9,242,806. Shares underlying lapsed or forfeited Awards of Restricted Stock shall not be treated as having beenissued pursuant to an Award under the Plan. Shares withheld from an Award to satisfy tax withholding obligations shall becounted as Shares issued pursuant to an Award under the Plan. Shares that are potentially deliverable under an Award thatexpires or is canceled, forfeited, settled in cash or otherwise settled without the delivery of Shares shall not be treated as havingbeen issued under the Plan.
Shares issued pursuant to the Plan may be (i) authorized but unissued Shares of Common Stock, (ii) treasury shares, or (iii) sharespurchased on the open market.
4.2 Adjustments in Authorized Shares. In the event of any equity restructuring such as a stock dividend, stock split, spinoff, rightsoffering or recapitalization through a large, nonrecurring cash dividend, the Committee shall cause an equitable adjustment to bemade (i) in the number and kind of Shares that may be delivered under the Plan, (ii) in the individual limitations set forth inSection 4.3 and (iii) with respect to outstanding Awards, in the number and kind of Shares subject to outstanding Awards, price ofShares subject to outstanding Awards, any Performance Goals relating to Shares, the market price of Shares, or per-Share results,and other terms and conditions of outstanding Awards, in the case of (i), (ii) and (iii) to prevent dilution or enlargement of rights.In the event of any other change in corporate capitalization, such as a merger, consolidation or liquidation, the Committee may, inits sole discretion, cause an equitable adjustment as described in the foregoing sentence to be made to prevent dilution orenlargement of rights. The number of Shares subject to any Award shall always be rounded down to a whole number whenadjustments are made pursuant to this Section 4.2. Adjustments made by the Committee pursuant to this Section 4.2 shall befinal, binding and conclusive.
4.3 Individual Limitations. Subject to Section 4.2 herein, (i) the total number of shares of Qualified Restricted Stock that may begranted in any calendar year to any Covered Employee shall not exceed 2,250,000 Shares; (ii) the total number of PerformanceShares or Performance Units that may be granted in any calendar year to any Covered Employee shall not exceed 2,250,000Performance Shares or Performance Units, as the case may be; (iii) the total number of Shares that are intended to qualify fordeduction under Section 162(m) of the Code granted pursuant to Article 8 herein in any calendar year to any Covered Employeeshall not exceed 2,250,000 Shares; (iv) the total cash Award that is intended to qualify for deduction under Section 162(m) ofthe Code that may be paid pursuant to Article 8 herein in any calendar year to any Covered Employee shall not exceed$6,000,000; and (v) the aggregate number of Dividend Equivalents that are intended to qualify for deduction under Section 162(m) of the Code that a Covered Employee may receive in any calendar year shall not exceed $6,000,000.
Article 5. Eligibility and Participation
5.1 Eligibility. Persons eligible to participate in the Plan include all officers and key employees of the Company and its Subsidiaries,as determined by the Committee, including Employees who are members of the Board, but excluding Directors who are notEmployees.
5.2 Actual Participation. Subject to the provisions of the Plan, the Committee may, from time to time, select from all eligibleEmployees those to whom Awards shall be granted and shall determine the nature and amount of each Award.
Article 6. Restricted Stock
6.1 Grant of Restricted Stock. Subject to the terms and conditions of the Plan, Restricted Stock may be granted to EligibleEmployees at any time and from time to time, as shall be determined by the Committee.
Proxy Statement
A-4 MDU Resources Group, Inc. Proxy Statement
The Committee shall have complete discretion in determining the number of shares of Restricted Stock granted to eachParticipant (subject to Article 4 herein) and, consistent with the provisions of the Plan, in determining the terms and conditionspertaining to such Restricted Stock.
In addition, the Committee may, prior to or at the time of grant, designate an Award of Restricted Stock as Qualified RestrictedStock, in which event it will condition the grant or vesting, as applicable, of such Qualified Restricted Stock upon the attainmentof the Performance Goals selected by the Committee.
6.2 Restricted Stock Award Agreement. Each Restricted Stock grant shall be evidenced by a Restricted Stock Award Agreement thatshall specify the Period or Periods of Restriction, the number of Restricted Stock Shares granted and such other provisions as theCommittee shall determine.
6.3 Transferability. Restricted Stock granted hereunder may not be sold, transferred, pledged, assigned, or otherwise alienated orhypothecated until the end of the applicable Period of Restriction established by the Committee and specified in the RestrictedStock Award Agreement. All rights with respect to the Restricted Stock granted to a Participant under the Plan shall be availableduring his or her lifetime only to such Participant or his or her legal representative.
6.4 Certificate Legend. Each certificate representing Restricted Stock granted pursuant to the Plan may bear a legend substantially asfollows:
”The sale or other transfer of the shares of stock represented by this certificate, whether voluntary, involuntary or by operation oflaw, is subject to certain restrictions on transfer as set forth in MDU Resources Group, Inc. Long-Term Performance-BasedIncentive Plan and in a Restricted Stock Award Agreement. A copy of such Plan and such Agreement may be obtained from MDUResources Group, Inc.”
The Company shall have the right to retain the certificates representing Restricted Stock in the Company’s possession until suchtime as all restrictions applicable to such Shares have been satisfied.
6.5 Removal of Restrictions. Restricted Stock shall become freely transferable by the Participant after the last day of the Period ofRestriction applicable thereto. Once Restricted Stock is released from the restrictions, the Participant shall be entitled to havethe legend referred to in Section 6.4 removed from his or her stock certificate.
6.6 Voting Rights. During the Period of Restriction, Participants holding Restricted Stock may exercise full voting rights with respectto those Shares.
6.7 Dividends and Other Distributions. Subject to the Committee’s right to determine otherwise at the time of grant, during the Periodof Restriction, Participants holding Restricted Stock shall receive all regular cash dividends paid with respect to all Shares whilethey are so held. All other distributions paid with respect to such Restricted Stock shall be credited to Participants subject to thesame restrictions on transferability and forfeitability as the Restricted Stock with respect to which they were paid and shall be paidto the Participant within forty-five (45) days following the full vesting of the Restricted Stock with respect to which suchdistributions were made.
6.8 Termination of Employment. Each Restricted Stock Award Agreement shall set forth the extent to which the Participant shall havethe right to receive unvested Restricted Stock following termination of the Participant’s employment with the Company and itsSubsidiaries. Such provisions shall be determined in the sole discretion of the Committee, shall be included in the RestrictedStock Award Agreement entered into with Participants, need not be uniform among all grants of Restricted Stock or amongParticipants and may reflect distinctions based on the reasons for termination of employment.
Article 7. Performance Units and Performance Shares
7.1 Grant of Performance Units and Performance Shares. Subject to the terms and conditions of the Plan, Performance Units and/orPerformance Shares may be granted to an Eligible Employee at any time and from time to time, as shall be determined by theCommittee.
The Committee shall have complete discretion in determining the number of Performance Units and/or Performance Sharesgranted to each Participant (subject to Article 4 herein) and, consistent with the provisions of the Plan, in determining the termsand conditions pertaining to such Awards.
Proxy Statement
MDU Resources Group, Inc. Proxy Statement A-5
7.2 Performance Unit/Performance Share Award Agreement. Each grant of Performance Units and/or Performance Shares shall beevidenced by a Performance Unit and/or Performance Share Award Agreement that shall specify the number of Performance Unitsand/or Performance Shares granted, the initial value (if applicable), the Performance Period, the Performance Goals and suchother provisions as the Committee shall determine, including but not limited to any rights to Dividend Equivalents.
7.3 Value of Performance Units/Performance Shares. Each Performance Unit shall have an initial value that is established by theCommittee at the time of grant. The value of a Performance Share shall be equal to the Fair Market Value of a Share. TheCommittee shall set Performance Goals in its discretion which, depending on the extent to which they are met, will determine thenumber and/or value of Performance Units/Performance Shares that will be paid out to the Participants. The time period duringwhich the Performance Goals must be met shall be called a “Performance Period.”
7.4 Earning of Performance Units/Performance Shares. After the applicable Performance Period has ended, the holder of PerformanceUnits/Performance Shares shall be entitled to receive a payout with respect to the Performance Units/Performance Shares earnedby the Participant over the Performance Period, to be determined as a function of the extent to which the correspondingPerformance Goals have been achieved.
7.5 Form and Timing of Payment of Performance Units/Performance Shares. Payment of earned Performance Units/PerformanceShares shall be made following the close of the applicable Performance Period. The Committee, in its sole discretion, may payearned Performance Units/Performance Shares in cash or in Shares (or in a combination thereof), which have an aggregate FairMarket Value equal to the value of the earned Performance Units/Performance Shares at the close of the applicable PerformancePeriod. Such Shares may be granted subject to any restrictions deemed appropriate by the Committee.
7.6 Termination of Employment. Each Performance Unit/Performance Share Award Agreement shall set forth the extent to which theParticipant shall have the right to receive a Performance Unit/Performance Share payment following termination of theParticipant’s employment with the Company and its Subsidiaries during a Performance Period. Such provisions shall bedetermined in the sole discretion of the Committee, shall be included in the Award Agreement entered into with Participants, neednot be uniform among all grants of Performance Units/Performance Shares or among Participants and may reflect distinctionsbased on reasons for termination of employment.
7.7 Transferability. Except as otherwise determined by the Committee and set forth in the Performance Unit/Performance Share AwardAgreement, Performance Units/Performance Shares may not be sold, transferred, pledged, assigned or otherwise alienated orhypothecated, other than by will or by the laws of descent and distribution, and a Participant’s rights with respect to PerformanceUnits/Performance Shares granted under the Plan shall be available during the Participant’s lifetime only to such Participant orthe Participant’s legal representative.
Article 8. Other Awards
The Committee shall have the right to grant other Awards which may include, without limitation, the grant of Shares based on attainment ofPerformance Goals established by the Committee, the payment of Shares in lieu of cash, the payment of cash based on attainment ofPerformance Goals established by the Committee, and the payment of Shares in lieu of cash under other Company incentive or bonusprograms. Payment under or settlement of any such Awards shall be made in such manner and at such times as the Committee maydetermine.
Article 9. Beneficiary Designation
Each Participant under the Plan may, from time to time, name any beneficiary or beneficiaries (who may be named contingently orsuccessively) to whom any benefit under the Plan is to be paid in case of his or her death before he or she receives any or all of suchbenefit. Each such designation shall revoke all prior designations by the same Participant, shall be in a form prescribed by the Company,and will be effective only when filed by the Participant in writing with the Company during the Participant’s lifetime. In the absence of anysuch designation, benefits remaining unpaid at the Participant’s death shall be paid to the Participant’s estate.
The spouse of a married Participant domiciled in a community property jurisdiction shall join in any designation of beneficiary orbeneficiaries other than the spouse.
Proxy Statement
A-6 MDU Resources Group, Inc. Proxy Statement
Article 10. Deferrals
The Committee may permit a Participant to defer the Participant’s receipt of the payment of cash or the delivery of Shares that wouldotherwise be due to such Participant under the Plan. If any such deferral election is permitted, the Committee shall, in its sole discretion,establish rules and procedures for such payment deferrals.
Article 11. Rights of Employees
11.1 Employment. Nothing in the Plan shall interfere with or limit in any way the right of the Company to terminate any Participant’semployment at any time, for any reason or no reason in the Company’s sole discretion, nor confer upon any Participant any right tocontinue in the employ of the Company.
11.2 Participation. No Employee shall have the right to be selected to receive an Award under the Plan, or, having been so selected, tobe selected to receive a future Award.
Article 12. Change in Control
The terms of this Article 12 shall immediately become operative, without further action or consent by any person or entity, upon a Change inControl, and once operative shall supersede and take control over any other provisions of this Plan.
Upon a Change in Control
(a) Any restriction periods and restrictions imposed on Restricted Stock, Qualified Restricted Stock or Awards granted pursuant toArticle 8 (if not performance-based) shall be deemed to have expired and such Restricted Stock, Qualified Restricted Stock or Awardsshall become immediately vested in full; and
(b) The target payout opportunity attainable under all outstanding Awards of Performance Units, Performance Shares and Awardsgranted pursuant to Article 8 (if performance-based) shall be deemed to have been fully earned for the entire Performance Period(s)as of the effective date of the Change in Control, and shall be paid out promptly in Shares or cash pursuant to the terms of the AwardAgreement, or in the absence of such designation, as the Committee shall determine.
Article 13. Amendment, Modification and Termination
13.1 Amendment, Modification and Termination. The Board may, at any time and from time to time, alter, amend, suspend orterminate the Plan, in whole or in part, provided that no amendment shall be made which shall increase the total number ofShares that may be issued under the Plan, materially modify the requirements for participation in the Plan, or materially increasethe benefits accruing to Participants under the Plan, in each case unless such amendment is approved by the stockholders.
13.2 Awards Previously Granted. No termination, amendment or modification of the Plan shall adversely affect in any material way anyAward previously granted under the Plan, without the written consent of the Participant holding such Award, unless suchtermination, modification or amendment is required by applicable law and except as otherwise provided herein.
Article 14. Withholding
14.1 Tax Withholding. The Company shall have the power and the right to deduct or withhold, or require a Participant to remit to theCompany, an amount sufficient to satisfy Federal, state and local taxes (including the Participant’s FICA obligation) required bylaw to be withheld with respect to an Award made under the Plan.
14.2 Share Withholding. With respect to withholding required upon the lapse of restrictions on Restricted Stock, or upon any othertaxable event arising out of or as a result of Awards granted hereunder, Participants may elect to satisfy the withholdingrequirement, in whole or in part, by tendering previously-owned Shares or by having the Company withhold Shares having a FairMarket Value on the date the tax is to be determined equal to the statutory total tax which could be imposed on the transaction.All elections shall be irrevocable, made in writing and signed by the Participant.
Proxy Statement
MDU Resources Group, Inc. Proxy Statement A-7
Article 15. Minimum Vesting
Notwithstanding any other provision of the Plan to the contrary, (a) the minimum vesting period for Full Value Awards with no performance-based vesting characteristics must be at least three years (vesting may occur ratably each month, quarter or anniversary of the grant dateover such vesting period); (b) the minimum vesting period for Full Value Awards with performance-based vesting characteristics must be atleast one year; and (c) the Committee shall not have discretion to accelerate vesting of Full Value Awards except in the event of a Change inControl or similar transaction, or the death, disability, or termination of employment of a Participant; provided, however, that the Committeemay grant a “de minimis” number of Full Value Awards that do not comply with the foregoing minimum vesting standards. For this purpose“de minimis” means 331,279 Shares available for issuance as Full Value Awards under the Plan, subject to adjustment under Section 4.2herein.
Article 16. Successors
All obligations of the Company under the Plan, with respect to Awards granted hereunder, shall be binding on any successor to theCompany, whether the existence of such successor is the result of a direct or indirect purchase, merger, consolidation or otherwise, of all orsubstantially all of the business and/or assets of the Company.
Article 17. Legal Construction
17.1 Gender and Number. Except where otherwise indicated by the context, any masculine term used herein also shall include thefeminine, the plural shall include the singular and the singular shall include the plural.
17.2 Severability. In the event any provision of the Plan shall be held illegal or invalid for any reason, the illegality or invalidity shallnot affect the remaining parts of the Plan, and the Plan shall be construed and enforced as if the illegal or invalid provision hadnot been included.
17.3 Requirements of Law. The granting of Awards and the issuance of Shares under the Plan shall be subject to all applicable laws,rules and regulations, and to such approvals by any governmental agencies or national securities exchanges as may be required.
17.4 Governing Law. To the extent not preempted by Federal law, the Plan, and all agreements hereunder, shall be construed inaccordance with, and governed by, the laws of the State of Delaware.
Article 18. Accounting Restatements
This Article 18 shall apply to Awards granted to all Participants in the Plan. Notwithstanding anything in the Plan or in any AwardAgreement to the contrary, if the Company is required to prepare an accounting restatement due to material noncompliance with anyfinancial reporting requirements under the securities laws, the Company or the Committee may, or shall if required, take action to recoverincentive-based compensation from specific executive officers in accordance with the Company’s Guidelines for Repayment of IncentivesDue to Accounting Restatements, as they may be amended or substituted from time to time, and in accordance with applicable law andapplicable rules of the Securities and Exchange Commission and the New York Stock Exchange.
Article 19. Code Section 409A Compliance
To the extent applicable, it is intended that this Plan and any Awards granted hereunder comply with the requirements of Section 409A ofthe Code and any related regulations or other guidance promulgated with respect to such Section by the U.S. Department of the Treasury orthe Internal Revenue Service (“Section 409A”). Any provision that would cause the Plan or any Award granted hereunder to fail to satisfySection 409A shall have no force or effect until amended to comply with Section 409A, which amendment may be retroactive to the extentpermitted by Section 409A.
Proxy Statement
A-8 MDU Resources Group, Inc. Proxy Statement
EXHIBIT B
Towers Watson 2013 CDBGeneral Industry ExecutiveDatabase
BD (Becton Dickinson) Cooper Standard Automotive Freeport-McMoRan Copper & Gold
Beam Corning Frontier Communications
Bechtel Systems & Infrastructure Cott Corporation Fujitsu Limited
3M Benjamin Moore Covance G&K Services
A.O. Smith Best Buy Covidien GAF Materials
AbbVie Big Lots CSX Gap
Accenture Biogen Idec Cumberland Gulf Group Gartner
ACH Food Black Box Curtiss-Wright Gates
Adecco Boise CVS Caremark Gavilon
Aerojet Boise Cascade Cytec GenCorp
AGCO Booz Allen Hamilton Daiichi Sankyo General Atomics
Agilent Technologies BorgWarner Daimler Trucks North America General Dynamics
Agrium Boston Scientific Darden Restaurants General Mills
Aimia Brady Day & Zimmermann General Motors
Air Liquide Bristol-Myers Squibb Dean Foods Gerdau Long Steel North America
Air Products and Chemicals Bunge Deere & Company Gilead Sciences
Alcoa Burlington Northern Santa Fe Dell GlaxoSmithKline
Alexander & Baldwin Bush Brothers Deluxe Goodman Manufacturing
Alliant Techsystems CA Technologies Dentsply Goodyear Tire & Rubber
American Crystal Sugar Caesar’s Entertainment Diageo North America Google
American Sugar Refining Calgon Carbon Donaldson Company Graco
Americas Styrenics Cardinal Health Dow Corning Green Mountain Coffee Roasters
AmerisourceBergen Cargill Dr Pepper Snapple Grupo Ferrovial
AMETEK Carlson DSM Nutritional Products GTECH
Amgen CarMax DuPont H.B. Fuller
AMR Carmeuse North America Group E.W. Scripps Hanesbrands
AMSTED Industries Carnival Eastman Chemical Harland Clarke
Amway Carpenter Technology Eaton Harman International Industries
Ansell Carriage Services eBay Harsco
AptarGroup Catalent Pharma Solutions Ecolab Hasbro
ARAMARK CBS Eli Lilly HBO
Arby’s Restaurant Group Celestica EMC HD Supply
Archer Daniels Midland Celgene EMD Millipore Henry Schein
Arkema CEVA Logistics Emerson Electric Herman Miller
Armstrong World Industries CF Industries EnCana Oil & Gas USA Hershey
Arrow Electronics CH2M Hill Engility Corporation Hertz
Ashland Chemtura EnPro Industries Hexcel
AstraZeneca Christensen Farms Equifax Hilton Worldwide
AT&T Chrysler Equity Office Properties Hitachi Data Systems
Automatic Data Processing CHS Ericsson HNI
Avaya Cisco Systems ESRI HNTB
Avery Dennison Clear Channel Communications Estee Lauder Hoffmann-La Roche
Avis Budget Group Cliffs Natural Resources Esterline Technologies Home Depot
Avon Products Cloud Peak Energy Exel Hormel Foods
Axiall Corporation CNH Exelis Host Hotels & Resorts
BAE Systems Coach Expedia Houghton Mifflin Harcourt Publishing
Ball Coca-Cola Experian Americas Hunt Consolidated
Barnes Group Coinstar Express Scripts Husky Injection Molding Systems
Barrick Gold of North America Colgate-Palmolive Exterran IBM
Baxter International Columbia Sportswear Federal-Mogul IDEXX Laboratories
Bayer Comcast First Data Illinois Tool Works
Bayer Business & Technology Commercial Metals Fiserv Ingersoll Rand
Services Compass Group Flowserve Intel
Bayer CropScience ConAgra Foods Ford Intercontinental Hotels Group
Bayer HealthCare Convergys Fortune Brands Home & Security International Automotive Components
Proxy Statement
MDU Resources Group, Inc. Proxy Statement B-1
International Flavors & Fragrances Merck & Co PPG Industries TE Connectivity
International Game Technology Micron Technology Praxair TeleTech Holdings
International Paper Microsoft PulteGroup Teradata
Invensys Controls Milacron Purdue Pharma Terex
ION Geophysical MillerCoors Qualcomm Tetra Tech
Irvine Millicom International Cellular Quest Diagnostics Texas Instruments
ITT Corporation Mine Safety Appliances Quintiles Textron
J.M. Smucker Molnlycke Health Care R.R. Donnelley Thermo Fisher Scientific
J.R. Simplot Molson Coors Brewing Rayonier Thomson Reuters
Jabil Circuit Molycorp Regal-Beloit Tiffany & Co.
Jacobs Engineering Momentive Specialty Chemicals Regeneron Pharmaceuticals Time Warner
JetBlue Airways Mosaic Revlon Time Warner Cable
Johns-Manville MTS Systems Reynolds Packaging T-Mobile
Johnson & Johnson Nash-Finch Ricoh Americas Toro
Johnson Controls Navigant Consulting Roche Diagnostics Toshiba Medical Research Institute
KBR Navistar International Rockwell Automation USA
Kellogg NBTY Rockwell Collins Total System Service (TSYS)
Kelly Services NCR Rolls-Royce North America Toyota Motor Engineering &
Kennametal Neoris USA Rowan Companies Manufacturing North America
Kewaunee Scientific Corporation Nestle USA Ryder System Transocean
Keystone Foods Newell Rubbermaid S.C. Johnson & Son Trinity Industries
Kimberly-Clark Newmont Mining Sage Software Tronox
Kimco Realty NewPage SAIC TRW Automotive
Kinross Gold Nissan North America Sanofi Tupperware Brands
Koch Industries Nokia SAS Institute Underwriters Laboratories
Kofax Norfolk Southern Schreiber Foods Unilever United States
Kohler NOVA Chemicals Schwan’s Unisys
Kyocera Corporation Novartis Scotts Miracle-Gro United Rentals
L-3 Communications Novo Nordisk Pharmaceuticals Seagate Technology United States Cellular
Land O’Lakes Nypro Sealed Air United States Steel
Leggett and Platt Occidental Petroleum Serco United Technologies
Lehigh Hanson Office Depot ServiceMaster Company UPS
Lend Lease Omgeo ShawCor URS
Leprino Foods Omnicare Sherwin-Williams Valero Energy
Level 3 Communications OMNOVA Solutions Shire Ventura Foods
Life Technologies Orange Business Services Sigma-Aldrich Verizon
Lifetouch Oshkosh Snap-on Vertex Pharmaceuticals
Lincoln Electric Owens Corning Sodexo Viacom
Lorillard Tobacco Owens-Illinois Sonoco Products Viad
LyondellBasell Oxford Instruments America Sony Electronics Visteon
Magellan Midstream Partners Pall Corporation Southwest Airlines Vulcan Materials
Makino Panasonic of North America Spirit AeroSystems VWR International
Manitowoc Parker Hannifin Sprint Nextel W.R. Grace
Marriott International Parsons Corporation SPX W.W. Grainger
Martin Marietta Materials PepsiCo SSAB Wal-Mart Stores
Mary Kay Performance Food Group St. Jude Medical Walt Disney
Masco Pfizer Staples Waste Management
Mattel PGI (Polymer Group) Starbucks Coffee Wendy’s Group
Matthews International PHH Starwood Hotels & Resorts West Pharmaceutical Services
McDermott International PHI Statoil Westinghouse Electric
McDonald’s Pitney Bowes Steelcase Weyerhaeuser
McKesson Plexus Stryker Whirlpool
MeadWestvaco Plum Creek Timber Suburban Propane Winnebago Industries
Media General Polaris Industries Syngenta Crop Protection Worthington Industries
Medtronic PolyOne Target Wyndham Worldwide
Menasha Corporation Potash Taubman Centers Xerium Technologies
Proxy Statement
B-2 MDU Resources Group, Inc. Proxy Statement
Xerox ISO New England Xcel Energy Boy Scouts of America
Xilinx ITC Holdings Bradley
Yum! Brands Kinder Morgan Towers Watson 2013 CSR Reporton Top ManagementCompensation
Brickman Group
Zimmer LG&E and KU Energy Bridgepoint Education
MDU Resources Briggs & Stratton
Towers Watson 2013 CDB EnergyServices Executive Database
MidAmerican Energy AAA Bristow Group
Midwest Independent Transmission ABX Air Brookdale Senior Living
System Operator Acuity Bryant University
AEI Services New York Independent System AFLAC Build-A-Bear Workshop
AES Operator AgFirst CACI International
AGL Resources New York Power Authority AGL Resources Caelum Research Corporation
Allete NextEra Energy AIG California Casualty Management
Alliant Energy NiSource Alere Health LLC California Dental Association
Ameren Northeast Utilities Alfa Laval, Inc. California Institute of Technology
American Electric Power NorthWestern Energy Alpha Packaging Calpine
Areva NV Energy Alyeska Pipeline Service Cambia Health Solutions
ATC Management NW Natural American Career College CareFirst BlueCross BlueShield
Atmos Energy OCI Enterprises American Enterprise Carlson
Avista OGE Energy American Greetings CDM Smith
BG US Services Oglethorpe Power American Heart Association CEMEX, Inc.
Black Hills Ohio Valley Electric American Water Works Chelan County Public Utility District
Calpine Old Dominion Electric AmerisourceBergen Chicago Transit Authority
Capital Power Corporation Omaha Public Power Ameristar Casinos Children’s Healthcare of Atlanta
CenterPoint Energy Otter Tail Ames True Temper Choice Hotels International
CH Energy Group Pacific Gas & Electric Amica Mutual Insurance CHS
Cleco People’s Natural Gas AOC Church of Jesus Christ of Latter-day
CMS Energy Pepco Holdings Applied Research Associates Saints
Colorado Springs Utilities Pinnacle West Capital Asahi Kasei Plastics N.A. Inc. Cigna
Consolidated Edison PJM Interconnection Ascend Performance Materials City of Chicago
CPS Energy PNM Resources Auto Club Group City of Garland
Crosstex Energy Portland General Electric Automobile Club of Southern City of Greensboro
Dominion Resources PPL California City of Houston
DTE Energy Proliance Holdings Avis Budget Group City of Las Vegas
Duke Energy Public Service Enterprise Group Avista City of Philadelphia
Dynegy Puget Energy Bain & Company ClubCorp Inc
Edison International Salt River Project Baxter CNL Financial Group
Edison Mission Energy SCANA Baylor College of Medicine Coca-Cola Bottling
ElectriCities of North Carolina Sempra Energy Baylor Health Care System Coca-Cola Refreshments
Energen Southern Company Services B Braun Medical College of Saint Benedict/Saint
Energy Future Holdings Southwest Gas Beaulieu John’s University
Energy Northwest Spectra Energy Bemis Manufacturing Company College of St Scholastica
Energy Solutions STP Nuclear Operating Beneficial Bank Colsa
Energy Transfer SunCoke Energy The Bergquist Company CommScope
Entergy TECO Energy Berwick Offray Community Coffee
EQT Corporation Tennessee Valley Authority Blue Cross Blue Shield of Louisiana Community Health Network
ERCOT TransCanada Blue Cross Blue Shield of South The Community Preservation
Exelon UGI Carolina Corporation
FirstEnergy UIL Holdings Blue Cross Blue Shield of Tennessee Computer Task Group
First Solar Unitil Blue Cross of Idaho ConnectiCare Capital LLC
GDF SUEZ Energy North America UNS Energy Bluestem Brands Copper Point
Grand River Dam Authority URENCO USA BMW Manufacturing Corporation Corinthian Colleges
Hunt Consolidated Vectren The Board of Pensions Cornell University
Iberdrola USA Westar Energy Boddie-Noell Enterprises The Cosmopolitan of Las Vegas
Idaho Power Williams Companies Bosch Packaging Services Country Financial
Indianapolis Power & Light Company Wisconsin Energy Boston University Cox Enterprises
Integrys Energy Group Wolf Creek Nuclear Boyd Gaming CPS Energy
Proxy Statement
MDU Resources Group, Inc. Proxy Statement B-3
CTI BioPharma Flowserve Ingram Industries Maxwell Technologies
CTS Corporation Fluor Federal Petroleum Operations Insperity Mayo Clinic
CUNA Mutual Fortune Brands Home & Security Institute for Defense Analyses McCain Foods USA
David C. Cook Franklin International Institute of Electrical & Electronic McGladrey LLP
DaVita Freeman Dallas Engineers (IEEE) Medical College of Wisconsin
Decurion Freeport-McMoRan Copper & Gold Integra Lifesciences MEGTEC Systems
Delhaize America Froedtert Health Intertape Polymer Corp Merit Medical Systems
Department of Defense Gannett Iron Mountain Merrill
DePaul University GENCO Irvine Metagenics
DeVry Education Group General Dynamics Information Ithaca College The Methodist Hospital System
Dickstein Shapiro Technology Ithaka Harbors MFS Investment Management.
Diebold Genesis Energy Itochu International MGM Resorts International
Doherty Employer Services Gentiva Health Services Jackson Hewitt Miami Children’s Hospital
Domino’s Pizza Georg Fischer Signet Jacobs Technology Michael Baker
DSC Logistics Georgia Health Sciences Medical Jarden MidAtlantic Employers Association
Duke Realty Center Jefferson Science Associates Mine Safety Appliances
Duke University & Health System Georgia Institute of Technology J&J Worldwide Services Miniature Precision Comps, Inc.
E A Sween Company G4S Secure Solutions (USA) Johnson Outdoors Minneapolis School District
Ecova Gibraltar Steel Corporation Joint Commission Minnesota Management & Budget
Edison Mission Energy G&K Services J.R. Simplot Missouri Department of Conservation
Education Management Godiva Chocolatier Judicial Council of California Missouri Department of
Edwards Lifesciences GOJO Industries Kelsey-Seybold Clinic Transportation
EGS Global Solutions Gold Eagle K. Hovnanian Companies Mitsubishi International
Elizabeth Arden Graco KI, Inc Molex
EMCOR Group Grande Cheese KIK Custom Products Morinda
Emerson Electric Great American Insurance Kingston Technology MTS Systems
Emory University Greyhound Lines Knape & Vogt Mfg Company MultiPlan
Energy Future Holdings Grinnell Mutual Reinsurance Laboratory Corporation of America Mutual of Omaha
Energy Solutions GuideStone Financial Resources Lake Federal Bank National Academies
Entergy Harman International Industries Lake Region Medical National Futures Association
Environmental Chemical Corp Harris Health System Lantech.com National Interstate
Erie Insurance Harvard Vanguard Medical Associates Layne Christensen National Louis University
ESCO Technologies Haynes International LBrands Nature’s Sunshine Products
Etnyre International Ltd Hazelden Foundation Legal & General America Navy Exchange Enterprise
Farm Credit Bank of Texas HDR Inc Leggett and Platt NBH Bank
Farm Credit Foundations HD Supply LG&E and KU Energy NCCI Holdings
Federal Reserve Bank of Atlanta Health Net Lieberman Research NCMIC
Federal Reserve Bank of Boston H. E. Butt Grocery Lighthouse International Nebraska Medical Center
Federal Reserve Bank of Chicago Hendrick Medical Center Littelfuse Nebraska Public Power District
Federal Reserve Bank of Cleveland Hendrickson Little Lady Foods New York Community Bank
Federal Reserve Bank of Dallas Henry Ford Health Systems L.L. Bean NiSource
Federal Reserve Bank of Minneapolis Highlights for Children Lower Colorado River Authority The Nordam Group
Federal Reserve Bank of Philadelphia Highway Equipment Company LSG Sky Chefs Nordson Corporation
Federal Reserve Bank of St. Louis Hilti Inc Luck Companies Northwestern Memorial Hospital
Federal Reserve Board Hilton Lutron Electronics Norton Health Care
FedEx Express Hitachi Computer Products Magellan Health Services NRG Energy
FedEx Office HNI Magna Seating NYU Langone Medical Center
Ferguson Enterprises HNTB Malco Products Inc Oerlikon Fairfield
Fermi National Accelerator Laboratory Hu-Friedy Manufacturing Company, Manpower Oglethorpe Power
Ferro Inc. ManTech International Old Dominion Electric
First American Hunter Industries MAPFRE U.S.A. Orbital Science Corporation
First Solar Huntington Memorial Hospital Maricopa County Office of Mgmt & Oriental Trading Company
Fiserv ICF International Budget Panduit
Fleetwood Group IDEX Corporation Maricopa Integrated Health System Papa John’s
Flexcon Company Inc IDEXX Laboratories Maritz Parsons Child & Family Center
Flexible Steel Lacing Information Management Service Marshfield Clinic Patterson Companies
Proxy Statement
B-4 MDU Resources Group, Inc. Proxy Statement
Pattonair Smithfield Farmland University of Michigan Xtek Inc
Paychex SMSC Gaming Enterprise University of Notre Dame Zimmer
Paycor Snyder’s Lance University of Pennsylvania
Pearson Sole Technology, Inc. University of RochesterMercer 2013 Total CompensationSurvey for the Energy SectorPegasus Solutions Southeastern Freight Lines University of Southern California
Penn State Hershey Medical Center South Jersey Gas University of South Florida
PM Southwest Gas University of St. Thomas A&A Tank Truck Co.
PMA Companies Space Dynamics Laboratory University of Texas at Austin AGL Resources - AGL Services
Port of Portland Spectrum Health - Grand Rapids University of Texas Health Science Company (Networks)
POWER Engineers Hospitals Center at Houston Access Midstream Partners, L.P.
Premera Blue Cross Stampin’ Up! University of Texas Health Science Addax Petroleum US
Principal Financial Group Standard Motor Products Center of San Antonio Afren Resources USA, Inc.
Project Management Institute Staples University of Wisconsin Medical Aker Solutions
Property Casualty Insurers State Corporation Commission Foundation Alliance Pipeline, Inc.
Association of America St. Cloud Hospital University Physicians Inc Alliant Energy Corporation
QBE the Americas Steris UPS Alyeska Pipeline Service Company
Quality Bicycle Products Stinger Ghaffarian Technologies URS Ameren Corporation
Rational Energies St Louis County Government USG Corporation Ameren Corporation - Ameren Energy
Recology Stonyfield Farm Inc Utah Transit Authority Marketing Co
Regency Centers Subaru of Indiana Automotive, Inc. UT Southwestern Medical Center Ameren Corporation - Ameren Energy
Regions Financial Syncada VACCO Industries Resources
Remedi SeniorCare Taubman Centers Vail Resorts Management Ameren Corporation - Ameren Illinois
Renaissance Learning Taylor Valero Energy Ameren Corporation - Ameren
Rexnord Corporation TDS Telecom Valspar Missouri
RiceTec Tech Data Vesuvius American Transmission Company
Rice University Tecolote Research Inc Via Christi Health Anadarko Petroleum Corporation
Rich Products Tele-Consultants Viejas Enterprises Apache Corporation
Ricoh Americas Texas Industries Inc Vi-Jon Associated Electric Cooperative, Inc.
Ricoh Electronics TIMET Vita-Mix Corporation Atlantic Power Corporation - Atlantic
Rite-Hite TJX Companies Walgreen Co Power Holdings, Inc.
Riverside Research Institute Total System Service (TSYS) Walter Energy Atlantic Power Corporation - Atlantic
RLI Transdev NA, Inc. Washington University in St. Louis Power Services, LLC
Rollins Transitions Optical Waste Management Atlantic Power Corporation -
RTC Travis County Wawa Ridgeline Energy, LLC
Salk Institute Treasure Island Resort & Casino Wayne Farms Atlas Energy, L.P.
Sally Beauty Tribune Wayne Memorial Hospital Atlas Resource Partners, L.P.
Salt Lake County Tri-Met W. C. Bradley Aux Sable Liquid Products, Inc.
Salt River Project Trinity Consultants Inc Wellmark BlueCross BlueShield BHP Billiton Petroleum
Samuel Roberts Noble Foundation Trinity Health Wells’ Dairy BOS Solutions, Inc.
San Jamar True Value Company West Bend Mutual Insurance Co Baker Hughes, Inc.
Sazerac Company Tufts Health Plan Western University of Health Basic Energy Services, LP
SCANA Turner Broadcasting Sciences Baytex Energy USA, Ltd.
S&C Electric UMDNJ-Univ of Medicine & Dentistry Weston Solutions Inc Boardwalk Pipeline Partners, LP
Schwan Food Company Underwriters Laboratories West Penn Allegheny Health System BreitBurn Energy Partners L.P.
Sealy UnitedHealthCare West Virginia University Hospitals, BreitBurn Energy Partners L.P. -
Seco Tools Inc United States Steel Inc. Breitburn Energy Company LP,
Securus Technologies Inc Universal Studios Orlando Wheaton Franciscan Healthcare Orcutt Facility
Seneca Gaming Corporation University Health System Whole Foods Market BreitBurn Energy Partners L.P. -
Sentara Healthcare University of Akron Wilmer Cutler Pickering Hale and Breitburn Energy Company LP, West
ServiceMaster Company University of Alabama at Birmingham Dorr LLP Pico Facility
Shands HealthCare University of Arkansas for Medical Windstream Communications BreitBurn Energy Partners L.P. -
Sharp Electronics Science Winn-Dixie Stores Eastern Division
Simon Property Group Inc University of California, Berkeley Wisconsin Physicians Service BreitBurn Energy Partners L.P. -
Simpson Housing University of Chicago Insurance Pacific Coast Energy Company LP
Sitel University of Georgia The Wornick Company
SJE-Rhombus University of Houston Worthington Industries
Proxy Statement
MDU Resources Group, Inc. Proxy Statement B-5
BreitBurn Energy Partners L.P. - Citation Oil & Gas Corp. Energy Future Holdings Corporation - Hilcorp Energy Company - Harvest
Regional Operations-Bigler, Texas Cobalt International Energy Luminant Pipeline Company
Operations Colonial Pipeline Company Energy Future Holdings Corporation - Hunt Consolidated - Hunt Oil
BreitBurn Energy Partners L.P. - ConocoPhillips TXU Energy Company
Western Division, California Core Laboratories EnergySolutions Husky Energy, Inc.
Operations Crescent Point Energy US Corp. EnergySolutions - Commercial ION Geophysical Corporation
BreitBurn Energy Partners L.P. - Crosstex Energy Services, LP Services Group J-W Energy Company
Western Division, Florida Cumberland Gulf Group EnergySolutions - Government J-W Energy Company - J-W
Operations DM Petroleum Operations Customer Group Manufacturing Company
BreitBurn Energy Partners L.P. - DTE Energy Enerplus Resources (USA) J-W Energy Company - J-W
Western Division, Wyoming DTE Energy Company - DTE Electric Corporation Measurement Company
Operations DTE Energy Company - DTE Gas Eni US Operating Company, Inc. J-W Energy Company - J-W Midstream
Breitburn Energy Partners L.P. - Davis Petroleum Corp. Ensco plc Company
Breitburn Energy Company LP Denbury Resources, Inc. Ensco plc - North & South America J-W Energy Company - J-W Operating
Brookfield Renewable Energy Det Norske Veritas USA Business Unit Company
Partners, LP USA Devon Energy Corporation Ensign United States Drilling, Inc. J-W Energy Company - J-W Power
Buckeye Partners, L.P. Dexco Polymers Ensign United States Drilling, Inc. - Company
CGG Diamond Offshore Drilling, Inc. California J-W Energy Company - J-W Wireline
CH2M Hill Direct Energy Ensign United States Drilling, Inc. - Company
CITGO Petroleum Corporation Dominion Resources, Inc. Ensign Well Services, Inc. JX Nippon Oil Exploration (U.S.A.),
CNPC USA Dominion Resources, Inc. - Dominion Entergy Ltd.
COG Operating, LLC Energy Entergy - Non-Regulated Kinder Morgan, Inc.
CPS Energy Dominion Resources, Inc. - Dominion Entergy - Regulated Kosmos Energy, LLC
CVR Energy, Inc. - CVR Refining LP Generation Equal Energy US, Inc. Laredo Petroleum Holdings, Inc.
CVR Energy, Inc. - Coffeyville Dominion Resources, Inc. - Dominion Explorer Pipeline Company Legacy Reserves, LP
Resources Nitrogen Fertilizers, LLC Virginia Power Exterran Holdings, Inc. Link Petroleum, Inc.
Calfrac Well Services Corporation Dresser-Rand Group, Inc. FTS International, Inc. Linn Energy, LLC
Calpine Corporation Dresser-Rand Group, Inc. - Dresser- FTS International, Inc. - FTSI MCX Exploration (USA), Ltd.
Cameron International Rand New Equipment Logistics MDU Resources Group, Inc.
Cameron International - Drilling and Dresser-Rand Group, Inc. - Dresser- FTS International, Inc. - FTSI MDU Resources Group, Inc. - Fidelity
Production Systems Rand Product Services Manufacturing Exploration & Production Company
Cameron International - Process and Dresser-Rand Group, Inc. - NAO FTS International, Inc. - FTSI MDU Resources Group, Inc. -
Compression Systems EDF Trading Resources, LLC Proppants Montana Dakota Utilities
Cameron International - Valves & EOG Resources, Inc. Forest Oil Corporation MDU Resources Group, Inc. - WBI
Measurement EP Energy, LLC Forum Energy Technologies, Inc. Energy, Inc.
Carrizo Oil & Gas, Inc. EV Energy Partners GDF SUEZ Energy Generation NA, Madison Gas And Electric Company
Castleton Commodities International, EXCO Resources, Inc. Inc. Magellan Midstream Holdings, LP
LLC EXCO Resources, Inc. - EXCO GDF SUEZ Energy North America, Magellan Midstream Holdings, LP -
CenterPoint Energy Appalachia Inc. Pipeline/Terminal Division
Chesapeake Energy Corporation EXCO Resources, Inc. - EXCO East GDF SUEZ Energy Resources NA, Magellan Midstream Holdings, LP -
Chesapeake Energy Corporation - TX/LA Inc. Transportation
Chesapeake Oilfield Services, Inc. EXCO Resources, Inc. - EXCO GDF SUEZ Gas NA, LLC Marathon Oil Company
Chesapeake Energy Corporation - Permian/Rockies Genesis Energy, LP MarkWest Energy Partners LP
Hodges Trucking Company, L.L.C. EXCO Resources, Inc. - TGGT Gibson Energy (U.S.), Inc. MarkWest Energy Partners LP - Gulf
Chesapeake Energy Corporation - Holdings, LLC Gibson Energy, LLC Coast Business Unit
MidCon Compression, L.L.C. Ecova, Inc. Great River Energy MarkWest Energy Partners LP -
Chesapeake Energy Corporation - Edison Mission Energy Halcón Resources Corporation Liberty Business Unit
Nomac Drilling, L.L.C. ElectriCities of North Carolina, Inc. Halliburton Company MarkWest Energy Partners LP -
Chesapeake Energy Corporation - Enbridge Employee Services, Inc. Helix Energy Solutions Group Northeast Business Unit
Oilfield Trucking Solutions, Inc. Encana Oil & Gas (USA), Inc. Helmerich & Payne, Inc. MarkWest Energy Partners LP -
Chesapeake Energy Corporation - EnerVest Operating, LLC Hercules Offshore, Inc. - Hercules Southwest Business Unit
Performance Technologies, LLC EnerVest, Ltd. Offshore Services, LLC Marquis Alliance Energy Group USA,
Chesapeake Energy Corporation - Energen Corporation Hess Corporation Inc.
Thunder Oilfield Services, L.L.C. Energen Corporation - Energen HighMount Exploration & Production, McMoRan Exploration Co.
Chief Oil & Gas, LLC Resources Corporation LLC MicroSeismic
Cimarex Energy Co. Energy Future Holdings Corporation Hilcorp Energy Company Mitsui E&P USA, LLC
Proxy Statement
B-6 MDU Resources Group, Inc. Proxy Statement
Murphy Oil Corporation Oceaneering International, Inc. Samson Exploration Sprague Operating Resources, LLC
New York Power Authority Oceaneering International, Inc. - Samson Offshore Stantec, Inc.
New York Power Authority - 500 MW Americas Sasol North America, Inc. Statoil
Combined Cycle Plant Oceaneering International, Inc. - Saxon Drilling L.P. Superior Energy Services, Inc.
New York Power Authority - Inspection Schlumberger Limited - Superior Energy Services, Inc. -
Blenheim-Gilboa Power Project Oceaneering International, Inc. - Schlumberger Oilfield Services Completion Services
New York Power Authority - Clark Umbilical Solutions Seadrill Americas, Inc. Superior Energy Services, Inc. - Fluid
Energy Center PDC Energy SemGroup Corporation Management
New York Power Authority - Niagara PJM Interconnection SemGroup Corporation - Rose Rock Superior Energy Services, Inc. - Well
Power Project PPL Corporation - LG&E and KU Midstream Solutions
New York Power Authority - Richard Energy, LLC SemGroup Corporation - SemGas Superior Energy Services, Inc. -
M. Flynn Power Plant PacifiCorp Sempra Energy - Cameron LNG Workstrings International
New York Power Authority - St. Parallel Petroleum, LLC Sempra Energy - Mobile Gas Service Superior Energy Services, Inc.- HB
Lawrence/FDR Power Project Parker Drilling Company Corporation Rentals
Newfield Exploration Company Pasadena Refining System, Inc. Sempra Energy - Sempra Global T.D. Williamson, Inc.
Nexen Petroleum U.S.A. Inc. Petrofac Training Services Sempra Energy - Sempra TGS-NOPEC Geophysical Company
NiSource Inc. Piedmont Natural Gas Company, Inc. International, LLC Talisman Energy, Inc. US
NiSource Inc. - Columbia Gas Pioneer Natural Resources Company Sempra Energy - Sempra LNG Technip USA, Inc.
Transmission L.L.C. Plains All American Pipeline, L.P. Sempra Energy - Sempra U.S. Gas & Tellus Operating Group, LLC
NiSource Inc. - Columbia Gas of Plains All American Pipeline, L.P. - Power, LLC Tenaris, Inc. USA
Kentucky PAA Natural Gas Storage, L.P. Sempra Energy - Willmut Gas The Keane Group
NiSource Inc. - Columbia Gas of Plains Exploration & Production Company The Keane Group - KS Drilling LP
Massachusetts Company ShawCor, Ltd. - Bredero Shaw, LLC The University of Texas System
NiSource Inc. - Columbia Gas of Ohio Praxair, Inc. ShawCor, Ltd. - Canusa-CPS The Williams Companies, Inc.
NiSource Inc. - Columbia Gas of Praxair, Inc. - Hydrogen-carbon ShawCor, Ltd. - DSG-Canusa The Williams Companies, Inc. -
Pennsylvania Monoxide (HyCO) ShawCor, Ltd. - Flexpipe Systems Northeast Gathering & Processing
NiSource Inc. - Columbia Gas of Praxair, Inc. - North American ShawCor, Ltd. - Guardian The Williams Companies, Inc. -
Virginia Industrial Gases ShawCor, Ltd. - Shaw Pipeline Northwest Pipeline
NiSource Inc. - NiSource Gas Praxair, Inc. - Praxair Distribution, Services The Williams Companies, Inc. -
Transmission & Storage Inc. ShawCor, Ltd. - ShawFlex Williams Gas Pipeline (WGP)
NiSource Inc. - NiSource Midstream Praxair, Inc. - Praxair Surface Southcross Energy Partners LP Tomkins Corporation - Gates
Services, L.L.C. Technologies Southern Company Corporation
NiSource Inc. - Northern Indiana Precision Drilling Corporation Southern Company - Alabama Power Total E&P USA, Inc.
Public Service Company Premier Natural Resources, LLC Company TransCanada Corporation
Noble Corporation Puget Sound Energy Southern Company - Georgia Power TransCanada Corporation - Energy
Noble Energy, Inc. QEP Resources, Inc. Southern Company - Gulf Power Group
NorthWestern Energy R Lacy Services, Ltd. Company Transocean, Inc.
Northwest Natural Gas RKI Exploration & Production, LLC Southern Company - Mississippi Turner & Townsend
OCI Enterprises, Inc. Range Resources Corp. Power Company Unit Corporation
OGE Energy Corp. Reef Subsea Southern Ute Indian Tribe - Southern Unit Corporation - Superior Pipeline
OGE Energy Corp. - Enogex Regency Energy Partners LP Ute Indian Tribe Growth Fund Company, LLC
OMNI Energy Services Corp. Repsol Services Company Southern Ute Indian Tribe - Aka Unit Corporation - Unit Drilling
ONEOK, Inc. Resolute Energy Corporation Energy Group, LLC Company
ONEOK, Inc. - Kansas Gas Services Rosewood Resources, Inc. Southern Ute Indian Tribe - Red Unit Corporation - Unit Petroleum
Division Rosewood Resources, Inc. - Cedar Gathering Company Company
ONEOK, Inc. - ONEOK Energy Rosewood Services Company Southern Ute Indian Tribe - Red Venari Resources, LLC
Services Company Rowan Companies, Inc. Willow Production Company WGL Holdings, Inc. - Washington Gas
ONEOK, Inc. - ONEOK Partners SCANA Corporation Southern Ute Indian Tribe - Southern WISCO, Inc.
ONEOK, Inc. - Oklahoma Natural Gas SCANA Corporation - Carolina Gas Ute Alternative Energy WPX Energy, Inc.
Division Transmission Corporation Southern Ute Indian Tribe - Southern Weatherford - US Region
ONEOK, Inc. - Texas Gas Services SCANA Corporation - PSNC Energy Ute Utilities Division Whiting Petroleum Corporation
Division SCANA Corporation - SC Electric & Southwest Gas Corporation WorleyParsons Canada, Inc.
Oasis Petroleum, Inc. Gas Southwest Gas Corporation-Southern Xcel Energy, Inc.
Occidental Petroleum Corporation SM Energy Company Nevada Division Zedi, Inc. - Southern Flow
Oceaneering International, Inc. - Saipem America, Inc. Southwestern Energy Company
Intervention Engineering Samson Energy Company, LLC Spectra Energy Corp
Proxy Statement
MDU Resources Group, Inc. Proxy Statement B-7

(This page has been left blank intentionally.)
MDU Resources Group, Inc. 9
Corporate HeadquartersMDU Resources Group, Inc.Street Address: 1200 W. Century Ave.Bismarck, ND 58503
Mailing Address: P.O. Box 5650Bismarck, ND 58506-5650
Telephone: 701-530-1000Toll-Free Telephone: 866-760-4852www.mdu.com
The company has filed as exhibits to its Annual Report on Form 10-K the CEO and CFO certifications as required by Section 302 of the Sarbanes-Oxley Act.
The company also submitted the required annual CEO certification to the New York Stock Exchange.
Common StockMDU Resources’ common stock is listed on the NYSE under the symbol MDU. The stock began trading on the NYSE in 1948 and is included in the Standard & Poor’s MidCap 400 index. Average daily trading volume in 2015 was 1,224,159 shares.
Common Stock Prices High Low Close
2015First Quarter $24.51 $20.01 $21.34Second Quarter 23.12 19.22 19.53Third Quarter 19.73 16.15 17.20Fourth Quarter 19.66 16.26 18.32
2014First Quarter $35.10 $29.62 $34.31Second Quarter 36.05 32.45 35.10Third Quarter 35.41 27.35 27.81Fourth Quarter 28.51 21.33 23.50
Dividend Reinvestment and Direct Stock Purchase PlanThe company’s plan provides interested investors the opportunity to purchase shares of the company’s common stock and to reinvest dividends without incurring brokerage commissions. For complete details, including an enrollment form, contact the stock transfer agent. Plan information also is available on the Wells Fargo Shareowner Services website: www.shareowneronline.com.
2016 Key Dividend Dates Ex-Dividend Date Record Date Payment Date
First Quarter March 8 March 10 April 1Second Quarter June 7 June 9 July 1Third Quarter September 6 September 8 October 1Fourth Quarter December 6 December 8 January 1, 2017Key dividend dates are subject to the discretion of the Board of Directors.
Annual Meeting11 a.m. CDT Tuesday, April 26, 2016Montana-Dakota Utilities Co. Service Center909 Airport RoadBismarck, North Dakota
Shareholder Information and InquiriesRegistered shareholders have electronic access to their accounts by visiting www.shareowneronline.com. Shareowner Online allows shareholders to view their account balance, dividend information, reinvestment details and more. The stock transfer agent maintains stockholder account information.
Communications regarding stock transfer requirements, lost certificates, dividends or change of address should be directed to the stock transfer agent.
Company information, including financial reports, is available at www.mdu.com.
Shareholder ContactDustin J. SengerTelephone: 866-866-8919Email: [email protected]
Analyst ContactDirector of Investor RelationsTelephone: 701-530-1057
Transfer Agent and Registrar for All Classes of Stock and Dividend Reinvestment PlanWells Fargo Bank, N.A.Stock Transfer DepartmentP.O. Box 64874St. Paul, MN 55164-0874Telephone: 651-450-4064Toll-Free Telephone: 877-536-3553www.shareowneronline.com
Transfer Agent and Registrar for Senior NotesThe Bank of New York MellonCorporate Trust Department101 Barclay St. — 12WNew York, NY 10286
Independent Registered Public Accounting FirmDeloitte & Touche LLP50 S. Sixth St., Suite 2800Minneapolis, MN 55402-1538
Note: This information is not given in connection with any sale or offer for sale or offer to buy any security.
Des
ign:
MD
U R
esou
rces
Prin
ting:
AFP
I
The paper used in this annual report is certified by the Forest Stewardship CouncilTM and contains a minimum of 10 percent post-consumer recycled paper fibers.
Stockholder Information
www.fsc.org
MIXPaper from
responsible sources
FSC® C015410
®
MDU Resources Group, Inc.10
Building a Strong America®
Trading Symbol: MDUwww.mdu.com
Street Address1200 W. Century Ave.Bismarck, ND 58503
Mailing AddressP.O. Box 5650Bismarck, ND 58506-5650
701-530-1000866-760-4852