Embed Size (px)
Citation preview

1GEORGE TAI Managing Director, Regent Publishing Services
Pride and Prejudice Rockport Publishers
PHILIP COOPER Publisher
Art: The Whole Story Quintessence Editions
2015 ANNUAL REPORT
AMY SLETTUM Print Promotions & Merchandising Manager
Sally’s Candy Addiction Race Point Publishing
MARLENE STURM Foreign Rights Executive
Charles Darwin The Voyage Of The Beagle Zenith Press
ZETA JONES PublisherAlice’s Adventures in Wonderland Rockport Publishers
HEATHER GODIN Art Director
The Paper Hat Book Quarry Books
#WEAREBOOKS
#WEAREPEOPLE
#WEAREQUARTO

JESSICA PINAULT Digital Marketing Co-ordinator
Sally’s Baking Addiction Race Point Publishing
CAITLIN FULTZ Project Manager
Beyond Canning Voyageur Press
KERRY ENZOR PublisherSuperfoods 24/7 Apple Press
#WEAREBOOKS #WEAREPEOPLE#WEAREQUARTO
Celebrating 40 years of Quarto, our company, our people and their favourite books!
DARWIN HOLMSTROM Senior Editor
American Muscle Cars Motorbooks
1
CONTENTS OVERVIEWSetting the scene for our Group and the businesses we operate
Highlights of the Year 2 Chairman's Statement 4 What we do & How we do it 6
STRATEGIC REPORTA review of our strategy and how we are delivering against this
Chief Executive Officer's Statement 8 Divisional Review 10 Key Initiatives 15 Outlook 17 Strategic Report 18 Key Performance Indicators 20 Our People 24 Financial Review 29
GOVERNANCEHow we manage our Group and an introduction to the Board and their focus
Directors' Report 35 Audit Committee Report 42 Directors' Remuneration Report 45 Annual Report on Remuneration 55 Nominations Committee Report 63 Statement of Directors' Responsibilities 64 Independent Auditor's Report 66
FINANCIAL STATEMENTSOur financial statements provide a complete overview of our 2015 performance
Consolidated Statement of Comprehensive Income 71 Consolidated Balance Sheet 72 Consolidated Statement of Changes in Equity 73 Consolidated Cash Flow Statement 74 Notes to the Financial Statements 75 Company Balance Sheet 112 Five Year Summary 119 Officers and Advisors 120

2
PROFIT BEFORE TAXATION
$12.9m (2014: $12.0m)2 +8%
PROFIT FOR THE YEAR
$9.3m (2014: $9.1m)2 +2%
ADJUSTED EARNINGS PER SHARE1
49.9cents (2014: 44.1 cents per share)2 +13%
REVENUE
$50.1m (2014: $42.7m) +17%
GROUP REVENUE
$182.2m1 (2014: $171.3m)2 +6%
REVENUE
$72.4m (2014: $64.0m) +13%
IMPRINTS
• Apple Press• Design Eye• Fine Wine Editions• Global Book Publishing• Iqon Editions• Ivy Press• Ivy Kids• Leaping Hare Press• Marshall Editions• QED Publishing• Qu:id Publishing• Quantum Publishing• Quarto Children’s Books• Quarto Publishing• Quintessence• Quintet Publishing• RotoVision• small world creations• words & pictures
IMPRINTS
• Book Sales• Cool Springs Press• Creative Publishing international• Fair Winds Press• Motorbooks• Quarry Books• QDS (Distribution Services)• Race Point Publishing• Rock Point Calendars• Rock Point Gift & Stationery• Rock Port Publishers• The Harvard Common Press• Voyageur Press• Walter Foster Publishing• Walter Foster Publishing Junior• Zenith Press
ADJUSTED3 OPERATING PROFIT
$6.3m (2014: $6.1m) +3%
ADJUSTED3 PROFIT BEFORE TAXATION
$14.1m (2014: $11.9m)2 +18%
ADJUSTED3 OPERATING PROFIT
$8.9m (2014: $6.6m) +35%
HIGHLIGHTS OF THE YEAR

3
REVENUE
$22.8m (2014: $21.4m) +6%
REVENUE
$22.1m (2014: $29.9m)2 -26%
REVENUE
$14.8m (2014: $13.3m) +11%
IMPRINTS
• Aurum Press• Frances Lincoln• Frances Lincoln Children's Books• Frances Lincoln Gift & Stationery• Jacqui Small• Kinkajou• Wide-Eyed Editions
BUSINESSES
Formerly: • Lifetime Distributors (Australia) • Premier Books (New Zealand)
BUSINESSES
• Regent Publishing Services• Quarto Hong Kong
ADJUSTED3 OPERATING PROFIT
$3.3m (2014: $3.1m) +6%
OPERATING PROFIT
$1.6m (2014: $2.8m)2 -43%
OPERATING PROFIT
$1.5m (2014: $1.1m) +36%
1 Includes revenue of $8.2m relating to the acquired Ivy Press business.2 Restated as set out in Note 1 and Note 35. 3 Adjusted measures are stated before amortisation of acquired intangible assets and exceptional items.

4
After three years of transformation, with cumulative earnings per share growth and debt reduction, 2015 was Quarto’s most profitable year ever. This is the fulfilment of the vision which led to my appointment as Chairman in 2012 and I am proud of what Quarto has achieved in that time. I have decided not to put myself forward for re-election at the Annual Meeting, but rather hand over with confidence to Peter Read, upon his election at the Annual Meeting, to lead the Board as Chairman through Quarto’s next phase of growth.
DIVIDEND
As well as our continued focus on debt reduction, the Board is pleased to recommend a final dividend of 9.4c/6.15p per share, making the total dividend for the year 14.5c/9.50p, a 6% increase over last year, giving dividend cover, based on Adjusted Earnings per Share of 49.9c (2014: 44.1c) of 3.4 times (2014: 3.2 times). Notwithstanding the increase in the final dividend for 2015, the Board believes that the balance between the interim dividend and final dividend should be more weighted to the final dividend given the increased second half weighting of revenues and profits. Accordingly, there will be no increase in the interim dividend in 2016, but with the expected earnings growth for the full year, the Board anticipate appropriate progression in the final dividend.
CORPORATE GOVERNANCE
I was elected as Chairman of Quarto at a time of great change in late 2012. Since that time Quarto’s earnings have increased by over 50% and its debt has reduced by over 25%.
The Company has a clear strategy for the future and I am pleased to have appointed such an accomplished executive management team during my tenure. With the exit of the activist shareholder block in November 2015, I shall leave the Board along with Christopher Mills, at the conclusion of the forthcoming Annual Meeting on May 24, 2016.
The proposed new Chairman, Peter Read, is currently a non-executive director of Quayle Munro Ltd. and Concha Plc, the Professional Cricketer’s Association, and the Royal Automobile Club. He was formerly Chairman of KPMG's Telecoms, Media & Technology practice and a partner for over 20 years. Peter will join the Board at the Annual Meeting. Marie Louise Windeler will also join the Board at the Annual Meeting and assume the role of Chair of the Remuneration Committee; she has had excellent experience of executive and non-executive roles in creative businesses. They will form the non-executive Board along with Mike Hartley, Senior Independent Director and Chair of the Audit Committee, and Jess Burley, both of who were appointed during my tenure as Chairman; I am grateful to both of them for their help in reforming the Company’s corporate governance.
CHAIRMAN'S STATEMENT
Financial highlights for the year include:
Revenue up 6% to $182.2m (2014: $171.3m)1
Adjusted2 Group Operating Profit up 8% to $17.2m (2014: $15.9m)1
Adjusted2 Profit Before Tax up 18% to $14.1m (2014: $11.9m)1
Profit Before Tax up 8% to $12.9m (2014: $12.0m)1
Adjusted2 Earnings per Share of 49.9c up 13% (2014: 44.1c)1
Net debt reduced by 10% to $59.5m (2014: $66.0m)
Proposed final dividend of 9.4c (2014: 8.2c)3 up 15%, making the total dividend for the year of 14.5c, up 6% (2014: 13.7c)
Dividend cover of 3.4x (2014: 3.2x)1, 3
1 Restated as set out in Note 1 and Note 35.
2 Adjusted measures are stated before amortisation of acquired intangible assets and exceptional items.
3 Dividend per share is declared in cents per share and paid in sterling. Dividend cover is calculated using adjusted earnings per share.

5
The Board has examined the merits of moving the Company’s domicile to the UK from its historic domicile in the USA in Delaware. Given the significant cost and execution risk of such a move which would have limited benefit to existing shareholders, the Directors do not believe this to be in the Company’s interests in the short to medium term. If there is a beneficial change in US tax legislation, then the Board will look at the issue again in the future.
PEOPLE
We said farewell to Mick Mousley, our long-standing Chief Financial Officer, in 2015. His enormous contribution to the Company can never be underestimated and we wish him well in his retirement. Our new CFO, Michael Connole, joined us in September and has made an excellent contribution to the business already.
Yet again our people at Quarto have shown restless creativity and resolute innovation. Increasingly tenacious sales and marketing efforts have lifted the Company to record profits in 2015. On behalf of the Board, I would like to thank all of our people in all of our businesses around the world for their talented hard work and commitment to Quarto.
Quarto is a fine business, poised at an exciting time in its history. I wish it all the best in executing its strategy.
"Quarto is a fine business, poised at an exciting time in its history. I wish it all the best in executing its strategy."
Timothy J. M. Chadwick Chairman
Timothy J.M Chadwick Chairman March 30, 2016
FAVOURITE TITLE
London Uncovered Frances Lincoln
Profit before tax up
8%
Revenue up
6%

6
WHAT WE DO & HOW WE DO IT
To educate, entertain and enrich the lives of our readers, putting books in their hands, wherever,
however and whenever they choose.

7
Driving growth through enhanced product distribution
with focus on existing channels, adaptation and
innovation in new channels as well as expansion into new
global markets.
Managing an efficient supply chain and distribution of product
in order to reach consumers, utilising best practice and the scale
of our international marketing and sales operations to drive cost
efficiencies, while allowing our creative teams to flourish.
Delivering profitability by developing the talented
people in our Group network that retains creative independence
but encourages marketing and sales interdependence
and collaboration.
Investing in creating product that excites the
enduring interest of niche enthusiast groups with category
focussed publishing teams who are creatively driven
and financially astute.

8
Our goal in our 40th anniversary year remains for Quarto to grow in a sustainable and profitable manner, organically and through judicious acquisitions, and steadily reduce net debt further.
Our core publishing operations contributed revenue growth of 13% and adjusted operating profit growth of 17%. Our publishing margins improved from 12.3% to 12.8%, demonstrating the quality of the revenue growth that we achieved which offset currency fluctuations in some areas of the Group. Our trading businesses contributed $3.3m in operating profits with an excellent year from Regent Publishing Services making up for another year of currency weakness and difficult trading at Book & Gifts Direct.
We have focused on tighter working capital management in all Group companies this year and net debt has been reduced by 10% or $6.5m and by over 25% since 2012. Working capital management and debt reduction will remain a key point of focus in 2016.
We continue to demonstrate the market demand and commercial value of illustrated print books. Quarto books serve clearly identified markets and are useful, instructive and well produced. These characteristics reflect our creative focus on customers and underpin the enduring quality of our imprints. We are a content-rich company, built on the foundations of the creative independence and vitality of each imprint, combined with senior management that is commercially focused. New titles are viewed through the prism of creativity, quality and economic impact. We celebrate our 40th Anniversary with confidence in the continued value of these principles in guiding our business strategy. Further, we have enhanced our model through the implementation of global operational, marketing and sales collaboration. Our new sales and marketing arrangements with Allen & Unwin in Australasia and the launch of www.QuartoKnows.com in June 2015 demonstrate this global collaboration; the second phase of the development of the latter, our digital hub and e-commerce platform will take place in 2016.
Consequently, Quarto enters its fifth decade as a highly diversified dynamic portfolio of creative businesses underpinned by a scalable production and sales platform for organic and acquisitive growth. We will continue to grow by creating and exploiting information rich content and licensing that content in domestic and global markets. We will allocate capital across our portfolio of businesses, backing long-lasting winners and flexibly responding to both market opportunities and market challenges as they arise.
CHIEF EXECUTIVE OFFICER’S STATEMENTSummary
Quarto made continued progress in 2015, delivering on our strategic objectives of revenue growth, debt reduction and dividend growth, while improving operational efficiency. This level of performance was enabled by the resilience of our business model and the professionalism, ambition and hard work of our people around the world.

9
Organic growth alone will be insufficient to leverage fully the market opportunity. Starting new imprints and attracting new talent is vital but, with very rare exceptions, takes time to have a significant impact on the Group. Notwithstanding the quality of our catalogue and strong revenue contribution of historic titles, imprints do decline and organic growth sometimes serves only to offset this natural life cycle. Acquisitions of appropriate publishing imprints will therefore remain fundamental to continued strong growth providing that we stay true to our acquisition principles: that the businesses acquired shall be within our known areas of publishing expertise, bring measurable benefits to the Group as a whole and in the year after acquisition, should be earnings enhancing.
Quarto’s people around the world have excelled in 2015 with the Quarto work ethic evident in all areas of the business; our people are hard-working, practical and focused. The spirit of co-operation within the Group continues and the commitment shown to our entire ecosystem of partners and network of suppliers allows us to keep up the momentum we have achieved in 2015 and aim for each year.
Total dividend up
6% FAVOURITE TITLE
The Bear And The Piano Frances Lincoln Children’s Books
Net debt down
10%
Adjusted earnings per share up
13% Marcus E. Leaver CEO, The Quarto Group

10
2015 has been a mixed year for the wide portfolio of imprints that constitute QIC. The integration and the outperformance of the acquired Ivy Press business has been a highlight, contributing revenue of $8.2m and operating profit of $1.9m. The weaker performance of some of the other imprints had been expected and of some others less so. A variety of factors came into play; those factors being market focussed, imprint focussed or category focussed or a combination thereof. We are addressing these issues and are confident that the recovery of these formerly successful units to previous levels of profitability will happen in the course of the next two financial years. We recognise the cyclical nature of a number of our businesses and manage the portfolio accordingly.
Currency fluctuations certainly had a negative impact on deal closing and deal flow in total. Some potential downside was countered with the execution of some entrepreneurial royalty deals as opposed to losing deals in total. But English language revenues were robust yet again with strength in most imprints in new title purchases and reprints. This bodes well for the future.
Enhanced by our acquisition of Ivy Press, this is a portfolio of market-leading imprints based in London and Brighton, that enjoys good medium-term visibility as we continue to produce and publish books that are of perennial interest, avoiding passing fads, while enjoying numerous reprints and justifying the initial investment.
ThisIsYourCookbook.com had an encouraging few months post-launch and proved its concept of producing personalised cookbooks. We will invest some marketing funds in this business in 2016. It is still too early to say whether this new venture will reach commercial success, but investment in new ways of exploiting our IP is essential to the ongoing health of Quarto.
Revenue $50.1m(2014: $42.7m)
Adjusted Operating Profit $6.3m(2014: $6.1m)
Backlist sales % of sales 59%(2014: 68%)
Intellectual Property Investment $15.7m(2014: $14.6m)
Sales by territory: US 34%, Europe 32%, UK 16%, ANZ 6%, RoW 12%(2014: US 31%, Europe 34%, UK 18%,
ANZ 9%, RoW 8%)
DIVISIONAL REVIEW
MARTIN TAYLOR Designer
Creature Close-Up: Ocean Animals QED Publishing
JOY AQUILINO Acquiring Editor
Sharpie Art Workshop Rockport Publishers

11
2015 has been an excellent year for the US-based imprints. After a challenging 2014 in the Home Improvement retail sector, the team has executed its business plan very effectively and outperformed in its market-leading sales in the Art Instruction category, led by adult colouring book sales. Our most successful titles came from a three year old organic start up imprint, Race Point. This highlights how important it is to reinvest continually in our various portfolios. Equally our sales and marketing structure excelled in making our product available as deeply and widely as it did in all channels both domestically and globally. That said, 2015 has been an exceptional year, and we will strive to repeat this performance in 2016.
Our direct relationships with retailers continue to develop as we focus our publishing and distribution into niche markets. Our strategy remains to diversify our channels to market in a way that matches the breadth of our publishing programmes which cater for enthusiasts. Our recent acquisition of The Harvard Common Press is a good example of this. The purchase, which was completed on February 1, 2016, adds hundreds of titles to our backlist as well as over 25,000 recipes. The acquisition furthers our position as a leading publisher of lifestyle-orientated titles for the consumer markets.
The medium-term view is positive in this business and we will continue to look for suitable acquisition candidates, either lists that complement what we already publish or businesses in areas where this portfolio is underweight, such as children’s books.
Revenue $72.4m(2014: $64.0m)
Adjusted Operating Profit $8.9m(2014: $6.6m)
Backlist sales % of sales 71%(2014: 70%)
Inventory % of sales 21%(2014: 19%)
At a turn of 2.0x(2014: 1.9x)
Intellectual Property Investment $14.9m(2014: $14.8m)
MARISSA GIAMBRONE Art DirectorTangled Travels Creative Publishing international

12
NICOLA PRICE Designer
The 50 States Wide Eyed Editions
2015 has been another year of progress for our UK-based imprints with particularly gratifying performances from Aurum Press, which has been transformed by its new Publisher into an illustrated and global imprint, and Wide Eyed Editions, a second year start up under a talented creative management team, who are also re-igniting the creativity in Frances Lincoln Children’s Books.
The medium-term view is encouraging as we maintain our focus on both domestic and international markets utilising the creative platform we now have in place. Suitable acquisition candidates will be identified in areas where the portfolio could be enhanced.
Revenue $22.8m(2014: $21.4m)
Adjusted Operating Profit $3.3m(2014: $3.1m)
Backlist sales % of sales 44%(2014: 54%)
Inventory % of sales 17.3%(2014: 19%)
At a turn of 1.5x(2014: 1.4x)
Intellectual Property Investment $4.3m(2014: $4.2m)
DIVISIONAL REVIEW
KATIE COTTON Senior Editor
There’s A Tiger In The Garden Frances Lincoln Children’s Books

13
JOSEPH CRAVEN Managing Director, Books & Gifts Direct
100 Perfect Hair Days RotoVision
Despite the fact the Australian Dollar weakened by 17% during the course of the year against the US Dollar, it cannot disguise the fact that it has been another demanding year for our business in Australia and New Zealand.
In local currency, poor last quarter trading saw our sales to the Australian Master Franchisers down 20% for the full year against 2014. This is a result of sales out of their networks being sluggish, leading to the Master Franchisers being overstocked and not needing to buy new inventory from Books & Gifts Direct as the Australian economy has cooled.
New Zealand has had a reasonable trading year following the merger of 2014 but has suffered lower margins resulting from a deliberate attempt to reduce levels of older inventory. We continue to explore the sale of the franchises for North Island and South Island as opposed to owning the business in this territory.
Progress has been made in this business in 2015 with the full roll out of our proprietary technology and network capacity up to 113% from 85% at the end of 2014. We have a coherent market-leading business in Australia and New Zealand. With resolutely committed partners in the Master Franchises, an increasingly experienced management team, enhanced buying power and the implementation of proprietary technology that has been developed over the last two years, we have all the ingredients for a return to the levels of profitability enjoyed previously. Quarto’s executive management will assist in this return to success in any way it can.
Revenue $22.1m(2014: $29.9m)1
Operating Profit $1.6m(2014: $2.8m)1
Network Capacity 113%(2014: 85%)
1 Restated as set out in Note 1 and Note 35.

14
WINCY KHO Senior Manager, Quarto Hong KongDreams Of Freedom Frances Lincoln Children’s Books
DIVISIONAL REVIEW
With one of the most experienced management teams in the industry, Regent, our long-established print broking business based in Hong Kong, produced an excellent result in 2015 with operating profit up 36% from revenues up 11%. The new sales and marketing strategy, focussed on in 2015, of children’s, religious, comic, gaming and stationery publishing is working well.
The establishment of Quarto Hong Kong in 2015, the Group’s print buying office in Hong Kong, is driving further savings for Quarto in print buying in China, a critical element of our supply chain and a cornerstone in our improving operational efficiencies across the Group.
Revenue $14.8m (2014: $13.3m)
Operating Profit $1.5m (2014: $1.1m)
MOZIDUR RAHMAN Licensing Manager
In A Minute Mum QED Publishing

15
Revenue $32.4m (2014: $23.0m)
KEY INITIATIVES
ALISON STONE Executive Assistant
The Best Homemade Kids' Snacks On The Planet Fair Winds Press
TOM READ English Language Sales Manager
Could A Whale Swim To The Moon? QED Publishing
Our children’s revenues have grown by over 75% from 2012 and now constitute 22% of our publishing revenues. Our talented creative teams around the world are suitably teamed up with excellent specialist children’s book sales people and marketers. We continue to attract and develop talent in this area and will examine potential acquisitions on both sides of the Atlantic.

16
CLEMENCE MAHEO Foreign Rights Manager
Taste Aurum Press
JONATHAN SIMCOSKY Acquiring Editor
Let’s Cook French Quarry Books
Our Foreign Rights team has battled hard to counter the currency fluctuations affecting most of the markets they sell into. Their entrepreneurial approach has salvaged what could have been a poor year and with the addition of Ivy Press they have ended the year ahead of last year.
Our Brazilian distribution agreement with Grupo Nobel, Quarto Editora, got off to a good start and 2015 saw a full year contribution from that business. We continue to source similar relationships in other undersold territories but have proceeded cautiously in ensuring we find the right partners who share our values.
Revenue $30.1m (2014: $26.6m)
KEY INITIATIVES

17
The Group is well-positioned to deliver continued earnings growth in 2016. We expect this to manifest itself in the second half of the year; the increase in second half weighting experienced in 2014 and 2015 is in line with continuing global retail trends. Visibility gained through our forward order books and the recurring revenues of our business model gives us confidence in our ability to continue the momentum of the last three years as we execute our business plan.
Quarto remains a cash generative business and we are committed to reducing our net debt, including by resolutely examining the strengths and weaknesses of our portfolio with a clear focus on our working capital. Continued reduction in net debt will further enhance our options to build on the strong platform that has been created in the last three years and prior. As we further develop our business to take advantage of growth areas and the acquisition opportunities that are presented to us, thereby increasing the Group’s earnings, we will progress the Company’s dividend in the second half of the year, as we have done in 2014 and 2015.
Marcus E. Leaver Chief Executive Officer March 30, 2016
OUTLOOK
We celebrate our 40th Anniversary in 2016 with a clear sense of purpose and identity. Quarto knows how to make and sell books that inspire, educate, entertain and encourage creativity. Quarto does this consistently and profitably and will continue to do so in 2016 and beyond.
CECILIA FARLEY Design Assistant
Atlas of Adventures Wide Eyed Editions

18 STRATEGIC REPORT
Our strategy is to grow our revenue and margins by leveraging our size, scale and reach as the leading global illustrated book publisher and distribution group to build a business with sustainable growth in earnings per share while reducing its debt burden. Our principal risks
and uncertainties are set out on page 33.
REVENUE GROWTH
We focus on revenue growth organically for each of our imprints in our portfolio. We also search for earnings accretive lists, imprints or businesses that can add to our portfolio and enhance the marketing and sales efforts of our existing businesses.
INTELLECTUAL PROPERTY INVESTMENT
We are committed to investing in long-lasting intellectual property. In pursuing the very best photography, artwork, design and writing, we aim to safeguard the future revenue streams of the business.
DISTRIBUTION DEVELOPMENT
We develop direct physical distribution relationships, global partnerships and the digital marketing and delivery of our content. We are committed to selling our books wherever, however and whenever our customers want them in multiple markets; multiple languages and multiple formats.
IMPROVING OPERATING MARGINS
We improve our operating margins on revenue by using the leverage of our illustrated publishing focus to buy print and freight effectively. We are relentless also in identifying other areas of supply chain efficiencies.
GROUP VALUE ADD
We continue to develop the value added by the Group function in supporting our people achieve our objectives while acknowledging our core belief of creative independence in each publishing imprint.
DEBT REDUCTION/DIVIDEND INCREASES
We shall continue to focus on reducing our debt burden and where possible, increase dividends to enhance shareholder value.

19STRATEGIC PROGRESS IN 2015
The year has seen us overlay the undoubted creative independence and rigour of our publishing with a tenacious marketing and sales force that works interdependently
and collaboratively on a global basis. With the directional control provided from the Group and support in non-publishing or sales/marketing functions, we are beginning to
leverage our scalable business model to good effect.
Up 13% in Publishing Businesses
Foreign Rights Revenues up 13%; Over 50% growth
in Children's foreign rights revenues
Up to 12.8% in Publishing Businesses
Global Publishing Operations unit established. Systems implementation in the US with 2016 UK rollout
Children's Publishing revenues up over 40%; 22% of Group Revenue
Net Debt down 10% Total dividend up 6%
Developing distribution
channels
Debt reduced & dividend increased
Improve operating margins
Revenue growth
Managing our IP investment
Group value add

20
Our net debt has reduced by 10%
in the year.
50.000000 60.666667 71.333333
20152014201320122011
$59.5m
$66.0m
$71.0m
$81.0m$81.4m
NET DEBT2
The Board uses this ratio to
evaluate the long-term financial health
of the company.
10.000000 11.266667 12.533333 13.800000
20152014201320122011
13.8%12.7%
11.8%
11.0%
11.2%
RETURN ON NET OPERATING ASSETS2
1 Adjusted operating profit before depreciation.2 All comparative indicators have been restated as set out in Note 1 and Note 35.3 Adjusted measures are stated before amortisation of acquired intangible assets and
exceptional items.
KEY PERFORMANCE INDICATORS (KPIs)
Our strategy is to grow our revenue and margins by leveraging our size, scale and reach as the leading global illustrated book publisher and distribution group to build a business with sustainable growth
in earnings per share while reducing our debt burden.
$16.1m
Our EBITDA has grown 8%
in the year.
14.500000 15.833333 17.166667 18.500000
20152014201320122011
$18.4m$17.0m
$15.9m
$16.5m
EBITDA1,2
Our Adjusted PBT has grown by 18%
in the year.
5.000000 8.033333 11.066667 14.100000
20152014201320122011
$14.1m$11.9m
$9.3m
$9.0m$10.8m
ADJUSTED3 PROFIT BEFORE TAX2

21
The new title sales for any given year are a leading
indicator that show how effective and
reliable our backlist sales might be.
20152014201320122011
1.34x
1.16x1.01x
1.02x
1.12x
PRODUCT EFFICIENCY
INTELLECTUAL PROPERTY DEVELOPMENT SPEND
We have increased the IP spend in order to
grow the publishing businesses organically.
28.000000 30.333333 32.666667 35.000000
20152014201320122011
$34.9m
$33.5m$31.7m
$30.5m$30.7m
We shall report this key strategic area of
our publishing from now on.
20152014201320122011
$32.4m
$23.0m$19.6m
$18.5m
$14.7m
CHILDREN'S PUBLISHING REVENUES
0 11 22
This is a measure of the cash used up in inventory as a proportion
of revenue.
20152014201320122011
14.4%
14.5%
11.2%12.6%
14.5%
INVENTORY % OF REVENUE2
10.000000 11.333333 12.666667 14.000000
Backlist has reduced as a % of sales as we have invested in new Intellectual Property.
20152014201320122011
61.4%
66.6%
71.3%
69.8%
68.6%
BACKLIST % OF SALES
56.000000 61.333333 66.666667 72.000000
The Board uses this ratio to evaluate
the quality of the company's earnings.
20152014201320122011
49.8c
44.1c
36.1c
41.6c
43.6c
ADJUSTED3 DILUTED EARNINGS PER SHARE2
25.000000 33.333333 41.666667 50.000000

22
BE COLLABORATIVE
Use 'we’ and bring the best out
of each other
BE EXCELLENT
Quality matters in everything we do
OUR VALUES

23
BE CONSISTENT
Be clear, concise and clear-headed
BE CURIOUS
Try things, fail well, do it quickly
BE ACCOUNTABLETake responsibility
and do what you say
BE PURPOSEFUL
Do what you love and make
it happen
24
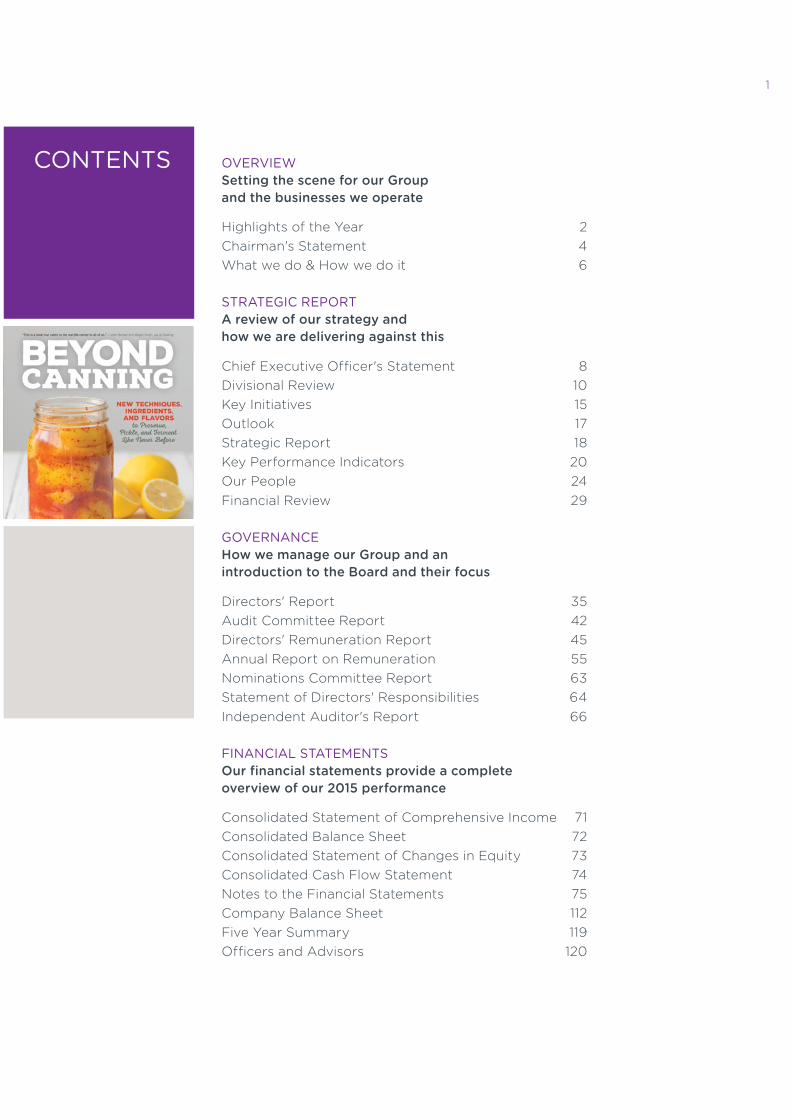
Sally Dwyer Group Director of People
FAVOURITE TITLE
Porsche Sixty Years Motorbooks
Quarto’s unique identity, the world over, is created by our people and shaped by our organisational culture.
Our values guide our journey to achieve our core purpose – to inspire, educate, create and entertain.
Today’s business environment demands greater need for collaboration, co-creation and learning agility.
Employees are a critical part of our business and our most important asset. We are always looking for better ways to attract, develop and retain employees who love what they do and who are driven by their passion for creating wonderful illustrated books.
This year our people strategy focused on employee engagement and getting the foundations in place so that we can attract the right talent for our business while nurturing our current talent. As part of this process, we reviewed and increased our global benefits for maternity, paternity, adoption and surrogacy. Across our UK businesses, we harmonised the employment terms and conditions of all our employees.
We are also committed to establishing lean HR processes to improve employee engagement and ensure we support an open and transparent people environment. This included developing and launching our employee intranet – Q Exchange and creating a dedicated HR section called People Zone. People Zone houses all our global career opportunities and people content, providing for just in time access to any HR related tool or process, quick access guides and HR contacts across the world.
OUR PEOPLE

25
SUPPORTING DIVERSITY
At Quarto we celebrate diversity, and our diverse team is a reflection of the communities where we live. By encouraging diversity and inclusion, we unlock different talents to increase creativity, problem solving and adaptability. Workplace diversity is a driver of competitiveness that supports our ability to attract, develop and retain the best employees, create an engaged team and deliver innovation.
We do not discriminate against age, gender, ethnicity, cultural background, sexual orientation or religious beliefs. We recruit, develop and promote our staff based on their performance alone. We are proud of the fact we review each job application and do not filter them through a system that disqualifies candidates based on education, sex or age.
Building an open, fair and transparent culture is not only embedded in our values but also imperative for business continuity. We believe that a culture that drives equal opportunity, meritocracy and one in which employees feel safe and ‘listened to’, will lead to higher levels engagement, retention and performance.
CARA CONNORS Project ManagerThe Homemade Flour Cookbook Fair Winds Press
HEIDI NORTH Senior Design Manager
Creative Lettering And Beyond Walter Foster

26
RICHARD JEWITT Senior DesignerAdorable Hedgehogs 2017 Rock Point Gift & Stationery
VICTORIA LYLE Commissioning Editor
Cats In Hats Quarto Publishing
HIGH PERFORMING CULTURE
An organisation’s talent pool and expertise will emerge as the key differentiator for business growth and success. At Quarto we believe in recognising the strengths of our people and developing them to take on different and/or more senior roles within the business. We do this predominately by mentoring, coaching and on the job development.
Our priority is driving a high performance culture where all our employees feel empowered to achieve and be the best they can be. We ensure individual performance goals are connected to the overall strategic goals of Quarto. We have listened to our employees who said the annual performance review process was too long, not relevant and did not provide the feedback needed throughout the year and in 2016 we will be moving away from a single annual process. We will be implementing a quarterly process that allows for more timely performance coaching and development, and one that ensures our people are engaging with our vision, values and strategy and aligning their goals to these key drivers.
We believe a quarterly performance check-in will help our people to better understand our performance expectations and track their progress. This gives them greater visibility about how they contribute to our business and perform in their roles. Most importantly, it allows our employees to be proactive in their career development.
Employees are a critical part of our business and our most important asset. We are always looking for better ways to attract, develop and retain employees who love what they do and who are driven by their passion for creating wonderful illustrated books.
OUR PEOPLE

27
SUSI MARTIN Art DirectorHow To Cook In 10 Easy Lessons Walter Foster Jr.
CORPORATE RESPONSIBILITY
Our people individually and collectively contribute to the communities in which we live and work. We are proud of the efforts our people make to educate, entertain and enrich the lives of not just our readers. Some of the highlights for this year have been:
Quarto California partnered with LA Parent magazine and some of Hollywood's young celebrities to donate books for the annual Celebrity Stuff-a-thon benefiting the Los Angeles Ronald McDonald House and deliver the bags to critically ill children and their families.
Quarto UK and Quarto Co-editions gave book in kind donations to several charities across the year, including Help for Heroes, Ronald McDonald House as well as The Family School.
Our Books & Gifts Direct business work closely with many communities and charitable organisations including Make A Wish Foundation, Little Heroes, Care Flight, and The Royal Children’s Hospital in Melbourne to name a few. To date we have raised over $2.0m and counting!
Since 2014, 5.0c from every product sold in Australia goes to the McGrath Foundation, which raises money to put breast care nurses in communities all over Australia as well as increasing breast cancer awareness in young Australian women. In New Zealand 5.0c from every product sale goes to the Starship Foundation, which is a children's charity who are a dedicated pediatric healthcare service and major teaching centre, providing family centred care to children and young people throughout New Zealand and the South Pacific.

28
SUSAN MEARS International Sales Administrator
Quilters Quarry Books
CORPORATE SUSTAINABILITY
Making our business more sustainable by integrating sustainability into the very heart of everything we do, where our efforts create value for our shareowners and continue to provide value to our customers, partners and communities in which we operate.
We are working towards developing sustainable operations by analyzing each link in the value chain and in particular identify the sources of waste in our supply chains, such as managing our carbon emissions by ensuring we consolidate shipments across the group and ship as infrequently as possible. This limits the shipping of empty space across the oceans, and reduces energy waste and our carbon footprint.
Going forward we will be producing our entire Children’s products using Forest Stewardship Council (FSC) paper. We continue to work with partners and suppliers who are certified by the FSC, IS0 14001 which covers environmental management systems and the ICTI CARE process covering ethical standards of manufacturing.
JAMES CAREY Director of Publishing Operations, UK
Actual Size Frances Lincoln Children’s Books
OUR PEOPLE

29
Michael Connole CFO, The Quarto Group
FAVOURITE TITLE
The Complete Book of Porsche 911 Motorbooks
“Our adjusted operating profit margins reflect the maturity and stability of the business”
ADJUSTED1 OPERATING PROFIT MARGIN2
FINANCIAL REVIEW
REVENUE AND PRE-TAX PROFIT
Revenue for the year was $182.2m (2014: $171.3m) and gross profit was $59.4m (2014: $55.0m) showing a stable gross margin of 32.6% (2014: 32.1%). $8.2m of the increase relates to the Ivy Press business which we acquired in March 2015.
Our administrative expenses of $35.0m show an increase of 8.0%, resulting mainly from the acquisition of Ivy Press in March 2015.
Adjusted operating profit, which is a key measure of how the business is performing, rose by 8.2% from $15.9m in 2014 to $17.2m in 2015. The 2015 figure includes a contribution of $1.9m from Ivy Press.
Operating profit of $16.0m (2014: $16.0m) includes exceptional charges $0.4m (2014: $0.6m exceptional credit), reflecting costs relating to our acquisition of Ivy Press and costs associated with certain other corporate transactions that we did not pursue. In 2014, operating profit reflected exceptional credits of $0.6m arising on sales of businesses and assets.
Our adjusted profit before tax was $14.1m, showing an improvement of 18.5% on the corresponding figure for 2014 of $11.9m.
1 Adjusted measures are stated before amortisation of acquired intangibles and exceptional items.2 All comparative years have been restated as set out in Note 1 and Note 35.
2015
2014
2013
2012
2011
7.0% 7.6% 8.2% 8.8% 9.4% 10.0%
9.3%
9.4%
8.3%
8.3%
7.8%

30
FINANCE COSTS
Finance costs of $3.2m (2014: $4.1m) represent the interest costs on the group’s borrowings together with the amortisation of the debt issuance costs associated with the refinancing of bank debt that took place in February 2015. The reduced finance costs reflects the reducing net debt and the reduction in interest margin negotiated as part of the refinancing. As set out in Note 1 and Note 35 the amortisation of debt issuance costs was previously included in administrative expenses and has been reclassified.
TAX CHARGE
The tax charge for the year of $3.7m represents an effective rate of tax of 28.5% which shows an increase on the corresponding figure for last year of 24.3%, explained by the increase in profits generated by our US publishing business where federal corporate taxes are levied at 34%, which compares unfavourably with the current UK corporation tax rate of 20.25%.
PROFIT FOR THE YEAR
Profit for the year of $9.3m showed a $0.2m increase on the same figure for 2014, which reflects the higher operating profit for the year.
EARNINGS PER SHARE
Basic earnings per share increased by 1.1% from 44.5c in 2014 to 45.0c, reflecting the higher profit for the year. Diluted earnings per share, which takes account of share options issued during the year was 44.9c (2014: 44.5c).
Our adjusted earnings per share of 49.9c per share shows a year-on-year increase of 13% (2014: 44.1c), and reflects the increase in adjusted profit referred to earlier. Note 9 to the accounts sets out how we calculate the adjusted earnings per share figures.
RETURN TO SHAREHOLDERS
The Directors are recommending a final dividend of 9.4c per share, bringing the total dividend per share for the year to 14.5c per share. In 2014 the total dividend paid was $13.7c per share, which is covered 3.4 times by earnings (2014: 3.2 times by earnings)
The increase in the dividend reflects the Directors’ commitment to maximising shareholder value through a progressive dividend policy, but underpinned by at least three times cover.
Reconciliation of profit before tax to adjusted profit before tax
2015$000
2014$000
RestatedProfit before tax 12,939 12,005
Amortisation of acquired intangibles 724 503
Exceptional items 445 (566)
Adjusted profit before tax 14,108 11,942
Our profit before tax was $12.0m (2014: $12.0m).

31
CASH FLOW
Free cash flow for the year was $15.1m, showing an increase of $3.9m on the same figure for 2014 of $11.2m.
Free cash flow is our operating cash flow less our cash expenditure on pre-publication costs and our capital expenditure, and shows the cash that the business has generated to fund acquisitions to pay taxes, service our debts and pay dividends to shareholders.
Our management of working capital produced an incremental $2.4m of free cash, generating $0.6m of cash in the year, compared to utilising $1.8m in 2014.
Our cash generated by operations was $51.9m (2014: $46.1m), which is stated before the cash expenditure on pre-publication costs of $34.9m (2014: $33.5m). The increase in our investment in pre-publication costs reflects the increase in the number of new titles we published in the year, some of which were published by Ivy Press, which we acquired during the year.
2015$000
2014$000
RestatedProfit for the year 9,254 9,083
Adjustment for:
Net finance costs 3,098 3,977
Depreciation of property, plant and equipment 1,189 1,106
Tax charge 3,685 2,922
Share based payments charges 186 –
Amortisation of acquired intangible assets 724 503
Amortisation of pre-publication costs 33,258 30,933
Movement in fair value of derivatives (85) (43)
Gain on disposal of property, plant and equipment – (642)
Operating profit before movement in working capital 51,309 47,839
Net movement in working capital 639 (1,779)
Cash generated by operations 51,948 46,060
Investment in pre-publication costs (34,872) (33,525)
Capital expenditure (2,010) (1,341)
Free cash flow 15,066 11,194

32
ACQUISITIONS
As referred to previously, we acquired Ivy Press on 4th March 2015 for a total consideration of $1.9m. We also assumed and settled debt of $0.4m. The consideration was payable in three tranches, the final tranche of which was paid on 4th January 2016. Goodwill of $0.3m arose on the acquisition, details of which are set out in Note 34.
NET ASSETS
The Group’s net assets of $55.0m show an increase of $4.3m on for 2014 of $50.7m, reflecting the improved trading performance.
Goodwill has reduced from $41.1m to $40.1m over the course of 2015 reflecting the addition of $0.3m of goodwill arising on the Ivy Press acquisition and currency movements.
The net investment in publishing assets of $131.1m, comprising our investment in pre-publication costs, our inventories and our trade receivables, shows an increase of $8.5m on 2014 of $122.6m. This is explained by our growth in the year arising from both the acquisition of Ivy Press and by organic growth in our existing publishing imprints. Since I joined Quarto Group in September 2015, I have made this investment a priority, looking to maintain resolute focus on its management and efficient use.
INDEBTEDNESS AND BORROWING FACILITIES
Our net debt comprising our bank borrowings less cash balances has reduced from $66.0m to $59.5m. The overall 10% reduction of $6.5m reflects both currency movements and the improvement in our operating cashflow referred to above. The continued reduction of our net debt is a key objective for the Directors.
Our actual bank borrowings at 31 December 2015 were $84.6m (2014: $89.2m). In February 2015, the Group agreed a new $95m multi-currency term loan and revolving credit facility, which expires on 30th April 2019. This facility requires us to maintain certain levels of interest cover, leverage and cashflow in the business and the interest payable on the debt is based on a ratchet whereby we pay LIBOR plus a margin of between 2.1% and 2.8% depending on our leverage ratio. We also have a £5m ($7.4m) working capital overdraft facility, which is renewable annually.
CURRENCY
The group reports in US dollars, which is the principal functional currency, but also transacts in Sterling, Euro, Australian dollars, New Zealand dollars and Hong Kong Dollars. We use a currency swap arrangement to mitigate the fluctuations between US dollars and Sterling. Our borrowings are in US dollars, Sterling and Euros to hedge the movement in our net assets in those currencies.
The key exchange rates for the year were:
Exchange ratesYear End Rate Average rate
Versus US Dollar 2015 2014 Movement 2015 2014 Movement
Sterling 0.68 0.64 -5% 0.65 0.61 -7%
Euro 0.92 0.83 -11% 0.90 0.75 -20%
Australian Dollar 1.37 1.22 -12% 1.33 1.11 -20%
New Zealand Dollar 1.46 1.28 -14% 1.43 1.21 -19%
Hong Kong Dollar 7.77 7.75 -0.3% 7.73 7.74 0%

33
In the year, all of currencies we transact in weakened against the US dollar. The net impact of these currency movements on our net assets was to reduce them by $2.5m (2014: reduction of $1.9m).
The impact on revenue and profits was felt most in our Books & Gifts Direct business in Australia and New Zealand where the local currencies weakened by 20% and 19% respectively against the US Dollar over the year which meant that revenue was down $7.8m and operating profit down by $1.2m.
PRINCIPAL RISKS AND UNCERTAINTIES
The Board has recently carried out a robust assessment of the principal business risks facing our various businesses and have documented these risks in a risk register, which will be regularly reviewed, and the Board will monitor these principal risks and associated material controls. Details of the group’s financial risk management objectives and policies is set out in Note 33.
The business risk review identified the following key risks that face our businesses.
a) Customer Risk. The Group operates across many of the major world economies including the USA, United Kingdom, Europe, Australia, New Zealand and Hong Kong and our revenues and profits depend on the general state of the economies in these territories. Another recessionary environment in our key USA and UK markets could have a significant impact on the financial status of some of our key customers and their ability to pay their debts to us. We monitor debts closely and maintain close relationships with all major customers that may provide prior warning of likely failure.
b) Currency Risk. The Group’s businesses operate in a number of different currencies giving rise to a risk of exchange loss due to fluctuating exchange rates. We have hedging and currency swaps in place. We have a natural hedge that mitigates against currency movements impacting our earnings in that one of our largest costs, which is print costs, are paid in US Dollars. Borrowings have been taken out in different currencies to mitigate risk of currency movements impacting our net assets.
c) Loss of Intellectual Property. As we are an owner of intellectual property, a lot of which is digitally stored and accessed, the security and strength of our information technology systems is very important. Because of its importance, we regularly review our storage and back-up routines and disciplines and are in the process of introducing a new title management system for our publishers that will improve the security of and access to our intellectual property.
d) Economic Conditions. A sudden downturn in revenues or profits caused by a global recession or through the impact of currency movements could reduce consumer discretionary spending which might result in a reduction in profitability and operating cashflow. The group is well funded with over $100m in debt facilities but in addition, in the event of such a reduction in profits and/or cashflow, the Directors have the ability to make a number of mitigating actions including the reduction of discretionary spend on pre-publication costs.
e) Supply Chain Risk. The Group uses a number of print suppliers to print its books, many of whom are based in Southern China. There is a risk that an interruption in the availability of printing services in Southern China could result in an interruption in the printing and distribution of new books to customers. The group maintain relationships with printers in other South East Asian countries, Eastern Europe, the UK and the USA and are confident that printing could be carried out by an alternative range of printers if supply from China was interrupted.
f) Cyber Security Risk. Like many organisations, the group is at risk from cyber attack. This presents a potentially serious risk disruption to the production process and could have a significant impact on the probability of the business and the security of intellectual property assets. The Group uses firewalls and IT controls to prevent attack as well as maintaining offsite backup of intellectual property. Computerised files of the Group's books are also maintained by printers.

34
GOING CONCERN AND VIABILITY STATEMENT
In accordance with provision C.2.2 of the 2014 revision of the Corporate Governance Code, the Directors have assessed the prospects of the Group over both a one-year and three year period. The one year period has a greater level of certainty and is, therefore, used to set budgets for all our businesses which culminates in the approval of a Group budget for the Board. The three-year period offers less certainty, but is aligned with long term incentives offered to Executive Directors and certain senior management.
The Directors have considered the underlying robustness of the Group’s business model, products and proposition and its recent trading performance, cash flows, compliance with its banking covenants and key performance indicators. They have also reviewed the cash forecasts prepared for the 3 years ending 31 December 2018, which comprise a detailed cash forecast for the year ending 31 December 2016 based on the budget for that year and using standard growth assumptions for revenue and costs for the years ending 31 December 2017 an 2018 to satisfy themselves of the going concern assumption used in preparing the financial statements.
The Directors noted the new $95.0m multi-currency term loan and revolving credit facility agreed in February 2015 and the £5.0m working capital overdraft facility and the forecast compliance with the new facility’s covenants for the foreseeable future.
The Directors have assessed the Group’s viability over a three year period ending on 31 December 2018 based on a three year financial model which was prepared as part of the process of considering and approving the 2016 Budget.
The Directors used the three-year review period for the following reasons:
• The Group’s publishing programme planning cycle normally works over a two to three year period.
• The Group’s current banking facilities have just over three years to run before they will need to be refinanced in April 2019.
As a result, it is expected that the Group’s assessment of viability will not extend beyond three years in future reporting periods.
In carrying out their analysis of viability, the Directors took account of the Group’s projected profits and cashflows, its banking covenants and the impact of a downturn in trading that the Group could endure whilst remaining viable. They also took account of the principal risks and uncertainties facing the business referred to above, a sensitivity analysis on the key revenue growth assumption, and the effectiveness of available mitigating actions.
Based on their assessment, the Directors have a reasonable expectation that the Group will be able to continue in operation and meet all of their liabilities as the fall due up to 31 December 2018. For this reason, they continue to adopt the going concern basis in preparing the financial statements. In doing so, it is recognised that such future assessments are subject to a level of uncertainty that increases with time and, therefore, future outcomes cannot be guaranteed or predicted with certainty.
Michael D. Connole Chief Financial Officer March 30, 2016
35DIRECTORS’ REPORT
GROUP
The Directors present their report and the audited financial statements of The Quarto Group, Inc., for the year ended December 31, 2015.
RESULTS AND DIVIDENDS
The profit for the year amounted to $9.3m (2014: $9.1m). The Directors propose a final ordinary dividend of 9.41c (6.15p) per share (2014: 8.17c (4.95p) per share), amounting to $1.9m (2014: $1.5m), subject to approval at the Annual Meeting.
DIRECTORS
Serving Directors during the year, were as follows:
T. J. M. Chadwick (Non-executive) ChairmanR. J. Morley (Non-executive) Deputy ChairmanM. E. LeaverM. D. Connole (Appointed 1 September 2015) J. Burley (Non-executive)M.G. Hartley (Non-executive)C.H.B. Mills (Non-executive) M. J. Mousley (Resigned 1 September 2015)
None of the Directors have a service agreement of more than one year's duration, other than Timothy Chadwick who had an initial three year agreement which has been extended until the end of the 2016 Annual Meeting and Robert Morley, the duration of whose appointment is unspecified, subject to the continuance of certain conditions as set out on page 52. All of the directors are subject to annual re-election. The terms and conditions of appointment of non-executive directors are made available for inspection.
Save as disclosed in Note 31, no Director had a contract of significance with the company or its subsidiaries during the year.
Neither Timothy Chadwick nor Christopher Mills are standing for re-election at the Annual Meeting on May 24, 2016. Two new non-executive Directors are being proposed for appointment at that meeting. It is proposed that Peter Read be elected to the Board and serve as Chairman. Marie Louise Windeler also be elected to the Board and assume the role of Chair of the Remuneration Committee at which point, Michael Hartley will relinquish that role.

36
BOARD
Timothy Chadwick (69) started his career in 1974 with Macmillan Publishers and established his first business, Aurum Press, in 1978. In 1988, he sold Aurum Press to The Really Useful Group. In 1991, he started ABC (All Books for Children), which he sold to HIT Entertainment plc in 1995 after developing the best-selling series, Angelina Ballerina.
In 1995, he floated American Port Services plc on the London Exchange. After growing his company into a substantial seaport and airport owner and operator in the USA and Belgium, APS was acquired in 1998 by Associated British Ports plc. Tim was elected as Chairman of Simon Ports plc in March 2003. The business grew substantially and was acquired in 2006 by Cobelfret.
Tim joined Quarto in 2012 and chairs the Nominations Committee and is a member of the Remuneration Committee.
Marcus Leaver (45) has been Chief Executive Officer since December 2012 having joined the Board of Quarto as Chief Operating Officer in May 2012. Prior to Quarto, he worked in the USA from 2005, latterly as President of Sterling Publishing, a subsidiary of Barnes & Noble, the leading bricks-and-mortar bookseller in the US.
Before living and working in the US, he worked in London for Chrysalis Group plc, a London Stock Exchange-listed media company, latterly as CEO of Chrysalis Books Group, from 2002, and prior to that Corporate Development Director and in a number of different general management roles, from 1998.
Marcus graduated from the University of East Anglia with a degree in Art History, and received his MBA from London Business School.
Marcus is a member of the Nominations Committee.
Michael Connole FCA (51) joined Quarto as Chief Financial Officer on 1 September 2015. He has considerable experience in media, being CFO of Global Radio, the UK's largest commercial radio group from June 2008 to August 2015, and before that he was Group Finance Director at Chrysalis Group PLC, where he worked from 1997 to 2008. He has also been Vice President – Finance (Europe) for Management Consulting Group plc and spent 7 years with KPMG's London office. He qualified as a chartered accountant in 1988.
Jess Burley (50) has over 20 years' experience in media, working previously as the Group Managing Director of Hearst in the UK, responsible for Hearst Digital and The National Magazine Company portfolio. Jess joined m/SIX (the WPP joint venture between CHI&Partners and GroupM) as CEO in May 2010 bringing a wealth of knowledge across all media. Jess has also held a number of Non Exec roles working currently as a Non Exec for UK Mail Plc and previously with the fashion retailer Jacques Vert Plc and TalkTalk Telecom Plc. Jess is also a Trustee of the young person's charity Get Connected. She became a Non-executive Director of Quarto in 2014.
Jess is a member of the Nominations, Audit and Remuneration Committees.
Mike Hartley (67) was appointed to the Board in August 2013 as Senior Independent Director and Chair of Remuneration and additionally as Chair of Audit from May 2014. Mike brings considerable board and international experience and a broad knowledge of strategic management. He formerly held a series of senior executive positions in both retail and manufacturing serving latterly as Chief Executive Officer of the £800m turnover Viyella division of Coats Viyella plc retiring in 2003. He has held a series of non-executive roles including Chairman of Dawson International plc from 2003 to 2009 and Senior Independent Director of ITE Group plc from 2003 to 2014. He is currently Chairman of US based Dawson Forte LLP.
Christopher Mills (63) is the Managing Partner of Harwood Capital Management LLP, which is the largest shareholder of The Quarto Group, Inc. Christopher is also currently a director of Gleeson PLC, Catalyst Media Group plc and Bioquell plc as well as a number of private companies. He became a Non-executive Director of Quarto in 2014.
Christopher is a member of the Nominations, Audit and Remuneration Committees.

37
Robert Morley (70) co-founded The Quarto Group in 1976, setting up the original co-edition imprints and later developing the newly acquired US imprints. As a graphic design graduate from art college, he started out his career at Haymarket Publishing Group. He also worked as Art Director on the Sunday Telegraph magazine and with Richard Branson at the start of what is now the Virgin Group. From there he worked for IPC art directing part-work magazines followed by a period developing new ideas for Readers Digest books before setting up Jackson-Morley, a boutique editorial and design company.
EMPLOYEES
Applications for employment of disabled persons are always fully considered, bearing in mind the aptitudes of the applicant concerned. In the event of staff becoming disabled, every effort is made to ensure that their employment with the Group continues and that appropriate training is arranged. It is the policy of the Group that the training, career development and promotion of disabled persons should, as far as possible, be identical with that of other employees.
The Group places considerable value on the involvement of its employees and has continued its practice of keeping them informed on matters affecting them as employees and on the various factors affecting the performance of the Group. This is achieved through formal and informal meetings. Employees are consulted regularly on a wide range of matters.
The Board recognises the importance of diversity amongst its employees and is committed to ensuring that employees are selected and promoted on the basis of merit and ability, regardless of age, gender, race, religion, sexual orientation or disability. The gender split across the Group for the year ended December 31, 2015 is illustrated in the table below.
Males FemalesBoard 6 1
Senior Leadership Team 6 2
All employees 141 297
The Group's Senior Leadership Team comprises the Group's CEO and CFO, together with six senior managers.
SUBSTANTIAL SHAREHOLDERS
As at March 14, 2016, the latest practicable date prior to the publication of this report, the Directors have been advised of the following shareholders who have an interest of 3% or more in the shares of common stock of the Company:
Number of US$0.10 shares of common stockL. F. Orbach 2,889,785 14.13%
Liontrust Asset Management 1,969,832 9.63%
Herald Investment Trust 1,812,045 8.86%
R. J. Morley 1,402,852 6.86%
Henderson Global Investors 1,192,791 5.83%
Unicorn Asset Management 995,116 4.87%
Cavendish Asset Management 813,500 3.98%
Lazard Freres Gestion 800,000 3.91%
AXA Investment Management 750,000 3.67%
1 R.J. Morley sold 1,022,228 shares on March 24, 2016.2 Gresham House Strategic PLC acquired 550,000 shares on March 24, 2016. On March 28, 2014 the Directors were advised
that the total shareholding was 898,837 shares, representing 4.40% of common stock in issue.

38
The rights attaching to the Company’s shares of common stock are set out in the Company’s By-Laws, which can be found on the Company’s website, www.quartoknows.com. The rules for appointment and replacement of the Directors are set out in the Company’s By-Laws. The powers of the Directors are set out in the Company’s By-Laws. The Company may purchase its own shares through the market or by tender at a price which will not exceed the average prices at which business was done for 10 business days before the purchase is made or, in the case of a purchase through the market, at the market price, provided that it is not more than 5% above such average. The Company may amend its By-Laws by special resolution approved by the affirmative vote of the holders of a majority of the voting power of the shares. The Directors' interests in the shares of the Company are set out on page 57. There are no restrictions on the number of shares that Directors can hold.
RISK MANAGEMENT STRATEGY
The Group is exposed to a number of principal risks and uncertainties. The Group’s financial risk management strategy is set out on in Note 33. Operational risks are set out on page 33 of the Financial Review.
CORPORATE GOVERNANCE
The Company is committed to high standards of corporate governance and supports the principles laid down in the UK Corporate Governance Code issued by the Financial Reporting Council in 2014 (the ‘Code’). The Board considers that the Company has been in compliance with the principles and provisions of the Code, with the exception of those outlined below, throughout the year ended December 31, 2015 and to the date of this report.
The principles of the Code have been applied as follows:
a) The Board of Directors represents the shareholders’ interests in maintaining and growing a successful business including optimising consistent long-term financial returns.
b) The Board comprises two Executive Directors and five Non-executive Directors. The Chairman is responsible for the leadership of the Board and ensuring its effectiveness. The different roles of the Chairman and Chief Executive Officer are acknowledged. The senior independent Non-executive Director is Michael Hartley who is available to shareholders, if they have concerns which are not able to be resolved through normal channels. Two Non-executive Directors, Michael Hartley and Jess Burley are considered by the Board to be independent. Timothy Chadwick and Christopher Mills are not deemed to be independent because of their relationship with Harwood Capital LLP, which was a major shareholder. Bob Morley, who co-founded the Group and previously served as a Director until May 2012, is also not deemed independent.
There are a number of standing Committees of the Board to which various matters are delegated. They all have formal terms of reference approved by the Board which are available on the Company’s website (www.quarto.com).
c) The Board met seven times in 2015. Attendance details are set out below. A formal agenda is prepared for each meeting and all board papers and information are circulated to the Board at least forty-eight hours before the meetings.
39
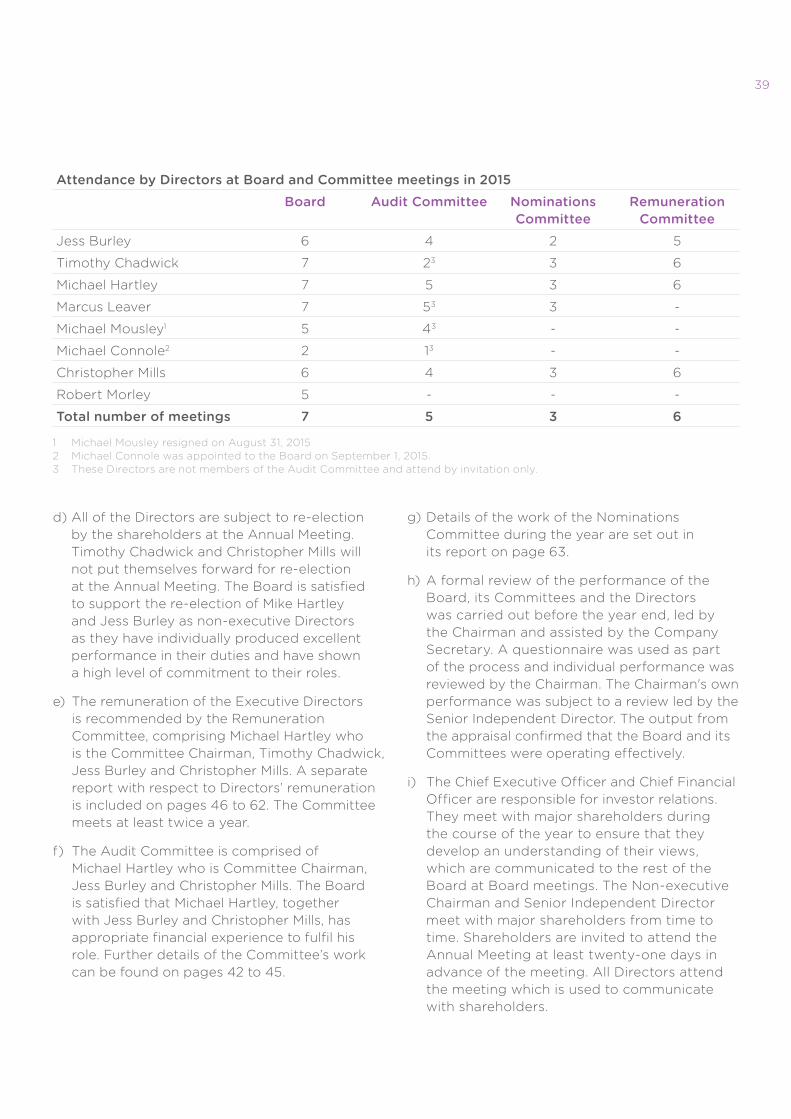
Attendance by Directors at Board and Committee meetings in 2015Board Audit Committee Nominations
CommitteeRemuneration
CommitteeJess Burley 6 4 2 5
Timothy Chadwick 7 23 3 6
Michael Hartley 7 5 3 6
Marcus Leaver 7 53 3 -
Michael Mousley1 5 43 - -
Michael Connole2 2 13 - -
Christopher Mills 6 4 3 6
Robert Morley 5 - - -
Total number of meetings 7 5 3 6
1 Michael Mousley resigned on August 31, 20152 Michael Connole was appointed to the Board on September 1, 2015.3 These Directors are not members of the Audit Committee and attend by invitation only.
d) All of the Directors are subject to re-election by the shareholders at the Annual Meeting. Timothy Chadwick and Christopher Mills will not put themselves forward for re-election at the Annual Meeting. The Board is satisfied to support the re-election of Mike Hartley and Jess Burley as non-executive Directors as they have individually produced excellent performance in their duties and have shown a high level of commitment to their roles.
e) The remuneration of the Executive Directors is recommended by the Remuneration Committee, comprising Michael Hartley who is the Committee Chairman, Timothy Chadwick, Jess Burley and Christopher Mills. A separate report with respect to Directors’ remuneration is included on pages 46 to 62. The Committee meets at least twice a year.
f) The Audit Committee is comprised of Michael Hartley who is Committee Chairman, Jess Burley and Christopher Mills. The Board is satisfied that Michael Hartley, together with Jess Burley and Christopher Mills, has appropriate financial experience to fulfil his role. Further details of the Committee’s work can be found on pages 42 to 45.
g) Details of the work of the Nominations Committee during the year are set out in its report on page 63.
h) A formal review of the performance of the Board, its Committees and the Directors was carried out before the year end, led by the Chairman and assisted by the Company Secretary. A questionnaire was used as part of the process and individual performance was reviewed by the Chairman. The Chairman's own performance was subject to a review led by the Senior Independent Director. The output from the appraisal confirmed that the Board and its Committees were operating effectively.
i) The Chief Executive Officer and Chief Financial Officer are responsible for investor relations. They meet with major shareholders during the course of the year to ensure that they develop an understanding of their views, which are communicated to the rest of the Board at Board meetings. The Non-executive Chairman and Senior Independent Director meet with major shareholders from time to time. Shareholders are invited to attend the Annual Meeting at least twenty-one days in advance of the meeting. All Directors attend the meeting which is used to communicate with shareholders.
40
j) The Board has a procedure for Directors to take independent professional advice at the Company’s expense, if required.
k) All Directors have access to the advice and services of the Company Secretary.
l) Quarto has arranged appropriate insurance cover in respect of legal action against the Directors.
m) The Company has an established whistle- blowing policy.
The provisions of the Code not complied with are as follows:
a) A.3.1. – As noted above, the Chairman of the Board was not independent at the date of appointment. Upon his anticipated election at the Annual Meeting as Chairman of the Board, Peter Read will be independent.
b) B.2.1. – The Nomination Committee is not composed of a majority of independent Non-executive Directors. The Board is however satisfied that its current composition enables the Committee to benefit from a broad range of views and does not inhibit it from following a formal, rigorous and transparent procedure when appointing new directors.
c) C.2.1. – During the year end, the Directors commenced a robust assessment of the principal business risks including those that would jeopardise its business model, future performance, solvency or liquidity. Since the year end, this assessment has been formally documented in a risk register which also details the effectiveness of the controls in place.
The Board will continue to review its corporate governance arrangements, in the light of the Code, as the Group develops and grows, and in particular will review those provisions that are not currently complied with.
The Directors consider that the annual report and accounts, taken as a whole, are fair, balanced and understandable and provide the information necessary for shareholders to assess the Group’s performance, business model and strategy.
GREENHOUSE GAS EMISSIONS REPORTING
During the year, the Group worked with Energy Management LLP, an energy procurement and carbon consultancy, to develop GHG reporting protocol based on DEFRA and World Resource Institute guidelines.
The Group has chosen to use Operational Control in their approach to reporting utility data, electricity and natural gas from UK and International operations. This includes sites that have been disposed of during the reporting period. Scope 1 (Natural Gas) and Scope 2 (Electricity) are reported on below, but the Group are not reporting on Scope 3 emissions covering emissions from transport and emissions from fully serviced offices where only a service charge is applied.
The Group has identified GHG (Greenhouse Gas) emissions per employee as the most appropriate available KPI (referred to as the intensity ratio) and has chosen 2014 as our Base Year, following the disposal of our silk screen printing business in 2013.
GLOBAL GHG EMISSIONS
2015 2014 Tonnes of CO2e
Scope 1 17 13
Scope 2 268 319
Total GHG emissions (CO e) 285 332
Average number of staff* 321 324
Emissions per staff member 0.89 1.02
* Excluding staff at fully serviced offices.

41
RISK MANAGEMENT AND INTERNAL CONTROLS
The Board is responsible for the Group’s system of internal control and for reviewing its effectiveness. As stated previously, the Directors have carried out a robust assessment of the principal businesses and considered the controls in place to eliminate or mitigate the impact of key risks. The Board has in place risk management systems in relation to the Company’s financial reporting process and the Group’s process for the preparation of the consolidated financial statements. However, such systems are designed to manage rather than eliminate the risk of failure to achieve business objectives and can provide only reasonable and not absolute assurance against material misstatement or loss.
Established procedures are in place to identify and consolidate reporting entities. Our control activities include policies and practices covering appropriate authorisation and approval of transactions, the application of financial reporting standards and reviews of significant judgements and financial performance.
The main elements of the internal control and financial reporting systems are:
a) The results of individual operating segments are reported and reviewed by the Board at its meetings during the year.
b) The management reports of each operating segment are tailored to suit the business and management needs of local management. Each operating segment has its own key performance indicators and these are regularly reviewed and assessed.
c) In addition to monthly reporting, individual operating units report certain management information more frequently, where it is considered appropriate.
d) All operating units report their bank balances twice weekly and a report is produced summarising the Group position.
e) The Chief Executive Officer and the Chief Financial Officer make frequent visits to all operating segments. These visits include reviews of the internal control and financial reporting systems.
f) All operating units prepare annual budgets and cash flow forecasts which are reviewed by the Board.
The UK Corporate Governance Code introduced a requirement that the Directors perform on-going monitoring and review of the effectiveness of the Group’s system of internal controls, to cover all controls including financial, operational, compliance, and risk management. The Board confirms that there are ongoing processes covering the identification, evaluation and management of the significant risks faced by the Group and covers all material controls. The processes are carried out through Group Board meetings, quarterly subsidiary management meetings, discussion and review by the Executive Board and the finance department during the several visits per year to individual operating units, and discussions with professional advisers where appropriate. The Board identified a significant failing in relation to financial reporting controls in the year, which together with the remedial actions, is discussed in the Audit Committee Report on page 44. We will continue to develop our risk management framework during 2016.
AUDITORS
Deloitte LLP have expressed their willingness to continue in office. A resolution to reappoint them as the Company’s auditors and to authorise the Directors to determine their remuneration will be proposed at the Annual Meeting.
Clive Potterell Secretary March 30, 2016 Company Registration Number: FC0 13814

42 AUDIT COMMITTEE REPORT
The members of the Audit Committee who served throughout the year are non-executive Directors Michael Hartley (Chairman), Jessica Burley and Christopher Mills. The Board considers Jessica Burley and Michael Hartley to be independent Directors. The Board considers a majority of members of the Committee to have recent and relevant financial experience and together have a wide range of financial and commercial experience to fulfil the Committee’s duties.
RESPONSIBILITIES
The Committee acts in accordance with its terms of reference as available on the Group’s website, and its specific responsibilities include:
• To consider and recommend the appointment of the Group’s auditor, the audit fee, audit engagement letter and questions of auditor performance, partner rotation, resignation, and dismissal.
• To meet with the auditor to discuss all aspects of the audit including audit planning, scope, findings, accounting policies, management judgements and estimates.
• To review the Board’s representation letter to the auditor.
• To review the auditor’s management letter and management’s response.
• To set policy and review the use of any non-audit services and assess the independence of the auditor.
• To review financial statements released to the public including interim and annual financial statements.
• To review the Group’s accounting policies, practices and use of accounting standards especially for decisions requiring major elements of judgement, significant adjustments, long term viability and going concern.
• To review the Group’s internal controls and risk management including:
- the financial reporting process
- identifying, managing and monitoring financial, operational, compliance and other risks
- compliance with regulatory and legal requirements
- detecting fraud
• To review the need for an internal audit function at least annually.
COMMITTEE MEETINGS
The Committee meets throughout the year to fulfil its responsibilities. The Committee Chairman also meets informally with the Chief Financial Officer throughout the year and with senior management. He also meets with the external Audit Partner from time to time to discuss issues and be appraised of regulatory change.
By invitation the Company’s Chairman of the Board, Chief Executive Officer, CFO and representatives of the Company’s auditor also attend Committee meetings although part of some meetings are exclusively for Committee members without executive management present.
The Chairman of the Committee attends the Annual Meeting to address any shareholder questions relating to the Committee.
The Committee met five times during 2015.
The Committee, as part of full Board meetings, was also involved in approving announcements made to the London Stock Exchange.
ACTIVITIES OF THE COMMITTEE
During 2015 and 2016 to date the work of the Committee included:
• Review of the plan and scope of the external audit.
• Review of the external auditor’s report on the 2015 year end audit and approval of the preliminary announcement and the annual report.
• Recommend to the Board its support for management’s recommendation for the final and interim dividend.

43
• Consider the external auditor’s comments in relation to internal control and review the need and potential scope of internal audit functions.
• Review compliance of the policy relating to use of the auditors for non-audit work.
• Review and approval of the interim report 2015 after discussion with management and the external auditor.
• Discussion of significant accounting issues facing the Group including goodwill impairment, the amortisation of intangible assets, going concern, revenue recognition and policy with regard to disclosure of exceptional items.
• Review of the Directors' viability statement.
• Review of the independence of the external auditor.
AUDIT RISKS, KEY FINDINGS AND FINANCIAL JUDGEMENTS RELATING TO YEAR END ACCOUNTS 2015
The Committee concentrated on the following judgement areas in relation to the 2015 accounts.
Goodwill impairment
Goodwill arising from acquisitions is stated at cost less any accumulated impairment losses. In accordance with IAS 36 the Group tests the goodwill on an annual basis for impairment. The Committee reviewed the methodology and assumptions in the testing process with focus on the discount rate used in the discounted cash flow valuations and the sensitivity to changes in the discount rate and growth rate. Further detail is set out in Note 10.
Amortisation and recoverability of intangible assets
Amortisation of intangible assets is charged to profit or loss on a straight line basis over the estimated useful lives of the intangible assets. Pre-publication costs which are capitalised in accordance with IAS 38 form much of these intangible assets and the Committee, with the external auditor, discussed the assumptions behind the amortisation including the amortisation period of the publications. Further detail is set out in Note 14.
Exceptional items
The Committee, in consultation with the Auditor, considered the latest regulatory guidelines issued by the FRC in December 2013 and agreed with the Executive Directors to restrict exceptional items to significant non-trading items outside the scope of normal business that need to be disclosed by virtue of their size or incidence. Further detail is set out in Note 4.
Going Concern
The Committee considered the underlying robustness of the Group’s business model, products and proposition, and the financial resources available to it for the future to satisfy itself of the going concern assumption in preparing the financial statements. The Committee noted the forecast compliance with the facility’s covenants for the foreseeable future.
Revenue recognition and sales returns
The Committee considered the risk that revenue may not be captured in the relevant period. Apart from the usual risks relating to the timing of revenue recognition, management are required to provide for returns which may be made subsequent to the period end. This requires a significant degree of judgement as management assesses sales returns through quantifying the previous returns experience. This judgement is particularly germane in 2015 due to the very high rate of sales of the fashionable adult colouring books, particularly in the final quarter. The Committee reviewed management's methodology, and discussed the procedures followed to ensure that revenue was booked into the correct period in line with the stated accounting policies and that returns provisions were reasonable.
During the audit of the BGD subsidiary in Australia where Deloitte replaced the previous local auditor, it was identified that due to the specific goods in transit insurance arrangements, title does not pass until receipt by the customer. The accounts had previously been based on title passing at port. The accounts have been restated to correctly reflect revenue cut off. Further detail is set out in Note 35.

44
Inventory provisioning
Manufacturing and wholesaling economics of books inherently leads to holding significant inventory. Most of these are not firm sales so there is a significant degree of judgement as to the provisions required to hold this inventory at the lower of cost or net realisable value. The Committee reviewed managements’ methodology and discussed the testing performed by the Auditor to provide comfort that these estimates were reasonable. Management recorded additional provisions on slow moving inventory in the Books & Gifts Direct business in New Zealand.
Receivables provisioning
Trade receivables is inherently a critical accounting estimate in relation to the risk of non recoverability of trade receivables. The Committee has discussed and challenged the overall receivables position and considered the reasonableness of the level of provisioning.
Restatement of overhead capitalisation
During consolidation testing procedures, the Auditor identified a balance of capitalised overheads of $0.6m, which had been incorrectly capitalised as it did not meet the recognition criteria identified by IAS 2 “Inventories”. The Accounts have been restated. Further detail is set out in Note 35.
The Committee was concerned by the need for restatements relating to 2014 identified above. The Committee notes the steps taken to strengthen the Group's finance function and also extend the scope of the Group's external auditor's involvement to other local markets including Australia, New Zealand and Hong Kong. Progress has been made, with certain control and process reviews initiated by Michael Connole (our CFO since his appointment in September 2015), and the extension of Deloitte's audit to these markets. The audit in 2016 has identified issues relating to Australia and the relevant restatements have been made. In 2016 further recruitment of senior finance personnel at Group and local markets has taken place. The Committee and executive management recognise the need for continuous improvement in this area and will be closely monitoring further progress in 2016.
EXTERNAL AUDIT
The Committee assesses the effectiveness of its external auditor through ongoing dialogue and communication with the Auditor. The audit cycle included formal meetings. The audit planning meeting, which happens prior to the audit, was when the Committee discussed reporting developments, significant accounting risks, the new requirements in relation to the viability statement and other Corporate Governance Code changes, improvement in relation to risk management and internal control and controls in the accounting process.
At the end of the audit process, the Committee met with the auditors to receive their report on the key findings with focus on identified key audit risks, any misstatements in management’s initial accounts and to consider areas of judgement and estimates.
The Auditor showed diligence and openness with the Committee during meetings and through written communication and during intermediate briefing sessions with the Chair of the Audit Committee. The Auditor gave the Committee forthright views on judgement areas whilst recognising that the decisions lay with the Committee. The Committee also received feedback from the Executive Directors involved with the audit. The Committee is satisfied with the Auditor’s effectiveness.
APPOINTMENT AND INDEPENDENCE
Deloitte was appointed the Group’s auditor in December 2014 and as auditor to the UK and US subsidiaries. Deloitte member firms were also appointed auditor of the Australian, Hong Kong and New Zealand subsidiaries in 2015. The Committee considers the appointment of the external auditor each year and considers the performance of the lead audit partner and the audit manager during the audit process. A tender process for the Company's audit was last completed in early 2014. There are no restrictions on the Committee’s choice of external auditor.
For the 2015 audit of the Group and the Company’s accounts, Deloitte was paid £266,600 (2014: £147,500).

45
DEAR SHAREHOLDER
I am pleased to present the Directors' Remuneration Report for the year ended 31 December 2015, which has been prepared by the Remuneration Committee (“the Committee”) and approved by the Board.
This is the Company’s third year of reporting in line with The Large and Medium-sized Companies and Groups (Accounts and Reports) (Amendment) Regulations 2013. The report is divided into two sections:
The first is the Policy Report which was approved by shareholders at the AGM on 22 May 2014 and which outlines the Group’s Remuneration Policy applying from 23 May 2014.
Whilst the Remuneration Policy is unchanged, for clarity we have updated the charts illustrating the application of the remuneration policy to reflect the latest salaries and changes to Directors where appropriate.
The second section is the Annual Report on Remuneration, which reviews how the policy was implemented. Mindful of the length of remuneration reports, we have aimed to be concise without compromising on transparency. I hope you find the Remuneration Report clear and easy to understand and we would welcome any feedback or comments.
Mike Hartley Chairman of the Remuneration Committee March 30, 2016
REMUNERATION COMMITTEE REPORT
NON-AUDIT SERVICES
Deloitte provided agreed upon procedures in respect of the interim financial statements at a fee of £5,000 (2014: $nil).
INTERNAL AUDIT
The Committee reviews the appropriateness of having an internal audit function. To date there has not been a separate internal audit function, given the size and scale of the Group's operations. However, in 2015, the Committee planned to implement a greater formalisation of the internal review of a set
list of required internal control tasks with reports on these items coming to the Committee for review. This was not achieved, partly due to a change in the Group CFO role. The new Group CFO has committed that this will be achieved in 2016.
Mike Hartley Chairman of the Audit Committee March 30, 2016

46 DIRECTORS' REMUNERATION REPORT
In line with The Large and Medium-sized Companies and Group’s (Accounts and Reports) (Amendment) Regulations 2013 the following parts of the Annual Report on Remuneration are audited: the single total figure of remuneration for each director, including annual bonus outcomes for the financial year ended December 31, 2015; pension entitlements; payments to past directors and payments for loss of office; and, directors’ shareholdings and share interests. All other parts of the Directors’ Remuneration Report are unaudited.
POLICY REPORT
This section provides Quarto’s remuneration policy for Directors, which has been applied from May 23, 2014, following approval at the 2014 Annual Meeting. The Group’s principal remuneration policy aim is to ensure that the Executive Directors' remuneration is designed to promote the long-term success of the Company.
Performance related elements are designed to be transparent, stretching and are rigorously applied.
In formulating its policies the Committee had regard to and balanced the following factors:
a) the need to align the interests of the executive with those of the shareholders;
b) the performance of the individual executive and of the Group as a whole;
c) the remuneration practice in the markets in which the executive is principally based; and,
d) the remuneration packages offered to executives in companies competing in the same markets and industry as the Group, but exercising caution, in view of the risk of an upward ratchet of remuneration levels with no corresponding improvement in corporate and individual performance.
SUMMARY OF QUARTO’S REMUNERATION POLICY APPLYING FROM MAY 23, 2014
The elements of the remuneration policy for Directors are set out below. The changes to the annual and medium- term bonus schemes were implemented from 2014. The Performance Share Plan (“PSP”) was implemented following approval at the 2014 Annual Meeting.
FIXED PAY – BASE SALARY / FEES
Purpose and link to strategy
Set at competitive levels in the markets in which Quarto operates, in order to attract and retain executives.
Operation Reviewed annually with changes normally effective from 1 January of each year. Reviews take account of:
• scope of the role and the markets in which Quarto operates;
• performance and experience of the individual;
• pay levels at organisations of a similar size and complexity; and,
• pay and conditions elsewhere in the Group.
Opportunity There is no prescribed maximum to avoid setting unhelpful expectations. Any salary increases are applied in line with the outcome of the review and taking into account wider factors, for example, local market inflation.
Performance metrics
Not applicable

47
Fixed pay – Benefits
Purpose and link to strategy
Designed to be competitive in the market in which the individual is employed.
Operation Benefits include life insurance and private medical insurance. Where appropriate, other benefits may be offered including, but not limited to, participation in all-employee share schemes.
Benefits are non-pensionable.
Opportunity Benefits vary by role and individual circumstance and eligibility is reviewed periodically.
Benefits are not anticipated to exceed 5% of salary p.a. over the period for which this policy applies.
The Committee retains the discretion to approve a higher cost in exceptional circumstances (e.g. relocation) or in circumstances where factors outside of the Group’s control have materially changed (e.g. increases in medical premiums).
Performance metrics
Not applicable
Fixed pay – Pension
Purpose and link to strategy
To provide cost effective retirement benefits.
Operation Participation in defined contribution plan or cash allowance in lieu.
Opportunity Up to 15% of base salary.
Performance metrics
Not applicable
Variable pay – Annual performance bonus
Purpose and link to strategy
Designed to reinforce individual performance and contribution to the achievement of profit growth and strategic objectives.
Operation Measures are reviewed prior to the start of the financial year to ensure they remain appropriate and reinforce the business strategy, and performance targets are set annually to ensure they are appropriately stretching and reflect those strategic objectives. At the end of the year the Committee determines the extent to which these were achieved.
Awards are payable in cash.
Payments made under the annual bonus are subject to claw-back for the later of one year following the date of award or the completion of the next audit of the Group’s accounts, in the event of a fraud or material misstatement of results being identified in relation to the year in which the bonus is earned.

48
Opportunity Maximum potential opportunity of up to 60% of base salary.
Typically, 10% of potential is achieved for Threshold performance of the financial goals and 100% for Stretching performance.
Performance metrics
At least half of the annual bonus is based on financial objectives with the balance on personal objectives.
The Committee will vary the weightings from year-to-year to reflect the changing strategic needs for the business with a default bias towards financial objectives.
In exceptional circumstances, the Committee has the ability to exercise discretion to override the formulaic bonus outcome within the limits of the Plan where it believes the outcome is not truly reflective of performance and to ensure fairness to both shareholders and participants.
Variable pay – Medium-term performance bonus
Purpose and link to strategy
Designed to reinforce the achievement of continuous profit growth over a longer time frame and aid staff retention.
Operation Measures are reviewed prior to the start of each 3 year period to ensure they remain appropriate and to ensure they are appropriately stretching. At the end of the 3 year period the Committee determines the extent to which these were achieved.
Awards are payable in cash.
Payments made under the medium-term bonus are subject to claw-back for the later of one year following the date of award or the completion of the next audit of the Group’s accounts, in the event of a fraud or material misstatement of results being identified in relation to the year in which the bonus is earned.
Opportunity Maximum potential opportunity of up to 120% of base salary for the three year period.
Typically, 10% of potential is achieved for achieving Threshold performance and 100% for Stretching performance.
Performance metrics
The medium-term bonus is based entirely on cumulative increases in earnings and is only paid at the end of the 3 year period based on the cumulative result.
In exceptional circumstances, the Committee has the ability to exercise discretion to override the formulaic bonus outcome within the limits of the Plan where it believes the outcome is not truly reflective of performance and to ensure fairness to both shareholders and participants.
Variable pay – Performance Share Plan (PSP)
Purpose and link to strategy
Ensures that the Executive’s interests are aligned with those of shareholders through reward for providing shareholders with substantial increases in shareholder value by June 30, 2016 and/or for achievement of a measure of sustained growth in earnings over the medium to long term.
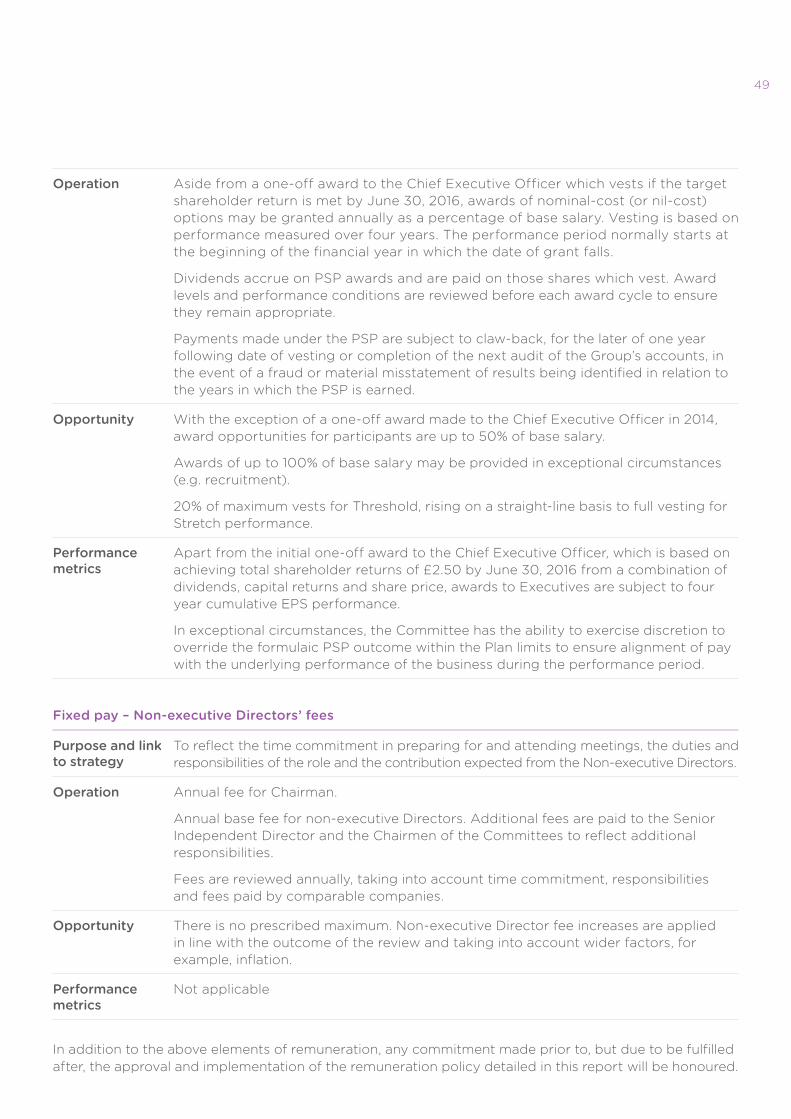
49
Operation Aside from a one-off award to the Chief Executive Officer which vests if the target shareholder return is met by June 30, 2016, awards of nominal-cost (or nil-cost) options may be granted annually as a percentage of base salary. Vesting is based on performance measured over four years. The performance period normally starts at the beginning of the financial year in which the date of grant falls.
Dividends accrue on PSP awards and are paid on those shares which vest. Award levels and performance conditions are reviewed before each award cycle to ensure they remain appropriate.
Payments made under the PSP are subject to claw-back, for the later of one year following date of vesting or completion of the next audit of the Group’s accounts, in the event of a fraud or material misstatement of results being identified in relation to the years in which the PSP is earned.
Opportunity With the exception of a one-off award made to the Chief Executive Officer in 2014, award opportunities for participants are up to 50% of base salary.
Awards of up to 100% of base salary may be provided in exceptional circumstances (e.g. recruitment).
20% of maximum vests for Threshold, rising on a straight-line basis to full vesting for Stretch performance.
Performance metrics
Apart from the initial one-off award to the Chief Executive Officer, which is based on achieving total shareholder returns of £2.50 by June 30, 2016 from a combination of dividends, capital returns and share price, awards to Executives are subject to four year cumulative EPS performance.
In exceptional circumstances, the Committee has the ability to exercise discretion to override the formulaic PSP outcome within the Plan limits to ensure alignment of pay with the underlying performance of the business during the performance period.
Fixed pay – Non-executive Directors’ fees
Purpose and link to strategy
To reflect the time commitment in preparing for and attending meetings, the duties and responsibilities of the role and the contribution expected from the Non-executive Directors.
Operation Annual fee for Chairman.
Annual base fee for non-executive Directors. Additional fees are paid to the Senior Independent Director and the Chairmen of the Committees to reflect additional responsibilities.
Fees are reviewed annually, taking into account time commitment, responsibilities and fees paid by comparable companies.
Opportunity There is no prescribed maximum. Non-executive Director fee increases are applied in line with the outcome of the review and taking into account wider factors, for example, inflation.
Performance metrics
Not applicable
In addition to the above elements of remuneration, any commitment made prior to, but due to be fulfilled after, the approval and implementation of the remuneration policy detailed in this report will be honoured.
50
PERFORMANCE MEASURE SELECTION AND APPROACH TO TARGET SETTING
The measures used under the annual bonus plan are selected annually to reflect the Group’s key strategic priorities for the year and reinforce financial performance and achievement of annual objectives as well as individual performance. Financial measures include, but may not be limited to, profit after tax.
The Committee considers that profit after tax adjusted for any exceptional items is the most appropriate measure of long-term performance of the Group. It is well-aligned with shareholder interests, provides clear visibility and the scheme is simple.
Performance targets are set at such a level as to be stretching and achievable, with regard to the particular strategic priorities and economic environment. The annual bonus Threshold is based on a 3% growth in profits with Stretch target being 10% growth. The same basis is used for the medium-term bonus where the targets compound annually.
The Committee reviews the performance targets applying to awards made to the proposed PSP scheme annually. Awards made to participants will be based on either one or a combination of total shareholder return and cumulative earnings per share over the measured period. These will be reported on each year in the Annual Report on Remuneration.
DIFFERENCES IN REMUNERATION POLICY OPERATED FOR OTHER EMPLOYEES
Quarto’s approach to annual salary reviews is consistent across the Group. Key management personnel and senior managers with substantial operational responsibilities are eligible to participate in an annual and, in certain cases, the medium-term bonus scheme with similar metrics to those used for the Chief Executive Officer. Opportunities and specific performance conditions vary by organisational level with business area-specific metrics incorporated where appropriate.
Key management personnel and senior managers are eligible to participate in the PSP. Performance conditions are consistent for all these participants, while award opportunities may vary by organisational level but are typically limited to 50% of base salary.
SHAREHOLDING GUIDELINES
The Committee recognises the importance of aligning the interests of Executives with shareholders through the building up of a significant shareholding in the Group. Save for the initial award made to Marcus Leaver in May 2014, Executive Directors are required to retain shares of a value equal to 50% of the after-tax gain made on the vesting of awards under the Plans, until they have built up a minimum shareholding of a value equivalent to at least 100% of annual base salary.

51
REMUNERATION POLICY FOR NEW DIRECTORS
When hiring or appointing a new executive director, including by way of internal promotion, the Committee may make use of all the existing components of remuneration as follows:
Component Approach Maximum value
Base salary Determined in line with the stated policy, and taking into account their previous salary. Initial salaries may be set below market and consideration given to phasing any increases over two or three years subject to development in the role.
Not applicable
Benefits In line with the stated policy. Not applicable
Pension In line with the stated policy. Not applicable
Annual bonus In line with stated policy, with the relevant maximum pro-rated to reflect the proportion of the year served.
60% of base salary
Medium-term bonus
In line with stated policy, with the relevant maximum pro-rated to reflect the proportion of the year served.
120% of base salary over 3 years
PSP In line with the stated policy. 100% of base salary (200% in exceptional circumstances)
In determining appropriate remuneration for a new executive, the Committee will take into consideration all relevant factors (including quantum, nature of remuneration and the jurisdiction from which the candidate was recruited) to ensure that arrangements are in the best interests of both The Quarto Group and its shareholders. The Committee may consider it appropriate to grant an award under a structure not included in the policy, for example to ‘buy out’ incentive arrangements forfeited on leaving a previous employer, and will exercise the discretion available under Listing Rule 9.4.2 R where necessary. In doing so, the Committee will
consider relevant factors including the expected value of all outstanding equity awards using a Monte Carlo, Black-Scholes, or other relevant equivalent valuation and, where applicable, taking into account toughness of performance conditions attached to these awards and the likelihood of those conditions being met.
In cases of appointing a new Executive Director by way of internal promotion, the Group will honour any contractual commitments made prior to their promotion to Executive Director.
In cases of appointing a new non-executive Director, the approach will be consistent with the policy.

52
SERVICE CONTRACTS AND EXIT PAYMENTS POLICY
Non-executive Directors are engaged on the basis of a letter of appointment. In line with the UK Corporate Governance Code, all Directors are subject to re-election annually at the Annual Meeting. The Chairman had an initial 3 year contract, subject to re-election each year and the non-executive Directors have a one month notice period. The Chairman’s contract was renewed in January 2016 to run until his retirement at the 2016 Annual Meeting. The non-executive Director Letters of Appointment are available to view at the Group’s registered office and the effective dates of their Letters of Appointment are as follows:
Director Date of Appointment Appointment Letter Notice period
Tim Chadwick November 7, 2012 January 25, 2016 Contract terminates coincident with the 2016 AGM
Jessica Burley May 22, 2014 January 17, 2014 1 month
Michael Hartley August 6, 2013 August 22, 2013 1 month
Christopher Mills October 15, 2014 October 22, 2014 1 month
Bob Morley August 6, 2013 August 6, 2013 None1
1 Bob Morley’s contract provides ongoing employment, without limit, whilst he meets certain conditions, including, but not limited to, him not selling or otherwise disposing of his shares in the Company in a manner that qualifies for Entrepreneur’s Relief. This contract precedes his re-appointment to the Board.
Executive Director service contracts have no fixed term and, save for Bob Morley, have a notice period of not more than 12 months from either the Executive or the Group. Save for Bob Morley, these notice periods meet best practice guidelines and give protection, mutually, to the Group and the Executive. Executive Director service contracts are available to view at the Group’s registered office. The dates of the Executive Director service contracts and the relevant notice period are as follows:
Director Effective date of contract Notice period
Marcus Leaver April 30, 2012 12 months
Michael Connole September 1, 2015 12 months
The Committee’s policy is to limit severance payments on termination to pre-established contractual arrangements and the rules of the relevant incentive plans. In doing so, the Committee’s objective is to avoid rewarding poor performance. Furthermore, the Committee will take account of the Executive Director’s duty to mitigate their loss.
Termination payments are limited to base salary and benefits during the unexpired notice period which cannot be mitigated.

53
In addition to the contractual provisions regarding payment on termination set out above, the Group’s incentive plans and share schemes contain provisions for termination of employment.
Component Bad leaver Good leaver Change-of-control
Annual bonus No annual bonus payable
Eligible for an award to the extent that performance conditions have been satisfied and pro-rated for the proportion of the financial year served, with Committee discretion to treat otherwise
Eligible for an award to the extent that performance conditions have been satisfied up to the change of control and pro-rated for the proportion of the financial year served, with Committee discretion to treat otherwise
Medium-term bonus
No annual bonus payable
Eligible for an award to the extent that performance conditions have been satisfied and pro-rated for the proportion of the three financial years served, with Committee discretion to treat otherwise
Eligible for an award to the extent that performance conditions have been satisfied up to the change of control and pro-rated for the proportion of the three financial years served, with Committee discretion to treat otherwise
PSP Outstanding awards are forfeited
Outstanding awards will normally continue and be tested for performance over the full period, and pro-rated for time based on the proportion of the period served, with Committee discretion to treat otherwise
Outstanding awards will normally vest and be tested for performance over the period to change-of-control, and pro-rated for time based on the proportion of the period served, with Committee discretion to treat otherwise
Any commitment made prior to, but due to be fulfilled after the policy comes into force, will be honoured.
An individual would normally be considered a good leaver if they leave for reasons of death, injury, ill-health, disability, redundancy, part of the business in which the individual is employed or engaged ceasing to be a member of the Group, circumstances that are considered by the Committee to be retirement, or any other reason as the Committee decides. Bad leaver provisions apply under other circumstances.
EXTERNAL APPOINTMENTS
The Executive Directors may accept external appointments with the prior approval of the Board and provided only that such appointments do not prejudice the individual’s ability to fulfil their duties at the Group. Whether any related fees are retained by the individual or remitted to the Group will be considered on a case-by-case basis.
ILLUSTRATION OF THE APPLICATION OF THE REMUNERATION POLICY
The chart on page 54 shows the remuneration that the Executive Directors could be expected to obtain based on varying performance scenarios. Illustrations are intended to provide further information to shareholders regarding the relationship between pay and performance.
Potential reward opportunities illustrated are based on the policies applying from May 23, 2014, applied to the latest known fixed pay of base salaries, pension, other benefits and variable pay of annual bonus, medium term bonus and PSP. To better illustrate the annual potential remuneration, the medium-term bonus potential and PSP Awards are pro-rated to an annual equivalent.

54
Minimum Maximum
Marcus Leaver Michael Connole
MaximumPerforming in line with expectations
Performing in line with expectations
Minimum0
300
600
900
1200
1500
421
996
1,247
278
338435
100% 82%
4%
64%
8%
100% 42%
9%6%
34%
37%
43%
12%
17%
14% 28%
* Does not include commissions which may become due (refer to Annual Report on Remuneration) ** Remuneration is contracted in sterling
Assumptions underlying each element of pay are provided in the below table:
Component ‘Minimum’ ‘Maximum’
Fix
ed
Base salary Latest known salary
Pension Contribution rate applied to latest known salary
Other benefits Benefits as provided in the single figure table on page 56
Annual bonus No bonus payable Maximum bonus
Medium-term bonus* No bonus payable Maximum bonus
PSP Vesting* None Vesting Full vesting
* The maximum medium term bonus and the PSP vesting has been pro-rated over three years
Fixed remuneration Annual variable remuneration Medium-term variable remuneration PSP
CONSIDERATION OF CONDITIONS ELSEWHERE IN THE GROUP
When reviewing and setting executive remuneration, the Committee takes into account the pay and employment conditions of all employees of the Group. The Group-wide pay review budget is one of the key factors when reviewing the salaries of the Executive Directors.
Although the Group has not carried out a formal employee consultation regarding Board remuneration, it does comply with local regulations and practices regarding employee consultation more broadly.
CONSIDERATION OF SHAREHOLDER VIEWS
It is the Committee’s policy to consult with major shareholders or their chosen shareholder representative body prior to any changes to its Executive Director remuneration structure.
Mike Hartley Chairman of the Remuneration Committee March 30, 2016

55ANNUAL REPORT ON REMUNERATION
THE REMUNERATION COMMITTEE (“THE COMMITTEE”)
The current members of the Committee are the Group’s non-executive Directors, Michael Hartley (Chairman), Jessica Burley, Tim Chadwick, and Christopher Mills. They served throughout the year.
The Committee met five times during the year. Further details of attendance of non-executive Directors at Remuneration Committee meetings can be found in the Corporate Governance Report on page 39. The CEO and the Director of People attended parts of certain meetings to make presentations and answer questions.
No individual was present when their own remuneration was being discussed. The Remuneration Committee’s Terms of Reference are available on the Group’s website.
The Committee is responsible for:
• Recommending to the Board the remuneration and terms and conditions of employment of the Chairman (who absents himself from discussions regarding his own remuneration), Executive Directors and key members of senior management;
• Measuring subsequent performance as a prelude to determining the Executive Directors’ and key managers’ total remuneration on behalf of the whole Board;
• Determining the structure and quantum of short-term and medium-term bonus schemes; and,
• Granting awards under the PSP Share Award Scheme.
The main issues discussed and/or approved during the financial year under review:
• Approval of the prior year Directors’ Remuneration Report;
• Annual review of the Executive Directors’ salaries and benefits;
• Review of the Executive Directors’ and the senior managers’ performance under the prior year’s annual bonus scheme, including a review of their performance against their personal objectives and approval of the bonus awards;
• Review of the design and targets for the forthcoming annual bonus scheme, including personal objectives;
• Approval of awards made in the year under the Performance Share Plan; and
• Approval of terms for new senior management appointments falling within the remit of the Committee.
ADVISERS
The Committee has not paid fees to any advisers during the financial year.
STATEMENT OF SHAREHOLDER VOTING AT THE 2015 ANNUAL MEETING
The following table shows the results of the advisory vote on the 2014 Annual Remuneration Report at the Annual Meeting on May 12, 2015.
Total number of votes % of votes cast
For (including discretionary) 9,452,804 75.7%
Against 3,027,938 24.3%
Total votes cast* 12,480,742 100%
* Representing 63.4% of the total voting shares

56
The following table shows the results of the vote on the proposal to amend the conditions relating to the Chairman's bonus at the Annual Meeting on May 12, 2015.
Total number of votes % of votes cast
For (including discretionary) 7,505,472 60.2%
Against 4,957,270 39.8%
Total votes cast* 12,462,742 100%
* Representing 65.4% of the total voting shares
SINGLE TOTAL FIGURE OF REMUNERATION (AUDITED)
The table below sets out a single figure for the total remuneration received by each Director for the year ended December 31, 2015 and the prior year. These amounts are shown in the reporting currency, although set in sterling. The exchange rates used in 2015 and 2014 were 1.53 and 1.65, respectively.
Base Salary Benefits1 Pension Annual Bonus2Long-term incentives3
Total remuneration
Executive Directors2015 $000
2014 $000
2015 $000
2014 $000
2015 $000
2014 $000
2015 $000
2014 $000
2015 $000
2014 $000
2015 $000
2014 $000
Marcus Leaver 536 577 8 9 80 87 305 169 – – 929 842
Michael Connole* 122 – 2 – 18 – 59 – – – 201 –
Mick Mousley* 260 422 9 13 38 63 78 60 – – 385 558
Robert Morley*5 258 349 21 22 – – – – – – 279 371
* For period for which he was a Director.
Fees4 Benefits Pension Annual BonusLong-term incentives3
Total remuneration
Non-executive Directors
2015 $000
2014 $000
2015 $000
2014 $000
2015 $000
2014 $000
2015 $000
2014 $000
2015 $000
2014 $000
2015 $000
2014 $000
Tim Chadwick 153 165 – – – – – – – – 153 165
Peter Campbell – – – – – – – – – – – –
Mike Hartley 69 71 – – – – – – – – 69 71
Edward Krawitt – 23 – – – – – – – – – 23
Max Lesser – 41 – – – – – – – – – 41
Peter Waine – – – – – – – – – – – –
Jess Burley 54 35 – – – – – – – – 54 35
Christopher Mills 54 12 – – – – – – – – 54 12
1 Benefits comprise private medical insurance contributions. 2 Annual bonus for performance over the relevant financial year. Further details of performance criteria, achievement,
and resulting awards can be found on page 58. 3 Further details of Long-term incentives can be found on page 59. The columns above are zero as no medium or long term
incentive schemes ended during 2014 or 2015. 4 Further details of non-executive Director fees can be found on page 60. 5 Total payments to Robert Morley include payments in lieu of his previous contract notice period is £165,385 paid in equal
amounts split across 2014 and 2015.
There has been no withholding, clawback or deferral of remuneration during the period.

57
EXECUTIVE DIRECTOR BASE SALARIES/FEES
During the year, Marcus Leaver, the Chief Executive Officer, received £350,000 in salary. His salary has been increased by 3.25% to £361,375 for 2016. This was set in line with the typical increase across the good performing UK employee population. The next salary review date will be January 1, 2017.
Mick Mousley resigned as Director on 31 August 2015. He will continue to be an employee and be paid his salary of £255,000 per annum until May 25, 2016, together with contributions to his personal pension and private health insurance, whilst providing whatever assistance is required to his successor.
During the year, Michael Connole, the newly appointed Chief Financial Officer, was paid £80,000 in salary. His salary has been set at £240,000 in line with his contract on appointment.
During the year, Bob Morley, the Deputy Chairman, received £86,000 in salary and a lump sum of £82,692, in relation to the second part payment of notice in lieu of the termination of his former
contract. From January 1, 2016 his salary has been set at £50,000 to reflect his reduced responsibilities and time commitments. He is also entitled to a commission of 37.5% of gross profit generated on projects that he creates for the Children's Design Eye imprint, from 2014.
PENSION AND OTHER BENEFITS
The Group makes a contribution to the personal pension schemes of Marcus Leaver, Mick Morsley and Michael Connole equal to 15% of their base salary which may, at their discretion, be taken as cash in line with the policy. Benefits are in line with the policy.
ANNUAL PERFORMANCE BONUS
2015 bonus framework
For the 2015 financial year, the maximum annual bonus opportunity was 60% of salary for Marcus Leaver and 20% for Mick Mousley. Michael Connole was appointed on 1 September 2015. His appointment letter provides for a maximum annual bonus entitlement of 50% of salary.
DIRECTORS’ INTERESTS
The share interests of the Directors who held office at December 31, 2015 and of their connected persons in the share capital of the Company are shown below:
Number of share options of common stock
Number of US$0.10 shares of common stock
Shareholding December 31, 20151 December 31, 20141 December 31, 20151 December 31, 20141
T. Chadwick – – – –
R. J. Morley – – 1,402,852 1,402,852
M. E. Leaver 750,398 666,666 14,000 14,000
M. D. Connole 60,000 – 10,000 –
J. Burley – – 3,300 3,300
M.G. Hartley – – 10,000 10,000
C.H.B. Mills – – 100,000 4,100,0002
1 or date of appointment 2 4,000,000 shares were held in the names of Oryx International Growth Fund and North Atlantic Smaller Companies
Investment Trust plc of which Christopher is a Director, and 100,000 shares are held by him personally.
During the year the market price of the shares of common stock ranged between 147p and 239p. The mid-market price at December 31, 2015 was 221p.
M.E. Leaver was granted a further award of 83,732 shares under the performance share plan, details of which are set out on page 59. On March 17, 2016, he acquired 4,562 shares at 272.34p per share.
M.D. Connole was granted an award of 60,000 shares under the performance share plan, details of which are set out on page 59.
R.J. Morley sold 1,022,228 shares at 264.0p per share on March 24, 2016.

58
The annual bonus opportunity was split between targeted growth in adjusted profit before tax and other financial and personal goals. Adjusted profit before tax represented 75% of total potential for Marcus Leaver, 50% for Mick Mousley and 85% for Michael Connole, with the balance being against personal objectives.
The adjusted group profit before tax target was based on the 2014 actual result, adjusted upwards to reflect the Ivy and Small World acquisitions giving a Threshold of $12.4m and a Stretch of $14.0m.
Adjusted profit before tax was $14.1m thus the Stretch target was exceeded and the Committee awarded maximum bonus to participants for this element.
Personal objectives for Marcus Leaver, Mick Mousley and Michael Connole were set by the Committee in discussion with the Chairman and CEO. The Committee reviewed and judged the level of achievement against the objectives at the end of the performance period.
Marcus Leaver’s personal objectives for 2015 were amended mid year to reflect changing Board priorities. His amended personal goal related to achievement of a net debt target, with a payment of zero for $61.9m and a full award for $58.9m. Year end net debt was $59.5m and he was awarded 80% of maximum for this element. Michael Connole's personal objectives mirrored the net debt target given to Marcus Leaver, and he was also awarded 80% of the maximum for this element.
Mick Mousley’s personal objectives related to negotiation of new debt facilities. Payout under this element of the bonus was assessed at 100%.
After taking account of their financial targets and personal goals bonus awards were:
% of maximum
Marcus Leaver £199,500 95%
Mick Mousley £51,000 100%
Michael Connole £38,800 97%
2016 annual bonus framework
For the financial year commencing January 1, 2016, the Executive Bonus Plan will operate in line with the approved remuneration policy, save for the measure being adjusted profit before tax (derivation of which is shown in note 32 on page 102) rather than profit after tax, adjusted as appropriate for exceptional items. The adjusted profit before tax measure is based on the 2015 actual result of $14.1m which will be adjusted as appropriate to reflect any acquisitions, disposals and any significant one-off exceptional items for Board initiatives outside management’s control, which do not qualify for inclusion in the Exceptional Item line in the Accounts.
Maximum annual bonus potential in 2016 for Marcus Leaver and Michael Connole is 60% and 50% respectively of which 75% and 85% respectively are based on adjusted group profit before tax.
For Marcus Leaver the remaining potential is split between certain deliverables in relation to acquisition planning and a sliding target based on net debt, adjusted for the effect of any Corporate activity, with zero being paid at $55.4m or below and maximum for $52.4m or above.
For Michael Connole the remaining potential is based on a split between certain deliverables in relation to the reorganisation of the finance team and the same net debt target as Marcus Leaver.
MEDIUM-TERM PERFORMANCE BONUS
2014-2016 medium-term bonus framework
This is the third and final year of the current medium term bonus scheme which is designed to motivate management to focus on continual profit improvement. The Committee recognises that profit development is not within an annual financial cycle. Rather, the publications (which are a substantial part of the Group’s businesses) are substantially created in the year before the sales are achieved. Thus within any one financial year, there is a limit to the influence of management on profits. These in-year influences are the marketing of the publications and cost control. Emphasis on a single year can motivate cost cutting of creative publishing resources to the detriment of the following year’s results. Thus the Committee has developed a mix of

59
annual and medium term performance goals. To most align these goals with shareholders, the targets are based on improving profits from the prior year/s as the Committee believes that ultimate shareholder value is most driven by a continual improvement in profits from which cash is generated for dividend growth.
The profit targets are based on a base year of 2013. The targets have been changed by the Committee to reflect the preferred measure of adjusted profit before tax in line with the Annual Bonus Awards. Base is the achieved adjusted profits before tax for 2013 adjusted upwards to account for a one-off gain in 2014 on interest charges from the effect of terminating an interest rate swap, in 2013. There has been no adjustment for major corporate actions, though the Committee may make such adjustments for items outside management’s control in the event of items determined to be material over the three-year period. As at the date of this Report, there have been no further adjustments. The target is based on compound increases over three years over the Base of $12.6m giving Threshold for a 9.3% increase at $13.6m and Stretch for a 33.1% increase at $16.6m. Payments are made at the end of the period based on the 2016 results.
Marcus Leaver has a maximum opportunity of 120% of salary, with 10% of maximum potential for Threshold and 100% for Stretch.
LONG-TERM INCENTIVES
PSP Awards
Subsequent to the approval by shareholders of the PSP Plan an initial award was made to CEO, Marcus Leaver with a grant of 666,666 shares (3.3% of share capital) which would vest on June 30, 2016 subject to a stretching performance condition of achieving an average share price of £2.50 over any consecutive 90 day period occurring before vesting date, adjusted for an agreed challenging minimum level of dividends and other cash distributions paid to shareholders from December 31, 2012. Following a change in Board strategy during 2015 to focus on building and developing the business in preference to cash distributions back to shareholders (save for a progressive dividend policy), the condition for a minimum level of cash returns to shareholders was removed by the Committee as being no longer appropriate. The target is now solely for achieving
an average share price (including dividends)of £2.50 over any consecutive 90 day period occurring before vesting date. Major shareholders have been consulted on this amendment.
On 24 September 2015, Marcus Leaver was granted 83,732 PSP Awards and Michael Connole 60,000. The face value of these awards was £175,000 and £125,400 respectively based on a closing price the day before of 209p. They represent 50.0% and 52.25% of salary respectively.
Half of these awards have a performance condition relating to cumulative Adjusted Diluted EPS performance for the four financial years 2015 to 2018 inclusive. The other half of these awards have a performance condition relating to total shareholder returns (“TSR”) from a combination of dividends, capital returns and share price growth (measured as an average over a 20 business day period leading up to grant and vesting as appropriate). The TSR period runs from September 24, 2015 to September 23, 2019.
Targets for EPS are annual compounded growth of 5% for Threshold to 10% for Stretch. Targets for total shareholder returns over the period are annual compounded growth of 7% for Threshold and 15% for Stretch.
The Committee believes the TSR directly measures shareholder returns and thereby aligns the goals of management and shareholders. However, TSR can be affected by a variety of investment factors, which are far removed from those which management can directly affect. The Committee believes that cumulative diluted EPS to be a good measure of managements’ long-term impact on the business and which over time translates into shareholder value. Thus a combination of TSR and EPS is believed to be suitable goals for the PSP Awards. Major shareholders have been consulted about adding the TSR condition.
Subject to shareholder consent at the 2016 AGM Marcus Leaver will be issued with a further 83,732 PSP Awards on the same vesting and performance conditions as those issued in September 2015. If approved, these will be treated as though they were issued in September 2015. Shareholder consent is required, as this award equates to 100% of salary in 2015, which exceeds approved Policy limits of 50%.
During 2016, it is envisaged that PSP Awards will be made to executive directors, key management personnel and certain senior managers with

60
2014
2015Total Employee Pay
(Excluding Ivy Press which was acquired during the year)
30.729.3
$m
2.6 2.9
Total Dividend
40
30
20
10
0
direct profit responsibility for business units or for major sales and marketing. The quantum has yet to be decided but will be restricted by the dilution limits. Performance measures are anticipated to be half EPS and half TSR both measured over a four year period.
OTHER LONG TERM INCENTIVES
On appointment to Chairman, Timothy Chadwick was awarded a potential bonus of £750,000 if, during the three year period commencing December 18, 2012, shareholders are able to sell their shares at a price of £2.50 or more, in the context of a general offer to acquire all the shares of the Company by a third party or by way of sale of shares in the market provided that the shares are traded on the market at a bid price of £2.50 or more for a continuous period of at least 6 months and during that period the shares are trading with sufficient liquidity to enable up to 15% of the shares to be sold in the market on a regular monthly basis at a bid price of at least £2.50 per share without the bid price falling as a consequence.
Following shareholder consent with a Special Resolution at the 2015 AGM, this bonus was reduced to £500,000 whilst extending the period for the award to end on 30 June 2016. As of the date of this report, with less than 6 months to run to 30 June 2016, it is clear that this bonus will not be achieved.
CHAIRMAN AND NON-EXECUTIVE DIRECTOR FEES
With effect from the date of the Annual Meeting in 2014, the non-executive Directors received an annual base fee of £35,000, with an additional annual fee for Audit and Remuneration Committee Chairs of £3,500 and the Senior Independent Director of £3,000.
The non-executive Directors’ fees for 2016 will remain unchanged and are therefore as follows: Jessica Burley £35,000, Michael Hartley £45,000 and Christopher Mills £35,000.
The Chairman's fee remains at a rate of £100,000 p.a. through to his retirement at the 2016 AGM. The Committee has determined that a more appropriate salary for the non-executive Chairman is £70,000 which will be the salary of the next Chairman on appointment.
RELATIVE IMPORTANCE OF SPEND ON PAY
The graph below shows Quarto’s distributions to shareholders and total employee pay expenditure for the financial years ended December 31, 2014 and December 31, 2015.
1 Total employee pay has been impacted by exchange rate movements.

61
REVIEW OF GROUP PERFORMANCE
The chart below compares the value of £100 invested in Quarto shares, including re-invested dividends, on December 31, 2010 compared to the equivalent investment in the FTSE Small Cap Index, over the last five financial years. The FTSE Small Cap Index has been chosen as it comprises companies of a broadly similar size to Quarto. The table below shows the single figure for the CEO over the same period.
2009 2010 2011 2012 2013 2014 2015
CEO single figure of remuneration including bonus ($000)
729 750 996 1,0201 870 842 929
Annual bonus awarded
$ amount ($000s) – 392 572 1212 233 169 305
% of maximum opportunity
– – – – 56.9% 33.5% 95.0%
PSP vesting
$ amount ($000s) – – – – – – –
% of maximum opportunity
– – – – – – –
1 The figure for 2012 is a combination of remuneration of Laurence Orbach, the previous CEO, and Marcus Leaver for the respective periods.
2 Discretionary
PERFORMANCE GRAPH
100
150
200
250
31 Dec 2009
Quarto Small cap
31 Dec2010
31 Dec2011
31 Dec2012
31 Dec2013
31 Dec2014
50
0
100
150
200
250
Quarto Small cap
31 Dec2015
31 Dec2010
31 Dec2011
31 Dec2012
31 Dec2013
31 Dec2014

62
CHANGE IN CEO REMUNERATION AND FOR EMPLOYEES AS A WHOLE
The table below shows the change in CEO annual cash remuneration, defined as salary, taxable benefits and annual bonus, compared to the average employees for 2014 to 2015.
CEOAverage for
other employees2
$ 000 2015 2014 % change % change
Salary1 536 577 -7.1% -7.4%
Taxable benefits1 8 9 – -5.4%
Annual variable 305 169 80.5% 28.5%
Total 849 755 12.5% -6.7%
1 There was no change to the CEO's salary and benefits. The change is due to exchange rate movements. 2 The salary of the other employees has been impacted by exchange rate movements
PAYMENTS TO PAST DIRECTORS AND PAYMENTS FOR LOSS OF OFFICE
There have been payments of $2,000, during 2015, to settle certain fees and costs relating to the Quarto Publishing PLC Pension Plan (a defined contribution scheme). Laurence Orbach and Bob Morley are the only remaining participants. There will be no further payments of any kind into this scheme. Laurence Orbach pro-rated benefit of such costs is $1,000. Bob Morley’s pro-rate benefit is shown under other income within the Director’s remuneration table on page 56.
DILUTION LIMITS
The Group has at all times complied with the dilution limits set out in the rules of its share plans (principally a limit of 10% in 10 years). In the 10 year period to December 31, 2015, awards made under the Group’s share schemes represented 4.0% (2014: 3.3%) of the Group’s issued share capital.
DIRECTORS’ SHAREHOLDING GUIDELINES AND SHARE SCHEME INTERESTS
To date there has been no requirement for Executive Directors to retain shares as there has been no vesting of share based incentives.
Mike Hartley Chairman of the Remuneration Committee March 30, 2016

63NOMINATIONS COMMITTEE REPORT
The members of the Nominations Committee are the Group’s non-executive Directors, Tim Chadwick (Committee Chairman), Michael Hartley, Jess Burley and Christopher Mills, and the Chief Executive Officer, Marcus Leaver. A copy of the Committee’s formal terms of reference can be found on the Company’s website. (www.quarto.com)
The search for Board candidates is conducted and appointments made, on merit, against objective criteria and with due regard to the benefits of diversity on the Board, including gender. External search consultants are engaged, as appropriate, and a formal and transparent process is followed. When dealing with the appointment of a successor to the Chairman, the senior independent non-executive Director will chair the Committee instead of the Chairman. All Directors are required to allocate sufficient time to discharge their responsibilities and new Directors receive a tailored induction on joining the Board. This includes presentations on the business, current strategy, shareholder expectations, and familiarisation with the Group's
operations worldwide. Guidance is also given on the duties, responsibilities and liabilities of a Director of a listed company and key Board policies and procedures.
The Committee met three times during the year and was active in the appointment of Quarto’s new Chief Financial Officer, Michael Connole, who joined the Board on 1 September 2015. Other activities included a review of the balance of skills and experience on the Board to consider if any changes were necessary, a review of the output from the annual Board evaluation process, and a review of the Company’s management structure and succession plans.
Tim Chadwick, Chairman of the Nominations Committee March 30, 2016

64 STATEMENT OF DIRECTORS’ RESPONSIBILITIES IN RESPECT OF THE DIRECTORS’ REPORT AND THE FINANCIAL STATEMENTS
The Directors are responsible for preparing the Directors’ Report, the Directors’ Remuneration Report and the financial statements in accordance with applicable law and regulations. The Company is incorporated in the State of Delaware, United States and is subject to the law of that state which places no requirement for annual reporting to shareholders upon the Directors. However, since the Company has a listing on the London Stock Exchange and a place of business in the UK, the Directors are required to prepare financial statements which comply with certain provisions which are contained within the Listing Rules of the UK Financial Conduct Authority (the Listing Rules) and UK company law for overseas companies.
The Company is an ‘overseas’ company within the meaning of the Companies Act 2006. The Directors have elected to prepare the Group financial statements in accordance with IFRSs as adopted by the EU, and the parent Company financial statements in accordance with applicable law and UK GAAP, including FRS102 "The Financial Reporting Standard applicable in the UK and Republic of Ireland".
The Directors have accepted responsibility for preparing Group financial statements as required by IFRSs as adopted by the EU which present fairly the financial position and the performance of the group. The Companies Act 2006 provides in relation to such financial statements that references in the relevant part of that Act to financial statements giving a true and fair view are references to their achieving a fair presentation.
The Directors have accepted responsibility for preparing parent Company financial statements which give a true and fair view of the state of affairs and profit or loss of the parent company.
In preparing the parent Company financial statements, the Directors are required to:
• select suitable accounting policies and then apply them consistently;
• make judgements and accounting estimates that are reasonable and prudent;
• state whether Financial Reporting Standard 102 'The Financial Reporting Standard applicable in the UK and Republic of Ireland' has been followed, subject to any material departures disclosed and explained in the financial statements; and
• prepare the financial statements on the going concern basis unless it is inappropriate to presume that the company will continue in business.
In preparing the Group financial statements, International Accounting Standard 1 requires that Directors:
• properly select and apply accounting policies;
• present information, including accounting policies, in a manner that provides relevant, reliable, comparable and understandable information;
• provide additional disclosures when compliance with the specific requirements in IFRSs are insufficient to enable users to understand the impact of particular transactions, other events and conditions on the entity's financial position and financial performance; and
• make an assessment of the company's ability to continue as a going concern.
The Directors are responsible for keeping adequate accounting records that are sufficient to show and explain the Company’s transactions and disclose with reasonable accuracy at any time the financial position of the Company and enable them to ensure that the financial statements and the Remuneration report comply with the Companies Act 2006 and Article 4 of the IAS Regulation. They are also responsible for safeguarding the assets of the Company and hence for taking reasonable steps for the prevention and detection of fraud and other irregularities.

65
The Directors confirm that:
• so far as each director is aware, there is no relevant audit information of which the Company’s auditor is unaware; and
• the Directors have taken all the steps that they ought to have taken as Directors in order to make themselves aware of any relevant audit information and to establish that the auditor is aware of that information.
The Directors are responsible for preparing the annual report in accordance with applicable law and regulations. Having taken advice from the Audit Committee, the Directors consider the annual report and the financial statements, taken as a whole, provides the information necessary to assess the Company’s performance, business model and strategy and is fair, balanced and understandable.
The Directors are responsible for the maintenance and integrity of the corporate and financial information included on the Company’s website. Legislation in the United Kingdom governing the preparation and dissemination of financial statements may differ from legislation in other jurisdictions.
We confirm to the best of our knowledge:
• the Group financial statements, prepared in accordance with IFRSs as adopted by the European Union, give a true and fair view of the assets, liabilities, financial position and profit or loss of the Group and the undertakings included in the consolidation taken as a whole;
• the Strategic Report includes a fair review of the development and performance of the business and the position of the Company and the undertakings included in the consolidation taken as a whole, together with a description of the principal risks and uncertainties that they face; and
• the annual report and financial statements, taken as a whole, are fair, balanced and understandable, and provide the information necessary for shareholders to assess the Company's position, performance, business model and strategy.
Clive Potterell, Secretary March 30, 2016

66
OPINION ON FINANCIAL STATEMENTS OF THE QUARTO GROUP INC.
In our opinion:
• The financial statements give a true and fair view of the state of the Group’s and of the parent Company’s affairs as at 31 December 2015 and of the Group profit for the year then ended;
• The Group financial statements have been properly prepared in accordance with International Financial Reporting Standards (IFRSs) as adopted by the European Union;
• The parent Company financial statements have been properly prepared in accordance with United Kingdom Generally Accepted Accounting Practice, including FRS 102 “The Financial Reporting Standard applicable in the UK and Republic of Ireland”; and
• The financial statements have been prepared in accordance with the provisions of the Companies Act 2006 which would have applied were the company incorporated in the United Kingdom.
The financial statements comprise the consolidated statement of comprehensive income, the consolidated balance sheet, the consolidated statement of changes in equity and the consolidated cash flow statement, and the related Notes 1 to 36, the parent company balance sheet, the parent company statement of changes in equity and the related notes to the parent company balance sheet 1 to 8. The financial reporting framework that has been applied in the preparation of the Group financial statements is applicable law and IFRSs as adopted by the European Union. The financial reporting framework that has been applied in the preparation of the parent company financial statements is applicable law and United Kingdom Accounting Standards (United Kingdom Generally Accepted Accounting Practice) including FRS 102 “The Financial Reporting Standard applicable in the UK and Republic of Ireland”.
GOING CONCERN AND THE DIRECTORS’ ASSESSMENT OF THE PRINCIPAL RISKS THAT WOULD THREATEN THE SOLVENCY OR LIQUIDITY OF THE GROUP
As required by the Listing Rules we have reviewed the Directors’ statement regarding the appropriateness of the going concern basis of accounting contained within note 1 to the financial statements and the Directors’ statement on the longer-term viability of the Group contained within the Financial Review on page 34.
We have nothing material to add or draw attention to in relation to:
• The Directors' confirmation on page 41 that they have carried out a robust assessment of the principal risks facing the Group, including those that would threaten its business model, future performance, solvency or liquidity;
• The disclosures on page 33 that describe those risks and explain how they are being managed or mitigated;
• The Directors’ statement in note 1 to the financial statements about whether they considered it appropriate to adopt the going concern basis of accounting in preparing them and their identification of any material uncertainties to the group’s ability to continue to do so over a period of at least twelve months from the date of approval of the financial statements;
• The Directors’ explanation on page 34 as to how they have assessed the prospects of the Group, over what period they have done so and why they consider that period to be appropriate, and their statement as to whether they have a reasonable expectation that the Group will be able to continue in operation and meet its liabilities as they fall due over the period of their assessment, including any related disclosures drawing attention to any necessary qualifications or assumptions.
We agreed with the Directors’ adoption of the going concern basis of accounting and we did not identify any such material uncertainties. However, because not all future events or conditions can be predicted, this statement is not a guarantee as to the Group’s ability to continue as a going concern.
INDEPENDENT AUDITOR’S REPORT

67
OUR ASSESSMENT OF RISKS OF MATERIAL MISSTATEMENT
The assessed risks of material misstatement described below are those that had the greatest effect on our audit strategy, the allocation of resources in the audit and directing the efforts of the engagement team:
INDEPENDENCE
We are required to comply with the Financial Reporting Council’s Ethical Standards for Auditors and we confirm that we are independent of the group and we have fulfilled our other ethical responsibilities in accordance with those standards. We also confirm we have not provided any of the prohibited non-audit services referred to in those standards.
Risk How the scope of our audit responded to the risk
Risk that the carrying value of goodwill ($40.1m) in the consolidated balance sheet exceeds the recoverable amount
The Group hold significant goodwill balances ($40.1m) arising from acquisitions of which the largest balance is the US CGU ($26.9m) as shown in Note 10 to the financial statements. The assessment of the carrying value of goodwill to ensure that the carrying value does not exceed the recoverable amount involves judgement in relation to identification of the appropriate cash generating units and forecasting future cash flows. It is sensitive to the growth rates and the discount rates applied to the future cash flows to estimate recoverable amount.
We tested management’s assumptions used in their impairment model for goodwill, specifically including the cash flow projections, discount rates and growth rates applied.
Our procedures included:
• Considering the identification of appropriate cash generating units;
• Assessing cash flow forecast projections and forecast growth rates with reference to historical trading performance and cash flow forecasting accuracy and external expectations of long term growth rates;
• Comparing the discount rate applied against a broad comparator group as well as involving our internal valuation specialists to review underlying calculations and assess the key components of the discount rate calculation;
• Considering the reasonableness of, and recalculating, the sensitivity assessment applied by management;
• Performing further independent sensitivity analysis on the impairment model; and
• Assessing the overall market capitalisation of the Group compared to the carrying value.
Risk that the carrying value of pre-publication costs ($59.4m) in the consolidated balance sheet exceeds the recoverable amount
The Group capitalises third party costs incurred and directly attributable costs in developing book titles prior to their publication. These costs are then amortised over a three year period which is the estimated economic life of a title. The assessment of the carrying value of these pre-publication costs to ensure that the carrying value does not exceed the recoverable amount, as described in Note 14, involves judgement in respect of the life of an imprint and its recoverability.
The audit procedures we performed in respect of this risk included:
• Analysing, on a sample basis, the historical level of sales following the date of publication;
• Evaluating a sample of sales, and their associated profit, in the current year against their respective pre-publication carrying value;
• Comparing the amortisation period applied to industry peers; and
• Analysing the overall sales profiles to evaluate the consistency of the amortisation period to the historical data.

68
The description of the above risks should be read in conjunction with the significant issues considered by the Audit Committee discussed on page 43. In 2014 we identified the assessment of going concern as a key audit risk. In 2015 the Group completed a re-financing and has committed facilities in place to April 2019, accordingly we do not identify this as a significant risk in the current year.
These matters were addressed in the context of our audit of the financial statements as a whole, and in forming our opinion thereon, and we do not provide a separate opinion on these matters.
OUR APPLICATION OF MATERIALITY
We define materiality as the magnitude of misstatement in the financial statements that makes it probable that the economic decisions of a reasonably knowledgeable person would be changed or influenced. We use materiality both in planning the scope of our audit work and in evaluating the results of our work.
We determined materiality for the group to be $697,000 (2014: $585,000), which is 5% (2014: 5%) of adjusted profit before tax plus amortisation, and 1% (2014: 1%) of equity. The adjusted profit before tax measure excludes those items identified as exceptional in the annual report (Note 4) and is consistent with the measures used by the Group for internal and external reporting requirements. This measure has been used to facilitate a better understanding of the trading performance of the Group as the Group policy for exceptional items is to include only non-trading items. The basis of determining materiality is consistent with our approach adopted in 2014.
We agreed with the Audit Committee we would report to the Committee all audit differences in excess of $13,900 (2014 $11,700) as well as differences below that threshold that, in our view, warranted reporting on qualitative grounds. We also report to the Audit Committee on disclosure matters that we identified when assessing the overall presentation of the financial statements.
Risk How the scope of our audit responded to the risk
Revenue recognition risk that the sales returns provision is inaccurate
The Group primarily generates revenue from publishing new titles and sales of back catalogues (see revenue recognition policy in note 1 to the financial statements). In certain business units customers have rights of return for a limited period and revenue is recorded net of a provision for these returns based on historical data. Management judgement is required when assessing the level of sales returns subsequent to the year-end to be provided for at the year-end. Key assumptions principally surround historical return experience when estimating future sale return levels against revenue recognised in the year.
To test the risk of material misstatement in respect of revenue recognition, our procedures included:
• Testing a sample of underlying returns data used to develop the sales return estimate for completeness and accuracy and challenging the appropriateness of the rate by reference to current and post year end sales return levels;
• Evaluating new title and / or seasonal sales and the potential impact on future sales returns estimates;
• Using analytical techniques to assess monthly returns by reference to historical trends; and
• Considering forecasting accuracy by comparing actual returns against accrual estimates.

69
AN OVERVIEW OF THE SCOPE OF OUR AUDIT
Our Group audit was scoped by obtaining an understanding of the Group and its environment, including group-wide controls, and assessing the risks of material misstatement at the Group level. Based on that assessment, we focused our Group audit scope primarily on the UK and US co-editions and publishing segments, operations in Australia, New Zealand and Hong Kong, and the Group corporate head office function. These locations were subject to full audit procedures and represent the principal business units and account for 98% of the Group’s net assets (2014: 92%), 99% of the Group’s revenue (2014: 97%) and 97% of the Group’ s profit before tax (2014: 82%). They were also selected to provide an appropriate basis for undertaking audit work to address the risks of material misstatement identified above. Our audit work at locations subject to full audit procedures was executed at levels of materiality applicable to each individual location which was lower than the Group materiality.
We carried out analytical procedures for operations in Switzerland and for the US holding company on an entity-only basis, neither of which were subject to audit, to confirm our planning assessment that there were no significant risks of material misstatement of the financial information of these entities.
At the parent entity level we also tested the consolidation process.
The Group audit team is following a programme of planned visits designed so that the Senior Statutory Auditor and/or a senior member of the Group audit team visit each of the locations where the group audit scope is focused. For 2015 the Senior Statutory Auditor again visited the United States, being the single most significant component outside of the United Kingdom and representing 40% of the Group’s revenue. In years when we do not visit a significant component we include the component audit team, including the component audit partner, in our team briefing, discuss the risk assessment, and review documentation of the findings from their work.
OPINION ON OTHER MATTERS PRESCRIBED BY OUR ENGAGEMENT LETTER
In our opinion:
• the part of Directors’ Remuneration Report to be audited has been properly prepared in accordance with the Companies Act 2006, were the requirements of the Act to apply to The Quarto Group Inc.; and
• the information given in the Strategic Report and the Directors’ Report for the financial year for which the financial statements are prepared is consistent with the financial statements.
MATTERS ON WHICH WE ARE REQUIRED TO REPORT BY EXCEPTION
Adequacy of explanations received and accounting records
Under our engagement letter, we are required to report to you if, in our opinion:
• We have not received all the information and explanations we require for our audit; or
• Adequate accounting records have not been kept by the parent company, or returns adequate for our audit have not been received from branches not visited by us; or
• The parent company financial statements are not in agreement with the accounting records and returns.
We have nothing to report in respect of these matters.
Directors’ remuneration
Under our engagement letter we are also required to report if in our opinion certain disclosures of directors’ remuneration have not been made or the part of the Directors’ Remuneration Report to be audited is not in agreement with the accounting records and returns. We have nothing to report arising from these matters.
Corporate Governance Statement
Under the Listing Rules we are also required to review part of the Corporate Governance Statement relating to the Company’s compliance with certain provisions of the UK Corporate Governance Code. We have nothing to report arising from our review.

70
Our duty to read other information in the Annual Report
Under International Standards on Auditing (UK and Ireland), we are required to report to you if, in our opinion, information in the annual report is:
• Materially inconsistent with the information in the audited financial statements; or
• Apparently materially incorrect based on, or materially inconsistent with, our knowledge of the group acquired in the course of performing our audit; or
• Otherwise misleading.
In particular, we are required to consider whether we have identified any inconsistencies between our knowledge acquired during the audit and the Directors’ statement that they consider the annual report is fair, balanced and understandable and whether the annual report appropriately discloses those matters that we communicated to the Audit Committee which we consider should have been disclosed. We confirm that we have not identified any such inconsistencies or misleading statements.
RESPECTIVE RESPONSIBILITIES OF DIRECTORS AND AUDITOR
As explained more fully in the Directors’ Responsibilities Statement, the Directors are responsible for the preparation of the financial statements and for being satisfied that they give a true and fair view. Our responsibility is to audit and express an opinion on the financial statements in accordance with applicable law and International Standards on Auditing (UK and Ireland). We also comply with International Standard on Quality Control 1 (UK and Ireland). Our audit methodology and tools aim to ensure that our quality control procedures are effective, understood and applied. Our quality controls and systems include our dedicated professional standards review team and independent partner reviews.
This report is made solely to the company’s members, as a body, in accordance with our engagement letter. Our audit work has been undertaken so that we might state to the company’s members those matters we are required to state to them in an auditor’s report and for no other purpose. To the fullest extent permitted by law, we do not accept or assume responsibility to anyone other than the company and the company’s members as a body, for our audit work, for this report, or for the opinions we have formed.
SCOPE OF THE AUDIT OF THE FINANCIAL STATEMENTS
An audit involves obtaining evidence about the amounts and disclosures in the financial statements sufficient to give reasonable assurance that the financial statements are free from material misstatement, whether caused by fraud or error. This includes an assessment of: whether the accounting policies are appropriate to the Group’s and the parent Company’s circumstances and have been consistently applied and adequately disclosed; the reasonableness of significant accounting estimates made by the Directors; and the overall presentation of the financial statements. In addition, we read all the financial and non-financial information in the annual report to identify material inconsistencies with the audited financial statements and to identify any information that is apparently materially incorrect based on, or materially inconsistent with, the knowledge acquired by us in the course of performing the audit. If we become aware of any apparent material misstatements or inconsistencies we consider the implications for our report.
Deloitte LLP Chartered Accountants and Statutory Auditor LondonMarch 30, 2016

71CONSOLIDATED STATEMENT OF COMPREHENSIVE INCOME FOR THE YEAR ENDED DECEMBER 31, 2015
Notes
2015 $000
2014 $000
Restated* Continuing operations Revenue 2 182,165 171,339Cost of sales (122,803) (116,326)
Gross profit 59,362 55,013Other operating income – 22Distribution costs (7,196) (6,747)Administrative expenses (34,960) (32,369)
Operating profit before amortisation of acquired intangibles and exceptional items
17,206
15,919
Amortisation of acquired intangibles (724) (503)Exceptional items 4 (445) 566
Operating profit 4 16,037 15,982Finance income 6 142 151Finance costs 7 (3,240) (4,128)
Profit before tax 12,939 12,005Tax 8 (3,685) (2,922)
Profit for the year 9,254 9,083
Other comprehensive income which may be reclassified to profit or lossForeign exchange translation differences (2,467) (1,936)Cash flow hedge: losses arising during the year (64) (46)Cash flow hedge: reclassification adjustment for net income recognised directly in equity 68 463
Tax relating to items that may be reclassified to profit or loss (14) (100)(2,477) (1,619)
Total comprehensive income for the year 6,777 7,464
Profit for the year attributable to:Owners of the parent 8,866 8,773Non-controlling interests 388 310
9,254 9,083
Total comprehensive income for the year attributable to:Owners of the parent 6,403 7,160Non-controlling interests 374 304
6,777 7,464
Earnings per shareBasic 9 45.0c 44.5cDiluted 9 44.9c 44.5c
* Restated as set out in Note 1 and 35.

72 CONSOLIDATED BALANCE SHEET AT DECEMBER 31, 2015
Notes
2015$000
2014$000
Restated*
2013$000
Restated* Non-current assetsGoodwill 10 40,112 41,069 41,367Other intangible assets 11 1,510 956 991Property, plant and equipment 12 3,368 2,731 3,752Intangible assets: Pre-publication costs 14 59,443 57,534 56,221Deferred tax assets 20 – 126 33Total non-current assets 104,433 102,416 102,364
Current assetsInventories 15 26,147 24,851 19,679Trade and other receivables 16 57,145 51,740 54,349Derivative financial instruments 19 18 – –Cash and cash equivalents 17 25,059 23,110 23,879Total current assets 108,369 99,701 97,907
Total assets 212,802 202,117 200,271
Current liabilitiesShort term borrowings 22 (5,000) (89,150) (16,603)Derivative financial instruments 19 (10) (67) (427)Trade and other payables 23 (63,076) (53,271) (52,784)Tax payable (2,549) (2,430) (671)Total current liabilities (70,635) (144,918) (70,485)
Non-current liabilitiesMedium and long term borrowings 18 (79,562) – (78,291)Deferred tax liabilities 20 (7,466) (5,927) (5,485)Other payables (99) (537) –Total non-current liabilities (87,127) (6,464) (83,776)
Total liabilities (157,762) (151,382) (154,261)
Net assets 55,040 50,735 46,010
EquityShare capital 24 2,045 2,045 2,045Paid in surplus 33,764 33,764 33,764Retained profit and other reserves 25 14,072 9,985 5,392
Equity attributable to owners of the parent 49,881 45,794 41,201
Non-controlling interests 5,159 4,941 4,809
Total equity 55,040 50,735 46,010
The financial statements were approved by the Board of Directors and authorised for issue on March 30, 2016. They were signed on its behalf by: M. D. Connole, Director
* Restated as set out in Note 1 and Note 35.

73
Share capital
(Note 24)
$000
Paid in surplus
$000
Hedging reserve (Note 25)
$000
Translation reserve (Note 25)
$000
Treasury stock
(Note 25)
$000
Retained earnings
$000
Equity attributable to owners of
the parent$000
Non controlling
interests$000
Total$000
Balance at January 1, 2014, as previously stated
2,045 33,764 (317) (3,681) (634) 10,861 42,038 4,809 46,847
Prior year adjustment – – – – – (837) (837) – (837)
Balance at January 1, 2014* 2,045 33,764 (317) (3,681) (634) 10,024 41,201 4,809 46,010
Profit for the year – – – – – 8,773 8,773 310 9,083
Other comprehensive income
Foreign exchange translation differences
– – – (1,930) – – (1,930) (6) (1,936)
Cash flow hedge: losses arising during the year
– – (46) – – – (46) – (46)
Cash flow hedge Reclassification adjustment for net income recognised directly in equity
– – 463 – – – 463 – 463
Tax relating to items that may be reclassified to profit or loss
– – (100) – – – (100) – (100)
Total comprehensive income for the year
– – 317 (1,930) – 8,773 7,160 304 7,464
Transactions with owners
Dividends to shareholders (Note 25)
– – – – – (2,567) (2,567) – (2,567)
Dividends paid to non-controlling interests
– – – – – – – (172) (172)
Balance at December 31, 2014 2,045 33,764 – (5,611) (634) 16,230 45,794 4,941 50,735
Profit for the year – – – – – 8,866 8,866 388 9,254
Other comprehensive income
Foreign exchange translation differences
– – – (2,453) – – (2,453) (14) (2,467)
Cash flow hedge: losses arising during the year
– – (64) – – – (64) – (64)
Cash flow hedge reclassification adjustment for net income recognised directly in equity
– – 68 – – – 68 – 68
Tax relating to items that may be reclassified to profit or loss
– – (14) – – – (14) – (14)
Total comprehensive income for the year
– – (10) (2,453) – 8,866 6,403 374 6,777
Transactions with owners
Dividends to shareholders (Note 25)
– – – – – (2,502) (2,502) – (2,502)
Dividends paid to non-controlling interests
– – – – – – – (156) (156)
Shared based payments – – – – – 186 186 – 186
Balance at December 31, 2015 2,045 33,764 (10) (8,064) (634) 22,780 49,881 5,159 55,040
CONSOLIDATED STATEMENT OF CHANGES IN EQUITY FOR THE YEAR ENDED DECEMBER 31, 2015
* Restated as set out in Note 1 and Note 35.
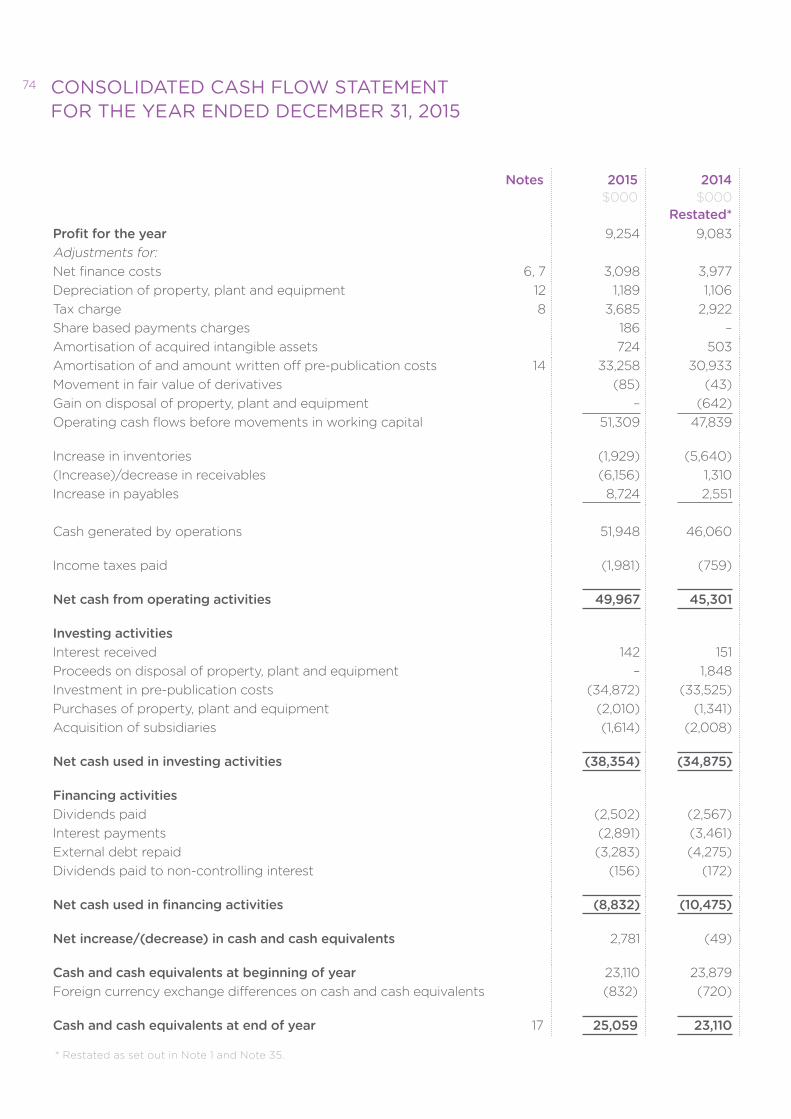
74 CONSOLIDATED CASH FLOW STATEMENT FOR THE YEAR ENDED DECEMBER 31, 2015
Notes 2015$000
2014$000
Restated* Profit for the year 9,254 9,083Adjustments for:Net finance costs 6, 7 3,098 3,977Depreciation of property, plant and equipment 12 1,189 1,106Tax charge 8 3,685 2,922Share based payments charges 186 –Amortisation of acquired intangible assets 724 503Amortisation of and amount written off pre-publication costs 14 33,258 30,933Movement in fair value of derivatives (85) (43)Gain on disposal of property, plant and equipment – (642)Operating cash flows before movements in working capital 51,309 47,839
Increase in inventories (1,929) (5,640)(Increase)/decrease in receivables (6,156) 1,310Increase in payables 8,724 2,551
Cash generated by operations 51,948 46,060
Income taxes paid (1,981) (759)
Net cash from operating activities 49,967 45,301
Investing activitiesInterest received 142 151Proceeds on disposal of property, plant and equipment – 1,848Investment in pre-publication costs (34,872) (33,525)Purchases of property, plant and equipment (2,010) (1,341)Acquisition of subsidiaries (1,614) (2,008)
Net cash used in investing activities (38,354) (34,875)
Financing activitiesDividends paid (2,502) (2,567)Interest payments (2,891) (3,461)External debt repaid (3,283) (4,275)Dividends paid to non-controlling interest (156) (172)
Net cash used in financing activities (8,832) (10,475)
Net increase/(decrease) in cash and cash equivalents 2,781 (49)
Cash and cash equivalents at beginning of year 23,110 23,879Foreign currency exchange differences on cash and cash equivalents (832) (720)
Cash and cash equivalents at end of year 17 25,059 23,110
* Restated as set out in Note 1 and Note 35.

75NOTES TO THE FINANCIAL STATEMENTS
GENERAL INFORMATION AND SIGNIFICANT ACCOUNTING POLICIES1
The Quarto Group, Inc. is a company incorporated in the State of Delaware, United States. The address of the registered office is given on page 120. The nature of the Group’s operations and its principal activities are set out in Note 3 and in the Chief Executive Officer's Statement on page 8.
The accounting policies adopted, are consistent with those of the annual financial statements for the year ended December 31, 2014, as described in those financial statements, except as described below and in Note 35.
Each entity in the Group determines its own functional currency and items included in the financial statements of each entity are measured using that functional currency. The presentational currency of the Group is US dollars.
RESTATEMENT OF PRIOR YEAR RESULTS
The results have been restated for the following items:
a) Classification of the amortisation of debt issuance cost.
The amortisation of debt issuance costs was previously included within administrative expenses. The policy on these costs has been changed to better reflect the underlying nature as a financing cost. There is no net impact to the income statement. The reclassified amount for the year ended December 31, 2014 was $720,000.
b) Insurance arrangements and related revenue recognition.
A review of certain insurance arrangements across the Group identified that in limited circumstances the Group remains the principal insurer of product shipments in transit. In these circumstances it was determined that it was inappropriate to recognise the related revenue until the shipment was receipted by the customer. This correction is limited to the Books & Gifts Direct business only. The impact on the results of the business for the year ended December 31, 2014 was a reduction in profit after tax of $128,000.
c) Allocation of overheads to inventories.
A review of the inventory costing model across the Group identified some inconsistency in the allocation of overheads to inventories. The inconsistency was limited to the Books & Gifts Direct business only and has been corrected. The impact of the results of the business for the year ended December 31, 2014 was an increase in profit after tax of $8,000.
The impact on the Consolidated Income Statement of Comprehensive Income for the year ended December 31, 2014 and on the Consolidated Balance Sheet as at December 31, 2014 and December 31, 2013 is set out in Note 35.
STATEMENT OF COMPLIANCE
The Group financial statements consolidate those of the Company and its subsidiaries (together referred to as the ‘Group’). The parent company financial statements present information about the Company as a separate entity and not about its Group.
The Group financial statements have been prepared and approved by the Directors in accordance with International Financial Reporting Standards as adopted by the EU (‘IFRS’). The Company has elected to prepare its parent company financial statements in accordance with UK GAAP, including The Financial Reporting Standard applicable in the UK and Republic of Ireland ('FRS 102'); these are presented on pages 112 to 118.
The Company adopted FRS 102 from January 1, 2015 in respect of the parent company financial statements. No adjustments were required and no restatements of prior year figures were necessary.
BASIS OF ACCOUNTING
The financial statements are prepared on the historical cost basis, except that derivative financial instruments are stated at fair value.
The preparation of financial statements in conformity with IFRS requires management to make judgements, estimates and assumptions that affect the application of policies and reported amounts of assets and liabilities, income

76
and expenses. The estimates and associated assumptions are based on historical experience and various other factors that are believed to be reasonable under the circumstances.
Actual results may differ from these estimates.
The estimates and underlying assumptions are reviewed on an ongoing basis. Revisions to accounting estimates are recognised in the period in which the estimate is revised if the revision affects only that period or in the period of the revision and future periods if the revision affects both current and future periods. Judgements made by Management in the application of IFRS that have a significant effect on the financial statements and accounting estimates are discussed in:
Note 10: Key assumptions in making the assessment of carrying value of goodwill
Note 14: Presentation of pre-publication costs and the assessment of their useful life
Note 16: Assessment of the impairment of trade receivables and the estimated allowance for sales returns
Note 20: Calculation of temporary differences in the assessment of deferred tax liabilities
There are no judgements, apart from those involving estimations, that management has made in applying the Group’s accounting policies. The accounting policies set out below have been applied to all periods presented.
GOING CONCERN BASIS
After making enquiries, the Directors have formed a judgement, at the time of approving the financial statements, that there is a reasonable expectation that the Group has adequate resources to continue in operational existence for the foreseeable future. For this reason the Directors continue to adopt the going concern basis in preparing the financial statements. See also the group concern and viability statement on Page 34.
The Group’s business activities, together with the factors likely to affect its future development, performance and position are set out in the Chief Executive Officer’s Statement on pages 8 to 17. The financial position of the Group, its cash flows,
liquidity position and borrowing facilities are described in the Financial Review on pages 29 to 34 and in Note 18 to the financial statements.
The Group has considerable financial resources together with a number of customers and suppliers across different geographies. As a consequence, the Directors believe that the Group is well placed to manage its business risks successfully despite the current economic outlook.
The Group has significant banking facilities including committed facilities comprising a US$95m multi-currency revolving credit and term loan facility. These facilities were agreed with the Group’s bankers on February 6, 2015 and expire on April 30, 2019. The Group has prepared a three-year financial plan comprising a budget for the year ending December 31, 2016 together with projections for the two years ending December 31, 2018. These show that the Group is forecasting to have sufficient headroom within that period. The Group complied with its bank covenants in 2015 and the three-year financial plans show sufficient headroom on the covenants throughout the period covered. The covenants will be monitored closely by the Board and appropriate action will be taken if it is considered that one or more of the covenants were likely to be breached.
BASIS OF CONSOLIDATION
The Group financial statements include the results of the Company and all of its subsidiary undertakings. A subsidiary is an entity controlled, directly or indirectly, by the Group. Control is the power to govern the financial and operating policies of the entity so as to obtain benefits from its activities. The financial statements of subsidiaries are included in the consolidated financial statements from the date that control commences until the date that control ceases.
Intragroup balances and any unrealised gains and losses or income and expenses arising from intra-group transactions are eliminated in preparing the consolidated financial statements.
The interest of non-controlling interests on an acquisition is initially measured at the minority’s proportion of the net fair value of the assets, liabilities and contingent liabilities recognised.

77
BUSINESS COMBINATIONS, INTANGIBLE ASSETS AND GOODWILL
All business combinations are accounted for by applying the acquisition method. Goodwill represents the excess of the consideration transferred over the fair value of the net assets and any contingent liabilities acquired. Acquisition costs are expensed as incurred.
Goodwill arising on acquisitions is stated at cost less any accumulated impairment losses. Goodwill is allocated to cash-generating units and is tested annually for impairment.
Other intangible assets, such as backlists, that are acquired by the Group are stated at cost less accumulated amortisation and impairment losses.
Amortisation of intangible assets is charged to profit or loss on a straight-line basis over the estimated useful lives of intangible assets. The amortisation period for non-contractual relationships is 2.5 years and for backlists is between 4 and 10 years.
VOLUME REBATES
In the ordinary course of business, the Group receives volume rebates from its printers. This is accounted for in accordance with contractual terms and is credited in full to cost of sales.
IMPAIRMENT OF PROPERTY, PLANT AND EQUIPMENT AND INTANGIBLE ASSETS INCLUDING GOODWILL
The carrying amount of the Group’s assets is reviewed at each balance sheet date to determine whether there is any indication of impairment. If any such indication exists, the asset’s recoverable amount is estimated. The recoverable amount is the higher of fair value, reflecting market conditions less costs to sell, and value in use based on an internal discounted cash flow valuation.
For goodwill, the recoverable amount is estimated at each balance sheet date. An impairment loss is recognised whenever the carrying amount of an asset or its cash-generating unit exceeds its recoverable amount. Impairment losses are recognised in profit or loss.
REVENUE RECOGNITION
Revenue comprises the fair value of the consideration received or receivable for the sale of goods and services, net of sales taxes, rebates and discounts, and after eliminating sales within the Group. For each of the Group’s operating segments, revenues are recognised on the despatch of goods and when the significant risks and rewards of ownership have been passed to the buyer. The following specific criteria also apply:
• The Group’s publishing revenues are stated net of an estimated allowance for sales returns, which is based on a review of the historical return patterns associated with the various sales outlets, as well as current market trends in the business in which the Group operates.
• Revenue from e-books is recognised when the content is delivered.
LEASING
Where assets are acquired under finance leases (including hire purchase contracts), which confer risks and rewards similar to those attached to owned assets, the amount representing the outright purchase price of such assets is included in property, plant and equipment. All other leases are classified as operating leases. Depreciation is provided in accordance with the accounting policy below. The capital element of future finance lease payments is included in liabilities and the interest element is charged to the income statement over the period of the lease in proportion to the capital element outstanding. Expenditure on operating leases is charged to the income statement on a straight line basis.
FOREIGN CURRENCIES
Transactions in foreign currencies are translated at the foreign exchange rate ruling at the date of the transaction. Monetary assets and liabilities denominated in foreign currencies at the balance sheet date are translated at the exchange rate ruling at that date with any exchange differences arising on retranslation being recognised in the income statement.
The assets and liabilities of foreign operations, including goodwill and fair value adjustments arising on consolidation, are translated into US Dollars at exchange rates ruling at the balance sheet date.

78
The revenues and expenses of foreign operations are translated into US Dollars at average annual exchange rates. Foreign exchange differences arising on retranslation are charged or credited to other comprehensive income and are recognised in the currency translation reserve in equity. On disposal of a foreign operation, the related cumulative translation differences recognised in equity are reclassified to profit or loss and are recognised as part of the gain or loss on disposal.
EXCEPTIONAL ITEMS
Exceptional items which the Company defines as non-trading items are, in management's judgement, significant items outside the scope of normal business that need to be disclosed by virtue of their size or incidence in order for the user to obtain a proper understanding of the financial information.
RETIREMENT BENEFIT COSTS
The Group’s pension costs relate to individual pension plans and are charged to profit or loss as they fall due.
TAXATION
Tax on the profit or loss for the year comprises both current and deferred tax. Current tax is the expected tax payable on the taxable income for the year, using tax rates enacted or substantively enacted at the balance sheet date, and any adjustments to tax payable in respect of previous years. Deferred tax is provided using the balance sheet liability method, providing for temporary differences between the carrying amounts of assets and liabilities for financial reporting purposes and the amounts used for taxation purposes. However, deferred tax is not provided on the initial recognition of goodwill, nor on the initial recognition of an asset or a liability unless the related transaction is a business combination or effects tax or accounting profit. Not all temporary differences give rise to deferred tax assets/liabilities. A deferred tax asset is recognised only to the extent that it is probable that future taxable profits will be available against which the asset can be utilised. Changes in deferred tax assets or liabilities are recognised as a component of
tax expense in the income statement, except where they relate to items that are charged or credited directly to other comprehensive income or equity, in which case the related deferred tax is also charged or credited directly to other comprehensive income or equity, respectively.
PROPERTY, PLANT AND EQUIPMENT
Property, plant and equipment are stated at deemed cost less accumulated depreciation and any provision for impairments in value. The Group recognises in the carrying amount of property, plant and equipment the subsequent costs of replacing part of such items when there are future economic benefits. All other costs are recognised in profit or loss as an expense as they are incurred.
Depreciation is provided on a straight-line basis to write off the cost, less the estimated residual value, of property, plant and equipment over their estimated useful lives, which are reviewed annually. Where parts of an item of plant and equipment have separate lives, they are accounted for and depreciated as separate items. Residual values are reassessed on an annual basis. Land is not depreciated.
Estimated useful lives are as follows:
• Freehold property and long leasehold property improvements – 50 years
• Short leasehold property improvements – over the period of the lease
• Plant, equipment and motor vehicles – 4 to 10 years
• Fixtures and fittings – 5 to 7 years
Assets held under finance leases are depreciated over their expected useful lives on the same basis as owned assets or, where shorter, over the term of the relevant lease.
The gain or loss arising on the disposal or retirement of an asset is determined as the difference between the sales proceeds and the carrying amount of the asset and is recognised in income.

79
PRE-PUBLICATION COSTS
Pre-publication costs represent directly attributable costs and attributable overheads incurred in the development of book titles prior to their publication. Attributable overheads are allocated on a title by title basis. These costs are carried forward in current intangible assets where the book title will generate future economic benefits and costs can be measured reliably. These costs are amortised on a straight line basis upon publication of the book title over estimated economic lives of three years or less, being an estimate of the expected useful economic life of a book title. The investment in pre-publication costs has been disclosed as part of the investing activities in the cash flow statement.
INVENTORIES
Inventory is valued at the lower of cost, including an appropriate portion of overheads, and net realisable value, on a first in, first out basis. Net realisable value is the estimated selling price in the ordinary course of business, less estimated costs of completion and selling expenses.
FINANCIAL INSTRUMENTS
Financial assets and financial liabilities are recognised on the Group’s balance sheet when the group becomes a party to the contractual provisions of the instrument.
FINANCIAL ASSETS
Financial assets other than hedging instruments are divided into the following categories:
• loans and receivables; and
• financial assets at fair value through profit or loss
Financial assets are assigned to the different categories on initial recognition, depending on the characteristics of the instrument and its purpose. A financial instrument’s category is relevant for the way it is measured and whether any resulting income and expenses is recognised in profit or loss or directly in equity. See Note 33 for a summary of the Group’s financial assets by category.
Generally, the Group recognises all financial assets using trade date accounting. An assessment of whether a financial asset is impaired is made at least at each reporting date. All income and expense relating to financial assets are recognised in the income statement line item ‘finance costs’ or ‘finance income’, respectively, with the exception of trade and other receivables which are recorded in revenue and administrative expenses.
Loans and receivables, including trade receivables, are non-derivative financial assets with fixed or determinable payments that are not quoted in an active market. After initial recognition, at fair value, these are measured at amortised cost using the effective interest method, less provision for impairment. Any change in their value is recognised in profit or loss. The Group’s trade and most other receivables fall into this category of financial instruments. Discounting, however, is omitted where the effect of discounting is immaterial.
Significant receivables are considered for impairment on a case-by-case basis when they are past due at the balance sheet date or when objective evidence is received that a specific counterparty will default. All other receivables are reviewed for impairment in groups, which are determined by reference to the industry and region of a counterparty and other available features of shared credit risk characteristics, if any. The percentage of the write-down is then based on recent historical counterparty default rates for each identified group.
Derivative financial instruments are initially recognised at fair value, and subsequently classified as financial assets at fair value through profit and loss. Any gain or loss arising from derivative financial instruments is based on changes in fair value, which is determined by direct reference to active market transactions or using a valuation technique where no active market exists.

80
FINANCIAL LIABILITIES
The Group’s financial liabilities include borrowings, trade and other payables (including finance lease liabilities).
After initial recognition at fair value, all financial liabilities, with the exception of derivative financial instruments, are measured at amortised cost using the effective interest rate method. A summary of the Group’s financial liabilities by category is given in Note 33.
All of the Group’s derivative financial instruments that are not designated as hedging instruments in accordance with the strict conditions explained under the heading ‘Derivative financial instruments and hedge accounting’, are accounted for at fair value through profit or loss by definition.
FINANCIAL LIABILITIES AND EQUITY INSTRUMENTS
Financial liabilities and equity instruments are classified according to the substance of the contractual arrangements entered into. An equity instrument is any contract that evidences a residual interest in the assets of the Group after deducting all of financial liabilities.
FINANCE COSTS
Finance costs comprise interest payable on borrowings calculated using the effective interest method together with the amortisation of debt issuance costs.
FINANCE INCOME
Finance income comprises interest receivable, which is recognised in profit or loss as it accrues using the effective interest method.
CASH AND CASH EQUIVALENTS
For the purposes of the statement of cash flows, cash and cash equivalents comprise cash balances, call deposits and bank overdrafts that form an integral part of the Group’s cash management processes.
DERIVATIVE FINANCIAL INSTRUMENTS AND HEDGE ACCOUNTING
The Group’s activities expose it primarily to the financial risks of changes in foreign currency exchange rates and interest rates. The Group uses interest rate swap contracts to hedge these exposures. The Group does not use derivative financial instruments for speculative purposes.
The use of financial derivatives is governed by the Group’s policies approved by the Board of Directors, which provide written principles on the use of financial derivatives.
Where a derivative financial instrument is designated as a hedge of the variability in cash flows of a recognised asset or liability, or a highly probable forecast transaction, the effective part of any gain or loss on the derivative financial instrument is recognised directly in other comprehensive income. If the cash flow of a firm commitment or forecast transaction results in the recognition of an asset or a liability, then, at the time the asset or liability is recognised, the associated gains or losses on the derivative that had previously been recognised in equity are included in initial recognition of that asset or liability. Amounts previously recognised in other comprehensive income are recognised in the profits and loss in the same period in which the hedged item affects net profit or loss. Changes in the fair value of derivative financial instruments that do not qualify for hedge accounting are recognised in profit or loss as they arise.
The Group’s derivatives are split between level 1 and level 2 financial instruments under IFRS 7. The foreign currency exchange rate derivatives are level 1 and they are valued based on a quoted price in an active market. The interest rate swaps are level 2 financial instruments and they are valued using techniques based significantly on observable market data such as yield curves as at the balance sheet date.
Hedge accounting is discontinued when the hedging instrument expires or is sold, terminated, or exercised, or no longer qualifies for hedge accounting. At that time, any cumulative gain or loss on the hedging instrument recognised in

81
equity is retained in other comprehensive income until the forecast transaction occurs. If a hedged transaction is no longer expected to occur, the net cumulative gain or loss recognised in other comprehensive income is transferred to net profit or loss for the period.
TREASURY SHARES
Treasury shares represent holdings of the Company’s own equity instruments. No gain or loss is recognised in profit or loss on the purchase, issue or cancellation of these equity instruments. Consideration paid or received is recognised directly in other comprehensive income.
SHARE-BASED PAYMENTS
The Group issues equity settled share-based payments to certain employees. Equity settled share-based payments are measured at fair value at the date of grant. The fair value, determined at the grant date, of equity settled share-based payments is expensed on a straight line basis over the vesting period, based on the Group's estimate of shares that will eventually vest.
The fair value of employee share option grants is calculated using a Monte Carlo model, taking into account the terms and conditions upon which the options were granted. The value of the charge is adjusted to reflect expected and actual levels of options vesting.
BORROWING COSTS
All borrowing costs are recognised in the income statement in the period in which they are incurred. Debt issuance costs comprising arrangement fees and legal costs are capitalised and amortised on a straight line basis over the period of the borrowing facility or included within the amortised cost calculation as appropriate. The annual amortisation charge is included within finance costs in the Consolidated Statement of Comprehensive Income.
The Group does not incur any borrowing costs which are directly attributable to the acquisition, construction or production of qualifying assets.
FINANCIAL RISK MANAGEMENT
The principal risk factors faced by the Group are disclosed in Note 33 and on page 33.
NEW STANDARDS AND INTERPRETATIONS NOT APPLIED
The International Accounting Standards Board and the International Reporting Interpretations Committee (IFRIC) have issued the following standards and interpretations for annual periods beginning on or after the effective dates noted below.
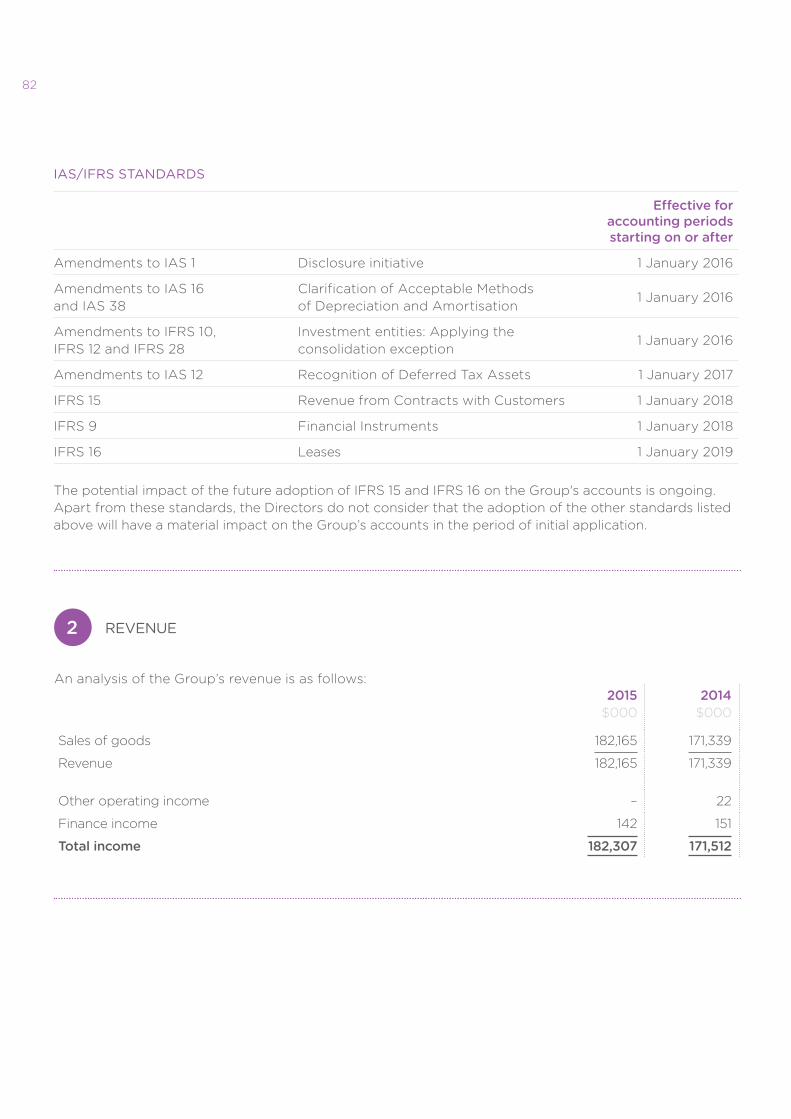
82
IAS/IFRS STANDARDS
Effective for accounting periods starting on or after
Amendments to IAS 1 Disclosure initiative 1 January 2016
Amendments to IAS 16 and IAS 38
Clarification of Acceptable Methods of Depreciation and Amortisation
1 January 2016
Amendments to IFRS 10, IFRS 12 and IFRS 28
Investment entities: Applying the consolidation exception
1 January 2016
Amendments to IAS 12 Recognition of Deferred Tax Assets 1 January 2017
IFRS 15 Revenue from Contracts with Customers 1 January 2018
IFRS 9 Financial Instruments 1 January 2018
IFRS 16 Leases 1 January 2019
The potential impact of the future adoption of IFRS 15 and IFRS 16 on the Group's accounts is ongoing. Apart from these standards, the Directors do not consider that the adoption of the other standards listed above will have a material impact on the Group’s accounts in the period of initial application.
An analysis of the Group’s revenue is as follows:2015
$0002014
$000
Sales of goods 182,165 171,339
Revenue 182,165 171,339
Other operating income – 22
Finance income 142 151
Total income 182,307 171,512
REVENUE2

83
The analysis by segment is presented below. This is based upon the operating results reviewed by the Chief Executive Officer.
2015
Quarto International Co-Editions
Group $000
Quarto Publishing
Group USA$000
Quarto Publishing Group UK
$000
Books & Gifts Direct,
ANZ $000
Quarto HK
$000Total$000
External revenue 50,147 72,441 22,765 22,060 14,752 182,165
Operating profit before amortisation of acquired intangibles and exceptional items
6,351 8,884 3,302 1,613 1,487 21,637
Amortisation of acquired intangibles (240) (346) (86) (52) – (724)
Segment result 6,111 8,538 3,216 1,561 1,487 20,913
Unallocated corporate expenses (4,431)
Exceptional Item – Acquisition costs (257)
Exceptional Item – Professional fees relating to aborted corporate transactions
(188)
Finance income 142
Finance costs (3,240)
Profit before tax 12,939
Tax (3,685)
Profit after tax 9,254
Capital expenditure 529 773 38 546 124 2,010
Depreciation 539 329 181 86 54 1,189
Investment in pre-publication costs 15,724 14,888 4,260 – – 34,872
Amortisation of pre-publication costs 16,246 13,014 3,998 – – 33,258
OPERATING SEGMENTS3
Transactions between operating segments are recorded at normal commercial terms.

84
OPERATING SEGMENTS (CONTINUED)3
2014 (Restated)
There are no other significant non-cash expenses.
Quarto International Co-Editions
Group $000
Quarto Publishing
Group USA$000
Quarto Publishing Group UK
$000
Books & Gifts Direct,
ANZ $000
Quarto HK
$000Total$000
External revenue 42,676 64,058 21,477 29,865 13,263 171,339
Operating profit before amortisation of acquired intangibles and exceptional items
6,063 6,636 3,099 2,773 1,112 19,683
Amortisation of acquired intangibles (3) (346) (93) (61) – (503)
Segment result 6,060 6,290 3,006 2,712 1,112 19,180
Unallocated corporate expenses (3,764)
Exceptional Item – Acquisition costs (78)
Exceptional Item – Profit on disposal of freehold property
644
Finance income 151
Finance costs (4,128)
Profit before tax 12,005
Tax (2,922)
Profit after tax 9,083
Capital expenditure 282 233 43 770 13 1,341
Depreciation 333 276 205 269 23 1,106
Investment in pre-publication costs 14,573 14,787 4,165 – – 33,525
Amortisation of and amount written off pre-publication costs
15,151 11,961 3,821 – – 30,933

85
Balance sheet 2015
$0002014
$000 Restated
Quarto Publishing Group USA 92,154 84,607
Quarto Publishing Group UK 20,562 20,414
Quarto International Co-Editions Group 49,957 46,486
Books & Gifts Direct, ANZ 17,241 20,242
Quarto HK 7,811 7,132
Unallocated (Deferred tax and cash) 25,077 23,236
Total assets 212,802 202,117
Quarto Publishing Group USA 22,567 16,488
Quarto Publishing Group UK 7,848 5,869
Quarto International Co-Editions Group 23,246 19,701
Books & Gifts Direct, ANZ 5,189 8,313
Quarto HK 4,325 3,438
Unallocated (Borrowings, derivatives, deferred tax and tax payable) 94,587 97,573
Total liabilities 157,762 151,382
Geographical areas
The Group operates in the following main geographic areas:
Revenues are allocated based on the country in which the customer is located, irrespective of the origin of the goods. Non-current assets are based on the subsidiary's country of domicile and comprise goodwill, other intangible assets, property, plant and equipment and pre-publication costs.
OPERATING SEGMENTS (CONTINUED)3
Revenues 2015
$000
Revenues 2014
$000 Restated
Non-current assets 2015
$000
Non-current assets 2014
$000
United States of America 92,758 79,537 55,507 53,559
Australasia and Far East 28,556 36,322 8,066 8,716
United Kingdom 24,150 24,665 39,304 38,005
Europe 24,453 22,703 1,556 2,136
Rest of the World 12,248 8,112 – –
182,165 171,339 104,433 102,416

86
OPERATING PROFIT4
Operating profit has been arrived at after charging/(crediting): 2015
$0002014
$000 Restated
Profit on sale of property, plant and equipment – (642)
Depreciation of property, plant and equipment 1,189 1,106
Net foreign currency exchange differences (118) (243)
Amortisation of acquired intangibles 724 503
Amortisation of pre-publication costs 33,258 30,933
Staff costs (Note 5) 30,843 30,725
Auditor’s remuneration (see below) 408 224
Cost of inventory recognised as an expense 43,413 36,430
Exceptional items 445 (566)
2015Number
2014Number
The average monthly number of employees (including Executive Directors) was: 434 402
Their aggregate remuneration comprised:
$000 $000
Wages and salaries 27,560 27,431
Social security costs 2,119 2,226
Other pension costs 1,164 1,068
30,843 30,725
Auditor’s remuneration
Fees payable to the Company’s auditor for the audit of the Company’s annual accounts
30
59
Fees payable to the Company’s auditor and its associates for other services: The audit of the Company’s subsidiaries pursuant to legislation
370
165
Fees payable to the Company’s auditor for other assurance services 8 –
408 224
Exceptional items comprise acquisition costs of $257,000 and costs relating to aborted corporate transactions of $188,000. Exceptional items for 2014 comprised the profit on sales of businesses and assets amounting to $644,000 and acquisition costs of $78,000.
The principal increase in the year relates to the Company's auditor appointment for certain overseas operations.
Directors’ remuneration is disclosed in the Remuneration Committee Report on page 57.
STAFF COSTS5

87
2015$000
2014$000
Restated
Current tax on profit for the year 2,277 2,413
Total current tax 2,277 2,413
Deferred tax (Note 20)
Current year origination and reversal of temporary differences 1,408 509
3,685 2,922
2015$000
2014$000
RestatedInterest expense on borrowings 2,837 3,408
Amortisation of debt issuance costs 403 720
Total finance costs 3,240 4,128
FINANCE COSTS7
TAX8
Corporation tax on UK profits is calculated at 20.25%, based on the UK standard rate of corporation tax, (2014: 21.5%) of the estimated assessable profit for the year. Taxation for other jurisdictions is calculated at the rates prevailing in the respective jurisdictions. The table below explains the difference between the expected expense at the UK statutory rate of 20.25% and the Group's total tax expense for the year.
2015$000
2014$000
Interest income on financial assets carried at amortised cost 142 151
2015$000
2015%
2014$000
Restated
2014%
Profit before tax 12,939 12,005
Tax at the UK corporation tax rate of 20.25% (2014: 21.5%) 2,620 2,581
Effect of different tax rates of subsidiaries operating in other jurisdictions
1,015 409
Adjustment to prior years – (480)
Other, including tax effect of expenses that are not deductible in determining taxable profit
50 412
Tax expense and effective tax rate for the year 3,685 28.5% 2,922 24.3%
FINANCE INCOME6
* See note 1 regarding reclassification of debt issuance costs.

88
EARNINGS PER SHARE9
Earnings 2015$000
2014$000
Restated
Earnings for the purposes of basic earnings per share being net profit attributable to owners of the parent 8,866 8,773
Number of shares Number Number
Weighted average number of ordinary shares for the purposesof basic earnings per share 19,696,729 19,696,729
Effect of potential dilutive ordinary shares: 38,591 –
Share options – –
Weighted average number of ordinary shares for the purposes of diluted earnings per share
19,735,320
19,696,729
Earnings per share 2015Cents
2014 Cents
Restated
Basic 45.0 44.5
Diluted 44.9 44.5
Adjusted earnings $000 $000 Restated
Earnings for the purposes of basic earnings per share being net profit attributable to owners of the parent:
8,866 8,773
Amortisation of acquired intangibles (net of tax) 526 350
Exceptional items (net of tax) 441 (427)
Earnings for the purposes of adjusted earnings per share 9,833 8,696
Adjusted earnings per share 2015Cents
2014Cents
Restated
Basic 49.9 44.1
Diluted 49.8 44.1
From continuing operations The calculation of the basic and diluted earnings per share is based on the following data:

89
2015$000
2014$000
2013$000
Cost
At January 1 41,423 41,744 41,869
Exchange differences (1,244) (971) (125)
Recognised on acquisitions (Note 34) 269 650 –
At December 31 40,448 41,423 41,744
Accumulated impairment losses
At January 1 (354) (377) (368)
Exchange differences 18 23 (9)
At December 31 (336) (354) (377)
Carrying amount
At December 31 40,112 41,069 41,367
2015$000
2014$000
2013$000
Quarto Publishing Group USA (QUS) 26,878 26,878 26,878
Quarto Publishing Group UK (QUK) 2,176 2,293 2,440
Quarto International Co-Editions Group (QIC) 5,145 5,171 4,987
Books & Gifts Direct, ANZ (BGD) 5,913 6,727 7,062
40,112 41,069 41,367
Impairment tests for cash generating units containing goodwillThe following units have significant carrying amounts of goodwill:
The recoverable amount of each cash generating unit (‘CGU’) is based on the value in use basis. In determining value in use, management prepare a detailed bottom up budget, with reviews conducted at each business unit. Cash flows beyond the budget period of twelve months are extrapolated into perpetuity, by applying the growth and rates applicable to each unit discounted to present value. The key assumptions used in the value in use calculations were:
Discount rate: 11.58% pre-tax for QUS, 12.17% for QUK and QIC and 11.58% for BGD which reflects current assessments of the time value of money. The discount rate has been calculated using Weighted Average Cost of Capital analysis adjusted to derive the pre-tax discount rate.
Cash flow growth rates: based on a forecast growth rate of 3% (2014: 3%), into perpetuity, to reflect the long term expected growth in each of the key markets. Changes in selling prices and direct costs are based on past experience and expectations of future changes in the market.
Determining whether goodwill, specific to the US, is impaired requires an estimation of the value of use of each CGU based on the key assumptions above. The headroom of the US CGU as at December 31, 2015 was $12.7m (2014: $12.8m).
Neither a 1.7% decrease in the long term growth rate or a 1.5% increase in the discount rate would have led to an impairment.
GOODWILL10

90
Non-contractual relationships
$000 Backlists
$000Total
$000
Cost
At January 1, 2014 1,127 18,121 19,248
Acquisitions – 503 503
Exchange differences (47) (131) (178)
At December 31, 2014 and January 1, 2015 1,080 18,493 19,573
Exchange differences (55) (223) (278)
Recognised on acquisitions (Note 34) – 1,365 1,365
Disposals (1,025) – (1,025)
At December 31, 2015 – 19,635 19,635
Amortisation and impairment
At January 1, 2014 1,127 17,130 18,257
Exchange differences (47) (96) (143)
Charge for the year – 503 503
At December 31, 2014 and January 1, 2015 1,080 17,537 18,617
Exchange differences (55) (136) (191)
Charge for the year – 724 724
Disposals (1,025) – (1,025)
At December 31, 2015 – 18,125 18,125
Carrying amount
At December 31, 2015 – 1,510 1,510
At December 31, 2014 – 956 956
At December 31, 2013 – 991 991
OTHER INTANGIBLE ASSETS11

91
Freehold Property
$000
Leasehold Property
Improvements$000
Plant Equipment
& Motor Vehicles
$000
Fixtures & Fittings
$000Total
$000
Cost
At January 1, 2014 1,371 1,253 4,461 1,489 8,574
Exchange difference (9) (38) (234) (17) (298)
Additions 12 6 1,184 139 1,341
Disposals (1,374) (364) (990) (630) (3,358)
Acquisition of subsidiaries – – 106 3 109
At December 31, 2014 and January 1, 2015 – 857 4,527 984 6,368
Acquisition of subsidiaries – – 2 – 2
Exchange difference – (46) (335) (38) (419)
Additions – 253 1,525 232 2,010
Disposals – (2) (177) (58) (237)
At December 31, 2015 – 1,062 5,542 1,120 7,724
Depreciation
At January 1, 2014 169 656 3,362 635 4,822
Exchange differences (1) (22) (109) (7) (139)
Charge for the year – 228 455 423 1,106
Disposals (168) (364) (990) (630) (2,152)
At December 31, 2014 and January 1, 2015 – 498 2,718 421 3,637
Exchange differences – (25) (206) (8) (239)
Charge for the year – 193 825 171 1,189
Disposals – – (177) (54) (231)
At December 31, 2015 – 666 3,160 530 4,356
Net book value
At December 31, 2015 – 396 2,382 590 3,368
At December 31, 2014 – 359 1,809 563 2,731
At December 31, 2013 1,202 597 1,099 854 3,752
PROPERTY, PLANT AND EQUIPMENT12

92
SUBSIDIARIES13
INTANGIBLE ASSETS – PRE-PUBLICATION COSTS14
A list of the significant investments in subsidiaries, including the name, country of incorporation and proportion of ownership interest is given in Note 4 to the Company’s balance sheet. All of these subsidiaries are included in the consolidated results.
The assessment of the useful life of pre-publication costs and amortisation involves a significant amount of judgement based on historical trends and management estimates of future potential sales, in accordance with the accounting policy stated in Note 1.
2015$000
2014$000
2013$000
Cost
At January 1 117,077 102,701 88,510
Exchange differences (2,217) (2,774) 858
Transfer from inventories – 660 691
Acquired on acquisition of subsidiaries 2,001 102 –
Additions 34,872 33,525 31,668
At December 31 151,733 134,214 121,727
Amortisation
At January 1 59,543 46,480 34,971
Exchange differences (511) (733) 233
Charge for the year 33,258 30,933 30,099
Amount written off – – 203
At December 31 92,290 76,680 65,506
Carrying amount 59,443 57,534 56,221

93
2015$000
2014$000
Restated
2013$000
Restated
Finished goods 25,889 24,525 19,394
Work in progress 151 114 167
Raw materials 107 212 118
26,147 24,851 19,679
All of the Group’s inventories have been reviewed for indicators of impairment. Certain inventories were found to be impaired and a provision of $1,649,000 (2014: $1,696,000) has been recorded accordingly.
2015$000
2014$000
Restated
2013$000
Restated
Trade receivables 45,475 40,225 44,611
Other receivables and prepayments 11,670 11,515 9,738
Amounts falling due within one year 57,145 51,740 54,349
The average credit period on sales of goods is 65 days (2014: 73 days).
The Group’s trade and other receivables have been reviewed for indicators of impairment. Certain trade receivables, including certain trade receivables not yet due, were not considered to be recoverable and a provision of $908,000 (2014: $1,509,000) has been recorded accordingly. The trade receivables considered irrecoverable relate to customers which are experiencing trading difficulties. In addition, some of the recoverable trade receivables are past due as at the reporting date. The extent of financial assets past due but not impaired is as follows:
2015$000
2014$000
2013$000
Less than one month 3,338 3,018 3,310
More than one month but less than two months 1,182 783 1,365
More than two months but less than three months 339 342 385
More than three months but less than six months 599 823 300
More than six months 73 444 172
5,531 5,410 5,532
The Group has not provided against these receivables as there has not been a significant change in credit quality and the Group believes they are still recoverable. No collateral is held over these balances.
INVENTORIES15
TRADE AND OTHER RECEIVABLES16

94
TRADE AND OTHER RECEIVABLES (CONTINUED)16
CASH AND CASH EQUIVALENTS172015
$0002014
$0002013
$000
Bank balances 18,274 13,375 15,145
Short term deposits 6,785 9,735 8,734
Cash and cash equivalents 25,059 23,110 23,879
The carrying amount of these assets approximates to their fair value.
The effective interest rates on bank balances and short term deposits was 0.4% (2014: 0.6%).
Movement in allowance for doubtful debts:
2015$000
2014$000
2013$000
Balance at beginning of year 1,509 1,185 957
On acquisition of subsidiaries 46 – –
Amounts written off in the year (1,571) (434) (607)
Amounts recovered during the year 150 337 268
Exchange difference (26) (16) 2
Increase in allowance recognised in profit or loss 800 437 565
Balance at end of the year 908 1,509 1,185
The Directors consider that the carrying amount of trade and other receivables approximates to their fair value. Trade receivables are disclosed after deducting a reserve for sales returns. The reserve is calculated based on a time lag between sales and returns and historical return patterns.

95
2015$000
2014$000
2013$000
Bank loans 79,562 – 78,287
Obligations under finance leases (see Note 21) – – 4
79,562 – 78,291
The borrowings (excluding obligations under finance leases) are repayable as follows:
On demand or within one year 5,000 89,150 16,600
In the second year 5,000 – 78,287
In the third to fifth years inclusive 74,562 – –
84,562 89,150 94,887
Less: Amount due for settlement within 12 months(shown under current liabilities) (5,000) (89,150) (16,600)
Amount due for settlement after 12 months 79,562 – 78,287
TotalFixed rate
borrowings
Variable rate
borrowings
Weighted average
interest rate for fixed rate
borrowings
Average time over
which interest rate
is fixed
$000 $000 $000 % Months
US dollar borrowings 57,000 30,000 27,000 3.5 19.5
Other currency borrowings 27,562 – 27,562 – –
As at December 31, 2015 84,562 30,000 54,562 3.5 19.5
US dollar borrowings 60,000 – 60,000 – –
Other currency borrowings 29,150 – 29,150 – –
As at December 31, 2014 89,150 – 89,150 – –
US dollar borrowings 62,635 44,000 18,635 3.8 11
Other currency borrowings 32,252 – 32,252 – –
As at December 31, 2013 94,887 44,000 50,887 3.8 11
The variable rate borrowings bear interest by reference to LIBOR plus a margin.
At December 31, 2015, undrawn borrowing facilities totalled $16,540,000 (2014: $5,480,000).
The Directors estimate the fair value of the Group’s borrowings to be equal to book value, by reference to market rates.
The above borrowings carry interest based on LIBOR plus a margin of between 2.1% and 2.8%, depending on the leverage ratio and are secured on the assets of the Group.
At December 31, 2015, the Group had a US$95m (2014: US$95m) multi-currency syndicated bank facility which is due to expire on April 30, 2019.
MEDIUM AND LONG TERM LOANS18

96
MEDIUM AND LONG TERM LOANS (CONTINUED)18
These facilities are subject to three principal covenants, namely:
(a) Total consolidated net indebtedness shall not exceed 3 times EBITDA (as defined in the committed facility agreements). At December 31, 2015, net indebtedness was 1.63 times (2014: 1.87 times) EBITDA.
(b) The consolidated operating profit before exceptional items and goodwill amortisation shall exceed three times net interest payable.
For the year ended December 31, 2015, net interest payable was 5.55 times (2014: 4.00 times) covered under this covenant.
(c) Cash flow shall exceed 1.2 times Debt Service. For the year ended December 31, 2015, Debt Service was 3.89 times (2014: 3.19 times) covered under this covenant.
The fair value of interest rate swaps is determined by using mark to market values at the balance sheet date, based on quoted prices in active markets.
OTHER FINANCIAL ASSETS/LIABILITIES19
The Group’s activities expose it primarily to the financial risks of changes in foreign currency exchange rates and interest rates. The Group uses exchange rate swaps to hedge exchange rate exposures and interest rate swap contracts to hedge the interest rate exposures. The Group does not use derivative financial instruments for speculative purposes. All interest rate swaps have been designated as hedging instruments in cash flow hedges in accordance with IAS 39.
The Group’s interest rate swaps have been designed to match the corresponding loan terms to maximise the effectiveness of the hedging instrument. There was no ineffectiveness during the year and all movements were recorded in other comprehensive income, with amounts reclassified to finance costs within profit or loss. Exchange rate swaps are not treated as hedging instruments for hedge accounting purposes.
The following table details the principal amounts and the remaining terms of interest rate swap contracts outstanding at the reporting date:
Principal amounts Committed interest payments
2015%
2014%
2013%
2015$000
2014$000
2013$000
2015$000
2014$000
2013$000
Within one year 3.1 – 3.8% 10,000 – 44,000 (134) – (317)
Within one to two years 3.5 – – 10,000 – – (384) – –
Within two to five years 3.8 – – 10,000 – – (674) – –
Derivative 30,000 – 44,000 (1,192) – (317)
2015$000
2014$000
2013$000
Current financial liabilities Derivative financial (assets)/liabilities – forward exchange contract (18) 67 110Derivative financial instruments – interest rate swaps 10 – 317
(8) 67 427
In the reporting periods under review, other financial assets/liabilities comprise derivative financial instruments as follows:

97
2015$000
2014$000
Restated
2013$000
RestatedDeferred taxation provided in the financial statements is as follows:
Excess of capital allowances over depreciation – UK 59 25 13
Other temporary differences – UK 4,190 4,493 4,756
4,249 4,518 4,769
Other temporary differences – US 2,924 1,545 906
Other overseas temporary differences 293 (136) (190)
7,466 5,927 5,485
Deferred taxation assets – – –
Other temporary differences – Other overseas – (126) (33)
Net deferred taxation liability 7,466 5,801 5,452
The movement on the net provision for deferred taxation is as follows:
2015$000
2014$000
Restated
2013$000
Restated
Net provision at January 1 5,801 5,452 5,609
Acquisitions 394 145 48
Exchange difference through other comprehensive income
(137) (305) 85
Charge/(credit) to profit and loss 1,408 509 (290)
Net provision at December 31 7,466 5,801 5,452
At the balance sheet date, the group has unused tax losses of $2,909,000, which are recognised in deferred tax above (2014: $8,947,000) available for offset against future profits.
At the balance sheet date, the aggregate amount of temporary differences associated with undistributed earnings of subsidiaries for which deferred tax has not been recognised was $20,165,000 (2014: $21,411,000).
DEFERRED TAX20

98
2015$000
2014$000
2013$000
Current loan instalments 5,000 89,150 16,600
Borrowings (Note 18) 5,000 89,150 16,600
Finance lease obligations (Note 21) – – 3
5,000 89,150 16,603
The carrying amount of these liabilities approximates to their fair value.
OBLIGATIONS UNDER FINANCE LEASES21
SHORT TERM BORROWINGS22
TRADE AND OTHER PAYABLES23
2015$000
2014$000
2013$000
Amounts payable under finance leases:
Within one year – – 4
In the second to fifth year inclusive – – 4
– – 8
Less: future finance charges – – (1)
– – 7
Less: Amount due for settlement within
12 months (Note 22) – – (3)
Amount due for settlement after 12 months – – 4
2015$000
2014$000
Restated
2013$000
Trade payables 49,856 44,047 41,025
Other payables 13,220 9,224 11,759
63,076 53,271 52,784
The Directors consider that the carrying amount of trade payables approximates to their fair value.

99
Authorised: 28,000,000 (2014: 28,000,000) shares of common stock of par value US$0.10 each (‘shares of common stock’) with an aggregate nominal value of US$2,800,000 (2014: US$2,800,000).
2015$000
2014$000
2013$000
Equity share capital
Allotted, called up and fully paid:
Shares of common stock of par value US$0.10 each 20,444,550 (2014: 20,444,550)
2,045
2,045
2,045
The Company has one class of common stock which carries no right to fixed income.
SHARE CAPITAL24
RETAINED EARNINGS AND OTHER RESERVES25
2015$000
2014$000
Amounts recognised as distributions to equity holders in the period: Interim dividend for the year ended December 31, 2015 of 5.13c/3.35p (2014: 5.53c/3.35p) per share
1,010
1,089
Final dividend for the year ended December 31, 2014 of 8.17c/4.95p (2013: 7.51c/4.55p) per share
1,492
1,478
2,502 2,567
Proposed final dividend for the year ended December 31, 2015 of 9.41c/6.15p (2014: 8.17c/4.95p) per share
1,853
1,521
1,853 1,521
The proposed final dividend is subject to approval by shareholders at the Annual Meeting and has not been included as a liability in these financial statements.
HEDGING RESERVE
The hedging reserve comprises the effective portion of the cumulative net change in the fair value of cash flow hedging instruments related to hedged transactions.
TRANSLATION RESERVE
The translation reserve comprises all foreign exchange differences arising from the translation of the closing balance sheets of foreign operations of the Group and the results of foreign operations of the Group since January 1, 2004.
TREASURY STOCK
Treasury stock represents the Group’s purchase of its own shares. The Group owns 747,821 (2014: 747,821) shares, representing 3.7% (2014: 3.7%) of its shares of common stock.
DIVIDENDS

100
RETAINED EARNINGS AND OTHER RESERVES (CONTINUED)25
NOTES TO THE CASH FLOW STATEMENT26
SUBSEQUENT EVENTS27
The Quarto Group, Inc., as a US incorporated company, is required to collect US dividend withholding taxes on dividend distributions made to its non-US shareholders. The US dividend withholding tax is generally 30% of any dividends paid to Quarto’s non-US shareholders, but this amount can potentially be reduced pursuant to an applicable income tax treaty between the US and the country of residence of the non-US shareholder.
For example, under the US/UK income tax treaty, the US dividend withholding tax rate can range from nil (applicable to certain UK resident pension trusts and tax exempt entities) to 15%
(applicable to UK resident individual shareholders and certain UK corporate shareholders). For US shareholders, no US dividend withholding tax is generally applicable. It should be noted that certain documentation requirements must be met by all shareholders prior to the payment of any dividends to certify their status as a US or non-US shareholder, and, if a non-US shareholder to claim any applicable benefits under the US/UK or other applicable income tax treaty. Each shareholder should consult their own tax adviser to determine whether and to what extent they may be entitled to claim a reduced amount of US dividend withholding taxes under a US income tax treaty.
Cash comprises cash on hand and demand deposits. Cash equivalents are short-term highly liquid investments that are readily convertible to known amounts of cash and which are subject to insignificant changes in value.
On February 3, 2016, the Group announced that it had acquired the trade and assets of Harvard Common Press through its subsidiary company, Quarto Publishing Group USA Inc. The consideration of $1,034,000 is payable in three instalments, on completion, in July 2016 and July 2017. These assets were acquired because of their strategic fit within the Group.

101
2015$000
2014$000
2013$000
Lease payments under operating leases recognised in income for the year 2,153 2,253
2,632
At the balance sheet date, the Group had outstanding commitments for future minimum lease payments under non-cancellable operating leases, which fall due as follows:
2015$000
2014$000
2013$000
Minimum lease payments under operating leases within one year
1,915 2,055 2,098
In the second to fifth years inclusive 3,836 5,288 3,994
After more than five years 2,399 2,006 1,462
8,150 9,349 7,554
Operating lease payments represent rentals payable by the Group, primarily for its office properties. There were no capital commitments amounting at the year end (2014: $24,000).
OPERATING LEASE ARRANGEMENTS AND OTHER FINANCIAL COMMITMENTS28
SHARE OPTIONS29
REMUNERATION OF KEY MANAGEMENT PERSONNEL30
The remuneration of the Directors and the Executive Committee, who are the key management personnel of the Group, is set out below in aggregate for each of the categories specified in IAS 24 Related Party Disclosures. Further information about the remuneration of individual Directors is provided in the audited part of the Directors’ Remuneration Report on page 56.
2015$000
2014$000
Short term employee benefits 3,424 3,559
Post-employment benefits 317 261
3,741 3,820
Details of the award under the Company's Performance Share Plan are set out in the Directors' report on page 35, and note 36.

102
DIRECTORS’ TRANSACTIONS31
There were no transactions with Directors during the year. In 2014, R. J. Morley maintained a current account with the Group. The balance due to the Group on this account was less than $5,000 throughout that year.
RECONCILIATION OF FIGURES INCLUDED IN THE OTHER PARTS OF THE FINANCIAL STATEMENTS
32
2015$000
2014$000
Restated
Adjusted profit before tax (before amortisation of acquired intangibles and exceptional items)
14,108 11,942
Amortisation of acquired intangibles (724) (503)
Exceptional items (Note 4) (445) 566
Profit before tax 12,939 12,005
EBITDA (as defined in the committed facility agreement)
Adjusted profit before tax (before amortisation of acquired intangibles and exceptional items)
14,108 11,942
Net interest 3,098 3,977
Depreciation 1,189 1,106
Amortisation of pre-publication costs 18,184 18,333
EBITDA, before exceptional items 36,579 35,358
Net debt
Short term borrowings 5,000 89,150
Medium and long term borrowings 79,562 –
Cash and cash equivalents (25,059) (23,110)
59,503 66,040
RISK MANAGEMENT OBJECTIVES AND POLICIES33
The Group is exposed to market risk through its use of financial instruments and specifically to currency risk, interest rate risk, credit risk, liquidity risk and certain other price risks, which result from both its operating and investing activities. The Group’s risk management is coordinated at its headquarters, in close co-operation with the Board of Directors, and focuses on actively securing the Group’s short to medium-term cash flows by minimising the exposure to financial markets.
The Group does not actively engage in the trading of financial assets for speculative purposes nor does it write options. The most significant financial risks to which the Group is exposed and a summary of financial assets and liabilities by category are described below:

103
RISK MANAGEMENT OBJECTIVES AND POLICIES (CONTINUED)33
Foreign currency denominated financial assets and liabilities, translated into US Dollars at the closing rate, are as follows:
2015$000
2014$000
Sterling Other Sterling Other
Financial assets 44 5,423 186 3,725
Financial liabilities (123) (4,497) – (8,000)
Short-term exposure (79) 926 186 (4,275)
Financial liabilities – – – –
Long-term exposure – (3,265) – –
At December 31 (79) (2,339) 186 (4,275)
The following table illustrates the sensitivity of the net result for the year and equity in regards to the Group’s financial assets and financial liabilities and the US Dollar – Sterling exchange rate.
It assumes a +/– 5% change of the Sterling/US-Dollar exchange rate. This percentage has been determined based on the average market volatility in exchange rates in the year ended December 31, 2015. The sensitivity analysis is based on the Group’s foreign currency financial instruments held at each balance sheet date.
If Sterling had strengthened against the US Dollar by 5% (2014: 5%) then this would have had the following impact:
2015$000
2014$000
Profit after tax for the year (3) 8
Equity (101) (297)
If Sterling had weakened against the US Dollar by 5% (2014: 5%) then this would have had the following impact:
2015$000
2014$000
Profit after tax for the year 3 (8)
Equity 101 297
Exposures to foreign exchange rates vary during the year depending on the volume of overseas transactions. Nonetheless, the analysis above is considered to be representative of the Group’s exposure to currency risk.
FOREIGN CURRENCY SENSITIVITY
Exposures to currency exchange rates arise from the Group’s overseas sales and costs, which are primarily denominated in Sterling.

104
RISK MANAGEMENT OBJECTIVES AND POLICIES (CONTINUED)33
INTEREST RATE SENSITIVITY
The Group’s policy is to minimise interest rate cash flow risk exposures on long-term financing, through interest rate swaps. A large part of longer-term borrowings are, therefore, usually at fixed rates.
At December 31, 2015, the Group is exposed to changes in market interest rates through its bank borrowings, which are subject to variable interest rates – see Note 18 for further information.
The following table illustrates the sensitivity of the profit after tax for the year and equity to a reasonably possible change in interest rates of +/–0.25%, with effect from the beginning of the year. These changes are considered to be reasonably possible based on observation of current market conditions. The calculations are based on the Group’s financial instruments held at each balance sheet date. All other variables are held constant.
The Group’s credit risk is primarily attributable to its trade receivables. The amounts presented in the balance sheet are net of allowances for doubtful receivables, estimated by the Group’s management based on prior experience and their assessment of the current economic environment.
The Group continuously monitors defaults of customers and other counterparties, identified either individually or by group, and incorporates this information into its credit risk controls. Where available at reasonable cost, external credit ratings and/or reports on customers and other counterparties are obtained and used. The Group’s policy is to deal only with creditworthy counterparties.
A 0.25% increase in interest rates would have the following impact:
2015$000
2014$000
Profit after tax for the year (108) (67)
Equity (108) (67)
A 0.25% decrease in interest rates would have had the following impact:
2015$000
2014$000
Profit after tax for the year 108 67
Equity 108 67
Credit risk analysisThe Group’s maximum exposure to credit risk is limited to the carrying amount of financial assets recognised at the balance sheet date, as summarised below:
2015$000
2014$000
RestatedCash and cash equivalents 25,059 23,110
Trade receivables 45,475 40,225
70,534 63,335

105
The Group’s management considers that all the above financial assets that are not impaired for each of the reporting dates under review are of good credit quality, including those that are past due.
None of the Group’s financial assets are secured by collateral or other credit enhancements.
In respect of trade and other receivables, the Group is not exposed to any significant credit risk exposure to any single counterparty or any group of counterparties having similar characteristics. The credit risk for liquid funds and other short-term financial assets is limited, since the counterparties are reputable banks with high quality external credit ratings.
LIQUIDITY RISK ANALYSIS
The Group manages its liquidity needs by carefully monitoring scheduled debt servicing payments for long-term financial liabilities as well as cash-outflows due in day-to-day business. Liquidity needs are monitored in various time bands, on a day-to-day and week-to-week basis.
The Group maintains cash and marketable securities to meet its liquidity requirements. Funding for long-term liquidity needs is additionally secured by an adequate amount of committed credit facilities.
As at December 31, 2015, the Group’s liabilities have contractual maturities which are summarised below:
December 31, 2015 Current Non-Current
6 to 12 months
1 to 5 years
Over 5 years
within 6 months
$000 $000 $000 $000
Bank loans 5,016 – 87,696 –
Trade payables 49,856 – – –
Other short term financial liabilities 13,220 – – –
At December 31 68,092 – 87,696 –
This compares to the maturity of the Group’s financial liabilities in the previous reporting period as follows:
December 31, 2014 Current Non-Current
6 to 12 months
1 to 5 years
Over 5 years
within 6 months
$000 $000 $000 $000
Bank loans 90,251 – – –
Trade payables 44,047 – – –
Other short term financial liabilities 9,224 – – –
At December 31 143,522 – – –
RISK MANAGEMENT OBJECTIVES AND POLICIES (CONTINUED)33

106
RISK MANAGEMENT OBJECTIVES AND POLICIES (CONTINUED)33
SUMMARY OF FINANCIAL ASSETS AND LIABILITIES BY CATEGORY
The carrying amounts of the Group’s financial assets and liabilities as recognised at the balance sheet date of the reporting periods under review may also be categorised as follows. See Note 1, significant accounting policies, covering financial assets, financial liabilities and derivative financial instruments and hedge accounting for explanations about how the category of instruments affects their subsequent measurement.
2015$000
2014$000
Restated
Current assets
Derivative financial instruments carried at fair value through profit and loss:
– Forward exchange contract 18 –
Loans and receivables:
– Trade receivables 45,475 40,225
– Cash and cash equivalents 25,059 23,110
70,552 63,335
Non-current liabilities
Financial liabilities measured at amortised cost:
– Borrowings 79,562 –
79,562 –
Current liabilities
Derivative financial instruments carried at fair value through profit and loss:
– Forward exchange contract – 67
Derivative financial instruments designated as hedging instruments:
– Interest rate swap 10 –
Financial liabilities measured at amortised cost:
– Borrowings 5,000 89,150
– Trade payables 49,856 44,047
54,866 133,264CAPITAL RISK MANAGEMENT
The Group manages its capital to ensure that entities in the Group will be able to continue as going concerns while maximising the return to shareholders through an optimal balance of debt and equity. The capital structure of the Group consists of debt, which includes the borrowings disclosed in Notes 17, 18 and 22, cash and cash equivalents and equity attributable to equity holders of the parent, comprising share capital and reserves as disclosed in the consolidated statement of changes in equity on page 73.
The Board reviews the capital structure, including the level of indebtedness and interest cover, as required. The Board’s objective is to maintain the optimal level of indebtedness and manage interest cover to comply with the covenant requirements set out in Note 18. As part of this review, the Board considers the cost of capital and the risks associated with each class of capital. Details of the level of indebtedness, in the form of net debt to EBITDA, and interest cover are given in Note 32, including a comparison with the covenants under the Group’s financing facilities.

107
On March 4, 2015, the Group acquired 100% of the equity share capital of Lewes Holdings Limited and its subsidiary company Ivy Press Limited (“Ivy Press”) for a total consideration of $1.9m, plus the assumption of $0.3m of debt. Ivy Press specialises in illustrated book publishing. The consideration was payable in three tranches: on completion, on July 1, 2015, and January 4, 2016. Transaction costs of $0.3m were incurred in relation to the acquisition (see Note 4). The transaction has been accounted for by the acquisition method of accounting. These companies were acquired because of their strategic fit within the Group.
Fair values$000
Net assets acquired
Intangibles 1,365
Property, plant and equipment 2
Intangible assets – pre-publication costs 2,001
Inventories 282
Trade and other receivables 1,397
Cash 114
Trade and other payables (2,757)
Borrowings (383)
Tax recoverable 15
Deferred tax (394)
1,642
Goodwill 269
Total consideration (including deferred consideration) 1,911
Net cash outflow arising on acquisition in the year
Cash consideration 1,247
Less: Cash acquired (114)
Net Cash consideration 1,133
Add: Borrowings repaid 383
1,516
The goodwill of $269,000 arising on the acquisitions is largely attributable to the anticipated incremental sales and cost synergies with being part of The Quarto Group and is expected to be deductible for tax purposes.
If the acquisitions had been completed on the first day of the financial year, Group revenues for the period would have been $183,473,000 and Group profit attributable to the equity holders of the Parent would have been $9,179,000. The revenue and operating profit of Ivy Press since the acquisition date included in the consolidated statement of comprehensive income for the year ended December 31, 2015 were $8,075,000 and $1,946,000 respectively.
ACQUISITIONS34

108
RESTATEMENT OF PRIOR YEAR RESULTS35
The results have been restated for the following items:
a. Classification of the amortisation of debt issuance costs The amortisation of debt issuance costs was previously included within administrative expenses. The policy on these costs has been changed to better reflect the underlying nature as a financing cost. The reclassified amount for the year ended December 31, 2014 was $720,000.
b. Insurance arrangements and related revenue recognition A review of certain insurance arrangements across the Group identified that in limited circumstances the Group remains the principal insurer of product shipments in transit.
In these circumstances it was determined that it was inappropriate to recognise the related revenue until the shipment was receipted by the customer, This correction is limited to the Books & Direct Gifts business only. The impact of the results of the business for the year ended December 31, 2014 was a reduction in profit after tax of $128,000.
c. Allocation of overheads to inventories A review of the inventory costing model across the Group identified some inconsistency in the allocation of overheads to inventories. The inconsistency was limited to the Books & Gifts direct business only and has been corrected. The impact of the results of the business for the year ended December 31, 2014 was an increase in profit after tax of $8,000.
CONDENSED CONSOLIDATED INCOME STATEMENT FOR THE YEAR ENDED DECEMBER 31, 2014
2014 $000
Reported
a $000
b $000
c $000
2014 $000
Restated Revenue 172,644 – (1,305) – 171,339Cost of sales (117,437) – 1,123 (12) (116,326)
Gross profit 55,207 – (182) (12) 55,013Other operating income 22 – – – 22Distribution costs (6,747) – – – (6,747)Administrative expenses (33,089) 720 – – (32,369)
Operating profit before amortisation of acquired intangibles and exceptional items
15,393 720 (182) (12) 15,919
Amortisation of acquired intangibles (503) – – – (503)Exceptional items 566 – – – 566
Operating profit 15,456 720 (182) (12) 15,982Finance income 151 – – – 151Finance costs (3,408) (720) – – (4,128)
Profit before tax 12,199 – (182) (12) 12,005Taxation (2,980) – 54 4 (2,922)
Profit for the year 9,219 – (128) (8) 9,083

109
CONDENSED CONSOLIDATED BALANCE SHEET AS AT DECEMBER 31, 2014
CONDENSED CONSOLIDATED BALANCE SHEET AS AT DECEMBER 31, 2013
2014$000
Reported
a$000
b$000
c$000
2014$000
Restated Inventories 23,347 – 2,294 (790) 24,851Trade and other receivables 54,616 – (2,876) – 51,740Deferred tax liabilities (6,338) – 176 236 (5,926)
Impact on net assets 71,625 – (406) (554) 70,665
Impact on total equity 51,695 – (406) (554) 50,735
2013$000
Reported
a$000
b$000
c$000
2013$000
Restated Inventories 19,181 – 1,277 (779) 19,679Trade and other receivables 56,043 – (1,694) – 54,349Deferred tax liabilities (5,844) – 125 234 (5,485)
Impact on net assets 69,380 – (292) (545) 68,543
Impact on total equity 46,847 – (292) (545) 46,010
RESTATEMENT OF PRIOR YEAR RESULTS (CONTINUED)35

110
SHARE-BASED PAYMENTS36
PERFORMANCE SHARE PLAN (“PSP”)
The Company operates a PSP scheme that awards free shares.
2014 award
The awards under this scheme were granted on May 22, 2014 and vest on June 30, 2016. Vesting is conditional on the average share price being equal to or greater than £2.50 over any consecutive period of 90 days during the performance period, adjusted for dividends and other cash distributions paid, where the minimum value of such dividends and other cash distributions paid is no less than £2.25p per share. Participants are entitled to receive dividend equivalents over the vesting period of the awards, which are payable on vesting.
For the year ended December 31, 2014 the awards under this scheme were valued at $nil as the performance criteria were not expected to be met.
During the year ended December 31, 2015 the performance criteria was amended such that vesting is only conditional on the average share price being equal to or greater than £2.50 over any consecutive period of 90 days during the performance period. Following this change, the fair value of the award was reassessed at $226,000.
2015 award
The awards under this scheme were granted on September 24, 2015. The vesting period is 4 years from the date of grant. The award vests in the following proportion:
• 50% is conditional on the cumulative growth in Adjusted Diluted EPS being between 5% and 10% over the performance period, resulting in the awards vesting on a sliding scale of 20% to 100%; and
• 50% is conditional on Total Shareholder Return being between 7% and 15%, resulting in vesting on a sliding scale of 20% to 100%.
Participants are not entitled to receive dividends until awards have vested.
Number of share optionsOutstanding at beginning of the year 666,666
Granted during the period –
Outstanding at the end of the year 666,666
Share price at date of grant £1.70
Expected life (years) 2.1
Fair value per award £0.23
Weighted average remaining contractual life 0.5 years
Dividend yield n/a
Expected volatility of share price (%) 16.6
Model used Monte-Carlo

111
Number of share optionsOutstanding at beginning of the year –
Granted during the period 143,732
Outstanding at the end of the year 143,732
The key inputs used to value the options are:
EPS Portion TSR PortionShare price at date of grant £2.09 £2.09
Expected life (years) 4 4
Fair value per award £1.78 £1.07
Weighted average remaining contractual life (years) 3.67 3.67
Dividend yield (%) 3.97 3.97
Expected volatility of share price (%) n/a 19.0
Model used Dividend discount Monte-Carlo
Details of the share options outstanding during the year are as follows.
SHARE-BASED PAYMENTS (CONTINUED)36

112 COMPANY BALANCE SHEET AT DECEMBER 31, 2015
Notes
2015$000
2014$000
Fixed assets
Investments 3 8,444 12,060
8,444 12,060
Current assets
Cash at bank and in hand – –
Current liabilities
Creditors: Amounts falling due within one year 5 (20,992) (19,565)
Net current liabilities (20,992) (19,565)
Net liabilities (12,548) (7,505)
Capital and reserves
Called up share capital 6 2,045 2,045
Treasury stock 6 (634) (634)
Reserves – Paid in surplus 33,764 33,764
– Profit and loss (47,723) (42,680)
Shareholders’ deficit (12,548) (7,505)
The financial statements were approved by the Board of Directors and authorised for issue on March 30, 2016. They were signed on its behalf by
M. D. Connole Director March 30, 2016

113COMPANY STATEMENT OF CHANGES IN EQUITY FOR THE YEAR ENDED DECEMBER 31, 2015
Share capital $000
Paid in surplus$000
Treasury stock $000
Retained earnings
$000
Equity attributable to
owners $000
Balance at December 31, 2013 and January 1, 2014
2,045 33,764 (634) (40,578) (5,403)
Profit for the year – – – – –
Other comprehensive income
Foreign exchange translation differences – – – 465 465
Total comprehensive income for the year – – – 465 465
Transactions with owners
Dividends to shareholders – – – (2,567) (2,567)
Balance at December 31, 2014 and December 31, 2014
2,045 33,764 (634) (42,680) (7,505)
Loss for the year – – – (3,802) (3,802)
Other comprehensive income
Foreign exchange translation differences – – – 1,075 1,075
Total comprehensive income for the year – – – 1,075 1,075
Transactions with owners
Dividends to shareholders – – – (2,502) (2,502)
Share based payments 186 186
Balance at December 31, 2015 2,045 33,764 (634) (47,723) (12,548)

114 NOTES TO COMPANY BALANCE SHEET AT DECEMBER 31, 2015
The separate financial statements of the Company are presented and have been prepared in accordance with Financial Reporting Standard 102 (FRS 102) issued by the Financial Reporting Council. These financial statements present information for the Company, not about its Group, which is presented on pages 71 to 111.
BASIS OF PREPARATION
The financial statements have been prepared in accordance with applicable accounting standards and under the historical cost accounting rules modified to include certain items as fair value and in accordance with FRS 102. FRS 102 was adopted from 1 January 2015. No adjustments were required and no restatements of prior year figures were necessary. The financial statements have been prepared using the going concern basis, as discussed in the Group going concern disclosure on page 76.
ACCOUNTING POLICIES
The following accounting policies have been applied consistently in dealing with items which are considered material in relation to the financial statements.
The functional currency of the company is Pounds Sterling, with the parent company accounts presented in US Dollars.
INVESTMENTS
Investments in subsidiaries are stated at cost less, where appropriate, provisions for impairment.
CREDITORS
Amounts owed to subsidiary undertakings are initially recognised at fair value, and subsequently measured at amortised cost using the effective interest method.
SHARE-BASED PAYMENTS
The Group issues equity settled share-based payments to certain employees. Equity settled share-based payments are measured at fair value at the date of grant. The fair value, determined at the grant date, of equity settled share–based payments is expensed on a straight line basis over the vesting period, based on the Group’s estimate of shares that will eventually vest.
The fair value of employee share option grants is calculated using a Monte Carlo model, taking into account the terms and conditions upon which the options were granted. The value of the charge is adjusted to reflect expected and actual levels of options vesting. Further detail is set out in Note 36.
CASH AND CASH EQUIVALENTS
There were no cash transactions during the year and accordingly no cash flow statement has been presented.
SIGNIFICANT ACCOUNTING POLICIES1

115
FOREIGN CURRENCIES
Transactions in foreign currencies are translated at the foreign exchange rate ruling at the date of the transaction. Monetary assets and liabilities denominated in foreign currencies at the balance sheet date are translated at the exchange rate ruling at that date with any exchange differences arising on retranslation being recognised in the income statement.
The assets and liabilities of foreign operations, including goodwill and fair value adjustments arising on consolidation, are translated into US Dollars at exchange rates ruling at the balance sheet date. The revenues and expenses of foreign operations are translated into US Dollars at average annual exchange rates. Foreign exchange differences arising on retranslation are charged or credited to other comprehensive income and are recognised in the currency translation reserve in equity. On disposal of a foreign operation, the related cumulative translation differences recognised in equity are reclassified to profit or loss and are recognised as part of the gain or loss on disposal.
FINANCIAL GUARANTEE CONTRACTS
Where the Company enters into financial guarantee contracts to guarantee the indebtedness of other companies within its group, the Company considers these to be insurance arrangements, and accounts for them as such. In this respect, the Company treats the guarantee contract as a contingent liability until such time as it becomes probable that the Company will be required to make a payment under the guarantee.
The loss for the financial year dealt with in the financial statements of the parent company was $3,802,000 (2014: $nil). No separate profit and loss account is presented in respect of the parent company as permitted by section 408 of the Companies Act 2006.
LOSS ATTRIBUTABLE TO THE COMPANY2
$000
At January 1, 2015 12,060
Amounts written off during year (3,616)
At December 31, 2015 8,444
INVESTMENTS3

116
SUBSIDIARIES4
Name Place and date of incorporation
Issued and fully paid share capital
Percentage held
Segment
Books & Gifts Direct (Pty) Limited
Australia 3 December, 1990
100,004 shares of A$1 each 100 Books & Gifts Direct, ANZ
Books & Gifts Direct Limited New Zealand 27 September, 1996
400,000 shares of NZ$1 each 100* Books & Gifts Direct, ANZ
Quarto Publishing plc United Kingdom 1 April, 1976
100,000 shares of £1 each 100* Quarto International Co-Editions Group
Quarto, Inc. Delaware, USA 16 October, 1986
86 shares of no par value 100* Quarto International Co-Editions Group
RotoVision S.A. Switzerland 18 July, 1977
1,500 shares of SFr500 each 100* Quarto International Co-Editions Group
Global Book Publishing Pty. Limited
Australia 4 November, 1999
1,000 shares of A$1 each 100* Quarto International Co-Editions Group
Apple Press Limited United Kingdom5 June, 1984
100 shares of £1 each 100 Quarto International Co-Editions Group
Small World CreationsLimited
United Kingdom20 September, 1997
1,536 share of £1 each 100 Quarto International Co-Editions Group
Lewes Holdings Limited United Kingdom 21 July, 2005
20,840 shares of £0.01 each 100 Quarto International Co-Editions Group
Aurum Press Limited United Kingdom 31 May, 1977
382,502 shares of £1 each 100 Quarto Publishing Group UK
Jacqui Small LLP United Kingdom 6 November, 1998
100 units 100 Quarto Publishing Group UK
Frances Lincoln Limited United Kingdom 15 December, 1980
565,000 shares of 10p each 100 Quarto Publishing Group UK
Quarto Publishing Group USA Inc.
Delaware, USA 28 June, 2004
380 shares of US$0.01 each 100 Quarto Publishing Group USA
Regent Publishing Services Limited
Hong Kong 23 October, 1985
1,000 shares of HK$10 each 75 Quarto HK
* Directly held by The Quarto Group, Inc.
TRADING COMPANIES

117
Name Place and date of incorporation Issued share capital
Percentage held
AP Screen Printers Limited United Kingdom – 30 September, 1980 1000 shares of £1 each 100
Cartographica Press Limited United Kingdom – 27 July, 1981 1000 shares of £1 each 100
Design Eye Holdings Limited United Kingdom – 22 June, 1992 200 shares of £1 each 100
Design Eye Limited United Kingdom – 18 March, 1988 100 shares of £1 each 100
Design Eye Publishing Limited United Kingdom – 17 June, 1992 2 shares of £1 each 100
Fine Wine Editions Limited United Kingdom – 23 June, 1949 9020 shares of £1 each 100
Frances Lincoln Publishers Limited United Kingdom – 11 March, 1987 100 shares of £1 each 100
Great American Trading Company Limited (THE) United Kingdom – 24 February, 1982 100 shares of £1 each 100
Global Book Publishing Pty Limited United Kingdom – 7 July, 1986 1000 shares of £1 each 100
IQON Editions Limited United Kingdom – 5 December, 1972 300 shares of £1 each 100
iqu-digital.com Limited United Kingdom – 30 November, 1978 100 shares of £1 each 100
JR Books Limited United Kingdom – 9 September, 1986 43 004 shares of £1 each 100
Marshall Editions Limited United Kingdom – 7 February, 2002 1 shares of £1 each 100
Marshall Publishing Limited United Kingdom – 7 February, 2002 1 shares of £1 each 100
Quarto Magazines Limited United Kingdom – 20 May, 1986 1000 shares of £1 each 100
Quarto Children's Books Limited United Kingdom – 6 January, 1976 2 shares of £1 each 100
QED Publishing Limited United Kingdom – 12 November, 1974 400 shares of £1 each 100
Quantum Books Limited United Kingdom – 7 February, 1983 100 shares of £1 each 100
Quarto Multi-Media Limited United Kingdom – 14 December, 1984 1000 shares of £1 each 100
QU:ID Publishing Limited United Kingdom – 30 September, 1980 100 shares of £1 each 100
Quill Publishing Limited United Kingdom – 14 May, 1979 1000 shares of £1 each 100
Quintessence Editions Limited United Kingdom – 7 February, 2002 1 shares of £1 each 100
Quintet Publishing Limited United Kingdom – 14 May, 1979 100 shares of £1 each 100
QEB Publishing Limited Delaware, USA – 27 April, 2004 1500 shares of no par value 100
Quarto Media Inc Delaware, USA – 10 December, 2010 1000 shares of $1 each 100
Quarto Marketing Inc Delaware, USA – 26 April, 1995 3000 shares of no par value 100
EYE Quarto Inc Delaware, USA – 19 December, 2002 1000 shares of no par value 100
DORMANT COMPANIES

118
2015$000
2014$000
Amounts owed to subsidiary undertakings 20,992 19,565
CREDITORS: AMOUNTS FALLING DUE WITHIN ONE YEAR5
Details of called up share capital and treasury stock are set out in Notes 24 to 25 of the consolidated financial statements.
CALLED UP SHARE CAPITAL AND TREASURY STOCK6
The Quarto Group, Inc. has issued guarantees in respect of bank loans of subsidiaries of $84,562,000 (2014: $89,150,000). Refer to Note 18.
CONTINGENT LIABILITIES7
The company borrowed an amount of $2,511,000 from its wholly owned subsidiary, Quarto Publishing plc, during the year (2014: $2,567,000 borrowed in the year). The balance on the loan at December 31, 2015 was $14,995,000 (2014: $13,255,000).
RELATED PARTY DISCLOSURE8

119FIVE YEAR SUMMARY
2015$000
2014*$000
2013*$000
2012*$000
2011*$000
Results
Revenue 182,165 171,339 175,481 180,632 185,937
Operating profit before amortisation of acquired intangibles and exceptional items 17,206 15,919 14,565 14,986 14,594
Operating profit 16,037 15,982 10,726 12,962 12,570
Profit before tax, amortisation of acquired intangible assets and exceptional items 14,108 11,942 9,294 9,034 10,844
Profit before tax 12,939 12,005 5,455 7,010 9,315
Profit after tax 9,254 9,083 3,761 5,124 7,681
Assets employed
Non-current assets 104,433 102,416 102,364 106,537 105,452
Current assets 108,369 99,701 97,907 106,157 117,482
Current liabilities (70,635) (144,918) (70,485) (67,002) (137,898)
Non-current liabilities (87,127) (6,464) (83,776) (98,019) (41,608)
Net assets 55,040 50,735 46,010 47,673 43,428
Financed by
Equity 49,881 45,794 41,201 40,726 36,741
Non-controlling interests 5,159 4,941 4,809 6,947 6,687
55,040 50,735 46,010 47,673 43,428
Key statistics (cents)
Basic 45.0 44.5 17.0 23.9 36.8
Diluted 44.9 44.5 17.0 23.9 36.8
Adjusted basic 49.9 44.1 36.1 41.6 43.6
Adjusted diluted 49.8 44.1 36.1 41.6 43.6
* Restated for prior year adjustments as set out in Note 35.

120
DIRECTORS
Timothy Chadwick (Non-executive Chairman) Robert Morley (Deputy Chairman) Marcus Leaver (CEO) Michael Connole, FCA (CFO) Jess Burley (Non-executive) Michael Hartley (Non-executive) Christopher Mills (Non-executive)
SECRETARY
Clive Potterell, ACIS
PRINCIPAL OFFICE
The Old Brewery 6 Blundell Street London N7 9BH Tel: +44 (0) 7700 6700
STOCKBROKERS
Stockdale Securities Limited Beaufort House 15 St Botolph Street London EC3A 7BB
AUDITOR
Deloitte LLP 2 New Street Square London EC4A 3BZ
SOLICITORS
Olswang LLP 90 High Holborn London WC1V 6XX
REGISTRARS AND TRANSFER OFFICE
Capita Asset Services The Registry 34 Beckenham Road Beckenham Kent BR3 4TU
PRINCIPAL BANKERS
Bank of America Corporation 100 Federal Street Boston MA 02110 USA
Fifth Third Bank 38 Fountain Square Plaza MD 109055 Cincinatti OH 45263 USA
Santander UK plc 4th Floor Santander House 100 Ludgate Hill London EC4M 7RE
The Royal Bank of Scotland plc 280 Bishopsgate London EC2M 4RB
COMPANY REGISTRATION NUMBER
FC0 13814
OFFICERS & PROFESSIONAL ADVISERS

WHERE TO FIND USThe Quarto Group, Inc+44 20 7700 9004
Marcus Leaver, CEO E [email protected]
Michael Connole, CFO E [email protected]
The Old Brewery, 6 Blundell Street, London, N7 9BH
www.quarto.com Twitter: @TheQuartoGroup
AMY YODANIS VP/Marketing Director
Cicchetti Jacqui Small
MICHELLE FAULKNER Editorial Director
The Art Of The Snowflake Voyageur Press
SHERRY ANISI Contracts & Licensing Assistant
The Easy Vegetarian Kitchen Fair Winds Press
ALAN BROWN Design Manager
Cars: A Complete History Quarto Children’s Books

JAMES CAREY Director of Publishing Operations, UK
Actual Size Frances Lincoln Children’s Books
AGATA RADKIEWICZ Foreign Rights Manager
Doodling For Cat People Walter Foster
ISHEETA MUSTAFI Editorial Director
Braids, Buns And Twists! RotoVision
BRAD SPRINGER Senior Art Director
The Doors Voyageur Press
RAGE KINDELSPERGER Editorial Director, Gifts & Stationery
Papercut Rockport Publishers
JENNY BROOM Editorial Director
Amazing Grace Frances Lincoln Children’s Books
#WEAREBOOKS #WEAREPEOPLE#WEAREQUARTO