Embed Size (px)
Citation preview
2017 ANNUAL REPORT
GENEVA PROJECT AREA
VINEYARD TOWN REDEVELOPMENT AGENCY
2015 ANNUAL REPORT
GENEVA PROJECT AREA VINEYARD TOWN REDEVELOPMENT AGENCY
NOVEMBER 1ST REPORT
Dated as of November 1, 2017
Prepared by Lewis Young Robertson & Burningham, Inc.
In compliance with Utah Code Section 17C-1-603 and 17C-1-402(9)(b)
Page | 2
2017 ANNUAL REPORT – GENEVA URA
NOVEMBER 1, 2017
Table of Contents INTRODUCTION .............................................................................................................. 3
SUMMARY OF REQUESTED FUNDS ................................................................................ 3
OVERVIEW OF THE GENEVA URA PROJECT AREA ........................................................ 3
SOURCES OF FUNDS ......................................................................................................................................................................................... 4
USES OF FUNDS ................................................................................................................................................................................................... 4
SCHOOL DISTRICT OBLIGATIONS AND INCENTIVES ......................................................................................................................... 5
DEVELOPMENT OBLIGATIONS AND INCENTIVES ................................................................................................................................. 5
NEW PHASES .................................................................................................................. 6
PROJECT AREA REPORTING AND ACCOUNTABILITY .................................................... 7
RELATIVE GROWTH IN ASSESSED VALUE ................................................................................................................................................. 7
BENEFITS DERIVED BY PARTICIPATING TAXING ENTITIES ................................................................................................................ 7
NOTABLE DEVELOPMENT AND FUTURE PROJECTS ............................................................................................................................. 8
FORECASTED PROJECT AREA BUDGET UPDATE .......................................................... 8
OTHER ISSUES ....................................................................................................................................................................................................... 8
PROJECT AREA ANNUAL AND MULTI-YEAR BUDGETS .................................................. 9
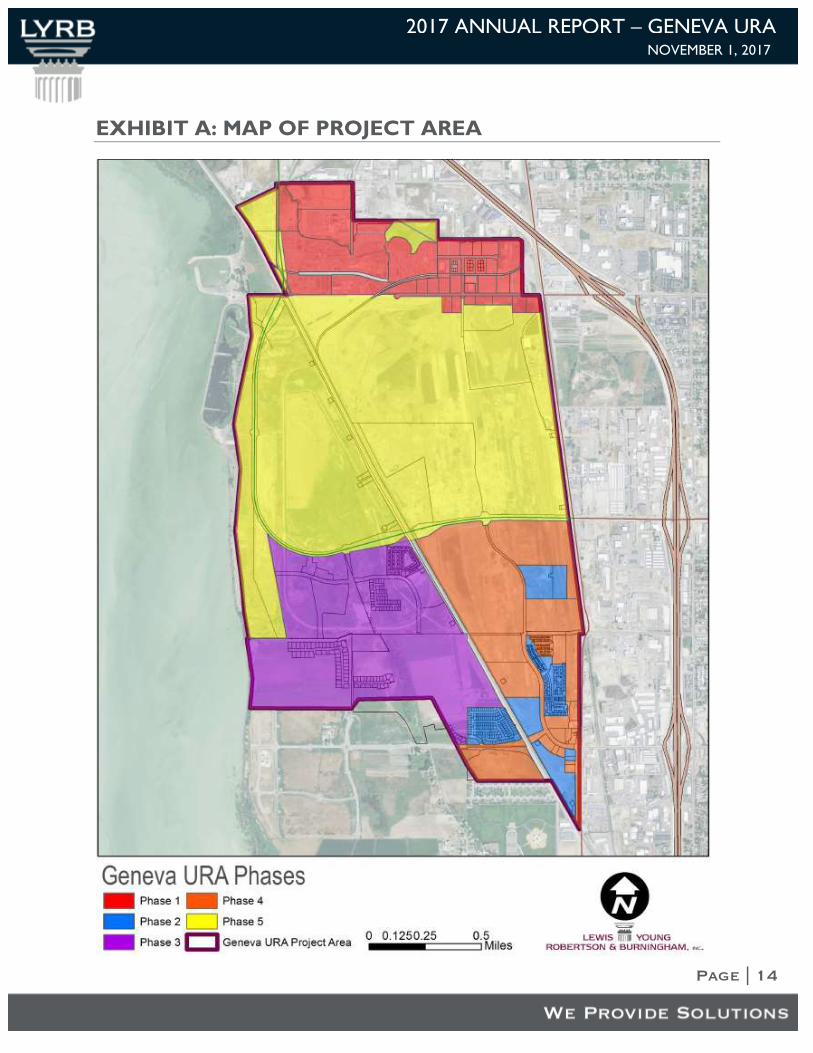
EXHIBIT A: MAP OF PROJECT AREA............................................................................. 14
Page | 3
2017 ANNUAL REPORT – GENEVA URA
NOVEMBER 1, 2017
INTRODUCTION Lewis Young Robertson & Burningham, Inc. (“LYRB”) has been retained by the Vineyard Town
Redevelopment Agency (the “Agency”) to assist with the management of the Agency’s Geneva URA
project area. LYRB has compiled the various creation and related documents associated with the Geneva
project area, created annual and multi-year budgets, and created a proprietary Excel-based software
package to manage the Agency’s RDAs.
The purpose of this report, in part, is to fulfill the requirements of Utah Code section 17C-1-402(9)(b)
and section 17C-1-603 – Agency Report. This report facilitates the RDA’s compliance with the new code
adopted in 2011, providing the data necessary to fulfill these new reporting requirements. This section of
Utah Code mandates that the Agency provide an annual report to the County Auditor, the State Tax
Commission, the State Board of Education, as well as each of the taxing entities that levy a tax on property
from which the Agency collects tax increment. Provided in this report is an overview of the Geneva URA,
including a summaries of the current and projected budgets and identification of certain concerns/needs.
SUMMARY OF REQUESTED FUNDS The Agency requests all funds it is legally entitled to receive, and estimates those funds according to
the following chart:
ESTIMATE OF TAX INCREMENT TO BE PAID TO THE AGENCY Property Tax Increment Tax Year 2017
(Ending Dec. 31, 2017)
Tax Year 2018
(Beginning Jan. 1, 2018) Geneva URA $6,345,101 $7,474,658
OVERVIEW OF THE GENEVA URA PROJECT AREA
OVERVIEW Creation Year 2010
Initial Tax Increment Year 2012 FY
Expiration Year 2046 FY
Project Area Type URA
Project Area Acreage 2,055 Acres
Developed Acreage 713 Acres
Undeveloped Acreage 1,342Acres
Base Year 2006 TY
Base Value (Entire Project Area) $120,131,398
Base Value (Phase 1) $51,323,328
Base Value (Phase II) $58,181
Base Value (Phase III) $5,247,574
Base Value (Phase IV) $45,361,240
Project Area Purpose Contamination and Blight Remediation, Job Creation, Commercial Development
FY 2017 Tax Increment $6,067,383
The Geneva Project Area was created in February 2010, and is governed by the (a) “Geneva Urban
Renewal Area: Project Area Plan” amended February 9, 2011; and (b) the “Land Donation and
Page | 4
2017 ANNUAL REPORT – GENEVA URA
NOVEMBER 1, 2017
Reimbursement Agreement” dated July 27, 2011, by and between Vineyard Redevelopment Agency and
Anderson Geneva, LLC and Ice Castle Retirement Fund L.L.C. These documents define the duration and
use of property tax generated within the Project Area as well as conditions and obligations by the Agency
and the Developer.
The purpose of the Geneva Project Area was to redevelop over 2,055 acres of under-utilized real estate
which had been contaminated due to over a half century of heavy industrial use, provide the basis for
enhanced property tax and sales tax revenues, and create a large number of jobs with a wide range of skill
levels. The Geneva Project Area is fully encompassed in Vineyard Town boundaries and contains about
three-fourths of the Town’s land area on the north. A map of the Project Area is included as Exhibit A.
SOURCES OF FUNDS The Geneva Project Area began to receive property
tax increment from Phase 1 beginning with the taxes
collected in 2011 and remitted to the agency in
2012. The project area will continue for 35 years,
but tax increment will only be collected from each phase (once triggered) for a maximum of 25 years.
This means Phase 1 will have tax increment through and including taxes collected in 2035 and paid to the
Agency in 2036 and Phase 2 through 2039/2040. The last year of collection for any phases in the project
area will be taxes collected in 2045 and paid to the Agency in 2046. All of the taxing entities within the
project area contribute 75% of their tax increment, with 25% passing through back to the respective tax
entity, for each of the 35 years.
With the total increment received after applying the 75% participation rate, the Agency will pay costs
associated with RDA administration, low to moderate income housing, bonds, Alpine School District
mitigation, Anderson/UVU reimbursement, and other infrastructure or development agreements. The
total property tax increment collected by the Agency from tax increment received in 2017, calculated at
the participation rate of 75% as outlined above, was $6,067,383. This amount includes the $6,067,383 of
tax increment from current year property taxes.
USES OF FUNDS According to applicable governing documents,
the Agency will use 7% of the tax increment
received in 2017 for RDA Administration. This
percentage decreases in steps over the 35 years
to a low of 3% in tax year 2045. The total amount
allocated for RDA Administration for 2017 is
$372,465.
Prior to and including TY 2016, 20% of the tax
increment received was earmarked for use on
approved low to moderate income housing
projects. On May 22, 2013, the Agency passed
Resolution U-2013-2, which amended the
Geneva Urban Renewal Project Area Housing
Plan. In accordance with Resolution U-2013-2,
Exhibit A, housing funds will be used “to pay the cost of improvements related to housing located both in
and outside of the Project Area, including the reimbursement of such costs paid by the Town of Vineyard.”
The amendment allowed for funds to be used both inside and outside the project area, which is in
FY 2017 SOURCES OF FUNDS Property Tax Increment 6,067,383
Total Sources of Funds $6,067,383
FY 2017 USES OF FUNDS RDA Administration 372,465 Low/Moderate Housing 249,683
2012 TIF Bond 0
2013B TIF Bond 0
2015 SIB Bond 1,859,851
2016 TIF Refunding Bonds 1,238,166
2017 TIF Bond 0
Alpine SD Mitigation 0
Anderson/UVU Payment 563,682
Anderson/Megaplex Payment 136,631
Other Agency Projects 597,815
Available for Other Uses 1,049,090
Total Uses of Funds
$6,067,383
Page | 5
2017 ANNUAL REPORT – GENEVA URA
NOVEMBER 1, 2017
accordance with Utah Code 17C-1-411 and 412. In May 2016, Utah State Statute 17C-2-203 related to
housing was modified which released the Geneva URA from the obligations to set aside housing funds.
The remaining balance in the housing fund will be used according to the applicable state statutes as well
as the housing plans mentioned herein. Beginning TY 2016, the Agency will not set aside additional funds
as the remediation costs exceed 20% of the project area funds. In 2017, $249,683 was spent on purchasing
and installing streetlights on Mill Road.
Payments will also be made on bonds issued to cover approved expenses related to the project area. The
2012 TIF Bond was issued to pay for necessary infrastructure improvements to be completed within the
project area. In 2013, the Agency issued additional TIF bonds to pay for utility and transportation
infrastructure. As part of the 2013 issuance, a new general indenture was created. This caused the 2012
TIF Bonds to be refunded and the debt renamed 2013A TIF Bonds and the new issuance to be named the
2013B TIF Bonds. The Agency issued the 2015 Bonds which were purchased by the State Infrastructure
Bank (UDOT) to finance the relocation of a rail spur line within the Project Area including entering into
a contract with Union Pacific Rail Road (UPRR) who owns the rail. The 2015 Bonds were modified in
2016 to reduce the 2015 debt payment. In October 2016, the 2013A & B bonds were refunded by the
issuance of the 2016 Refunding bonds for economic savings. In 2017, additional Tax Increment bonds were
issued to cover approved expenses related to the project area.
SCHOOL DISTRICT OBLIGATIONS AND INCENTIVES
The Alpine School District Mitigation payment is calculated according to the provisions outlined in the
Geneva Urban Renewal Area: Project Area Plan and is designed to mitigate potential impacts on the School
District in the case that the District’s pass through increment is not sufficient to cover services to new
housing projects built in the project area. Based upon actual and projected housing units in the Project
Area, the total tax collections to the District will be more than the total expenditures for the students in
the District.
DEVELOPMENT OBLIGATIONS AND INCENTIVES
The Anderson/UVU payment is calculated in
accordance with the Land Donation and
Reimbursement Agreement between Vineyard
Redevelopment Agency and Anderson Geneva,
LLC, and Ice Castle Retirement Fund L.L.C. The
agreement allows up to $5 million to be paid to
Anderson Geneva, LLC to help incentivize the Utah
Valley University (UVU) land purchase. The $5
million will be paid out over time from the tax increment generated in the project area, excluding any
increment which comes from the power plant parcels described in the agreement. Each year 50% of the
new available tax increment, after all other obligations are paid, will be remitted to Anderson. In addition,
payments will not begin until after four necessary improvements have been completed. These
improvements include a new sewer lift station, a new sewer trunk line, a new water line, and a new
roadway connecting the UVU site to Geneva Road. In 2014, all the necessary improvements were
completed. The 2017 payment was for $563,682.
FY 2017 DEVELOPER
REIMBURSEMENT Anderson/UVU Payment $563,682 Anderson/Megaplex Payment $136,631 Waters Edge Payment $0
Total Developer Reimbursements $700,313
Page | 6
2017 ANNUAL REPORT – GENEVA URA
NOVEMBER 1, 2017
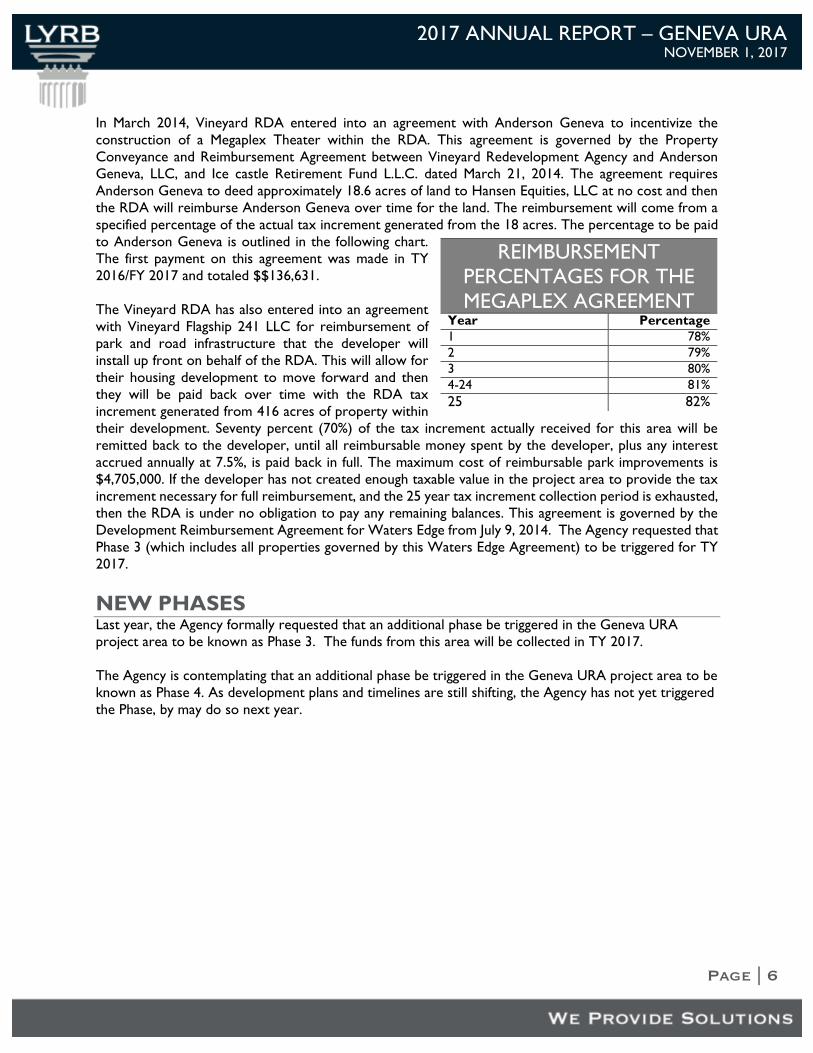
In March 2014, Vineyard RDA entered into an agreement with Anderson Geneva to incentivize the
construction of a Megaplex Theater within the RDA. This agreement is governed by the Property
Conveyance and Reimbursement Agreement between Vineyard Redevelopment Agency and Anderson
Geneva, LLC, and Ice castle Retirement Fund L.L.C. dated March 21, 2014. The agreement requires
Anderson Geneva to deed approximately 18.6 acres of land to Hansen Equities, LLC at no cost and then
the RDA will reimburse Anderson Geneva over time for the land. The reimbursement will come from a
specified percentage of the actual tax increment generated from the 18 acres. The percentage to be paid
to Anderson Geneva is outlined in the following chart.
The first payment on this agreement was made in TY
2016/FY 2017 and totaled $$136,631.
The Vineyard RDA has also entered into an agreement
with Vineyard Flagship 241 LLC for reimbursement of
park and road infrastructure that the developer will
install up front on behalf of the RDA. This will allow for
their housing development to move forward and then
they will be paid back over time with the RDA tax
increment generated from 416 acres of property within
their development. Seventy percent (70%) of the tax increment actually received for this area will be
remitted back to the developer, until all reimbursable money spent by the developer, plus any interest
accrued annually at 7.5%, is paid back in full. The maximum cost of reimbursable park improvements is
$4,705,000. If the developer has not created enough taxable value in the project area to provide the tax
increment necessary for full reimbursement, and the 25 year tax increment collection period is exhausted,
then the RDA is under no obligation to pay any remaining balances. This agreement is governed by the
Development Reimbursement Agreement for Waters Edge from July 9, 2014. The Agency requested that
Phase 3 (which includes all properties governed by this Waters Edge Agreement) to be triggered for TY
2017.
NEW PHASES Last year, the Agency formally requested that an additional phase be triggered in the Geneva URA
project area to be known as Phase 3. The funds from this area will be collected in TY 2017.
The Agency is contemplating that an additional phase be triggered in the Geneva URA project area to be
known as Phase 4. As development plans and timelines are still shifting, the Agency has not yet triggered
the Phase, by may do so next year.
REIMBURSEMENT
PERCENTAGES FOR THE
MEGAPLEX AGREEMENT Year Percentage 1 78% 2 79% 3 80% 4-24 81%
25 82%
Page | 7
2017 ANNUAL REPORT – GENEVA URA
NOVEMBER 1, 2017
PROJECT AREA REPORTING AND ACCOUNTABILITY
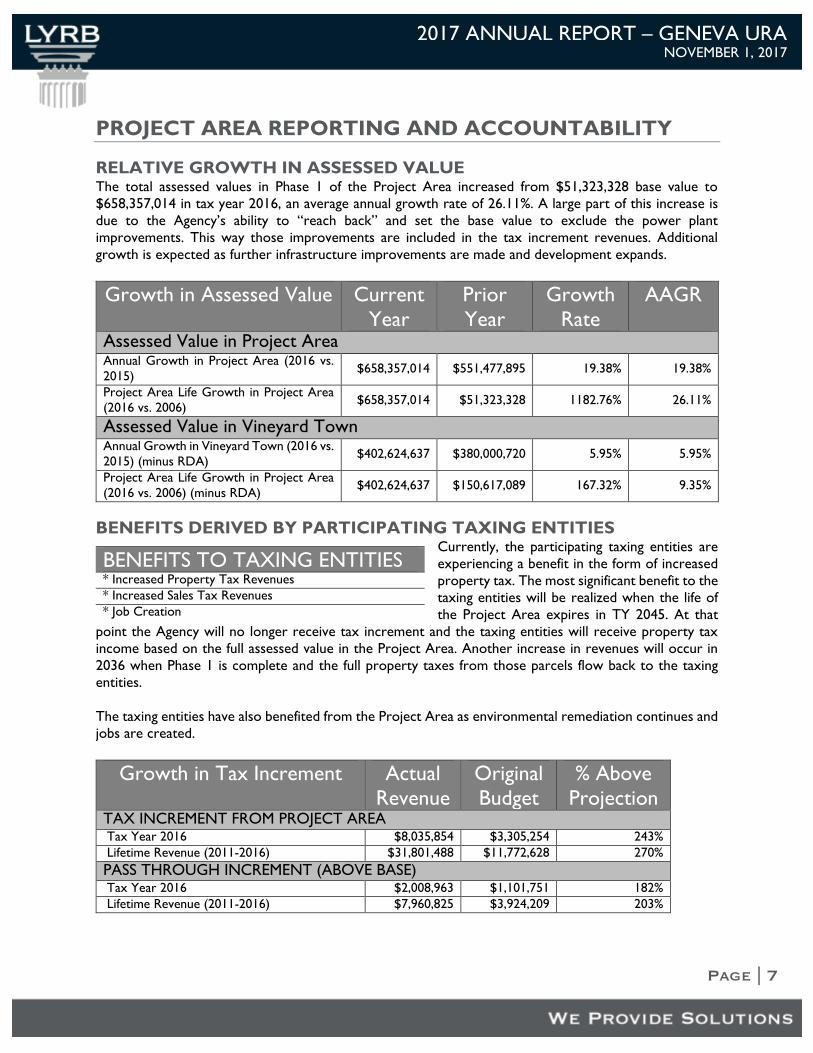
RELATIVE GROWTH IN ASSESSED VALUE The total assessed values in Phase 1 of the Project Area increased from $51,323,328 base value to
$658,357,014 in tax year 2016, an average annual growth rate of 26.11%. A large part of this increase is
due to the Agency’s ability to “reach back” and set the base value to exclude the power plant
improvements. This way those improvements are included in the tax increment revenues. Additional
growth is expected as further infrastructure improvements are made and development expands.
Growth in Assessed Value Current
Year
Prior
Year
Growth
Rate
AAGR
Assessed Value in Project Area Annual Growth in Project Area (2016 vs.
2015) $658,357,014 $551,477,895 19.38% 19.38%
Project Area Life Growth in Project Area
(2016 vs. 2006) $658,357,014 $51,323,328 1182.76% 26.11%
Assessed Value in Vineyard Town Annual Growth in Vineyard Town (2016 vs.
2015) (minus RDA) $402,624,637 $380,000,720 5.95% 5.95%
Project Area Life Growth in Project Area
(2016 vs. 2006) (minus RDA) $402,624,637 $150,617,089 167.32% 9.35%
BENEFITS DERIVED BY PARTICIPATING TAXING ENTITIES Currently, the participating taxing entities are
experiencing a benefit in the form of increased
property tax. The most significant benefit to the
taxing entities will be realized when the life of
the Project Area expires in TY 2045. At that
point the Agency will no longer receive tax increment and the taxing entities will receive property tax
income based on the full assessed value in the Project Area. Another increase in revenues will occur in
2036 when Phase 1 is complete and the full property taxes from those parcels flow back to the taxing
entities.
The taxing entities have also benefited from the Project Area as environmental remediation continues and
jobs are created.
Growth in Tax Increment Actual
Revenue
Original
Budget
% Above
Projection TAX INCREMENT FROM PROJECT AREA Tax Year 2016 $8,035,854 $3,305,254 243%
Lifetime Revenue (2011-2016) $31,801,488 $11,772,628 270%
PASS THROUGH INCREMENT (ABOVE BASE) Tax Year 2016 $2,008,963 $1,101,751 182%
Lifetime Revenue (2011-2016) $7,960,825 $3,924,209 203%
BENEFITS TO TAXING ENTITIES * Increased Property Tax Revenues * Increased Sales Tax Revenues * Job Creation
Page | 8
2017 ANNUAL REPORT – GENEVA URA
NOVEMBER 1, 2017
Due to greater value in the power plant parcels than originally projected, the Project Area has produced
more tax increment, and more pass through revenue for the taxing entities, than expected.
NOTABLE DEVELOPMENT AND FUTURE PROJECTS The Water’s Edge development is developing at a much faster pace than anticipated, they are nearing 50%
buildout. Other residential projects are underway on the east side of the project area. Additional projects
advanced or completed in 2017 including a) 500 residential units in the Waters Edge development, d) the
construction of 200,000 square feet of flex office space, e) the construction of 20,000 square feet of retail
Pads, f) the construction of an 18-acre residential park, g) the construction of a 6-acre residential park, h)
and the construction of 2 charter schools (Freedom Preparatory Academy & Franklin Discovery
Academy).
In FY 2017, the RDA funded remediation projects, streetlights on Main Street and Mill Road, Landscaping
on Main Street, public infrastructure for the Forge Development, and a SCADA system among other
potential projects. These projects were funded with bond proceeds, general RDA funds, and RDA housing
funds.
Development plans are moving forward for the Forge Development. The development is in the future
Phase 4 area and includes an office park, hotel, a parking structure, and retail.
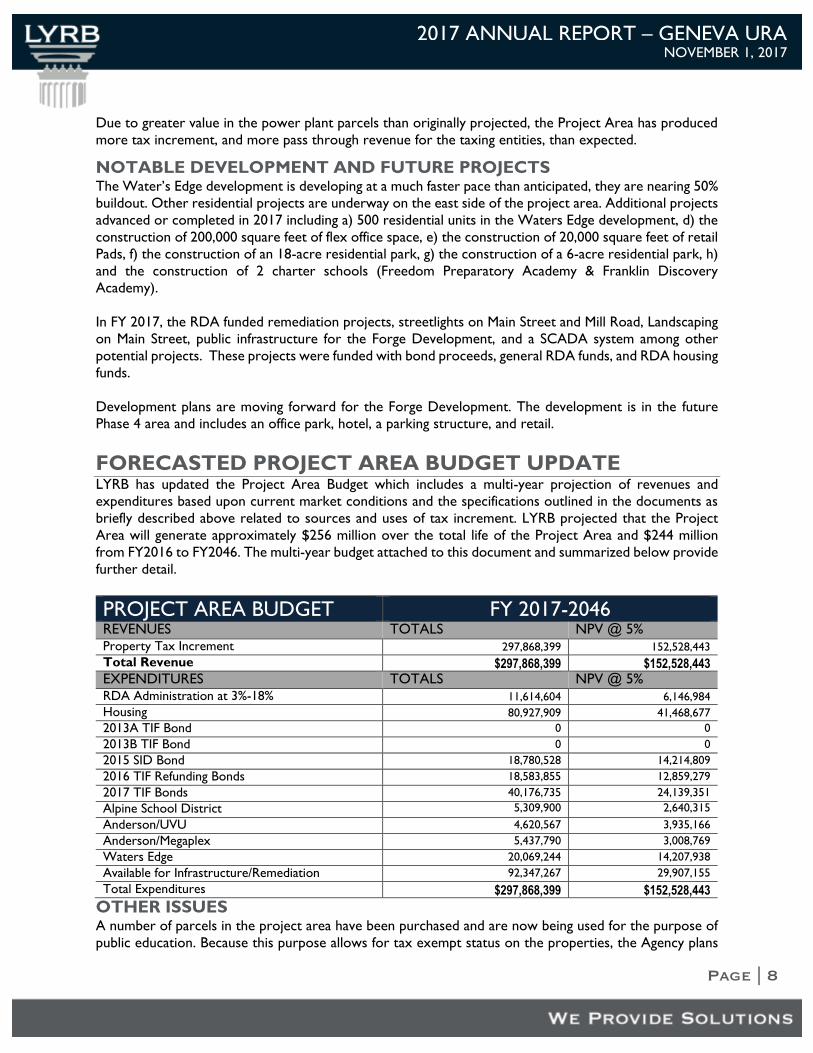
FORECASTED PROJECT AREA BUDGET UPDATE LYRB has updated the Project Area Budget which includes a multi-year projection of revenues and
expenditures based upon current market conditions and the specifications outlined in the documents as
briefly described above related to sources and uses of tax increment. LYRB projected that the Project
Area will generate approximately $256 million over the total life of the Project Area and $244 million
from FY2016 to FY2046. The multi-year budget attached to this document and summarized below provide
further detail.
PROJECT AREA BUDGET FY 2017-2046 REVENUES TOTALS NPV @ 5% Property Tax Increment 297,868,399 152,528,443
Total Revenue $297,868,399 $152,528,443
EXPENDITURES TOTALS NPV @ 5% RDA Administration at 3%-18% 11,614,604 6,146,984
Housing 80,927,909 41,468,677
2013A TIF Bond 0 0
2013B TIF Bond 0 0
2015 SID Bond 18,780,528 14,214,809
2016 TIF Refunding Bonds 18,583,855 12,859,279
2017 TIF Bonds 40,176,735 24,139,351
Alpine School District 5,309,900 2,640,315
Anderson/UVU 4,620,567 3,935,166
Anderson/Megaplex 5,437,790 3,008,769
Waters Edge 20,069,244 14,207,938
Available for Infrastructure/Remediation 92,347,267 29,907,155
Total Expenditures $297,868,399 $152,528,443
OTHER ISSUES A number of parcels in the project area have been purchased and are now being used for the purpose of
public education. Because this purpose allows for tax exempt status on the properties, the Agency plans
Page | 9
2017 ANNUAL REPORT – GENEVA URA
NOVEMBER 1, 2017
to renegotiate the project area’s base year value to an updated base year value. The updated base year
value will exclude the value that these parcels added to the original base year value.
LYRB believes that, according to the records reviewed, all parties are meeting their respective obligations
related to this Project Area.
PROJECT AREA ANNUAL AND MULTI-YEAR BUDGETS
The following four sheets represent the FY 2017, FY 2018, FY 2019 and abbreviated multi-year budget
from 2012 to 2046.

Page | 10
2017 ANNUAL REPORT – GENEVA URA
NOVEMBER 1, 2017
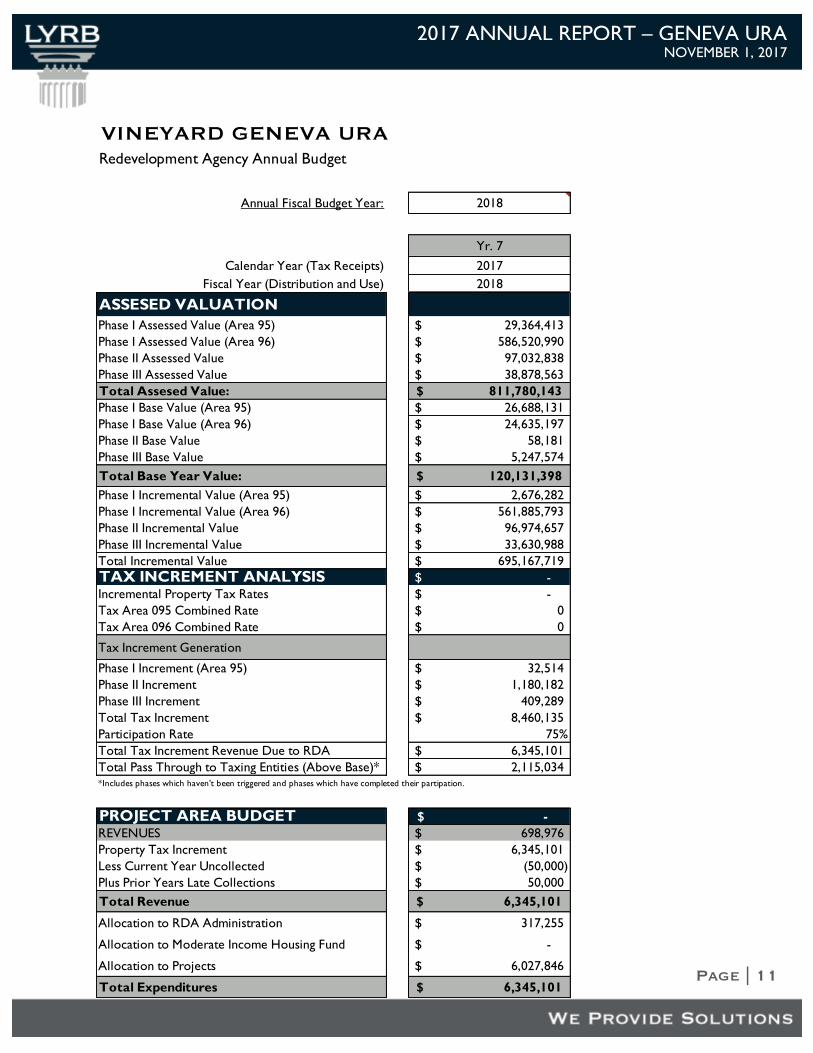
VINEYARD GENEVA URA
Redevelopment Agency Annual Budget
Annual Fiscal Budget Year: 2017
Yr. 6
Calendar Year (Tax Receipts) 2016
Fiscal Year (Distribution and Use) 2017
ASSESED VALUATION
Phase I Assessed Value (Area 95) 28,942,838$
Phase I Assessed Value (Area 96) 586,520,990$
Phase II Assessed Value 94,274,695$
Phase III Assessed Value 21,623,000$
Total Assesed Value: 791,344,863$
Phase I Base Value (Area 95) 26,688,131$
Phase I Base Value (Area 96) 24,635,197$
Phase II Base Value 58,181$
Phase III Base Value 5,247,574$
Total Base Year Value: 120,131,398$
Phase I Incremental Value (Area 95) 2,254,707$
Phase I Incremental Value (Area 96) 561,885,793$
Phase II Incremental Value 94,216,514$
Phase III Incremental Value -$
Total Incremental Value 658,357,014$
TAX INCREMENT ANALYSIS -$
Incremental Property Tax Rates -$
Tax Area 095 Combined Rate 0$
Tax Area 096 Combined Rate 0$
Tax Increment Generation
Phase I Increment (Area 95) 27,469$
Phase II Increment 1,150,007$
Phase III Increment -$
Total Tax Increment 8,035,854$
Participation Rate 75%
Total Tax Increment Revenue Due to RDA 6,067,383$
Total Pass Through to Taxing Entities (Above Base)* 2,008,963$ *Includes phases which haven't been triggered and phases which have completed their partipation.
PROJECT AREA BUDGET -$
REVENUES 568,242$
Property Tax Increment 6,067,383$
Less Current Year Uncollected (50,000)$
Plus Prior Years Late Collections 50,000$
Total Revenue 6,067,383$
Allocation to RDA Administration 364,043$
Allocation to Moderate Income Housing Fund -$
Allocation to Projects 5,703,340$
Total Expenditures 6,067,383$
Page | 11
2017 ANNUAL REPORT – GENEVA URA
NOVEMBER 1, 2017
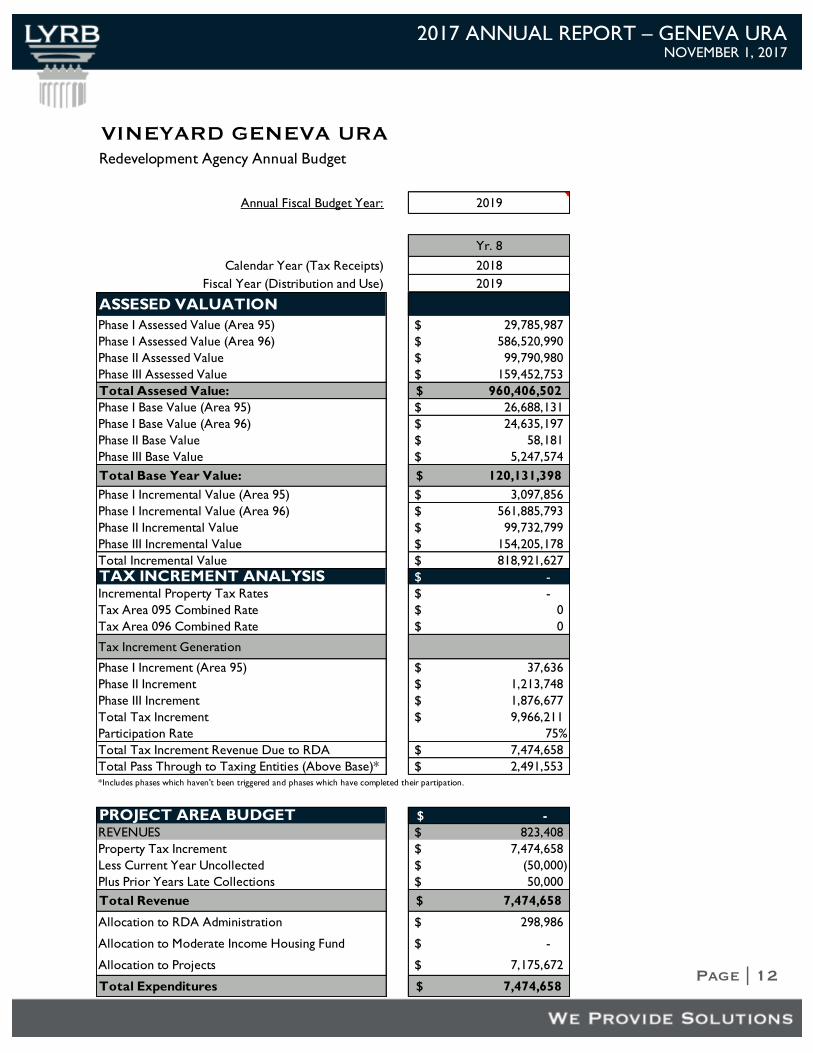
VINEYARD GENEVA URA
Redevelopment Agency Annual Budget
Annual Fiscal Budget Year: 2018
Yr. 7
Calendar Year (Tax Receipts) 2017
Fiscal Year (Distribution and Use) 2018
ASSESED VALUATION
Phase I Assessed Value (Area 95) 29,364,413$
Phase I Assessed Value (Area 96) 586,520,990$
Phase II Assessed Value 97,032,838$
Phase III Assessed Value 38,878,563$
Total Assesed Value: 811,780,143$
Phase I Base Value (Area 95) 26,688,131$
Phase I Base Value (Area 96) 24,635,197$
Phase II Base Value 58,181$
Phase III Base Value 5,247,574$
Total Base Year Value: 120,131,398$
Phase I Incremental Value (Area 95) 2,676,282$
Phase I Incremental Value (Area 96) 561,885,793$
Phase II Incremental Value 96,974,657$
Phase III Incremental Value 33,630,988$
Total Incremental Value 695,167,719$
TAX INCREMENT ANALYSIS -$
Incremental Property Tax Rates -$
Tax Area 095 Combined Rate 0$
Tax Area 096 Combined Rate 0$
Tax Increment Generation
Phase I Increment (Area 95) 32,514$
Phase II Increment 1,180,182$
Phase III Increment 409,289$
Total Tax Increment 8,460,135$
Participation Rate 75%
Total Tax Increment Revenue Due to RDA 6,345,101$
Total Pass Through to Taxing Entities (Above Base)* 2,115,034$ *Includes phases which haven't been triggered and phases which have completed their partipation.
PROJECT AREA BUDGET -$
REVENUES 698,976$
Property Tax Increment 6,345,101$
Less Current Year Uncollected (50,000)$
Plus Prior Years Late Collections 50,000$
Total Revenue 6,345,101$
Allocation to RDA Administration 317,255$
Allocation to Moderate Income Housing Fund -$
Allocation to Projects 6,027,846$
Total Expenditures 6,345,101$
Page | 12
2017 ANNUAL REPORT – GENEVA URA
NOVEMBER 1, 2017
VINEYARD GENEVA URA
Redevelopment Agency Annual Budget
Annual Fiscal Budget Year: 2019
Yr. 8
Calendar Year (Tax Receipts) 2018
Fiscal Year (Distribution and Use) 2019
ASSESED VALUATION
Phase I Assessed Value (Area 95) 29,785,987$
Phase I Assessed Value (Area 96) 586,520,990$
Phase II Assessed Value 99,790,980$
Phase III Assessed Value 159,452,753$
Total Assesed Value: 960,406,502$
Phase I Base Value (Area 95) 26,688,131$
Phase I Base Value (Area 96) 24,635,197$
Phase II Base Value 58,181$
Phase III Base Value 5,247,574$
Total Base Year Value: 120,131,398$
Phase I Incremental Value (Area 95) 3,097,856$
Phase I Incremental Value (Area 96) 561,885,793$
Phase II Incremental Value 99,732,799$
Phase III Incremental Value 154,205,178$
Total Incremental Value 818,921,627$
TAX INCREMENT ANALYSIS -$
Incremental Property Tax Rates -$
Tax Area 095 Combined Rate 0$
Tax Area 096 Combined Rate 0$
Tax Increment Generation
Phase I Increment (Area 95) 37,636$
Phase II Increment 1,213,748$
Phase III Increment 1,876,677$
Total Tax Increment 9,966,211$
Participation Rate 75%
Total Tax Increment Revenue Due to RDA 7,474,658$
Total Pass Through to Taxing Entities (Above Base)* 2,491,553$ *Includes phases which haven't been triggered and phases which have completed their partipation.
PROJECT AREA BUDGET -$
REVENUES 823,408$
Property Tax Increment 7,474,658$
Less Current Year Uncollected (50,000)$
Plus Prior Years Late Collections 50,000$
Total Revenue 7,474,658$
Allocation to RDA Administration 298,986$
Allocation to Moderate Income Housing Fund -$
Allocation to Projects 7,175,672$
Total Expenditures 7,474,658$
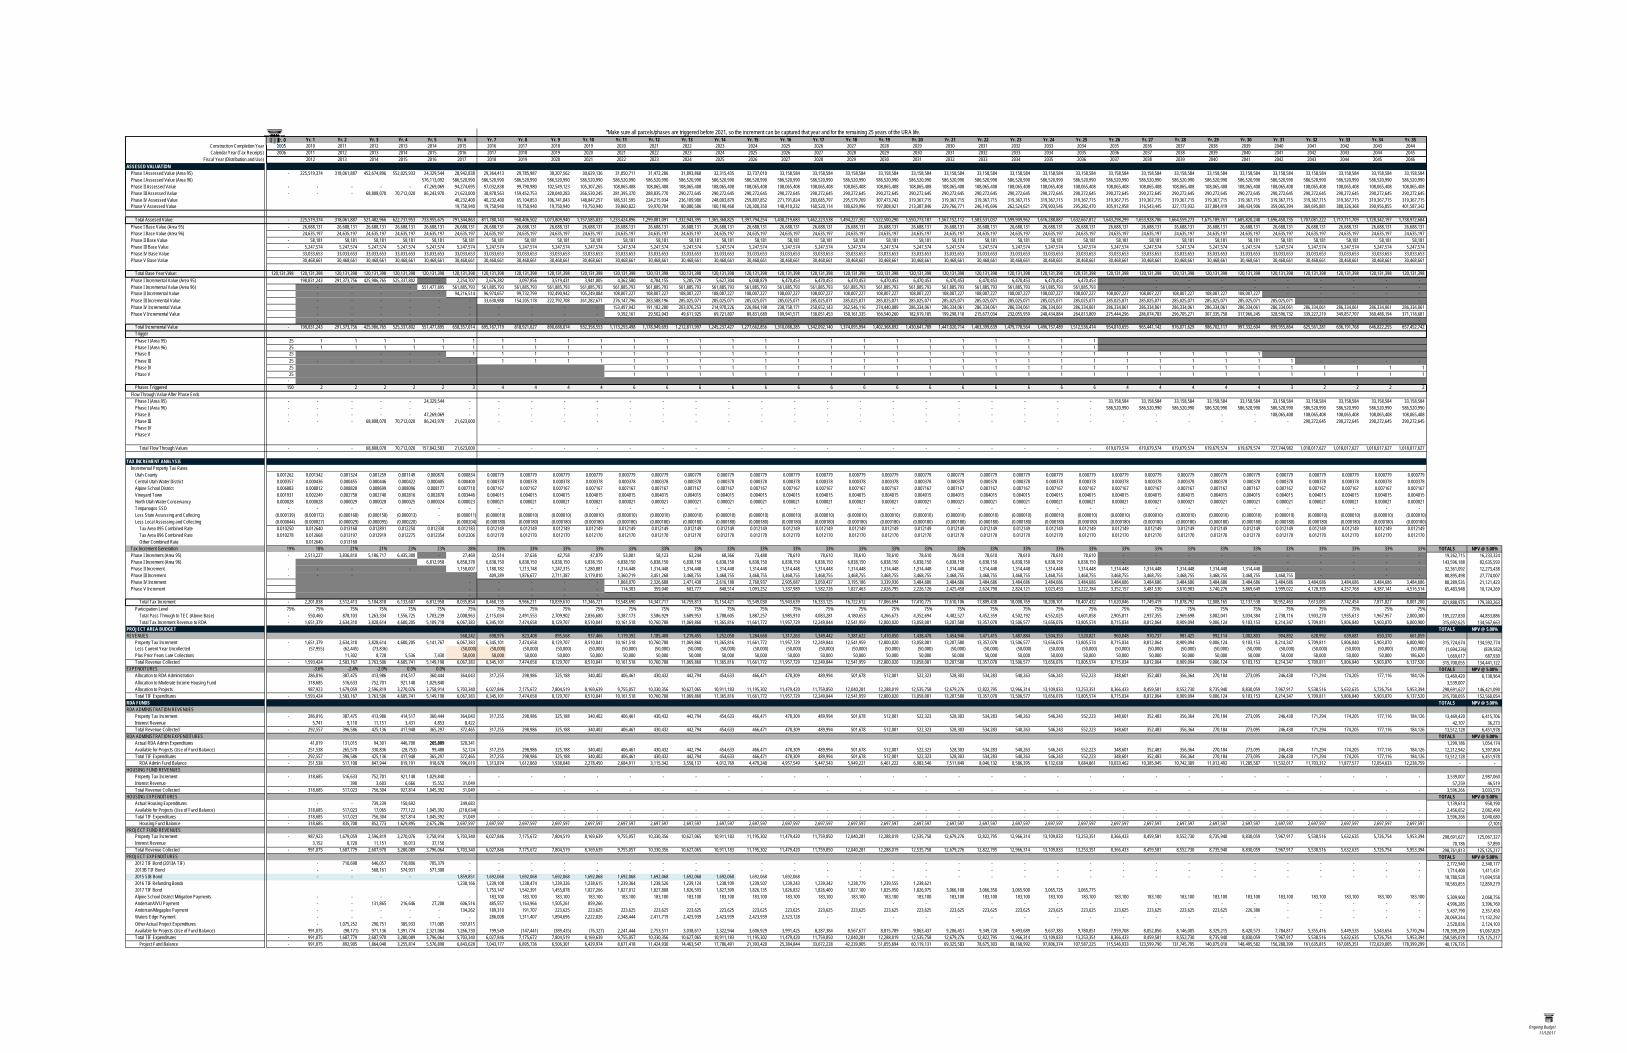
*Make sure all parcels/phases are triggered before 2021, so the increment can be captured that year and for the remaining 25 years of the URA life.Yr. 0 Yr. 1 Yr. 2 Yr. 3 Yr. 4 Yr. 5 Yr. 6 Yr. 7 Yr. 8 Yr. 9 Yr. 10 Yr. 11 Yr. 12 Yr. 13 Yr. 14 Yr. 15 Yr. 16 Yr. 17 Yr. 18 Yr. 19 Yr. 20 Yr. 21 Yr. 22 Yr. 23 Yr. 24 Yr. 25 Yr. 26 Yr. 27 Yr. 28 Yr. 29 Yr. 30 Yr. 31 Yr. 32 Yr. 33 Yr. 34 Yr. 35
Construction Completion Year 2005 2010 2011 2012 2013 2014 2015 2016 2017 2018 2019 2020 2021 2022 2023 2024 2025 2026 2027 2028 2029 2030 2031 2032 2033 2034 2035 2036 2037 2038 2039 2040 2041 2042 2043 2044Calendar Year (Tax Receipts) 2006 2011 2012 2013 2014 2015 2016 2017 2018 2019 2020 2021 2022 2023 2024 2025 2026 2027 2028 2029 2030 2031 2032 2033 2034 2035 2036 2037 2038 2039 2040 2041 2042 2043 2044 2045
Fiscal Year (Distribution and Use) 2012 2013 2014 2015 2016 2017 2018 2019 2020 2021 2022 2023 2024 2025 2026 2027 2028 2029 2030 2031 2032 2033 2034 2035 2036 2037 2038 2039 2040 2041 2042 2043 2044 2045 2046ASSESED VALUATION
Phase I Assessed Value (Area 95) - 225,519,374 318,061,887 452,674,896 552,025,933 24,329,544 28,942,838 29,364,413 29,785,987 30,207,562 30,629,136 31,050,711 31,472,286 31,893,860 32,315,435 32,737,010 33,158,584 33,158,584 33,158,584 33,158,584 33,158,584 33,158,584 33,158,584 33,158,584 33,158,584 33,158,584 33,158,584 33,158,584 33,158,584 33,158,584 33,158,584 33,158,584 33,158,584 33,158,584 33,158,584 33,158,584 Phase I Assessed Value (Area 96) 576,113,092 586,520,990 586,520,990 586,520,990 586,520,990 586,520,990 586,520,990 586,520,990 586,520,990 586,520,990 586,520,990 586,520,990 586,520,990 586,520,990 586,520,990 586,520,990 586,520,990 586,520,990 586,520,990 586,520,990 586,520,990 586,520,990 586,520,990 586,520,990 586,520,990 586,520,990 586,520,990 586,520,990 586,520,990 586,520,990 586,520,990 Phase II Assessed Value - - - - - 47,269,069 94,274,695 97,032,838 99,790,980 102,549,123 105,307,265 108,065,408 108,065,408 108,065,408 108,065,408 108,065,408 108,065,408 108,065,408 108,065,408 108,065,408 108,065,408 108,065,408 108,065,408 108,065,408 108,065,408 108,065,408 108,065,408 108,065,408 108,065,408 108,065,408 108,065,408 108,065,408 108,065,408 108,065,408 108,065,408 108,065,408 Phase III Assessed Value - - - 68,808,070 70,712,020 86,243,970 21,623,000 38,878,563 159,452,753 228,040,283 266,530,245 281,395,370 288,835,770 290,272,645 290,272,645 290,272,645 290,272,645 290,272,645 290,272,645 290,272,645 290,272,645 290,272,645 290,272,645 290,272,645 290,272,645 290,272,645 290,272,645 290,272,645 290,272,645 290,272,645 290,272,645 290,272,645 290,272,645 290,272,645 290,272,645 290,272,645 Phase IV Assessed Value 40,232,400 40,232,400 65,104,853 106,741,043 148,847,257 186,531,595 224,215,934 236,109,906 248,003,879 259,897,852 271,791,824 283,685,797 295,579,769 307,473,742 319,367,715 319,367,715 319,367,715 319,367,715 319,367,715 319,367,715 319,367,715 319,367,715 319,367,715 319,367,715 319,367,715 319,367,715 319,367,715 319,367,715 319,367,715 319,367,715 Phase V Assessed Value 19,750,940 19,750,940 19,750,940 19,750,940 19,750,940 39,860,822 59,970,704 80,080,586 100,190,468 120,300,350 140,410,232 160,520,114 180,629,996 197,008,921 213,387,846 229,766,771 246,145,696 262,524,621 278,903,546 295,282,470 305,912,958 316,543,445 327,173,932 337,804,419 348,434,906 359,065,394 369,695,881 380,326,368 390,956,855 401,587,342
Total Assesed Value: - 225,519,374 318,061,887 521,482,966 622,737,953 733,955,675 791,344,863 811,780,143 960,406,502 1,073,809,940 1,157,585,833 1,233,424,896 1,299,081,091 1,332,943,395 1,365,368,825 1,397,794,254 1,430,219,683 1,462,223,538 1,494,227,392 1,522,500,290 1,550,773,187 1,567,152,112 1,583,531,037 1,599,909,962 1,616,288,887 1,632,667,812 1,643,298,299 1,653,928,786 1,664,559,273 1,675,189,761 1,685,820,248 1,696,450,735 1,707,081,222 1,717,711,709 1,728,342,197 1,738,972,684 Phase I Base Value (Area 95) - 26,688,131 26,688,131 26,688,131 26,688,131 26,688,131 26,688,131 26,688,131 26,688,131 26,688,131 26,688,131 26,688,131 26,688,131 26,688,131 26,688,131 26,688,131 26,688,131 26,688,131 26,688,131 26,688,131 26,688,131 26,688,131 26,688,131 26,688,131 26,688,131 26,688,131 26,688,131 26,688,131 26,688,131 26,688,131 26,688,131 26,688,131 26,688,131 26,688,131 26,688,131 26,688,131 Phase I Base Value (Area 96) 24,635,197 24,635,197 24,635,197 24,635,197 24,635,197 24,635,197 24,635,197 24,635,197 24,635,197 24,635,197 24,635,197 24,635,197 24,635,197 24,635,197 24,635,197 24,635,197 24,635,197 24,635,197 24,635,197 24,635,197 24,635,197 24,635,197 24,635,197 24,635,197 24,635,197 24,635,197 24,635,197 24,635,197 24,635,197 24,635,197 24,635,197 24,635,197 24,635,197 24,635,197 24,635,197 Phase II Base Value - 58,181 58,181 58,181 58,181 58,181 58,181 58,181 58,181 58,181 58,181 58,181 58,181 58,181 58,181 58,181 58,181 58,181 58,181 58,181 58,181 58,181 58,181 58,181 58,181 58,181 58,181 58,181 58,181 58,181 58,181 58,181 58,181 58,181 58,181 58,181 Phase III Base Value - 5,247,574 5,247,574 5,247,574 5,247,574 5,247,574 5,247,574 5,247,574 5,247,574 5,247,574 5,247,574 5,247,574 5,247,574 5,247,574 5,247,574 5,247,574 5,247,574 5,247,574 5,247,574 5,247,574 5,247,574 5,247,574 5,247,574 5,247,574 5,247,574 5,247,574 5,247,574 5,247,574 5,247,574 5,247,574 5,247,574 5,247,574 5,247,574 5,247,574 5,247,574 5,247,574 Phase IV Base Value 33,033,653 33,033,653 33,033,653 33,033,653 33,033,653 33,033,653 33,033,653 33,033,653 33,033,653 33,033,653 33,033,653 33,033,653 33,033,653 33,033,653 33,033,653 33,033,653 33,033,653 33,033,653 33,033,653 33,033,653 33,033,653 33,033,653 33,033,653 33,033,653 33,033,653 33,033,653 33,033,653 33,033,653 33,033,653 33,033,653 33,033,653 33,033,653 33,033,653 33,033,653 33,033,653 Phase V Base Value 30,468,661 30,468,661 30,468,661 30,468,661 30,468,661 30,468,661 30,468,661 30,468,661 30,468,661 30,468,661 30,468,661 30,468,661 30,468,661 30,468,661 30,468,661 30,468,661 30,468,661 30,468,661 30,468,661 30,468,661 30,468,661 30,468,661 30,468,661 30,468,661 30,468,661 30,468,661 30,468,661 30,468,661 30,468,661 30,468,661 30,468,661 30,468,661 30,468,661 30,468,661 30,468,661
Total Base Year Value: 120,131,398 120,131,398 120,131,398 120,131,398 120,131,398 120,131,398 120,131,398 120,131,398 120,131,398 120,131,398 120,131,398 120,131,398 120,131,398 120,131,398 120,131,398 120,131,398 120,131,398 120,131,398 120,131,398 120,131,398 120,131,398 120,131,398 120,131,398 120,131,398 120,131,398 120,131,398 120,131,398 120,131,398 120,131,398 120,131,398 120,131,398 120,131,398 120,131,398 120,131,398 120,131,398 120,131,398 Phase I Incremental Value (Area 95) 198,831,243 291,373,756 425,986,765 525,337,802 - 2,254,707 2,676,282 3,097,856 3,519,431 3,941,005 4,362,580 4,784,155 5,205,729 5,627,304 6,048,879 6,470,453 6,470,453 6,470,453 6,470,453 6,470,453 6,470,453 6,470,453 6,470,453 6,470,453 6,470,453 - - - - - - - - - - Phase I Incremental Value (Area 96) - - - - 551,477,895 561,885,793 561,885,793 561,885,793 561,885,793 561,885,793 561,885,793 561,885,793 561,885,793 561,885,793 561,885,793 561,885,793 561,885,793 561,885,793 561,885,793 561,885,793 561,885,793 561,885,793 561,885,793 561,885,793 561,885,793 - - - - - - - - - - Phase II Incremental Value - - - - - 94,216,514 96,974,657 99,732,799 102,490,942 105,249,084 108,007,227 108,007,227 108,007,227 108,007,227 108,007,227 108,007,227 108,007,227 108,007,227 108,007,227 108,007,227 108,007,227 108,007,227 108,007,227 108,007,227 108,007,227 108,007,227 108,007,227 108,007,227 108,007,227 108,007,227 - - - - - Phase III Incremental Value - - - - - - 33,630,988 154,205,178 222,792,708 261,282,671 276,147,796 283,588,196 285,025,071 285,025,071 285,025,071 285,025,071 285,025,071 285,025,071 285,025,071 285,025,071 285,025,071 285,025,071 285,025,071 285,025,071 285,025,071 285,025,071 285,025,071 285,025,071 285,025,071 285,025,071 285,025,071 - - - - Phase IV Incremental Value - - - - - - - - - - 153,497,942 191,182,280 203,076,253 214,970,226 226,864,198 238,758,171 250,652,143 262,546,116 274,440,089 286,334,061 286,334,061 286,334,061 286,334,061 286,334,061 286,334,061 286,334,061 286,334,061 286,334,061 286,334,061 286,334,061 286,334,061 286,334,061 286,334,061 286,334,061 286,334,061 Phase V Incremental Value - - - - - - - - - - 9,392,161 29,502,043 49,611,925 69,721,807 89,831,689 109,941,571 130,051,453 150,161,335 166,540,260 182,919,185 199,298,110 215,677,034 232,055,959 248,434,884 264,813,809 275,444,296 286,074,783 296,705,271 307,335,758 317,966,245 328,596,732 339,227,219 349,857,707 360,488,194 371,118,681
- - - - - - - - - - - - - - - - - - - - - - - - - - - - - - - - - - - Total Incremental Value - 198,831,243 291,373,756 425,986,765 525,337,802 551,477,895 658,357,014 695,167,719 818,921,627 890,688,874 932,358,553 1,113,293,498 1,178,949,693 1,212,811,997 1,245,237,427 1,277,662,856 1,310,088,285 1,342,092,140 1,374,095,994 1,402,368,892 1,430,641,789 1,447,020,714 1,463,399,639 1,479,778,564 1,496,157,489 1,512,536,414 954,810,655 965,441,142 976,071,629 986,702,117 997,332,604 899,955,864 625,561,281 636,191,768 646,822,255 657,452,742 TriggerPhase I (Area 95) 25 1 1 1 1 1 1 1 1 1 1 1 1 1 1 1 1 1 1 1 1 1 1 1 1 1 Phase I (Area 96) 25 1 1 1 1 1 1 1 1 1 1 1 1 1 1 1 1 1 1 1 1 1 1 1 1 1 Phase II 25 - - - 1 1 1 1 1 1 1 1 1 1 1 1 1 1 1 1 1 1 1 1 1 1 1 1 1 Phase III 25 - - - - - - 1 1 1 1 1 1 1 1 1 1 1 1 1 1 1 1 1 1 1 1 1 1 1 1 1 - - - - Phase IV 25 1 1 1 1 1 1 1 1 1 1 1 1 1 1 1 1 1 1 1 1 1 1 1 1 1 Phase V 25 1 1 1 1 1 1 1 1 1 1 1 1 1 1 1 1 1 1 1 1 1 1 1 1 1
- Phases Triggered 150 2 2 2 2 2 3 4 4 4 4 6 6 6 6 6 6 6 6 6 6 6 6 6 6 6 4 4 4 4 4 3 2 2 2 2
Flow Through Value After Phase EndsPhase I (Area 95) - - - - - 24,329,544 - - - - - - - - - - - - - - - - - - - - 33,158,584 33,158,584 33,158,584 33,158,584 33,158,584 33,158,584 33,158,584 33,158,584 33,158,584 33,158,584 Phase I (Area 96) - - - - - - - - - - - - - - - - - - - - - - - - - - 586,520,990 586,520,990 586,520,990 586,520,990 586,520,990 586,520,990 586,520,990 586,520,990 586,520,990 586,520,990 Phase II - - - - - 47,269,069 - - - - - - - - - - - - - - - - - - - - - - - - - 108,065,408 108,065,408 108,065,408 108,065,408 108,065,408 Phase III - - - 68,808,070 70,712,020 86,243,970 21,623,000 - - - - - - - - - - - - - - - - - - - - - - - - - 290,272,645 290,272,645 290,272,645 290,272,645 Phase IVPhase V
Total Flow Through Values - - - 68,808,070 70,712,020 157,842,583 21,623,000 - - - - - - - - - - - - - - - - - - - 619,679,574 619,679,574 619,679,574 619,679,574 619,679,574 727,744,982 1,018,017,627 1,018,017,627 1,018,017,627 1,018,017,627
TAX INCREMENT ANALYSISIncremental Property Tax Rates
Utah County 0.001262 0.001342 0.001324 0.001259 0.001149 0.000870 0.000834 0.000779 0.000779 0.000779 0.000779 0.000779 0.000779 0.000779 0.000779 0.000779 0.000779 0.000779 0.000779 0.000779 0.000779 0.000779 0.000779 0.000779 0.000779 0.000779 0.000779 0.000779 0.000779 0.000779 0.000779 0.000779 0.000779 0.000779 0.000779 0.000779 Central Utah Water District 0.000357 0.000436 0.000455 0.000446 0.000422 0.000405 0.000400 0.000378 0.000378 0.000378 0.000378 0.000378 0.000378 0.000378 0.000378 0.000378 0.000378 0.000378 0.000378 0.000378 0.000378 0.000378 0.000378 0.000378 0.000378 0.000378 0.000378 0.000378 0.000378 0.000378 0.000378 0.000378 0.000378 0.000378 0.000378 0.000378 Alpine School District 0.006883 0.008812 0.008828 0.008699 0.008096 0.008177 0.007718 0.007167 0.007167 0.007167 0.007167 0.007167 0.007167 0.007167 0.007167 0.007167 0.007167 0.007167 0.007167 0.007167 0.007167 0.007167 0.007167 0.007167 0.007167 0.007167 0.007167 0.007167 0.007167 0.007167 0.007167 0.007167 0.007167 0.007167 0.007167 0.007167 Vineyard Town 0.001931 0.002249 0.002758 0.002740 0.002816 0.002878 0.003446 0.004015 0.004015 0.004015 0.004015 0.004015 0.004015 0.004015 0.004015 0.004015 0.004015 0.004015 0.004015 0.004015 0.004015 0.004015 0.004015 0.004015 0.004015 0.004015 0.004015 0.004015 0.004015 0.004015 0.004015 0.004015 0.004015 0.004015 0.004015 0.004015 North Utah Water Conservancy 0.000028 0.000028 0.000029 0.000028 0.000025 0.000024 0.000023 0.000021 0.000021 0.000021 0.000021 0.000021 0.000021 0.000021 0.000021 0.000021 0.000021 0.000021 0.000021 0.000021 0.000021 0.000021 0.000021 0.000021 0.000021 0.000021 0.000021 0.000021 0.000021 0.000021 0.000021 0.000021 0.000021 0.000021 0.000021 0.000021 Timpanogos SSD - - - - - - - - - - - - - - - - - - - - - - - - - - - - - - - - - - - - Less State Assessing and Collecing (0.000139) (0.000172) (0.000168) (0.000158) (0.000013) - (0.000011) (0.000010) (0.000010) (0.000010) (0.000010) (0.000010) (0.000010) (0.000010) (0.000010) (0.000010) (0.000010) (0.000010) (0.000010) (0.000010) (0.000010) (0.000010) (0.000010) (0.000010) (0.000010) (0.000010) (0.000010) (0.000010) (0.000010) (0.000010) (0.000010) (0.000010) (0.000010) (0.000010) (0.000010) (0.000010) Less Local Assessing and Collecting (0.000044) (0.000027) (0.000029) (0.000095) (0.000220) - (0.000204) (0.000180) (0.000180) (0.000180) (0.000180) (0.000180) (0.000180) (0.000180) (0.000180) (0.000180) (0.000180) (0.000180) (0.000180) (0.000180) (0.000180) (0.000180) (0.000180) (0.000180) (0.000180) (0.000180) (0.000180) (0.000180) (0.000180) (0.000180) (0.000180) (0.000180) (0.000180) (0.000180) (0.000180) (0.000180)
Tax Area 095 Combined Rate 0.010250 0.012640 0.013168 0.012891 0.012250 0.012330 0.012183 0.012149 0.012149 0.012149 0.012149 0.012149 0.012149 0.012149 0.012149 0.012149 0.012149 0.012149 0.012149 0.012149 0.012149 0.012149 0.012149 0.012149 0.012149 0.012149 0.012149 0.012149 0.012149 0.012149 0.012149 0.012149 0.012149 0.012149 0.012149 0.012149 Tax Area 096 Combined Rate 0.010278 0.012668 0.013197 0.012919 0.012275 0.012354 0.012206 0.012170 0.012170 0.012170 0.012170 0.012170 0.012170 0.012170 0.012170 0.012170 0.012170 0.012170 0.012170 0.012170 0.012170 0.012170 0.012170 0.012170 0.012170 0.012170 0.012170 0.012170 0.012170 0.012170 0.012170 0.012170 0.012170 0.012170 0.012170 0.012170 Other Combined Rate 0.012640 0.013168
Tax Increment Generation 19% 18% 21% 21% 23% 23% 28% 33% 33% 33% 33% 33% 33% 33% 33% 33% 33% 33% 33% 33% 33% 33% 33% 33% 33% 33% 33% 33% 33% 33% 33% 33% 33% 33% 33% 33% TOTALS NPV @ 5.00%Phase I Increment (Area 95) - 2,513,227 3,836,810 5,186,717 6,435,388 - 27,469 32,514 37,636 42,758 47,879 53,001 58,123 63,244 68,366 73,488 78,610 78,610 78,610 78,610 78,610 78,610 78,610 78,610 78,610 78,610 - - - - - - - - - - 19,262,715 16,233,324 Phase I Increment (Area 96) 6,812,958 6,858,378 6,838,150 6,838,150 6,838,150 6,838,150 6,838,150 6,838,150 6,838,150 6,838,150 6,838,150 6,838,150 6,838,150 6,838,150 6,838,150 6,838,150 6,838,150 6,838,150 6,838,150 6,838,150 6,838,150 - - - - - - - - - - 143,596,188 82,635,593 Phase II Increment - - - - 1,150,007 1,180,182 1,213,748 1,247,315 1,280,881 1,314,448 1,314,448 1,314,448 1,314,448 1,314,448 1,314,448 1,314,448 1,314,448 1,314,448 1,314,448 1,314,448 1,314,448 1,314,448 1,314,448 1,314,448 1,314,448 1,314,448 1,314,448 1,314,448 1,314,448 - - - - - 32,361,092 12,273,438 Phase III Increment - - - - 409,289 1,876,677 2,711,387 3,179,810 3,360,719 3,451,268 3,468,755 3,468,755 3,468,755 3,468,755 3,468,755 3,468,755 3,468,755 3,468,755 3,468,755 3,468,755 3,468,755 3,468,755 3,468,755 3,468,755 3,468,755 3,468,755 3,468,755 3,468,755 3,468,755 - - - - 80,895,498 27,774,007 Phase IV Increment - - - - - 1,868,070 2,326,688 2,471,438 2,616,188 2,760,937 2,905,687 3,050,437 3,195,186 3,339,936 3,484,686 3,484,686 3,484,686 3,484,686 3,484,686 3,484,686 3,484,686 3,484,686 3,484,686 3,484,686 3,484,686 3,484,686 3,484,686 3,484,686 3,484,686 3,484,686 80,289,535 21,121,423 Phase V Increment - - - - - 114,303 359,040 603,777 848,514 1,093,252 1,337,989 1,582,726 1,827,463 2,026,795 2,226,126 2,425,458 2,624,790 2,824,121 3,023,453 3,222,784 3,352,157 3,481,530 3,610,903 3,740,276 3,869,649 3,999,022 4,128,395 4,257,768 4,387,141 4,516,514 65,483,948 10,124,269
- - - - - - - - - - - - - - - - - - - - - - - - - - - - - - Total Tax Increment - 2,201,838 3,512,413 5,104,818 6,133,607 6,812,958 8,035,854 8,460,135 9,966,211 10,839,610 11,346,721 13,548,690 14,347,717 14,759,813 15,154,421 15,549,030 15,943,639 16,333,125 16,722,612 17,066,694 17,410,775 17,610,106 17,809,438 18,008,769 18,208,101 18,407,432 11,620,046 11,749,419 11,878,792 12,008,165 12,137,538 10,952,463 7,613,081 7,742,454 7,871,827 8,001,200 421,888,975 179,383,263
Participation Level 75% 75% 75% 75% 75% 75% 75% 75% 75% 75% 75% 75% 75% 75% 75% 75% 75% 75% 75% 75% 75% 75% 75% 75% 75% 75% 75% 75% 75% 75% 75% 75% 75% 75% 75% 75%Total Pass Through to TEC (Above Base) - 550,460 878,103 1,263,334 1,556,725 1,703,239 2,008,963 2,115,034 2,491,553 2,709,902 2,836,680 3,387,173 3,586,929 3,689,953 3,788,605 3,887,257 3,985,910 4,083,281 4,180,653 4,266,673 4,352,694 4,402,527 4,452,359 4,502,192 4,552,025 4,601,858 2,905,011 2,937,355 2,969,698 3,002,041 3,034,384 2,738,116 1,903,270 1,935,613 1,967,957 2,000,300 105,227,830 44,853,886 Total Tax Increment Revenue to RDA - 1,651,379 2,634,310 3,828,614 4,600,205 5,109,718 6,067,383 6,345,101 7,474,658 8,129,707 8,510,041 10,161,518 10,760,788 11,069,860 11,365,816 11,661,772 11,957,729 12,249,844 12,541,959 12,800,020 13,058,081 13,207,580 13,357,078 13,506,577 13,656,076 13,805,574 8,715,034 8,812,064 8,909,094 9,006,124 9,103,153 8,214,347 5,709,811 5,806,840 5,903,870 6,000,900 315,692,625 134,567,663
PROJECT AREA BUDGET TOTALS NPV @ 5.00%REVENUES 568,242 698,976 823,408 895,568 937,466 1,119,392 1,185,408 1,219,455 1,252,058 1,284,660 1,317,263 1,349,442 1,381,622 1,410,050 1,438,478 1,454,946 1,471,415 1,487,884 1,504,353 1,520,821 960,048 970,737 981,425 992,114 1,002,803 904,892 628,992 639,681 650,370 661,059
Property Tax Increment - 1,651,379 2,634,310 3,828,614 4,600,205 5,141,767 6,067,383 6,345,101 7,474,658 8,129,707 8,510,041 10,161,518 10,760,788 11,069,860 11,365,816 11,661,772 11,957,729 12,249,844 12,541,959 12,800,020 13,058,081 13,207,580 13,357,078 13,506,577 13,656,076 13,805,574 8,715,034 8,812,064 8,909,094 9,006,124 9,103,153 8,214,347 5,709,811 5,806,840 5,903,870 6,000,900 315,724,674 134,592,774 Less Current Year Uncollected (57,955) (62,445) (73,836) (50,000) (50,000) (50,000) (50,000) (50,000) (50,000) (50,000) (50,000) (50,000) (50,000) (50,000) (50,000) (50,000) (50,000) (50,000) (50,000) (50,000) (50,000) (50,000) (50,000) (50,000) (50,000) (50,000) (50,000) (50,000) (50,000) (50,000) (50,000) (50,000) (50,000) (1,694,236) (839,582) Plus Prior Years Late Collections 11,302 8,728 5,536 7,430 50,000 50,000 50,000 50,000 50,000 50,000 50,000 50,000 50,000 50,000 50,000 50,000 50,000 50,000 50,000 50,000 50,000 50,000 50,000 50,000 50,000 50,000 50,000 50,000 50,000 50,000 50,000 50,000 50,000 186,620 1,669,617 687,930 Total Revenue Collected - 1,593,424 2,583,167 3,763,506 4,605,741 5,149,198 6,067,383 6,345,101 7,474,658 8,129,707 8,510,041 10,161,518 10,760,788 11,069,860 11,365,816 11,661,772 11,957,729 12,249,844 12,541,959 12,800,020 13,058,081 13,207,580 13,357,078 13,506,577 13,656,076 13,805,574 8,715,034 8,812,064 8,909,094 9,006,124 9,103,153 8,214,347 5,709,811 5,806,840 5,903,870 6,137,520 315,700,055 134,441,122
EXPENDITURES -3.6% -2.4% -2.0% 0.0% 0.0% TOTALS NPV @ 5.00%Allocation to RDA Administration 286,816 387,475 413,986 414,517 360,444 364,043 317,255 298,986 325,188 340,402 406,461 430,432 442,794 454,633 466,471 478,309 489,994 501,678 512,001 522,323 528,303 534,283 540,263 546,243 552,223 348,601 352,483 356,364 270,184 273,095 246,430 171,294 174,205 177,116 184,126 13,469,420 6,138,964 Allocation to Moderate Income Housing Fund 318,685 516,633 752,701 921,148 1,029,840 - - - - - - - - - - - - - - - - - - - - - - - - - - - - - - 3,539,007 - Allocation to Projects 987,923 1,679,059 2,596,819 3,270,076 3,758,914 5,703,340 6,027,846 7,175,672 7,804,519 8,169,639 9,755,057 10,330,356 10,627,065 10,911,183 11,195,302 11,479,420 11,759,850 12,040,281 12,288,019 12,535,758 12,679,276 12,822,795 12,966,314 13,109,833 13,253,351 8,366,433 8,459,581 8,552,730 8,735,940 8,830,059 7,967,917 5,538,516 5,632,635 5,726,754 5,953,394 298,691,627 146,421,090 Total TIF Expenditures - 1,593,424 2,583,167 3,763,506 4,605,741 5,149,198 6,067,383 6,345,101 7,474,658 8,129,707 8,510,041 10,161,518 10,760,788 11,069,860 11,365,816 11,661,772 11,957,729 12,249,844 12,541,959 12,800,020 13,058,081 13,207,580 13,357,078 13,506,577 13,656,076 13,805,574 8,715,034 8,812,064 8,909,094 9,006,124 9,103,153 8,214,347 5,709,811 5,806,840 5,903,870 6,137,520 315,700,055 152,560,054
RDA FUNDS TOTALS NPV @ 5.00%RDA ADMINISTRATION REVENUES
Property Tax Increment - 286,816 387,475 413,986 414,517 360,444 364,043 317,255 298,986 325,188 340,402 406,461 430,432 442,794 454,633 466,471 478,309 489,994 501,678 512,001 522,323 528,303 534,283 540,263 546,243 552,223 348,601 352,483 356,364 270,184 273,095 246,430 171,294 174,205 177,116 184,126 13,469,420 6,415,706 Interest Revenue 5,741 9,110 11,151 3,431 4,853 8,422 42,707 36,273 Total Revenue Collected - 292,557 396,586 425,136 417,948 365,297 372,465 317,255 298,986 325,188 340,402 406,461 430,432 442,794 454,633 466,471 478,309 489,994 501,678 512,001 522,323 528,303 534,283 540,263 546,243 552,223 348,601 352,483 356,364 270,184 273,095 246,430 171,294 174,205 177,116 184,126 13,512,128 6,451,978
RDA ADMINISTRATION EXPENDITURES TOTALS NPV @ 5.00%Actual RDA Admin Expenditures 41,019 131,015 94,301 446,700 265,809 320,341 1,299,186 1,054,174 Available for Projects (Use of Fund Balance) 251,538 265,570 330,836 (28,753) 99,488 52,124 317,255 298,986 325,188 340,402 406,461 430,432 442,794 454,633 466,471 478,309 489,994 501,678 512,001 522,323 528,303 534,283 540,263 546,243 552,223 348,601 352,483 356,364 270,184 273,095 246,430 171,294 174,205 177,116 184,126 12,212,942 5,397,804 Total TIF Expenditures - 292,557 396,586 425,136 417,948 365,297 372,465 317,255 298,986 325,188 340,402 406,461 430,432 442,794 454,633 466,471 478,309 489,994 501,678 512,001 522,323 528,303 534,283 540,263 546,243 552,223 348,601 352,483 356,364 270,184 273,095 246,430 171,294 174,205 177,116 184,126 13,512,128 6,451,978
RDA Admin Fund Balance - 251,538 517,108 847,944 819,191 918,678 996,619 1,313,874 1,612,860 1,938,048 2,278,450 2,684,911 3,115,342 3,558,137 4,012,769 4,479,240 4,957,549 5,447,543 5,949,221 6,461,222 6,983,546 7,511,849 8,046,132 8,586,395 9,132,638 9,684,861 10,033,462 10,385,945 10,742,309 11,012,492 11,285,587 11,532,017 11,703,312 11,877,517 12,054,633 12,238,759 - - HOUSING FUND REVENUES
Property Tax Increment - 318,685 516,633 752,701 921,148 1,029,840 - - - - - - - - - - - - - - - - - - - - - - - - - - - - - - 3,539,007 2,987,060 Interest Revenue 390 3,603 6,666 15,552 31,049 57,259 46,519 Total Revenue Collected - 318,685 517,023 756,304 927,814 1,045,392 31,049 - - - - - - - - - - - - - - - - - - - - - - - - - - - - - 3,596,266 3,033,579
HOUSING EXPENDITURES - TOTALS NPV @ 5.00%Actual Housing Expenditures - - 739,239 150,692 249,683 1,139,614 958,190 Available for Projects (Use of Fund Balance) 318,685 517,023 17,065 777,122 1,045,392 (218,634) - - - - - - - - - - - - - - - - - - - - - - - - - - - - - 2,456,652 2,082,490 Total TIF Expenditures - 318,685 517,023 756,304 927,814 1,045,392 31,049 - - - - - - - - - - - - - - - - - - - - - - - - - - - - - 3,596,266 3,040,680
Housing Fund Balance - 318,685 835,708 852,773 1,629,895 2,675,286 2,697,597 2,697,597 2,697,597 2,697,597 2,697,597 2,697,597 2,697,597 2,697,597 2,697,597 2,697,597 2,697,597 2,697,597 2,697,597 2,697,597 2,697,597 2,697,597 2,697,597 2,697,597 2,697,597 2,697,597 2,697,597 2,697,597 2,697,597 2,697,597 2,697,597 2,697,597 2,697,597 2,697,597 2,697,597 2,697,597 - (7,101) PROJECT FUND REVENUES
Property Tax Increment - 987,923 1,679,059 2,596,819 3,270,076 3,758,914 5,703,340 6,027,846 7,175,672 7,804,519 8,169,639 9,755,057 10,330,356 10,627,065 10,911,183 11,195,302 11,479,420 11,759,850 12,040,281 12,288,019 12,535,758 12,679,276 12,822,795 12,966,314 13,109,833 13,253,351 8,366,433 8,459,581 8,552,730 8,735,940 8,830,059 7,967,917 5,538,516 5,632,635 5,726,754 5,953,394 298,691,627 125,067,327 Interest Revenue 3,152 8,720 11,151 10,013 37,150 70,186 57,890 Total Revenue Collected - 991,075 1,687,779 2,607,970 3,280,089 3,796,064 5,703,340 6,027,846 7,175,672 7,804,519 8,169,639 9,755,057 10,330,356 10,627,065 10,911,183 11,195,302 11,479,420 11,759,850 12,040,281 12,288,019 12,535,758 12,679,276 12,822,795 12,966,314 13,109,833 13,253,351 8,366,433 8,459,581 8,552,730 8,735,940 8,830,059 7,967,917 5,538,516 5,632,635 5,726,754 5,953,394 298,761,813 125,125,217
PROJECT EXPENDITURES TOTALS NPV @ 5.00%2012 TIF Bond (2013A TIF) - 710,698 646,057 710,806 705,379 - - - - - - - - - - - - - - - - - - - - - - - - - - - - - - 2,772,940 2,340,177 2013B TIF Bond - - 568,161 574,931 571,308 - - - - - - - - - - - - - - - - - - - - - - - - - - - - - - 1,714,400 1,411,431 2015 SIB Bond - - - - 1,859,851 1,692,068 1,692,068 1,692,068 1,692,068 1,692,068 1,692,068 1,692,068 1,692,068 1,692,068 1,692,068 - - - - - - - - - - - - - - - - - - - 18,780,528 11,694,558 2016 TIF Refunding Bonds 1,238,166 1,239,108 1,238,474 1,239,326 1,238,615 1,239,364 1,238,526 1,239,124 1,238,109 1,239,507 1,239,243 1,239,342 1,238,779 1,239,555 1,238,621 18,583,855 12,859,279 2017 TIF Bond 1,753,147 1,542,391 1,455,878 1,827,266 1,827,012 1,827,808 1,826,593 1,827,399 1,826,135 1,826,832 1,826,400 1,827,100 1,825,950 1,826,975 3,066,100 3,066,350 3,065,900 3,065,725 3,065,775 Alpine School District Mitigation Payments - - - - - - 183,100 183,100 183,100 183,100 183,100 183,100 183,100 183,100 183,100 183,100 183,100 183,100 183,100 183,100 183,100 183,100 183,100 183,100 183,100 183,100 183,100 183,100 183,100 183,100 183,100 183,100 183,100 183,100 183,100 5,309,900 2,068,756 Anderson/UVU Payment - - 131,865 216,646 27,208 606,516 485,557 1,163,966 1,505,261 859,266 - - - - - - - - - - - - - - - - - - - - - - - - - 4,996,285 3,396,769 Anderson/Megaplex Payment - - - - - 134,262 189,310 191,707 223,625 223,625 223,625 223,625 223,625 223,625 223,625 223,625 223,625 223,625 223,625 223,625 223,625 223,625 223,625 223,625 223,625 223,625 223,625 223,625 223,625 226,386 - - - - - 5,437,790 2,357,450 Waters Edge Payment - - - - - - 286,008 1,311,407 1,894,696 2,222,026 2,348,444 2,411,719 2,423,939 2,423,939 2,423,939 2,323,128 - - - - - - - - - - - - - - - - - - - 20,069,244 11,132,292 Other Actual Project Expenditures - 1,075,252 290,751 385,933 171,085 597,815 2,520,836 2,124,103 Available for Projects (Use of Fund Balance) 991,075 (98,171) 971,136 1,391,774 2,321,084 1,266,730 199,549 (147,441) (389,435) (76,327) 2,241,444 2,753,511 3,038,617 3,322,944 3,606,929 3,991,425 8,287,384 8,567,677 8,815,789 9,063,437 9,206,451 9,349,720 9,493,689 9,637,383 9,780,851 7,959,708 8,052,856 8,146,005 8,329,215 8,420,573 7,784,817 5,355,416 5,449,535 5,543,654 5,770,294 178,399,299 61,067,829 Total TIF Expenditures - 991,075 1,687,779 2,607,970 3,280,089 3,796,064 5,703,340 6,027,846 7,175,672 7,804,519 8,169,639 9,755,057 10,330,356 10,627,065 10,911,183 11,195,302 11,479,420 11,759,850 12,040,281 12,288,019 12,535,758 12,679,276 12,822,795 12,966,314 13,109,833 13,253,351 8,366,433 8,459,581 8,552,730 8,735,940 8,830,059 7,967,917 5,538,516 5,632,635 5,726,754 5,953,394 258,585,078 125,125,217
Project Fund Balance - 991,075 892,905 1,864,040 3,255,814 5,576,898 6,843,628 7,043,177 6,895,736 6,506,301 6,429,974 8,671,418 11,424,930 14,463,547 17,786,491 21,393,420 25,384,844 33,672,228 42,239,905 51,055,694 60,119,131 69,325,583 78,675,303 88,168,992 97,806,374 107,587,225 115,546,933 123,599,790 131,745,795 140,075,010 148,495,582 156,280,399 161,635,815 167,085,351 172,629,005 178,399,299 40,176,735
Ongoing Budget11/1/2017
Page | 14
2017 ANNUAL REPORT – GENEVA URA
NOVEMBER 1, 2017
EXHIBIT A: MAP OF PROJECT AREA


![GENEVA STATE FOREST WILDLIFE MANAGEMENT AREA...GENEVA STATE FOREST WILDLIFE MANAGEMENT AREA ... 1119 Forest Area Road, Kinston, AL 36453 (Telephone [334] 898-7013). ... NOTE: A State](https://img.pdfslide.us/doc/110x75/5f09febe7e708231d42980b7/geneva-state-forest-wildlife-management-area-geneva-state-forest-wildlife-management.jpg)