Embed Size (px)
Citation preview
ANNUAL REPORT AND FINANCIAL STATEMENTSFOR THE YEAR ENDED 31 DECEMBER 2015
ANNUAL REPORT AND FINANCIAL STATEMENTSFOR THE YEAR ENDED 31 DECEMBER 2015
1
Annual REPORT
FINANCIAL STATEMENTS&
Family Bank Towers, 6th Floor, Muindi Mbingu StreetP.O. Box 74145 - 00200, Nairobi, KenyaTel: 254-2-3252 445/0703 095 445
Email: [email protected] Website: www.familybank.co.ke

ANNUAL REPORT AND FINANCIAL STATEMENTSFOR THE YEAR ENDED 31 DECEMBER 2015
ANNUAL REPORT AND FINANCIAL STATEMENTSFOR THE YEAR ENDED 31 DECEMBER 2015
2
OUR CORE VALUES
To be the financial institution that leads inthe positive transformation of peoples’ livesin Africa.
MISSION
VISION
We positively transform peoples’ lives by providing quality financial services throughinnovative, efficient and reputable practices.
Within ourselves and with our customers, we worktogether and we win together.
• Winning Together
In ours and customers’ ability to change the world
• Self Belief
Our customers will trust and reward us for it
• Transparency
It’s not about us, it’s about our customers.
• Humility

ANNUAL REPORT AND FINANCIAL STATEMENTSFOR THE YEAR ENDED 31 DECEMBER 2015
ANNUAL REPORT AND FINANCIAL STATEMENTSFOR THE YEAR ENDED 31 DECEMBER 2015
1
Table of Contents
Corporate information .......................................................................................... 2 - 3
Notice of AGM ........................................................................................................... 4
Board of Directors ................................................................................................ 5 - 8
Chairman’s Statement ........................................................................................ 9 - 15
Managing Director’s Statement ........................................................................ 16 - 25
Family Bank Insurance Agency .......................................................................... 26 - 27
Corporate governance statement ..................................................................... 29 - 34
Report of the directors ............................................................................................ 35
Statement of Directors’ responsibilities ................................................................... 36
Independent Auditors’ Report .................................................................................. 37
Financial statements:
Consolidated and bank statements of profit or loss and other comprehensive income .......... 38
Consolidated and bank statements of financial position ........................................... 39
Consolidated statement of changes in equity ........................................................... 40
Bank statement of changes in equity ........................................................................ 41
Consolidated statement of cash flows ...................................................................... 42
Notes to the financial statements .................................................................... 43 - 100
1

ANNUAL REPORT AND FINANCIAL STATEMENTSFOR THE YEAR ENDED 31 DECEMBER 2015
ANNUAL REPORT AND FINANCIAL STATEMENTSFOR THE YEAR ENDED 31 DECEMBER 2015
2
CORPORATE INFORMATION
DIRECTORS Non Executive
Dr. Wilfred D Kiboro - Chairman Mr. Titus K. MuyaProf. David Kimutai arap SomeMr. David KimaniDr. Ruth Waweru Mr. Lerionka S. Tiampati Mr. Francis Gitau MungaiMr. Brian Muya Kiondo - Alternate to Titus K. Muya
Executive
Mr. Peter Munyiri - Managing Director and CEOMr. Njung’e Kamau – Director Finance and Strategy
COMPANY SECRETARY Rebecca Mbithi6th Floor, Family Bank Towers, Muindi Mbingu StreetP.O. Box 74145 - 00200, NairobiTel: 254-2-318173/318940/2/7/0720 098 300Fax: 254-2-318174Email: [email protected] Website: www.familybank.co.ke
REGISTERED OFFICE Family Bank Limited6th Floor, Family Bank Towers, Muindi Mbingu StreetP.O. Box 74145- 00200, NairobiTel: 254-2-318173/318940/2/7/0720 098 300Fax: 254-2-318174Email: [email protected] Website: www.familybank.co.ke
AUDITORS Deloitte & ToucheCertified Public Accountants (Kenya)Deloitte Place, Waiyaki Way, MuthangariP. O. Box 40092 – 00100Nairobi
LEGAL ADVISERS Mboya Wangong’u & Waiyaki Advocates Lex Chamber, Maji Mazuri Road off James Gichuru Road

ANNUAL REPORT AND FINANCIAL STATEMENTSFOR THE YEAR ENDED 31 DECEMBER 2015
ANNUAL REPORT AND FINANCIAL STATEMENTSFOR THE YEAR ENDED 31 DECEMBER 2015
3
CORPORATE INFORMATION (Continued)
CORRESPONDENT BANKS Deutsche Bank AG London6 BishopsgateLondonEC2P 2ATUnited Kingdom
DZ Bank AG60265 Frankfurt am Main
Deutsche Bank Trust Company AmericasP O Box 318, Church Street StationNew York, New York 10008 – 0318
National Bank of CanadaP. O. Box 600 rue de la Gauchetière OuestMontréal, Québec, Canada
BOARD COMMITTEES
Credit Committee Prof. David Kimutai arap Some - ChairmanMr. T. K. Muya
Dr. Wilfred D. KiboroMr. Peter MunyiriMr. Njung’e Kamau
Audit Committee Mr. David Kimani - Chairman
Dr. Ruth Waweru Mr. Lerionka S. Tiampati
Risk Management Committee Mr. David Kimani - ChairmanMrs.Ruth Waweru
Human Resource Committee Dr. Ruth Waweru - ChairmanProf. David Kimutai arap SomeMr. T. K. Muya Dr. Wilfred D. Kiboro Mr. Peter MunyiriMr. Brian Kiondo
Strategy Committee Dr. Ruth Waweru - ChairmanMr. T. K. MuyaMr. Lerionka S. Tiampati Dr. Wilfred D. KiboroMr. Peter MunyiriMr. Njung’e Kamau
Nomination Committee Dr Ruth Waweru Dr. Wilfred Kiboro Mr T.K.Muya

ANNUAL REPORT AND FINANCIAL STATEMENTSFOR THE YEAR ENDED 31 DECEMBER 2015
ANNUAL REPORT AND FINANCIAL STATEMENTSFOR THE YEAR ENDED 31 DECEMBER 2015
4
NOTICE IS HEREBY GIVEN that the 9th ANNUAL GENERAL MEETING of the Shareholders will be held at KENYATTA INTERNATIONAL CONFERENCE CENTRE LENANA AND ABERDARE ROOMS on Friday 22ndApril 2016 at 10:00 a.m. to transact the following business:
Ordinary Business:
1. To receive the Audited Accounts for the year ended 31st December 2015, the Report of the Directors and the Report of the Auditors thereon.
2. To approve the payment of a first and final dividend of KShs0.50 per share, subject to withholding tax where applicable, on the issued and paid up capital of the Company and payable to the shareholders registered as at 22nd April 2016. To facilitate payment of the Dividend, the register of members will be closed on 22nd April 2016.
3. Resignation, Rotation and Election of Directors in accordance with Article 112 of the Articles of Association: a) To consider and, if deemed fit, approve the appointment of Mr F.G Mungai as a Director.b) Mr T.K Muya who retires by rotation and, being eligible, offers himself for re-election.c) Mr L.S Tiampati who retires by rotation and, being eligible, offers himself for re-electiond) To note that the Managing Director Mr P.M Munyiri will retire with effect from 11th June 2016 upon expiry of his Employment Contract with
the Bank.
4. To approve the Directors’ remuneration for the year ending 31st December 2015.
5. To confirm that the auditors, Deloitte and Touché, being qualified for re-appointment, will continue in office in accordance with Section 159 (2) of the Companies Act, Chapter 486 Laws of Kenya (now repealed)and to authorise the Directors to fix the Auditors’ remuneration.
6. Special Business:To consider and, if thought fit, pass the following resolutions:
6.1 ORDINARY RESOLUTIONS
6.1.1 THAT the incorporation of Family Bank (Kenya) Limited as a wholly owned subsidiary of the Company be and is hereby ratified.
6.1.2 THAT the Company be and is hereby authorized to transfer its banking business, assets and liabilities (excluding the excluded assets and liabilities) to Family Bank ( Kenya) Limited subject to obtaining all required regulatory and tax approvals and/or exemptions in terms acceptable to the Directors.
6.1.3 THAT any acquisition of subsidiaries in Africa principally undertaking businesses similar to those of the Company and its subsidiaries in accordance with the business strategy of the Company, as approved by the Board from time to time, be and is hereby approved and the Board of the Company be and is hereby authorized to approve the terms of such acquisitions and enter into agreements in order to undertake such acquisitions, subject to obtaining all requisite regulatory approvals.
6.2 SPECIAL RESOLUTIONS
6.2.1 THAT subject to completion of the transfer of banking business, assets and liabilities (excluding the excluded assets and liabilities) occurring (“Completion”) the Articles of Association of the Company (deemed to incorporate the objects of the Company by virtue of Section 26 of the Companies Act, 2015)be amended to include the following objects:
“To carry out the business of a non-operating holding company as defined under the Banking Act (Chapter 488, Laws of Kenya)
To co-ordinate the administration of and to provide advisory, administrative management and other services in connection with the activities of any companies which are for the time being subsidiaries of the Company”
6.2.2 THAT subject to Completion of the change of name of the Company from Family Bank Limited to Family Group Public Limited Company be and is hereby approved and confirmed to take effect from the date of Completion.
6.2.3. THAT out of the unissued ordinary shares of the company, the company issue by way of rights to the holders of ordinary shares of the company on the register of members at close of business on 22nd April 2016 upto a maximum of 105,000,000 new shares on such terms, timeline and at such price to be determined by the board following valuation of the company shares provided that fractional shares shall not be considered and the holders of ordinary shares shall not be entitled to fractional certificates or to payments in lieu of them.That this authorization shall expire on 21st April 2021.
6.2.4 THAT the board be and is hereby authorised to offer and allot any rights not taken up and paid in full by the existing shareholders within twenty one days of the close of the offer, to such interested investors by way of private placement as the Board deems fit but on no more favourable terms than those on which it offered to its members.
By order of the BoardRebecca Mbithi Company SecretaryNairobi
31st March, 2016
Notes: A member entitled to attend and vote at this Meeting may appoint a proxy to attend and vote on his/her behalf and such proxy need not be a member of the Company. The proxy shall be required to be deposited at the Company Secretary office 8th Floor at Family Bank Towers Muindi Mbingu Street Nairobi not less than Forty-eight hours before the time for holding the meeting failing which it shall be invalid. In the case of a corporate body the proxy must be under its common seal. The proxy form is available on the Company’s website www.familybank.co.ke.
The full set of audited accounts for the year ended 31st December 2015 is available at the Company’s registered office at Family bank Towers 6th Floor or can be downloaded at the website www.familybank.co.ke
Companies Act 2015Family Bank Ltd

ANNUAL REPORT AND FINANCIAL STATEMENTSFOR THE YEAR ENDED 31 DECEMBER 2015
ANNUAL REPORT AND FINANCIAL STATEMENTSFOR THE YEAR ENDED 31 DECEMBER 2015
5
BOA
RD O
F D
IREC
TORS
Left
to R
ight
sea
ted:
Reb
ecca
Mbi
thi (
Com
pany
Sec
reta
ry),
Dr.
Wilf
red
Kibo
ro (C
hair
man
), D
r. Ru
th W
awer
u, T
.K M
uya
Left
to R
ight
sta
ndin
g: L
erio
nka
Tiam
pati,
Fra
ncis
Mun
gai,
Dav
id K
iman
i, Br
ian
Muy
a Ki
ondo
, Nju
nge
Kam
au (F
inan
ce D
irect
or) P
eter
Mun
yiri
(Man
agin
g D
irect
or a
nd C
hief
Exe
cutiv
e O
ffice
r),
Prof
. Dav
id K
imut
ai S
ome,
Mar
k Ke
riri

ANNUAL REPORT AND FINANCIAL STATEMENTSFOR THE YEAR ENDED 31 DECEMBER 2015
ANNUAL REPORT AND FINANCIAL STATEMENTSFOR THE YEAR ENDED 31 DECEMBER 2015
6
Board of Directors
Dr. Kiboro holds a Bachelor of Science (Civil Engineering) from the University of Nairobi and he began his engineering career with Shell and Esso where he rose through the ranks to head the Sales and Marketing functions. He was later appointed as Managing Director of Rank Xerox, and he is the immediate former Chief Executive Officer of the Nation Media Group where he still serves as Chairman. Dr. Kiboro is also the Chancellor of Riara University and a Trustee of the Rhino Ark, a charitable trust founded in 1988 to support conservation in Kenya and Wilfrey Investment Group. Dr. Kiboro has received various accolades including being a Member of International Who’s Who of Professionals, and he is a past Chairman of several organisations including the Media Owners Association, the East African Business Council, the International Press Institute Board, the Federation of Kenyan Employers, and the Standard Chartered Bank, Kenya. He has also served on the Boards of the Kenya Association of Manufacturers, and the National Environmental Manage-ment Authority (NEMA).
Mr. Munyiri holds a BA Honors degree in Economics from the University of Nairobi and an EMBA from Jomo Kenyatta University of Agriculture and Technology. Mr. Munyiri is an Associate member of the Chartered Institute of Bankers UK (ACIB), a Fellow of the Kenya Institute of Bankers (FKIB) and Alumni of Oxford University (Said Business School), INSEAD (France) and Strathmore Business Schools. He has also trained in the World Bank headquarters (Washington DC). He has a wealth of experience in banking and strategy execution spanning over many years having previously worked at Executive levels with Kenya Commercial Bank (KCB), Co-operative Bank of Kenya, Standard Charted Bank and Barclays Bank of Kenya. His experience cuts across several Pan African markets including market entry strategies. Among key highlights in his career path is leading a major transformational project for a big bank in several markets in East Africa together with McKinsey and Company, the global management consultancy firm.
His last appointment was the Deputy Group Chief Executive Officer with the Kenya Commercial Bank where he was a member of the Boards of the several group companies. He is a member of Governing Council Kenya Bankers Asso-ciation. He has also served as council Member of the Kenya Institute of Bankers and Pan African Christian University. He holds a Head of State Commendation (HSC) and in 2015 was also awarded Order of the Golden Warrior (OGW) for his contribution to the growth of the Kenyan Banking Industry and transformation of small businesses in East Africa through financial intermediation.
Dr. Wilfred D Kiboro Chairman
Mr. Peter Munyiri, Managing Director & Chief Executive Officer
TK, as he is popularly known, founded Family Bank in 1984 and he served as the institution’s Chief Executive Officer from 1984 to June 2006 after which he chaired the Bank until December 2012. He is one of Kenya’s leading visionaryentrepreneurs associated with various companies including Kenya Orient Insurance Limited, Daykio Plantations Limited and Alpha Africa Asset Managers Limited on whose Boards he sits or is represented in different capacities.
In recognition of his entrepreneurship and, more specifically, his contribution to the banking industry, TK was awarded the national accolade, Elder of the Order of the Burning Spear, in December 2011.
Mr. Titus K. Muya Director
Prof. Some is the Chief Executive Officer of the Commission on University Education, and is a former Vice Chancellor of Moi University, Eldoret. He holds a PhD from University of Newcastle –upon Tyne, U.K., M.Sc from Cranfield University and B.Sc. (Hons) University of Newcastle-upon Tyne, UK. Prof Some is a member of a number of boards including the Higher Education Loans Board, Kenya Polytechnic Board of Governor among others.
He has also served as a member and founder chairman Board of Kenya Medical Training Colleges as well as ApproTEC, (Makers of Water pump) (Moneymaker) and oil presses. He is also the Collaborating Editor of the Journal of Agricultural Mechanization in Asia, Africa and Latin America.
Prof. David Kimutai arap SomeDirector
ANNUAL REPORT AND FINANCIAL STATEMENTSFOR THE YEAR ENDED 31 DECEMBER 2015
ANNUAL REPORT AND FINANCIAL STATEMENTSFOR THE YEAR ENDED 31 DECEMBER 2015
7
Board of Directors
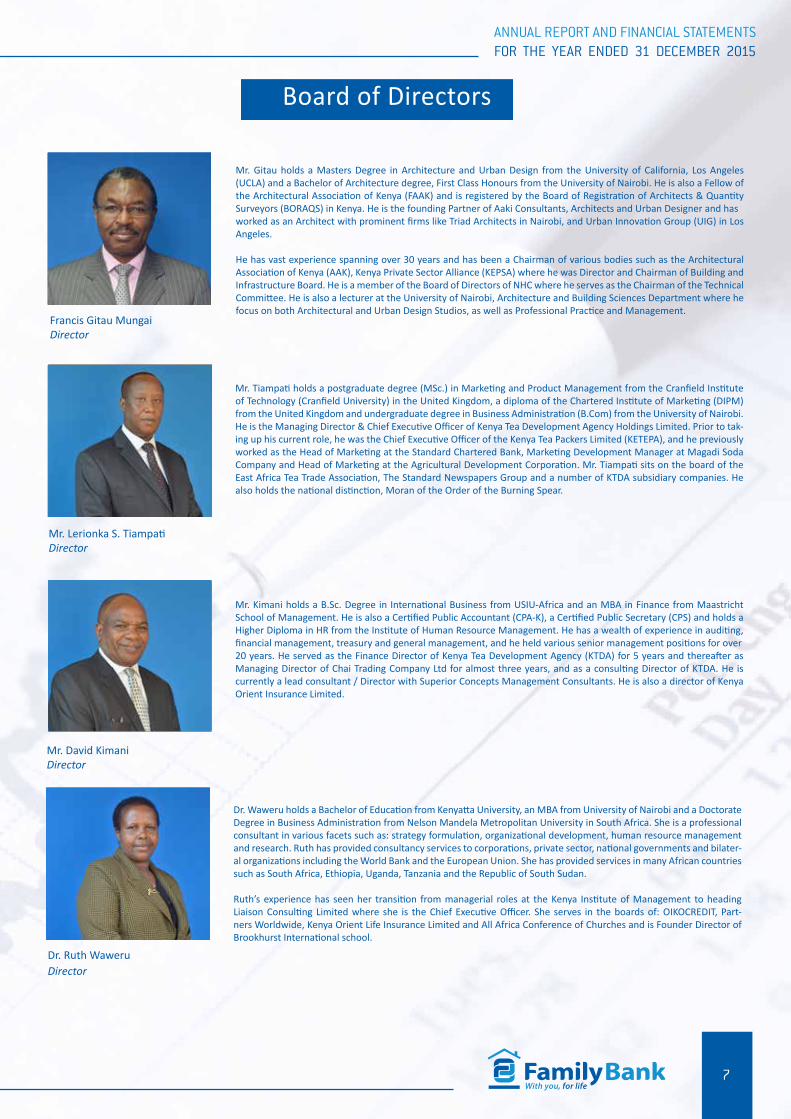
Mr. Tiampati holds a postgraduate degree (MSc.) in Marketing and Product Management from the Cranfield Institute of Technology (Cranfield University) in the United Kingdom, a diploma of the Chartered Institute of Marketing (DIPM) from the United Kingdom and undergraduate degree in Business Administration (B.Com) from the University of Nairobi.He is the Managing Director & Chief Executive Officer of Kenya Tea Development Agency Holdings Limited. Prior to tak-ing up his current role, he was the Chief Executive Officer of the Kenya Tea Packers Limited (KETEPA), and he previouslyworked as the Head of Marketing at the Standard Chartered Bank, Marketing Development Manager at Magadi Soda Company and Head of Marketing at the Agricultural Development Corporation. Mr. Tiampati sits on the board of the East Africa Tea Trade Association, The Standard Newspapers Group and a number of KTDA subsidiary companies. He also holds the national distinction, Moran of the Order of the Burning Spear.
Mr. Kimani holds a B.Sc. Degree in International Business from USIU-Africa and an MBA in Finance from Maastricht School of Management. He is also a Certified Public Accountant (CPA-K), a Certified Public Secretary (CPS) and holds a Higher Diploma in HR from the Institute of Human Resource Management. He has a wealth of experience in auditing, financial management, treasury and general management, and he held various senior management positions for over20 years. He served as the Finance Director of Kenya Tea Development Agency (KTDA) for 5 years and thereafter as Managing Director of Chai Trading Company Ltd for almost three years, and as a consulting Director of KTDA. He is currently a lead consultant / Director with Superior Concepts Management Consultants. He is also a director of Kenya Orient Insurance Limited.
Mr. Lerionka S. TiampatiDirector
Mr. David KimaniDirector
Mr. Gitau holds a Masters Degree in Architecture and Urban Design from the University of California, Los Angeles (UCLA) and a Bachelor of Architecture degree, First Class Honours from the University of Nairobi. He is also a Fellow of the Architectural Association of Kenya (FAAK) and is registered by the Board of Registration of Architects & Quantity Surveyors (BORAQS) in Kenya. He is the founding Partner of Aaki Consultants, Architects and Urban Designer and hasworked as an Architect with prominent firms like Triad Architects in Nairobi, and Urban Innovation Group (UIG) in Los Angeles.
He has vast experience spanning over 30 years and has been a Chairman of various bodies such as the Architectural Association of Kenya (AAK), Kenya Private Sector Alliance (KEPSA) where he was Director and Chairman of Building andInfrastructure Board. He is a member of the Board of Directors of NHC where he serves as the Chairman of the Technical Committee. He is also a lecturer at the University of Nairobi, Architecture and Building Sciences Department where he focus on both Architectural and Urban Design Studios, as well as Professional Practice and Management.
Francis Gitau MungaiDirector
Dr. Waweru holds a Bachelor of Education from Kenyatta University, an MBA from University of Nairobi and a Doctorate Degree in Business Administration from Nelson Mandela Metropolitan University in South Africa. She is a professional consultant in various facets such as: strategy formulation, organizational development, human resource management and research. Ruth has provided consultancy services to corporations, private sector, national governments and bilater-al organizations including the World Bank and the European Union. She has provided services in many African countries such as South Africa, Ethiopia, Uganda, Tanzania and the Republic of South Sudan.
Ruth’s experience has seen her transition from managerial roles at the Kenya Institute of Management to heading Liaison Consulting Limited where she is the Chief Executive Officer. She serves in the boards of: OIKOCREDIT, Part-ners Worldwide, Kenya Orient Life Insurance Limited and All Africa Conference of Churches and is Founder Director of Brookhurst International school.
Dr. Ruth WaweruDirector

ANNUAL REPORT AND FINANCIAL STATEMENTSFOR THE YEAR ENDED 31 DECEMBER 2015
ANNUAL REPORT AND FINANCIAL STATEMENTSFOR THE YEAR ENDED 31 DECEMBER 2015
8
Board of Directors
Njung’e Kamau is the Finance & Strategy Director of the Bank. . He has over 24 years extensive local and international professional working experience in Advanced Global Finance, Strategy, Banking, Treasury, Company Secretarial, Pro-curement & Logistics,Audit and Business Risk Assurance & Compliance in Banking and other global diverse business environments. He commenced his career with Ernst & Young and also worked with Lonrho Africa Plc as a Senior Auditor covering 14 countries. He has also worked with East African Breweries Limited as Manager, Audit &Business Risk Assur-ance. Prior to joining Family Bank, Njung’e was the Head of Finance at Equity Bank. He holds an MBA in Finance and a B.Com Degree (Accounting Option) from The University of Nairobi. He is also a Certified Public Accountant (CPA-K), Certified Public Secretary (CPS-K) from Strathmore University and a member of ICPAK and ICPSK.
He is also a Certified Financial Modeller (CFM) from The International Academy of Financial Management from (Dubai, UAE &Hongkong).He also studied a course on Macroeconomics of Competitiveness of Nations from Havard University Business School’s Institute for Strategy & Competitiveness and The World Bank / CGAP training in the USA. He fur-ther studied at The International Banking Summer School (IBSS) in Australia and also did anEffective Director (ED) & Advanced Management Programme (AMP) from Strathmore University, Lagos University and IESE – Barcelona, Spain University.His experience of studying and working in many diverse international markets equipped him with invaluable knowledge in global corporate governance standards and best practices as well as establishing vital global business networks / contacts. In addition, he possess strong leadership, interpersonal, mul-ti-tasking, communication, negotiating, numerical, financial and analyticaland IT skills. Njung’e has also done a lot of philanthropy work since 1980s mainly because of his poor background / roots and especially helping orphans and other disadvantaged children, women and other very needy people.
Rebecca Mbithi holds a Bachelor of Laws Degree from the University of Nairobi and a Masters in BusinessAdministration from United States International University. She is a Certified Public Secretary and a CertifiedPublic Accountant.
She has over fourteen years’ experience in legal and Company Secretarial practice both as an advocate andalso at top management level in two large organizations. She served as Head of Legal and Regulatory Affairsin Kenya Tea Development Agency Ltd for four years before joining Rift Valley Railways as the CompanySecretary and Legal Counsel for five years. She has vast experience in corporate governance and has servedin the Corporate Governance and Standards Committee of the Institute of Certified Public Secretaries Kenya.
Mr. Njung’e Kamau - Director Finance & Strategy
Rebecca Mbithi - Company Secretary
Mr. Muyah holds a Bachelor’s Degree in Economics from Syracuse University, New York, and is a seasoned marketer with over 15 years’ experience in both the Unites States and Kenya. He has extensive knowledge in business develop-ment, service delivery management, product development, strategy implementation and staff training, development and motivation. Julius headed the sales and marketing department during the conversion of Family Finance Building Society into a commercial bank during which time he spearheaded the development of new products and services.
He is also Chairman of Kenya Orient Insurance Limited and Daykio Plantations Group, a real estate company, and is the founder Director of Ingenious Concepts - an outdoor advertising and marketing firm in Kenya.
Mr. Julius Brian Kiondo Muyah(Alternate to Mr. TK Muya)

ANNUAL REPORT AND FINANCIAL STATEMENTSFOR THE YEAR ENDED 31 DECEMBER 2015
ANNUAL REPORT AND FINANCIAL STATEMENTSFOR THE YEAR ENDED 31 DECEMBER 2015
9
Dear Shareholders,
I am pleased to present the Annual Report and Financial Statements for the year ended 31st December, 2015. The Bank continues to post very impressive financial performance despite the challenging environment. The unstinting support by our customers and shareholders clearly demonstrates the confidence in the Bank. The Board, Management and Staff have also been instrumental in the great performance of this great Bank.
Once again, we are happy to have set the pace in the banking industry by delivering enviable results in the growth among our peers and among the listed banks. With this remarkable performance our ambition to become a Tier 1 Bank in the next few years is firmly on course.
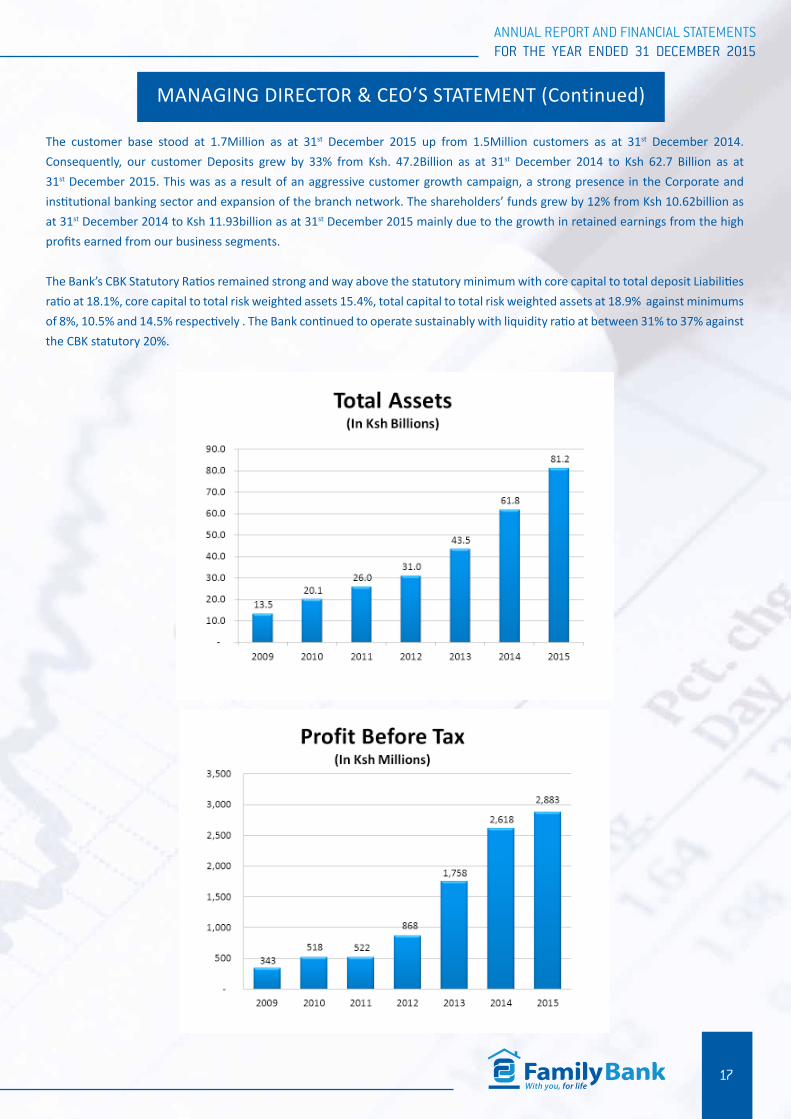
Key Financial Performance Highlights• Profit before Tax increased by 10% from Ksh 2.62 Billion for
the year ended 31st December 2014 to Ksh 2.88Billion for the year ended 31st December 2015.
• Total assets grew by 31% from Ksh 61.8 Billion as at December 2014 to Ksh 81.2Billion as at December 2015.
• Total Shareholders’ funds grew by 12% from Ksh 10.62 Billion as at December 2014 to Ksh 11.93 Billion as at December 2015.
• Deposits grew by 33% from Ksh 47.2 Billion as at December 2014 to Ksh62.7Billion as at December 2015.• Loans grew by 47% from Ksh 37.9Billion as at December 2014 to Ksh 55.9Billion as at December 2015. • The Bank now has over 1.7 Million customers.
Review of the macroeconomic environment
The Year 2015 commenced very well in the Country with the Government leveraging on the astute steps taken earlier to sustainably
grow the Economy. Overall, the country experienced a 5.7% growth in Gross Domestic Product against the projected 6% growth.
This was better than the 5.3% growth realized in 2014. The key drivers of the operating environment were security challenges and
the El Nino rains that wreaked havoc and destruction in some parts of the Country.
From a Sectoral perspective, agriculture, infrastructure, financial services and ICT contributed to the growth, but manufacturing
and tourism declined.
The government also maintained fiscal and monetary discipline, despite increasing pressure from the devolution process and
rising public sector wage bill. Total public debt has increased but remains sustainable, according to Central Bank figures, while
interest rates rose substantially over the period under review .The stock exchange weakened due to increased net foreign investor
outflows, while the Kenya shilling weakened against the US dollar.
With the increased competitiveness of the manufacturing sector which will be a key driver of growth, exports and job creation,
Kenya is emerging as one of Africa’s key growth centers and is also poised to become one of the fastest growing economies in East
Africa. This was further supported by the high spending on infrastructure by the government and globally low oil prices which
boosted the manufacturing and the construction sectors since Kenya is a net oil importer.
Month on month Inflation has remained largely stable during the year and within the CBK target range of 2.5% to 7.5%. The
inflation rate started the year at 5.5%, moved on to 7.1% in April eventually reaching a high of 8.01 % in December 2015.
CHAIRMAN’S STATEMENT REVIEW OF THE MACROECONOMIC ENVIRONMENT
ANNUAL REPORT AND FINANCIAL STATEMENTSFOR THE YEAR ENDED 31 DECEMBER 2015
ANNUAL REPORT AND FINANCIAL STATEMENTSFOR THE YEAR ENDED 31 DECEMBER 2015
10
CHAIRMAN’S STATEMENT (Continued)
On the currency, the Kenya Shilling has depreciated by 15.9% YTD on account of a strengthening Dollar globally and a widening
current account deficit driven by high government spending. Additionally, there was reduced foreign exchange inflows on the back
of poor revenues from tea, horticulture and tourism. As of the end of Q3, 2015, the import cover stood at 4.3 months which is
marginally above the mandatory requirement of 4 months. Since June 2015, CBK has increased Central Bank Rate (CBR) by 300
bps to 11.5% in order to stabilize the currency, and eventually, the KBRR also increased by 133 basis points to 9.87% which had a
spiraling effect on the interest rates and slowed down credit.
The Country is making huge investments in infrastructure development, in road, rail port and energy sectors. Notably, the $3.6
billion standard-gauge railway from the port of Mombasa to Nairobi, with an extension to Naivasha. Additionally, the Government
is on track to boost installed power-generation capacity by 5,000 megawatts by end of 2017.
Tourism, which is a key foreign exchange earner has been adversely affected by insecurity putting further pressure on the budget
deficit.
On the Ease of doing business, Kenya improved 28 positions in the World Bank’s ranking index helped by reforms in business and
property registration, electricity connections and access to credit. The country was ranked at position 108 out of 189 countries
globally compared to 136 in last year, making it the third most improved economy. This translated into increased investment in key
growth areas including the Banking Sector.
Banking Sector Developments
The banking sector performed well in Year 2015 with a number of banks innovating around customer needs, convenience and
efficiency through use of alternative banking channels such as mobile, internet and agency banking. In addition there has been
an industry wide branch network expansion strategy both in Kenya and in the East African region. Further a resilience by banks
to reduce their rates following the introduction of the KBRR through strategies of protecting their margins regardless of the rate
environment has been evident.
Notably throughout 2015, Banks have adopted very austeric measures to drive their growth strategies. To manage costs, banks
have adopted measures to enhance operational efficiency and protect the Net interest Margins (NIMS).
In an effort to diversify income lines, the industry has witnessed an accelerated adoption of Alternative Business Channels involving
use of mobile and agency banking. This has increased their footprint and market penetration as well as enabling banks to continue
providing loan products to the mass market.
There has been unprecedented growth in the retail business segment supported by the expanding middle class, which is growing
faster than other countries in Africa. This has led to an inherent increase in consumption expenditure and an increase in the
percentage of the population requiring banking services.
With devolution gaining momentum in Kenya, banks have expanded their footprints both regionally and domestically. Sector
players have been more aggressive in trying to capture the opportunities that exist at county levels, which will increase their
customer base. Banks are also looking to expand in the less penetrated markets of Tanzania, Uganda, Rwanda and South Sudan
opening up new channels of revenue.
The Banking sector experienced a remarkable increase in interest rates throughout 2015. The Kenya Bankers Reference Rate
ANNUAL REPORT AND FINANCIAL STATEMENTSFOR THE YEAR ENDED 31 DECEMBER 2015
ANNUAL REPORT AND FINANCIAL STATEMENTSFOR THE YEAR ENDED 31 DECEMBER 2015
11
CHAIRMAN’S STATEMENT (Continued)
increased by 133 bps to 9.87% largely as a result of an increase in the CBR by 300 bps to 11.5%.This led to increase in interest on
all loans pegged on the KBRR. Banks experienced their slowest year on year growth in 6 years of 8.3% during 2015 compared to
15.6% in 2014. Some Banks reported either losses or significant reduced earnings during this period as per the published financials
statements.
Additionally, there was a huge jump in interest expense in Q4 2015 and the impact of flight of deposits to the big banks after the
collapse of Imperial Bank, which forced the small banks in particular to take deposits at exorbitant costs. Specifically, interest on
large deposits reached unprecedented levels significantly eroding bank’s interest income. This negative effect has continued to
be felt into 2016 which is a key focus area being addressed by Central Bank of Kenya. Banks are also under increasing pressure by
Treasury and the Central Bank of Kenya to reduce interest rates and make loans more affordable to customers.
The Central Bank of Kenya announced a moratorium on the licensing of Banks with the exception of cases related to amalgamation
and acquisition of Banks. With the number of Commercial Banks at 40, this high number of banks comes with advantages such as
financial inclusion but also puts strains on CBK in providing thorough and effective supervision.
Going forward we expect banks’ net interest margins to remain depressed, and the only way for the banks to drive revenue is
by diversification to increase their non-funded income. The ability of the banks to diversify their top line helps reduce risks in
uncertain and volatile economic environments.
Two banks were put under receivership during the year for what the regulator said were issues relating to poor corporate
governance. Going forward, we expect the sector to come under greater scrutiny by the regulator to ensure commercial banks
adopt a robust risk based analysis in lending, supported by strong management and corporate Governance structures and strict
adherence to prudential guidelines and compliance.
Corporate Governance
Corporate governance continues to be an important focus area for us as changes in regulations and best practice continues to evolve. Our Board Charter is dynamic as is our approach to the board composition, board independence and composition of the various board committees. Having a strong management team continues to be key to the Bank’s success. Management and the various board committees continue to play a vital role in supporting the Main Board in discharging its mandate and meet stakeholders’ expectations.
Risk management framework founded on local and international regulatory guidelines and best practices were also reinforced. The risk framework covers all risks across all functional levels of the Bank. There is a Board Risk Committee and a Risk & Compliance Department tasked to closely monitor the various types of identified risks and the mitigants that should be in place. The Board Credit Committee oversees prudence in the lending Processes across the Bank network while the Board Strategy Committee guides the Management on overall implementation of the Growth Strategy. The Board Human Resources Committee provides leadership to our Staff who remain our greatest investment in the Bank.

ANNUAL REPORT AND FINANCIAL STATEMENTSFOR THE YEAR ENDED 31 DECEMBER 2015
ANNUAL REPORT AND FINANCIAL STATEMENTSFOR THE YEAR ENDED 31 DECEMBER 2015
12
Corporate Social Responsibility (CSR)
In 2015, Family Bank continued to reaffirm and demonstrate leadership in CSR initiatives. The Bank attributes its success to the support that we continue to receive from our shareholders and customers. The Bank is committed to supporting worthy causes and projects from various sectors in the areas of sports, education, healthcare and community empowerment as follows:
Sports
· Family Bank continues to reassert its credentials in the sporting arena through sponsorship of the annual Family Bank Eldoret Half Marathon to nurture young upcoming athletes. Since its launch in 2007, the Half Marathon has produced talented world beaters who have gone to win international marathons. In the year 2015 the Bank upped its investment to Ksh 10 Million towards this initiative that saw over 1000 athletes participate in the Eldoret Marathon. During the year, the Bank also sponsored golf at Eldoret Club, with the day dubbed, “Family Bank Golf Day”.
Education
· Family Bank appreciates the role played by education in the society and the Kenyan Economy at large. “The Education Scholarship Fund” launched in 2012 continues to support bright but very needy children access quality education. The fund is currently sponsoring over 300 students in paying school and boarding fees. Early in the year the Bank teamed up with our associated Companies, Kenya Orient Insurance Limited and Daykio Plantations through the “The Family Bank Group Foundation” and donated Ksh20Million towards the Beyond Zero Campaign championed by the First Lady and participated in the First Lady Half Marathon. The Foundation is the philanthropic arm formed in partnership with Family Bank, Kenya Orient Insurance Ltd and Daykio Plantations Ltd.
· In 2015 we also supported Starehe Girls Centre during their fund-raising initiatives which included a Charity Golf event at Windsor Country Club.
CHAIRMAN’S STATEMENT (Continued)
Family Bank MD- Peter Munyiri takes a maiden ride with KNH CEO - Lily Koros during the unveilling of the Kshs 4.3 Million Children’s playground facility at the Kenyatta National Hospital.
Athletes starting off during the 9th edition of the Family Bank Eldoret half Marathon.
ANNUAL REPORT AND FINANCIAL STATEMENTSFOR THE YEAR ENDED 31 DECEMBER 2015
ANNUAL REPORT AND FINANCIAL STATEMENTSFOR THE YEAR ENDED 31 DECEMBER 2015
13
Health Care Support
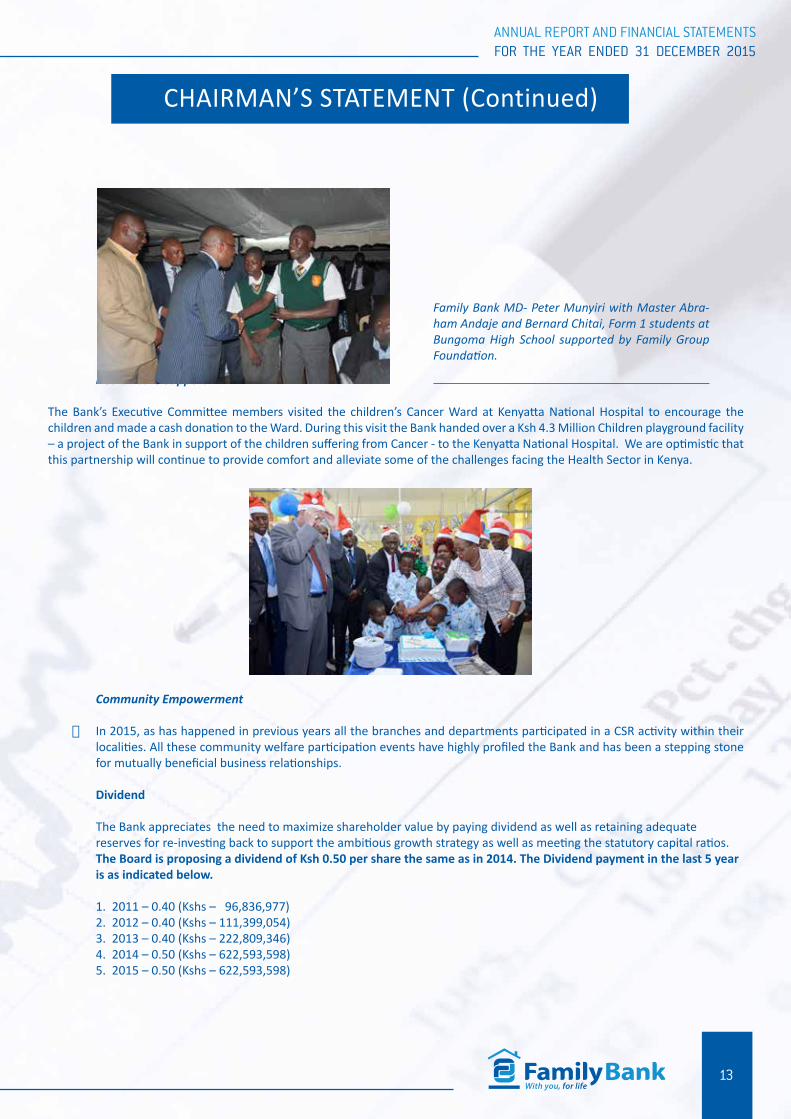
The Bank’s Executive Committee members visited the children’s Cancer Ward at Kenyatta National Hospital to encourage the children and made a cash donation to the Ward. During this visit the Bank handed over a Ksh 4.3 Million Children playground facility – a project of the Bank in support of the children suffering from Cancer - to the Kenyatta National Hospital. We are optimistic that this partnership will continue to provide comfort and alleviate some of the challenges facing the Health Sector in Kenya.
Community Empowerment
· In 2015, as has happened in previous years all the branches and departments participated in a CSR activity within their localities. All these community welfare participation events have highly profiled the Bank and has been a stepping stone for mutually beneficial business relationships.
Dividend
The Bank appreciates the need to maximize shareholder value by paying dividend as well as retaining adequate reserves for re-investing back to support the ambitious growth strategy as well as meeting the statutory capital ratios. The Board is proposing a dividend of Ksh 0.50 per share the same as in 2014. The Dividend payment in the last 5 year is as indicated below.
1. 2011 – 0.40 (Kshs – 96,836,977) 2. 2012 – 0.40 (Kshs – 111,399,054) 3. 2013 – 0.40 (Kshs – 222,809,346) 4. 2014 – 0.50 (Kshs – 622,593,598) 5. 2015 – 0.50 (Kshs – 622,593,598)
CHAIRMAN’S STATEMENT (Continued)
Family Bank MD- Peter Munyiri with Master Abra-ham Andaje and Bernard Chitai, Form 1 students at Bungoma High School supported by Family Group Foundation.

ANNUAL REPORT AND FINANCIAL STATEMENTSFOR THE YEAR ENDED 31 DECEMBER 2015
ANNUAL REPORT AND FINANCIAL STATEMENTSFOR THE YEAR ENDED 31 DECEMBER 2015
14
Outlook for 2016The Bank shall continue to rely on the support and goodwill of all our stakeholders and specifically our shareholders and customers to drive its growth strategy. We are collectively determined to exceed our stretching targets for 2016 with renewed determination, resilience and commitment of our Board, management and staff.Our commitment to focus on positively transforming peoples’ lives through the provision of quality financial services and efficient customer service remains steadfast. We will leverage on Information and Communications Technology and innovating new products and services to support the growing financial needs of our customers. The bank will continue to invest substantial amount in capital to upgrade its IT infrastructure and architecture and also continue expanding its branch and virtual networks.
FundingAs a bank we will continue to ensure that we support the growth momentum and meet the statutory ratios with the Board continuing to explore various funding options both in equity and debt financing. In mid-2015 we signed our second tranche of Ksh 4 billion debt financing agreement with the European Investment Bank (EIB) having successfully exhausted the first facility of Ksh2Billion in 2014. We confirm that the EIB funds have now been received in our accounts to support our growth especially in the SME sector. We also received another Ksh1Billion from Oiko Credit and are currently in advanced discussions with other international partners like Africa Development Bank (AfDB) for more funding to support our growth strategy.The Bank remains committed to its five year capital plan as per the latest CBK Guidelines. As stated earlier, we continue to explore various equity and Debt Financing options to maintain our fast paced but sustainable growth. On the Equity side, we once more call on our shareholders to approve and participate in a Rights issue to support this noble agenda.
CHAIRMAN’S STATEMENT (Continued)
Family Bank Chairman Dr. Wilfred Kiboro and Managing Director & CEO Mr. Peter Munyiri during the Corporate Bond Launch.

ANNUAL REPORT AND FINANCIAL STATEMENTSFOR THE YEAR ENDED 31 DECEMBER 2015
ANNUAL REPORT AND FINANCIAL STATEMENTSFOR THE YEAR ENDED 31 DECEMBER 2015
15
Regional Expansion To further support our Tier one journey, the bank is actively exploring valuable options in the African Region to have a presence in at least one country in the next one year. Our options will leverage on the country profile and business risk profile through a Brown Field entry Strategy. This will also be determined by the quality of assets available in the specific country we will eventually commit our investment.In preparation for our entry in the Region, The board is proposing to the Shareholders incorporation of a Non-operating Holding Company to manage our planned regional Strategy and Subsidiaries. This move will position Family Bank as a regional entity positively transforming lives in Africa and beyond. Family Bank projects that the new structure will increase efficiency and enable the Group’s business operate more robustly and independently. We are confident as a board that the re-organization will result in operational efficiencies and better financial performance for the Bank. The new units will be able to operate independently while being supervised by the mother company to ensure that the activities are run according to the laid down practices and move towards boosting the bank’s financial performance remarkably.
The structure we are proposing to form will go a long way in enhancing the Group’s capacity to attract capital and also enable us to venture invest in new areas outside traditional banking. The structure will also help us achieve operational and strategic autonomy for the Group’s operating entities and enhance corporate governance across the Group and oversight in management of subsidiaries.
Exit of Managing Director & Chief Executive Officer Our Managing Director and CEO will be leaving the Bank in June 2016 after the end of his contract, during which he presided over unprecedented growth in the Bank’s history. On behalf of the Board of Directors and Staff, I sincerely express the Bank’s appreciation for his contribution to the Bank and wish him the best in his future plans.
Conclusion Our business continues to thrive despite the challenging operating environment the Kenyan Financial services industry is undergoing We are registering exemplary financial performance; outperforming the industry and sustainably grown our key business lines. This growth is a clear record of our ability and commitment to build a sustainable and impactful business in Kenya. We seek to leverage on the vast opportunities both locally, regionally and globally to maintain our winning track record
On behalf of the Board of Directors, I take this opportunity to thank our shareholders for their confidence in the bank and supporting it fully, our customers for your tireless support and clear demonstration of your faith in the Bank and its growth strategies. We are deeply humbled and highly indebted for this unwavering support.
I also sincerely thank and high appreciate the management and staff of the Bank for their dedicated service and achievement in implementing successful sustainable strategies in a dynamic and competitive banking environment during the year. My special thanks also go to my fellow Board Members for their support, diligence and commitment as we work towards achieving the Bank’s objectives of realizing full potential of our business. Finally, I want to thank the Central Bank of Kenya and other stakeholders for providing an enabling business environment and for supporting us in our activities to help us grow, and provide value adding solutions to our customers and other Stakeholders.
I sincerely appreciate our very able and hardworking Board Members who have always provided me and the Bank invaluable support and guidance. I am certain that with continued focus, clarity of strategy and support of all stakeholders the years ahead will be even more promising and brighter for the Bank.
Thank you.
Dr. Wilfred D. KiboroChairman- Board of Directors
CHAIRMAN’S STATEMENT (Continued)

ANNUAL REPORT AND FINANCIAL STATEMENTSFOR THE YEAR ENDED 31 DECEMBER 2015
ANNUAL REPORT AND FINANCIAL STATEMENTSFOR THE YEAR ENDED 31 DECEMBER 2015
16
MANAGING DIRECTOR & CEO’S STATEMENT
Dear Shareholders,
I am delighted to present the Bank’s Annual Report and Financial
Statements for the year ended 31st December 2015. It was a year of
great performance set against a challenging industry wide economic
backdrop. We registered impressive growth on all parameters – once
again ending the year with a strong Balance Sheet and Profit position.
The Bank overcame increasing pressure from the operating
environment and continued to manage various macroeconomic issues
with vigor, tact and urgency. Notably, we were able to manage the
industry wide challenge of increasing cost of funds and the renewed
pressure by the Regulators and other lobby groups to reduce interest
rates by enhancing our business volumes and operational efficiency
across the bank.
The journey to become a Tier one Bank is well elaborated within our
Growth strategy and Must Win Battles which has been fully embraced
by the Board, Management and Staff. Our Sustained good financial
performance reaffirms that the sustained push to unlock the potential
for greater performance is on.
During the year we consolidated our gains in the new business areas i.e. Corporate and Institutional Banking, Treasury, Trade
Finance, Diaspora, Sacco Banking and Alternative Business Channels.
One of our key achievements in 2015 was the successful roll-out of our capital raising initiatives including the Corporate Bond in
which we sought to raise Ksh10Billion in tranches. This with other ongoing efforts will catapult the Bank on a growth trajectory to
attain tier one Status in the next three years.
We continued leveraging on Strategic Partnerships with key high value institutions thus growing our market share in all the business
segments. This is a manifestation of our brand strength and commitment to continue with our vision of positively transforming
lives.
Financial Performance
Profit before tax (PBT) increased by 10% from Ksh 2.62 Billion full year 2014 to Ksh 2.88 Billion for the year ended 31st December
2015. This commendable financial performance strengthened the Bank’s position as one of the leading banks in good Profit growth
ranking. The Bank outperformed peers in the banking industry by registering this sustainable performance. The remarkable increase
in profit before tax was mainly attributed to selective Credit acquisition, growth in the customer base and operating efficiency.
Total assets grew by Ksh 19.4 billion representing a 31% increase from Ksh 61.8billion as at 31st December 2014 to Ksh 81.2Bllion
as at 31st December 2015. This high growth in assets was primarily attributable to the growth in the number of customers, the loan
book and the branch expansion strategy. Net loans and advances stood at Ksh 55.9billion as at 31st December 2015 compared to
Ksh 37.9 billion as at 31st December 2014, representing a 47% growth.
ANNUAL REPORT AND FINANCIAL STATEMENTSFOR THE YEAR ENDED 31 DECEMBER 2015
ANNUAL REPORT AND FINANCIAL STATEMENTSFOR THE YEAR ENDED 31 DECEMBER 2015
17
MANAGING DIRECTOR & CEO’S STATEMENT (Continued)
The customer base stood at 1.7Million as at 31st December 2015 up from 1.5Million customers as at 31st December 2014.
Consequently, our customer Deposits grew by 33% from Ksh. 47.2Billion as at 31st December 2014 to Ksh 62.7 Billion as at
31st December 2015. This was as a result of an aggressive customer growth campaign, a strong presence in the Corporate and
institutional banking sector and expansion of the branch network. The shareholders’ funds grew by 12% from Ksh 10.62billion as
at 31st December 2014 to Ksh 11.93billion as at 31st December 2015 mainly due to the growth in retained earnings from the high
profits earned from our business segments.
The Bank’s CBK Statutory Ratios remained strong and way above the statutory minimum with core capital to total deposit Liabilities
ratio at 18.1%, core capital to total risk weighted assets 15.4%, total capital to total risk weighted assets at 18.9% against minimums
of 8%, 10.5% and 14.5% respectively . The Bank continued to operate sustainably with liquidity ratio at between 31% to 37% against
the CBK statutory 20%.

ANNUAL REPORT AND FINANCIAL STATEMENTSFOR THE YEAR ENDED 31 DECEMBER 2015
ANNUAL REPORT AND FINANCIAL STATEMENTSFOR THE YEAR ENDED 31 DECEMBER 2015
18
MANAGING DIRECTOR & CEO’S STATEMENT (Continued)

ANNUAL REPORT AND FINANCIAL STATEMENTSFOR THE YEAR ENDED 31 DECEMBER 2015
ANNUAL REPORT AND FINANCIAL STATEMENTSFOR THE YEAR ENDED 31 DECEMBER 2015
19
MANAGING DIRECTOR & CEO’S STATEMENT (Continued)

ANNUAL REPORT AND FINANCIAL STATEMENTSFOR THE YEAR ENDED 31 DECEMBER 2015
ANNUAL REPORT AND FINANCIAL STATEMENTSFOR THE YEAR ENDED 31 DECEMBER 2015
20
Branch Expansion and Alternative Business Channels
The Bank rolled out 11 additional branches to our network in the year 2015 to close with 91 branches. The Bank also has 170 ATMs
installed to date and is also a member bank of the Kenswitch and PesaPoint ATM networks with 1800 ATM points. In our endeavor
to provide excellent customer service beyond normal working hours we have continued to expand our Alternative business
channels to enable customer access our services 24/7.
Agency banking remains top on our agenda as a key driver of customer numbers and non-funded income lines. Currently we
have over 3000 active Agents in the market serving customers. The main advantage of alternative business channels is their cost
effectiveness, greater outreach, longer access hours and convenience especially for our customers. Moving forward, we remain
committed to these collaborations to grow our business lines in a sustainable way and further deepen our Universal Banking
Model.
Products and Services overview
During the year we continued to be innovative in the following value adding products and service-offering:
· The Bank operationalised a 24 Hour Call Centre in line with our stated objective of improving customer service. In addition
all staff have successful undergone customer centrism training to enhance the experience at all contact points throughout
the Bank network. This investment has translated in enhanced business relationships and patronage of the Banks products
and Services. This exemplary service has been received well by our customers leading to better and sustained business
performance.
· Retail Banking Business - we have further re-modelled our Retail Banking Business to enable strategic focus on the SME,
Micro, Agribusiness and Consumer market segments. Through our robust Cross Selling strategy, our sales teams have
adopted a multi –dimensional approach to business acquisition which highly contributed to the impressive results. This
MANAGING DIRECTOR & CEO’S STATEMENT (Continued)

ANNUAL REPORT AND FINANCIAL STATEMENTSFOR THE YEAR ENDED 31 DECEMBER 2015
ANNUAL REPORT AND FINANCIAL STATEMENTSFOR THE YEAR ENDED 31 DECEMBER 2015
21
gave us wider scope to offer targeted customer value propositions that are aligned to the needs of the respective customer
segments. Our SME strategy continued to deliver a comprehensive one stop offering of products for business customers
through dedicated relationship managers and officers in our branches. The micro banking strategy focuses on the needs
of individuals, small businesses and groups (Chamas) through our well trained officers while the Agribusiness strategy,
that has earned the Bank accolades of being the most popular farmers’ bank in many counties, focuses on the agricultural
sector through our competent field officers. The Consumer Banking strategy focuses on the salaried employees, mainly
though working partnerships with employers to offer tailor made comprehensive banking solutions to their employees.
We have innovative relevant products for all these key segments to adequately cater for their needs and expectations.
· Improved branch model – The year under review witnessed a general improvement in the brand positioning and look
and feel of the branch network. This was driven by our endeavor to further improve on our customer service delivery
to adequately need the dynamic and diversified needs of our clientele. This model branch concept with streamlined,
efficient processes was adopted because it facilitates optimal utilization of staff and other resources within our branches
and other distribution channels. This is complemented by a well-trained and motivated workforce all set to manage the
ambitious growth Strategy of the branches.
· Retail branches, corporate branches and Pesapap Agents - we have segmented our service outlets to offer a wide choice
of services to our customers, so that they settle on what serves them best. These include retail branches, corporate
branches and Pesapap Agents. These physical outlets are supplemented by an integrated suite of alternate channels
including mobile banking through Pesapap, internet banking and ATMs.
Corporate, Institutional Banking and Strategic Partnerships
The Bank continued to diversify Partnerships and Strategic Alliances to optimize on business growth. This new business front is
generating incremental value as detailed below;
· Corporate Banking
The corporate banking and Institutional business has gained a lot of momentum and in the last 3 years we have been
able to bag sizeable number of large corporate clients across the entire Country. We will continue to focus on all the key
sectors of the economy as detailed in vision 2030 and build more strategic partnerships. We have also developed products
and financial solutions which are tailored to meet the needs of these customers. Some of the main products that we
have continued to diversify in 2015 include Trade finance products such as invoice discounting, LPO Financing, bid bonds,
performance bonds, advance payment guarantees, Letters of Credit (LCs), Standby LCs and import duty financing. Our team
of dedicated and highly experienced Relationship Managers in the various fields are able to offer personalized services to
all customers. We continue to leverage on our robust internet banking Platform provide value to our corporates,as this
solution allows them to access banking services remotely and conveniently without the need to physically visit the bank.
· Institutional Banking
The Bank has become a preferred provider of banking and cash management services to key players in the industry. In
this regard, we have further enhanced business relationships with, large cash rich corporates and private individuals,
and quasi-government organizations as well driven a full brown marketing strategy for the county Governments. As a
result we have developed relationships with universities, colleges, Counties, Parastatals and several Fund Managers. The
bank has also become a preferred partner in liability management to leading players who previously banked with the
competition, a testament to the success we have enjoyed to date. We also continue to create partnerships with other
institutions and companies to deploy mobile banking platforms for enhanced transaction income and fee based revenue
streams.
MANAGING DIRECTOR & CEO’S STATEMENT (Continued)
ANNUAL REPORT AND FINANCIAL STATEMENTSFOR THE YEAR ENDED 31 DECEMBER 2015
ANNUAL REPORT AND FINANCIAL STATEMENTSFOR THE YEAR ENDED 31 DECEMBER 2015
22
· Diaspora Banking
Throughout 2015 the Bank made major inroads in growing and diversifying diaspora business and getting market share
from the market pace setters. We have established a robust network of Agents to drive business in the high source
areas in North America, Western Europe and Middle East. Through the Flagship M-Kenya Daima Diaspora Account our
Diaspora customers have been able to invest bank home in real Estate, Mortgage Financing, Education, Stocks among
others without the need to travel to Kenya. This business line has been greatly supportive of our rapidly expanding
alternative business and digital channels in which the bank has committed a huge investment aimed at enhancing non
funded income lines.
Sacco Business
The Bank made key successes in growing Sacco business in 2015 especially in the area of providing innovative payment solutions to their customers. The Saccos appoint the bank as their transactional Agent whereby customers deposit and withdraw cash through our banks branches. This has been very value adding to these clients but is also a revenue opportunity for the bank. In addition, they clear their cheques through our Bank further enhancing this beneficial business relationship. In 2015, The Bank managed to establish 7 new such partnerships with Saccos spread all over the Country. In addition, the Bank has developed value adding innovations like ATM Card less solution for Saccos where members can withdraw from our ATM network through their mobile platform. By leveraging on this strategy we managed to mobilize substantial additional deposits in form of Fixed Deposits and running balances from operational accounts. The above partnerships have also bolstered the bank’s image. We are bank that is able to serve wide array of customers and segments across the country through bank’s networks.
Information Technology, Systems and Processes
In order for the Bank to continuously offer excellent customer service and remain competitive, we continued to have more
investments in our ICT systems. The key result out of this approach has been systems availability and operational excellence across
all functions and branches. The key investments to our ICT Systems last year include the following:
MANAGING DIRECTOR & CEO’S STATEMENT (Continued)
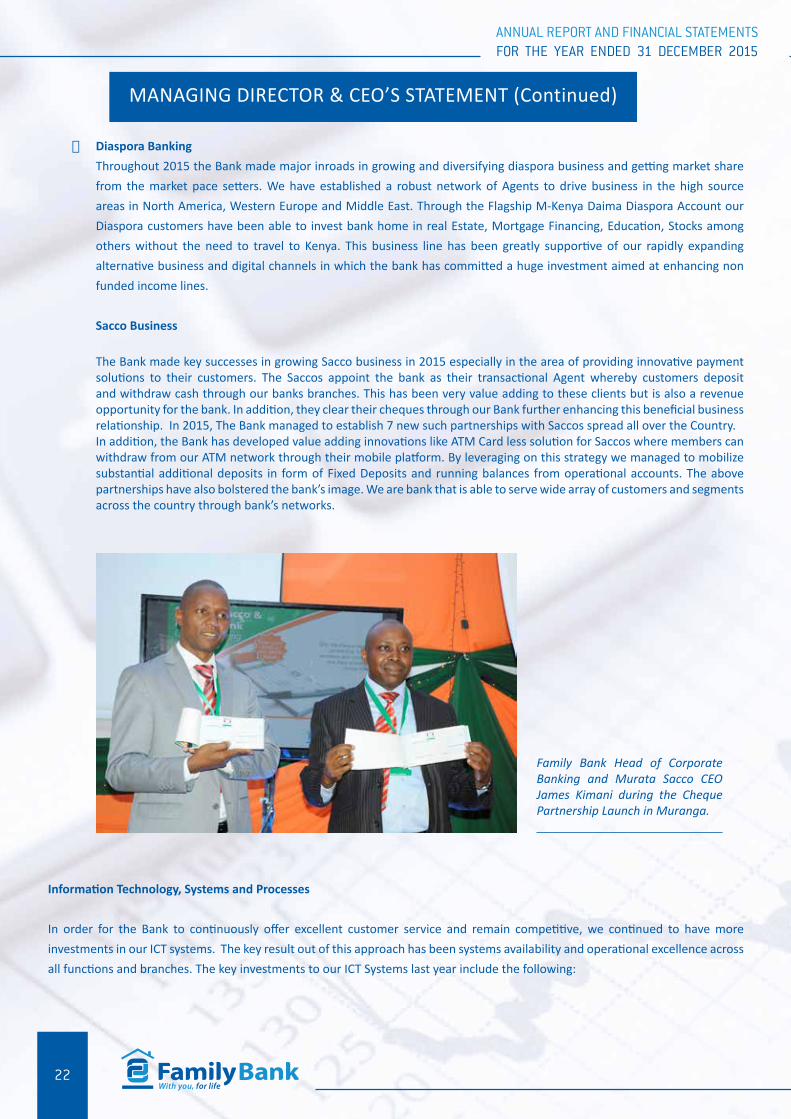
Family Bank Head of Corporate Banking and Murata Sacco CEO James Kimani during the Cheque Partnership Launch in Muranga.
ANNUAL REPORT AND FINANCIAL STATEMENTSFOR THE YEAR ENDED 31 DECEMBER 2015
ANNUAL REPORT AND FINANCIAL STATEMENTSFOR THE YEAR ENDED 31 DECEMBER 2015
23
· ICT infrastructure
We enhanced our Core Banking System, Flexcube and information Communications Technology Infrastructure including
operationalisation of redundancy systems in the branches.This enabled the Bank to provide all round services to our
customers both at the branch and at all virtual channels. We now have 24/7 support services available with fully automated
notification. This also enabled us ensure that all critical systems are replicated at DR Sites and improvement of the overall
customer experience thoughout the Bank.
· Business Support
The Bank continued to enhance its valuable business through various projects in 2015. The Data centre infrastructure
Management system enabled staff to get a 360 degrees visibility of Data Components .This included improving the
Capacity of the servers to adequately Support the needs of our fast expanding business. We also attained key network
milestones like the Data centre core and security upgrade. These two projects were crucial for information security and
control and aiding in developing decision models for the whole Bank.
· Operational excellence
We continued to provide adequate capacity building to our ICT and operations Staff to drive excellence in all processes.
This was supported by the roll out of the SLA monitoring system between branches and Head office to improve turnaround
times. This helped the bank to Support use of Alternative Channels to ensure full availability of systems including a 24
Hour Monitoring mechanism .We have improved performance and reliability of the ATM by migrating the ATM interface
from a Microsoft Windows environment to an AIX (IBM) environment. The AIX environment (which the core banking
application runs from) is more stable.
People Talent
As a Bank our greatest investment and assets remains our people whose engagement continues to be very high. The bank is able
to attract and retain outstanding talent to strengthen the company. Our core values of humility, integrity, team work and winning
together have offered great push with the embedding of a high performance culture through the Balanced Score Card.
We continue to develop our staff through local and overseas training to enhance their skills and leadership qualities. We also
encourage our staff to commit themselves to continuous learning in both professional and personal endeavors. Our Leadership and
Training Centre continued to equip our Staff complement with rich and diversified skills to meet the needs of our very enlightened
customers and Strategic Partnerships. We have a robust e-learning platform and training remains a key performance target for
each staff. As a Bank, a well-motivated and competent work force is key to improving performance and competitiveness. All our
Management team have undergone thorough and comprehensive leadership training programme to build beter teams into to the
future.
Our staff complement continues to be well diversified in terms of age, gender, skills, expertise and professional standing. We
continue to enhance the performance culture to ensure a sustainable return to Stakeholder’s year on year. In 2015, various staff
motivation programmes continued to be effected with opportunities for internal staff development and also getting high level
resources from the industry to optimally support our business.
MANAGING DIRECTOR & CEO’S STATEMENT (Continued)
ANNUAL REPORT AND FINANCIAL STATEMENTSFOR THE YEAR ENDED 31 DECEMBER 2015
ANNUAL REPORT AND FINANCIAL STATEMENTSFOR THE YEAR ENDED 31 DECEMBER 2015
24
Outlook for 2016
Performance indicators focus on a challenging Macro environment but in which well-run banks like family bank will continue
to excel. We are alive to all the opportunities and the challenges and these are specifically being addressed. The business has
grown over the years which is the reason more shareholders support is being sought today. With the Bank’s proven impressive
track record we will continuously strive to be among the best banks this country has. Changing and aligning to a customer-centric
company was among the first steps in our journey to unlock our full potential and prepare the ground for our future growth.
Growing our company requires a new, shared mindset –a customer focused, agile, can-do mentality.
The bank will continue with the customer-centric initiative to drive new performance and growth culture premised on the Bank’s
Vision which is: “to be the financial institution that leads in the positive transformation of people’s lives in Africa.” Our vision is
driven by the need to continuously support our customers with diversified products and service, which to date has seen the Bank
transform the lives of millions of people.
Top of the business agenda in 2016 will be consolidation of the business in the different market segments; enhanced product
offering through ABC channels expansions. We are in the forefront in terms of exploiting technology for service and product
offerings.
We shall continue to roll-out the various EMV compliant VISA cards which include: VISA Classic Debit Card and VISA Gold Classic
Debit Card. We also launched our VISA Classic Credit Card and VISA Gold Credit Card in March 2015 for all our customers.
As a team, we will strive to achieve the Bank’s targets and sustain the business momentum. We will maintain the capacity to grow
and compete in the chosen profitable markets the bank is operating in.
We have started 2016 strongly despite the challenges banking and other sectors are facing. We will strive to deliver the targets set
for this year and we are fully cognizant of the challenges
MANAGING DIRECTOR & CEO’S STATEMENT (Continued)
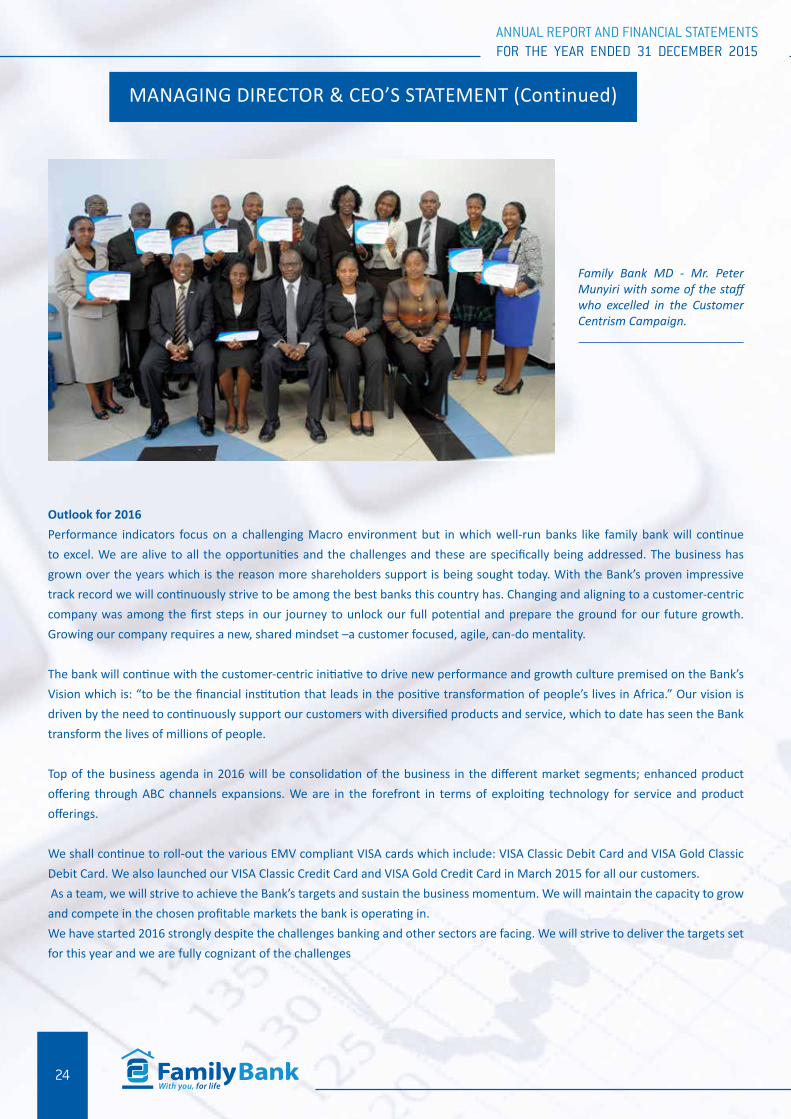
Family Bank MD - Mr. Peter Munyiri with some of the staff who excelled in the Customer Centrism Campaign.

ANNUAL REPORT AND FINANCIAL STATEMENTSFOR THE YEAR ENDED 31 DECEMBER 2015
ANNUAL REPORT AND FINANCIAL STATEMENTSFOR THE YEAR ENDED 31 DECEMBER 2015
25
Conclusion
The potential of our Company is massive. We have unwavering support from our shareholders, customers and the public. We
remain confident in our chosen strategic direction. Indeed, my assurance to you shareholders and customers is that the bank’s
future looks even brighter. The Bank is very well placed and actively growing as well as supporting the economy to grow.
I thank the management and staff for their hard work and professionalism. We have embraced and are living to the performance
based culture. I also register my appreciation to our Chairman and the Board for the continued support, oversight, and guidance.
They have given us invaluable support and oversight over the years.
I would like to thank our customers for their loyalty to Family Bank. I take this opportunity to invite and welcome new customers
to our bank. And finally I would like to thank our shareholders for the continued support. We have have been on a demanding and
exciting journey .More than ever before, we have as strong resolve to accelerate and unlock Family Bank’s potential and grow the
value of your investment.
We thank God for all these achievements.
Thank you and God Bless You
Peter Munyiri
Managing Director & Chief Executive Officer
MANAGING DIRECTOR & CEO’S STATEMENT (Continued)

ANNUAL REPORT AND FINANCIAL STATEMENTSFOR THE YEAR ENDED 31 DECEMBER 2015
ANNUAL REPORT AND FINANCIAL STATEMENTSFOR THE YEAR ENDED 31 DECEMBER 2015
26

ANNUAL REPORT AND FINANCIAL STATEMENTSFOR THE YEAR ENDED 31 DECEMBER 2015
ANNUAL REPORT AND FINANCIAL STATEMENTSFOR THE YEAR ENDED 31 DECEMBER 2015
27
Family Bank continues to leverage its Bancassurance business to meet is customer’s diversified needs. The Company was rebranded
to Family Bank Insurance Agency Limited (FBIA) from Dhamana Insurance Agency Limited which was licensed in May 2010 by the
Insurance Regulatory Agency. This rebranding consolidated the Brand Name “Family “as a one stop shop for financial Services.
With the insurance penetration in Kenya at less than 4%, there is unique opportunity to drive the business of the Company through
various activities.
Launch of Family Bank Insurance Agency Limited
The Year 2015 was a milestone in the rebranding and repositioning of the Subsidiary to greater heights. Our Business was renamed
Family Bank Insurance Agency Limited (FBIAL) with a new logo and corporate colours at a colourful event held on 15th December
2016 at Nairobi Serena attended by various industry executives. This continues to enhance our corporate image to scale new
heights and source for more business in new frontiers. The rebranded unit forms part of the bank’s strategy of serving its customers
better through becoming a one-stop shop for financial services.
Areas of Competitive advantage
Strong Relationship Team
Family Bank Insurance Agency has a very proactive sales team spread out in 92 Branches and growing. Throughout 2015, our
Relationship team grew the business significantly to attain leadership in areas of general and life Insurance segments. This was
supported by a team of 48 well trained General insurance officers and over 100 life Agents. The performance of these teams
continue to be monitored through a weekly dashboard on the business growth prospects for the month.
FAMILY BANK INSURANCE AGENCY LIMITED

ANNUAL REPORT AND FINANCIAL STATEMENTSFOR THE YEAR ENDED 31 DECEMBER 2015
ANNUAL REPORT AND FINANCIAL STATEMENTSFOR THE YEAR ENDED 31 DECEMBER 2015
28
Strategic Partnerships and Alliances
The Company continued to strengthen strategic partnerships with Insurance Companies and expand its business model. Our
Partnership as agents of 13 Insurance Companies with a countrywide footprint helped to further optimize the Banks Universal
Banking business model of being a one stop shop for financial services.
Board Support
The Company continued to leverage on the guidance and advice of its highly qualified and committed Board of Directors under the
Chairmanship of Professor Kabiru Kinyanjui to drive its business in 2015. We were able to reach new frontiers in business growth
supported by the robust sales team throughout the year. This was supported by the intensive training programme implemented in
key areas of underwriting, sales, negotiation, customer relationship management and business development.
Sustainable growth
Our business model continued to provide a one stop shop for various products and services. These range from Motor Insurance
for all classes, Marine insurance, Education Plan, Funeral Covers, Life Insurance, Fire and Burglary, Goods in transit, Individual
medical and home insurance. In 2015 the Subsidiary managed to realize a compounded annual Growth rated (CAGR) of over 40%.
Robust Operating Systems
We continued improving our operating systems throughout the year to attain enhanced turnaround times in customer service
areas of premium collection and reconciliation, claims management and financial reporting. Currently the agency is implementing
a new bancassurance operating system, a multi-million investment to enhance its insurance subsidiary interface with customers.
The technology platform – Avenir, is an integrated Bancassurance portal solution that will allow Family Bank Insurance Agency to
improve on service delivery through enhanced business responsiveness. The new portal which provides customer need analysis
capabilities based on their requirement and will simplify the policy servicing and claims settlements thereby improving the quality
of service for the customers.
The process of reengineering the entire Bancassurance process continues throughout 2016. Into the future, the System will
provide tremendous business agility, time-to-market advantage, and impeccable delivery track record and unmatched domain
expertise. The System will serve as a model for the Insurance industry as a whole in Africa.
I register my appreciation to our customers for their support to Family Bank Insurance Agency. I welcome you all to the new look
Agency.
Dipesh Shah
General Manager

ANNUAL REPORT AND FINANCIAL STATEMENTSFOR THE YEAR ENDED 31 DECEMBER 2015
ANNUAL REPORT AND FINANCIAL STATEMENTSFOR THE YEAR ENDED 31 DECEMBER 2015
29
CORPORATE GOVERNANCE STATEMENT
1. STATEMENT OF COMPLIANCE
The Board and management of the Bank continue to comply with the Corporate Governance guidelines and Code of Con-duct prescribed by Central Bank of Kenya (CBK) Prudential Guidelines for the banking industry. The Board recognizes the fundamental role of corporate governance in enhancing the culture and business performance and that high standards of corporate governance are a key contributor to the long term success of a company, creating trust and engagement between the company and its stakeholders.
The Group has adequate policies and procedures in place that are reviewed regularly and which include:
a) clearly defined responsibilities and authority of directors, the Managing Director and managementb) established corporate objectives and strategies;c) recognition of the interests of various stakeholders; d) alignment of corporate activities and behaviour in compliance with applicable laws and regulations; ande) protection of the interests of depositors and other creditors
The board in December 2015 updated its Board Charter so as to bring in it line with the key values of the Bank, generally ac-cepted Principles of Good Corporate Governance and in compliance with the sound corporate governance principles under the Prudential Guidelines published by the Central Bank of Kenya as well as the Companies Act 2015. The purpose of the Board Charter is to provide1. The demarcation of the roles and responsibilities, functions and powers of the Board and management.2. The relevant principles of the company’s limits and delegation of authority and matters reserved for the Board3. The policies and practices of the Board in respect of matters such as corporate governance, conflict of interest , board
meetings, composition of the Board, appointment, induction and evaluation
2. RELATIONS WITH SHAREHOLDERSThe Board recognises the importance of good communications with all shareholders. The Annual General Meeting (AGM) as well as the published annual report is used as an opportunity to communicate with all shareholders. The Company al-ways gives shareholders the 21 days’ notice of the AGM as provided for in the Kenyan Companies Act and shareholders are encouraged to submit questions and also appoint proxies to represent them where they are unable to attend. Ad hoc share-holder requests for information are handled on an on-going basis and also on the floor of the AGM. The Board uses elec-tronic means to communicate with shareholders and shareholders are encouraged to visit the website familybank.co.ke and click on investor relations for general information on the Company as well as annual reports. In upholding and protecting shareholders’ rights, the Board recognises that every shareholder has a right to participate and vote at the general share-holders meeting. The Board also invites shareholders to seek clarity on the Company’s performance in general meetings.
3. BOARD COMPOSITION The Group has a competent Board of Directors bringing together diverse backgrounds and expertise necessary to provide leadership to the bank. The Board comprises of seven non-executive Directors (four of whom are Independent Non-Execu-tive Directors), two executive directors and one alternate Director. Dr Kabiru Kinyanjui resigned from the board with effect from 31 March 2015 after serving the Bank for Fourteen years and the Board appointed Mr Francis Mungai with effect from11th June 2015 to fill in the casual vacancy. He serves this term until the next AGM.
4. BOARD INDEPENDENCE AND CONFLICT OF INTERESTThe Prudential Guideline No 2 prescribes the criteria for independence and minimum ratio of independent directors to the total Board of Directors as one- third. The Bank is in compliance with these requirements. The Board has set standards to ensure the Directors’ independence. The fundamental premise of the standards is that any Director is independent of management and free of any business or other relationship that could materially interfere with exercising their independent judgement. The Directors are required to disclose their areas of conflict. Directors are required to refrain from contributing to or voting on matters in which they have such conflict.

ANNUAL REPORT AND FINANCIAL STATEMENTSFOR THE YEAR ENDED 31 DECEMBER 2015
ANNUAL REPORT AND FINANCIAL STATEMENTSFOR THE YEAR ENDED 31 DECEMBER 2015
30
CORPORATE GOVERNANCE STATEMENT (Continued)
BOARD INDEPENDENCE AND CONFLICT OF INTEREST ( CONTINUED)
As a board we encourage independence by objectively challenging management; challenging each other’s assumptions, de-bating constructively and deciding dispassionately. Our decisions are aimed at supporting the ultimate good of the organisa-tion. As the Chairman, I have ensured that board decisions are taken on a sound and well-informed basis while encouraging critical discussion to ensure that dissenting views can be expressed and discussed within the decision-making process, all the while upholding the principle of collective responsibility for Board decisions.
The role of Chairman and the Managing Director are separate and distinct. The Board maintains a good working relationship with the Managing Director, Executive Directors and management without detracting from the Governance Principles of Accountability and Independence that must exist to ensure sustainable performance. In addition to the Managing Direc-tor, Executive Directors, members of senior management of the Company attend Board Meetings by invitation to ensure informed and efficient decision-making by the Board of Directors. Further, the Board invites third party professionals to attend Meetings and provide opinions and advice when necessary to enable the Board discharge its fiduciary mandate
5. BOARD LEADERSHIP AND RESPONSIBILITY OF THE BOARDAs a Board we recognise our responsibility to provide effective leadership based on an ethical foundation. This involves responsible leadership characterized by the ethical values of responsibility, accountability, fairness and transparency all of which are enshrined in our core values. The Board Charter sets out the responsibilities of the Board which include:
1. The provision of strategic guidance and effective oversight of management and maximization of the Group’s financial performance and shareholder value within the framework of appropriate risk assessment.
2. The provision of the overall direction, governance and promoting proper standards of conduct and sound banking practices which enhance internal controls and shareholder value.
3. Cognisant of our responsibility for defining appropriate governance practices and to ensure that such practices are followed and periodically reviewed for improvement, the Board has met at regular intervals to, amongst others things:
a) Agree on the Company’s strategic objectives, and its roadmap to achieving the agreed objectives b) Review and approve the Company’s annual budgetc) Review the Company’s performance against approved budget. d) Review the Company’s policies and procedures e) Consider and approve the annual and interim financial statementsf) Recommend dividends to the shareholders; g) Evaluate the performance of the Managing Director; and h) Approve other matters of fundamental significance

ANNUAL REPORT AND FINANCIAL STATEMENTSFOR THE YEAR ENDED 31 DECEMBER 2015
ANNUAL REPORT AND FINANCIAL STATEMENTSFOR THE YEAR ENDED 31 DECEMBER 2015
31
CORPORATE GOVERNANCE STATEMENT
6. BOARD ACTIVITIES 2015
6.1 Board attendance
The Board convened 10 board meetings during the year. All the meetings convened had sufficient quorum. The attendance of all directors was over 75% and therefore in compliance with the CBK prudential guidelines.
The attendance of the individual directors was as follows:
Directors Total Attendance
Wilfred D Kiboro (Chairman) 100%
TK Muya 100%
David Some 80%
David Kimani 100%
Ruth Waweru 100%
Francis Mungai 85%
Lerionka Tiampati 80%
Peter Munyiri 100%
Njung’e Kamau 100%
6.2 Board Training and Continuous Professional Development 2015
During the year, the board members attended training on Risk Management as part of Continuous Professional Develop-ment and in line with CBK Prudential Guideline on Corporate Governance. The training covered Anti- money Laundering laws and the Board’s role in ensuring compliance.
6.3 Board Evaluation
The annual Board evaluation was conducted in March 2016 in a process led by the Chairman to the Board and supported by the Company Secretary. The Board engaged an independent advisor Deloitte & Touché to analyse the results of the evalu-ation and table the findings before the Board.
The evaluation entailed an evaluation of the board, peer evaluation for each director, evaluation of the Chair to the Board and the Board Committees It covered overall Board interactions, conduct of board meetings and scope of control exercised by the directors. Following the exercise, the directors identified areas that required further consideration by the Board and these issues have been captured in the rolling agenda.

ANNUAL REPORT AND FINANCIAL STATEMENTSFOR THE YEAR ENDED 31 DECEMBER 2015
ANNUAL REPORT AND FINANCIAL STATEMENTSFOR THE YEAR ENDED 31 DECEMBER 2015
32
CORPORATE GOVERNANCE STATEMENT
7. COMMITTEES OF THE BOARD
The Board has six Committees with specific delegated authorities. These are the Board Audit Committee, the Board Risk Management Committee, the Board Credit Committee, the Board Nomination Committee, Board Strategy Committee and the Human Resources Committee. Three of the five committees are mandatory from a regulatory perspective while three have been established to provide dedicated oversight on specific key functions of the bank. Board Committee members are appointed by the Board which also reviews the composition of each Committee regularly.
7.1 Board Audit Committee
The Committee reviews the integrity of the financial statements of the Company and its subsidiaries and recommends the statements for approval to the Board, the effectiveness of the Company’s system of internal control and receives reports on the findings of the internal and external audits and tracks the actions on audit findings. The Committee also reviews the proposed work plans for the Country Internal Audit and Compliance functions at the beginning of each year.
The Committee held six meetings during the year under review. The members of this committee during the year under review were Mr David Kimani (Chairman), Dr Ruth Waweru and Mr Lerionka Tiampati. The Head of Internal Audit attended all Committee meetings.
7.2 Board Credit Committee
The Credit Committee plays a critical role in the formulation and review of lending policies and ensures that such policies are in compliance with regulatory requirements. It assesses the credit quality and risk profile of the Bank’s lending book by sector and by product and makes recommendations to the Board on remedial actions or on matters that may enhance the quality of the lending book.
The committee met once during the year under review. The members of the committee in the year under review were: Prof. David Some (Chairman) Mr Kabiru Kinyanjui, Dr. W.D Kiboro, Mr T.K Muya, Mr Peter Munyiri, Mr Njunge Kamau. The Director Credit attended all Committee meetings.
7.3 Board Risk Management Committee
The Committee oversees the group’s preparedness and mitigation for the major risks faced by the Group across the business including operational risk, country risk, credit risk, liquidity risk, market risk, regulatory risk, legal risk, reputational risk and compliance risk. The Committee is responsible for ensuring that there are written policies, procedures and processes for identifying and managing the risks.
The Committee met four times during the year and recorded a quorum during all its meetings. The members of the Com-mittee in the year under review were Mr.David Kimani (Chairman) and Dr Ruth Waweru. The Head of Risk and Compliance attended all Committee meetings.
7.4 Board Human Resource Committee
The Committee acts as the link between the board and management and is responsible for the review of the human resourc-es policies and practices, particularly in relation to the operations of the various business units. The Committee also assists the Managing Director in Human Resources Management and act as a medium of key management staff and new Board members’ recruitment and ensures that the organizational structure supports the business strategy and growth.
The Committee met twice during the year under review. The members of the Committee are Mr T.K Muya, Mr Brian Kiondo Dr. W. D Kiboro, Prof. David Some and Mr. Peter Munyiri. The Director Human Resources attended all the Committee meet-ings.

ANNUAL REPORT AND FINANCIAL STATEMENTSFOR THE YEAR ENDED 31 DECEMBER 2015
ANNUAL REPORT AND FINANCIAL STATEMENTSFOR THE YEAR ENDED 31 DECEMBER 2015
33
CORPORATE GOVERNANCE STATEMENT
7. COMMITTEES OF THE BOARD (CONTINUED)
7.5 Board Strategy Committee
The Committee analyses the strategy of the Group and provides oversight over the implementation of the strategy approved by the Board by reviewing progress on a regular basis. They review the budget and strategic plan of the Group prior to sub-mission to the Board. The Committee met five times during the year and achieved sufficient quorum in all its meetings. The members of the Committee are Dr Ruth Waweru, Dr. W.D Kiboro, Mr T. K Muya, Mr Lerionka Tiampati, Mr Peter Munyiri, Mr Njunge Kamau, Mr Brian Kiondo and Mr. Mark Keriri. The Head of strategy and other members of management attend the meetings of the Committee.
7.6 Board Nomination Committee
The Committees regularly reviews the structure, size and composition of the board and make recommendations on any adjustments deemed necessary. It identifies, nominates and recommends for the approval of the board, candidates to fill board vacancies as and when they arise. The Committee members are Dr Ruth Waweru,Dr. W.D Kiboro and Mr T.K Muya. This committee held one meeting in 2015.
8. BOARD PERFORMANCE
The Board had full access to corporate information and sufficient detail to enable a productive and open discussion. There is diversity in the Board which ensures that the level of debate is both detailed and of a high technical standard. Overall, the Board’s performance was efficient and effective, leading to the remarkable performance of the Group in all parameters during the year.
9. CAPITAL STRUCTURE
a) Share Capital
The authorized and issued share capital of Family Bank Group consists of only ordinary shares as disclosed on note 30 to the financial statements.
b) Top ten Shareholders as at 31 December 2015
No Shareholder No. of Shares
1 Kenya Tea Development Agency Holding ltd 192,418,298
2 Rachael Muya 167,143,948
3 Daykio Plantations Limited 153,808,121
4 Titus Kiondo Muya 66,965,268
5 Standard Chartered Kenya Nominees ltd a/c 9660b 46,417,000
6 PA securities 44,444,445
7 Kenya Orient Insurance Limited 35,600,936
8 Julius Muya Kiondo 33,448,788
9 Ann Muya 33,428,788
10 Mark Keriri 33,428,788
___________
Top 10 Shareholders 807,104,380
Others 438,082,816_________________
Total Issued Shares 1,245,187,196=============

ANNUAL REPORT AND FINANCIAL STATEMENTSFOR THE YEAR ENDED 31 DECEMBER 2015
ANNUAL REPORT AND FINANCIAL STATEMENTSFOR THE YEAR ENDED 31 DECEMBER 2015
34
CORPORATE GOVERNANCE STATEMENT
9. CAPITAL STRUCTURE
c) Distribution of Shareholders as at 31 December 2015
No. of No. of % Shareholders Shares
10,000,000 - Above 17 966,977,952 77.66%50,000 - 9,999,999 559 224,238,891 18.01%10,000 - 49,999 2,020 36,211,983 2.90%1 - 9,999 3,227 17,758,370 1.43%
______ _________ ______
Total 5,823 1,245,187,196 100% ===== ========== =====
d) Directors Holding Shares as at 31 December 2015
Name No. of shares %
Wilfred Kiboro 11,740,468 0.94%
Titus Muya 66,965,268 5.38%
Prof David Some 279,667 0.02%
Dr Ruth Waweru 180,000 0.01%
David Kimani 128,889 0.01%
Julius Muyah 33,448,788 2.69%
Francis Mungai 1,296,900 0.10%
Peter Munyiri 10,223,258 0.82%
Njung’e Kamau 10,000 0.001%
______________ _________
Total 124,273,238 9.97%
========== ======
________________________________ Chairman
29th March 2016

ANNUAL REPORT AND FINANCIAL STATEMENTSFOR THE YEAR ENDED 31 DECEMBER 2015
ANNUAL REPORT AND FINANCIAL STATEMENTSFOR THE YEAR ENDED 31 DECEMBER 2015
35
REPORT OF THE DIRECTORS
The directors have pleasure in presenting their annual report together with the audited financial statements of Family Bank Lim-ited (“the bank”) and its subsidiary (together, “the group”) for the year ended 31 December 2015, which show the state of affairs of the group and of the bank.
INCORPORATION
The bank and its subsidiary, Family Insurance Agency Limited are both incorporated in the Republic of Kenya under the Compa-nies Act and are domiciled in Kenya.
ACTIVITIES
The principal activities of the bank, which is licensed under the Banking Act, are the provision of banking, financial and related services. The principal activity of the subsidiary is to provide banc assurance services through insurance agency services.
GROUP RESULTS
The following is the summary of the results for the year ended 31 December 2015:
Group Bank Sh’000 Sh’000
Profit before taxation 2,957,128 2,883,486Taxation charge (974,182) (946,828) ________ ________
Profit for the year 1,982,946 1,936,658 ======= ========
DIVIDEND
The directors recommend a first and final dividend of Sh 0.50 (2014: Sh 0.50) per share for the year amounting to Sh 622,593,598 (2014: Sh 622,593,598) subject to shareholders’ approval at the Annual General Meeting.
DIRECTORS
The present members of the board of directors are shown on page 2. Kabiru Kinyanjui and Mark Keriri resigned as directors in April 2015 and December 2015 respectively and Francis Mungai was appointed a director on 11th June 2015.
AUDITORS
Deloitte & Touche, have expressed their willingness to continue in office in accordance with the provisions of section 159 (2) of the Companies Act (Cap 486) and subject to approval by the Central Bank of Kenya in accordance with section 24 of the Banking Act.
BY ORDER OF THE BOARDSecretaryNairobi
29th March 2016
ANNUAL REPORT AND FINANCIAL STATEMENTSFOR THE YEAR ENDED 31 DECEMBER 2015
ANNUAL REPORT AND FINANCIAL STATEMENTSFOR THE YEAR ENDED 31 DECEMBER 2015
36
STATEMENT OF DIRECTORS’ RESPONSIBILITIES
The Kenyan Companies Act requires the directors to prepare financial statements for each financial year which give a true and fair view of the state of affairs of the bank and its subsidiary as at the end of the financial year and of their operating results for that year. It also requires the directors to ensure that the bank and its subsidiary keeps proper accounting records which disclose with reasonable accuracy at any time the financial position of the bank and its subsidiary. They are also responsible for safeguarding the assets of the group.
The directors are responsible for the preparation of financial statements that give a true and fair view in accordance with Interna-tional Financial Reporting Standards and the requirements of the Kenyan Companies Act, and for such internal controls as directors determine are necessary to enable the preparation of financial statements that are free from material misstatement, whether due to fraud or error.
The directors accept responsibility for the annual financial statements, which have been prepared using appropriate accounting policies supported by reasonable and prudent judgements and estimates, in conformity with International Financial Reporting Standards and in the manner required by the Kenyan Companies Act. The directors are of the opinion that the financial state-ments give a true and fair view of the state of the financial affairs of the bank and its subsidiary and of their operating results. The directors further accept responsibility for the maintenance of accounting records which may be relied upon in the preparation of financial statements, as well as adequate systems of internal financial control.
Nothing has come to the attention of the directors to indicate that the bank and its subsidiary will not remain going concerns for at least the next twelve months from the date of this statement.
----------------------------------------- ------------------------------------- Chairman Managing Director
29th March 2016

ANNUAL REPORT AND FINANCIAL STATEMENTSFOR THE YEAR ENDED 31 DECEMBER 2015
ANNUAL REPORT AND FINANCIAL STATEMENTSFOR THE YEAR ENDED 31 DECEMBER 2015
37
INDEPENDENT AUDITORS’ REPORT TO THE MEMBERS OF FAMILY BANK LIMITED
Report on the Financial Statements
We have audited the accompanying financial statements of Family Bank Limited and its subsidiary, set out on pages 38 to 100, which comprise the consolidated and bank statements of financial position as at 31 December 2015, and the consolidated and bank statements of profit or loss and other comprehensive income, consolidated and bank statements of changes in equity and consolidated statement of cash flows for the year then ended, and a summary of significant accounting policies and other explan-atory notes.
Directors’ Responsibility for the Financial Statements
The directors are responsible for the preparation of financial statements that give a true and fair view in accordance with Interna-tional Financial Reporting Standards and the requirements of the Kenyan Companies Act, and for such internal controls as directors determine are necessary to enable the preparation of financial statements that are free from material misstatement, whether due to fraud or error.
Auditors’ Responsibility
Our responsibility is to express an opinion on these financial statements based on our audit. We conducted our audit in accordance with International Standards on Auditing. Those standards require that we comply with ethical requirements and plan and perform the audit to obtain reasonable assurance about whether the financial statements are free from material misstatement.
An audit involves performing procedures to obtain audit evidence about the amounts and disclosures in the financial statements. The procedures selected depend on our judgement, including the assessment of the risks of material misstatement of the financial statements, whether due to fraud or error. In making those risk assessments, we considered the internal controls relevant to the entity’s preparation of financial statements that give a true and fair view in order to design audit procedures that were appropri-ate in the circumstances, but not for the purpose of expressing an opinion on the entity’s internal controls. An audit also includes evaluating the appropriateness of accounting policies used and the reasonableness of accounting estimates made by the directors, as well as evaluating the overall presentation of the financial statements.
We believe that the audit evidence we have obtained is sufficient and appropriate to provide a basis for our audit opinion.
Opinion
In our opinion, the financial statements give a true and fair view of the state of financial affairs of the group and of the bank as at 31 December 2015 and of their profits and cash flows for the year then ended in accordance with International Financial Reporting Standards and the requirements of the Kenyan Companies Act and the Banking Act.
Report on Other Legal Requirements
As required by the Kenyan Companies Act we report to you, based on our audit, that:
i) we have obtained all the information and explanations which to the best of our knowledge and belief were necessary for the purposes of our audit;
ii) in our opinion proper books of account have been kept by the bank, so far as appears from our examination of those books; and
iii) the bank’s statement of financial position (balance sheet) and statement profit or loss and other of comprehensive income (profit and loss account) are in agreement with the books of account.
The engagement partner responsible for the audit resulting in this independent auditor’s report is CPA Anne Muraya P/No - 1697.
Certified Public Accountants (Kenya)
Nairobi, Kenya
29th March 2016

ANNUAL REPORT AND FINANCIAL STATEMENTSFOR THE YEAR ENDED 31 DECEMBER 2015
ANNUAL REPORT AND FINANCIAL STATEMENTSFOR THE YEAR ENDED 31 DECEMBER 2015
38
CONSOLIDATED AND BANK STATEMENTS OF PROFIT OR LOSS AND OTHER COMPREHENSIVE INCOMEFOR THE YEAR ENDED 31 DECEMBER 2015
Group Bank
Note 2015 2014 2015 2014
Sh’000 Sh’000 Sh’000 Sh’000
INTEREST INCOME 6 10,032,314 7,121,576 10,032,314 7,121,576
INTEREST EXPENSE 7 (3,632,385) (1,748,220) (3,639,883) (1,750,857)
_________ _________ _________ _________
NET INTEREST INCOME 6,399,929 5,373,356 6,392,431 5,370,719
Foreign exchange gain 298,484 111,444 298,484 111,444
Fee and commission income 8 2,472,113 2,359,721 2,472,113 2,359,721
Other income 206,432 167,950 43,521 83,619
_________ _________ _________ _________
OPERATING INCOME 9,376,958 8,012,471 9,206,549 7,925,503
Operating expenses 9 (6,207,955) (4,957,467) (6,111,188) (4,917,200)
Impairment charge on loans and advances 17 (211,875) (389,944) (211,875) (389,944)
_________ _________ _________ _________
PROFIT BEFORE TAXATION 2,957,128 2,665,060 2,883,486 2,618,359
TAXATION 11 (974,182) (855,275) (946,828) (837,757)
_________ _________ _________ _________
PROFIT FOR THE YEAR 1,982,946 1,809,785 1,936,658 1,780,602
OTHER COMPREHENSIVE INCOME 15(b)(6,778) - (6,778) -
_________ _________ _________ _________
TOTAL COMPREHENSIVE INCOME FOR THE YEAR 1,976,168 1,809,785 1,929,880 1,780,602
======== ======== ======== ========
EARNINGS PER SHARE Sh Sh Sh Sh
Basic and diluted 12 1.59 1.61 1.55 1.58
======== ======== ======== ========

ANNUAL REPORT AND FINANCIAL STATEMENTSFOR THE YEAR ENDED 31 DECEMBER 2015
ANNUAL REPORT AND FINANCIAL STATEMENTSFOR THE YEAR ENDED 31 DECEMBER 2015
39
CONSOLIDATED AND BANK STATEMENTS OF FINANCIAL POSITION AS AT 31 DECEMBER 2015
Group Bank
2015 2014 2015 2014
Note Sh’000 Sh’000 Sh’000 Sh’000
ASSETS
Cash balances with Central Bank of Kenya 13 6,167,092 5,532,611 6,167,092 5,532,611
Balances due from banking institutions 14(a) 4,892,358 7,378,051 4,892,358 7,378,051
Government securities held to maturity 15(a) 7,246,561 5,901,181 7,183,394 5,901,181
Government securities available for sale 15(b) 443,222 150,000 443,222 150,000
Loans and advances to customers 16 55,853,882 37,925,476 55,853,882 37,925,476
Corporate bonds 18(a) 936,410 554,830 936,410 554,830
Commercial paper 18(b) 631,916 700,000 631,916 700,000
Other assets 19 1,346,593 1,001,555 1,325,075 982,802
Investment in subsidiary 20 - - 1,000 1,000
Investment properties 21(a) 18,200 127,400 18,200 127,400
Non-Current Assets Held For Sale 21(b) 90,000 - 90,000 -
Property and equipment 22 3,175,595 2,083,099 3,169,489 2,080,202
Intangible assets 23 318,801 317,620 317,625 316,530
Prepaid operating lease rentals 24 157,969 162,580 157,969 162,580
Deferred tax 29 2,767 - 2,582 -
______________ _______________ ______________ ______________
TOTAL ASSETS 81,281,366 61,834,403 81,190,214 61,812,663
============= ============= ============= =============
LIABILITIES AND SHAREHOLDERS’ FUNDS
LIABILITIES
Balances due to banking institutions 14(b) 131,643 209,291 131,643 209,291
Customer deposits 25 62,710,859 47,136,480 62,730,867 47,186,425
Taxation payable 11(c) 30,441 222,608 36,951 221,971
Borrowings 26 5,587,720 2,900,335 5,587,720 2,900,335
Other liabilities 27 750,135 658,113 747,662 655,819
Unclaimed dividends 28(a) 28,589 12,587 28,589 12,587
Deferred tax liability 29 - 5,427 - 5,582
_____________ _____________ _____________ _____________
TOTAL LIABILITIES 69,239,387 51,144,841 69,263,432 51,192,010
_____________ _____________ _____________ _____________
SHAREHOLDERS’ FUNDS
Share capital 30 1,245,186 1,245,186 1,245,186 1,245,186
Share premium 30 5,062,519 5,063,676 5,062,519 5,063,676
Revaluation surplus 76,823 78,956 76,823 78,956
Fair Value reserve (6,778) - (6,778) -
Retained earnings 5,136,745 3,944,241 5,021,548 3,875,332
Statutory reserve 527,484 357,503 527,484 357,503
______________ ______________ ______________ ______________
TOTAL SHAREHOLDERS’ FUNDS 12,041,979 10,689,562 11,926,782 10,620,653
______________ ______________ _______________ _____________
TOTAL LIABILITIES AND
SHAREHOLDERS’ FUNDS 81,281,366 61,834,403 81,190,214 61,812,663
========= ========= ========= =========
The financial statements on pages 38 to 100 were approved and authorised for issue by the Board of Directors on 29th March 2016 and were signed on its behalf by:
______________________ _____________________Chairman Managing Director
______________________ _____________________Director Company Secretary

ANNUAL REPORT AND FINANCIAL STATEMENTSFOR THE YEAR ENDED 31 DECEMBER 2015
ANNUAL REPORT AND FINANCIAL STATEMENTSFOR THE YEAR ENDED 31 DECEMBER 2015
40
CONSOLIDATED STATEMENT OF CHANGES IN EQUITY FOR THE YEAR ENDED 31 DECEMBER 2015
Share ShareRevaluation
surplus
Fair Value Retained Statutory
capital premium Rerseves earnings reserve Total
Sh’000 Sh’000 Sh’000 Sh’000 Sh’000 Sh’000
At 1 January 2014 1,114,046 2,100,251 81,089 - 2,456,490 256,145 6,008,021
Total comprehensive income for the year - - - 1,809,785 - 1,809,785
New shares issued (Note 30) 11,140* 111,406 122,546
Rights issue proceeds 120,000 2,880,000 - - - 3,000,000
Rights issue costs (Note 30) (27,981) (27,981)
Dividend paid - 2013 - - - - (222,809) - (222,809)
Transfer to statutory reserve - - - - (101,358) 101,358 -
Transfer of excess depreciation
(3,047)
-
3,047 - -
Deferred tax on excess depre-ciation
- - 914 - (914) - -
_________ ________ ______ ________ ________ ________ __________
At 31 December 2014 1,245,186 5,063,676 78,956 - 3,944,241 357,503 10,689,562
======== ======== ====== ======= ======= ======= ========
At 1 January 2015 1,245,186 5,063,676 78,956 - 3,944,241 357,503 10,689,562
Total comprehensive income for the year
- -(6,778)
1,982,946 - 1,976,168
Rights issue costs - (1,157) - - - - (1,157)
Dividend paid - 2014 - - - - (622,594) - (622,594)
Transfer to statutory reserve - - - - (169,981) 169,981 -
Transfer of excess depreciation - - (3,047) - 3,047 - -
Deferred tax on excess depre-ciation - - 914 - (914) - -
________ ________ _______ ________ ________ _______ _________
At 31 December 2015 1,245,186 5,062,519 76,823 (6,778) 5,136,745 527,484 12,041,979
======= ======= ====== ======= ======== ====== ========
*The new issue of shares relates to new shares issued to the chairman.

ANNUAL REPORT AND FINANCIAL STATEMENTSFOR THE YEAR ENDED 31 DECEMBER 2015
ANNUAL REPORT AND FINANCIAL STATEMENTSFOR THE YEAR ENDED 31 DECEMBER 2015
41
BANK STATEMENT OF CHANGES IN EQUITY FOR THE YEAR ENDED 31 DECEMBER 2015
Share Share Revaluation surplus
Fair Value Retained Statutory
capital premium Reserve earnings reserve Total
Sh’000 Sh’000 Sh’000 Sh’000 Sh’000 Sh’000 Sh’000
At 1 January 2014 1,114,046 2,100,251 81,089 - 2,416,765 256,145 5,968,296
Total comprehensive income for the year - - - 1,780,602 - 1,780,602
New shares issued 11,140 111,406 - - - - 122,546
Rights issue proceeds (Note 30) 120,000 2,880,000 - - - - 3,000,000
Rights issue costs (Note 30) - (27,981) - - - - (27,981)
Dividend paid 2013 - - - - (222,810) - (222,810)
Transfer to statutory reserve - - - - (101,358) 101,358 -
Transfer of excess depreciation - - (3,047) - 3,047 - -
Deferred tax on excess depreci-ation - - 914
-(914) - -
________ ________ _______ ______- ________ _______ _________
At 31 December 2014 1,245,186 5,063,676 78,956 - 3,875,332 357,503 10,620,653
======= ======= ====== ====== ======= ====== ========
At 1 January 2015 1,245,186 5,063,676 78,956 - 3,875,332 357,503 10,620,653
Total comprehensive income for the year - - (6,778) 1,936,658 - 1,929,880
Rights issue costs (Note 30) - (1,157) - - - (1,157)
Dividend paid – 2014 - - - (622,594) - (622,594)
Transfer to statutory reserve - - - (169,981) 169,981 -
Transfer of excess depreciation - - (3,047) 3,047 - -
Deferred tax on excess depreci-ation - - 914 (914) - -
________ _________ _______ ________ ________ _______ _________
At 31 December 2015 1,245,186 5,062,519 76,823 (6,778) 5,021,548 527,484 11,926,782
======= ======== ====== ======= ======== ====== ========
*The new issue of shares relates to new shares issued to the chairman

ANNUAL REPORT AND FINANCIAL STATEMENTSFOR THE YEAR ENDED 31 DECEMBER 2015
ANNUAL REPORT AND FINANCIAL STATEMENTSFOR THE YEAR ENDED 31 DECEMBER 2015
42
CONSOLIDATED STATEMENT OF CASH FLOWSFOR THE YEAR ENDED 31 DECEMBER 2015
2015 2014 Note Sh’000 Sh’000CASH FLOWS FROM OPERATING ACTIVITIES
Net cash (used in)/generated from operations 31(a) (1,470,852) 2,379,422 Taxation paid 11(c) (1,174,543) (848,298) ________ ________
Net cash (used in)/generated from operating activities (2,645,395) 1,531,124 ________ ________
CASH FLOWS FROM INVESTING ACTIVITIES
Purchase of property and equipment 22 (1,718,335) (770,439) Proceeds on sale of property and equipment 22,632 954 Purchase of intangible assets 23 (97,466) (86,030) ________ ________
Net cash used in investing activities (1,793,169) (855,515) ________ ________
CASH FLOWS FROM FINANCING ACTIVITIES
Borrowings received 26 3,018,800 2,331,920 Repayment of borrowings 26 (511,827) (853,114) Dividends paid 28 (606,592) (216,736) Proceeds from issue of shares 30 - 3,122,546 Rights issue costs 30 (1,157) (27,981) ________ ________
Net cash generated from financing activities 1,899,224 4,356,635 ________ ________
NET (DECREASE)/INCREASE IN CASH AND CASH EQUIVALENTS IN THE YEAR (2,539,340) 5,032,244
CASH AND CASH EQUIVALENTS AT BEGINNING OF THE YEAR 10,206,979 5,174,735 _________ ________
CASH AND CASH EQUIVALENTS AT END OF THE YEAR 31(b) 7,667,639 10,206,979 ======== ========

ANNUAL REPORT AND FINANCIAL STATEMENTSFOR THE YEAR ENDED 31 DECEMBER 2015
ANNUAL REPORT AND FINANCIAL STATEMENTSFOR THE YEAR ENDED 31 DECEMBER 2015
43
CONSOLIDATED STATEMENT OF CASH FLOWSFOR THE YEAR ENDED 31 DECEMBER 2015
2015 2014 Note Sh’000 Sh’000CASH FLOWS FROM OPERATING ACTIVITIES
Net cash (used in)/generated from operations 31(a) (1,470,852) 2,379,422 Taxation paid 11(c) (1,174,543) (848,298) ________ ________
Net cash (used in)/generated from operating activities (2,645,395) 1,531,124 ________ ________
CASH FLOWS FROM INVESTING ACTIVITIES
Purchase of property and equipment 22 (1,718,335) (770,439) Proceeds on sale of property and equipment 22,632 954 Purchase of intangible assets 23 (97,466) (86,030) ________ ________
Net cash used in investing activities (1,793,169) (855,515) ________ ________
CASH FLOWS FROM FINANCING ACTIVITIES
Borrowings received 26 3,018,800 2,331,920 Repayment of borrowings 26 (511,827) (853,114) Dividends paid 28 (606,592) (216,736) Proceeds from issue of shares 30 - 3,122,546 Rights issue costs 30 (1,157) (27,981) ________ ________
Net cash generated from financing activities 1,899,224 4,356,635 ________ ________
NET (DECREASE)/INCREASE IN CASH AND CASH EQUIVALENTS IN THE YEAR (2,539,340) 5,032,244
CASH AND CASH EQUIVALENTS AT BEGINNING OF THE YEAR 10,206,979 5,174,735 _________ ________
CASH AND CASH EQUIVALENTS AT END OF THE YEAR 31(b) 7,667,639 10,206,979 ======== ========
NOTES TO THE FINANCIAL STATEMENTSFOR THE YEAR ENDED 31 DECEMBER 2015
1 REPORTING ENTITY
Family Bank Limited (The “bank”) together with its subsidiary (together “the group”) provides commercial banking services. Family bank Limited and its subsidiary Family Insurance Agency Limited are both incorporated in Kenya under the Companies Act and is domiciled in Kenya.
The address of its registered office is as follows:Family Bank Limited6th Floor, Family Bank Towers, Muindi Mbingu StreetPO Box 74145, 00200 Nairobi
2 ACCOUNTING POLICIES
Statement of compliance
The financial statements have been prepared in accordance with International Financial Reporting Standards (IFRS).
For the Kenyan Companies Act reporting purposes, in these financial statements the balance sheet is represented by/is equivalent to the statement of financial position and the profit and loss account is presented in the statement of comprehensive income.
Adoption of new and revised International Financial Reporting Standards (IFRS)
i) New standards and amendments to published standards effective for the year ended 31 December 2015
The following new and revised IFRSs were effective in the current year and had no material impact on the amounts reported in these financial statements.
IAS 19 Defined Benefit Plans: Employee Contributions
The amendments to IAS 19 clarify the accounting treatment for contributions from employees or third parties to a defined benefit plan. According to the amendments, discretionary contributions made by employees or third parties reduce service cost upon payment of these contributions to the plan. When the formal terms of the plan specify contributions from employees or third parties, the accounting depends on whether the contributions are linked to service, as follows:
• If the contributions are not linked to services (e.g. contributions are required to reduce a deficit arising from losses on plan assets or from actuarial losses), they affect the remeasurement of the net defined benefit liability (asset).
• If contributions are linked to services, they reduce service costs. If the amount of contribution is dependent on the number of years of service, the entity should reduce service cost by attributing it to the contributions to periods of service using the attribution method required by IAS 19 paragraph 70 (for the gross benefits). If the amount of contribution is independent of the number of years of service, the entity is permitted to either reduce service cost in the period in which the related ser-vice is rendered, or reduce service cost by attributing the contributions to the employees’ periods of
service in accordance with IAS 19 paragraph 70 The amendment requires retrospective application
• The directors anticipate that the application of the standard will not have an impact on the Group’s financial statements since the company doesn’t have a defined benefit plan.

ANNUAL REPORT AND FINANCIAL STATEMENTSFOR THE YEAR ENDED 31 DECEMBER 2015
ANNUAL REPORT AND FINANCIAL STATEMENTSFOR THE YEAR ENDED 31 DECEMBER 2015
44
NOTES TO THE FINANCIAL STATEMENTS (Continued)
2 ACCOUNTING POLICIES (Continued)
Adoption of new and revised International Financial Reporting Standards (IFRSs) (Continued)
(i) New standards and amendments to published standards effective for the year ended 31 December 2015 (Con-tinued)
Annual Improvements 2010-2012 Cycle
The Annual Improvements to IFRSs 2010-2012 Cycle include a number of amendments to various IFRSs, which are summarised below:
The amendment to IFRS 2 is to clarify the definition of vesting condition and market condition to ensure the consistent classification of conditions attached to a share-based payment. It also adds definitions for ‘perfor-mance condition’ and ‘service condition’ which were previously included as part of the definition of ‘vesting
condition’. The amendment requires prospective application.
The amendment to IFRS 3 clarifies that contingent consideration should be measured at fair value at each reporting date, irrespective of whether or not the contingent consideration falls within the scope of IFRS 9 or IAS 39. Changes in fair value (other than measurement period adjustments as defined in IFRS 3) should be recognised in profit and loss. The amendment to IFRS 3 requires prospective application.
The amendment to IFRS 8(i) requires an entity to disclose the judgements made by management in applying the aggregation criteria to operating segments, including a brief description of the operating segments ag-gregated and the economic indicators assessed in determining whether the operating segments share similar economic characteristics; and (ii) clarifies that a reconciliation of the total of the reportable segments’ assets to the entity’s assets should only be provided if information about the amount of segment assets are regularly provided to the chief operating decision-maker.
The amendment to IFRS 13 clarifies that the issuance of IFRS 13 and consequential amendments to IAS 39 and IFRS 9 did not remove the ability to measure short- term receivables and payables with no stated interest rate at their invoice amounts without discounting, if the effect of discounting is immaterial. This amendment does not include any effective date because this is just to clarify the intended meaning in the basis for conclusions.
The amendment to IAS 16 and IAS 38 remove perceived inconsistencies in the accounting for accumulated depreciation/amortisation when an item of property, plant and equipment or an intangible asset is revalued. The amended standards clarify that the gross carrying amount is adjusted in a manner consistent with the revaluation of the carrying amount of the asset and that accumulated depreciation/ amortisation is the dif-ference between the gross carrying amount and the carrying amount after taking into account accumulated impairment losses.
The amendment to IAS 24 clarifies that a management entity providing key management personnel services to the reporting entity or to the parent of the reporting entity is a related party of the reporting entity. Conse-quently, the reporting entity should disclose as related party transactions the amounts incurred for the service paid or payable to the management entity for the provision of key management personnel services. However, disclosure of the components of compensation to key management personnel that is paid by the management entity to the management entity’s employees or directors is not required.

ANNUAL REPORT AND FINANCIAL STATEMENTSFOR THE YEAR ENDED 31 DECEMBER 2015
ANNUAL REPORT AND FINANCIAL STATEMENTSFOR THE YEAR ENDED 31 DECEMBER 2015
45
NOTES TO THE FINANCIAL STATEMENTS (Continued)
2 ACCOUNTING POLICIES (Continued)
(i) New standards and amendments to published standards effective for the year ended 31 December 2015 (Contin-ued)
Annual Improvements 2011-2013 Cycle
The Annual Improvements to IFRSs 2011-2013 Cycle include a number of amendments to various IFRSs, which are summarised below:
The amendments to IFRS 3 clarify that the standard does not apply to the accounting for the formation of all types of joint arrangement in the financial statements of the joint arrangement itself.
The amendments to IFRS 13 clarify that the scope of the portfolio exception for measuring the fair value of a group of financial assets and financial liabilities on a net basis includes all contracts that are within the scope of, and accounted for in accordance with, IAS 39 or IFRS 9, even if those contracts do not meet the definitions of financial assets or financial liabilities within IAS 32
The amendments to IAS 40 clarify that IAS 40 and IFRS 3 are not mutually exclusive and application of both stan-dards may be required. Consequently, an entity acquiring investment property must determine whether:
(a) the property meets the definition of investment property in terms of IAS 40; and (b) the transaction meets the definition of a business combination under IFRS 3
The directors of the group do not anticipate that the application of these amendments will have a significant impact on the group’s financial statements.
i) Relevant new and amended standards and interpretations in issue but not yet effective in the year ended 31 December 2015
New and Amendments to standards Effective for annual periods beginning on or after
IFRS 9 1 January 2018
IFRS 15 1 January 2018
IFRS 16 1 January 2019
Amendments to IFRS 11 1 January 2016
Amendments to IAS 16 and IAS 38 1 January 2016
IFRS 9 Financial Instruments
IFRS 9, issued in November 2009, introduced new requirements for the classification and measurement of finan-cial assets. IFRS 9 was amended in October 2010 to include requirements for the classification and measurement of financial liabilities and for de-recognitionKey requirements of IFRS 9:
· All recognised financial assets that are within the scope of IAS 39 Financial Instruments: Recognition and Measurement are required to be subsequently measured at amortised cost or fair value. Specifically, debt investments that are held within a business model whose objective is to collect the contractual cash flows, and that have contractual cash flows that are solely payments of principal and interest on the principal outstanding are generally measured at amortised cost at the end of subsequent accounting periods. All other debt investments and equity investments are measured at their fair value at the end of subsequent accounting periods. In addition, under IFRS 9, entities may make an irrevocable election to present subse-quent changes in the fair value of an equity investment (that is not held for trading) in other comprehen-sive income, with only dividend income generally recognised in profit or loss.

ANNUAL REPORT AND FINANCIAL STATEMENTSFOR THE YEAR ENDED 31 DECEMBER 2015
ANNUAL REPORT AND FINANCIAL STATEMENTSFOR THE YEAR ENDED 31 DECEMBER 2015
46
NOTES TO THE FINANCIAL STATEMENTS (Continued)
2 ACCOUNTING POLICIES (Continued)
Adoption of new and revised International Financial Reporting Standards (IFRSs) (Continued)
(ii) Relevant new and amended standards and interpretations in issue but not yet effective in the year ended 31 Decem-ber 2015 (continued)
IFRS 9 Financial Instruments (Continued)
· With regard to the measurement of financial liabilities designated as at fair value through profit or loss, IFRS 9 requires that the amount of change in the fair value of the financial liability that is attributable to changes in the credit risk of that liability is presented in other comprehensive income, unless the recog-nition of the effects of changes in the liability’s credit risk in other comprehensive income would create or enlarge an accounting mismatch in profit or loss. Changes in fair value attributable to a financial liabil-ity’s credit risk are not subsequently reclassified to profit or loss. Under IAS 39, the entire amount of the change in the fair value of the financial liability designated as fair value through profit or loss is presented in profit or loss.
· The directors of the Group anticipate that the application of IFRS 9 in the future will have a significant impact on amounts reported in respect of the Group’s financial assets and financial liabilities. However, it is not practicable to provide a reasonable estimate of the effect of IFRS 9 until a detailed review has been completed.
IFRS 15 Revenue from Contracts with Customers
In May 2015, IFRS 15 was issued which establishes a single comprehensive model for entities to use in accounting for revenue arising from contracts with customers. IFRS 15 will supersede the current revenue recognition guid-ance including IAS 18 Revenue, IAS 11 Construction Contracts and the related Interpretations when it becomes effective.
The core principle of IFRS 15 is that an entity should recognise revenue to depict the transfer of promised goods or services to customers in an amount that reflects the consideration to which the entity expects to be entitled in exchange for those goods or services. Specifically, the Standard introduces a 5-step approach to revenue rec-ognition:
Step 1: Identify the contract(s) with a customerStep 2: Identify the performance obligations in the contractStep 3: Determine the transaction priceStep 4: Allocate the transaction price to the performance obligations in the contractStep 5: Recognise revenue when (or as) the entity satisfies a performance obligation
Under IFRS 15, an entity recognises revenue when (or as) a performance obligation is satisfied, i.e. when ‘control’ of the goods or services underlying the particular performance obligation is transferred to the customer. Far more prescriptive guidance has been added in IFRS 15 to deal with specific scenarios. Furthermore, extensive disclosures are required by IFRS 15. The directors of the company do not expect the adoption of IFRS 15 to have a significant impact on the Group’s financial statements.
IFRS 16 Leases
IFRS 16 specifies how an entity will recognise, measure, present and disclose leases. The standard provides a single lease accounting model, requiring lesses to recognise assets and liabilities for all leases unless the lease term is 12 months or less or the underlying asset has a low value. Lessors continue to classify leases as operating or finance lease, with IFRS 16, approach to lessor accounting unchanged from its predecessor, IAS 17.
IFRS 16 applies to annual reporting periods beginning on or after 1 January 2019.The directors anticipate that the adoption of IFRS 16 will not have a significant impact on the group’s financial statements.

ANNUAL REPORT AND FINANCIAL STATEMENTSFOR THE YEAR ENDED 31 DECEMBER 2015
ANNUAL REPORT AND FINANCIAL STATEMENTSFOR THE YEAR ENDED 31 DECEMBER 2015
47
NOTES TO THE FINANCIAL STATEMENTS (Continued)
2 ACCOUNTING POLICIES (Continued)
Adoption of new and revised International Financial Reporting Standards (IFRSs) (Continued)
(ii) Relevant new and amended standards and interpretations in issue but not yet effective in the year ended 31 De-cember 2015 (continued)
IFRS 9 Financial Instruments (Continued)
Amendments to IAS 16 and IAS 38 Clarification of Acceptable Methods of Depreciation and Amortisation
The amendments to IAS 16 prohibit entities from using a revenue-based depreciation method for items of property, plant and equipment. The amendments to IAS 38 introduce a rebuttable presumption that revenue is not an ap-propriate basis for amortisation of an intangible asset. This presumption can only be rebutted in the following two limited circumstances:
a) when the intangible asset is expressed as a measure of revenue; orb) when it can be demonstrated that revenue and consumption of the economic benefits of the intangible asset are highly correlated.
The amendments apply prospectively for annual periods beginning on or after 1 January 2016. Currently, the Group uses the straight-line method for depreciation and amortisation for its property and equipment, and intangible assets respectively.
The directors of the Group do not anticipate that the application of the standard will have a significant impact on the Group’s financial statements.
iii) Impact of new and amended standards and interpretations on the financial statements for the year ended 31 De-cember 2015 and future annual periods (Continued)
Annual Improvements 2012-2014 Cycle
The amendments to IFRS 5 adds specific guidance in IFRS 5 for cases in which an entity reclassifies an asset from held for sale to held for distribution or vice versa and cases in which held-for-distribution accounting is discontin-ued. The amendments to IFRS 7 adds additional guidance to clarify whether a servicing contract is continuing involve-
ment in a transferred asset for the purpose of determining the disclosures required. Clarifies the applicability of the amendments to IFRS 7 on offsetting disclosures to condensed interim financial statements.
The amendments to IAS 19 clarifies that the high quality corporate bonds used in estimating the discount rate for post-employment benefits should be denominated in the same currency as the benefits to be paid (thus, the depth of the market for high quality corporate bonds should be assessed at currency level).
The amendment to IAS 34 clarifies the meaning of ‘elsewhere in the interim report’ and requires a cross-reference
The directors of the Group do not anticipate that the application of these amendments will have a significant im-pact on the Group’s financial statements.

ANNUAL REPORT AND FINANCIAL STATEMENTSFOR THE YEAR ENDED 31 DECEMBER 2015
ANNUAL REPORT AND FINANCIAL STATEMENTSFOR THE YEAR ENDED 31 DECEMBER 2015
48
NOTES TO THE FINANCIAL STATEMENTS (Continued)
2 ACCOUNTING POLICIES (Continued)
Adoption of new and revised International Financial Reporting Standards (IFRSs) (Continued)
iii) Impact of new and amended standards and interpretations on the financial statements for the year ended 31 De-cember 2015 and future annual periods (Continued)
IFRS 11 Accounting for Acquisitions of Interests in Joint Operations
The amendments to IFRS 11 provide guidance on how to account for the acquisition of an interest in a joint operation in which the activities constitute a business as defined in IFRS 3 Business Combinations Specifically, the amendments state that the relevant principles on accounting for business combinations in IFRS 3 and other standards (e.g. IAS 12 Income Taxes regarding recognition of deferred taxes at the time of acquisition and IAS 36 Impairment of Assets regarding impairment testing of a cash-generating unit to which goodwill on acquisi-tion of a joint operation has been allocated) should be applied. The same requirements should be applied to the formation of a joint operation if and only if an existing business is contributed to the joint operation by one of the parties that participate in the joint operation. A joint operator is also required to disclose the relevant information required by IFRS 3 and other standards for business combinations.
Entities should apply the amendments prospectively to acquisitions of interests in joint operations (in which the activities of the joint operations constitute businesses as defined in IFRS 3) occurring from the beginning of annual periods beginning on or after 1 January 2016
The directors of the Company do not anticipate that the application of the standard will have a significant impact on the group’s financial statements
iv) Early adoption of standards
The group did not early-adopt any new or amended standards in 2015
The principal accounting policies applied in the preparation of the financial statements are set out below. These policies have been applied consistently.
Basis of preparation
The financial statements have been prepared on the historical cost basis of accounting as modified to include the valuation of property and certain financial assets.
Basis of consolidation
The consolidated financial statements incorporate the financial statements of the bank and its subsidiary for the year ended 31 December, 2015. The bank’s subsidiary is shown in note 20.
Subsidiaries are those entities in which the group has power to exercise control over their operations. The group controls an entity when the group is exposed to, or has rights to, variable returns from its involvement with the entity and has the ability to affect those returns through its power over the entity. Subsidiaries are included in the consolidated financial statements from the date the group gains effective control. The acquisition method of accounting is used when subsidiaries are acquired by the group. The cost of an acquisition in a business combination is measured at fair value, which is calculated as the sum of the ac-quisition-date fair values of the consideration transferred by the group, liabilities incurred by the group to the former owners of the acquiree and the equity interests issued by the group in exchange for control of the acquiree. Acquisition-related costs are recognised in profit or loss as incurred. Entities controlled by the group are consolidated until the date that control ceases.

ANNUAL REPORT AND FINANCIAL STATEMENTSFOR THE YEAR ENDED 31 DECEMBER 2015
ANNUAL REPORT AND FINANCIAL STATEMENTSFOR THE YEAR ENDED 31 DECEMBER 2015
49
NOTES TO THE FINANCIAL STATEMENTS (Continued)
2 ACCOUNTING POLICIES (Continued)
Basis of consolidation (Continued)
The accounting policies of subsidiaries have been changed when necessary to align them with the policies adopted by the group.
Intra-group balances and any unrealised income and expenses arising from intra-group transactions are eliminated in prepar-ing the consolidated financial statements.
Interest income and expense
Interest income and expense for all interest bearing financial instruments, except for those classified as held for trading or designated at fair value through profit or loss are recognised in the profit or loss using the effective interest method.
The effective interest method is a method of calculating the amortised cost of a financial asset or a financial liability and of allocating the interest income or interest expense over the relevant year. The effective interest rate is the rate that exactly discounts the estimated future cash payments and receipts through the expected life of the financial asset or liability or when appropriate, a shorter period to the net carrying amount of the financial asset or liability.
The calculation of the effective interest rate includes all fees and commissions paid or received, transaction costs, and dis-counts or premiums that are an integral part of the effective interest rate. Transaction costs are incremental costs that are directly attributable to the acquisition, issue or disposal of a financial asset or liability.
Once a financial asset or group of similar financial assets has been written down as a result of an impairment loss, interest income is recognised using the rate of interest that was used to discount the future cash flows for the purpose of measuring the impairment loss.
Fees and commission income
In the normal course of business, the group earns fees and commission income from a diverse range of services to its custom-ers. Fees and commission income and expenses that are integral to the effective interest rate on a financial asset or liability are included in the measurement of the effective interest rate.
Fees and commission income, including account servicing fees, investment management fees, placement fees and syndication fees, are recognised as the related services are performed. When a loan commitment is not expected to result in the draw-down of a loan, loan commitment fees are recognised on a straight-line basis over the commitment period.
Fees and commission expense relates mainly to transaction and service fees, which are expensed as the services are received.
Property and equipment
Property and equipment are stated at cost or as professionally revalued from time to time less accumulated depreciation and any accumulated impairment losses.
Any surplus arising on the revaluation is recognised in other comprehensive income and accumulated in the revaluation sur-plus. Decreases that offset previous increases of the same asset are recognised in other comprehensive income and charged against the revaluation surplus; all other decreases are charged to profit or loss.

ANNUAL REPORT AND FINANCIAL STATEMENTSFOR THE YEAR ENDED 31 DECEMBER 2015
ANNUAL REPORT AND FINANCIAL STATEMENTSFOR THE YEAR ENDED 31 DECEMBER 2015
50
NOTES TO THE FINANCIAL STATEMENTS (Continued)
2 ACCOUNTING POLICIES (Continued)
Property and equipment (Continued)
The group’s policy is to professionally revalue property at least once every five years. The last valuation was done on 31 De-
cember 2011. The valuation considered the highest and best use of the property. The basis of valuation is as follows:
Freehold land and buildings – open market value
Depreciation
Depreciation is calculated on a straight-line basis at annual rates estimated to write off the cost of each asset or the revalued amounts, to its residual values over its estimated useful life as follows:
Buildings 2.5%Fixtures, fittings and equipment 12.5%ATM Machines 16.7%Motor vehicles 20%Computers 20%
Freehold land is not depreciated as it is deemed to have an indefinite life.
The depreciation charge to profit and loss is based on the carrying amounts of the property and equipment. The excess of this charge over that based on the historical cost of the property and equipment is released each year from the revaluation surplus to retained earnings.
Leasehold land
Payments to acquire interests in leasehold land are treated as prepaid operating rentals. They are stated at historical cost and are amortised over the term of the related lease. When a lease includes land and buildings elements, the group assesses the classification of each element as either a finance lease or an operating lease. In determining classification of the land element, an important consideration is that land normally has an indefinite economic life. Therefore the finance lease or operating lease classification of the land is considered a critical area of judgment. See note 3 to these financial statements.
Intangible assets - computer software costs
Generally, costs associated with developing computer software programmes are recognised as an expense incurred. Howev-er, costs that are clearly associated with an identifiable and unique product which will be controlled by the group and has a probable benefit exceeding the cost beyond one year, are recognised as an intangible asset.
Expenditure which enhances and extends computer software programmes beyond their original specifications and lives is recognised as a capital improvement and added to the original costs of the software.
Computer software development costs recognised as assets are stated at cost less amortisation. Amortisation is calculated on a straight line basis over the estimated useful lives not exceeding a period of 3 years.
Impairment of non-financial assets
At the end of each reporting period, the group reviews the carrying amounts of its assets to determine whether there is any indication that those assets have suffered an impairment loss. If any such indication exists, the recoverable amount of the asset is estimated and an impairment loss is recognized in profit or loss whenever the carrying amount of the asset exceeds its recoverable amount. Previously recognised impairment losses may be reversed to the extent of the assets carrying amount.
ANNUAL REPORT AND FINANCIAL STATEMENTSFOR THE YEAR ENDED 31 DECEMBER 2015
ANNUAL REPORT AND FINANCIAL STATEMENTSFOR THE YEAR ENDED 31 DECEMBER 2015
51
NOTES TO THE FINANCIAL STATEMENTS (Continued)
2 ACCOUNTING POLICIES (Continued)
Investment properties
Investment properties comprise land and buildings and parts of buildings held to earn rentals and/or for capital appreciation. They are carried at fair value, determined annually by external independent valuers. Fair value is based on active market prices as adjusted, if necessary, for any difference in the nature, condition or location of the specific asset.
Investment properties are not subject to depreciation. Gains and losses arising from changes in the fair value of investment property are included in profit or loss in the year in which they arise.
On disposal of an investment property, the difference between the net disposal proceeds and the carrying amount is charged or credited to the profit or loss for the year.
Non-current assets held for sale
The group classifies a non-current asset as held for sale if, and only if, its carrying amount will be recovered principally through a sale transaction rather than through continuing use. Non current assets held for sale are measured at the lower of their carrying amounts and fair values less estimated selling costs at end of reporting period date.
Impairment loss arising from any subsequent write-down of the carrying amount of an asset identified for sale to fair value less costs to make the sale is charged to profit or loss in the year in which the loss is identified.
Foreign currencies
i) Functional and presentation currency
The financial statements of the group are measured using the currency of the primary economic environment in which the group operates (‘the functional currency’). The financial statements are presented in Kenya Shillings, which is the group’s functional and presentational currency. Except as indicated, financial information presented in Kenya Shillings has been rounded to the nearest thousand.
ii) Transactions and balances
Foreign currency transactions that are transactions denominated, or that require settlement, in a foreign currency are translated into the functional currency using the exchange rates prevailing at the dates of the transactions. At the report-ing date, monetary items denominated in foreign currencies are retranslated at the rates prevailing at that date.
Non-monetary items carried at fair value that are denominated in foreign currencies are retranslated at the rates prevail-ing at the date when fair value was determined. Non-monetary items that are measured in terms of historical cost in a foreign currency are not retranslated.
Foreign exchange gains and losses resulting from the settlement of such transactions and from the translation at year end exchange rates of monetary assets and liabilities denominated in foreign currencies are recognised through profit or loss.
Taxation
Income tax expense represents the sum of the tax currently payable and deferred tax.
ANNUAL REPORT AND FINANCIAL STATEMENTSFOR THE YEAR ENDED 31 DECEMBER 2015
ANNUAL REPORT AND FINANCIAL STATEMENTSFOR THE YEAR ENDED 31 DECEMBER 2015
52
NOTES TO THE FINANCIAL STATEMENTS (Continued)
2 ACCOUNTING POLICIES (Continued)
Taxation
Current tax
The tax currently payable is based on taxable profit for the year. Taxable profit differs from profit as reported in the state-ment of comprehensive income because of items of income or expense that are taxable or deductible in other years and items that are never taxable or deductible. The company’s liability for current tax is calculated using tax rates that have been enacted or substantively enacted by the end of the reporting period.
Deferred tax
Deferred tax is recognised on temporary differences between the carrying amounts of assets and liabilities in the financial statements and the corresponding tax bases used in the computation of taxable profit. Deferred tax liabilities are gener-ally recognised for all taxable temporary differences.
Deferred tax assets are generally recognised for all deductible temporary differences to the extent that it is probable that taxable profits will be available against which those deductible temporary differences are utilised. Such deferred tax assets and liabilities are not recognised if the temporary difference arises from good will or from the initial recognition (other than in a business combination) of other assets and liabilities in a transaction that affects neither the taxable profit nor the accounting profit. The carrying amount of deferred tax assets is reviewed at the end of each reporting period and reduced to the extent that it is no longer probable that sufficient taxable profits will be available to allow all or part of the asset to be recovered.
Deferred tax liabilities and assets are measured at the tax rates that are expected to apply in the period in which the lia-bility is settled or the asset realised, based on tax rates that have been enacted by the end of the reporting period. The measurement of deferred tax liabilities and assets reflects the tax consequences that would follow from the manner in which the company expects, at the end of the reporting period, to recover or settle the carrying amount of its assets and liabilities.
Current and deferred tax for the year
Current and deferred tax are recognised in profit or loss, except when they relate to items that are recognised in other comprehensive income or directly in equity, in which case, the current and deferred tax are also recognised in other comprehensive income.
Financial instruments
A financial asset or liability is recognised when the group becomes party to the contractual provisions of the instrument.
Financial assets
a) Classification and measurement
The group classifies its financial assets into the following IAS 39 categories: Financial assets at fair value through profit or loss; loans and receivables; held- to- maturity investments; and available-for-sale financial assets. Manage-ment determines the appropriate classification of its financial instruments at initial recognition, depending on the purpose and intention for which the financial instrument was acquired and their characteristics.

ANNUAL REPORT AND FINANCIAL STATEMENTSFOR THE YEAR ENDED 31 DECEMBER 2015
ANNUAL REPORT AND FINANCIAL STATEMENTSFOR THE YEAR ENDED 31 DECEMBER 2015
53
NOTES TO THE FINANCIAL STATEMENTS (Continued)
2 ACCOUNTING POLICIES (Continued)
Financial instruments (Continued)
Financial assets (Continued)
a) Classification and measurement (Continued)
i) Due from banks and loans and advances to customers
Due from banks and loans, advances and receivables include non–derivative financial assets with fixed or determinable payments that are not quoted in an active market. Loans and advances are recognised when cash is advanced to borrow-
ers.
After initial recognition, amounts ‘Due from banks’ and ‘Loans to customers’ are subsequently measured at amortised cost
using the effective interest rates, less allowance for impairment Amortised cost is calculated by taking into account any discount or premium on acquisition and fees and costs that are an integral part of the effective interest rate. The amortisation is included in ‘Interest and similar income’ in profit or loss. The losses arising from impairment are recognised in profit or loss.
iii) Held-to-maturity financial assets
Held-to-maturity financial assets are non-derivative financial assets with fixed or determinable payments and fixed matur-ities that the group has the positive intention and ability to hold to maturity.
Held to maturity financial assets are initially recognised at fair value including direct and incremental transaction costs and measured subsequently at amortised cost using the effective interest method less any impairment, with revenue recognised on an effective yield basis. Amortised cost is calculated by taking into account any discount or premium on acquisition and fees that are an integral part of the effective interest rate and recognised in the profit or loss.
Where a sale occurs other than an insignificant amount of held-to-maturity assets, the entire category would be tainted and classified as available for sale. Furthermore, the group would be prohibited from classifying any financial asset as held to maturity during the following two years.
iv) Available-for-sale financial assets
Available for sale investments are those that are intended to be held for an indefinite period of time, which may be sold in response to needs for liquidity or changes in interest rates or equity prices or that are not classified as loans and receiv-ables, held-to-maturity investments or financial assets at fair value through profit or loss.
Available-for-sale investments are initially recognised at fair value, which is the cash consideration including any transac-tion costs, and measured subsequently at fair value. Gains and losses arising from changes in fair value are recognised in other comprehensive income and accumulated in the investments revaluation reserve with the exception of impairment losses, interest calculated using the effective interest method, and foreign exchange gains and losses on monetary assets which are recognised in profit or loss.
Where the investment is disposed of or is determined to be impaired, the cumulative gain or loss previously accumulated in the investments revaluation reserve is reclassified to profit or loss.
Dividends on available for sale equity instruments are recognised in profit and loss when the group’s right to receive the dividends is established.
ANNUAL REPORT AND FINANCIAL STATEMENTSFOR THE YEAR ENDED 31 DECEMBER 2015
ANNUAL REPORT AND FINANCIAL STATEMENTSFOR THE YEAR ENDED 31 DECEMBER 2015
54
NOTES TO THE FINANCIAL STATEMENTS (Continued)
2 ACCOUNTING POLICIES (Continued)
Financial instruments (Continued)
Financial assets (Continued)
b) Derecognition of financial assets
A financial asset (or, where applicable a part of a financial asset or part of a group of similar financial assets) is derecognised when:
· the rights to receive cash flows from the asset have expired.· the group has transferred its rights to receive cash flows from the asset or has assumed an obligation to pay the
received cash flows in full without material delay to a third party under a ‘pass–through’ arrangement; and either:· the group has transferred substantially all the risks and rewards of the asset, or· the group has neither transferred nor retained substantially all the risks and rewards of the asset, but has transferred
control of the asset.
When the group has transferred its rights to receive cash flows from an asset or has entered into a pass–through arrange-ment, and has neither transferred nor retained substantially all the risks and rewards of the asset nor transferred control of the asset, the asset is recognised to the extent of the group’s continuing involvement in the asset. In that case, the group also recognises an associated liability.
The transferred asset and the associated liability are measured on a basis that reflects the rights and obligations that the group has retained.
Continuing involvement that takes the form of a guarantee over the transferred asset is measured at the lower of the orig-inal carrying amount of the asset and the maximum amount of consideration that the group could be required to repay.
c) Impairment and uncollectability of financial assets
The group assesses at each reporting date whether there is objective evidence that a financial asset or group of financial assets is impaired. A financial asset or group of financial assets is impaired and impairment losses are incurred only if there is objective evidence of impairment as a result of one or more events that occurred after initial recognition of the asset (a ‘loss’ event) and that loss event (or events) has an impact on the estimated future cash flows of the financial asset or group of financial assets that can be reliably estimated. The criteria that the group uses to determine that there is objective evidence of an impairment loss include:
· Delinquency in contractual payments of principal and interest;· Cash flow difficulties experienced by the borrower (for example, equity ratio, net income percentage of sales);· Breach of loan covenants or conditions;· Initiation of bankruptcy proceedings;· Deterioration of the borrower’s competitive position;· Deterioration in the value of collateral; and· Downgrading below investment grade level.
ANNUAL REPORT AND FINANCIAL STATEMENTSFOR THE YEAR ENDED 31 DECEMBER 2015
ANNUAL REPORT AND FINANCIAL STATEMENTSFOR THE YEAR ENDED 31 DECEMBER 2015
55
NOTES TO THE FINANCIAL STATEMENTS (Continued)
2 ACCOUNTING POLICIES (Continued)
Financial instruments (Continued)
Financial assets (Continued)
b) Impairment and uncollectability of financial assets (Continued)
If it is probable that the group will not be able to collect all amounts due (principal and interest) according to the contrac-tual terms of loans, receivables, or held-to-maturity investments carried at amortised cost, an impairment or bad debt loss has occurred. The amount of the loss is the difference between the asset’s carrying amount and the present value of expected future cash flows discounted at the financial instrument’s original effective interest rate (recoverable amount). The carrying amount of the asset is reduced to its estimated recoverable amount through use of the provision for bad and doubtful debts account. The amount of the loss incurred is included in profit or loss for the year.
i) Assets carried at amortised cost
The group assesses whether objective evidence of impairment exist individually for assets that are individually significant and individually or collectively for assets that are not individually significant. If the group determines that no objective evidence of impairment exists for an individually assessed financial asset, whether significant or not, it includes the asset in a group of financial assets with similar credit risk characteristics and collectively assesses them for impairment. Assets that are individually assessed for impairment and for which an impairment loss is or continues to be recognised are not included in a collective assessment of impairment.If there is objective evidence that an impairment loss on financial assets carried at amortised cost has been incurred, the amount of the loss is measured as the difference between the asset’s carrying amount and the present value of the estimated future cash flows (excluding future credit losses that have not been incurred) discounted at the financial instru-ments effective interest rate. The carrying amount of the asset is reduced through the use of an allowance account and the amount of the loss is recognised in profit or loss.
For the purposes of a collective evaluation of impairment, financial assets are grouped on the basis of similar credit risk characteristics that is, on the basis of the group’s grading process that considers asset type, industry, geographical loca-tion, collateral types, past due status and other relevant factors. Those characteristics are relevant to the estimation of future cash flows for groups of such assets by being indicative of the debtors’ ability to pay all amounts due according to the contractual terms of the assets being evaluated.
Future cash flows in a group of financial assets that are collectively evaluated for impairment are estimated on the basis of the contractual cash flows of the assets in the group and historical loss experience for assets with credit risk characteristics similar to those in the group. Historical loss experience is adjusted on the basis of current observable data to reflect the effects of current conditions that did not affect the period on which the historical loss experience is based and to remove the effects of conditions in the historical period that do not exist currently.
When a loan is uncollectible it is written off against the related provisions for loan impairment. Such loans are written off after all the necessary recovery procedures have been completed and the amount of loan has been determined. Subse-quent recoveries of amounts previously written off are recognised as gains in the profit and loss.
ii) Renegotiated loans
Where possible, the group seeks to restructure loans rather than to take possession of collateral. This may involve extend-ing the payment arrangements and the agreement of new loan conditions. Once the terms have been renegotiated any impairment is measured using the original effective interest rate as calculated before the modification of terms and the loan is no longer considered past due. Management continually reviews renegotiated loans to ensure that all criteria are met and that future payments are likely to occur. The loans continue to be subject to an individual or collective impairment assessment, calculated using the loan’s original effective interest rate.
ANNUAL REPORT AND FINANCIAL STATEMENTSFOR THE YEAR ENDED 31 DECEMBER 2015
ANNUAL REPORT AND FINANCIAL STATEMENTSFOR THE YEAR ENDED 31 DECEMBER 2015
56
NOTES TO THE FINANCIAL STATEMENTS (Continued)
2 ACCOUNTING POLICIES (Continued)
Financial instruments (Continued)
Financial liabilities and equity instruments issued by the group
a) Classification and measurement
Debt and equity instruments are classified as either financial liabilities or as equity in accordance with the substance of the contractual arrangement.
Equity instruments
An equity instrument is any contract that evidences a residual interest in the assets of an entity after deducting all of its liabilities. Equity instruments issued by the group are recorded at the proceeds received, net of direct issue costs.
Financial liabilities
Financial liabilities are classified as either financial liabilities at fair value through profit or loss or other financial liabili-ties.
i) Financial liabilities at fair value through profit or loss
Financial liabilities are classified as at fair value through profit or loss when the financial liability is either held for trading or it is designated as at fair value through profit or loss.
Financial liabilities at fair value through profit or loss are stated at fair value, with any gains or losses arising on remeasurement recognised in profit or loss. The net gain or loss recognised in profit or loss incorporates any inter-est paid on the financial liability.
ii) Other financial liabilities
Other financial liabilities, including borrowings, are initially measured at fair value, net of transaction costs.
Other financial liabilities are subsequently measured at amortised cost using the effective interest method, with interest expense recognised on an effective yield basis. The effective interest method is a method of calculating the amortised cost of a financial liability and of allocating interest expense over the relevant period. The effective inter-est rate is the rate that exactly discounts estimated future cash payments through the expected life of the financial liability, or (where appropriate) a shorter period, to the net carrying amount on initial recognition.
iii) Financial guarantee contracts
Financial guarantee contracts are contracts that require the issuer to make specified payments to reimburse the holder for a loss it incurs because a specified debtor fails to make payments when due, in accordance with the terms of a debt instrument. Such financial guarantees are given to banks, financial institutions and other bodies on behalf of customers to secure loans, overdrafts and other banking facilities.
Financial guarantees are initially recognised in the financial statements at fair value on the date the guarantee was given. The fair value of a financial guarantee at the time of signature is zero because all guarantees are agreed on arm’s length terms and the value of the premium agreed corresponds to the value of the guarantee obligation. No receivable for the future premiums is recognised. Subsequent to initial recognition, the group’s liabilities under such guarantees are measured at the higher of the initial amount, less amortisation of fees recognised in accor-dance with IAS 18, and the best estimate of the amount required to settle the guarantee. These estimates are determined based on experience of similar transactions and history of past losses, supplemented by the judgement of management. The fee income earned is recognised on a straight line basis over the life of the guarantee.

ANNUAL REPORT AND FINANCIAL STATEMENTSFOR THE YEAR ENDED 31 DECEMBER 2015
ANNUAL REPORT AND FINANCIAL STATEMENTSFOR THE YEAR ENDED 31 DECEMBER 2015
57
NOTES TO THE FINANCIAL STATEMENTS (Continued)
2 ACCOUNTING POLICIES (Continued)
Financial instruments (Continued)
Financial liabilities (Continued)
b) Derecognition of financial liabilities
A financial liability is derecognised when the obligation under the liability is discharged or cancelled or expires. Where an existing financial liability is replaced by another from the same lender on substantially different terms, or the terms of an existing liability are substantially modified, such an exchange or modification is treated as a derecognition of the original liability and the recognition of a new liability. The difference between the carrying value of the original financial liability and the consideration paid is recognised in profit or loss.The group derecognises financial liabilities when, and only when, the group’s obligations are discharged, cancelled or they expire.
Offsetting
Financial assets and liabilities are offset and stated at net amount in the statement of financial position when there is a legally enforceable right to set off, and there is an intention to settle on a net basis or realise the asset and settle the liability simul-taneously.
Provisions
A provision is recognised if, as a result of a past event, the group has a present legal or constructive obligation that can be estimated reliably, and it is probable that an outflow of economic benefits will be required to settle the obligation. Provisions are determined by discounting the expected future cash flows at a pre-tax rate that reflects current market assessments of the time value of money and, where appropriate, the risks specific to the liability.
Statutory reserve
IAS 39 requires the group to recognise an impairment loss when there is objective evidence that loans and advances are impaired. However, Central Bank of Kenya prudential guidelines require the bank to set aside amounts for impairment loss-es on loans and advances in addition to those losses that have been recognised under IAS 39. Any such amounts set aside represent appropriations of retained earnings and not expenses in determining profit or loss. These amounts are dealt with in the statutory reserve.
Leasing
Leases are classified as finance leases whenever the terms of the lease transfer substantially all the risks and rewards of own-ership to the lessee. All other leases are classified as operating leases.
The group as lessor
Rental income from operating leases is recognised on a straight-line basis over the term of the relevant lease.
The group as lessee
Rentals payable under operating leases are charged to income on a straight-line basis over the term of the relevant lease.
Cash and cash equivalents
Cash and cash equivalents include cash in hand, unrestricted balances held with the Central Bank of Kenya and highly liquid financial assets with original maturities of less than three months, which are subject to insignificant risk of changes in their fair value, and are used by the group in the management of its short-term commitments. Cash and cash equivalents are carried at amortised cost in the statement of financial position.

ANNUAL REPORT AND FINANCIAL STATEMENTSFOR THE YEAR ENDED 31 DECEMBER 2015
ANNUAL REPORT AND FINANCIAL STATEMENTSFOR THE YEAR ENDED 31 DECEMBER 2015
58
NOTES TO THE FINANCIAL STATEMENTS (Continued)
2 ACCOUNTING POLICIES (Continued)
Contingent liabilities
Letters of credit, acceptances, guarantees and performance bonds are generally written by the group to support perfor-mance by a customer to third parties. The group will only be required to meet these obligations in the event of the custom-er’s default. These obligations are accounted for as off balance sheet transactions and disclosed as contingent liabilities.
Fiduciary activities
Assets and income arising thereon together with related undertakings to return such assets to customers are excluded from these financial statements where the group acts in a fiduciary capacity such as nominee, trustee or agent.
Employee benefit costs
The group operates a defined contribution retirement benefit scheme for all its employees. The scheme is administered by an independent investment management company and is funded by contributions from both the group and employees.
The group also contributes to the statutory National Social Security Fund (NSSF). This is a defined contribution scheme regis-tered under the National Social Security Fund Act. The obligations under the scheme are limited to specific contributions legislated from time to time
The group’s contributions in respect of retirement benefit costs are charged to the profit and loss in the period to which they relate.
Employee entitlement to leave not taken is charged to profit or loss as it accrues.
Sale and repurchase agreements
Securities sold to the Central Bank of Kenya subject to repurchase agreements (‘repos’) are retained in the financial state-ments under government securities and the counterparty liability is included in advances from Central bank of Kenya. The difference between the sale and repurchase price is treated as interest and accrued over the life of the agreements using the effective interest method.
Fair value hierarchy
The bank specifies a hierarchy of valuation techniques based on whether the inputs to those valuation techniques are ob-servable or unobservable. Observable inputs reflect market data obtained from independent sources; unobservable inputs reflect the bank’s market assumptions. These two types of inputs have created the following fair value hierarchy:
· Level 1 – Quoted prices in active markets for identical assets or liabilities. This level includes equity securities and debt instruments listed on the Nairobi Securities Exchange.
· Level 2 – Inputs other than quoted prices included within Level 1 that are observable for the asset or liability, either directly as prices or indirectly as derived from prices.
· Level 3 – inputs for the assets or liabilities that are not based on observable market data (unobservable inputs). This level includes equity investments and debt instruments with significant unobservable components.

ANNUAL REPORT AND FINANCIAL STATEMENTSFOR THE YEAR ENDED 31 DECEMBER 2015
ANNUAL REPORT AND FINANCIAL STATEMENTSFOR THE YEAR ENDED 31 DECEMBER 2015
59
NOTES TO THE FINANCIAL STATEMENTS (Continued)
2 ACCOUNTING POLICIES (Continued)
Fair value hierarchy
This hierarchy requires the use of observable market data when available. The bank considers relevant and observable market prices in its valuations where possible.
Operating segments
Operating segments are reported in a manner consistent with the internal reporting provided to the Chief Operating Decision Maker (Managing Director and CEO). Management then allocates resources to and assesses the performance of the operat-ing segments of the Group.
Segment result is segment revenue less segment expenses.
Segment revenue is the revenue that is directly attributable to a segment plus the relevant portion of the group’s revenue that can be allocated to the segment on a reasonable basis.
Segment expenses are expenses resulting from the operating activities of a segment plus the relevant portion of an expense that can be allocated to the segment on a reasonable basis.
Segment assets and liabilities comprise those operating assets and liabilities that are directly attributable to the segment or can be allocated to the segment on a reasonable basis.
Capital expenditure represents the total cost incurred during the year to acquire segment assets (property, plant and equip-ment) that are expected to be used during more than one year.
Comparatives
Where necessary, comparative figures have been adjusted to conform with changes in presentation in the current year.
3 CRITICAL JUDGEMENTS AND KEY SOURCES OF ESTIMATION UNCERTAINTY
In the application of the group’s accounting policies, which are described in note 2, management is required to make judge-ments, estimates and assumptions about the carrying amounts of assets and liabilities that are not readily apparent from other sources. The estimates and associated assumptions are based on historical experience and other factors that are con-sidered to be relevant including expectations of future events that are believed to be reasonable under the circumstances. Actual results may differ from these estimates.
The estimates and underlying assumptions are reviewed on an on-going basis. Revisions to accounting estimates are rec-ognised in the year in which the estimate is revised if the revision affects only that period, or in the period of the revision and future periods if the revision affects both current and future periods.
(i) Critical judgements in applying the group’s accounting policies
The following are the critical judgements, apart from those involving estimations (see (ii) overleaf), that management have made in the process of applying the group’s accounting policies and that have the most significant effect on the amounts recognised in the financial statements.

ANNUAL REPORT AND FINANCIAL STATEMENTSFOR THE YEAR ENDED 31 DECEMBER 2015
ANNUAL REPORT AND FINANCIAL STATEMENTSFOR THE YEAR ENDED 31 DECEMBER 2015
60
NOTES TO THE FINANCIAL STATEMENTS (Continued)
3 CRITICAL JUDGEMENTS AND KEY SOURCES OF ESTIMATION UNCERTAINTY (Continued)
(i) Critical judgements in applying the group’s accounting policies (continued)
Impairment losses on loans and receivables
The group reviews its loan portfolios to assess impairment regularly. In determining whether an impairment loss should be recorded in the profit and loss, the group makes judgements as to whether there is any observable data indicating that there is a measurable decrease in the estimated future cash flows from a portfolio of loans, before a decrease can be identified with an individual loan in that portfolio.
This evidence may include observable data indicating that there has been an adverse change in the payment status of borrowers in a group, or national or local economic conditions that correlate with defaults on assets in the group. Management uses estimates based on historical loss experience for assets with credit risk characteristics and objec-tive evidence of impairment similar to those in the portfolio when scheduling its future cash flows. The methodology and assumptions used for estimating both the amount and timing of future cash flows are reviewed regularly to reduce any differences between loss estimates and actual loss experience.
Impairment of available-for-sale investments
The group reviews its debt securities classified as available–for–sale investments at each reporting date to assess whether they are impaired. This requires similar judgment as applied to the individual assessment of loans and ad-vances.
The group also records impairment charges on available–for–sale equity investments when there has been a signifi-cant or prolonged decline in the fair value below their cost. The determination of what is ‘significant’ or ‘prolonged’ requires judgment. In making this judgment, the group evaluates, among other factors, historical share price move-ments and duration and extent to which the fair value of an investment is less than its cost.
Held -to-maturity investments
The group follows the guidance of IAS 39 on classifying non-derivative financial assets with fixed or determinable payments and fixed maturity as held-to-maturity. This classification requires significant judgement. In making this judgement, the group evaluates its intention and ability to hold such investments to maturity. If the group fails to keep these investments to maturity other than for the specific circumstances – for example, selling an insignificant amount close to maturity – it will be required to reclassify the entire class as available-for-sale. The investments would therefore be measured at fair value not amortised cost.
Classification of leases of land and buildings as finance or operating leases
At the inception of each lease of land or building, the group considers the substance rather than the form of the lease contract. Examples of situations that individually or in combination would normally lead to a lease being classified as a finance lease are:
· The lease transfers ownership of the asset to the lessee by the end of the lease term; · The lessee has the option to purchase the asset at a price that is expected to be sufficiently lower than the
fair value at the date the option becomes exercisable for it to be reasonably certain, at the inception of the lease, that the option will be exercised;
· The lease term is for the major part of the economic life of the asset even if title is not transferred;

ANNUAL REPORT AND FINANCIAL STATEMENTSFOR THE YEAR ENDED 31 DECEMBER 2015
ANNUAL REPORT AND FINANCIAL STATEMENTSFOR THE YEAR ENDED 31 DECEMBER 2015
61
NOTES TO THE FINANCIAL STATEMENTS (Continued)
3 CRITICAL JUDGEMENTS AND KEY SOURCES OF ESTIMATION UNCERTAINTY (Continued)
(i) Critical judgements in applying the group’s accounting policies (continued)
Classification of leases of land and buildings as finance or operating leases (Continued)
· At the inception of the lease the present value of the minimum lease payments amounts to at least substan-tially all of the fair value of the leased asset; and
· The leased assets are of such a specialised nature that only the lessee can use them without major modifica-tions.
The group also considers indicators of situations that individually or in combination could also lead to a lease being classified as a finance lease. Examples of such indicators include:
· If the lessee can cancel the lease, the lessor’s losses associated with the cancellation are borne by the les-see;
· gains or losses from the fluctuation in the fair value of the residual accrue to the lessee (for example, in the form of a rent rebate equalling most of the sales proceeds at the end of the lease); and the lessee has the ability to continue the lease for a secondary period at a rent that is substantially lower than market rent.
(i) Key sources of estimation uncertainty
The following are the key assumptions concerning the future, and other key sources of estimation uncertainty at the reporting date, that have a significant risk of causing a material adjustment to the carrying amounts of assets and liabilities within the next financial period.
Property, equipment and intangible assets
Critical estimates are made by management in determining depreciation rates for property, equipment and intangible assets.
4 RISK MANAGEMENT OBJECTIVES AND POLICIES
The group defines risk as the possibility of losses or profits foregone, which may be caused by internal or external factors. The group aims to achieve an appropriate balance between risk and return and minimise the potential adverse effects of the group’s financial performance.
A. FINANCIAL RISK MANAGEMENT OBJECTIVES AND POLICIES
The most important type of risks to which the group is exposed to are financial risks which include:
a) Credit riskb) Liquidity riskc) Market risks
Risk management framework
The board of directors has overall responsibility for the establishment and oversight of the group’s risk management frame-work. The board has established a risk management committee comprising of two non-executive directors to assist in the discharge of this responsibility. The board has also established the group Asset and Liability (ALCO), Credit Committee and Risk and Compliance Committees, which are responsible for developing and monitoring risk management policies in their specified areas. With the exception of the ALCO which is a Management Committee, these committees comprise of both non-executive and executive members and report regularly to the board of directors on their activities.

ANNUAL REPORT AND FINANCIAL STATEMENTSFOR THE YEAR ENDED 31 DECEMBER 2015
ANNUAL REPORT AND FINANCIAL STATEMENTSFOR THE YEAR ENDED 31 DECEMBER 2015
62
NOTES TO THE FINANCIAL STATEMENTS (Continued)
4 FINANCIAL RISK MANAGEMENT OBJECTIVES AND POLICIES (Continued)
The board provides written principles for overall risk management as well as written policies covering specific risk areas. The group’s risk management policies are established to identify and analyse the risks faced by the group, to set appropriate risk limits and controls, and to monitor risks and adherence to limits. Risk management policies and systems are reviewed regularly to reflect changes in market conditions, products and best market practices. The group, through its training and management standards and procedures, aims to develop a disciplined and constructive control environment, in which all employees understand their roles and obligations.
Financial Risk Management disclosures
The Risk and Compliance Committee is responsible for monitoring compliance with the group’s risk management policies and procedures, and for reviewing the adequacy of the risk management framework in relation to the risks faced by the group. This committee is assisted in these functions by the Assurance Function. The Assurance Function undertakes reviews of risk management controls and procedures, the results of which are reported to the committee.
(a) Credit risk
Credit risk is the risk of financial loss to the group if a customer or counterparty to a financial instrument fails to meet its contractual obligations. Credit risk arises principally from the group’s loans and advances to customers and other banks and investment securities but can also arise from credit enhancement provided such as financial guarantees, letters of credit and acceptances. The group is also exposed to other credit risks arising from its trading activities including derivatives.
Credit risk is the single largest risk for the group’s business and management carefully manages its exposure to credit risk. For risk management reporting purposes, the group considers and consolidates all elements of credit risk expo-sure.
For risk management purposes, credit risk arising on trading securities is managed independently, but reported as a component of market risk exposure.
The board of directors has delegated responsibility for the oversight of credit risk to its credit committee comprising of three. non-executive directors and two executive directors. The implementation of the credit risk policies and mon-itoring of the credit portfolio to ensure that risks are managed within acceptable standards is the responsibility of the credit committee comprising of executive management.
Management of credit risk
The board of directors has delegated responsibility for the oversight of credit risk to its credit committee comprising of three non-executive directors and two executive directors. The implementation of the credit risk policies and mon-itoring of the credit portfolio to ensure that risks are managed within acceptable standards is the responsibility of the credit committee comprising of executive management.
The committee assisted by the credit department is responsible for the management of the group’s credit risk includ-ing:
· Formulating credit policies in consultation with business units, covering collateral requirements, credit assess-ment, risk grading and reporting, documentary and legal procedures, and compliance with regulatory and statu-tory requirements.
· Establishing the authorisation structure for the approval and renewal of credit facilities. Authorisation limits are delegated to the head of credit and the credit committee while larger facilities require approval by the board of directors.
· Limiting concentrations of exposure to counterparties, geographies and industries for loans and advances.
ANNUAL REPORT AND FINANCIAL STATEMENTSFOR THE YEAR ENDED 31 DECEMBER 2015
ANNUAL REPORT AND FINANCIAL STATEMENTSFOR THE YEAR ENDED 31 DECEMBER 2015
63
NOTES TO THE FINANCIAL STATEMENTS (Continued)
4 FINANCIAL RISK MANAGEMENT OBJECTIVES AND POLICIES (Continued)
(a) Credit risk (Continued)
Management of credit risk (Continued)
· Developing and maintaining the group’s risk gradings in order to categorise exposures according to the degree of risk of financial loss faced and to focus management on the attendant risks. The risk grading system is used in deter-mining where impairment provisions may be required against specific credit exposures.
· Varying degrees of risk of default and the availability of collateral or other credit risk mitigation. Risk grades are subject to regular reviews by credit department.
· Reviewing compliance of business units with agreed exposure limits, including those for selected industries, country risk and product types. Regular reports are provided to the group credit committee on the credit quality of local portfolios and appropriate corrective action is taken.
· Providing advice, guidance and specialist skills to branches to promote best practice throughout the group in the management of credit risk.
Credit risk measurement
In measuring credit risk of loans and advances to customers, the group takes into account the following factors:
· The probability of default: this is the possibility of the customer failure to pay over the stipulated period in the con-tract.
· Current exposure on the borrower and the likely future development from which the group derives the exposure at default.
· Estimated recovery ratio should default occur; this is the amount that can be recovered through sale of collateral.
The group assesses the probability of default of individual borrowers using internal rating methods tailored to the vari-ous categories of the borrower. In assessing the credit quality of the customer the group takes into account the custom-ers financial position, past experience and other industry specific factors. The credit risk measurements are embedded in the group’s daily operational management and closely aligned to the Central Bank of Kenya loan classifications. The impairment allowances on loans and advances computed through the group’s internal measures and the Central Bank of Kenya prudential guidelines are contrasted with the measurement of impairment under the IAS 39.
Risk limit control and mitigation policies
The group structures the level of credit risk it undertakes by placing limits on amounts of risk accepted in relation to one borrower or a group of borrowers. Such risks are monitored on a revolving basis and are subject to annual or more frequent review.
Exposure to credit risk is managed through regular analysis of the ability of borrowers and potential borrowers to meet interest and capital repayment obligations and by changing limits where appropriate.
The group takes security for funds advances and implements guidelines on the acceptability of specific classes of col-lateral. To minimise credit loss the group will seek additional collateral from the counterparty as soon as impairment indicators are identified for the relevant individual loans and advances. Collateral held for other financial assets other than loans and advances depends on the nature of the instrument.
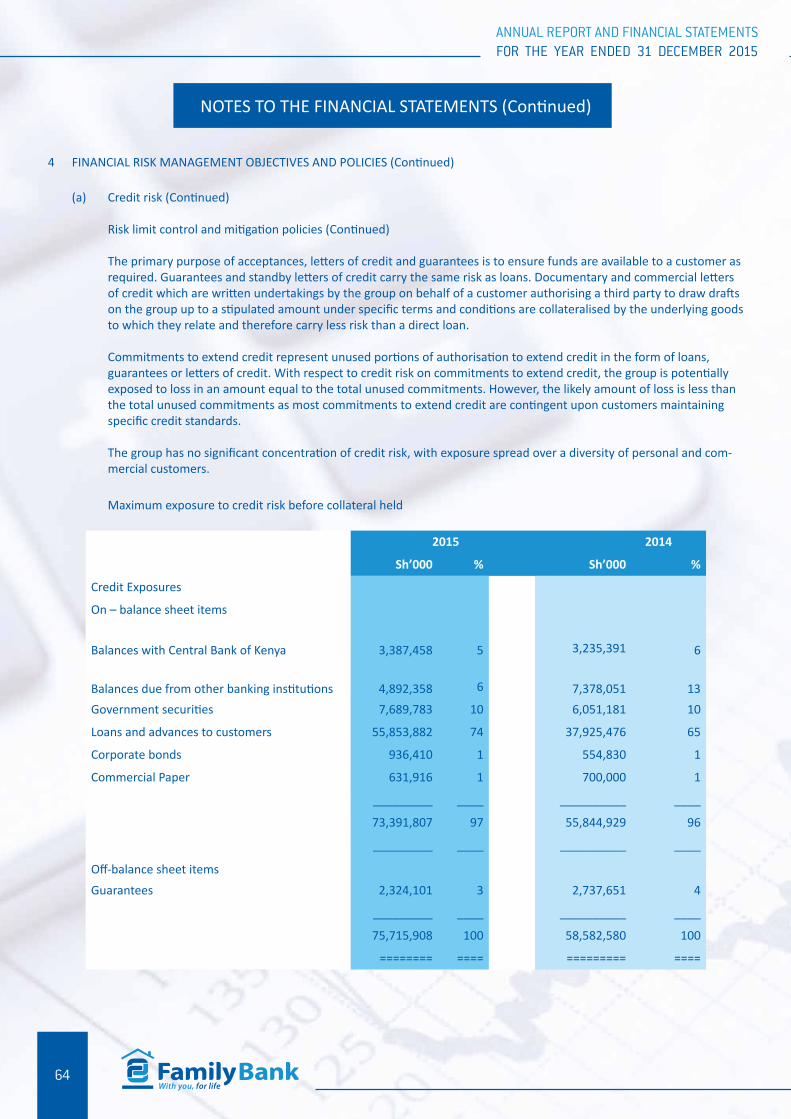
ANNUAL REPORT AND FINANCIAL STATEMENTSFOR THE YEAR ENDED 31 DECEMBER 2015
ANNUAL REPORT AND FINANCIAL STATEMENTSFOR THE YEAR ENDED 31 DECEMBER 2015
64
NOTES TO THE FINANCIAL STATEMENTS (Continued)
4 FINANCIAL RISK MANAGEMENT OBJECTIVES AND POLICIES (Continued)
(a) Credit risk (Continued)
Risk limit control and mitigation policies (Continued)
The primary purpose of acceptances, letters of credit and guarantees is to ensure funds are available to a customer as required. Guarantees and standby letters of credit carry the same risk as loans. Documentary and commercial letters of credit which are written undertakings by the group on behalf of a customer authorising a third party to draw drafts on the group up to a stipulated amount under specific terms and conditions are collateralised by the underlying goods to which they relate and therefore carry less risk than a direct loan.
Commitments to extend credit represent unused portions of authorisation to extend credit in the form of loans, guarantees or letters of credit. With respect to credit risk on commitments to extend credit, the group is potentially exposed to loss in an amount equal to the total unused commitments. However, the likely amount of loss is less than the total unused commitments as most commitments to extend credit are contingent upon customers maintaining specific credit standards.
The group has no significant concentration of credit risk, with exposure spread over a diversity of personal and com-mercial customers.
Maximum exposure to credit risk before collateral held
2015 2014
Sh’000 % Sh’000 %
Credit Exposures
On – balance sheet items
Balances with Central Bank of Kenya 3,387,458 5 3,235,391 6
Balances due from other banking institutions 4,892,358 6 7,378,051 13
Government securities 7,689,783 10 6,051,181 10
Loans and advances to customers 55,853,882 74 37,925,476 65
Corporate bonds 936,410 1 554,830 1
Commercial Paper 631,916 1 700,000 1
_________ ____ __________ ____
73,391,807 97 55,844,929 96
_________ ____ __________ ____
Off-balance sheet items Guarantees 2,324,101 3 2,737,651 4
_________ ____ __________ ____
75,715,908 100 58,582,580 100
======== ==== ========= ====
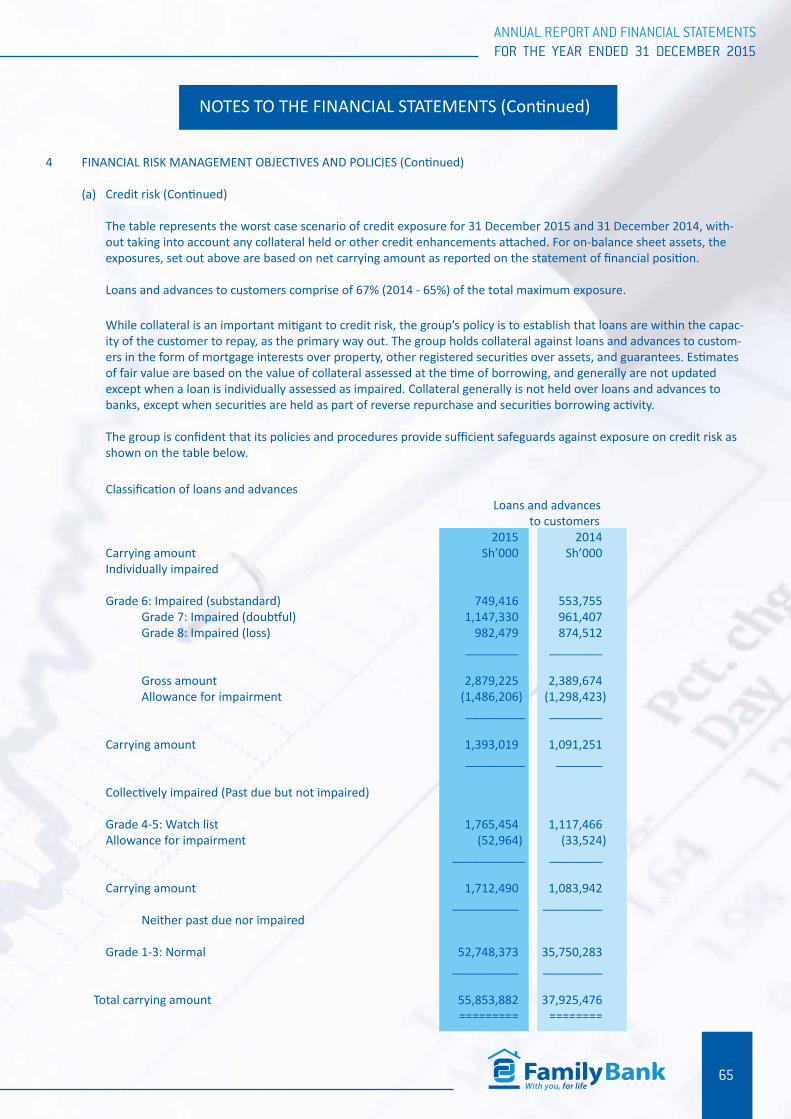
ANNUAL REPORT AND FINANCIAL STATEMENTSFOR THE YEAR ENDED 31 DECEMBER 2015
ANNUAL REPORT AND FINANCIAL STATEMENTSFOR THE YEAR ENDED 31 DECEMBER 2015
65
NOTES TO THE FINANCIAL STATEMENTS (Continued)
4 FINANCIAL RISK MANAGEMENT OBJECTIVES AND POLICIES (Continued)
(a) Credit risk (Continued)
The table represents the worst case scenario of credit exposure for 31 December 2015 and 31 December 2014, with-out taking into account any collateral held or other credit enhancements attached. For on-balance sheet assets, the exposures, set out above are based on net carrying amount as reported on the statement of financial position.
Loans and advances to customers comprise of 67% (2014 - 65%) of the total maximum exposure.
While collateral is an important mitigant to credit risk, the group’s policy is to establish that loans are within the capac-ity of the customer to repay, as the primary way out. The group holds collateral against loans and advances to custom-ers in the form of mortgage interests over property, other registered securities over assets, and guarantees. Estimates of fair value are based on the value of collateral assessed at the time of borrowing, and generally are not updated except when a loan is individually assessed as impaired. Collateral generally is not held over loans and advances to banks, except when securities are held as part of reverse repurchase and securities borrowing activity.
The group is confident that its policies and procedures provide sufficient safeguards against exposure on credit risk as shown on the table below.
Classification of loans and advances Loans and advances to customers 2015 2014 Carrying amount Sh’000 Sh’000 Individually impaired
Grade 6: Impaired (substandard) 749,416 553,755 Grade 7: Impaired (doubtful) 1,147,330 961,407 Grade 8: Impaired (loss) 982,479 874,512 ________ ________
Gross amount 2,879,225 2,389,674 Allowance for impairment (1,486,206) (1,298,423) ________ _ ________
Carrying amount 1,393,019 1,091,251 ________ _ _______
Collectively impaired (Past due but not impaired)
Grade 4-5: Watch list 1,765,454 1,117,466 Allowance for impairment (52,964) (33,524) __________ _ ________
Carrying amount 1,712,490 1,083,942 __________ _________
Neither past due nor impaired
Grade 1-3: Normal 52,748,373 35,750,283 __________ _________
Total carrying amount 55,853,882 37,925,476 ========= ========

ANNUAL REPORT AND FINANCIAL STATEMENTSFOR THE YEAR ENDED 31 DECEMBER 2015
ANNUAL REPORT AND FINANCIAL STATEMENTSFOR THE YEAR ENDED 31 DECEMBER 2015
66
NOTES TO THE FINANCIAL STATEMENTS (Continued)
4 FINANCIAL RISK MANAGEMENT OBJECTIVES AND POLICIES (Continued)
(a) Credit risk (Continued)
Loans and advances neither past due nor impaired
Apart from the loans and advances to customers all other credit exposures are neither past due nor impaired.The group classifies loans and advances under this category for those exposures that are up to date and in line with contractual agreements. These exposures will normally be maintained within approved product programs and with no signs of impairment or distress. These exposures are categorised internally as grade 1-3, that is, normal accounts in line with CBK prudential guidelines and a provision of 1 % is made and appropriated from revenue reserves to statuto-ry reserves.
Loans and advances past due but not impaired loans
Loans where the contractual interest or principal payments are past due but the group believes that impairment is not appropriate on the basis of the level of security/collateral available and/or the stage of collection of amounts owed to the group are classified as past due but not impaired. These exposures are graded internally as category 4-5 that is watch accounts in the group’s internal credit risk grading system, in line with CBK guidelines.
Allowances for impairment
The group establishes an allowance for impairment losses that represents its estimate of incurred losses in its loan portfolio. The main components of this allowance are a specific loss component that relates to individually significant exposures, and a collective loan loss allowance established for homogeneous assets in respect of losses that have been incurred but have not been identified on loans subject to individual assessment for impairment.
The internal credit risk grading system which is in line with CBK prudential guidelines focus on expected credit losses – that is taking into account the risk of future events giving rise to losses. In contrast, impairment allowances are recognised for financial reporting purposes only for losses that have been incurred at the date of the statement of fi-nancial position based on objective evidence of impairment. Due to the different methodologies applied, the amount of incurred credit losses provided for in the statement of comprehensive income is usually lower than the amount determined from the expected loss model that is used for internal operational management and banking regulation purposes.
Write-off policy
When a loan is uncollectible it is written off against the related provisions for loan impairment. Such loans are written off after all the necessary recovery procedures have been completed and the amount of loan has been determined. Subsequent recoveries of amounts previously written off are recognised as gains in the profit or loss.
The group holds collateral against loans and advances to customers in the form of mortgage interests over property, other registered securities over assets, and guarantees. Estimates of fair value are based on the value of collateral assessed at the time of borrowing, and generally are not updated except when a loan is individually assessed as impaired. Collateral generally is not held over loans and advances to banks, except when securities are held as part of reverse repurchase and securities borrowing activity.
Settlement risk
The group’s activities may give rise to risk at the time of settlement of transactions and trades. Settlement risk is the risk of loss due to the failure of a bank to honour its obligations to deliver cash, securities or other assets as contractu-ally agreed.
Settlement limits form part of the credit approval/limit monitoring process described earlier. Acceptance of settle-ment risk on free settlement trades requires transaction specific or counterparty specific approvals from bank risk.
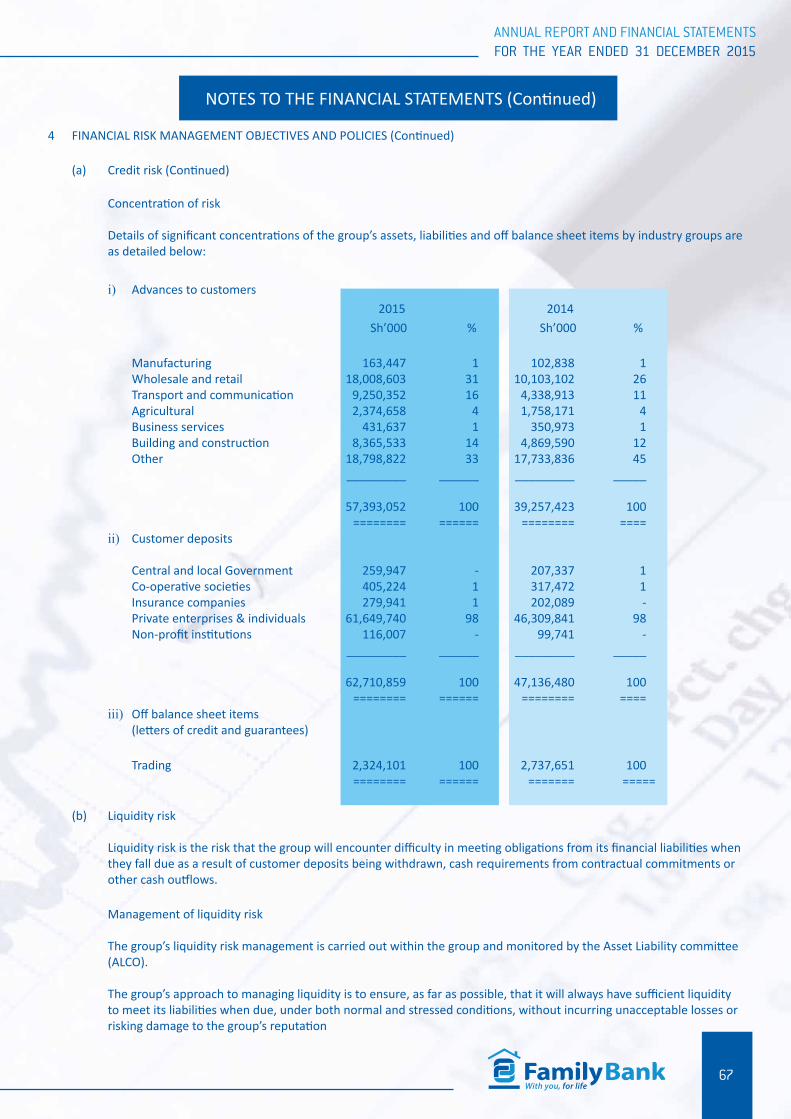
ANNUAL REPORT AND FINANCIAL STATEMENTSFOR THE YEAR ENDED 31 DECEMBER 2015
ANNUAL REPORT AND FINANCIAL STATEMENTSFOR THE YEAR ENDED 31 DECEMBER 2015
67
NOTES TO THE FINANCIAL STATEMENTS (Continued)
4 FINANCIAL RISK MANAGEMENT OBJECTIVES AND POLICIES (Continued)
(a) Credit risk (Continued)
Concentration of risk
Details of significant concentrations of the group’s assets, liabilities and off balance sheet items by industry groups are as detailed below:
i) Advances to customers 2015 2014
Sh’000 % Sh’000 %
Manufacturing 163,447 1 102,838 1 Wholesale and retail 18,008,603 31 10,103,102 26 Transport and communication 9,250,352 16 4,338,913 11 Agricultural 2,374,658 4 1,758,171 4 Business services 431,637 1 350,973 1 Building and construction 8,365,533 14 4,869,590 12 Other 18,798,822 33 17,733,836 45
_________ ______ _________ _____ 57,393,052 100 39,257,423 100 ======== ====== ======== ====ii) Customer deposits
Central and local Government 259,947 - 207,337 1 Co-operative societies 405,224 1 317,472 1 Insurance companies 279,941 1 202,089 - Private enterprises & individuals 61,649,740 98 46,309,841 98 Non-profit institutions 116,007 - 99,741 - _________ ______ _________ _____
62,710,859 100 47,136,480 100 ======== ====== ======== ====iii) Off balance sheet items
(letters of credit and guarantees)
Trading 2,324,101 100 2,737,651 100 ======== ====== ======= =====
(b) Liquidity risk
Liquidity risk is the risk that the group will encounter difficulty in meeting obligations from its financial liabilities when they fall due as a result of customer deposits being withdrawn, cash requirements from contractual commitments or other cash outflows.
Management of liquidity risk
The group’s liquidity risk management is carried out within the group and monitored by the Asset Liability committee (ALCO).
The group’s approach to managing liquidity is to ensure, as far as possible, that it will always have sufficient liquidity to meet its liabilities when due, under both normal and stressed conditions, without incurring unacceptable losses or risking damage to the group’s reputation

ANNUAL REPORT AND FINANCIAL STATEMENTSFOR THE YEAR ENDED 31 DECEMBER 2015
ANNUAL REPORT AND FINANCIAL STATEMENTSFOR THE YEAR ENDED 31 DECEMBER 2015
68
NOTES TO THE FINANCIAL STATEMENTS (Continued)
4 FINANCIAL RISK MANAGEMENT OBJECTIVES AND POLICIES (Continued)
(b) Liquidity risk (Continued)
Liquidity risk is addressed through the following measures:
· The treasury department monitors liquidity ratios on a daily basis against internal and regulatory requirements· Day to day funding is managed by monitoring future cash flows to ensure that requirements can be met. This
includes replenishment of funds as they mature or are borrowed by customers.
The group invests in short term liquid instruments which can easily be sold in the market when the need arises
· The group enters into lending contracts subject to availability of funds.· The group has an aggressive strategy aimed at increasing the customer deposit base.· The group borrows from the market through interbank transactions with other banks and The Central Bank of
Kenya for short term liquidity requirements.· Investments in property and equipment are properly budgeted for and done when the group has sufficient cash
flows.
The daily liquidity position is monitored and regular liquidity stress testing is conducted under a variety of scenarios covering both normal and more severe market conditions. All liquidity policies and procedures are subject to review and approval by the board. Daily reports covering the liquidity position of the group are regularly submitted to Asset and Liability Committee.
Exposure to liquidity risk
The key measure used by the group for managing liquidity risk is the ratio of net liquid assets to deposits from cus-tomers. For this purpose net liquid assets are considered as including cash and cash equivalents and investment grade debt securities for which there is an active and liquid market less any deposits from banks, debt securities issued, other borrowings and commitments maturing within the next month. The Central Bank of Kenya minimum liquidity ratio is 20%. Details of the reported group ratio of net liquid assets to deposits and customers at the reporting date and during the reporting period were as follows:
2015 2014
At 31 December 31% 41% Average for the year 36% 33% Maximum for the year 42% 41% Minimum for the year 31% 29%
==== === =======

ANNUAL REPORT AND FINANCIAL STATEMENTSFOR THE YEAR ENDED 31 DECEMBER 2015
ANNUAL REPORT AND FINANCIAL STATEMENTSFOR THE YEAR ENDED 31 DECEMBER 2015
69
NOTES TO THE FINANCIAL STATEMENTS (Continued)
4 FINANCIAL RISK MANAGEMENT OBJECTIVES AND POLICIES (Continued)
(b) Liquidity risk (continued)
Liquidity risk based on undiscounted cash flows
The table below analyses the cash flows payable by the group under non-derivative financial liabilities by remaining contractual maturities and non-derivative financial assets by expected maturity dates as at the date of the statement of financial position.
31 December 2015
Up to1 month
Sh’000
1 – 3monthsSh’000
4 - 12monthsSh’000
1 – 5years
Sh’000
Over 5 yearsSh’000
TotalSh’000
Financial assets
Cash in hand 2,779,634 - - - - 2,779,634
Balances with Central Bank of Kenya 3,387,458 - - - - 3,387,458
Balances due from banks 4,892,358 - - - - 4,892,358
Government securities 420,055 3,370,425 294,998 63,167 3,541,138 7,689,783
Loans and advances to customers 3,564,966 1,441,100 7,267,852 29,821,472 13,758,492 55,853,882
Corporate bonds and commercial paper - - 727,438 840,888 - 1,568,326
Other assets 51,393 - - - - 51,393
_________ _______ ________ _________ _________ __________
Total financial assets 15,095,864 4,811,525 8,290,288 30,725,527 17,299,630 76,222,834
_________ _______ _________ _________ _________ __________
Financial liabilities
Balances due to banks 131,643 - - - - 131,643
Customer deposits 31,199,548 5,101,986 21,691,306 4,718,018 - 62,710,859
Borrowings - - 135,284 3,442,517 2,009,920 5,587,720
Other liabilities 158,676 - - - - 158,676
__________ _________ _________ _________ _________ __________
Total financial liabilities 31,489,867 5,101,986 21,826,590 8,160,535 2,009,920 68,588,898
__________ _________ _________ _________ _________ __________
Net liquidity gap (16,394,003) (290,461) (13,536,302) 22,564,992 15,289,710 7,633,936
========== ========= ========= ========= ========= =========
As at 31 December 2014
Total financial assets 14,169,796 2,395,196 5,426,708 21,616,810 14,681,910 58,290,420
Total financial liabilities 27,327,619 3,208,179 13,752,115 6,108,907 - 50,396,820
___________ __________ __________ _________ __________ __________
Net liquidity gap (13,157,823) (812,983) (8,325,407) 15,507,903 14,681,910 7,893,600
========== ========= ========= ======== ========= =========
The above table shows the undiscounted cash flows on the group’s financial liabilities and unrecognised loan commit-ments on the basis of their earliest possible contractual maturity. The group’s expected cash flows on these instruments vary significantly from this analysis.

ANNUAL REPORT AND FINANCIAL STATEMENTSFOR THE YEAR ENDED 31 DECEMBER 2015
ANNUAL REPORT AND FINANCIAL STATEMENTSFOR THE YEAR ENDED 31 DECEMBER 2015
70
NOTES TO THE FINANCIAL STATEMENTS (Continued)
4 FINANCIAL RISK MANAGEMENT OBJECTIVES AND POLICIES (Continued)
(c) Market risks
Market risk is the risk that fair value or future cash flows of a financial instrument will fluctuate because of changes in market prices. Market risk arise from open positions in interest rates, currency and equity products, all of which are exposed to general and specific market movements and changes in the level of volatility of market rates or prices such as interest rates, equity prices, foreign exchange rates and credit spreads. The objective of market risk management is to manage and control market risk exposures within acceptable parameters, while optimising the return on risk.
The group separates exposures to market risk into either trading or non-trading portfolios. Trading portfolios include those positions arising from market-making transactions where the group acts as principal with clients or with the market. Non-trading portfolios mainly arise from the interest rate management of the entity’s retail and commercial banking assets and liabilities.
Management of market risks
Overall responsibility of managing market risk rests with the Asset and Liability Committee. The Treasury department is responsible for the development of detailed risk management policies (subject to review and approval by ALCO) and for the day-to-day review of their implementation. The board of directors sets limits on the level of mismatch of interest rate repricing that may be undertaken which is monitored daily.
i) Interest rate risk
The principal risk to which non-trading portfolios are exposed is the risk of loss from fluctuations in the future cash flows or fair values of financial instruments because of a change in market interest rates. The ALCO is the monitoring body for compliance with these limits and is assisted by Treasury Department in its day-to-day monitoring activities. The table below summarises the group’s exposures to interest rate risks. Included in the table are the group’s assets and liabilities at carrying amounts, categorised by the earlier of the contractual repricing or maturity dates. The group does not bear an interest rate risk on off balance sheet items.
31 December 2015Up to
1 monthSh’000
1 – 3monthsSh’000
4 – 12monthsSh’000
1-5 years Sh’000
Over 5 yearsSh’000
Non-interestbearingSh’000
TotalSh’000
Financial assets
Cash in hand - - - - - 2,779,634 2,779,634
Balances with CBK - - - - - 3,387,458 3,387,458
Balances due from banks 4,687,834 - - - - 204,524 4,892,358
Government securities 420,055 3,370,425 294,998 63,167 3,541,138 - 7,689,783
Loans and advances to custom-ers 55,853,882 - - - - - 55,853,882
Corporate bonds - - 727,438 840,888 - - 1,568,326
___________ _________ _________ _________ __________ __________ ___________
60,961,771 3,370,425 1,022,436 904,055 3,541,138 6,371,616 76,171,441
___________ _________ _________ _________ __________ __________ ___________
Financial liabilities
Balances due to banks 131,643 - - - - - 131,643
Customer deposits 5,101,986 6,806,558 14,884,748 4,718,018 - 31,199,548 62,710,859
Borrowings - - 135,284 3,442,571 2,009,920 - 5,587,720
____________ ___________ _____________ ____________ ___________ _____________ ____________
5,233,629 6,806,558 15,020,032 8,160,589 2,009,920 31,199,548 68,430,222
____________ ____________ _____________ ____________ ___________ _____________ ____________
Interest sensitivity gap 55,728,142 (3,436,133) (13,997,596) (7,256,534) 1,531,218 (24,827,932) 7,741,219
========= ========= ========== ========= ======== ========= ========

ANNUAL REPORT AND FINANCIAL STATEMENTSFOR THE YEAR ENDED 31 DECEMBER 2015
ANNUAL REPORT AND FINANCIAL STATEMENTSFOR THE YEAR ENDED 31 DECEMBER 2015
71
NOTES TO THE FINANCIAL STATEMENTS (Continued)
4 FINANCIAL RISK MANAGEMENT OBJECTIVES AND POLICIES (Continued)
(c) Market risks (Continued)
(i) Interest rate risks (continued)
31 December 2014Up to
1 monthSh’000
1 – 3monthsSh’000
4 – 12monthsSh’000
1-5 years Sh’000
Over 5 yearsSh’000
Non-interestbearingSh’000
TotalSh’000
Total financial assets 38,085,222 8,961,840 1,179,910 437,240 3,807,702 5,670,236 58,142,150
Total financial liabilities (3,417,470) 4,277,319) (9,474,796) (6,108,907) - (26,967,613) (50,246,105)
__________ __________ _________ _________ _________ __________ __________
Interest rate sensitivity gap 34,667,752 4,684,520 (8,294,886) (5,671,667) 3,807,702 (21,297,377) 7,896,045
========= ========= ======== ======== ======== ========= =========
(ii) Currency Risk
The group takes on exposure to the effects of fluctuations in the prevailing foreign currency exchange rates on its finan-cial position and cash flows. The board sets limits on the level of exposure by currency and in total for both overnight and intra-day positions which are monitored daily.
USD GBP EURO TOTAL
As at 31 December 2015 Sh’000 Sh’000 Sh’000 Sh’000
Financial assets
Deposits and balances due from banking institutions 310,724 30,342 43,383 384,449
======= ====== ====== =======
As at 31 December 2014
Financial assets
Deposits and balances due from banking institutions 14,840 92,071 49,512 156,423
________ _______ _______ ________
Financial liabilities
Borrowings (381,976) - - (381,976)
________ _______ _______ ________
Sensitivity gap (367,136) 92,071 49,512 (225,553)
======= ====== ====== =======
Market Risks - Sensitivity Analysis
A principal part of the group’s management of market risk is to monitor the sensitivity of projected net interest income under varying interest rate scenarios (simulation modelling) and the sensitivity of future earnings and capital to varying foreign exchange rates. Stress tests provide an indication of the potential size of losses that could arise in extreme condi-tions.
The group aims, through its management of market risk, to mitigate the impact of prospective interest rate movements and foreign exchange fluctuations which could reduce future earnings and capital.
For simulation modelling, the group uses a combination of scenarios relevant to local businesses and local markets. These scenarios are used to illustrate the effect on the group’s earnings and capital.
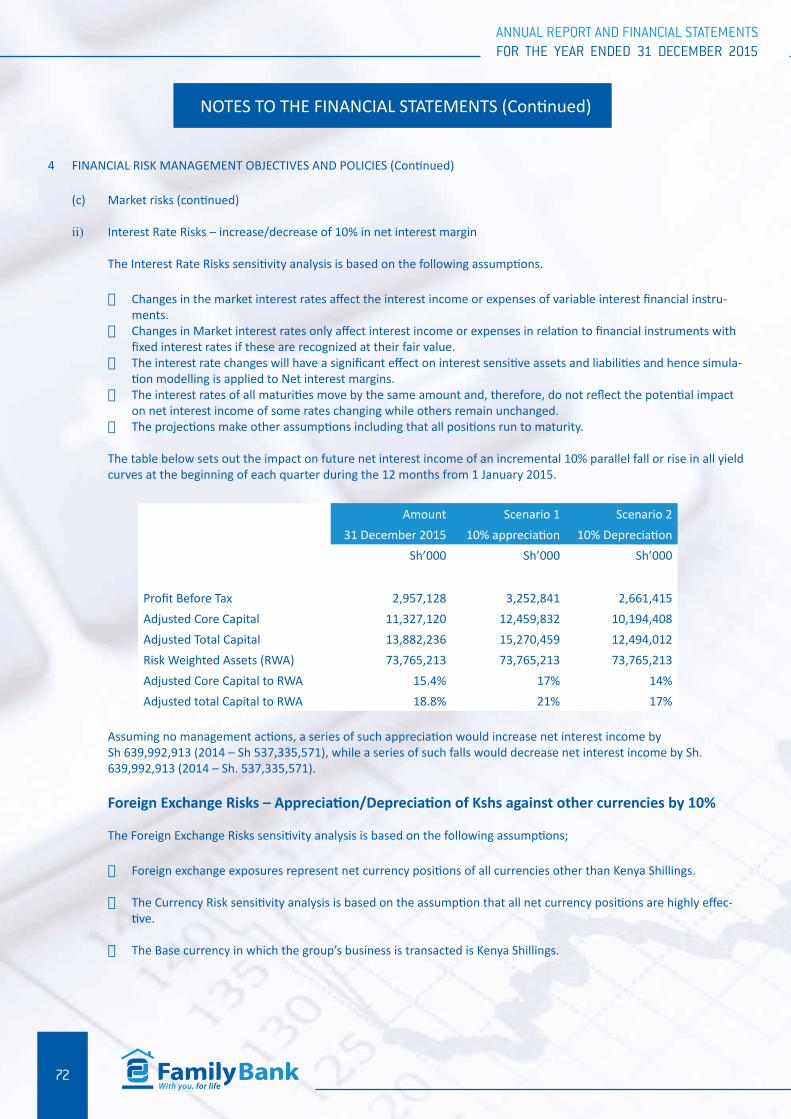
ANNUAL REPORT AND FINANCIAL STATEMENTSFOR THE YEAR ENDED 31 DECEMBER 2015
ANNUAL REPORT AND FINANCIAL STATEMENTSFOR THE YEAR ENDED 31 DECEMBER 2015
72
NOTES TO THE FINANCIAL STATEMENTS (Continued)
4 FINANCIAL RISK MANAGEMENT OBJECTIVES AND POLICIES (Continued)
(c) Market risks (continued)
ii) Interest Rate Risks – increase/decrease of 10% in net interest margin
The Interest Rate Risks sensitivity analysis is based on the following assumptions.
· Changes in the market interest rates affect the interest income or expenses of variable interest financial instru-ments.
· Changes in Market interest rates only affect interest income or expenses in relation to financial instruments with fixed interest rates if these are recognized at their fair value.
· The interest rate changes will have a significant effect on interest sensitive assets and liabilities and hence simula-tion modelling is applied to Net interest margins.
· The interest rates of all maturities move by the same amount and, therefore, do not reflect the potential impact on net interest income of some rates changing while others remain unchanged.
· The projections make other assumptions including that all positions run to maturity.
The table below sets out the impact on future net interest income of an incremental 10% parallel fall or rise in all yield curves at the beginning of each quarter during the 12 months from 1 January 2015.
Amount Scenario 1 Scenario 2
31 December 2015 10% appreciation 10% Depreciation
Sh’000 Sh’000 Sh’000
Profit Before Tax 2,957,128 3,252,841 2,661,415
Adjusted Core Capital 11,327,120 12,459,832 10,194,408
Adjusted Total Capital 13,882,236 15,270,459 12,494,012
Risk Weighted Assets (RWA) 73,765,213 73,765,213 73,765,213
Adjusted Core Capital to RWA 15.4% 17% 14%
Adjusted total Capital to RWA 18.8% 21% 17%
Assuming no management actions, a series of such appreciation would increase net interest income by Sh 639,992,913 (2014 – Sh 537,335,571), while a series of such falls would decrease net interest income by Sh. 639,992,913 (2014 – Sh. 537,335,571).
Foreign Exchange Risks – Appreciation/Depreciation of Kshs against other currencies by 10%
The Foreign Exchange Risks sensitivity analysis is based on the following assumptions;
· Foreign exchange exposures represent net currency positions of all currencies other than Kenya Shillings.
· The Currency Risk sensitivity analysis is based on the assumption that all net currency positions are highly effec-tive.
· The Base currency in which the group’s business is transacted is Kenya Shillings.

ANNUAL REPORT AND FINANCIAL STATEMENTSFOR THE YEAR ENDED 31 DECEMBER 2015
ANNUAL REPORT AND FINANCIAL STATEMENTSFOR THE YEAR ENDED 31 DECEMBER 2015
73
NOTES TO THE FINANCIAL STATEMENTS (Continued)
4 FINANCIAL RISK MANAGEMENT OBJECTIVES AND POLICIES (Continued)
(c) Market risks (continued)
The table below sets out the impact on future earnings of an incremental 10% parallel fall or rise in all foreign curren-cies at the beginning of each quarter during the 12 months from 1 January 2015.
Assuming no management actions, a series of such rise and fall would impact the future earnings and capital as illus-trated in the table below;
Amount Scenario 1 Scenario 2
31 December 2015 10% appreciation 10% Depreciation
Sh’000 Sh’000 Sh’000
Profit Before Tax 2,957,128 3,252,841 2,661,415
Adjusted Core Capital 11,327,120 12,459,832 10,194,408
Adjusted Total Capital 13,882,236 15,270,459 12,494,012
Risk Weighted Assets (RWA) 73,765,213 73,765,213 73,765,213
Adjusted Core Capital to RWA 15.4% 17% 14%
Adjusted total Capital to RWA 18.8% 21% 17%
Assuming no management actions, a series of such appreciation would increase earnings by Sh 29,848,418 (2014 - Sh 11,144,389), while a series of such falls would decrease net interest income by Sh 29,848,418 (2014 - Sh 11,144,389).
(d) Other risks
i) Strategic risk
Strategic risk is the potential for loss arising from ineffective business strategies, improper implementation of strat-egies, sudden unexpected changes in the Group’s environment, or from lack of adequate responsiveness to changes in the business environment.
The Group faces several strategic risks from its environment which include:
· Macro-economic changes.· Competition from the financial industry and organisations providing similar services.· Technological changes.· Key legislative and regulatory changes.· Major political events.· Human capital or social/demographic trends and changes.
Who manages strategic risk?
The Board of Directors is responsible for the overall generation and implementation of the Bank’s strategy for purposes of enhancing shareholders’ value. It has however delegated the implementation aspects to the Managing Director and the Senior Management team who execute strategy.
The bank has a strategy office reporting directly to the Managing Director with a mandate of co-ordinating strategy development, monitoring implementation of the strategic objectives and performing evaluation and control.

ANNUAL REPORT AND FINANCIAL STATEMENTSFOR THE YEAR ENDED 31 DECEMBER 2015
ANNUAL REPORT AND FINANCIAL STATEMENTSFOR THE YEAR ENDED 31 DECEMBER 2015
74
NOTES TO THE FINANCIAL STATEMENTS (Continued)
4 FINANCIAL MANAGEMENT OBJECTIVES AND POLICIES (Continued)
(d) Other risks (Continued)
i) Strategic risk (Continued)
How we manage strategic risk
The Managing Director supported by the Head of Strategy and other Senior Management executes the approved strategic objectives on a day to day basis and actively monitors business performance against these objectives through periodic reviews.
The business carries out business performance reviews on a monthly basis against pre-determined milestones and key performance indicators. The reviews which cover branch and head office departments are supported by the Board of Directors through the board chairman.
The Managing Director co-ordinates an annual strategic planning process for Senior Management intended to align individual business strategies to overall enterprise level strategies as approved by the Board of Directors. They include a comprehensive review and evaluation of the business strategies, competitive positioning, financial performance, initiatives of strategic executions, and key business risks
Each business head unit is responsible for directing strategies in their respective units and ensure such strategies are aligned to the overall strategy of the Bank. They are also responsible for monitoring, managing and reporting on the effectiveness and risks of their business’ strategic objectives, and the progress they have made towards achieving these. They oversee the direction and trends of significant current and emerging risks related to their business units and that mitigating actions are taken where appropriate.
ii) Operational risk
Operational risk is the potential for loss arising from inadequate or failed processes, systems, people or external events. Operational risk is embedded in all business activities including the practices for managing other risks e.g. credit, market and liquidity risks and arises in the normal course of business. The impact of these risks can result in significant financial loss, reputational harm or regulatory censure and penalties.
The major operational risks faced by the Group include:
· People and related issues such as staff retention, frauds, amongst others.· Systems and processes changes related to the drive to meet our clients’ needs.
Who manages operational risk
The Risk & Compliance department is tasked with the responsibility designing and maintaining an operational risk framework that emphasises a strong risk management and internal control culture throughout the Bank.
The department continuously assesses the continued applicability of policies and procedures in place to identify assess report, monitor, and control or mitigate operational risks.
The Head of Risk & Compliance reports to the Board Risk Management Committee (BRMC) in line with good gov-ernance practices and on quarterly basis presents a risk assessment report to the committee covering all the risks including operational risk.
ANNUAL REPORT AND FINANCIAL STATEMENTSFOR THE YEAR ENDED 31 DECEMBER 2015
ANNUAL REPORT AND FINANCIAL STATEMENTSFOR THE YEAR ENDED 31 DECEMBER 2015
75
NOTES TO THE FINANCIAL STATEMENTS (Continued)
4 FINANCIAL MANAGEMENT OBJECTIVES AND POLICIES (Continued)
(d) Other risks (Continued)
ii) Operational risk (Continued)
How we manage operational risk
Our operational risk management framework is designed to ensure key risk exposures are proactively managed within acceptable levels. It incorporates best practice and meets regulatory guidelines through:
· Governance and Policy: Management as well as Committee reporting and organisational structures empha-sise accountability, ownership and effective oversight of each business unit’s operational risk exposures. Furthermore, the Board Risk Management Committee and Senior Management’s expectations are set out via enterprise-wide policies.
· Risk and Control Self-Assessment: Through quarterly comprehensive assessments of our key operational risk exposures and internal control environments, Senior Management is able to evaluate.
· its effectiveness and implement appropriate additional corrective actions where needed, to offset or reduce unacceptable risks.
· Operational Risk Event Monitoring: Our policies require that internal and industry-wide operational risk events are identified, tracked, and reported to the right levels to ensure they are analysed appropriately and corrective action taken in a timely manner.
· Risk Reporting: Significant operational risk issues together with measures to address them are tracked, assessed and reported to Senior Management and the Board of Directors to ensure accountability is main-tained over current and emerging risks.
· Insurance: A comprehensive portfolio of insurance and other risk mitigating arrangements are maintained with the type and level of insurance coverage continually assessed to ensure both risk tolerance and statu-tory requirements are met. This includes identifying opportunities for transferring our risks to third parties where appropriate.
· Technology and Information: The key risks here revolve around our reliance on technology and information and their impact on operational availability, integrity and security of our information data and systems / infrastructure. Our risk framework and programs use best practice and include robust threat and vulnerability assessments, as well as security and change management practices.
· Business Continuity Management: Business Continuity Management supports the ability of Senior Manage-ment to continue to operate their businesses, and provide customer access to products and services in times of disruptions. This program includes formal crisis management protocols and continuity strategies. All key functions of the Group are regularly tested to confirm their contingency plan designs are able to respond to a broad range of potentially disruptive scenarios.
iii) Compliance risk
Compliance risk refers to the potential of loss arising from non-compliance with laws, rules, regulations, obligato-ry practices / standards, contractual agreements, or other legal requirements including the effectiveness of pre-venting and handling litigation. It is not actively or deliberately pursued in the expectation of a return but occurs in the normal course of our business operations.
The Group meets high standards of compliance with policy, legal and regulatory requirements in all business dealings and transactions. As a result of high financial business regulation we are exposed to regulatory and legal risks in virtually all our activities. Failure to comply with regulation not only poses a risk of censure and litigation but may lead to serious reputational risks. Financial penalties and costs related to litigation may also substantially erode the Bank’s earnings.

ANNUAL REPORT AND FINANCIAL STATEMENTSFOR THE YEAR ENDED 31 DECEMBER 2015
ANNUAL REPORT AND FINANCIAL STATEMENTSFOR THE YEAR ENDED 31 DECEMBER 2015
76
NOTES TO THE FINANCIAL STATEMENTS (Continued)
4 FINANCIAL RISK MANAGEMENT OBJECTIVES AND POLICIES (Continued)
(d) Other risks (Continued)
iii) Compliance risk (Continued)
Who manages regulatory and legal risk
The various departments have the responsibility and accountability of managing regulatory and legal risks relating to their units on a day to day basis with assistance and oversight from Legal and Risk & Compliance Departments.
Risk & Compliance Department identifies and monitors the key risks and is responsible for ensuring that the day to day business controls comply with applicable legislation and are in line with best practice.
How we manage regulatory and legal risks
External legal counsel work closely with business units to identify areas of existing and potential regulato-ry/legal risks and actively manage them to reduce the Bank’s exposures.Senior Management and the Board Risk Management Committee receive the Risk & Compliance Depart-ment’s reports on the status of the Bank’s Compliance
Senior Management and the Board Risk Management Committee receive the Risk & Compliance De-partment’s reports on the status of the Bank’s Compliance Risk Framework to enable them to determine whether it is under control and where not, tracks significant corrective actions to finality. Additionally, significant exposures under “for or against” litigation are reviewed periodically.
The Board of Directors and Senior Management sets the “tone at the top” for a compliance culture begin-ning with concern for what is right (including compliance to policy and the law) in all our business consid-erations, decisions and actions.
How we manage regulatory and legal risks
Business unit heads manage day-to-day regulatory and legal risk primarily by implementing appropriate policies, procedures and controls already in place. The Legal & Compliance departments assist them by:
· Communicating and advising on regulatory and legal requirements, and emerging compliance obliga-tions to each business unit as required.
· Implementing or assisting with reviews of policies, procedures and training. They do this by inde-pendently monitoring and testing for adherence to certain regulatory and legal requirements, as well as the effectiveness of associated key internal controls.
· Tracking, escalating and reporting significant issues and findings to Senior Management and the Board of Directors.
· Liaising with regulators, as appropriate, regarding new or revised legislation, regulatory guidelines or regulatory examinations.
We have developed robust policies and procedures designed to manage Know Your Customer (KYC) and Anti-Money Laundering (AML) risks as envisaged in the Proceeds of Crime & Anti-Money Laundering Act. Our account opening requirements and customer transaction screening procedures meet the stringent requirements stipulated therein. Reporting of suspicious and other transactions is done as required by the law and policy standards. We carry out appropriate periodic due diligence on correspondent banking counterparties, and meet KYC / AML obligations to them continuously. All staff are trained when they join the Bank.

ANNUAL REPORT AND FINANCIAL STATEMENTSFOR THE YEAR ENDED 31 DECEMBER 2015
ANNUAL REPORT AND FINANCIAL STATEMENTSFOR THE YEAR ENDED 31 DECEMBER 2015
77
NOTES TO THE FINANCIAL STATEMENTS (Continued)
4 FINANCIAL RISK MANAGEMENT OBJECTIVES AND POLICIES (Continued)
(d) Other risks (Continued)
iv) Reputational risk
Reputational risk is the potential that negative stakeholder impressions or perceptions, whether true or not, re-garding the Bank’s business practices, actions or inactions, will or may cause a decline in its value, brand, liquidity or customer base. It is a resultant effect of all other risks highlighted in this report and therefore cannot be man-aged in isolation. Therefore, when all the other risks are managed well, this risk is substantially minimised.
The Family Bank’s reputation is an invaluable business asset essential for optimising shareholder value, hence it is constantly under threat. Our services and activities, including new ones, ensure the Bank’s good reputation is always maintained or enhanced.
The Ultimate responsibility for this risk rests with the Board of Directors and Senior Management who examine the Bank’s reputational risk as part of their regular mandate. They are assisted in this aspect by the Marketing & Corporate Communications Department.Their purpose is to ensure that all products, services, and activities meet the Bank’s reputational risk objectives in line with the Board of Director’s approved appetite. Nonetheless, every employee and representative of the Bank has a responsibility to contribute positively to our reputation.
Senior Management and the BRMC receive periodic reports from Risk & Compliance Department on the assess-ment of the Bank’s reputational risk exposures that arise from its business activities.
How we manage reputational risk Every employee and representative of the Bank has a responsibility to contribute in a positive way towards our reputation. This is through ensuring ethical practices are always adhered to, interactions with all stakeholders are positive, and we comply with applicable policies, legislation, and regulations
Reputational risk is most effectively managed when every individual works continuously to protect and enhance our reputation. In addition our customer service department maintain a log of all incidences emanating from negative media publicity and customer complaints touching on the reputation of the bank.
5 CAPITAL MANAGEMENT
Regulatory capital
The group’s objectives when managing capital are:
· To safeguard the group’s ability to continue as a going concern so that it can continue to provide returns for the share-holders and benefits for the other stakeholders.
· To maintain a strong capital base to support the current and future development needs of the business.· To comply with the capital requirements set by the Central Bank of Kenya.
Capital adequacy and use of regulatory capital are monitored by management employing techniques based on the guide-lines developed by the Central Bank of Kenya for supervisory purposes. The required information is filed with the Central Bank of Kenya on a monthly basis.
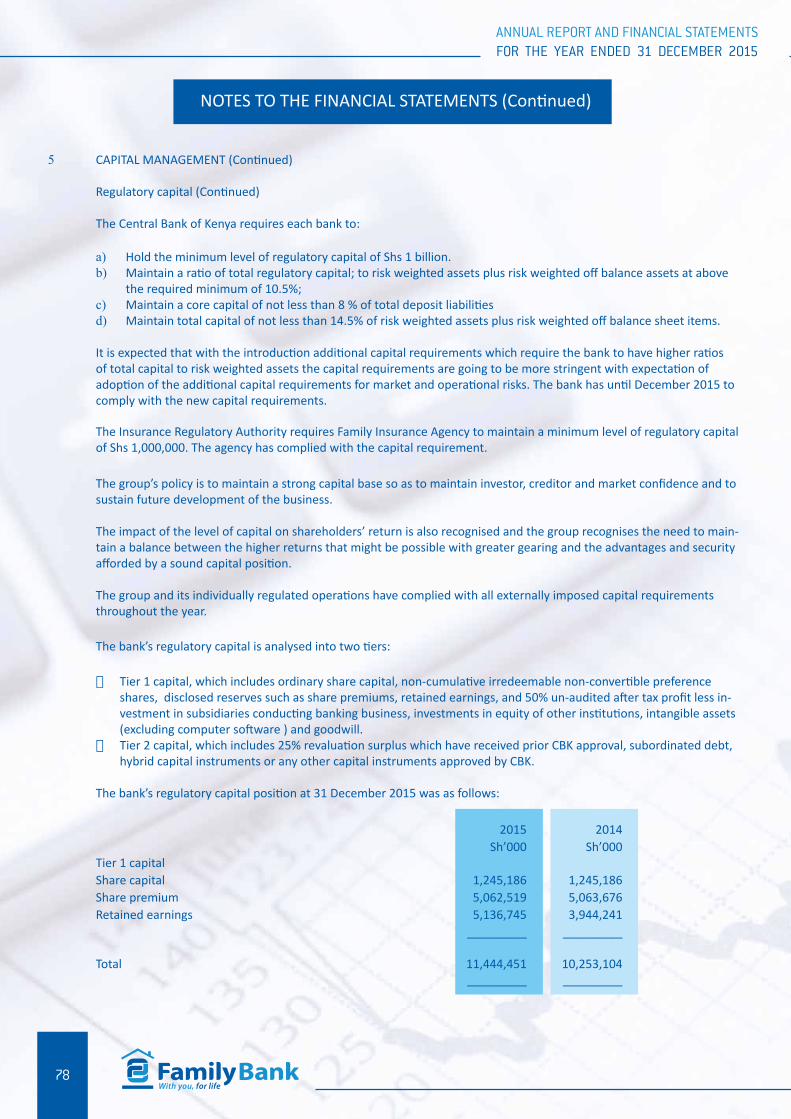
ANNUAL REPORT AND FINANCIAL STATEMENTSFOR THE YEAR ENDED 31 DECEMBER 2015
ANNUAL REPORT AND FINANCIAL STATEMENTSFOR THE YEAR ENDED 31 DECEMBER 2015
78
NOTES TO THE FINANCIAL STATEMENTS (Continued)
5 CAPITAL MANAGEMENT (Continued)
Regulatory capital (Continued)
The Central Bank of Kenya requires each bank to:
a) Hold the minimum level of regulatory capital of Shs 1 billion. b) Maintain a ratio of total regulatory capital; to risk weighted assets plus risk weighted off balance assets at above
the required minimum of 10.5%; c) Maintain a core capital of not less than 8 % of total deposit liabilities d) Maintain total capital of not less than 14.5% of risk weighted assets plus risk weighted off balance sheet items.
It is expected that with the introduction additional capital requirements which require the bank to have higher ratios of total capital to risk weighted assets the capital requirements are going to be more stringent with expectation of adoption of the additional capital requirements for market and operational risks. The bank has until December 2015 to comply with the new capital requirements.
The Insurance Regulatory Authority requires Family Insurance Agency to maintain a minimum level of regulatory capital of Shs 1,000,000. The agency has complied with the capital requirement.
The group’s policy is to maintain a strong capital base so as to maintain investor, creditor and market confidence and to sustain future development of the business.
The impact of the level of capital on shareholders’ return is also recognised and the group recognises the need to main-tain a balance between the higher returns that might be possible with greater gearing and the advantages and security afforded by a sound capital position.
The group and its individually regulated operations have complied with all externally imposed capital requirements throughout the year.
The bank’s regulatory capital is analysed into two tiers:
· Tier 1 capital, which includes ordinary share capital, non-cumulative irredeemable non-convertible preference shares, disclosed reserves such as share premiums, retained earnings, and 50% un-audited after tax profit less in-vestment in subsidiaries conducting banking business, investments in equity of other institutions, intangible assets (excluding computer software ) and goodwill.
· Tier 2 capital, which includes 25% revaluation surplus which have received prior CBK approval, subordinated debt, hybrid capital instruments or any other capital instruments approved by CBK.
The bank’s regulatory capital position at 31 December 2015 was as follows:
2015 2014 Sh’000 Sh’000
Tier 1 capitalShare capital 1,245,186 1,245,186 Share premium 5,062,519 5,063,676 Retained earnings 5,136,745 3,944,241
_________ _________
Total 11,444,451 10,253,104 _________ _________

ANNUAL REPORT AND FINANCIAL STATEMENTSFOR THE YEAR ENDED 31 DECEMBER 2015
ANNUAL REPORT AND FINANCIAL STATEMENTSFOR THE YEAR ENDED 31 DECEMBER 2015
79
NOTES TO THE FINANCIAL STATEMENTS (Continued)
5 CAPITAL MANAGEMENT (Continued)
Regulatory capital (Continued)
2015 2014 Sh’000 Sh’000
Tier 2 capitalRevaluation reserves (25%) 18,044 19,677 Term subordinated debt 2,018,000 -General loan loss provision (statutory reserve) 527,484 357,503 _________ _________
Total 2,563,528 377,180 _________ _________ Total regulatory capital 14,008,778 10,630,283 ======== ========
Risk-weighted assets 73,765,213 52,060,130 ======== ========
Capital ratios 2015 2014Total regulatory capital expressed as a percentage of total risk-weighted assets (CBK minimum 14.5%) 18.86% 20.26%
======== ========
Total tier 1 capital expressed as a percentage of risk-weighted assets (CBK minimum 10.5%) 15.5% 19.56%
======== ========
Group Bank
2015 2014 2015 2014
Sh’000 Sh’000 Sh’000 Sh’000
6 INTEREST INCOME
Interest on loans and advances 8,258,102 6,216,205 8,258,102 6,216,205
Interest on bank placements 764,346 243,377 764,346 243,377
Interest on held to maturity assets:
- government securities 742,962 520,445 742,962 520,445
- corporate bonds and commercial paper 222,218 134,846 222,218 134,846
Interest on available for sale assets
- government securities 44,686 6,703 44,686 6,703
_________ _________ _________ _________
10,032,314 7,121,576 10,032,314 7,121,576
========= ======== ========= ========
7 INTEREST EXPENSE
Interest on customer deposits 3,261,998 1,544,940 3,269,496 1,547,577
Interest on balances due to banks 45,908 11,213 45,908 11,213
Interest on borrowings 324,479 192,067 324,479 192,067
_________ _________ _________ _________
3,632,385 1,748,220 3,639,883 1,750,857
======== ======== ======== ========

ANNUAL REPORT AND FINANCIAL STATEMENTSFOR THE YEAR ENDED 31 DECEMBER 2015
ANNUAL REPORT AND FINANCIAL STATEMENTSFOR THE YEAR ENDED 31 DECEMBER 2015
80
NOTES TO THE FINANCIAL STATEMENTS (Continued)
Group Bank
2015 2014 2015 2014
Sh’000 Sh’000 Sh’000 Sh’000
8 FEE AND COMMISSION INCOME
Transaction related fees 1,498,220 1,572,996 1,498,220 1,572,996
Credit related fees and commissions 878,115 703,886 878,115 703,886
Ledger related fees and commissions 95,778 82,839 95,778 82,839
_________ _________ _________ _________
2,472,113 2,359,721 2,472,113 2,359,721
======== ======== ======== ========
9 OPERATING EXPENSES
Staff costs (note 10) 2,640,640 2,303,713 2,590,411 2,273,639
Directors’ emoluments - Fees 70,793 56,690 64,530 54,080
- Other 158,860 134,800 158,860 134,800
Depreciation – property and equipment556,230 371,932 555,008 371,360
Amortisation of intangible assets 96,286 90,277 95,946 90,022
Contribution to Deposit Protection Fund 62,746 44,954 62,746 44,954
Auditors’ remuneration 4,638 3,957 4,568 3,559
Amortisation of prepaid operating lease 4,610 4,610 4,610 4,610
Marketing expenses 168,898 144,297 167,430 143,262
Occupancy expenses 1,013,360 743,113 1,012,658 742,550
Other operating expenses 1,430,894 1,059,124 1,394,421 1,054,364
_________ _________ _________ _________
6,207,955 4,957,467 6,111,188 4,917,200
======== ======== ======== ========
10 STAFF COSTS
Salaries and wages 2,242,210 1,967,639 2,196,188 1,940,498
Training, recruitment and staff welfare costs 95,108 115,832 95,108 115,798
Contributions to defined contribution pension scheme132,151 81,901 132,151 81,727
Medical expenses 156,256 122,345 152,049 120,219
Leave pay provision 10,670 2,915 10,670 2,336
NSSF contributions 4,245 13,081 4,245 13,061
_________ _________ _________ __________
2,640,640 2,303,713 2,590,411 2,273,639
======== ========= ========= ========
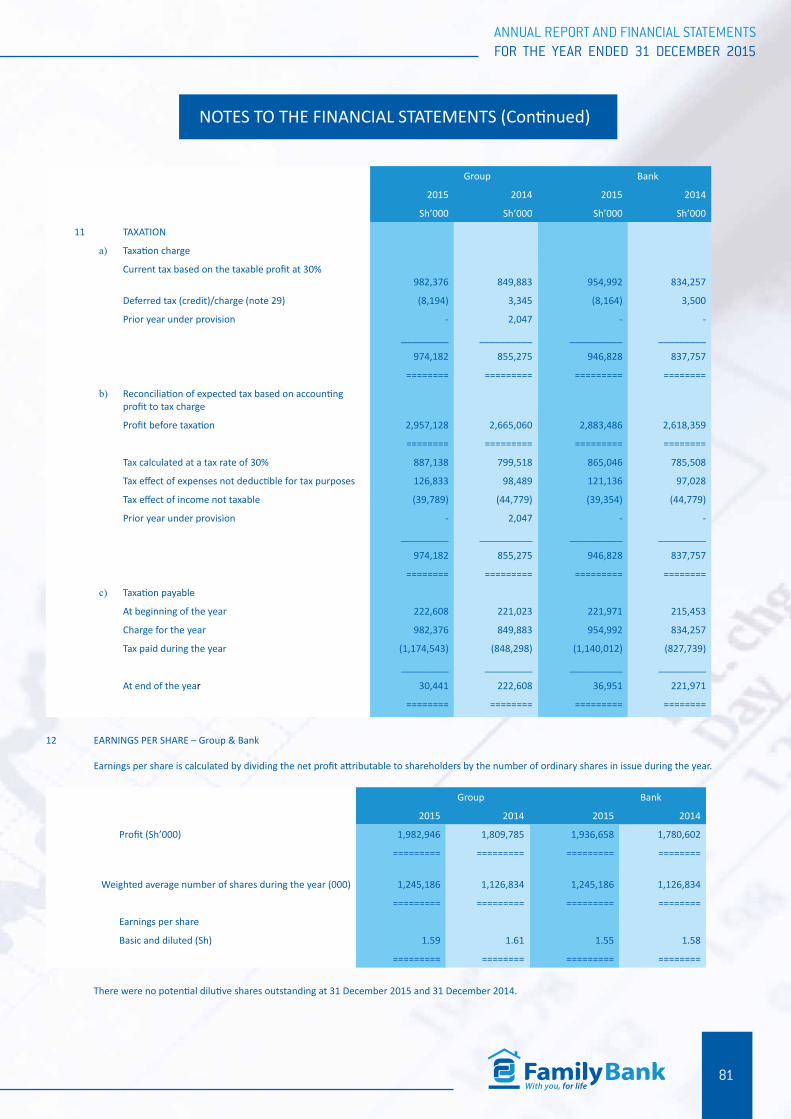
ANNUAL REPORT AND FINANCIAL STATEMENTSFOR THE YEAR ENDED 31 DECEMBER 2015
ANNUAL REPORT AND FINANCIAL STATEMENTSFOR THE YEAR ENDED 31 DECEMBER 2015
81
NOTES TO THE FINANCIAL STATEMENTS (Continued)
Group Bank
2015 2014 2015 2014
Sh’000 Sh’000 Sh’000 Sh’000
11 TAXATION
a) Taxation charge
Current tax based on the taxable profit at 30%982,376 849,883 954,992 834,257
Deferred tax (credit)/charge (note 29) (8,194) 3,345 (8,164) 3,500
Prior year under provision - 2,047 - -
_________ __________ __________ _________
974,182 855,275 946,828 837,757
======== ========= ========= ========
b) Reconciliation of expected tax based on accounting profit to tax charge
Profit before taxation 2,957,128 2,665,060 2,883,486 2,618,359
======== ========= ========= ========
Tax calculated at a tax rate of 30% 887,138 799,518 865,046 785,508
Tax effect of expenses not deductible for tax purposes 126,833 98,489 121,136 97,028
Tax effect of income not taxable (39,789) (44,779) (39,354) (44,779)
Prior year under provision - 2,047 - -
_________ __________ __________ _________
974,182 855,275 946,828 837,757
======== ========= ========= ========
c) Taxation payable
At beginning of the year 222,608 221,023 221,971 215,453
Charge for the year 982,376 849,883 954,992 834,257
Tax paid during the year (1,174,543) (848,298) (1,140,012) (827,739)
_________ _________ __________ _________
At end of the year 30,441 222,608 36,951 221,971
======== ======== ========= ========
12 EARNINGS PER SHARE – Group & Bank
Earnings per share is calculated by dividing the net profit attributable to shareholders by the number of ordinary shares in issue during the year.
Group Bank
2015 2014 2015 2014
Profit (Sh’000) 1,982,946 1,809,785 1,936,658 1,780,602
========= ========= ========= ========
Weighted average number of shares during the year (000) 1,245,186 1,126,834 1,245,186 1,126,834
========= ========= ========= ========
Earnings per share
Basic and diluted (Sh) 1.59 1.61 1.55 1.58
========= ======== ========= ========
There were no potential dilutive shares outstanding at 31 December 2015 and 31 December 2014.

ANNUAL REPORT AND FINANCIAL STATEMENTSFOR THE YEAR ENDED 31 DECEMBER 2015
ANNUAL REPORT AND FINANCIAL STATEMENTSFOR THE YEAR ENDED 31 DECEMBER 2015
82
NOTES TO THE FINANCIAL STATEMENTS (Continued)
2015 2014
Sh’000 Sh’000
13 CASH AND BALANCES WITH CENTRAL BANK OF KENYA – Group & Bank
Cash in hand 2,779,634 2,297,220
Balances with Central Bank of Kenya - cash ratio reserve 3,260,168 2,494,392
- other balances 127,290 740,999
__________ _________
6,167,092 5,532,611
========= ========
The cash ratio reserve is based on the value of customer deposits as adjusted by the Central Bank of Kenya requirements. As at 31 De-cember 2015 the cash ratio reserve requirement was 5.20% (2014 – 5.29%) of all customer deposits held by the group. These funds are not available to finance the group’s day to day operations.
14 BALANCES DUE FROM BANKING
INSTITUTIONS – Group & Bank
2015 2014
Sh’000 Sh’000
a) Balances due from banking institutions maturing within 90 days:
Overnight lending and placement with other banks 4,687,834 7,240,426
Balances due from local banking institutions 525 527
Balances due from foreign banking institutions 203,999 137,098
_________ _________
4,892,358 7,378,051
======== ========
b) Balances due to banking institutions maturing within 90 days:
Balances with local banks 131,643 209,291
======= ========
Deposits with/from local banks as at 31 December represent overnight lending. The effective interest rate on deposits due from local banking institutions at 31 December 2015 was 8.97 %( 2014 – 8.56%). The effective interest rate on deposits due to local banking institu-tions at 31 December 2015 was 7.59% (2014 – 6.68%).

ANNUAL REPORT AND FINANCIAL STATEMENTSFOR THE YEAR ENDED 31 DECEMBER 2015
ANNUAL REPORT AND FINANCIAL STATEMENTSFOR THE YEAR ENDED 31 DECEMBER 2015
83
NOTES TO THE FINANCIAL STATEMENTS (Continued)
Group Bank2015 2014 2015 2014
15 a) GOVERNMENT SECURITIES - HELD TO MATURITY Sh’000 Sh’000 Sh’000 Sh’000
Treasury bonds –at amortised cost 3,831,972 4,198,080 3,831,972 4,198,080
Treasury bills-face value less unearned discount 3,414,589 1,703,101 3,351,422 1,703,101
_________ ________ _________ _________
7,246,561 5,901,181 7,183,394 5,901,181
======== ======= ======== ========
The maturity profile of government securities is as follows:
Maturing within one year 3,705,423 1,773,380 3,642,256 1,773,380
Maturing between 2 to 5 years - 438,034 - 438,034
Maturing after 5 years 3,541,138 3,689,767 3,541,138 3,689,767
_________ ________ _________ _________
7,246,561 5,901,181 7,183,394 5,901,181
======== ======= ======== ========
The weighted average effective interest rate on treasury bonds at 31 December 2015 was 11.69% (2014 – 11.09%). The effective interest rate on treasury bills at 31 December 2015 was 8.66% (2014 - 10.61%).
As of 31st December 2015, no treasury bonds were pledged as collateral under repurchase agreements with the Central Bank of Kenya (2014 – Sh 760,000).
2015 2014
a) GOVERNMENT SECURITIES – AVAILABLE FOR SALE - Group & Bank
Sh’000 Sh’000
At January 150,000 -
Additions 300,000 150,000
Fair Value loss (6,778) -
_________ __________
443,222 150,000
======== ========
16 LOANS AND ADVANCES TO CUSTOMERS - Group & Bank
LOANS AND ADVANCES TO CUS-TOMERS - Group & Bank
a) Commercial loans 43,764,715 31,722,243
Overdrafts 2,420,763 1,600,885
Asset finance loans 9,393,251 4,235,077
Staff loans 1,814,323 1,699,218
_________ _________
Gross loans and advances to customers 57,393,052
39,257,423
Less: Impairment losses (note 17) (1,539,170) (1,331,947)
__________ __________
Net loans and advances to cus-tomers
55,853,882 37,925,476
========= =========
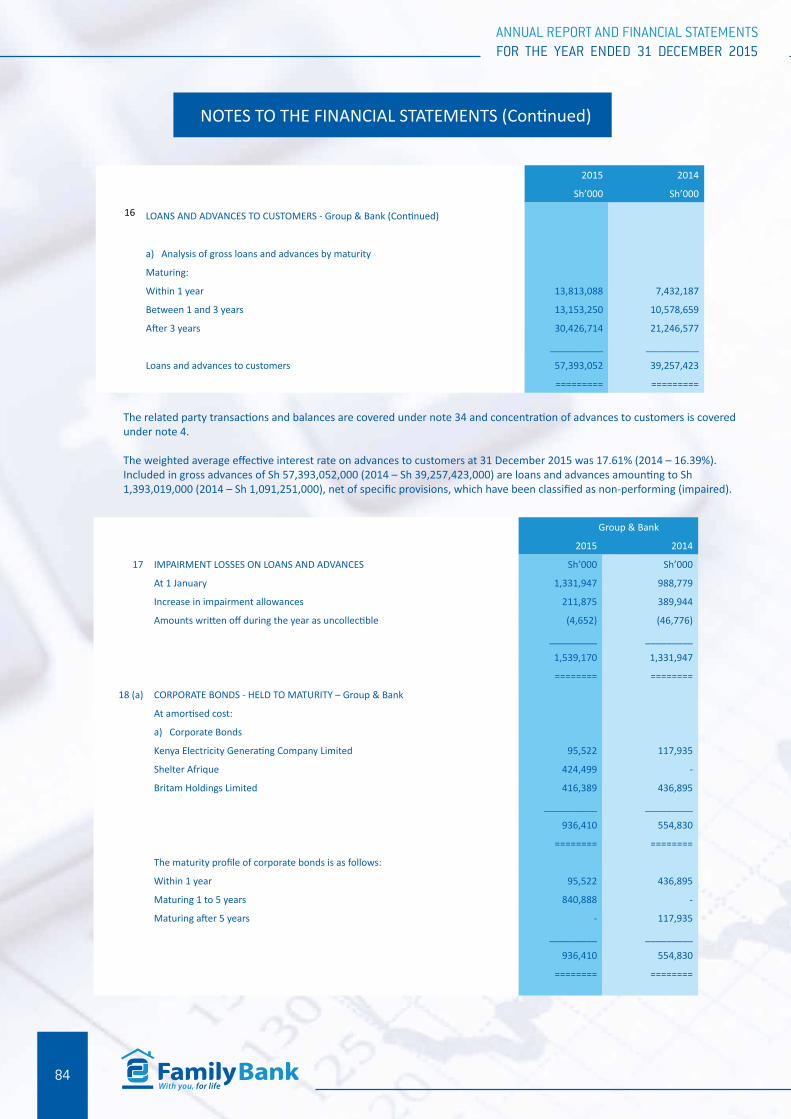
ANNUAL REPORT AND FINANCIAL STATEMENTSFOR THE YEAR ENDED 31 DECEMBER 2015
ANNUAL REPORT AND FINANCIAL STATEMENTSFOR THE YEAR ENDED 31 DECEMBER 2015
84
NOTES TO THE FINANCIAL STATEMENTS (Continued)
2015 2014
Sh’000 Sh’000
16 LOANS AND ADVANCES TO CUSTOMERS - Group & Bank (Continued)
a) Analysis of gross loans and advances by maturity
Maturing:
Within 1 year 13,813,088 7,432,187
Between 1 and 3 years 13,153,250 10,578,659
After 3 years 30,426,714 21,246,577
__________ __________
Loans and advances to customers 57,393,052 39,257,423
========= =========
The related party transactions and balances are covered under note 34 and concentration of advances to customers is covered under note 4.
The weighted average effective interest rate on advances to customers at 31 December 2015 was 17.61% (2014 – 16.39%).Included in gross advances of Sh 57,393,052,000 (2014 – Sh 39,257,423,000) are loans and advances amounting to Sh 1,393,019,000 (2014 – Sh 1,091,251,000), net of specific provisions, which have been classified as non-performing (impaired).
Group & Bank
2015 2014
17 IMPAIRMENT LOSSES ON LOANS AND ADVANCES Sh’000 Sh’000
At 1 January 1,331,947 988,779
Increase in impairment allowances 211,875 389,944
Amounts written off during the year as uncollectible (4,652) (46,776)
_________ _________
1,539,170 1,331,947
======== ========
18 (a) CORPORATE BONDS - HELD TO MATURITY – Group & Bank
At amortised cost:
a) Corporate Bonds
Kenya Electricity Generating Company Limited 95,522 117,935
Shelter Afrique 424,499 -
Britam Holdings Limited 416,389 436,895
__________ _________
936,410 554,830
======== ========
The maturity profile of corporate bonds is as follows:
Within 1 year 95,522 436,895
Maturing 1 to 5 years 840,888 -
Maturing after 5 years - 117,935
_________ _________
936,410 554,830
======== ========

ANNUAL REPORT AND FINANCIAL STATEMENTSFOR THE YEAR ENDED 31 DECEMBER 2015
ANNUAL REPORT AND FINANCIAL STATEMENTSFOR THE YEAR ENDED 31 DECEMBER 2015
85
NOTES TO THE FINANCIAL STATEMENTS (Continued)
2015 2014
Sh’000 Sh’000
18 (b) COMMERCIAL PAPER - HELD TO MATURITY – Group & Bank
Nakumatt Holdings Limited 100,000 500,000
ASL Credit Limited - 200,000
ARM Cement Limited 531,916 -
__________ _________
631,916 700,000
======== ========
The maturity profile of commercial papers is as follows:
Within 1 year 631,916 700,000
======== ========
The weighted average effective interest rate on corporate bonds at 31 December 2015 was 13.7% (2014 – 12.41%).
Group Bank
2015 2014 2015 2014
19 OTHER ASSETS Sh’000 Sh’000 Sh’000 Sh’000
Un-cleared items in the course of collection 51,393 148,271 51,393 148,271
Prepayments 853,633 202,799 853,633 202,799
Deposits for services 133,373 97,610 133,373 97,610
Other 308,194 552,875 286,676 534,122
_________ _________ __________ _________
1,346,593 1,001,555 1,325,075 982,802
======== ======== ========= ========
20 INVESTMENT IN SUBSIDIARY - Bank
No. of shares Holding
2015Sh’000
2014Sh’000
Family Insurance Agency Limited 1,000 100% 1,000 1,000
====== ======
The subsidiary is wholly owned Limited Liability Company incorporated and domiciled in Kenya. Dhamana Insurance Agency Limited was incorporated on 22 May 2014. The company received its licence to operate Insurance Agency/brokerage business on 30 December 2010 and started trading in 2010. The subsidiary acquired Family Insurance Brokers Limited on 31 July 2015 and changed its name to Family Insurance Agency Limited.
The principal activity of the company is insurance agency business.

ANNUAL REPORT AND FINANCIAL STATEMENTSFOR THE YEAR ENDED 31 DECEMBER 2015
ANNUAL REPORT AND FINANCIAL STATEMENTSFOR THE YEAR ENDED 31 DECEMBER 2015
86
NOTES TO THE FINANCIAL STATEMENTS (Continued)
20 INVESTMENT IN SUBSIDIARY – Bank (Continued)
Set out below is the summarised financial information for the subsidiary:
2015 2014
Summarised statement of financial position Sh’000 Sh’000
Total assets 119,491 71,957
Total liabilities 3,641 12,014
_________ ________
Net assets 115,850 59,943
======== =======
Summarised statement of profit and loss and other comprehensive income
Brokerage Commission 146,644 73,848
__________ __________
Profit before income tax 83,111 36,218
Taxation (27,204) (14,988)
__________ __________
Profit for the year 55,907 21,230
========= ========
Summarised statement of cash flows
Net cash generated from operating activities 44,847 19,737
Net cash used in investing activities (64,805) (2,696)
__________ _________
Net (decrease)/increase in cash and cash equivalents (19,958) 17,041
Cash and cash equivalents at beginning of year 49,945 32,904
__________ _________
Cash and cash equivalents at end of year 29,987 49,945
========= ========

ANNUAL REPORT AND FINANCIAL STATEMENTSFOR THE YEAR ENDED 31 DECEMBER 2015
ANNUAL REPORT AND FINANCIAL STATEMENTSFOR THE YEAR ENDED 31 DECEMBER 2015
87
NOTES TO THE FINANCIAL STATEMENTS (Continued)
2015 2014
Sh’000 Sh’000
21 a) INVESTMENT PROPERTIES – Group & Bank
At start of year 127,400 106,000
Disposal (4,200) (3,000)
Gain on revaluation - 24,400
To non-current assets held for sale (105,000) -
________ ________
At end of year 18,200 127,400
======= =======
b) NON-CURRENT ASSETS HELD FOR SALE – Group & Bank
At start of year - -
From Investment properties 105,000 -
Fair value loss (15,000) -
________ ________
At end of year 90,000 -
======= =======
Investment property relate to Leasehold land acquired at a cost of Shs 24,500,000 as part of the Group’s expansion plans and Lease hold land acquired at a cost of Shs 3,170,000 for national customer promotion raffle in 2015 part of the land at value of shs.7,200,000 was given out in Kunacha Mili na Acre promotion to the various winners. The properties were re-valued as at 31 December 2015 by M.S Kibui & Associates Valuers, registered valuers. Valuations for the properties were made on the basis of the open market value and the concept of highest and best use was used. The book values of the re-valued items were adjusted to the re-valued amounts and the resultant surplus was credited to profit and loss.
In accordance with IFRS 13, the fair value ranking of the Investment Property is at Level 2 as the fair value measurement is derived from inputs other than quoted prices that are observable for the asset or liability, either directly as prices or indirectly as derived from prices.
The industrial area property was transferred from investment property to assets held for sale as the bank had entered into a sale agreement and a deposit of Kshs 9 million had been received by the bank as at 31 December 2015.

ANNUAL REPORT AND FINANCIAL STATEMENTSFOR THE YEAR ENDED 31 DECEMBER 2015
ANNUAL REPORT AND FINANCIAL STATEMENTSFOR THE YEAR ENDED 31 DECEMBER 2015
88
NOTES TO THE FINANCIAL STATEMENTS (Continued)
22 PROPERTY AND EQUIPMENT – GROUP
Freehold land Buildings
Leasehold improve-ments Computer
Motor vehiclesFixtures, fittings and equipment
Total
COST/VALUATION Sh’000 Sh’000 Sh’000 Sh’000 Sh’000 Sh’000 Sh’000
At 1 January 2014 122,412 357,288 1,418,833 945,133 100,967 505,653 3,450,286
Additions - - 394,318 129,582 8,440 238,099 770,439
Write offs - - (6,373) (24,827) - (27,763) (58,963)
Disposal - - - - (3,530) - (3,530)
_______ _______ ________ ______ ______ _______ ________
At 31 December 2014 122,412 357,288 1,806,778 1,049,888 105,877 715,989 4,158,232
_______ _______ ________ _______ ______ _______ ________
122,412 357,288 1,806,778 1,049,888 105,877 715,989 4,158,232
Additions - - 535,790 860,603 52,406 269,536 1,718,335
Write offs - - (3,690) (195) - (51,694) (55,579)
Disposal - - (17,626) (2,555) (15,649) (6,668) (42,498)
_______ _______ ________ ______ ______ _______ ________
At 31 December 2015 122,412 357,288 2,321,252 1,907,741 142,634 927,163 5,778,490
_______ _______ ________ _______ ______ _______ ________
Comprising:
At cost 119,812 32,288 2,321,252 1,907,741 142,634 927,163 5,450,890
At valuation 2,600 325,000 - - - - 327,600
_______ _______ ________ ________ _______ _______ ________
At 31 December 2015 122,412 357,288 2,321,252 1,907,741 142,634 927,163 5,778,490
_______ _______ ________ ________ _______ _______ ________
DEPRECIATION
At 1 January 2014 - 16,317 710,161 709,411 49,868 258,908 1,744,665
Charge for the year - 8,932 171,909 107,613 16,924 66,554 371,932
Eliminated on disposal - - - - (3,530) - (3,530)
Write off - - - (21,254) - (16,680) (37,934)
_______ _______ _______ _______ _______ _______ ________
At 31 December 2014 - 25,249 882,070 795,770 63,262 308,782 2,075,133
_______ _______ _______ _______ _______ _______ ________
At 1 January 2015 - 25,249 882,070 795,770 63,262 308,782 2,075,133
Charge for the year - 8,932 212,099 224,374 23,648 87,176 556,229
Eliminated on disposal - - (8,976) (2,110) (14,855) (2,526) (28,467)
_______ _______ _______ _______ _______ _______ ________
At 31 December 2015 - 34,181 1,085,193 1,018,034 72,055 393,432 2,602,895
_______ _______ _______ _______ _______ _______ ________
NET BOOK VALUE – VALUATION BASIS
At 31 December 2015 122,412 323,106 1,236,059 889,710 70,578 533,730 3,175,595
======= ======= ======= ======= ======= ======== ========
At 31 December 2014 122,412 332,039 924,708 254,118 42,615 407,207 2,083,099
======= ======= ======= ======= ======= ======= ========
NET BOOK VALUE – COST BASIS
At 31 December 2015 119,812 214,991 1,236,059 889,710 70,578 533,730 3,064,880
======= ======= ======= ====== ====== ======== ========
At 31 December 2014 119,812 221,743 924,708 254,118 42,615 407,207 1,970,203
======= ======= ======= ====== ====== ======== ========
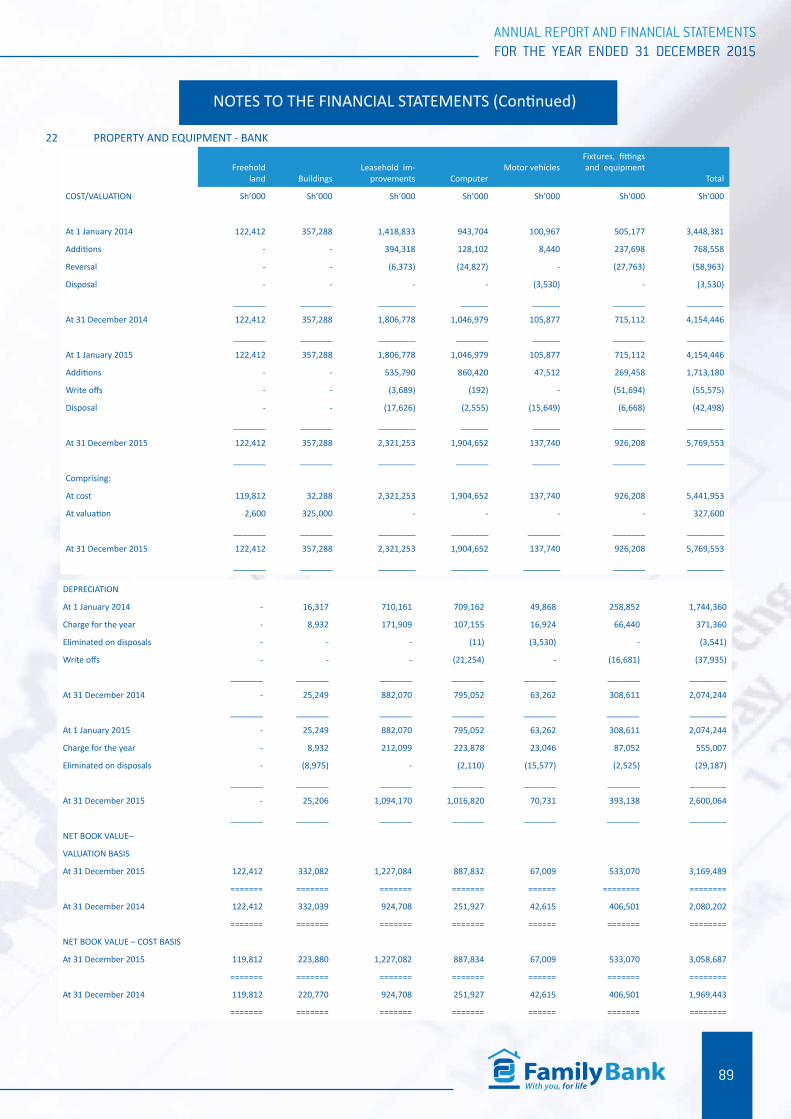
ANNUAL REPORT AND FINANCIAL STATEMENTSFOR THE YEAR ENDED 31 DECEMBER 2015
ANNUAL REPORT AND FINANCIAL STATEMENTSFOR THE YEAR ENDED 31 DECEMBER 2015
89
NOTES TO THE FINANCIAL STATEMENTS (Continued)
22 PROPERTY AND EQUIPMENT - BANK
Freehold land Buildings
Leasehold im-provements Computer
Motor vehiclesFixtures, fittings and equipment
Total
COST/VALUATION Sh’000 Sh’000 Sh’000 Sh’000 Sh’000 Sh’000 Sh’000
At 1 January 2014 122,412 357,288 1,418,833 943,704 100,967 505,177 3,448,381
Additions - - 394,318 128,102 8,440 237,698 768,558
Reversal - - (6,373) (24,827) - (27,763) (58,963)
Disposal - - - - (3,530) - (3,530)
_______ _______ ________ ______ ______ _______ ________
At 31 December 2014 122,412 357,288 1,806,778 1,046,979 105,877 715,112 4,154,446
_______ _______ ________ _______ ______ _______ ________
At 1 January 2015 122,412 357,288 1,806,778 1,046,979 105,877 715,112 4,154,446
Additions - - 535,790 860,420 47,512 269,458 1,713,180
Write offs - - (3,689) (192) - (51,694) (55,575)
Disposal - - (17,626) (2,555) (15,649) (6,668) (42,498)
_______ _______ ________ ______ ______ _______ ________
At 31 December 2015 122,412 357,288 2,321,253 1,904,652 137,740 926,208 5,769,553
_______ _______ ________ _______ ______ _______ ________
Comprising:
At cost 119,812 32,288 2,321,253 1,904,652 137,740 926,208 5,441,953
At valuation 2,600 325,000 - - - - 327,600
_______ _______ ________ ________ _______ _______ ________
At 31 December 2015 122,412 357,288 2,321,253 1,904,652 137,740 926,208 5,769,553
_______ _______ ________ ________ ________ _______ ________
DEPRECIATION
At 1 January 2014 - 16,317 710,161 709,162 49,868 258,852 1,744,360
Charge for the year - 8,932 171,909 107,155 16,924 66,440 371,360
Eliminated on disposals - - - (11) (3,530) - (3,541)
Write offs - - - (21,254) - (16,681) (37,935)
_______ _______ _______ _______ _______ _______ ________
At 31 December 2014 - 25,249 882,070 795,052 63,262 308,611 2,074,244
_______ _______ _______ _______ _______ _______ ________
At 1 January 2015 - 25,249 882,070 795,052 63,262 308,611 2,074,244
Charge for the year - 8,932 212,099 223,878 23,046 87,052 555,007
Eliminated on disposals - (8,975) - (2,110) (15,577) (2,525) (29,187)
_______ _______ _______ _______ _______ _______ ________
At 31 December 2015 - 25,206 1,094,170 1,016,820 70,731 393,138 2,600,064
_______ _______ _______ _______ _______ _______ ________
NET BOOK VALUE–
VALUATION BASIS
At 31 December 2015 122,412 332,082 1,227,084 887,832 67,009 533,070 3,169,489
======= ======= ======= ======= ====== ======== ========
At 31 December 2014 122,412 332,039 924,708 251,927 42,615 406,501 2,080,202
======= ======= ======= ======= ====== ======= ========
NET BOOK VALUE – COST BASIS
At 31 December 2015 119,812 223,880 1,227,082 887,834 67,009 533,070 3,058,687
======= ======= ======= ======= ====== ======= ========
At 31 December 2014 119,812 220,770 924,708 251,927 42,615 406,501 1,969,443
======= ======= ======= ======= ====== ======= ========

ANNUAL REPORT AND FINANCIAL STATEMENTSFOR THE YEAR ENDED 31 DECEMBER 2015
ANNUAL REPORT AND FINANCIAL STATEMENTSFOR THE YEAR ENDED 31 DECEMBER 2015
90
NOTES TO THE FINANCIAL STATEMENTS (Continued)
22 PROPERTY AND EQUIPMENT – BANK (Continued)
The properties were re-valued as at 31 December 2011 by Ebony Estate Valuers Limited, Registered valuers. Valuations for the properties were made on the basis of the open market value.
In accordance with IFRS 13, the fair value ranking of the buildings is at Level 2 as the fair value measurement is derived from inputs other than quoted prices included within Level 1 that are observable for the asset or liability, either directly as prices or indirectly as derived from prices.
Group Bank
23 INTANGIBLE ASSETS – COMPUTER SOFTWARE 2015 2014 2015 2014
Sh’000 Sh’000 Sh’000 Sh’000
COST
At 1 January 735,203 655,518 733,857 655,518
Additions 97,466 86,030 97,041 84,715
Write offs - (6,346) - (6,376)
__________ _________ _________ _________
At 31 December 832,669 735,202 830,898 733,857
__________ _________ _________ _________
AMORTISATION
At 1 January 417,582 327,305 417,327 327,305
Charge for the year 96,286 90,277 95,946 90,022
__________ _________ _________ _________
At 31 December 513,868 417,582 513,273 417,327
__________ _________ ________ _________
NET BOOK VALUE
At 31 December 318,801 317,620 317,625 316,530
======== ======== ======== ========
24 PREPAID OPERATING LEASE RENTALS – Group & Bank Sh’000 Sh’000
Leasehold land:
COST
At 1 January and 31 December 180,335 180,335
________ ________
AMORTISATION
At 1 January 17,755 13,145
Charge for the year 4,611 4,610
________ ________
At 31 December 22,366 17,755
________ ________
NET BOOK VALUE
At 31 December 157,969 162,580
======= =======

ANNUAL REPORT AND FINANCIAL STATEMENTSFOR THE YEAR ENDED 31 DECEMBER 2015
ANNUAL REPORT AND FINANCIAL STATEMENTSFOR THE YEAR ENDED 31 DECEMBER 2015
91
NOTES TO THE FINANCIAL STATEMENTS (Continued)
Group Bank
2015 2014 2015 2014
Sh’000 Sh’000 Sh’000 Sh’000
25 CUSTOMER DEPOSITS
Current and demand accounts 31,218,004 27,017,203 31,219,555 27,017,558
Savings accounts 2,782,404 2,113,262 2,782,404 2,113,262
Fixed deposit accounts 28,710,451 18,006,015 28,728,908 18,055,605
_________ __________ __________ __________
62,710,859 47,136,480 62,730,867 47,186,425
======== ========= ========= =========
MATURITY ANALYSIS OF CUSTOMER DEPOSITS
Repayable:
On demand 31,218,004 27,017,203 31,219,555 27,017,558
Within one year 31,492,855 20,119,277 31,511,312 20,168,867
_________ __________ __________ _________
62,710,859 47,136,480 62,730,867 47,186,425
======== ========= ========= ========
The weighted average effective interest rate on interest bearing customer deposits at 31 December 2015 was 9 % (2014 – 7.63%). The related party transactions and balances are covered under note 34 and concentration of customers’ deposits is covered under note 4.
2015 2014
26 BORROWINGS – Group & Bank Sh’000 Sh’000
a) Analysis
EIB 2,425,990 2,386,009
OIKO Credit 1,016,526 -
PTA Loan 2(USD) - 381,976
Kenya ICT Board – Pasha loan 124,420 121,050
Waste_Finish Ink 10,864 11,300
_________ ________
3,577,800 2,900,335
Subordinated Corporate Bond 2,073,945 -
Upfront Fees (64,025) -
_________ _________
5,587,720 2,900,335
======== ========
b) Movement:
b) At beginning of the year 2,900,335 1,343,811
Received in the year 3,018,800 2,331,920
Accrued interest 180,412 77,718
Repaid in the year (511,827) (853,114)
_________ _________
5,587,720 2,900,335
======== ========

ANNUAL REPORT AND FINANCIAL STATEMENTSFOR THE YEAR ENDED 31 DECEMBER 2015
ANNUAL REPORT AND FINANCIAL STATEMENTSFOR THE YEAR ENDED 31 DECEMBER 2015
92
NOTES TO THE FINANCIAL STATEMENTS (Continued)
26 BORROWINGS – Group & Bank (Continued)
Facilities:
EIB loan is a long term, unsecured floating rate and fixed arte facility which is denominated in EURO, USD and KES. The EURO and USD loans are repayable within 5 years while the KES loans are repayable within 7 years. The interest rate charged for a non KES tranche is based on margin of 1.85. For KES Tranche a margin per annum fixed for the life of the relevant tranche, equal to 1.85% plus a currency risk premium determined in accordance with the following table is charged.
Tenor of the Tranche ( years) Currency risk premium p.a
4 years 5.5%
5 years 6.0%
6 years 6.5%
7 years 7.0%
PTA loan 2 Sh loan is a long term facility, repayable within 5 years. The interest rate charged is 12.5% p.a. The loan was received in November 2015 and matures in 2018.
The Kenya ICT Board - Pasha Loan is a credit from the International Development Authority advanced to the Kenya Information and Communication Technology for the purposes of developing the digital villages program. Family Bank is charged with managing the disbursements of the loans.
The Oiko loan is credit from Oiko Credit for the purpose of targeting financial intervention in sanitation and hygieneThe interest charged is 10.4% on a reducing balance basis it will be repaid in 6 annual instalments of Shs 166,666,667.
The Finish Ink Loan is a fund delegated to Family Bank Ltd by Finish Ink for the funding of various sanitation projects in Kenya. Family Bank Limited does not pay any interest on these funds. Expenses incurred in respect to this fund are offset off the fund amount.
The EIB loan is a long term facility repayable in 6.5 years .The interest rate charged is 9.78% p.a. The loan repayments are due on the 10th of July and 10th of January of every year. The principal amount of the loan is to be paid commencing 10th July 2016.
During the year, Family Bank issued a multicurrency medium term note and listed it on the Nairobi Securities Exchange , Fixed Income Segment on 26th October 2015.The par value accepted by the bank from investors was Shs 2 billion while the amount received was 1.895 billion. The fixed rate portion was issued at a discount of 122 million .The term of the bond is 5.5 years. The interest rates for the three categories available to the investors were;-
· Fixed rate bond 13.75%· Mixed rate bond 14% · Floating rate bond .Referenced 182 day treasury bill rate subject to a floor of 12.5% and a cap of 17.5%
The effective interest rates for the various loans are as follows:
2015 2014
% %
EIB 9 9
OIKO Credit 10.4 8
PTA Loan 2(USD) 8 8
Kenya ICT Board – Pasha loan 4 4
Waste Finish ink - -
Subordinated Corporate Bond 15 -
==== =====
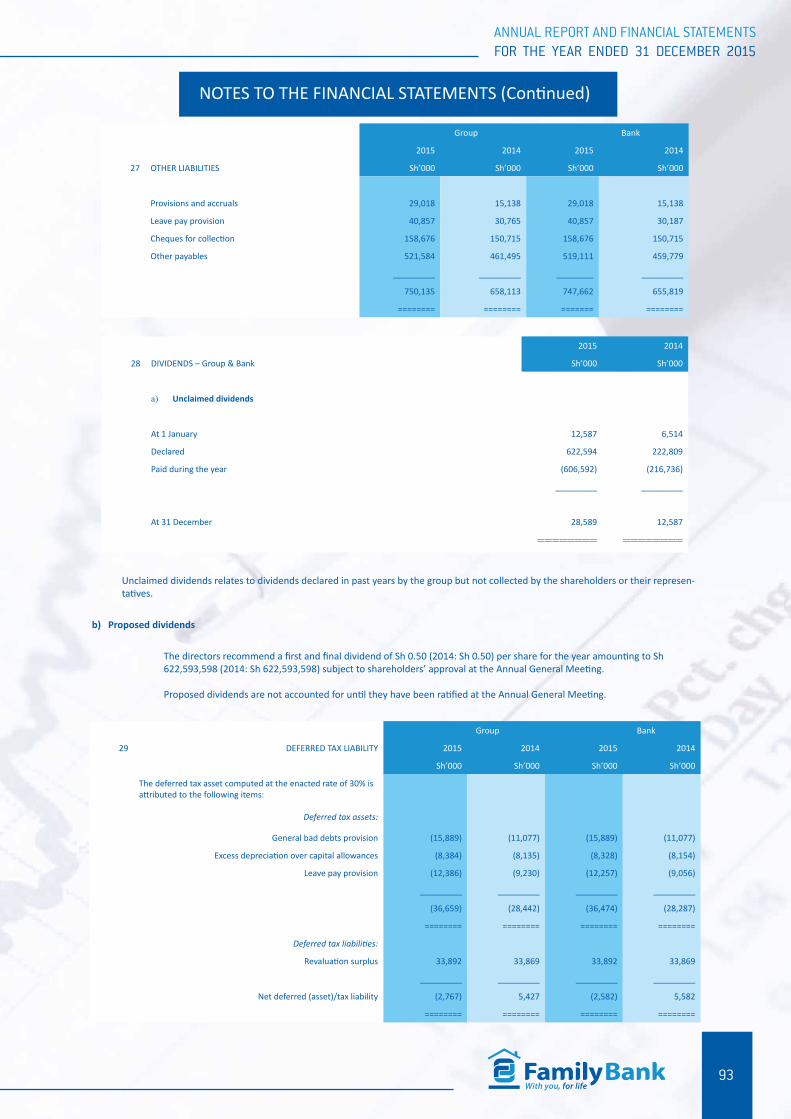
ANNUAL REPORT AND FINANCIAL STATEMENTSFOR THE YEAR ENDED 31 DECEMBER 2015
ANNUAL REPORT AND FINANCIAL STATEMENTSFOR THE YEAR ENDED 31 DECEMBER 2015
93
NOTES TO THE FINANCIAL STATEMENTS (Continued)
Group Bank
2015 2014 2015 2014
27 OTHER LIABILITIES Sh’000 Sh’000 Sh’000 Sh’000
Provisions and accruals 29,018 15,138 29,018 15,138
Leave pay provision 40,857 30,765 40,857 30,187
Cheques for collection 158,676 150,715 158,676 150,715
Other payables 521,584 461,495 519,111 459,779
_________ _________ ________ _________
750,135 658,113 747,662 655,819
======== ======== ======= ========
2015 2014
28 DIVIDENDS – Group & Bank Sh’000 Sh’000
a) Unclaimed dividends
At 1 January 12,587 6,514
Declared 622,594 222,809
Paid during the year (606,592) (216,736)
_________ _________
At 31 December 28,589 12,587
======== ========
Unclaimed dividends relates to dividends declared in past years by the group but not collected by the shareholders or their represen-tatives.
b) Proposed dividends
The directors recommend a first and final dividend of Sh 0.50 (2014: Sh 0.50) per share for the year amounting to Sh 622,593,598 (2014: Sh 622,593,598) subject to shareholders’ approval at the Annual General Meeting.
Proposed dividends are not accounted for until they have been ratified at the Annual General Meeting.
Group Bank
29 DEFERRED TAX LIABILITY 2015 2014 2015 2014
Sh’000 Sh’000 Sh’000 Sh’000
The deferred tax asset computed at the enacted rate of 30% is attributed to the following items:
Deferred tax assets:
General bad debts provision (15,889) (11,077) (15,889) (11,077)
Excess depreciation over capital allowances (8,384) (8,135) (8,328) (8,154)
Leave pay provision (12,386) (9,230) (12,257) (9,056)
_________ _________ _________ _________
(36,659) (28,442) (36,474) (28,287)
======== ======== ======== ========
Deferred tax liabilities:
Revaluation surplus 33,892 33,869 33,892 33,869
_________ _________ _________ _________
Net deferred (asset)/tax liability (2,767) 5,427 (2,582) 5,582
======== ======== ======== ========

ANNUAL REPORT AND FINANCIAL STATEMENTSFOR THE YEAR ENDED 31 DECEMBER 2015
ANNUAL REPORT AND FINANCIAL STATEMENTSFOR THE YEAR ENDED 31 DECEMBER 2015
94
NOTES TO THE FINANCIAL STATEMENTS (Continued)
29 DEFERRED TAX LIABILITY -Group & Bank (Continued) Group Bank
Movement in deferred tax liability is as follows: 2015 2014 2015 2014
Sh’000 Sh’000 Sh’000 Sh’000
At 1 January 5,427 2,082 5,582 2,082
Charge/(credit) to profit or loss (note 11) (8,194) 3,345 (8,164) 3,500
__________ _________ _________ _________
At 31 December (2,767) 5,427 (2,582) 5,582
========= ======== ======== ========
2015 2014
30 SHARE CAPITAL Sh’000 Sh’000
Authorised:
1,500,000,000 ordinary shares of Sh 1 each (2014:750,000,000 ordinary shares of Sh 2 each)
1,500,000 1,500,000
========= ========
Issued and fully paid:
1,245,187,196 (2014: 1,245,187,196) ordinary shares of Sh 1 each 1,245,186 1,245,186
========= ========
Movement in issued and fully paid shares
Number of shares
Share CapitalSh ‘000
Share PremiumSh ‘000
TotalSh’000
At 1 January 2014 557,023,364 1,114,046 2,100,251 3,214,297
New shares 5,570,234 11,140 111,406 122,546
__________ ________ ________ ________
562,593,598 1,125,186 2,211,657 3,336,843
__________ ________ ________ ________
Share split 1,125,187,196 1,125,186 2,211,657 3,336,843
Rights issued in the year 120,000,000 120,000 2,880,000 3,000,000
Rights issue costs* - - (27,981) (27,981)
___________ ________ ________ ________
At 31 December 2014 1,245,187,196 1,245,186 5,063,676 6,308,862
========== ======= ======= =======
At 1 January 2015 1,245,187,196 1,245,186 5,063,676 6,308,862
Rights issue costs - - (1,157) (1,157)
___________ ________ ________ ________
At 31 December 2015 1,245,187,196 1,245,186 5,062,519 6,307,705
========== ======= ======= =======
In 2014, the Group increased its capital by 3,094,563,000 through the rights issue of 120,000,000 shares at Sh 25 and issue of 5,570,234 new shares to the chairman. In addition the bank did as share split of 1:1 ratio translating to 562,593,598 shares. The share premium is net off rights issue costs of Sh 27,981,000.

ANNUAL REPORT AND FINANCIAL STATEMENTSFOR THE YEAR ENDED 31 DECEMBER 2015
ANNUAL REPORT AND FINANCIAL STATEMENTSFOR THE YEAR ENDED 31 DECEMBER 2015
95
NOTES TO THE FINANCIAL STATEMENTS (Continued)
2015 2014
31 NOTES TO THE STATEMENT OF CASH FLOWS Sh’000 Sh’000
(a) Reconciliation of profit before taxation to cash used in operations
Profit before taxation 2,957,128 2,665,060Adjustments for:Depreciation of property and equipment 556,230 371,932 Amortisation of intangible assets 96,286 90,277 Amortisation of leasehold land 4,611 4,610 Loss on disposal of equipment 44,398 27,375 Loss/(gain) on revaluation of investment property 15,000 (24,400) Accrued interest on borrowings 180,412 77,718
Working capital changes
Changes in working capital items:Cash ratio balance (765,776) (711,329) Loans and advances to customers (17,928,406) (9,982,116) Other assets (345,038) (517,016) Customer deposits 15,574,379 12,553,893 Other liabilities 92,022 (255,442) Government securities (1,638,602) (1,254,722) Corporate bonds and commercial paper (313,496) (666,418)
_________ _________
Cash (used in)/generated from operations (1,470,852) 2,379,422 ======== ========
(b) Analysis of the balances of cash and cash equivalentsas shown in the statement of financial position and notes
Cash in hand (note 13) 2,779,634 2,297,220 Balances with the Central Bank of Kenya (note13) 127,290 740,999 Balances with other banking institutions 4,892,358 7,378,051 Balances due to other banking institutions (131,643) (209,291) _________ _________
7,667,639 10,206,979 ======== ========
For the purpose of the statement of cash flows, cash and cash equivalents comprise balances with less than three months’ maturity from the date of acquisition, including cash in hand, deposits held at call with banks and other short term highly liquid investments with original maturities of three months or below, less advances from banks repayable within three months from the dates of the advances.

ANNUAL REPORT AND FINANCIAL STATEMENTSFOR THE YEAR ENDED 31 DECEMBER 2015
ANNUAL REPORT AND FINANCIAL STATEMENTSFOR THE YEAR ENDED 31 DECEMBER 2015
96
NOTES TO THE FINANCIAL STATEMENTS (Continued)
32. OPERATING SEGMENTS
For management purposes, the Bank is organised into two main operating segments based on products and services as follows:
i) Retail Banking: Includes loans deposits and other transactions and balances with retail customers;ii) Wholesale Banking: Includes loans deposits and other transactions and balances with corporate and institutional customers.
Management monitors the operating results of its business units separately for the purpose of making decisions about resource allocation and perfor-mance assessment. Segment performance is evaluated based on operating profit or loss. Income taxes are managed on a group basis and are not allo-cated to operating segments. The Group’s segment operations are all financial with a majority of revenues deriving from interest. The management relies primarily on net interest revenue to assess the performance of the segment. Interest income is reported net as management primarily relies on net interest revenue as a performance measure, not gross income and expenses. No revenue from transactions with a single external customer or counterparty amounted to 10% or more of the Bank’s total revenue in 2015 or 2014.
The following table presents income and profit and certain asset and liability information regarding the Group’s operating segements,
Profit or loss for the year ended 31 December 2015
Whole sale banking Retail banking Other Total
Sh’000 Sh’000 Sh’000 Sh’000
Net interest income 2,556,973 3,835,459 - 6,392,431
Other income 1,125,647 1,688,471 170,409 2,984,527
__________ _________ _________ _________
Operating income 3,682,620 5,523,930 170,409 9,376,958
__________ _________ _________ ________
Depreciation and amortisation (222,003) (333,005) (1,560) (556,568)
Other Operating Expenses (2,256,569) (3,393,819) (295,986) (5,946,374)
Share of Profit Subsidiary - - 83,111 83,111
________ _________ _________ ________
Profit before tax 1,204,048 1,797,106 (44,026) 2,957,128
============= ============= ============== =============
Profit or loss for the year ended 31 December 2014
Net interest income 2,148,287 3,222,431 - 5,370,718
Other income 1,021,914 1,532,871 86,968 2,641,753
__________ _________ _________ _________
Operating income 3,170,201 4,755,302 86,968 8,012,471
__________ _________ _________ ________
Depreciation &Amortisation (148,544) (222,816) (827) (372,186)
Other Operating Expenses (1,834,112) (2,751,167) (426,163) (5,011,443)
Share of Profit Subsidiary - - 36,218 36,218
_________ _________ _________ ________
Profit before tax 1,187,545 1,781,319 (303,804) 2,665,060
============= ============= =============== ============

ANNUAL REPORT AND FINANCIAL STATEMENTSFOR THE YEAR ENDED 31 DECEMBER 2015
ANNUAL REPORT AND FINANCIAL STATEMENTSFOR THE YEAR ENDED 31 DECEMBER 2015
97
NOTES TO THE FINANCIAL STATEMENTS (Continued)
32. OPERATING SEGMENTS (Continued)
Statement of financial position as at 31 December 2015
Whole sale banking
Retail banking Other Total
Sh’000 Sh’000 Sh’000 Sh’000
Assets
Segment assets 32,475,071 48,705,380 - 81,180,451
Un-allocated assets - - 100,915 100,915
__________ _________ _________ _________
Total Assets 32,475,071 48,705,380 100,915 81,281,366
__________ _________ _________ ________
Liabilities and equity:
Segment Liabilities 32,521,150 48,774,498 - 81,295,648
Un-allocated Liabilities - - (14,282) (14,282)
Inter-segment lending (46,079) (69,118) 115,197 -
__________ _________ _________ ________
Total liabilities and equity 32,475,071 48,705,380 100,915 81,281,366
============= ============= =============== ============
Other Disclosures
Capital Expenditure 724,088 905,110 181,022 1,810,220
======== ======= ======== =======
Statement of financial position as at 31 December 2014
Whole sale banking
Retail banking Other Total
Sh’000 Sh’000 Sh’000 Sh’000
Assets
Segment assets 24,725,065 37,087,598 - 61,812,663
Un-allocated assets - - 21,740 21,740
__________ _________ _________ _________
Total Assets 24,725,065 37,087,598 21,740 61,834,403
__________ _________ _________ _________
Liabilities and equity:
Segment Liabilities 24,752,629 37,128,943 - 61,881,572
Un-allocated Liabilities - - (47,169) (47,169)
Inter-segment lending (27,564) (41,345) 68,909 -
__________ _________ _________ _________
Total liabilities and equity 24,725,065 37,087,598 21,740 61,834,403
============== ============= ============== =============
Other Disclosures
Capital Expenditure 342,588 428,235 85,647 856,469
======== ======= ======== =======
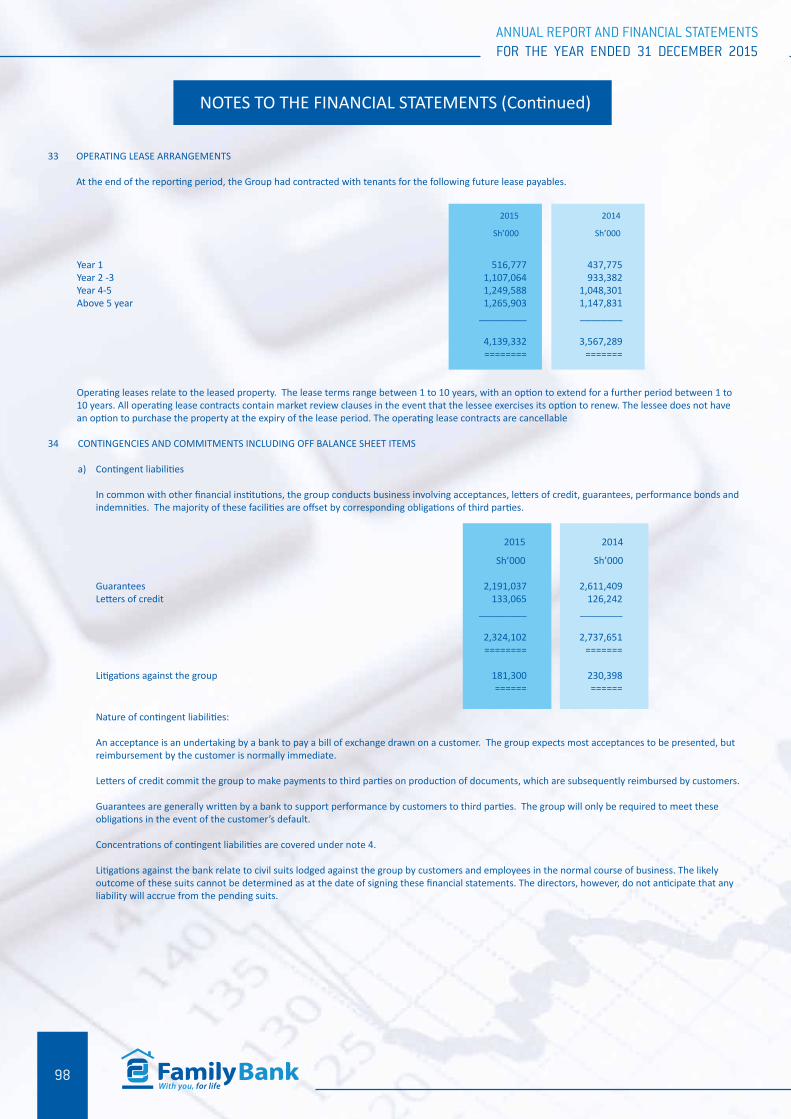
ANNUAL REPORT AND FINANCIAL STATEMENTSFOR THE YEAR ENDED 31 DECEMBER 2015
ANNUAL REPORT AND FINANCIAL STATEMENTSFOR THE YEAR ENDED 31 DECEMBER 2015
98
NOTES TO THE FINANCIAL STATEMENTS (Continued)
33 OPERATING LEASE ARRANGEMENTS
At the end of the reporting period, the Group had contracted with tenants for the following future lease payables.
2015 2014
Sh’000 Sh’000
Year 1 516,777 437,775Year 2 -3 1,107,064 933,382Year 4-5 1,249,588 1,048,301Above 5 year 1,265,903 1,147,831
_________ ________
4,139,332 3,567,289 ======== =======
Operating leases relate to the leased property. The lease terms range between 1 to 10 years, with an option to extend for a further period between 1 to 10 years. All operating lease contracts contain market review clauses in the event that the lessee exercises its option to renew. The lessee does not have an option to purchase the property at the expiry of the lease period. The operating lease contracts are cancellable
34 CONTINGENCIES AND COMMITMENTS INCLUDING OFF BALANCE SHEET ITEMS
a) Contingent liabilities
In common with other financial institutions, the group conducts business involving acceptances, letters of credit, guarantees, performance bonds and indemnities. The majority of these facilities are offset by corresponding obligations of third parties.
2015 2014
Sh’000 Sh’000 Guarantees 2,191,037 2,611,409 Letters of credit 133,065 126,242 _________ ________
2,324,102 2,737,651 ======== =======
Litigations against the group 181,300 230,398 ====== ======
Nature of contingent liabilities:
An acceptance is an undertaking by a bank to pay a bill of exchange drawn on a customer. The group expects most acceptances to be presented, but reimbursement by the customer is normally immediate.
Letters of credit commit the group to make payments to third parties on production of documents, which are subsequently reimbursed by customers.
Guarantees are generally written by a bank to support performance by customers to third parties. The group will only be required to meet these obligations in the event of the customer’s default.
Concentrations of contingent liabilities are covered under note 4.
Litigations against the bank relate to civil suits lodged against the group by customers and employees in the normal course of business. The likely outcome of these suits cannot be determined as at the date of signing these financial statements. The directors, however, do not anticipate that any liability will accrue from the pending suits.

ANNUAL REPORT AND FINANCIAL STATEMENTSFOR THE YEAR ENDED 31 DECEMBER 2015
ANNUAL REPORT AND FINANCIAL STATEMENTSFOR THE YEAR ENDED 31 DECEMBER 2015
99
NOTES TO THE FINANCIAL STATEMENTS (Continued)
34 CONTINGENCIES AND COMMITMENTS INCLUDING OFF BALANCE SHEET ITEMS (Continued)
2015 2014
Sh’000 Sh’000
b) Commitments to extend credit
Undrawn formal stand-by facilities, credit lines andother commitments to lend 6,504,694 2,932,581 ======= ========
Commitments to extend credit are agreements to lend to a customer in future subject to certain conditions. Such commitments are normally made for a fixed period. The group may withdraw from its contractual obligation to extend credit by giving reasonable notice to the customer.
2015 2014
Sh’000 Sh’000c) Capital commitments
Authorised and contracted for 654,399 168,472 ====== =======Authorised but not contracted for 272,000 655,000 ====== =======
The authorised but not contracted for capital commitments relate to the branch set up costs amounting to Sh.167 million for 6 proposed branches and planned renovations/expansion of 6 already existing branches amounting to Sh.105 Million.
35 RELATED PARTY TRANSACTIONS
Parties are considered to be related if one party has the ability to control the other party or exercise significant influence over the other party in mak-ing financial or operational decisions.Placings are made in the group by directors, their associates and companies associated to directors. Advances to customers at 31 December 2015 include advances and loans to companies associated with the directors. Contingent liabilities at 31 December 2015 include guarantees and letters of credit for companies associated with the directors.
2015 2014
Movement in related party balances was as follows: Sh’000 Sh’000
Loans and advances:At 1 January 2,306,912 1,775,987 Advanced during the year 1,046,205 782,455 Interest earned 338,461 224,482 Repaid during the year (574,237) (476,012) ________ ________
At 31 December 3,117,341 2,306,912 ======= ========
As at 31 December 2015 loans and advances to staff amounted to Ksh 1,849,722,000 (2014 – Sh 1,643,962,000. The loans and advances to related parties are performing and adequately secured.
2015 2014
Key management compensation Sh’000 Sh’000
The remuneration of directors and other members of key management during the year were as follows:
Salaries and other benefits 104,350 80,002 Directors’ emoluments 229,652 191,490 ________ _______
334,002 271,492 ======= ======

ANNUAL REPORT AND FINANCIAL STATEMENTSFOR THE YEAR ENDED 31 DECEMBER 2015
ANNUAL REPORT AND FINANCIAL STATEMENTSFOR THE YEAR ENDED 31 DECEMBER 2015
100
NOTES TO THE FINANCIAL STATEMENTS (Continued)
36 EVENTS SUBSEQUENT TO YEAR END
There were no material subsequent events after the reporting date requiring disclosure in these financial statements as at the date of the financial
statements approval.
37 INCORPORATION
The group is domiciled and incorporated in Kenya under the Companies Act.
37 CURRENCY
These financial statements are prepared in Kenya shillings thousands (Sh’000) which is the group’s functional and presentation currency.

ANNUAL REPORT AND FINANCIAL STATEMENTSFOR THE YEAR ENDED 31 DECEMBER 2015
ANNUAL REPORT AND FINANCIAL STATEMENTSFOR THE YEAR ENDED 31 DECEMBER 2015
101
Shareholder’s Share Account No. ....................................................................
The Company SecretaryFamily Bank LimitedFamily Bank Towers, 8th Floor, Muindi Mbingu StreetP.O Box 74145-00200Nairobi
PROXY FORM
I/We ................................................................................................................................. of P.O Box ................................................................
.being a shareholder(s) of Family Bank Limited, appoint ......................................................................................................................
of P.O. Box ................................................................................................... and failing him/her,the chairman of the meeting to be
my/our proxy, to vote on my/our behalf at the Annual General meeting of the Bank to be held on Friday, 22nd April
2016 at 10.00 am at Kenyatta International Conference Centre, Lenana and AberdareRoomsand at any adjournment thereof.
This form is to be used in favor or against the resolution and unless otherwise instructed the proxy will vote as he/she deems fi t.
As witnessed by my/our hand this .............................................................. day of ............................................... 2016
Signed ................................................................................. Signed ....................................................................................
ID No ................................................................................... ID No ......................................................................................
NOTES
1. A member who is unable to attend the meeting is entitled to appoint a proxy to attend and vote on his or her behalf.
2. A proxy need not be a member.
3. In the case of a corporate body, the proxy must be under its common seal or underthe hand of an offi cer or attorney duly authorized in writing.
4. Joint account holders must state their joint names and sign according to their signing mandates.
5. The proxy must be delivered to the bank’s registered offi ce not less than forty eight hours before the time for holding the meeting or adjourned meeting, failing which it will be invalid.
Shareholder’s Admission Form
Please complete this form and note that it must be produced at the Annual General Meeting by you or your proxy for admission.
Name .................................................................................................................. ID Number ...............................................................
Shareholder’s Account No ........................................................................... Signature ..................................................................

ANNUAL REPORT AND FINANCIAL STATEMENTSFOR THE YEAR ENDED 31 DECEMBER 2015
ANNUAL REPORT AND FINANCIAL STATEMENTSFOR THE YEAR ENDED 31 DECEMBER 2015
102
NotesNotes

ANNUAL REPORT AND FINANCIAL STATEMENTSFOR THE YEAR ENDED 31 DECEMBER 2015
ANNUAL REPORT AND FINANCIAL STATEMENTSFOR THE YEAR ENDED 31 DECEMBER 2015
103
NotesNotes

ANNUAL REPORT AND FINANCIAL STATEMENTSFOR THE YEAR ENDED 31 DECEMBER 2015
ANNUAL REPORT AND FINANCIAL STATEMENTSFOR THE YEAR ENDED 31 DECEMBER 2015
104
Notes

ANNUAL REPORT AND FINANCIAL STATEMENTSFOR THE YEAR ENDED 31 DECEMBER 2015
ANNUAL REPORT AND FINANCIAL STATEMENTSFOR THE YEAR ENDED 31 DECEMBER 2015
105
BRANCH NAME NUMBERS
KIAMBU 726610434
GITHUNGURI 726610473
SONALUX 724255733, 0728802389 ,0705951759
GATUNDU 726610469 ,0719233148
THIKA 0724255735,0727324470, ,07284110518
MURANGA 724255732
KANGARI 727220045
KIRIA-INI 0726 610 439
KANGEMA 726610476
OTHAYA 719390122
KENYATTA AVENUE 0752 240259, 0724 255731
CARGEN 0738544097, 0724255740
LAPTRUST 0707818153/0717129817
CITY HALL 713771906/0713771908
KASARANI 708086235/0716212650
NAKURU FINANCE 712202679/0724255737
NAKURU MARKET 0724 255739/0703225095
DAGORETTI 715363848
KERICHO 715364284/0708541006
NYAHURURU 712076034/0705807063
RUIRU 713026158/0700366841
KISUMU RELIANCE 0726610477/0706948886
NYAMIRA 727531028
KISII 0719390124 /0719233167
KISUMU AL-MIRAN 0715363859/ 0708199839
NAROK 702830989/0702830890
INDUSRIAL AREA 719397047/0713771875
DONHOLM 710602290
UTAWALA 0702214912/0702314930
FBT-RETAIL 726610472
OL-KALOU 0708569533/0708569494
KTDA RETAIL 0726610435/0726610433/0703974352
KARIOBANGI 710602292/0703759672
GIKOMBA 42 707391858
GIKOMBA 0727531150/0770175019
GITHURAI 0711 481 036/0725 011 900
KILIMANI 717724877
LIMURU 0726610438/0714186773
WESTLANDS 715363849/0736166371
KAGWE 0715-364262
BRANCH NAME NUMBERS
BANANA 715363814/ 0715023829
NAIVASHA 719233159/0719397038
NYERI 0716 316 163
KARATINA 0737146570/0716507097
KERUGOYA 726610475
TOM MBOYA 0719397045/0734650265
RIVER ROAD 0714631652 /0715363817
KAYOLE 0701968696/0724329751
NKUBU 0714822956/0715363850
MERU 0710901406/0713600850
NANYUKI 700753232/0719233157
KTDA-CORP 0726610435/0726610433/0703974352
ONGATA RONGAI 700753234/0700753218
KAJIADO 725449447/0725449525
FBT-CORP 072285672/0772251218/0726610432
NGARA 719397049
KITENGELA 0719397046/0706614406
KITUI 0715364248/0703582299
MACHAKOS 0702764022/0727531029
UTAWALA 0702214875/0702214886
EMBU 0724255736/0705948758
MWEA 0706669818/0706669794
BUNGOMA 726610478
KAKAMEGA 702830937
BUSIA 712076019
MUMIAS 0705639525/0702282615
ELDORET WEST 0703669366/0714027094
MOLO 705375748
BOMET 713772282/0713771916
ELDORET MAIN 0716 383853/0701 010851
LITEIN 706670075/0706669670
UKUNDA 0718129905/0718129979
DIGO 0702830985/0702830987
KITALE 0726610467/0702282235
MTWAPA 716224124
MOMBASA NKRUMAH 0726610436/0700802057
MOMBASA KENYATTA AVENUE 0710602293/0737526487
KAPSABET 728607750
MALINDI 0718129900/0718129973
KIKUYU 0707677619/0725449451
Notes
Branches

ANNUAL REPORT AND FINANCIAL STATEMENTSFOR THE YEAR ENDED 31 DECEMBER 2015
ANNUAL REPORT AND FINANCIAL STATEMENTSFOR THE YEAR ENDED 31 DECEMBER 2015
106
Annual REPORT
FINANCIAL STATEMENTS&
Family Bank Towers, 6th Floor, Muindi Mbingu StreetP.O. Box 74145 - 00200, Nairobi, KenyaTel: 254-2-3252 445/0703 095 445
Email: [email protected] Website: www.familybank.co.ke