Embed Size (px)
Citation preview
2 0 1 5 A n n u a l R e p o r t
Glatfelter is a global supplier of specialty papers and fiber-based engineered
materials, offering innovation, world-class service and over a century and a half
of technical expertise. Headquartered in York, PA, the company employs over
4,300 people and serves customers in over 100 countries. U.S. operations include
facilities in Pennsylvania and Ohio. International operations include facilities in
Canada, Germany, France, the United Kingdom and the Philippines, and sales and
distribution offices in China and Russia. Glatfelter’s sales approximate $1.7 billion
annually and its common stock is traded on the New York Stock Exchange under the
ticker symbol GLT. Additional information may be found at www.glatfelter.com.
FORWARD-LOOKING STATEMENTS
Certain statements made in this annual report which pertain to future financial and business performance and conditions and other financial
and business matters are “forward-looking statements” within the meaning of the safe harbor provisions of the United States Private
Securities Litigation Reform Act of 1995. These statements are based on management’s current expectations and are subject to numerous
risks, uncertainties and other unpredictable or uncontrollable factors which may cause actual results or performance to differ materially from
the Company’s expectations. Some of the risks, uncertainties and other factors that could cause actual results to differ materially from those
expressed in the forward-looking statements are detailed on page 16 of the accompanying 2015 Annual Report on Form 10-K included
herein and in other filings with the SEC.

1
As Glatfelter entered 2015, we knew that success in a
volatile world economy would demand adaptation and
focused execution. As the year unfolded, we encountered
significant macro-level headwinds that made it difficult
to meet our own and investors’ expectations. A weaker
euro, lower product pricing, the ongoing decline of
the uncoated free sheet market, and geopolitical and
economic issues in Russia/Ukraine combined to restrain
our performance.
In response, Glatfelter PEOPLE remained true to our
strategy of driving growth in our global, fiber-based
engineered materials businesses. We pursued operational
excellence and continuous improvement practices to
reduce costs, improve safety, and better serve customer
needs. A set of aggressive actions was initiated that
helped mitigate the effects of our macro-level challenges.
• $31 million of total cost reductions were achieved,
including a 3.1% workforce reduction, exceeding our
target range.
• Volumes grew in core segments such as tea,
single-serve coffee, technical specialties, and wipes.
• Feminine hygiene shipments increased in the
second half of the year.
• Specialty Papers outperformed the uncoated free
sheet market for the 11th consecutive year.
In addition, Glatfelter PEOPLE achieved another
companywide safety record. We are now approaching
industry top-quartile performance and have the
opportunity to become a safety leader.
During the year, our balance sheet strengthened
as we carefully managed working capital and capital
spending. Higher cash flow supported investments in
compliance-related environmental projects, process
improvement, and growth initiatives. Net debt was
reduced by $46 million, and our dividend was increased
for the third year in a row.
But our many accomplishments were unable
to offset the full impact of the macro-level headwinds.
Adjusted annual earnings in 2015 were down 14%
from the previous year, which impacted our share
price performance.
Dante C. Parrini Chairman and Chief Executive Officer
LOOKING AHEAD
As we look forward to 2016, it’s clear we will
continue to operate in a dynamic global economy.
Glatfelter will leverage the core competencies that have
underpinned our progress and fueled our past success.
• Our close relationships with blue-chip customers
have created binding partnerships that give us leading
positions in global growth markets. Forged over
decades, Glatfelter’s value proposition of providing
premium-quality, value-adding products and services
has engendered loyalty and trust that Glatfelter is their
supplier of choice.
• Our new business development capabilities have
spawned clearly differentiated products that embrace
innovation and specialization to fulfill customer needs.
For example, specialty wipes increased shipments by 44%
over 2014, leveraging an exciting new growth market.
• The scale and diversity of our engineered
materials assets and technical know-how, coupled with
our consistency of service, give global customers the
assurance that Glatfelter will support their needs and
solve their most challenging problems.
D E A R F E L L O W S H A R E H O L D E R S
UNITED STATES SECURITIES AND EXCHANGE COMMISSIONWASHINGTON, D.C. 20549
FORM 10-KÍ Annual report pursuant to Section 13 or 15(d) of the Securities Exchange Act of 1934
For the fiscal year ended December 31, 2015or
‘ Transition Report Pursuant to Section 13 or 15(d) of the Securities Exchange Act of 1934For the transition period from to
96 South George Street, Suite 520York, Pennsylvania 17401
(Address of principal executive offices)
(717) 225-4711(Registrant’s telephone number, including area code)
Commission file numberExact name of registrant as
specified in its charterIRS Employer
Identification No.State or other jurisdiction ofincorporation or organization
1-03560 P. H. Glatfelter Company 23-0628360 Pennsylvania
Securities registered pursuant to Section 12(b) of the Act:Title of Each Class Name of Each Exchange on which registered
Common Stock, par value $.01 per share New York Stock Exchange
Indicate by check mark if the registrant is a well-known seasoned issuer, as defined in Rule 405 of the Securities Act. Yes ‘ No Í.
Indicate by check mark if the registrant is not required to file reports pursuant to Section 13 or Section 15(d) of the Act. Yes ‘ No Í.
Indicate by check mark whether the registrant (1) has filed all reports required to be filed by Section 13 or 15(d) of the Securities Exchange Act of 1934during the preceding 12 months (or for such shorter period that the registrant was required to file such reports) and (2) has been subject to such filingrequirements for the past 90 days. Yes Í No ‘.
Indicate by check mark whether the registrant has submitted electronically and posted on its corporate Web site, if any, every Interactive Data Filerequired to be submitted and posted pursuant to Rule 405 of Regulation S-T during the preceding 12 months (or for such shorter period that theregistrant was required to submit and post such files). Yes Í No ‘.
Indicate by check mark if disclosure of delinquent filers pursuant to Item 405 of Regulation S-K is not contained herein, and will not be contained, tothe best of registrant’s knowledge, in definitive proxy or information statements incorporated by reference in Part III of this Form 10-K or anyamendment to this Form 10-K. ‘
Indicate by check mark whether the registrant is a large accelerated filer, an accelerated filer, a non-accelerated filer, or a small reporting company. Seethe definitions of “large accelerated filer”, “accelerated filer” and “smaller reporting company” in Rule 12b-2 of the Exchange Act. Í Largeaccelerated filer ‘ Accelerated filer ‘ Non-accelerated filer ‘ Small reporting company (Do not check if a smaller reporting company).
Indicate by check mark whether the registrant is a shell company (as defined in Rule 12b-2 of the Exchange Act) Yes ‘ No Í.
Based on the closing price as of June 30, 2015, the aggregate market value of the Common Stock of the Registrant held by non-affiliates was$940.3 million.
Common Stock outstanding on February 23, 2016 totaled 43,442,171 shares.
DOCUMENTS INCORPORATED BY REFERENCE
Portions of the following documents are incorporated by reference in this Annual Report on Form 10-K:
Portions of the registrant’s Proxy Statement to be dated on or about March 31, 2016 are incorporated by reference into Part III.

P. H. GLATFELTER COMPANYANNUAL REPORT ON FORM 10-K
For the Year Ended
DECEMBER 31, 2015Table of Contents
Page
PART IItem 1 Business 1Item 1A Risk Factors 7Item 1B Unresolved Staff Comments 12Item 2 Properties 12Item 3 Legal Proceedings 13
Executive Officers 13Item 4 Mine Safety Disclosures 14
PART IIItem 5 Market for Registrant’s Common Equity,
Related Stockholder Matters and IssuerPurchases of Equity Securities 14Common Stock Prices and Dividends
Declared Information 14Stock Performance Graph 14
Item 6 Selected Financial Data 15Item 7 Management’s Discussion and Analysis of
Financial Condition and Results ofOperations 16Results of Operations 17Liquidity and Capital Resources 25
Critical Accounting Policies and Estimates 28Item 7A Quantitative and Qualitative Disclosures
about Market Risk 29Item 8 Financial Statements and Supplementary
Data 30Report of Independent Registered Public
Accountants 31Statements of Income 33Statements of Comprehensive Income 34Balance Sheets 35Statements of Cash Flows 36Statements of Shareholders’ Equity 37Notes to Consolidated Financial Statements1. Organization 382. Accounting Policies 383. Acquisitions 404. Energy and Related Sales,
Net 415. Gain on Dispositions of Plant,
Equipment andTimberlands 42
6. Asset Impairment Charges 427. Earnings Per Share 428. Accumulated Other
Comprehensive Income 439. Income Taxes 4410. Stock-Based Compensation 4611. Retirement Plans and Other
Post-Retirement Benefits 47
Page
12. Inventories 5013. Plant, Equipment and
Timberlands 5014. Goodwill and Intangible
Assets 5015. Other Long-Term Assets 5016. Other Current Liabilities 5117. Long-Term Debt 5118. Asset Retirement Obligation 5219. Fair Value of Financial
Instruments 5320. Financial Derivatives and
Hedging Activities 5321. Shareholders’ Equity 5422. Share Repurchases 5523. Commitments, Contingencies
and Legal Proceedings 5524. Segment and Geographic
Information 5925. Condensed Consolidating
Financial Statements 6226. Quarterly Results (Unaudited) 66
Item 9 Changes in and Disagreements WithAccountants on Accounting and FinancialDisclosures 67
Item 9A Controls and Procedures 67Item 9B Other Information 67
PART IIIItem 10 Directors, Executive Officers and Corporate
Governance 67Item 11 Executive Compensation 67Item 12 Security Ownership of Certain Beneficial
Owners and Management and RelatedStockholder Matters 67
Item 13 Certain Relationships and RelatedTransactions, and Director Independence 67
Item 14 Principal Accountant Fees and Services 67
PART IVItem 15 Exhibits, Financial Statement Schedules 68
Signatures 71
Schedule II 73

PART I
P. H. Glatfelter Company makes regular filings withthe Securities and Exchange Commission (“SEC”),including this Annual Report on Form 10-K, as well asQuarterly Reports on Form 10-Q and Current Reports onForm 8-K. These filings are available, free of charge, on ourwebsite, www.glatfelter.com, and the SEC’s website atwww.sec.gov. We also provide copies of our SEC filings atno charge upon request to Investor Relations at (717) 225-2719, [email protected], or by mail to Investor Relations,96 South George Street, Suite 520, York, PA, 17401. Inthis filing, unless the context indicates otherwise, the terms“we,” “us,” “our,” “the Company,” or “Glatfelter” referto P. H. Glatfelter Company and subsidiaries.
ITEM 1 BUSINESS
Overview Glatfelter began operations in 1864,and we believe we are one of the world’s leadingmanufacturers of specialty papers and fiber-basedengineered materials. Headquartered in York,Pennsylvania, we own and operate manufacturing facilitiesin Pennsylvania, Ohio, Canada, Germany, the UnitedKingdom, France, and the Philippines and we have salesand distribution offices in Russia and China.
Acquisitions Over the past several years, we havecompleted a number of acquisitions that have diversifiedour revenue, expanded our geographic footprint andenhanced our asset base. The most recent transactionsinclude the April 2013, $211 million acquisition of DresdenPapier GmbH (“Dresden”) and the October 2014, $8.0million acquisition of Spezialpapierfabrik OberschmittenGmbH (“SPO”). Dresden is a leading supplier of nonwovenwall covering products with annual revenues ofapproximately $160 million in the year of acquisition. SPOis a producer of highly technical papers for a wide range ofelectrical applications with annual sales of approximately$33 million. Both of these businesses operate within ourComposite Fibers business unit.
Products Our three business units manufactureand distribute a wide array of specialty papers and fiber-based engineered materials including:
• Composite Fibers with revenue from the sale ofsingle-serve tea and coffee filtration papers,nonwoven wall covering materials, metallizedpapers, composite laminates papers, and manytechnically special papers including substrates forelectrical applications;
• Advanced Airlaid Materials with revenue fromthe sale of airlaid nonwoven fabric-like materialsused in feminine hygiene and adult incontinenceproducts, wipes, and other airlaid applications;and
• Specialty Papers with revenue from the sale ofpapers for carbonless and other forms, envelopes,book publishing, and engineered products such aspapers for high-speed ink jet printing, officespecialty products, greeting cards, packaging,casting, release, transfer, playing card, postal,FDA-compliant food and beverage applications,and other niche specialty applications.
The global growth markets served by the CompositeFibers and Advanced Airlaid Materials business units arecharacterized by attractive growth rates as the result ofemerging products and markets, changing end-userpreferences and evolving demographics. Specialty Papersserves more mature market segments, many of which arein decline.
As a result of our strategy to diversify sources ofrevenue and invest in growth businesses, revenuegenerated from Composite Fibers and Advanced AirlaidMaterials is expected to represent an increasingly greaterproportion of total revenue. Combined, these two businessunits comprised 47% of our total net sales in 2015compared with 30% in 2006.
Consolidated net sales and the relative net salescontribution of each of our business units for the pastthree years are summarized below:
Dollars in thousands 2015 2014 2013
Net sales $1,661,084 $1,802,415 $1,722,615Business unit
contributionComposite Fibers 32.6% 34.3% 32.9%Advanced Airlaid
Materials 14.7 15.6 15.6Specialty Papers 52.7 50.1 51.5
Total 100.0% 100.0% 100.0%
Strategy Our strategy is focused on growingrevenues, organically and by acquisition, in our key globalgrowth markets including single-serve coffee and tea,nonwoven wall covering materials, electrical products,hygiene and wipes products, and other technical materials.We partner with leading consumer product companies andother market leaders to provide innovative products withoutstanding performance to meet market requirements.Over the past several years, we have made investments toincrease production capacity and improve our technicalcapabilities to ensure we are best positioned to serve the
GLATFELTER 2015 FORM 10-K 1
market demands and grow our revenue. This includes a$50 million investment in 2013 to expand capacity andimprove inclined wire paper machine capabilities inComposite Fibers. We are committed to growing in our keymarkets and expect to make additional investments tosupport our customers and satisfy market demands.Consistent with this strategy, in December 2015, weannounced plans to invest approximately $80 million tobuild a new advanced airlaid facility in the southern U.S. toservice the North America market. Production at the newfacility is expected to start in two years with an annualcapacity of approximately 22,000 short tons, increasingour total global airlaid materials capacity to approximately129,000 short tons.
New product development and new businessdevelopment is a critical component of our businessstrategy requiring a focus on product innovation. During2015, 2014 and 2013, we invested $10.4 million, $12.3million and $12.2 million, respectively, in new productdevelopment activities. In each of the past three years, inexcess of 50% of net sales were generated from productsdeveloped, enhanced or improved within the past fiveyears.
In addition, our business strategy includes expandingproduct margins driven by cost reduction and continuousimprovement initiatives, generating strong and reliable freecash flows and making strategic investments designed toimprove our returns on invested capital.
And finally, the strength of our balance sheet andcash flow profile has allowed us to pursue strategic actionssuch as the Dresden and SPO acquisitions. Our acquisitionstrategy complements our long-term strategy of drivinggrowth in core and adjacent markets. Since 2006, we havesuccessfully completed six acquisitions demonstrating ourability to establish leading market positions through thesuccessful acquisition and integration of complementarybusinesses.
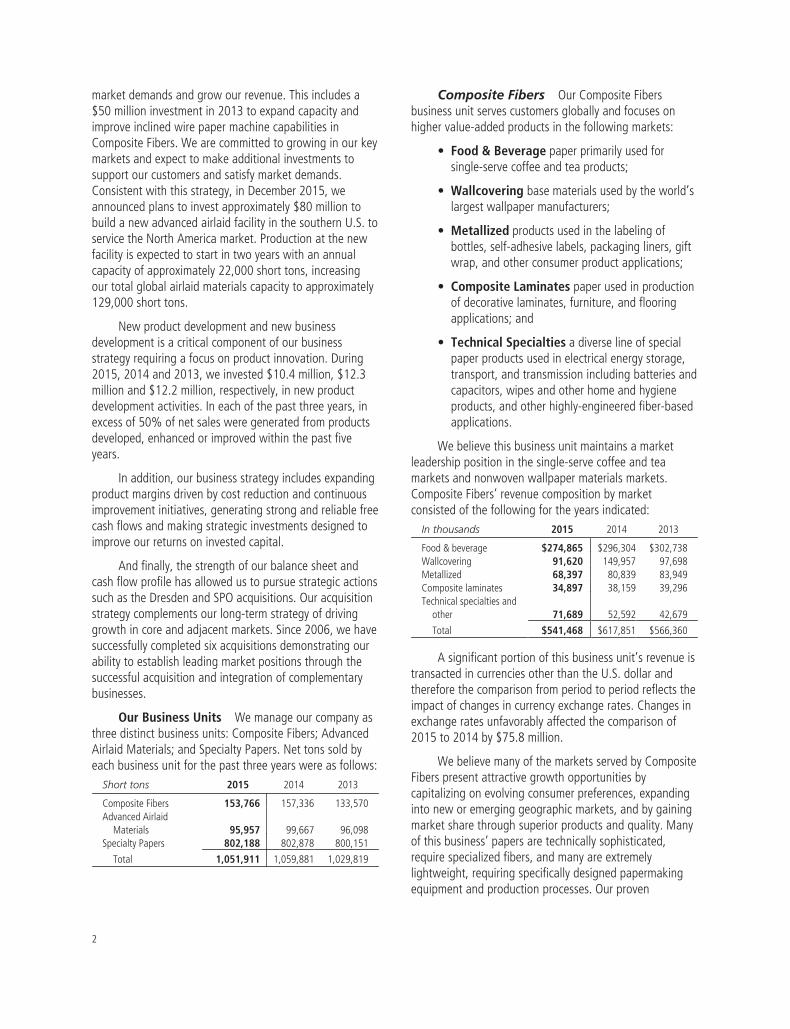
Our Business Units We manage our company asthree distinct business units: Composite Fibers; AdvancedAirlaid Materials; and Specialty Papers. Net tons sold byeach business unit for the past three years were as follows:
Short tons 2015 2014 2013
Composite Fibers 153,766 157,336 133,570Advanced Airlaid
Materials 95,957 99,667 96,098Specialty Papers 802,188 802,878 800,151
Total 1,051,911 1,059,881 1,029,819
Composite Fibers Our Composite Fibersbusiness unit serves customers globally and focuses onhigher value-added products in the following markets:
• Food & Beverage paper primarily used forsingle-serve coffee and tea products;
• Wallcovering base materials used by the world’slargest wallpaper manufacturers;
• Metallized products used in the labeling ofbottles, self-adhesive labels, packaging liners, giftwrap, and other consumer product applications;
• Composite Laminates paper used in productionof decorative laminates, furniture, and flooringapplications; and
• Technical Specialties a diverse line of specialpaper products used in electrical energy storage,transport, and transmission including batteries andcapacitors, wipes and other home and hygieneproducts, and other highly-engineered fiber-basedapplications.
We believe this business unit maintains a marketleadership position in the single-serve coffee and teamarkets and nonwoven wallpaper materials markets.Composite Fibers’ revenue composition by marketconsisted of the following for the years indicated:
In thousands 2015 2014 2013
Food & beverage $274,865 $296,304 $302,738Wallcovering 91,620 149,957 97,698Metallized 68,397 80,839 83,949Composite laminates 34,897 38,159 39,296Technical specialties and
other 71,689 52,592 42,679
Total $541,468 $617,851 $566,360
A significant portion of this business unit’s revenue istransacted in currencies other than the U.S. dollar andtherefore the comparison from period to period reflects theimpact of changes in currency exchange rates. Changes inexchange rates unfavorably affected the comparison of2015 to 2014 by $75.8 million.
We believe many of the markets served by CompositeFibers present attractive growth opportunities bycapitalizing on evolving consumer preferences, expandinginto new or emerging geographic markets, and by gainingmarket share through superior products and quality. Manyof this business’ papers are technically sophisticated,require specialized fibers, and many are extremelylightweight, requiring specifically designed papermakingequipment and production processes. Our proven
2

capability to produce these demanding products and ourcustomer orientation positions us well to compete in theseglobal markets.
During 2013, we completed the acquisition ofDresden, a leading global supplier of nonwoven wallpaperbase materials. The Dresden acquisition added anotherindustry-leading nonwovens product line to our CompositeFibers business, and broadened our relationship withleading producers of consumer and industrial products.Dresden produces products with superior performance andcharacteristics such as dry strip-ability, higher tearresistance, and no material shrinkage or expansion whenwet. However, since late 2014, demand for and pricing ofDresden’s products has been adversely impacted by thegeopolitical and economic conditions in Russia andUkraine, countries from which Dresden generates asignificant portion of its revenue.
The primary raw materials used in the production ofour lightweight papers are abaca pulp, wood pulp andsynthetic fibers. Abaca pulp is a specialized pulp withlimited sources of availability. Sufficient quantities of abacapulp and its source fiber are required to support growth inthis business unit. Our abaca pulp production process,fulfilled by our Philippine mill, provides a unique advantageto our Composite Fibers business unit. In the event thesupply of abaca fiber becomes constrained or whenproduction demands exceed the capacity of the Philippinesmill, alternative sources and/or substitute fibers are used tomeet customer demands.
The Composite Fibers business unit is comprised offour paper making facilities (Germany, France andEngland), a nonwoven wall cover base mill (Germany),metallizing operations (Wales and Germany) and a pulpmill (the Philippines). The combined attributes of thefacilities are summarized as follows:
ProductionCapacity
(short tons)
Principal RawMaterial(“PRM”)
Estimated AnnualQuantity of PRM
(short tons)
154,000 lightweightand other Abaca pulp 17,300
Wood pulp 95,000Synthetic fiber 22,000
28,000 metallized Base stock 28,00018,000 abaca pulp Abaca fiber 27,000
Composite Fibers’ lightweight products are producedusing highly specialized inclined wire paper machinetechnology and we believe we currently maintainapproximately 25% of the global inclined wire capacity.
In addition to critical raw materials, the cost toproduce Composite Fibers’ products is influenced byenergy. Although the business unit generates all of itssteam needed for production, in 2015, it purchased 75%of its electricity.
In Composite Fibers’ markets, competition is productline specific as the necessity for technical expertise andspecialized manufacturing equipment limits the number ofcompanies offering multiple product lines. The followingchart summarizes key competitors by market segment:
Market segment Competitor
Single serve coffee & tea Ahlstrom, Purico, MB Papelesand Zhejiang Kan
Nonwoven wallcovering Ahlstrom, Technocell, Neu Kaliss,and Goznak
Composite laminates Schweitzer-Maudit, Purico, MBPapeles and Oi Feng
Metallized AR Metallizing, Torras PapelNovelis, Vaassen, GalileoNanotech, and Wenzhou ProtecVacuum Metallizing Co.
Our strategy in Composite Fibers is focused on:
• capitalizing on growing global markets in food &beverage, electrical products and dispersiblewipes;
• maximizing capacity utilization provided by theinvestment in state-of-the-art inclined wiretechnology to support consistent growth of keymarkets;
• enhancing product mix across all markets byutilizing new product and new businessdevelopment capabilities;
• implementing continuous improvementmethodologies to increase productivity, reducecosts and expand capacity; and
• ensuring readily available access to specialized rawmaterial requirements to support projectedgrowth.
As part of our commitment to realizing the growthpotential of certain of this business unit’s markets, in 2013we completed a $50 million investment to expand ourinclined wire capacity by nearly 20%, or approximately10,500 short tons. In addition, the 2014 acquisition of SPOfurthers our strategy of capitalizing on the fast-growingelectrical market by broadening our electrical papersplatform and know-how.
GLATFELTER 2015 FORM 10-K 3

Advanced Airlaid Materials Our AdvancedAirlaid Materials business unit is a leading global supplierof highly absorbent cellulose-based airlaid nonwovenmaterials primarily used to manufacture consumer productsfor growing global end-user markets. These productsinclude:
• feminine hygiene;
• specialty wipes;
• adult incontinence;
• home care;
• table top; and
• food pads.
Advanced Airlaid Materials serves customers who areindustry leading consumer product companies as well asprivate-label converters for feminine hygiene, adultincontinence and specialty wipes products. We believe thisbusiness unit holds leading market share positions in manyof the markets it serves. Advanced Airlaid Materials hasdeveloped long-term customer relationships throughsuperior quality, customer service, and a reputation forquickly bringing product and process innovations tomarket.
Advanced Airlaid Materials’ revenue composition bymarket consisted of the following for the years indicated:
In thousands 2015 2014 2013
Feminine hygiene $182,048 $216,836 $219,222Wipes 22,950 16,002 15,186Adult incontinence 10,720 17,586 5,046Home care 13,345 15,401 14,857Other 15,526 15,848 14,085
Total $244,589 $281,673 $268,396
A significant portion of this business unit’s revenue istransacted in currencies other than the U.S. dollar andtherefore the comparison from period to period reflects theimpact of changes in currency exchange rates. Changes inexchange rates unfavorably affected the comparison of2015 to 2014 by $25.1 million.
The feminine hygiene category accounted for 74% ofAdvanced Airlaid Material’s revenue in 2015. The majorityof sales of this product are to a small group of large,leading global consumer products companies. Thesemarkets are considered to be more growth oriented due topopulation growth in certain geographic regions andchanging consumer preferences. In developing regions,demand is also influenced by increases in disposableincome and cultural preferences. The airlaid wipes market
presents attractive growth opportunities and as a result,we are investing approximately $80 million over the nexttwo years to build a new advanced airlaid facility in theUnited States.
The Advanced Airlaid Materials business unitoperates state-of-the-art facilities in Falkenhagen,Germany and Gatineau, Canada. The Falkenhagen locationoperates three multi-bonded production lines and threeproprietary single-lane festooners. The Gatineau locationconsists of two airlaid production lines employing multi-bonded and thermal-bonded airlaid technologies and twoproprietary single-lane festooners.
The business unit’s two facilities operate with thefollowing combined attributes:
Airlaid ProductionCapacity (short tons)
Principal RawMaterial (“PRM”)
Estimated AnnualQuantity of PRM
(short tons)
107,000 Fluff pulp 75,000
In addition to the cost of critical raw materials,production cost is impacted by energy. Advanced AirlaidMaterials purchases substantially all of the electricity andnatural gas used in its operations. Approximately 90% ofthis business unit’s revenue is earned under contracts withpass-through provisions directly related to the price of keyraw material costs.
Advanced Airlaid Materials continues to be atechnology and product innovation leader in technicallydemanding segments of the airlaid market, most notablyfeminine hygiene. This business unit’s airlaid materialproduction employs multi-bonded and thermal-bondedairlaid technologies as opposed to other methods such ashydrogen-bonding. We believe that its facilities are amongthe most modern and flexible airlaid facilities in the world,allowing it to produce at industry leading operating rates.Its proprietary single-lane festooning technology providesconverting and product packaging which supportsefficiency optimization by the customers convertingprocesses. This business unit’s in-house technical expertise,combined with significant capital investment requirementsand rigorous customer expectations creates large barriersto entry for new competitors.
The following summarizes this business unit’s keycompetitors:Market segment Competitor
Airlaid products Georgia-Pacific LLC, Fitesa,McAirlaid’s GmbH, Domtar
4

The global markets served by this business unit arecharacterized by attractive growth opportunities. To takeadvantage of this, our strategy is focused on:
• maintaining and expanding relationships withcustomers that are market-leading consumerproduct companies as well as companiesdistributing through private label arrangements;
• capitalizing on our product and process innovationcapabilities;
• expanding geographic reach of markets served;
• optimizing the use of existing production capacity;and
• employing continuous improvement methodologiesand initiatives to reduce costs, improve efficienciesand create additional capacity.
Specialty Papers Our North America-basedSpecialty Papers business unit focuses on producing papersfor the following markets:
• Carbonless & non-carbonless forms papersfor credit card receipts, multi-part forms, securitypapers and other end-user applications;
• Engineered products for high speed ink jetprinting, office specialty products, greeting cards,and other niche specialty applications;
• Envelope and converting papers primarilyutilized for transactional and direct mail envelopes;and
• Book publishing papers for the production ofhigh-quality hardbound books and other bookpublishing needs.
This business unit produces both commodity productsand higher-value-added specialty products. SpecialtyPapers’ revenue composition by market consisted of thefollowing for the years indicated:
In thousands 2015 2014 2013
Carbonless & forms $349,831 $376,959 $369,618Engineered products 190,943 194,189 184,913Envelope & converting 178,067 183,194 175,928Book publishing 152,647 144,744 153,054Other 3,538 3,805 4,346
Total $875,026 $902,891 $887,859
Many of the market segments served by SpecialtyPapers are characterized by declining demand resulting inexcess capacity, lower operating rates and pricing pressure.As a result, over the past several years, certain producershave closed, reduced or repurposed production capacity in
an attempt to bring supply balance to the market. Inaddition, foreign producers have created additionalimbalance by shipping product to the U.S. when marketpricing is favorable or the U.S. dollar is stronger.Maintaining the supply and demand balance will requirethe industry to continually remove capacity sufficient tomatch declining demand.
Despite our exposure to declining markets, in each ofthe past eleven years, we have outperformed the broaderuncoated free sheet market in terms of shipping volume.We have been successful at maintaining this businessunit’s shipments by leveraging the flexibility of our assetbase to respond to new product and new businessdevelopment opportunities, efficiently responding tochanging customer demands and delivering superiorcustomer service.
We are one of the leading suppliers of carbonless andbook publishing papers in the United States. Although themarkets for these products are declining, we have beensuccessful in executing our strategy to replace this lostvolume with products such as envelope papers, businessforms, and other value-added specialty engineeredproducts. Specialty Papers’ envelope papers market is alsodeclining, however we have leveraged our customer servicecapabilities and geographic locations to grow our marketshare in each of the last several years.
Specialty Papers’ highly technical engineered productsinclude high speed ink jet printing products, office specialtyproducts, greeting cards, packaging, casting, release,transfer, playing card, postal, FDA-compliant food and otherniche specialty applications. Such products comprise an arrayof distinct business niches that are in a continuous state ofevolution. Many of these products are utilized fordemanding, specialized customer and end-user applications.Some of our products are new and higher growth whileothers are more mature and further along in the product lifecycle. Because many of these products are technicallycomplex and involve substantial customer-supplierdevelopment collaboration, they typically command higherper ton prices and generally exhibit greater pricing stabilityrelative to commodity grade paper products.
The Specialty Papers business unit operates twointegrated pulp and paper making facilities with thefollowing combined attributes:Uncoated ProductionCapacity(short tons)
Principal RawMaterial (“PRM”)
Estimated AnnualQuantity of PRM
(short tons)
820,000 Pulpwood 2,327,250Wood-and other pulps 708,000
GLATFELTER 2015 FORM 10-K 5
This business unit’s pulp mills have a combined pulpmaking capacity of 615,000 tons of bleached pulp peryear. The principal raw material used to produce pulp ispulpwood, including both hardwoods and softwoods.Pulpwood is obtained from a variety of locations includingthe states of Pennsylvania, Maryland, Delaware, NewJersey, New York, West Virginia, Virginia, Kentucky, Ohioand Tennessee. To protect our sources of pulpwood, weactively promote conservation and forest managementamong suppliers and woodland owners.
The Spring Grove facility includes five uncoated papermachines as well as an off-line combi-blade coater and aSpecialty Coater which together provide annual productioncapacity for coated paper of approximately 65,000 tons.The Chillicothe facility operates four paper machinesproducing uncoated and carbonless paper. Two of themachines have built-in coating capability which along withthree additional coaters at the facility provide annualcoated capacity of approximately 126,000 tons.
In addition to critical raw materials, the cost to produceSpecialty Papers’ products is influenced by energy. Althoughthe business unit generates all of its steam needed forproduction at both facilities and generates more power than itconsumes at the Spring Grove, PA facility, it purchasedapproximately 25% of its electricity needed for the Chillicothe,OH mill in 2015. The facilities’ source of fuel is primarily coaland, to a lesser extent, natural gas. As discussed more fullyunder “Environmental Matters,” in order to comply with newair quality regulations, we will be implementing modificationsthat will convert certain boilers to burn natural gas rather thancoal. As a result, the consumption of natural gas will increasesignificantly in late 2016 and beyond.
In Specialty Papers’ markets, competition is product linespecific due to the necessity for technical expertise andspecialized manufacturing for certain products. The followingchart summarizes key competitors by market segment:Market segment Competitor
Carbonless paper Appvion, Inc., and to a lesserextent, Fibria Celulose, KoehlerPaper, Mitsubishi Paper, NekoosaCoated Products and Asia Pulpand Paper Co.
Engineered products Specialty papers divisions ofInternational Paper, DomtarCorp., Packaging Corp, and SappiLimited, among others.
Envelope & converting Domtar and International Paper
Book publishing Domtar Corp., North PacificPaper (NORPAC), Resolute Forestand others
Customer service, product performance, technologicaladvances and product pricing are important competitivefactors with respect to all our products. We believe ourreputation in these areas continues to be excellent.
To be successful in the market environment in whichSpecialty Papers operates, our strategy is focused on:
• new product and new business developmentcapabilities to ensure optimal utilization of ourcapacity and to maximize margins;
• leveraging our flexible operating platform tooptimize product mix by shifting production amongthe machines in our system to more closely matchoutput with changing demand trends;
• utilizing ongoing continuous improvementmethodologies to ensure operational efficienciesand asset reliability; and
• maintaining superior customer service.
Additional financial information for each of ourbusiness units is included in Item 7 – Management’sDiscussion and Analysis of Financial Condition and Resultsof Operations and in Item 8 – Financial Statements andSupplementary Data, Note 24 including geographicrevenue and long-lived asset financial information.
Concentration of Customers For each of thepast three years, no single customer represented morethan 10% of our consolidated net sales. However, asdiscussed in Item 1A Risk Factors, one customer accountedfor the majority of Advanced Airlaid Materials net sales in2015, 2014 and 2013.
Capital Expenditures Our business is capitalintensive and requires significant expenditures for new andenhanced equipment. These capital investments arenecessary to support growth strategies, research anddevelopment initiatives, environmental compliance, and fornormal upgrades or replacements. Capital expenditurestotaled $99.9 million, $66.0 million and $103.0 million, in2015, 2014 and 2013, respectively. For 2016, capitalexpenditures are estimated as follows:
In millions
Normal capital expenditures $ 70 – $ 80Major Projects
AMBU capacity expansion 40 – 45SPBU environmental compliance 40 – 45
Total $150 – $170
Environmental Matters We are subject tovarious federal, state and local laws and regulationsintended to protect the environment as well as human
6

health and safety. At various times, we have incurredsignificant costs to comply with these regulations and wecould incur additional costs as new regulations aredeveloped or regulatory priorities change.
We have incurred and will incur additional materialcapital costs to comply with upcoming air qualityregulations including the U.S. EPA Best Available RetrofitTechnology rule (BART; otherwise known as the RegionalHaze Rule) and the Boiler Maximum Achievable ControlTechnology rule (Boiler MACT). These rules require processmodifications and/or upgrades of air pollution controls onboilers at two of our facilities. We have begun convertingor replacing five coal-fired boilers to natural gas andupgrading site infrastructure to accommodate the newboilers, including connecting to gas supply. The total costof these projects is estimated at $85 million to $90 million,of which $33.0 million has been incurred through the endof 2015. The balance of the related spending should besubstantially completed in 2016.
We are a defendant in the Fox River environmentalmatter. Although this matter is the subject of extensive andongoing litigation, during 2015, we spent $9.7 million forremediation activities, and possibly may spend a similaramount in 2016. For a more complete discussion of thismatter, see Item 8 – Financial Statements andSupplementary Data – Note 23.
Employees As of December 31, 2015, weemployed 4,375 people worldwide, of whichapproximately 75% are unionized. The UnitedSteelworkers International Union and the Office andProfessional Employees International Union represents1,446 hourly employees at our Chillicothe, OH and SpringGrove, PA facilities under labor contracts expiring inAugust 2016 for Chillicothe and January 2017 for SpringGrove. Hourly employees at each of our internationallocations are represented by various unions or workscouncils. We consider the overall relationship with ouremployees to be satisfactory.
Other Available Information The CorporateGovernance page of our website includes the Company’sGovernance Principles, Code of Business Conduct, andbiographies of our Board of Directors and ExecutiveOfficers. In addition, the website includes charters of theAudit, Compensation, Finance, and Nominating andCorporate Governance Committees of the Board ofDirectors. The Corporate Governance page also includesthe Code of Business Ethics for the CEO and SeniorFinancial Officers of Glatfelter, our “whistle-blower” policyand other related material. We satisfy the disclosurerequirement for any future amendments to, or waivers
from, our Code of Business Conduct or Code of BusinessEthics for the CEO and Senior Financial Officers by postingsuch information on our website. We will provide a copy ofthe Code of Business Conduct or Code of Business Ethicsfor the CEO and Senior Financial Officers, without charge,to any person who requests one, by contacting InvestorRelations at (717) 225-2719, [email protected] or by mailto 96 South George Street, Suite 520, York, PA, 17401.
ITEM 1A RISK FACTORS
Our business and financial performancemay be adversely affected by a weakglobal economic environment ordownturns in the target markets that weserve.
Adverse global economic conditions could impact ourtarget markets resulting in decreased demand for ourproducts. Our results could be adversely affected ifeconomic conditions weaken or fail to improve. In theevent of significant currency weakening in the countriesinto which our products are sold, demand for or pricing ofour products could be adversely impacted. Also, there maybe periods during which demand for our products isinsufficient to enable us to operate our production facilitiesin an economical manner. As a result, we may be forced totake machine downtime. The economic environment mayalso cause customer insolvencies which may result in theirinability to satisfy their financial obligations to us. Theseconditions are beyond our control and may have asignificant impact on our sales and results of operations.
Approximately $75 million of our revenue in 2015was earned from customers located in Ukraine, Russia andmembers of the Commonwealth of Independent States(also known as “CIS”). Uncertain geo-political andeconomic conditions in this region and weak currencieshave and may continue to cause weak demand for ourproducts as well as volatility in our customers buyingpatterns.
Approximately 28% of our net sales in 2015 wereshipped to customers in Europe, the demand for which isdependent on economic conditions in this area, or to theextent such customers do business outside of Europe, inother regions of the world. Uncertain economic conditionsin this region may cause weakness in demand for ourproducts as well as volatility in our customers buyingpatterns.
GLATFELTER 2015 FORM 10-K 7
Foreign currency exchange ratefluctuations could adversely affect ourresults of operations.
A significant proportion of our revenue is generatedfrom operations outside of the United States. We own andoperate manufacturing facilities in Canada, Germany,France, the United Kingdom and the Philippines. Asignificant portion of our business is transacted in currenciesother than the U.S. dollar such as euros, British pound,Canadian dollars or Philippine peso. Our euro denominatedrevenue exceeds euro expenses by approximately €120million. With respect to the British pound, Canadian dollar,and Philippine peso, we have greater outflows than inflowsof these currencies, although to a lesser degree. As a result,we are exposed to changes in currency exchange rates andsuch changes could be significant.
Economic weakness, the potential inability of certainEuropean countries to continue to service their sovereigndebt obligations, and the related actions of this region’scentral banks has caused, and could continue to cause, thevalue of the euro to weaken. As a result, our operatingresults could be negatively impacted. In the event that oneor more European countries were to replace the euro withanother currency, business may be adversely affected untilstable exchange rates are established.
Our ability to maintain our products’ pricecompetitiveness is reliant, in part, on the relative strengthof the currency in which the product is denominatedcompared to the currency of the market into which it issold and the functional currency of our competitors.Changes in the rate of exchange of foreign currencies inrelation to the U.S. dollar, and other currencies, mayadversely impact our results of operations and our abilityto offer products in certain markets at acceptable prices.For example, approximately $75 million of our revenue in2015 was earned from shipments to customers located inUkraine, Russia and members of the CIS. Although thesesales are denominated in euros, a significant weakening ofthe customers’ local currencies has and may continue toadversely affect our revenue, our customers’ credit risk andour results of operation.
The cost of raw materials and energy usedto manufacture our products could increaseand the availability of certain raw materialscould become constrained.
We require access to sufficient and reasonably pricedquantities of pulpwood, purchased pulps, pulp substitutes,abaca fiber, synthetic fibers, and certain other rawmaterials.
Our Specialty Papers’ locations are verticallyintegrated manufacturing facilities that can generateapproximately 85% of their annual pulp requirements.
Our Philippine mill purchases abaca fiber to produceabaca pulp, a key material used to manufacture paper forsingle-serve coffee, tea and technical specialty products atour Gernsbach, Scaër, and Lydney facilities. At certaintimes, the supply of abaca fiber has been constrained dueto factors such as weather-related damage to the sourcecrop as well as decisions by land owners to producealternative crops in lieu of those used to produce abacafiber.
Our Advanced Airlaid Materials business unit requiresaccess to sufficient quantities of fluff pulp, the supply ofwhich is subject to availability of certain softwoods.Softwood availability can be limited by many factors,including weather in regions where softwoods areabundant.
The cost of many of our production materials,including petroleum based chemicals and freight charges,are influenced by the cost of oil. In addition, although weare currently converting our boilers to burn natural gas,coal is currently a principal source of fuel for both theSpring Grove and Chillicothe facilities. Natural gas is usedas a source of fuel at Chillicothe and our Composite Fibersand Advanced Airlaid Materials business units’ facilities.
Government rules, regulations and policies have animpact on the cost of certain energy sources, particularlyfor our European operations. We currently benefit from anumber of government sponsored programs related to,among others, green energy or renewable energyinitiatives designed to mitigate the cost of electricity tolarger industrial consumers of power. Any reduction in theextent of government sponsored incentives may adverselyaffect the cost ultimately borne by our operations.
Although we have contractual cost pass-througharrangements with certain Advanced Airlaid Materials’customers, we may not be able to fully pass increased rawmaterials or energy costs on to all customers if the marketwill not bear the higher price or if existing agreements limitprice increases. If price adjustments significantly trailincreases in raw materials or energy prices, our operatingresults could be adversely affected.
8
Our industry is highly competitive andincreased competition could reduce oursales and profitability.
Specialty Papers The primary market for ourSpecialty Papers business unit is the United States, whichhas been adversely affected by capacity exceeding thedemand for products, increased imports from foreigncompetitors and by declining uncoated free sheet demand.As a result, the industry has taken steps to reduce capacity.However, slowing demand or increased competition couldforce us to lower our prices or to offer additional servicesat a higher cost to us, which could reduce our grossmargins and net income. The greater financial resources ofcertain of our competitors may enable them to commitlarger amounts of capital in response to changing marketconditions. Certain competitors may also have the ability todevelop product or service innovations that could put us ata competitive disadvantage.
There have been periods of supply/demand imbalancein our industry which have caused pulp prices and ourproducts’ selling prices to be volatile. The timing andmagnitude of price increases or decreases in these marketshave generally varied by region and by product type. Asustained period of weak demand or excess supply wouldlikely adversely affect pulp prices and our products’ sellingprices. This could have a material adverse effect on ouroperating and financial results.
Some of the other factors that may adversely affectour ability to compete in Specialty Papers markets in whichwe participate include:
• the entry of new competitors into the markets weserve;
• the prevalence of imported product, particularlyuncoated free sheet, into the U.S.;
• the willingness of commodity-based producers toenter our markets when they are unable tocompete or when demand softens in theirtraditional markets;
• the aggressiveness of our competitors’ pricingstrategies, which could force us to decrease pricesin order to maintain market share;
• our failure to anticipate and respond to changingcustomer preferences;
• the impact of electronic-based substitutes forcertain of our products such as carbonless andforms, book publishing, and envelope papers;
• the impact of replacement or disruptivetechnologies;
• changes in end-user preferences;
• our inability to develop new, improved orenhanced products;
• our inability to maintain the cost efficiency of ourfacilities; and
• the cost of regulatory environmental compliancerequirements.
Composite Fibers and Advanced AirlaidMaterials The global markets in which we compete,although growing, are not as large as the markets forSpecialty Papers. As a result, our ability to compete is moresensitive to and may be adversely impacted by thefollowing:
• the entry of new competitors into the markets weserve;
• the aggressiveness of our competitors’ pricingstrategies, which could force us to decrease pricesin order to maintain market share;
• our failure to anticipate and respond to changingcustomer preferences; and
• technological advances or changes that impactproduction of our products.
The impact of any significant changes may result inour inability to effectively compete in the markets in whichwe operate, and as a result our sales and operating resultswould be adversely affected.
We may not be able to develop newproducts acceptable to our existing orpotential customers.
Our business strategy is market focused and includesinvestments in developing new products to meet thechanging needs of our customers or serve new customersand to maintain our market share. Our success willdepend, in part, on our ability to develop and introducenew and enhanced products that keep pace withintroductions by our competitors and changing customerpreferences. If we fail to anticipate or respond adequatelyto these factors, we may lose opportunities for businesswith both current and potential customers. The success ofour new product offerings will depend on several factors,including our ability to:
• anticipate and properly identify our customers’needs and industry trends;
GLATFELTER 2015 FORM 10-K 9

• develop and commercialize new products andapplications in a timely manner;
• price our products competitively;
• differentiate our products from our competitors’products; and
• invest efficiently in research and developmentactivities.
Our inability to develop new products or newbusiness opportunities could adversely impact our businessand ultimately harm our profitability.
We are subject to substantial costs andpotential liability for environmentalmatters.
We are subject to various environmental laws andregulations that govern our operations, including dischargesinto the environment, and the handling and disposal ofhazardous substances and wastes. We are also subject tolaws and regulations that impose liability and clean-upresponsibility for releases of hazardous substances into theenvironment. To comply with environmental laws andregulations, we have incurred, and will continue to incur,substantial capital and operating expenditures. The CleanAir Act, and similar regulations, will impose significantcompliance costs or require significant capital expenditures.Compliance with the Clean Air Act will require processmodifications and/or installation of air pollution controls onboilers at two of our facilities, as well as connecting to gaspipelines. Because of the complexities of this initiative, ourinability to successfully complete all aspects of the projectcould adversely impact the expenditures required or ourresults of operations.
We anticipate that environmental regulation of ouroperations will continue to become more burdensome andthat capital and operating expenditures necessary tocomply with environmental regulations will continue, andperhaps increase, in the future. Because environmentalregulations are not consistent worldwide, our ability tocompete globally may be adversely affected by capital andoperating expenditures required for environmentalcompliance. In addition, we may incur obligations toremove or mitigate any adverse effects on theenvironment, such as air and water quality, resulting frommills we operate or have operated. Potential obligationsinclude compensation for the restoration of naturalresources, personal injury and property damages. SeeItem 1 – Environmental Matters for an additionaldiscussion of expected costs to comply with environmentalregulations.
We have exposure to potential liability forremediation and other costs related to the presence ofpolychlorinated biphenyls (PCBs) in the lower Fox River onwhich our former Neenah, Wisconsin mill was located.During 2015, we incurred $9.7 million for remediationactivities in the downstream portion of the river and it ispossible we may incur a similar amount in 2016. While webelieve this to be a reasonable estimation of our currentexposure, there can be no assurance that we will not berequired to provide significant contributions to fundremediation efforts in the near term and/or ultimately paymaterial amounts to resolve our liability in the Fox Rivermatter. We have financial reserves for environmentalmatters, including the Fox River site, but we cannot becertain that those reserves will be adequate to provide forfuture obligations related to these matters, that our shareof costs and/or damages for these matters will not exceedour available resources, or that such obligations will nothave a long-term, material adverse effect on ourconsolidated financial position, liquidity or results ofoperations.
Our environmental issues are complex and should bereviewed in the context set forth in more detail in Item 8 –Financial Statements and Supplementary Data – Note 23.
The Advanced Airlaid Materials businessunit generates a substantial portion of itsrevenue from one customer serving thehygiene products market, the loss of whichcould have a material adverse effect on ourresults of operations.
The majority of Advanced Airlaid Materials’ net salesof hygiene products are from one customer. In addition,sales to the feminine hygiene market accounted for 74% ofAdvanced Airlaid Materials’ net sales in 2015 and sales areconcentrated within a small group of large customers. Theloss of the large customer or a decline in sales of hygieneproducts could have a material adverse effect on thisbusiness’s operating results. Our ability to effectivelycompete could be affected by technological productionalternatives which could provide substitute products intothis market segment. Customers in the airlaid nonwovenfabric material market, including the hygiene market, mayalso switch to less expensive products, change preferencesor otherwise reduce demand for Advanced AirlaidMaterial’s products, thus reducing the size of the marketsin which it currently sells its products. Any of the foregoingcould have a material adverse effect on our financialperformance and business prospects.
10
Our operations may be impaired and wemay be exposed to potential losses andliability as a result of natural disasters, actsof terrorism or sabotage or similar events.
If we have a catastrophic loss or unforeseenoperational problem at any of our facilities, we could suffersignificant lost production which could impair our ability tosatisfy customer demands.
Natural disasters, such as earthquakes, hurricanes,typhoons, flooding or fire, and acts of terrorism orsabotage affecting our operating activities and majorfacilities could materially and adversely affect ouroperations, operating results and financial condition.
In addition, we own and maintain two dams in YorkCounty, Pennsylvania, that were built to ensure a steadysupply of water for the operation of our facility in SpringGrove which is a primary manufacturing location for ourenvelope papers and engineered products. Each of thesedams is classified as “high hazard” by the Commonwealthof Pennsylvania because they are located in close proximityto inhabited areas. Any sudden failure of a dam, includingas a result of natural disaster or act of terrorism orsabotage, would endanger occupants and residential,commercial and industrial structures, for which we couldbe liable. The failure of a dam could also be extremelydisruptive and result in damage to, or the shutdown of, ourSpring Grove mill. Any losses or liabilities incurred due tothe failure of one of our dams may not be fully covered byor may substantially exceed the limits of our insurancepolicies and could materially and adversely affect ouroperating results and financial condition.
In addition, many of our papermaking operationsrequire a reliable and abundant supply of water. Such millsrely on a local water body or water source for their waterneeds and, therefore, are particularly impacted by droughtconditions or other natural or manmade interruptions towater supplies. At various times and for differing periods,each of our mills has had to modify operations due towater shortages, water clarity, or low flow conditions in itsprincipal water supplies. Any interruption or curtailment ofoperations at any of our paper mills due to drought or lowflow conditions at the principal water source or anothercause could materially and adversely affect our operatingresults and financial condition.
Our pulp mill in Lanao del Norte on the Island ofMindanao in the Republic of the Philippines is locatedalong the Pacific Rim, one of the world’s hazard belts. Byvirtue of its geographic location, this mill is subject tosimilar types of natural disasters discussed above, cyclones,
typhoons, and volcanic activity. Moreover, the area ofLanao del Norte has been a target of suspected terroristactivities. Our pulp mill in Mindanao is located in a ruralportion of the island and is susceptible to attacks or powerinterruptions. The Mindanao mill supplies the abaca pulpused by our Composite Fibers business unit to manufactureour paper for single serve coffee and tea products andcertain technical specialties products. Any interruption, lossor extended curtailment of operations at our Mindanaomill could affect our ability to meet customer demands forour products and materially affect our operating resultsand financial condition.
We have operations in a potentiallypolitically and economically unstablelocation.
Our pulp mill in the Philippines is located in a regionthat is unstable and subject to political unrest. Asdiscussed above, our Philippine pulp mill produces abacapulp, a significant raw material used by our CompositeFibers business unit, and is currently our main provider ofabaca pulp. There are limited suitable alternative sourcesof readily available abaca pulp in the world. In the event ofa disruption in supply from our Philippine mill, there is noguarantee that we could obtain adequate amounts ofabaca pulp, if at all, from alternative sources at areasonable price. Further, there is no assurance theperformance of such alternative materials will be satisfycustomer performance requirements. As a consequence,any civil disturbance, unrest, political instability or otherevent that causes a disruption in supply could limit theavailability of abaca pulp and would increase our cost ofobtaining abaca pulp. Such occurrences could adverselyimpact our sales volumes, revenues and operating results.
Our international operations pose certainrisks that may adversely impact sales andearnings.
We have significant operations and assets located inCanada, Germany, France, the United Kingdom, and thePhilippines. Our international sales and operations aresubject to a number of unique risks, in addition to the risksin our domestic sales and operations, including differingprotections of intellectual property, trade barriers, laborunrest, exchange controls, regional economic uncertainty,differing (and possibly more stringent) labor regulation,risk of governmental expropriation, domestic and foreigncustoms and tariffs, differing regulatory environments,difficulty in managing widespread operations and politicalinstability. These factors may adversely affect our futureprofits. Also, in some foreign jurisdictions, we may be
GLATFELTER 2015 FORM 10-K 11
subject to laws limiting the right and ability of entitiesorganized or operating therein to pay dividends or remitearnings to affiliated companies unless specified conditionsare met. Any such limitations would restrict our flexibility inusing funds generated in those jurisdictions.
We are subject to cyber-security risksrelated to unauthorized or malicious accessto sensitive customer, vendor, company oremployee information as well as to thetechnology that supports our operationsand other business processes.
Our business operations rely upon secure systems formill operations, and data capture, processing, storage andreporting. Although we maintain appropriate data securityand controls, our information technology systems, andthose of our third party providers, could become subject tocyber attacks. Systems such as ours are inherently exposedto cyber-security risks and potential attacks. The result ofsuch attacks could result in a breach of data security andcontrols. Such a breach of our network, systems,applications or data could result in operational disruptionsor damage or information misappropriation including, butnot limited to, interruption to systems availability, denial ofaccess to and misuse of applications required by ourcustomers to conduct business with us, denial of access tothe applications we use to plan our operations, procurematerials, manufacture and ship products and account fororders, theft of intellectual knowhow and trade secrets,and inappropriate disclosure of confidential company,employee, customer or vendor information, could stemfrom such incidents.
Any of these operational disruptions and/ormisappropriation of information could adversely affect ourresults of operations, create negative publicity and couldhave a material effect on our business.
We operate in and are subject to taxationfrom numerous U.S. and foreignjurisdictions.
The multinational nature of our business subjects usto taxation in the U.S and numerous foreign jurisdictions.Due to economic and political conditions, tax rates invarious jurisdictions may be subject to significant change.Our effective tax rates could be affected by changes in taxlaws or their interpretation or changes in the mix ofearnings in jurisdictions with differing statutory tax rates,changes in the valuation of deferred tax assets andliabilities. For example, the European Commission has
opened formal investigations to examine whether decisionsby the tax authorities in certain European countries complywith European Union rules on state aid. The outcome ofthe European Commission’s investigations could requirechanges to existing tax rulings that, in turn, could have animpact on our income taxes and results of operations.
In the event any of the above risk factorsimpact our business in a material way or incombination during the same period, wemay be unable to generate sufficient cashflow to simultaneously fund ouroperations, finance capital expenditures,satisfy obligations and make dividendpayments on our common stock.
In addition to debt service obligations, our business iscapital intensive and requires significant expenditures tosupport growth strategies, research and developmentinitiatives, environmental compliance, and for normalupgrades or replacements. During 2016, we expect our useof cash for capital expenditures, strategic investments andenvironmental compliance projects will exceed cashgenerated from operations. We expect to meet all of ournear and long-term cash needs from a combination ofoperating cash flow, cash and cash equivalents, ourexisting credit facility and other long-term debt. If we areunable to generate sufficient cash flow from these sources,we could be unable to meet our near and long-term cashneeds or make dividend payments.
ITEM 1B UNRESOLVED STAFF COMMENTS
None.
ITEM 2 PROPERTIES
We own substantially all of the land and buildingscomprising our manufacturing facilities located inPennsylvania; Ohio; Canada; the United Kingdom;Germany; France; and the Philippines; as well assubstantially all of the equipment used in ourmanufacturing and related operations. Certain of ouroperations are under lease arrangements including ourmetallized paper production facility located in Caerphilly,Wales, office and warehouse space in Moscow, Russia,Souzou, China and our corporate offices in York,Pennsylvania. All of our properties, other than those thatare leased, are free from any material liens orencumbrances. We consider all of our buildings to be ingood structural condition and well maintained and ourproperties to be suitable and adequate for presentoperations.
12

ITEM 3 LEGAL PROCEEDINGS
We are involved in various lawsuits that we considerto be ordinary and incidental to our business. The ultimateoutcome of these lawsuits cannot be predicted withcertainty; however, except with respect to the Fox Rivermatter referred to below, we do not expect such lawsuits,individually or in the aggregate, will have a materialadverse effect on our consolidated financial position,liquidity or results of operations.
We are one of several defendants in a significantenvironmental matter relating to contamination in the FoxRiver and Bay of Green Bay in Wisconsin. For a discussionthis matter, see Item 8 – Financial Statements andSupplementary Data – Note 23.
EXECUTIVE OFFICERS
The following table sets forth certain informationwith respect to our executive officers and seniormanagement as of February 26, 2016.
Name Age Office with the Company
Dante C. Parrini 51 Chairman and Chief ExecutiveOfficer
John P. Jacunski 50 Executive Vice President and ChiefFinancial Officer
Christopher W. Astley 43 Senior Vice President & BusinessUnit President, AdvancedAirlaid Materials
Brian E. Janki 43 Senior Vice President & BusinessUnit President, Specialty Papers
Martin Rapp 56 Senior Vice President & BusinessUnit President, CompositeFibers
William T. Yanavitch II 55 Senior Vice President, HumanResources and Administration
David C. Elder 47 Vice President, FinanceKent K. Matsumoto 56 Vice President, General Counsel
and Corporate SecretaryMark A. Sullivan 60 Vice President
Officers are elected to serve at the pleasure of theBoard of Directors. Except in the case of officers elected tofill a new position or a vacancy occurring at some otherdate, officers are generally elected at the organizationalmeeting of the Board of Directors held immediately afterthe annual meeting of shareholders.
Dante C. Parrini became Chief Executive Officereffective January 1, 2011 and Chairman of the Board inMay 2011. Prior to this, he was Executive Vice Presidentand Chief Operating Officer, a position he held sinceFebruary 2005. Mr. Parrini joined us in 1997 and haspreviously served as Senior Vice President and GeneralManager, a position he held beginning in January 2003
and prior to that as Vice President responsible for Salesand Marketing.
John P. Jacunski was promoted to Executive VicePresident and Chief Financial Officer in February 2014. Hejoined us in October 2003 and served as Vice Presidentand Corporate Controller. In July 2006 he was promoted toSenior Vice President and Chief Financial Officer.Mr. Jacunski was previously Vice President and ChiefFinancial Officer at WCI Steel, Inc. from June 1999 toOctober 2003. Prior to joining WCI, Mr. Jacunski was withKPMG, an international accounting and consulting firm,where he served in various capacities.
Christopher W. Astley was named Senior VicePresident & Business Unit President, Advanced AirlaidMaterials in January 2015. He joined us in August 2010 asVice President, Corporate Strategy and was promoted toSenior Vice President in February 2014. Prior to joining us,he was an entrepreneur leading a privately held businessfrom 2004 until 2010. Prior to that Mr. Astley heldpositions with Accenture, a global management consultingfirm, and The Coca-Cola Company.
Brian E. Janki serves as Senior Vice President &Business Unit President, Specialty Papers. Prior to joiningus in August 2013 Mr. Janki was employed by Greif astheir Vice President & General Manager, Rigid IndustrialPackaging & Services. During his twelve years with Greif,Mr. Janki held leadership positions including profit/lossresponsibilities for two business units, global responsibilityfor supply chain and sourcing, and transformationalassignments including global oversight of theimplementation of the Greif Business System.
Martin Rapp serves as Senior Vice President &Business Unit President, Composite Fibers. Mr. Rapp joinedus in August 2006 and has lead the Composite Fibersbusiness unit since that time. Prior to this, he was VicePresident and General Manager of Avery Dennison’s RollMaterials Business in Central and Eastern Europe sinceAugust 2002.
William T. Yanavitch II was promoted to SeniorVice President Human Resources and Administration inFebruary 2014. Since joining us in July 2000, he has servedas Vice President, Human Resources. Prior to joining us heworked for Dentsply International and Gould Pumps Inc. invarious leadership capacities.
David C. Elder was named Vice President, Financein December 2011 and continues as our chief accountingofficer. Prior to his promotion, he was our Vice President,Corporate Controller, a position held since joining
GLATFELTER 2015 FORM 10-K 13
Glatfelter in January 2006. Mr. Elder was previouslyCorporate Controller for YORK International Corporation.
Kent K. Matsumoto was appointed Vice President,General Counsel and Corporate Secretary in October 2013.Mr. Matsumoto joined us in June 2012 as Assistant GeneralCounsel and also served as interim General Counsel fromMarch 2013 to October 2013. From July 2008 untilFebruary 2012, he was Associate General Counsel forWolters Kluwer.
Mark A. Sullivan serves as a Vice President.Previously, he was Vice President, Global Supply Chain andInformation Technology since his promotion in November2012. Mr. Sullivan joined us in December 2003 as ChiefProcurement Officer and he was appointed Vice President,Global Supply Chain in February 2005.
ITEM 4 MINE SAFETY DISCLOSURES
Not Applicable
PART II
ITEM 5 MARKET FOR REGISTRANT’SCOMMON EQUITY, RELATEDSTOCKHOLDER MATTERS ANDISSUER PURCHASES OF EQUITYSECURITIES
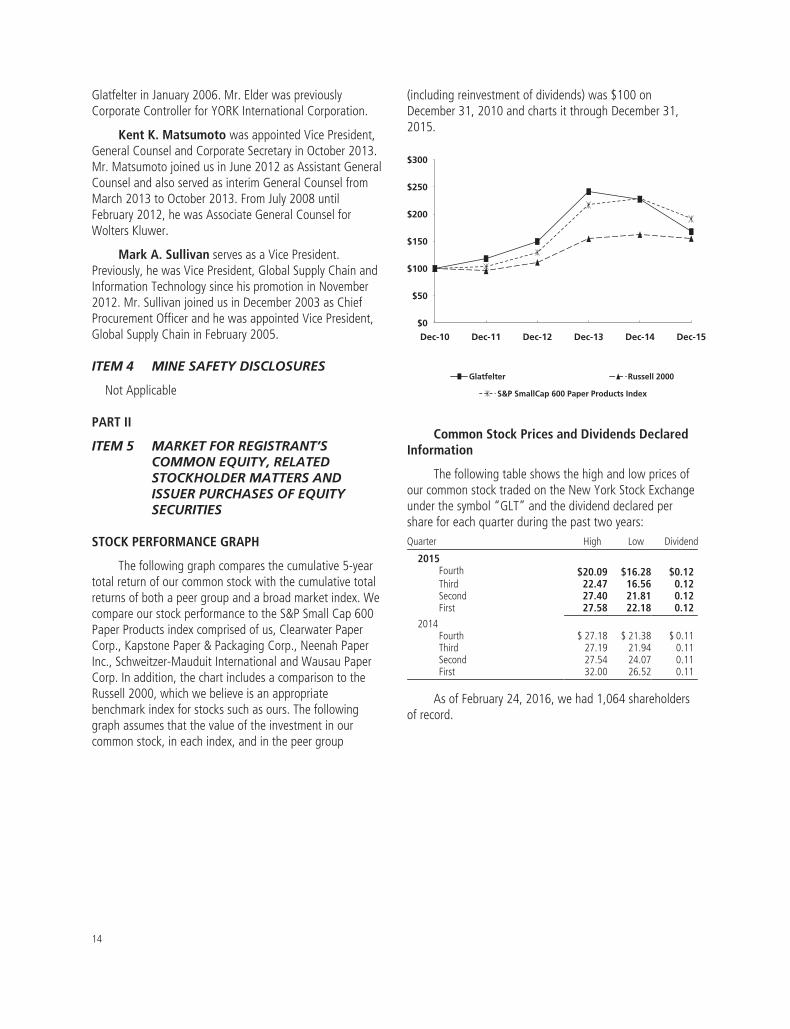
STOCK PERFORMANCE GRAPH
The following graph compares the cumulative 5-yeartotal return of our common stock with the cumulative totalreturns of both a peer group and a broad market index. Wecompare our stock performance to the S&P Small Cap 600Paper Products index comprised of us, Clearwater PaperCorp., Kapstone Paper & Packaging Corp., Neenah PaperInc., Schweitzer-Mauduit International and Wausau PaperCorp. In addition, the chart includes a comparison to theRussell 2000, which we believe is an appropriatebenchmark index for stocks such as ours. The followinggraph assumes that the value of the investment in ourcommon stock, in each index, and in the peer group
(including reinvestment of dividends) was $100 onDecember 31, 2010 and charts it through December 31,2015.
Glatfelter Russell 2000
S&P SmallCap 600 Paper Products Index
$300
$200
$250
$150
$100
$50
$0
Dec-10 Dec-11 Dec-12 Dec-13 Dec-15Dec-14
Common Stock Prices and Dividends DeclaredInformation
The following table shows the high and low prices ofour common stock traded on the New York Stock Exchangeunder the symbol “GLT” and the dividend declared pershare for each quarter during the past two years:Quarter High Low Dividend
2015Fourth $20.09 $16.28 $0.12Third 22.47 16.56 0.12Second 27.40 21.81 0.12First 27.58 22.18 0.12
2014Fourth $ 27.18 $ 21.38 $ 0.11Third 27.19 21.94 0.11Second 27.54 24.07 0.11First 32.00 26.52 0.11
As of February 24, 2016, we had 1,064 shareholdersof record.
14

ITEM 6 SELECTED FINANCIAL DATA
As of or for the year ended December 31Dollars in thousands, except per share 2015 2014 2013 (1) 2012 2011
Net sales $1,661,084 $1,802,415 $1,722,615 $1,577,788 $1,603,154Energy and related sales, net 5,664 7,927 3,153 7,000 9,344
Total revenue 1,666,748 1,810,342 1,725,768 1,584,788 1,612,498
Gains on dispositions of plant, equipmentand timberlands, net 21,113 4,861 1,726 9,815 3,950
Net income $ 64,575 $ 69,246 $ 67,158 $ 59,379 $ 42,694Earnings per share
Basic $ 1.49 $ 1.60 $ 1.56 $ 1.39 $ 0.94Diluted 1.47 1.57 1.52 1.36 0.93
Total assets $1,503,624 $1,561,504 $1,678,410 $1,242,985 $1,136,925Total debt 363,870 404,612 442,325 250,000 227,000
Shareholders’ equity 663,247 649,109 684,476 539,679 490,404Cash dividends declared per common share 0.48 0.44 0.40 0.36 0.36
Depreciation, depletion and amortization 63,236 70,555 68,196 69,500 69,313Capital expenditures 99,889 66,046 103,047 58,752 64,491
Net tons sold 1,051,911 1,059,881 1,029,819 969,833 960,915Number of employees 4,375 4,516 4,403 4,258 4,274
(1) On April 30, 2013, we acquired Dresden Papier GmbH, the results of which are included prospectively from the acquisition date, including $101.8million of net sales and $18.3 million of operating income.
GLATFELTER 2015 FORM 10-K 15

ITEM 7 MANAGEMENT’S DISCUSSION ANDANALYSIS OF FINANCIALCONDITION AND RESULTS OFOPERATIONS
Forward-Looking Statements This AnnualReport on Form 10-K includes forward-looking statementswithin the meaning of the Private Securities LitigationReform Act of 1995. All statements other than statements ofhistorical fact, including statements regarding industryprospects and future consolidated financial position orresults of operations, made in this Report on Form 10-K areforward looking. We use words such as “anticipates”,“believes”, “expects”, “future”, “intends” and similarexpressions to identify forward-looking statements. Forward-looking statements reflect management’s currentexpectations and are inherently uncertain. Our actual resultsmay differ significantly from such expectations. The followingdiscussion includes forward-looking statements regardingexpectations of, among others, non-cash pension expense,environmental costs, capital expenditures and liquidity, all ofwhich are inherently difficult to predict. Although we makesuch statements based on assumptions that we believe to bereasonable, there can be no assurance that actual resultswill not differ materially from our expectations. Accordingly,we identify the following important factors, among others,which could cause our results to differ from any results thatmight be projected, forecasted or estimated in any suchforward-looking statements:
i. variations in demand for our products including theimpact of unplanned market-related downtime,variations in product pricing, or product substitution;
ii. the impact of competition, both domestic andinternational, changes in industry production capacity,including the construction of new mills or newmachines, the closing of mills and incremental changesdue to capital expenditures or productivity increases;
iii. risks associated with our international operations,including local economic and political environmentsand fluctuations in currency exchange rates;
iv. geopolitical events, including the impact of conflictssuch as Russia and Ukraine;
v. our ability to develop new, high value-addedproducts;
vi. changes in the cost or availability of raw materials weuse, in particular pulpwood, pulp, pulp substitutes,caustic soda, and abaca fiber;
vii. changes in energy-related costs and commodity rawmaterials with an energy component;
viii. the impact of unplanned production interruption;
ix. disruptions in production and/or increased costs dueto labor disputes;
x. the impact of exposure to volatile market-basedpricing for sales of excess electricity;
xi. the gain or loss of significant customers and/or on-going viability of such customers;
xii. cost and other effects of environmental compliance,cleanup, damages, remediation or restoration, orpersonal injury or property damages related thereto,such as the costs of natural resource restoration ordamages related to the presence of polychlorinatedbiphenyls (“PCBs”) in the lower Fox River on whichour former Neenah mill was located;
xiii. adverse results in litigation in the Fox River matter;
xiv. the impact of war and terrorism;
xv. the impact of unfavorable outcomes of audits byvarious state, federal or international tax authorities;
xvi. enactment of adverse state, federal or foreign tax orother legislation or changes in government policy orregulation; and
xvii. our ability to finance, consummate and integrateacquisitions.
Introduction We manufacture a wide array ofspecialty papers and fiber-based engineered materials andwe manage our company along three business units:
• Composite Fibers with revenue from the sale ofsingle-serve tea and coffee filtration papers,nonwoven wall covering materials, metallizedpapers, composite laminates papers, and manytechnically special papers including substrates forelectrical applications;
• Advanced Airlaid Materials with revenue fromthe sale of airlaid nonwoven fabric-like materialsused in feminine hygiene and adult incontinenceproducts, wipes, and other airlaid applications;and
• Specialty Papers with revenue from the sale ofpapers for carbonless and other forms, envelopes,book publishing, and engineered products such aspapers for high-speed ink jet printing, officespecialty products, greeting cards, packaging,casting, release, transfer, playing card, postal,FDA-compliant food and beverage applications,and other niche specialty applications.
16

RESULTS OF OPERATIONS
2015 versus 2014
Overview Net income for 2015 was $64.6 million, or$1.47 per diluted share, compared with $69.2 million, or$1.57 per diluted share, in 2014. On an adjusted earningsbasis, a non-GAAP measure that excludes non-core businessitems discussed below, earnings per share were $1.34compared with $1.55 in 2014. The year-over-year comparisonof results of operations reflects the adverse impact of i) thestronger U.S. dollar on our euro-denominated businesses; ii)weaker demand and pricing for nonwoven wallcover productsprimarily due to economic conditions in Russia and Ukraine;iii) pricing pressures in our Specialty Papers business; and iv)weaker demand for certain Advanced Airlaid Materials’products in the first half of 2015.
During 2015, we implemented cost reduction andcontinuous improvement initiatives that generated $31million of savings. Our workforce was reduced by 3.1%.
We generated $133.7 million of cash flow fromoperations compared with $99.6 million in 2014. We alsoreturned additional cash to our shareholders in the form ofa 9% increase in the quarterly dividend beginning with the2015 first quarter dividend payment. This was the thirdconsecutive year in which the dividend was increased.
We also announced a plan to invest $80 million tobuild a new production facility in the United States in theAdvanced Airlaid Materials business (“AMBU”). Our planto build this new facility is in direct response to customerneeds for increased capacity in a tightening NorthAmerican airlaid market.
On October 1, 2014, we completed the acquisition ofSpezialpapierfabrik Oberschmitten GmbH (“SPO”) for $8.0million in cash. SPO’s results are reported as part of theComposite Fibers business unit prospectively from theacquisition date. It primarily produces highly technical papersfor use in a wide range of capacitors used in consumer andindustrial products; insulation papers for cables andtransformers; and materials for industrial power inverters,electromagnetic current filters and electric rail traction.
The following table sets forth summarized results ofoperations:
Year ended December 31
In thousands, except per share 2015 2014
Net sales $1,661,084 $1,802,415Gross profit 202,965 235,154Operating income 96,372 106,780Net income 64,575 69,246Earnings per diluted share 1.47 1.57
Consolidated net sales for year ended December 31,2015 were $1,661.1 million compared with $1,802.4million for 2014. On a constant currency basis, net salesdeclined $40.3 million, or 2.2 percent. Shipping volumesdeclined less than one percent.
In addition to the results reported in accordance withGAAP, we evaluate our performance using adjusted netincome and adjusted earnings per diluted share. Wedisclose this information so that investors can evaluate ourperformance exclusive of certain unique or unusual itemsthat impact the comparability of results from period toperiod as it allows them to understand underlyingoperating trends and cash flow generation.
Adjusted earnings per diluted share is calculated bydividing adjusted net income by diluted weighted-averageshares outstanding. Adjusted earnings and adjustedearnings per diluted share are considered measures notcalculated in accordance with GAAP, and therefore are non-GAAP measures. These non-GAAP measures may differ fromother companies. The non-GAAP financial informationshould not be considered in isolation from, or as a substitutefor, measures of financial performance prepared inaccordance with GAAP. The following table sets for thereconciliation of net income to adjusted earnings for theyears ended December 31, 2015 and 2014:
In thousands, except per shareAfter-taxamounts
DilutedEPS
2015Net income $ 64,575 $ 1.47Timberland sales and related costs (14,652) (0.33)Fox River environmental matter 6,222 0.14Workforce efficiency charges 1,768 0.04Asset impairment charge 857 0.02Acquisition and integration related costs 126 –AMBU capacity expansion costs 30 –
Adjusted earnings (non-GAAP) $ 58,926 $ 1.34
2014Net income $ 69,246 $ 1.57Timberland sales and related costs (2,995) (0.07)Workforce efficiency charges 373 0.01Asset impairment charge 2,356 0.05Acquisition and integration related costs 603 0.01Alternative fuel mixture/Cellulosic biofuel
credits (1,115) (0.03)Adjusted earnings (non-GAAP) $ 68,468 $ 1.55
GLATFELTER 2015 FORM 10-K 17

The sum of individual per share amounts set forthabove may not agree to adjusted earnings per share due torounding.
Adjusted net income consists of net incomedetermined in accordance with GAAP adjusted to excludethe impact of the following:
Timberland sales and related costs. Theseadjustments exclude gains from the sales of timberlands asthese items are not considered to be part of our corebusiness, ongoing results of operations or cash flows.These adjustments are irregular in timing and amount andmay significantly impact our operating performance. Assuch, these items may not be indicative of past or futureperformance of the Company and therefore are excludedfor comparability purposes.
Fox River environmental matter. This adjustmentreflects a charge incurred to increase our reserve forestimated costs to remediate environmental contaminationat the Fox River site. These costs are irregular in timing andas such may not be indicative of our past or futureperformance.
Workforce efficiency charges. These adjustmentsinclude costs that are directly related to
actions undertaken to reduce costs and improve operatingefficiencies. Such costs were specifically incurred as part ofour initiative to reduce global headcount as part of a morebroad based cost reduction program announced at the endof 2014.
Asset impairment charges. This adjustmentrepresents a non-cash charge required to adjust to itsestimated fair value the carrying value of a trade nameintangible asset. Charges of this nature are irregular intiming and as such may not be indicative of our past andfuture performance.
Acquisition and integration related costs.These adjustments include costs directly related to theconsummation of the acquisition process and those relatedto integrating recently acquired businesses. These costs areirregular in timing and as such may not be indicative of ourpast or future performance.
Alternative fuel mixture/Cellulosic biofuelcredits. These adjustments reflect the release of reservesfor uncertain tax position due to the lapse of statutes oflimitation.
AMBU capacity expansion costs. Theseadjustments reflect costs incurred directly related to thestart-up of a new production facility for AMBU.
Business Unit PerformanceYear ended December 31
Dollars in millions Composite FibersAdvanced Airlaid
Materials Specialty PapersOther and
Unallocated Total
2015 2014 2015 2014 2015 2014 2015 2014 2015 2014
Net sales $541.5 $617.9 $244.6 $281.7 $875.0 $902.9 $ – $ – $1,661.1 $1,802.4Energy and related sales, net – – – – 5.7 7.9 – – 5.7 7.9
Total revenue 541.5 617.9 244.6 281.7 880.7 910.8 – – 1,666.7 1,810.3Cost of products sold 434.4 498.0 215.7 247.6 804.5 821.8 9.2 7.8 1,463.8 1,575.2
Gross profit (loss) 107.1 119.9 28.9 34.1 76.2 89.0 (9.2) (7.8) 203.0 235.2SG&A 45.7 51.6 7.6 8.8 43.3 50.4 31.0 22.4 127.7 133.2Gains on dispositions of plant,
equipment and timberlands, net – – – – – – (21.1) (4.9) (21.1) (4.9)
Total operating income (loss) 61.4 68.3 21.3 25.3 32.9 38.6 (19.1) (25.3) 96.4 106.8Non-operating expense – – – – – – (17.8) (19.4) (17.8) (19.4)
Income (loss) beforeincome taxes $ 61.4 $ 68.3 $ 21.3 $ 25.3 $ 32.9 $ 38.6 $(36.9) $(44.7) $ 78.6 $ 87.4
Supplementary DataNet tons sold (thousands) 153.8 157.3 96.0 99.7 802.2 802.9 – – 1,051.9 1,059.9Depreciation, depletion and
amortization $ 26.2 $ 29.7 $ 8.8 $ 9.1 $ 26.0 $ 29.9 $ 2.2 $ 1.9 $ 63.2 $ 70.6Capital expenditures 26.8 23.9 7.8 7.6 63.5 32.1 1.8 2.4 99.9 66.0
The sum of individual amounts set forth above may not agree to the consolidated financial statements included herein due torounding.
18
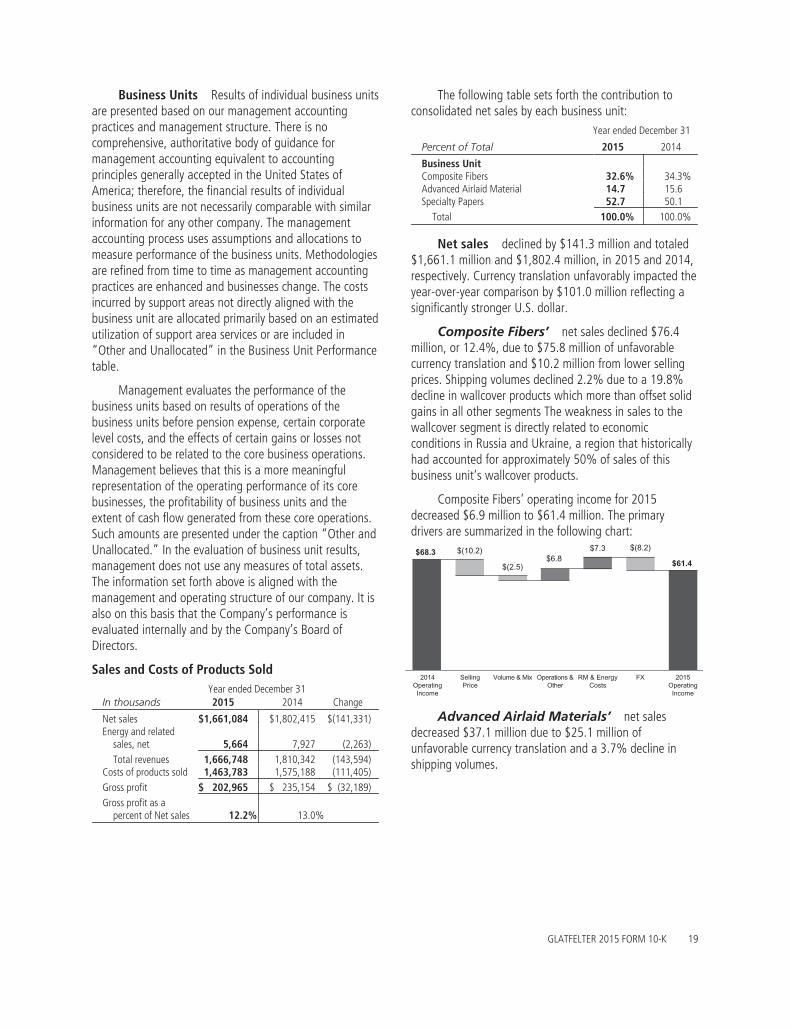
Business Units Results of individual business unitsare presented based on our management accountingpractices and management structure. There is nocomprehensive, authoritative body of guidance formanagement accounting equivalent to accountingprinciples generally accepted in the United States ofAmerica; therefore, the financial results of individualbusiness units are not necessarily comparable with similarinformation for any other company. The managementaccounting process uses assumptions and allocations tomeasure performance of the business units. Methodologiesare refined from time to time as management accountingpractices are enhanced and businesses change. The costsincurred by support areas not directly aligned with thebusiness unit are allocated primarily based on an estimatedutilization of support area services or are included in“Other and Unallocated” in the Business Unit Performancetable.
Management evaluates the performance of thebusiness units based on results of operations of thebusiness units before pension expense, certain corporatelevel costs, and the effects of certain gains or losses notconsidered to be related to the core business operations.Management believes that this is a more meaningfulrepresentation of the operating performance of its corebusinesses, the profitability of business units and theextent of cash flow generated from these core operations.Such amounts are presented under the caption “Other andUnallocated.” In the evaluation of business unit results,management does not use any measures of total assets.The information set forth above is aligned with themanagement and operating structure of our company. It isalso on this basis that the Company’s performance isevaluated internally and by the Company’s Board ofDirectors.
Sales and Costs of Products SoldYear ended December 31
In thousands 2015 2014 Change
Net sales $1,661,084 $1,802,415 $(141,331)Energy and related
sales, net 5,664 7,927 (2,263)Total revenues 1,666,748 1,810,342 (143,594)
Costs of products sold 1,463,783 1,575,188 (111,405)Gross profit $ 202,965 $ 235,154 $ (32,189)Gross profit as a
percent of Net sales 12.2% 13.0%
The following table sets forth the contribution toconsolidated net sales by each business unit:
Year ended December 31
Percent of Total 2015 2014
Business UnitComposite Fibers 32.6% 34.3%Advanced Airlaid Material 14.7 15.6Specialty Papers 52.7 50.1
Total 100.0% 100.0%
Net sales declined by $141.3 million and totaled$1,661.1 million and $1,802.4 million, in 2015 and 2014,respectively. Currency translation unfavorably impacted theyear-over-year comparison by $101.0 million reflecting asignificantly stronger U.S. dollar.
Composite Fibers’ net sales declined $76.4million, or 12.4%, due to $75.8 million of unfavorablecurrency translation and $10.2 million from lower sellingprices. Shipping volumes declined 2.2% due to a 19.8%decline in wallcover products which more than offset solidgains in all other segments The weakness in sales to thewallcover segment is directly related to economicconditions in Russia and Ukraine, a region that historicallyhad accounted for approximately 50% of sales of thisbusiness unit’s wallcover products.
Composite Fibers’ operating income for 2015decreased $6.9 million to $61.4 million. The primarydrivers are summarized in the following chart:
$68.3 $61.4
$(10.2)
$(2.5)$6.8
$7.3
SellingPrice
FX 2015OperatingIncome
RM & EnergyCosts
Operations &Other
Volume & Mix2014OperatingIncome
$(8.2)
Advanced Airlaid Materials’ net salesdecreased $37.1 million due to $25.1 million ofunfavorable currency translation and a 3.7% decline inshipping volumes.
GLATFELTER 2015 FORM 10-K 19

Advanced Airlaid Materials’ operating income for2015 declined $4.0 million compared to 2014. The primarydrivers are summarized in the following chart:
SellingPrice
FX 2015OperatingIncome
RM &Energy Costs
Operations& Other
Volume &Mix
2014OperatingIncome
$25.3
$21.3
$0.0$(5.2)
$3.6
$(1.8)
$(0.7)
The adverse impact from lower shipping volumesreflects softer market demand in the first half of the year.The amount set forth for “Operations & other” includesgeneral wage cost inflation, $2.6 million of market relateddowntime as well as lost production associated withmachine upgrades.
Specialty Papers’ net sales declined $27.9million, or 3.1% primarily due to $11.3 million from lowerselling prices, slightly lower shipping volumes andunfavorable mix changes.
This business unit’s operating income totaled $32.9million in 2015, a $5.7 million decline from $38.6 million ayear ago. The primary drivers are summarized in thefollowing chart:
SellingPrice
Energy &RelatedSales
2015OperatingIncome
RM &EnergyCosts
Operations &Other
Volume& Mix
2014OperatingIncome
$32.9
$38.6 $(11.3)
$(2.1)$(4.8)
$14.8 $(2.3)
We sell excess power generated by the Spring Grove,PA facility. The following table summarizes this activity for2015 and 2014:
Year ended December 31In thousands 2015 2014 Change
Energy sales $ 5,315 $11,886 $(6,571)Costs to produce (4,428) (6,204) 1,776
Net 887 5,682 (4,795)Renewable energy credits 4,777 2,245 2,532
Total $ 5,664 $ 7,927 $(2,263)
Renewable energy credits (“RECs”) represent sales ofcertified credits earned related to burning renewablesources of energy such as black liquor and wood waste.We sell RECs into an illiquid market. The extent and valueof future revenues from REC sales is dependent on manyfactors outside of management’s control. Therefore, wemay not be able to generate consistent additional sales ofRECs in future periods.
Energy and related sales decreased $2.3 million in thecomparison as severe weather conditions in early 2014resulted in higher selling prices for excess power and a boileroutage in the first quarter of 2015 reduced power sales.
Other and Unallocated The amount of netoperating expenses not allocated to a business unit andreported as “Other and Unallocated” in our table ofBusiness Unit Performance, excluding gains from salesof plant, equipment and timberlands, totaled $40.2 millionin 2015 compared with $30.2 million in 2014. Theincrease was primarily due to a $10.0 charge to increaseour reserve for the Fox River environmental matter as wellas related legal costs which were partially offset bybenefits from corporate cost reduction initiatives.
Asset impairment charges During 2015 and2014, in connection with our annual test of potentialimpairment of indefinite lived intangible assets, werecorded a non-cash asset impairment charge of $1.2million and $3.3 million, respectively, related to a tradename intangible asset acquired in connection with ourComposite Fibers business unit’s 2013 Dresden acquisition.The charges were due to changes in the estimated fairvalue of the trade name, primarily driven by lowerforecasted revenues associated with the business, anincrease in discount rates related to Dresden’s business inRussia and Ukraine and this region’s political andeconomic instability. The charges are expenses notallocated to a business unit and are recorded in theaccompanying consolidated statements of income underthe caption “Selling, general and administrativeexpenses.”
20

Pension Expense Pension expenses are notallocated to a business unit. The following tablesummarizes the amounts of pension expense recognizedfor the periods indicated:
Year ended December 31
In thousands 2015 2014 Change
Recorded as:Costs of products sold $7,043 $6,605 $ 438SG&A expense 2,038 55 1,983
Total $9,081 $6,660 $2,421
The amount of pension expense recognized each yearis dependent on various actuarial assumptions and certainother factors, including discount rates, mortality, and thefair value of our pension assets. Pension expense in 2016is expected to be approximately $4.6 million comparedwith $9.1 million in 2015. The change is primarily due tohigher discount rates partially offset by a lower assumedlong term rate of return on plan assets.
Gain on Sales of Plant, Equipment andTimberlands, net During the years endedDecember 31, 2015 and 2014, we completed thefollowing sales of assets:
Dollars in thousands Acres Proceeds Gain
2015Timberlands 15,628 $23,917 $20,867Other n/a 542 246
Total $24,459 $21,113
2014Timberlands 2,753 $ 5,062 $ 4,855Other n/a 10 6
Total $ 5,072 $ 4,861
Income taxes For 2015, we recorded a provisionfor income taxes of $14.0 million on pretax income of$78.6 million. The comparable amounts in 2014 were anincome tax provision of $18.1 million on $87.4 million ofpretax income. The lower effective rate in 2015 is largelydriven by a greater proportion of earnings generated inlower tax foreign jurisdictions relative to the U.S. due, inpart, to a $10.0 million increase in our reserve for the FoxRiver matter. Income tax expense in 2014 includes a $4.2million benefit from the reduction of deferred tax liabilitiesand release of valuation allowances related to therestructuring of non-U.S. legal entities.
Foreign Currency We own and operate facilitiesin Canada, Germany, France, the United Kingdom and thePhilippines. The functional currency of our Canadianoperations is the U.S. dollar. However, in Germany andFrance it is the Euro, in the UK, it is the BritishPound Sterling, and in the Philippines the functional
currency is the Peso. Our euro denominated revenueexceeds euro expenses by approximately €120 million. Forthe year ended December 31, 2015, the average currencyexchange rate declined to 1.11 U.S. dollars to 1.00 eurocompared with 1.33 to 1.00 for 2014. With respect to theBritish Pound Sterling, Canadian dollar, and PhilippinePeso, we have greater outflows than inflows of thesecurrencies, although to a lesser degree. As a result,particularly with respect to the euro, we are exposed tochanges in currency exchange rates and such changescould be significant. The translation of the results frominternational operations into U.S. dollars is subject tochanges in foreign currency exchange rates.
The table below summarizes the translation impacton reported results that changes in currency exchangerates had on our non-U.S. based operations from theconversion of these operation’s results for 2015:
In thousandsYear ended
December 31, 2015Favorable
(unfavorable)Net sales $(104,996)Costs of products sold 84,156SG&A expenses 8,436Income taxes and other 2,565
Net income $ (9,839)
The above table only presents the financial reportingimpact of foreign currency translations assuming currencyexchange rates in 2015 were the same as 2014. It doesnot include the impact of certain competitive advantagesor disadvantages of operating or competing in multi-currency markets.
2014 versus 2013
Overview Our net income in 2014 was $69.2million, or $1.57 per diluted share, compared with $67.2million, or $1.52 per diluted share, in 2013. On an adjustedearnings basis, a non-GAAP measure that excludes non-corebusiness items discussed below, earnings per diluted shareincreased to $1.55 compared with $1.40 in 2013. Adjustedearnings per share increased 10.7% driven by improvedresults from our growth businesses, as well as lower pensionexpense. Our results were adversely impacted by significantcosts related to pulp mill performance issues in Ohio, severeweather conditions and higher costs related to annualmaintenance outages. In addition, our Composite Fibersbusiness was adversely impacted by macro-level challenges,including the fluid economic and political situation in Russiaand Ukraine, weak economic growth in Europe as well asincreased competitive pressures and higher market relateddowntime.
GLATFELTER 2015 FORM 10-K 21

On October 1, 2014, we completed the acquisition ofSPO for $8.0 million in cash. SPO’s results are reported aspart of the Composite Fibers business unit prospectivelyfrom the acquisition date.
Effective April 30, 2013, we completed theacquisition of Dresden Papier GmbH (“Dresden”) for $211million, net of cash acquired. Our reported results includeDresden for a full year of 2014 and, in 2013, onlyprospectively from the acquisition date.
The following table sets forth summarized results ofoperations:
Year ended December 31
In thousands, except per share 2014 2013
Net sales $1,802,415 $1,722,615Gross profit 235,154 218,660Operating income 106,780 86,519Net income 69,246 67,158Earnings per diluted share 1.57 1.52
Our results reflect benefits from our two growthbusinesses as they delivered a combined 8% increase innet sales. Composite Fibers, driven by the previouslyacquired Dresden business, and Advanced Airlaid Materialsreported improved operating profit of 9% and 18%,respectively, over the prior year period.
In addition to the results reported in accordance withGAAP, we evaluate our performance using adjusted netincome and adjusted earnings per diluted share. Wedisclose this information so that investors can evaluate ourperformance exclusive of certain items that impact thecomparability of results from period to period as it allowsthem to understand underlying operating trends and cashflow generation.
Adjusted earnings per diluted share is calculated bydividing adjusted net income by diluted weighted-averageshares outstanding. Adjusted earnings and adjusted
earnings per diluted share are considered measures notcalculated in accordance with GAAP, and therefore arenon-GAAP measures. These non-GAAP measures maydiffer from other companies. The non-GAAP financialinformation should not be considered in isolation from, oras a substitute for, measures of financial performanceprepared in accordance with GAAP. The following tablesets for the reconciliation of net income to adjustedearnings for the years ended December 31, 2014 and2013:
In thousands, except per shareAfter-taxamounts
DilutedEPS
2014Net income $ 69,246 $ 1.57Acquisition and integration related costs 603 0.01Workforce efficiency charges 373 0.01Asset impairment charge 2,356 0.05Timberland sales and related costs (2,995) (0.07)Alternative fuel mixture/Cellulosic biofuel credits (1,115) (0.03)
Adjusted earnings (non-GAAP) $ 68,468 $ 1.55
2013Net income $ 67,158 $ 1.52Acquisition and integration related costs 6,079 0.14International legal entity restructuring 630 0.01Timberland sales and related costs (1,725) (0.04)Alternative fuel mixture/Cellulosic biofuel credits (10,316) (0.23)
Adjusted earnings (non-GAAP) $ 61,826 $ 1.40
The sum of individual per share amounts set forthabove may not agree to adjusted earnings per share due torounding.
Our growth-oriented fiber-based engineeredmaterials businesses reported improved results withoperating profit increasing $9.7 million. However, SpecialtyPapers operating income declined $1.1 million reflectingthe impact of operational issues and higher costs ofmaintenance outages nearly offset by higher selling prices.
22

Business Unit Performance
Year ended December 31
Dollars in millions Composite FibersAdvanced Airlaid
Materials Specialty PapersOther and
Unallocated Total
2014 2013 2014 2013 2014 2013 2014 2013 2014 2013
Net sales $617.9 $566.4 $281.7 $268.4 $902.9 $887.9 $ – $ – $1,802.4 $1,722.6Energy and related sales, net – – – – 7.9 3.2 – – 7.9 3.2
Total revenue 617.9 566.4 281.7 268.4 910.8 891.1 – – 1,810.3 1,725.8Cost of products sold 498.0 456.5 247.6 238.0 821.8 799.3 7.8 13.3 1,575.2 1,507.1
Gross profit (loss) 119.9 109.8 34.1 30.4 89.0 91.7 (7.8) (13.3) 235.2 218.7SG&A 51.6 47.4 8.8 8.9 50.4 52.0 22.4 25.5 133.2 133.9Gains on dispositions of plant,
equipment and timberlands, net – – – – – – (4.9) (1.7) (4.9) (1.7)
Total operating income (loss) 68.3 62.4 25.3 21.5 38.6 39.7 (25.3) (37.1) 106.8 86.5Non-operating expense – – – – – – (19.4) (17.3) (19.4) (17.3)
Income (loss) before incometaxes $ 68.3 $ 62.4 $ 25.3 $ 21.5 $ 38.6 $ 39.7 $(44.7) $(54.4) $ 87.4 $ 69.2
Supplementary DataNet tons sold (thousands) 157.3 133.6 99.7 96.1 802.9 800.2 – – 1,059.9 1,029.8Depreciation, depletion and
amortization $ 29.7 $ 24.8 $ 9.1 $ 8.9 $ 29.9 $ 33.2 $ 1.9 $ 1.3 $ 70.6 $ 68.2Capital expenditures 23.9 56.9 7.6 6.7 32.1 33.8 2.4 5.7 66.0 103.0
The sum of individual amounts set forth above may not agree to the consolidated financial statements included herein due torounding.
Sales and Costs of Products SoldYear ended December 31
In thousands 2014 2013 Change
Net sales $1,802,415 $1,722,615 $79,800Energy and related sales,
net 7,927 3,153 4,774Total revenues 1,810,342 1,725,768 84,574
Costs of products sold 1,575,188 1,507,108 68,080Gross profit $ 235,154 $ 218,660 $16,494Gross profit as a percent
of Net sales 13.0% 12.7%
The following table sets forth the contribution toconsolidated net sales by each business unit:
Year endedDecember 31
Percent of Total 2014 2013
Business UnitComposite Fibers 34.3% 32.9%Advanced Airlaid Material 15.6 15.6Specialty Papers 50.1 51.5
Total 100.0% 100.0%
Net sales for 2014 totaled $1,802.4 million, a4.6% increase compared with 2013. Excluding theDresden and SPO acquisitions, organic growth totaled1.5%.
Composite Fibers’ net sales totaled $617.9 million in2014, an increase of $51.5 million or 9% compared to2013, primarily due to the inclusion of a full year of
Dresden’s activity in 2014, compared with eight months in2013, together with SPO’s results prospectively from theOctober 1, 2014 acquisition date. These factors were offsetby lower selling prices and unfavorable currency translationof $11.9 million and $2.0 million, respectively. The lowerselling prices primarily reflect the adverse impact ofcompetitive pressures in certain market segments andweak economic conditions, particularly in Europe, Russiaand Ukraine.
Composite Fibers’ operating income totaled $68.3million in 2014, a $5.9 million increase from 2013. Theprimary drivers are summarized in the following chart:
$62.4 $68.3
$(11.9)
$1.3
$8.5 $5.7
$2.9 $(0.5)
2013OperatingIncome
SellingPrice
Volume &Mix
DresdenAcquisition
Operations& Other
RM andEnergyCosts
2014OperatingIncome
FX
In Advanced Airlaid Materials, net sales totaled$281.7 million in 2014, an increase of $13.3 million or5.0% compared to 2013, primarily due to a 3.7% increasein shipping volumes. Lower selling prices negativelyaffected the comparison by $1.1 million.
GLATFELTER 2015 FORM 10-K 23

Advanced Airlaid Materials’ operating income totaled$25.3 million in 2014, a $3.8 million increase from 2013.The primary drivers are summarized in the following chart:
2013OperatingIncome
SellingPrice
Volume &Mix
$21.5
$25.3
$(1.1)
$4.2$0.3
$1.9
Operations& Other
RM andEnergyCosts
FX 2014OperatingIncome
$(1.5)
In the Specialty Papers business unit, net salestotaled $902.9 million in 2014, an increase of $15.0million or 1.7% compared to 2013 due to higher sellingprices. Higher selling prices favorably affected thecomparison by $21.7 million.
Specialty Papers’ operating income totaled $38.6million in 2014, a $0.9 million decrease from 2013. Theprimary drivers are summarized in the following chart:
$38.6 $39.7
$21.7$(22.3)
$(3.3) $4.8
2013OperatingIncome
SellingPrice
Volume& Mix
Operations &Other
RM andEnergyCosts
Net PowerSales and
RECs
2014OperatingIncome
$(2.0)
The decline of $22.3 million under the caption“Operations & Other” relates to higher costs from pulp millperformance issues, severe weather conditions andmaintenance spending.
We sell excess power generated by the Spring Grove,PA facility. The following table summarizes this activity for2014 and 2013:
Year ended December 31In thousands 2014 2013 Change
Energy sales $11,886 $ 8,189 $3,697Costs to produce (6,204) (6,784) 580
Net 5,682 1,405 4,277Renewable energy credits 2,245 1,748 497
Total $ 7,927 $ 3,153 $4,774
Renewable energy credits (“RECs”) represent sales ofcertified credits earned related to burning renewablesources of energy such as black liquor and wood waste.We sell RECs into an illiquid market. The extent and valueof future revenues from REC sales is dependent on manyfactors outside of management’s control. Therefore, wemay not be able to generate consistent additional sales ofRECs in future periods.
Energy and related sales increased in the year-over-year comparison as severe weather conditions early in2014 resulted in higher selling prices for excess power.
Other and Unallocated The amount of netoperating expenses not allocated to a business unit andreported as “Other and Unallocated” in our table ofBusiness Unit Performance, excluding gains from salesof plant, equipment and timberlands, totaled $30.2 millionin 2014 compared with $38.8 million in 2013. Thedecrease was primarily due to lower pension expense, legaland professional fees, partially offset by the assetimpairment charge.
Asset impairment charges During 2014, inconnection with our annual test of potential impairment ofindefinite lived intangible assets, we recorded a non-cashasset impairment charge of $3.3 million related to a tradename intangible asset acquired in connection with ourComposite Fibers business unit’s 2013 Dresden acquisition.The charge was primarily driven by an increase in discountrates related to Dresden’s business in Russia and Ukraineand this region’s political instability. The charge is notallocated to a business unit and is recorded in theaccompanying consolidated statements of income underthe caption “Selling, general and administrativeexpenses.”
Pension Expense The following tablesummarizes the amounts of pension expense recognizedfor the periods indicated:
Year ended December 31
In thousands 2014 2013 Change
Recorded as:Costs of products sold $6,605 $12,368 $(5,763)SG&A expense 55 1,849 (1,794)
Total $6,660 $14,217 $(7,557)
The amount of pension expense recognized each yearis dependent on various actuarial assumptions and certainother factors, including discount rates, mortality, and thefair value of our pension assets.
24
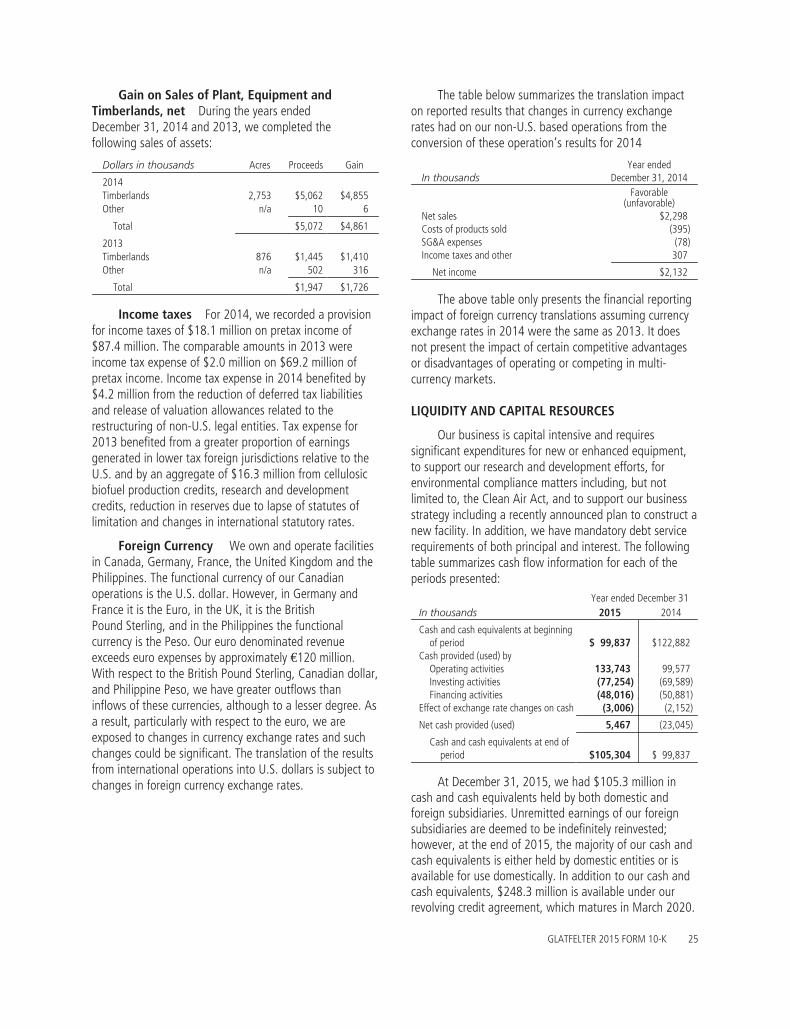
Gain on Sales of Plant, Equipment andTimberlands, net During the years endedDecember 31, 2014 and 2013, we completed thefollowing sales of assets:
Dollars in thousands Acres Proceeds Gain
2014Timberlands 2,753 $5,062 $4,855Other n/a 10 6
Total $5,072 $4,861
2013Timberlands 876 $1,445 $1,410Other n/a 502 316
Total $1,947 $1,726
Income taxes For 2014, we recorded a provisionfor income taxes of $18.1 million on pretax income of$87.4 million. The comparable amounts in 2013 wereincome tax expense of $2.0 million on $69.2 million ofpretax income. Income tax expense in 2014 benefited by$4.2 million from the reduction of deferred tax liabilitiesand release of valuation allowances related to therestructuring of non-U.S. legal entities. Tax expense for2013 benefited from a greater proportion of earningsgenerated in lower tax foreign jurisdictions relative to theU.S. and by an aggregate of $16.3 million from cellulosicbiofuel production credits, research and developmentcredits, reduction in reserves due to lapse of statutes oflimitation and changes in international statutory rates.
Foreign Currency We own and operate facilitiesin Canada, Germany, France, the United Kingdom and thePhilippines. The functional currency of our Canadianoperations is the U.S. dollar. However, in Germany andFrance it is the Euro, in the UK, it is the BritishPound Sterling, and in the Philippines the functionalcurrency is the Peso. Our euro denominated revenueexceeds euro expenses by approximately €120 million.With respect to the British Pound Sterling, Canadian dollar,and Philippine Peso, we have greater outflows thaninflows of these currencies, although to a lesser degree. Asa result, particularly with respect to the euro, we areexposed to changes in currency exchange rates and suchchanges could be significant. The translation of the resultsfrom international operations into U.S. dollars is subject tochanges in foreign currency exchange rates.
The table below summarizes the translation impacton reported results that changes in currency exchangerates had on our non-U.S. based operations from theconversion of these operation’s results for 2014
In thousandsYear ended
December 31, 2014Favorable
(unfavorable)Net sales $2,298Costs of products sold (395)SG&A expenses (78)Income taxes and other 307
Net income $2,132
The above table only presents the financial reportingimpact of foreign currency translations assuming currencyexchange rates in 2014 were the same as 2013. It doesnot present the impact of certain competitive advantagesor disadvantages of operating or competing in multi-currency markets.
LIQUIDITY AND CAPITAL RESOURCES
Our business is capital intensive and requiressignificant expenditures for new or enhanced equipment,to support our research and development efforts, forenvironmental compliance matters including, but notlimited to, the Clean Air Act, and to support our businessstrategy including a recently announced plan to construct anew facility. In addition, we have mandatory debt servicerequirements of both principal and interest. The followingtable summarizes cash flow information for each of theperiods presented:
Year ended December 31In thousands 2015 2014
Cash and cash equivalents at beginningof period $ 99,837 $122,882
Cash provided (used) byOperating activities 133,743 99,577Investing activities (77,254) (69,589)Financing activities (48,016) (50,881)
Effect of exchange rate changes on cash (3,006) (2,152)
Net cash provided (used) 5,467 (23,045)
Cash and cash equivalents at end ofperiod $105,304 $ 99,837
At December 31, 2015, we had $105.3 million incash and cash equivalents held by both domestic andforeign subsidiaries. Unremitted earnings of our foreignsubsidiaries are deemed to be indefinitely reinvested;however, at the end of 2015, the majority of our cash andcash equivalents is either held by domestic entities or isavailable for use domestically. In addition to our cash andcash equivalents, $248.3 million is available under ourrevolving credit agreement, which matures in March 2020.
GLATFELTER 2015 FORM 10-K 25

Cash provided by operating activities totaled $133.7million in 2015 compared with $99.6 million a year ago.The increase in cash from operations primarily reflects abenefit from a decrease in cash used for working capitalprimarily related to inventory and improved payment termswith suppliers. In 2015, we used less cash for incometaxes, however this was offset by cash used for Fox Riverenvironmental remediation activities.
Net cash used by investing activities primarily consistsof capital expenditures, cash used for acquisitions andproceeds from sales of assets, primarily timberlands. Netcash used for investing increased by $7.7 million in theyear-over-year comparison primarily due to a $33.8 millionincrease in capital expenditures largely related toenvironmental compliance projects which was partiallyoffset by a $19.4 million increase in proceeds from assetsales. Capital expenditures during 2015 and 2014,includes $26.9 million and $6.1 million, respectively,related to environmental compliance projects. For 2016,capital expenditures are expected to total $150 million to$170 million, including approximately $40 million to $45million related to Specialty Papers’ environmentalcompliance projects and $40 million to $45 million forAdvanced Airlaid Materials’ new airlaid facility.
Net cash used by financing activities totaled $48.0million in 2015 compared with $50.9 million in 2014.
At December 31, 2015, our net debt (a non-GAAPmeasure and defined as total debt less cash) totaled$258.6 million compared to $304.8 million at the end of2014.
The following table sets forth our outstanding long-term indebtedness:
December 31In thousands 2015 2014Revolving credit facility, due Mar. 2020 $ 58,792 $ –Revolving credit facility, due Nov. 2016 – 90,5555.375% Notes, due Oct. 2020 250,000 250,0002.40% Term Loan, due Jun. 2022 10,109 12,1552.05% Term Loan, due Mar. 2023 42,130 51,9021.55% Term Loan, due Sep. 2025 2,839 –
Total long-term debt 363,870 404,612Less current portion (7,366) (5,734)
Long-term debt, net of current portion $356,504 $398,878
Our revolving credit facility contains a number ofcustomary compliance covenants, the most restrictive ofwhich is a maximum leverage ratio of 3.5x. As ofDecember 31, 2015, the leverage ratio, as calculated inaccordance with the definition in our credit agreement,was 1.6x. Based on our expectations of future results ofoperations and capital needs, we do not believe the debt
covenants will impact our operations or limit our ability toundertake financings that may be necessary to meet ourcapital needs.
The 5.375% Notes contain cross default provisionsthat could result in all such notes becoming due andpayable in the event of a failure to repay debt outstandingunder the credit agreement at maturity, or a default underthe credit agreement that accelerates the debt outstandingthereunder. As of December 31, 2015, we met all of therequirements of our debt covenants. The significant termsof the debt instruments are more fully discussed inItem 8 – Financial Statements and SupplementaryData – Note 17.
Our long-term debt includes three term loans withmandatory principal repayments that used $5.2 million ofcash in 2015. Principal repayments will total approximately$7.4 million 2016.
Cash used for financing activities includes cash usedfor common stock dividends, and, with respect to 2014,stock repurchases. In February 2015, our Board ofDirectors authorized a 9% increase in our quarterly cashdividend. During 2015, we used $20.4 million of cash fordividends on our common stock compared with $18.7million in 2014. The Board of Directors determines what, ifany, dividends will be paid to our shareholders. Dividendpayment decisions are based upon then-existing factorsand conditions and, therefore, historical trends of dividendpayments are not necessarily indicative of future payments.
On May 1, 2014, we announced that our Board ofDirectors approved a $25 million increase to our sharerepurchase program and extended the expiration date toMay 1, 2016. Under the revised program, we mayrepurchase up to $50 million of our outstanding commonstock of which $33.4 million remains available as of theend of 2015. No repurchases were made in 2015 andtotaled $12.2 million in 2014.
We are subject to various federal, state and locallaws and regulations intended to protect the environmentas well as human health and safety. At various times, wehave incurred significant costs to comply with theseregulations and we could incur additional costs as newregulations are developed or regulatory priorities change.We will incur material capital costs to comply with new airquality regulations including the U.S. EPA Best AvailableRetrofit Technology rule (BART; otherwise known as theRegional Haze Rule) and the Boiler Maximum AchievableControl Technology rule (Boiler MACT). These rules willrequire process modifications and/or installation of airpollution controls on boilers at two of our facilities. We
26

have begun converting or replacing five coal-fired boilersto natural gas and upgrading site infrastructure toaccommodate the new boilers, including connecting to gaspipelines. The total cost of these projects is estimated at$85 million to $90 million of which $33.0 million has beenincurred through the end of 2015. The balance of therelated spending will be substantially completed in 2016.
As more fully discussed in Item 8 – FinancialStatements and Supplementary Data – Note 23 –Commitments, Contingencies and Legal Proceedings, weare involved in the Lower Fox River in Wisconsin (the “FoxRiver”), an EPA Superfund site for which we remainpotentially liable for contributions to the clean-up activity.During 2015, we used $9.1 million for remediationactivities and it is conceivable we may need to fund aportion of the on-going costs in 2016 or beyond. Althoughwe are unable to determine with any degree of certaintythe amount we may be required to fund for interimremediation work, such amounts could be significant. Theultimate allocation of such costs is the subject of extensiveongoing litigation amongst three potentially responsibleparties. See Item 8 – Financial Statements and
Supplementary Data – Note 23 for a summary ofsignificant environmental matters.
During 2016, we expect our use of cash for capitalexpenditures, strategic investments and environmentalcompliance projects will exceed cash generated fromoperations. We expect to meet all of our near and long-term cash needs from a combination of operating cashflow, cash and cash equivalents, our existing credit facilityand other long-term debt. However, as discussed in Item 8– Financial Statements and Supplementary Data – Note23, an unfavorable outcome of the Fox River matters couldhave a material adverse impact on our consolidatedfinancial position, liquidity and/or results of operations.
Off-Balance-Sheet Arrangements As ofDecember 31, 2015 and 2014, we had not entered intoany off-balance-sheet arrangements. Financial derivativeinstruments, to which we are a party, and guarantees ofindebtedness, which solely consist of obligations ofsubsidiaries and a partnership, are reflected in theconsolidated balance sheets included herein in Item 8 –Financial Statements.
Contractual Obligations The following table sets forth contractual obligations as of December 31, 2015:Payments Due During the Year Ended December 31,
In millions Total 20162017 to
20182019 to
20202021 andbeyond
Long-term debt (1) $445 $ 22 $ 44 $352 $27Operating leases (2) 13 6 5 1 1Purchase obligations (3) 129 75 54 – –Other long term obligations (4),(5) 63 6 12 13 32
Total $650 $109 $115 $366 $60
(1) Represents principal and interest payments due on long-term debt, the significant terms of which are discussed in Item 8 – Financial Statements, Note17, “Long-term Debt.” The amounts set forth above include expected interest payments of $81 million over the term of the underlying debt instrumentsbased contractual rates or current market rates in the case of variable rate instruments. See Item 8 – Financial Statements, Note 17, “Long-Term Debt”.
(2) Represents rental agreements for various land, buildings, vehicles, and computer and office equipment.(3) Represents open purchase order commitments and other obligations, primarily for raw material, and forward purchases with minimum annual purchase
obligations. In certain situations, prices are subject to variations based on market prices. In such situations, the information above is based on prices ineffect at December 31, 2015.
(4) Primarily represents expected benefits to be paid pursuant to post-retirement medical plans, nonqualified pension plans and the expected costs of assetretirement obligations.
(5) Since we are unable to reasonably estimate the timing of ultimate payment, the amounts set forth above do not include any payments that may bemade related to uncertain tax positions, including potential interest, accounted for in accordance with ASC 740-10-20. As discussed in more detail inItem 8 – Financial Statements, Note 9, “Income Taxes”, such amounts totaled $12 million at December 31, 2015.
GLATFELTER 2015 FORM 10-K 27
Critical Accounting Policies andEstimates The preceding discussion and analysis of ourconsolidated financial position and results of operations isbased upon our consolidated financial statements, whichhave been prepared in accordance with accountingprinciples generally accepted in the United States ofAmerica. The preparation of these consolidated financialstatements requires us to make estimates and assumptionsthat affect the reported amounts of assets, liabilities,revenues and expenses, and related disclosures ofcontingent assets and liabilities. On an on-going basis, weevaluate our estimates, including those related toinventories, long-lived assets, pension and post-employment obligations, environmental liabilities andincome taxes. We base our estimates on historicalexperience and on various other assumptions that webelieve are reasonable under the circumstances, the resultsof which form the basis for making judgments about thecarrying values of assets and liabilities that are not readilyapparent from other sources. Actual results may differ fromthese estimates.
We believe the following represent the mostsignificant and subjective estimates used in the preparationof our consolidated financial statements.
Long-lived Assets We evaluate the recoverabilityof our long-lived assets, including plant, equipment,timberlands, goodwill and other intangible assetsperiodically or whenever events or changes incircumstances indicate that the carrying amounts may notbe recoverable. Goodwill and non-amortizing tradenameintangible assets are reviewed, on a discounted cash flowbasis, during the third quarter of each year for impairmentor more frequently if impairment indicators are present.Our evaluations include considerations of a variety ofqualitative factors and analyses based on the cash flowsgenerated by the underlying assets, profitabilityinformation, including estimated future operating results,trends or other determinants of fair value. If the value ofan asset determined by these evaluations is less than itscarrying amount, a loss is recognized for the differencebetween the fair value and the carrying value of the asset.Future adverse changes in market conditions or pooroperating results of the related business may indicate aninability to recover the carrying value of the assets, therebypossibly requiring an impairment charge in the future.
Pension and Other Post-EmploymentObligations Accounting for defined-benefit pensionplans, and any curtailments thereof, requires variousassumptions, including, but not limited to, discount rates,expected long-term rates of return on plan assets, futurecompensation growth rates and mortality rates.Accounting for our retiree medical plans, and anycurtailments thereof, also requires various assumptions,
which include, but are not limited to, discount rates andannual rates of increase in the per capita costs of healthcare benefits.
The following chart summarizes the more significantassumption used in the actuarial valuation of our defined-benefit plans for each of the past three years:
2015 2014 2013
Pension plansWeighted average discount rate
for benefit expense 4.21% 5.20% 4.28%for benefit obligation 4.65 4.21 5.20
Expected long-term rate of on plan assets(1) 8.00 8.00 8.50Rate of compensation increase(2) 4.00 4.00 4.00Post-employment medicalWeighted average discount rate
for benefit expense 3.89 4.52 3.58for benefit obligation 4.38 3.89 4.52
Health care cost trend rateassumed for next year 6.80 7.46 7.46
Ultimate cost trend rate 4.50 4.50 4.50Year that the ultimate cost trend rate is
reached 2037 2028 2028
(1) For 2016, the expected long-term rate of return on plan assets wasreduced to 7.75%.
(2) For 2016, the rate of compensation increase was reduced to 3.50%.
We evaluate these assumptions at least once eachyear or as facts and circumstances dictate and we makechanges as conditions warrant. Changes to theseassumptions will increase or decrease our reported netperiodic benefit expense, which will result in changes tothe recorded benefit plan assets and liabilities.
Environmental Liabilities We maintain accrualsfor losses associated with environmental obligations whenit is probable that a liability has been incurred and theamount of the liability can be reasonably estimated basedon existing legislation and remediation technologies. Theseaccruals are adjusted periodically as assessment andremediation actions continue and/or further legal ortechnical information develops. Such undiscountedliabilities are exclusive of any insurance or other claimsagainst third parties. Environmental costs are capitalized ifthe costs extend the life of the asset, increase its capacityand/or mitigate or prevent contamination from futureoperations. Recoveries of environmental remediation costsfrom other parties, including insurance carriers, arerecorded as assets when their receipt is assured beyond areasonable doubt.
Income Taxes We record the estimated future taxeffects of temporary differences between the tax bases ofassets and liabilities and amounts reported in ourconsolidated balance sheets, as well as operating loss andtax credit carry forwards. These deferred tax assets andliabilities are measured using enacted tax rates and lawsthat will be in effect when such amounts are expected toreverse or be utilized. We regularly review our deferred tax
28
assets for recoverability based on historical taxable income,projected future taxable income, the expected timing of thereversals of existing temporary differences and taxplanning strategies. If we are unable to generate sufficientfuture taxable income, or if there is a material change inthe actual effective tax rates or time period within whichthe underlying temporary differences become taxable ordeductible, we could be required to increase the valuationallowance against our deferred tax assets, which mayresult in a substantial increase in our effective tax rate anda material adverse impact on our reported results.
Significant judgment is required in determining ourworldwide provision for income taxes and recording therelated assets and liabilities. In the ordinary course of ourbusiness, there are many transactions and calculationswhere the ultimate tax determination is less than certain.
We and our subsidiaries are examined by various Federal,State and foreign tax authorities. We regularly assess thepotential outcomes of these examinations and any futureexaminations for the current or prior years in determiningthe adequacy of our provision for income taxes. Wecontinually assess the likelihood and amount of potentialadjustments and adjust the income tax provision, thecurrent liability and deferred taxes in the period in whichthe facts that give rise to a revision become known. Othersignificant accounting policies, not involving the same levelof uncertainties as those discussed above, are neverthelessimportant to an understanding of the ConsolidatedFinancial Statements. Refer to Item 8 – FinancialStatements and Supplementary Data – Notes toConsolidated Financial Statements for additionalaccounting policies.
ITEM 7A QUANTITATIVE AND QUALITATIVE DISCLOSURES ABOUT MARKET RISK
Year Ended December 31 December 31, 2015Dollars in thousands 2016 2017 2018 2019 2020 Carrying Value Fair Value
Long-term debtAverage principal outstanding
At fixed interest rates – Bond $250,000 $250,000 $250,000 $250,000 $250,000 $250,000 $250,938At fixed interest rates – Term Loans 53,627 46,260 38,717 30,995 23,273 55,078 55,945At variable interest rates 58,792 58,792 58,792 58,792 58,792 58,792 58,792
$363,870 $365,675
Weighted-average interest rateOn fixed rate debt – Bond 5.375% 5.375% 5.375% 5.375% 5.375%On fixed rate debt – Term Loans 2.08 2.09 2.08 2.08 2.07On variable rate debt 1.50 1.50 1.50 1.50 1.50
The table above presents the average principaloutstanding and related interest rates for the next fiveyears for debt outstanding as of December 31, 2015. Fairvalues included herein have been determined based uponrates currently available to us for debt with similar termsand remaining maturities.
Our market risk exposure primarily results fromchanges in interest rates and currency exchange rates. AtDecember 31, 2015, we had $363.9 million of long-termdebt, of which 16.2% was at variable interest rates. Thefixed rate Term Loans and the variable rate debt are alleuro-based borrowings and thus the value of which is alsosubject to currency risk. Variable-rate debt outstandingrepresents borrowings under our revolving creditagreement that accrues interest based on one monthLIBOR plus a margin. At December 31, 2015, the interestrate paid was 1.50%. A hypothetical 100 basis pointincrease or decrease in the interest rate on variable ratedebt would increase or decrease annual interest expenseby $0.6 million.
As part of our overall risk management practices, weenter into financial derivatives primarily designed to eitheri) hedge currency risks associated with forecastedtransactions – “cash flow hedges”; or ii) mitigate theimpact that changes in currency exchange rates have onintercompany financing transactions and foreign currencydenominated receivables and payables – “foreign currencyhedges.” For a more complete discussion of this activity,refer to Item 8 – Financial Statements and SuplementaryData – Note 20.
We are subject to certain risks associated with changesin foreign currency exchange rates to the extent ouroperations are conducted in currencies other than the U.S.Dollar. Our euro denominated revenue exceeds euroexpenses by approximately €120 million. With respect to theBritish Pound Sterling, Canadian dollar, and Philippine Peso,we have greater outflows than inflows of these currencies,although to a lesser degree. As a result, particularly withrespect to the euro, we are exposed to changes in currencyexchange rates and such changes could be significant.
GLATFELTER 2015 FORM 10-K 29

ITEM 8 FINANCIAL STATEMENTS ANDSUPPLEMENTARY DATA
MANAGEMENT’S REPORT ON INTERNAL CONTROLOVER FINANCIAL REPORTING
Management of P. H. Glatfelter Company (the“Company”) is responsible for establishing andmaintaining adequate internal control over financialreporting. The Company’s internal control over financialreporting is a process designed under the supervision ofthe chief executive and chief financial officers to providereasonable assurance regarding the reliability of financialreporting and the preparation of the Company’s financialstatements for external reporting purposes in accordancewith accounting principles generally accepted in the UnitedStates.
As of December 31, 2015, management conductedan assessment of the effectiveness of the Company’sinternal control over financial reporting based on theframework established in Internal Control – IntegratedFramework (2013) issued by the Committee ofSponsoring Organizations of the Treadway Commission(COSO). Management has determined that the Company’sinternal control over financial reporting as of December 31,2015, is effective to provide reasonable assuranceregarding the reliability of financial reporting and thepreparation of the Company’s financial statements forexternal reporting purposes in accordance with accountingprinciples generally accepted in the United States.
The Company’s internal control over financialreporting includes policies and procedures that pertain tothe maintenance of records that, in reasonable detail,accurately and fairly reflect transactions and dispositions ofassets; provide reasonable assurances that transactions arerecorded as necessary to permit preparation of financialstatements in accordance with accounting principlesgenerally accepted in the United States, and that receiptsand expenditures are being made only in accordance withauthorizations of management; and provide reasonableassurance regarding prevention or timely detection ofunauthorized acquisition, use or disposition of theCompany’s assets that could have a material effect on ourfinancial statements.
The Company’s internal control over financialreporting as of December 31, 2015, has been audited byDeloitte & Touche LLP, an independent registered publicaccounting firm, as stated in their reports appearingherein, which expresses an unqualified opinion on theeffectiveness of the Company’s internal control overfinancial reporting as of December 31, 2015.
The Company’s management, including the chiefexecutive officer and chief financial officer, does not expectthat our internal control over financial reporting willprevent or detect all errors and all frauds. A control system,no matter how well designed and operated, can provideonly reasonable, not absolute, assurance that the controlsystem’s objectives will be met. The design of a controlsystem must reflect the fact that there are resourceconstraints, and the benefits of controls must beconsidered relative to their costs. Further, because of theinherent limitations in all control systems, no evaluation ofcontrols can provide absolute assurance thatmisstatements due to error or fraud will not occur or thatall control issues and instances of fraud, if any, within theCompany have been detected. These inherent limitationsinclude the realities that judgments in decision-making canbe faulty and that breakdowns can occur because of simpleerror or mistake. Controls can also be circumvented by theindividual acts of some persons, by collusion of two ormore people, or by management override of the controls.The design of any system of controls is based, in part, oncertain assumptions about the likelihood of future events,and there can be no assurance that any design willsucceed in achieving its stated goals under all potentialfuture conditions. Projections of any evaluation of controlseffectiveness to future periods are subject to risks. Overtime, controls may become inadequate because of changesin conditions or deterioration in the degree of compliancewith policies or procedures.
30

REPORT OF INDEPENDENT REGISTERED PUBLICACCOUNTING FIRM
To the Board of Directors and Shareholders of P. H.Glatfelter Company
We have audited the internal control over financialreporting of P. H. Glatfelter Company and subsidiaries (the“Company”) as of December 31, 2015, based on criteriaestablished in Internal Control – Integrated Framework(2013) issued by the Committee of SponsoringOrganizations of the Treadway Commission. TheCompany’s management is responsible for maintainingeffective internal control over financial reporting and for itsassessment of the effectiveness of internal control overfinancial reporting, included in the accompanyingManagement’s Report on Internal Control overFinancial Reporting. Our responsibility is to express anopinion on the Company’s internal control over financialreporting based on our audit.
We conducted our audit in accordance with thestandards of the Public Company Accounting OversightBoard (United States). Those standards require that weplan and perform the audit to obtain reasonable assuranceabout whether effective internal control over financialreporting was maintained in all material respects. Ouraudit included obtaining an understanding of internalcontrol over financial reporting, assessing the risk that amaterial weakness exists, testing and evaluating thedesign and operating effectiveness of internal controlbased on the assessed risk, and performing such otherprocedures as we considered necessary in thecircumstances. We believe that our audit provides areasonable basis for our opinion.
A company’s internal control over financial reportingis a process designed by, or under the supervision of, thecompany’s principal executive and principal financialofficers, or persons performing similar functions, andeffected by the company’s board of directors,management, and other personnel to provide reasonableassurance regarding the reliability of financial reportingand the preparation of financial statements for externalpurposes in accordance with generally accepted accountingprinciples. A company’s internal control over financialreporting includes those policies and procedures that(1) pertain to the maintenance of records that, inreasonable detail, accurately and fairly reflect thetransactions and dispositions of the assets of the company;
(2) provide reasonable assurance that transactions arerecorded as necessary to permit preparation of financialstatements in accordance with generally acceptedaccounting principles, and that receipts and expendituresof the company are being made only in accordance withauthorizations of management and directors of thecompany; and (3) provide reasonable assurance regardingprevention or timely detection of unauthorized acquisition,use, or disposition of the company’s assets that could havea material effect on the financial statements.
Because of the inherent limitations of internal controlover financial reporting, including the possibility ofcollusion or improper management override of controls,material misstatements due to error or fraud may not beprevented or detected on a timely basis. Also, projectionsof any evaluation of the effectiveness of the internalcontrol over financial reporting to future periods aresubject to the risk that the controls may becomeinadequate because of changes in conditions, or that thedegree of compliance with the policies or procedures maydeteriorate.
In our opinion, the Company maintained, in allmaterial respects, effective internal control over financialreporting as of December 31, 2015, based on the criteriaestablished in Internal Control – Integrated Framework(2013) issued by the Committee of SponsoringOrganizations of the Treadway Commission.
We have also audited, in accordance with thestandards of the Public Company Accounting OversightBoard (United States), the consolidated financialstatements and financial statement schedule as of and forthe year ended December 31, 2015 of the Company andour report dated February 26, 2016 expressed anunqualified opinion on those consolidated financialstatements and financial statement schedule.
DELOITTE & TOUCHE LLP
Philadelphia, PennsylvaniaFebruary 26, 2016
GLATFELTER 2015 FORM 10-K 31

REPORT OF INDEPENDENT REGISTERED PUBLICACCOUNTING FIRM
To the Board of Directors and Shareholders of P. H.Glatfelter Company
We have audited the accompanying consolidatedbalance sheets of P. H. Glatfelter Company andsubsidiaries (the “Company”) as of December 31, 2015and 2014, and the related consolidated statements ofincome, comprehensive income, shareholders’ equity, andcash flows for each of the three years in the period endedDecember 31, 2015. Our audits also included the financialstatement schedule listed in the Index at Item 15. Theseconsolidated financial statements and financial statementschedule are the responsibility of the Company’smanagement. Our responsibility is to express an opinion onthe consolidated financial statements and financialstatement schedule based on our audits.
We conducted our audits in accordance with thestandards of the Public Company Accounting OversightBoard (United States). Those standards require that weplan and perform the audit to obtain reasonable assuranceabout whether the financial statements are free of materialmisstatement. An audit includes examining, on a testbasis, evidence supporting the amounts and disclosures inthe financial statements. An audit also includes assessingthe accounting principles used and significant estimatesmade by management, as well as evaluating the overallfinancial statement presentation. We believe that ouraudits provide a reasonable basis for our opinion.
In our opinion, such consolidated financialstatements present fairly, in all material respects, thefinancial position of P. H. Glatfelter Company andsubsidiaries as of December 31, 2015 and 2014, and theresults of their operations and their cash flows for each ofthe three years in the period ended December 31, 2015, inconformity with accounting principles generally accepted inthe United States of America. Also, in our opinion, suchfinancial statement schedule, when considered in relationto the basic consolidated financial statements taken as awhole, presents fairly, in all material respects, theinformation set forth therein.
We have also audited, in accordance with thestandards of the Public Company Accounting OversightBoard (United States), the Company’s internal control overfinancial reporting as of December 31, 2015, based on thecriteria established in Internal Control – IntegratedFramework (2013) issued by the Committee of SponsoringOrganizations of the Treadway Commission and our reportdated February 26, 2016 expressed an unqualified opinionon the Company’s internal control over financial reporting.
DELOITTE & TOUCHE LLP
Philadelphia, PennsylvaniaFebruary 26, 2016
32

P. H. GLATFELTER COMPANY and SUBSIDIARIESCONSOLIDATED STATEMENTS OF INCOME
Year ended December 31
In thousands, except per share 2015 2014 2013
Net sales $1,661,084 $1,802,415 $1,722,615Energy and related sales, net 5,664 7,927 3,153
Total revenues 1,666,748 1,810,342 1,725,768Costs of products sold 1,463,783 1,575,188 1,507,108
Gross profit 202,965 235,154 218,660Selling, general and administrative expenses 127,706 133,235 133,867Gains on dispositions of plant, equipment and timberlands, net (21,113) (4,861) (1,726)
Operating income 96,372 106,780 86,519Non-operating income (expense)
Interest expense (17,464) (18,921) (17,965)Interest income 283 159 310Other, net (615) (635) 337
Total other expense (17,796) (19,397) (17,318)
Income before income taxes 78,576 87,383 69,201Income tax provision 14,001 18,137 2,043
Net income $ 64,575 $ 69,246 $ 67,158
Earnings per shareBasic $ 1.49 $ 1.60 $ 1.56Diluted 1.47 1.57 1.52
Cash dividends declared per common share $ 0.48 $ 0.44 $ 0.40
Weighted average shares outstandingBasic 43,397 43,201 43,158Diluted 43,942 44,066 44,299
The accompanying notes are an integral part of these consolidated financial statements.
GLATFELTER 2015 FORM 10-K 33

P. H. GLATFELTER COMPANY AND SUBSIDIARIESCONSOLIDATED STATEMENTS OF COMPREHENSIVE INCOME
Year ended December 31In thousands 2015 2014 2013
Net income $ 64,575 $ 69,246 $ 67,158
Foreign currency translation adjustments (38,817) (49,365) 14,826Net change in:
Deferred gains (losses) on cash flow hedges, net of taxes of $880, $(1,281) and$178, respectively (2,581) 3,297 (517)
Unrecognized retirement obligations, net of taxes of $(2,920), $20,730 and$(45,118), respectively 5,782 (33,445) 74,300
Other comprehensive income (loss) (35,616) (79,513) 88,609
Comprehensive income (loss) $ 28,959 $(10,267) $155,767
The accompanying notes are an integral part of these consolidated financial statements.
34
P. H. GLATFELTER COMPANY and SUBSIDIARIESCONSOLIDATED BALANCE SHEETS
December 31In thousands 2015 2014
AssetsCash and cash equivalents $ 105,304 $ 99,837Accounts receivable (less allowance for doubtful accounts:
2015 – $2,239; 2014 – $2,703) 167,199 163,760Inventories 247,214 248,705Prepaid expenses and other current assets 32,650 62,320
Total current assets 552,367 574,622
Plant, equipment and timberlands, net 698,864 697,608Goodwill 76,056 84,137Intangible assets 63,057 77,098Other assets 113,280 128,039
Total assets $1,503,624 $1,561,504
Liabilities and Shareholders’ EquityCurrent portion of long-term debt $ 7,366 $ 5,734Accounts payable 172,735 157,070Dividends payable 5,231 4,775Environmental liabilities 12,544 1,075Other current liabilities 106,444 111,077
Total current liabilities 304,320 279,731
Long-term debt 356,504 398,878Deferred income taxes 76,458 104,016Other long-term liabilities 103,095 129,770
Total liabilities 840,377 912,395Commitments and contingencies – –
Shareholders’ equityCommon stock, $0.01 par value; authorized – 120,000,000; issued – 54,361,980
(including treasury shares: 2015 – 10,941,944; 2014 – 11,307,589) 544 544Capital in excess of par value 54,912 54,342Retained earnings 963,143 919,468Accumulated other comprehensive loss (190,486) (154,870)
828,113 819,484
Less cost of common stock in treasury (164,866) (170,375)
Total shareholders’ equity 663,247 649,109
Total liabilities and shareholders’ equity $1,503,624 $1,561,504
The accompanying notes are an integral part of these consolidated financial statements.
GLATFELTER 2015 FORM 10-K 35

P.H. GLATFELTER COMPANY and SUBSIDIARIESCONSOLIDATED STATEMENTS OF CASH FLOWS
Year ended December 31In thousands 2015 2014 2013
Operating activitiesNet income $ 64,575 $ 69,246 $ 67,158Adjustments to reconcile to net cash provided by operations:
Depreciation, depletion and amortization 63,236 70,555 68,196Amortization of debt issue costs and original issue discount 1,184 1,315 1,305Pension expense, net of unfunded benefits paid 7,383 5,173 12,787Charge for impairment of intangible asset 1,200 3,262 –Deferred income tax benefit (1,902) (9,419) (11,485)Gains on dispositions of plant, equipment and timberlands, net (21,113) (4,861) (1,726)Share-based compensation 7,244 7,859 7,337
Change in operating assets and liabilitiesAccounts receivable (13,312) (5,404) (777)Inventories (8,054) (21,456) 2,704Prepaid and other current assets 5,506 (3,521) 7,965Accounts payable 26,042 (4,175) 24,822Accruals and other current liabilities (2,186) (12,802) 3,140Other 3,940 3,805 (7,791)
Net cash provided by operating activities 133,743 99,577 173,635Investing activitiesExpenditures for purchases of plant, equipment and timberlands (99,889) (66,046) (103,047)Proceeds from disposals of plant, equipment and timberlands, net 24,459 5,072 1,947Acquisition, net of cash acquired (224) (8,015) (210,911)Other (1,600) (600) (425)
Net cash used by investing activities (77,254) (69,589) (312,436)Financing activitiesNet borrowings under (repayments of) revolving credit facility (22,294) (30,720) 126,139Payments of borrowing costs (1,329) – (419)Proceeds from term loans 2,873 12,592 56,091Repayment of term loans (5,229) – –Repurchases of common stock – (12,180) –Payments of dividends (20,443) (18,696) (16,965)Payments related to share-based compensation awards and other (1,594) (1,877) (1,671)
Net cash (used) provided by financing activities (48,016) (50,881) 163,175Effect of exchange rate changes on cash (3,006) (2,152) 829Net increase (decrease) in cash and cash equivalents 5,467 (23,045) 25,203Cash and cash equivalents at the beginning of period 99,837 122,882 97,679Cash and cash equivalents at the end of period $105,304 $ 99,837 $ 122,882
Supplemental cash flow informationCash paid for:
Interest, net of amounts capitalized $ 16,256 $ 17,643 $ 17,231Income taxes, net 15,849 24,139 15,588
The accompanying notes are an integral part of these consolidated financial statements.
36

P. H. GLATFELTER COMPANY and SUBSIDIARIESCONSOLIDATED STATEMENTS OF SHAREHOLDERS’ EQUITYFor the Years Ended December 31, 2015, 2014 and 2013
In thousandsCommon
Stock
Capital inExcess ofPar Value
RetainedEarnings
AccumulatedOther
ComprehensiveLoss
TreasuryStock
TotalShareholders’
Equity
Balance at January 1, 2013 $ 544 $ 52,492 $ 819,593 $ (163,966) $ (168,984) $ 539,679Net income 67,158 67,158Other comprehensive income 88,609 88,609
Comprehensive income 155,767Tax effect on exercise of stock awards 1,451 1,451Cash dividends declared ($0.40 per share) (17,422) (17,422)Share-based compensation expense 4,473 4,473Delivery of treasury shares
RSUs (1,763) 1,234 (529)401 (k) plans 1,099 1,791 2,890Employee stock options exercised – net (3,812) 1,979 (1,833)
Balance at December 31, 2013 544 53,940 869,329 (75,357) (163,980) 684,476
Net income 69,246 69,246Other comprehensive income (79,513) (79,513)
Comprehensive income (10,267)Tax effect on exercise of stock awards (14) (14)Cash dividends declared ($0.44 per share) (19,107) (19,107)Share-based compensation expense 4,738 4,738Repurchase of common shares (12,180) (12,180)Delivery of treasury shares
RSUs and PSAs (4,121) 2,363 (1,758)401 (k) plans 1,318 1,775 3,093Employee stock options exercised – net (1,519) 1,647 128
Balance at December 31, 2014 544 54,342 919,468 (154,870) (170,375) 649,109
Net income 64,575 64,575Other comprehensive income (35,616) (35,616)
Comprehensive income 28,959Tax effect on exercise of stock awards 843 843Cash dividends declared ($0.48 per share) (20,900) (20,900)Share-based compensation expense 4,403 4,403Delivery of treasury shares
RSUs and PSAs (5,078) 3,102 (1,976)401 (k) plans 838 2,010 2,848Employee stock options exercised – net (436) 397 (39)
Balance at December 31, 2015 $544 $54,912 $963,143 $(190,486) $(164,866) $663,247
The accompanying notes are an integral part of the consolidated financial statements.
GLATFELTER 2015 FORM 10-K 37

P. H. GLATFELTER COMPANYNOTES TO CONSOLIDATED FINANCIAL STATEMENTS
1. ORGANIZATION
P. H. Glatfelter Company and subsidiaries(“Glatfelter”) is a manufacturer of specialty papers andfiber-based engineered materials. Headquartered in York,PA, U.S. operations include facilities in Spring Grove, PAand Chillicothe and Fremont, OH. International operationsinclude facilities in Canada, Germany, France, the UnitedKingdom and the Philippines, and sales and distributionoffices in Russia and China. Our products are marketedworldwide, either through wholesale paper merchants,brokers and agents, or directly to customers.
2. ACCOUNTING POLICIES
Principles of Consolidation The consolidatedfinancial statements include the accounts of Glatfelter andits wholly owned subsidiaries. All intercompany balancesand transactions have been eliminated.
Accounting Estimates The preparation offinancial statements in conformity with accountingprinciples generally accepted in the United States ofAmerica requires management to make estimates andassumptions that affect the reported amounts of assetsand liabilities and disclosures of contingencies as of thebalance sheet date and the reported amounts of revenuesand expenses during the reporting period. Managementbelieves the estimates and assumptions used in thepreparation of these consolidated financial statements arereasonable, based upon currently available facts andknown circumstances, but recognizes that actual resultsmay differ from those estimates and assumptions.
Cash and Cash Equivalents We classify allhighly liquid instruments with an original maturity of threemonths or less at the time of purchase as cash equivalents.
Inventories Inventories are stated at the lower ofcost or market. Raw materials, in-process and finishedinventories of our U.S. manufacturing operations arevalued using the last-in, first-out (LIFO) method, and thesupplies inventories are valued principally using theaverage-cost method. Inventories at our foreign operationsare valued using the average cost method.
Plant, Equipment and Timberlands Forfinancial reporting purposes, depreciation is computedusing the straight-line method over the estimated usefullives of the respective assets.
The range of estimated service lives used to calculatefinancial reporting depreciation for principal items of plantand equipment are as follows:
Buildings 15 – 45 YearsMachinery and equipment 5 – 40 YearsOther 3 – 25 Years
Maintenance and Repairs Maintenance andrepairs costs are charged to income and major renewalsand betterments are capitalized. At the time property isretired or sold, the net carrying value is eliminated and anyresultant gain or loss is included in income.
Valuation of Long-lived Assets, IntangibleAssets and Goodwill We evaluate long-lived assets forimpairment when a specific event indicates that thecarrying value of an asset may not be recoverable.Recoverability is assessed based on estimates of futurecash flows expected to result from the use and eventualdisposition of the asset. If the sum of expectedundiscounted cash flows is less than the carrying value ofthe asset, the asset’s fair value is estimated and animpairment loss is recognized for any deficiencies.Goodwill and non-amortizing tradename intangible assetsare reviewed, on a discounted cash flow basis, during thethird quarter of each year for impairment or morefrequently if impairment indicators are present. Impairmentlosses, if any, are recognized for the amount by which thecarrying value of the reporting unit exceeds its fair value.The carrying value of a reporting unit is defined using anenterprise premise which is generally determined by thedifference between the unit’s assets and operatingliabilities.
Asset Retirement Obligations In accordancewith the Financial Accounting Standards Board (“FASB”)Accounting Standards Codification (“ASC”) No. 410,Asset Retirement and Environmental Obligations,we accrue asset retirement obligations in the period inwhich obligations relating to future asset retirements areincurred and when a reasonable estimate of fair value canbe determined. Under these standards, costs are to beaccrued at estimated fair value, and a related long-livedasset is capitalized. Over time, the liability is accreted to itssettlement value and the capitalized cost is depreciatedover the useful life of the related asset for which theobligation exists. Upon settlement of the liability, werecognize a gain or loss for any difference between thesettlement amount and the liability recorded.
38

Income Taxes Income taxes are determined usingthe asset and liability method of accounting for incometaxes in accordance with FASB ASC 740 Income Taxes(“ASC 740”). Under ASC 740, tax expense includes U.S.and international income taxes plus the provision for U.S.taxes on undistributed earnings of internationalsubsidiaries not deemed to be permanently invested. Taxcredits and other incentives reduce tax expense in the yearthe credits are claimed. Certain items of income andexpense are not reported in tax returns and financialstatements in the same year. The tax effect of suchtemporary differences is reported in deferred income taxes.Deferred tax assets are recognized if it is more likely thannot that the assets will be realized in future years. Weestablish a valuation allowance for deferred tax assets forwhich realization is not more likely than not.
Significant judgment is required in determining ourworldwide provision for income taxes and recording therelated assets and liabilities. In the ordinary course of ourbusiness, there are many transactions and calculationswhere the ultimate tax determination is less than certain.We and our subsidiaries are examined by various Federal,State, and foreign tax authorities. We regularly assess thepotential outcomes of these examinations and any futureexaminations for the current or prior years in determiningthe adequacy of our provision for income taxes. Wecontinually assess the likelihood and amount of potentialadjustments and record any necessary adjustments in theperiod in which the facts that give rise to a revisionbecome known.
Treasury Stock Common stock purchased fortreasury is recorded at cost. At the date of subsequentreissue, the treasury stock account is reduced by the cost ofsuch stock on the weighted-average cost basis.
Foreign Currency Translation Foreign currencytranslation gains and losses and the effect of exchangerate changes on transactions designated as hedges of netforeign investments are included as a component of othercomprehensive income (loss). Transaction gains and lossesare included in income in the period in which they occur.
Revenue Recognition We recognize revenue onproduct sales when the customer takes title and assumesthe risks and rewards of ownership. Estimated costs forsales incentives, discounts and sales returns andallowances are recorded as sales deductions in the periodin which the related revenue is recognized.
Revenue from energy sales is recognized whenelectricity is delivered to the customer. Certain costsassociated with the production of electricity, such as fuel,
labor, depreciation and maintenance are netted againstenergy sales for presentation on the consolidatedstatements of income.
Revenue from renewable energy credits is recordedunder the caption “Energy and related sales, net” in theconsolidated statements of income and is recognized whenall risks, rights and rewards to the certificate aretransferred to the counterparty.
Environmental Liabilities Accruals for lossesassociated with environmental obligations are recordedwhen it is probable that a liability has been incurred andthe amount of the liability can be reasonably estimatedbased on existing legislation and remediation technologies.These accruals are adjusted periodically as assessment andremediation actions continue and/or further legal ortechnical information develops. Such undiscountedliabilities are exclusive of any insurance or other claimsagainst third parties. Environmental costs are capitalized ifthe costs extend the life of the asset, increase its capacityand/or mitigate or prevent contamination from futureoperations. Recoveries of environmental remediation costsfrom other parties, including insurance carriers, arerecorded as assets when their receipt is assured beyond areasonable doubt.
Earnings Per Share Basic earnings per share iscomputed by dividing net income by the weighted-averagecommon shares outstanding during the respective periods.Diluted earnings per share is computed by dividing netincome by the weighted-average common shares andcommon share equivalents outstanding during the period.The dilutive effect of common share equivalents isconsidered in the diluted earnings per share computationusing the treasury stock method.
Financial Derivatives and HedgingActivities We use financial derivatives to manageexposure to changes in foreign currencies. In accordancewith FASB ASC 815 Derivatives and Hedging (“ASC815”), we record all derivatives on the balance sheet atfair value. The accounting for changes in the fair value ofderivatives depends on the intended use of the derivative,whether we have elected to designate a derivative in ahedging relationship and apply hedge accounting, andwhether the hedging relationship has satisfied the criterianecessary to apply hedge accounting.
Cash Flow Hedges The effective portion of thegain or loss on those derivative instruments designatedand qualifying as a hedge of the exposure to variability inexpected future cash flows related to forecastedtransactions is deferred and reported as a component of
GLATFELTER 2015 FORM 10-K 39

accumulated other comprehensive income (loss). Deferredgains or losses are reclassified to our results of operationsat the time the hedged forecasted transaction is recordedin our results of operations. The effectiveness of cash flowhedges is assessed at inception and quarterly thereafter. Ifthe instrument becomes ineffective or it becomes probablethat the originally forecasted transaction will not occur, therelated change in fair value of the derivative instrument isalso reclassified from accumulated other comprehensiveincome (loss) and recognized in earnings.
Fair Value of Financial Instruments Under theaccounting for fair value measurements and disclosures, afair value hierarchy was established that prioritizes theinputs to valuation techniques used to measure fair value.The hierarchy gives the highest priority to unadjustedquoted prices in active markets for identical assets orliabilities (Level 1 measurements) and the lowest priority tounobservable inputs (Level 3 measurements). A financialinstrument’s level within the fair value hierarchy is basedon the lowest level of any input that is significant to thefair value measurement. The three levels of the fair valuehierarchy are described below:
Level 1 – Unadjusted quoted prices in active markets thatare accessible at the measurement date foridentical, unrestricted assets or liabilities.
Level 2 – Inputs other than quoted prices included withinLevel 1 that are observable for the asset orliability, either directly or indirectly, includingquoted prices for similar assets or liabilities inactive markets; quoted prices for identical orsimilar assets or liabilities in markets that are notactive; inputs other than quoted prices that areobservable for the asset or liability (e.g., interestrates); and inputs that are derived principallyfrom or corroborated by observable market databy correlation or other means.
Level 3 – Inputs that are both significant to the fair valuemeasurement and unobservable.
Recently Issued Accounting Pronouncements
In February 2016, the FASB issued AccountingStandards Update (“ASU”) No. 2016-02, Leases(Topic 842). The ASU will require organizations that leaseassets – referred to as “lessees” – to recognize on thebalance sheet the assets and liabilities for the rights andobligations created by those leases. The new guidance willbe effective for annual periods beginning afterDecember 15, 2018, and interim periods therein. Early
adoption is permitted. We have yet to analyze or assessthe impact this standard will have on us.
In April 2015, the FASB issued ASU No. 2015-03,Interest - Imputation of Interest (Subtopic 835-30)Simplifying the Presentation of Debt Issuance Costs(ASU 2015-03). This update requires debt issuance costs tobe presented as a direct deduction from the carrying value ofthe related debt instrument rather than as a deferred assetexcept for costs associated with a revolving line of credit.The guidance in ASU 2015-03 is required for annualreporting periods beginning after December 15, 2015,including interim periods within the reporting period. Thisstandard will be adopted in the first quarter of 2016 and willresult in the reclassification of approximately $3.1 million ofunamortized deferred debt issuance fees.
In May 2014, the FASB issued ASU No. 2014-09 -Revenue from Contracts with Customers whichclarifies the principles for recognizing revenue anddevelops a common revenue standard for GAAP andInternational Financial Reporting Standards. The newstandard is required to be adopted for fiscal yearsbeginning after December 15, 2017 and early adoption ispermitted only for reporting periods beginning afterDecember 31, 2016. We are in the process of evaluatingthe impact this standard may have, if any, on our reportedresults of operations or financial position.
3. ACQUISITIONS
On October 1, 2014, we completed the acquisition ofall of the outstanding equity of SpezialpapierfabrikOberschmitten GmbH (“SPO”) from FINSPO Beteiligungs-GmbH for $8.0 million. SPO had annual sales ofapproximately $33 million in 2014. SPO, located nearFrankfurt, Germany, primarily produces highly technicalpapers for a wide range of capacitors used in consumerand industrial products; insulation papers for cables andtransformers; and materials for industrial power inverters,electromagnetic current filters and electric rail traction.SPO also produces glassine products, which are used incosmetics packaging, food packaging, and pharmaceuticaldosage bags. SPO is operated as part of the CompositeFibers business unit, and complements our technicalspecialties products.
On April 30, 2013, we completed the acquisition ofall outstanding shares of Dresden Papier GmbH(“Dresden”) from Fortress Paper Ltd. for $211 million, netof cash acquired. Dresden, based in Heidenau, Germany, isthe leading global supplier of nonwoven wallpaper basematerials, and is a major supplier to most of the world’s
40
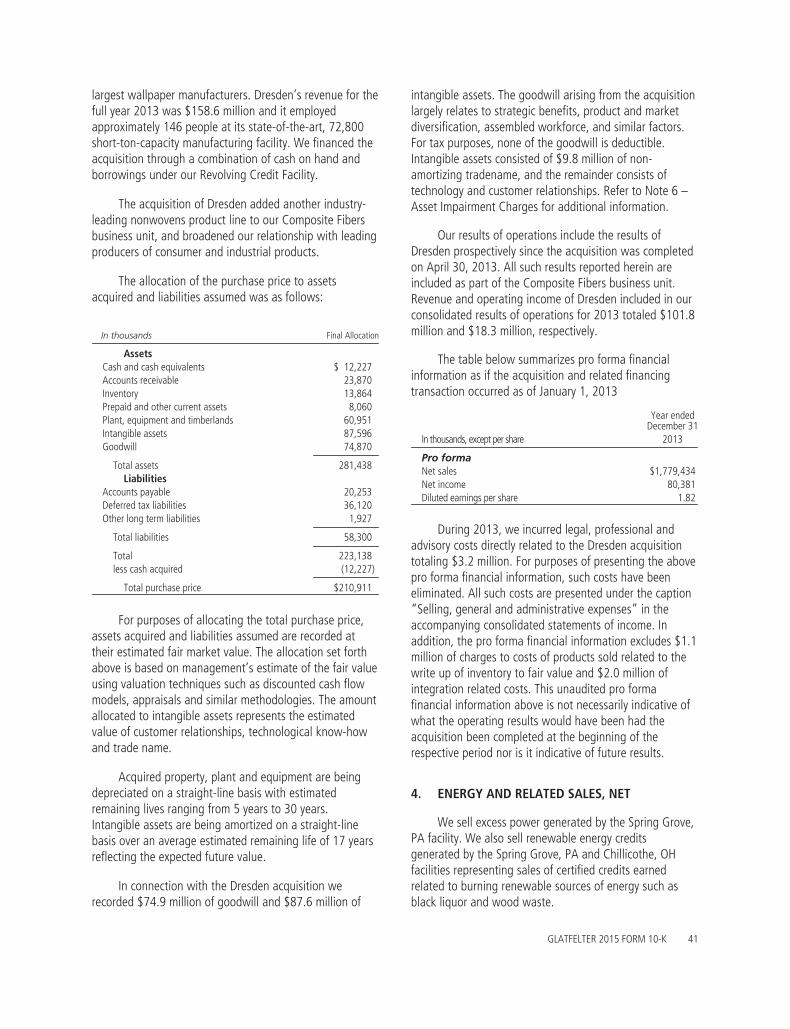
largest wallpaper manufacturers. Dresden’s revenue for thefull year 2013 was $158.6 million and it employedapproximately 146 people at its state-of-the-art, 72,800short-ton-capacity manufacturing facility. We financed theacquisition through a combination of cash on hand andborrowings under our Revolving Credit Facility.
The acquisition of Dresden added another industry-leading nonwovens product line to our Composite Fibersbusiness unit, and broadened our relationship with leadingproducers of consumer and industrial products.
The allocation of the purchase price to assetsacquired and liabilities assumed was as follows:
In thousands Final Allocation
AssetsCash and cash equivalents $ 12,227Accounts receivable 23,870Inventory 13,864Prepaid and other current assets 8,060Plant, equipment and timberlands 60,951Intangible assets 87,596Goodwill 74,870
Total assets 281,438Liabilities
Accounts payable 20,253Deferred tax liabilities 36,120Other long term liabilities 1,927
Total liabilities 58,300
Total 223,138less cash acquired (12,227)
Total purchase price $210,911
For purposes of allocating the total purchase price,assets acquired and liabilities assumed are recorded attheir estimated fair market value. The allocation set forthabove is based on management’s estimate of the fair valueusing valuation techniques such as discounted cash flowmodels, appraisals and similar methodologies. The amountallocated to intangible assets represents the estimatedvalue of customer relationships, technological know-howand trade name.
Acquired property, plant and equipment are beingdepreciated on a straight-line basis with estimatedremaining lives ranging from 5 years to 30 years.Intangible assets are being amortized on a straight-linebasis over an average estimated remaining life of 17 yearsreflecting the expected future value.
In connection with the Dresden acquisition werecorded $74.9 million of goodwill and $87.6 million of
intangible assets. The goodwill arising from the acquisitionlargely relates to strategic benefits, product and marketdiversification, assembled workforce, and similar factors.For tax purposes, none of the goodwill is deductible.Intangible assets consisted of $9.8 million of non-amortizing tradename, and the remainder consists oftechnology and customer relationships. Refer to Note 6 –Asset Impairment Charges for additional information.
Our results of operations include the results ofDresden prospectively since the acquisition was completedon April 30, 2013. All such results reported herein areincluded as part of the Composite Fibers business unit.Revenue and operating income of Dresden included in ourconsolidated results of operations for 2013 totaled $101.8million and $18.3 million, respectively.
The table below summarizes pro forma financialinformation as if the acquisition and related financingtransaction occurred as of January 1, 2013
Year endedDecember 31
2013In thousands, except per share
Pro formaNet sales $1,779,434Net income 80,381Diluted earnings per share 1.82
During 2013, we incurred legal, professional andadvisory costs directly related to the Dresden acquisitiontotaling $3.2 million. For purposes of presenting the abovepro forma financial information, such costs have beeneliminated. All such costs are presented under the caption“Selling, general and administrative expenses” in theaccompanying consolidated statements of income. Inaddition, the pro forma financial information excludes $1.1million of charges to costs of products sold related to thewrite up of inventory to fair value and $2.0 million ofintegration related costs. This unaudited pro formafinancial information above is not necessarily indicative ofwhat the operating results would have been had theacquisition been completed at the beginning of therespective period nor is it indicative of future results.
4. ENERGY AND RELATED SALES, NET
We sell excess power generated by the Spring Grove,PA facility. We also sell renewable energy creditsgenerated by the Spring Grove, PA and Chillicothe, OHfacilities representing sales of certified credits earnedrelated to burning renewable sources of energy such asblack liquor and wood waste.
GLATFELTER 2015 FORM 10-K 41

The following table summarizes this activity for eachof the past three years:
Year ended December 31In thousands 2015 2014 2013
Energy sales $ 5,315 $11,886 $ 8,189Costs to produce (4,428) (6,204) (6,784)
Net 887 5,682 1,405Renewable energy credits 4,777 2,245 1,748
Total $ 5,664 $ 7,927 $ 3,153
5. GAIN ON DISPOSITIONS OF PLANT,EQUIPMENT AND TIMBERLANDS
During 2015, 2014 and 2013, we completed thefollowing sales of assets:
Dollars in thousands Acres Proceeds Gain
2015Timberlands 15,628 $23,917 $20,867Other n/a 542 246
Total $24,459 $21,113
2014Timberlands 2,753 $ 5,062 $ 4,855Other n/a 10 6
Total $ 5,072 $ 4,861
2013Timberlands 876 $ 1,445 $ 1,410Other n/a 502 316
Total $ 1,947 $ 1,726
6. ASSET IMPAIRMENT CHARGES
During 2015 and 2014, in connection with ourannual test of potential impairment of indefinite livedintangible assets, we recorded $1.2 million and $3.3million, respectively, of non-cash asset impairmentcharges. The trade name intangible asset was acquired inconnection with our Composite Fibers business unit’s 2013Dresden acquisition. The charges were due to changes inthe estimated fair value of the trade name, primarily drivenby lower forecasted revenues associated with the business,
an increase in discount rates related to Dresden’s businessin Russia and Ukraine and this region’s political andeconomic instability. The fair value of the asset wasestimated using a discounted cash flow model under arelief from royalty method. The significant assumptionsused included projected financial performance anddiscount rates, which resulted in a Level 3 fair valueclassification.
The charge is recorded in the accompanyingconsolidated statements of income under the caption“Selling, general and administrative expenses.” Foradditional information on Goodwill and Intangible Assets,see Note 14.
7. EARNINGS PER SHARE
The following table sets forth the details of basic anddiluted earnings per share (EPS):
Year ended December 31In thousands, except per share 2015 2014 2013
Net income $64,575 $69,246 $67,158
Weighted average common sharesoutstanding used in basic EPS 43,397 43,201 43,158
Common shares issuable uponexercise of dilutive stock optionsand PSAs / RSUs 545 865 1,141
Weighted average common sharesoutstanding and common shareequivalents used in diluted EPS 43,942 44,066 44,299
Earnings per shareBasic $ 1.49 $ 1.60 $ 1.56Diluted 1.47 1.57 1.52
The following table sets forth the potential commonshares outstanding for stock options and restricted stockunits that were not included in the computation of dilutedEPS for the period indicated, because their effect would beanti-dilutive:
Year ended December 31In thousands 2015 2014 2013
Potential common shares 678 277 7
42
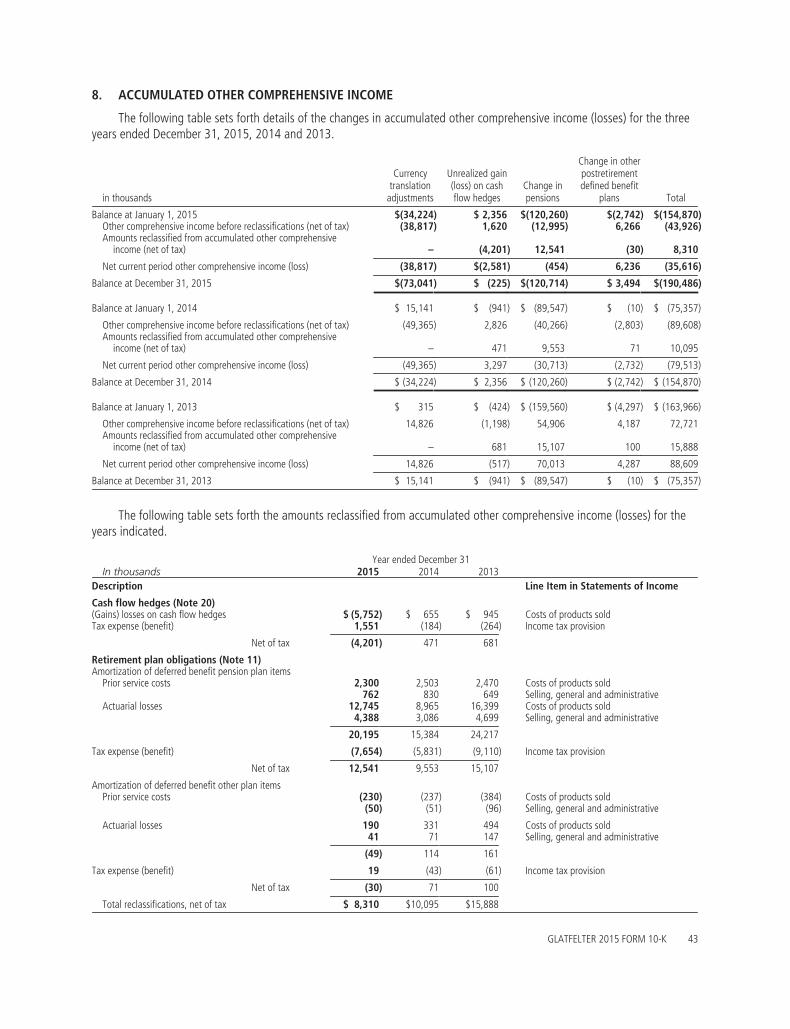
8. ACCUMULATED OTHER COMPREHENSIVE INCOME
The following table sets forth details of the changes in accumulated other comprehensive income (losses) for the threeyears ended December 31, 2015, 2014 and 2013.
in thousands
Currencytranslation
adjustments
Unrealized gain(loss) on cashflow hedges
Change inpensions
Change in otherpostretirementdefined benefit
plans Total
Balance at January 1, 2015 $(34,224) $ 2,356 $(120,260) $(2,742) $(154,870)Other comprehensive income before reclassifications (net of tax) (38,817) 1,620 (12,995) 6,266 (43,926)Amounts reclassified from accumulated other comprehensive
income (net of tax) – (4,201) 12,541 (30) 8,310
Net current period other comprehensive income (loss) (38,817) $(2,581) (454) 6,236 (35,616)
Balance at December 31, 2015 $(73,041) $ (225) $(120,714) $ 3,494 $(190,486)
Balance at January 1, 2014 $ 15,141 $ (941) $ (89,547) $ (10) $ (75,357)
Other comprehensive income before reclassifications (net of tax) (49,365) 2,826 (40,266) (2,803) (89,608)Amounts reclassified from accumulated other comprehensive
income (net of tax) – 471 9,553 71 10,095
Net current period other comprehensive income (loss) (49,365) 3,297 (30,713) (2,732) (79,513)
Balance at December 31, 2014 $ (34,224) $ 2,356 $ (120,260) $ (2,742) $ (154,870)
Balance at January 1, 2013 $ 315 $ (424) $ (159,560) $ (4,297) $ (163,966)
Other comprehensive income before reclassifications (net of tax) 14,826 (1,198) 54,906 4,187 72,721Amounts reclassified from accumulated other comprehensive
income (net of tax) – 681 15,107 100 15,888
Net current period other comprehensive income (loss) 14,826 (517) 70,013 4,287 88,609
Balance at December 31, 2013 $ 15,141 $ (941) $ (89,547) $ (10) $ (75,357)
The following table sets forth the amounts reclassified from accumulated other comprehensive income (losses) for theyears indicated.
Year ended December 31In thousands 2015 2014 2013
Description Line Item in Statements of Income
Cash flow hedges (Note 20)(Gains) losses on cash flow hedges $ (5,752) $ 655 $ 945 Costs of products soldTax expense (benefit) 1,551 (184) (264) Income tax provision
Net of tax (4,201) 471 681
Retirement plan obligations (Note 11)Amortization of deferred benefit pension plan items
Prior service costs 2,300 2,503 2,470 Costs of products sold762 830 649 Selling, general and administrative
Actuarial losses 12,745 8,965 16,399 Costs of products sold4,388 3,086 4,699 Selling, general and administrative
20,195 15,384 24,217
Tax expense (benefit) (7,654) (5,831) (9,110) Income tax provision
Net of tax 12,541 9,553 15,107
Amortization of deferred benefit other plan itemsPrior service costs (230) (237) (384) Costs of products sold
(50) (51) (96) Selling, general and administrative
Actuarial losses 190 331 494 Costs of products sold41 71 147 Selling, general and administrative
(49) 114 161
Tax expense (benefit) 19 (43) (61) Income tax provision
Net of tax (30) 71 100
Total reclassifications, net of tax $ 8,310 $10,095 $15,888
GLATFELTER 2015 FORM 10-K 43
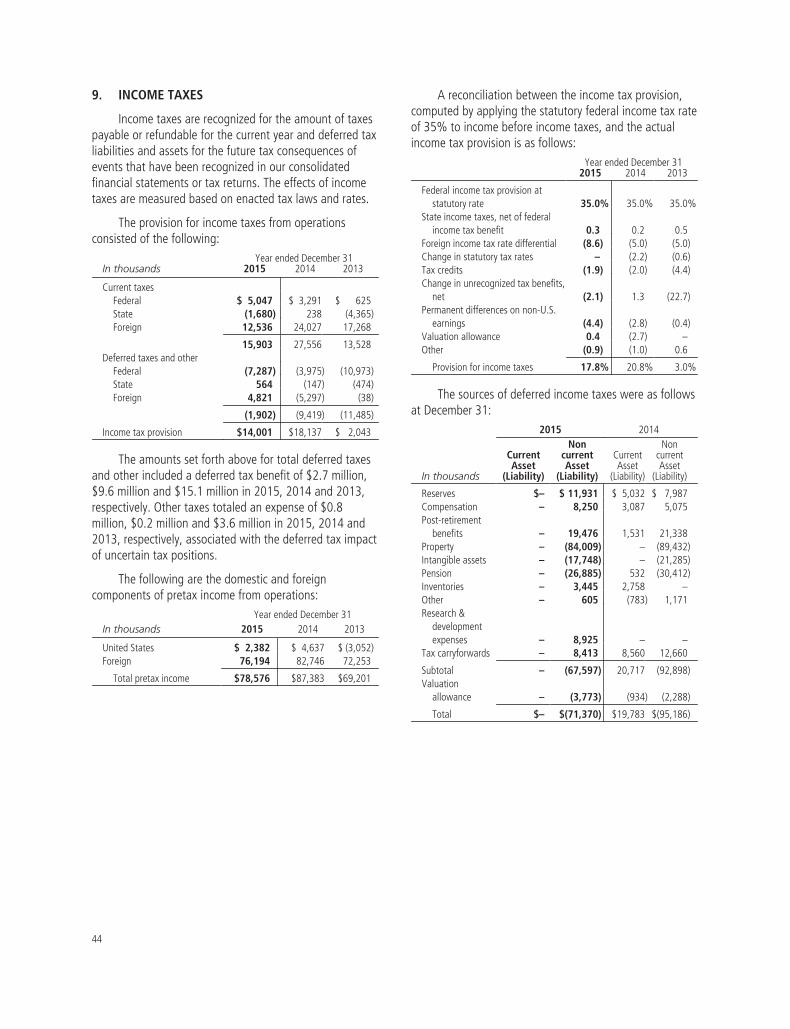
9. INCOME TAXES
Income taxes are recognized for the amount of taxespayable or refundable for the current year and deferred taxliabilities and assets for the future tax consequences ofevents that have been recognized in our consolidatedfinancial statements or tax returns. The effects of incometaxes are measured based on enacted tax laws and rates.
The provision for income taxes from operationsconsisted of the following:
Year ended December 31In thousands 2015 2014 2013
Current taxesFederal $ 5,047 $ 3,291 $ 625State (1,680) 238 (4,365)Foreign 12,536 24,027 17,268
15,903 27,556 13,528Deferred taxes and other
Federal (7,287) (3,975) (10,973)State 564 (147) (474)Foreign 4,821 (5,297) (38)
(1,902) (9,419) (11,485)
Income tax provision $14,001 $18,137 $ 2,043
The amounts set forth above for total deferred taxesand other included a deferred tax benefit of $2.7 million,$9.6 million and $15.1 million in 2015, 2014 and 2013,respectively. Other taxes totaled an expense of $0.8million, $0.2 million and $3.6 million in 2015, 2014 and2013, respectively, associated with the deferred tax impactof uncertain tax positions.
The following are the domestic and foreigncomponents of pretax income from operations:
Year ended December 31In thousands 2015 2014 2013
United States $ 2,382 $ 4,637 $ (3,052)Foreign 76,194 82,746 72,253
Total pretax income $78,576 $87,383 $69,201
A reconciliation between the income tax provision,computed by applying the statutory federal income tax rateof 35% to income before income taxes, and the actualincome tax provision is as follows:
Year ended December 312015 2014 2013
Federal income tax provision atstatutory rate 35.0% 35.0% 35.0%
State income taxes, net of federalincome tax benefit 0.3 0.2 0.5
Foreign income tax rate differential (8.6) (5.0) (5.0)Change in statutory tax rates – (2.2) (0.6)Tax credits (1.9) (2.0) (4.4)Change in unrecognized tax benefits,
net (2.1) 1.3 (22.7)Permanent differences on non-U.S.
earnings (4.4) (2.8) (0.4)Valuation allowance 0.4 (2.7) –Other (0.9) (1.0) 0.6
Provision for income taxes 17.8% 20.8% 3.0%
The sources of deferred income taxes were as followsat December 31:
2015 2014
In thousands
CurrentAsset
(Liability)
NoncurrentAsset
(Liability)
CurrentAsset
(Liability)
NoncurrentAsset
(Liability)
Reserves $– $ 11,931 $ 5,032 $ 7,987Compensation – 8,250 3,087 5,075Post-retirement
benefits – 19,476 1,531 21,338Property – (84,009) – (89,432)Intangible assets – (17,748) – (21,285)Pension – (26,885) 532 (30,412)Inventories – 3,445 2,758 –Other – 605 (783) 1,171Research &
developmentexpenses – 8,925 – –
Tax carryforwards – 8,413 8,560 12,660
Subtotal – (67,597) 20,717 (92,898)Valuation
allowance – (3,773) (934) (2,288)
Total $– $(71,370) $19,783 $(95,186)
44

Current and non-current deferred tax assets andliabilities are included in the following balance sheetcaptions:
December 31In thousands 2015 2014
Prepaid expenses andother current assets $ – $ 20,017
Other assets 5,088 8,830Other current liabilities – 234Deferred income taxes 76,458 104,016
We early adopted Accounting Standards Update2015-17, Income Taxes (Topic 740) effective December 31,2015 on a prospective basis. Adoption of this ASU requiredthe reclassification of our current deferred tax assets andliabilities to non-current deferred tax assets and liabilitiesin our consolidated balance sheet as of December 31,2015. No prior periods were retrospectively adjusted. Theadoption of ASU 2015-17 had no impact on ourconsolidated results of income or financial position.
At December 31, 2015 we had state and foreign taxnet operating loss (“NOL”) carryforwards of $80.9 millionand $4.2 million, respectively. These NOL carryforwards areavailable to offset future taxable income, if any. The stateNOL carryforwards expire at various times and in variousamounts beginning in 2016 and through 2035. Certainforeign NOL carryforwards begin to expire in 2019.
The state and foreign NOL carryforwards on theincome tax returns filed included unrecognized tax benefitstaken in prior years. The NOLs for which a deferred taxasset is recognized for financial statement purposes inaccordance with ASC 740 are presented net of theseunrecognized tax benefits.
In addition, we had various state tax creditcarryforwards totaling $0.4 million, which begin to expirein 2016, and foreign investment tax credits of $2.3 millionwhich begin to expire in 2028.
As of December 31, 2015 and 2014, we had valuationallowances of $3.8 million and $3.2 million, respectively,against net deferred tax assets, primarily due to uncertaintyregarding the ability to utilize state and foreign tax NOLcarryforwards and certain state tax credits. The change inthe valuation allowance was primarily due to the inability toutilize certain state NOLs before they expire.
Tax credits and other incentives reduce tax expense inthe year the credits are claimed. We recorded tax credits of$1.5 million, $1.8 million and $3.0 million in 2015, 2014and 2013, respectively, related to research anddevelopment credits and fuels tax credits.
At December 31, 2015 and 2014, unremittedearnings of subsidiaries outside the United States deemedto be indefinitely reinvested totaled $338.6 million and$305.6 million, respectively. Because the unremittedearnings of subsidiaries are deemed to be indefinitelyreinvested as of December 31, 2015 and because we haveno need, or plans, to repatriate such earnings, no deferredtax liability has been recognized in our consolidatedfinancial statements. It is not practicable to determine theamount of additional taxes that have not been provided.
As of December 31, 2015, 2014 and 2013, we had$12.2 million, $14.9 million and $14.9 million of grossunrecognized tax benefits, respectively. As ofDecember 31, 2015, if such benefits were to berecognized, approximately $10.8 million would berecorded as a component of income tax expense, therebyaffecting our effective tax rate.
A reconciliation of the beginning and endingbalances of the total amounts of gross unrecognized taxbenefits is as follows:
In millions 2015 2014 2013
Balance at January 1 $14.9 $14.9 $ 30.4Increases in tax positions for prior
years – 0.7 0.2Decreases in tax positions for prior
years (4.3) (0.5) (4.9)Acquisition related:
Purchase Accounting – 0.3 1.3Increases in tax positions for
current year 1.9 3.4 1.7Settlements – (1.3) –Lapse in statutes of limitation (0.3) (2.6) (13.8)
Balance at December 31 $12.2 $14.9 $ 14.9
We, or one of our subsidiaries, file income tax returnswith the United States Internal Revenue Service, as well asvarious state and foreign authorities. The following tablesummarizes tax years that remain subject to examinationby major jurisdiction:
Open Tax Years
JurisdictionExaminations not yet
initiatedExamination in
progress
United StatesFederal 2013 – 2015 N/AState 2011 – 2015 2012 – 2014
Canada(1) 2010 – 2015 N/AGermany(1) 2012 – 2015 2007 – 2011France 2013 – 2015 2011 – 2012United Kingdom 2014 – 2015 N/APhilippines 2012, 2014 – 2015 2013
(1) includes provincial or similar local jurisdictions, as applicable.
GLATFELTER 2015 FORM 10-K 45

The amount of income taxes we pay is subject toongoing audits by federal, state and foreign taxauthorities, which often result in proposed assessments.Management performs a comprehensive review of itsglobal tax positions on a quarterly basis and accruesamounts for uncertain tax positions. Based on thesereviews and the result of discussions and resolutions ofmatters with certain tax authorities and the closure of taxyears subject to tax audit, reserves are adjusted asnecessary. However, future results may include favorable orunfavorable adjustments to our estimated tax liabilities inthe period the assessments are determined or resolved oras such statutes are closed. Due to potential for resolutionof federal, state and foreign examinations, and theexpiration of various statutes of limitation, it is reasonablypossible our gross unrecognized tax benefits balance maydecrease within the next twelve months by a range of zeroto $1.7 million. Substantially all of this range relates to taxpositions taken in Germany.
We recognize interest and penalties related touncertain tax positions as income tax expense. Thefollowing table summarizes information related to interestand penalties on uncertain tax positions:
As of or for the year endedDecember 31
In millions 2015 2014 2013
Accrued interest payable $0.6 $0.6 $ 0.6Interest expense (income) – – (0.8)Penalties – – –
10. STOCK-BASED COMPENSATION
The P. H. Glatfelter Amended and Restated LongTerm Incentive Plan (the “LTIP”) provides for the issuanceof Glatfelter common stock to eligible participants in theform of restricted stock units, restricted stock awards, non-qualified stock options, performance shares, incentivestock options and performance units. As of December 31,2015, there were 1,364,223 shares of common stockavailable for future issuance under the LTIP.
Since the approval of the LTIP, we have issued toeligible participants restricted stock units, performanceshare awards and stock only stock appreciation rights(“SOSARs”).
Restricted Stock Units (“RSUs”) andPerformance Share Awards (“PSAs”) Awards ofRSUs and PSAs are made under our LTIP. The vesting ofRSUs is generally based on the passage of time, generallyon a graded scale over a three, four, and five-year period.Beginning in March of 2011, PSAs were issued annually tomembers of senior management and each respective grantcliff vests each December 31, assuming the achievement ofpredetermined, three-year cumulative performance targets.The performance measures include a minimum, target andmaximum performance level providing the grantees anopportunity to receive more or less shares than targeteddepending on actual financial performance. For both RSUsand PSAs, the grant date fair value of the awards, which isequal to the closing price per common share on the date ofthe award, is used to determine the amount of expense tobe recognized over the applicable service period.Settlement of RSUs and PSAs will be made in shares of ourcommon stock currently held in treasury.
The following table summarizes RSU and PSA activityduring the past three years:
Units 2015 2014 2013
Balance at January 1, 888,942 1,001,814 847,679Granted 164,666 178,882 315,196Forfeited (92,183) (47,379) (47,831)Shares delivered (286,902) (244,375) (113,230)
Balance at December 31, 674,523 888,942 1,001,814
2015 2014 2013
Compensation expense $ 1,758 $ 2,652 $ 2,882
The amount granted in 2015, 2014 and 2013includes 105,017, 101,743 and 183,910 PSAs,respectively, exclusive of reinvested dividends. Theperformance period for the 2013 PSAs concluded onDecember 31, 2015 and, based on actual performancerelative to target, approximately 25% of the award wasissued to participants in 2016. The weighted average grantdate fair value per unit for awards in 2015, 2014 and2013 was $24.62, $28.89 and $22.34, respectively. As ofDecember 31, 2015, unrecognized compensation expensefor outstanding RSUs and PSAs totaled $4.8 million. Theweighted average remaining period over which theexpense will be recognized is 2.5 years.
46

Stock Only Stock Appreciation Rights The following table sets forth information related to outstanding SOSARS:2015 2014 2013
SOSARS SharesWtd Avg
Exercise Price SharesWtd Avg
Exercise Price SharesWtd Avg
Exercise Price
Outstanding at January 1, 1,864,707 $16.20 1,977,133 $13.91 2,121,454 $12.93Granted 423,590 24.62 281,881 29.78 368,687 18.51Exercised (70,347) 14.12 (364,465) 13.99 (435,562) 12.63Canceled / forfeited (18,208) 25.41 (29,842) 19.36 (77,446) 16.28
Outstanding at December 31, 2,199,742 $17.82 1,864,707 $16.20 1,977,133 $13.91Exercisable at December 31, 1,504,599 14.48 1,285,998 12.94 1,330,816 12.58Vested and expected to vest 2,178,708 1,754,295 1,863,244
SOSAR Grants
Weighted average grant date fair value per share $ 7.46 $ 9.81 $ 5.74Aggregate grant date fair value (in thousands) $ 3,134 $ 2,764 $ 2,103Black-Scholes assumptions
Dividend yield 1.94% 1.48% 2.16%Risk free rate of return 1.64% 1.74% 1.01%Volatility 36.38% 37.59% 39.58%Expected life 6 yrs 6 yrs 6 yrs
Compensation expense (in thousands) $ 2,645 $ 2,086 $ 1,591
Under terms of the SOSAR, the recipients received theright to receive a payment in the form of shares of commonstock equal to the difference, if any, in the fair market value ofone share of common stock at the time of exercising theSOSAR and the exercise price. The SOSARs vest ratably over athree year period. As of December 31, 2015, the intrinsicvalue of SOSARs vested and expected to vest totaled $7.1million. The remaining weighted average contractual life ofoutstanding SOSARs was 5.4 years as of December 31, 2015.
11. RETIREMENT PLANS AND OTHER POST-RETIREMENT BENEFITS
We provide non-contributory retirement benefitsunder both funded and unfunded plans to all U.S.employees and to certain non-U.S. employees.Participation and benefits under the plans are based uponthe employees’ date of hire and the covered group inwhich that employee falls. U.S. benefits are based oneither a unit-benefit formula for bargained hourlyemployees, or a final average pay formula or cash balanceformula for salaried employees. Non-U.S. benefits arebased, in the case of certain plans, on average salary andyears of service and, in the case of other plans, on a fixedamount for each year of service. U.S. plan provisions andfunding meet the requirements of the Employee RetirementIncome Security Act of 1974. We use a December 31-measurement date for all of our defined benefit plans.
We also provide certain health care benefits toeligible U.S.-based retired employees and exclude allsalaried employees hired after January 1, 2008. Thesebenefits include a comprehensive medical plan for retireesprior to age 65 and fixed supplemental premium payments
to certain retirees over age 65 to help defray the costs ofMedicare. Claims are paid as reported.
Pension Benefits Other BenefitsIn millions 2015 2014 2015 2014
Change in Benefit ObligationBalance at beginning of year $577.6 $487.7 $ 59.8 $ 54.8Service cost 11.6 10.4 1.4 1.5Interest cost 23.3 24.8 2.0 2.5Plan amendments – 3.6 – –Participant contributions – – 1.2 1.3Actuarial (gain)/loss (34.8) 83.9 (10.1) 4.5Benefits paid (34.8) (31.5) (3.3) (4.8)Effect of currency rate changes (1.0) (1.3) – –
Balance at end of year $541.9 $577.6 $ 51.0 $ 59.8
Change in Plan AssetsFair value of plan assets at
beginning of year $638.0 $601.2 $ – $ –Actual return on plan assets (10.3) 66.3 – –Total contributions 2.0 2.0 3.3 4.8Benefits paid (34.8) (31.5) (3.3) (4.8)
Fair value of plan assets at endof year $594.9 $638.0 – –
Funded status at end of year $ 53.0 $ 60.4 $(51.0) $(59.8)
The December 31, 2014 measurement of projectedbenefit obligations reflected the adoption of new mortalityassumptions derived from actuarially determined expectedlives. The impact of changing assumptions is reflected asan actuarial loss in the change in benefit obligation.
Amounts recognized in the consolidated balancesheets consist of the following as of December 31:
Pension Benefits Other Benefits
In millions 2015 2014 2015 2014
Other long-term assets $ 89.1 $102.0 $ – $ –Current liabilities (2.1) (2.0) (3.2) (3.7)Other long-term liabilities (34.0) (39.6) (47.7) (56.1)
Net amount recognized $ 53.0 $ 60.4 $(50.9) $(59.8)
GLATFELTER 2015 FORM 10-K 47
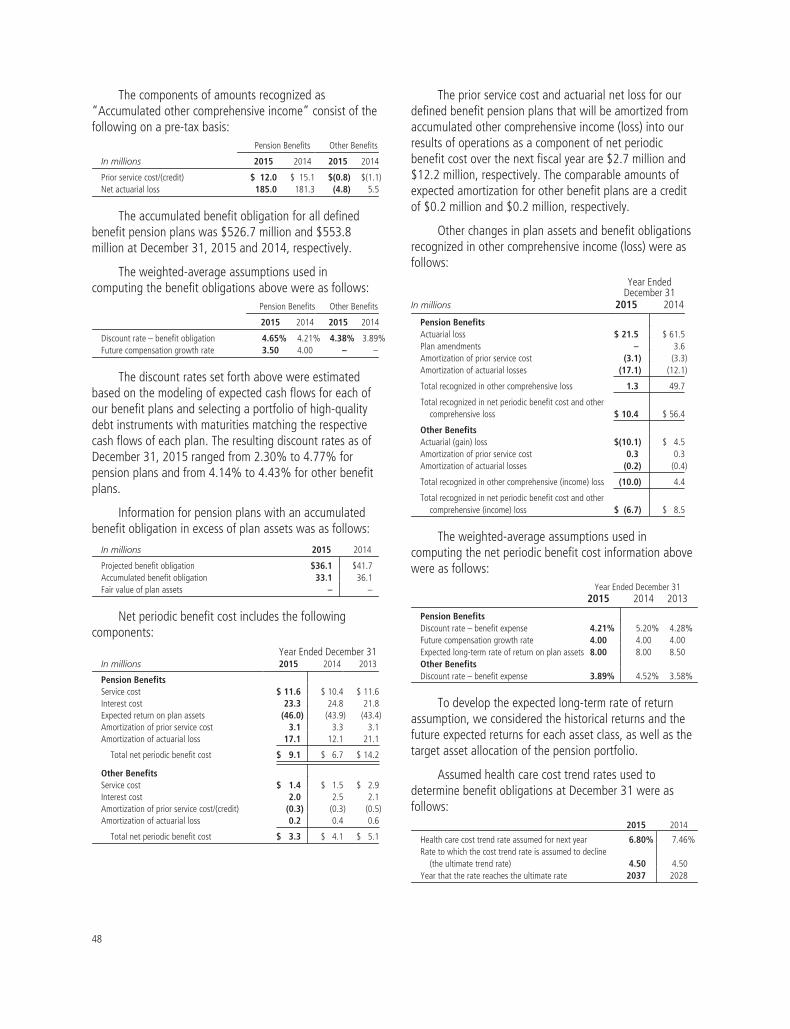
The components of amounts recognized as“Accumulated other comprehensive income” consist of thefollowing on a pre-tax basis:
Pension Benefits Other Benefits
In millions 2015 2014 2015 2014
Prior service cost/(credit) $ 12.0 $ 15.1 $(0.8) $(1.1)Net actuarial loss 185.0 181.3 (4.8) 5.5
The accumulated benefit obligation for all definedbenefit pension plans was $526.7 million and $553.8million at December 31, 2015 and 2014, respectively.
The weighted-average assumptions used incomputing the benefit obligations above were as follows:
Pension Benefits Other Benefits
2015 2014 2015 2014
Discount rate – benefit obligation 4.65% 4.21% 4.38% 3.89%Future compensation growth rate 3.50 4.00 – –
The discount rates set forth above were estimatedbased on the modeling of expected cash flows for each ofour benefit plans and selecting a portfolio of high-qualitydebt instruments with maturities matching the respectivecash flows of each plan. The resulting discount rates as ofDecember 31, 2015 ranged from 2.30% to 4.77% forpension plans and from 4.14% to 4.43% for other benefitplans.
Information for pension plans with an accumulatedbenefit obligation in excess of plan assets was as follows:
In millions 2015 2014
Projected benefit obligation $36.1 $41.7Accumulated benefit obligation 33.1 36.1Fair value of plan assets – –
Net periodic benefit cost includes the followingcomponents:
Year Ended December 31In millions 2015 2014 2013
Pension BenefitsService cost $ 11.6 $ 10.4 $ 11.6Interest cost 23.3 24.8 21.8Expected return on plan assets (46.0) (43.9) (43.4)Amortization of prior service cost 3.1 3.3 3.1Amortization of actuarial loss 17.1 12.1 21.1
Total net periodic benefit cost $ 9.1 $ 6.7 $ 14.2
Other BenefitsService cost $ 1.4 $ 1.5 $ 2.9Interest cost 2.0 2.5 2.1Amortization of prior service cost/(credit) (0.3) (0.3) (0.5)Amortization of actuarial loss 0.2 0.4 0.6
Total net periodic benefit cost $ 3.3 $ 4.1 $ 5.1
The prior service cost and actuarial net loss for ourdefined benefit pension plans that will be amortized fromaccumulated other comprehensive income (loss) into ourresults of operations as a component of net periodicbenefit cost over the next fiscal year are $2.7 million and$12.2 million, respectively. The comparable amounts ofexpected amortization for other benefit plans are a creditof $0.2 million and $0.2 million, respectively.
Other changes in plan assets and benefit obligationsrecognized in other comprehensive income (loss) were asfollows:
Year EndedDecember 31
In millions 2015 2014
Pension BenefitsActuarial loss $ 21.5 $ 61.5Plan amendments – 3.6Amortization of prior service cost (3.1) (3.3)Amortization of actuarial losses (17.1) (12.1)
Total recognized in other comprehensive loss 1.3 49.7
Total recognized in net periodic benefit cost and othercomprehensive loss $ 10.4 $ 56.4
Other BenefitsActuarial (gain) loss $(10.1) $ 4.5Amortization of prior service cost 0.3 0.3Amortization of actuarial losses (0.2) (0.4)
Total recognized in other comprehensive (income) loss (10.0) 4.4
Total recognized in net periodic benefit cost and othercomprehensive (income) loss $ (6.7) $ 8.5
The weighted-average assumptions used incomputing the net periodic benefit cost information abovewere as follows:
Year Ended December 312015 2014 2013
Pension BenefitsDiscount rate – benefit expense 4.21% 5.20% 4.28%Future compensation growth rate 4.00 4.00 4.00Expected long-term rate of return on plan assets 8.00 8.00 8.50Other BenefitsDiscount rate – benefit expense 3.89% 4.52% 3.58%
To develop the expected long-term rate of returnassumption, we considered the historical returns and thefuture expected returns for each asset class, as well as thetarget asset allocation of the pension portfolio.
Assumed health care cost trend rates used todetermine benefit obligations at December 31 were asfollows:
2015 2014
Health care cost trend rate assumed for next year 6.80% 7.46%Rate to which the cost trend rate is assumed to decline
(the ultimate trend rate) 4.50 4.50Year that the rate reaches the ultimate rate 2037 2028
48
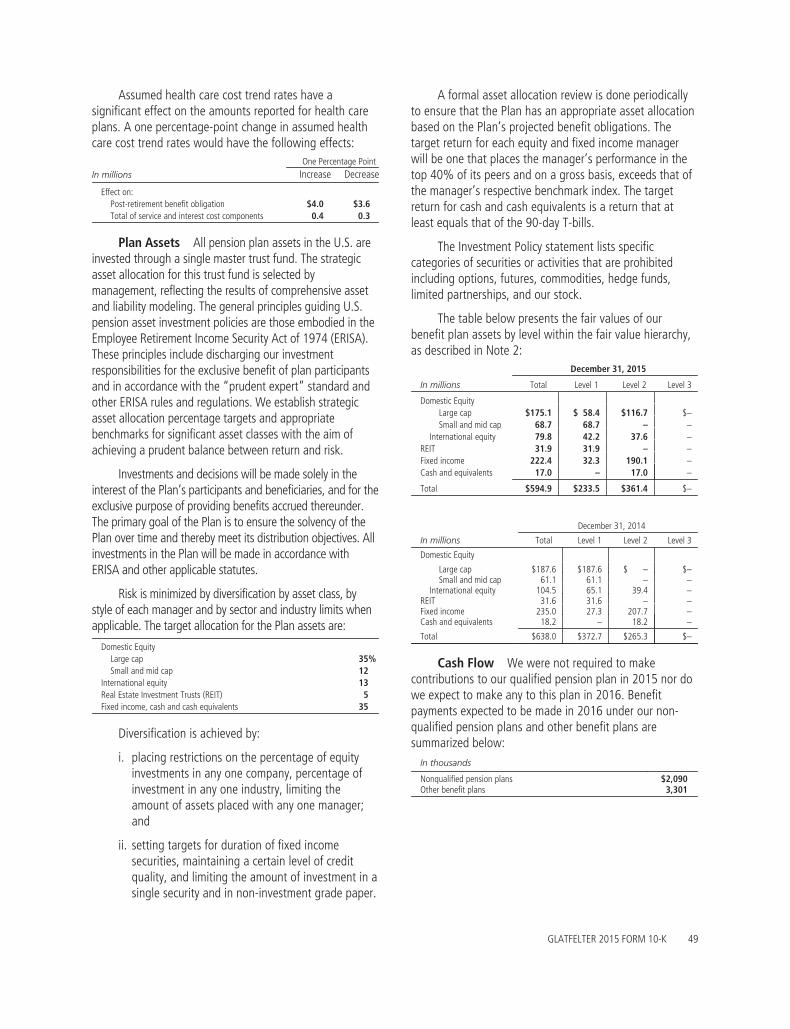
Assumed health care cost trend rates have asignificant effect on the amounts reported for health careplans. A one percentage-point change in assumed healthcare cost trend rates would have the following effects:
One Percentage PointIn millions Increase Decrease
Effect on:Post-retirement benefit obligation $4.0 $3.6Total of service and interest cost components 0.4 0.3
Plan Assets All pension plan assets in the U.S. areinvested through a single master trust fund. The strategicasset allocation for this trust fund is selected bymanagement, reflecting the results of comprehensive assetand liability modeling. The general principles guiding U.S.pension asset investment policies are those embodied in theEmployee Retirement Income Security Act of 1974 (ERISA).These principles include discharging our investmentresponsibilities for the exclusive benefit of plan participantsand in accordance with the “prudent expert” standard andother ERISA rules and regulations. We establish strategicasset allocation percentage targets and appropriatebenchmarks for significant asset classes with the aim ofachieving a prudent balance between return and risk.
Investments and decisions will be made solely in theinterest of the Plan’s participants and beneficiaries, and for theexclusive purpose of providing benefits accrued thereunder.The primary goal of the Plan is to ensure the solvency of thePlan over time and thereby meet its distribution objectives. Allinvestments in the Plan will be made in accordance withERISA and other applicable statutes.
Risk is minimized by diversification by asset class, bystyle of each manager and by sector and industry limits whenapplicable. The target allocation for the Plan assets are:
Domestic EquityLarge cap 35%Small and mid cap 12
International equity 13Real Estate Investment Trusts (REIT) 5Fixed income, cash and cash equivalents 35
Diversification is achieved by:
i. placing restrictions on the percentage of equityinvestments in any one company, percentage ofinvestment in any one industry, limiting theamount of assets placed with any one manager;and
ii. setting targets for duration of fixed incomesecurities, maintaining a certain level of creditquality, and limiting the amount of investment in asingle security and in non-investment grade paper.
A formal asset allocation review is done periodicallyto ensure that the Plan has an appropriate asset allocationbased on the Plan’s projected benefit obligations. Thetarget return for each equity and fixed income managerwill be one that places the manager’s performance in thetop 40% of its peers and on a gross basis, exceeds that ofthe manager’s respective benchmark index. The targetreturn for cash and cash equivalents is a return that atleast equals that of the 90-day T-bills.
The Investment Policy statement lists specificcategories of securities or activities that are prohibitedincluding options, futures, commodities, hedge funds,limited partnerships, and our stock.
The table below presents the fair values of ourbenefit plan assets by level within the fair value hierarchy,as described in Note 2:
December 31, 2015
In millions Total Level 1 Level 2 Level 3
Domestic EquityLarge cap $175.1 $ 58.4 $116.7 $–Small and mid cap 68.7 68.7 – –
International equity 79.8 42.2 37.6 –REIT 31.9 31.9 – –Fixed income 222.4 32.3 190.1 –Cash and equivalents 17.0 – 17.0 –
Total $594.9 $233.5 $361.4 $–
December 31, 2014
In millions Total Level 1 Level 2 Level 3
Domestic Equity
Large cap $187.6 $187.6 $ – $–Small and mid cap 61.1 61.1 – –
International equity 104.5 65.1 39.4 –REIT 31.6 31.6 – –Fixed income 235.0 27.3 207.7 –Cash and equivalents 18.2 – 18.2 –
Total $638.0 $372.7 $265.3 $–
Cash Flow We were not required to makecontributions to our qualified pension plan in 2015 nor dowe expect to make any to this plan in 2016. Benefitpayments expected to be made in 2016 under our non-qualified pension plans and other benefit plans aresummarized below:
In thousands
Nonqualified pension plans $2,090Other benefit plans 3,301
GLATFELTER 2015 FORM 10-K 49

The following benefit payments under all pension andother benefit plans, and giving effect to expected futureservice, as appropriate, are expected to be paid:
In thousandsPensionBenefits
OtherBenefits
2016 $ 36,924 $ 3,3012017 36,340 3,8012018 35,799 4,1542019 35,955 4,5592020 35,841 4,8342021 through 2025 185,391 22,801
Defined Contribution Plans We maintain 401(k)plans for certain hourly and salaried employees. Employeesmay contribute up to 50% of their earnings, subject tocertain restrictions. Through November 2015, we matcheda portion of the employee’s contribution, subject to certainlimitations, in the form of shares of Glatfelter commonstock out of treasury. Company matches are now made incash. The expense associated with our 401(k) match was$2.1 million, $2.0 million and $1.9 million in 2015, 2014and 2013, respectively.
12. INVENTORIES
Inventories, net of reserves were as follows:December 31
In thousands 2015 2014
Raw materials $ 60,098 $ 61,266In-process and finished 115,874 117,580Supplies 71,242 69,859
Total $247,214 $248,705
We value all of our U.S. inventories, excluding supplies,on the LIFO method. If we had valued these inventories usingthe first-in, first-out method, inventories would have been$28.2 million and $25.4 million higher than reported atDecember 31, 2015 and 2014, respectively.
13. PLANT, EQUIPMENT AND TIMBERLANDS
Plant, equipment and timberlands were as follows:December 31
In thousands 2015 2014
Land and buildings $ 205,338 $ 208,230Machinery and equipment 1,305,067 1,265,317Furniture, fixtures, and other 135,355 157,730Accumulated depreciation (1,009,331) (989,093)
636,429 642,184Construction in progress 58,657 49,078Asset retirement obligation, net 579 3,021Timberlands, less depletion 3,199 3,325
Total $ 698,864 $ 697,608
As of December 31, 2015 and 2014, we had $13.4million and $16.3 million, respectively, of accrued capitalexpenditures.
14. GOODWILL AND INTANGIBLE ASSETS
The following table sets forth information withrespect to goodwill and other intangible assets:
December 31In thousands 2015 2014
Goodwill – Composite Fibers $ 76,056 $ 84,137
Specialty PapersCustomer relationships $ 6,155 $ 6,155
Composite FibersTradename 4,332 5,902Technology and related 37,625 41,749Customer relationships and related 33,618 37,421
Advanced Airlaid MaterialsTechnology and related 1,403 1,500Customer relationships and related 2,725 3,042
Total intangibles 85,858 95,769Accumulated amortization (22,801) (18,671)
Net intangibles $ 63,057 $ 77,098
The change in goodwill was due to currencytranslation adjustments. Other than non-amortizablegoodwill and tradename, intangible assets are amortizedon a straight-line basis. Customer relationships areamortized over periods ranging from 10 years to 14 yearsand technology and related intangible assets are amortizedover periods ranging from 14 years to 20 years. Thefollowing table sets forth information pertaining toamortization of intangible assets:
In thousands 2015 2014 2013
Aggregate amortization expense: $5,340 $6,136 $4,511Estimated amortization expense:2016 4,8062017 4,6522018 4,6522019 4,6522020 4,497
The remaining weighted average useful life ofintangible assets was 13.9 years at December 31, 2015.
15. OTHER LONG-TERM ASSETS
Other long-term assets consist of the following:December 31
In thousands 2015 2014
Pension $ 89,093 $102,007Other 24,187 26,032
Total $113,280 $128,039
50

16. OTHER CURRENT LIABILITIES
Other current liabilities consist of the following:
December 31In thousands 2015 2014
Accrued payroll and benefits $ 35,079 $ 39,471Other accrued compensation and retirement
benefits 6,866 7,920Income taxes payable 2,921 3,502Accrued rebates 18,248 18,910Other accrued expenses 43,330 41,274
Total $106,444 $111,077
17. LONG-TERM DEBT
Long-term debt is summarized as follows:
December 31In thousands 2015 2014
Revolving credit facility, due Mar. 2020 $ 58,792 $ –Revolving credit facility, due Nov. 2016 – 90,5555.375% Notes, due Oct. 2020 250,000 250,0002.40% Term Loan, due Jun. 2022 10,109 12,1552.05% Term Loan, due Mar. 2023 42,130 51,9021.55% Term Loan, due Sep. 2025 2,839 –
Total long-term debt 363,870 404,612Less current portion (7,366) (5,734)
Long-term debt, net of current portion $356,504 $398,878
On March 12, 2015, we amended our revolvingcredit agreement with a consortium of banks (the“Revolving Credit Facility”) which increased the amountavailable for borrowing to $400 million, extended thematurity of the facility to March 12, 2020, and instituted arevised interest rate pricing grid.
For all US dollar denominated borrowings under theRevolving Credit Facility, the borrowing rate is, at ouroption, either, (a) the bank’s base rate which is equal tothe greater of i) the prime rate; ii) the federal funds rateplus 50 basis points; or iii) the daily Euro-rate plus 100basis points plus an applicable spread over either i), ii) oriii) ranging from 12.5 basis points to 100 basis pointsbased on the Company’s leverage ratio and its corporatecredit ratings determined by Standard & Poor’s RatingServices and Moody’s Investor Service, Inc. (the “CorporateCredit Rating”); or (b) the daily Euro-rate plus anapplicable margin ranging from 112.5 basis points to 200basis points based on the Company’s leverage ratio andthe Corporate Credit Rating. For non-US dollardenominated borrowings, interest is based on (b) above.
The Revolving Credit Facility contains a number ofcustomary covenants for financings of this type that, amongother things, restrict our ability to dispose of or create liens onassets, incur additional indebtedness, repay otherindebtedness, limits certain intercompany financing
arrangements, make acquisitions and engage in mergers orconsolidations. We are also required to comply with specifiedfinancial tests and ratios including: i) maximum net debt toearnings before interest, taxes, depreciation and amortization(“EBITDA”) ratio (the “leverage ratio”); and ii) a consolidatedEBITDA to interest expense ratio. The most restrictive of ourcovenants is a maximum leverage ratio of 3.5x. As ofDecember 31, 2015, the leverage ratio, as calculated inaccordance with the definition in our credit agreement, was1.6x. A breach of these requirements would give rise tocertain remedies under the Revolving Credit Facility, amongwhich are the termination of the agreement and acceleratedrepayment of the outstanding borrowings plus accrued andunpaid interest under the credit facility.
On October 3, 2012, we completed a privateplacement offering of $250.0 million aggregate principalamount of 5.375% Senior Notes due 2020 (the “5.375%Notes”). The 5.375% Notes, which are now publicallyregistered, are fully and unconditionally guaranteed, jointlyand severally, by PHG Tea Leaves, Inc., Mollanvick, Inc.,Glatfelter Composite Fibers N. A., Inc., Glatfelter AdvanceMaterials N.A., Inc., and Glatfelter Holdings, LLC (the“Guarantors”). Interest on the 5.375% Notes is payablesemiannually in arrears on April 15 and October 15.
The 5.375% Notes are redeemable, in whole or inpart, at anytime on or after October 15, 2016 at theredemption prices specified in the applicable Indenture.Prior to October 15, 2016, we may redeem some or all ofthe Notes at a “make-whole” premium as specified in theIndenture. These Notes and the guarantees of the notesare senior obligations of the Company and the Guarantors,respectively, rank equally in right of payment with futuresenior indebtedness of the Company and the Guarantorsand will mature on October 15, 2020.
The 5.375% Notes contain various covenantscustomary to indebtedness of this nature includinglimitations on i) the amount of indebtedness that may beincurred; ii) certain restricted payments including commonstock dividends; iii) distributions from certain subsidiaries;iv) sales of assets; v) transactions amongst subsidiaries;and vi) incurrence of liens on assets. In addition, the5.375% Notes contain cross default provisions that couldresult in all such notes becoming due and payable in theevent of a failure to repay debt outstanding under theRevolving Credit Agreement at maturity or a default underthe Revolving Credit Agreement that accelerates the debtoutstanding thereunder. As of December 31, 2015, we metall of the requirements of our debt covenants.
Glatfelter Gernsbach GmbH & Co. KG (“Gernsbach”),a wholly-owned subsidiary of ours, entered into a series of
GLATFELTER 2015 FORM 10-K 51

borrowing agreements with IKB Deutsche IndustriebankAG, Düsseldorf (“IKB”) as summarized below:
Amounts in thousandsOringinalPrincipal
InterestRate Maturity
Borrowing dateApr.11, 2013 €42,700 2.05% Mar. 2023Sep. 4, 2014 10,000 2.40% Jun. 2022Oct. 10, 2015 2,608 1.55% Sep. 2025
Each of the borrowings require quarterly repaymentsof principal and interest and provide for representations,warranties and covenants customary for financings ofthese types. The financial covenants contained in each ofthe IKB loans, which relate to the minimum ratio ofconsolidated EBITDA to consolidated interest expense andthe maximum ratio of consolidated total net debt toconsolidated adjusted EBITDA, will be calculated byreference to our Revolving Credit Agreement.
Aggregated unamortized deferred debt issuance costsincurred in connection with all of our outstanding debt totaled$5.4 million at December 31, 2015 and are reported underthe caption “Other assets” in the accompanying consolidatedbalance sheets. The deferred costs are being amortized on astraight line basis over the life of the underlying instruments.Amortization expense related to deferred debt issuance coststotaled $1.2 million in 2015.
The following schedule sets forth the amortization ofour term loan agreements together with the maturity ofour other long-term debt during the indicated year.
In thousands
2016 $ 7,3662017 7,3662018 7,7212019 7,7212020 316,513
Thereafter 17,183
P. H. Glatfelter Company guarantees all debtobligations of its subsidiaries. All such obligations arerecorded in these consolidated financial statements.
As of December 31, 2015 and 2014, we had $5.3million of letters of credit issued to us by certain financialinstitutions. The letters of credit, which reduce amountsavailable under our revolving credit facility, primarilyprovide financial assurances for the benefit of certain stateworkers compensation insurance agencies in conjunctionwith our self-insurance program. We bear the credit risk onthis amount to the extent that we do not comply with theprovisions of certain agreements. No amounts areoutstanding under the letters of credit.
18. ASSET RETIREMENT OBLIGATION
During 2008, we recorded $11.5 million, net presentvalue, of asset retirement obligations related to the legalrequirement to close several lagoons at the Spring Grove,PA facility. Historically, lagoons were used to dispose ofresidual waste material. Closure of the lagoons, which isexpected to be completed in 2016, will be accomplished byfilling the lagoons, installing a non-permeable liner andcovering with soil to construct the required cap over thelagoons. The amount referred to above, in addition toupward revisions, was accrued with a correspondingincrease in the carrying value of the property, equipmentand timberlands caption on the consolidated balancesheet. The amount capitalized is being amortized as acharge to operations on the straight-line basis in relationto the expected closure period.
Following is a summary of the reserve for assetretirement obligations for the periods indicated:
In thousands 2015 2014
Balance at January 1, $ 4,114 $5,032Accretion 58 145Payments (2,394) (827)Downward revision (1,000) –Gain (359) (236)
Balance at December 31, $ 419 $4,114
During 2015 we recorded a downward revision to ourestimated cost of closing the lagoons. The revision wasrecorded as an adjustment to both the carrying value ofthe associated property, equipment and timberlands aswell as the asset retirement obligation.
During 2015, 2014 and 2013, we recognized gainsof $0.4 million, $0.2 million and $1.3 million, respectively,related to the progress of closure activities for a portion ofthe lagoons required to be retired. The gains are reflectedin the accompanying consolidated statements of incomeunder the caption “Costs of products sold.”
The following table summarizes the line items in theaccompanying consolidated balance sheets where theasset retirement obligations are recorded:
December 31
In thousands 2015 2014
Other current liabilities $419 $2,855Other long-term liabilities – 1,259
Total $419 $4,114
52
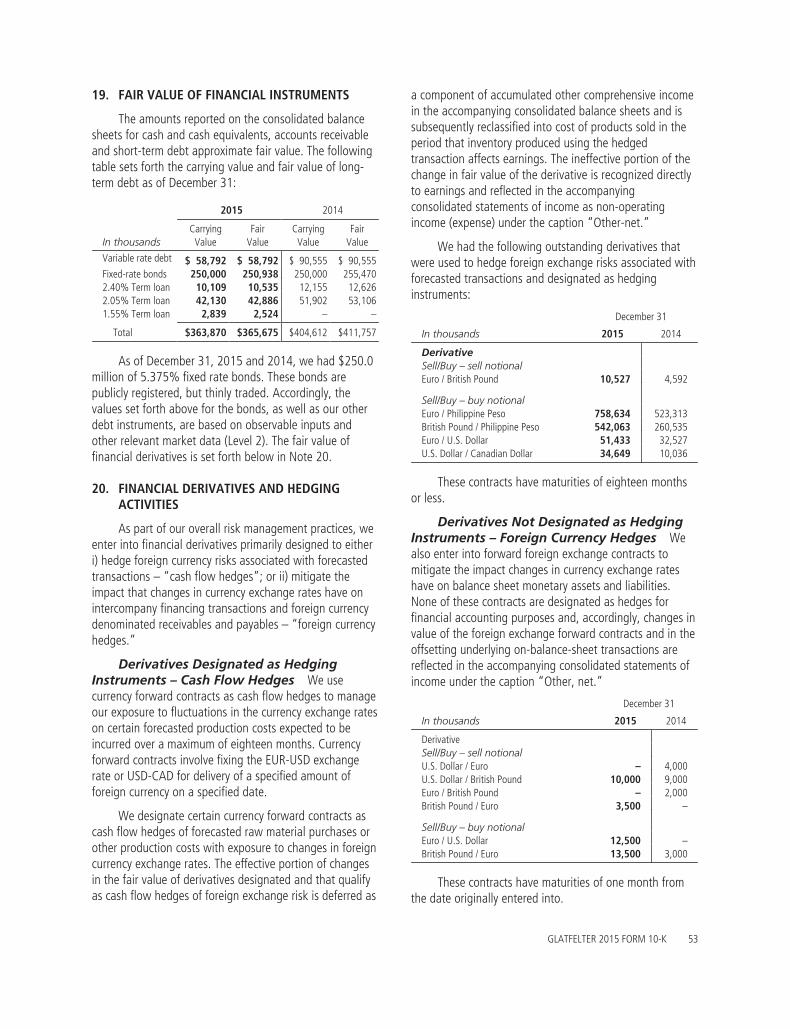
19. FAIR VALUE OF FINANCIAL INSTRUMENTS
The amounts reported on the consolidated balancesheets for cash and cash equivalents, accounts receivableand short-term debt approximate fair value. The followingtable sets forth the carrying value and fair value of long-term debt as of December 31:
2015 2014
In thousandsCarrying
ValueFair
ValueCarrying
ValueFair
Value
Variable rate debt $ 58,792 $ 58,792 $ 90,555 $ 90,555Fixed-rate bonds 250,000 250,938 250,000 255,4702.40% Term loan 10,109 10,535 12,155 12,6262.05% Term loan 42,130 42,886 51,902 53,1061.55% Term loan 2,839 2,524 – –
Total $363,870 $365,675 $404,612 $411,757
As of December 31, 2015 and 2014, we had $250.0million of 5.375% fixed rate bonds. These bonds arepublicly registered, but thinly traded. Accordingly, thevalues set forth above for the bonds, as well as our otherdebt instruments, are based on observable inputs andother relevant market data (Level 2). The fair value offinancial derivatives is set forth below in Note 20.
20. FINANCIAL DERIVATIVES AND HEDGINGACTIVITIES
As part of our overall risk management practices, weenter into financial derivatives primarily designed to eitheri) hedge foreign currency risks associated with forecastedtransactions – “cash flow hedges”; or ii) mitigate theimpact that changes in currency exchange rates have onintercompany financing transactions and foreign currencydenominated receivables and payables – “foreign currencyhedges.”
Derivatives Designated as HedgingInstruments – Cash Flow Hedges We usecurrency forward contracts as cash flow hedges to manageour exposure to fluctuations in the currency exchange rateson certain forecasted production costs expected to beincurred over a maximum of eighteen months. Currencyforward contracts involve fixing the EUR-USD exchangerate or USD-CAD for delivery of a specified amount offoreign currency on a specified date.
We designate certain currency forward contracts ascash flow hedges of forecasted raw material purchases orother production costs with exposure to changes in foreigncurrency exchange rates. The effective portion of changesin the fair value of derivatives designated and that qualifyas cash flow hedges of foreign exchange risk is deferred as
a component of accumulated other comprehensive incomein the accompanying consolidated balance sheets and issubsequently reclassified into cost of products sold in theperiod that inventory produced using the hedgedtransaction affects earnings. The ineffective portion of thechange in fair value of the derivative is recognized directlyto earnings and reflected in the accompanyingconsolidated statements of income as non-operatingincome (expense) under the caption “Other-net.”
We had the following outstanding derivatives thatwere used to hedge foreign exchange risks associated withforecasted transactions and designated as hedginginstruments:
December 31
In thousands 2015 2014
DerivativeSell/Buy – sell notionalEuro / British Pound 10,527 4,592
Sell/Buy – buy notionalEuro / Philippine Peso 758,634 523,313British Pound / Philippine Peso 542,063 260,535Euro / U.S. Dollar 51,433 32,527U.S. Dollar / Canadian Dollar 34,649 10,036
These contracts have maturities of eighteen monthsor less.
Derivatives Not Designated as HedgingInstruments – Foreign Currency Hedges Wealso enter into forward foreign exchange contracts tomitigate the impact changes in currency exchange rateshave on balance sheet monetary assets and liabilities.None of these contracts are designated as hedges forfinancial accounting purposes and, accordingly, changes invalue of the foreign exchange forward contracts and in theoffsetting underlying on-balance-sheet transactions arereflected in the accompanying consolidated statements ofincome under the caption “Other, net.”
December 31
In thousands 2015 2014
DerivativeSell/Buy – sell notionalU.S. Dollar / Euro – 4,000U.S. Dollar / British Pound 10,000 9,000Euro / British Pound – 2,000British Pound / Euro 3,500 –
Sell/Buy – buy notionalEuro / U.S. Dollar 12,500 –British Pound / Euro 13,500 3,000
These contracts have maturities of one month fromthe date originally entered into.
GLATFELTER 2015 FORM 10-K 53

Fair Value Measurements
The following table summarizes the fair values ofderivative instruments as of December 31 for the yearindicated and the line items in the accompanyingconsolidated balance sheets where the instruments arerecorded:
December 31 December 31
In thousands 2015 2014 2015 2014
Balance sheet caption
Prepaid Expensesand Other
Current AssetsOther Current
Liabilities
Designated ashedging:
Forward foreign currencyexchange contracts $955 $3,106 $1,545 $394
Not designated ashedging:
Forward foreign currencyexchange contracts $ 68 $ 70 $49 $161
The amounts set forth in the table above representthe net asset or liability giving effect to rights of offset witheach counterparty.
The following table summarizes the amount ofincome or loss from derivative instruments recognized inour results of operations for the periods indicated and theline items in the accompanying consolidated statements ofincome where the results are recorded:
Year ended December 31
In thousands 2015 2014 2013
Designated as hedging:Forward foreign currency
exchange contracts:Effective portion – cost of
products sold $5,752 $ (655) $(945)Ineffective portion – other – net (152) 184 38
Not designated ashedging :
Forward foreign currencyexchange contracts:Other – net $ 599 $1,599 $(455)
The impact of activity not designated as hedging wassubstantially all offset by the remeasurement of theunderlying on-balance sheet item.
The fair value hierarchy consists of three broad levels,which gives the highest priority to unadjusted quotedprices in active markets for identical assets or liabilities(Level 1) and the lowest priority to unobservable inputs(Level 3). The three levels of the fair value hierarchy aredescribed in Note 2.
The fair values of the foreign exchange forwardcontracts are considered to be Level 2. Foreign currencyforward contracts are valued using foreign currencyforward and interest rate curves. The fair value of eachcontract is determined by comparing the contract rate tothe forward rate and discounting to present value.Contracts in a gain position are recorded in theaccompanying consolidated balance sheets under thecaption “Prepaid expenses and other current assets” andthe value of contracts in a loss position is recorded underthe caption “Other current liabilities.”
A rollforward of fair value amounts recorded as acomponent of accumulated other comprehensive income isas follows:
In thousands 2015 2014
Balance at January 1, $ 3,282 $(1,296)Deferred (losses) gains on cash flow
hedges 2,292 3,923Reclassified to earnings (5,752) 655
Balance at December 31, $ (178) $ 3,282
We expect substantially all of the amounts recordedas a component of accumulated other comprehensiveincome will be realized in results of operations within thenext twelve to eighteen months and the amount ultimatelyrecognized will vary depending on actual market rates.
Credit risk related to derivative activity arises in theevent a counterparty fails to meet its obligations to us. Thisexposure is generally limited to the amounts, if any, bywhich the counterparty’s obligations exceed our obligationto them. Our policy is to enter into contracts only withfinancial institutions which meet certain minimum creditratings.
21. SHAREHOLDERS’ EQUITY
The following table summarizes outstanding sharesof common stock:
Year ended December 31
In thousands 2015 2014 2013
Shares outstanding at beginningof year 43,054 43,130 42,784
Shares repurchased – (464) –Treasury shares issued for:
Restricted stock awards 206 162 86401(k) plan 134 116 123Employee stock options
exercised 26 110 137
Shares outstanding at end ofyear 43,420 43,054 43,130
54
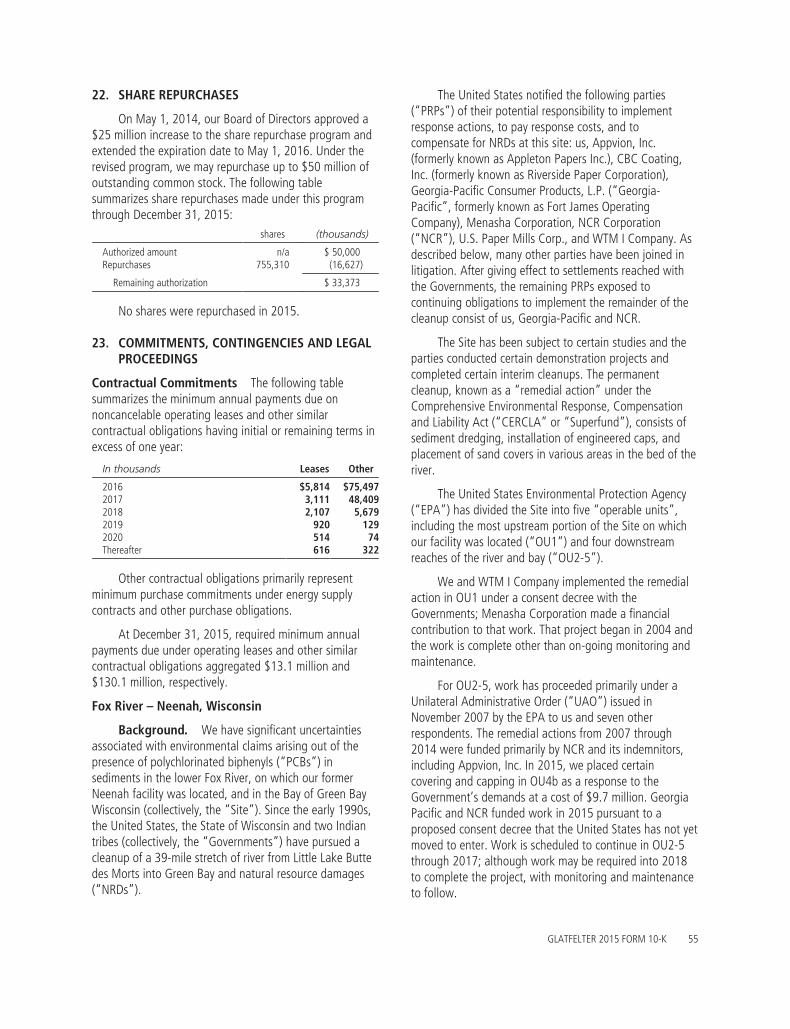
22. SHARE REPURCHASES
On May 1, 2014, our Board of Directors approved a$25 million increase to the share repurchase program andextended the expiration date to May 1, 2016. Under therevised program, we may repurchase up to $50 million ofoutstanding common stock. The following tablesummarizes share repurchases made under this programthrough December 31, 2015:
shares (thousands)
Authorized amount n/a $ 50,000Repurchases 755,310 (16,627)
Remaining authorization $ 33,373
No shares were repurchased in 2015.
23. COMMITMENTS, CONTINGENCIES AND LEGALPROCEEDINGS
Contractual Commitments The following tablesummarizes the minimum annual payments due onnoncancelable operating leases and other similarcontractual obligations having initial or remaining terms inexcess of one year:
In thousands Leases Other
2016 $5,814 $75,4972017 3,111 48,4092018 2,107 5,6792019 920 1292020 514 74Thereafter 616 322
Other contractual obligations primarily representminimum purchase commitments under energy supplycontracts and other purchase obligations.
At December 31, 2015, required minimum annualpayments due under operating leases and other similarcontractual obligations aggregated $13.1 million and$130.1 million, respectively.
Fox River – Neenah, Wisconsin
Background. We have significant uncertaintiesassociated with environmental claims arising out of thepresence of polychlorinated biphenyls (“PCBs”) insediments in the lower Fox River, on which our formerNeenah facility was located, and in the Bay of Green BayWisconsin (collectively, the “Site”). Since the early 1990s,the United States, the State of Wisconsin and two Indiantribes (collectively, the “Governments”) have pursued acleanup of a 39-mile stretch of river from Little Lake Buttedes Morts into Green Bay and natural resource damages(“NRDs”).
The United States notified the following parties(“PRPs”) of their potential responsibility to implementresponse actions, to pay response costs, and tocompensate for NRDs at this site: us, Appvion, Inc.(formerly known as Appleton Papers Inc.), CBC Coating,Inc. (formerly known as Riverside Paper Corporation),Georgia-Pacific Consumer Products, L.P. (“Georgia-Pacific”, formerly known as Fort James OperatingCompany), Menasha Corporation, NCR Corporation(“NCR”), U.S. Paper Mills Corp., and WTM I Company. Asdescribed below, many other parties have been joined inlitigation. After giving effect to settlements reached withthe Governments, the remaining PRPs exposed tocontinuing obligations to implement the remainder of thecleanup consist of us, Georgia-Pacific and NCR.
The Site has been subject to certain studies and theparties conducted certain demonstration projects andcompleted certain interim cleanups. The permanentcleanup, known as a “remedial action” under theComprehensive Environmental Response, Compensationand Liability Act (“CERCLA” or “Superfund”), consists ofsediment dredging, installation of engineered caps, andplacement of sand covers in various areas in the bed of theriver.
The United States Environmental Protection Agency(“EPA”) has divided the Site into five “operable units”,including the most upstream portion of the Site on whichour facility was located (“OU1”) and four downstreamreaches of the river and bay (“OU2-5”).
We and WTM I Company implemented the remedialaction in OU1 under a consent decree with theGovernments; Menasha Corporation made a financialcontribution to that work. That project began in 2004 andthe work is complete other than on-going monitoring andmaintenance.
For OU2-5, work has proceeded primarily under aUnilateral Administrative Order (“UAO”) issued inNovember 2007 by the EPA to us and seven otherrespondents. The remedial actions from 2007 through2014 were funded primarily by NCR and its indemnitors,including Appvion, Inc. In 2015, we placed certaincovering and capping in OU4b as a response to theGovernment’s demands at a cost of $9.7 million. GeorgiaPacific and NCR funded work in 2015 pursuant to aproposed consent decree that the United States has not yetmoved to enter. Work is scheduled to continue in OU2-5through 2017; although work may be required into 2018to complete the project, with monitoring and maintenanceto follow.
GLATFELTER 2015 FORM 10-K 55

As more fully discussed below, significantuncertainties exist pertaining to the ultimate allocation ofOU2-5 remediation costs as well as the shorter termfunding of the remedial actions for OU2-5.
Cost estimates. Estimates of the Site remediationchange over time as we, or others, gain additional dataand experience at the Site. In addition, disagreement existsover the likely costs for some of this work. On October 14,2014, the Governments represented to the United StatesDistrict Court in Green Bay that $1.1 billion provided an“upper end estimate of total past and future responsecosts” including a $100 million “uncertainty premium forfuture response costs.” Based upon estimates made by theGovernments and independent estimates commissioned byvarious potentially responsible parties, we have no reasonto disagree with the Governments’ assertion. Much of thatamount has already been incurred, including approximately$100 million for OU1 and what we believe to beapproximately $500 million for OU2-5 prior to the 2015remediation season, and, although final accounts have notbeen prepared, less than $100 million in 2015.
For 2015, Governments indicated their expectationwas to have approximately $100 million worth of workcompleted in OU2-5; however we do not believe all workwas completed.
As the result of a partial settlement, Georgia-Pacifichas no obligation to pay for work upstream of a line nearGeorgia-Pacific’s Green Bay West Mill located in OU4. Webelieve substantially all in-water work upstream of this linehad been completed as of the end of the 2014 dredgingseason.
Allocation Litigation. In January 2008, NCR andAppvion brought an action in the federal district court inGreen Bay to allocate among all parties responsible for thisSite all of the costs incurred by the Governments, all of thecosts incurred by the parties, and all of the NRDs owed tothe Natural Resource Trustees. We have previously referredto this case as the “Whiting Litigation.” After severalsummary judgment rulings and a trial, the trial courtentered judgment in the Whiting Litigation, allocating toNCR 100% of the costs of (a) the OU2-5 cleanup,(b) NRDs, (c) past and future costs incurred by theGovernments in OU2-5, and (d) past and future costsincurred by any of the other parties net of an appropriateequitable adjustment for insurance recoveries. As toGlatfelter, NCR was judged liable to us for $4.28 millionand any future costs or damages we may incur. NCR washeld not responsible for costs incurred in OU1.
All parties appealed the Whiting Litigation judgmentto the United States Court of Appeals for the Seventh
Circuit. On September 25, 2014, that court affirmed,holding that if knowledge and fault were the onlyequitable factors governing allocation of costs and NRDs atthe Site, NCR would owe 100% of all costs and damagesin OU2-5, but would not have a share of costs in OU1 –which is upstream of the outfall of the facilities for whichNCR is responsible – solely as an “arranger for disposal”of PCB-containing waste paper by recycling it at our mill.However, the court of appeals vacated the judgment andremanded the case for the district court’s furtherconsideration of whether any other equitable factors mightcause the district court to alter its allocation.
We contend the district court should, after furtherconsideration, reinstate the 100%, or some similar veryhigh, allocation to NCR of all the costs, and should holdthat we should bear no share or a very small share.However, NCR has taken a contrary position and hassought contributions from others for future work until allallocation issues are resolved.
In addition, we take the position that the “singlesite” theory on which the courts held us responsible forcleaning up parts of the Site far downstream of our formermill should, if applied to NCR, make it liable for costsincurred in OU1. The district court agreed with us in anorder dated March 3, 2015. On March 31, 2015, NCRsought review of that order by the court of appeals whichreview was denied on May 1, 2015.
Appvion and NCR have had a cost-sharing agreementsince at least 1998. The court of appeals held if Appvionincurred any recoverable costs because the Governmentshad named Appvion as a potentially responsible party,then Appvion may have a right to recover those costsunder CERCLA. We and Appvion disagree over the propertreatment of amounts that Appvion incurred while a PRPthat were also subject to a cost-sharing agreement withNCR; we contend Appvion may not recover costs it wascontractually obligated to incur, that it has no other costs,and if it did, we would have a right to contribution of anyrecovery against NCR and others. However, Appvion takesa contrary position and claims in excess of $170 million.
The district court has established a schedule for theWhiting Litigation under which it would hold a trial inJanuary 2017 on remaining issues.
Enforcement Litigation. In October 2010, the UnitedStates and the State of Wisconsin brought an action(“Government Action”) in the federal district court inGreen Bay against us and 13 other defendants seeking(a) to recover all of their unreimbursed past costs, (b) toobtain a declaration of joint and several liability for all oftheir future costs, (c) to recover NRDs, and (d) to obtain a
56
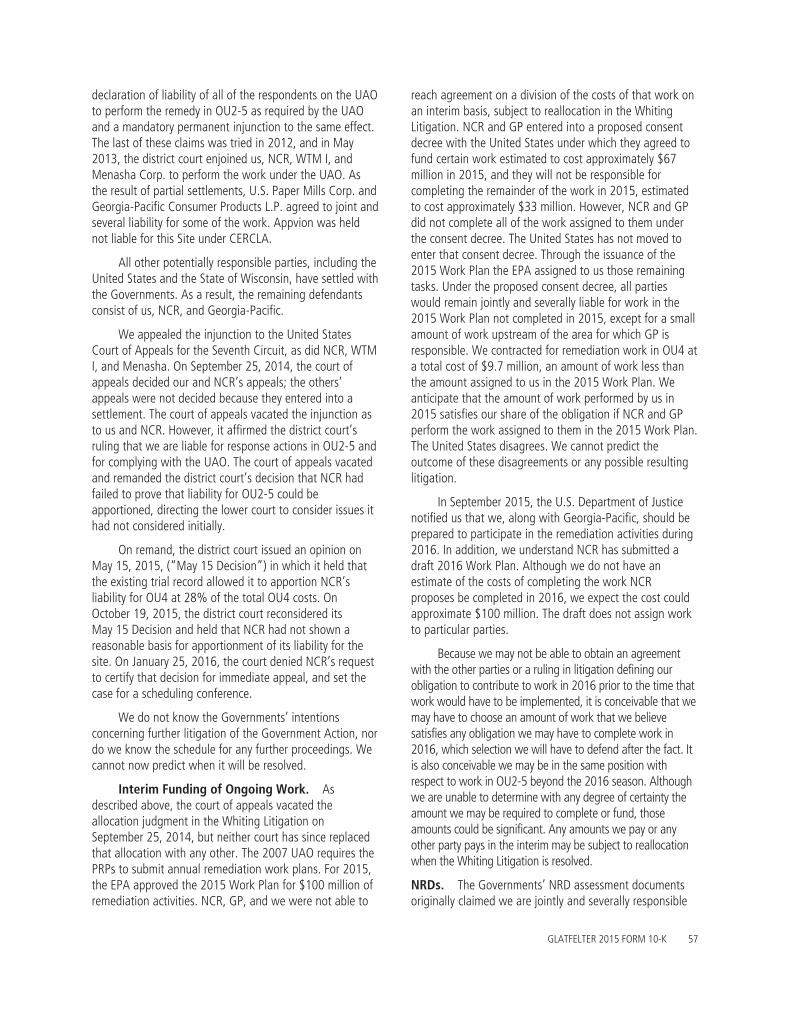
declaration of liability of all of the respondents on the UAOto perform the remedy in OU2-5 as required by the UAOand a mandatory permanent injunction to the same effect.The last of these claims was tried in 2012, and in May2013, the district court enjoined us, NCR, WTM I, andMenasha Corp. to perform the work under the UAO. Asthe result of partial settlements, U.S. Paper Mills Corp. andGeorgia-Pacific Consumer Products L.P. agreed to joint andseveral liability for some of the work. Appvion was heldnot liable for this Site under CERCLA.
All other potentially responsible parties, including theUnited States and the State of Wisconsin, have settled withthe Governments. As a result, the remaining defendantsconsist of us, NCR, and Georgia-Pacific.
We appealed the injunction to the United StatesCourt of Appeals for the Seventh Circuit, as did NCR, WTMI, and Menasha. On September 25, 2014, the court ofappeals decided our and NCR’s appeals; the others’appeals were not decided because they entered into asettlement. The court of appeals vacated the injunction asto us and NCR. However, it affirmed the district court’sruling that we are liable for response actions in OU2-5 andfor complying with the UAO. The court of appeals vacatedand remanded the district court’s decision that NCR hadfailed to prove that liability for OU2-5 could beapportioned, directing the lower court to consider issues ithad not considered initially.
On remand, the district court issued an opinion onMay 15, 2015, (“May 15 Decision”) in which it held thatthe existing trial record allowed it to apportion NCR’sliability for OU4 at 28% of the total OU4 costs. OnOctober 19, 2015, the district court reconsidered itsMay 15 Decision and held that NCR had not shown areasonable basis for apportionment of its liability for thesite. On January 25, 2016, the court denied NCR’s requestto certify that decision for immediate appeal, and set thecase for a scheduling conference.
We do not know the Governments’ intentionsconcerning further litigation of the Government Action, nordo we know the schedule for any further proceedings. Wecannot now predict when it will be resolved.
Interim Funding of Ongoing Work. Asdescribed above, the court of appeals vacated theallocation judgment in the Whiting Litigation onSeptember 25, 2014, but neither court has since replacedthat allocation with any other. The 2007 UAO requires thePRPs to submit annual remediation work plans. For 2015,the EPA approved the 2015 Work Plan for $100 million ofremediation activities. NCR, GP, and we were not able to
reach agreement on a division of the costs of that work onan interim basis, subject to reallocation in the WhitingLitigation. NCR and GP entered into a proposed consentdecree with the United States under which they agreed tofund certain work estimated to cost approximately $67million in 2015, and they will not be responsible forcompleting the remainder of the work in 2015, estimatedto cost approximately $33 million. However, NCR and GPdid not complete all of the work assigned to them underthe consent decree. The United States has not moved toenter that consent decree. Through the issuance of the2015 Work Plan the EPA assigned to us those remainingtasks. Under the proposed consent decree, all partieswould remain jointly and severally liable for work in the2015 Work Plan not completed in 2015, except for a smallamount of work upstream of the area for which GP isresponsible. We contracted for remediation work in OU4 ata total cost of $9.7 million, an amount of work less thanthe amount assigned to us in the 2015 Work Plan. Weanticipate that the amount of work performed by us in2015 satisfies our share of the obligation if NCR and GPperform the work assigned to them in the 2015 Work Plan.The United States disagrees. We cannot predict theoutcome of these disagreements or any possible resultinglitigation.
In September 2015, the U.S. Department of Justicenotified us that we, along with Georgia-Pacific, should beprepared to participate in the remediation activities during2016. In addition, we understand NCR has submitted adraft 2016 Work Plan. Although we do not have anestimate of the costs of completing the work NCRproposes be completed in 2016, we expect the cost couldapproximate $100 million. The draft does not assign workto particular parties.
Because we may not be able to obtain an agreementwith the other parties or a ruling in litigation defining ourobligation to contribute to work in 2016 prior to the time thatwork would have to be implemented, it is conceivable that wemay have to choose an amount of work that we believesatisfies any obligation we may have to complete work in2016, which selection we will have to defend after the fact. Itis also conceivable we may be in the same position withrespect to work in OU2-5 beyond the 2016 season. Althoughwe are unable to determine with any degree of certainty theamount we may be required to complete or fund, thoseamounts could be significant. Any amounts we pay or anyother party pays in the interim may be subject to reallocationwhen the Whiting Litigation is resolved.
NRDs. The Governments’ NRD assessment documentsoriginally claimed we are jointly and severally responsible
GLATFELTER 2015 FORM 10-K 57
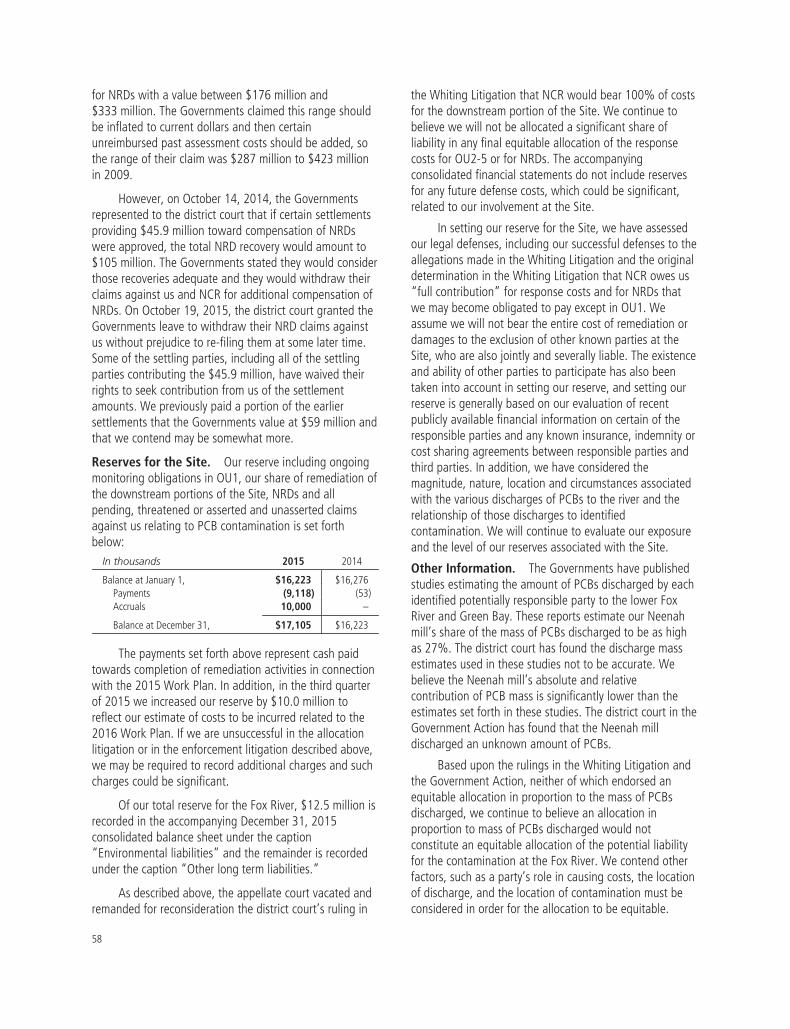
for NRDs with a value between $176 million and$333 million. The Governments claimed this range shouldbe inflated to current dollars and then certainunreimbursed past assessment costs should be added, sothe range of their claim was $287 million to $423 millionin 2009.
However, on October 14, 2014, the Governmentsrepresented to the district court that if certain settlementsproviding $45.9 million toward compensation of NRDswere approved, the total NRD recovery would amount to$105 million. The Governments stated they would considerthose recoveries adequate and they would withdraw theirclaims against us and NCR for additional compensation ofNRDs. On October 19, 2015, the district court granted theGovernments leave to withdraw their NRD claims againstus without prejudice to re-filing them at some later time.Some of the settling parties, including all of the settlingparties contributing the $45.9 million, have waived theirrights to seek contribution from us of the settlementamounts. We previously paid a portion of the earliersettlements that the Governments value at $59 million andthat we contend may be somewhat more.
Reserves for the Site. Our reserve including ongoingmonitoring obligations in OU1, our share of remediation ofthe downstream portions of the Site, NRDs and allpending, threatened or asserted and unasserted claimsagainst us relating to PCB contamination is set forthbelow:
In thousands 2015 2014
Balance at January 1, $16,223 $16,276Payments (9,118) (53)Accruals 10,000 –
Balance at December 31, $17,105 $16,223
The payments set forth above represent cash paidtowards completion of remediation activities in connectionwith the 2015 Work Plan. In addition, in the third quarterof 2015 we increased our reserve by $10.0 million toreflect our estimate of costs to be incurred related to the2016 Work Plan. If we are unsuccessful in the allocationlitigation or in the enforcement litigation described above,we may be required to record additional charges and suchcharges could be significant.
Of our total reserve for the Fox River, $12.5 million isrecorded in the accompanying December 31, 2015consolidated balance sheet under the caption“Environmental liabilities” and the remainder is recordedunder the caption “Other long term liabilities.”
As described above, the appellate court vacated andremanded for reconsideration the district court’s ruling in
the Whiting Litigation that NCR would bear 100% of costsfor the downstream portion of the Site. We continue tobelieve we will not be allocated a significant share ofliability in any final equitable allocation of the responsecosts for OU2-5 or for NRDs. The accompanyingconsolidated financial statements do not include reservesfor any future defense costs, which could be significant,related to our involvement at the Site.
In setting our reserve for the Site, we have assessedour legal defenses, including our successful defenses to theallegations made in the Whiting Litigation and the originaldetermination in the Whiting Litigation that NCR owes us“full contribution” for response costs and for NRDs thatwe may become obligated to pay except in OU1. Weassume we will not bear the entire cost of remediation ordamages to the exclusion of other known parties at theSite, who are also jointly and severally liable. The existenceand ability of other parties to participate has also beentaken into account in setting our reserve, and setting ourreserve is generally based on our evaluation of recentpublicly available financial information on certain of theresponsible parties and any known insurance, indemnity orcost sharing agreements between responsible parties andthird parties. In addition, we have considered themagnitude, nature, location and circumstances associatedwith the various discharges of PCBs to the river and therelationship of those discharges to identifiedcontamination. We will continue to evaluate our exposureand the level of our reserves associated with the Site.
Other Information. The Governments have publishedstudies estimating the amount of PCBs discharged by eachidentified potentially responsible party to the lower FoxRiver and Green Bay. These reports estimate our Neenahmill’s share of the mass of PCBs discharged to be as highas 27%. The district court has found the discharge massestimates used in these studies not to be accurate. Webelieve the Neenah mill’s absolute and relativecontribution of PCB mass is significantly lower than theestimates set forth in these studies. The district court in theGovernment Action has found that the Neenah milldischarged an unknown amount of PCBs.
Based upon the rulings in the Whiting Litigation andthe Government Action, neither of which endorsed anequitable allocation in proportion to the mass of PCBsdischarged, we continue to believe an allocation inproportion to mass of PCBs discharged would notconstitute an equitable allocation of the potential liabilityfor the contamination at the Fox River. We contend otherfactors, such as a party’s role in causing costs, the locationof discharge, and the location of contamination must beconsidered in order for the allocation to be equitable.
58

Range of Reasonably Possible Outcomes. Based onour analysis of all available information, including but notlimited to decisions of the courts, official documents suchas records of decision, as well as discussions with legalcounsel and cost estimates for work to be performed at theSite, and substantially dependent on the resolution of theallocation issues discussed above, we believe it isreasonably possible that our costs associated with the FoxRiver matter could exceed the aggregate amounts accruedfor the Fox River matter by amounts ranging frominsignificant to $175 million. We believe the likelihood ofan outcome in the upper end of the monetary range is lessthan other possible outcomes within the range and thepossibility of an outcome in excess of the upper end of themonetary range is remote.
We expect remediation costs to be incurred primarilyover the next two to three years, although we are unableto determine with any degree of certainty the amount wemay be required to fund for interim remediation work. Tothe extent we provide such interim funding, we contendthat NCR or another party would be required to reimburseus once the final allocation is determined.
Summary. Our current assessment is we will be able tomanage this environmental matter without a long-term,material adverse impact on the Company. This mattercould, however, at any particular time or for any particularyear or years, have a material adverse effect on ourconsolidated financial position, liquidity and/or results ofoperations or could result in a default under our debtcovenants. Moreover, there can be no assurance ourreserves will be adequate to provide for future obligationsrelated to this matter, or our share of costs and/ordamages will not exceed our available resources, or thoseobligations will not have a long-term, material adverseeffect on our consolidated financial position, liquidity orresults of operations. Should a court grant the UnitedStates or the State of Wisconsin relief requiring usindividually either to perform directly or to contributesignificant amounts towards remedial action downstreamof Little Lake Butte des Morts those developments couldhave a material adverse effect on our consolidatedfinancial position, liquidity and results of operations andmight result in a default under our loan covenants.
24. SEGMENT AND GEOGRAPHIC INFORMATION
The following tables set forth profitability and other information by business unit:
For the year ended December 31, 2015In millions
CompositeFibers
AdvancedAirlaid
MaterialsSpecialtyPapers
Other andUnallocated Total
Net sales $541.5 $244.6 $875.0 $ – $1,661.1Energy and related sales, net – – 5.7 – 5.7
Total revenue 541.5 244.6 880.7 – 1,666.7Cost of products sold 434.4 215.7 804.5 9.2 1,463.8
Gross profit 107.1 28.9 76.2 (9.2) 203.0SG&A 45.7 7.6 43.3 31.0 127.7Gains on dispositions of plant, equipment and timberlands, net – – – (21.1) (21.1)
Total operating income (loss) 61.4 21.3 32.9 (19.1) 96.4Non-operating expense – – – (17.8) (17.8)
Income (loss) before income taxes $ 61.4 $ 21.3 $ 32.9 $(36.9) $ 78.6
Supplementary DataPlant, equipment and timberlands, net $258.1 $153.5 $281.6 $ 5.7 $ 698.9Depreciation, depletion and amortization 26.2 8.8 26.0 2.2 63.2Capital expenditures 26.8 7.8 63.5 1.8 99.9
GLATFELTER 2015 FORM 10-K 59

For the year ended December 31, 2014In millions
CompositeFibers
AdvancedAirlaid
MaterialsSpecialtyPapers
Other andUnallocated Total
Net sales $617.9 $281.7 $902.9 $ – $1,802.4Energy and related sales, net – – 7.9 – 7.9
Total revenue 617.9 281.7 910.8 – 1,810.3Cost of products sold 498.0 247.6 821.8 7.8 1,575.2
Gross profit 119.9 34.1 89.0 (7.8) 235.2SG&A 51.6 8.8 50.4 22.4 133.2Gains on dispositions of plant, equipment and timberlands, net – – – (4.9) (4.9)
Total operating income (loss) 68.3 25.3 38.6 (25.3) 106.8Non-operating expense – – – (19.4) (19.4)
Income (loss) before income taxes $ 68.3 $ 25.3 $ 38.6 $(44.7) $ 87.4
Supplementary DataPlant, equipment and timberlands, net $277.8 $163.6 $250.1 $ 6.1 $ 697.6Depreciation, depletion and amortization 29.7 9.1 29.9 1.9 70.6Capital expenditures 23.9 7.6 32.1 2.4 66.0
For the year ended December 31, 2013In millions
CompositeFibers
AdvancedAirlaid
MaterialsSpecialtyPapers
Other andUnallocated Total
Net sales $566.4 $268.4 $887.9 $ – $1,722.6Energy and related sales, net – – 3.2 – 3.2
Total revenue 566.4 268.4 891.0 – 1,725.8Cost of products sold 456.5 238.0 799.3 13.3 1,507.1
Gross profit 109.8 30.4 91.7 (13.3) 218.7SG&A 47.4 8.9 52.0 25.5 133.9Gains on dispositions of plant, equipment and timberlands, net – – – (1.7) (1.7)
Total operating income (loss) 62.4 21.5 39.7 (37.1) 86.5Non-operating expense – – – (17.3) (17.3)
Income (loss) before income taxes $ 62.4 $ 21.5 $ 39.7 $(54.4) $ 69.2
Supplementary DataPlant, equipment and timberlands, net $300.0 $175.1 $242.6 $ 5.6 $ 723.3Depreciation, depletion and amortization 24.8 8.9 33.2 1.3 68.2Capital expenditures 56.9 6.7 34.3 5.1 103.0
The sum of individual amounts set forth above may not agree to the consolidated financial statements included hereindue to rounding.
Results of individual business units are presentedbased on our management accounting practices andmanagement structure. There is no comprehensive,authoritative body of guidance for managementaccounting equivalent to accounting principles generallyaccepted in the United States of America; therefore, thefinancial results of individual business units are notnecessarily comparable with similar information for anyother company. The management accounting process usesassumptions and allocations to measure performance ofthe business units. Methodologies are refined from time totime as management accounting practices are enhancedand businesses change. The costs incurred by supportareas not directly aligned with the business unit areallocated primarily based on an estimated utilization ofsupport area services.
Management evaluates the performance of thebusiness units based on results of operations of thebusiness units before pension expense, certain corporatelevel costs, and the effects of certain gains or losses notconsidered to be related to the core business operations.Management believes that this is a more meaningfulrepresentation of the operating performance of its corebusinesses, the profitability of business units and theextent of cash flow generated from these core operations.Such amounts are presented under the caption “Other andUnallocated.” In the evaluation of business unit results,management does not use any measures of total assets.The information set forth above is aligned with themanagement and operating structure of our company. It isalso on this basis that the Company’s performance isevaluated internally and by the Company’s Board ofDirectors.
60
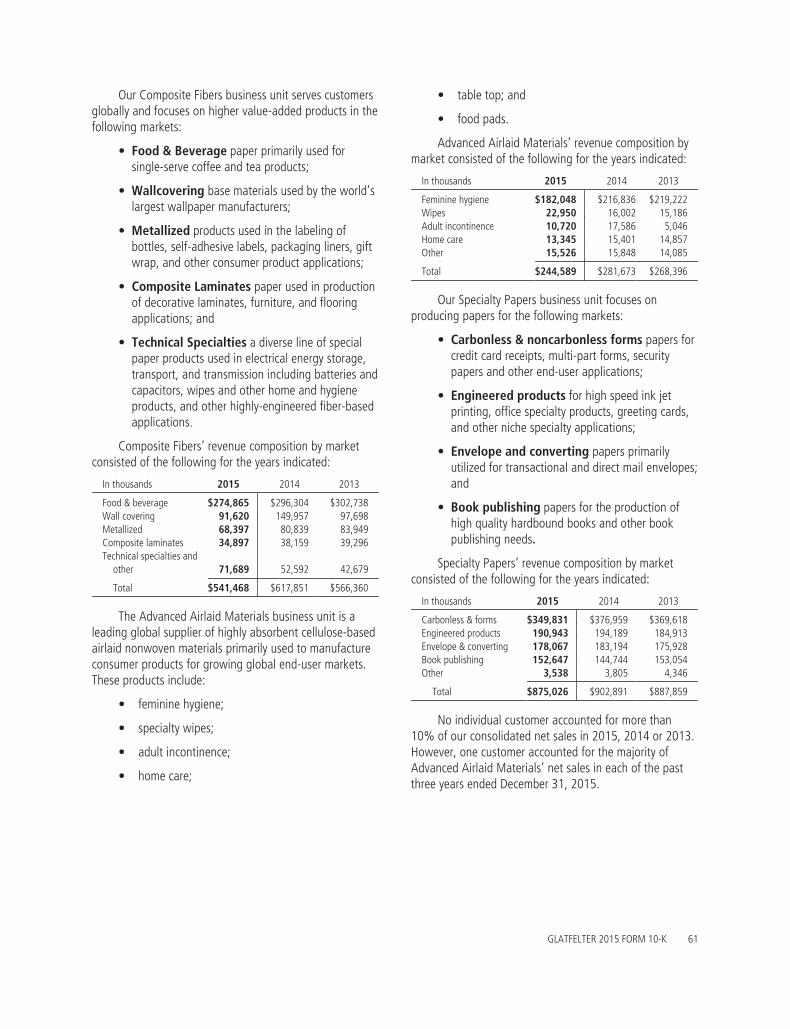
Our Composite Fibers business unit serves customersglobally and focuses on higher value-added products in thefollowing markets:
• Food & Beverage paper primarily used forsingle-serve coffee and tea products;
• Wallcovering base materials used by the world’slargest wallpaper manufacturers;
• Metallized products used in the labeling ofbottles, self-adhesive labels, packaging liners, giftwrap, and other consumer product applications;
• Composite Laminates paper used in productionof decorative laminates, furniture, and flooringapplications; and
• Technical Specialties a diverse line of specialpaper products used in electrical energy storage,transport, and transmission including batteries andcapacitors, wipes and other home and hygieneproducts, and other highly-engineered fiber-basedapplications.
Composite Fibers’ revenue composition by marketconsisted of the following for the years indicated:
In thousands 2015 2014 2013
Food & beverage $274,865 $296,304 $302,738Wall covering 91,620 149,957 97,698Metallized 68,397 80,839 83,949Composite laminates 34,897 38,159 39,296Technical specialties and
other 71,689 52,592 42,679
Total $541,468 $617,851 $566,360
The Advanced Airlaid Materials business unit is aleading global supplier of highly absorbent cellulose-basedairlaid nonwoven materials primarily used to manufactureconsumer products for growing global end-user markets.These products include:
• feminine hygiene;
• specialty wipes;
• adult incontinence;
• home care;
• table top; and
• food pads.
Advanced Airlaid Materials’ revenue composition bymarket consisted of the following for the years indicated:
In thousands 2015 2014 2013
Feminine hygiene $182,048 $216,836 $219,222Wipes 22,950 16,002 15,186Adult incontinence 10,720 17,586 5,046Home care 13,345 15,401 14,857Other 15,526 15,848 14,085
Total $244,589 $281,673 $268,396
Our Specialty Papers business unit focuses onproducing papers for the following markets:
• Carbonless & noncarbonless forms papers forcredit card receipts, multi-part forms, securitypapers and other end-user applications;
• Engineered products for high speed ink jetprinting, office specialty products, greeting cards,and other niche specialty applications;
• Envelope and converting papers primarilyutilized for transactional and direct mail envelopes;and
• Book publishing papers for the production ofhigh quality hardbound books and other bookpublishing needs.
Specialty Papers’ revenue composition by marketconsisted of the following for the years indicated:
In thousands 2015 2014 2013
Carbonless & forms $349,831 $376,959 $369,618Engineered products 190,943 194,189 184,913Envelope & converting 178,067 183,194 175,928Book publishing 152,647 144,744 153,054Other 3,538 3,805 4,346
Total $875,026 $902,891 $887,859
No individual customer accounted for more than10% of our consolidated net sales in 2015, 2014 or 2013.However, one customer accounted for the majority ofAdvanced Airlaid Materials’ net sales in each of the pastthree years ended December 31, 2015.
GLATFELTER 2015 FORM 10-K 61
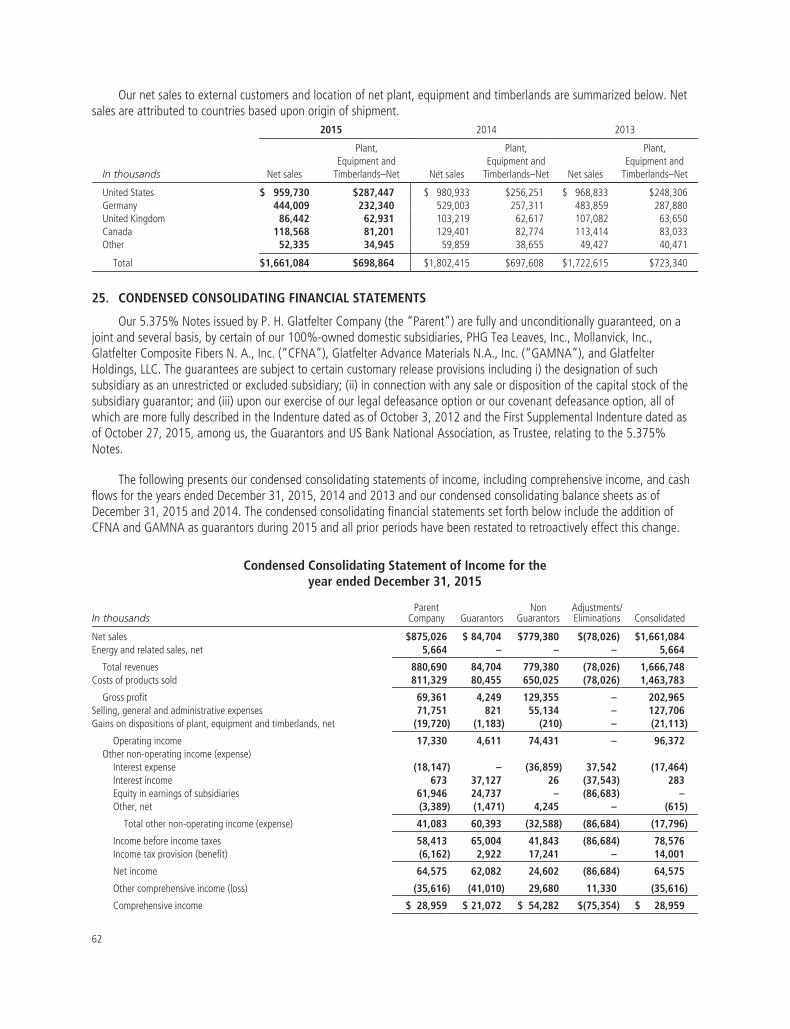
Our net sales to external customers and location of net plant, equipment and timberlands are summarized below. Netsales are attributed to countries based upon origin of shipment.
2015 2014 2013
In thousands Net sales
Plant,Equipment and
Timberlands–Net Net sales
Plant,Equipment and
Timberlands–Net Net sales
Plant,Equipment and
Timberlands–Net
United States $ 959,730 $287,447 $ 980,933 $256,251 $ 968,833 $248,306Germany 444,009 232,340 529,003 257,311 483,859 287,880United Kingdom 86,442 62,931 103,219 62,617 107,082 63,650Canada 118,568 81,201 129,401 82,774 113,414 83,033Other 52,335 34,945 59,859 38,655 49,427 40,471
Total $1,661,084 $698,864 $1,802,415 $697,608 $1,722,615 $723,340
25. CONDENSED CONSOLIDATING FINANCIAL STATEMENTS
Our 5.375% Notes issued by P. H. Glatfelter Company (the “Parent”) are fully and unconditionally guaranteed, on ajoint and several basis, by certain of our 100%-owned domestic subsidiaries, PHG Tea Leaves, Inc., Mollanvick, Inc.,Glatfelter Composite Fibers N. A., Inc. (“CFNA”), Glatfelter Advance Materials N.A., Inc. (“GAMNA”), and GlatfelterHoldings, LLC. The guarantees are subject to certain customary release provisions including i) the designation of suchsubsidiary as an unrestricted or excluded subsidiary; (ii) in connection with any sale or disposition of the capital stock of thesubsidiary guarantor; and (iii) upon our exercise of our legal defeasance option or our covenant defeasance option, all ofwhich are more fully described in the Indenture dated as of October 3, 2012 and the First Supplemental Indenture dated asof October 27, 2015, among us, the Guarantors and US Bank National Association, as Trustee, relating to the 5.375%Notes.
The following presents our condensed consolidating statements of income, including comprehensive income, and cashflows for the years ended December 31, 2015, 2014 and 2013 and our condensed consolidating balance sheets as ofDecember 31, 2015 and 2014. The condensed consolidating financial statements set forth below include the addition ofCFNA and GAMNA as guarantors during 2015 and all prior periods have been restated to retroactively effect this change.
Condensed Consolidating Statement of Income for theyear ended December 31, 2015
In thousandsParent
Company GuarantorsNon
GuarantorsAdjustments/Eliminations Consolidated
Net sales $875,026 $ 84,704 $779,380 $(78,026) $1,661,084Energy and related sales, net 5,664 – – – 5,664
Total revenues 880,690 84,704 779,380 (78,026) 1,666,748Costs of products sold 811,329 80,455 650,025 (78,026) 1,463,783
Gross profit 69,361 4,249 129,355 – 202,965Selling, general and administrative expenses 71,751 821 55,134 – 127,706Gains on dispositions of plant, equipment and timberlands, net (19,720) (1,183) (210) – (21,113)
Operating income 17,330 4,611 74,431 – 96,372Other non-operating income (expense)
Interest expense (18,147) – (36,859) 37,542 (17,464)Interest income 673 37,127 26 (37,543) 283Equity in earnings of subsidiaries 61,946 24,737 – (86,683) –Other, net (3,389) (1,471) 4,245 – (615)
Total other non-operating income (expense) 41,083 60,393 (32,588) (86,684) (17,796)
Income before income taxes 58,413 65,004 41,843 (86,684) 78,576Income tax provision (benefit) (6,162) 2,922 17,241 – 14,001
Net income 64,575 62,082 24,602 (86,684) 64,575
Other comprehensive income (loss) (35,616) (41,010) 29,680 11,330 (35,616)
Comprehensive income $ 28,959 $ 21,072 $ 54,282 $(75,354) $ 28,959
62
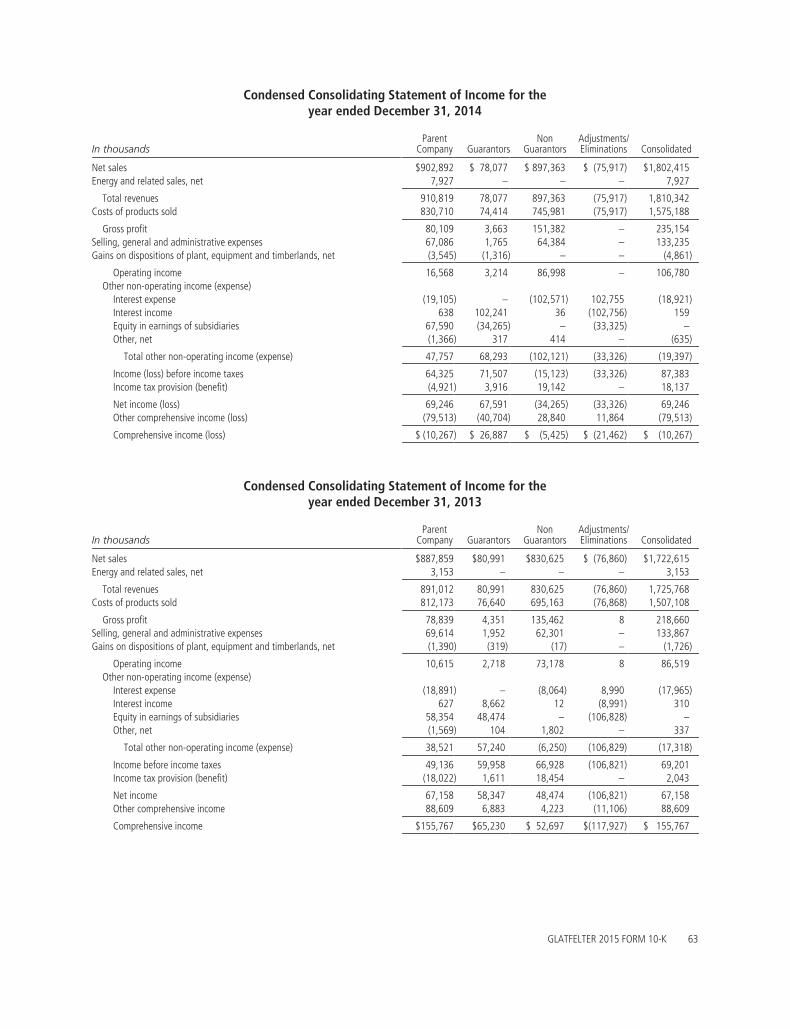
Condensed Consolidating Statement of Income for theyear ended December 31, 2014
In thousandsParent
Company GuarantorsNon
GuarantorsAdjustments/Eliminations Consolidated
Net sales $902,892 $ 78,077 $ 897,363 $ (75,917) $1,802,415Energy and related sales, net 7,927 – – – 7,927
Total revenues 910,819 78,077 897,363 (75,917) 1,810,342Costs of products sold 830,710 74,414 745,981 (75,917) 1,575,188
Gross profit 80,109 3,663 151,382 – 235,154Selling, general and administrative expenses 67,086 1,765 64,384 – 133,235Gains on dispositions of plant, equipment and timberlands, net (3,545) (1,316) – – (4,861)
Operating income 16,568 3,214 86,998 – 106,780Other non-operating income (expense)
Interest expense (19,105) – (102,571) 102,755 (18,921)Interest income 638 102,241 36 (102,756) 159Equity in earnings of subsidiaries 67,590 (34,265) – (33,325) –Other, net (1,366) 317 414 – (635)
Total other non-operating income (expense) 47,757 68,293 (102,121) (33,326) (19,397)
Income (loss) before income taxes 64,325 71,507 (15,123) (33,326) 87,383Income tax provision (benefit) (4,921) 3,916 19,142 – 18,137
Net income (loss) 69,246 67,591 (34,265) (33,326) 69,246Other comprehensive income (loss) (79,513) (40,704) 28,840 11,864 (79,513)
Comprehensive income (loss) $ (10,267) $ 26,887 $ (5,425) $ (21,462) $ (10,267)
Condensed Consolidating Statement of Income for theyear ended December 31, 2013
In thousandsParent
Company GuarantorsNon
GuarantorsAdjustments/Eliminations Consolidated
Net sales $887,859 $80,991 $830,625 $ (76,860) $1,722,615Energy and related sales, net 3,153 – – – 3,153
Total revenues 891,012 80,991 830,625 (76,860) 1,725,768Costs of products sold 812,173 76,640 695,163 (76,868) 1,507,108
Gross profit 78,839 4,351 135,462 8 218,660Selling, general and administrative expenses 69,614 1,952 62,301 – 133,867Gains on dispositions of plant, equipment and timberlands, net (1,390) (319) (17) – (1,726)
Operating income 10,615 2,718 73,178 8 86,519Other non-operating income (expense)
Interest expense (18,891) – (8,064) 8,990 (17,965)Interest income 627 8,662 12 (8,991) 310Equity in earnings of subsidiaries 58,354 48,474 – (106,828) –Other, net (1,569) 104 1,802 – 337
Total other non-operating income (expense) 38,521 57,240 (6,250) (106,829) (17,318)
Income before income taxes 49,136 59,958 66,928 (106,821) 69,201Income tax provision (benefit) (18,022) 1,611 18,454 – 2,043
Net income 67,158 58,347 48,474 (106,821) 67,158Other comprehensive income 88,609 6,883 4,223 (11,106) 88,609
Comprehensive income $155,767 $65,230 $ 52,697 $(117,927) $ 155,767
GLATFELTER 2015 FORM 10-K 63
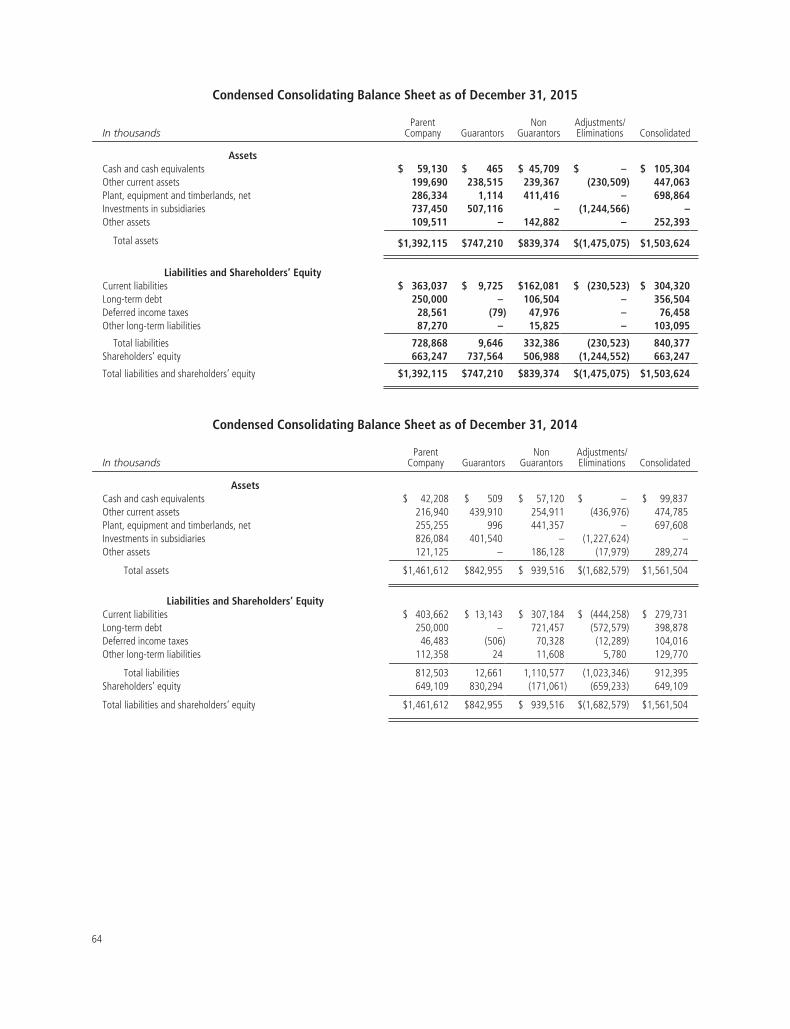
Condensed Consolidating Balance Sheet as of December 31, 2015
In thousandsParent
Company GuarantorsNon
GuarantorsAdjustments/Eliminations Consolidated
AssetsCash and cash equivalents $ 59,130 $ 465 $ 45,709 $ – $ 105,304Other current assets 199,690 238,515 239,367 (230,509) 447,063Plant, equipment and timberlands, net 286,334 1,114 411,416 – 698,864Investments in subsidiaries 737,450 507,116 – (1,244,566) –Other assets 109,511 – 142,882 – 252,393
Total assets $1,392,115 $747,210 $839,374 $(1,475,075) $1,503,624
Liabilities and Shareholders’ EquityCurrent liabilities $ 363,037 $ 9,725 $162,081 $ (230,523) $ 304,320Long-term debt 250,000 – 106,504 – 356,504Deferred income taxes 28,561 (79) 47,976 – 76,458Other long-term liabilities 87,270 – 15,825 – 103,095
Total liabilities 728,868 9,646 332,386 (230,523) 840,377Shareholders’ equity 663,247 737,564 506,988 (1,244,552) 663,247
Total liabilities and shareholders’ equity $1,392,115 $747,210 $839,374 $(1,475,075) $1,503,624
Condensed Consolidating Balance Sheet as of December 31, 2014
In thousandsParent
Company GuarantorsNon
GuarantorsAdjustments/Eliminations Consolidated
AssetsCash and cash equivalents $ 42,208 $ 509 $ 57,120 $ – $ 99,837Other current assets 216,940 439,910 254,911 (436,976) 474,785Plant, equipment and timberlands, net 255,255 996 441,357 – 697,608Investments in subsidiaries 826,084 401,540 – (1,227,624) –Other assets 121,125 – 186,128 (17,979) 289,274
Total assets $1,461,612 $842,955 $ 939,516 $(1,682,579) $1,561,504
Liabilities and Shareholders’ EquityCurrent liabilities $ 403,662 $ 13,143 $ 307,184 $ (444,258) $ 279,731Long-term debt 250,000 – 721,457 (572,579) 398,878Deferred income taxes 46,483 (506) 70,328 (12,289) 104,016Other long-term liabilities 112,358 24 11,608 5,780 129,770
Total liabilities 812,503 12,661 1,110,577 (1,023,346) 912,395Shareholders’ equity 649,109 830,294 (171,061) (659,233) 649,109
Total liabilities and shareholders’ equity $1,461,612 $842,955 $ 939,516 $(1,682,579) $1,561,504
64

Condensed Consolidating Statement of Cash Flows for the yearended December 31, 2015
In thousandsParent
Company GuarantorsNon
GuarantorsAdjustments/Eliminations Consolidated
Net cash provided (used) byOperating activities $ 34,391 $ 627 $ 98,725 $ – $133,743Investing activities
Expenditures for purchases of plant, equipment and timberlands (65,265) (109) (34,515) – (99,889)Proceeds from disposal plant, equipment and timberlands, net 22,741 1,213 505 – 24,459Repayments from intercompany loans – 57,855 – (57,855) –Advances of intercompany loans – (49,230) – 49,230 –Intercompany capital (contributed) returned 10,100 (300) – (9,800) –Acquisitions, net of cash acquired – – (224) – (224)Other (1,600) – – – (1,600)Total investing activities (34,024) 9,429 (34,234) (18,425) (77,254)
Financing activitiesNet repayments of indebtedness – – (24,650) – (24,650)Payments of note offering costs (1,329) – – – (1,329)Payment of dividends to shareholders (20,443) – – – (20,443)Repayments of intercompany loans (9,158) – (48,697) 57,855 –Borrowings of intercompany loans 49,230 – – (49,230) –Intercompany capital (returned) received – (10,100) 300 9,800 –Payments related to share-based compensation awards and other (1,745) – 151 – (1,594)Total financing activities 16,555 (10,100) (72,896) 18,425 (48,016)
Effect of exchange rate on cash – – (3,006) – (3,006)Net increase (decrease) in cash 16,922 (44) (11,411) – 5,467Cash at the beginning of period 42,208 509 57,120 – 99,837
Cash at the end of period $ 59,130 $ 465 $ 45,709 $ – $105,304
Condensed Consolidating Statement of Cash Flows for the yearended December 31, 2014
In thousandsParent
Company GuarantorsNon
GuarantorsAdjustments/Eliminations Consolidated
Net cash provided (used) byOperating activities $ 36,240 $ 4,159 $ 59,178 $ – $ 99,577Investing activities
Expenditures for purchases of plant, equipment and timberlands (34,518) – (31,528) – (66,046)Proceeds from disposal plant, equipment and timberlands, net 3,707 1,355 10 – 5,072Repayments from intercompany loans – 20,840 – (20,840) –Advances of intercompany loans (12,671) (26,340) – 39,011 –Acquisitions, net of cash acquired – – (8,015) – (8,015)Other (600) – – – (600)Total investing activities (44,082) (4,145) (39,533) 18,171 (69,589)
Financing activitiesNet repayments of indebtedness – – (18,128) – (18,128)Payment of dividends to shareholders (18,696) – – – (18,696)Repurchases of common stock (12,180) – – – (12,180)Repayments of intercompany loans – – (20,840) 20,840 –Borrowings of intercompany loans 26,340 – 12,671 (39,011) –Payments related to share-based compensation awards and other (1,630) – (247) – (1,877)Total financing activities (6,166) – (26,544) (18,171) (50,881)
Effect of exchange rate on cash – – (2,152) – (2,152)Net increase (decrease) in cash (14,008) 14 (9,051) – (23,045)Cash at the beginning of period 56,216 495 66,171 – 122,882
Cash at the end of period $ 42,208 $ 509 $ 57,120 $ – $ 99,837
GLATFELTER 2015 FORM 10-K 65
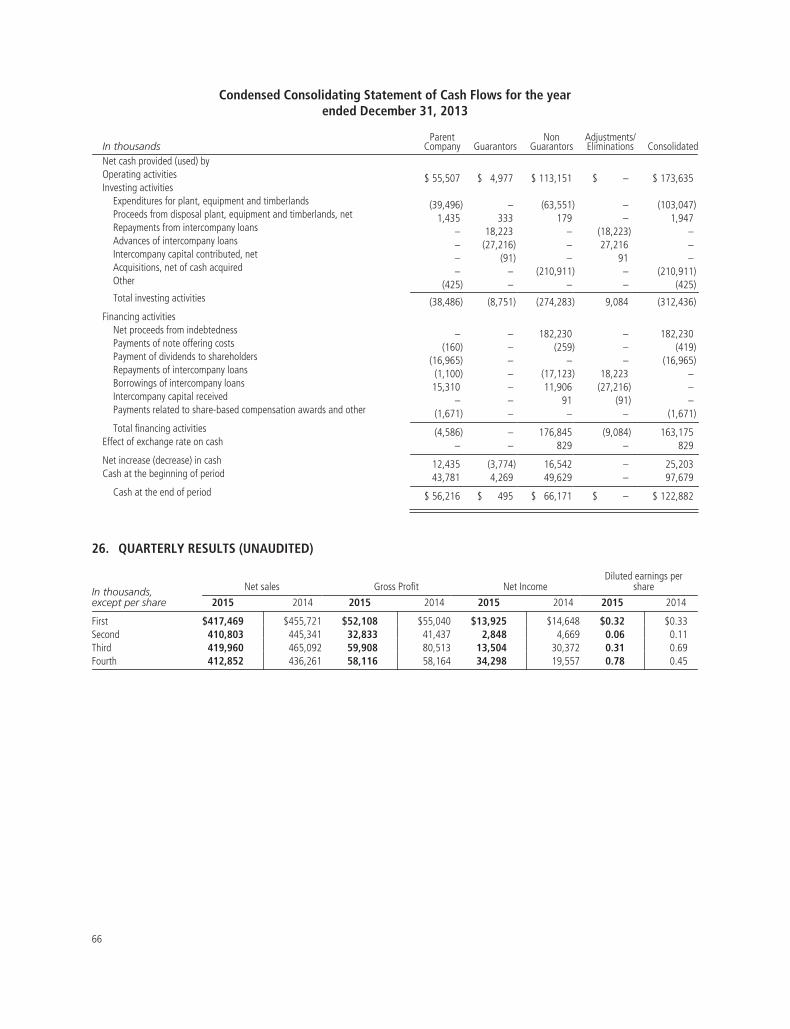
Condensed Consolidating Statement of Cash Flows for the yearended December 31, 2013
In thousandsParent
Company GuarantorsNon
GuarantorsAdjustments/Eliminations Consolidated
Net cash provided (used) byOperating activities $ 55,507 $ 4,977 $ 113,151 $ – $ 173,635Investing activities
Expenditures for plant, equipment and timberlands (39,496) – (63,551) – (103,047)Proceeds from disposal plant, equipment and timberlands, net 1,435 333 179 – 1,947Repayments from intercompany loans – 18,223 – (18,223) –Advances of intercompany loans – (27,216) – 27,216 –Intercompany capital contributed, net – (91) – 91 –Acquisitions, net of cash acquired – – (210,911) – (210,911)Other (425) – – – (425)Total investing activities (38,486) (8,751) (274,283) 9,084 (312,436)
Financing activitiesNet proceeds from indebtedness – – 182,230 – 182,230Payments of note offering costs (160) – (259) – (419)Payment of dividends to shareholders (16,965) – – – (16,965)Repayments of intercompany loans (1,100) – (17,123) 18,223 –Borrowings of intercompany loans 15,310 – 11,906 (27,216) –Intercompany capital received – – 91 (91) –Payments related to share-based compensation awards and other (1,671) – – – (1,671)Total financing activities (4,586) – 176,845 (9,084) 163,175
Effect of exchange rate on cash – – 829 – 829Net increase (decrease) in cash 12,435 (3,774) 16,542 – 25,203Cash at the beginning of period 43,781 4,269 49,629 – 97,679
Cash at the end of period $ 56,216 $ 495 $ 66,171 $ – $ 122,882
26. QUARTERLY RESULTS (UNAUDITED)
In thousands,except per share
Net sales Gross Profit Net IncomeDiluted earnings per
share
2015 2014 2015 2014 2015 2014 2015 2014
First $417,469 $455,721 $52,108 $55,040 $13,925 $14,648 $0.32 $0.33Second 410,803 445,341 32,833 41,437 2,848 4,669 0.06 0.11Third 419,960 465,092 59,908 80,513 13,504 30,372 0.31 0.69Fourth 412,852 436,261 58,116 58,164 34,298 19,557 0.78 0.45
66
ITEM 9 CHANGES IN AND DISAGREEMENTSWITH ACCOUNTANTS ONACCOUNTING AND FINANCIALDISCLOSURES
None.
ITEM 9A CONTROLS AND PROCEDURES
Disclosure Controls and Procedures
Our chief executive officer and our chief financialofficer have, after evaluating the effectiveness of ourdisclosure controls and procedures (as defined in ExchangeAct Rules 13a-15(e) and 15d-15(e)), as of December 31,2015, concluded that, as of the evaluation date, ourdisclosure controls and procedures were effective.
Internal Control Over Financial Reporting
Management’s report on the Company’s internalcontrol over financial reporting (as defined in Exchange ActRules 13a-15(f) and 15d-15(f)) and the related report ofour independent registered public accounting firm areincluded in Item 8 – Financial Statements andSupplementary Data.
Changes in Internal Control over FinancialReporting
There were no changes in our internal control overfinancial reporting during the three months endedDecember 31, 2015, that have materially affected or arereasonably likely to materially affect our internal controlover financial reporting.
ITEM 9B OTHER INFORMATION
None.
PART III
ITEM 10 DIRECTORS, EXECUTIVE OFFICERSAND CORPORATE GOVERNANCE
Directors The information with respect todirectors required under this Item is incorporated herein byreference to our Proxy Statement, to be dated on or aboutMarch 31, 2016. Our board of directors has determinedthat, based on the relevant experience of the members ofthe Audit Committee, two of the four members are “auditcommittee financial experts” as this term is set forth in theapplicable regulations of the SEC.
Executive Officers of the Registrant Theinformation with respect to the executive officers requiredunder this Item incorporated herein by reference to“Executive Officers” as set forth in Part I, page 13 of thisreport.
We have adopted a Code of Business Ethics for theCEO and Senior Financial Officers (the “Code of BusinessEthics”) in compliance with applicable rules of theSecurities and Exchange Commission that applies to ourchief executive officer, chief financial officer and ourprincipal accounting officer or controller, or personsperforming similar functions. A copy of the Code ofBusiness Ethics is filed as an exhibit to this Annual Reporton Form 10-K and is available on our website, free ofcharge, at www.glatfelter.com.
ITEM 11 EXECUTIVE COMPENSATION
The information required under this Item isincorporated herein by reference to our Proxy Statement,to be dated on or about March 31, 2016.
ITEM 12 SECURITY OWNERSHIP OF CERTAINBENEFICIAL OWNERS ANDMANAGEMENT
The information required under this Item isincorporated herein by reference to our Proxy Statement,to be dated on or about March 31, 2016.
ITEM 13 CERTAIN RELATIONSHIPS ANDRELATED TRANSACTIONS, ANDDIRECTOR INDEPENDENCE
The information required under this Item isincorporated herein by reference to our Proxy Statement,to be dated on or about March 31, 2016.
ITEM 14 PRINCIPAL ACCOUNTANT FEES ANDSERVICES
The information required under this Item isincorporated herein by reference to our Proxy Statement,to be dated on or about March 31, 2016.
Our Chief Executive Officer has certified to the NewYork Stock Exchange that he is not aware of any violationsby the Company of the NYSE corporate governance listingstandards.
GLATFELTER 2015 FORM 10-K 67
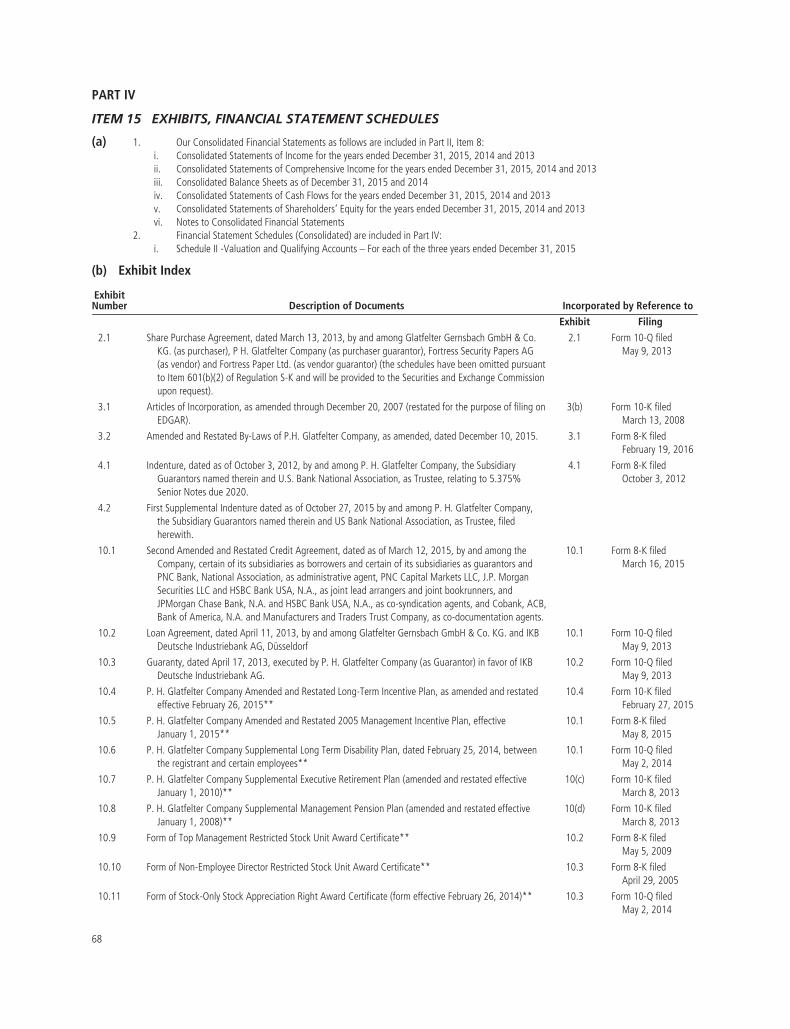
PART IV
ITEM 15 EXHIBITS, FINANCIAL STATEMENT SCHEDULES
(a) 1. Our Consolidated Financial Statements as follows are included in Part II, Item 8:i. Consolidated Statements of Income for the years ended December 31, 2015, 2014 and 2013ii. Consolidated Statements of Comprehensive Income for the years ended December 31, 2015, 2014 and 2013iii. Consolidated Balance Sheets as of December 31, 2015 and 2014iv. Consolidated Statements of Cash Flows for the years ended December 31, 2015, 2014 and 2013v. Consolidated Statements of Shareholders’ Equity for the years ended December 31, 2015, 2014 and 2013vi. Notes to Consolidated Financial Statements
2. Financial Statement Schedules (Consolidated) are included in Part IV:i. Schedule II -Valuation and Qualifying Accounts – For each of the three years ended December 31, 2015
(b) Exhibit Index
ExhibitNumber Description of Documents Incorporated by Reference to
Exhibit Filing
2.1 Share Purchase Agreement, dated March 13, 2013, by and among Glatfelter Gernsbach GmbH & Co.KG. (as purchaser), P H. Glatfelter Company (as purchaser guarantor), Fortress Security Papers AG(as vendor) and Fortress Paper Ltd. (as vendor guarantor) (the schedules have been omitted pursuantto Item 601(b)(2) of Regulation S-K and will be provided to the Securities and Exchange Commissionupon request).
2.1 Form 10-Q filedMay 9, 2013
3.1 Articles of Incorporation, as amended through December 20, 2007 (restated for the purpose of filing onEDGAR).
3(b) Form 10-K filedMarch 13, 2008
3.2 Amended and Restated By-Laws of P.H. Glatfelter Company, as amended, dated December 10, 2015. 3.1 Form 8-K filedFebruary 19, 2016
4.1 Indenture, dated as of October 3, 2012, by and among P. H. Glatfelter Company, the SubsidiaryGuarantors named therein and U.S. Bank National Association, as Trustee, relating to 5.375%Senior Notes due 2020.
4.1 Form 8-K filedOctober 3, 2012
4.2 First Supplemental Indenture dated as of October 27, 2015 by and among P. H. Glatfelter Company,the Subsidiary Guarantors named therein and US Bank National Association, as Trustee, filedherewith.
10.1 Second Amended and Restated Credit Agreement, dated as of March 12, 2015, by and among theCompany, certain of its subsidiaries as borrowers and certain of its subsidiaries as guarantors andPNC Bank, National Association, as administrative agent, PNC Capital Markets LLC, J.P. MorganSecurities LLC and HSBC Bank USA, N.A., as joint lead arrangers and joint bookrunners, andJPMorgan Chase Bank, N.A. and HSBC Bank USA, N.A., as co-syndication agents, and Cobank, ACB,Bank of America, N.A. and Manufacturers and Traders Trust Company, as co-documentation agents.
10.1 Form 8-K filedMarch 16, 2015
10.2 Loan Agreement, dated April 11, 2013, by and among Glatfelter Gernsbach GmbH & Co. KG. and IKBDeutsche Industriebank AG, Düsseldorf
10.1 Form 10-Q filedMay 9, 2013
10.3 Guaranty, dated April 17, 2013, executed by P. H. Glatfelter Company (as Guarantor) in favor of IKBDeutsche Industriebank AG.
10.2 Form 10-Q filedMay 9, 2013
10.4 P. H. Glatfelter Company Amended and Restated Long-Term Incentive Plan, as amended and restatedeffective February 26, 2015**
10.4 Form 10-K filedFebruary 27, 2015
10.5 P. H. Glatfelter Company Amended and Restated 2005 Management Incentive Plan, effectiveJanuary 1, 2015**
10.1 Form 8-K filedMay 8, 2015
10.6 P. H. Glatfelter Company Supplemental Long Term Disability Plan, dated February 25, 2014, betweenthe registrant and certain employees**
10.1 Form 10-Q filedMay 2, 2014
10.7 P. H. Glatfelter Company Supplemental Executive Retirement Plan (amended and restated effectiveJanuary 1, 2010)**
10(c) Form 10-K filedMarch 8, 2013
10.8 P. H. Glatfelter Company Supplemental Management Pension Plan (amended and restated effectiveJanuary 1, 2008)**
10(d) Form 10-K filedMarch 8, 2013
10.9 Form of Top Management Restricted Stock Unit Award Certificate** 10.2 Form 8-K filedMay 5, 2009
10.10 Form of Non-Employee Director Restricted Stock Unit Award Certificate** 10.3 Form 8-K filedApril 29, 2005
10.11 Form of Stock-Only Stock Appreciation Right Award Certificate (form effective February 26, 2014)** 10.3 Form 10-Q filedMay 2, 2014
68

ExhibitNumber Description of Documents Incorporated by Reference to
Exhibit Filing
10.12 Form of Performance Share Award Certificate (form effective February 26, 2014)** 10.2 Form 10-Q filedMay 2, 2014
10.13 Form of Restricted Stock Unit Award Certificate, form effective as of December 13, 2013** 10.(l) Form 10-K filedMarch 3, 2014
10.14 Restricted Stock Unit Award Certificate, dated as of December 13, 2013, for Dante C. Parrini** 10.1 Form 8-K filedDecember 17, 2013
10.15 Non-Competition and Non-Solicitation Agreement by and between P. H. Glatfelter Company and DanteC. Parrini, dated July 2, 2010. **
10.1 Form 8-K filedJuly 6, 2010
10.16 Form of Change in Control Employment Agreement by and between P. H. Glatfelter Company andcertain employees, form effective as of December 8, 2008 **
10(j) Form 10-K filedMarch 13, 2009
10.16 (A) Schedule of Change in Control Employment Agreements** 10(l) A Form 10-K filedMarch 8, 2013
10.17 Form of Change in Control Employment Agreement by and between P.H. Glatfelter Company andcertain employees, form effective as of August 5, 2013**
10(q) Form 10-K filedMarch 3, 2014
10.17 (A) Schedule of Change in Control Employment Agreements** 10.19(A) Form 10-K filedFebruary 27, 2015
10.18 Summary of Non-Employee Director Compensation (effective January 1, 2005)** 10.1 Form 8-K filedDecember 20, 2004
10.19 P. H. Glatfelter Company Deferred Compensation Plan for Directors, effective as of January 1, 2007** 10(k) Form 10-K filedMarch 8, 2013
10.20 Service Agreement, commencing on August 1, 2006, between the Registrant (through a wholly ownedsubsidiary) and Martin Rapp**
10(r) Form 10-K filedMarch 16, 2007
10.21 Retirement Pension Contract, dated October 31, 2007, between Registrant (through a wholly ownedsubsidiary) and Martin Rapp**
10(t) Form 10-K filedMarch 13, 2008
10.22 Guidelines for Executive Severance** 10.2 Form 8-K filedJuly 6, 2010
10.23 Agreement between the State of Wisconsin and Certain Companies Concerning the Fox River, dated asof January 31, 1997, among P. H. Glatfelter Company, Fort Howard Corporation, NCR Corporation,Appleton Papers Inc., Riverside Paper Corporation, U.S. Paper Mills, Wisconsin Tissue Mills Inc. andthe State of Wisconsin
10(i) Form 10-K filedMarch 28, 1997
10.24 Consent Decree for Remedial Design and Remedial Action at Operable Unit 1 of the Lower Fox Riverand Green Bay Site between the United States of America and the State of Wisconsin v. P. H.Glatfelter Company and WTM I Company (f/k/a Wisconsin Tissue Mills Inc.)
10.3(a) Form 10-Q filedAugust 6, 2010
10.24 (A) Agreed Supplement to Consent Decree between United States of America and the State of Wisconsinvs. P.H. Glatfelter Company and WTM I Company (f/k/a Wisconsin Tissue Mills Inc.)
10.3(b) Form 10-Q filedAugust 6, 2010
10.24 (B) Second Agreed Supplement to Consent Decree between United States of America and the State ofWisconsin vs. P.H. Glatfelter Company and WTM I Company (f/k/a Wisconsin Tissue Mills Inc.)
10.3(c) Form 10-Q filedAugust 6, 2010
10.24 (C) Amended Consent Decree for Remedial Design and Remedial Action at Operable Unit 1 of the LowerFox River and Green Bay Site by and among the United States of America and the State of Wisconsinv. P. H. Glatfelter and WTM I Company (f/k/a Wisconsin Tissue Mills Inc.) (certain Appendices havebeen intentionally omitted, copies of which can be obtained free of charge from the Registrant)
10.3(d) Form 10-Q filedAugust 6, 2010
10.25 Administrative Order for Remedial Action dated November 13, 2007, issued by the United StatesEnvironmental Protection Agency
10.2 Form 8-K filedNovember 19, 2007
14 Code of Business Ethics for the CEO and Senior Financial Officers of Glatfelter 14 Form 10-K filedMarch 15, 2004
21 Subsidiaries of the Registrant, filed herewith
23 Consent of Independent Registered Public Accounting Firm, filed herewith
31.1 Certification of Dante C. Parrini, Chairman and Chief Executive Officer of Glatfelter, pursuant toSection 302(a) of the Sarbanes-Oxley Act Of 2002, filed herewith
31.2 Certification of John P. Jacunski, Executive Vice President and Chief Financial Officer of Glatfelter,pursuant to Section 302(a) of the Sarbanes-Oxley Act Of 2002, filed herewith
32.1 Certification of Dante C. Parrini, Chairman and Chief Executive Officer of Glatfelter, pursuant to Section906 of the Sarbanes-Oxley Act of 2002, 18 U.S.C. Section 1350, furnished herewith
GLATFELTER 2015 FORM 10-K 69

ExhibitNumber Description of Documents Incorporated by Reference to
Exhibit Filing
32.2 Certification of John P. Jacunski, Executive Vice President and Chief Financial Officer of Glatfelter,pursuant to Section 906 of the Sarbanes-Oxley Act of 2002, 18 U.S.C. Section 1350, furnishedherewith
101.INS XBRL Instance Document, filed herewith
101.SCH XBRL Taxonomy Extension Schema, filed herewith
101.CAL XBRL Extension Calculation Linkbase, filed herewith
101.DEF XBRL Extension Definition Linkbase, filed herewith
101.LAB XBRL Extension Label Linkbase, filed herewith
101.PRE XBRL Extension Presentation Linkbase, filed herewith
** Management contract or compensatory plan
70

SIGNATURES
Pursuant to the requirements of Section 13 or 15(d) of the Securities Exchange Act of 1934, the Registrant has dulycaused this report to be signed on its behalf by the undersigned, thereunto duly authorized.
P. H. GLATFELTER COMPANY(Registrant)
February 26, 2016By /s/ Dante C. Parrini
Dante C. ParriniChairman and
Chief Executive Officer
Pursuant to the requirements of the Securities Exchange Act of 1934, this report has been signed below by thefollowing persons on behalf of the Registrant in the capacities and on the dates indicated:
Date Signature Capacity
February 26, 2016 /s/ Dante C. Parrini
Dante C. ParriniChairman and Chief Executive Officer
Principal Executive Officer and Director
February 26, 2016 /s/ John P. Jacunski
John P. JacunskiExecutive Vice President and Chief Financial Officer
Principal Financial Officer
February 26, 2016 /s/ David C. Elder
David C. ElderVice President, Finance
Chief Accounting Officer
February 26, 2016 /s/ Bruce Brown
Bruce Brown
Director
February 26, 2016 /s/ Kathleen A. Dahlberg
Kathleen A. Dahlberg
Director
February 26, 2016 /s/ Nicholas DeBenedictis
Nicholas DeBenedictis
Director
February 26, 2016 /s/ Kevin M. Fogarty
Kevin M. Fogarty
Director
February 26, 2016 /s/ J. Robert Hall
J. Robert Hall
Director
February 26, 2016 /s/ Richard C. Ill
Richard C. Ill
Director
February 26, 2016 /s/ Ronald J. Naples
Ronald J. Naples
Director
February 26, 2016 /s/ Lee C. Stewart
Lee C. Stewart
Director
GLATFELTER 2015 FORM 10-K 71
[THIS PAGE INTENTIONALLY LEFT BLANK]

Schedule II
P. H. GLATFELTER COMPANY AND SUBSIDIARIESSUPPLEMENTAL FINANCIAL STATEMENT SCHEDULE
For each of the three years ended December 31, 2015Valuation and Qualifying Accounts
Allowance forIn thousands Doubtful Accounts Sales Discounts and Deductions
2015 2014 2013 2015 2014 2013
Balance, beginning of year $2,703 $2,725 $ 2,858 $ 1,809 $ 1,810 $ 2,302Provision 7 1,061 945 3,856 4,356 5,526Write-offs, recoveries and discounts allowed (275) (946) (1,119) (3,649) (4,719) (6,148)Other (a) (196) (137) 41 (423) 362 130
Balance, end of year $2,239 $2,703 $ 2,725 $ 1,593 $ 1,809 $ 1,810
The provision for doubtful accounts is included in selling, general and administrative expense and the provision for salesdiscounts and deductions is deducted from sales. The related allowances are deducted from accounts receivable.
(a) Relates primarily to changes in currency exchange rates.
GLATFELTER 2015 FORM 10-K 73
WORLD HEADQUARTERS P. H . GL ATFELTER COMPANY
96 South George Street
Suite 520
York, PA 17401
phone: 717-225-2719
fax: 717-846-7208
www.glatfelter.com
STOCK EXCHANGE AND SYMBOL
New York Stock Exchange
GLT
ANNUAL MEETING OF SHAREHOLDERS
May 5, 2016, 9:00 a.m. Eastern
York County Heritage Trust,
Historical Society Museum
250 East Market Street, York, PA
INFORMATION SOURCES
For the latest quarterly business results or
other information, visit www.glatfelter.com
or contact:
Investor Relations
P. H. Glatfelter Company
96 South George Street
Suite 520
York, PA 17401
phone: 717-225-2719
e-mail: [email protected]
TR ANSFER AGENT, DIVIDEND DISBURSING AGENT AND REGISTR AR
Computershare
P. O. Box 30170
College Station, TX 77842-3170
Private Couriers/Registered Mail:
Computershare
211 Quality Circle, Suite 210
College Station, TX 77845
Shareholder website
www.computershare.com/investor
Shareholder online inquiries
https://www-us.computershare.com/investor/Contact
toll-free: 877-832-7259
international: 201-680-6578
DIRECTORS
Dante C. Parrini
Chairman and Chief Executive Officer
Bruce Brown
Retired Chief Technology Officer
Procter & Gamble
Kathleen A. Dahlberg
Chief Executive Officer
G.G.I., Inc.
Richard C. Ill
Retired Chairman and Chief Executive Officer
Triumph Group, Inc.
Ronald J. Naples
Chairman Emeritus
Quaker Chemical Corporation
Lee C. Stewart
Private Financial Consultant
Nicholas DeBenedictis
Retired Chairman and Chief Executive Officer
Aqua America, Inc.
Kevin M. Fogarty
President and Chief Executive Officer
Kraton Performance Polymers, Inc.
J. Robert Hall
Managing Director
Centerview Capital
OFFICERS AND MANAGEMENT
D I R E C T O R S A N D O F F I C E R S
C O R P O R A T E I N F O R M A T I O N
Dante C. Parrini
Chairman and Chief Executive Officer
John P. Jacunski
Executive Vice President and
Chief Financial Officer
Christopher W. Astley
Senior Vice President & Business Unit
President, Advanced Airlaid Materials
Brian E. Janki
Senior Vice President & Business Unit
President, Specialty Papers
Martin Rapp
Senior Vice President & Business Unit
President, Composite Fibers
Reinhard S. Schiebeler
Vice President, Operations &
Supply Chain, Composite Fibers
Ramesh Shettigar
Vice President & Treasurer
Jeffrey G. Walters
Vice President, Internal Audit
Amy R. Wannemacher
Vice President, Tax
Joseph J. Zakutney
Vice President and Chief Information Officer
William T. Yanavitch II
Senior Vice President, Human Resources
and Administration
Eileen L. Beck
Vice President, Global Compensation &
Benefits
David C. Elder
Vice President, Finance
Timothy R. Hess
Vice President, Sales & Marketing,
Specialty Papers
Kent K. Matsumoto
Vice President, General Counsel &
Corporate Secretary

LL OO CC A T I O N S
WWORL EAADDDQ R E S
P. H. Glatfelter Company
96 Soutthh eorge Str et
Suite 5200
York, PA 17440
U.S.A.
U.S. O AATTINN O TIIOONNS
Spring Grove Facility*
2228 SSouthh Main Str et
Sprring GGrrrooove PPA 11 62
Chillicothe Facility*
2233222 EEEEEaassttt EEEiigggg tthh Sttrr eett
Chilliiccooooootthe, HH 56 1
Fremont Facility
2222227755 CCoommmmmmmm rrcce Drriiivvvee
Freemmont, OHHH 43 20
Fort Smith Facility
8201 Chhaad C llle BB uulevard
FFoorrtt SSmmiitthhh,, A 7 99911
(producttiion tt bbb ggii laattee 2011 )
INTT RRNAA ONALLL OPPPPEEERRR T GGGLOCCCC TTIIO
Gernsbach Facility*
Hörddener Stra 5
776659933 Gernsb h
GGerrmany
Dresden Facility*
Bergg ttraa e 776
010 999 DDre enn
Ger a yy
Ober-Schmitten Facility*
nnnsssttt aaß 133
Obbeerr-SSchhhhmittteennn
6633667 iddd aa
Gerrmma y
Scaër Facility*
P 22
2 99999900 SScccaëërrr
FFrra ce
Lydney Facility*
CCh rrchh Road
Lyydd eeyy,, GGlloucesterrrssshhirre
GL15 5EEJJ
Uni edd KKiinnggdomm
Caerphilly Facility*
PPoonnnnn yyggwwiinnddyyyy IInndd ssttrriiaallll EEEssttatte
CCae philly, Mid lammorg nn
CF8 3HU
Unit d Kingdo
Gatineau Facility*
6800 r e Atmec
attiinne uu, Q J8P 7 7
anad
Falkenhagen Facility*
GGGewerrbbepar Prig itz/Fal enh en
RRollfff-HHöveellllmaannn-Strraaße 11
116928 ritzww lllk
Geermanyy
Newtech Pulp Facility
Bo. Maaariiiiiaa CCrr sstttttiiiiinnnnnaaaa
9217 BBaloo---I, LLaaanaao dddeeel NNoo e
Phiillliiip iness
* Also a Sales Office
SSALESS OOOOFFFFFICCE- ONLYYYLOOCATIIOONSSS
Gainesville, Georgia
2000 BBrrooaadd SStreet
Suiittee 222066
GGainesvviille, GGA 305001
UUUU.SS.AA.
Moscow, Russia
1333 2--yyaa ZZZZvenniigoorroddsskkaya Street
Buildddiinnnngg 4411 (Floorr 99)
Moosscooowwww,, 1123022
RRuussiaa
OTTHHEERR LLLLOOOOOOOCCAATTIIOONNNNSS
China
Rooommm 501
Buiilldddiiinnng 2244 offff TTiimmmmmmeeeeessss SSSSSSSSSSqqqqqqqqquuuaaaarrrreeee
SSuuzhou IIInnnddduuustriaaalll Paaarrk
215502288 SSuuuuuzzzhou
Peeeoplee’’’sss Reppppuuubbllliiic of CChiiiinaa

© 2016 GLATFELTER
P . H . G L A T F E L T E R C O M P A N Y 9 6 S O U T H G E O R G E S T R E E T , S U I T E 5 2 0 Y O R K , P A 1 7 4 0 1 W W W . G L A T F E L T E R . C O M