Embed Size (px)
Citation preview

2015-2020
Approved by the Peralta Community College District Board of Trustees, June 14, 2016

2 | P a g e
ACKNOWLEDGEMENTS
We would like to thank the following individuals for their participation and dedication to
developing a data driven Educational Master Plan that will serve the College as a guide for the
next five years in supporting our students in achieving their academic, career and life goals. We
also thank members of the Merritt College community who contributed through their participation
in the Educational Master Plan Town Hall meetings.
Educational Master Plan Core Team
Dr. Tina Vasconcellos
Nghiem Thai
Samantha Kessler
Ann Elliott
Dr. Mario Rivas
Educational Master Plan Work Group Teams
CTE
Rachel Antrobus
Jennifer Briffa
Courtney Brown
Hank Fabian
Maria Perez
Kinga Sidzinska
Maria Suarez
Elaine Wallace
Jennifer Yates
Foundations
Dr. Arnulfo Cedillo
Ann Elliott
Brenda Mora
Mary Ciddio
Timothy Hackett
Jason Holloway
Walter Johnson
Daniel Lawson
Louisa Roberts
Isela Gonzalez Santana
Marty Zielke
Transfer
Dr. Rosemary Delia
Dr. Lilia Chavez
Dr. Mario Rivas
Maria Spencer
Sarah Gallardo
Tanya Illarde
Bill Love
Sheila Metcalf-Tobin
Ernesto Nery
Tae-Soon Park
Jason Seals

3 | P a g e
Dear Colleagues,
On behalf of Merritt College, I am very pleased to present this update of Merritt
College’s 2015-2020 Educational Master Plan. This plan emerged in fall 2015 and continued
through spring 2016 with extensive reflections, ideas, and campus-wide participation by the
Merritt College community. The Educational Master Plan serves as a key part of the college’s
integrated planning process and will be implemented during the next five years through action-
oriented strategic plans.
Merritt College’s Educational Master Plan is the foundation and the primary reference for
guiding program planning and reviews, managing student learning outcomes, and coordinating
college resources. The plan embraces new ideas to augment and further strengthen our programs
and services for student success. It exemplifies opportunities for greater attention to partnerships,
college engagement and innovation for students. Lastly, it affirms that Merritt College will
continue to serve its students and community effectively with broad-based leadership, and vision
for the next five years.
In acknowledgment of this work, I would like to thank the entire college community for
their involvement in this important endeavor. And, a special thanks to the Educational Master
Plan Committee for their extraordinary commitment and for the many hours they spent in
developing and shaping this plan.
Merritt College Education Master Plan centers on the preparation of our students as
future leaders of the 21st century! Merritt College—We change lives!
Sincerely,
Norma Ambriz-Galaviz, Ed.D. President

4 | P a g e
TABLE OF CONTENTS
CHAPTER I ...................................................................................................................... 6
INTRODUCTION ........................................................................................................... 6
COLLEGE OVERVIEW ......................................................................................................... 6
A Historical Perspective............................................................................................... 7
MISSION, VISION, CORE VALUES AND INSTITUTIONAL LEARNING OUTCOMES ................... 7
Mission ......................................................................................................................... 7
Vision ............................................................................................................................ 8
Core Values .................................................................................................................. 8
Institutional Learning Outcomes .................................................................................. 9
PERALTA DISTRICT AND MERRITT COLLEGE STRATEGIC GOALS ...................................... 10
EDUCATIONAL MASTER PLANNING PROCESS ................................................................... 10
2015-2016 Educational Master Planning Activities and Timeline ............................ 11
CHAPTER II ................................................................................................................... 13
DATA PORTFOLIO ..................................................................................................... 13
EXTERNAL SCAN ............................................................................................................ 13
Demographic Trends of the Population ..................................................................... 13
Economic Data ........................................................................................................... 16
External Scan Analysis Summary ............................................................................... 17
INTERNAL SCAN ............................................................................................................. 17
Employee Data ........................................................................................................... 17
Student Demographics ............................................................................................... 19
Student Success and Achievement .............................................................................. 24
Internal Scan Analysis Summary................................................................................ 25
CHAPTER III ................................................................................................................. 26
ENROLLMENT FORECASTING ................................................................................ 26
DEMOGRAPHICS .............................................................................................................. 26
Alameda County Demographics and K-12 Enrollment/Graduation Projections ...... 27
LABOR MARKET TRENDS ............................................................................................... 30
Occupational Trends .................................................................................................. 31
CHAPTER IV.................................................................................................................. 33
2015-2020 STRATEGIC DIRECTIONS....................................................................... 33
STRATEGIC DIRECTIONS .................................................................................................. 33
Student Success .......................................................................................................... 34
Partnerships ............................................................................................................... 38
Non-Credit to Credit Pathways .................................................................................. 39
Engagement and College Culture .............................................................................. 41
Institutional Stability .................................................................................................. 42
CHAPTER V ................................................................................................................... 43
CONTINUOUS PLANNING AND EVALUATION .................................................... 43
EDUCATIONAL MASTER PLAN IMPLEMENTATION ............................................................ 44

5 | P a g e
EDUCATIONAL MASTER PLANNING 5-YEAR CALENDAR ................................................... 44
SUCCESS INDICATORS AND EVALUATION MEASURES ...................................................... 45
CHAPTER VI.................................................................................................................. 46
OPPORTUNITIES AND RECOMMENDATIONS ..................................................... 46
DISTRICT-WIDE CHALLENGES AND OPPORTUNITIES ......................................................... 46
MERRITT COLLEGE CHALLENGES AND OPPORTUNITIES .................................................... 49
APPENDICES ................................................................................................................. 50
APPENDIX A ................................................................................................................ 50
FOUNDATIONS SKILLS GOALS AND ACTIVITIES PLANNING MATRIX ................................. 50
CAREER TECHNICAL EDUCATION GOALS AND ACTIVITIES PLANNING MATRIX ............. 52
TRANSFER EDUCATION GOALS AND ACTIVITIES PLANNING MATRIX ............................. 55
APPENDIX B ................................................................................................................ 57
MERRITT COLLEGE DATA PORTFOLIO FOR THE EDUCATIONAL MASTER PLAN .............. 57
LABOR MARKET GAP ANALYSIS .................................................................................... 57

6 | P a g e
CHAPTER I. INTRODUCTION
This chapter provides an overview of Merritt College and its history and outlines the process
conducted beginning Fall 2015 to develop the Educational Master Plan.
College Overview
Merritt College, one of the four constituent colleges of the Peralta Community College District
(PCCD), is a public, comprehensive two-year college in Oakland, Alameda County, California.
Nestled in the hills above San Francisco Bay, Merritt offers students the opportunity to study in
one of the most dramatic natural settings in Northern California. With a panorama that includes
the Golden Gate Bridge and the Pacific Ocean, Merritt's striking vistas provide a breathtaking
backdrop for quality academic and career technical programs.
Minutes from the East Bay's busiest commercial centers, Merritt College provides career
technical programs in Administration of Justice, Business, Community Social Services,
Computer Information Systems, Cybersecurity, Early Child Development, Emergency Medical
Technician, Environmental Studies, Genomics, Landscape Horticulture, Medical Assisting,
Microscopy, Nutrition and Dietetics, Paralegal Studies, Radiologic Science, Associate’s Degree
Nursing, and Real Estate, in addition to offering strong general education and transfer majors in
the sciences and associate’s degree programs such as African-American Studies, Psychology and
Anthropology.
Merritt College operates an outreach site, Merritt@Fruitvale, located at 1900 Fruitvale Avenue
in Oakland, which serves a predominantly Latino community. The site forms a vital link with
other community groups, such as the Unity Council, to coordinate and plan services for
community members. Merritt@Fruitvale has traditionally had a special emphasis on English as a

7 | P a g e
Second Language course offerings, and, through grant funds and community collaboration
directed by the Unity Council, assisted in the development of the Medical Assisting and
Healthcare Interpreter programs. One of the goals for Merritt@Fruitvale is to ease the transition
of first-generation and non-traditional students to the main campus by encouraging students to
take classes first in their own community.
Merritt College's more than 7,000 students benefit from a diverse and beautiful learning
environment, as well as from excellent student support services and dedicated faculty and staff.
The College offers Associate’s degrees in 24 disciplines and certificates in 52 disciplines. Merritt
faculty, staff and administrators exemplify the College’s motto: We change lives!
A Historical Perspective
During the years in which the community college concept was evolving, many institutions set the
stage for the Peralta Community College District. Longtime East Bay residents will recall The
Part Time School, Central Trade (later renamed The Joseph C. Laney Trade and Technical
Institute) and The Merritt School of Business.
In July 1953, the Oakland Board of Education established Oakland Junior College, creating
Laney and Merritt as separate and distinct campuses of the new institution. Merritt College was
named for one of the pioneer developers of Oakland, Dr. Samuel Merritt.
Merritt added an outstanding liberal arts curriculum to the already established business
curriculum in 1954. The following year, the first students graduated with Associate in Arts
degrees. Residents of Alameda, Albany, Berkeley, Emeryville, Oakland, and Piedmont voted to
establish a separate junior college district in November 1963. The name chosen to encompass the
District’s six cities was “Peralta” in honor of Sgt. Luis Maria Peralta, who had been granted
44,800 acres of East Bay lands in 1820. On July 1, 1964, the Board of Education voted to offer
vocational, occupational, and liberal arts courses on each of the existing campuses.
Merritt College moved in 1971 from its former Grove Street location to the East Oakland Hills
near Skyline Boulevard.
Mission, Vision, Core Values and Institutional Learning Outcomes
The foundation of the Educational Master Plan incorporates Merritt’s mission, vision, core
values and institutional learning outcomes with Peralta’s strategic goals, as well as the California
Community Colleges’ educational priorities. These elements guide all institutional planning and
serve as the underpinnings for program development and implementation.
Mission
The mission of Merritt College is to enhance the quality of life in the communities we serve by
helping students to attain knowledge, master skills, and develop the appreciation, attitudes and
values needed to succeed and participate responsibly in a democratic society and a global
economy. (Adopted by the PCCD Board of Trustees Fall 2014)
8 | P a g e
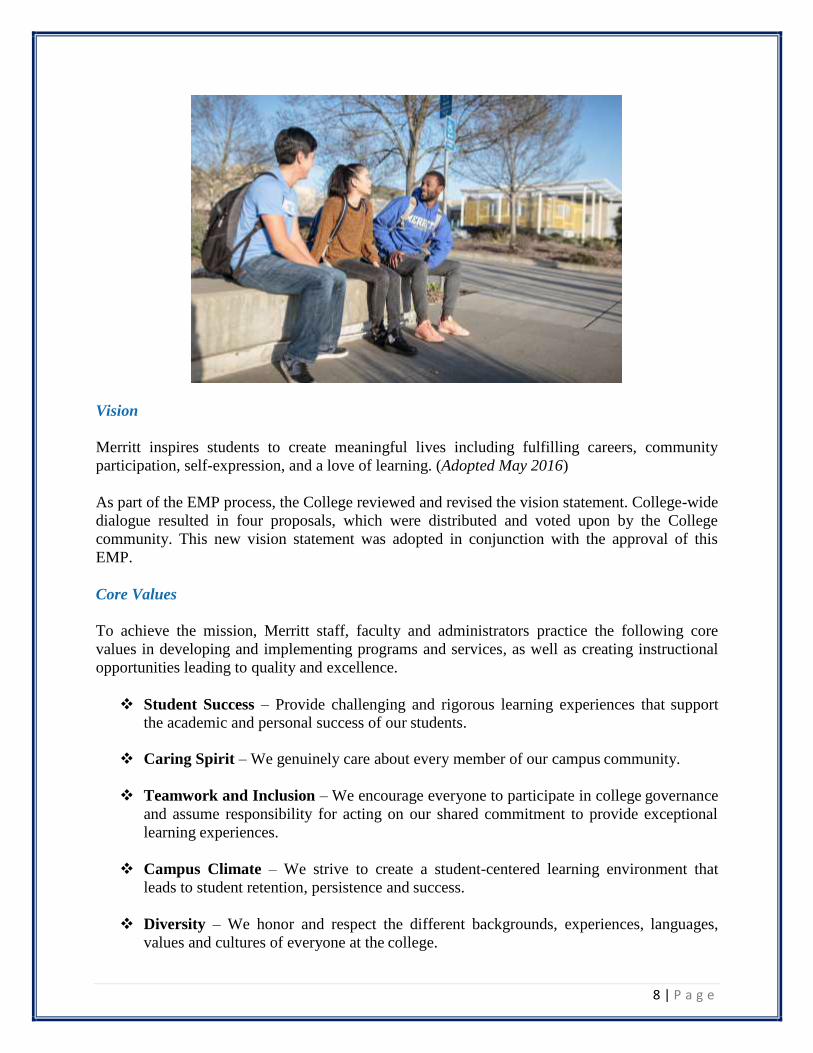
Vision
Merritt inspires students to create meaningful lives including fulfilling careers, community
participation, self-expression, and a love of learning. (Adopted May 2016)
As part of the EMP process, the College reviewed and revised the vision statement. College-wide
dialogue resulted in four proposals, which were distributed and voted upon by the College
community. This new vision statement was adopted in conjunction with the approval of this
EMP.
Core Values
To achieve the mission, Merritt staff, faculty and administrators practice the following core
values in developing and implementing programs and services, as well as creating instructional
opportunities leading to quality and excellence.
Student Success – Provide challenging and rigorous learning experiences that support
the academic and personal success of our students.
Caring Spirit – We genuinely care about every member of our campus community.
Teamwork and Inclusion – We encourage everyone to participate in college governance
and assume responsibility for acting on our shared commitment to provide exceptional
learning experiences.
Campus Climate – We strive to create a student-centered learning environment that
leads to student retention, persistence and success.
Diversity – We honor and respect the different backgrounds, experiences, languages,
values and cultures of everyone at the college.

9 | P a g e
In spring 2016, the College initiated a process to evaluate and reaffirm the core values. During
two Educational Master Plan town halls, faculty, staff and administration participated in
activities resulting in dialogue assessing whether Merritt is successful in actively embodying
each core value. As a result of these activities, while individuals affirm the importance of each
core value, the College recognizes the need to encourage ongoing engagement with them.
Institutional Learning Outcomes
In 2009, Merritt College identified five institutional learning outcomes (ILOs) to guide college-
wide learning assessment. All course, program, service area, and administrative unit outcomes
are mapped to these ILOs. Merritt students who complete courses and programs of study or who
receive support services should be able to demonstrate proficiency in each of the following five
areas:
Communication – Communicate with clarity and precision using oral, nonverbal, and/or
written language, expressing an awareness of audience, situation, and purpose.
Critical Thinking – Think critically using appropriate methods of reasoning to evaluate
ideas and identify and investigate problems and to develop creative and practical
solutions to issues that arise in workplaces, institutions, and local and global
communities.
Quantitative Reasoning – Apply college-level mathematical reasoning to analyze and
explain real world issues and to interpret and construct graphs, charts, and tables.
Cultural Awareness – Through a knowledge of history and cultural diversity, recognize
and value perspectives and contributions that persons of diverse backgrounds bring to
multicultural settings and respond constructively to issues that arise out of human
diversity on both the local and the global level.
Civic Engagement and Ethics – Internalize and exhibit ethical values and behaviors that
address self- respect and respect for others with integrity and honesty that will enable
success and participation in the larger society.
Information and Computer Literacy – Use appropriate technology to identify, locate,
evaluate and present information for personal, educational and workplace goals.

10 | P a g e
Peralta District and Merritt College Strategic Goals
As part of the PCCD integrated planning and budgeting process, five strategic goals have been
identified to guide the District. Merritt aligns its own strategic goals with those of the District
and evaluates them annually.
2015-2016 Goals
PCCD Strategic Goals Merritt College Goals
A. Advance Student Access, Equity,
and Success
Create an environment of exceptional student access, equity and success.
B. Engage and Leverage Partners Engage our community through respectful dialogue to create partnerships and opportunities for our students.
C. Build Programs of Distinction Create and implement effective innovative programs that meet the diverse needs of our community.
D. Strengthen Accountability,
Innovation and Collaboration
Through collegial governance, support institutional communication, innovation and interdisciplinary collaboration.
E. Develop and Manage Resources
to Advance Our Mission
Develop human, fiscal and technological resources to advance
and sustain our mission.
Educational Master Planning Process
The 2015-2020 Educational Master Plan represents the culmination of a several year process
beginning in 2012. The College engages in continuous integrated, strategic planning. The
following are examples of college-wide planning and evaluation activities:
Program reviews (fall 2015);
Accreditation self-evaluation report (spring 2015);
Annual program updates (2013, 2014);
External and internal scans research and data analysis;
Annual planning summits;
Flex day activities;
Participatory governance committee work;
Educational master plan town halls.

11 | P a g e
2015-2016 Educational Master Plan Activities and Timeline
In Fall 2015, Merritt College launched a formal educational master planning process. To ensure
college-wide dialogue and development of the Educational Master Plan, the College through the
College Educational Master Planning Committee (CEMPC) convened a taskforce, the EMP Core
Team, led by an administrator with faculty and staff representation. The Core Team provided
overall structure and direction for the planning process and developed the table of contents as
well as the timeline for the Educational Master Plan. The Core Team met weekly, held college-
wide town halls, established a website and distributed a newsletter to ensure the campus was
informed about the ongoing educational master planning activities. In Spring 2016 the College
held the first EMP college-wide meeting hosted by the Collaborative Brain Trust (CBT), a
consulting group contracted to support the Peralta Colleges in developing their 2015-2020
Educational Master Plans. CBT introduced their team and provided an overview of their
proposed process and timeline.
Based on the California Community College educational priorities, the EMP Core Team
identified a framework of three instructional focus areas including foundation skills, career
technical education (CTE) and transfer education. Each educational priority workgroup was
charged with reviewing institutional data including the CBT data portfolio, the SSSP Plan,
Student Equity Plan, labor market information and other Peralta data to develop overarching
goals to address the analysis and findings.
At the first campus-wide town hall on February 26, 2016, campus constituents were invited to
participate in reviewing and revising the College vision statement and to reaffirm the College
core values. Participants were invited to join one of the three workgroups associated with the
areas of focus. Workgroups were comprised of instructional and student services faculty and
staff, and each team included counseling and library representatives. On March 8, the campus
held an additional town hall and opportunity for the campus to reaffirm the core values and join a
workgroup. In addition to soliciting participation at the two aforementioned town halls, the lead
administrator sent out personal invitations to faculty and staff across the college inviting them to
participate in a workgroup best fitting their expertise. Beginning the second week of March,
workgroups met weekly to develop goals and activities, as well as timelines, as detailed in the
matrices located in Appendix A.
On April 1, 2016, CBT presented its comprehensive data portfolio to the campus, including an
internal and external scan and analysis, as well as planning assumptions. The workgroups
incorporated this information and continued to refine their goals. Upon review of the data
portfolio and the initial findings of the EMP workgroups, the College developed five overarching
strategic directions to guide the institutional planning process for the next five years.
The final college-wide town hall meeting on April 15, 2016 provided an overview of the process
thus far and served as an opportunity for the campus to evaluate and affirm the strategic
directions. Based on college-wide dialogue, the strategic directions were modified to incorporate
feedback as appropriate.

12 | P a g e
The workgroups concluded goal development by the end of April 2016, and the Core Team
synthesized and organized the data and information into an initial draft. Editing and final writing
continued during the first half of May. The final draft was presented to the campus community
via a virtual town hall during the week of May 16-20. During the same week, the campus
constituency groups and participatory governance committees vetted and endorsed the vision
statement and Educational Master Plan document, forwarding their recommendations for
approval to the College President and District Board of Trustees. The Educational Master Plan
was formally adopted by the Board of Trustees in June 14, 2016.
The chart below details the Educational Master Plan activities and dates during spring 2016.
EMP ACTIVITY DATES
EMP Launch with CBT Consultants January 13, 2016
EMP Core Team Formed and EMP Structure Established February 2016
EMP Town Hall: Vision, Core Values and Workgroups February 26, 2016
EMP Workgroup Weekly Meetings March 4, 11, 18,
April 1, 8, 15, 22
EMP Town Hall: Core Values March 8, 2016
EMP Newsletter I Distributed March 28, 2016
EMP Town Hall: Data Portfolio April 1, 2016
EMP Workgroup Outlines Due April 1, 2016
EMP Town Hall: Strategic Initiatives April 15, 2016
EMP Final Writing/Editing May 1-13, 2016
EMP Participatory Governance Vetting May 17-18, 2016
Board Approval June 14, 2016

13 | P a g e
CHAPTER II: DATA PORTFOLIO
This chapter provides an overview of external and internal scans conducted to inform the
educational master planning process. The College engages in ongoing assessment of community
changes and needs through formal research and through recommendations of CTE advisory
committees.
The Collaborative Brain Trust provided the data portfolio for this Educational Master Plan after
conducting research and analysis in February and March 2016.
External Scan
The external scan is an analysis of the
population of the College’s service area.
The data examines many metrics in an
attempt to better understand who lives in the
College’s service area so that Merritt can
best meet current and future community
needs. The service area has been defined as
a circular geographic area with a 4-mile
radius, with the College at its epicenter in
order to answer the questions, “Who lives in
the area around the college?” and, “In which
ways is that population changing?” For
comparison purposes, data is also provided
for PCCD, the County of Alameda and the
State of California.
Demographic Trends of the Population
This section of the plan examines the demographic trends of the college service area. Throughout
the section, the service area data includes comparison data for the population living in the entire
District, the County and the State.
Population Growth and Household Change
The population growth of the college service area is 1.1% per year. These rates are
approximately the same as those for the District and County populations and more robust than
those for the State of California. Household and per capita income levels for the service area are
lower than those of the District, County and State.
14 | P a g e
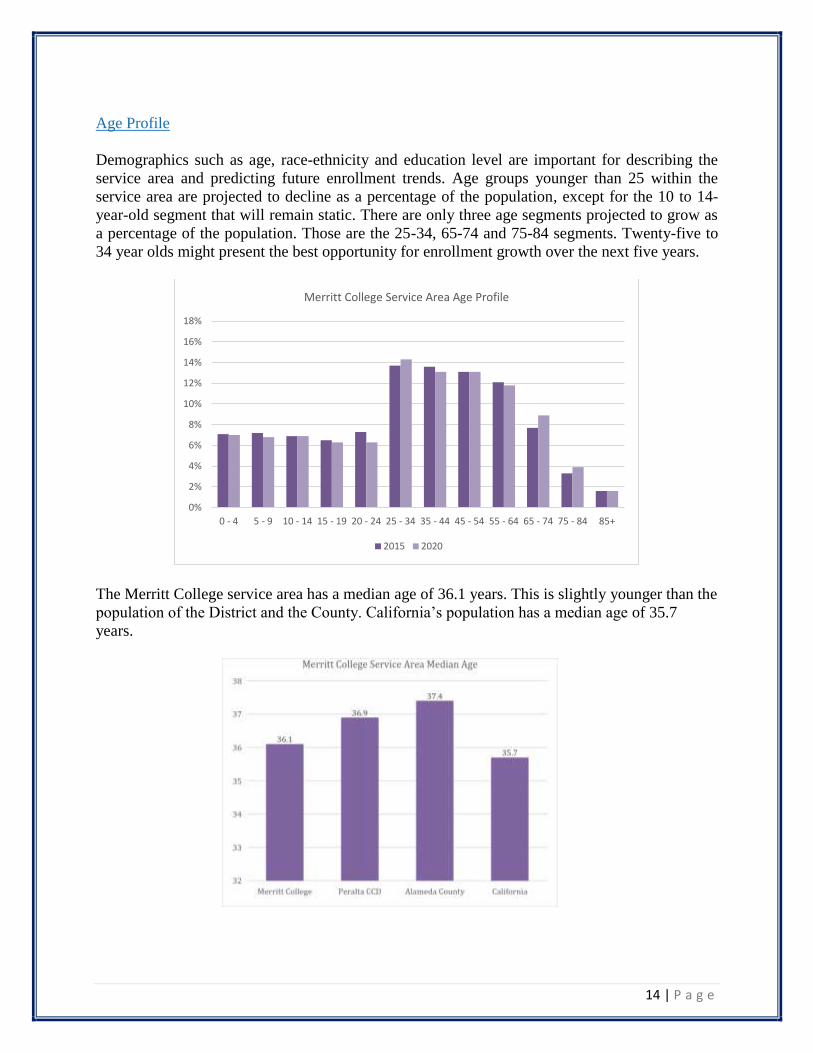
Age Profile
Demographics such as age, race-ethnicity and education level are important for describing the
service area and predicting future enrollment trends. Age groups younger than 25 within the
service area are projected to decline as a percentage of the population, except for the 10 to 14-
year-old segment that will remain static. There are only three age segments projected to grow as
a percentage of the population. Those are the 25-34, 65-74 and 75-84 segments. Twenty-five to
34 year olds might present the best opportunity for enrollment growth over the next five years.
The Merritt College service area has a median age of 36.1 years. This is slightly younger than the
population of the District and the County. California’s population has a median age of 35.7
years.
0%
2%
4%
6%
8%
10%
12%
14%
16%
18%
0 - 4 5 - 9 10 - 14 15 - 19 20 - 24 25 - 34 35 - 44 45 - 54 55 - 64 65 - 74 75 - 84 85+
Merritt College Service Area Age Profile
2015 2020
15 | P a g e
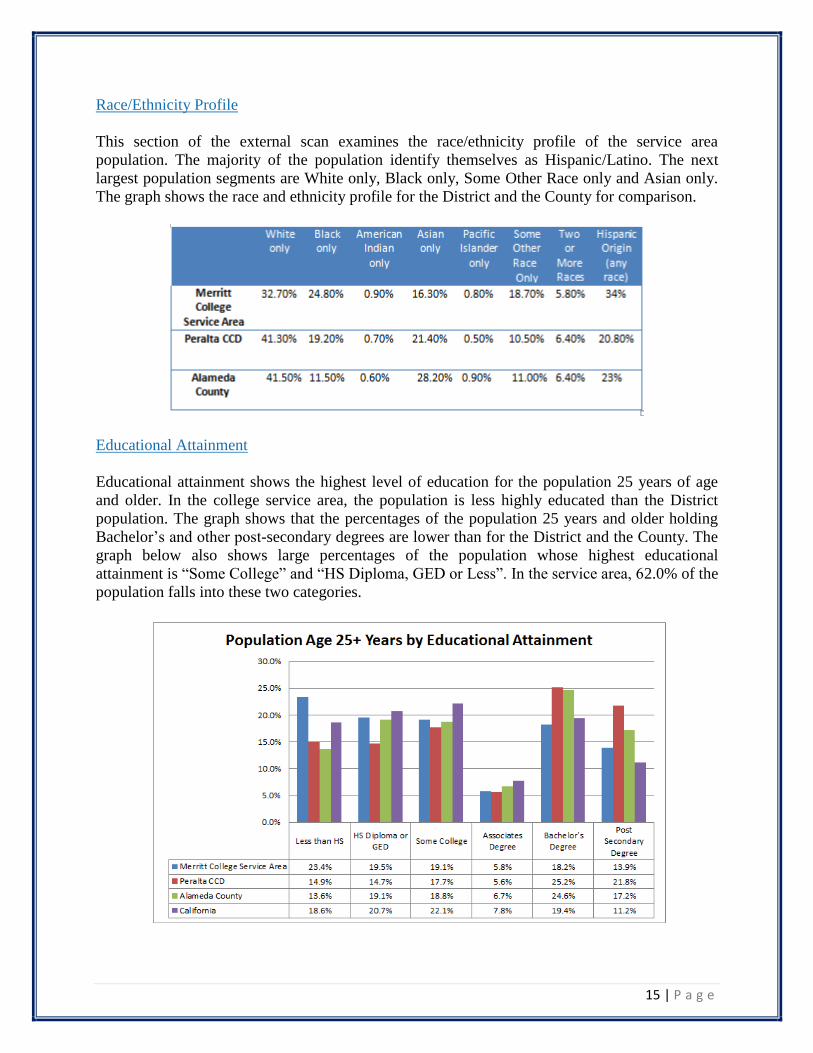
Race/Ethnicity Profile
This section of the external scan examines the race/ethnicity profile of the service area
population. The majority of the population identify themselves as Hispanic/Latino. The next
largest population segments are White only, Black only, Some Other Race only and Asian only.
The graph shows the race and ethnicity profile for the District and the County for comparison.
Educational Attainment
Educational attainment shows the highest level of education for the population 25 years of age
and older. In the college service area, the population is less highly educated than the District
population. The graph shows that the percentages of the population 25 years and older holding
Bachelor’s and other post-secondary degrees are lower than for the District and the County. The
graph below also shows large percentages of the population whose highest educational
attainment is “Some College” and “HS Diploma, GED or Less”. In the service area, 62.0% of the
population falls into these two categories.

16 | P a g e
Economic Data
Unemployment Rate
The unemployment rate in Alameda County has fallen steadily over the past six years. A
noticeable 5% change in unemployment from 2010 to 2014 significantly effects enrollment as
community college enrollments increase when unemployment is high and decrease when it is
low.
Employment by Industry
The following graph shows the percentages of the civilian workforce by industry for the Merritt
College service area. The top four industries employ 42.2% of the civilian workforce. These
industries are health care and social assistance, retail trade, educational services and professional,
scientific and technical services.
10.9% 10.1%
8.7%
7.3%
5.9%
0%
2%
4%
6%
8%
10%
12%
2010 2011 2012 2013 2014
Alameda County Civilian Unemployment Rate
0.0% 0.1% 0.3% 0.5%
2.0% 2.3% 2.4% 2.5%
3.5% 3.9%
4.9% 6.4% 6.4%
7.0% 7.8% 7.8%
8.4% 8.8%
10.3% 14.7%
0% 2% 4% 6% 8% 10% 12% 14% 16%
Mining, quarrying, and oil and gas extraction
Agriculture, forestry, fishing and hunting
Real estate and rental and leasing
Arts, entertainment, and recreation
Finance and insurance
Transportation and warehousing
Other services, except public administration
Construction
Professional, scientific, and technical services
Retail trade
Merritt College Service Area Civilian Employment by Industry

17 | P a g e
External Scan Analysis Summary
As indicated in the external scan, the service area is socially, economically and demographically
diverse. Changes in these factors impact the College and influence future planning, program
development and implementation to ensure that the needs of the community are met and all
students are prepared to thrive and succeed in attaining their academic and career goals. Since
economic conditions are favorable in allied health with declining unemployment rates and clear
growth in industries like healthcare and social assistance, there are opportunities for growth and
pathway development. Aligning and adjusting to these external trends will strengthen the
College and improve the opportunities for students to succeed.
Internal Scan
The internal scan is an analysis of the College including the students, faculty, staff and
administration. The data examines many metrics in order to describe the campus, the students
and programs. This section will review data on both employees and students.
Employee Data
Permanent Employee Counts by Category
Merritt College employed 145 permanent staff in fall 2015. Overall, the number of employees
has increased by four people, or 3% in recent years, mainly due to a doubling of administrators
from four to nine. It is important to note that all deans were laid off in 2011 due to State and
District budget fiscal crisis. The College has been restoring dean positions over the past three
years to ensure institutional stability and viability. The number of classified staff remained
constant at 65, while the number of permanent faculty decreased by one over the past five years.
Full-Time to Part-Time Faculty FTEF Ratio
The FTEF of permanent faculty decreased by 7% over the past five years while the FTEF of
part-time faculty increased by 43%. The table also displays the ratio between the FTEF of the
permanent faculty and that of the part-time faculty. The ratio has been declining for permanent
faculty due to their loss of FTEF growth and the high growth of part-time faculty FTEF.

18 | P a g e
Permanent Employees by Ethnicity
Over the past five years, there has been an increase in Latino faculty and a decrease in White
faculty. In addition, there has been an increase in Asian/Pacific Islander and Latino classified and
a decrease in Mixed/Other classified.
Permanent Employees by Age Group
The majority of administrators in recent years are between the ages of 50 and 59, while the
majority of faculty are between the ages of 50 and 65. The age distribution of classified staff is
fairly evenly distributed between the ages of 30 and 59.

19 | P a g e
Student Demographics
Fall Headcount Enrollment by Student Attributes
In the past five years, the College headcount enrollment has increased by 1% while the full-time
equivalent students (FTES) has increased by 2% over the past five years. PCCD as a whole has
experienced a decline of 3% in headcount and stable FTES numbers over the same period. A
greater percentage of students at Merritt are part-time, compared to the District. The ratio
between full- and part-time students has remained steady over the past five years.
There is no majority ethnicity at the College or in the District, with a large proportion of
Other/Unknowns and Multiple ethnicities. The Multiple category has grown in recent years to
11% because students may now indicate more than one ethnicity on their applications and are
doing so. The largest proportion of students is African-American at 29%. The second largest is
Latino, followed by White. The proportion of Latinos has increased by 25% over the past five
years while that of the African-Americans has decreased slightly. There are very few Filipinos at
3%, but somewhat more than in the District as a whole.
The female-to-male ratio is substantially higher than the District and has been steady over the
most recent five years. Forty-five percent of students are 24 years old or younger compared to
the District. Those over 30 to 54 comprise a significant group at 33%.

20 | P a g e
Fall Headcount Enrollment Trends by Residency Status
In-state residents account for 95% of headcount enrollment in fall 2015, while out-of-state
account for 4% and international students account for 1%. The number of out-of-state students
has almost tripled over the last five years from 102 to 273. International student enrollment has
declined slightly from 101 to 98 over five years.

21 | P a g e
New Students at Census by Top 25 Feeder Districts and High Schools
Most new students are coming from high schools in the Oakland Unified School District, but
many are coming from schools and districts throughout the East Bay. The data in the table
indicates new schools have begun to feed students to the College. Those from Oakland Unified
have increased by 18% over the past five years, while those from San Lorenzo Unified have
increased 63%. Skyline High School is the largest feeder school with 68 incoming students in
fall 2015, up 19% from five years ago. Area private high schools are also a substantial source of
new, first-time college students for Merritt.

22 | P a g e
Enrollment by Zip Code
Since 2009, between 50 and 55% of students enrolled at Merritt College reside in Oakland,
California. The chart in the figure below reflects the top ten resident zip codes for Merritt
College since 2011.

23 | P a g e
Associate’s Degrees by Top 20 Largest Majors
Social Sciences, Health Sciences, and Child Development majors are the largest majors. Nursing,
Liberal Arts, and Business are also degrees with the most majors.
Certificates by Top 20 Largest Majors
Child Development, Dietary Manager and Paralegal Studies majors are among the largest
majors.
24 | P a g e
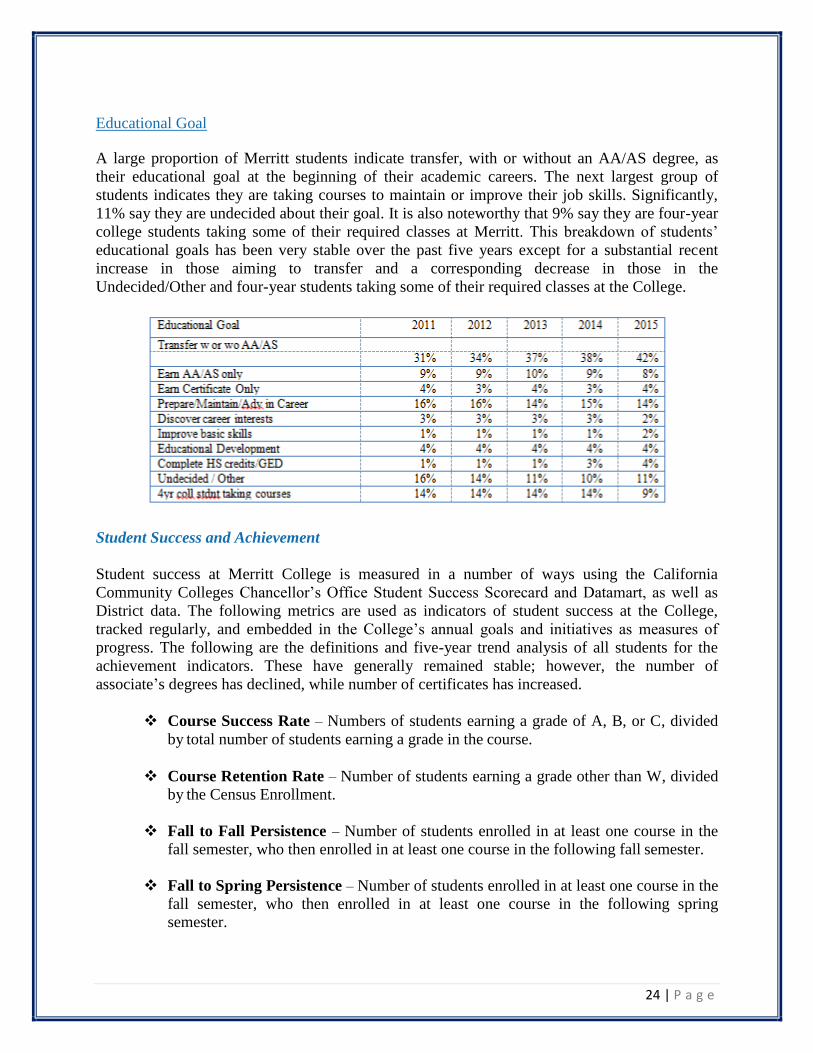
Educational Goal
A large proportion of Merritt students indicate transfer, with or without an AA/AS degree, as
their educational goal at the beginning of their academic careers. The next largest group of
students indicates they are taking courses to maintain or improve their job skills. Significantly,
11% say they are undecided about their goal. It is also noteworthy that 9% say they are four-year
college students taking some of their required classes at Merritt. This breakdown of students’
educational goals has been very stable over the past five years except for a substantial recent
increase in those aiming to transfer and a corresponding decrease in those in the
Undecided/Other and four-year students taking some of their required classes at the College.
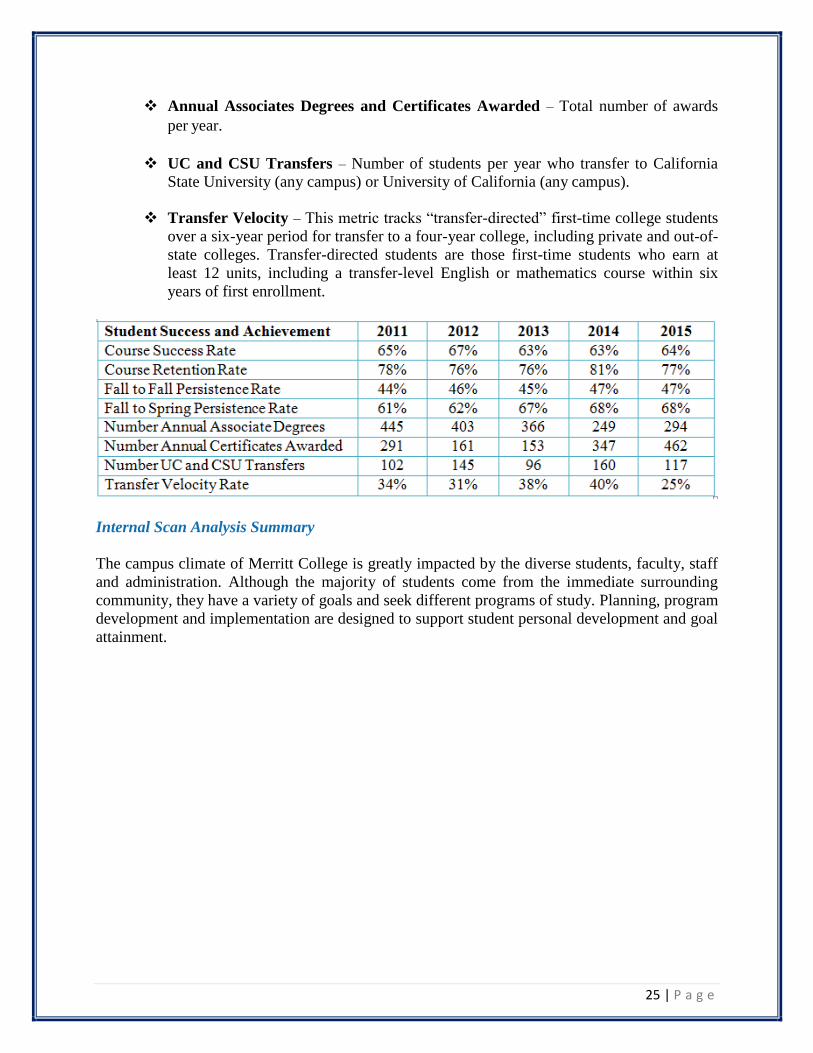
Student Success and Achievement
Student success at Merritt College is measured in a number of ways using the California
Community Colleges Chancellor’s Office Student Success Scorecard and Datamart, as well as
District data. The following metrics are used as indicators of student success at the College,
tracked regularly, and embedded in the College’s annual goals and initiatives as measures of
progress. The following are the definitions and five-year trend analysis of all students for the
achievement indicators. These have generally remained stable; however, the number of
associate’s degrees has declined, while number of certificates has increased.
Course Success Rate – Numbers of students earning a grade of A, B, or C, divided
by total number of students earning a grade in the course.
Course Retention Rate – Number of students earning a grade other than W, divided
by the Census Enrollment.
Fall to Fall Persistence – Number of students enrolled in at least one course in the
fall semester, who then enrolled in at least one course in the following fall semester.
Fall to Spring Persistence – Number of students enrolled in at least one course in the
fall semester, who then enrolled in at least one course in the following spring
semester.
25 | P a g e
Annual Associates Degrees and Certificates Awarded – Total number of awards
per year.
UC and CSU Transfers – Number of students per year who transfer to California
State University (any campus) or University of California (any campus).
Transfer Velocity – This metric tracks “transfer-directed” first-time college students
over a six-year period for transfer to a four-year college, including private and out-of-
state colleges. Transfer-directed students are those first-time students who earn at
least 12 units, including a transfer-level English or mathematics course within six
years of first enrollment.
Internal Scan Analysis Summary
The campus climate of Merritt College is greatly impacted by the diverse students, faculty, staff
and administration. Although the majority of students come from the immediate surrounding
community, they have a variety of goals and seek different programs of study. Planning, program
development and implementation are designed to support student personal development and goal
attainment.

26 | P a g e
CHAPTER III: ENROLLMENT FORECASTING
This chapter provides an overview of enrollment forecasting data and an analysis to provide a
context for future direction. Enrollment forecasting is a predictive process utilizing data from
community demographic projections as well as state, county, and feeder school district current
and future data trends as well as labor market trend analysis. These combined provide a picture
of potential demographic changes over the next five years and directly informs planning and
development to ensure the College is meeting community needs.
Demographics
A successful college is a reflection of the surrounding community. As introduced in chapter Two
and in the charts below, both the College and the community have experienced shifts and
changes in population, and are expected to experience more change in the upcoming years and
decade.
In addition to expected changes in the age of the population of the service area, there are
indicators of shifts in the racial-ethnic composition of the Bay Area and service area, as indicated
by census data, the Association of Bay Area Governments and Oakland Unified School District
(OUSD) data. Similar to the community demographics discussed in the external scan, OUSD,
Merritt’s feeder school district has experienced a significant population shift in the last 10 years.

27 | P a g e
Alameda County Demographic and K-12 Enrollment/Graduation Projections
Alameda County demographic projections between 2010 and 2040 forecast a decrease in White
and African-Americans and an increase in Asian and Latino populations in the County. Based on
the data, It is anticipated that African-Americans decrease by 3%, Whites decrease by
approximately 9% while Asians and Hispanic/Latinos are expected to increase by 5%.
The chart below represents projected Alameda County K-12 student enrollment and high school
graduation between 2015 and 2025. As projected, K-12 enrollment is anticipated to increase
from 2015 to 2022 and then decrease between 2022 and 2025. High School graduation rates in
Alameda County are expected to increase by less than 2,000 students over a ten year period.

28 | P a g e
In addition to overall population trends and projections, feeder high school data is useful in
predicting enrollment growth or decline as well as specific demographic projections. The
following charts depict OUSD enrollment patterns for K-5, middle school and high school from
2004-2015. This is useful in reviewing demographic changes that will affect the student base for
the College.
OUSD K-5 Enrollment Pattern 2004-2015
The chart below clearly indicates an increase in Latino students and a decrease in African-
American students between 2004 and 2015. The chart shows an increase of approximately 1,000
Latino students and a nearly 3,000 student reduction in African-Americans over a ten year
period.
OUSD Middle School Enrollment Pattern 2004-2015
OUSD middle school data indicates a gradually increasing Latino population of nearly 1,000
students in a ten year period. Whereas, the African-American middle school student population
decreased by nearly 2,000 students during the same period.

29 | P a g e
OUSD High School Enrollment Pattern 2004-2015
OUSD high school data below indicates an increase in enrollment by approximately 2,000 Latino
students in a ten year period and a decrease of nearly 2,000 African-American students in the
same period.
30 | P a g e
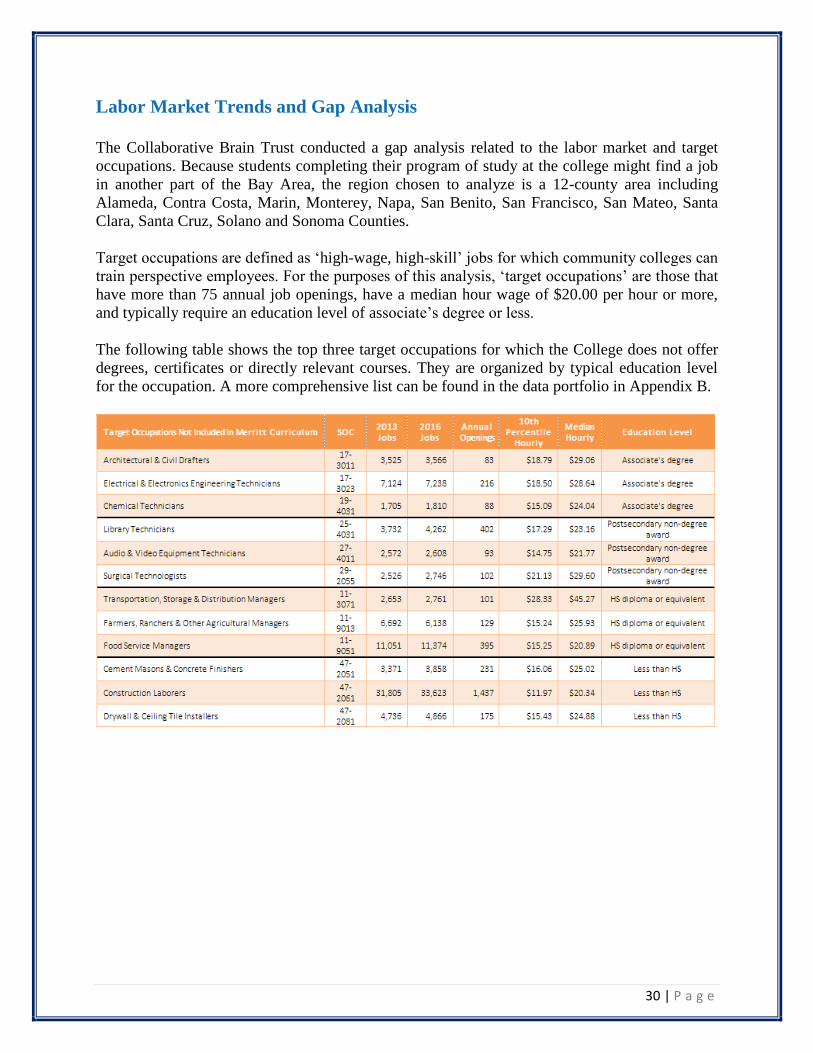
Labor Market Trends and Gap Analysis
The Collaborative Brain Trust conducted a gap analysis related to the labor market and target
occupations. Because students completing their program of study at the college might find a job
in another part of the Bay Area, the region chosen to analyze is a 12-county area including
Alameda, Contra Costa, Marin, Monterey, Napa, San Benito, San Francisco, San Mateo, Santa
Clara, Santa Cruz, Solano and Sonoma Counties.
Target occupations are defined as ‘high-wage, high-skill’ jobs for which community colleges can
train perspective employees. For the purposes of this analysis, ‘target occupations’ are those that
have more than 75 annual job openings, have a median hour wage of $20.00 per hour or more,
and typically require an education level of associate’s degree or less.
The following table shows the top three target occupations for which the College does not offer
degrees, certificates or directly relevant courses. They are organized by typical education level
for the occupation. A more comprehensive list can be found in the data portfolio in Appendix B.

31 | P a g e
Occupation Trends
The following data is for the Oakland-Hayward-Berkeley Metropolitan Division (Alameda and
Contra Costa Counties). The first table shows the occupations with the most job openings from
2012 to 2022.
32 | P a g e
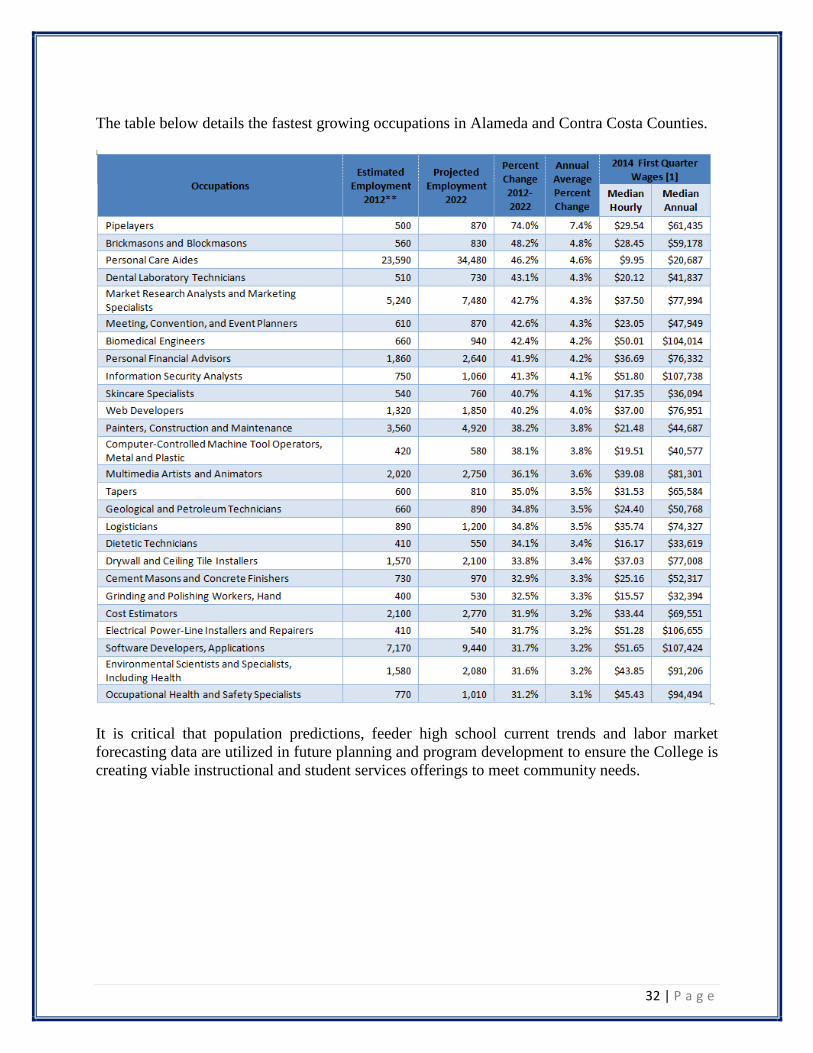
The table below details the fastest growing occupations in Alameda and Contra Costa Counties.
It is critical that population predictions, feeder high school current trends and labor market
forecasting data are utilized in future planning and program development to ensure the College is
creating viable instructional and student services offerings to meet community needs.
33 | P a g e
CHAPTER IV: 2015-2020 STRATEGIC DIRECTIONS
This chapter provides a detailed description of the Merritt College five strategic directions
designed to guide the College over the next five years and throughout the educational master
planning process. These directions were derived from data driven processes and from many
sources including the goals developed by the Foundations, Career Technical Education and
Transfer Educational Master Plan work groups as well as college-wide town halls and the
College data portfolio.
Strategic Directions
Student Success – The College will engage in integrated planning related to student
success, student equity, distance education, foundation skills, career technical education
and transfer curriculum.
Partnerships – The College will enhance, pursue and increase partnerships with
educational, nonprofit and community employers to enhance and create viable and timely
programs.
Non-Credit to Credit Pathways – The College will increase noncredit pathways leading
to credit programs for native and nonnative English speakers focused on developing self-
advocacy, civic engagement and self-sufficiency.
Engagement and College Culture – The College will implement strategies to increase
student, faculty and staff equity and engagement and will create a culture of inclusiveness
that demonstrates value of diversity across the campus.
Institutional Stability – The College will utilize data driven decision making based on
learning assessments in the Integrated Planning and Budget Model to advocate for
adequate human, technological, facility and fiscal resources to support successful
achievement of the Educational Master Plan strategic initiatives.

34 | P a g e
Student Success
The College will engage in integrated planning related to student success, student equity,
foundation skills, career technical education and transfer curriculum.
President Obama’s National College Completion Goal initiative launched in 2011 challenged
higher education institutions to double their completion rates in certificate, degree and transfer
completion as well as increase workforce placement. Over the next five years, Merritt College
will continue to focus on increasing student completion in all disciplines. Leveraging state
funding for the Student Success and Support Program and Student Equity initiatives focused on
narrowing the achievement gaps and disparities in student success the College will enhance the
development and implementation of programs designed to support student goal attainment; these
programs will be funded in part by SSSP and Student Equity State funds focused on narrowing
achievement gaps and reducing disparities in access and success.
Capitalizing on the RP Group 2013 research, Student Support (Re) Defined based on qualitative
data from community college students, the College will continue to emphasize the six factors
students indicated they need for success including; direction, focus, nurturance, engagement,
connection and a sense of being valued when planning, developing and implementing student
services and instruction programs to support increased success.
Based on the Merritt College 2014 Community College Survey of Student Engagement (CCSSE)
and Noel Levitz research, student services support, in addition to instructional support, is
instrumental to student success. To ensure academic excellence and institutional effectiveness,
the College will strive to consistently meet institution-set standards and targets for student
success outcomes, these include: course success, persistence, certificate and degree completion
and transfer. In addition to analysis of the institution set standards and as part of the Integrated

35 | P a g e
Planning and Budgeting (IPB) model, the College will analyze student learning assessment data
and other measures as part of the program review and annual unit plan updates. Furthermore, as
part of the state initiative to address standardization in distance education course offerings,
Merritt will advocate for the adoption of Instructure’s Canvas course management system to
enhance the quality of online instruction and support leading increased success for all students.
Data Driven Planning
As part of the Integrated Planning and Budgeting (IPB) model and during the 2015 educational
master planning process, workgroups analyzed disaggregated student success data in their area of
focus. Success data was derived from regularly assessed course success rates as well as degree,
certificate completion and transfer rates. By disaggregating these metrics, the College identified
areas for improvement and resources needed to ensure equitable student success, as seen in
course success rate below.
As illustrated in the chart below, Merritt College course success and retention rates remained
fairly stable between 2011 and 2015. While course success rates mirror the District rate of 65%,
course retention falls below the 80% rate in 2015. Filipino, Native American and White students
have slightly greater success rates than students of the same ethnicity across the District.
However basic skills students are not succeeding at the same rate as across the District and are
approximately 10 percentage points lower.

36 | P a g e
As indicated in the chart below, there has been a 34% decrease in associate’s degree completion
from 2010 to 2015. Conversely, there was a 59% increase in certificate achievement.
The data chart below details UC and CSU transfer data from 2010 to 2015. As indicated, there
has been a 3% increase in CSU transfer rates during this five year period however there was a
significant drop of approximately 30% from 2013-2014 to 2014-2015. While there was a 75%
increase in students transferring to a UC, there was a decrease between 2013-2014 and 2014-
2015.

37 | P a g e
Regularly assessing measures including basic skills progress rates and CTE completion rates will
allow the College to gauge progress towards achieving goals related to Strategic Direction One.
As seen below, the College has baseline data for basic skills progress rate and CTE completion
rate. Goals addressing these areas will use these measures to assess the outcomes of the
associated activities.

38 | P a g e
Partnerships
The College will enhance, pursue and increase partnerships with educational, nonprofit and
community employers to enhance and create viable and timely programs.
Partnerships are at the heart of connections between the student, College and the community.
Merritt College will nurture and grow partnerships to broaden and strengthen recruitment and
enrollment efforts, purposely improve programs, enhance the student experience with internships
and out of class experiences, and connect students to employment or a transfer institution
following their completion. The College will strengthen relationships with high schools, 4-year
institutions and community partners and employers. Partnerships at all levels of matriculation
will maximize the participation rate from local high schools, positively impact student success
and transfer rates, and connect students to large local employers and growing industries.
Data Driven Planning
Partnerships with transfer and feeder institutions are essential to student access, success and goal
attainment. In 2010, the California Community Colleges were directed to develop associate’s
degrees for transfer (ADT) through a partnership with the California State University (CSU).
Through this partnership, community colleges are able to offer students the opportunity to
achieve guaranteed admission into the CSU system if they complete an ADT. Merritt offers
several ADTs and continues to build additional associate’s degrees for transfer to increase
completion along with providing students guaranteed opportunities for furthering their education.
In addition to focusing on building the pipeline of continued education for Merritt students,
creating meaningful and effective partnerships with feeder institutions ensures younger students
broaden their educational and career goals and view higher education as a viable option. Merritt
College will continue to engage in and build upon initiatives focused on high school students.
These initiatives include AB288 (Dual Enrollment) designed to create and strengthen
partnerships between high schools and community colleges and to remove barriers to
traditionally underserved students as well as the Oakland Promise. The Oakland Promise
launches in fall 2016 and is a partnership between PCCD, OUSD and the City of Oakland. First
time freshman, recent OUSD high school graduates will receive tuition-free education their first
semester enrolled in Peralta classes.
As indicated in the highlighted sections of the chart below, OUSD’s high school student
population increased 18% over the last four years. There have been significant increases in
students enrolling at the College from Oakland Technical High School, Castlemont High School
and Fremont High Schools during the same period.

39 | P a g e
Non-Credit to Credit Pathways
The College will increase noncredit pathways leading to credit programs for native and
nonnative English speakers. The programs will be focused on developing self-advocacy, civic
engagement and self-sufficiency.
Merritt College will address the challenges in supporting its diverse students with varying
academic and non-academic needs. Diversity of the community, and therefore the campus,
directly impacts the student experience while at Merritt College. By developing appropriate
pathways, students will be more directed and focused and better able to thrive academically,
socially and professionally. The College will create non-credit pathways to support students in
English skills along with career technical skill development leading to further educational
opportunities and employment.
Merritt College participates in the Adult Education Pathway Consortium supported by the
California State Community College Chancellor’s Office allocating funding for adult education
and pathway development. In partnership with the Oakland Adult School and community based
organizations, the College will continue to develop noncredit pathways focused on English skill
development for native and nonnative speakers coupled with career technical education to
promote educational and career goal attainment.

40 | P a g e
Data Driven Planning
Data reflecting languages spoken at home informs program planning, development and
implementation in both student services and instruction. As the community demographics
change, the College must adjust and enhance programs and services to support access equity and
success. The following table shows the English proficiency for the population five years and
older who live in a household that speaks another language at home. In the Merritt service area,
15.1% of the population does not speak English well. The largest concentration of these
individuals is between 18 and 64 years of age and lives in households where Spanish or Asian
and Pacific Island languages are spoken.

41 | P a g e
Engagement and College Culture
The College will implement strategies to increase student, faculty and staff equity and
engagement and will create a culture of inclusiveness that demonstrates value of diversity across
the campus.
The College will direct goals and activities to promote inclusion and engagement for all of its
diverse students, faculty, staff and administration. Collaboration is not just a success factor for
students, but for the entire campus and by living and working through our core values, the
College can engage the entire campus and improve the climate on behalf of improving student
learning and success. In an internal scan of the campus, faculty, staff and administration named
their students and colleagues as a strength of the College. However, in the 2014 Noel Levitz
student survey, students indicated the need for feeling cared for as individuals as well as in
reaching their educational goals. Capitalizing on this sentiment will permeate all areas of the
College to bring the campus together. These results affirm the RP Group research of 2013 stating
that students need an engaging and nurturing environment to be successful.
Data Driven Planning
As part of the educational master planning process, the College held two town hall sessions
focused on reaffirmation of its core values. While personal affirmation was strong for all core
values, data results indicated the need to focus on creating an environment of caring and
inclusiveness while promoting collaboration and community for all employees and students.
Merritt College demographic data indicates that faculty, staff, and administration represent many
ethnicities and together create a diverse community of educators. As indicated in the table below,
the College reflects the student population in many cases however in two categories there are
disparities including Filipinos and Latinos where the student populations are greater than college
personnel.
Source: PCCD

42 | P a g e
Institutional Stability
The College will utilize the integrated planning and budget model to advocate for adequate
human, technological, facility and fiscal resources to support successful achievement of the
Educational Master Plan strategic initiatives.
Merritt College is impacted by the reality of a rapidly changing community. The viability of the
institution depends not only on the enrollment and retention of our students, but also on
responding to the shifts in the age of our students and the changes in the composition of
households within the service area. This means that the College must be proactive and flexible as
it revises processes, alters staffing and adjusts resource allocations in preparation for a changing
student population. Administrators and faculty need to carefully schedule course and program
offerings to respond to both increased and decreased demand in various instructional programs.
Learning assessments across the College will provide data for program adjustments and will
inform program reviews and resource allocations. In addition, part of the internal scan of the
College indicated facilities, safety and food services as needing improvement.
In addition to enacting a responsive stance to develop and implement programs to meet
community needs, Merritt College participation in larger state and local initiatives such as the
Adult School Education Pathway Consortium, the California Community Colleges’ Online
Education Initiative, dual enrollment with OUSD and the Oakland Promise will support
increased student access, enrollment enhancement, opportunities and institutional stability.

43 | P a g e
CHAPTER V: CONTINUOUS PLANNING AND EVALUATION
Chapter five provides a description of the College Integrated Planning and Budgeting (IPB)
Model as well as the continuous planning and evaluation process and the Five year calendar for
the 2015 Educational Master Plan.
The 2015-2020 Educational Master Plan strategic directions and recommendations will serve as
the foundation for an updated Facilities Master Plan in fall 2016. The EMP is the driving force
behind all planning associated with the annual Integrated Planning and Budgeting Model (IPB),
as seen in the figure below. Annual plans including SSSP, Student Equity, Basic Skills, and
annual program updates or program reviews are required to align with the Educational Master
Plan, Merritt College goals, and the PCCD goals. Budget development and resource allocations
are determined by department and discipline assessment outcome results and plans. The IBP
model is assessed annually in the spring by the College for overall effectiveness.

44 | P a g e
Educational Master Plan Implementation
The College Educational Master Planning Committee (CEMPC) will lead the 2015 Educational
Master Plan implementation and assessment as well as future educational master planning
activities. CEMPC is a shared governance committee of the College Council. CEMPC
recommends annual institutional priorities to strengthen program practices to maintain quality
instruction and services and improve student achievement and learning.
As part of a five year process, CEMPC will continue educational master planning work and will
lead further planning, implementation and evaluation annually. As part of its bylaws, CEMPC
reviews and updates the mission statement every five years, with college-wide participation.
CEMPC conducts annual reviews of District strategic directions, goals and institutional
objectives. Additionally, CEMPC leads the College community in the process of creating annual
institutional priorities based on the College Educational Master Plan and the District strategic
educational goals. Finally, CEMPC provides leadership for the annual review and update of the
College Educational Master Plan.
Educational Master Planning 5-Year Calendar
CEMPC will implement the five year Educational Master Planning Calendar as described below
to finalize planning, implementation and assessment of the 2015 EMP and the five strategic
directions detailed in Chapter four. The Educational Master Plan and the strategic directions will
serve to guide the College in planning and finalization of the goals and activities documented in
Appendix A. The upcoming academic year, 2016-2017 is designated as a planning year for goals
and activities. As feasible, goals will be implemented earlier. Once a goal and associated
activities are implemented the following year will be used to assess the effectiveness and
efficacy. Each strategic direction will be assessed through this process. Finally, after assessment
and evaluation has occurred, goal realignment will commence. Goal realignment includes
revising goals and activities as needed to align with the strategic directions.
This process will provide a strong foundation for the next Educational Master Plan that will
commence in the 2019-2020 academic year. The next Educational Master Plan will guide the
College from 2020-2025.
Strategic Direction
Development
Spring 2016
Goal Development Finalized
Fall 2016
Goal Implementation
Planning
2016-2017
Goal
Implementation 2017-2018
Strategic Direction & Goal Assessment
2018-2019
Goal Realignment 2019-2020

45 | P a g e
Success Indicators and Evaluation Measures
Merritt College measures and evaluates college-wide achievement using institution-set standards
and holds college-wide dialogue at fall and spring summits. This process is folded into the IPB
Model, setting the standards, goals and targets in the spring, and evaluating the measures in the
fall. While the College has identified institution set standards for instructional areas including
course completion, student retention, certificate and associate’s degree completion as well as
transfer to a four year university, additional student services set standards will be identified
during the 2016-2017 academic year.
In addition to these macro-level indicators of institutional achievement and effectiveness, plans
for assessment of specific success indicators for the strategic directions identified in Chapter
Two will be finalized in fall 2016. As the College finalizes goal setting, data points will be
established as well as appropriate mechanisms for evaluation. In some areas, we have identified
the need for additional surveys, and tracking of meetings, events and attendance. Other goals will
be measured by the scheduled assessment of student learning outcomes, service area outcomes,
program learning outcomes or institutional learning outcomes.

46 | P a g e
CHAPTER VI: Opportunities and Recommendations
The Collaborative Brain Trust developed the Opportunities and Recommendations chapter after
data collection for the external and internal scans and data analysis. These opportunities,
challenges and recommendations are for the College to consider as it continues planning over the
next five years.
The EMP, similar to that of the other three Peralta Community College District (PCCD)
Colleges, has involved many hours of work by College staff and a consultant team providing
external, objective support for data collection and analysis. In addition to the internal and
external scanning processes and focused discussions that took place, many staff and students
responded to a district-wide survey, further contributing to the development of this EMP.
Participants in the EMP process explored a broad range of topics, but not all issues identified
could be represented in this EMP, or perhaps they did not rise to the level of being included in a
few selected, High-priority, college-wide goals and planning priorities for the next five years.
Many of these ideas will resurface and be included as action items as division and departmental
planning takes place during implementation of the EMP. In addition to the EMP provided in this
document, planning leadership wanted to ensure a venue, via this chapter, to document critical
challenges and opportunities that arose during the process that warrant further exploration and
action planning.
Some of these are at the college level, and some span the Peralta District as a whole. Each of
these areas are delineated and described below. The theme, “challenges and opportunities,"
represents two issues that blend together. Each challenge provides an opportunity for quality
improvement, and each opportunity demonstrates a challenge. Thus, the items delineated and
described below aren’t distinguished as one or the other.
District-Wide Challenges and Opportunities
The need for District-wide Educational Master Planning upon completion of the four College
EMPs became apparent during the process. A systematic, coordinated review of the findings of
the four Peralta District College EMPs, in the context of the district-wide environmental
scanning that was conducted, is an important next step to further enhance integrated planning
and budgeting to serve the region as a whole. This was particularly evidenced in the response
from students, more than half of whom take courses at two or more of the colleges in the District.
A coordinated, district-wide planning effort avoids duplication and gaps in service delivery, and
utilizes limited district resources in an effective, efficient manner. Such a systematic review
would lead to comprehensive, intentional planning of programs, services, facilities, and
technology that would support student and community needs across the District. The following
topics represent several interwoven essential elements of college viability and health that need to
be developed via collaborative district-wide planning:
47 | P a g e
Enrollment forecasting – There is a critical need for each college to forecast enrollment,
but this has to be developed from a district-wide perspective, given that FTES is allocated
to community college districts, from the state, and then distributed to each college via a
district venue. The data portfolio work for this EMP established some basic ingredients
for projecting enrollment, such as the following:
o Population growth for the service area
o Participation rates by zip code
o Age ranges of projected service are population
o High school graduation projections
o High school graduate enrollment trends
o Data on Merritt College students concurrently enrolled in multiple PCCD colleges
o Using this information for each college along with program and services planning,
data-informed decisions can be collaboratively developed about projected
enrollments.
Collaborative academic and CTE program planning - The EMP data portfolio
identified labor market needs, including jobs and occupations that will have greater
numbers of openings in the future. This was used in a “gap analysis” to identify growing
occupational fields for which the College does or does not offer a certificate or degree.
While the PCCD colleges have developed and used such information, a concerted,
comprehensive and renewed District-wide look at programs planned for the future and
past performance of existing programs is timely to assist in preparation for facilities
master planning and ensure that the wider community’s labor and economy needs are
being addressed by the College for the very dynamic projected future.
District-wide scheduling of courses, programs, and their respective delivery modes -
Because data analysis revealed that a large percentage of PCCD students attend
concurrently two or more colleges in the Peralta District -- and perhaps other colleges in
the area as well -- collaborative scheduling of courses and programs is important to
ensure that students can access, progress, and achieve educational goals with ease in a
smooth and timely manner. Results of the student survey conducted for the EMP showed
that students attend multiple colleges for a variety of reasons. There are practices in
place to provide “home” college services to students. Enhancing a broader discussion
may prove helpful to college efficiency, and student access and progress along
educational pathways.
Fiscal and facilities planning – Enrollment management and program planning have to
be evaluated and addressed within the context of stable financial planning—another
48 | P a g e
district-wide topic and also an accreditation concern. While the College continues to
refine its IPB Model, and participate in the district Budget Allocation Model (BAM),
long-term goals and frameworks relative to FTES distribution and planned growth will be
required for realistic college program and enrollment planning, as well as facilities master
planning.
Technology planning – Technology planning on a district-wide basis will be an
important second step to support the program and delivery modes determined in
educational master planning on a district-wide level as described above. This will be an
integral component of the facilities planning as well.
Coordinated and systematic research support – Similarly, research must be
undertaken both on a local College level as well as District-wide to serve the Peralta
District region as a whole. Coordinated and systematic research support is critical in
order to adequately plan for a state-of- the-art college in a dynamic and diverse 21st
Century environment, and one of the most advanced communities in the world.
Throughout PCCD, institutional research struggles to keep up with the needs and
requirements of a sophisticated, changing, and results-oriented organization. Further,
coordination between and among the Peralta colleges and the district office is uneven
despite good intentions. At least one or more colleges have no Research
Director/Analyst. It is critical that resources and efforts for research support—for long-
term institutional planning as well as for assessing and promoting student learning
success—be enhanced and assured.
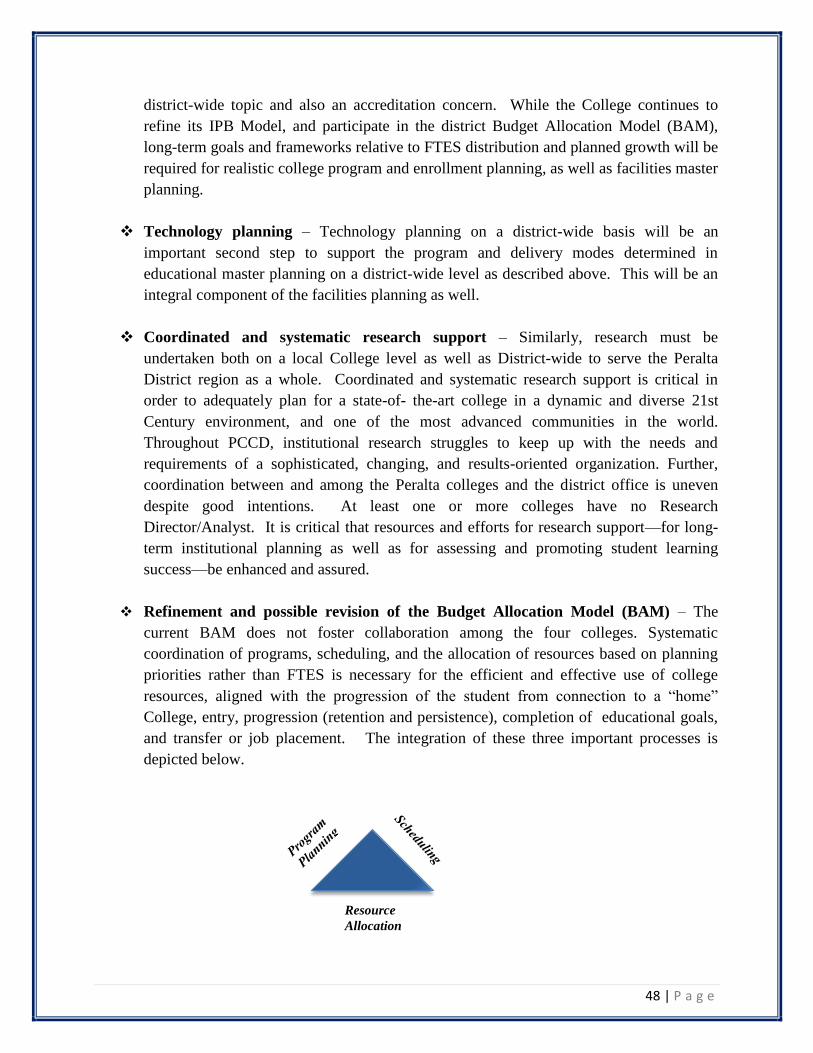
Refinement and possible revision of the Budget Allocation Model (BAM) – The
current BAM does not foster collaboration among the four colleges. Systematic
coordination of programs, scheduling, and the allocation of resources based on planning
priorities rather than FTES is necessary for the efficient and effective use of college
resources, aligned with the progression of the student from connection to a “home”
College, entry, progression (retention and persistence), completion of educational goals,
and transfer or job placement. The integration of these three important processes is
depicted below.
Resource
Allocation

49 | P a g e
Merritt College Challenges and Opportunities
In addition to those outlined in the EMP, several areas that represent both a challenge and an
opportunity at the college level and will need to be further addressed were found during the
development of this EMP and are described below.
Integrated planning – Merritt College has made great advances in this 2015 educational
master planning process of integrating existing, multiple planning efforts. Consistently
heard among constituents was the need for planning efforts to be synthesized into a
comprehensive approach. Because planning is often accompanied by a reporting
requirement to a specific funding source, separate planning committees are often
established to develop a Plan of Work specific to that funding stream. In the Merritt
2016-2021Educational Master Plan, eight distinct college planning efforts have been
integrated into a holistic approach to the EMP. An icon is used to identify each area in
the plan, so that individual tracking can be accomplished in compliance with such
disparate funding sources. Mechanisms for the ongoing integration of new initiatives
will need to be developed.
Succession planning and continuity with staff changes – Administrative, faculty, and
staff turnover has been high and is projected to persist over the next ten years. Nearly
two-thirds of Merritt College’s professional staff is at retirement age. Complementary to
the EMP is the need for continuity, communication, and systematic planning with
anticipated staff turnover.
Campus enhancement – As a component of facilities planning, campus enhancement in
all areas to create safe, attractive, clean facilities with accessible technology, designed for
today’s student must be considered to support teaching, learning, and campus life.

50 | P a g e
Appendix A
Strategic Directions ~ Foundations Skills Goal and Activities Planning Matrix
Educational Master Plan work groups created goals and activities to support the implementation of the five strategic directions. Each Appendix A matrix includes
goals and activities aligned with the Strategic Directions and focused on one of the California Community College educational priorities including Foundation
Skills, Career Technical Education and Transfer Education
Student Success (SD1)
Partnerships (SD2)
Non-credit to Credit Pathways (SD3)
Engagement and College Culture (SD4)
Institutional Stability (SD5)
GOALS (Mapped SD) ACTIVITIES TIMELINE ASSESSMENT RESPONSIBLE PARTY
1. Assess students’ strengths
and needs thoroughly to
accelerate completion of
certificates, degrees and
transfer readiness. (SD 1)
1.1 Improve assessment process
to place more students
directly into gateway courses
1.2 Extend on-site assessment to
high schools
1.3 Require undeclared majors to
enroll in COUN 57 or a
career workshop to earn the
right for priority enrollment
1.4 Use writing sample for
English placement
1.5 Strengthen orientation to
include use of technology in
college and developing a
college identity
1.1 16-17 Begin the process of
implementing the new
multiple measures and the
new state mandated changes
1.2 SP 17 & ongoing
1.3 F17
1.4 F17 pilot; F18 extend; F19
assess/adjust
F20 institutionalize or
discontinue
1.5 16-17 plan orientation
improvements
17-18 implement
18-19 assess/adjust
19-20 extend
1.1 A new assessment process is
in place informed by data on
student success and
completion (SP 18)
1.2 Ongoing on-site assessment
in at least two highs schools
1.3 Decrease in number of
undeclared majors
1.1 Student Services faculty and
staff; Math and English
faculty
1.2 Assessment and outreach
faculty and staff
1.3 Counseling faculty
1.4 English and Counseling
faculty
1.5 Counseling and teaching
faculty; deans; ASMC
members
2. Support and develop
programs, curriculum and
services that increase
completion of courses,
certificates, degrees and
transfer. (SD 1, 3, 4)
2.1 Create comprehensive CTE
pathways for DSP students
2.2 Strengthen Early Alert
interventions Midterm
counselling update session –
students meet with basic
skills counselor to re-assess
progress and current status.
Interventions can be
suggested to address certain
issues
2.3 Establish a student
ambassador/.peer mentor
2.1 16-17 Plan
17-18 Implement
2.2 18-19 assess and adjust
2.3 19-20 extend
2.4 2.2 2018
2.1 Pathways identified and
implemented (# TBD);
Increased Student completion
rates (baseline 15-16 )
2.1DSP faculty; DSP counselors
and CTE faculty and support staff
2.2 Grant leaders; support staff;
faculty and students

51 | P a g e
program to contact struggling
students
2.4 Increase campus engagement
around student athletics and
other events; STEM problem
of the week/ basic skills
2.5 Develop tutoring-across-the-
curriculum training program
2.6 Strengthen the curriculum:
contextualized courses in
Math &English; learning
communities; first-year
experience pathway
2.7 Increase professional
development both on campus
and off campus: develop
faculty inquiry groups;
promote faculty training in
culturally responsive
teaching; developing
curriculum
2.8 Strengthen SLO/PLO
assessment to support quality
teaching and learning
3. Establish an organizational
structure that promotes
coordination, innovation, and
accountability, and which
embeds basic skills
development across the
campus. (SD 1, 5)
3.1 Incorporate explicit language
regarding mission, goals, and
objectives of basic skills
education into mission
statement, educational master
plan, and college catalog
3.2 Review institutional
structures as they pertain to
basic skills and make
recommendations
3.3 Develop formal mechanisms
to facilitate communication
and coordination between
faculty and staff across
disciplines, learning
communities and student
services to respond to
students‘ holistic needs
3.4 Coordinate /integrate the
multiple efforts occurring:
grant funded, categorical,
general fund
May 2019
May 2018
May 2019
SP 18 and ongoing
Printed documents reflecting
language
Recommendations to College
Council
Recommendations to Classified
and Faculty Senates Process in
place
An integrated map of activities,
goals and outcomes
Dean of Instruction Basic Skills
Work Group
Basic Skills Work Group
Basic Skills Work Group /
VP Instruction

52 | P a g e
Appendix A
Strategic Directions ~ Career Technical Education Goal and Activities Planning Matrix
Educational Master Plan work groups created goals and activities to support the implementation of the five strategic directions. Each Appendix A matrix includes
goals and activities aligned with the Strategic Directions and focused on one of the California Community College educational priorities including Foundation
Skills, Career Technical Education and Transfer Education
Student Success (SD1)
Partnerships (SD2)
Non-credit to Credit Pathways (SD3)
Engagement and College Culture (SD4)
Institutional Stability (SD5)
GOALS (Mapped SD) ACTIVITIES TIMELINE ASSESSMENT RESPONSIBLE PARTY
1. Increased Student
Engagement: Develop
opportunities for CTE
students to engage in campus
and community experiences
that enhance learning and
student success (program-
level clubs/enterprises,
activities that develop soft
skills, etc.) by
contextualizing and
proactively engaging
students. (SD 1, 3)
a. Create avenues to engage
CTE programs in the
conversation and
development around basic
skills contextualization in
light of new funding for this
design.
b. CHDEV will place students
employed either after or
during their tenure at Merritt
with Mentor Teachers for 6-
12 months.
Fall 2016
Fall 2016
Plan in development.
Quantitative and qualitative
assessment of student experiences
via surveys
Quantitative and qualitative
assessment of student experiences
via surveys
CTE Committee, CTE Dean, and
all CTE programs and the basic
skills Initiative group.
Merritt College Mentor Teacher
Program Coordinator
2. Coordinated Employer
Partnerships: Create a
Merritt-wide infrastructure
that streamlines and develops
employer partnerships,
including offering High
quality internships, serving
on advisory boards, and
engaging in curriculum
development. (SD 2, 3, 4)
a. Develop a career center
where we all can come
together to prepare students
for successful internship
opportunities and career
placement employment.
b. Child Development
Department will begin a
portfolio development project
for next academic year for
CHDEV majors; students
will finish program with a
tangible product to facilitate
securing employment.
2016-2017 school year
2016-2017
Quantitative and qualitative
measure of the following
activities:
Frequency of advisory board
convenings
Incorporation and
implementation of employer
feedback into curriculum and
program
Evidence based data on the
effectiveness of the portfolios will
be collected. Surveys of students
with portfolios, follow-up with
students who have developed
portfolios.
Merritt CTE Project Manager
Child Development Resource
Center and CHDEV Department
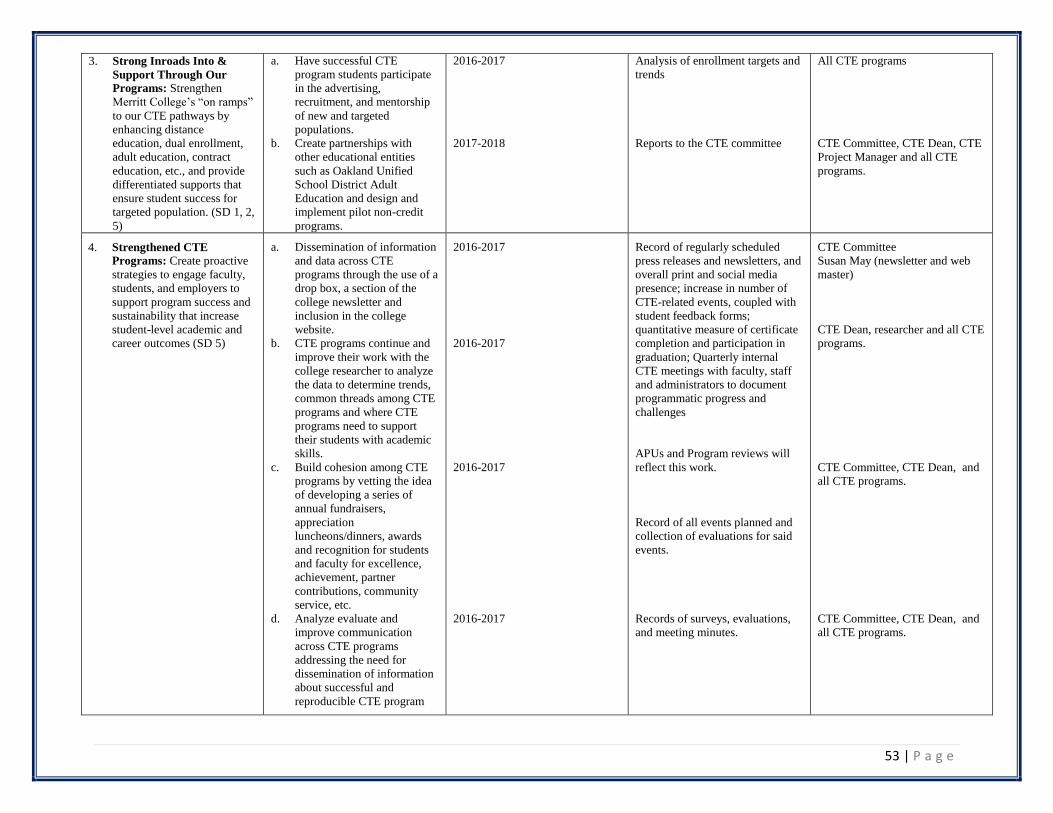
53 | P a g e
3. Strong Inroads Into &
Support Through Our
Programs: Strengthen
Merritt College’s “on ramps”
to our CTE pathways by
enhancing distance
education, dual enrollment,
adult education, contract
education, etc., and provide
differentiated supports that
ensure student success for
targeted population. (SD 1, 2,
5)
a. Have successful CTE
program students participate
in the advertising,
recruitment, and mentorship
of new and targeted
populations.
b. Create partnerships with
other educational entities
such as Oakland Unified
School District Adult
Education and design and
implement pilot non-credit
programs.
2016-2017
2017-2018
Analysis of enrollment targets and
trends
Reports to the CTE committee
All CTE programs
CTE Committee, CTE Dean, CTE
Project Manager and all CTE
programs.
4. Strengthened CTE
Programs: Create proactive
strategies to engage faculty,
students, and employers to
support program success and
sustainability that increase
student-level academic and
career outcomes (SD 5)
a. Dissemination of information
and data across CTE
programs through the use of a
drop box, a section of the
college newsletter and
inclusion in the college
website.
b. CTE programs continue and
improve their work with the
college researcher to analyze
the data to determine trends,
common threads among CTE
programs and where CTE
programs need to support
their students with academic
skills.
c. Build cohesion among CTE
programs by vetting the idea
of developing a series of
annual fundraisers,
appreciation
luncheons/dinners, awards
and recognition for students
and faculty for excellence,
achievement, partner
contributions, community
service, etc.
d. Analyze evaluate and
improve communication
across CTE programs
addressing the need for
dissemination of information
about successful and
reproducible CTE program
2016-2017
2016-2017
2016-2017
2016-2017
Record of regularly scheduled
press releases and newsletters, and
overall print and social media
presence; increase in number of
CTE-related events, coupled with
student feedback forms;
quantitative measure of certificate
completion and participation in
graduation; Quarterly internal
CTE meetings with faculty, staff
and administrators to document
programmatic progress and
challenges
APUs and Program reviews will
reflect this work.
Record of all events planned and
collection of evaluations for said
events.
Records of surveys, evaluations,
and meeting minutes.
CTE Committee
Susan May (newsletter and web
master)
CTE Dean, researcher and all CTE
programs.
CTE Committee, CTE Dean, and
all CTE programs.
CTE Committee, CTE Dean, and
all CTE programs.

54 | P a g e
models, common needs of
CTE programs such as timely
budget allocation, and grant
opportunities.

55 | P a g e
Appendix A
Strategic Directions~ Transfer Education Goal and Activities Planning Matrix
Educational Master Plan work groups created goals and activities to support the implementation of the five strategic directions. Each Appendix A matrix includes
goals and activities aligned with the Strategic Directions and focused on one of the California Community College educational priorities including Foundation
Skills, Career Technical Education and Transfer Education
Student Success (SD1)
Partnerships (SD2)
Non-credit to Credit Pathways (SD3)
Engagement and College Culture (SD4)
Institutional Stability (SD5)
GOALS (Mapped SD) ACTIVITIES TIMELINE ASSESSMENT RESPONSIBLE PARTY
1. Establish fully functioning
transfer center (SD1)
1. Identify what we already
have
2. Visit other colleges and do a
comparative analysis
3. Identify budget and program
responsibilities staffing
needed
2016-2017 1. Survey faculty and students as
to effectiveness of transfer center
2. Evaluate functionality
3. Survey
VPSS
2. Acquire more and better
data (Higher granularity) on
transfer rates. (SD4, SD5)
Collect transfer data to
include UC, State, and
Private institutions.
1. Update outdated data (e.g.
equity data for transfer)
2. Survey graduating students on
what affected their decision to
transfer, what support services
would help
2016-2017 Evaluate clarity of data and
identify trends related to transfer
populations and transfer
institutions.
Determine trends related to
choice of major and preferred
institutions
VPI, VPSS, and IR
3. Augment and strengthen
specific partnerships with
academic departments in
CSUs, UCs, and privates to
develop transfer pipelines
(SD2)
1. Identify select departments
consistent with students’
transfer preferences and
develop faculty-to-faculty
and student-to-student
pipelines, e.g., already
established ADT majors,
High interest transfer
majors, e.g., psychology,
STEM, Administration of
Justice, Child
Development, Human
2016-2017

56 | P a g e
Development
2. Faculty to faculty and
student to student discipline
pipeline at select
institutions (3 UC, 3 CSU,
2 private)
3. Further develop cross-
registration programs and
increase student
participation in them
4. Look at possibility of
developing an AA program
that builds a larger student
transfer pool related to
Merritt’s course offering,
e,g., Wellness-related AA
that would incorporate
health education, nutrition
and dietetics, Kinesiology,
Psychology, Ethnic
Studies, etc.
4. Augment and strengthen
support services for transfer
students campus-wide.
(SD1)
1. Create and/or increase
funding/capacity for transfer
clubs (e.g. Puente, Sankofa, First
Year Experience)
2. Increase transfer-related
activities, campus-wide, such as
group information meetings,
diversified college fairs, e.g.
HBCUs and HSIs, literature and
advertising, e.g., targeted
discipline-specific marketing,
and more discipline-related
events
3. Hire a full-time, experienced
coordinator for campus transfer
center
Fall 2016 Survey students and faculty
regarding effectiveness of
transfer activities on campus, i.e.,
engagement, attendance,
satisfaction, and relevance
Transfer center
5. Augment and strengthen
support for transfer students
within academic programs
(SD1, SD4)
1. Faculty mentoring of
students by discipline, include
transfer data in program reviews,
recognize faculty for efforts in
this area.
Fall 2016-2017 Survey students and faculty
regarding effectiveness of efforts
to strengthen discipline-related
support of transfer students
Transfer center, VPI, department
chairs, discipline faculty,
counselors

57 | P a g e
Appendix B
The Collaborative Brain Trust complete Data Portfolio may be found on the Merritt College Educational
Master Plan web page. Please use the following link:
http://www.merritt.edu/wp/emp/wp-content/uploads/sites/371/2016/04/MC-EMP-Data-Portfolio.pdf
The Collaborative Brain Trust Labor Market Gap Analysis may be found on the Merritt College
Educational Master Plan web page. Please use the following link:
http://www.merritt.edu/wp/emp/wp-content/uploads/sites/371/2016/05/EMP-Labor-Market-Gap-
Analysis.pdf