Embed Size (px)
Citation preview
About our flu activity reporting
MSDH relies upon selected sentinel health practitioners across the state to report the percentage of total patient visits consistent with an influenza-like illness (ILI: fever of 100°F or higher AND cough and/or sore throat). Also, providers are supplied with specimen collection kits. Samples are submitted to the Mississippi Public Health Laboratory for influenza PCR testing. Reports are used to estimate the state’s ILI rate and the magnitude of the state’s influenza activity. Reports represent only the distribution of flu in the state, not an actual count of all flu cases statewide. Information is provisional only and may change depending on additional reporting from sentinel providers. Content
State ILI Surveillance
Flu Testing Reports
National and Mississippi Pediatric Mortality Surveillance
National ILI Surveillance
Appendix
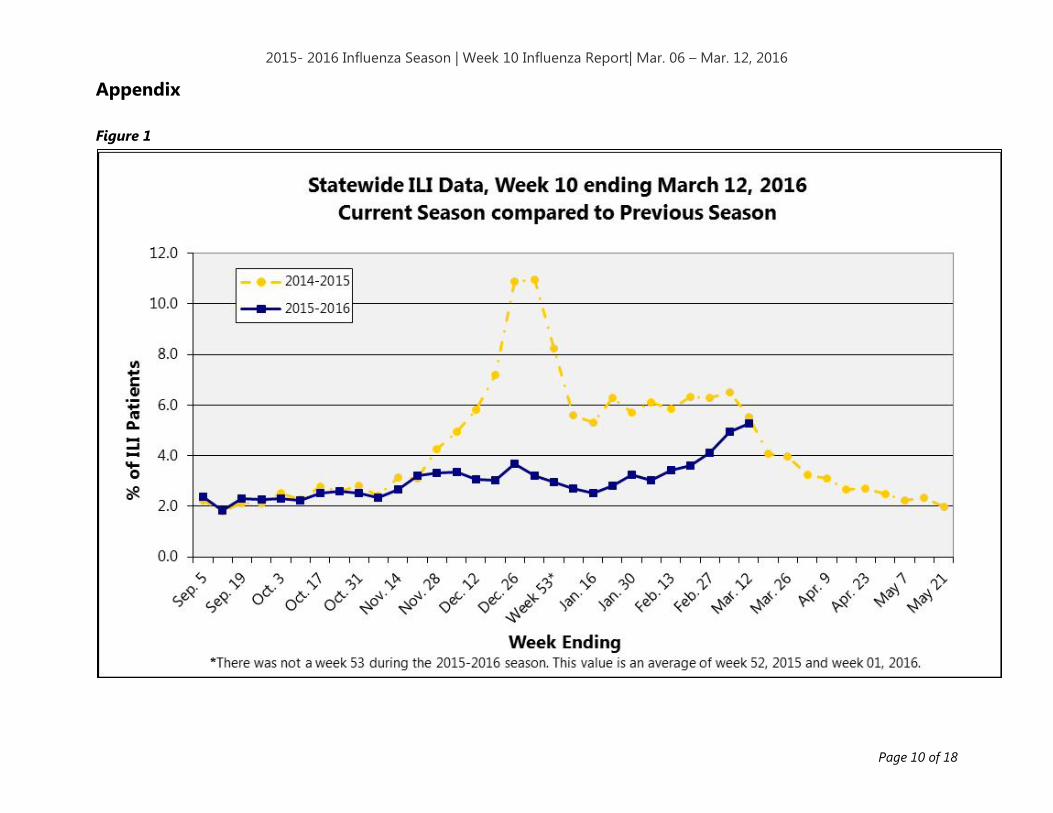
• Figure 1 (Statewide ILI Data, Current Season compared to Previous Season)
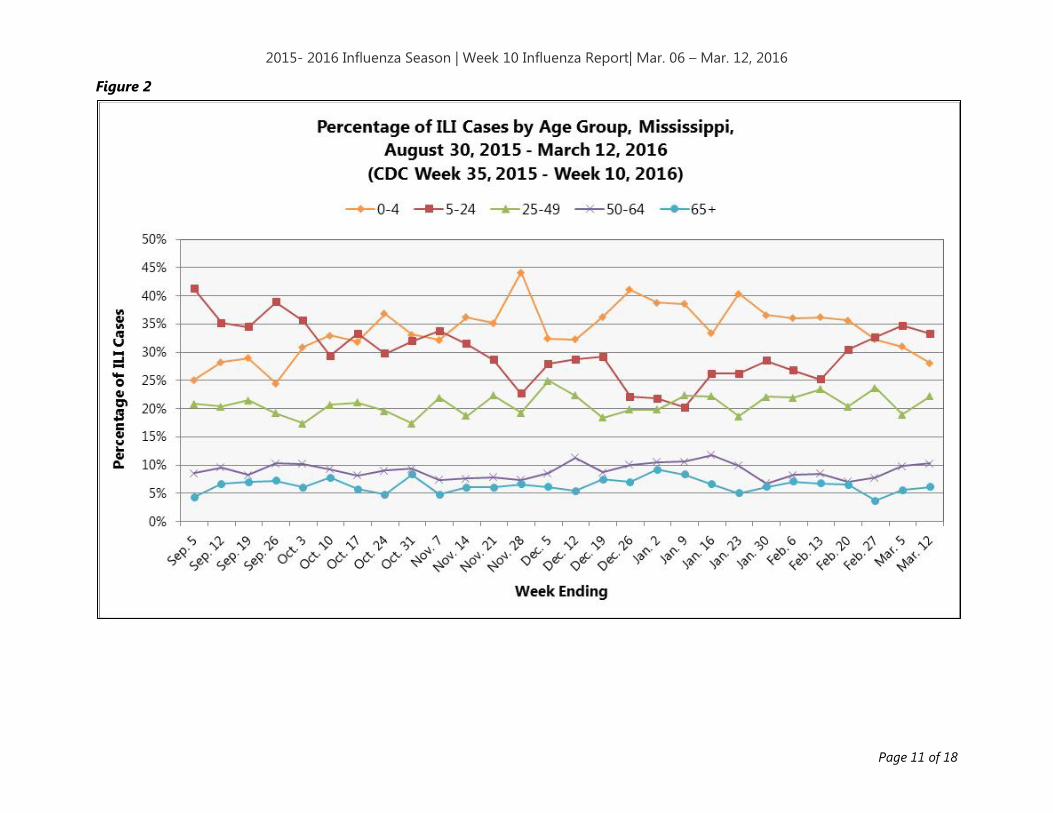
• Figure 2 (Percentage of ILI Cases by Age Group, Mississippi)
• Figure 3 (Mississippi ILI Rates, 2015-2016 and Previous Seasons)
• Figure 4 (State ILI/URI Rates 2012-2016 (YTD))
• Figure 5 (Comparison of Statewide ILI Rate to Positive Influenza Isolates by Type and Subtype, Mississippi)
• Figure 6 (Number of Influenza-Associated Pediatric Deaths by Week of Death and Influenza Type, Nationwide)
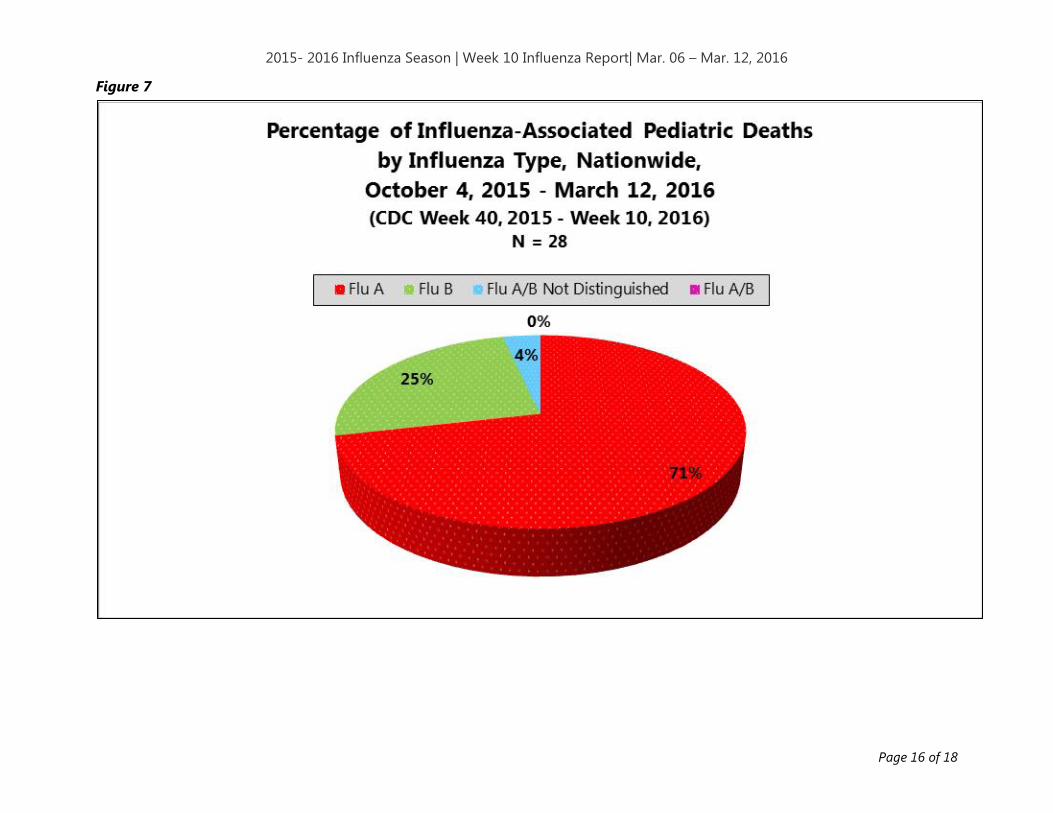
• Figure 7 (Percentage of Influenza-Associated Pediatric Deaths by Influenza Type, Nationwide)
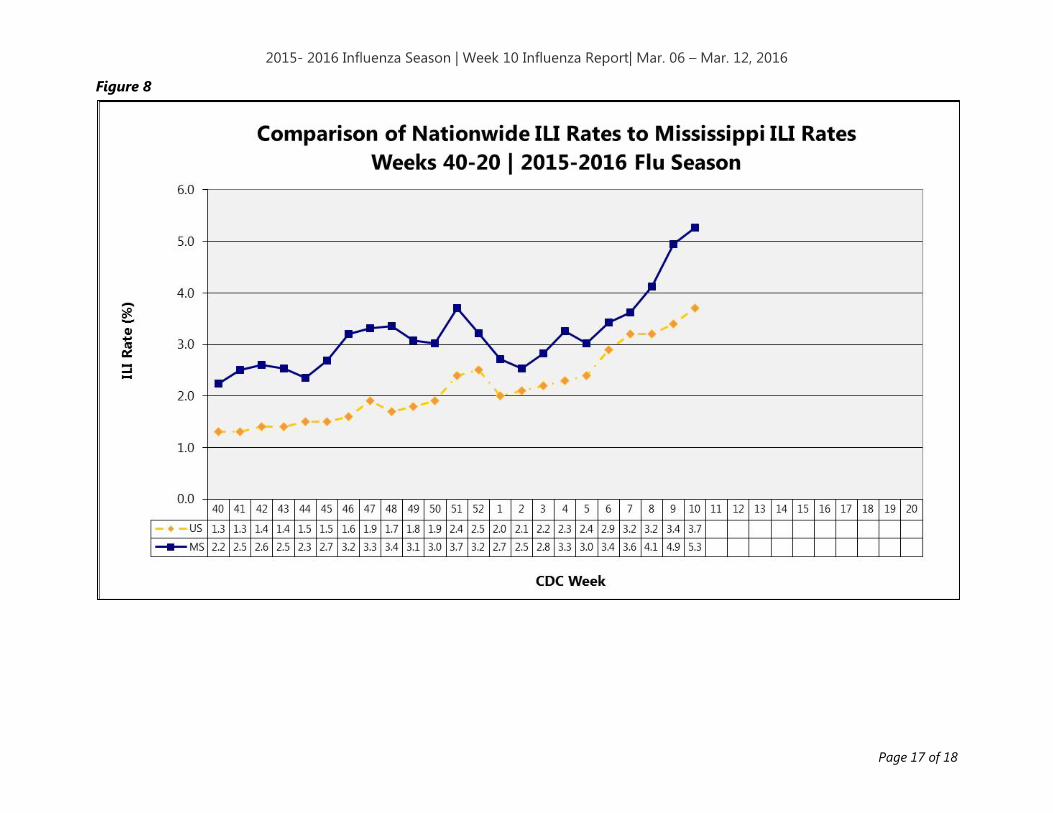
• Figure 8 (Comparison of Nationwide ILI Rates to Mississippi ILI Rates)
• Figure 9 (CDC FluView Weekly Influenza Activity Map)
2015-2016 Influenza Report
Week 10 March 6 – March 12, 2016
2015- 2016 Influenza Season | Week 10 Influenza Report| Mar. 06 – Mar. 12, 2016
State ILI Surveillance
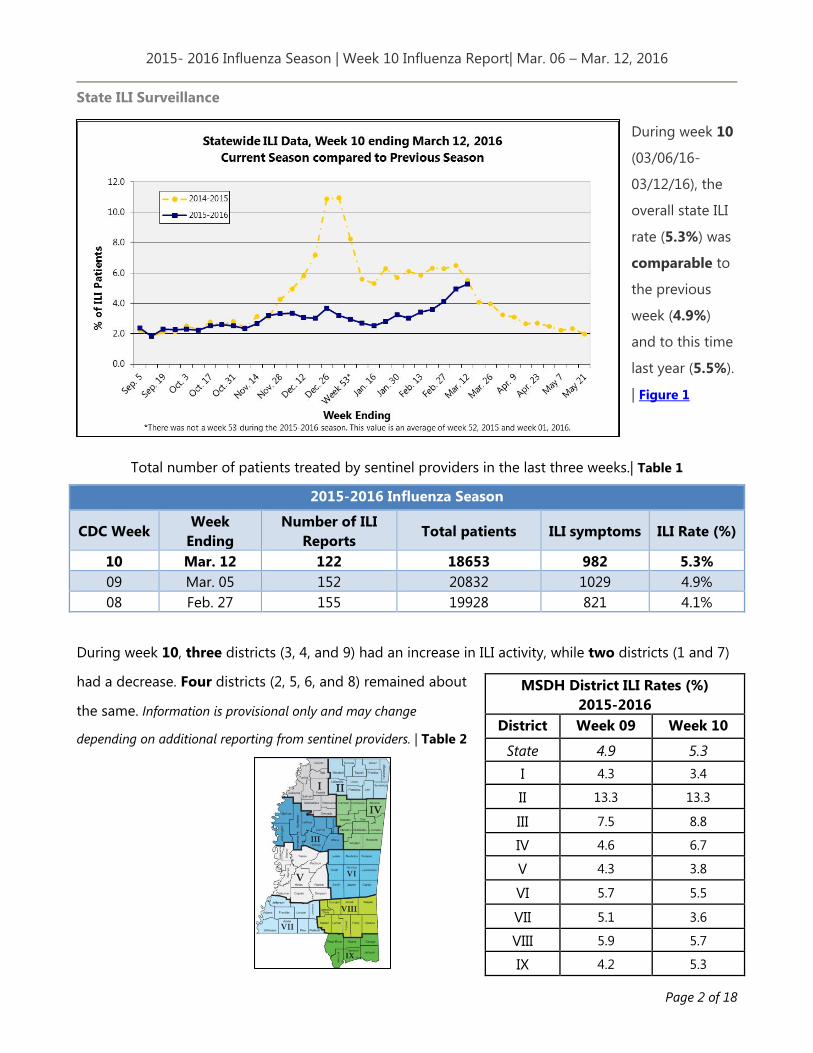
During week 10
(03/06/16-
03/12/16), the
overall state ILI
rate (5.3%) was
comparable to
the previous
week (4.9%)
and to this time
last year (5.5%).
| Figure 1
Total number of patients treated by sentinel providers in the last three weeks.| Table 1
During week 10, three districts (3, 4, and 9) had an increase in ILI activity, while two districts (1 and 7)
had a decrease. Four districts (2, 5, 6, and 8) remained about
the same. Information is provisional only and may change
depending on additional reporting from sentinel providers. | Table 2
2015-2016 Influenza Season
CDC Week Week
Ending Number of ILI
Reports Total patients ILI symptoms ILI Rate (%)
10 Mar. 12 122 18653 982 5.3% 09 Mar. 05 152 20832 1029 4.9% 08 Feb. 27 155 19928 821 4.1%
MSDH District ILI Rates (%) 2015-2016
District Week 09 Week 10
State 4.9 5.3 I 4.3 3.4
II 13.3 13.3
III 7.5 8.8
IV 4.6 6.7
V 4.3 3.8
VI 5.7 5.5
VII 5.1 3.6
VIII 5.9 5.7
IX 4.2 5.3
Page 2 of 18

2015- 2016 Influenza Season | Week 10 Influenza Report| Mar. 06 – Mar. 12, 2016 Overall, the
percentage of
reported ILI
cases has been
highest among
those in the 0-4
and 5-24 years
of age groups.
This trend
continued
during week 10.
| Figure 2
The 2015-16 state ILI rate was above the national, Region 4, and state baselines for week 10. | Figure 3
Page 3 of 18

2015- 2016 Influenza Season | Week 10 Influenza Report| Mar. 06 – Mar. 12, 2016
Mississippi ILI Rates 2012-2016 | Figure 4
Page 4 of 18
2015- 2016 Influenza Season | Week 10 Influenza Report| Mar. 06 – Mar. 12, 2016
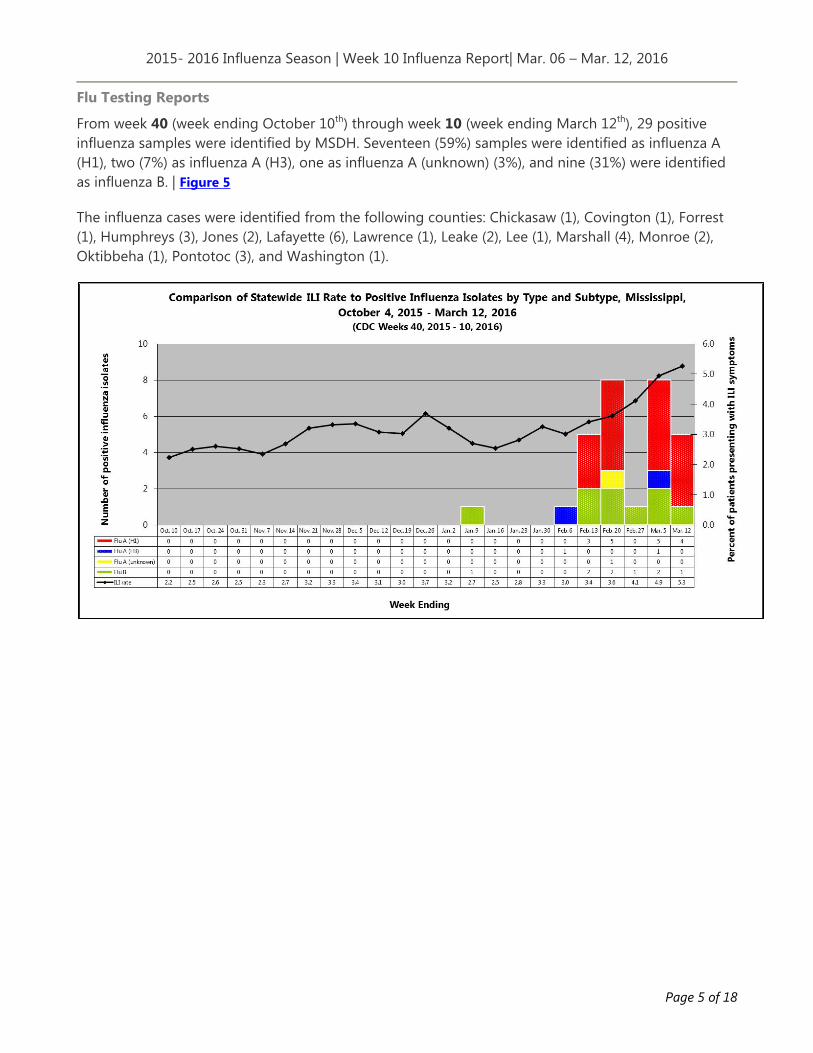
Flu Testing Reports
From week 40 (week ending October 10th) through week 10 (week ending March 12th), 29 positive influenza samples were identified by MSDH. Seventeen (59%) samples were identified as influenza A (H1), two (7%) as influenza A (H3), one as influenza A (unknown) (3%), and nine (31%) were identified as influenza B. | Figure 5
The influenza cases were identified from the following counties: Chickasaw (1), Covington (1), Forrest (1), Humphreys (3), Jones (2), Lafayette (6), Lawrence (1), Leake (2), Lee (1), Marshall (4), Monroe (2), Oktibbeha (1), Pontotoc (3), and Washington (1).
Page 5 of 18
2015- 2016 Influenza Season | Week 10 Influenza Report| Mar. 06 – Mar. 12, 2016
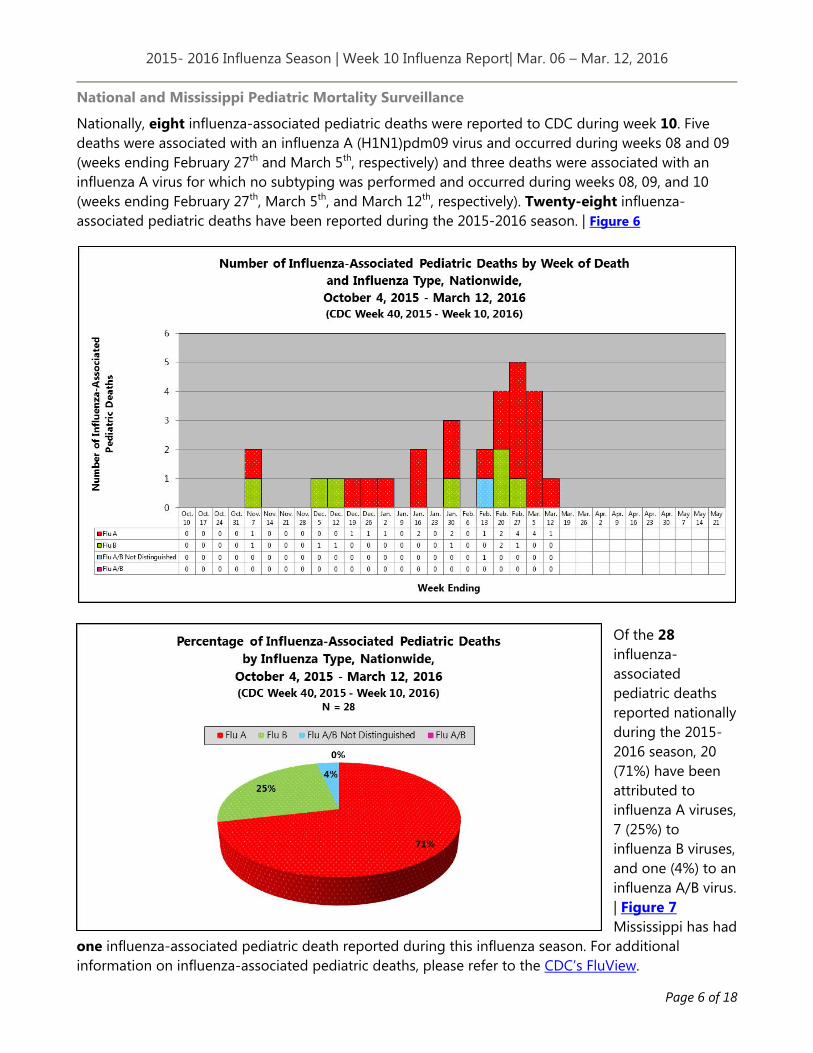
National and Mississippi Pediatric Mortality Surveillance
Nationally, eight influenza-associated pediatric deaths were reported to CDC during week 10. Five deaths were associated with an influenza A (H1N1)pdm09 virus and occurred during weeks 08 and 09 (weeks ending February 27th and March 5th, respectively) and three deaths were associated with an influenza A virus for which no subtyping was performed and occurred during weeks 08, 09, and 10 (weeks ending February 27th, March 5th, and March 12th, respectively). Twenty-eight influenza-associated pediatric deaths have been reported during the 2015-2016 season. | Figure 6
Of the 28 influenza-associated pediatric deaths reported nationally during the 2015-2016 season, 20 (71%) have been attributed to influenza A viruses, 7 (25%) to influenza B viruses, and one (4%) to an influenza A/B virus. | Figure 7 Mississippi has had
one influenza-associated pediatric death reported during this influenza season. For additional information on influenza-associated pediatric deaths, please refer to the CDC’s FluView.
Page 6 of 18
2015- 2016 Influenza Season | Week 10 Influenza Report| Mar. 06 – Mar. 12, 2016
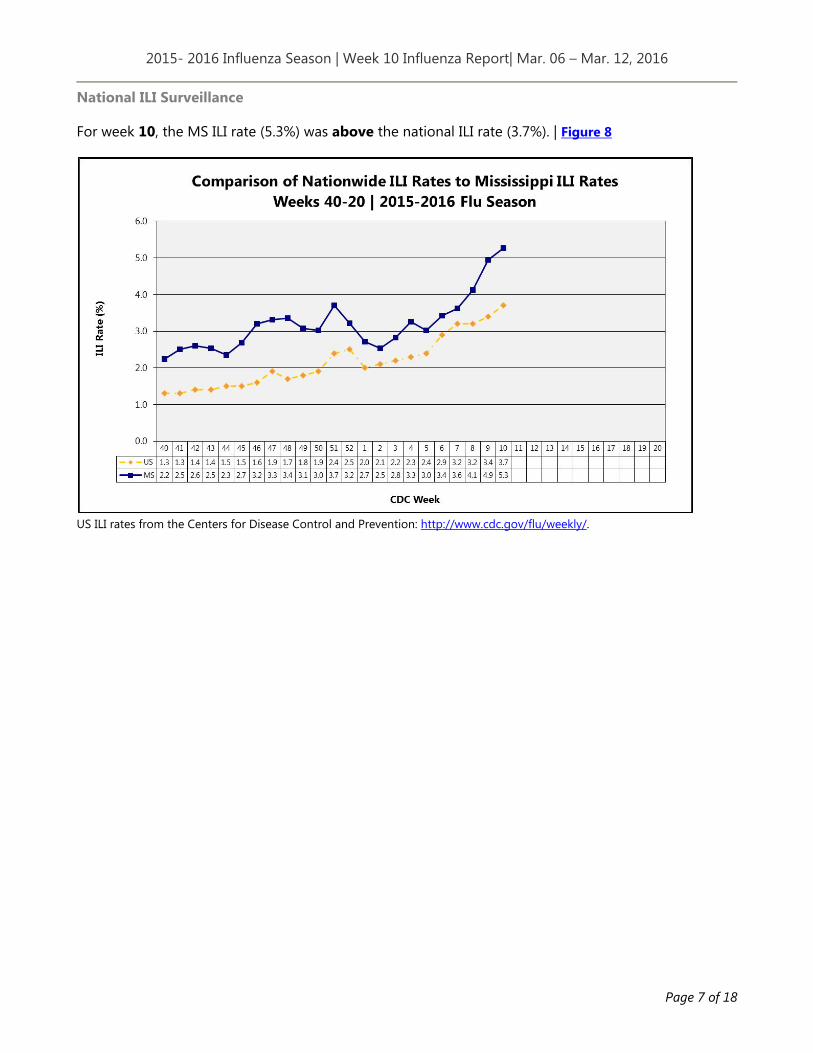
National ILI Surveillance
For week 10, the MS ILI rate (5.3%) was above the national ILI rate (3.7%). | Figure 8
US ILI rates from the Centers for Disease Control and Prevention: http://www.cdc.gov/flu/weekly/.
Page 7 of 18

2015- 2016 Influenza Season | Week 10 Influenza Report| Mar. 06 – Mar. 12, 2016
During week 10, influenza activity increased in the United States.1 | Figure 9
1For up-to-date information on flu activity nationwide, please refer to the CDC’s website: http://www.cdc.gov/flu/weekly/fluactivitysurv.htm. Mississippi reported “Regional” for the influenza activity during week 10. | Table 3
Level of Flu Activity
Definition
No Activity Overall clinical activity remains low and there are no lab confirmed cases.
Sporadic Isolated cases of lab confirmed influenza in the state; ILI activity is not increased OR A lab-confirmed outbreak in a single institution in the state; ILI activity is not increased.
Local Increased ILI within a single region AND recent (within the past 3 weeks) laboratory evidence of influenza in that region. ILI activity in other regions is not increased OR two of more institutional outbreaks (ILI or lab confirmed) within a single region AND recent (within the past 3 weeks) lab confirmed influenza in that region. Other regions do not have increased ILI and virus activity is no greater than sporadic in those regions
Regional Increased ILI in at least 2 regions but fewer than half of the regions AND recent (within the past 3 weeks) lab confirmed influenza in the affected regions OR Institutional outbreaks (ILI or lab confirmed) in at least 2 regions but fewer than half of the regions AND recent lab confirmed influenza in the affected regions.
Widespread Increased ILI and/or institutional outbreaks (ILI or lab confirmed) in at least half of the regions AND recent (within the past 3 weeks) lab confirmed influenza in the state.
Page 8 of 18

2015- 2016 Influenza Season | Week 10 Influenza Report| Mar. 06 – Mar. 12, 2016
Additional influenza information:
Centers for Disease Control and
Prevention
http://cdc.gov/flu/
Centers for Disease Control and
Prevention FluView
http://www.cdc.gov/flu/weekly/
Flu.gov http://www.flu.gov/
MSDH Flu and Pneumonia http://msdh.ms.gov/msdhsite/_static/14,0,199.html
World Health Organization FluNet http://www.who.int/influenza/gisrs_laboratory/flunet/en/
Page 9 of 18
2015- 2016 Influenza Season | Week 10 Influenza Report| Mar. 06 – Mar. 12, 2016
Appendix
Figure 1
Page 10 of 18
2015- 2016 Influenza Season | Week 10 Influenza Report| Mar. 06 – Mar. 12, 2016
Figure 2
Page 11 of 18

2015- 2016 Influenza Season | Week 10 Influenza Report| Mar. 06 – Mar. 12, 2016
Figure 3
Page 12 of 18

2015- 2016 Influenza Season | Week 10 Influenza Report| Mar. 06 – Mar. 12, 2016
Figure 4
Page 13 of 18

2015- 2016 Influenza Season | Week 10 Influenza Report| Mar. 06 – Mar. 12, 2016
Figure 5
Page 14 of 18

2015- 2016 Influenza Season | Week 10 Influenza Report| Mar. 06 – Mar. 12, 2016
Figure 6
Page 15 of 18
2015- 2016 Influenza Season | Week 10 Influenza Report| Mar. 06 – Mar. 12, 2016
Figure 7
Page 16 of 18
2015- 2016 Influenza Season | Week 10 Influenza Report| Mar. 06 – Mar. 12, 2016
Figure 8
Page 17 of 18

2015- 2016 Influenza Season | Week 10 Influenza Report| Mar. 06 – Mar. 12, 2016
Figure 9
Page 18 of 18