Embed Size (px)
Citation preview

2015-20
Unique Dividends for Retail Shareholders:Evidence from Shareholder perks
Katsushi Suzuki

Unique Dividends for Retail Shareholders: Evidence from Shareholder Perks
Katsushi Suzuki
Graduate School of Business Administration, Kobe University, Japan
First version dated February 11, 2014 Version H dated June 2, 2015
Abstract
Previous studies indicate that retail investors are thought of as noise traders, price-takers, and free riders. However, many managers worldwide embrace the expense and treat their retail shareholders favorably. We examine why firms provide small individual stockholders with special treatment by using Japanese shareholder perks, which resemble dividends that are only for small individual shareholders. We find that firms with a low number of individual shareholders and high board ownership tend to initiate shareholder perks. The number of individual shareholders increases dramatically after perk initiation. The high attractiveness of perks for individual investors is positively associated with the stock return on the initiation announcement day and negatively associated with the cost of capital after initiation. The ex-perk day return is significantly negative, and the trading volume around the ex-perk day is significantly positive. The number of individual shareholders is positively associated with the discount premium and the abnormal volume around the ex-day. These results imply that firms introduce perks to attract individuals and that a preference clientele effect clearly exists in dealings around the ex-day.
JEL classification: G14, G30, G35
Keywords: Shareholder perks, Retail investors, Clientele effect, Ex-day return

1
1. Introduction
Numerous existing studies indicate that small individual investors and shareholders are thought of
as proverbial noise traders, price-takers, and free riders (e.g., Grossman and Hart (1980), Kyle
(1985), Black (1986)). However, many firms and managers assume significant expense and treat
their small shareholders favorably by providing, e.g., an information session, a factory tour or a
shareholder perk.1 Why do firms provide small shareholders with special treatment? How does
this special treatment affect the shareholder clientele and firm value? Shareholder perks provide a
unique opportunity to examine these questions.
A shareholder perk is a gift to shareholders. Such gifts are not cash; instead, they consist of
products either from the firm or from other firms.2 Although these perks are uncommon in the
U.S., many companies worldwide provide shareholder perks.3,4 At the end of 2013, approximately
28% of all public companies in Japan, 17% of the FTSE 100 companies on the London Stock
Exchange, and 12% of the ATX 100 companies on the Australian Securities Exchange had adopted
shareholder perks.5 Because shareholder perks of approximately the same value are given to every
shareholder, retail shareholders have advantages related to the value of the shareholder perk over
their investment value.6 From 2001 to 2011, the average perk yield for the smallest shareholders
1 Some countries’ governments have also adopted preferential treatment for retail shareholders. For example, the U.K. has
introduced the individual saving account, ISA, which makes income and capital gains tax-exempt for investors with investment
capital of 11,280 pounds or less. Japan introduced a system similar to the U.K. version of the ISA in 2014. 2 Other firms’ products include food, gift cards, etc. For example, NIPRO, which is the largest producer of medical equipment in
Japan, provides a ¥15,000 ($150) JCB gift card to every shareholder as a shareholder perk. The minimum trading size of NIPRO
investors is ¥901,000 (approximately $9,010), and the perk yield for minimum-size shareholders is approximately 1.66% based on
NIPRO’s stock price on February 28, 2014. 3 The Wall Street Journal examined some perks from U.S. companies on December 13, 2013.
(http://online.wsj.com/news/articles/SB10001424052702303330204579250763759331636) 4 Tirole (2005) shows the ownership of common stock for listed companies in Germany, Japan, the U.K. and the U.S. While
individual ownership in the U.S. was 42.5%, individual ownership in other countries was less than 20%. One reason that
shareholder perks are widely used among countries other than the U.S. may be that those countries have stronger incentives to
encourage individual investors to participate in the market than the U.S. does. 5 Fama and French (2001) report that the proportion of U.S. dividend payers was only 20.8% in 1999 and has declined
substantially in the last two decades. 6 Some business reports argue that perks affect stock returns. For example, consider the case of Coles Myers, an Australian
company. After introducing a shareholder perk (a shareholder discount card), the number of shareholders swelled from 68,000 to
580,000. When Coles Myers cancelled its discount card in 2005, the company’s share price fell by nearly 17% the following day
(http://www.theage.com.au/articles/2004/07/29/1091080376943.html?from=storylhs).

2
in Japanese public companies is approximately 2.0% in our sample, which is larger than the average
dividend yield (approximately 1.6%). We thus consider shareholder perks to be a pseudo-dividend
only for retail shareholders.7 The aggregate value of the perks that firms offer is markedly smaller
than a total dividend payment. The average total payment for perks is approximately 0.1% of firm
value in our sample. It would be difficult to use shareholder perks as a means to signal future
performance or to alleviate a free cash flow problem, such as a cash dividend.
To examine the role of shareholder perks, we offer the following three hypotheses: (1) the
Investor base hypothesis, (2) the Entrenchment hypothesis and (3) the Advertising hypothesis. The
introduction of perks may attract attention from individual investors who face informational
problems, e.g., the winner’s curse problem, because adopting shareholder perks only increases an
individual's yield or improves their recognition.8 Merton (1987) argues that an increase in the
relative size of a firm’s investor base reduces the firm’s cost of capital, i.e., the cost of information
completion, and increases its market value. The Investor base hypothesis is that firms introduce
perks as a tool to increase the number of retail shareholders. The hypothesis predicts that firms
with low attention from individuals will be likely to introduce perks, and the number of individual
shareholders will increase after the introduction. The hypothesis also predicts that the initiation of
a shareholder perk will reduce the firm's cost of capital after perk adoption and raise the firm's
stock price on the announcement day of adoption.
The introduction of shareholder perks may change a firm’s ownership structure because
shareholder perks encourage investments by individual shareholders. Grossman and Hart (1980)
and Shleifer and Vishny (1986) argue that retail shareholders are not likely to play a monitoring
role because their ownership is too small. Further, because shareholder perks increase the payout
7 Investors are not taxed on shareholder perks. 8 Rock (1986) and Beatty and Ritter (1986) argue that newly listed firms pay sweeteners to uninformed investors who face the
winner's curse problem to encourage their participation in an offering. Barber and Odean (2008) and Lou (2014) indicate that
individual investors are likely to purchase attention-grabbing stocks.

3
yield only for retail shareholders, the special treatment transfers wealth from large shareholders to
retail shareholders. Large shareholders who have a monitoring role and dislike such a transfer will
sell off their positions after shareholder perks are initiated. Therefore, managers may introduce
shareholder perks to entrench themselves (Entrenchment hypothesis). Several existing papers show
that manager entrenchment destroys firm value (e.g., Stulz (1988), Morck, Shleifer, and Vishny,
(1988), McConnell and Servaes, (1990), Barclay, Holderness, and Sheehan (2007), and Faleye
(2007)). The Entrenchment hypothesis predicts that the stock return on the initiation announcement
day will drop and that institutional ownership and operating performance will decrease after the
introduction.
In many cases, firms pay out their own products as perks. Such firms may use their perks as
an effective advertising tool because the opportunity for their individual shareholders to use their
products increases. The Advertising hypothesis predicts that a business-to-consumer company
(hereafter, a B-to-C company) will be likely to introduce its product as perks. Furthermore, the
operating performance of a B-to-C company that uses its own products as perks will increase after
adoption, and this firm's stock return on the announcement day of adoption will be positive.
All of the above-mentioned hypotheses are based on the premise that small investors have a
higher interest in shareholder perks than large investors. The difference in preferences among
investors has attracted attention from many researchers. Numerous existing papers examine the
difference in tax and dividend preferences among investors on ex-dividend day, i.e., the tax and
dividend clientele effect (e.g., Elton and Gruber (1970), Kalay (1982), Eades, Hess, and Kim (1984),
Michaely (1991), Michaely, Thaler, and Womack (1995), Green and Rydqvist (1999), Seida (2001)
and Graham, Michaely, and Roberts (2003)). However, these studies provide mixed evidence about
whether the clientele effect exists. Shareholder perks have a stronger influence on the difference in
preferences among shareholders than a change in dividends or capital gain taxes. Furthermore, as

4
mentioned above, the total value of shareholder perks is low. If the difference in preferences among
investors does not affect stock trading, the ex-perk day return and volume will be not significantly
changed, unlike ex-dividend day stock behavior.9 The stock behavior around the ex-perk day
provides an opportunity to clearly examine whether the clientele effect exists.
This paper uses Japanese data to examine these predictions, which provides several benefits.
We can collect extensive perk data because many Japanese firms have introduced shareholder perks.
In addition, Japanese public companies are required to release the number of individual
shareholders each year. Therefore, we are able to examine the behavior of individual shareholders
carefully.
We find the following. First, firms that have a low number of individual shareholders, have
high board ownership, and operate as B-to-C companies tend to initiate shareholder perks. Second,
the number of individual shareholders increases dramatically after perk initiation. Although the
average institutional ownership does not change around the perk initiation, the average individual
ownership increases by approximately 3%. Third, operating performance does not change around
perk initiation. Fourth, the announcement day return is significantly positive, at approximately 3%.
The increasing ratio of the number of individual shareholders around initiation is positively
associated with the announcement return. However, B-to-C companies do not significantly
associate with the announcement return. Fifth, the average cost of capital decreases significantly
after perk initiation. Additionally, the decrease in the cost of capital after perk initiation is positively
associated with Merton’s shadow costs and negatively related with the increasing ratio of the
number of individual shareholders. Finally, the price drop on the ex-perk day is nearly equal to the
perk yield for retail shareholders. The average abnormal trading volumes around the ex-perk day
are significantly positive. The number of individual shareholders is positively associated with the
9 Even if the market is perfect, the ex-dividend day return will be negative.

5
price drop and the trading volume around the ex-perk day.
These findings are consistent with the Investor base hypothesis and inconsistent with both
the Entrenchment and the Advertising hypotheses. Our findings imply that special treatment
provided to individual stockholders is in the interest of all current shareholders.10 Merton (1987)
argues as follows: “If an increase in the size of a firm’s investor base is in the best interest of the
current stockholders, then management should expend resources of the firm to induce investors
who are not currently shareholders to incur the necessary costs of becoming aware of the firm
(p.500).” Our findings regarding stock behavior around the ex-perk day are also consistent with
the dynamic dividend clientele model of Michaely and Vila (1995) and Michaely and Vila (1996),
in which the expected price drop and the trading volume around the ex-day are reflected by the
difference in preference among investors.
Our results contribute to the existing literature in several ways. First, our paper is the first that
examines the role of shareholder perks as special treatment for retail shareholders. Because
shareholder perks are used around the world, our results will provide many firms in these countries
with a suggestion, e.g., the drivers of adoption, regarding the effect of perks on ownership change,
firm value, and stock behavior around the ex-perk day.
Second, our paper contributes to the Investor base literature. A large number of studies
examine various events or variables to test Merton’s (1987) Investor base model, e.g., exchange
changes (Kadlec and McConnell (1994)), cross-listings for foreign companies (Foerster and
Karolyi (1999), changes in minimum trading units (Amihud, Mendelson, and Uno (1999)), the
initiation of analyst coverage (Irvine (2003)), advertising expenditures (Grullon, Kanatas and
Weston (2004) and Lou (2014)) and company name fluency (Green and Jame (2013)). Most
existing studies, excluding Amihud et al. (1999) and Green and Jame (2013), use the number of
10 B-to-C companies may not use their products as perks for advertising but instead for cost savings.

6
analysts, institutional shareholders, and total shareholders in recognizing investors and do not focus
on the number of retail shareholders. Further, Bondnruk and Östberg (2013) show that the
shareholder base affects the payout policy. Our paper extends these papers by using the unique
payout and focusing on the number of retail shareholders.
Finally, our paper contributes to the clientele literature on payout policy. Numerous previous
papers examine the clientele effect through the ownership shift around dividend adoption and
dividend-related taxation changes (Michaely et al. (1995), Grinstein and Michaely (2005), Graham
and Kumar (2006), and Korkeamaki, Liljeblom and Pasternack (2010)), stock return around ex-
dividend day (Elton and Gruber (1970), Kalay (1982), Eades et al. (1984), Michaely (1991), Green
and Rydqvist (1999), and Graham et al. (2003)), and trading volume around ex-dividend day
(Michaely et al. (1995), Seida (2001) and Rantapuska (2008)). Using the unique payout event, our
paper provides findings that are consistent with the clientele effect in these studies.
The remainder of the paper is organized as follows. Section 2 describes the features of
Japanese shareholder perks. Section 3 describes our data. In Section 4, we report our empirical
results and discuss our findings. Section 5 contains our conclusions.
2. Shareholder perks in Japan
A shareholder perk is a gift to shareholders. The gift is not in the form of money but consists of the
firm’s products or those of another firm. For example, ANA, a famous Japanese airline, provides a
50% discount coupon for airline tickets to shareholders who hold more than 1,000 shares (the
minimum trade unit). The stock price of ANA on Feb 28, 2014 is ¥227. Therefore, investors who
invest ¥227,000 (approximately $2,270) in ANA stock can receive the discount coupon as a perk.
Figure 1 indicates the number and percentage of Japanese companies with shareholder perks.
The percentage of public companies with shareholder perks has increased gradually, exceeding
28% in 2011. During our sample period, the average percentage of public companies with

7
shareholder perks is 24.75%. The number of firms with shareholder perks increased through 2008
but decreased as the total number of public firms in Japan decreased due to mergers, acquisitions
and delistings.
We examine the 6-digit industry classifications (Nikkei 139 small-size industry
classifications) of firm-year samples with shareholder perks from January 2001 to December
2011.11 The number of B-to-C companies is 15,246 firm-year samples (approximately 38.87% of
the total 39,228 firm-year samples), which is fewer than the number of business-to-business
companies (hereafter B-to-B companies). B-to-C companies (6,413 firm-year samples and 66.03%
of the total sample of 9,712) are more likely to adopt shareholder perks than B-to-B companies
(3,299 firm-year samples and 33.97% of the total sample). Among B-to-C companies, 86.13% of
the firms that offer shareholder perks use their own products or services as perks (only 871 of the
B-to-C companies use other firms’ products, e.g., gift cards or food, as perks). Of the B-to-B sample,
46.98% use products that are relevant to their company as shareholder perks.12 These results are
consistent with the advertising tool concept, which states that firms tend to use perks as a marketing
strategy.
In approximately 50% of all companies that have adopted shareholder perks, the value of the
perk that investors receive increases as the number of shares held increases. However, because the
rate of increase in perk value is quite low, in nearly all cases, minimum-unit stockholders receive
the highest value. For example, Toyo Suisan, which is a major food company, provides two types
of shareholder perks. The first is a gift of its food with a value of ¥3,000 for shareholders who hold
between 1,000 (the minimum trade unit) and 5,000 shares. The second is a similar gift with a value
of ¥5,000 for shareholders who hold more than 5,000 shares. For large stockholders, the yield of
11 We cannot use the 3-digit industry classification system to classify B-to-C companies. For example, auto parts suppliers and
auto dealers are both classified as belonging to the auto industry. However, auto parts suppliers are B-to-B companies, whereas
auto dealers are B-to-C companies. 12 For example, although a parts company is a B-to-B company, when a parts company uses end products made using their parts
as shareholder parks, we classify such perks as their own product perks.

8
the shareholder perk is quite small and nearly valueless.
Shareholders commonly receive their perks at the time that the company’s financial book closes.
If a firm pays its perks twice per year, shareholders can receive a perk at both book and interim
closings. If a firm also pays a dividend, the timing of the perk is the same as the timing of the
dividend payment, i.e., the ex-dividend day and the ex-perk day are the same day.
3. Data
We use shareholder perk data collected from the Japan Company Handbook (in Japanese, Kaisha
Shiki Hou), for all publicly traded firms in Japan for the period from January 2001 to December
2011. The Japan Company Handbook provides data on the name and ticker of companies that have
adopted perks, the values of those perks, the minimum number of trading shares required to receive
shareholder perks, the types of perks offered, and the timing of perk payment.
Announcement dates of the initiation of shareholder perks are obtained from the eol ESPer
database. When a Japanese company introduces a stockholder perk, it is not required to make an
official announcement through a press release. 13 Therefore, we collect information regarding
announcement days only from companies that voluntarily issued press releases. The eol ESPer
database contains voluntarily issued press releases announcing the initiation of perks. We obtained
429 samples of the announcement date of shareholder perks.
Financial data, the number of shareholders, the ownership of firms, the names of the top 10
shareholders, the value of dividends, the existence of anti-takeover defenses, and industry
classifications are obtained from the Nikkei NEEDS Financial Quest database. We collect data
related to stock prices, stock returns, and three-factor portfolio returns from the NPM portfolio
master database. We also obtain the liquidity factor of Pastor and Stambaugh (2003) from Professor
Hitoshi Takehara of Waseda University. Information on the number of directors on the board and
13 See the Tokyo Stock Exchange home page (http://www.tse.or.jp/sr/faq/index.html#title_6_4).

9
the number of outside directors is obtained using Board data from Toyo Keizai Inc.
4. Examination
4.1. The determinants of perk initiation
We begin by examining the determinants of shareholder perk initiation. Our sample for this analysis
includes public firm-years from 2001 to 2011 unless (1) the firm had already adopted a shareholder
perk, (2) the firm is a financial firm, or (3) the data used in the analysis are unavailable. The number
of firms in our firm-year sample is 27,196, and the number of firms that initiated perks in the next
year during the sample period is 544.14 We use the sample to examine the drivers of shareholder
perk initiation.
We first compare firm characteristics between the Initiation and Non-Initiation sample. Table
1 presents descriptive statistics for the sample. Column one shows the summary statistics for our
total sample; summary statistics for the Initiation and Non-Initiation samples are separately
documented in columns two and three, respectively. The total number of individual shareholders,
# of individual shareholders, and the individual shareholder ratio, which is defined as the
percentage of individual shareholders to total shareholders, are the proxies for the number of
individual investors. We find that the # of individual shareholders and the individual shareholder
ratio for the initiation sample are significantly lower than for the non-initiation sample. These
results are consistent with the idea that the initiation sample has a low number of individual
shareholders.
We compare ownership and governance structures. To calculate total retail investor
ownership, we define individual ownership, which deducts the ownership of individual
shareholders who are Top 10 shareholders from total individual ownership. Comparing individual
14 To examine the determinants of perk initiation, we also use a sample constructed using initiation and matching samples (one to
one matching). We select as matching companies non-adopting firms where the ROA is nearest to the adopting firm in the range
of 80% to 120% of scale (book assets). We arrive at nearly the same results.

10
ownership, we find that the initiation sample tends to be much lower than the non-initiation sample.
These results imply that the initiation sample is less attractive to individual investors. We define
Top 10 ownership, Board ownership and Institutional ownership as the sum of the top 10
shareholders’ ownership, board members’ ownership and institutional ownership, respectively. The
mean Top 10 ownership for the initiation sample is approximately 4% larger than that for the non-
initiation sample. In particular, the mean Board ownership for the initiation sample is
approximately 7% larger than that for the non-initiation sample. However, the mean Institutional
ownership in the initiation sample is approximately 2% lower than that in the non-initiation sample.
Companies in which management intentions are easily adopted may have introduced shareholder
perks. We use the % of outside directors and anti-takeover defense as proxies for corporate
governance. The variable % of outside directors is defined as the percentage of the number of
outside directors to the total number of directors. Anti-takeover defense is a dummy variable that
is equal to one if the firm adopts an anti-takeover defense and zero otherwise. Although there is no
significant difference in % of outside directors between the initiation and the non-initiation samples,
the anti-takeover defense for the initiation sample is lower than that for the non-initiation sample.
To compare the other characteristics between the initiation and non-initiation samples, we
use several proxies: Market Asset, Leverage, ROA, Excess Cash, Tobin’s Q, Dividend, and B-to-C
company. Market Asset is a size proxy and is defined as the market capitalization at the closing
price of the previous fiscal year plus the debt book value of the firm from the previous fiscal year.
The number of shareholders may be strongly correlated with firm size. Leverage is defined as the
sum of short- and long-term leverage over book assets of the previous fiscal year. There is no
significant difference in Market Asset and Leverage between the initiation and the non-initiation
samples. ROA is the operating profit over book assets of the previous fiscal year. Excess Cash is
the residual from regressing cash holdings on firm-specific characteristics and represents the firm’s

11
excess cash holdings.15 TobinQ is a proxy of growth opportunities and is defined as the sum of
market capitalization and book debt over book assets. The mean ROA and TobinQ in the initiation
sample are larger than in the non-initiation sample. Dividend is a dummy variable that is equal to
one if a firm pays a dividend and zero otherwise. B-to-C company is a dummy variable that is equal
to one if the firm is a business-to-consumer company and zero otherwise. B-to-C companies tend
to initiate shareholder perks, which is consistent with the idea of shareholder perks as marketing
tools.
We next conduct multivariate logistic regression analyses of the determinants of shareholder
perk initiation. The dependent variable in the regression is Initiation, which is a dummy variable
equal to one if a firm initiates a shareholder perk and zero otherwise. We focus on the independent
variable of ln(# of individual shareholders) and Individual shareholder ratio as the proxies for the
Investor base hypothesis. If companies with a low number of individual shareholders tend to initiate
shareholder perks to attract individual investors, the predicted signs of ln(# of individual
shareholders) and Individual shareholder ratio will be negative. We also focus on the ownership
of retail shareholders as a proxy of the incentive to change ownership. If the governance mechanism
discourages managers working toward entrenchment from adopting the perk, the proxies for the
governance mechanism will be negatively associated with perk initiation. We use Institutional
ownership, Board ownership, % of outside directors, and Anti-takeover as the governance proxies.
The Entrenchment hypothesis predicts that these variables are negatively associated with perk
initiation. To examine the advertising concept, we use the B-to-C company variable. If firms
introduce a perk as an advertising tool, a B-to-C company will tend to introduce the perk. We
therefore predict that the coefficient of B-to-C company will be positive. As control variables, we
used the following variables: ln(Market Asset), ROA, Leverage, Excess Cash, TobinQ, Dividend,
15 The residual from regressing cash holdings on firm-specific characteristics represents the firm’s excess cash holdings. The first
step regression is as follows: (Cash/Book Asset) = 0.55+0.1*Cash flow + 0.65*Volatility - 0.22*Leverage +1.64*Dividend -
0.06*CapEx + 0.03*TobinQ - 0.01*ln(Market Asset)+ Year dummy + Industry dummy.

12
Year indicator dummy variables and Industry indicator dummy variables.16
Table 2 shows the logistic regression results. The coefficients of ln(# of individual
shareholders) and Individual shareholder ratio are negatively associated with the probability of
perk initiation in all of the models that include those variables. The ln(# of non-individual
shareholders) is not negatively associated with the probability of perk initiation in Models 2 and 5.
These results imply that firms with low attraction for individual shareholders tend to initiate
shareholder perks and are consistent with the Investor base hypothesis. Although the coefficient of
Individual ownership is negative in Model 3, it is not significantly negative in the other models. In
all of the models, the coefficient of Board ownership is significantly positive. Thus, managers of
firms with high board ownership tend to introduce perks. The other governance proxies are not
significantly associated with the probability of perk initiation. These results are not consistent with
the predictions of the Entrenchment hypothesis. The coefficient of B-to-C company is significantly
positive in all of the models. The results are consistent with the advertising tool concept.
Firms may use shareholder perks to signal future performance or to alleviate a free cash flow
problem, similar to a cash dividend. The signaling idea predicts that firms with high informational
asymmetries will be likely to initiate shareholder perks. We use ln(Market Asset) as a proxy for
informational asymmetries. The idea behind alleviating a free cash flow problem is that
overinvestment problems are likely to be more pronounced in cash-rich firms without many growth
opportunities. If the idea is supported, TobinQ will be negatively and Excess Cash will be positively
associated with perk initiation.17 We find that ln(Market Asset) is positively and Excess Cash is
negatively associated with the probability of perk initiation. TobinQ is not significantly or
marginally associated with perk initiation. These findings are not consistent with the signaling and
16 We use the 33 Nikkei medium industry classifications. 17 Lang and Litzenberger (1989) use Tobin’s Q as a proxy for growth opportunities and examine the relation between Tobin’s Q
and stock performance after an increase in dividends. They find that the performance of high Tobin’s Q firms after an increase in
dividends is stronger than the performance of low Tobin’s Q firms. Lie (2000) examines the relation between excess cash and firm
payouts. He finds that cash-rich firms are likely to increase dividends and repurchases.

13
free cash flow idea that shareholder perks are used as a dividend.
4.2. Number of shareholders, ownership and operating performance around perk initiation
In this section, we examine the number of shareholders, the ownership, and operating performance
(ROA, ROS, and SOA) around the time of shareholder perk initiation using a sample of 536 perk
adoptions. We exclude the 8 samples from the 544 perk initiation sample in the previous section
because we cannot use financial statistics for firms after delisting. ROA is operating profits over
book assets, ROS is operating profits over sales, and SOA is sales over book assets. The Investor
base hypothesis predicts that the number of individual shareholders will increase after shareholder
perk initiation. If shareholder perks encourage managerial entrenchment, the ownership of retail
shareholders will increase and institutional ownership will decrease after perk initiation. The
Entrenchment hypothesis also predicts that operating performance will decrease after perk
initiation because agency problems worsen. The Advertising hypothesis predicts that operating
performance, particularly in B-to-C companies with perks tied to their own products, will improve
following the initiation of shareholder perks.
To control for various features of the initiation firms (specifically, firm size, growth
opportunities, profitability, and risk), we use a difference-in-difference (hereafter DID) estimator
of the number of shareholders, ownership and ex-post operating performance variables. The DID
estimator is defined as follows:
𝐷𝐼𝐷𝑁 = (𝑉𝑎𝑟𝑖𝑎𝑏𝑙𝑒𝑡+𝑁𝑇 − 𝑉𝑎𝑟𝑖𝑎𝑏𝑙𝑒𝑡
𝑇) − (𝑉𝑎𝑟𝑖𝑎𝑏𝑙𝑒𝑡+𝑁𝐶 − 𝑉𝑎𝑟𝑖𝑎𝑏𝑙𝑒𝑡
𝐶)
where Variable indicates the number of shareholders, ownership, or performance variables; and T
and C denote the treatment and control groups, respectively. Treatment and control observations

14
are matched to examine the change in the variables around the time of perk initiation. The lower
case t represents the fiscal period immediately before perk initiation; N is the fiscal period covering
two or three years after perk initiation. The method of control group selection is explained in
Appendix A.
Table 3 shows the DID results for the number of shareholders, ownership and operating
performance around the time of perk initiation. The number of individual and non-individual
shareholders significantly increases from t to t+3.18 These results imply that recognition from
investors improves after perk initiation. The Individual shareholder ratio increases after perk
adoption. These results imply that there may be greater improvement in individual recognition than
in non-individual recognition. We also find that ownership per individual shareholder decreases
after perk initiation. These results support the clientele effect and the Investor base hypothesis.
We find that although Individual ownership increases by approximately 1.5% between t and
t+3, Institutional ownership does not significantly change around the time of perk initiation. Not
all performance variables decrease around perk initiation. These results are not consistent with the
Entrenchment hypothesis. Board ownership decreases by approximately 0.9% from t to t+3. This
result implies that a decrease in board ownership is covered by an increase in individual ownership.
The operating performance variables of B-to-C companies that use their products as perks do not
improve following perk initiation. These results are inconsistent with the Advertising hypothesis.
4.3 Announcement-day return
The results of Sections 4.1 and 4.2 imply that firms with a low number of individual shareholders
are likely to initiate shareholder perks and that the number of individual shareholders increases
following perk initiation. According to Merton’s (1987) Investor base model, an increase in the
18 Using the panel regression followed by Grullon et al.’s (2004) specification, we examine the effect of shareholder perks on the
number of individual investors and find that shareholder perks are positively associated with the number of individual
shareholders and individual ownership.

15
number of shareholders decreases a firm’s cost of capital and raises its stock price. The Investor
base model predicts that the announcement of a perk should raise the stock price in firms with
shareholder perks, which attract individual shareholders. The Entrenchment hypothesis predicts
that the stock return on the announcement day of a perk initiation will be negative. The Advertising
hypothesis predicts that the stock return on the announcement day will be positive in a B-to-C
company.
In this section, we examine stock returns on the announcement day of perk initiation. To
examine abnormal returns on adoption announcement days, we collect data from 429 firms that
announced perk adoption from January 2001 to December 2011. We exclude non-public firms in
previous book closings, financial companies, firms that announced a stock split or changed the
trading unit on the same day, and firms for which 150 days or more had passed since their IPO.
Because 122 samples are excluded, we use the remaining 307 samples to examine announcement
day returns.
To examine abnormal stock returns on the announcement day, we use the market model.
Abnormal returns are computed as follows:
𝐴𝑅𝑖,𝑡 = 𝑅𝑒𝑡𝑢𝑟𝑛𝑖,𝑡 − 𝛼�̂� − 𝛽�̂�𝑅𝑀𝑡
𝐶𝐴𝑅𝑖[𝑑, 𝑇] = ∑ 𝐴𝑅𝑖,𝑡
𝑇
𝑡=𝑑
where Returni,t is the stock return on day t for firm i, and RM is the value-weighted return for all
listed firms. ARi,t is the abnormal return for firm i on day t. Coefficient estimates are obtained using
an OLS regression on estimation period returns. The estimation period is -150 days to -11 days
before the announcement day. CARi[d,T] is the cumulative abnormal return for firm i from day d
16
to day T.
Table 4 present the abnormal returns and cumulative abnormal returns around the
announcement day of the initiation of perks. We find that cumulative abnormal returns from day -
1 to day +1 are significantly positive—approximately 2%. These results are consistent with the
Investor base and the Advertising hypotheses and inconsistent with the Entrenchment hypothesis.
To examine the relationship between the increasing number of individual shareholders and
cumulative abnormal returns, we use the variables IR_IND and ΔIndividual shareholder ratio.
IR_IND and IR_NON_IND denote increasing ratios for the number of individual and institutional
shareholders, respectively, from year t to t+2 (i.e., IR_IND = # of individual shareholderst+2 / # of
individual shareholderst – 1, IR_NON_IND = # of non_individual shareholderst+2 / # of
non_individual shareholderst – 1).19 Year t is the accounting period immediately preceding perk
initiation. ΔIndividual shareholder ratio is the difference in the Individual shareholder ratio from
the fiscal period immediately before perk initiation to the fiscal period two years after perk
initiation. The Investor base hypothesis predicts that the IR_IND and ΔIndividual shareholder ratio
are positively associated with the cumulative abnormal return around the announcement day. To
examine the Advertising hypothesis, we use the product dummy, OWN, which is equal to one if the
firm uses its products as shareholder perks and zero otherwise. The Advertising hypothesis predicts
that OWN is positively associated with the cumulative abnormal return around the announcement
day.
Panel A of Table 5 shows the summary statistics for the announcement sample. The mean
(median) IR_IND and IR_INST are 1.335 (0.408) and 0.174 (0.059), respectively.20 The mean
ΔIndividual shareholder ratio is 0.022. Of the B-to-C companies, 62.7% use their own products as
perks in the announcement day return sample.
19 When we use increasing ratios from t to t+1, the results are qualitatively similar. In this paper, we only report results for
increasing ratios from t to t+2. 20 IR_IND and IR_NON_IND are winsorized at the upper and the lower 1% level.

17
Panel B of Table 5 presents the OLS regression results for cumulative abnormal returns
around the announcement day of the perk initiation. The dependent variable is the cumulative
abnormal return from AD–1 to AD+1, CAR[–1,+1]. The independent variables that we most focus
on are IR_IND, ΔIndividual shareholder ratio, and OWN. We find that the coefficients of IR_IND
and ΔIndividual shareholder ratio are significantly positive in all of the models. The results imply
that the high attractiveness of perks for individual shareholders raise the stock price on the
announcement day, which is consistent with the Investor base hypothesis. The dummy variable of
B-to-C company is not significantly associated with cumulative abnormal returns. The coefficient
of OWN in Models 5 and 6 is not statistically significant. These results are not consistent with the
Advertising hypothesis.
As control variables, we use IR_INST, Ownership structure, Market Asset, Leverage, ROA,
and TobinQ. The coefficient of IR_INST is significantly negative in Models 3 and 4, although the
coefficient in Model 2 is not statistically significant. These results are inconsistent with the
institutional investor base idea in which firms introduce shareholder perks that attract institutional
investors to increase their stock price. Although the coefficients of individual ownership and board
ownership are not statistically significant, institutional ownership is negatively related with
cumulative abnormal returns. The coefficient of ln(Market Asset) is not statistically significant.
Because we can consider the market asset variable to represent informational asymmetry, the result
shows that the market does not evaluate the signal as an alleviation of informational asymmetry,
unlike cash dividend results. Moreover, TobinQ, which is the proxy of growth opportunities, is not
associated with announcement returns. These results imply that the perk is not evaluated as
fulfilling the role of easing a free cash flow problem in the markets.
4.4.Cost of Capital
18
Next, we examine the cost of equity capital around the time of the initiation of a shareholder
perk. Merton (1987) develops a model of capital market equilibrium in an incomplete information
market. Merton’s model assumes that each investor purchases only shares for which they can obtain
the information. Under this assumption, each investor cannot diversify the idiosyncratic risk in
their portfolio. In equilibrium, a security’s expected return depends on the fraction of investors that
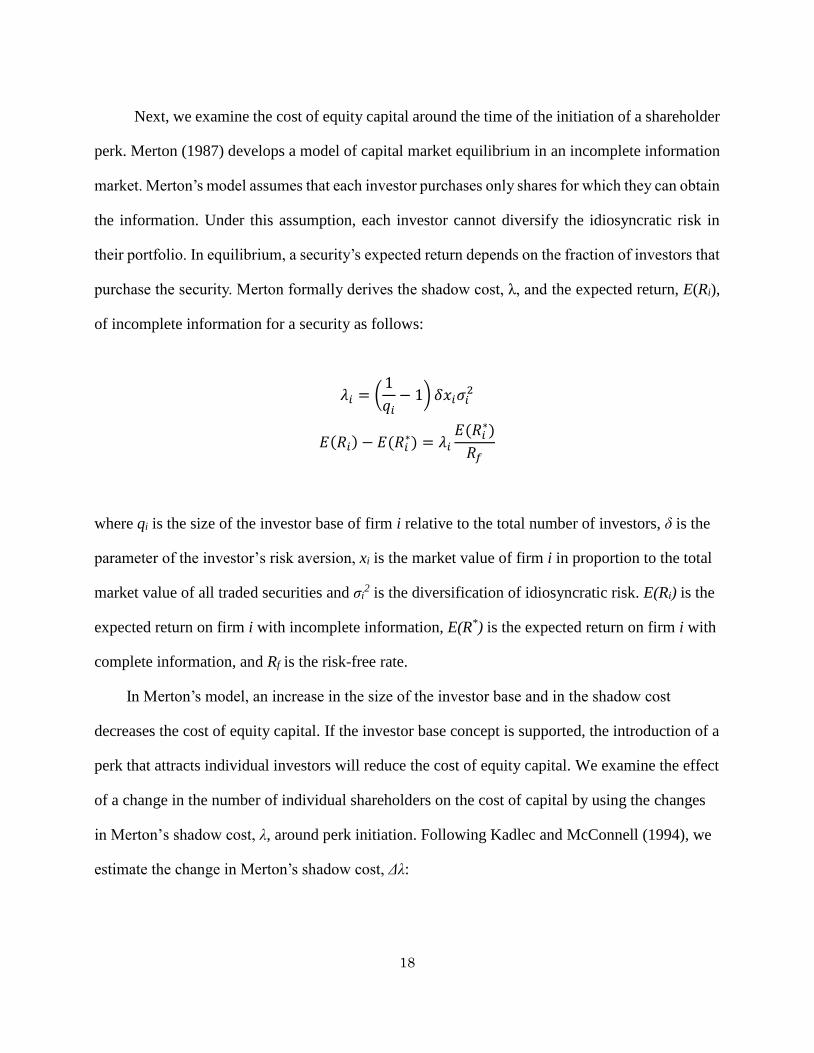
purchase the security. Merton formally derives the shadow cost, λ, and the expected return, E(Ri),
of incomplete information for a security as follows:
𝜆𝑖 = (1
𝑞𝑖− 1) 𝛿𝑥𝑖𝜎𝑖
2
𝐸(𝑅𝑖) − 𝐸(𝑅𝑖∗) = 𝜆𝑖
𝐸(𝑅𝑖∗)
𝑅𝑓
where qi is the size of the investor base of firm i relative to the total number of investors, δ is the
parameter of the investor’s risk aversion, xi is the market value of firm i in proportion to the total
market value of all traded securities and σi2 is the diversification of idiosyncratic risk. E(Ri) is the
expected return on firm i with incomplete information, E(R*) is the expected return on firm i with
complete information, and Rf is the risk-free rate.
In Merton’s model, an increase in the size of the investor base and in the shadow cost
decreases the cost of equity capital. If the investor base concept is supported, the introduction of a
perk that attracts individual investors will reduce the cost of equity capital. We examine the effect
of a change in the number of individual shareholders on the cost of capital by using the changes
in Merton’s shadow cost, λ, around perk initiation. Following Kadlec and McConnell (1994), we
estimate the change in Merton’s shadow cost, Δλ:

19
∆𝜆 = [(𝑅𝑉𝐴𝑅𝑝𝑜𝑠𝑡 ∗ 𝑅𝐸𝐿𝐶𝐴𝑃𝑝𝑜𝑠𝑡
𝑁𝐼𝑁𝐷𝑝𝑜𝑠𝑡) − (
𝑅𝑉𝐴𝑅𝑝𝑟𝑒 ∗ 𝑅𝐸𝐿𝐶𝐴𝑃𝑝𝑟𝑒
𝑁𝐼𝑁𝐷𝑝𝑟𝑒)] ∗ 1,000,000
where NINDpre and NINDpost are the number of individual shareholders of the end of the most recent
fiscal year prior to the perk initiation announcement date and at the second fiscal year end after the
announcement date, respectively. RVARpre and RVARpost are the stock’s residual variance calculated
from the daily date over the interval [-150, -11] prior to the announcement date and over the interval
[11, 150] following the second fiscal year end after the announcement date, respectively.
RELCAPpre and RELCAPpost are the firm’s market capitalization divided by the sum of the market
capitalization of all stocks available on the NPM portfolio master data base, calculated at the end
of the month prior to the announcement date and the end of the second fiscal year following the
announcement date, respectively.
To examine whether the cost of capital is reduced through perks that attract individual
investors, we use Fama and French’s three-factors and Pastor and Stambaugh’s (2003) liquidity
factor.21 We run the following time-series regression for each firm that adopted a perk:
𝑟𝑖,𝑡 − 𝑟𝑓,𝑡 = 𝛼𝑖,0 + 𝛼𝑖,1𝐷𝑡 + (𝛽𝑖,0 + 𝛽𝑖,1𝐷𝑡)(𝑟𝑚,𝑡 − 𝑟𝑓,𝑡) + (𝛾𝑖,0 + 𝛾𝑖,1𝐷𝑡)𝑆𝑀𝐵𝑡
+ (𝛿𝑖,0 + 𝛿𝑖,1𝐷𝑡)𝐻𝑀𝐿𝑡 + (𝜎𝑖,0 + 𝜎𝑖,1𝐷𝑡)𝐿𝐼𝑄𝑡 + 휀𝑖,𝑡
where 𝑟𝑖,𝑡 is the monthly return of adoption firm i at time t, and 𝑟𝑓,𝑡 is the risk-free rate at time t.
𝐷𝑡 = 1 if t is in the post-adoption period and 𝐷𝑡 = 0 otherwise. 𝛽𝑖,0, 𝛾𝑖,0, 𝛿𝑖,0, and 𝜎𝑖,0are the
pre-adoption factor loadings on the three Fama-French factors and Pastor and Stambaugh’s
liquidity factor. 𝛽𝑖,𝑖 , 𝛾𝑖,𝑖 , 𝛿𝑖,1 , and 𝜎𝑖,1 indicate the differences between the post- and pre-
adoption factor loadings on the four factors. 𝛼𝑖,0 is the pre-adoption abnormal return. Our main
21 Using the relative volume and the ILLQ measure, as in Amihud, Mendelson, and Lauterbach (1997), we also examine liquidity
around the initiation of a perk. However, we do not find an average improvement in liquidity associated with shareholder perks.

20
variable of interest is 𝛼1, which is the difference between post- and pre-adoption abnormal returns.
To avoid an announcement effect, we run the regression for each firm for a 46-month period, from
month – 24 to month – 2 prior to the shareholder perk declaration month and from month + 2 to
month + 24 after the shareholder perk declaration month.
Table 6 presents the summary of the cost of equity capital (𝛼1) calculated by FF3/LIQ, the
FF3- and one-factor models and the difference tests of the cost of equity capital using the change
in Merton’s shadow cost (Δλ). We winsorize each variable at the 1st and 99th percentiles. We
divide the total sample into four groups based on Δλ to examine the effect of the change in
shadow costs on the change in the cost of capital. The increasing rate of the number of individual
shareholders, IR_IND, and the change in the individual shareholder ratio, ΔIndividual
shareholder ratio, are negatively associated with Δλ. We find that the difference between post-
and pre-adoption abnormal returns in the lowest Δλ subgroup is significantly lower than that in
the highest Δλ subgroup. These results are consistent with the Investor base hypothesis.
Table 7 presents the OLS regression results for the difference between post- and pre-adoption
abnormal returns. The dependent variable is 𝛼1 calculated using the FF3/LIQ model. Our
independent variables of interest are Δλ, IR_IND and ΔIndividual shareholder ratio. The
recognition concept predicts that the coefficient of Δλ will be positively and IR_IND and
ΔIndividual shareholder ratio will be negatively associated with 𝛼1. We also use IR_NON_IND,
B-to-C company, ln(Market Asset), Unsystematic risk, Leverage, ROA, and TobinQ as control
variables. Unsystematic risk is the mean square error computed as the deviation of the stock price
from the value predicted by the market model for the period from -150 days to -11 days before the
announcement day. We find that the coefficient of Δλ is positively and the coefficients of IR_IND
and ΔIndividual shareholder ratio are negatively associated with the difference between post- and
pre-adoption abnormal returns in Models 2 to 5. The results in this section suggest that shareholder

21
perks that attract individual shareholders reduce the cost of equity capital. These findings are
consistent with the Investor base hypothesis.22
4.5.Ex-perk day return and volume
4.5.1. Ex-perk day return
As mentioned above, the shareholder perk yield is different for retail and large shareholders. We
find that ownership changes around shareholder perk initiation. These findings are consistent with
the dividend clientele effect. The ex-perk day analysis also provides an opportunity to examine
whether the dividend clientele effect exists, for example, based on the dividend-related tax
difference between retail and large shareholders. We examine stock returns and trading volumes
around the ex-perk day.
The ratios of the total value of shareholder perks to capitalization are close to zero. In a
perfect market, the ex-perk day return will also be close to zero. The Dynamic dividend clientele
model of Michaely and Vila (1995) and Michaely and Vila (1996) indicates that the expected price
drop on the ex-dividend day reflects the average preference of all traders.23 The Dynamic dividend
clientele model predicts that if retail investors participate in ex-perk day trading, their preference
will have a significant effect on the ex-perk day return.
We obtain a sample of 8,163 ex-perk days from 2001 to 2011. There are many firms that
have released the value of their perks. We collect from the sample those for which we can calculate
the shareholder perk yield. The number of ex-perk days for which we can specify perk values (e.g.,
a $100 Amazon gift card for each investor holding more than 100 shares) is 3,279. Among the
3,279 ex-perk days, 2,844 are on the same day as the ex-dividend day, and the remaining 435 ex-
22 We also use 𝛼1 calculated using the FF3-factor and the one-factor models as a dependent variable. The results are qualitatively
similar. 23 The model also incorporates the risk involved in the ex-day transaction and transaction costs. Kalay’s (1982) and Boyd and
Jagannathan’s (1994) models incorporate the transaction costs into the ex-dividend day return.

22
perk days are not on an ex-dividend day. In addition, we collect a sample of 21,631 ex-dividend
days that are not also ex-perk days to compare the ex-perk day return.
Perk values differ for retail and non-retail shareholders. We calculate the perk’s yield as
follows:
𝑃𝑉𝑃𝑆𝑟𝑒𝑡𝑎𝑖𝑙,𝑖 =𝑃𝑒𝑟𝑘 𝑣𝑎𝑙𝑢𝑒 𝑝𝑒𝑟 𝑚𝑖𝑛𝑖𝑚𝑢𝑚 𝑠ℎ𝑎𝑟𝑒ℎ𝑜𝑙𝑑𝑒𝑟𝑖
𝑇ℎ𝑒 𝑛𝑢𝑚𝑏𝑒𝑟 𝑜𝑓 𝑚𝑖𝑛𝑖𝑚𝑢𝑚 𝑡𝑟𝑎𝑑𝑖𝑛𝑔 𝑠ℎ𝑎𝑟𝑒𝑖
𝑃𝑉𝑃𝑆𝑡𝑜𝑡𝑎𝑙,𝑖 =𝑇𝑜𝑡𝑎𝑙 𝑃𝑒𝑟𝑘 𝑣𝑎𝑙𝑢𝑒𝑖
𝑇𝑜𝑡𝑎𝑙 𝑛𝑢𝑚 𝑜𝑓 𝑜𝑢𝑠𝑡𝑎𝑛𝑑𝑖𝑛𝑔 𝑠ℎ𝑎𝑟𝑒𝑠𝑖
𝑃𝑌𝑟𝑒𝑡𝑎𝑖𝑙,𝑖 =𝑃𝑉𝑃𝑆𝑟𝑒𝑡𝑎𝑖𝑙,𝑖
𝑃𝑐𝑢𝑚,𝑖
𝑃𝑌𝑡𝑜𝑡𝑎𝑙,𝑖 =𝑃𝑉𝑃𝑆𝑡𝑜𝑡𝑎𝑙,𝑖
𝑃𝑐𝑢𝑚,𝑖
𝐷𝑌𝑖 =𝐷𝑖
𝑃𝑐𝑢𝑚,𝑖
Total yieldi = PYretail,i + DYi
PVPSretail,i is the perk value per share for minimum-unit investors in firm i.24 PVPSretail is the
highest perk value per share for firm i’s investors. PVPStotal indicates the average perk value per
share. Pcum,i is the closing price of firm i on cum-day. PYretail and PYtotal represent the perk yields
for retail investors and average investors, respectively. Di is the dividend per share of firm i, and
DY is the dividend yield. If trading by retail investors affects the ex-perk day return, the ex-day
return will more closely approximate Total yieldi than the sum of PYtotal and DYi. We also calculate
the premium on ex-day returns, Premium, as follows:
24 In Japan, all firms have minimum trading units. We adjust the minimum trading unit to examine PVPSretail. For example,
suppose the minimum trading size of company A is 100 shares and company A’s perk is a $100 Amazon gift card for each investor
who holds more than 100 shares. If the investor purchases only 100 shares, he/she can obtain the $100 Amazon gift card. Thus,
PVPSretail = $100/100 shares.

23
𝑃𝑟𝑒𝑚𝑖𝑢𝑚𝑖 =𝑃𝑐𝑢𝑚,𝑖 −
𝑃𝑒𝑥,𝑖 + 𝐷𝑖
1 + 𝐸[𝑟𝑖]𝑃𝑉𝑃𝑆𝑟𝑒𝑡𝑎𝑖𝑙,𝑖
1 + 𝐸[𝑟𝑖]
− 1
where Pex,i is the closing price of firm i on ex-day, and 1 + E[ri] is the prospective return. If a firm
does not pay a dividend, the value of D is zero. To estimate E[ri], we use the market model, which
provides an estimation window of 140 days from -150 to -11 days prior to ex-day. We winsorize
the Premium at the 1st and 99th percentiles to minimize the influence of outliers.
Table 8 presents the summary statistics for the raw return on ex-day, the perk yield, the
dividend yield, the total yield, and the discount. Columns 1, 2, and 3 show the summary statistics
for the total ex-perk day sample, only the ex-perk-day sample and a simultaneous ex-day sample,
respectively. Column 4 shows the summary statistics for only the ex-dividend-day sample. The
mean (median) raw return on the ex-day of every ex-perk sample is negative. The average (median)
PYretail is 2.0% (1.2%) in the total ex-day sample. For retail shareholders, the shareholder perk is a
very attractive payout. By contrast, other investors will not be attracted by the shareholder perk
because the average (median) perk yield for average shareholders (PYtotal) is 0.1% (0.05%) in the
total ex-day sample.
Clearly, Total yield is closer to the decline in stock returns on all ex-day samples than DY
and than the sum of DY and PYtotal in both the only ex-perk-day and the same-day samples. The
results imply that the perk yield for minimum-unit shareholders significantly affects the ex-day
return. Surprisingly, the mean discount for every ex-perk subsample is significantly positive. These
results imply that retail shareholders have an important effect on the ex-day return and evaluate the
perk value higher than the value of the equivalent in money.25
25 Numerous studies find that the premium on the ex-dividend day is less than one (Elton and Gruber (1970), Kalay (1982), Eades
et al. (1984), Kato and Loewenstein (1995) Graham, et al. (2003)).

24
We next conduct multivariate OLS regression analyses of Premium. The dependent variable
in the regression is Premium. We focus on the independent variable of ln(# of individual
shareholders) and Individual shareholder ratio. Because shareholder perks are distributed for every
shareholder, these variables are proxies for the individual shareholder’s demand for shareholder
perks. We predict that the ln(# of individual shareholders) and Individual shareholder ratio will be
positively associated with Premium. We also predict that ln(# of non-individual shareholders) will
be negatively associated with Premium because the perk value may not be worth consideration for
non-individual shareholders. Elton and Gruber (1970) and Kaley (1982) find that the dividend yield
is negatively associated with the ex-dividend return. Therefore, we predict that PYretail and DY will
be positively associated with Premium. Institutional investors, who prefer capital gains to perk
yields, may play the role of arbitrager in high PYretail stocks. In this case, we predict that PYretail will
be negatively associated with Premium. Because a gift-card-type perk is more liquid than a product
perk, a gift-card-type perk will be evaluated higher than a product-type perk. We predict that Gift
card dummy will be positively associated with Premium. As control variables, we use the Only perk
dummy, ln(Market capitalization), Systematic risk, and Unsystematic risk. Systematic risk is
estimated using beta, and Unsystematic risk is defined as the idiosyncratic risk scaled by market
variance in the same time period. Beta and idiosyncratic risk are estimated using the market model,
where the estimation window is 140 days, running from -150 to -11 prior to the ex-day.
Panels A and B of Table 9 show the summary statistics for the ex-perk sample and the results
of the OLS regression, respectively. We find the ln(# of individual shareholders) is positively
associated with Premium. The coefficient of Individual investor ratio is significantly negative in
Models 3, 4, and 7. These results imply that the demands of different investors affect the ex-day
return. The coefficient of ln(# of non-individual shareholders) is significantly negative. We also
find that PYretail is negatively associated with the discount. These results may reflect the trading of

25
non-individual arbitragers. Karpoff and Walking (1988 and 1990) argue that effective arbitrage
trading reduces the excess return on the ex-dividend day. The result is consistent with the effective
arbitrage hypothesis (Karpoff and Walking (1988 and 1990)). The type of perk (gift card vs.
product) does not affect the discount. Why is the discount significantly positive and why is the gift-
card-type perk evaluated at the same value as the product-type perk? One reason may be social
norms: in the case of a present, people prefer goods to the same value in cash (Ariely (2008)).26
4.5.2. Ex-perk-day volume
The Dynamic dividend clientele model of Michaely and Vila (1995) argues that when ex-day
returns are affected by varying investor preferences, trading volumes will increase around the ex-
day. In accordance with Dhaliwal and Li (2006), we examine abnormal trading volumes around the
ex-perk day as follows:
𝑁𝑉𝑖 =∑ 𝑇𝑢𝑛𝑜𝑣𝑒𝑟𝑖,𝑡𝑡∈[−150,−11]
140
We calculate the average turnover ratio for trading between -150 and -11 days before the ex-perk
day:
𝐴𝑉𝑖,𝑡 =𝑇𝑢𝑛𝑜𝑣𝑒𝑟𝑖,𝑡
𝑁𝑉𝑖− 1
Next, we calculate AV and AAV. AVt is turnover on day t divided by NV. AAV is the average
abnormal volume around the ex-perk day.
Table 10 presents summary statistics of AV and AAV. Columns 1, 2 and 3 show the results
26 Many managers who initiate perks say “We would like to send our gratitude to our stockholders.”

26
for the total ex-perk day sample, the only ex-perk day sample, and a simultaneous ex-day sample,
respectively. The AV of all of the columns increases gradually until immediately before the ex-perk
day and decreases gradually after the ex-perk day. AAV[-5,+5] of the total ex-perk day sample is
approximately 0.55 and is significantly positive. These results are consistent with the argument of
Michaely and Vila (1995).
To investigate the relationship between the preference of retail shareholders and AAV, we
examine an OLS regression of the trading volumes around the ex-perk day. The dependent variable
is AAV between -5 to +5 of the ex-perk day. Our independent variables of focus are ln(# of
individual shareholders), Individual investor ratio, and the perk yield for retail investors. These
variables are proxies for the level of preference of retail investors. The Dynamic dividend clientele
model predicts that these variables are positively associated with the trading volume around the ex-
perk day. ln(# of non-individual shareholders) is the proxy for the preference of non-retail investors.
We predict that the ln(# of non-individual shareholders) will be negatively related with the trading
volume. Following Michaely and Vila (1996), we add DY, ln(Market capitalization), Systematic
risk, and Unsystematic risk to our empirical models. DY and ln(Market capitalization) are the
proxies for dividend preference and trading costs, respectively. Risk reduces trading volume;
investors cannot hedge all of the systematic risk when trading costs exist. Therefore, both
Systematic risk and Unsystematic risk may be negatively associated with the trading volume. We
also include Gift card dummy, Only perk dummy, and B-to-C company as control variables.
Table 11 presents the OLS regression results. We find that ln(# of individual shareholders)
and Individual investor ratio are positively and that ln(# of non-individual shareholders) is
negatively associated with AAV. These results imply that both the individual investor and non-
individual investor groups receive the benefit from trading around the ex-perk day, which is
consistent with the findings of Michaely and Vila (1995 and 1996). In Models 1, 3, and 5, we also

27
find that PYretail and DY are positively associated with AAV; these results are also consistent with
the ex-dividend return results. When ln(# of individual shareholders) and PYretail are included in the
same model, the coefficient of PYretail is not statistically significant. One of the reasons for this
result may be the correlation of ln(# of individual shareholders) and PYretail. The coefficients of
Systematic risk and Unsystematic risk are negatively associated with AAV, and the coefficient of
ln(Market Capitalization) is positively associated with AAV. These results are consistent with the
findings of Michaely and Vila (1996). The coefficients of Gift card dummy and B-to-C company
are not significantly related with AAV and are consistent with the ex-day return results.
5. Conclusion
A unique pseudo-dividend for retail investors, the shareholder perk, is used around the world.
Through analyzing the determinants of perk initiation, the change in a firm’s features around perk
initiation, the stock return on the announcement day of perk initiation, and the stock behavior
around the ex-perk day, this paper examines the role and the impact of shareholder perks on firm
value and stock behavior using Japanese shareholder perk data from 2001 to 2011. We offer three
hypotheses to examine why firms introduce shareholder perks that provide individual stockholders
with special treatment, i.e., (1) the Investor base hypothesis, (2) the Entrenchment hypothesis, and
(3) the Advertising hypothesis.
We find several results. First, firms that have a low number of individual shareholders, have
high ownership by board members and operate as B-to-C companies tend to initiate shareholder
perks. Second, the number of individual shareholders increases after perk initiation. The average
ownership of individual shareholders increases by approximately 3% and board members’
ownership decreases by approximately 3% after perk initiation. Ownership per individual
shareholder decreases after perk initiation. Third, operating performance does not change after

28
initiation, even if B-to-C companies use their products as perks. Fourth, the announcement day
return is significantly positive, at approximately 3%. Additionally, an attractive perk for individual
investors is positively associated with the announcement return. Board ownership and
identification as a B-to-C company are not significantly associated with the announcement return.
Fifth, the average cost of capital decreases significantly after perk initiation. Additionally, the
decrease in the cost of capital after perk initiation is positively associated with the increase in
individual shareholder numbers. Sixth, the average abnormal return on the ex-perk day is
significantly negative. The perk yield for minimum-unit investors is nearly equal to the price drop
on the ex-perk day. The number of individual shareholders is positively and the number of non-
individual shareholders is negatively associated with the premium discount of the ex-perk day
return. Finally, the average abnormal volumes around the ex-perk day are significantly positive.
Additionally, the number of individual shareholders is positively and the number of non-individual
shareholders is negatively associated with the abnormal trading volume around the ex-perk day.
These results are consistent with the Investor base hypothesis that an attractive shareholder
perk for individual investors increases the size of the individual shareholder base, decreases the
cost of capital, and increases the stock price and that special treatment provided to individual
stockholders is in the interest of current shareholders. Moreover, our findings imply that stock
returns and volumes around the ex-day are affected by the preferences of retail and non-retail
investors.
Our results suggest various avenues for future research. Much of the asset pricing literature
finds that individual and institutional investors have significantly different effects on stock prices
and trading volume (Barber and Odean (2000, 2001, 2008), Kaniel, Saar, and Titman (2008) and
Kaniel, Liu, Saar, and Titman (2012)). There may be methods of financing and defense against
takeovers that harness individual investors and/or their optimism. Further consideration of the

29
influence of individual investors on corporate finance events may therefore be warranted.
Appendix A: Matching Procedure
The matching procedure was performed as follows. First, we used a probit estimation to model the
probability of a perk’s initiation in year t conditional on the covariates observed in year t. Firms
that initiated perks (𝐴𝑑𝑜𝑝𝑡𝑖𝑜𝑛𝑡 = 1) were used in treatment observations. Next, we attached a
propensity score to each observation. The propensity score 𝑒(∙) was defined as
e(𝑋𝑡) ≡ Pr (𝐴𝑑𝑜𝑝𝑡𝑖𝑜𝑛𝑡+1 = 1|𝑋𝑡) (A1)
where 𝑋𝑡 is a vector of the covariates in the probit estimation.
Next, we implemented another set of probit estimations, including cross-terms, which were
multiplied by variables that measured the extent of firms’ external control. For each treatment
observation, we identified matched observations from the sample of firms not issuing securities.
The matched observations are those that demonstrated the closest propensity scores to a particular
treatment observation, and these were labeled control observations. It should also be noted that we
were able to use each non-treated observation more than once as a control; that is, a non-treatment
observation may have been used as a control for more than one treatment observation. Several
matching algorithms were used to find the closest control observations. As a baseline, we employed
five matches by selecting five arbitrarily determined observations whose propensity scores were
closest to each treatment observation.27
One of the benefits of a propensity-score-matching estimation is that it enables us to match
the treatment and control observations using the scalar propensity score. The propensity score,
27 We find that the results obtained using different matching algorithms (e.g., the ten nearest and the kernel matches) are similar
to those obtained using the five nearest matches.
30
which is the conditional probability of a treatment given the value of the observed characteristics,
is a useful variable to employ when using vectors of covariates of large dimensionality. Rosenbaum
and Rubin (1983) show that treatment observations and control observations with the same
propensity scores have the same distribution as the full vector of covariates. Thus, to obtain the
same covariate probability distributions for the treatment and control observations, it is sufficient
to match firms in terms of their propensity scores. We began with the baseline probit estimation,
from which we obtained the conditional probability of a firm initiating a perk in year t given the
industry (2-digit classification) and the values of the observed firm’s characteristics in year t. The
dependent binary variable represents the initiation of the perk in year t. The following explanatory
variables were used. To measure firm performance, we employed ROA, which is defined as the
operating return on total assets. Market Asset, which is defined as the natural logarithm of total
market assets, indicates the extent of asymmetric information among investors. We also used the
dividend dummy (Dividend) to represent the payout policy, Leverage to represent the risk of
bankruptcy, and Tobin’s Q to represent the firm’s value gap.
References
Amihud, Y., Mendelson, H., & Lauterbach, B. (1997). Market microstructure and securities
values: Evidence from the Tel Aviv Stock Exchange. Journal of Financial Economics,
45(3), 365-390.
Amihud, Y., Mendelson, H., & Uno, J. (1999). Number of shareholders and stock prices:
Evidence from Japan. The Journal of Finance, 54(3), 1169-1184.
Ariely, D. (2008). Predictably irrational. New York: HarperCollins.
Barber, B. M., & Odean, T. (2000). Trading is hazardous to your wealth: The common stock
investment performance of individual investors. The Journal of Finance, 55(2), 773-806.
Barber, B. M., & Odean, T. (2001). Boys will be boys: Gender, overconfidence, and common
stock investment. The Quarterly Journal of Economics, 116(1), 261-292.

31
Barber, B. M., & Odean, T. (2008). All that glitters: The effect of attention and news on the
buying behavior of individual and institutional investors. Review of Financial Studies,
21(2), 785-818.
Black, F. (1986). Noise. The Journal of Finance, 41(3), 529-543.
Beatty, R. P., & Ritter, J. R. (1986). Investment banking, reputation, and the underpricing of
initial public offerings. Journal of Financial Economics, 15(1), 213-232.
Barclay, M. J., Holderness, C. G., & Sheehan, D. P. (2007). Private placements and managerial
entrenchment. Journal of Corporate Finance, 13(4), 461-484.
Bodnaruk, A., & Östberg, P. (2013). The shareholder base and payout policy. Journal of
Financial and Quantitative Analysis, 48(03), 729-760.
Boyd, J. H., & Jagannathan, R. (1994). Ex-dividend price behavior of common stocks. Review of
Financial Studies, 7(4), 711-741.
Dhaliwal, D., & Li, O. Z. (2006). Investor Tax Heterogeneity and Ex‐Dividend Day Trading
Volume. The Journal of Finance, 61(1), 463-490.
Eades, K. M., Hess, P. J., & Kim, E. H. (1984). On interpreting security returns during the ex-
dividend period. Journal of Financial Economics, 13(1), 3-34.
Elton, E. J., & Gruber, M. J. (1970). Marginal stockholder tax rates and the clientele effect. The
Review of Economics and Statistics, 52(1), 68-74.
Fama, E. F., & French, K. R. (2001). Disappearing dividends: changing firm characteristics or
lower propensity to pay?. Journal of Financial economics, 60(1), 3-43.
Faleye, O. (2007). Classified boards, firm value, and managerial entrenchment. Journal of
Financial Economics, 83(2), 501-529.
Foerster, S. R., & Karolyi, G. A. (1999). The effects of market segmentation and investor
recognition on asset prices: Evidence from foreign stocks listing in the United States. The
Journal of Finance, 54(3), 981-1013.
Graham, J. R., & Kumar, A. (2006). Do dividend clienteles exist? Evidence on dividend
preferences of retail investors. The Journal of Finance, 61(3), 1305-1336.
Graham, J. R., Michaely, R., & Roberts, M. R. (2003). Do price discreteness and transactions
costs affect stock returns? Comparing ex-dividend pricing before and after decimalization.
The Journal of Finance, 58(6), 2611-2636.

32
Green, R. C., & Rydqvist, K. (1999). Ex-day behavior with dividend preference and limitations to
short-term arbitrage: The case of Swedish lottery bonds. Journal of Financial Economics,
53(2), 145-187.
Green, T. C., & Jame, R. (2013). Company name fluency, investor recognition, and firm value.
Journal of Financial Economics, 109(3), 813-834.
Grinstein, Y., & Michaely, R. (2005). Institutional holdings and payout policy. The Journal of
Finance, 60(3), 1389-1426.
Grossman, S. J., & Hart, O. D. (1980). Takeover bids, the free-rider problem, and the theory of
the corporation. The Bell Journal of Economics, 42-64.
Grullon, G., Kanatas, G., & Weston, J. P. (2004). Advertising, breadth of ownership, and
liquidity. Review of Financial Studies, 17(2), 439-461.
Irvine, P. J. (2003). The incremental impact of analyst initiation of coverage. Journal of
Corporate Finance, 9, 431–451.
Kadlec, G. B., & McConnell, J. J. (1994). The effect of market segmentation and illiquidity on
asset prices: Evidence from exchange listings. The Journal of Finance, 49(2), 611-636.
Kalay, A. (1982). The ex-dividend day behavior of stock prices: A re-examination of the clientele
effect. The Journal of Finance, 37(4), 1059-1070.
Kaniel, R., Liu, S., Saar, G., & Titman, S. (2012). Individual investor trading and return patterns
around earnings announcements. The Journal of Finance, 67(2), 639-680.
Kaniel, R., Saar, G., & Titman, S. (2008). Individual investor trading and stock returns. The
Journal of Finance, 63(1), 273-310.
Karpoff, J. M., & Walkling, R. A. (1988). Short-term trading around ex-dividend days: Additional
evidence. Journal of Financial Economics, 21(2), 291-298.
Karpoff, J. M., & Walkling, R. A. (1990). Dividend capture in NASDAQ stocks. Journal of
Financial Economics, 28(1), 39-65.
Kato, K., & Loewenstein, U. (1995). The ex-dividend-day behavior of stock prices: The case of
Japan. Review of Financial Studies, 8(3), 817-847.
Korkeamaki, T., Liljeblom, E., & Pasternack, D. (2010). Tax reform and payout policy: Do
shareholder clienteles or payout policy adjust?. Journal of Corporate Finance, 16(4), 572-
587.

33
Kyle, A. S. (1985). Continuous auctions and insider trading. Econometrica: Journal of the
Econometric Society, 1315-1335.
Lang, L. H., & Litzenberger, R. H. (1989). Dividend announcements: Cash flow signalling vs.
free cash flow hypothesis?. Journal of Financial Economics, 24(1), 181-191.
Lie, E. (2000). Excess funds and agency problems: an empirical study of incremental cash
disbursements. Review of Financial Studies, 13(1), 219-248.
Lou, D. (2014). Attracting investor attention through advertising. Review of Financial Studies,
27(6), 1797-1829.
McConnell, J. J., & Servaes, H. (1990). Additional evidence on equity ownership and corporate
value. Journal of Financial economics, 27(2), 595-612.
Merton, R. C. (1987). A simple model of capital market equilibrium with incomplete information.
The Journal of Finance, 42(3), 483-510.
Michaely, R. (1991). Ex‐Dividend Day Stock Price Behavior: The Case of the 1986 Tax Reform
Act. The Journal of Finance, 46(3), 845-859.
Michaely, R., Thaler, R. H., & Womack, K. L. (1995). Price reactions to dividend initiations and
omissions: Overreaction or drift? The Journal of Finance, 50(2), 573-608.
Michaely, R., & Vila, J. L. (1995). Investors' heterogeneity, prices, and volume around the ex-
dividend day. Journal of Financial and Quantitative Analysis, 30(02), 171-198.
Michaely, R., & Vila, J. L. (1996). Trading volume with private valuation: Evidence from the ex-
dividend day. Review of Financial Studies, 9(2), 471-509.
Morck, R., Shleifer, A., & Vishny, R. W. (1988). Management ownership and market valuation:
An empirical analysis. Journal of Financial Economics, 20, 293-315.
Pastor, L., & Stambaugh, R. F. (2003). Liquidity risk and expected stock returns. Journal of
Political Economy, 111, 642-685
Rock, K. (1986). Why new issues are underpriced. Journal of Financial Economics, 15(1), 187-
212.
Rantapuska, E. (2008). Ex-dividend day trading: Who, how, and why?: Evidence from the
Finnish market. Journal of Financial Economics, 88(2), 355-374.
Rosenbaum, P. R., & Rubin, D. B. (1983). The central role of the propensity score in
observational studies for causal effects. Biometrika, 70(1), 41-55.

34
Seida, J. A., (2001), Evidence of tax-clientele-related trading following dividend increases,
Journal of the American Taxation Association, 23, 1–21.
Shleifer, A., & Vishny, R. W. (1986). Large shareholders and corporate control. The Journal of
Political Economy, 461-488.
Stulz, R. (1988). Managerial control of voting rights: Financing policies and the market for
corporate control. Journal of Financial Economics, 20, 25-54.
Tirole, J. (2005). The theory of corporate finance. Princeton University Press.

35
Figure 1. Number and percentage of firms with shareholder perks

36
Table 1.
Summary statistics
This table provides the summary statistics for our sample. The sample consists of 27,196 firm-year observations from 2001 to 2011. The first column shows the summary statistics for the total sample. The second and third columns show the summary statistics for the initiation and the non-initiation of shareholder perks subsamples. # of individual shareholders is the number of individual shareholders. # of institutional shareholders is the number of institutional shareholders. # of non-individual shareholders is the number of non-individual shareholders. Individual shareholder ratio is defined as the number of individual shareholders over the total number of shareholders. Individual ownership is the total ownership of individual shareholders minus the ownership of the individual shareholders who are Top 10 shareholders. Institutional ownership is the total ownership of institutional shareholders. Top 10 ownership is the sum of the top 10 shareholders' ownership. Board ownership is the sum of the board members’ ownership. % of outside directors is the number of outside directors divided by the total number of board members. Anti-takeover is a dummy variable that is equal to one if the firm adopts an anti-takeover defense and zero otherwise. Market Asset is the sum of the market capitalization at the closing price of the previous fiscal year end and the debt book value of the firm from the previous fiscal year. Leverage is the sum of short- and long-term leverage over the book assets of the previous fiscal year. ROA is the operating profit over the book assets of the previous fiscal year. Excess Cash is the residual from regressing cash holdings on firm-specific characteristics and represents the firm’s excess cash holdings. TobinQ is the sum of market capitalization and book debt over book assets. Dividend is a dummy variable that is equal to one if a firm pays a dividend and zero otherwise. B-to-C company is a dummy variable that is equal to one if the firm is a business-to-consumer company and zero otherwise. Statistical significance levels are based on cross-sectional t-statistics. * and *** indicate significance at the 10% and 1% levels, respectively, in two-tailed tests.
Mean MedianMean
(A)Median
Mean
(B)Median
Number of shareholders
# of total shareholders 10,769 3,069 7,564 2,088 10,834 3,098 -3,269 -1.74 *
# of individual shareholders 10,483 2,887 7,317 1,923 10,547 2,920 -3,230 -1.74 *
# of non-individual shareholders 286 137 247 111 287 138 -39.3 -1.62
Individual shareholder ratio 0.941 0.955 0.929 0.946 0.941 0.955 -0.012 -5.60 ***
Ownership & Governance
Individual ownership 0.320 0.313 0.278 0.266 0.321 0.314 -0.04 -10.62 ***
Top 10 ownership 0.540 0.530 0.584 0.589 0.539 0.528 0.04 3.98 ***
Institutional ownership 0.196 0.166 0.177 0.149 0.197 0.167 -0.02 -3.26 ***
Board ownership 0.091 0.017 0.160 0.092 0.089 0.017 0.07 11.66 ***
% of outside director 0.262 0.250 0.263 0.250 0.262 0.250 0.00 0.29
Anti-takeover 0.058 0.000 0.028 0.000 0.059 0.000 -0.03 -3.08 ***
Other characteristics
Market Asset (million yen) 226,333 26,093 156,536 27,032 227,758 26,078 -71,222 -1.45
Leverage 0.214 0.180 0.213 0.178 0.215 0.180 0.00 -0.16
ROA 0.044 0.040 0.067 0.059 0.043 0.039 0.02 8.03 ***
Excess Cash 0.003 -0.009 0.002 -0.009 0.003 -0.009 0.00 -0.21
TobinQ 1.168 0.963 1.387 1.051 1.164 0.962 0.22 6.60 ***
Dividend 0.804 1.000 0.875 1.000 0.802 1.000 0.07 4.22 ***
B-to-C company 0.304 0.000 0.548 1.000 0.299 0.000 0.25 12.55 ***
Observations
Diff
(A) - (B)t-statistics
27,196 544 26,652
Total sample Initiation sampleNon-initiation
sample

37
Table 2.
Logistic regression of the determinants of perk initiation
This table shows the results for the logistic regression of the determinants of perk initiation. The dependent variable is the initiation dummy variable, which is equal to one if a firm initiates a perk during the fiscal year and zero otherwise. The independent variables are as follows: ln(# of individual shareholders) is the natural logarithm of the number of individual shareholders. Individual shareholder ratio is defined as the number of individual shareholders to the total number of shareholders. Individual ownership is the total ownership of individual shareholders minus the ownership of individual shareholders who are Top 10 shareholders. Institutional ownership is the total ownership of institutional shareholders. Board ownership is the sum of the board members’ ownership. % of outside directors is the number of outside directors divided by the total number of board members. Anti-takeover is a dummy variable that is equal to one if the firm adopts an anti-takeover defense and zero otherwise. Market Asset is the sum of the market capitalization at the closing price of the previous fiscal year end and the debt book value of the firm from the previous fiscal year. Leverage is the sum of short- and long-term leverage over the book assets of the previous fiscal year. ROA is the operating profit over the book assets of the previous fiscal year. Excess cash is the residual from regressing cash holdings on firm-specific characteristics and represents the firm’s excess cash holdings. TobinQ is the sum of the market capitalization and book debt over the book assets. Dividend is a dummy variable that is equal to one if a firm pays a dividend and zero otherwise. B-to-C company is a dummy variable that is equal to one if the firm is a business-to-commerce company and zero otherwise. We use industry dummy variables and year dummy variables.*, **, and *** indicate statistical significance at the 0.1, 0.05, and 0.01 levels, respectively.

38
(N = 27,196) Model 1 Model 2 Model 3 Model 4 Model 5 Model 6
ln(# of individual shareholders) -0.31*** -0.36*** -0.26*** -0.28***
(-5.33) (-5.91) (-4.26) (-4.33)
ln(# of non-individual shareholders) 0.23** 0.11
(2.07) (0.95)
Individual shareholder ratio -2.89*** -1.94***
(-4.84) (-2.96)
Individual ownership -0.29 -0.29 -0.89** -0.10 -0.10 -0.67
(-0.64) (-0.64) (-2.19) (-0.21) (-0.23) (-1.55)
Institutional ownership -0.06 -0.28 -0.30 -0.11 -0.22 -0.31
(-0.13) (-0.64) (-0.70) (-0.26) (-0.49) (-0.70)
Board ownership 1.86*** 1.94*** 1.91*** 1.91*** 1.95*** 1.92***
(5.98) (6.14) (6.17) (5.83) (5.86) (5.92)
% of outside director 0.40 0.39 0.19 0.47 0.47 0.28
(1.16) (1.12) (0.56) (1.35) (1.34) (0.80)
Anti-takeover -0.03 -0.03 -0.02 -0.03 -0.03 -0.02
(-0.10) (-0.11) (-0.06) (-0.11) (-0.11) (-0.08)
B-to-C Company 0.92*** 0.93*** 0.87*** 0.55*** 0.55*** 0.51**
(9.27) (9.34) (8.80) (2.59) (2.61) (2.41)
ln(Market Asset) 0.26*** 0.17** 0.06 0.24*** 0.20*** 0.07*
(4.46) (2.34) (1.47) (3.91) (2.62) (1.70)
ROA 2.07** 2.22** 2.35*** 2.34** 2.41** 2.54***
(2.29) (2.44) (2.67) (2.40) (2.46) (2.68)
Excess Cash -0.68* -0.70* -0.74** -0.74* -0.75* -0.80**
(-1.82) (-1.88) (-2.00) (-1.86) (-1.89) (-2.05)
Leverage -0.01 0.12 0.20 -0.04 0.02 0.12
(-0.05) (0.46) (0.80) (-0.12) (0.07) (0.40)
TobinQ -0.11 -0.09 -0.11* -0.06 -0.06 -0.07
(-1.63) (-1.37) (-1.68) (-0.96) (-0.85) (-0.99)
Dividend 0.19 0.22 0.28* 0.19 0.20 0.27*
(1.24) (1.40) (1.82) (1.22) (1.28) (1.71)
Year indicators Yes Yes Yes Yes Yes Yes
Industry indicators No No No Yes Yes Yes
Constant -5.14*** -4.98*** -2.58*** -3.82*** -3.75*** -2.10***
(-11.06) (-10.56) (-4.26) (-7.08) (-6.92) (-3.01)
Pseudo R2 0.069 0.069 0.067 0.097 0.097 0.095

39
Table 3. Difference in differences test of ownership and operating performance
This table shows the difference in differences estimator for the number of shareholders, ownership and operating performance variables around perk initiation. The sample consists of 536 perk initiation firms from 2001 to 2011. T is the fiscal period immediately before perk initiation. T+2 and T+3 are fiscal periods of two and three years after the perk initiation, respectively. # of individual shareholders is the number of individual shareholders. # of non-individual shareholders is the number of non-individual shareholders. Individual shareholder ratio is defined as the number of individual shareholder to the total number of shareholders. Individual ownership is the total ownership of individual shareholders minus the ownership of individual shareholders who are Top 10 shareholders. Institutional ownership is the total ownership of institutional shareholders. Board ownership is the sum of the board members’ ownership. Individual ownership per individual shareholder is defined as the individual ownership divided by the number of individual shareholders. ROA is operating profits on book assets. ROS is operating profits on sales. SOA is sales on book assets. Statistical significance levels are based on t-statistics. ** and *** indicate significance at the 5% and 1% levels, respectively, in two-tailed tests.

40
Difference
periodTreatment Control DID N
Number of shareholders
# of individual shareholders (T+2) - T 2,064 -170 1,917 6.19 *** 536
(T+3) - T 3,500 979 2,937 4.25 *** 522
# of non-individual shareholders (T+2) - T 11 -11 22 3.79 *** 536
(T+3) - T 16 -1 17 2.43 ** 522
(T+2) - T 0.545 0.088 0.458 13.69 *** 536
(T+3) - T 0.693 0.137 0.556 14.42 *** 522
(T+2) - T 0.098 -0.010 0.108 6.30 *** 536
(T+3) - T 0.101 -0.039 0.139 6.18 *** 522
(T+2) - T 0.021 0.003 0.018 6.83 *** 536
(T+3) - T 0.029 0.005 0.024 9.57 *** 522
Ownership
(T+2) - T 0.018 0.007 0.011 2.60 *** 536
(T+3) - T 0.029 0.014 0.015 3.45 *** 522
Institutional ownership (T+2) - T -0.008 -0.007 -0.001 -0.41 536
(T+3) - T -0.013 -0.013 0.000 0.11 522
Board ownership (T+2) - T -0.021 -0.017 -0.004 -1.26 536
(T+3) - T -0.033 -0.024 -0.009 -2.28 ** 522
(T+2) - T -0.089 -0.009 -0.794 -7.86 *** 536
(T+3) - T -0.103 -0.011 -0.944 -8.75 *** 522
Firm performance
ROA (T+2) - T -0.011 -0.014 0.003 0.65 536
(T+3) - T -0.017 -0.017 0.000 0.09 522
ROS (T+2) - T -0.010 -0.013 0.003 0.68 536
(T+3) - T -0.019 -0.019 0.000 -0.03 522
(T+2) - T 0.022 0.034 -0.012 -0.67 536
(T+3) - T 0.016 0.043 -0.027 -1.36 522
(T+2) - T -0.020 -0.019 -0.001 -0.11 199
(T+3) - T -0.030 -0.027 -0.002 -0.42 193
(T+2) - T -0.017 -0.013 -0.004 -0.46 199
(T+3) - T -0.024 -0.022 -0.003 -0.34 193
(T+2) - T 0.034 0.047 -0.012 -0.29 199
(T+3) - T 0.012 0.025 -0.013 -0.41 193
t-stat
Individual ownership
Individual shareholder ratio
ln(# of individual shareholders)
ln(# of non-individual shareholders)
Individual ownership per individual
shareholder (x 10,000)
SOA of B-to-C company that uses own
product as a perk
ROA of B-to-C company that uses own
product as a perk
ROS of B-to-C company that uses own
product as a perk
SOA

41
Table 4. Summary statistics for the announcement return
This table shows the mean abnormal returns and cumulative abnormal returns around announcement day and summary statistics for the 307 perk initiations sample from 2001 to 2011. AR is abnormal returns. CAR is cumulative abnormal returns. AD is the announcement day. Statistical significance levels of the mean abnormal returns are based on cross-sectional t-statistics. *, **, and *** indicate significance at the 10%, 5%, and 1% levels, respectively, in two-tailed tests.
(N=307) t-statistics Median # of positive % of positive
AR[AD-5] 0.004 0.03 -0.049 148 48.2%
AR[AD-4] -0.378 ** -2.44 -0.207 135 44.0%
AR[AD-3] 0.012 0.08 -0.048 139 45.3%
AR[AD-2] 0.228 1.44 0.024 156 50.8%
AR[AD-1] 0.491 ** 2.36 0.169 165 53.7%
AR[AD] 1.205 *** 4.69 0.456 186 60.6%
AR[AD+1] 0.365 * 1.86 0.136 168 54.7%
AR[AD+2] 0.212 1.17 -0.024 153 49.8%
AR[AD+3] 0.502 *** 2.62 -0.003 153 49.8%
AR[AD+4] -0.011 -0.07 -0.203 131 42.7%
AR[AD+5] 0.212 1.05 -0.160 135 44.0%
CAR[-5,-2] -0.133 -0.39 -0.162 141 45.9%
CAR[-1,+1] 2.061 *** 5.02 1.079 190 61.9%
CAR[+2,+5] 0.915 ** 2.14 0.108 157 51.1%
CAR[-5,+5] 2.843 *** 3.68 1.099 173 56.4%
Mean

42
Table 5. OLS regression of the cumulative abnormal return around the announcement day of perk
initiation
This table shows the summary statistics and the results for an ordinary least squares regression of cumulative abnormal returns around the announcement day. Panel A shows summary statistics for the sample. Panel B shows the ordinary least squares regression of cumulative abnormal returns around the announcement. The dependent variable is the three-day cumulative abnormal returns around the time of the perk announcement. The independent variables are as follows. IR_IND and IR_NON_IND denote increasing ratios for the number of individual and institutional investors, respectively, from the fiscal year prior to the perk announcement to the second fiscal year end after the perk announcement. ΔIndividual shareholder ratio is the difference in the individual shareholder ratio from the fiscal period immediately before perk initiation to the fiscal period two years after perk initiation. Individual ownership is the total ownership of individual shareholders minus the ownership of the individual shareholders who are Top 10 shareholders. Board ownership is the sum of the board members’ ownership. B-to-C company is a dummy variable that is equal to one if the firm is a business-to-commerce company and zero otherwise. OWN is a dummy variable that is equal to one if a B-to-C company uses its products as shareholder perks and zero otherwise. Market Asset is the sum of the market capitalization at the closing price of the previous fiscal year end and the debt book value of the firm from the previous fiscal year. Leverage is the sum of short- and long-term leverage over the book assets of the previous fiscal year. ROA is the operating profit over the book assets of the previous fiscal year. TobinQ is the sum of market capitalization and book debt over book assets. Heteroskedasticity-adjusted t-statistics are presented in parentheses below the regression coefficients. *, **, and *** indicate statistical significance at the 10%, 5% and 1% levels, respectively.
Panel A: Summary statistics of the announcement sample
(N = 307) Mean Median Std.dev10th
percentile
90th
percentile
IR_IND 1.335 0.408 2.523 -0.117 3.553
IR_NON_IND 0.174 0.059 0.486 -0.182 0.660
Δindividual shareholder ratio 0.022 0.013 0.042 -0.006 0.054
Individual ownership 0.278 0.266 0.140 0.110 0.449
Board ownership 0.169 0.096 0.200 0.002 0.472
B-to-C Company 0.577 1.000 0.495 0.000 1.000
OWN 0.362 0.000 0.481 0.000 1.000
Market Asset 139,357 39,251 304,916 9,330 353,194
Leverage 0.207 0.177 0.184 0.000 0.463
ROA 0.072 0.059 0.067 0.018 0.149
TobinQ 1.511 1.055 1.512 0.799 2.396

Panel B. OLS regression of the CAR
(N = 307) Model 1 Model 2 Model 3 Model 4 Model 5 Model 6
IR_IND 0.40** 0.54*** 0.54***
(2.39) (3.00) (3.03)
IR_NON_IND -0.66 -1.57** -1.57**
(-0.88) (-2.16) (-2.14)
Δindividual shareholder ratio 24.38** 24.17**
(2.17) (2.16)
Individual ownership 4.24 3.08 4.64 4.25 4.64 4.24
(1.05) (0.77) (1.17) (1.06) (1.16) (1.05)
Institutional ownership -8.40** -10.24** -9.52** -8.75** -9.53** -8.70**
(-2.06) (-2.51) (-2.34) (-2.12) (-2.32) (-2.10)
Board ownership -3.49 -3.58 -3.66 -3.38 -3.67 -3.30
(-1.08) (-1.16) (-1.17) (-1.07) (-1.14) (-1.02)
B-to-C company 0.46 0.29 0.32 0.45 0.31 0.63
(0.55) (0.34) (0.39) (0.54) (0.34) (0.68)
OWN 0.02 -0.29
(0.02) (-0.25)
ln(Market Asset) -0.47 -0.48 -0.43 -0.49 -0.43 -0.48
(-1.45) (-1.49) (-1.33) (-1.50) (-1.32) (-1.48)
Leverage 3.68* 3.56 3.64* 3.89* 3.64* 3.90*
(1.70) (1.64) (1.69) (1.80) (1.68) (1.80)
ROA -0.25 1.54 0.41 0.58 0.44 0.24
(-0.02) (0.14) (0.04) (0.05) (0.04) (0.02)
TobinQ 0.36 0.46 0.42 0.46 0.42 0.46
(0.49) (0.65) (0.58) (0.64) (0.58) (0.65)
Constant 5.96 7.21* 5.68 5.95 5.68 5.91
(1.43) (1.75) (1.37) (1.43) (1.36) (1.41)
Adjusted R-squared 0.057 0.041 0.067 0.049 0.064 0.046

34
Table 6. Changes in the cost of capital
This table reports the difference in the abnormal return of the following time-series regression, which was run for each perk initiation firm for t from month -24 to month -2 prior to the perk initiation declaration month and from month +2 to month +24 after the initiation declaration month:
𝑟𝑖,𝑡 − 𝑟𝑓,𝑡 = 𝛼𝑖,0 + 𝛼𝑖,1𝐷𝑡 + (𝛽𝑖,0 + 𝛽𝑖,1𝐷𝑡)(𝑟𝑚,𝑡 − 𝑟𝑓,𝑡) + (𝛾𝑖,0 + 𝛾𝑖,1𝐷𝑡)𝑆𝑀𝐵𝑡 + (𝛿𝑖,0 + 𝛿𝑖,1𝐷𝑡)𝐻𝑀𝐿𝑡 + (𝜎𝑖,0 + 𝜎𝑖,1𝐷𝑡)𝐿𝐼𝑄𝑡 + 휀𝑖,𝑡 where Dt = 1 if t is in the post-adoption period, and Dt = 0 otherwise. αi,0 is the pre-adoption abnormal return, and αi,1 is the difference between the post- and the pre-adoption abnormal returns. βi,1, i,1, i,1, and σi,1 are, respectively, the differences between the post- and the pre-adoption betas of the market portfolio, SMB, HML and LIQ factor (FF 3/LIQ model). The table also shows the difference between the post- and pre-adoption abnormal returns by using FF3-factor (rm – rf, SMB and HML) and one-factor (rm – rf) models. The table shows the αi for the total sample and the individual groups divided by Δλ quartiles.
∆𝜆 = [(𝑅𝑉𝐴𝑅𝑝𝑜𝑠𝑡 ∗ 𝑅𝐸𝐿𝐶𝐴𝑃𝑝𝑜𝑠𝑡
𝑁𝐼𝑁𝐷𝑝𝑜𝑠𝑡
) − (𝑅𝑉𝐴𝑅𝑝𝑟𝑒 ∗ 𝑅𝐸𝐿𝐶𝐴𝑃𝑝𝑟𝑒
𝑁𝐼𝑁𝐷𝑝𝑟𝑒
)] ∗ 1,000,000
NINDpre and NINDpost are the number of individual shareholders at the end of the most recent fiscal year prior to the perk initiation announcement date and at the second fiscal year end after the announcement date, respectively. RVARpre and RVARpost are the stock’s residual variance calculated from the daily date in the interval [-150, -11] prior to the announcement date and in the interval [11, 150] following the second fiscal year end after the announcement date, respectively. RELCAPpre and RELCAPpost are the firm’s market capitalization divided by the sum of the market capitalization of all stocks available on the NPM portfolio master data base, calculated at the end of the month previous to the announcement date and the second fiscal year end following the announcement date, respectively. IR_IND is the increasing ratio of the number of individual and institutional investors from the fiscal year prior to the perk announcement to the second fiscal year end after the perk announcement. ΔIndividual shareholder ratio is the difference in the individual shareholder ratio from the fiscal period immediately before perk initiation to the fiscal period two years after perk initiation. t-statistics with autoregressive error correction standard errors (where errors are deviations from the means) are presented in parentheses. *, **, and *** indicate statistical significance at the 10%, 5% and 1% levels, respectively.

45
Total sample 307 -0.019 1.335 0.020 -0.890*** (-2.58) -1.405*** (-4.38) -0.635** (-2.14)
Δλ quartile
Quartile 1 (least Δλ ) 77 -0.079 3.178 0.044 -4.394*** (-6.37) -4.745*** (-6.58) -3.349*** (-5.41)
Quartile 2 77 -0.012 1.594 0.023 -0.615 (-0.87) -1.337** (-2.08) -1.144* (-1.85)
Quartile 3 77 -0.001 0.349 0.009 0.303 (0.48) -0.556 (-1.13) 0.662 (1.43)
Quartile 4 (Most Δλ ) 76 0.015 0.204 0.006 1.171** (2.10) 1.051** (2.12) 1.318** (2.55)
Quartile 4 - Quartile 1 5.565*** (-6.26) 5.795*** (6.60) 4.667*** (5.78)
N
α 1
FF3/LIQ model FF3 model CAPM
Mean
Δλ
Mean
IR_IND
Mean
ΔIndividual
shareholder
ratio

34
Table 7. OLS regression of the changes in the cost of capital
This table shows the results for ordinary least squares regressions of the change in the cost of capital around perk initiation. The dependent variable αi,1 is the difference between post- and pre-adoption abnormal returns. The independent variables are as follows. Δλ is defined in Table 6. IR_IND and IR_NON_IND denote increasing ratios for the number of individual and institutional investors, respectively, from the fiscal year prior to the perk announcement to the second fiscal year end after the perk announcement. ΔIndividual shareholder ratio is the difference in the individual shareholder ratio from the fiscal period immediately before perk initiation to the fiscal period two years after perk initiation. B-to-C company is a dummy variable that is equal to one if the firm is a business-to-commerce company and zero otherwise. Market Asset is the sum of the market capitalization at the closing price of the previous fiscal year end and the debt book value of the firm from the previous fiscal year. Unsystematic risk is the mean square error computed as the deviation of the stock price from the value predicted by the market model for the period from -150 days to -11 days before the announcement day. Leverage is the sum of short- and long-term leverage over the book assets of the previous fiscal year. ROA is the operating profit over the book assets of the previous fiscal year. TobinQ is the sum of market capitalization and book debt over book assets. Heteroskedasticity-adjusted t-statistics are presented in parentheses below the regression coefficients. *, ** and *** indicate statistical significance at the 10%, 5% and 1% levels, respectively.
Model 1 Model 2 Model 3 Model 4 Model 5
Δλ 28.08***
(3.90)
IR_IND -0.52*** -0.41***
(-4.08) (-3.19)
IR_NON_IND -1.23*
(-1.87)
ΔIndividual investor ratio -19.59**
(-2.39)
B-to-C company 0.85 1.03* 0.90 0.82 0.85
(1.46) (1.84) (1.58) (1.42) (1.47)
ln(Market Asset) -0.80*** -0.67*** -0.86*** -0.87*** -0.81***
(-3.56) (-3.10) (-3.95) (-3.96) (-3.61)
Unsystematic risk -0.25*** -0.26*** -0.26*** -0.26*** -0.25***
(-3.21) (-3.46) (-3.43) (-3.37) (-3.28)
Leverage -17.08** -14.86** -14.81** -0.98 -1.09
(-2.55) (-2.47) (-2.38) (-0.48) (-0.52)
ROA -0.96 -0.79 -0.88 -14.63** -16.41**
(-0.46) (-0.38) (-0.42) (-2.36) (-2.52)
TobinQ 0.11 0.36 0.25 0.30 0.10
(0.23) (0.85) (0.57) (0.69) (0.23)
Constant 11.55*** 10.05*** 12.66*** 12.71*** 12.15***
(4.24) (3.83) (4.71) (4.73) (4.43)
Observations 307 307 307 307 307
Adjusted R-squared 0.154 0.213 0.198 0.207 0.161

47
Table 8. Summary statistics of ex-day return, perk yield, and perk premium
This table shows the summary statistics of the perk yield, the dividend yield, the ex-day return and the ex-day perk discount. The sample consists of 3,279 ex-perk day firms from 2001 to 2011. Columns 1, 2, and 3 show the summary statistics for the total ex-perk day sample, the only ex-perk-day sample and a simultaneous ex-day sample, respectively. Column 4 shows the summary statistics of the only ex-dividend-day sample. Return[Ex-day] is the raw return on ex-day. PYretail is the perk yield for minimum-unit investors. PYtotal is the perk yield based on the total number of outstanding shares. DY is the dividend yield. Total yield is the sum of PYretail and DY. Discount is the level of the perk premium on the ex-perk day for minimum-unit investors. t-statistics, presented below the coefficients, are the t-statistics for the mean difference from zero. *, ** and *** indicate statistical significance at the 10%, 5% and 1% levels, respectively.
Total Only perkPerk and
Dividend
Return[Ex-day] Mean -0.030 -0.042 -0.028 -0.010
Median -0.023 -0.036 -0.022 -0.009
PY retail Mean 0.020 0.041 0.016
Median 0.012 0.026 0.010
PY total Mean 0.001 0.004 0.001
Median 0.001 0.003 0.001
DY Mean 0.013 0.000 0.015 0.016
Median 0.011 0.000 0.012 0.013
Total yield Mean 0.033 0.041 0.031 0.016
Median 0.026 0.026 0.025 0.013
Premium Mean 0.284*** 0.643*** 0.229***
t-statistics 4.426 5.604 3.189
N 3,279 435 2,844 21,631
Ex-perk day sample
Only dividend
sample

48
Table 9. OLS regression of the perk discount on ex-perk day
This table shows the results for the ordinary least squares regression of the discount for minimum-unit investors. Panel A shows the summary statistics for the total ex-perk day sample. Panel B shows the results of the OLS regression of the perk discount on the ex-perk day. The dependent variable is Discount, which is the level of the perk premium on the ex-perk day for minimum-unit investors. The independent variables are as follows. ln(# of individual shareholders) is the natural logarithm of the number of individual shareholders. ln(# of non-individual shareholders) is the natural logarithm of the number of non-individual shareholders. Individual shareholder ratio is defined as the number of individual shareholders to the total number of shareholders. Individual ownership is the total ownership of individual shareholders minus the ownership of the individual shareholders who are Top 10 shareholders. Capitalization is market capitalization as of the last day of the previous month. Systematic risk is estimated using data from the market model, in which the estimation window is 140 days, running from -150 to -11 days from ex-day. Unsystematic risk is the residual of the market model, in which the estimation window is 140 days, from -150 to -11, scaled by the market variance in the same time period. Only perk dummy is a dummy variable that is equal to one if a firm pays only a perk and zero otherwise. B-to-C company is a dummy variable that is equal to one if the firm is a business-to-commerce company and zero otherwise. Gift card dummy is a dummy variable that is equal to one if the firm offers a gift-card-type perk (high liquidity perk) and zero otherwise. Heteroskedasticity-adjusted t-statistics are presented in parentheses below the regression coefficients. *, **, and *** indicate statistical significance at the 10%, 5% and 1% levels, respectively.
Panel A. Summary statistics of the ex-perk day sample
(N = 3,279) Mean Median Std.dev10th
percentile
90th
percentile
# of individual shareholders 7,041 3,403 13,052 659 14,430
# of non individual shareholders 227 144 302 46 483
Individual shareholder ratio 0.94 0.96 0.06 0.89 0.99
Capitalization (million yen) 44,808 10,560 136,859 2,239 102,295
Systematic risk 1.39 1.15 0.64 0.89 2.96
Unsystematic risk 1.69 1.48 0.98 0.80 2.84
Only perk dummy 0.13 0.00 0.34 0.00 1.00
Gift card dummy 0.16 0.00 0.36 0.00 1.00

49
Panel B. OLS regression results of the discount
Model 1 Model 2 Model 3 Model 4 Model 5
ln(# of individual shareholders) 0.42*** 0.49***
(5.31) (6.08)
ln(# of non individual shareholders) -0.23* -0.44***
(-1.78) (-3.34)
Individual investor ratio 7.07***
(5.43)
PY retail -21.99*** -27.63*** -21.20*** -27.05*** -24.69***
(-11.24) (-13.74) (-10.93) (-13.50) (-12.40)
DY 9.36 2.84 9.78 2.56 1.00
(1.22) (0.36) (1.27) (0.33) (0.13)
Gift card dummy -0.47*** -0.70*** -0.35*** -0.51*** -0.48***
(-7.80) (-9.13) (-3.80) (-5.23) (-8.01)
ln(Capitalization) -0.16 -0.22 -0.18 -0.26 -0.25
(-0.78) (-1.06) (-0.87) (-1.26) (-1.25)
Systematic risk -0.35* -0.61*** -0.32 -0.60*** -0.62***
(-1.80) (-3.08) (-1.64) (-3.02) (-3.09)
Unsystematic risk -0.02 0.08 -0.05 0.05 0.02
(-0.30) (0.97) (-0.58) (0.62) (0.29)
Only perk dummy 0.44** 0.07 0.54*** 0.21 0.22
(2.12) (0.35) (2.58) (0.97) (1.06)
B-to-C company 0.22 0.20 0.19 0.14 0.18
(1.64) (1.51) (1.42) (1.08) (1.38)
Constant 5.10*** 4.10*** 5.09*** 3.93*** -1.18
(7.77) (6.07) (7.76) (5.83) (-0.89)
Observations 3,279 3,279 3,279 3,279 3,279
Adjusted R-squared 0.051 0.058 0.051 0.061 0.061

50
Table 10. Abnormal return and abnormal volume around the ex-day
This table shows the mean abnormal volume (AV) and the mean average abnormal volume (AAV) around ex-perk day. Columns 1, 2, and 3 show the summary statistics for the total ex-perk day sample, the only ex-perk-day sample and a simultaneous ex-day sample, respectively. The statistical significance levels of the mean AV and AAV are based on cross-sectional t-statistics. *, **, and *** indicate significance at the 10%, 5%, and 1% levels, respectively, in two-tailed tests.
t-stat t-stat t-stat
AV
Ex-day -5 0.380 *** 14.77 0.397 *** 5.05 0.377 *** 13.91
Ex-day -4 0.424 *** 16.27 0.408 *** 5.24 0.426 *** 15.46
Ex-day -3 0.565 *** 19.30 0.630 *** 7.28 0.555 *** 17.88
Ex-day -2 0.870 *** 25.45 0.968 *** 10.02 0.855 *** 23.41
Ex-day -1 2.259 *** 32.25 2.502 *** 12.51 2.221 *** 29.73
Ex-day 0 1.115 *** 25.14 1.395 *** 10.11 1.072 *** 23.04
Ex-day 1 0.238 *** 10.59 0.372 *** 4.78 0.218 *** 9.45
Ex-day 2 0.073 *** 3.74 0.121 * 1.91 0.065 *** 3.23
Ex-day 3 0.051 *** 2.61 0.032 0.54 0.053 *** 2.62
Ex-day 4 0.013 0.69 0.012 0.20 0.013 0.67
Ex-day 5 0.037 * 1.78 0.118 1.56 0.024 1.17
AAV
Ex-day[-5,-1] 0.899 *** 31.88 0.981 *** 12.02 0.887 *** 29.53
Ex-day[-1,+1] 1.204 *** 30.27 1.423 *** 11.62 1.170 *** 27.98
Ex-day[+1,+5] 0.082 *** 5.54 0.131 ** 2.53 0.075 *** 4.93
Ex-day[-5,+5] 0.548 *** 26.56 0.633 *** 10.07 0.535 *** 24.59
N 3,279 435 2,844
Total Only perk Perk and dividend
AV/AAV AV/AAV AV/AAV