Embed Size (px)
Citation preview

Growth Model for School Accountability 2015/16 Technical Report July 2017
Prepared for the New York State Education Department
by Education Analytics, Inc. under contract C-012798

New York State Education Department 2015/16 Growth Model for Institutional Accountability
Technical Report
www.nysed.gov Page 2
Contents Introduction .......................................................................................................................... 4
Content and Organization of This Report ................................................................................... 4
Data ...................................................................................................................................... 4
Test Scores................................................................................................................................... 5
School Attribution ....................................................................................................................... 6
Model ................................................................................................................................... 7
Covariate Adjustment Model ...................................................................................................... 7
Accounting for Measurement Variance in the Predictor Variables ............................................ 8
Specification for MGP Model for Grades 4–8 ............................................................................. 9
Student Growth Percentiles ........................................................................................................ 9
Mean Growth Percentiles ......................................................................................................... 12
Combining Student Growth Percentiles Across Grades and Subjects ...................................... 13
Reporting ............................................................................................................................ 13
Results ................................................................................................................................ 14
Model Fit Statistics for Grades 4–8 ........................................................................................... 14
Student Growth Percentiles for Grades 4–8 ............................................................................. 14
Reliability of Unadjusted MGPs ................................................................................................. 15
Neutrality of Unadjusted MGPs ................................................................................................ 16
References .......................................................................................................................... 18
Appendix A. Model Coefficients ........................................................................................... 19

New York State Education Department 2015/16 Growth Model for Institutional Accountability
Technical Report
www.nysed.gov Page 3
Figures Figure 1. Conditional Standard Error of Measurement Plot (Grade 8 ELA, 2015/16) .................... 8
Figure 2. Sample Growth Percentile from Model ......................................................................... 11
Figure 3. Sample Growth Percentile from Model ......................................................................... 12
Tables Table 1. Prior Year Same Subject Test Scores Included .................................................................. 6
Table 2. Grades 4-8 School-Student Attribution Rates ................................................................... 6
Table 3. Grades 4-8 Reporting Rates ............................................................................................ 14
Table 4. Grades 4–8 Unadjusted Model Pseudo R-Squared Values by Grade and Subject ......... 14
Table 5. Grades 4–8 Unadjusted Model Correlation Between SGP and Prior-Year Scale Score .. 15
Table 6. Grades 4–8 Unadjusted Model Mean Standard Errors, Standard Deviation, and Value of
𝜌 by Grade for Schools .................................................................................................................. 15
Table 7. Grades 4–8 Unadjusted Model School MGPs Above or Below the Mean at a 95%
Confidence Level ........................................................................................................................... 16
Table 8. Correlation Between Unadjusted Overall MGP and Average Prior Achievement Across
Grades and Subjects...................................................................................................................... 16
Table 9. Grade 4 ELA Unadjusted Model Coefficients .................................................................. 19
Table 10. Grade 5 ELA Unadjusted Model Coefficients ................................................................ 19
Table 11. Grade 6 ELA Unadjusted Model Coefficients ................................................................ 19
Table 12. Grade 7 ELA Unadjusted Model Coefficients ................................................................ 20
Table 13. Grade 8 ELA Unadjusted Model Coefficients ................................................................ 20
Table 14. Grade 4 Mathematics Unadjusted Model Coefficients ................................................ 20
Table 15. Grade 5 Mathematics Unadjusted Model Coefficients ................................................ 20
Table 16. Grade 6 Mathematics Unadjusted Model Coefficients ................................................ 21
Table 17. Grade 7 Mathematics Unadjusted Model Coefficients ................................................ 21
Table 18. Grade 8 Mathematics Unadjusted Model Coefficients ................................................ 21
New York State Education Department 2015/16 Growth Model for Institutional Accountability
Technical Report
www.nysed.gov Page 4
Introduction The New York State Education Department (NYSED) reports unadjusted growth scores that
include only prior achievement as a predictor variable. NYSED also reports adjusted growth
scores that control for prior achievement and student characteristics as predictor variables1.
Unadjusted scores are reported for informational purposes to educators and are used for
school accountability in Grades 4–8. For school accountability purposes, New York State uses a
school’s or subgroup’s unweighted two-year average mean growth percentile (MGP) in ELA and
mathematics.
This document describes the model used to measure student growth for institutional
accountability in New York State for the 2015/16 school year. In 2015/16, growth models were
implemented for institutional accountability in Grades 4–8 ELA and mathematics. All models
are based on assessing each student’s change in performance between 2014/15 (and prior
years) and 2015/16 on State assessments compared with students who have similar prior
performance. Revisions to the State-provided growth model will be considered in future years.
Content and Organization of This Report The results presented in this report are based on 2015/16 and prior school years’ data, with
some comparison to prior-year results. This technical report contains four main sections:
1. Data – Description of the data used to implement the student growth model, including
data processing rules and relevant issues that arose during processing.
2. Model – Description of the unadjusted statistical model.
3. Reporting – Description of reporting metrics.
4. Results – Overview of key model results aimed at providing information on model
quality and characteristics.
Data To measure student growth and attribute that growth to schools, at least two sources of data
are required: student test scores that can be observed across time and information describing
how students are linked to schools (i.e., identifying which school students attend for a tested
subject).
1 For information on the growth model used for teacher and principal evaluation, see the 2015/16 technical report.

New York State Education Department 2015/16 Growth Model for Institutional Accountability
Technical Report
www.nysed.gov Page 5
The following sections describe the data used for model estimation in New York in more detail,
including some of the issues and challenges that arose and how they were handled.
Test Scores New York’s student growth models drew on test score data from statewide testing programs in
Grades 3–8 in ELA and mathematics for the growth model for schools of students in Grades 4–
8. In Grades 4–8, institutional growth models are estimated separately by grade and subject
using scores from each grade (e.g., Grade 5 mathematics) as the outcome.
State Tests in ELA and Mathematics (Grades 3-8)
The New York State tests at the elementary and middle school grade levels measure a range of
knowledge and skills in mathematics and ELA. State tests in ELA and mathematics for Grades 3–
8 are given in the spring. The 2015/16 school year was the fourth school year that the State
tests were designed to measure the Common Core State Standards.
The New York Grades 4–8 institutional growth model uses test scores in each subject area as a
predictor for that subject area (e.g., mathematics scores are used to predict mathematics
scores). Specifically, New York’s Grades 4–8 institutional growth model includes three prior test
scores in the same subject area. If the immediate prior-year test score in the same subject was
missing from the immediate prior grade, the student was not included in the growth measure
for that subject. For example, students without a prior-year test score or with a prior-year test
score for the same grade as the current year test score did not have growth scores computed
for them.
For the other prior scores, missing data indicators were used. These missing indicator variables
allow the model to include students who do not have the maximum possible test history and
mean that the model results measure outcomes for students with and without the maximum
possible assessment history. This approach was taken to include as many students as possible.
For the 2015/16 analyses, data from 2015/16 were used as outcomes, with prior achievement
predictors coming from the previous 3 years (going back to 2012/13). The specific tests used as
predictors vary by grade and subject and are as follows and presented visually in Table 1:
Grade 4 ELA and mathematics models used scores from Grade 3 in ELA and
mathematics. Students were NOT included if they lacked Grade 3 scores from the
immediate prior year in the same subject.
Grade 5 ELA and mathematics models used scores from Grades 3 and 4 in ELA and
mathematics. Students were NOT included if they lacked Grade 4 scores from the
immediate prior year in the same subject.
Grades 6–8 ELA and mathematics models used scores from Grades 3–7 in ELA and
mathematics. Students were NOT included if they lacked the immediate prior-year score
New York State Education Department 2015/16 Growth Model for Institutional Accountability
Technical Report
www.nysed.gov Page 6
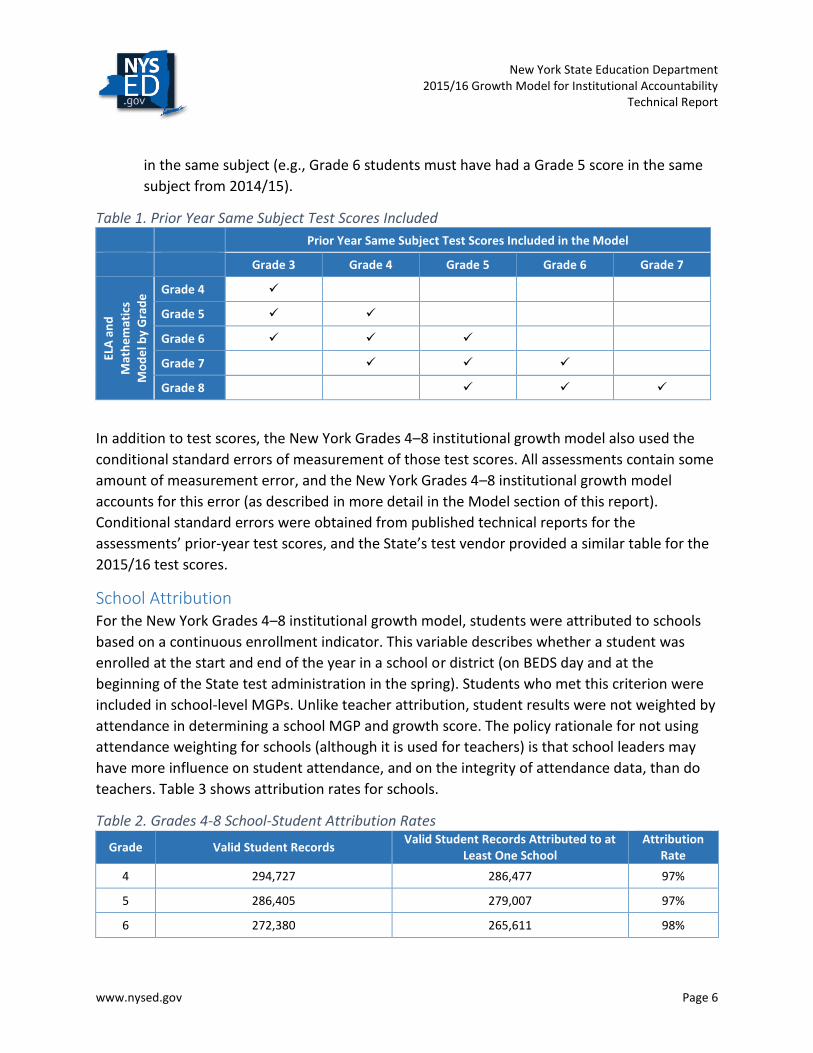
in the same subject (e.g., Grade 6 students must have had a Grade 5 score in the same
subject from 2014/15).
Table 1. Prior Year Same Subject Test Scores Included Prior Year Same Subject Test Scores Included in the Model
Grade 3 Grade 4 Grade 5 Grade 6 Grade 7
ELA
an
d
Mat
he
mat
ics
Mo
de
l by
Gra
de
Grade 4
Grade 5
Grade 6
Grade 7
Grade 8
In addition to test scores, the New York Grades 4–8 institutional growth model also used the
conditional standard errors of measurement of those test scores. All assessments contain some
amount of measurement error, and the New York Grades 4–8 institutional growth model
accounts for this error (as described in more detail in the Model section of this report).
Conditional standard errors were obtained from published technical reports for the
assessments’ prior-year test scores, and the State’s test vendor provided a similar table for the
2015/16 test scores.
School Attribution For the New York Grades 4–8 institutional growth model, students were attributed to schools
based on a continuous enrollment indicator. This variable describes whether a student was
enrolled at the start and end of the year in a school or district (on BEDS day and at the
beginning of the State test administration in the spring). Students who met this criterion were
included in school-level MGPs. Unlike teacher attribution, student results were not weighted by
attendance in determining a school MGP and growth score. The policy rationale for not using
attendance weighting for schools (although it is used for teachers) is that school leaders may
have more influence on student attendance, and on the integrity of attendance data, than do
teachers. Table 3 shows attribution rates for schools.
Table 2. Grades 4-8 School-Student Attribution Rates
Grade Valid Student Records Valid Student Records Attributed to at
Least One School Attribution
Rate
4 294,727 286,477 97%
5 286,405 279,007 97%
6 272,380 265,611 98%

New York State Education Department 2015/16 Growth Model for Institutional Accountability
Technical Report
www.nysed.gov Page 7
Grade Valid Student Records Valid Student Records Attributed to at
Least One School Attribution
Rate
7 260,571 254,297 98%
8 220,316 214,643 97%
Total 1,334,399 1,300,035 97%
Note. Student records are considered valid for the purposes of growth modeling when there are at least two
consecutive years of valid assessment scores. Students can have as many as two valid records per year, one for ELA
and one for mathematics.
The attribution rate at the school level in 2015/16 (97%) was the same as the value in 2014/15.
Fewer student records overall were attributed to schools in 2015/16 than in 2014/15.
Model This section describes the statistical model used to measure student growth in New York
between two points in time on a single subject of a State assessment. The section begins with a
description of the statistical model used to form the comparison point against which students
are measured, and follows with a description of how SGPs are derived from the comparison
point. In addition, this section describes how MGPs and all variance estimates are produced.
At the core of the New York State institutional growth model is the production of an SGP. This
statistic characterizes the student’s current year score relative to other students with similar
prior test score histories. For example, an SGP equal to 75 denotes that the student’s current
year score is the same as or better than 75% of the students in the State with prior test score
histories and other measured characteristics that are similar. It does not mean that the
student’s growth is better than that of 75% of all other students in the population.
The institutional model implemented for New York State is a linear regression model designed
to account for measurement variance in the predictor variables, as well as the outcome
variable, to yield unbiased estimates of the model coefficients. Subsequently, these model
coefficients are used to form a predicted score, which is ultimately the basis for the SGP.
Because the prediction is based on the observed score, it is necessary to account for
measurement variance in the prediction as well. Hence, the model accounts for measurement
variance in two steps: first in the model estimation and second in forming the prediction. The
next section describes this model in detail.
Covariate Adjustment Model The statistical model implemented as the MGP model is typically referred to as a covariate
adjustment model (McCaffrey, Lockwood, Koretz, & Hamilton, 2004), as the current year

New York State Education Department 2015/16 Growth Model for Institutional Accountability
Technical Report
www.nysed.gov Page 8
observed score is conditioned on prior levels of student achievement as well as other possible
covariates.
In its most general form, the model can be represented as follows:
𝑦𝑡𝑖 =∑ 𝑦𝑡−𝑟,𝑖𝛾𝑡−𝑟 + 𝑒𝑖𝐿
𝑟=1
where 𝑦𝑡𝑖 is the observed score at time 𝑡 for student 𝑖, 𝑦𝑡−𝑟 is the observed lag score at time
𝑡 − 𝑟 (𝑟 ∈ {1,2, … , 𝐿}) and 𝛾 is the coefficient vector capturing the effects of lagged scores.
Accounting for Measurement Variance in the Predictor Variables All test scores are measured with variance, and the magnitude of the variance varies across the
range of test scores. The standard errors (square roots of variances) of measurement are
referred to as conditional standard errors of measurement (CSEMs) because the variance of a
score is heteroscedastic and depends on the score itself. Figure 1 shows a sample from the
Grade 8 ELA test in New York.
Figure 1. Conditional Standard Error of Measurement Plot (Grade 8 ELA, 2015/16)
Treating the observed scores as if they were the true scores introduces a bias in the regression,
and this bias cannot be ignored within the context of a high-stakes accountability system
(Greene, 2003). In test theory, the observed score is described as the sum of a true score plus
an independent variance component, 𝑋 = 𝑋∗ + 𝑈, where 𝑈 is a matrix of unobserved
disturbances with the same dimensions as 𝑋.
Our estimator accounting for the error in the predictor variables is derived in a manner similar to
that of Goldstein (1995).

New York State Education Department 2015/16 Growth Model for Institutional Accountability
Technical Report
www.nysed.gov Page 9
Specification for MGP Model for Grades 4–8 The preceding section provides details on the general modeling approach and specifically how
measurement variance is accounted for in the model. The exact specification for the New York
Grades 4–8 model in 2015/16 is described as follows:
𝑦𝑔𝑖 = 𝜇 +∑ 𝛽𝑙𝑦𝑔−𝑟,𝑖 +∑ 𝜏𝑠𝑚𝑠𝑖 + 휀𝑖𝑀
𝑠=1
𝐾
𝑙=1
where 𝑦𝑔𝑖 is the current year test scale score for student 𝑖 in grade 𝑔, 𝜇 is the intercept, 𝛽𝑙 is
the set of coefficients associated with the three prior test scores, 𝜏𝑠 is the set of coefficients
associated with the missing variable indicators, and 휀𝑖 is the student residual.
Student Growth Percentiles The previously described regression models yield unbiased estimates of the coefficients by
accounting for the measurement error in the observed scores. The resulting estimates are then
used to form a student-level SGP statistic. For purposes of the growth model, a predicted value
and its variance for each student are required to compute the SGPs as follows:
𝑆𝐺𝑃𝑖 = Φ
(
𝑦𝑖 − �̂�𝑖
√𝜎𝑦𝑓,𝑖2
)
where 𝑆𝐺𝑃𝑖 is the observed value of the outcome variable and �̂�𝑖 = 𝑤′𝛿 where 𝑤′ is the ith row
of the model matrix 𝑊, and the notation 𝜎𝑦𝑓,𝑖2 is used to mean the variance of the predicted
value of 𝑦 for the ith student.
Here, the regression is of form
𝑌 = 𝑊𝛿 + 𝜖
where
𝜖~𝑁(0, 𝜎2)
For this case, the classic variance of a predictor is
𝜎𝑦𝑓,𝑖2 = [1 + 𝑤𝑖
′(𝑤′𝑤)−1𝑤𝑖]�̂�𝑒2
where �̂�𝑒2 is the variance of the predictor. However, in this case, we make two refinements to
acknowledge the effect of measurement error on the residual variance. The first is to use the
actual variance on 𝑦𝑖, called 𝜎𝑦𝑖2 , rather than the population variance on 𝑦𝑖, called 𝜎𝑦𝑖
2 , which is
New York State Education Department 2015/16 Growth Model for Institutional Accountability
Technical Report
www.nysed.gov Page 10
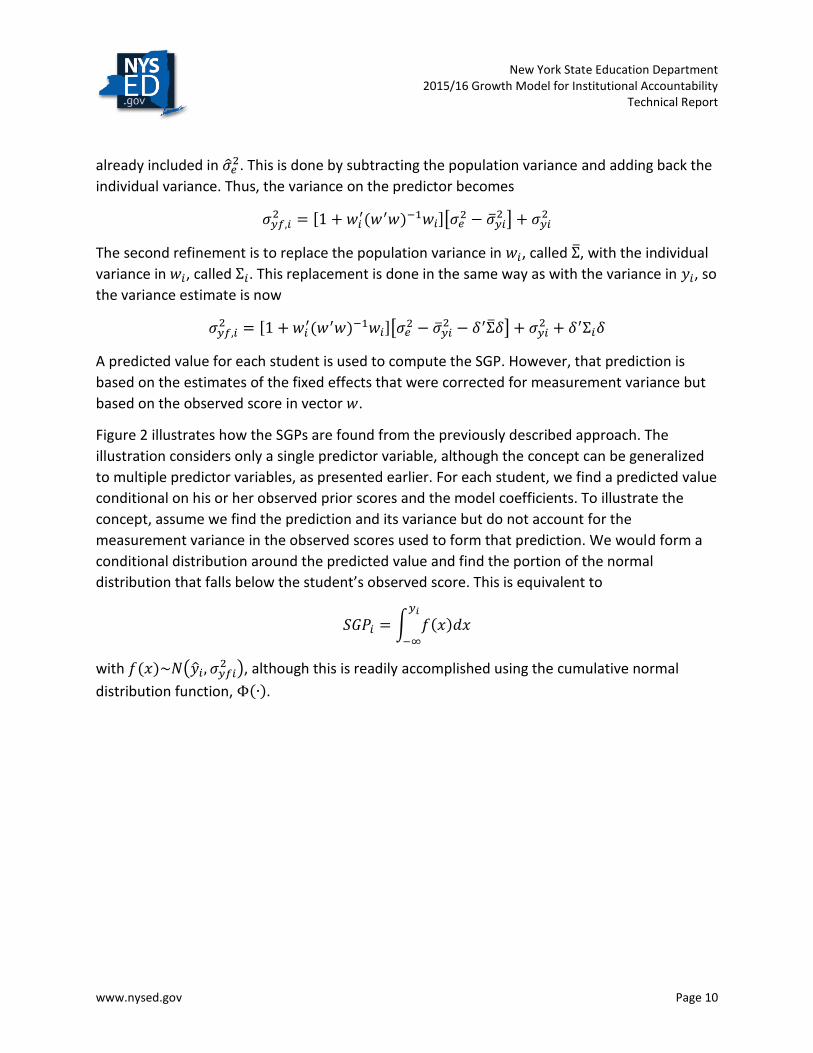
already included in �̂�𝑒2. This is done by subtracting the population variance and adding back the
individual variance. Thus, the variance on the predictor becomes
𝜎𝑦𝑓,𝑖2 = [1 + 𝑤𝑖
′(𝑤′𝑤)−1𝑤𝑖][𝜎𝑒2 − 𝜎𝑦𝑖
2 ] + 𝜎𝑦𝑖2
The second refinement is to replace the population variance in 𝑤𝑖, called Σ̅, with the individual
variance in 𝑤𝑖, called Σ𝑖. This replacement is done in the same way as with the variance in 𝑦𝑖, so
the variance estimate is now
𝜎𝑦𝑓,𝑖2 = [1 + 𝑤𝑖
′(𝑤′𝑤)−1𝑤𝑖][𝜎𝑒2 − 𝜎𝑦𝑖
2 − 𝛿′Σ̅𝛿] + 𝜎𝑦𝑖2 + 𝛿′Σ𝑖𝛿
A predicted value for each student is used to compute the SGP. However, that prediction is
based on the estimates of the fixed effects that were corrected for measurement variance but
based on the observed score in vector 𝑤.
Figure 2 illustrates how the SGPs are found from the previously described approach. The
illustration considers only a single predictor variable, although the concept can be generalized
to multiple predictor variables, as presented earlier. For each student, we find a predicted value
conditional on his or her observed prior scores and the model coefficients. To illustrate the
concept, assume we find the prediction and its variance but do not account for the
measurement variance in the observed scores used to form that prediction. We would form a
conditional distribution around the predicted value and find the portion of the normal
distribution that falls below the student’s observed score. This is equivalent to
𝑆𝐺𝑃𝑖 = ∫ 𝑓(𝑥)𝑑𝑥𝑦𝑖
−∞
with 𝑓(𝑥)~𝑁(�̂�𝑖, 𝜎𝑦𝑓𝑖2 ), although this is readily accomplished using the cumulative normal
distribution function, Φ(∙).

New York State Education Department 2015/16 Growth Model for Institutional Accountability
Technical Report
www.nysed.gov Page 11
Figure 2. Sample Growth Percentile from Model
Figure 3 illustrates the same hypothetical student shown in Figure 2. Note that the observed
score and predicted value are identical. However, the prediction variance is larger than in
Figure 2. As a result, when we integrate over the normal from −∞ to 𝑦𝑖, the SGP is 60, not 90
as in the previous example. This difference occurs because the conditional density curve has
become more spread out, reflecting less precision in the prediction.

New York State Education Department 2015/16 Growth Model for Institutional Accountability
Technical Report
www.nysed.gov Page 12
Figure 3. Sample Growth Percentile from Model
Mean Growth Percentiles Once SGPs are estimated for each student, group-level (e.g., school-level) statistics can be
formed that characterize the typical performance of students within a group. New York’s
growth model Technical Advisory Committee recommended using a mean SGP for educator
scores. Hence, group-level statistics are expressed as the mean SGP within a group. This statistic
is referred to as the MGP.
For each aggregate unit (𝑗𝜖{1,2, … , 𝐽}), such as a school, the statistic of interest is a summary
measure of growth for students within this group. Within group 𝑗, there are
{𝑆𝐺𝑃𝑗(1), 𝑆𝐺𝑃𝑗(2), … , 𝑆𝐺𝑃𝑗(𝑁)}. That is, there is an observed SGP for each student within group 𝑗.
Then the MGP for unit 𝑗 is produced as
𝜃𝑗 = 𝑚𝑒𝑎𝑛(𝑆𝐺𝑃𝑗(1))
As with all statistics, the MGP is an estimate, and it has a variance term. The following measures
of variance are produced for the MGP.
The analytic standard error of the unweighted MGP for schools is computed within unit 𝑗 as

New York State Education Department 2015/16 Growth Model for Institutional Accountability
Technical Report
www.nysed.gov Page 13
𝑠𝑒(𝜃𝑗) =𝑠𝑑(𝑆𝐺𝑃𝑖𝑗)
√𝑁𝑗
where 𝑠𝑑(𝑆𝐺𝑃𝑖𝑗) is the sample standard deviation of the SGPs in group 𝑗, and 𝑁𝑗 is the number
of students in group 𝑗.
Combining Student Growth Percentiles Across Grades and Subjects Many schools serve students from different grades and with results from different tested
subjects. For evaluation purposes, there is a need to aggregate these SGPs and form a summary
measure, in this case, mean growth percentiles (MGPs).
Because the SGPs are expressed as percentiles, they are free from scale-specific inferences and
can be combined. For any aggregate-level statistics to be provided (MGPs), all SGPs of relevant
students are pooled and the mean of the pooled SGPs is found.
Reporting The main reporting metrics for schools of Grades 4-8 were as follows:
Number of Student Scores – The number of SGPs included in an MGP.
Unadjusted MGP – The mean of the SGPs for students attributed to the school based on
similar prior achievement scores only, without taking into consideration ELL, disability,
economic disadvantage, or other student characteristics.
Lower Limit and Upper Limit – Highest and lowest possible MGP for a 95% confidence
range.
MGPs disaggregated by grade and subject also are provided. Districts also are provided with
student roster files. These files show which students were included in a school’s MGP along
with information about each student, such as whether the student has a disability or is
identified as an ELL.
Minimum sample size requirements for reporting MGPs and growth ratings were determined to
balance statistical reliability and availability of school growth scores. On one hand, setting no
(or a low) minimum sample size will result in the greatest number of schools receiving
information; on the other hand, the quality of the information they receive may be reduced. A
minimum threshold of 16 student scores was implemented. Scores on any measure at any level
based on fewer than 16 student scores were not reported.
After applying this rule, the fraction of schools with reported results is shown in Table 3 for
Grades 4–8. The percentages of schools receiving results in 2015/16 were unchanged relative to
the 2014/15 percentages.

New York State Education Department 2015/16 Growth Model for Institutional Accountability
Technical Report
www.nysed.gov Page 14
Table 3. Grades 4-8 Reporting Rates
Number of Schools with at Least One Student Attributed
Number of Schools Meeting the Minimum Sample Size
Requirement
Percentage of Schools Meeting the Minimum Sample Size
Requirement
3,745 3,583 96%
For schools of Grades 4–8, the overall MGP (i.e., the MGP that combines information across all
applicable grade levels and subjects outlined in the previous section) and upper and lower limit
MGPs were used to determine growth ratings.
Results This section provides an overview of the results of the 2015/16 growth model estimation. Some
comparisons to earlier year growth model results are also included. A pseudo R-squared
statistic and summary statistics characterizing the SGPs, MGPs, and their precision provide an
overview of model fit.
Model Fit Statistics for Grades 4–8 The R-square value is a statistic commonly used to describe the goodness-of-fit for a regression
model. Because the model implemented here is an EiV model, not a least squares regression,
we refer to this as a pseudo R-square. Table 9 presents the pseudo R-square values for each
grade and subject, computed as the squared correlation between the fitted values and the
outcome variable.
Table 4. Grades 4–8 Unadjusted Model Pseudo R-Squared Values by Grade and Subject
Grade ELA Mathematics
4 0.64 0.69
5 0.70 0.74
6 0.70 0.72
7 0.73 0.74
8 0.71 0.67
Student Growth Percentiles for Grades 4–8 SGPs describe a student’s current year score relative to those of other students in the data with
similar prior academic histories and other measured characteristics. A student’s SGP should not
be expected to be higher or lower based on his or her prior-year score. Table 5 shows the
correlation between the prior-year scale score and SGP for each grade and subject. These
correlations are usually negative as a result of using the EiV approach to account for

New York State Education Department 2015/16 Growth Model for Institutional Accountability
Technical Report
www.nysed.gov Page 15
measurement variance in the prior-year scale score; the correlation need not be zero. Squaring
these values gives the percentage of variation in SGPs explained by prior-year scores for any
grade and subject. Although prior-year test scores are generally good predictors of current year
test scores, the prior-year test score is a poor predictor of current year SGPs. As shown in Table
5, prior-year test scores explain about 2% to 3% of the variation in SGPs. Because SGPs are
intended to allow students to show low or high growth no matter their prior performance, this
result is as expected.
Table 5. Grades 4–8 Unadjusted Model Correlation Between SGP and Prior-Year Scale Score
Grade ELA Mathematics
4 -0.155 -0.125
5 -0.140 -0.164
6 -0.120 -0.144
7 -0.139 -0.180
8 -0.130 -0.175
Reliability of Unadjusted MGPs It is useful to examine the reliability statistic to assess the precision of the school-level MGPs,
specified here as 𝜌:
𝜌 = 1 − (𝜎
𝑠𝑑(𝜃𝑗))
2
where 𝜎 is the mean standard error of the MGP, and 𝑠𝑑(𝜃𝑗) is the standard deviation between
school MGPs. In theory, the highest possible value is one, which would represent complete
precision in the measure. When the ratio is zero, the variation in MGPs is explained entirely by
sampling variation. Larger values of 𝜌 are associated with more precisely measured MGPs.
Table 6.provides the mean standard errors, the standard deviations, and the values of 𝜌 for the
unadjusted model for schools.
Table 6. Grades 4–8 Unadjusted Model Mean Standard Errors, Standard Deviation, and Value of 𝜌 by Grade for Schools
Grade Unadjusted Mean
Standard Error Unadjusted Standard
Deviation Reliability Statistic (𝝆)
4 2.81 9.04 0.903
5 2.86 8.75 0.893
6 2.72 9.46 0.918

New York State Education Department 2015/16 Growth Model for Institutional Accountability
Technical Report
www.nysed.gov Page 16
Grade Unadjusted Mean
Standard Error Unadjusted Standard
Deviation Reliability Statistic (𝝆)
7 2.61 8.43 0.904
8 2.83 8.21 0.881
Table 7 provides the share of schools whose MGPs are significantly above or below the State
mean, using the 95% confidence intervals. In all cases, the percentage exceeding the mean is
larger than what would be expected by chance alone, indicating the model distinguishes
between schools (2.5% of schools would be expected to be above or below the mean by chance
alone).
Table 7. Grades 4–8 Unadjusted Model School MGPs Above or Below the Mean at a 95% Confidence Level
Below Mean Above Mean
Grade N % N %
4 698 29.4% 581 24.5%
5 691 30.1% 562 24.4%
6 476 28.7% 477 28.7%
7 435 29.9% 371 25.5%
8 441 30.8% 306 21.4%
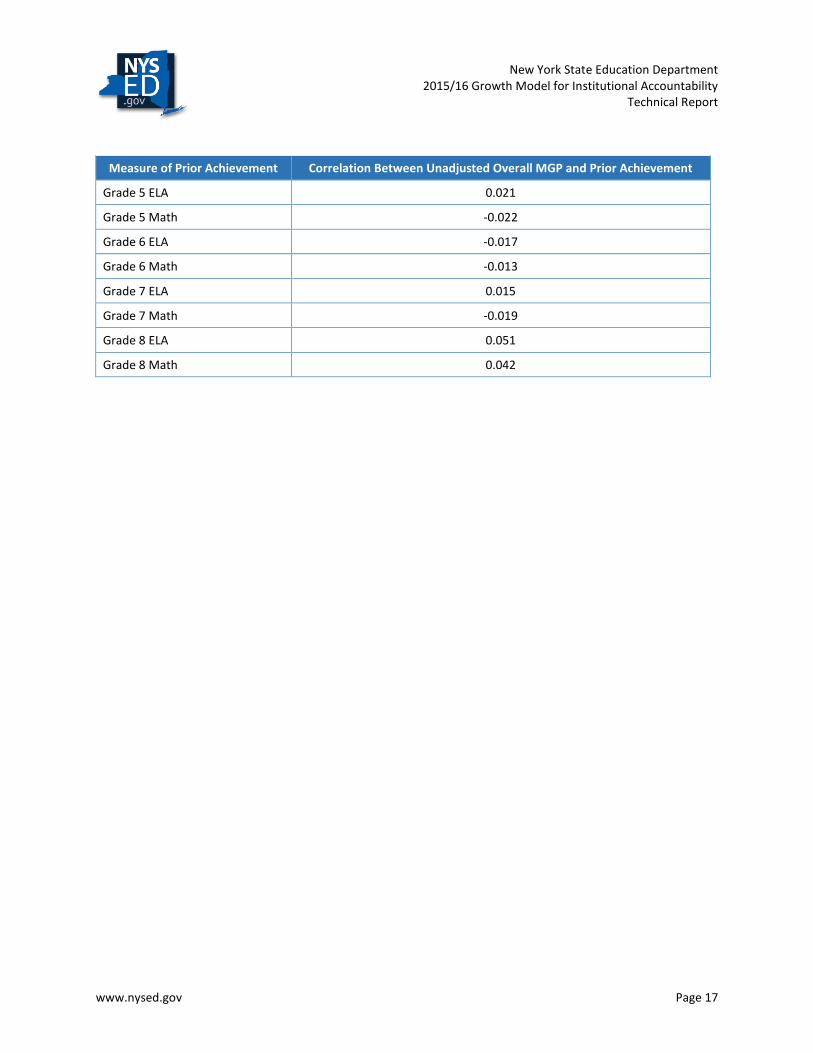
Neutrality of Unadjusted MGPs Given that a primary claim for the use of MGPs in institutional accountability is that all schools
can demonstrate growth, regardless of the academic starting point of students, it is necessary
to determine if there is a strong relationship between MGPs and average prior achievement for
students in a school. To that end, These correlations illustrate that the MGPs are substantially
neutral to prior achievement.
Table 8 shows the correlations between MGPs and average prior achievement, with low to
moderate correlations across all grades and subjects. These correlations illustrate that the
MGPs are substantially neutral to prior achievement.
Table 8. Correlation Between Unadjusted Overall MGP and Average Prior Achievement Across Grades and Subjects
Measure of Prior Achievement Correlation Between Unadjusted Overall MGP and Prior Achievement
Grade 4 ELA 0.177
Grade 4 Math 0.152
New York State Education Department 2015/16 Growth Model for Institutional Accountability
Technical Report
www.nysed.gov Page 17
Measure of Prior Achievement Correlation Between Unadjusted Overall MGP and Prior Achievement
Grade 5 ELA 0.021
Grade 5 Math -0.022
Grade 6 ELA -0.017
Grade 6 Math -0.013
Grade 7 ELA 0.015
Grade 7 Math -0.019
Grade 8 ELA 0.051
Grade 8 Math 0.042

New York State Education Department 2015/16 Growth Model for Institutional Accountability
Technical Report
www.nysed.gov Page 18
References Goldstein, H. (1995). Multilevel statistical models. Bristol, UK: University of Bristol. Retrieved
from http://www.bristol.ac.uk/cmm/team/hg/multbook1995.pdf
Greene, W. H. (2003). Econometric analysis (5th ed.). Upper Saddle River, NJ: Prentice Hall.
Hausman, J. (2001). Mismeasured variables in econometric analysis: Problems from the right
and problems from the left. Journal of Economic Perspectives, 15(4), 57–67.
Henderson, C. R. (1953). Estimation of variance and covariance components. Biometrics, 9,
226–252.
McCaffrey, D. F., Lockwood, J. R., Koretz, D. M., & Hamilton, L. S. (2004). Evaluating value-
added models for teacher accountability. Santa Monica, CA: RAND.
McCaffrey, D. F., Sass, T. R., Lockwood, J. R., & Mihaly, K. (2009). The intertemporal variability
of teacher effect estimates. Education, Finance and Policy, 4(4), 572–606.
Wei, Y., & Carroll, R. J. (2009). Quantile regression with measurement error. Journal of the
American Statistical Association, 104, 1129–1143.

New York State Education Department 2015/16 Growth Model for Institutional Accountability
Technical Report
www.nysed.gov Page 19
Appendix A. Model Coefficients The tables that follow display regression model coefficients (labeled as “Effects”) for the New
York growth model in each grade and subject. For the Grades 4–8 model, these model
coefficients represent the predicted change in current year test scores for one unit of change in
each variable shown in the table, holding other variables constant. For example, in Table 9, the
predicted change in a student’s current year ELA test score given a one point increase in a
student’s prior grade ELA test score is 0.794. The interpretation of a one-unit change varies by
variable type. For yes/no variables, model coefficients represent the predicted change in
current year test scores given a change from no to yes. Missing flags are yes/no variables set to
yes if the noted variable is missing and no otherwise.
Because of the differences in model and variable types, it is important to keep in mind that
effect sizes cannot be compared directly across different types of variables.
Table 9. Grade 4 ELA Unadjusted Model Coefficients
Effect Name Effect Standard Error p-value
Constant Term 69.720 0.497 0.000
Prior-Grade ELA Scale Score 0.794 0.002 0.000
Table 10. Grade 5 ELA Unadjusted Model Coefficients
Effect Name Effect Standard Error p-value
Constant Term 3.339 0.542 0.000
Prior-Grade ELA Scale Score 0.707 0.004 0.000
Two-Grades-Prior ELA Scale Score 0.280 0.004 0.000
Missing Flag: Two-Grades-Prior ELA Scale Score 82.155 1.312 0.000
Table 11. Grade 6 ELA Unadjusted Model Coefficients
Effect Name Effect Standard Error p-value
Constant Term 26.484 0.539 0.000
Prior-Grade ELA Scale Score 0.634 0.004 0.000
Two-Grades-Prior ELA Scale Score 0.186 0.005 0.000
Missing Flag: Two-Grades-Prior ELA Scale Score 53.781 1.473 0.000
Three-Grades-Prior ELA Scale Score 0.097 0.004 0.000
Missing Flag: Three-Grades-Prior ELA Scale Score 30.569 1.276 0.000

New York State Education Department 2015/16 Growth Model for Institutional Accountability
Technical Report
www.nysed.gov Page 20
Table 12. Grade 7 ELA Unadjusted Model Coefficients
Effect Name Effect Standard Error p-value
Constant Term 32.351 0.494 0.000
Prior-Grade ELA Scale Score 0.637 0.004 0.000
Two-Grades-Prior ELA Scale Score 0.185 0.005 0.000
Missing Flag: Two-Grades-Prior ELA Scale Score 52.671 1.380 0.000
Three-Grades-Prior ELA Scale Score 0.084 0.004 0.000
Missing Flag: Three-Grades-Prior ELA Scale Score 25.787 1.221 0.000
Table 13. Grade 8 ELA Unadjusted Model Coefficients
Effect Name Effect Standard Error p-value
Constant Term 37.647 0.523 0.000
Prior-Grade ELA Scale Score 0.606 0.004 0.000
Two-Grades-Prior ELA Scale Score 0.202 0.005 0.000
Missing Flag: Two-Grades-Prior ELA Scale Score 57.377 1.415 0.000
Three-Grades-Prior ELA Scale Score 0.095 0.004 0.000
Missing Flag: Three-Grades-Prior ELA Scale Score 28.463 1.199 0.000
Table 14. Grade 4 Mathematics Unadjusted Model Coefficients
Effect Name Effect Standard Error p-value
Constant Term 1.078 0.552 0.051
Prior-Grade ELA Scale Score 0.996 0.002 0.000
Table 15. Grade 5 Mathematics Unadjusted Model Coefficients
Effect Name Effect Standard Error p-value
Constant Term 13.620 0.518 0.000
Prior-Grade ELA Scale Score 0.734 0.004 0.000
Two-Grades-Prior ELA Scale Score 0.229 0.004 0.000
Missing Flag: Two-Grades-Prior ELA Scale Score 71.301 1.229 0.000

New York State Education Department 2015/16 Growth Model for Institutional Accountability
Technical Report
www.nysed.gov Page 21
Table 16. Grade 6 Mathematics Unadjusted Model Coefficients
Effect Name Effect Standard Error p-value
Constant Term -9.395 0.620 0.000
Prior-Grade ELA Scale Score 0.684 0.005 0.000
Two-Grades-Prior ELA Scale Score 0.190 0.005 0.000
Missing Flag: Two-Grades-Prior ELA Scale Score 57.335 1.557 0.000
Three-Grades-Prior ELA Scale Score 0.151 0.005 0.000
Missing Flag: Three-Grades-Prior ELA Scale Score 46.137 1.417 0.000
Table 17. Grade 7 Mathematics Unadjusted Model Coefficients
Effect Name Effect Standard Error p-value
Constant Term 2.806 0.567 0.000
Prior-Grade ELA Scale Score 0.757 0.004 0.000
Two-Grades-Prior ELA Scale Score 0.137 0.005 0.000
Missing Flag: Two-Grades-Prior ELA Scale Score 43.203 1.411 0.000
Three-Grades-Prior ELA Scale Score 0.097 0.004 0.000
Missing Flag: Three-Grades-Prior ELA Scale Score 29.289 1.263 0.000
Table 18. Grade 8 Mathematics Unadjusted Model Coefficients
Effect Name Effect Standard Error p-value
Constant Term -24.308 0.816 0.000
Prior-Grade ELA Scale Score 0.715 0.006 0.000
Two-Grades-Prior ELA Scale Score 0.277 0.007 0.000
Missing Flag: Two-Grades-Prior ELA Scale Score 83.342 1.976 0.000
Three-Grades-Prior ELA Scale Score 0.077 0.006 0.000
Missing Flag: Three-Grades-Prior ELA Scale Score 23.358 1.592 0.000