Embed Size (px)
Citation preview
MBTA Route Performance Analysis
Rider ExperienceSchedule Analysis Vehicle Optimization
Agenda
1. Problem Statement: Transportation Issues
2. Data, What it can/cannot tell us
3. Platform Overview
4. Early Observations
5. Early Insights
6. Early Recommendations to MBTA
1. Problem Statement: Transportation Issues
• Waits can be long• Buses not always showing up on schedule• Buses sometimes stacked one-after-another
which is wasteful
• How much, how often, and why?
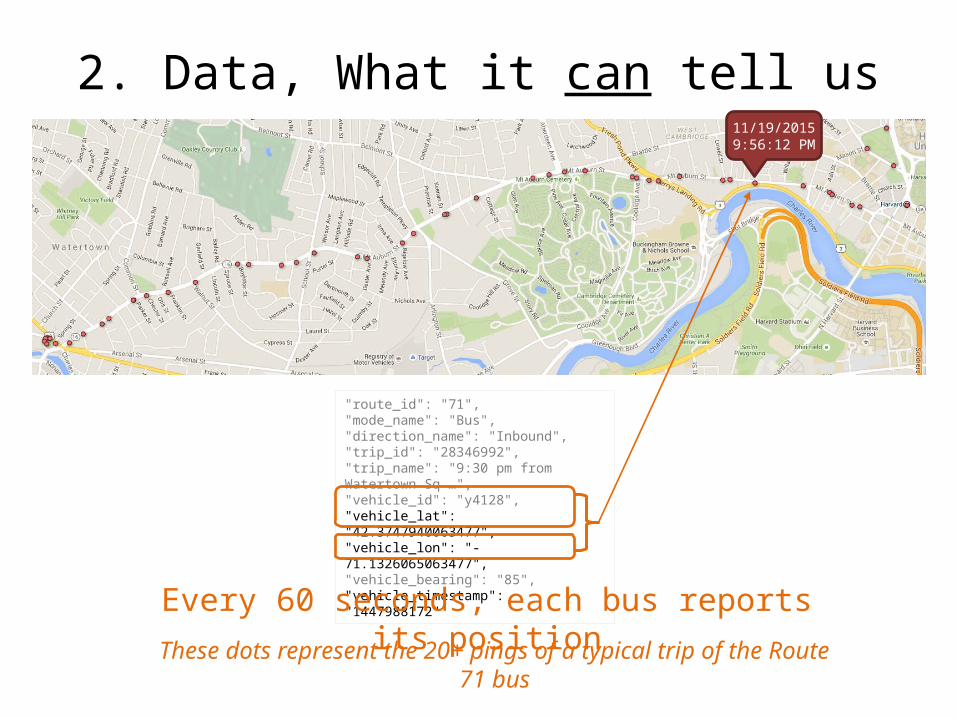
2. Data, What it can tell us
"route_id": "71","mode_name": "Bus","direction_name": "Inbound","trip_id": "28346992","trip_name": "9:30 pm from Watertown Sq …","vehicle_id": "y4128","vehicle_lat": "42.3747940063477","vehicle_lon": "-71.1326065063477","vehicle_bearing": "85","vehicle_timestamp": "1447988172"
11/19/20159:56:12 PM
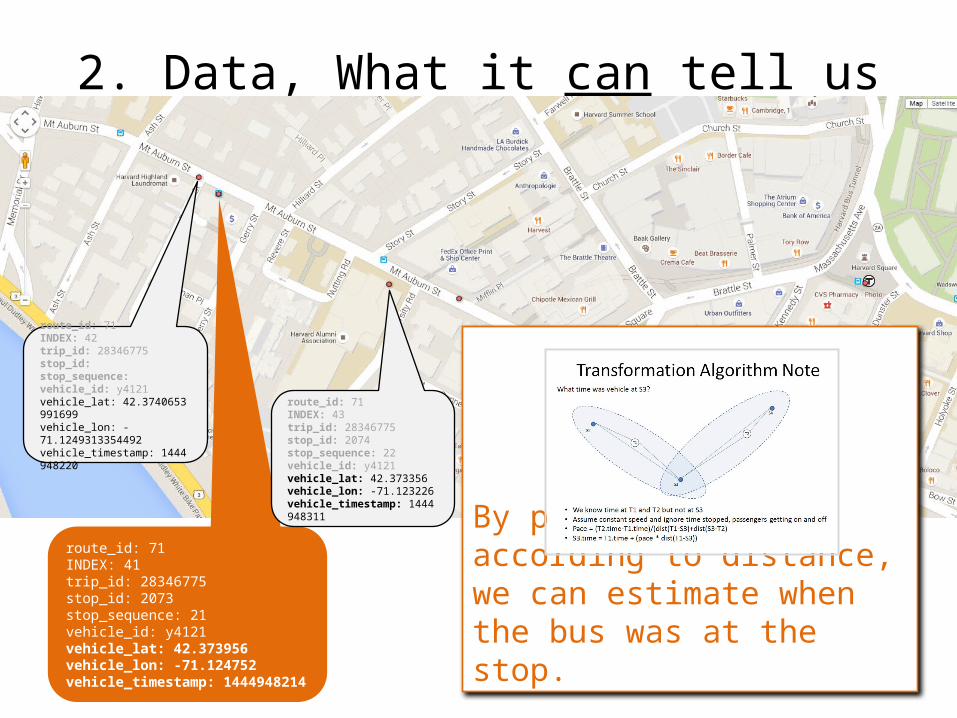
Every 60 seconds, each bus reports its positionThese dots represent the 20+ pings of a typical trip of the Route 71 bus
2. Data, What it can tell us
route_id: 71INDEX: 42trip_id: 28346775stop_id: stop_sequence: vehicle_id: y4121vehicle_lat: 42.3740653991699vehicle_lon: -71.1249313354492vehicle_timestamp: 1444948220
route_id: 71INDEX: 41trip_id: 28346775stop_id: 2073stop_sequence: 21vehicle_id: y4121vehicle_lat: 42.373956vehicle_lon: -71.124752vehicle_timestamp: 1444948214
route_id: 71INDEX: 43trip_id: 28346775stop_id: 2074stop_sequence: 22vehicle_id: y4121vehicle_lat: 42.373356vehicle_lon: -71.123226vehicle_timestamp: 1444948311
By portioning time according to distance, we can estimate when the bus was at the stop.
2. Data, What it can tell us
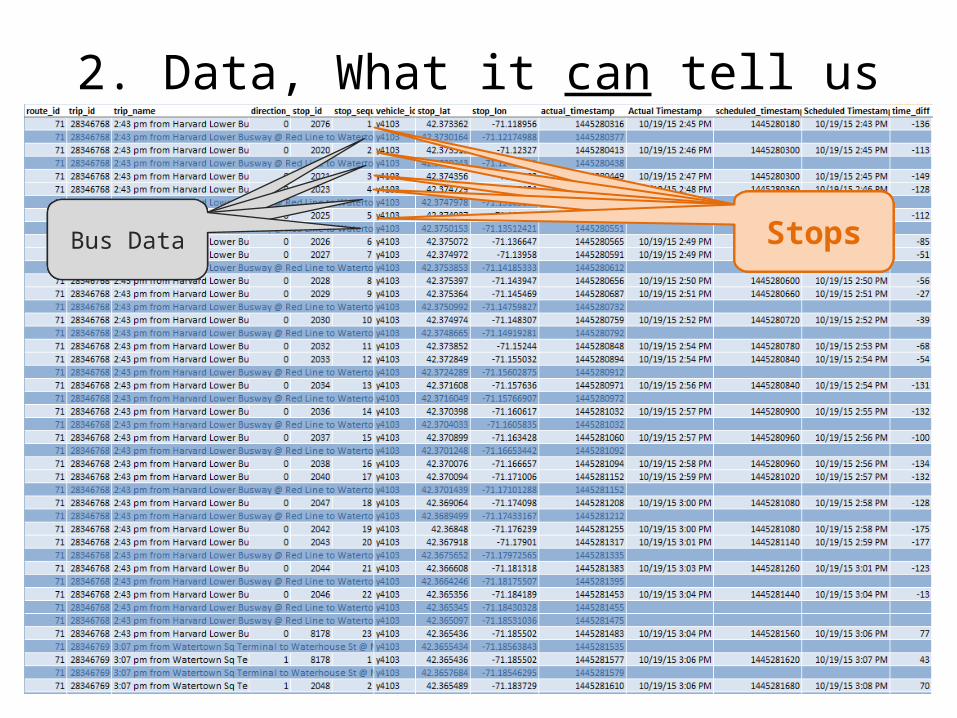
StopsStopsStopsStopsStopsBus DataBus DataBus DataBus Data
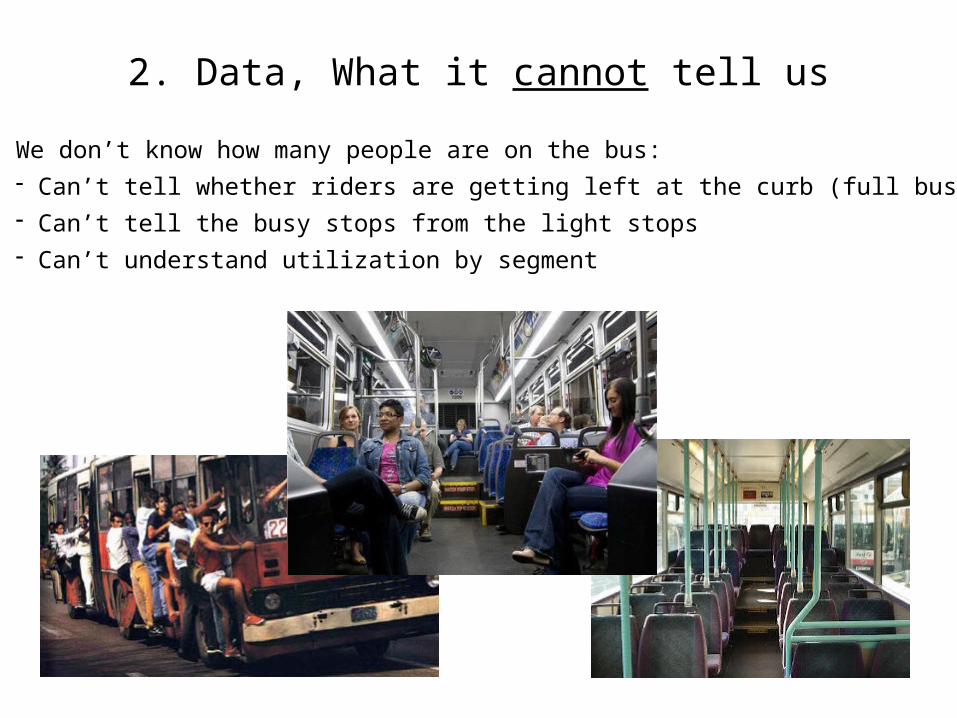
2. Data, What it cannot tell usWe don’t know how many people are on the bus:- Can’t tell whether riders are getting left at the curb (full bus)- Can’t tell the busy stops from the light stops- Can’t understand utilization by segment
3. Platform Overview
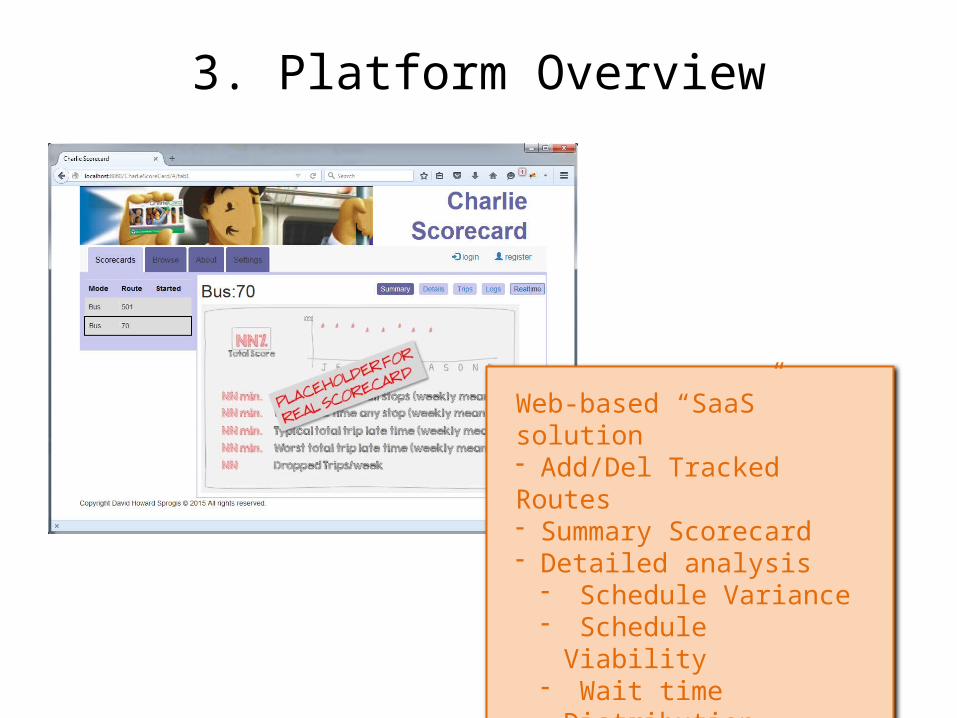
Web-based “SaaS” solution- Add/Del Tracked Routes- Summary Scorecard- Detailed analysis
- Schedule Variance- Schedule Viability- Wait time Distribution- Vehicle Deployment Policy
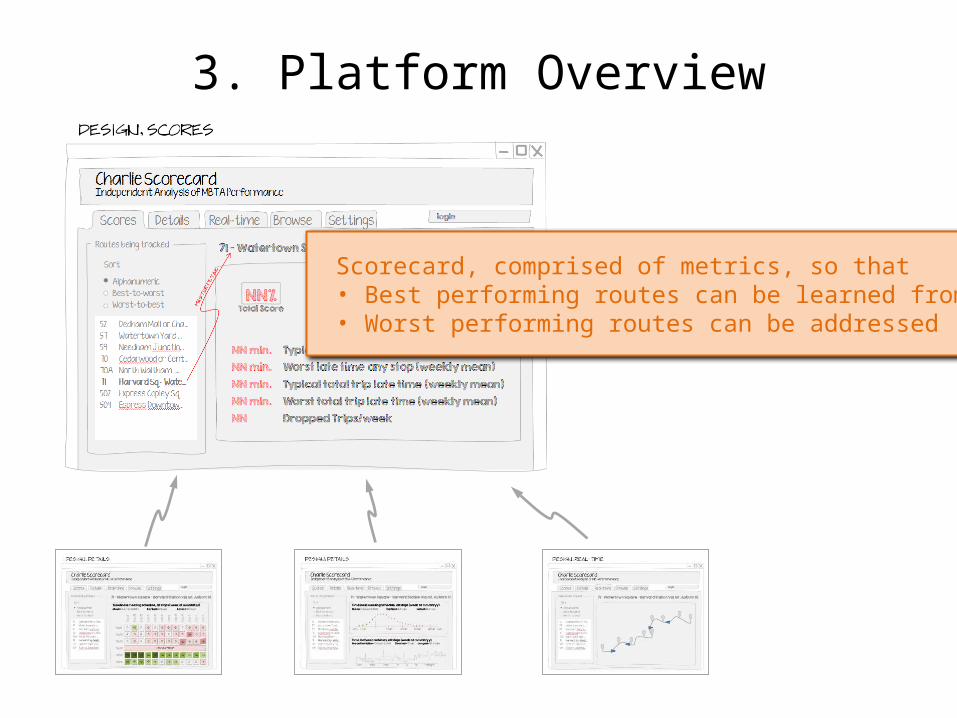
3. Platform Overview
Scorecard, comprised of metrics, so that• Best performing routes can be learned from,• Worst performing routes can be addressed
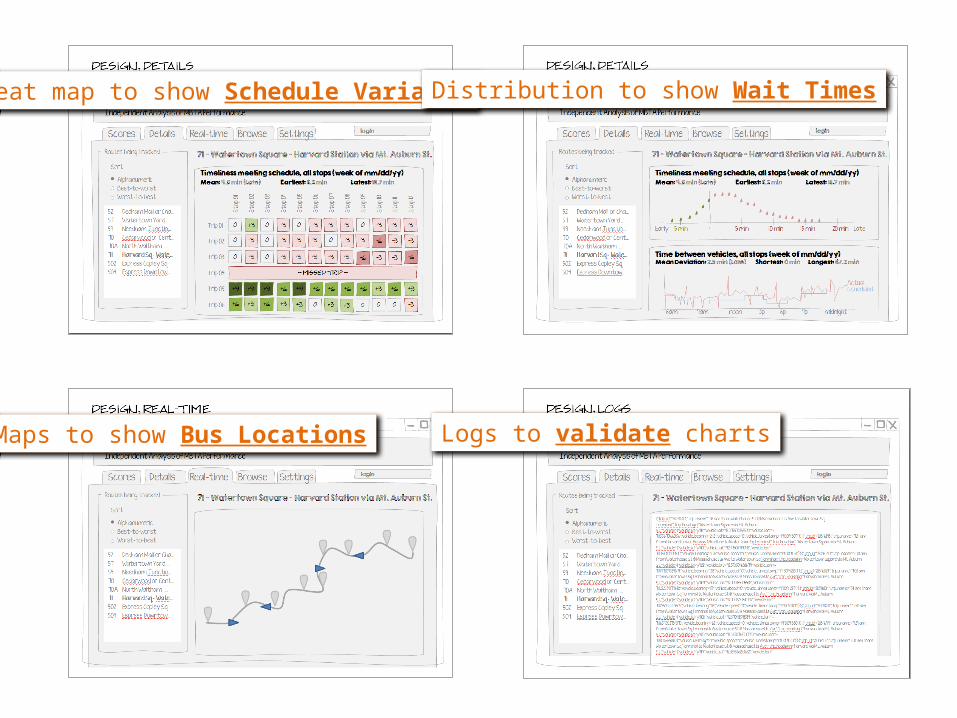
Heat map to show Schedule Variance Distribution to show Wait Times
Maps to show Bus Locations Logs to validate charts
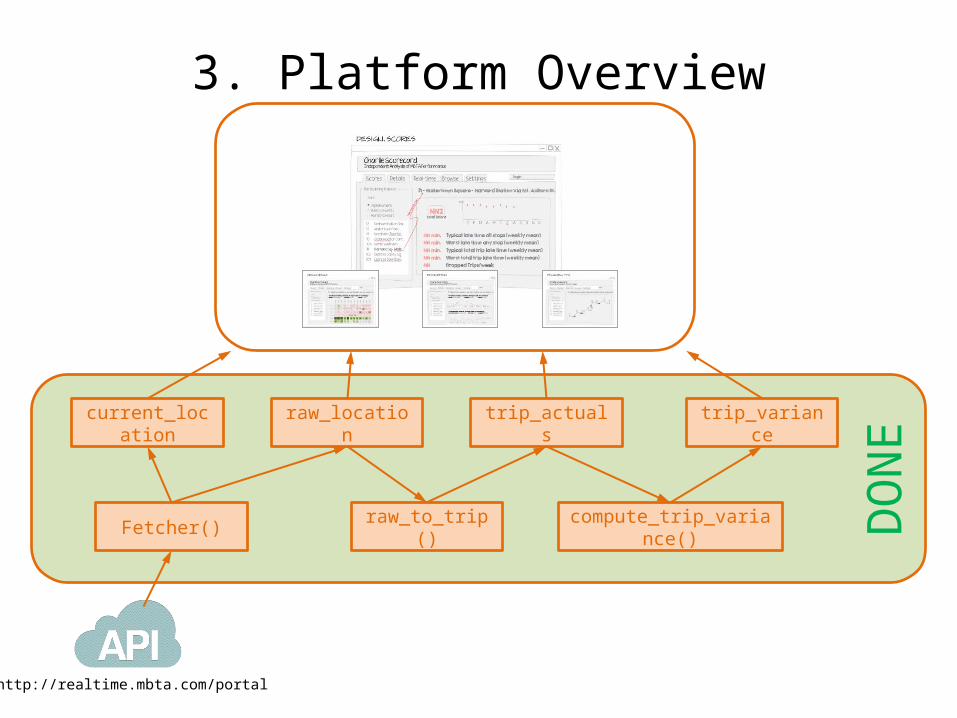
DON
E
3. Platform Overview
http://realtime.mbta.com/portal
current_location raw_location
Fetcher()
trip_actuals
raw_to_trip()
trip_variance
compute_trip_variance()
DON
E
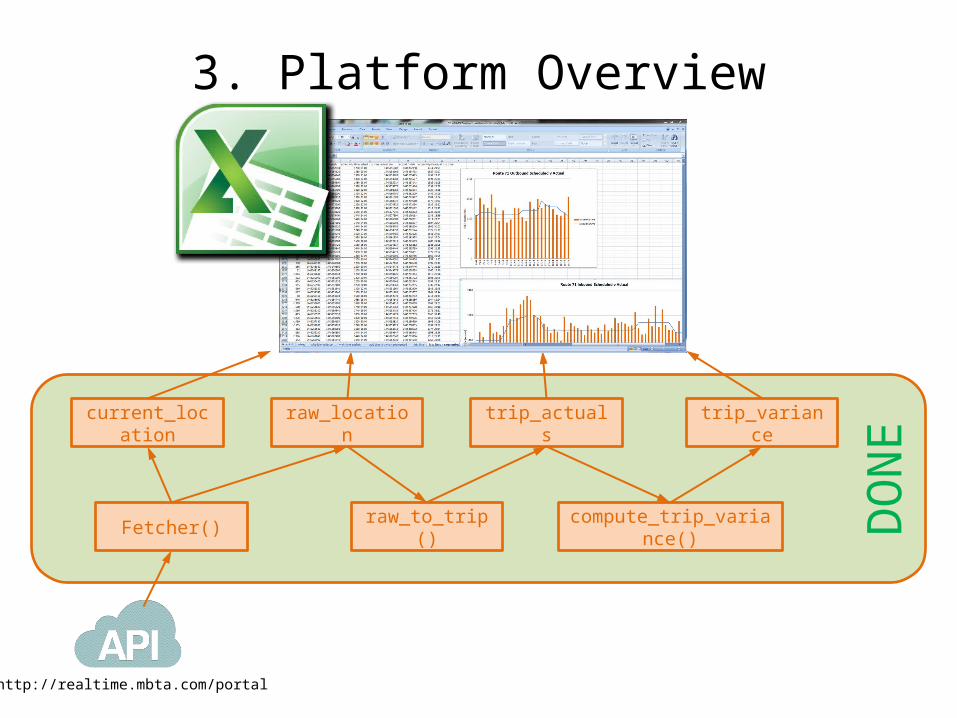
3. Platform Overview
http://realtime.mbta.com/portal
current_location raw_location
Fetcher()
trip_actuals
raw_to_trip()
trip_variance
compute_trip_variance()
GTIFSchedules
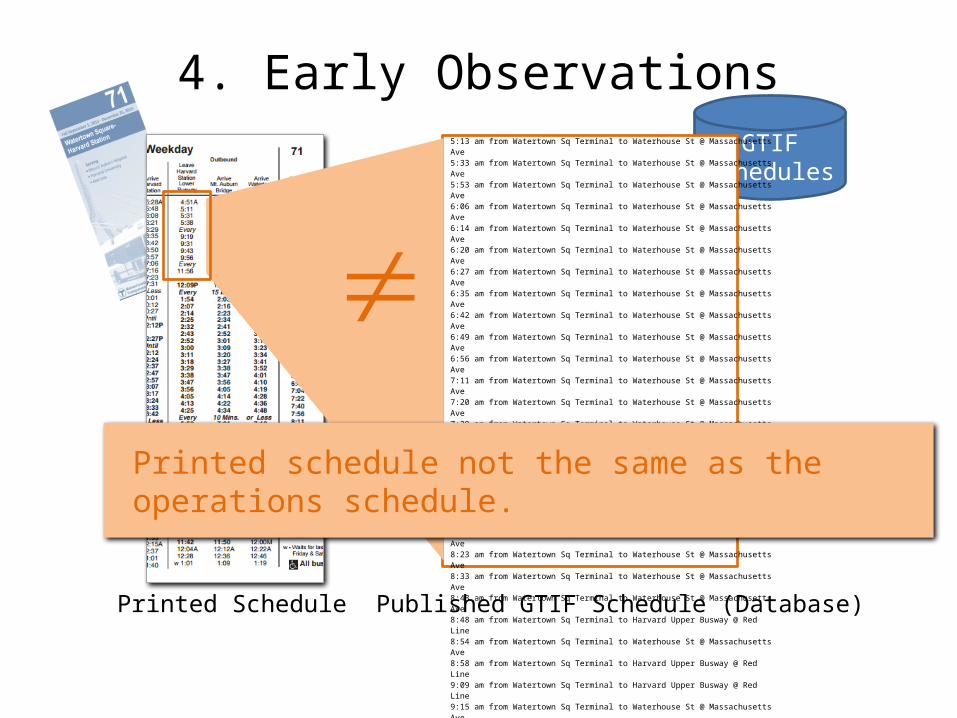
4. Early Observations5:13 am from Watertown Sq Terminal to Waterhouse St @ Massachusetts Ave5:33 am from Watertown Sq Terminal to Waterhouse St @ Massachusetts Ave5:53 am from Watertown Sq Terminal to Waterhouse St @ Massachusetts Ave6:06 am from Watertown Sq Terminal to Waterhouse St @ Massachusetts Ave6:14 am from Watertown Sq Terminal to Waterhouse St @ Massachusetts Ave6:20 am from Watertown Sq Terminal to Waterhouse St @ Massachusetts Ave6:27 am from Watertown Sq Terminal to Waterhouse St @ Massachusetts Ave6:35 am from Watertown Sq Terminal to Waterhouse St @ Massachusetts Ave6:42 am from Watertown Sq Terminal to Waterhouse St @ Massachusetts Ave6:49 am from Watertown Sq Terminal to Waterhouse St @ Massachusetts Ave6:56 am from Watertown Sq Terminal to Waterhouse St @ Massachusetts Ave7:11 am from Watertown Sq Terminal to Waterhouse St @ Massachusetts Ave7:20 am from Watertown Sq Terminal to Waterhouse St @ Massachusetts Ave7:29 am from Watertown Sq Terminal to Waterhouse St @ Massachusetts Ave7:38 am from Watertown Sq Terminal to Waterhouse St @ Massachusetts Ave7:45 am from Watertown Sq Terminal to Waterhouse St @ Massachusetts Ave7:52 am from Watertown Sq Terminal to Waterhouse St @ Massachusetts Ave7:59 am from Watertown Sq Terminal to Waterhouse St @ Massachusetts Ave8:10 am from Watertown Sq Terminal to Waterhouse St @ Massachusetts Ave8:23 am from Watertown Sq Terminal to Waterhouse St @ Massachusetts Ave8:33 am from Watertown Sq Terminal to Waterhouse St @ Massachusetts Ave8:43 am from Watertown Sq Terminal to Waterhouse St @ Massachusetts Ave8:48 am from Watertown Sq Terminal to Harvard Upper Busway @ Red Line8:54 am from Watertown Sq Terminal to Waterhouse St @ Massachusetts Ave8:58 am from Watertown Sq Terminal to Harvard Upper Busway @ Red Line9:09 am from Watertown Sq Terminal to Harvard Upper Busway @ Red Line9:15 am from Watertown Sq Terminal to Waterhouse St @ Massachusetts Ave9:24 am from Watertown Sq Terminal to Waterhouse St @ Massachusetts Ave9:34 am from Watertown Sq Terminal to Waterhouse St @ Massachusetts Ave9:44 am from Watertown Sq Terminal to Harvard Upper Busway @ Red Line9:55 am from Watertown Sq Terminal to Waterhouse St @ Massachusetts Ave10:10 am from Watertown Sq Terminal to Waterhouse St @ Massachusetts Ave10:25 am from Watertown Sq Terminal to Waterhouse St @ Massachusetts Ave10:40 am from Watertown Sq Terminal to Waterhouse St @ Massachusetts Ave10:55 am from Watertown Sq Terminal to Waterhouse St @ Massachusetts Ave11:10 am from Watertown Sq Terminal to Waterhouse St @ Massachusetts Ave11:25 am from Watertown Sq Terminal to Waterhouse St @ Massachusetts Ave
Printed Schedule Published GTIF Schedule (Database)
Printed schedule not the same as the operations schedule.
4. Early Observations
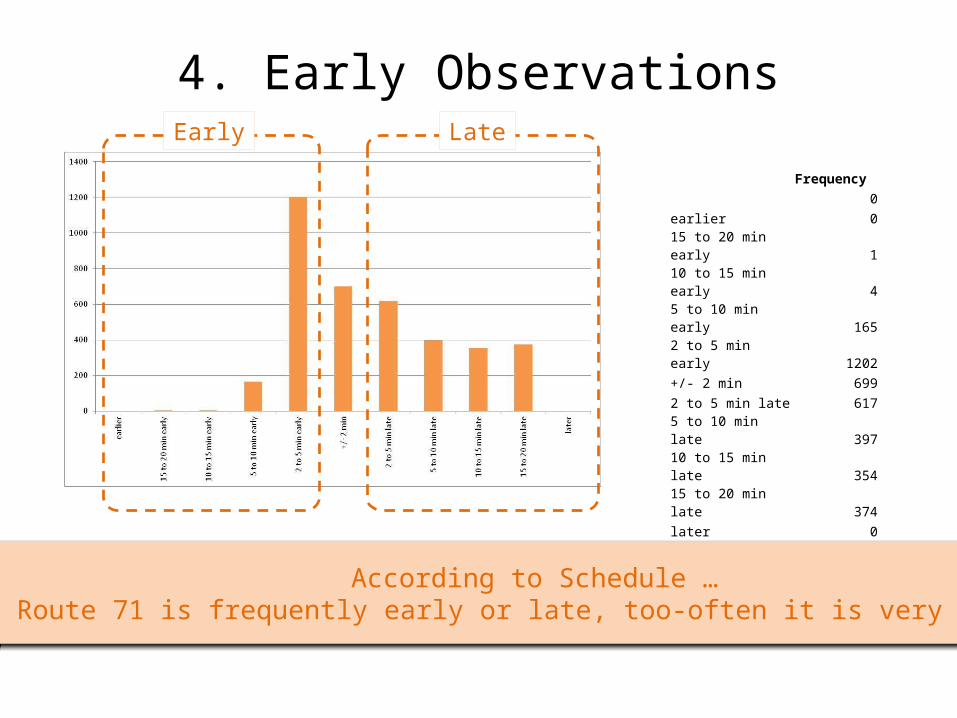
Frequency0
earlier 015 to 20 min early 110 to 15 min early 45 to 10 min early 1652 to 5 min early 1202+/- 2 min 6992 to 5 min late 6175 to 10 min late 39710 to 15 min late 35415 to 20 min late 374later 0
Early Late
According to Schedule …Route 71 is frequently early or late, too-often it is very late.
4. Early Observations
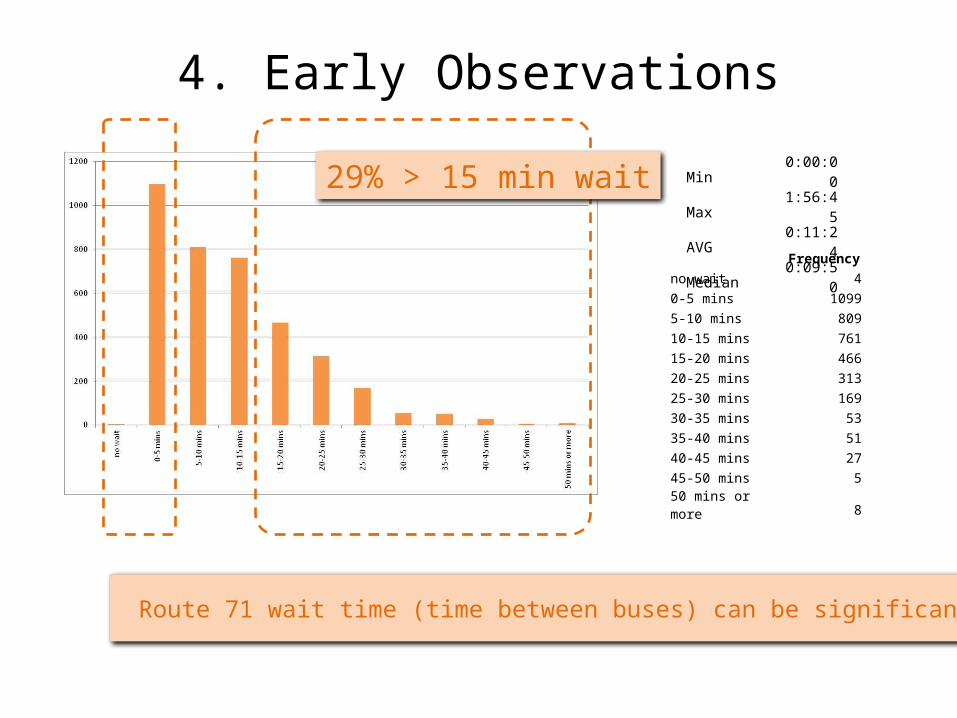
Route 71 wait time (time between buses) can be significant.
Frequencyno wait 40-5 mins 10995-10 mins 80910-15 mins 76115-20 mins 46620-25 mins 31325-30 mins 16930-35 mins 5335-40 mins 5140-45 mins 2745-50 mins 550 mins or more 8
Min 0:00:00Max 1:56:45AVG 0:11:24Median 0:09:50
29% > 15 min wait
4. Early ObservationsM
orni
ng R
ush
Even
ing
Rush
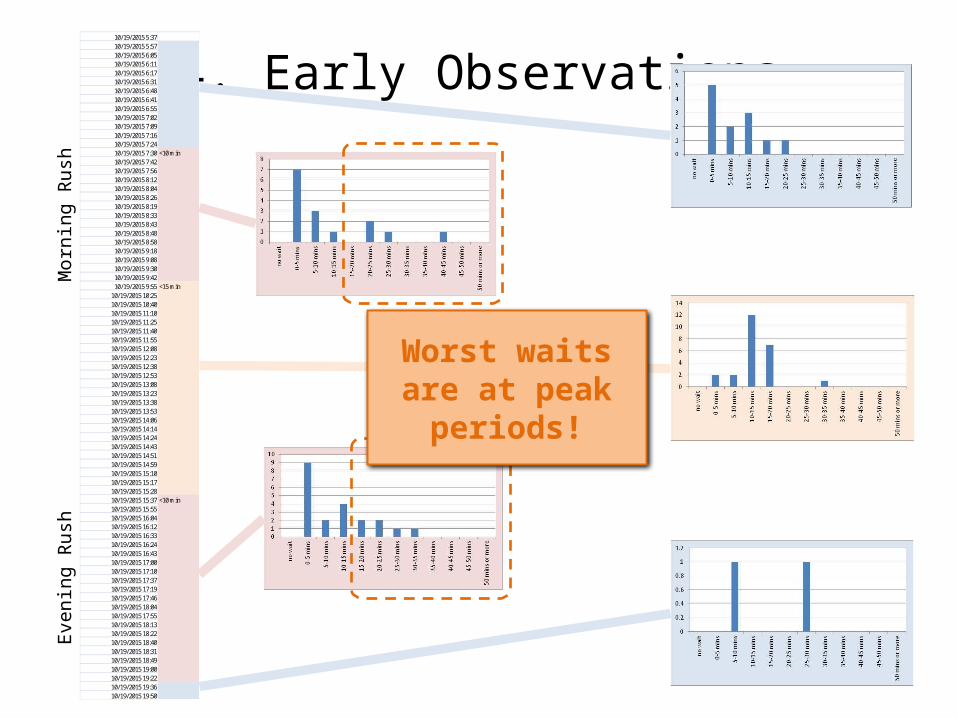
10/19/2015 5:3710/19/2015 5:5710/19/2015 6:0510/19/2015 6:1110/19/2015 6:1710/19/2015 6:3110/19/2015 6:4810/19/2015 6:4110/19/2015 6:5510/19/2015 7:0210/19/2015 7:0910/19/2015 7:1610/19/2015 7:2410/19/2015 7:30 <10 min10/19/2015 7:4210/19/2015 7:5610/19/2015 8:1210/19/2015 8:0410/19/2015 8:2610/19/2015 8:1910/19/2015 8:3310/19/2015 8:4310/19/2015 8:4810/19/2015 8:5810/19/2015 9:1810/19/2015 9:0810/19/2015 9:3010/19/2015 9:4210/19/2015 9:55 <15 min
10/19/2015 10:2510/19/2015 10:4010/19/2015 11:1010/19/2015 11:2510/19/2015 11:4010/19/2015 11:5510/19/2015 12:0810/19/2015 12:2310/19/2015 12:3810/19/2015 12:5310/19/2015 13:0810/19/2015 13:2310/19/2015 13:3810/19/2015 13:5310/19/2015 14:0610/19/2015 14:1410/19/2015 14:2410/19/2015 14:4310/19/2015 14:5110/19/2015 14:5910/19/2015 15:1010/19/2015 15:1710/19/2015 15:2810/19/2015 15:37 <10 min10/19/2015 15:5510/19/2015 16:0410/19/2015 16:1210/19/2015 16:3310/19/2015 16:2410/19/2015 16:4310/19/2015 17:0010/19/2015 17:1010/19/2015 17:3710/19/2015 17:1910/19/2015 17:4610/19/2015 18:0410/19/2015 17:5510/19/2015 18:1310/19/2015 18:2210/19/2015 18:4010/19/2015 18:3110/19/2015 18:4910/19/2015 19:0010/19/2015 19:2210/19/2015 19:3610/19/2015 19:50
Worst waits are at peak periods!
4. Early Observations
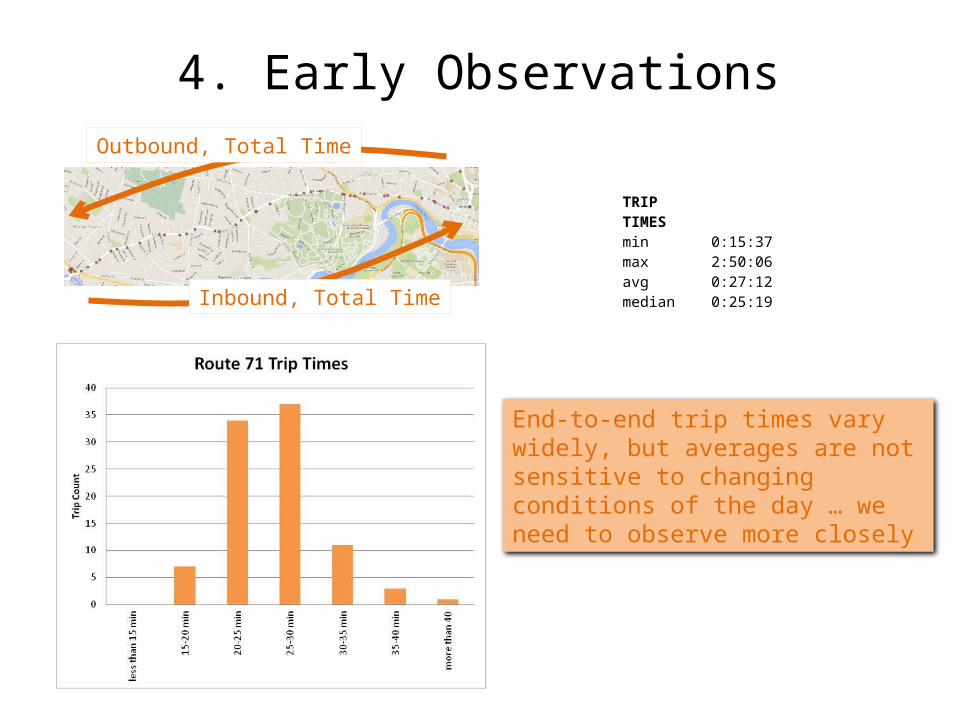
TRIP TIMESmin 0:15:37max 2:50:06avg 0:27:12median 0:25:19
End-to-end trip times vary widely, but averages are not sensitive to changing conditions of the day … we need to observe more closely
Outbound, Total Time
Inbound, Total Time
4. Early Insights
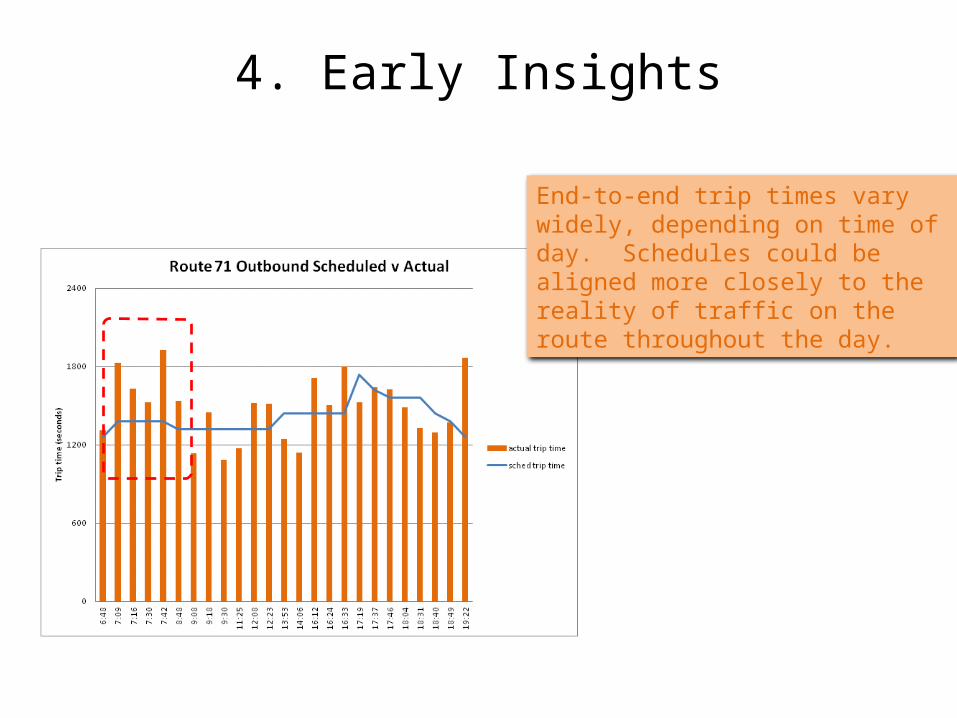
End-to-end trip times vary widely, depending on time of day. Schedules could be aligned more closely to the reality of traffic on the route throughout the day.
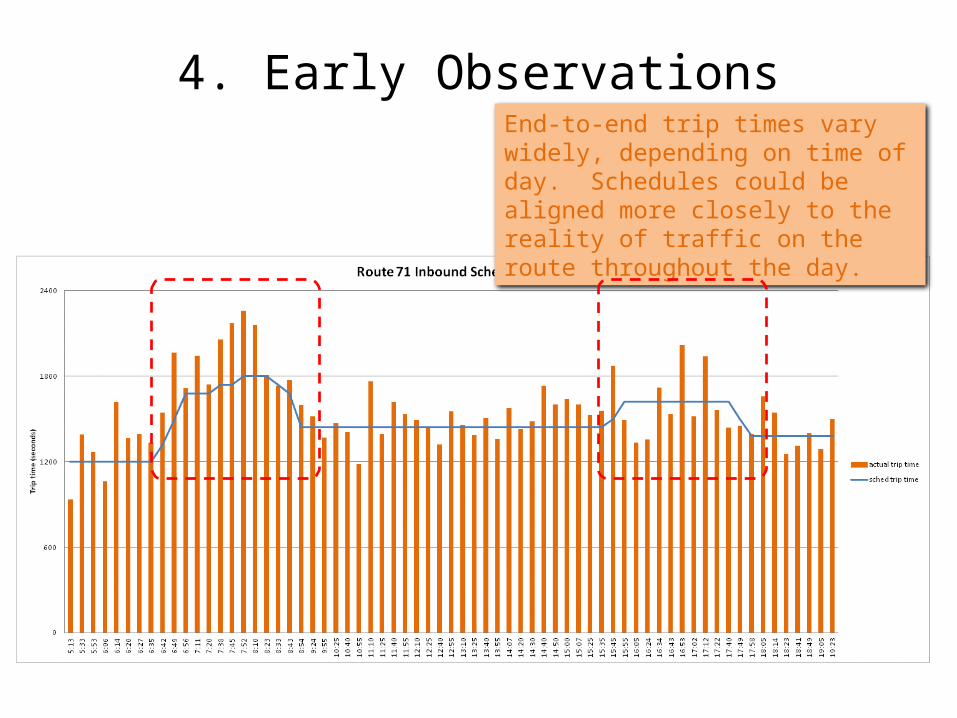
4. Early ObservationsEnd-to-end trip times vary widely, depending on time of day. Schedules could be aligned more closely to the reality of traffic on the route throughout the day.
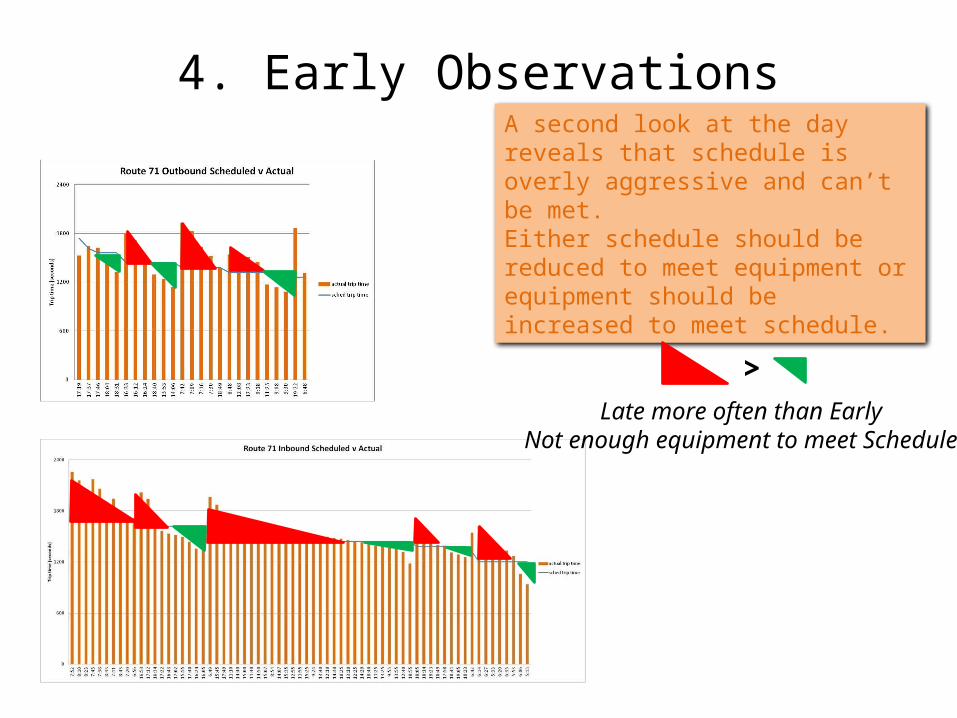
4. Early ObservationsA second look at the day reveals that schedule is overly aggressive and can’t be met.Either schedule should be reduced to meet equipment or equipment should be increased to meet schedule.
>Late more often than Early
Not enough equipment to meet Schedule
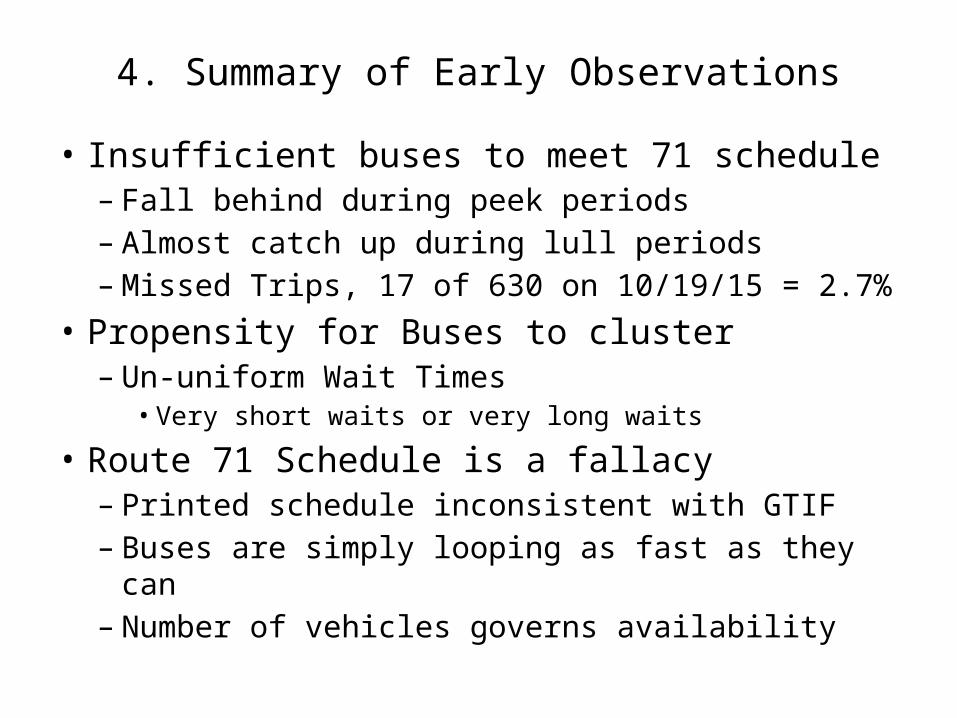
4. Summary of Early Observations
• Insufficient buses to meet 71 schedule– Fall behind during peek periods– Almost catch up during lull periods– Missed Trips, 17 of 630 on 10/19/15 = 2.7%
• Propensity for Buses to cluster– Un-uniform Wait Times
• Very short waits or very long waits
• Route 71 Schedule is a fallacy– Printed schedule inconsistent with GTIF– Buses are simply looping as fast as they can– Number of vehicles governs availability
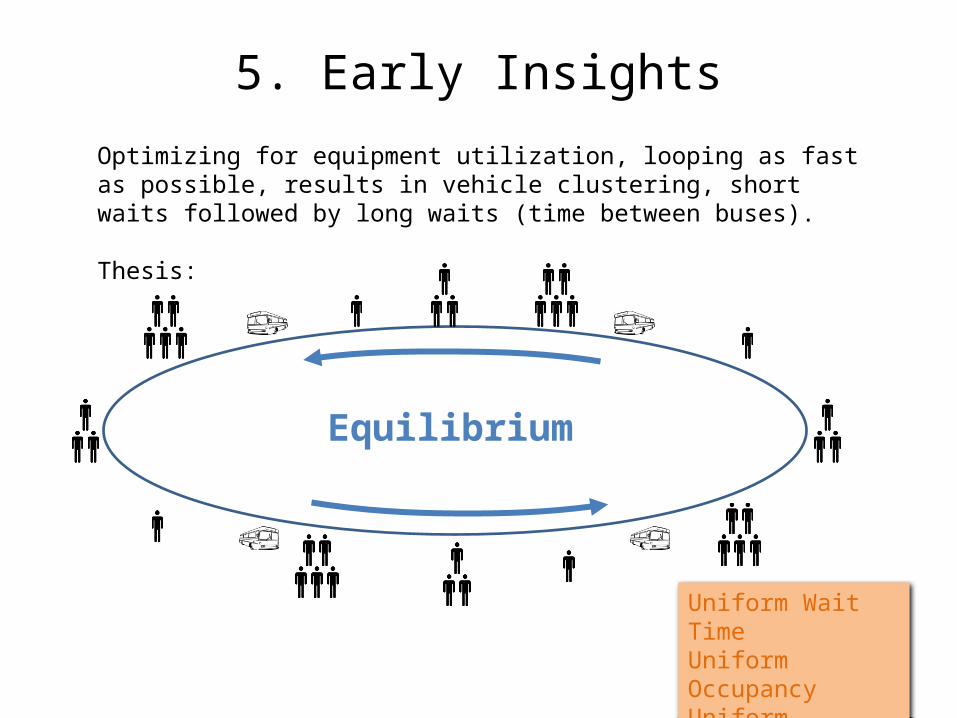
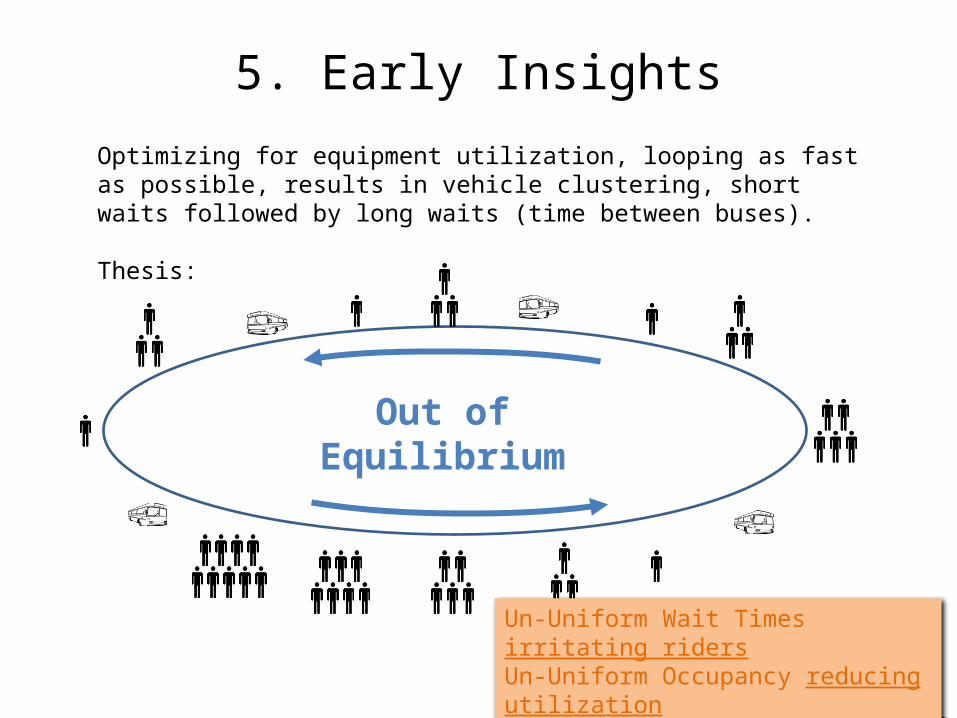
5. Early InsightsOptimizing for equipment utilization, looping as fast as possible, results in vehicle clustering, short waits followed by long waits (time between buses).
Thesis:
Equilibrium
Uniform Wait TimeUniform OccupancyUniform Velocity
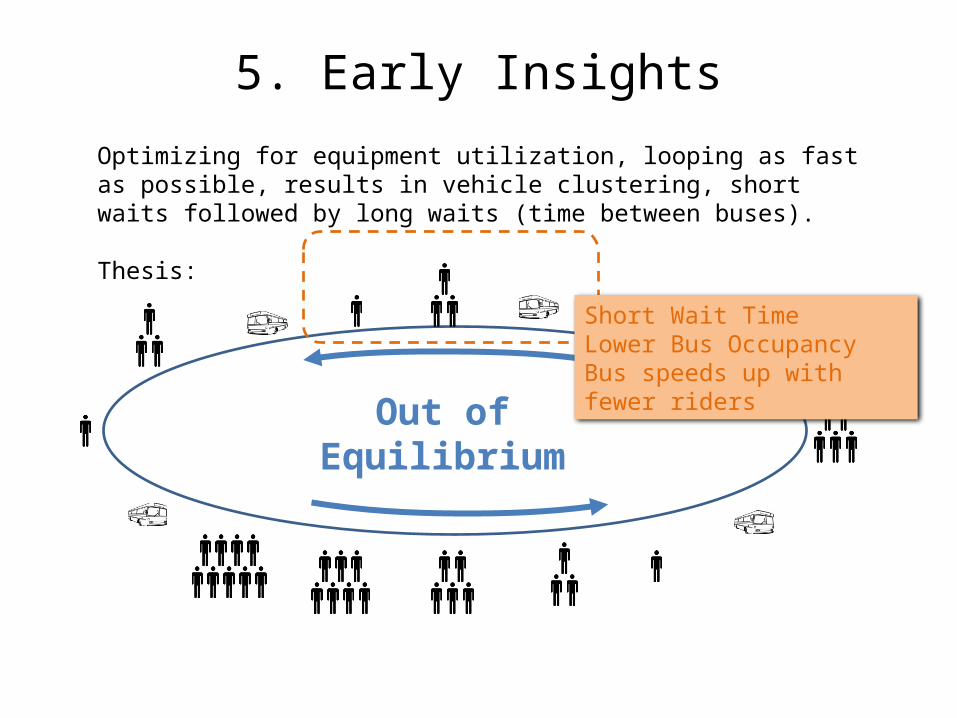
5. Early InsightsOptimizing for equipment utilization, looping as fast as possible, results in vehicle clustering, short waits followed by long waits (time between buses).
Thesis:
Out ofEquilibrium
Short Wait TimeLower Bus OccupancyBus speeds up with fewer riders
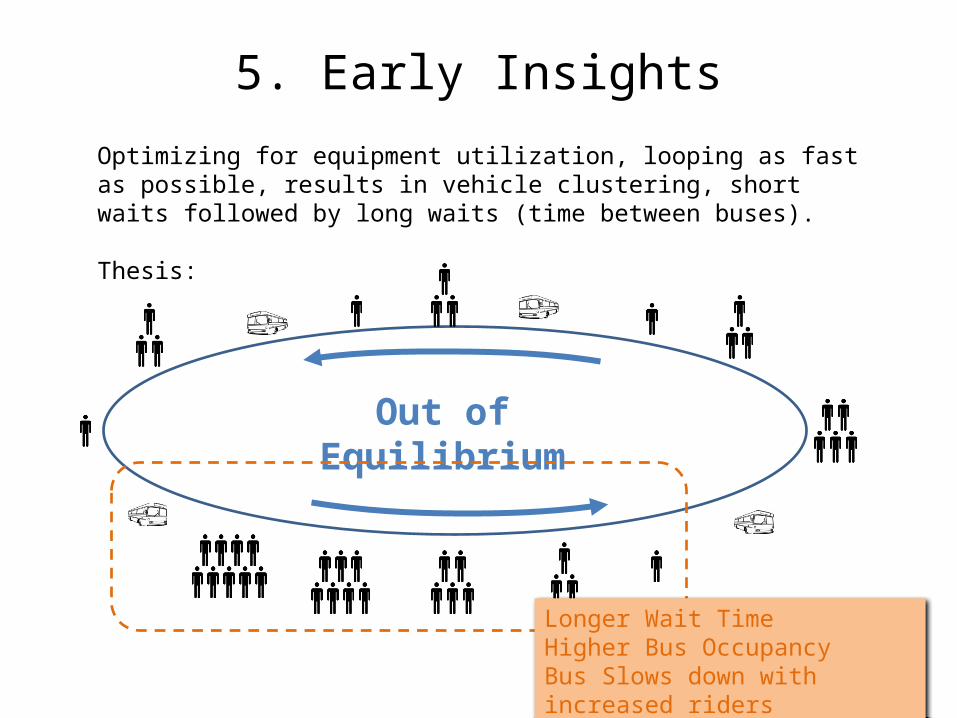
5. Early InsightsOptimizing for equipment utilization, looping as fast as possible, results in vehicle clustering, short waits followed by long waits (time between buses).
Thesis:
Out ofEquilibrium
Longer Wait TimeHigher Bus OccupancyBus Slows down with increased riders
5. Early InsightsOptimizing for equipment utilization, looping as fast as possible, results in vehicle clustering, short waits followed by long waits (time between buses).
Thesis:
Out ofEquilibrium
Un-Uniform Wait Times irritating ridersUn-Uniform Occupancy reducing utilizationSpeed impacted, exacerbates clustering
6. Early Recommendations to MBTA• Align schedules, printed and GTIF/internal
• Set realistic schedules based on analysis
• Space vehicles more uniformly to reduce maximum rider wait times– Requires thought to balance schedule with rider experience – should
be “tuned” through A/B testing
• Send location update when bus at stop and door open– Improve accuracy of future analyses
• Add Ridership data to feed– # people (or weight of vehicle for approximation)
– Anonymized load/unload so individual rider trips can be analyzed
6. Early Recommendations to MBTA
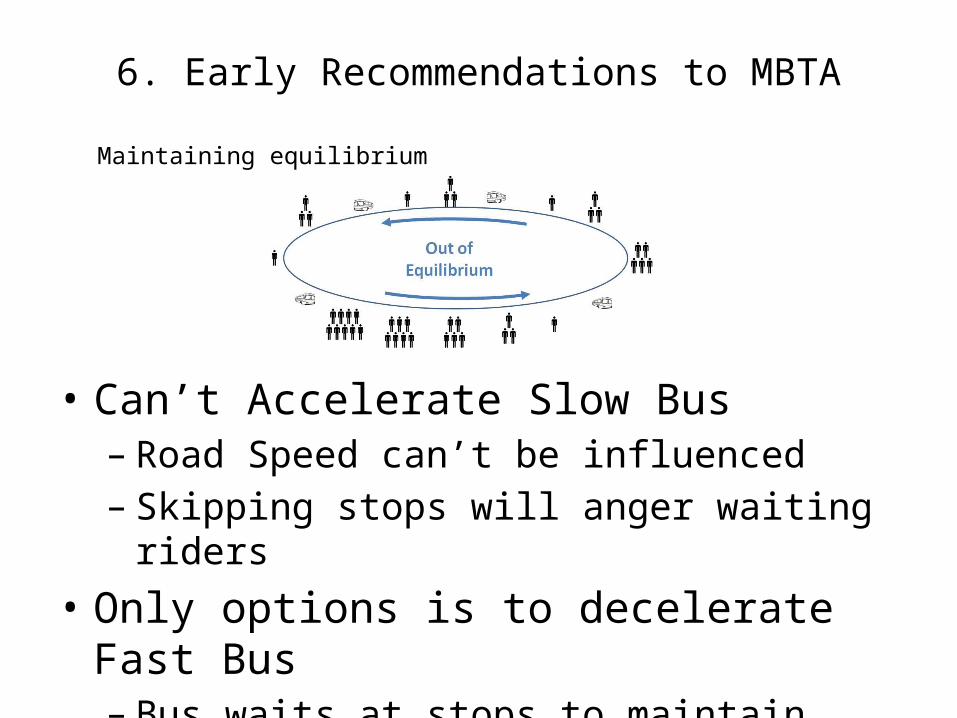
• Can’t Accelerate Slow Bus– Road Speed can’t be influenced– Skipping stops will anger waiting riders
• Only options is to decelerate Fast Bus– Bus waits at stops to maintain spacing
Maintaining equilibrium
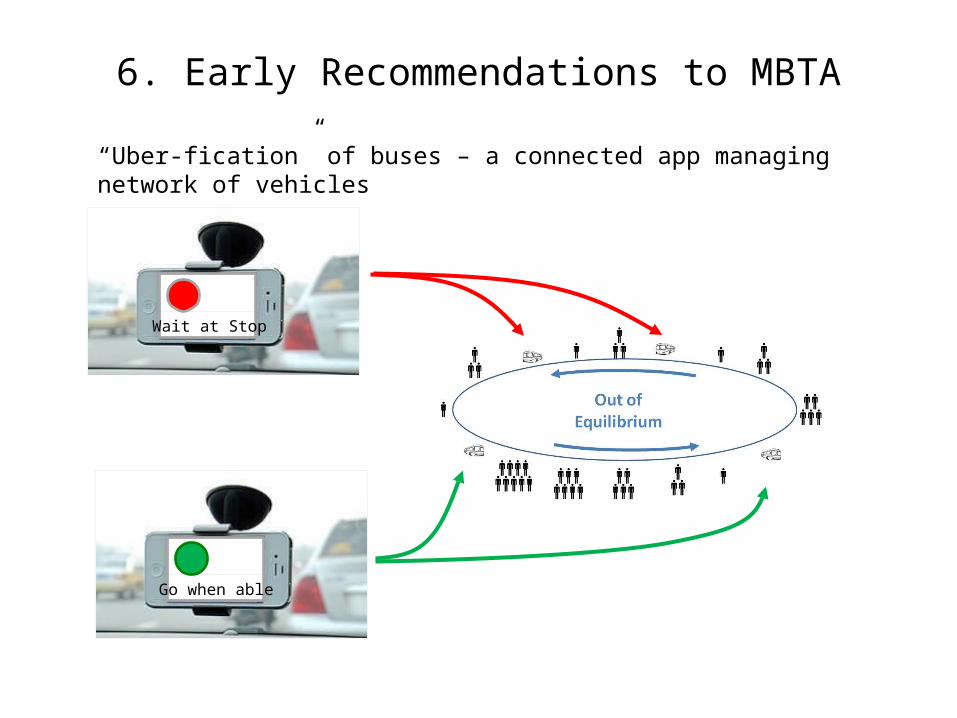
6. Early Recommendations to MBTA“Uber-fication” of buses – a connected app managing network of vehicles
Wait at Stop
Go when able
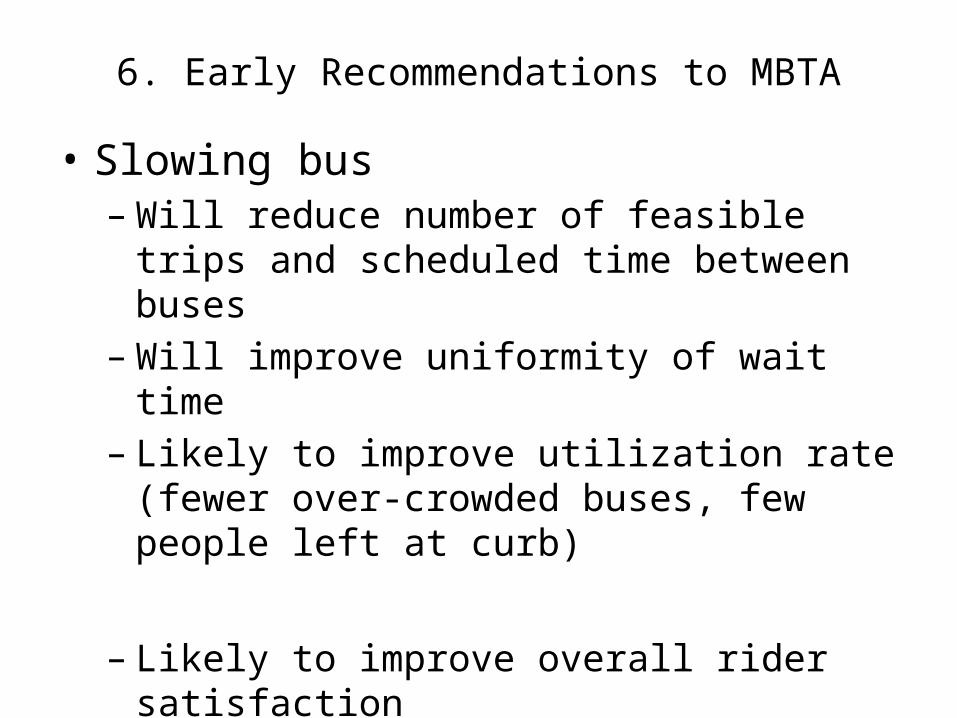
6. Early Recommendations to MBTA
• Slowing bus– Will reduce number of feasible trips and
scheduled time between buses– Will improve uniformity of wait time– Likely to improve utilization rate (fewer over-
crowded buses, few people left at curb)
– Likely to improve overall rider satisfaction
Thank you