Embed Size (px)
Citation preview
Past or backtested performance is no guarantee of future results. Potential for profi t is accompanied by possibility of loss. All strategies discussed herein are not actual live strategies offered by First Quadrant and are provided for conceptual discussion purposes only. The performance results therefore are shown gross of fees.
FQ P
ER
SP
EC
TIVE
FIR
STQ
UA
DR
AN
T.C
OM
1
FQ Perspective
Upside Capture and Downside Risk Mitigation
March 2015
JIA YE PhD
Partner, InvestmentsPAUL GOLDWHITE CFA
Director, Investments
Investors who had maintained their equity market exposures during the past fi ve years have a reason to celebrate. As of the end of June 2014, they achieved an av-erage annual return of 18.8% in the US market and 15.6% globally, both at the top quintiles of their respective histories. As the celebration runs its course, investors must wonder what the future holds. In particular, do past results provide any hint about the future of equity investing?
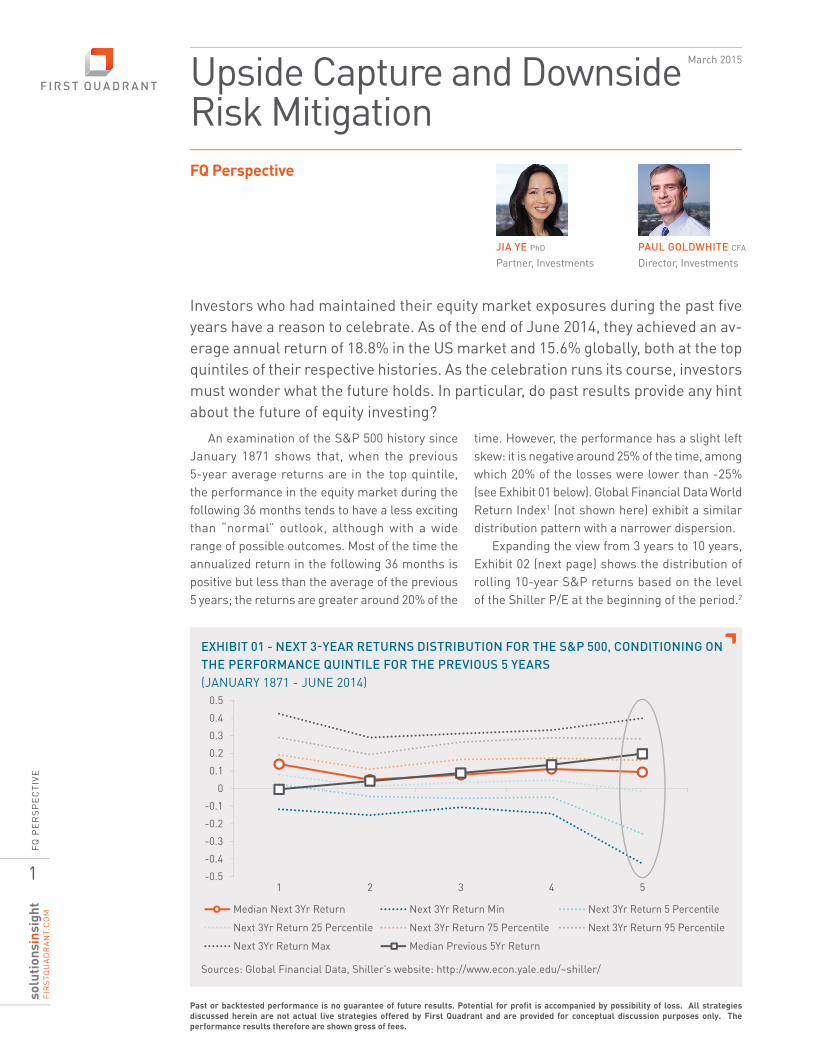
An examination of the S&P 500 history since January 1871 shows that, when the previous 5-year average returns are in the top quintile, the performance in the equity market during the following 36 months tends to have a less exciting than “normal” outlook, although with a wide range of possible outcomes. Most of the time the annualized return in the following 36 months is positive but less than the average of the previous 5 years; the returns are greater around 20% of the
time. However, the performance has a slight left skew: it is negative around 25% of the time, among which 20% of the losses were lower than -25% (see Exhibit 01 below). Global Financial Data World Return Index1 (not shown here) exhibit a similar distribution pattern with a narrower dispersion.
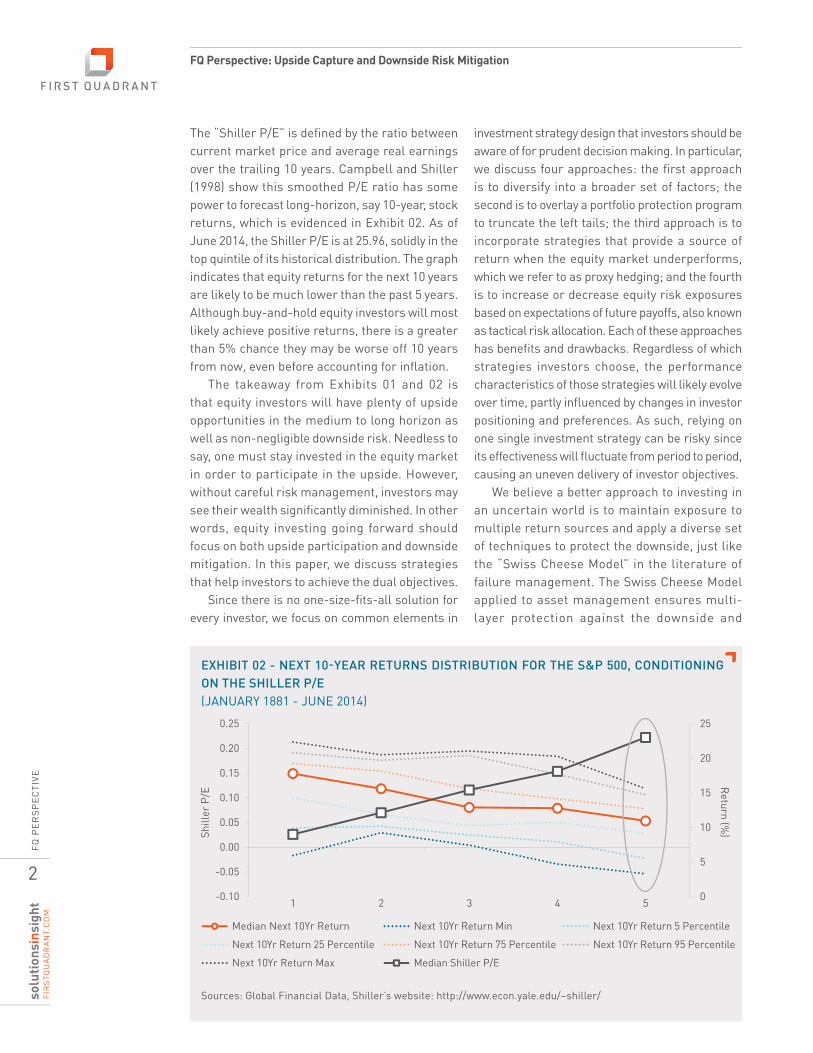
Expanding the view from 3 years to 10 years, Exhibit 02 (next page) shows the distribution of rolling 10-year S&P returns based on the level of the Shiller P/E at the beginning of the period.2
EXHIBIT 01 - NEXT 3-YEAR RETURNS DISTRIBUTION FOR THE S&P 500, CONDITIONING ON
THE PERFORMANCE QUINTILE FOR THE PREVIOUS 5 YEARS
(JANUARY 1871 - JUNE 2014)
Sources: Global Financial Data, Shiller’s website: http://www.econ.yale.edu/~shiller/
Median Next 3Yr Return Next 3Yr Return Min Next 3Yr Return 5 Percentile
Next 3Yr Return 25 Percentile Next 3Yr Return 75 Percentile Next 3Yr Return 95 Percentile
Next 3Yr Return Max Median Previous 5Yr Return
-0.5
-0.4
-0.3
-0.2
-0.1
0
0.1
0.2
0.3
0.4
0.5
1 2 3 4 5
FQ P
ER
SP
EC
TIVE
FIR
STQ
UA
DR
AN
T.C
OM
2
FQ Perspective: Upside Capture and Downside Risk Mitigation
The “Shiller P/E” is defi ned by the ratio between current market price and average real earnings over the trailing 10 years. Campbell and Shiller (1998) show this smoothed P/E ratio has some power to forecast long-horizon, say 10-year, stock returns, which is evidenced in Exhibit 02. As of June 2014, the Shiller P/E is at 25.96, solidly in the top quintile of its historical distribution. The graph indicates that equity returns for the next 10 years are likely to be much lower than the past 5 years. Although buy-and-hold equity investors will most likely achieve positive returns, there is a greater than 5% chance they may be worse off 10 years from now, even before accounting for infl ation.
The takeaway from Exhibits 01 and 02 is that equity investors will have plenty of upside opportunities in the medium to long horizon as well as non-negligible downside risk. Needless to say, one must stay invested in the equity market in order to participate in the upside. However, without careful risk management, investors may see their wealth signifi cantly diminished. In other words, equity investing going forward should focus on both upside participation and downside mitigation. In this paper, we discuss strategies that help investors to achieve the dual objectives.
Since there is no one-size-fi ts-all solution for every investor, we focus on common elements in
investment strategy design that investors should be aware of for prudent decision making. In particular, we discuss four approaches: the fi rst approach is to diversify into a broader set of factors; the second is to overlay a portfolio protection program to truncate the left tails; the third approach is to incorporate strategies that provide a source of return when the equity market underperforms, which we refer to as proxy hedging; and the fourth is to increase or decrease equity risk exposures based on expectations of future payoffs, also known as tactical risk allocation. Each of these approaches has benefi ts and drawbacks. Regardless of which strategies investors choose, the performance characteristics of those strategies will likely evolve over time, partly infl uenced by changes in investor positioning and preferences. As such, relying on one single investment strategy can be risky since its effectiveness will fl uctuate from period to period, causing an uneven delivery of investor objectives.
We believe a better approach to investing in an uncertain world is to maintain exposure to multiple return sources and apply a diverse set of techniques to protect the downside, just like the “Swiss Cheese Model” in the literature of failure management. The Swiss Cheese Model applied to asset management ensures multi-layer protection against the downside and
EXHIBIT 02 - NEXT 10-YEAR RETURNS DISTRIBUTION FOR THE S&P 500, CONDITIONING
ON THE SHILLER P/E
(JANUARY 1881 - JUNE 2014)
Sources: Global Financial Data, Shiller’s website: http://www.econ.yale.edu/~shiller/
0
5
10
15
20
25
-0.10
-0.05
0.00
0.05
0.10
0.15
0.20
0.25
1 2 3 4 5
Median Next 10Yr Return Next 10Yr Return Min Next 10Yr Return 5 Percentile
Next 10Yr Return 25 Percentile Next 10Yr Return 75 Percentile Next 10Yr Return 95 Percentile
Next 10Yr Return Max Median Shiller P/E
Shill
er P
/E
Return (%
)
FQ P
ER
SP
EC
TIVE
FIR
STQ
UA
DR
AN
T.C
OM
3
FQ Perspective: Upside Capture and Downside Risk Mitigation
multiple venues of participating in the upside. When these layers have low correlation both in outcomes and in concepts, investment strategies based on the Swiss Cheese Model tend to be robust and investors will have a better chance to achieve their objectives.
The paper is organized as follows. Section I discusses how our behavior can provide feedback to the market, causing a change in price patterns, and thus also in performance characteristics of investment strategies. In section II, we analyze the benefi ts and drawbacks of four approaches to generate capital appreciation with drawdown protection, and discuss the advantages of a multi-layer approach to achieve investor objectives. Section III summarizes our conclusions.
I. The Human Factor
Investing is all about decision making under uncertainty. Before the advent of Prospect Theory (Kahneman and Tversky, 1979), economic models of decision making under uncertainty generally assume that decision makers are rational with a preference to maximize their expected utility. Specifically, when facing uncertainty we are expected to take into account all the information we have to make cool-headed calculations about the choices we face, the outcomes each choice may lead to, and their probabilities. In reality, decisions are made in social and emotional contexts that are often complex, confusing, and with time pressure. Therefore, we use heuristics to make decisions; we rely on our innate risk preference, and we use anchoring and framing to narrow down the choices.3 This type of decision process is effi cient for human brains but it inevitably leads to biases, thus the difference between humans and robots. The beauty of Prospect Theory is that it provides an alternative version of (bounded) rationality that suits how the human brain functions, but not the unbiased and unemotional robots.
The asymmetry between how we make decisions when facing gains and losses is one of the most important fi ndings of Prospect Theory. The asymmetry can be used to explain our
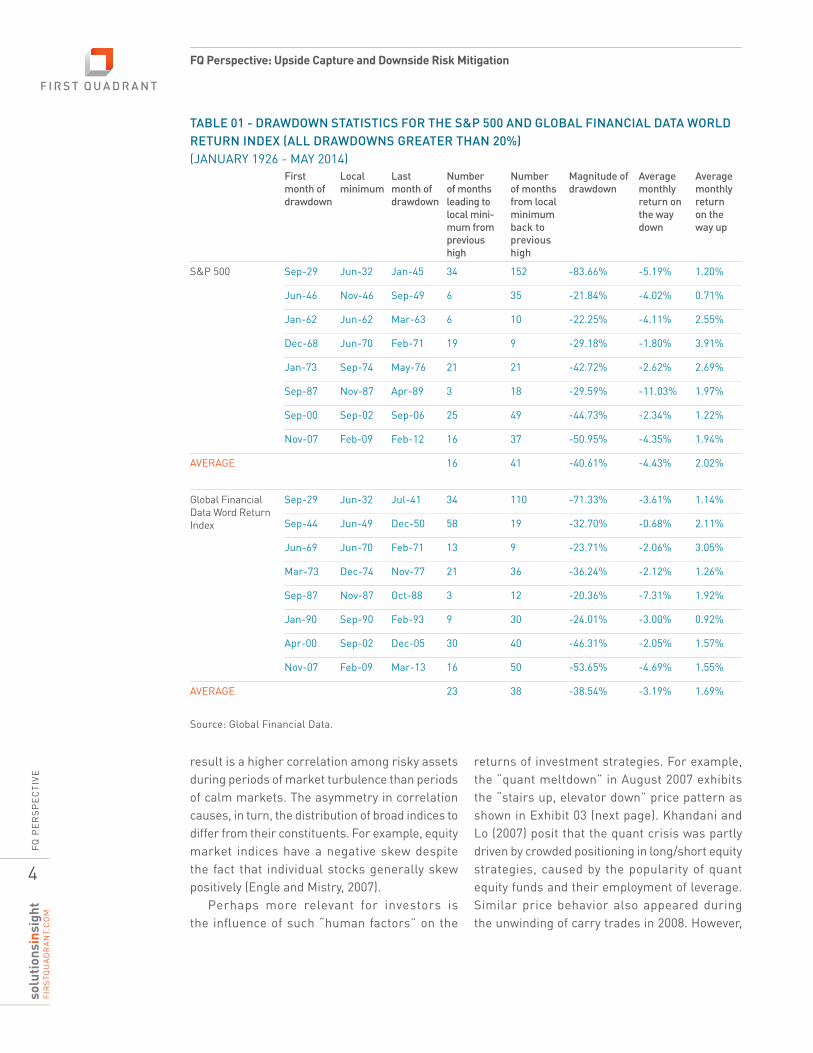
reluctance to accept fair bets on even chances and our general preference for the status quo. In investing, the asymmetry means that we are more reluctant to accept losses than gains. Investment writers often describe the performance pattern in the equity market as “taking the stairs up and the elevator down”. Table 01 (next page) shows all the drawdowns greater than 20% for the S&P 500 and the Global Financial Data World Return Index4 between January 1926 and May 2014. The table reports the dates of these drawdowns, their respective magnitudes, durations both on the way up and on the way down, and the corresponding average monthly returns. The results show that declines indeed tend to be fast and steep, while ascents are slower and more gradual. We conjecture that this empirical regularity is partly driven by the combination of overall long positioning in the market and our asymmetric valuation towards gains and losses.
The human “imprint” appears in the inter-relationship among securities as well. For example, Ang and Chen (2001) report that individual stocks and the aggregate market have greater correlation for downside moves than for upside moves. Another example is that the equity markets moved in lock-step with high-yielding currencies, such as the Australian dollar and New Zealand dollar, during the second half of 2008, the climax of the great recession. In fact, the latter example is often described as a symptom of the global liquidity crisis triggered by funding shortages, leverage limits, margin calls, stop-loss thresholds, etc. Here we argue that our innate loss aversion and desire to protect our wealth are non-negligible forces as well. During market stresses purchasing insurance tends to be very expensive; for example, as the VIX5 was at a record level in October 2008, so were the risk reversals of the Australian dollar and New Zealand dollar. Therefore, investors reduced their risky holdings in order to protect their wealth. Additionally, when the fear of losses was looming large, withdrawals tended to be implemented in a hurry and affected a broad cross-section of risky assets. The empirical
FQ P
ER
SP
EC
TIVE
FIR
STQ
UA
DR
AN
T.C
OM
4
FQ Perspective: Upside Capture and Downside Risk Mitigation
result is a higher correlation among risky assets during periods of market turbulence than periods of calm markets. The asymmetry in correlation causes, in turn, the distribution of broad indices to differ from their constituents. For example, equity market indices have a negative skew despite the fact that individual stocks generally skew positively (Engle and Mistry, 2007).
Perhaps more relevant for investors is the infl uence of such “human factors” on the
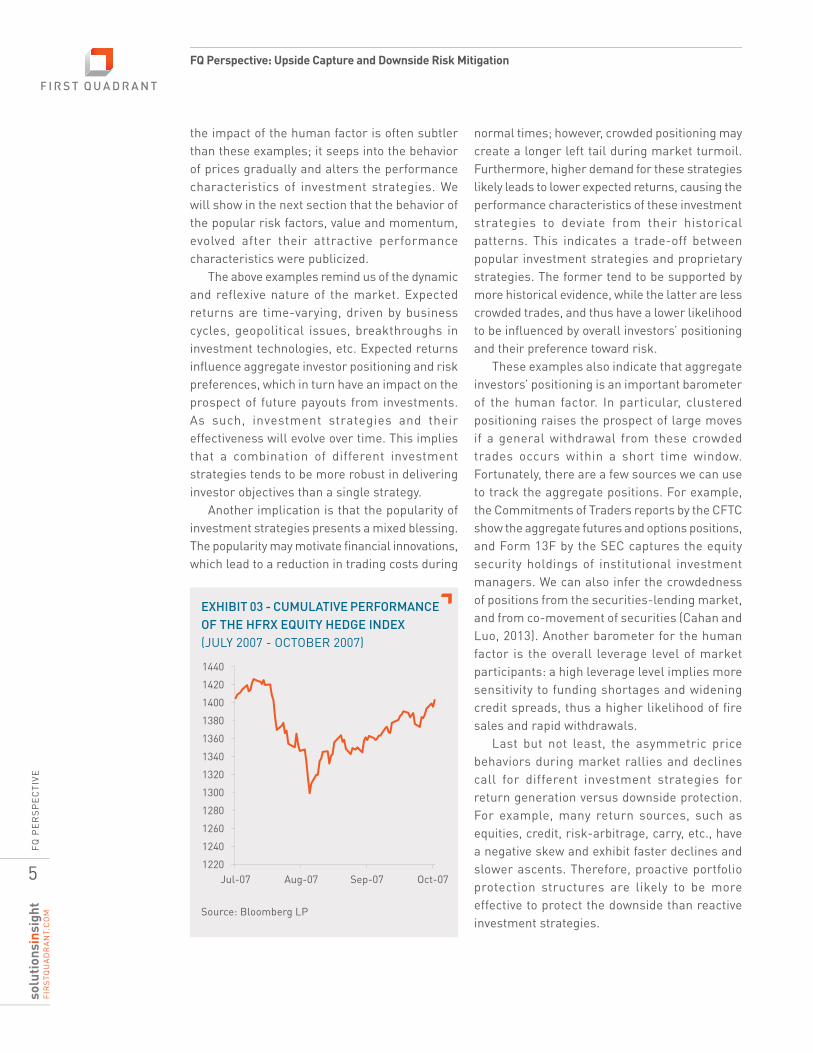
returns of investment strategies. For example, the “quant meltdown” in August 2007 exhibits the “stairs up, elevator down” price pattern as shown in Exhibit 03 (next page). Khandani and Lo (2007) posit that the quant crisis was partly driven by crowded positioning in long/short equity strategies, caused by the popularity of quant equity funds and their employment of leverage. Similar price behavior also appeared during the unwinding of carry trades in 2008. However,
TABLE 01 - DRAWDOWN STATISTICS FOR THE S&P 500 AND GLOBAL FINANCIAL DATA WORLD
RETURN INDEX (ALL DRAWDOWNS GREATER THAN 20%)
(JANUARY 1926 - MAY 2014)First
month of
drawdown
Local
minimum
Last
month of
drawdown
Number
of months
leading to
local mini-
mum from
previous
high
Number
of months
from local
minimum
back to
previous
high
Magnitude of
drawdown
Average
monthly
return on
the way
down
Average
monthly
return
on the
way up
S&P 500 Sep-29 Jun-32 Jan-45 34 152 -83.66% -5.19% 1.20%
Jun-46 Nov-46 Sep-49 6 35 -21.84% -4.02% 0.71%
Jan-62 Jun-62 Mar-63 6 10 -22.25% -4.11% 2.55%
Dec-68 Jun-70 Feb-71 19 9 -29.18% -1.80% 3.91%
Jan-73 Sep-74 May-76 21 21 -42.72% -2.62% 2.69%
Sep-87 Nov-87 Apr-89 3 18 -29.59% -11.03% 1.97%
Sep-00 Sep-02 Sep-06 25 49 -44.73% -2.34% 1.22%
Nov-07 Feb-09 Feb-12 16 37 -50.95% -4.35% 1.94%
AVERAGE 16 41 -40.61% -4.43% 2.02%
Global Financial Data Word Return Index
Sep-29 Jun-32 Jul-41 34 110 -71.33% -3.61% 1.14%
Sep-44 Jun-49 Dec-50 58 19 -32.70% -0.68% 2.11%
Jun-69 Jun-70 Feb-71 13 9 -23.71% -2.06% 3.05%
Mar-73 Dec-74 Nov-77 21 36 -36.24% -2.12% 1.26%
Sep-87 Nov-87 Oct-88 3 12 -20.36% -7.31% 1.92%
Jan-90 Sep-90 Feb-93 9 30 -24.01% -3.00% 0.92%
Apr-00 Sep-02 Dec-05 30 40 -46.31% -2.05% 1.57%
Nov-07 Feb-09 Mar-13 16 50 -53.65% -4.69% 1.55%
AVERAGE 23 38 -38.54% -3.19% 1.69%
Source: Global Financial Data.
FQ P
ER
SP
EC
TIVE
FIR
STQ
UA
DR
AN
T.C
OM
5
FQ Perspective: Upside Capture and Downside Risk Mitigation
the impact of the human factor is often subtler than these examples; it seeps into the behavior of prices gradually and alters the performance characteristics of investment strategies. We will show in the next section that the behavior of the popular risk factors, value and momentum, evolved after their attractive performance characteristics were publicized.
The above examples remind us of the dynamic and reflexive nature of the market. Expected returns are time-varying, driven by business cycles, geopolitical issues, breakthroughs in investment technologies, etc. Expected returns infl uence aggregate investor positioning and risk preferences, which in turn have an impact on the prospect of future payouts from investments. As such, investment strategies and their effectiveness will evolve over time. This implies that a combination of different investment strategies tends to be more robust in delivering investor objectives than a single strategy.
Another implication is that the popularity of investment strategies presents a mixed blessing. The popularity may motivate fi nancial innovations, which lead to a reduction in trading costs during
normal times; however, crowded positioning may create a longer left tail during market turmoil. Furthermore, higher demand for these strategies likely leads to lower expected returns, causing the performance characteristics of these investment strategies to deviate from their historical patterns. This indicates a trade-off between popular investment strategies and proprietary strategies. The former tend to be supported by more historical evidence, while the latter are less crowded trades, and thus have a lower likelihood to be infl uenced by overall investors’ positioning and their preference toward risk.
These examples also indicate that aggregate investors’ positioning is an important barometer of the human factor. In particular, clustered positioning raises the prospect of large moves if a general withdrawal from these crowded trades occurs within a short time window. Fortunately, there are a few sources we can use to track the aggregate positions. For example, the Commitments of Traders reports by the CFTC show the aggregate futures and options positions, and Form 13F by the SEC captures the equity security holdings of institutional investment managers. We can also infer the crowdedness of positions from the securities-lending market, and from co-movement of securities (Cahan and Luo, 2013). Another barometer for the human factor is the overall leverage level of market participants: a high leverage level implies more sensitivity to funding shortages and widening credit spreads, thus a higher likelihood of fi re sales and rapid withdrawals.
Last but not least, the asymmetric price behaviors during market rallies and declines call for different investment strategies for return generation versus downside protection. For example, many return sources, such as equities, credit, risk-arbitrage, carry, etc., have a negative skew and exhibit faster declines and slower ascents. Therefore, proactive portfolio protection structures are likely to be more effective to protect the downside than reactive investment strategies.
EXHIBIT 03 - CUMULATIVE PERFORMANCE
OF THE HFRX EQUITY HEDGE INDEX
(JULY 2007 - OCTOBER 2007)
Source: Bloomberg LP
1220
1240
1260
1280
1300
1320
1340
1360
1380
1400
1420
1440
Jul-07 Aug-07 Sep-07 Oct-07
FQ P
ER
SP
EC
TIVE
FIR
STQ
UA
DR
AN
T.C
OM
6
FQ Perspective: Upside Capture and Downside Risk Mitigation
II. Investment Strategies for Upside
Capture and Downside Protection
Investor objectives and preferences are diverse, thus a one-size-fits-all investment strategy does not exist. However, there are a few common elements good investment strategies generally share. In this section, we shall highlight these elements and provide a conceptual framework for building investment strategies that may be effective in capturing the upside and mitigating the downside. We divide these elements into four categories: factor diversifi cation, portfolio protection, proxy hedging, and tactical risk allocation. We discuss their benefi ts, drawbacks, and how investors may utilize these elements to achieve their investment objectives. The discussions focus on equity risk, although the concepts and analyses can be easily generalized to other types of risk in the market.
II.I Factor Diversifi cation
The first and most important element for upside capture and downside protection is factor diversifi cation. Factors are drivers of security returns that cannot be diversifi ed or arbitraged away, either because of rational economic fundamentals or non-rational behavioral biases. Each of these factors has its own set of bad times and investors collect premia from being exposed to them. In general, factors that perform poorly in bad economic times command high premia in the market. The equity risk premium is often considered the most important source of capital appreciation for long-term investors, partly because the bad times of equity investing tend to coincide with poor economic states or low points of business cycles. Empirical evidence so far indicates that the correlations between factors and the equity market returns tend to be low. Therefore, factor diversifi cation has the potential benefi t of lowering downside risk while maintaining a similar level of expected returns.
Many investment writers fondly refer to diversification as the only thing close to a “free lunch” in investment. Nevertheless, the
implementation of the diversifi cation concept is not without risk. Poor application often results in sub-optimal investment strategies. For example, the effi ciency gains from holding a large number of assets will be rather limited if those assets are highly correlated. Similarly, holding assets with similar notional value but a large difference in risk, such as the 60/40 stock/bond portfolio, does not benefi t much from diversifi cation either. On the other hand, exposure to a diverse set of factors that have low correlations with equity market returns and among themselves can potentially generate signifi cant effi ciency gains.
For an illustration, we constructed three sample strategies based on two popular factors investors use: value and momentum:6
A long/short strategy that equally weights value and momentum;
A long-only strategy that equally weights value and momentum; and
A strategy that overlays the S&P 500 Index with the long/short value-momentum strategy.
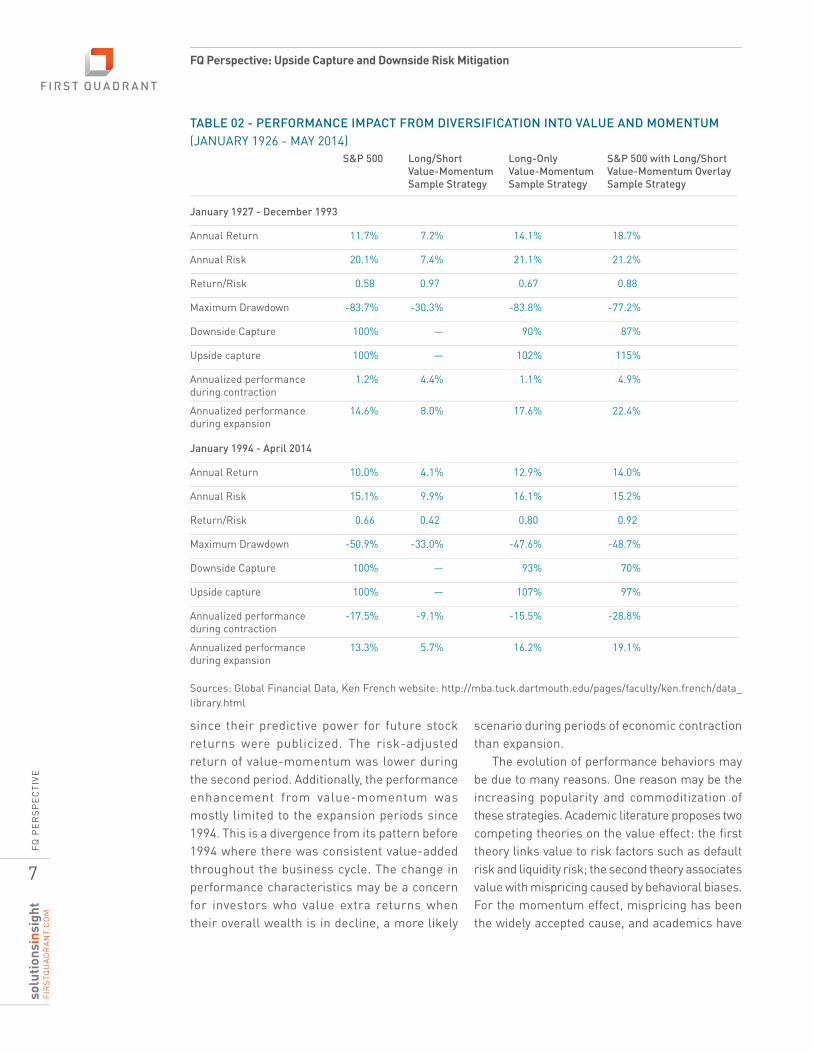
For ease of comparison, the last two strategies are risk-adjusted based on expanding windows of realized risk to match the S&P 500 during the same period. Table 02 below shows the performance characteristics of these strategies, including their upside and downside capture vs. the S&P 500, and their average performance during contraction and expansion periods as defi ned by the NBER. We divide the sample history into two periods: January 1927 to December 1993, and January 1994 to April 2014. Information on the value and momentum anomalies was publically available during the second period.7
The results show that diversification into value-momentum tends to lead to a signifi cant improvement in risk-adjusted returns and a reduction in downside during both periods. In this example, the overlay strategy outperformed the long-only strategy, refl ecting the benefi ts investors gain from the ability to hold short positions and to incorporate leverage in the portfolio.
It is worth noting that the characteristics of the value-momentum strategy have evolved
FQ P
ER
SP
EC
TIVE
FIR
STQ
UA
DR
AN
T.C
OM
7
FQ Perspective: Upside Capture and Downside Risk Mitigation
since their predictive power for future stock returns were publicized. The risk-adjusted return of value-momentum was lower during the second period. Additionally, the performance enhancement from value-momentum was mostly limited to the expansion periods since 1994. This is a divergence from its pattern before 1994 where there was consistent value-added throughout the business cycle. The change in performance characteristics may be a concern for investors who value extra returns when their overall wealth is in decline, a more likely
scenario during periods of economic contraction than expansion.
The evolution of performance behaviors may be due to many reasons. One reason may be the increasing popularity and commoditization of these strategies. Academic literature proposes two competing theories on the value effect: the fi rst theory links value to risk factors such as default risk and liquidity risk; the second theory associates value with mispricing caused by behavioral biases. For the momentum effect, mispricing has been the widely accepted cause, and academics have
S&P 500 Long/Short
Value-Momentum
Sample Strategy
Long-Only
Value-Momentum
Sample Strategy
S&P 500 with Long/Short
Value-Momentum Overlay
Sample Strategy
January 1927 - December 1993
Annual Return 11.7% 7.2% 14.1% 18.7%
Annual Risk 20.1% 7.4% 21.1% 21.2%
Return/Risk 0.58 0.97 0.67 0.88
Maximum Drawdown -83.7% -30.3% -83.8% -77.2%
Downside Capture 100% — 90% 87%
Upside capture 100% — 102% 115%
Annualized performance during contraction
1.2% 4.4% 1.1% 4.9%
Annualized performance during expansion
14.6% 8.0% 17.6% 22.4%
January 1994 - April 2014
Annual Return 10.0% 4.1% 12.9% 14.0%
Annual Risk 15.1% 9.9% 16.1% 15.2%
Return/Risk 0.66 0.42 0.80 0.92
Maximum Drawdown -50.9% -33.0% -47.6% -48.7%
Downside Capture 100% — 93% 70%
Upside capture 100% — 107% 97%
Annualized performance during contraction
-17.5% -9.1% -15.5% -28.8%
Annualized performance during expansion
13.3% 5.7% 16.2% 19.1%
Sources: Global Financial Data, Ken French website: http://mba.tuck.dartmouth.edu/pages/faculty/ken.french/data_library.html
TABLE 02 - PERFORMANCE IMPACT FROM DIVERSIFICATION INTO VALUE AND MOMENTUM
(JANUARY 1926 - MAY 2014)
FQ P
ER
SP
EC
TIVE
FIR
STQ
UA
DR
AN
T.C
OM
8
FQ Perspective: Upside Capture and Downside Risk Mitigation
struggled to associate momentum with risk. To the extent that mispricing is a driver, higher demand for value and momentum strategies may counteract the behavioral biases and arbitrage the mispricing away. Additionally, crowded positioning in momentum may be destabilizing (Stein, 2009) since the strategy lacks a fundamental anchor; i.e., momentum traders do not base their strategies on independent estimates such as valuation; thus the strategy tends to crash and revert periodically (Lou and Polk, 2014). In other words, the “human factor” we discuss in the previous section seems to play an active role in infl uencing the performance behaviors of value and momentum.
There are many other factors (see Ang, 2012 and Ilmanen, 2011 for a more detailed description) investors may seek exposure to that generate positive expected returns, such as quality, low volatility, etc. Similar to value and momentum, these factors are subjected to the infl uence of investor positioning and preferences, and will evolve over time. Investors should determine what factors to invest in according to how these factors will help them achieve their objectives. Regardless of which factors investors choose, our expectation is that factor diversifi cation enhances the risk-adjusted returns over traditional asset classes such as equities and bonds, and therefore, we believe, it should be a permanent feature of investment portfolios.
A natural question then is, are investor interests ful ly served through factor diversifi cation? We do not think they are. One limitation is that factor diversifi cation does not directly address the downside of equity risk, which some investors may desire. Additionally, correlation among factors varies over time. In particular, the average correlation may increase in times of crisis as more investors include factor strategies in their portfolios, which renders factor diversification less effective. On the other hand, market downturns can be sudden and substantial as shown earlier in the paper, and therefore for some investors the downside
protection from factor diversifi cation alone may not be adequate. We believe these investors will benefi t from including additional elements into their investment portfolios that specifi cally target the management of downside risk.
II.II Portfolio Protection
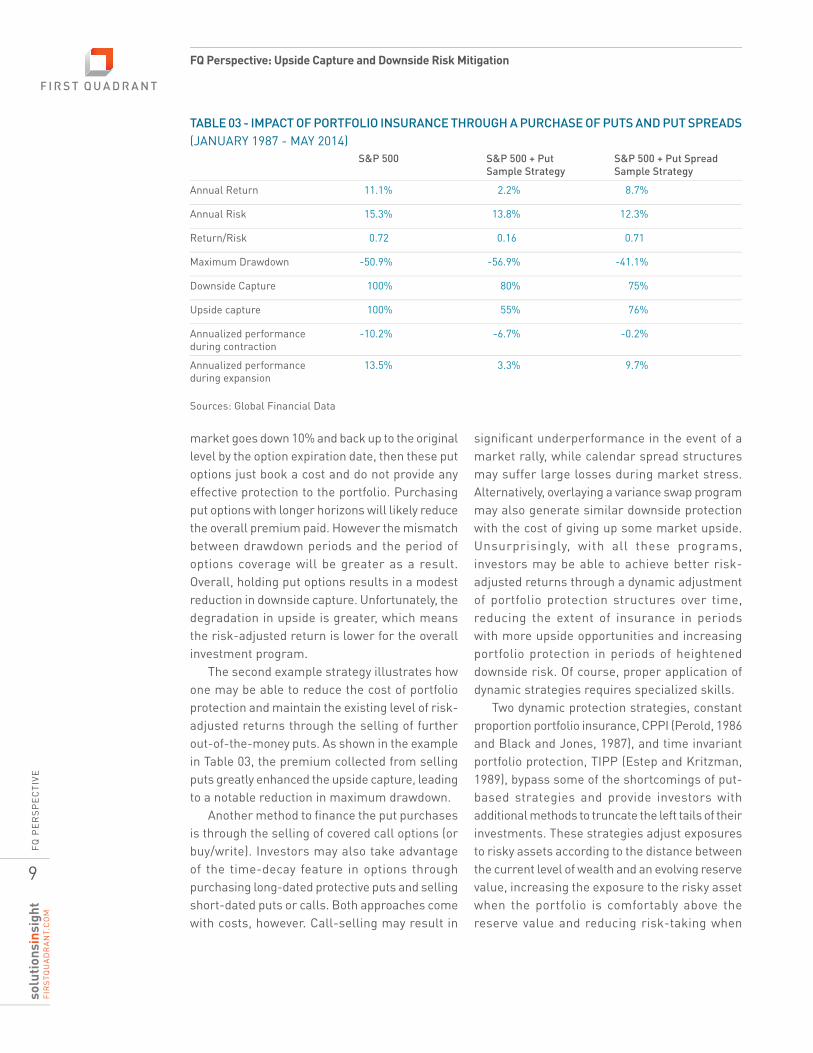
A common approach to managing the downside risk is by overlaying a portfolio protection program. The selection of these programs tends to vary according to the needs of investors; for example, some investors set explicit fl oors for the extent of losses they are willing to take; others link their return targets and risk tolerances to the overall funding status of their assets. Table 03 (next page) shows examples of two different put-based strategies to protect the downside of equity risk. The fi rst strategy involves overlaying equity market exposure with the purchase of 3-month put options on S&P 500 futures that are rolled quarterly one day before expiration; the strikes of these options are set around one standard deviation away from the market price at the time of the purchase. The second strategy involves the purchase of put spreads on S&P 500 futures, i.e. long and short 3-month options that are one and two standard deviations away from the market price respectively.8
By construction, the fi rst example strategy is expected to provide better protection against downside risk than the second strategy, simply due to the fact that the second strategy explicitly limits the protection to within a two-standard-deviation downward price movement. In reality, the outcome of purchasing put options for downside protection is very poor for two reasons. The fi rst reason is that investors pay a signifi cant risk premium for put options on the equity market due to the overall long positioning in the market and risk aversion of market participants; the premium can rise drastically during market turmoil which may coincide with roll periods. The second reason is that the time windows covered by the put options often do not overlap with the periods of market decline. For example, if the
FQ P
ER
SP
EC
TIVE
FIR
STQ
UA
DR
AN
T.C
OM
9
FQ Perspective: Upside Capture and Downside Risk Mitigation
market goes down 10% and back up to the original level by the option expiration date, then these put options just book a cost and do not provide any effective protection to the portfolio. Purchasing put options with longer horizons will likely reduce the overall premium paid. However the mismatch between drawdown periods and the period of options coverage will be greater as a result. Overall, holding put options results in a modest reduction in downside capture. Unfortunately, the degradation in upside is greater, which means the risk-adjusted return is lower for the overall investment program.
The second example strategy illustrates how one may be able to reduce the cost of portfolio protection and maintain the existing level of risk-adjusted returns through the selling of further out-of-the-money puts. As shown in the example in Table 03, the premium collected from selling puts greatly enhanced the upside capture, leading to a notable reduction in maximum drawdown.
Another method to fi nance the put purchases is through the selling of covered call options (or buy/write). Investors may also take advantage of the time-decay feature in options through purchasing long-dated protective puts and selling short-dated puts or calls. Both approaches come with costs, however. Call-selling may result in
signifi cant underperformance in the event of a market rally, while calendar spread structures may suffer large losses during market stress. Alternatively, overlaying a variance swap program may also generate similar downside protection with the cost of giving up some market upside. Unsurprisingly, with all these programs, investors may be able to achieve better risk-adjusted returns through a dynamic adjustment of portfolio protection structures over time, reducing the extent of insurance in periods with more upside opportunities and increasing portfolio protection in periods of heightened downside risk. Of course, proper application of dynamic strategies requires specialized skills.
Two dynamic protection strategies, constant proportion portfolio insurance, CPPI (Perold, 1986 and Black and Jones, 1987), and time invariant portfolio protection, TIPP (Estep and Kritzman, 1989), bypass some of the shortcomings of put-based strategies and provide investors with additional methods to truncate the left tails of their investments. These strategies adjust exposures to risky assets according to the distance between the current level of wealth and an evolving reserve value, increasing the exposure to the risky asset when the portfolio is comfortably above the reserve value and reducing risk-taking when
S&P 500 S&P 500 + Put
Sample Strategy
S&P 500 + Put Spread
Sample Strategy
Annual Return 11.1% 2.2% 8.7%
Annual Risk 15.3% 13.8% 12.3%
Return/Risk 0.72 0.16 0.71
Maximum Drawdown -50.9% -56.9% -41.1%
Downside Capture 100% 80% 75%
Upside capture 100% 55% 76%
Annualized performance during contraction
-10.2% -6.7% -0.2%
Annualized performance during expansion
13.5% 3.3% 9.7%
Sources: Global Financial Data
TABLE 03 - IMPACT OF PORTFOLIO INSURANCE THROUGH A PURCHASE OF PUTS AND PUT SPREADS
(JANUARY 1987 - MAY 2014)
FQ P
ER
SP
EC
TIVE
FIR
STQ
UA
DR
AN
T.C
OM
10
FQ Perspective: Upside Capture and Downside Risk Mitigation
the value of the portfolio is close to the level of maximum loss tolerance. The implementation of CPPI and TIPP is formulaic and simple enough to manage without relying on complicated technical tools or trading complex fi nancial instruments. However, outcomes of these strategies can vary widely depending on their respective parameters; and a proper selection of parameters is usually an elusive concept. Additionally, these strategies may result in non-trivial opportunity costs if the underlying risky assets have a mean-reverting performance pattern.
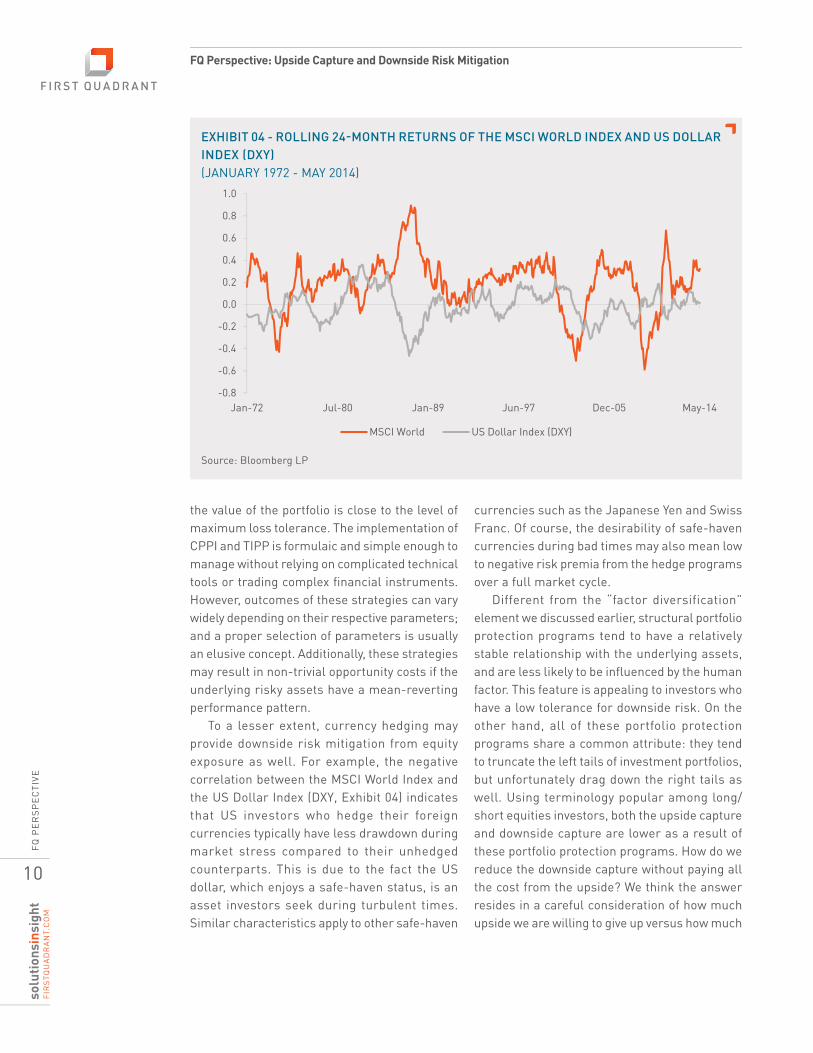
To a lesser extent, currency hedging may provide downside risk mitigation from equity exposure as well. For example, the negative correlation between the MSCI World Index and the US Dollar Index (DXY, Exhibit 04) indicates that US investors who hedge their foreign currencies typically have less drawdown during market stress compared to their unhedged counterparts. This is due to the fact the US dollar, which enjoys a safe-haven status, is an asset investors seek during turbulent times. Similar characteristics apply to other safe-haven
currencies such as the Japanese Yen and Swiss Franc. Of course, the desirability of safe-haven currencies during bad times may also mean low to negative risk premia from the hedge programs over a full market cycle.
Different from the “factor diversification” element we discussed earlier, structural portfolio protection programs tend to have a relatively stable relationship with the underlying assets, and are less likely to be infl uenced by the human factor. This feature is appealing to investors who have a low tolerance for downside risk. On the other hand, all of these portfolio protection programs share a common attribute: they tend to truncate the left tails of investment portfolios, but unfortunately drag down the right tails as well. Using terminology popular among long/short equities investors, both the upside capture and downside capture are lower as a result of these portfolio protection programs. How do we reduce the downside capture without paying all the cost from the upside? We think the answer resides in a careful consideration of how much upside we are willing to give up versus how much
EXHIBIT 04 - ROLLING 24-MONTH RETURNS OF THE MSCI WORLD INDEX AND US DOLLAR
INDEX (DXY)
(JANUARY 1972 - MAY 2014)
Source: Bloomberg LP
-0.8
-0.6
-0.4
-0.2
0.0
0.2
0.4
0.6
0.8
1.0
Jan-72 Jul-80 Jan-89 Jun-97 Dec-05 May-14
MSCI World US Dollar Index (DXY)
FQ P
ER
SP
EC
TIVE
FIR
STQ
UA
DR
AN
T.C
OM
11
FQ Perspective: Upside Capture and Downside Risk Mitigation
downside we would like to truncate, and when we will apply more of the “dry power” to capture market opportunities. In other words, portfolio protection should be a return-reshaping exercise rather than a pure reduction in risk taking, an important point that is often lost in the pursuit of portfolio protection.
II.III Proxy Hedging
Combining the concept of diversifi cation and the objective of downside protection, we now turn to a third type of investment strategy: proxy hedging. Proxy hedging refers to an overlay of investment strategies that have the potential to deliver positive expected returns and strong performance when the primary investment suffers losses. In other words, “proxy hedging” provides a source of diversifi cation that is targeted towards the primary risk of concern. Ideally, strategies in this category should be cash effi cient, fl exible, and highly liquid so that investors will be able to adjust their risk allocation when necessary. We highlight the cash effi ciency property because it generally comes with a lower risk of asset-liability mismatch and often with a better tax benefi t; many derivative-based strategies share such a property. As the name implies, these strategies tend not to be as reliable in truncating the left tails
as portfolio protection programs. However, they are self-fi nanced, i.e., they tend to have positive risk-adjusted returns, and their goal is to deliver the desirable impact of retaining the upside and reducing the downside.
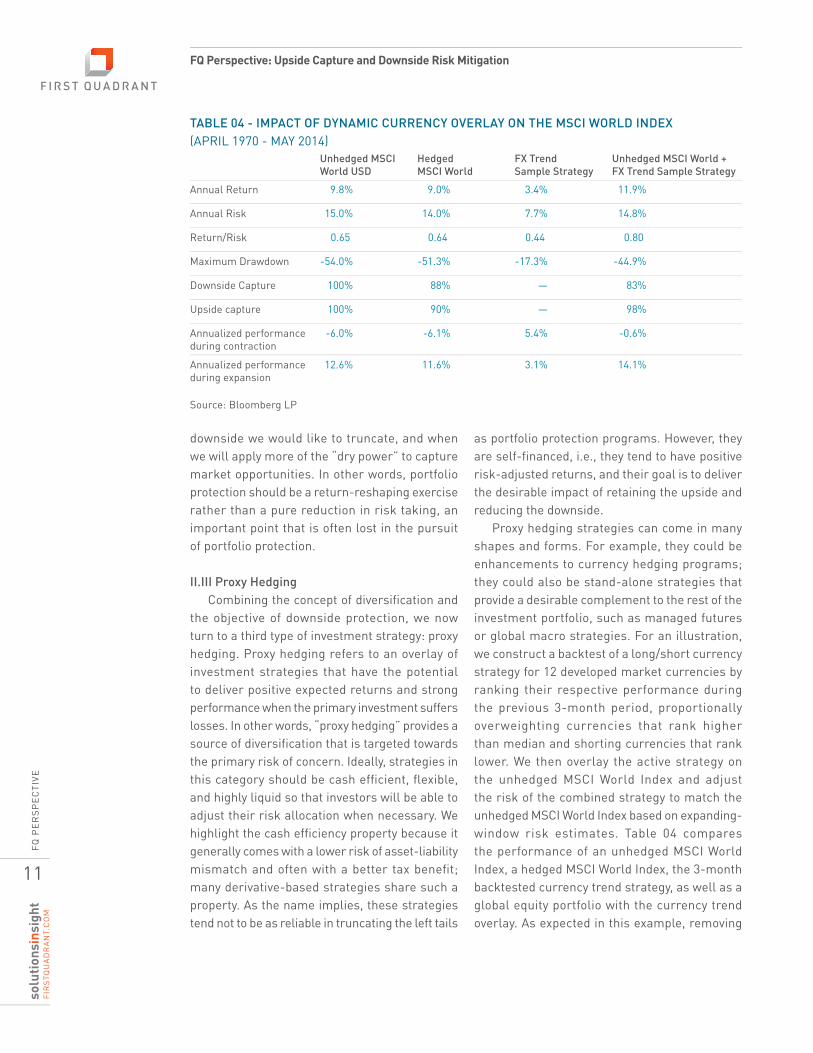
Proxy hedging strategies can come in many shapes and forms. For example, they could be enhancements to currency hedging programs; they could also be stand-alone strategies that provide a desirable complement to the rest of the investment portfolio, such as managed futures or global macro strategies. For an illustration, we construct a backtest of a long/short currency strategy for 12 developed market currencies by ranking their respective performance during the previous 3-month period, proportionally overweighting currencies that rank higher than median and shorting currencies that rank lower. We then overlay the active strategy on the unhedged MSCI World Index and adjust the risk of the combined strategy to match the unhedged MSCI World Index based on expanding-window risk estimates. Table 04 compares the performance of an unhedged MSCI World Index, a hedged MSCI World Index, the 3-month backtested currency trend strategy, as well as a global equity portfolio with the currency trend overlay. As expected in this example, removing
TABLE 04 - IMPACT OF DYNAMIC CURRENCY OVERLAY ON THE MSCI WORLD INDEX
(APRIL 1970 - MAY 2014) Unhedged MSCI
World USD
Hedged
MSCI World
FX Trend
Sample Strategy
Unhedged MSCI World +
FX Trend Sample Strategy
Annual Return 9.8% 9.0% 3.4% 11.9%
Annual Risk 15.0% 14.0% 7.7% 14.8%
Return/Risk 0.65 0.64 0.44 0.80
Maximum Drawdown -54.0% -51.3% -17.3% -44.9%
Downside Capture 100% 88% — 83%
Upside capture 100% 90% — 98%
Annualized performance during contraction
-6.0% -6.1% 5.4% -0.6%
Annualized performance during expansion
12.6% 11.6% 3.1% 14.1%
Source: Bloomberg LP
FQ P
ER
SP
EC
TIVE
FIR
STQ
UA
DR
AN
T.C
OM
12
FQ Perspective: Upside Capture and Downside Risk Mitigation
foreign exchange risk leads to a smaller maximum drawdown and a slightly lower risk-adjusted return for US dollar-based investors. Overall, currency hedging reduces the downside capture, but it unfortunately lowers the upside capture as well.
As illustrated, the active currency overlay fares better. It has a lower downside capture, a smaller maximum drawdown, and it retains nearly all the market upside. Additionally, the overlay strategy provides better performance throughout the full business cycle within our study, with a bigger lift in return during the contraction periods. However, the performance of the sample strategy tends to be sensitive to the selection of time windows for the currency trends, which may indicate a lower level of robustness for the strategy. On the other hand, the currency trend is not the only strategy with these desirable features. For example, one may achieve similar performance characteristics by overlaying strategies based on currency fundamentals (Nozaki, 2010) as well.
Managed futures strategies also tend to possess the desirable properties that would make them a suitable proxy hedge for equity portfolios (Abrams et. Al, 2012 and Till and Eagleeye, 2011).
These strategies take long and short positions using liquid derivative instruments such as exchange-traded futures, options, and foreign exchange forwards. The margin requirements of these instruments are generally low, thus cash can be deployed for more productive purposes. “Trend-following” is the dominant style among managed futures strategies. According to Fung and Hsieh (2001), trend-following has a payout profi le that resembles lookback straddles. As such, managed futures tend to deliver strong performance in pronounced market uptrends and downtrends. Similar to managed futures, global macro strategies take long and short positions in a wide variety of asset classes using mostly derivatives. Global macro can be discretionary or systematic, with the goal to deploy capital in places where best potential rewards lie. Unlike managed futures strategies that have the common theme of trend-following, global macro strategies encompass a wide range of styles.
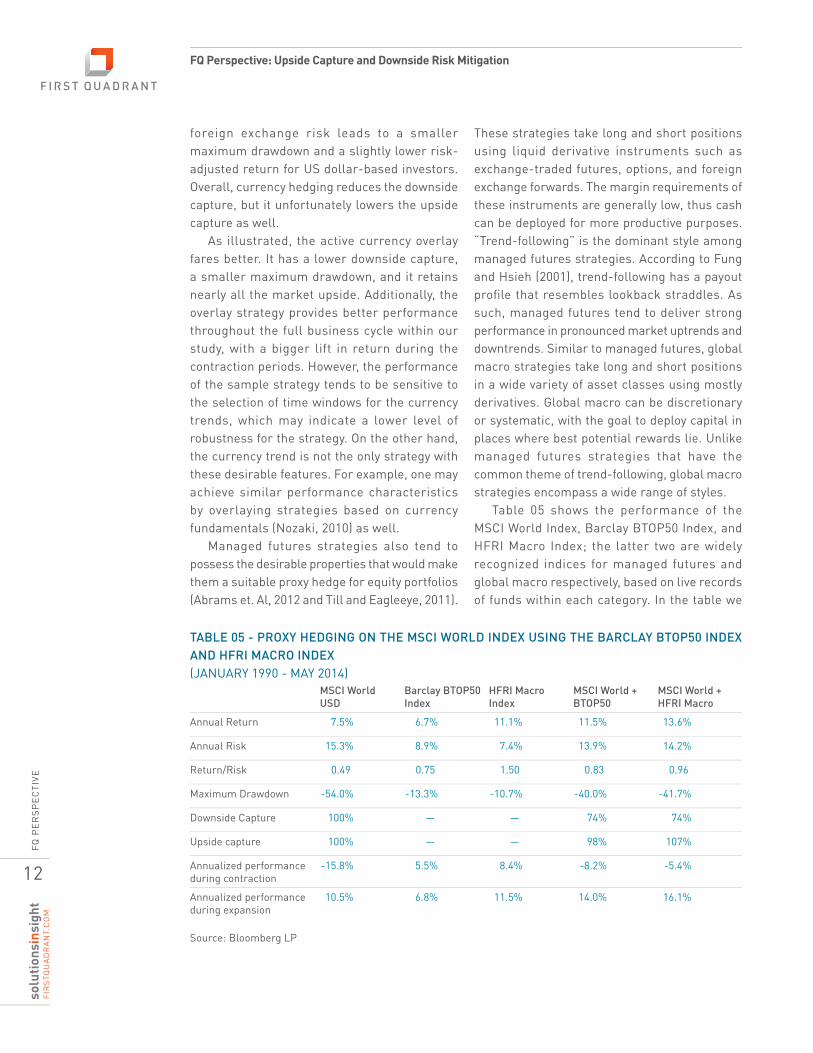
Table 05 shows the performance of the MSCI World Index, Barclay BTOP50 Index, and HFRI Macro Index; the latter two are widely recognized indices for managed futures and global macro respectively, based on live records of funds within each category. In the table we
MSCI World
USD
Barclay BTOP50
Index
HFRI Macro
Index
MSCI World +
BTOP50
MSCI World +
HFRI Macro
Annual Return 7.5% 6.7% 11.1% 11.5% 13.6%
Annual Risk 15.3% 8.9% 7.4% 13.9% 14.2%
Return/Risk 0.49 0.75 1.50 0.83 0.96
Maximum Drawdown -54.0% -13.3% -10.7% -40.0% -41.7%
Downside Capture 100% — — 74% 74%
Upside capture 100% — — 98% 107%
Annualized performance during contraction
-15.8% 5.5% 8.4% -8.2% -5.4%
Annualized performance during expansion
10.5% 6.8% 11.5% 14.0% 16.1%
Source: Bloomberg LP
TABLE 05 - PROXY HEDGING ON THE MSCI WORLD INDEX USING THE BARCLAY BTOP50 INDEX
AND HFRI MACRO INDEX
(JANUARY 1990 - MAY 2014)
FQ P
ER
SP
EC
TIVE
FIR
STQ
UA
DR
AN
T.C
OM
13
FQ Perspective: Upside Capture and Downside Risk Mitigation
also show the performance of two sample overlay programs, in which the BTOP50 and HFRI Macro are combined with the MSCI World Index. Both sample overlay programs are risk adjusted ex-ante based on expanding-window estimates to match the risk of the MSCI World Index. The results in the fi rst three columns of Table 05 show that BTOP50 and HFRI Macro deliver positive performance throughout the full business cycle, while the MSCI World Index has large losses during contractions and large gains during expansions. Unsurprisingly, the example overlay strategies generate better returns over time with smaller maximum drawdown. In particular, both programs eliminate around 25% of downside while retaining or even adding to the upside.
It is worth noting that fund indices such as the BTOP50 and the HFRI Macro tend to have better risk-adjusted returns than a typical fund in their respective constituents because of the additional diversifi cation returns (Booth and Fama, 1992) derived from their construction. On the other hand, diversifi cation “fi lters out” fund-specifi c noises and retains the common characteristics of strategies within each category, which is the main focus of our discussion. In practice, replicating hedge fund indices by investing in all the constituent funds directly is uncommon since it requires a lot of time and resources and can be very costly. Additionally, some funds may be closed to new investors. Therefore, investors generally select an investment style category fi rst and then choose a few managers within the category to diversify manager-specifi c risk.9
Lastly, proxy hedging strategies are active investment strategies by defi nition. Thus, they share many of the benefits and drawbacks active strategies have. For example, many will question their validity since robust strategies are diffi cult to fi nd. The “human factor” will likely have important influences as well. Therefore it is difficult to foretell how the performance characteristics of these strategies will evolve over time. However, we believe there is much
evidence that proxy hedging strategies can be robust; and given their desirable characteristics, it is worthwhile for investors to make the effort to seek them out. In the end, a good understanding of the underlying drivers for these strategies, rigorous research processes, and thorough due diligence will improve the likelihood that investors will benefi t from adding a proxy hedging component to their portfolios.
II.IV Tactical Risk Allocation
The fourth element we can employ to capture the upside and protect the downside is tactical risk allocation, i.e. increasing or decreasing risk exposures according to expectations of future payoffs. The concept of tactical risk allocation is simple and intuitive and has been practiced by investors long before Markowitz developed the theory of diversifi cation and long before liquid instruments for portfolio protection existed. Despite its long history, tactical allocation of equity market risk has been a contentious subject among academics and practitioners throughout its existence. The debate centers on the predictability of the equity premium. Since the late 1970s, numerous academic studies reported evidence of predictability using variables that range from the inflation rate (Fama and Schwert, 1977), earnings to price ratio (Campbell and Shiller, 1988, 1998) and variance risk premia (Bollerslev et al. , 2009), to name a few of the more prominent. These studies did not settle the debate, however. For example, Welch and Goyal (2008) re-examine the empirical evidence as of early 2006 and fi nd the majority of predictors to be unstable and have poor out-of-sample performance, although Rapach et al. (2009) shows combined forecasts yield much better results.
Among the forecasting models, predictability over multi-year horizons has gained broader acceptance within the investment community. A well-known long-term predictor of the equity premium is the Shiller P/E. To the extent that the price-to-earnings ratio refl ects the amount of
FQ P
ER
SP
EC
TIVE
FIR
STQ
UA
DR
AN
T.C
OM
14
FQ Perspective: Upside Capture and Downside Risk Mitigation
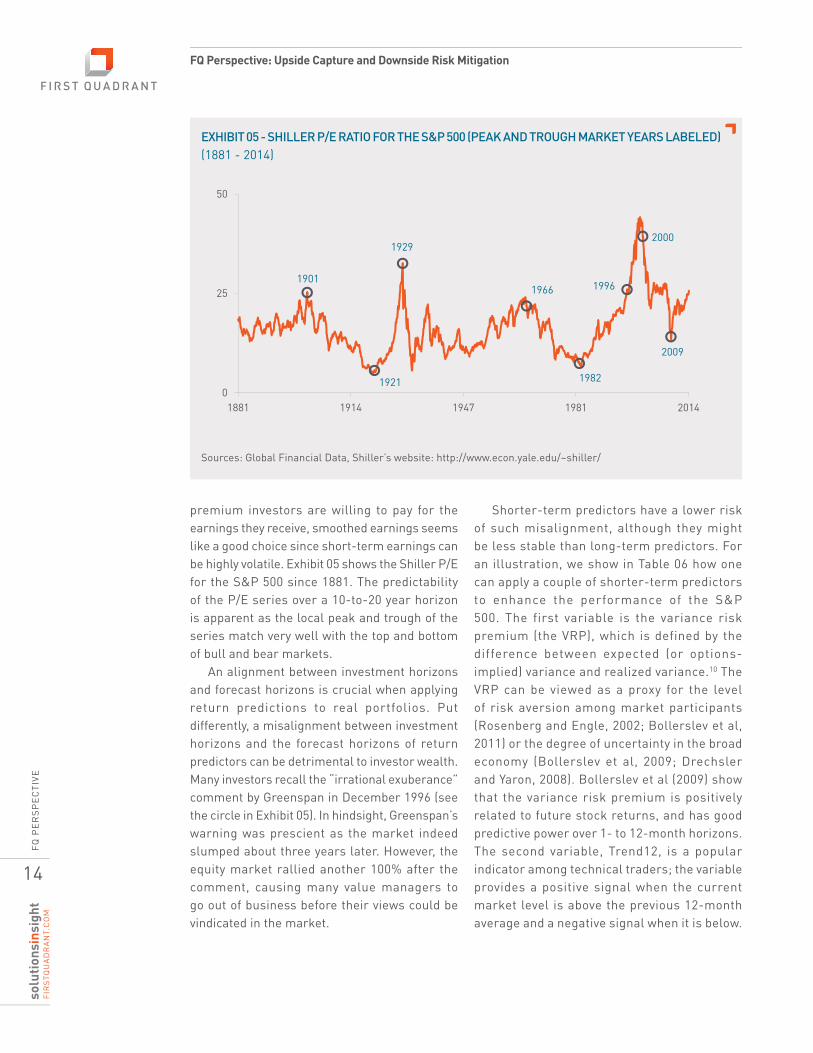
premium investors are willing to pay for the earnings they receive, smoothed earnings seems like a good choice since short-term earnings can be highly volatile. Exhibit 05 shows the Shiller P/E for the S&P 500 since 1881. The predictability of the P/E series over a 10-to-20 year horizon is apparent as the local peak and trough of the series match very well with the top and bottom of bull and bear markets.
An alignment between investment horizons and forecast horizons is crucial when applying return predictions to real portfolios. Put differently, a misalignment between investment horizons and the forecast horizons of return predictors can be detrimental to investor wealth. Many investors recall the “irrational exuberance” comment by Greenspan in December 1996 (see the circle in Exhibit 05). In hindsight, Greenspan’s warning was prescient as the market indeed slumped about three years later. However, the equity market rallied another 100% after the comment, causing many value managers to go out of business before their views could be vindicated in the market.
Shorter-term predictors have a lower risk of such misalignment, although they might be less stable than long-term predictors. For an illustration, we show in Table 06 how one can apply a couple of shorter-term predictors to enhance the performance of the S&P 500. The first variable is the variance risk premium (the VRP), which is defined by the difference between expected (or options-implied) variance and realized variance.10 The VRP can be viewed as a proxy for the level of risk aversion among market participants (Rosenberg and Engle, 2002; Bollerslev et al, 2011) or the degree of uncertainty in the broad economy (Bollerslev et al, 2009; Drechsler and Yaron, 2008). Bollerslev et al (2009) show that the variance risk premium is positively related to future stock returns, and has good predictive power over 1- to 12-month horizons. The second variable, Trend12, is a popular indicator among technical traders; the variable provides a positive signal when the current market level is above the previous 12-month average and a negative signal when it is below.
EXHIBIT 05 - SHILLER P/E RATIO FOR THE S&P 500 (PEAK AND TROUGH MARKET YEARS LABELED)
(1881 - 2014)
Sources: Global Financial Data, Shiller’s website: http://www.econ.yale.edu/~shiller/
0
25
50
1881 1914 1947 1981 2014
1901
1921
1929
1966
1982
1996
2000
2009
FQ P
ER
SP
EC
TIVE
FIR
STQ
UA
DR
AN
T.C
OM
15
FQ Perspective: Upside Capture and Downside Risk Mitigation
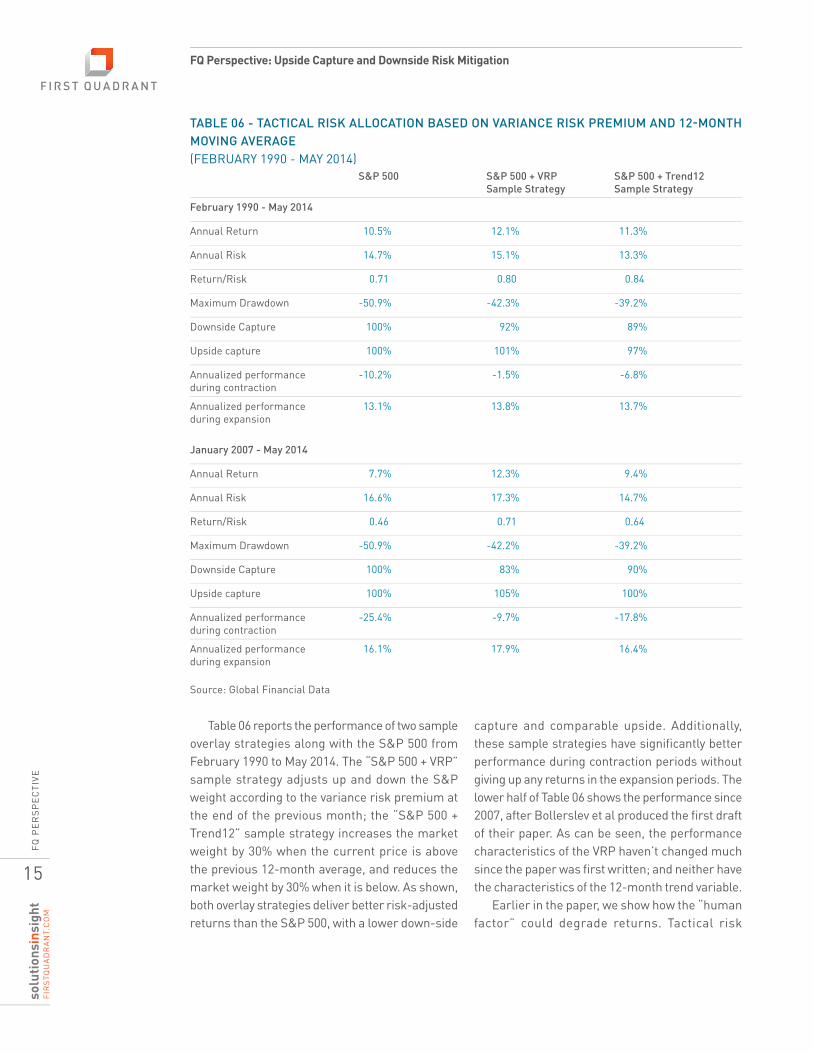
Table 06 reports the performance of two sample overlay strategies along with the S&P 500 from February 1990 to May 2014. The “S&P 500 + VRP” sample strategy adjusts up and down the S&P weight according to the variance risk premium at the end of the previous month; the “S&P 500 + Trend12” sample strategy increases the market weight by 30% when the current price is above the previous 12-month average, and reduces the market weight by 30% when it is below. As shown, both overlay strategies deliver better risk-adjusted returns than the S&P 500, with a lower down-side
capture and comparable upside. Additionally, these sample strategies have signifi cantly better performance during contraction periods without giving up any returns in the expansion periods. The lower half of Table 06 shows the performance since 2007, after Bollerslev et al produced the fi rst draft of their paper. As can be seen, the performance characteristics of the VRP haven’t changed much since the paper was fi rst written; and neither have the characteristics of the 12-month trend variable.
Earlier in the paper, we show how the “human factor” could degrade returns. Tactical risk
TABLE 06 - TACTICAL RISK ALLOCATION BASED ON VARIANCE RISK PREMIUM AND 12-MONTH
MOVING AVERAGE
(FEBRUARY 1990 - MAY 2014) S&P 500 S&P 500 + VRP
Sample Strategy
S&P 500 + Trend12
Sample Strategy
February 1990 - May 2014
Annual Return 10.5% 12.1% 11.3%
Annual Risk 14.7% 15.1% 13.3%
Return/Risk 0.71 0.80 0.84
Maximum Drawdown -50.9% -42.3% -39.2%
Downside Capture 100% 92% 89%
Upside capture 100% 101% 97%
Annualized performance during contraction
-10.2% -1.5% -6.8%
Annualized performance during expansion
13.1% 13.8% 13.7%
January 2007 - May 2014
Annual Return 7.7% 12.3% 9.4%
Annual Risk 16.6% 17.3% 14.7%
Return/Risk 0.46 0.71 0.64
Maximum Drawdown -50.9% -42.2% -39.2%
Downside Capture 100% 83% 90%
Upside capture 100% 105% 100%
Annualized performance during contraction
-25.4% -9.7% -17.8%
Annualized performance during expansion
16.1% 17.9% 16.4%
Source: Global Financial Data
FQ P
ER
SP
EC
TIVE
FIR
STQ
UA
DR
AN
T.C
OM
16
FQ Perspective: Upside Capture and Downside Risk Mitigation
allocation gives investors the opportunity to turn the human factor to their advantage. They can incorporate information on crowded positioning, leverage, and changes in investor preferences (barometers of the “human factor”) to better enhance performance. This is a nice differentiating feature for these types of strategies.
On the other hand, a healthy dose of skepticism is warranted with respect to tactical asset allocation since many predictive variables for the equity market do not fare as well as those in Table 06 (Welch and Goyal, 2008). Investors will benefi t from setting a high hurdle for tactical risk decisions and from combining these strategies with other investment ideas to increase the breadth of their opportunity sets.
II.V The Swiss Cheese Model
To summarize, we have discussed four elements of an investment strategy: factor diversification, portfolio protection, proxy hedging, and tactical risk allocation. Each of these elements utilizes different concepts to
participate in the upside, mitigate the downside, or both. Each has different benefits and drawbacks. Their performance characteristics may evolve differently with changes in the macroeconomic environment. Furthermore, the “human factor” affects strategies in each of these elements in different ways: some may be adversely impacted by it, some may benefi t from it, while others may be unaffected. In other words, the diverse concepts and outcomes of these four elements makes it rather unlikely that they will all evolve in the same way compared to how they performed in the past.
We liken strategies in these elements to slices of Swiss cheese, and drawbacks to the holes in each of the slices. These holes tend to appear randomly, in unexpected forms and places. Therefore, relying on one single strategy or approach will be risky as these drawbacks will likely cause an uneven delivery of investor objectives. The ideal system is analogous to slices of Swiss cheese stacked next to each other, the Swiss Cheese Model mentioned earlier. The multiple layers of defense reduce the chance that the holes in each slice will line up, which causes the system to fail. Similarly, an ideal approach to investing in an uncertain world is to maintain exposure to multiple return sources and apply a diverse set of techniques to protect the downside.
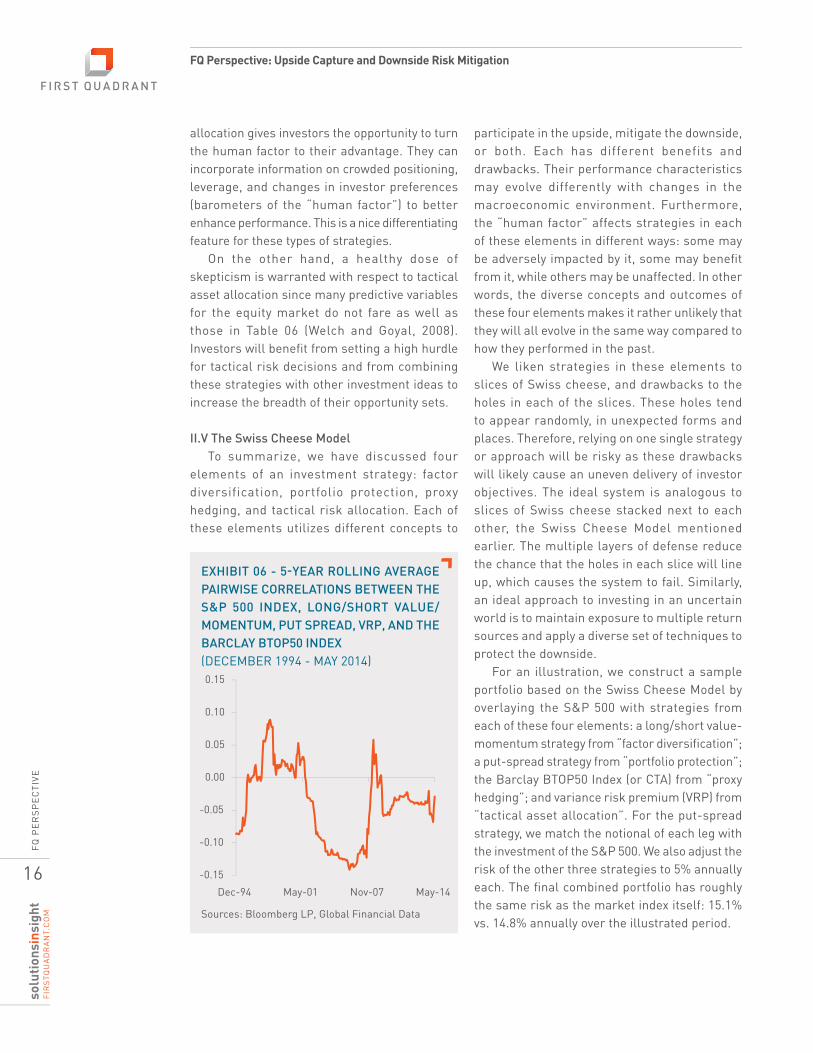
For an illustration, we construct a s ample portfolio based on the Swiss Cheese Model by overlaying the S&P 500 with strategies from each of these four elements: a long/short value-momentum strategy from “factor diversifi cation”; a put-spread strategy from “portfolio protection”; the Barclay BTOP50 Index (or CTA) from “proxy hedging”; and variance risk premium (VRP) from “tactical asset allocation”. For the put-spread strategy, we match the notional of each leg with the investment of the S&P 500. We also adjust the risk of the other three strategies to 5% annually each. The fi nal combined portfolio has roughly the same risk as the market index itself: 15.1% vs. 14.8% annually over the illustrated period.
EXHIBIT 06 - 5-YEAR ROLLING AVERAGE
PAIRWISE CORRELATIONS BETWEEN THE
S&P 500 INDEX, LONG/SHORT VALUE/
MOMENTUM, PUT SPREAD, VRP, AND THE
BARCLAY BTOP50 INDEX
(DECEMBER 1994 - MAY 2014)
Sources: Bloomberg LP, Global Financial Data
-0.15
-0.10
-0.05
0.00
0.05
0.10
0.15
Dec-94 May-01 Nov-07 May-14
FQ P
ER
SP
EC
TIVE
FIR
STQ
UA
DR
AN
T.C
OM
17
FQ Perspective: Upside Capture and Downside Risk Mitigation
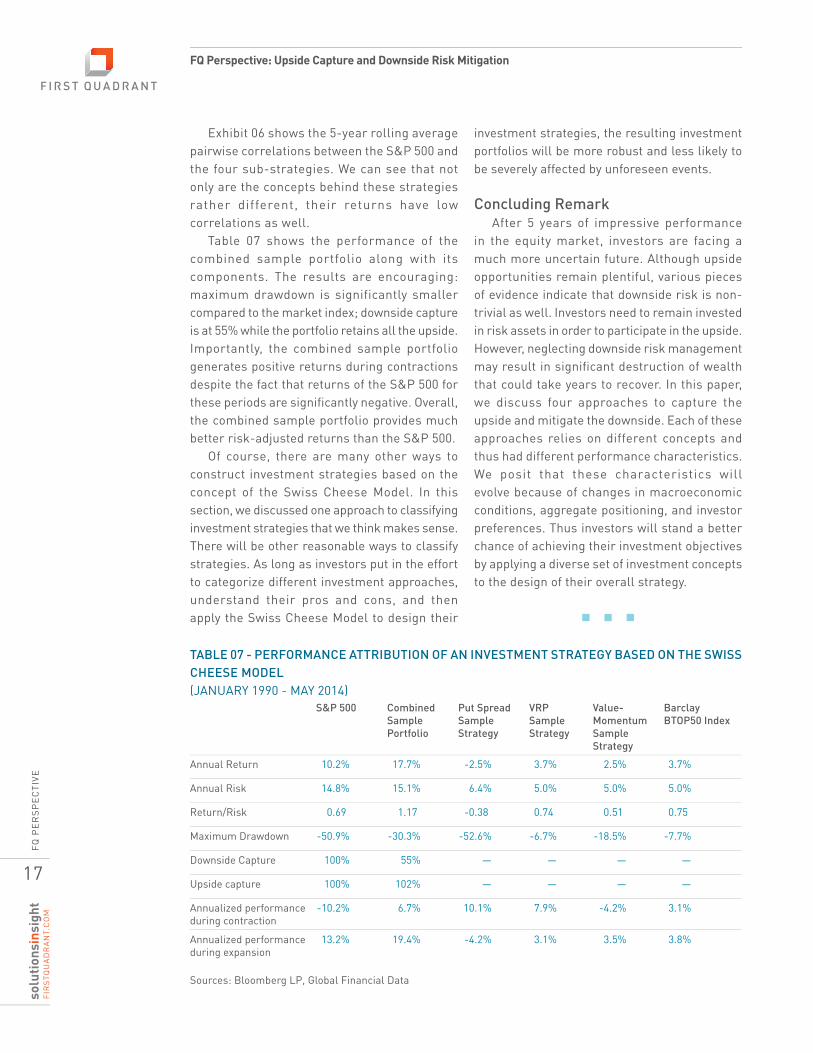
Exhibit 06 shows the 5-year rolling average pairwise correlations between the S&P 500 and the four sub-strategies. We can see that not only are the concepts behind these strategies rather different, their returns have low correlations as well.
Table 07 shows the performance of the combined sample portfolio along with its components. The results are encouraging: maximum drawdown is significantly smaller compared to the market index; downside capture is at 55% while the portfolio retains all the upside. Importantly, the combined sample portfolio generates positive returns during contractions despite the fact that returns of the S&P 500 for these periods are signifi cantly negative. Overall, the combined sample portfolio provides much better risk-adjusted returns than the S&P 500.
Of course, there are many other ways to construct investment strategies based on the concept of the Swiss Cheese Model. In this section, we discussed one approach to classifying investment strategies that we think makes sense. There will be other reasonable ways to classify strategies. As long as investors put in the effort to categorize different investment approaches, understand their pros and cons, and then apply the Swiss Cheese Model to design their
investment strategies, the resulting investment portfolios will be more robust and less likely to be severely affected by unforeseen events.
Concluding Remark
After 5 years of impressive performance in the equity market, investors are facing a much more uncertain future. Although upside opportunities remain plentiful, various pieces of evidence indicate that downside risk is non-trivial as well. Investors need to remain invested in risk assets in order to participate in the upside. However, neglecting downside risk management may result in signifi cant destruction of wealth that could take years to recover. In this paper, we discuss four approaches to capture the upside and mitigate the downside. Each of these approaches relies on different concepts and thus had different performance characteristics. We posit that these characteristics will evolve because of changes in macroeconomic conditions, aggregate positioning, and investor preferences. Thus investors will stand a better chance of achieving their investment objectives by applying a diverse set of investment concepts to the design of their overall strategy.
TABLE 07 - PERFORMANCE ATTRIBUTION OF AN INVESTMENT STRATEGY BASED ON THE SWISS
CHEESE MODEL
(JANUARY 1990 - MAY 2014) S&P 500 Combined
Sample
Portfolio
Put Spread
Sample
Strategy
VRP
Sample
Strategy
Value-
Momentum
Sample
Strategy
Barclay
BTOP50 Index
Annual Return 10.2% 17.7% -2.5% 3.7% 2.5% 3.7%
Annual Risk 14.8% 15.1% 6.4% 5.0% 5.0% 5.0%
Return/Risk 0.69 1.17 -0.38 0.74 0.51 0.75
Maximum Drawdown -50.9% -30.3% -52.6% -6.7% -18.5% -7.7%
Downside Capture 100% 55% — — — —
Upside capture 100% 102% — — — —
Annualized performance during contraction
-10.2% 6.7% 10.1% 7.9% -4.2% 3.1%
Annualized performance during expansion
13.2% 19.4% -4.2% 3.1% 3.5% 3.8%
Sources: Bloomberg LP, Global Financial Data
FQ P
ER
SP
EC
TIVE
FIR
STQ
UA
DR
AN
T.C
OM
18
FQ Perspective: Upside Capture and Downside Risk Mitigation
ReferencesAbrams, Ryan, Ranjan Bhaduri, and Elizabeth Flores, 2012, “Lintner Revisited: A Quantitative Analysis of Managed Futures”, CME Group Amenc, Noël, Lionel Martillini, Jean-Christophe Meyfredi, Volker Ziemann, 2009, “The Performance of Passive Hedge Fund Replication Strategies”, working paperAng, Andrew, 2012, “Factors”Asness, Clifford and Antti Ilmanen. May 2012, “Money Masters, Part 5: The Five-Percent Solution”, Institutional Investo, ppBollerslev, Tim, Mike Gibson, and Hao Zhou, 2011, “Dynamic Estimation of Volatility Risk Premia and Investor Risk Aversion from Option-Implied and Realized Volatilities,” Journal of Econometrics, 160, pp235-245Bollerslev, Tim, George Tauchen and Hao Zhou, 2009, “Expected Stock Returns and Variance Risk Premia”, Review of Financial Study, v22 n11, pp 4463 – 4492.Booth, David, and Eugene Fama, 1992, “Diversifi cation Returns and Asset Contributions”, Financial Analysts Journal, May-June 1992, pp 26-32.Campbell, J.Y., and R.J. Shiller, 1988, “Stock Prices, Earnings, and Expected Dividends”, Journalof Finance 43, pp661–676.Campbell, J.Y., and R.J. Shiller, 1998, “Valuation Ratios and the Long-Run Stock Market Outlook”, Journal of Portfolio Management 24, pp11–26.Cahan, Rochester and Yin Luo, Summer 2013, “Standing Out from the Crowd: Measuring Crowding in Quantitative Strategies”, Journal of Portfolio Management, pp 14-23Drechsler, Itamar and Amir Yaron, 2008, “What’s Vol Got to Do With It,” Working Paper, University of Pennsylvania. Fama, Eugene F., and Kenneth R. French, 1992, “The cross-section of expected stock returns”, Journal of Finance 47, 427–465.Fama, E.F., and G.W. Schwert, 1977, “Asset Returns and Infl ation”, Journal of Financial Economics 5, pp115–146.Fung, Willian, and David A. Hsieh, 2001, “The Risk in Hedge Fund Strategies: Theory and Evidence from Trend Followers”, Review of Financial Studies, Summer 2001 Vol. 14, No. 2, pp 313-341.Goyal, Amit, and Sunil Wahal, 2008, “The Selection and Termination of Investment Management Firms by Plan Sponsors.” Journal of Finance, vol. 63, no. 4 (August):1805–1847.Hasanhodzic, Jasmina and Andrew Lo, 2006, “Can Hedge-Fund Returns Be Replicated?: The Linear Case.”Ilmanen, Antti, 2011, “Expected Returns: An Investor’s Guide to Harvesting Market Rewards”Ilmanen, Antti, 2012, “Do Financial Markets Reward Buying or Selling Insurance and Lottery Tickets?” Financial Analysts Journal, 26-36. Jegadeesh, Narasimhan, and Sheridan Titman, 1993, “Returns to buying winners and selling losers: Implications for stock market effi ciency”, Journal of Finance 48, 65–91.Kahneman, D., & Tversky, A., 1979, “Prospect theory: An analysis of decisions under risk.” Econometrica, 47, 313–327.Lou, Dong and Christopher Polk, 2014, “Inferring Arbitrage Activity from Return Correlations”, Working paper, London School of BusinessNozaki, Masahiro, 2010, “Do Currency Fundamental Matter for Currency Speculators?” IMF working paper.
Perold, Andre F., 2012, “Negative Real Interest Rates: The Conundrum for Investment and Spending Policies”, Financial Analyst Journal, 6-12Rapach, David, Jack Strauss, and Guofu Zhou, 2009, “Out-of-Sample Equity Premium Prediction: Combination Forecasts and Links to the Real Economy”, working paperRosenberg, Joshua V. and Robert F. Engle, 2002, “Empirical Pricing Kernels,” Journal of Financial Economics, vol. 64, 341–372.Stein, Jeremy, 2009, “Sophisticated Investors and Market Effi ciency”, Journal of Finance 64, 1517-1548.Till, Hilary and Joseph Eagleeye, 2011, “A Hedge Fund Investor’s Guide to Understanding Managed Futures”, EDHEC-Risk Institute working paperWelch, I., and A. Goyal, 2008, “A Comprehensive Look at the Empirical Performance of Equity Premium Prediction”, Review of Financial Studies 21, pp1455–1508.Zhou, H., 2011. “Variance risk premia, asset predictability puzzles, and macroeconomic uncertainty”, SSRN Working Paper.
Endnotes1Both the Global Financial Data World Return series (1925-12 to 2014-06) and the S&P 500 total return series (1871-01 to 2014-06) are from Global Financial Data. 2The monthly data series is from Shiller’s website; the data goes from January 1881 to July 2014.3“Anchoring” refers to the tendency for people to base on information available to them to make decisions. “Framing” refers to the simplifi cation of reality to focus on a subset of aspects.4Both the Global Financial Data World Return series (1926-01 to 2014-05) and the S&P 500 total return series (1926-01 to 2014-05) are from Global Financial Data. 5The VIX Index is the options implied volatility of the S&P 500 Index; FX risk reversal is the difference in volatility (delta) between similar call and put options. A high VIX level and low risk reversal indicate large insurance cost to protect the respective equity and currency positions.6The historical data of value and momentum are from Ken French website: http://mba.tuck.dartmouth.edu/pages/faculty/ken.french/data_library.html.7Fama and French (1992) fi nds that value stocks outperform growth stocks on average; Jegadeesh and Titman (1993) reports that stocks with high price momentum outperform stocks with low momentum.8In a typical put spread, the purchase of puts is fi nanced, wholly or in part, by the sale of further out-of-the money puts.9One can also replicate hedge fund performance by combining common risk factors (Hasanbodzic and Lo, 2006), but the performance of the replicating strategies is generally inferior to that of actual hedge funds. (Amenc et al., 2009).10The expected variance for the S&P 500 Index is calculated by the formula: VIX2/12; the monthly realized variance is based on roughly 78 x 22 = 1716 “fi ve month” returns, which consists of 78 intraday fi ve-minute squared log returns covering the normal trading hours from 9:30am to 4:00 pm EST along with the close-to-open overnight returns, and 22 trading days in a typical month. We obtained the estimates of the Variance Risk Premium from the Quantitative Strategy Team in Deutsche Bank.
FQ P
ER
SP
EC
TIVE
FIR
STQ
UA
DR
AN
T.C
OM
19
FQ Perspective: Upside Capture and Downside Risk Mitigation
This material is for your private information. The views expressed are the views of First Quadrant, L.P. only through this period and are subject to change based on market and other conditions. All material has been obtained from sources believed to be reliable, but its accuracy is not guaranteed.
FIRST QUADRANT, L.P. | 800 E. COLORADO BLVD. SUITE 900, PASADENA, CALIFORNIA 91101MARKETING SERVICES [email protected] | OFFICE 626 683 4223 | WEB FIRSTQUADRANT.COMCopyright © by First Quadrant, LP, 2015, all rights reserved.
The S&P 500® has been widely regarded as the best single gauge of the large cap U.S. equities market since the index was fi rst published in 1957. The index has over US$ 5.58 trillion benchmarked, with index assets comprising approximately US$ 1.31 trillion of this total. The index includes 500 leading companies in leading industries of the U.S. economy, capturing 75% coverage of U.S. equities. S&P 500® is a registered trademark of the McGraw-Hill Companies Inc.The S&P 500® is proprietary data of Standard & Poor’s, a division of The McGraw-Hill Companies, Inc. All rights reserved.The MSCI World Index captures large and mid cap representation across 23 Developed Markets (DM) countries. The index covers approximately 85% of the free fl oat-adjusted market capitalization in each country. DM countries include: Australia, Austria, Belgium, Canada, Denmark, Finland, France, Germany, Hong Kong, Ireland, Israel, Italy, Japan, Netherlands, New Zealand, Norway, Portugal, Singapore, Spain, Sweden, Switzerland, the UK and the US.All MSCI data is provided ‘as is’. The products described herein are not sponsored or endorsed and have not been reviewed or passed on by MSCI. In no event shall MSCI, its affi liates, or any MSCI data provider have any liability of any kind in connection with the MSCI data or the products described herein. Copying or redistributing the MSCI data is strictly prohibited.Global Financial Data World Return Index website: https://www.globalfi nancialdata.com/index.html
Model,backtested or simulated performance presented in this paper are for illustrative purposes and are not a representation of strategies
currently managed by First Quadrant, L.P. and are provided solely for conceptual discussion only; therefore no fees are discussed or illustrated
within this paper. Results from any live implementation of strategies discussed would in actuality be reduced by fees charged against an account
deploying the strategy. Model, backtested, or simulated performance is no guarantee of the future results in a live portfolio using the strategy.
Potential for profi t is accompanied by possibility of loss. Hypothetical or simulated performance results have certain inherent limitations. Unlike an actual performance record, simulated results do not represent actual trading. Simulated trading programs in general are also subject to the fact that they are designed with the benefi t of hindsight. Further, backtesting allows the security selection methodology to be adjusted until past returns are maximized. No representation is being made that any account will or is likely to achieve profi ts or losses similar to those shown. Unless otherwise noted, performance returns for one year or longer are annualized. Performance returns for periods of less than one year are for the period reported. Reinvestment of earnings was assumed. The simulated performance used in this presentation may differ from live performance experienced using the same strategies for a variety of reasons such as: The simulation assumes that the strategy guidelines are constant through the life of the portfolio, whereas, the guidelines for live portfolios may change over the life of each portfolio; the simulation assumes zero transaction cost whereas live portfolio transaction costs will be variable; dependent on market conditions such as liquidity and portfolio size, the types of instruments traded within the simulation may not have been permissible in a live portfolio; etc.